Embed Size (px)
Citation preview

Spatial Epigenetic Control of Mono- and Bistable GeneExpressionJanos Z. Kelemen, Prasuna Ratna, Simone Scherrer, Attila Becskei*
Institute of Molecular Life Sciences, University of Zurich, Zurich, Switzerland
Abstract
Bistability in signaling networks is frequently employed to promote stochastic switch-like transitions between cellulardifferentiation states. Differentiation can also be triggered by antagonism of activators and repressors mediated byepigenetic processes that constitute regulatory circuits anchored to the chromosome. Their regulatory logic has remainedunclear. A reaction–diffusion model reveals that the same reaction mechanism can support both graded monostable andswitch-like bistable gene expression, depending on whether recruited repressor proteins generate a single silencinggradient or two interacting gradients that flank a gene. Our experiments confirm that chromosomal recruitment of activatorand repressor proteins permits a plastic form of control; the stability of gene expression is determined by the spatialdistribution of silencing nucleation sites along the chromosome. The unveiled regulatory principles will help to understandthe mechanisms of variegated gene expression, to design synthetic genetic networks that combine transcriptionalregulatory motifs with chromatin-based epigenetic effects, and to control cellular differentiation.
Citation: Kelemen JZ, Ratna P, Scherrer S, Becskei A (2010) Spatial Epigenetic Control of Mono- and Bistable Gene Expression. PLoS Biol 8(3): e1000332.doi:10.1371/journal.pbio.1000332
Academic Editor: Andre Levchenko, Johns Hopkins University, United States of America
Received October 14, 2009; Accepted February 9, 2010; Published March 16, 2010
Copyright: � 2010 Kelemen et al. This is an open-access article distributed under the terms of the Creative Commons Attribution License, which permitsunrestricted use, distribution, and reproduction in any medium, provided the original author and source are credited.
Funding: This work is supported by the Swiss National Foundation and by the UZH-URPP. The funders had no role in study design, data collection and analysis,decision to publish, or preparation of the manuscript.
Competing Interests: The authors have declared that no competing interests exist.
Abbreviations: GA, gene activation
* E-mail: [email protected]
Introduction
Graded and switch-like responses reflect fundamental aspects of
the functioning of regulatory networks. A graded, monostable
response enables the faithful propagation of a signal, and it is often
the default response of simple pathways, but regulatory mecha-
nisms can improve the linearity and the dynamic range of the
graded response [1,2]. Conversely, when the signal strength
reaches a threshold value, the switch-like response is often
manifested in ON and OFF states within a cell population. This
binary response can be induced by positive feedback loops capable
of generating bistability, but many other mechanisms can support
it by rendering the underlying processes more nonlinear and
stochastic [3–9]. Positive feedback loops in transcriptional or
protein kinase networks have been increasingly recognized as a
driving force of cellular differentiation [10,11]. The components of
these networks are dissolved in the cytoplasm or nucleoplasm, and
typically have a spatially homogeneous distribution.
In contrast, inhomogeneously distributed regulatory compo-
nents are frequently observed in eukaryotic transcriptional
regulation. Binding of eukaryotic transcriptional factors—activa-
tors and repressors—to the DNA can lead to recruitment of
enzymes and structural proteins of opposing functions, that induce
structural changes and covalent modifications of chromatin,
exemplified by acetylation and methylation [12,13]. This leads
to a spatially inhomogeneous distribution of regulators along the
DNA, constituting the epigenetic code. Activators loosen the
chromatin structure. Conversely, the compaction of chromatin
and heterochromatin formation are typically induced by repressors
or repressor-recruiting DNA sequences that act or interact over
long distances, variously termed as long-range repressors, silencing
proteins, and silencers in different systems and organisms [14–17].
Genes exposed to the antagonism of activators and repressors or
silenced chromosomal regions have been frequently observed to
display binary response [13,18–21]. Although regulatory princi-
ples underlying the graded and binary responses generated by
networks with spatially homogeneously distributed components
have been increasingly elucidated, the quantitative aspects of the
behavior of epigenetic circuits anchored to the chromosome have
remained unclear.
We examined whether the spatial distribution of activator and
repressor binding sites influences gene expression to become
monostable or bistable. We examined long-range interactions
between these sites. Since long intervening DNA sequences can
receive signals from endogenous cellular pathways, we used
heterologous synthetic gene expression systems precluding
pleiotropic cellular effects. Synthetic networks have been
instrumental in reconstituting nonmonotonous responses and in
revealing the basic principles of binary response and bistability in
transcriptional regulatory networks based on feedback or
competition of activators and repressors [19,22–26]. We
identified a concise nonlinear reaction–diffusion equation that
explains gene expression of a large number of genetic constructs
with different configurations. We found that binary response is
not inherent to repressor proteins exhibiting synergy over long
distances. Both graded and binary responses can arise depending
on the spatial distribution of the binding sites of the repressors
along the DNA.
PLoS Biology | www.plosbiology.org 1 March 2010 | Volume 8 | Issue 3 | e1000332

Results
Bistable Synergistic Interaction of Silencing GradientsSilencing is efficiently induced when multiple silencers interact
[14]. To mimic this architecture, we inserted binding sites for the
silencing protein Sir3p (in the form of a fusion protein) both
downstream and upstream of a gene reporter construct, in the
model organism Saccharomyces cerevisiae. When recruited to these
dual recruitment constructs, Sir3p evoked a variegated GFP
expression at intermediate levels of gene activation (GA) with a
bimodal distribution of cellular fluorescence (Figure 1A and 1B).
When GA was enhanced, all of the cells switched from the OFF to
the ON expression state; so that the ON state was affected only by
a residual repression (Figure 1A). Thus, a small change in the input
generated a large change in the output. The ON and OFF cell
populations represent a simple form of cellular differentiation.
To understand the principles of this form of differentiation, we
built a mathematical model based on realistic molecular processes.
Due to the complexity and incomplete description of these
processes, we sought to identify key mechanisms that can account
for bistability in the dual recruitment constructs. The changes in
the concentration of the silencing protein at a given point of the
space-time, c(x, t), are governed by source s(x), reaction r(c), and
nonlinear diffusion terms (Figure 1C, Table S1, and Text S1).
Lc
Lt~r cð Þzs xð Þz L
LxD x,cð Þ Lc
Lx
� �ð1Þ
The nucleation term, s(x), represents the recruitment of the
silencing proteins, and it is a rectangular function. Its width, sw, is
proportional to the number of tet operators, while the height of the
rectangle, sh, is proportional to the amount of the silencing proteins
recruited to the operators. Thus, sh is a function of the doxycycline
concentration. The constant nucleation of silencing proteins is
necessary for the establishment of steady-state concentration profiles
of silencing proteins around the nucleation sites (Figure S1).
Silencing proteins and their cofactors spread along the
chromosome, whereby nonspecific protein DNA interactions can
facilitate their sliding, a process described by one-dimensional
diffusion [18,27–30]. The diffusivity, D(x, c), itself is a variable
because the silencing proteins, in particular Sir3, can bridge
neighboring DNA segments and condense the chromatin in a
concentration-dependent manner, leading the heterochromatin
formation [27]. Consequently, the superimposed concentration
gradient becomes steeper, accelerating the flux of silencing
proteins. Thus, D(x, c) was approximated by DAc, so that the
diffusion term was expressed asLLx
DAcLc
Lx
� �. This non-Fickian
diffusion term arises in models where diffusional clustering or
condensation of particles is described [31,32].
The reaction term represents an autocatalytic loop based on
processes encompassing the cooperative binding of Sir3p and
Sir4p, mutual binding of Sir2p, Sir3p, and Sir4p, deacetylation of
chromatin by Sir2p creating higher affinity sites for Sir3p and
Sir4p, and polymerization of Sir3p proteins [18,27,33–36].
r cð Þ~Lcn
Kzcn{kdczb
It is assumed that the autocatalytic association of the silencing
proteins is superimposed onto a basal, nonspecific association,
occurring at a rate of b. The former is represented by a Hill function,
where L stands for the maximal association rate in the limit of c R ‘.
The dissociation of the silencing proteins is a linear process, and occurs
at a rate of kd.
Initial conditions with uniformly distributed low and high
concentrations were used to reflect biochemical fluctuations in the
initial accumulation of the silencing proteins (Figure 1D). The
simulation of the reaction–diffusion model (Equation 1) revealed that
when two silencing nucleation sites were positioned into sufficient
proximity, the two initial conditions gave rise to two distinct solutions
representing two concentration profiles (Figures 1D and S2). The low-
concentration profile was composed of two isolated gradients around
the silencing nucleation sites. The high-concentration profile repre-
sented a synergistic interaction of the two nucleation sites (Figure 1E).
Stability Diagram of Gene Expression as a Function ofTranscriptional Activation
The coexistence of two concentration profiles for the same
parameter values is in accord with the co-occurrence of ON and
OFF cells at intermediate GA (Figures 1A, 1E, and S3). For a more
detailed analysis of bistability, the gene expression has to be
calculated from the concentration profiles.
Gene expression is determined jointly by transcriptional
activation and silencing. Quantitatively, gene expression is defined
as the product of GA and fold inhibition due to silencing (see also
Materials and Methods). Transcriptional activators not only
induce gene expression, but also reduce the spreading of silencing
proteins because activators recruit enzymes that relax the structure
of chromatin, diminishing the slope of the superimposed
concentration gradient [37]. Furthermore, the recruited histone
acetyltransferases decrease the number of the available high-
affinity binding sites for the silencing proteins [18,33]. Therefore,
the diffusivity was set to be inversely proportional to GA, DA = D0
KGA/(KGA + GA). Fold inhibition was equated with the
concentration of silencing proteins at the gene regulatory region,
Author Summary
In the simplest scenario, a gene is expressed when anactivator protein binds to its regulatory sequence, and issilenced when the regulatory sequence is bound by arepressor. Many genes are regulated by both activatorsand repressors, with the response determined by thecombined influence of both factors. When the response ismonostable graded, expression is finely tuned to a levelthat reflects the proportion of the bound activator to thebound repressor. Monostable graded systems allow cellsto respond precisely to stimuli. If the response is bistable,the response of each cell depends on whether theactivator or the repressor wins. Bistable regulation resultsin the same gene being expressed in some cells andsilenced in others, an outcome that promotes cellulardifferentiation. It remains unclear, however, how differentgenetic regulatory structures code for monostable gradedand bistable responses. We modeled mathematically thebehavior of repressors as they bind to and spread theirinhibitory effect along genes and found that the spatialdistribution of the binding sites determines whichresponse is chosen. If repressors bind both upstream anddownstream of the coding sequence, the response isbistable. If they bind only to one side of the codingsequence, the response is monostable. We confirmed ourtheoretical findings using synthetic genetic constructs inyeast. These findings help to explain how variations in thelocation of regulatory elements can lead to cellulardifferentiation and adaption to varying environments.
Chromosomal Epigenetic Regulatory Circuits
PLoS Biology | www.plosbiology.org 2 March 2010 | Volume 8 | Issue 3 | e1000332
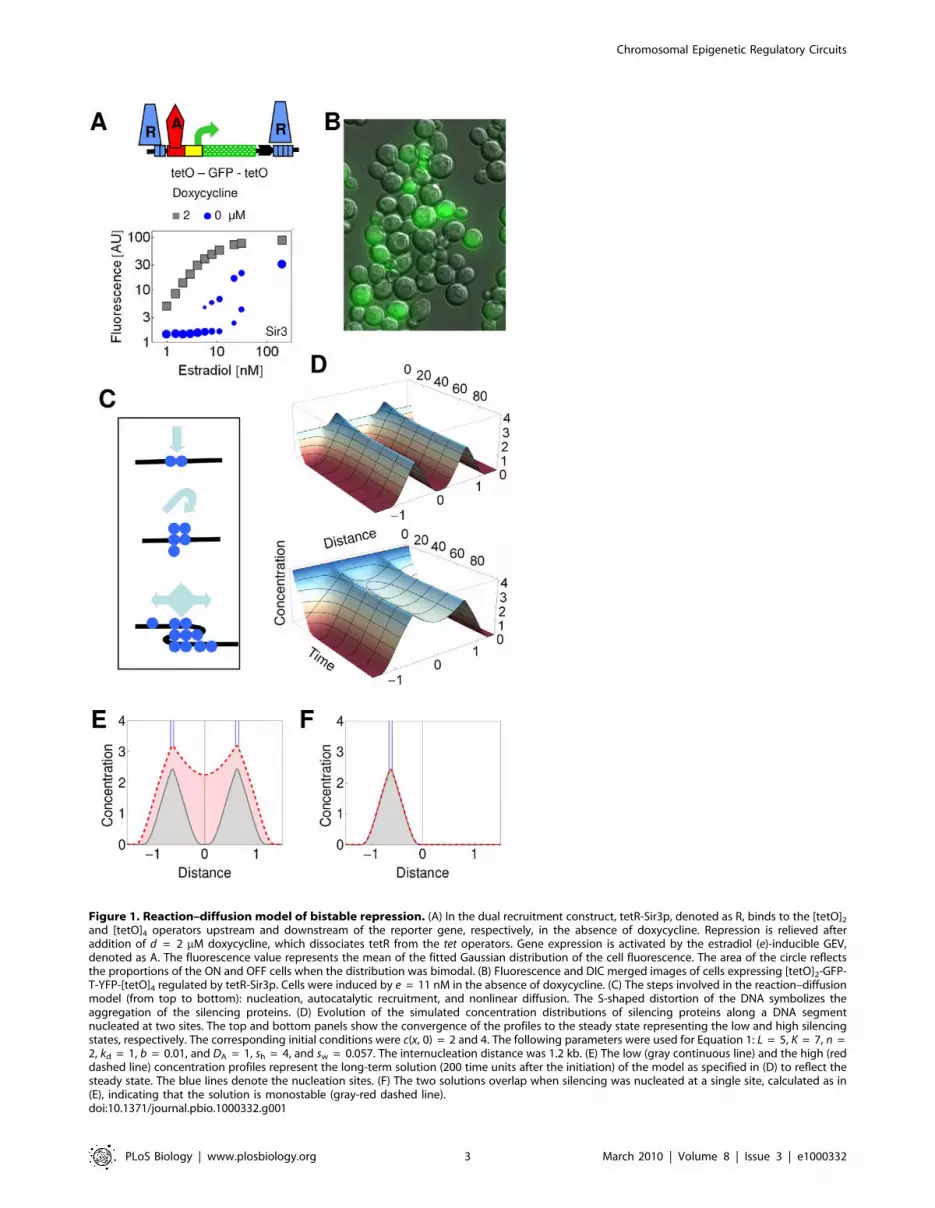
Figure 1. Reaction–diffusion model of bistable repression. (A) In the dual recruitment construct, tetR-Sir3p, denoted as R, binds to the [tetO]2
and [tetO]4 operators upstream and downstream of the reporter gene, respectively, in the absence of doxycycline. Repression is relieved afteraddition of d = 2 mM doxycycline, which dissociates tetR from the tet operators. Gene expression is activated by the estradiol (e)-inducible GEV,denoted as A. The fluorescence value represents the mean of the fitted Gaussian distribution of the cell fluorescence. The area of the circle reflectsthe proportions of the ON and OFF cells when the distribution was bimodal. (B) Fluorescence and DIC merged images of cells expressing [tetO]2-GFP-T-YFP-[tetO]4 regulated by tetR-Sir3p. Cells were induced by e = 11 nM in the absence of doxycycline. (C) The steps involved in the reaction–diffusionmodel (from top to bottom): nucleation, autocatalytic recruitment, and nonlinear diffusion. The S-shaped distortion of the DNA symbolizes theaggregation of the silencing proteins. (D) Evolution of the simulated concentration distributions of silencing proteins along a DNA segmentnucleated at two sites. The top and bottom panels show the convergence of the profiles to the steady state representing the low and high silencingstates, respectively. The corresponding initial conditions were c(x, 0) = 2 and 4. The following parameters were used for Equation 1: L = 5, K = 7, n =2, kd = 1, b = 0.01, and DA = 1, sh = 4, and sw = 0.057. The internucleation distance was 1.2 kb. (E) The low (gray continuous line) and the high (reddashed line) concentration profiles represent the long-term solution (200 time units after the initiation) of the model as specified in (D) to reflect thesteady state. The blue lines denote the nucleation sites. (F) The two solutions overlap when silencing was nucleated at a single site, calculated as in(E), indicating that the solution is monostable (gray-red dashed line).doi:10.1371/journal.pbio.1000332.g001
Chromosomal Epigenetic Regulatory Circuits
PLoS Biology | www.plosbiology.org 3 March 2010 | Volume 8 | Issue 3 | e1000332

assuming a linear relation between them. Since repression from
the upstream and downstream sites interact multiplicatively [38]:
fold inhibition{1~ c xuð Þz1ð Þ c xdð Þz1ð Þ{1 ð2Þ
where xu and xd correspond to the positions 20.38 kb and 0 kb,
respectively (Figure 2A).
When DA was high due to the weak GA, simulations initiated
with both conditions converged to the synergistically interacting
Figure 2. Prediction of gene expression based on the concentration profiles of silencing proteins. The values of the parameters aregiven in Table S1, unless otherwise indicated. (A) Inhibition of gene expression, expressed as fold inhibition 2 1, was calculated from the values of thesilencing concentration gradient at the positions xu = 20.38 and xd = 0 kb (yellow dots), which span the transcriptional regulatory region of thegene (Equation 2). The upstream point, xu, corresponds approximately to the region of the activator binding sites while the downstream point, xd,corresponds to the transcriptional initiation site. These points were chosen as plausible sites of action of silencing proteins. The silencing nucleationsites are positioned at 20.6 and 0.6 kb in the dual nucleation setting. (B) The upwards and downwards arrows represent the solutions initiated withlow (c(x, 0) #2) and high (c(x, 0) $4) starting concentrations, for the [O]2-Gene-[O]4 setting. When the solutions converge, the two arrows merge intoan arrow with two arrowheads (monostable region). Double arrows represent weighed mean values of the two solutions to reflect the populationaverage in the bistable region. The red and blue arrows represent solutions with DA = D0 ˙ KGA / (KGA + GA) and DA = D0 ˙ KGA / 1.36 ˙ (KGA + GA),respectively. The reduction of diffusivity for the blue arrows reflects the effect of the transcriptional activators bound to the downstream sites that donot contribute to GA. (C) GA reflects the ratio of expression at the applied estradiol concentration to that at maximal induction (200 nM estradiol), inthe absence of repression (d = 2 mM). Fold inhibition 2 1 at the applied estradiol concentration reflects the change in gene expression when therepressor binds to the recruitment site (see Materials and Methods). Fold inhibition 2 1 was measured for the [tetO]2-GFP-[tetO]4 (red symbols) andthe [tetO]2-GFP-GALUAS-[tetO]4 (blue symbols) constructs when the fluorescence distributions were unimodal (o) or bimodal (‘). The insertion of theGALUAS did not increase the maximal expression of the construct relative to the control constructs (unpublished data). (D) Calculations performed forthe Gene-[O]4 setting as in (B). (E) Fold inhibition 2 1 was measured for the GFP-[tetO]4 (red symbols) and the GFP-GALUAS [tetO]4 (blue symbols)constructs, as in (B).doi:10.1371/journal.pbio.1000332.g002
Chromosomal Epigenetic Regulatory Circuits
PLoS Biology | www.plosbiology.org 4 March 2010 | Volume 8 | Issue 3 | e1000332

concentration profiles. Correspondingly, gene expression was
inhibited strongly. In contrast, the inhibition was weak when GA
was strong (Figure 2B). At intermediate activation, the strongly
and weakly inhibited states co-occurred. In summary, increasing
GA is accompanied by a transition from the monostable OFF to
the monostable ON state through a bistable region, creating a
characteristic bifurcation diagram (stability within the mono- and
bistable terms refers to the number of steady states) (Figure 2B).
The bifurcation diagram was in accordance with the transitions
observed for the silenced gene expression as the GA was varied
experimentally, recapitulating a classical binary response
(Figures 1A and 2C).
The model can be validated when further activator binding sites
are inserted between the two silencing nucleation sites in a way that
they do not contribute to gene expression (Figure 2C). In this case,
the model predicted that the bifurcation diagram would not change
qualitatively; only the respective stability regions would shift toward
the lower GA levels since the diffusion of silencing proteins is further
diminished (Figure 2B). We tested this prediction by inserting
activator binding sites between the terminator of the reporter gene
and the tet operators, where they do not activate gene expression
(Figure 2C). Indeed, bimodal expression was observed for a lower
range of GA (Figures 2C and S4).
In the above model, the reduction of DA between the silencing
nucleation sites was spatially uniform. We compared this simple
model with a more complex one, in which the reduction of DA was
more pronounced in the proximity of the activator binding sites.
The solutions of the two models were in qualitative agreement
(Figure S5).
Lateral Amplification of Silencing GradientsWhereas the predicted concentration gradient is strongly
amplified between the two nucleation sites, a moderate amplifi-
cation was also predicted for outside of the internucleation
segment (Figure 1E). To test this lateral amplification, we
compared the inhibition of gene expression when Sir3p was
recruited downstream of GFP either to a single site or to two sites
separated by a 1-kb-long transcription unit, expressing Cherry
(Figure 3A). Indeed, the efficiency of inhibition was stronger by a
factor of three for the dual recruitment construct in comparison to
the single recruitment construct (Figure 3B), suggesting that the
model adequately describes the shape of the gradient. The lateral
amplification is predicted to be stronger when DA is high (compare
Figures 1E, 1F, and S5). The detection of lateral amplification in
the convergent transcription constructs (Figure 3A) may have been
facilitated by the presence of two terminators separating the GFP
and Cherry genes, because silencing, and possibly the spreading of
silencing proteins, can be enhanced by transcriptional terminators
[38,39].
Critical Nucleation Lengths Are Required for SynergisticBistable Response
Bistable systems can undergo bifurcations with respect to
multiple parameters. Therefore, we explored the stability of
predicted gene expression as a function of the width of the
nucleation sites. The above simulations represented systems with
two operators upstream and four operators downstream of the
reporter gene (Figure 2B). When the width of the downstream
nucleation site was halved, the bistable response persisted: the
synergistic monostable, the bistable, and the low monostable
concentration profiles alternated as gene expression increased
(Figure 4A). Indeed, the experiments utilizing the [tetO]2-GFP-
[tetO]2 construct evidenced the bimodal gene expression at
intermediate GA and strong average repression (Figure 4C).
When the width of both nucleation segments was halved relative
to the previous setting, bistability collapsed, and only the low-
concentration profiles were seen over the entire range of GA
(Figure 4B). In the corresponding experiments, the number of tet
Figure 3. Lateral amplification of silencing gradients. (A) The lateral amplification of silencing gradients can be read out with constructs, inwhich GFP expression is repressed either by a single downstream cluster of recruitment sites, [tetO]2, or by two downstream clusters of recruitmentsites separated by a transcription unit, [tetO]2-Cherry-[tetO]2. (B and C) Fold inhibition 2 1 was measured for GFP expression for the GFP-[tetO]2 andthe GFP [tetO]2-Cherry-[tetO]2 constructs. The ratio of the inhibition strengths (see Materials and Methods) of the dual recruitment constructs to thatof the single recruitment constructs was 3.2 6 0.31 and 1.77 6 0.31 for Sir3p (B) and Sum1p (C), respectively.doi:10.1371/journal.pbio.1000332.g003
Chromosomal Epigenetic Regulatory Circuits
PLoS Biology | www.plosbiology.org 5 March 2010 | Volume 8 | Issue 3 | e1000332

operators was reduced. The resulting [tetO]1-GFP-[tetO]1 con-
struct displayed weak silencing and monostable gene expression
(Figure 4C), confirming that synergistic interaction of gradients
occurs only when the nucleation widths reach a certain threshold.
The Bistable Response Is Conserved for RepressorsExhibiting Long-Range Synergy
A model of a biological dynamical system can be corroborated
by replacing a network component with a functionally similar
component. For this purpose, we tested the Sum1p repressor that
binds to the E silencer of the HML heterochromatic locus and
contributes to gene silencing [40]. Its cofactor, Hst1p, is a homolog
of the silencing protein Sir2p [41]. When Sum1p was recruited as
a tetR-Sum1p fusion protein to tet operators, it inhibited
expression of GFP, independently of whether the tet operators
were positioned upstream or downstream of the reporter gene
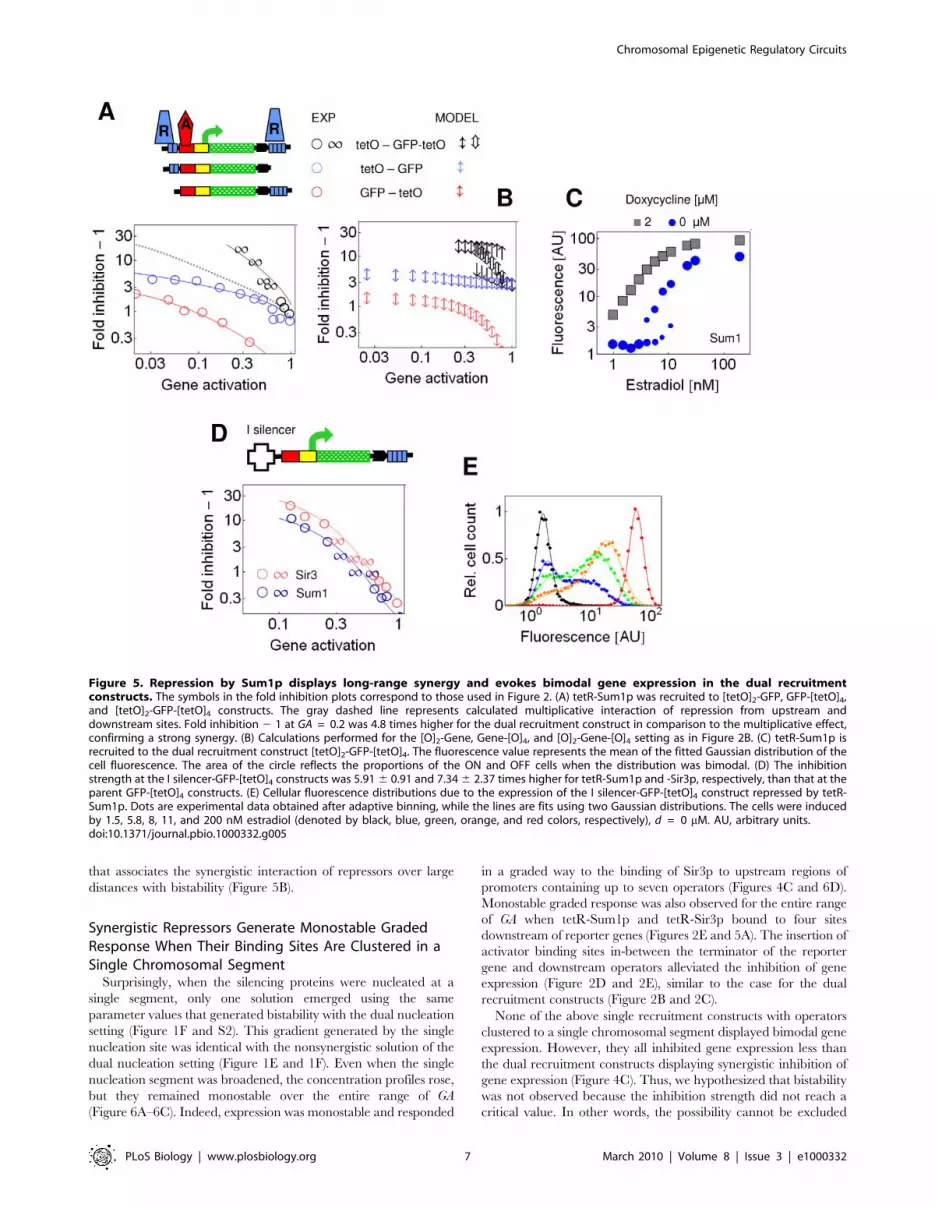
(Figure 5A). When bound to both of these sites, Sum1p inhibited
gene expression in a strong, synergistic way (Figure 5A). The
synergistic interaction over long distance is a phenomenon typical
of silencers and repressors acting at heterochromatic loci [14,42].
At intermediate GA, expression of GFP was bimodal (Figure 5C),
similar to the observations with Sir3p. The bimodal expression was
observed up to 8 h after induction of gene expression (Figure S6).
We also examined a well-characterized mutant form of Sum1p,
Sum1-1p. This variant was identified in order to efficiently
substitute Sir-dependent silencing, and it has a capability to induce
pronounced heterochromatin formation [43,44]. Indeed, Sum1-1p
displayed a stronger synergy than Sum1p (Figure S7), and bimodal
expression was observed even up to 16 h after induction (Figure S6).
We examined whether Sir3p and Sum1p interacted with the
native HML I silencer synergistically. The Sir proteins are
recruited to both the E and I silencers, which flank the
heterochromatic HML genes, whereas Sum1p is recruited to the
E silencer only [40]. The I silencer alone did not have an
inhibitory effect on gene expression (Figure S8) [42]. When the
reporter gene was flanked by an upstream I silencer and by
downstream tet operators, both tetR-Sir3p and tetR-Sum1p
induced bimodal gene expression at intermediate GA (Figures 5D,
5E, and S9).
When the reporter gene was lengthened in the dual recruitment
constructs, the synergistic and bistable inhibition of gene
expression by Sum1p was abolished (Figure S10). This confirms
that in addition to the critical nucleation strength, the two
nucleation sites have to be within a critical distance to generate
synergistic interaction of the silencing gradients (Figure S5).
In summary, we observed similar responses for four different
combinations of silencers and repressor proteins (Figures 2B, 3,
and 5), suggesting that they follow the same regulatory principle
Figure 4. Stability of gene expression and inhibition strength as the function of the number and distribution of nucleation sites. (Aand B) Concentration profiles calculated for the [O]2-Gene-[O]2 (A) and [O]1-Gene-[O]1 (B) settings. The red dashed and gray continuous linesrepresent the solutions initiated with the two initial conditions. The two solutions overlap when GA is either weak or strong (thin and thick red-graydashed lines). At intermediate GA, two distinct solutions evidenced the bistability (medium red dashed and gray dashed lines) for [O]2-Gene-[O]2. (C)Inhibition strength at single (upstream or downstream) and dual recruitment constructs. The inhibition strength is the average value for foldinhibition 2 1 in the [0.06, 0.6] interval of GA. The total number of tet operators is indicated for each dual recruitment construct [tetO]1-GFP-[tetO]1 (n= 2), [tetO]1-GFP-[tetO]2 (n = 3), [tetO]2-GFP-[tetO]2 (n = 4), and [tetO]2-GFP-[tetO]4 (n = 6). Empty symbols stand for constructs that display bimodalgene expression.doi:10.1371/journal.pbio.1000332.g004
Chromosomal Epigenetic Regulatory Circuits
PLoS Biology | www.plosbiology.org 6 March 2010 | Volume 8 | Issue 3 | e1000332
that associates the synergistic interaction of repressors over large
distances with bistability (Figure 5B).
Synergistic Repressors Generate Monostable GradedResponse When Their Binding Sites Are Clustered in aSingle Chromosomal Segment
Surprisingly, when the silencing proteins were nucleated at a
single segment, only one solution emerged using the same
parameter values that generated bistability with the dual nucleation
setting (Figure 1F and S2). This gradient generated by the single
nucleation site was identical with the nonsynergistic solution of the
dual nucleation setting (Figure 1E and 1F). Even when the single
nucleation segment was broadened, the concentration profiles rose,
but they remained monostable over the entire range of GA
(Figure 6A–6C). Indeed, expression was monostable and responded
in a graded way to the binding of Sir3p to upstream regions of
promoters containing up to seven operators (Figures 4C and 6D).
Monostable graded response was also observed for the entire range
of GA when tetR-Sum1p and tetR-Sir3p bound to four sites
downstream of reporter genes (Figures 2E and 5A). The insertion of
activator binding sites in-between the terminator of the reporter
gene and downstream operators alleviated the inhibition of gene
expression (Figure 2D and 2E), similar to the case for the dual
recruitment constructs (Figure 2B and 2C).
None of the above single recruitment constructs with operators
clustered to a single chromosomal segment displayed bimodal gene
expression. However, they all inhibited gene expression less than
the dual recruitment constructs displaying synergistic inhibition of
gene expression (Figure 4C). Thus, we hypothesized that bistability
was not observed because the inhibition strength did not reach a
critical value. In other words, the possibility cannot be excluded
Figure 5. Repression by Sum1p displays long-range synergy and evokes bimodal gene expression in the dual recruitmentconstructs. The symbols in the fold inhibition plots correspond to those used in Figure 2. (A) tetR-Sum1p was recruited to [tetO]2-GFP, GFP-[tetO]4,and [tetO]2-GFP-[tetO]4 constructs. The gray dashed line represents calculated multiplicative interaction of repression from upstream anddownstream sites. Fold inhibition 2 1 at GA = 0.2 was 4.8 times higher for the dual recruitment construct in comparison to the multiplicative effect,confirming a strong synergy. (B) Calculations performed for the [O]2-Gene, Gene-[O]4, and [O]2-Gene-[O]4 setting as in Figure 2B. (C) tetR-Sum1p isrecruited to the dual recruitment construct [tetO]2-GFP-[tetO]4. The fluorescence value represents the mean of the fitted Gaussian distribution of thecell fluorescence. The area of the circle reflects the proportions of the ON and OFF cells when the distribution was bimodal. (D) The inhibitionstrength at the I silencer-GFP-[tetO]4 constructs was 5.91 6 0.91 and 7.34 6 2.37 times higher for tetR-Sum1p and -Sir3p, respectively, than that at theparent GFP-[tetO]4 constructs. (E) Cellular fluorescence distributions due to the expression of the I silencer-GFP-[tetO]4 construct repressed by tetR-Sum1p. Dots are experimental data obtained after adaptive binning, while the lines are fits using two Gaussian distributions. The cells were inducedby 1.5, 5.8, 8, 11, and 200 nM estradiol (denoted by black, blue, green, orange, and red colors, respectively), d = 0 mM. AU, arbitrary units.doi:10.1371/journal.pbio.1000332.g005
Chromosomal Epigenetic Regulatory Circuits
PLoS Biology | www.plosbiology.org 7 March 2010 | Volume 8 | Issue 3 | e1000332

that if silencing nucleated at a single cluster inhibited gene
expression strongly enough, then the response would be binary.
Therefore, we searched for single recruitment constructs with
strong inhibitory potential. Fortuitously, when the tet operators
were inserted between the activator binding sites and the TATA
box, a strong inhibition of expression by both Sum1p and Sir3p
was observed. In particular, Sum1p inhibited gene expression
more strongly when bound to these intercalated operators in
comparison to when Sum1p repressed gene expression synergis-
tically in the dual recruitment constructs (Figure 7A).
However, gene expression responded in a graded way over a broad
range of activator and repressor binding when Sum1p or Sir3p
bound to the intercalated operators (Figure 7B, 7C, and S11). In
contrast, the dual recruitment constructs displayed bimodal gene
expression when the binding of the activator and repressor was
balanced (Figure 7C). The region of bistability was broader for Sir3p
in comparison to Sum1p (Figure 7C), in accordance with the stronger
synergistic repression and lateral amplification of the gradient by
Sir3p (Figure 3B and 3C) [38].
Thus, our experiments confirmed the predictions of the
reaction–diffusion model, revealing that the same mechanism
can support both graded and binary gene expression depending on
the spatial distribution of silencing nucleation sites. Monostable
graded expression was characteristic of single nucleation con-
structs, whereas binary expression was found when two nucleation
sites flanked a gene. The OFF and ON cells reflect the effect of the
synergistically interacting and isolated silencing gradients, respec-
tively (Figures 1E, 1F, and 4A). Thus, the ON cells are inhibited to
a degree comparable to the repression of single nucleation
constructs when GA is strong (Figure 5A–5C), whereas the OFF
cells are inhibited synergistically.
A further exploration of the model revealed a high degree of
plasticity of system behavior depending on the parameter values. In
particular, the dual nucleation setting generated a graded response
when the cooperativity of binding of silencing proteins was reduced
(Figure S12). Furthermore, the single nucleation setting displayed
bistability when the ratio of the diffusivity to the nucleation width
was reduced. In the latter case, however, the silencing proteins did
not propagate to long distances due to the low diffusivity, and
consequently, they may have no or little impact on gene expression
(Figure S13). It remains to be determined whether epigenetic
silencing processes exist that assume such parameter values and
display behaviors reproducing the above predictions.
Discussion
Eukaryotic transcriptional cis regulation governs developmental
and differentiation programs [45]. Long-range interaction between
Figure 6. A single cluster of silencing nucleation sites generates a graded, monostable response. (A) The concentration profiles werecalculated when GA was set to 0.022 and silencing was nucleated at 20.6 kb. The nucleation site comprised one, two, four, and seven operators. The bluelines denote the width of the [O]7 nucleation site. The gray continuous and red dashed lines represent the simulated solutions initiated with low and highconcentrations, c(x, 0), respectively. When they overlap, the system is monostable (red-gray dashed lines). (B) The concentration profiles were calculated for[O]7 as in (A), but GA was varied. (C) Gene expression was calculated from (B) by setting the maximal value of unrepressed gene expression to 1 (seeMaterials and Methods), so that the black, blue, and red lines correspond to a GA of 0.01, 0.15, and 0.43, respectively. A lognormal distribution was assignedto each calculated mean value. (D) Cellular fluorescence distributions due to the expression of [tetO]7-GFP, repressed by tetR-Sir3p (YSSD227.4) The cellswere induced by 2.9, 5.7, 11, 22, 32, and 200 nM estradiol, in the absence of doxycycline.doi:10.1371/journal.pbio.1000332.g006
Chromosomal Epigenetic Regulatory Circuits
PLoS Biology | www.plosbiology.org 8 March 2010 | Volume 8 | Issue 3 | e1000332

transcription factors makes the deciphering of the logic of this
regulation difficult [16,17,46]. Whereas long-range interactions can
occur even in prokaryotes through looping of the intervening DNA
sequences, the long-range effects of eukaryotic activators (enhancers)
and repressors (silencers) are often mediated by cofactors that spread
along the chromatin, modifying its composition and conformation.
Therefore, eukaryotic transcriptional cis regulation requires complex
spatiotemporal models to understand its logic.
We have devised a concise reaction–diffusion model that
captures the important molecular aspects of long-range synergistic
repression: autocatalytic recruitment of proteins and their
spreading along the DNA that is accompanied by aggregation
and condensation of chromatin. We presented a number of
experimental tests that confirmed the model predictions. The
central result of the model is that the response type depends on the
distribution silencing nucleation sites. When two clusters of
Figure 7. Graded responses can be generated by both Sum1p and Sir3p even when they strongly repress gene expression. (A)PGAL1tetO2 corresponds to the GAL1 promoter, in which the Mig1p binding sites, positioned between the GALUAS and the TATA box, were replaced bytet operators. Fold inhibition of gene expression of the respective constructs was obtained for unimodal (o) and bimodal (‘) distributions. (B)Gaussians were fit to fluorescence distributions induced by 3.75, 7.5, 15, 30, and 200 nM estradiol, in the absence of doxycycline. AU, arbitrary units.(C) The means of the fitted Gaussians are color coded. When the distributions were bimodal, the squares were split into two triangles of differentcolors. The cells were induced by 3.75, 7.5, 15, 30, and 200 nM estradiol and 0, 10, 20, 40, 80,160, and 2,000 nM doxycycline.doi:10.1371/journal.pbio.1000332.g007
Chromosomal Epigenetic Regulatory Circuits
PLoS Biology | www.plosbiology.org 9 March 2010 | Volume 8 | Issue 3 | e1000332

nucleation sites flank a gene, the system is bistable. For the
corresponding genetic constructs, stochastic gene expression with
ON and OFF cells was observed. On the other hand, a
monostable graded response was generated when silencing was
nucleated at a single cluster even if it was relatively long.
Both types of distributions of recruitment clusters for repressors
and silencing proteins have been encountered in the genome. An
increasing number of promoters have been identified that are
dynamically regulated by a single group of binding sites for long-
range repressors even within euchromatic regions [41,47,48]. In
such cases, monostable graded expression is expected to be
generated by repressors that follow the regulatory mechanisms we
identified.
On the other hand, the synergistic interaction of two or more
silencers scattered through telomeric and subtelomeric regions is
thought to be required for efficient heterochromatin formation in a
broad range of organisms, including yeasts and the mammalian X
chromosome [14]. The identification of such silencers is hampered
by the fact that in isolation, they lose their silencing capability or
may even activate gene expression, so a large number of
protosilencers may be hidden in the genome [14]. Genes flanked
by two or more silencers are expected to display a stochastic binary
expression. Indeed, genes positioned to subtelomeric domains
frequently display bimodal and stochastic gene expression in
response to environmental stimuli [20,21,49]. For example, cell
adhesion proteins are localized to subtelomeric domains and are
expressed in a variegated way. This phenotypic diversity may
enhance the survival and virulence of fungal cells [20,21].
Conversely, position-effect variegation, a phenomenon character-
ized by stochastic bimodal expression of a gene positioned to the
silenced domains of the chromosome, can arise due to chromo-
somal aberrations and lead to developmental abnormalities and
diseases [50–52]. Interaction between multiple silencing gradients
can also contribute to correlations in the stochastic fluctuations of
expression of genes ordered along the chromosome [53,54].
Components or mechanisms employed in silencing are often
conserved between yeast and higher organisms [33]. Long-range
repression and heterochromatin formation can be efficiently
reconstituted by tethering the appropriate proteins (or RNA) to
the chromosome in different organisms [19,34,55,56]. Therefore,
well-defined genetic systems comparable to ours can be employed
to examine if the regulatory logic we unveiled is evolutionarily
conserved.
Our results highlight a difference between signal transducers
dissolved in the cell protoplasm and regulatory circuits anchored
to the chromosome. Dissolved kinases or transcription factors
produce either a monostable or bistable response in a single cell
depending on whether they are constitutively regulated or
embedded in feedback loops (Figure 8A). In contrast, the same
long-range repressor can evoke a monostable graded response at
one gene but can induce stochastic transitions between ON and
OFF states at another gene (Figure 8B). The outcome is
determined by the distribution and density of the recruitment
sites of silencing proteins and activators.
The dissolved cellular regulatory networks and the spatially
inhomogeneously distributed chromosomal epigenetic circuits will
jointly determine gene expression and stability of cellular
differentiation states [54,57–59]. Knowing the regulatory princi-
ples of the latter will certainly help to decipher their interaction
and to understand how they shape cellular functioning.
Materials and Methods
Strain Construction and Growth ConditionsThe expression of GFP from chromosomally integrated
constructs was activated by GEV, an estradiol (e)-inducible
transcriptional activator, when bound to the GALUAS, and was
repressed by tetR fusion proteins (Tables S2 and S3). tetR
dissociates from the tet operators in the presence of doxycycline (d),
and repression was relieved at d = 2 mM.
GEV is integrated into the genome into the MRP7 locus; having
five copies in the resulting YSSH208. The plasmids containing the
tetR-Sir3p and tetR-Sum1p constructs were integrated into the
RET2 locus. The GFP reporter constructs were integrated into the
YFR054c locus, unless otherwise specified.
Cells containing inducible gene expression constructs were
grown for 4 h after induction in minimal media, until a cell density
of OD600 = 0.4–0.8.
Figure 8. Control modes of dissolved and anchored regulatory circuits. (A) A regulator dissolved in the protoplasm under constitutive orautocatalytic control can trigger either a graded or binary response in a cell population. (B) A regulator anchored to the chromosome can trigger bothgraded and binary responses at different genes (black-green rectangles) within a single cell.doi:10.1371/journal.pbio.1000332.g008
Chromosomal Epigenetic Regulatory Circuits
PLoS Biology | www.plosbiology.org 10 March 2010 | Volume 8 | Issue 3 | e1000332

Analysis of Mean Expression ValuesCellular fluorescence Fe,d, was measured by flow cytometry.
Total fluorescence of at least 5,000 cells was measured using flow
cytometry. Five to 15% of the total cell population was selected in
the forward-scatter versus side-scatter plot to measure GFP
fluorescence of cells with similar size.
GA is the uninhibited expression at a given estradiol concen-
tration normalized by the maximally induced uninhibited
expression (e = 0.2 mM, d = 2 mM).
GAe,2~Fe,2{FC
F0:2,2{FC
FC is the background fluorescence of the cells. Fold inhibition is
the ratio of the unrepressed expression to the repressed expression
(typically at d = 0), at a given degree of activation.
FIe,d~Fe,2{FC
Fe,d{FC
Thus, normalized gene expression is the product of GA and fold
inhibition at given concentrations of estradiol and doxycycline.
Typically, the OFF cells had fluorescence levels very close to the
cellular fluorescence background, which implies that the values of
fold inhibition 2 1 calculated for the OFF cells after histogram
fitting are associated with large measurement errors. For this
reason, we calculated fold inhibition 2 1 for the entire cell
population, which has a higher fluorescence value.
The inhibition strength is the average value for fold inhibition 2
1 in the interval GA = [0.06, 0.6]. Error bars represent standard
deviations calculated from three experiments.
Histogram Fitting and Bimodality DetectionThe logarithmic cellular fluorescence intensities of more than
30,000 cells were extracted from list mode files. The data were
subjected to an adaptive binning algorithm [60] to determine the
number of bins, and hence, a sampled function of the distribution.
A mixture of two Gaussians (Equation 3) was then fitted to each
discrete distribution using nonlinear regression.
m xð Þ~ ae
x{m1ð Þ22s12
ffiffiffiffiffiffi2pp
s1
zbe
x{m2
� �2
2s22
ffiffiffiffiffiffi2pp
s2
ð3Þ
Finally, the data were transformed from the log space into the
linear space.
To systematically detect bimodality in a distribution, we
performed the following procedure. The fluorescence distribution
was first normalized to a mean of zero, mM = 0, and standard
deviation of 1, sM = 1, and then subjected to binning and
regression, as previously described. Subsequently, we considered
three metapopulations for the further analysis. The first metapop-
ulation corresponded to the measured events (M), with mM = 0 and
sM = 1, since the distribution had been normalized. The
population size was normalized to 100. The two remaining
metapopulations, denoted A and B, represented the two fitted
Gaussian components (Equation 3) with the mean and variance
parameters (mi, si2) resulting from the nonlinear regression,
whereas the respective population sizes na and nb resulted from
the normalization of the coefficients a and b to the sum of 100, na +nb = 100. Thus, the sample sizes of M, A, and B were set
empirically to correspond to percentages. Next, we performed
statistical comparisons between the means of the metapopulations
using two-sample t-test with unequal variance. When the
difference, mM 2 m1 (m1 ,m2,) was significant (a = 1024), the
distribution m(x) was considered bimodal.
Supporting Information
Figure S1 Simulated evolution of concentration ofsilencing proteins in the absence of persistent nucle-ation, sh = 0. An initial pulse was provided in the form of c(x,
0) = 6 within the segment 20.6, x ,0.6 kb. DA = 0.64. The
initiated accumulation of silencing proteins dissipates after around
15 time units, indicating that a constant source of silencing
proteins is needed for the maintenance of concentration profiles in
the range of parameter values used in our simulations.
Found at: doi:10.1371/journal.pbio.1000332.s001 (0.12 MB TIF)
Figure S2 Simulated concentration distribution of si-lencing proteins along a DNA segment with coarsespatial discretization. To account for the compartmental
nature of chromatin, we employed the method of finite difference
to simulate the model (Equation 1). For the Euler discretization of
space and time, the space steps were sized according to the length
of the nucleosome (0.16 kb) to ensure the numerical stability of the
procedure, the time step was considerably smaller than the space
step. The simulation ran to reach 200 time units, similar to the
simulations employing the FEM. The concentration profiles are
comparable to those in Figure 1E and 1F, using the same kinetic
parameters, except for D0 = 0.5, sh = 4; sw had to be extended to
0.16 kb, because this is the minimal nucleation width using the
coarse spatial discretization. The steady-state concentration
profiles were obtained by extending the data points to lines (as
with the zero-order hold procedure) to better illustrate the
coarseness of the space resolution.
Found at: doi:10.1371/journal.pbio.1000332.s002 (0.19 MB TIF)
Figure S3 Parameter dependence of the switch-liketransition. The surface represents the bistable region, which
separates the ON and OFF expression states. L, K, and n were
varied in the range [0.5, 10], [0.5, 10], and [1,3], respectively, with
steps of 0.5 units each. The rest of the parameters were kept
constant at the same values as used for the dual nucleation model
in Figure 1E. Two long-term solutions were calculated, using the
low and high initial conditions, to determine the occurrence of
bistability. The surface was extrapolated from the points
corresponding to parameter triplets (L, K, n) that give rise to
bistability. Note, that for n = 1 (lack of cooperativity), bistability did
not occur.
Found at: doi:10.1371/journal.pbio.1000332.s003 (0.24 MB TIF)
Figure S4 Cellular fluorescence distributions due to theexpression of the [tetO]2-GFP-GALUAS-[tetO]4 constructrepressed by tetR-Sir3. The cells (PRY524.1) were induced
by 2.1, 4.1, 8, 16, and 200 nM estradiol in the absence of
doxycycline.
Found at: doi:10.1371/journal.pbio.1000332.s004 (0.19 MB TIF)
Figure S5 Comparison of the concentration profileswith uniform and nonuniform diffusivities within the[O]2-Gene-[O]4 setting. GA reduces the spreading of the
silencing proteins, which can be mediated by histone acetylation,
and by the activator-induced transcription that disrupts hetero-
chromatin. The former process is expected to reduce diffusivity
around the activator binding sites, whereas the latter reduces
Chromosomal Epigenetic Regulatory Circuits
PLoS Biology | www.plosbiology.org 11 March 2010 | Volume 8 | Issue 3 | e1000332

diffusivity along the entire gene. In the main simulations, the
diffusion coefficient was reduced uniformly in the segment flanked
by the nucleation sites to imitate reduction of diffusivity along the
entire gene (see also [A, C, and E]). For comparison, we simulated
concentration profiles when the diffusivity was reduced nonuni-
formly, around the activator binding sites (B, D, and F). The
results are comparable using the two approaches. (A) DA was
reduced uniformly as GA was increased in-between the nucleation
sites, whereas outside of this region, D0 = 0.64. Curves represent
the functions DA = 0.52, 0.36, and 0.24. (B) The nonuniform
distribution is given by DA(x) = D0N(1+fsN(m, s2))21 where N(m,s2) denotes the Gaussian distribution with mean m and variance
s2. m was set to 20.38 kb, which corresponds to the activator
binding site, while s equals the internucleation distance divided by
four. D0 = 0.64. GA was increased by setting f to 1.5, 6, and
12. (C and D) The red dashed and gray continuous lines
represent the solutions initiated with low and high starting
concentrations. The internucleation distance was 1.2 kb. (E
and F) Simulations as performed in (C) and (D), but the
internucleation distance was increased to 1.5 kb. Consequently,
the synergistic interaction between the two gradients was
abolished.
Found at: doi:10.1371/journal.pbio.1000332.s005 (0.55 MB TIF)
Figure S6 Long-term changes in the cellular fluores-cence distributions due to the expression of the [tetO]2-GFP-[tetO]4 construct repressed by Sum1p or Sum1-1p. The cells were induced by 0, 8, 11.3, 22, and 200 nM
estradiol (denoted by black, blue, green, orange, and red colors,
respectively), in the absence of doxycycline. Cells were grown
exponentially for the period (8 h or 16 h) indicated. Bimodal
expression can be seen 16 h after induction by 11.3 nM estradiol
due to silencing by Sum1-1p.
Found at: doi:10.1371/journal.pbio.1000332.s006 (0.45 MB TIF)
Figure S7 Synergy of repression by Sum1-1p. Sum1-1p
is the T988I mutant form of Sum1p. tetR-Sum1-1p was recruited
to [tetO]2-GFP (DHS43), GFP-[tetO]4 (DHS44), and [tetO]2-
GFP-[tetO]4 (DHS45) constructs. The gray dashed line represents
calculated multiplicative interaction of repression from upstream
and downstream sites. Fold inhibition 2 1 at GA = 0.2 was 13.1
times higher for the dual recruitment construct in comparison to
the multiplicative effect, indicating a very strong synergy (see also
Figure 5A).
Found at: doi:10.1371/journal.pbio.1000332.s007 (0.16 MB TIF)
Figure S8 The I silencer alone does not repress thereporter gene. The expression induced by GEV at the I
silencer-GFP-[tetO]4 construct (PRY544.1, 2545.1) was not lower
than that at the GFP-tetO4 construct (YJK15), in nonrepressive
conditions (tetR-Sum1p and tetR-Sir3p do not repress expression
in the presence of 2 mM doxycycline). Thus, the I silencer alone
does not repress the reporter gene; it has rather a weak activatory
potential.
Found at: doi:10.1371/journal.pbio.1000332.s008 (0.23 MB TIF)
Figure S9 Cellular fluorescence distributions due to theexpression of the I-silencer-GFP-tetO construct re-pressed by tetR-Sir3. The cells (PRY544.1) were induced
by 1.5, 5.8, 8, 11, and 200 nM estradiol, in the absence of
doxycycline.
Found at: doi:10.1371/journal.pbio.1000332.s009 (0.19 MB TIF)
Figure S10 Collapse of bimodal expression as thedistance between the recruitment sites for tetR-Sum1is increased. (A) Sum1p was recruited to the dual recruitment
constructs enclosing reporter genes of varying lengths (GFP,
[GFP]2, GFP-T-YFP, GFP-T-lacZ integrated within the respective
strains: YJKD-16, 23.4, 23.5, 23.6). The relative inhibition
denotes the inhibition strength (see Materials and Methods) of the
dual recruitment constructs normalized using the [tetO]2-GFP
construct. The inhibition strength is the average value of the fold
inhibition 2 1 interpolated on the interval GA = [0.06, 0.6]. Error
bars represent standard deviations calculated from three experi-
ments. (B and C) Cellular fluorescence distributions due to the
expression of the [tetO]2-[GFP]2-[tetO]4 (B) and [tetO]2-GFP-T-
lacZ-[tetO]4 (C) constructs repressed by Sum1p. The cells were
induced by 0, 4.1, 5.8, 16, and 200 nM estradiol, in the absence of
doxycycline. No bimodal response was detected for the [tetO]2-
GFP-T-lacZ-[tetO]4 construct.
Found at: doi:10.1371/journal.pbio.1000332.s010 (0.36 MB TIF)
Figure S11 Cellular fluorescence distributions whenexpression is repressed by Sum1p. The cells (YJKD21.2.2
and YJK16) were induced by 3.75, 7.5, 15, 30, and 200 nM
estradiol, in the absence of doxycycline.
Found at: doi:10.1371/journal.pbio.1000332.s011 (0.24 MB TIF)
Figure S12 Monostable concentration profiles arisewhen cooperativity in the positive feedback loop issmall. The Hill coefficient was reduced from 2 to n = 1.5. The
following parameters were used for the simulations: sh = 6, L = 5,
K = 5, b = 0.01, and kd = 1. The internucleation distance was 1.2 kb
for the [O]2-Gene-[O]2 setting. (A) The red dashed and gray
continuous lines represent the solutions initiated with low and high
starting concentrations. The blue lines delimit the nucleation sites.
When the two concentration profiles overlap red–gray dashed
lines are visible. Monostable concentration profiles were obtained
even at intermediate GA. (B) Inhibition of gene expression,
expressed as fold inhibition 2 1, was calculated from the values of
the silencing concentration gradients. Even though there is no
bistability at intermediate GA, a sigmoidal change in fold inhibition
can be seen in this range.
Found at: doi:10.1371/journal.pbio.1000332.s012 (0.25 MB TIF)
Figure S13 Bistable concentration profiles are confinedto the proximity of the nucleating segment whendiffusivity is low relative to the nucleation width. The
following parameters were used for the simulations: sh = 0.3, L = 5,
K = 7, b = 0.01, and kd = 1 for a [O]20-Gene setting. DA was set to
the indicated values uniformly between the boundaries of the
simulation. The blue lines delimit the nucleation segment,
sw = 0.741 kb. The widening of the nucleation segment and
reduction of the diffusivity renders the spatial aspect of the
reaction–diffusion system less pronounced. Consequently, the
behavior of the systems approximates that of a simple (nonspatial)
positive feedback loop that generates bistability. The yellow dots
denote the concentrations at 20.38 and 0 kb, which determine the
level of GA. (A and B) The red dashed and gray continuous lines
represent the solutions initiated with low and high starting
concentrations with DA = 0.2 (A) and 0.6 (B). Bistable solution is
obtained for lower diffusivity, DA = 0.2. It is evident that the
silencing proteins do not propagate to long distances relative to the
width of the nucleation segment and the concentrations of the
silencing proteins at the gene regulatory region (yellow dots) are
low even for the high-concentration profile. Thus, they have an
effect on gene expression only in the vicinity of the nucleating
segment. (C) The magnified version of the low-concentration
profiles is displayed for DA = 0.2 (thin line) and 0.6 (thick line). It is
evident that the concentration profile obtained for the lower
diffusivity is more square-like.
Found at: doi:10.1371/journal.pbio.1000332.s013 (0.29 MB TIF)
Chromosomal Epigenetic Regulatory Circuits
PLoS Biology | www.plosbiology.org 12 March 2010 | Volume 8 | Issue 3 | e1000332

Table S1 Constants used in the equations.Found at: doi:10.1371/journal.pbio.1000332.s014 (0.04 MB
DOC)
Table S2 Strains.Found at: doi:10.1371/journal.pbio.1000332.s015 (0.06 MB
DOC)
Table S3 Plasmids.Found at: doi:10.1371/journal.pbio.1000332.s016 (0.05 MB
DOC)
Text S1 Supporting text and references.Found at: doi:10.1371/journal.pbio.1000332.s017 (0.05 MB
DOC)
Acknowledgments
We thank Melanie Anding for technical help, Walter Schaffner for helpful
discussion, and Bernhard Dichtl for comments on the manuscript.
Author Contributions
The author(s) have made the following declarations about their
contributions: Conceived and designed the experiments: AB. Performed
the experiments: JZK PR. Analyzed the data: JZK AB. Contributed
reagents/materials/analysis tools: SS. Wrote the paper: JZK AB.
References
1. Nevozhay D, Adams RM, Murphy KF, Josic K, Balazsi G (2009) Negativeautoregulation linearizes the dose-response and suppresses the heterogeneity of
gene expression. Proc Natl Acad Sci U S A 106: 5123–5128.
2. Takahashi S, Pryciak PM (2008) Membrane localization of scaffold proteinspromotes graded signaling in the yeast MAP kinase cascade. Curr Biol 18:
1184–1191.
3. Ferrell JE, Jr., Bhatt RR (1997) Mechanistic studies of the dual phosphorylation
of mitogen-activated protein kinase. J Biol Chem 272: 19008–19016.
4. Blake WJ, Balazsi G, Kohanski MA, Isaacs FJ, Murphy KF, et al. (2006)Phenotypic consequences of promoter-mediated transcriptional noise. Mol Cell
24: 853–865.
5. Paliwal S, Iglesias PA, Campbell K, Hilioti Z, Groisman A, et al. (2007) MAPK-
mediated bimodal gene expression and adaptive gradient sensing in yeast.Nature 446: 46–51.
6. Kim SY, Ferrell JE, Jr. (2007) Substrate competition as a source of
ultrasensitivity in the inactivation of Wee1. Cell 128: 1133–1145.
7. Burnett JC, Miller-Jensen K, Shah PS, Arkin AP, Schaffer DV (2009) Control of
stochastic gene expression by host factors at the HIV promoter. PLoS Pathog 5:e1000260. doi:10.1371/journal.ppat.1000260.
8. Ansel J, Bottin H, Rodriguez-Beltran C, Damon C, Nagarajan M, et al. (2008)
Cell-to-cell stochastic variation in gene expression is a complex genetic trait.PLoS Genet 4: e1000049. doi:10.1371/journal.pgen.1000049.
9. Kalmar T, Lim C, Hayward P, Munoz-Descalzo S, Nichols J, et al. (2009)
Regulated fluctuations in Nanog expression mediate cell fate decisions in
embryonic stem cells. PLoS Biol 7: e1000149. doi:10.1371/journal.-pbio.1000149.
10. Muzzey D, van Oudenaarden A (2006) When it comes to decisions, myeloid
progenitors crave positive feedback. Cell 126: 650–652.
11. Macarthur BD, Ma’ayan A, Lemischka IR (2009) Systems biology of stem cell
fate and cellular reprogramming. Nat Rev Mol Cell Biol 10: 672–681.
12. Rice KL, Hormaeche I, Licht JD (2007) Epigenetic regulation of normal andmalignant hematopoiesis. Oncogene 26: 6697–6714.
13. Hutchins AS, Mullen AC, Lee HW, Sykes KJ, High FA, et al. (2002) Gene
silencing quantitatively controls the function of a developmental trans-activator.
Mol Cell 10: 81–91.
14. Fourel G, Lebrun E, Gilson E (2002) Protosilencers as building blocks forheterochromatin. Bioessays 24: 828–835.
15. Tiwari VK, McGarvey KM, Licchesi JD, Ohm JE, Herman JG, et al. (2008)
PcG proteins, DNA methylation, and gene repression by chromatin looping.PLoS Biol 6: e306. doi:10.1371/journal.pbio.0060306.
16. Martinez CA, Arnosti DN (2008) Spreading of a corepressor linked to action oflong-range repressor hairy. Mol Cell Biol 28: 2792–2802.
17. Nibu Y, Zhang H, Levine M (2001) Local action of long-range repressors in the
Drosophila embryo. EMBO J 20: 2246–2253.
18. Talbert PB, Henikoff S (2006) Spreading of silent chromatin: inaction at a
distance. Nat Rev Genet 7: 793–803.
19. Rossi FM, Kringstein AM, Spicher A, Guicherit OM, Blau HM (2000)Transcriptional control: rheostat converted to on/off switch. Mol Cell 6:
723–728.
20. Halme A, Bumgarner S, Styles C, Fink GR (2004) Genetic and epigeneticregulation of the FLO gene family generates cell-surface variation in yeast. Cell
116: 405–415.
21. Domergue R, Castano I, De Las Penas A, Zupancic M, Lockatell V, et al. (2005)
Nicotinic acid limitation regulates silencing of Candida adhesins during UTI.Science 308: 866–870.
22. Becskei A, Seraphin B, Serrano L (2001) Positive feedback in eukaryotic gene
networks: cell differentiation by graded to binary response conversion. EMBO J
20: 2528–2535.
23. Yeh BJ, Lim WA (2007) Synthetic biology: lessons from the history of syntheticorganic chemistry. Nat Chem Biol 3: 521–525.
24. Buetti-Dinh A, Ungricht R, Kelemen JZ, Shetty C, Ratna P, et al. (2009)
Control and signal processing by transcriptional interference. Mol Syst Biol 5:
300.
25. Greber D, Fussenegger M (2007) Mammalian synthetic biology: engineering of
sophisticated gene networks. J Biotechnol 130: 329–345.
26. Tan C, Marguet P, You L (2009) Emergent bistability by a growth-modulating
positive feedback circuit. Nat Chem Biol 5: 842–848.
27. Adkins NL, McBryant SJ, Johnson CN, Leidy JM, Woodcock CL, et al. (2009)
Role of nucleic acid binding in Sir3p-dependent interactions with chromatin
fibers. Biochemistry 48: 276–288.
28. Sedighi M, Sengupta AM (2007) Epigenetic chromatin silencing: bistability and
front propagation. Phys Biol 4: 246–255.
29. Biebricher A, Wende W, Escude C, Pingoud A, Desbiolles P (2009) Tracking of
single quantum dot labeled EcoRV sliding along DNA manipulated by double
optical tweezers. Biophys J 96: L50–52.
30. McKinney K, Mattia M, Gottifredi V, Prives C (2004) p53 linear diffusion along
DNA requires its C terminus. Mol Cell 16: 413–424.
31. Bodnar M, Velazquez JJL (2005) Derivation of macroscopic equations for
individual cell-based models: a formal approach. Math Methods Appl Sci 28:
1757–1779.
32. Murray JD (2007) Mathematical biology: I. An introduction. New York (New
York): Springer. 555 p.
33. Buhler M, Gasser SM (2009) Silent chromatin at the middle and ends: lessons
from yeasts. EMBO J 28: 2149–2161.
34. Chou CC, Li YC, Gartenberg MR (2008) Bypassing Sir2 and O-acetyl-ADP-
ribose in transcriptional silencing. Mol Cell 31: 650–659.
35. Fourel G, Magdinier F, Gilson E (2004) Insulator dynamics and the setting of
chromatin domains. Bioessays 26: 523–532.
36. King DA, Hall BE, Iwamoto MA, Win KZ, Chang JF, et al. (2006) Domain
structure and protein interactions of the silent information regulator Sir3
revealed by screening a nested deletion library of protein fragments. J Biol Chem
281: 20107–20119.
37. Fourel G, Boscheron C, Revardel E, Lebrun E, Hu YF, et al. (2001) An
activation-independent role of transcription factors in insulator function. EMBO
Rep 2: 124–132.
38. Ratna P, Scherrer S, Fleischli C, Becskei A (2009) Synergy of repression and
silencing gradients along the chromosome. J Mol Biol 387: 826–839.
39. Vasiljeva L, Kim M, Terzi N, Soares LM, Buratowski S (2008) Transcription
termination and RNA degradation contribute to silencing of RNA polymerase II
transcription within heterochromatin. Mol Cell 29: 313–323.
40. Irlbacher H, Franke J, Manke T, Vingron M, Ehrenhofer-Murray AE (2005)
Control of replication initiation and heterochromatin formation in Saccharo-
myces cerevisiae by a regulator of meiotic gene expression. Genes Dev 19:
1811–1822.
41. Xie J, Pierce M, Gailus-Durner V, Wagner M, Winter E, et al. (1999) Sum1 and
Hst1 repress middle sporulation-specific gene expression during mitosis in
Saccharomyces cerevisiae. EMBO J 18: 6448–6454.
42. Boscheron C, Maillet L, Marcand S, Tsai-Pflugfelder M, Gasser SM, et al.
(1996) Cooperation at a distance between silencers and proto-silencers at the
yeast HML locus. EMBO J 15: 2184–2195.
43. Klar AJ, Kakar SN, Ivy JM, Hicks JB, Livi GP, et al. (1985) SUM1, an apparent
positive regulator of the cryptic mating-type loci in Saccharomyces cerevisiae.
Genetics 111: 745–758.
44. Yu Q, Elizondo S, Bi X (2006) Structural analyses of Sum1-1p-dependent
transcriptionally silent chromatin in Saccharomyces cerevisiae. J Mol Biol 356:
1082–1092.
45. Bolouri H (2008) Embryonic pattern formation without morphogens. Bioessays
30: 412–417.
46. Halfon MS (2006) (Re)modeling the transcriptional enhancer. Nat Genet 38:
1102–1103.
47. Zhang Y, Lin N, Carroll PM, Chan G, Guan B, et al. (2008) Epigenetic blocking
of an enhancer region controls irradiation-induced proapoptotic gene expression
in Drosophila embryos. Dev Cell 14: 481–493.
48. Schwartz YB, Pirrotta V (2008) Polycomb complexes and epigenetic states. Curr
Opin Cell Biol 20: 266–273.
Chromosomal Epigenetic Regulatory Circuits
PLoS Biology | www.plosbiology.org 13 March 2010 | Volume 8 | Issue 3 | e1000332

49. Choi JK, Hwang S, Kim YJ (2008) Stochastic and regulatory role of chromatin
silencing in genomic response to environmental changes. PLoS ONE 3: e3002.doi:10.1371/journal.pone.0003002.
50. Xu EY, Zawadzki KA, Broach JR (2006) Single-cell observations reveal
intermediate transcriptional silencing states. Mol Cell 23: 219–229.51. Rando OJ, Paulsson J (2006) Noisy silencing of chromatin. Dev Cell 11:
134–136.52. Saveliev A, Everett C, Sharpe T, Webster Z, Festenstein R (2003) DNA triplet
repeats mediate heterochromatin-protein-1-sensitive variegated gene silencing.
Nature 422: 909–913.53. Raj A, Peskin CS, Tranchina D, Vargas DY, Tyagi S (2006) Stochastic
mRNA synthesis in mammalian cells. PLoS Biol 4: e309. doi:10.1371/journal.pbio.0040309.
54. Yin S, Wang P, Deng W, Zheng H, Hu L, et al. (2009) Dosage compensation onthe active X chromosome minimizes transcriptional noise of X-linked genes in
mammals. Genome Biol 10: R74.
55. Kagansky A, Folco HD, Almeida R, Pidoux AL, Boukaba A, et al. (2009)
Synthetic heterochromatin bypasses RNAi and centromeric repeats to establishfunctional centromeres. Science 324: 1716–1719.
56. Buhler M, Verdel A, Moazed D (2006) Tethering RITS to a nascent transcript
initiates RNAi- and heterochromatin-dependent gene silencing. Cell 125:873–886.
57. Bruggeman FJ, Oancea I, van Driel R (2008) Exploring the behavior of smalleukaryotic gene networks. J Theor Biol 252: 482–487.
58. Benecke A (2006) Chromatin code, local non-equilibrium dynamics, and the
emergence of transcription regulatory programs. Eur Phys J E Soft Matter 19:353–366.
59. Hnisz D, Schwarzmuller T, Kuchler K (2009) Transcriptional loops meetchromatin: a dual-layer network controls white-opaque switching in Candida
albicans. Mol Microbiol 74: 1–15.60. Shimazaki H, Shinomoto S (2007) A method for selecting the bin size of a time
histogram. Neural Comput 19: 1503–1527.
Chromosomal Epigenetic Regulatory Circuits
PLoS Biology | www.plosbiology.org 14 March 2010 | Volume 8 | Issue 3 | e1000332


