Embed Size (px)
Citation preview

Spatial Methods of Epicardial Activation Time Determinationin Normal Hearts
BONNIE B. PUNSKE,1 QUAN NI,2 ROBERT L. LUX,1 ROBERT S. MACLEOD,1 PHILIP R. ERSHLER,1THEODORE J. DUSTMAN,1 MATTHEW J. ALLISON,1 and BRUNO TACCARDI1
1Nora Eccles Harrison Cardiovascular Research and Training Institute, University of Utah, Salt Lake City, UTand 2Guidant Corporation, St. Paul, MN
(Received 6 May 2002; accepted 14 March 2003)
Abstract—The purpose of this study was to demonstrate errorsin activation time maps created using the time derivativemethod on fractionated unipolar electrograms, to characterizethe epicardial distribution of those fractionated electrograms,and to investigate spatial methods of activation time determi-nation. Electrograms !EGs" were recorded using uniform gridsof electrodes !1 or 2 mm spacing" on the epicardial surface ofsix normal canine hearts. Activation times were estimated usingthe time of the minimum time derivative, maximum spatialgradient, and zero Laplacian and compared with the time ofarrival of the activation wave front as assessed from a timeseries of potential maps as the standard. When comparing ac-tivation times from the time derivative for the case of epicar-dial pacing, spatial gradient and Laplacian methods with thestandard for EGs without fractionation, correlations were high(R2!0.98, 0.98, 0.97, respectively". Similar comparisons usingresults from only fractionated EGs (R2!0.85,0.97,0.95)showed a lower correlation between times from the time de-rivative method and the standard. The results suggest an ad-vantage of spatial methods over the time derivative methodonly for the case of epicardial pacing where large numbers offractionated electrograms are found. © 2003 Biomedical En-gineering Society. #DOI: 10.1114/1.1581877$
Keywords—Activation time mapping, Spatial gradient, SurfaceLaplacian, Isochronal map, Unipolar electrograms.
INTRODUCTION
Isochronal maps of cardiac activation are commonlyused to study the spread of excitation in the heart, toidentify the mechanism of atrial and ventricular arrhyth-mias, to localize conduction disorders, and to guide ab-lative therapies. To obtain epicardial isochronal maps weneed to measure activation times over an epicardial re-gion, with adequate space and time resolution, possiblyon a beat-to-beat basis.15The most generally used methods for determining ac-
tivation times are based on analyzing unipolar or bipolar
electrograms !EGs" recorded from electrode arrays, ap-plied directly to the heart.5,8,15,16,34,35 These methods of-ten provide satisfactory descriptions of the spread ofexcitation, but there are cases in which the results areambiguous, uncertain, or even erroneous, even in normalhearts.15 The purpose of this study is to describe thedifficulties encountered using conventional methods ofactivation time determination for unipolar electrogramsand to investigate alternative methods.When analyzing unipolar electrograms, the time of
minimum derivative during the QRS interval is generallyconsidered the best index of local activation time. Ex-perimental measurements and computer models haveshown that activation times obtained with this methodare highly correlated with the time of maximum deriva-tive during the upstroke of the local transmembrane ac-tion potential.31,33 Preliminary experimental observationsfrom our laboratory showed that the method of the mini-mum derivative occasionally gave unsatisfactory or am-biguous results suggesting large errors.27 This happenedwhen unipolar EGs exhibited a slow, fractionated down-stroke with a total duration of up to 30 ms or more, andthe resulting time derivative showed multipleminima.12,15,17,32 This study will demonstrate that choos-ing activation times from the absolute minimum of mul-tipeaked time derivatives can result in activation mapsthat exhibit errors or inconsistencies.To establish the magnitude and spatial distribution of
errors in activation time determination and to evaluatethe accuracy of alternative methods, a reference or ‘‘goldstandard’’ is necessary. For the most accurate assessmentof local activation the time of the upstroke of the trans-membrane or monophasic action potential is the beststandard for comparison with other methods.10,31 How-ever, the use of monophasic or transmembrane measure-ments is not practical for application to hundreds ofclosely spaced sites in a beating heart.Without simultaneous monophasic or transmembrane
measurements from all regions of the heart for compari-
Address correspondence to Dr. Bonnie B. Punske, University ofUtah, Nora Eccles Harrison CVRTI, 95 South 2000 East, Salt LakeCity, UT 84112-5000. Electronic mail: [email protected]
Annals of Biomedical Engineering, Vol. 31, pp. 781–792, 2003 0090-6964/2003/31!7"/781/12/$20.00Printed in the USA. All rights reserved. Copyright © 2003 Biomedical Engineering Society
781

son, another good measure of activation time is to ana-lyze sequences of instantaneous isopotential contourmaps from recordings in the area of interest, a methoddescribed by Arisi et al.1,2 based on the classical work ofLorente de No19 and Plonsey.23 Using epicardial isopo-tential maps, the shape and position of an advancingdepolarization wave front are revealed by a band ofdensely packed isopotential lines, which are an expres-sion of the high extracellular potential gradient associ-ated with the wave front. A number of three-dimensionalcomputer simulation studies have shown that the inter-section of the wave front with the epicardium is coinci-dent with the dense array of epicardial equipotentiallines.6,14,22,24 By taking the time of arrival of this densearray of isopotential lines to an electrode location as theindicator of local activation time at that site, the uncer-tainties in activation time maps obtained by other meth-ods can be evaluated.The method of detecting activation by identifying
dense arrays of equipotential lines is reliable but imprac-tical because it requires visual analysis of many dozensof instantaneous potential maps, each of which providesonly one isochronal line. Moreover, the visual identifica-tion of the sites with the highest density of isopotentiallines may be at least partly subjective. Therefore, a goalof this study was to implement alternative methods thatare also based on detecting the extracellular electricalmanifestations of a spreading wave front, but which canbe actuated automatically and accurately by computer.The high current density and the presence of a series
of adjacent source-sink pairs across the wave front offerother ways for localizing the intersection of the wavefront with the epicardium. The high spatial potential gra-dients and the source-sink pairs can be identified andlocalized, for every time instant, by computing the firstspatial derivative !spatial gradient, a vector" and the sec-ond spatial derivative !Laplacian, a scalar" of the epicar-dial potential distribution, respectively. The feasibility ofusing the spatial gradient to determine activation timewas first reported by Lux et al.20 Similarly, the secondspatial derivative or the three-dimensional Laplacian ofthe potentials can identify the location of a wave front asthe locus of points that separate the current sources pre-ceding the wave front from the current sinks followingthe wave front. Coronel et al. used the surface Laplacianelectrogram to assess activation times during ventricularfibrillation on the epicardial surface.7The spatial gradient and the surface Laplacian meth-
ods of activation time determination offer the advantagesof both having a clear biophysical basis as detectors ofthe underlying wave front and requiring relatively simplemathematical and computational implementation. As aresult, we hypothesized that these methods would pro-duce more accurate isochronal maps than the time de-rivative approach in areas where unipolar EGs have frac-
tionated downstrokes. This study proposes to first,demonstrate errors in isochronal maps created using thetime derivative method of activation time determinationon fractionated unipolar electrograms. The second objec-tive is to characterize the epicardial distribution of thosefractionated electrograms that contribute to these errors.The third aim of the study is to investigate how wellspatial methods of activation time determination performwhen applied to epicardial unipolar electrograms in nor-mal hearts and determine if spatial methods generatemore accurate results in cases where electrograms showa fractionated downstroke during the QRS interval.
METHODS
Experimental Preparation
All experimental protocols for this study were ap-proved by our institution’s animal care and use commit-tee and conform to the Guide for the Care and Use ofLaboratory Animals !NIH 1985". Six mongrel dogs,weighing 25"6 kg were anesthetized with 30 mg/kg so-dium pentobarbital I.V. with additional amounts admin-istered as needed. A median sternotomy or left lateralthoracotomy was performed and the heart was suspendedin a pericardial cradle. A flexible piece of nylon with 744(31#24, 1 mm spacing", 525 (25#21, 2 mm spacing",or 960 !nonrectangular, 2 mm spacing" silver electrodewires !0.003 in. diameter" attached in a uniform grid,was placed on the epicardial surface. A 2 mm long sec-tion of insulation was removed from the tip of each wire.Then the uninsulated wire was tied in a tiny knot !%0.15mm in diameter" around a thread of nylon and trimmedto generate the electrode.2 Three of the studies exploredportions of the anterior right ventricular surface and theother three studies explored portions of the anterior leftventricular surface.Unipolar electrograms, referenced to a remote elec-
trode placed on the left hind leg, were recorded from theelectrode arrays. The six hearts were paced from theright atrium and from a total of 29 different ventricularlocations on the left and right ventricles !7 epicardial, 4endocardial, and 18 intramural locations" at variousdepths.
Data Collection and Analysis
All signals were amplified in groups of 192, 256, or1024, digitized at a sampling rate of 1 kHz with 12-bitresolution, and stored on a Macintosh computer.9 Theamplifiers provided bandpass filtering from 0.03 to 500Hz. Potential values were gain adjusted using calibrationsignals and linear base lines were established betweenconsecutive TP intervals.Signal noise was assessed by taking the root mean
square !rms" voltage from 60 ms of data during the
782 PUNSKE et al.

quiescent TP segment of the signals from all electrodelocations. The average rms voltage of the TP segmentcompiled from all six experiments was 0.018"0.024 mV, with the maximum rms voltage found inany TP segment equal to 0.28"0.49 mV. The maximumvalue of the noise only represents 1% of the peak rms ofthe recorded potentials during the QRS interval (24.3"5.0 mV). The TP segments were then differentiated todetermine the variation in the value of the derivative thatcould be attributed to the presence of noise in the signal.The average rms value of the derivative of the TP seg-ments from all six experiments was 0.0005"0.011 mV/ms, with the maximum value found in anyTP segment equal to 0.004"0.016 mV/ms. The maxi-mum value of the noise in the derivative represented lessthan 1% of the peak rms value of the derivative duringthe QRS interval (3.9"1.4 mV/ms).Activation times at all electrode sites were estimated
using minimum time derivative, maximum spatial gradi-ent, zero Laplacian, and the time of arrival of the depo-larization wave front as seen in the time series of isopo-tential maps. All activation times were referenced to thetime of the pacing artifact for ventricularly paced beatsor to the onset of the QRS complex for atrially pacedbeats. For the minimum time derivative method, eachunipolar EG was differentiated with respect to time(dV/dt) using least squares fit of a quadratic function tothe potential values !see the Appendix". The time of theminimum value of the derivative was taken as the acti-vation time for each electrode site. Fractionated electro-grams were identified from all electrode sites from allstudies as any that had a time derivative containing morethan a single local minimum during the downstroke ofthe QRS interval.Activation time was assessed as the time of arrival of
the depolarization wave front as seen in the time seriesof isopotential maps. The frames of instantaneous poten-tial maps were advanced in time until the wave front asrepresented by the dense band of isopotential lines wascentered over the electrode location. That time instantwas then taken as the activation time for that electrodesite. Activation times were assessed with this method forevery fifth recorded EG, constituting a subset of the dataset.The spatial gradient (&V!'V/'xi$'V/'yj) was cal-
culated using a standard central difference approach!MATLAB® version 6.0" from the potential values fromthe four neighboring electrode sites !2 in the vertical and2 in the horizontal direction" for every time instant dur-ing the QRS complex. One-sided differences were usedat the edges of the array. The magnitude of the gradient(!&V!!!('V/'x)2$('V/'y)2) was calculated at everytime instant for every site. The time of maximum mag-nitude of the spatial gradient for any given lead was usedto indicate activation time.
The surface Laplacian (&2V!'2V/'x2$'2V/'y2)was similarly calculated as the difference between thepotential value at any site and the average of the valuesfrom the four closest sites in the uniform grid of elec-trodes !see del2 function in MATLAB® version 6.0".Electrode sites on the corners or edges of the array usedvalues from the two or three nearest sites for the aver-age. The Laplacian was calculated for every time instantduring the QRS complex. The values of the Laplacian ata given electrode location were plotted as a function oftime, and the time of zero crossing was taken as theactivation time at that site. The algorithm to detect thetime of zero crossing used the maximum derivative ofthe Laplacian as a first approximation and found thenearest zero crossing. If there was no local zero crossing,then the time of maximum derivative of the Laplacianwas taken as the activation time.Spatial distributions of potentials, activation times,
magnitude of the gradient, and values of the Laplacianwere displayed in the form of two-dimensional contourmaps on a Silicon Graphics® workstation using customsoftware.21 Linear interpolation was used to generatecontour lines between the measured values in all maps.
Statistical Analysis
The values of activation times from all methods werecompared using simple linear regression. The square ofthe correlation coefficient, R2, was reported as an ex-pression of the goodness of the linear fit. The amplitudeof the derivative and the magnitude of the potential gra-dient for all EGs and EGs with multipeaked time deriva-tives were compared using a student’s t test with p!0.05 considered significant. A student’s t test was usedto compare the values of the slope and intercept fromlinear regression with the expected values of 1 and 0,respectively, with p!0.05 considered significant.
RESULTS
Errors in Activation Time Associated with the TimeDerivative
Figure 1!G" shows an activation time map generatedby choosing the time of the minimum of the time de-rivative of the unipolar electrograms collected from a525 electrode array !2 mm spacing" positioned on theanterior right ventricle as shown in the schematic #panel!G"$. Electrograms in panels !A"–!F" were recorded fromlocations marked with black dots in the isochronal map.The corresponding time derivatives are shown just beloweach EG. Electrograms !A", !B", and !C", recorded fromsites as marked, show sharp intrinsic deflections and adistinct, single minimum in each of the time derivativesignals. EGs !D", !E", and !F" show slow, fractionateddownstrokes with corresponding low amplitude deriva-
783Spatial Methods for Activation Time Determination

tives lacking single, clear-cut minima during the down-stroke of the QRS. The isochronal lines near sites !D"and !E" #panel !G"$ show abrupt changes in density sug-gesting corresponding changes in apparent velocity. Asimple estimation of conduction velocity near sites !D"and !E" across the crowded isochrones to the sitesmarked with x’s resulted in values of 7 and 6 cm/s,respectively. These values are below the physiologicalranges reported in the literature for normal canine ven-tricles !49–88 cm/s along fibers and 14–25 cm/s acrossfibers".26 The time of activation as indicated by the mini-mum of the time derivative in electrograms !D" and !E"occurs at 30 ms after the pacing stimulus #see panel !J"$.An isopotential map taken at the 30 ms time frame isshown in panel !I". The dense band of isopotential linesindicating the location of the depolarization wave front
has clearly passed beyond the electrode sites marked by!D" and !E" in the map. In the previous panel !H" takenat 18 ms, the wave front appears to be directly overelectrode sites !D" and !E". This implies a 12 ms dis-crepancy between the activation time determined by theminimum derivative and that based on the time of arrivalof the wave front in the isopotential maps. A recalcula-tion of the velocities using the 18 ms activation time atsites !D" and !E" resulted in values of 24 and 21 cm/s,respectively, which are within the reported ranges.26Figure 2!A" shows an isochronal map from a 744
electrode array with 1 mm uniform spacing for a leftventricular paced beat. Electrode sites that are markedwith black dots (n!238) indicate locations where thetime derivatives exhibited multi-peaked morphologies.Figure 2!B" shows the same isochronal map with activa-
FIGURE 1. „A…–„F… Epicardial unipolar EGs normalized with voltage maxÕmin indicated in mV. Below each EG is the correspond-ing time derivative „dVÕdt… with the minimum value „mVÕms… indicated „vertical bars mark minimum dVÕdt…. „G… Epicardialisochronal map „pacing site indicated by a star, local fiber direction indicated by a double arrow… generated using the time ofthe minimum dVÕdt. Activation times for each contour line indicated in the boxes. Electrode recording sites for the EGs inpanels „A…–„F… are indicated and marked by black dots. Schematic location of electrode placement on the epicardium is shownbelow panel „G…. „H… Isopotential map taken at 18 ms after stimulation „pacing site indicated by a star… showing electrode sites„D… and „E… „black dots… within the potential jump associated with the wave front. Potential min, max and contour step „inparentheses… indicated in mV. „I… Isopotential map taken at 30 ms after stimulation „pacing site indicated by a star…. Potentialmin, max, and contour step „in parentheses… indicated in mV. „J… EGs D and E are shown with the time of stimulation, 18 and30 ms marked with vertical bars.
784 PUNSKE et al.
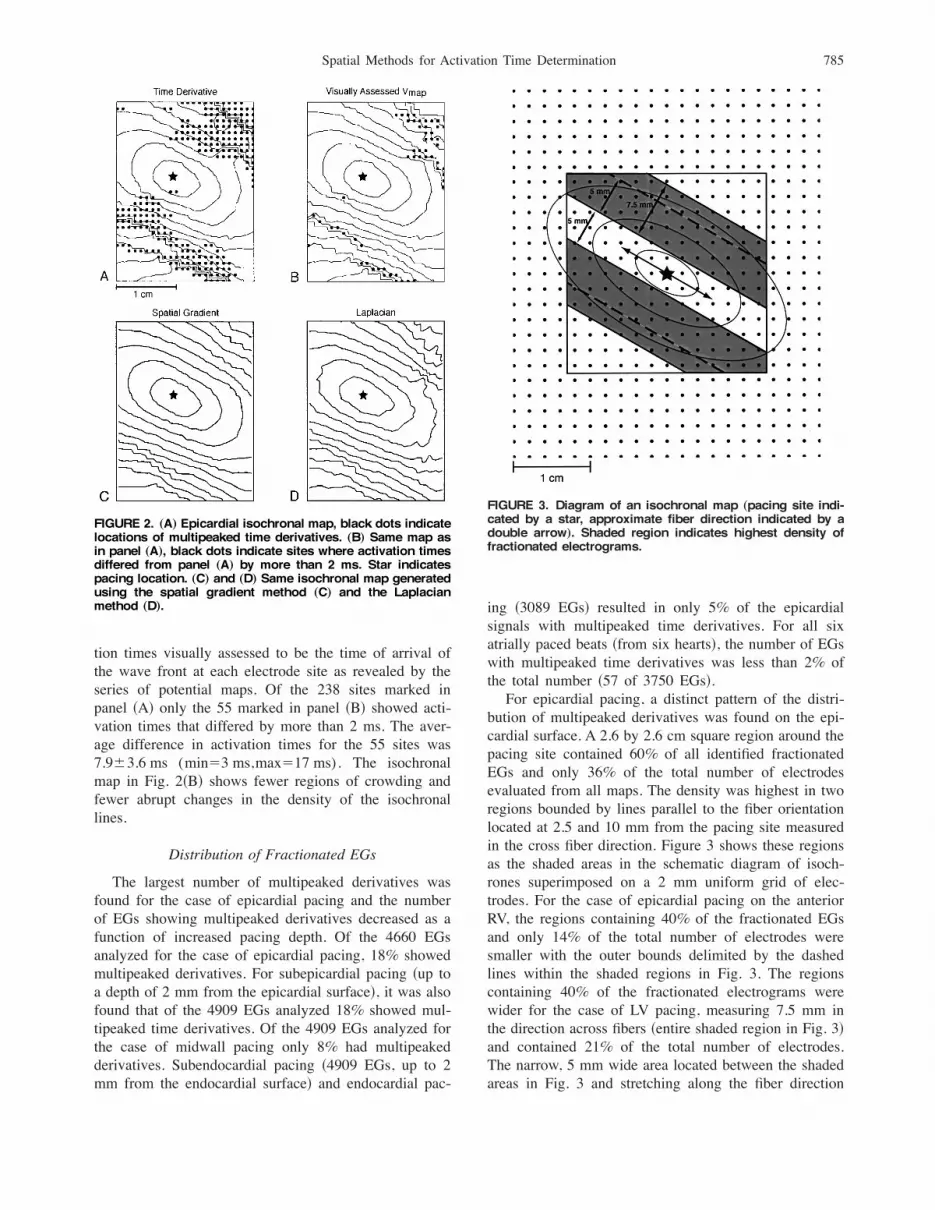
tion times visually assessed to be the time of arrival ofthe wave front at each electrode site as revealed by theseries of potential maps. Of the 238 sites marked inpanel !A" only the 55 marked in panel !B" showed acti-vation times that differed by more than 2 ms. The aver-age difference in activation times for the 55 sites was7.9"3.6 ms (min!3 ms,max!17 ms). The isochronalmap in Fig. 2!B" shows fewer regions of crowding andfewer abrupt changes in the density of the isochronallines.
Distribution of Fractionated EGs
The largest number of multipeaked derivatives wasfound for the case of epicardial pacing and the numberof EGs showing multipeaked derivatives decreased as afunction of increased pacing depth. Of the 4660 EGsanalyzed for the case of epicardial pacing, 18% showedmultipeaked derivatives. For subepicardial pacing !up toa depth of 2 mm from the epicardial surface", it was alsofound that of the 4909 EGs analyzed 18% showed mul-tipeaked time derivatives. Of the 4909 EGs analyzed forthe case of midwall pacing only 8% had multipeakedderivatives. Subendocardial pacing !4909 EGs, up to 2mm from the endocardial surface" and endocardial pac-
ing !3089 EGs" resulted in only 5% of the epicardialsignals with multipeaked time derivatives. For all sixatrially paced beats !from six hearts", the number of EGswith multipeaked time derivatives was less than 2% ofthe total number !57 of 3750 EGs".For epicardial pacing, a distinct pattern of the distri-
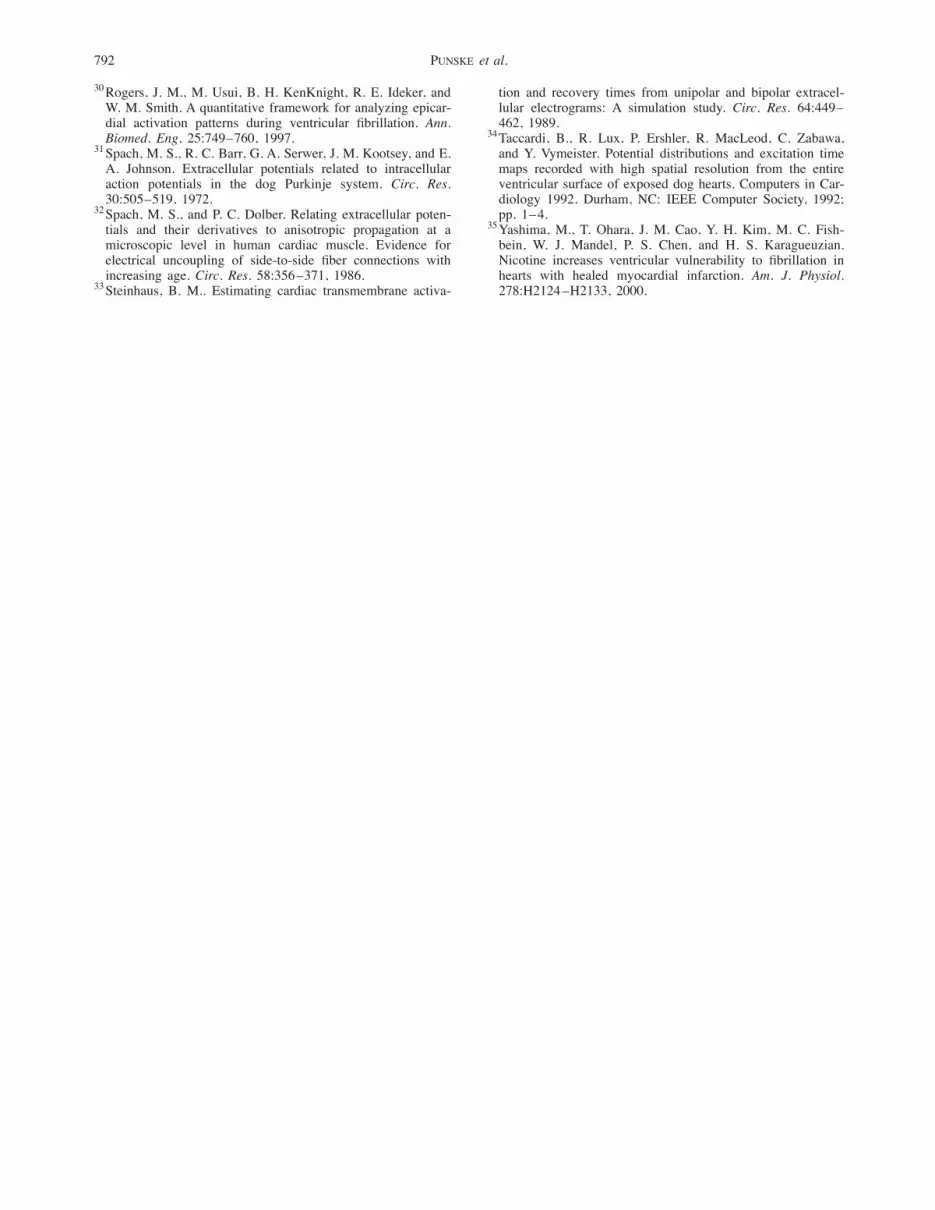
bution of multipeaked derivatives was found on the epi-cardial surface. A 2.6 by 2.6 cm square region around thepacing site contained 60% of all identified fractionatedEGs and only 36% of the total number of electrodesevaluated from all maps. The density was highest in tworegions bounded by lines parallel to the fiber orientationlocated at 2.5 and 10 mm from the pacing site measuredin the cross fiber direction. Figure 3 shows these regionsas the shaded areas in the schematic diagram of isoch-rones superimposed on a 2 mm uniform grid of elec-trodes. For the case of epicardial pacing on the anteriorRV, the regions containing 40% of the fractionated EGsand only 14% of the total number of electrodes weresmaller with the outer bounds delimited by the dashedlines within the shaded regions in Fig. 3. The regionscontaining 40% of the fractionated electrograms werewider for the case of LV pacing, measuring 7.5 mm inthe direction across fibers !entire shaded region in Fig. 3"and contained 21% of the total number of electrodes.The narrow, 5 mm wide area located between the shadedareas in Fig. 3 and stretching along the fiber direction
FIGURE 2. „A… Epicardial isochronal map, black dots indicatelocations of multipeaked time derivatives. „B… Same map asin panel „A…, black dots indicate sites where activation timesdiffered from panel „A… by more than 2 ms. Star indicatespacing location. „C… and „D… Same isochronal map generatedusing the spatial gradient method „C… and the Laplacianmethod „D….
FIGURE 3. Diagram of an isochronal map „pacing site indi-cated by a star, approximate fiber direction indicated by adouble arrow…. Shaded region indicates highest density offractionated electrograms.
785Spatial Methods for Activation Time Determination

contained less than 3% of the identified fractionated EGsand 4.5% of the total number of electrodes.In order to characterize the occurrence of multipeaked
derivatives found on the epicardium, it was observed thatmultipeaked time derivatives coincided with low ampli-tude of the derivative, but not low amplitude of thepotentials. The average peak amplitude of the time de-rivative for all EGs (n!22,477) was %7.4"1.1 mV/ms, whereas the average amplitude for onlymultipeaked EGs (n!2565) was %3.8"0.8 mV/ms (p&0.0001). A similar comparison for the magnitude ofthe gradient showed that for all EGs (n!22,477) theaverage maximum amplitude was 11.6"3.3 mV/mm andfor the same group of EGs with multipeaked time de-rivatives was 10.4"3.2 mV/mm (n!2565, p!NS).
Spatial Methods
Figure 4 shows the spatial distribution of the poten-tials, value of the time derivative, magnitude of the gra-dient, and the location of the zero Laplacian at 8, 21, and28 ms after ventricular stimulation. In all of the maps,the elliptical wave front is readily identifiable. The wavefront location is indicated in the potential maps by thesteep potential jump and in the time derivative maps asthe band of the most negative values !darker shadedregions". In the maps that display the distribution of thespatial gradient !third row", the wave front is depicted byan elliptical band of the highest values !darker shadedregions". In the Laplacian maps, the wave front is des-ignated by the contour outlining the zero value of theLaplacian with negative values !current sources, light
FIGURE 4. The epicardial spatial distributions of the potentials, value of the time derivative, magnitude of the gradient, and thelocation of the zero Laplacian at 8, 21, and 28 ms after the epicardial pacing stimulus „pacing site indicated by a star…. Minimumand maximum values and the contour step size, in parentheses, are indicated „mV…. The time instant is marked by the verticalbar in the time series signal associated with black or white dot located in each map.
786 PUNSKE et al.

shading" ahead of the wave front and positive values!current sinks, darker shading" behind the wave front.For each of the four different distributions shown !po-tentials, time derivative, spatial gradient, and Laplacian"the representation of the wave front is centered over themarked electrode site. Results from all the maps are inagreement and support the fact that the times of activa-tion at the three marked electrodes sites are 8, 21, and 28ms !respectively, from left to right". When consideringonly the EGs at 21 and 28 ms, it is difficult to tell whenactivation occurs. The scalars of the time derivative showdistinct minima at 8 and 21 ms consistent with the as-sociated maps, however, at 28 ms, the vertical bar in thescalar for the time derivative does not indicate the mini-mum. The scalars for the spatial gradient have maximacoinciding with the activation times indicated by themaps. Likewise, the zero crossings of all three of thescalars for the Laplacian are also consistent with the timeof activation indicated by the maps.
Figure 2, panels !C" and !D" show isochronal mapsgenerated from activation times determined as the timeof the maximum magnitude of the spatial gradient andthe time of zero Laplacian, respectively. The originaltime derivative method yielded a map #panel !A"$ withabrupt changes in density and local crowding of thecontour lines. These features were not as prevalent whenspatial methods were applied.
Comparison of Activation Times
Table 1 contains values of R2 and the average abso-lute difference " the standard deviation in activationtime computed from all electrode sites for each pacingsequence and results from the appropriate pacing se-quences were then averaged.For cases of epicardial pacing #see Table 1, part !a"$,
when considering only activation times of those EGswithout multipeaked time derivatives, the comparisons
TABLE 1. Summary of the comparisons of activation times obtained using the visualassessment of the time of arrival of the wave front in the time series of potential maps „Vmap…,the time derivative method „dVÕdt…, the spatial gradient method „"&V"…, and the Laplacianmethod „&2V…. Values indicate the average absolute difference in activation time Á thestandard deviation and the average square of the correlation coefficient „R2… from all sixexperiments. Results are grouped by type of pacing, „a… epicardial, „b… endocardial and
intramural, and „c… atrial.(a) Epicardial pacing
EGs without multipeaked time derivatives EGs with multipeaked time derivatives
Comparison
Averagedifference (ms)
"St DevAverage R2
(slope, intercept) Comparison
Averagedifference (ms)
"St DevAverage R2
(slope, intercept)
Vmap vs dV/dt 1.51"1.67 0.98 (1.0, 1.3) Vmap vs dV/dt 2.24"3.16 0.85 (0.9, 3.2)Vmap vs !&V! 1.34"1.19 0.98 „1.0, 0.6… Vmap vs !&V! 1.57"1.47 0.97 „0.9, 2.4…Vmap vs &2V 1.61"1.50 0.97 „1.0, 1.7… Vmap vs &2V 1.89"1.86 0.95 „1.0, 0.7…
(b) Endocardial pacing
EGs without multipeaked time derivatives EGs with multipeaked time derivatives
Comparison
Averagedifference (ms)
"St DevAverage R2
(slope, intercept) Comparison
Averagedifference (ms)
"St DevAverage R2
(slope, intercept)
Vmap vs dV/dt 1.08"0.73 0.95 (1.0, %1.0) Vmap vs dV/dt 1.83"2.27 0.97 (1.0, 2.0)Vmap vs !&V! 1.18"0.97 0.90 (1.0, 0.6) Vmap vs !&V! 1.61"1.70 0.98 (0.9, 3.1)Vmap vs &2V 1.69"1.33 0.81 (1.3, 6.9*) Vmap vs &2V 1.73"1.78 0.98 (0.9, 1.7)
(c) Atrial pacing
EGs without multipeaked time derivatives EGs with multipeaked time derivatives
Comparison
Averagedifference (ms)
"St DevAverage R2
(slope, intercept) Comparison
Averagedifference (ms)
"St Dev Average R2
Vmap vs dV/dt 1.63"0.64 0.97 (1.0, 2.0) Vmap vs dV/dt ¯ ¯Vmap vs !&V! 1.80"1.41 0.95 (1.0, 0.6) Vmap vs !&V! ¯ ¯Vmap vs &2V 2.12"1.90 0.89 (0.9, 5.8*) Vmap vs &2V ¯ ¯
787Spatial Methods for Activation Time Determination

between the standard any other methods were veryhighly correlated. When considering only activationtimes of EGs with multipeaked time derivatives, the val-ues of R2 comparing each of the two spatial methodswith the visual assessment method !standard" remainedvery highly correlated and the differences remainedsmall. Comparisons of the time derivative method withthe standard showed a weaker correlation for EGs withmultipeaked time derivatives and the average differencewas larger.For endocardial pacing #Table 1, part !b"$, the largest
values of R2 and smallest differences were obtained fromcomparisons between the time derivative method and thestandard for all EGs without multipeaked time deriva-tives. Results from the Laplacian method show the larg-est differences and weakest correlation when comparedwith the visually assessed results for EGs without mul-tipeaked time derivatives. Only a small number of EGs!24 of 439" with multipeaked time derivatives were iden-tified in the visually assessed subset. The comparisons ofthe activation times for these EGs with those from thetime derivative and both spatial methods turned out to behighly correlated, however, the averaged time differencesand standard deviations were larger.In each of the six experiments activation times were
compared for the case of atrial stimulation #see Table 1,part !c"$. The Laplacian method showed the weakestcorrelation and the largest time differences when com-pared to the standard for EGs without multipeaked de-rivatives. There were only three EGs identified with mul-tipeaked time derivatives in the visually assessed subset,therefore, linear regression was not performed on such asmall population of data points and the correspondingvalues in the table were left blank.The average slope and intercept values from linear
regression of activation time comparisons are shown inTable 1 next to the values of R2. A student’s t testdetermined if the average values of the slope and inter-cept were statistically different from 1.0 and 0.0, respec-tively !star indicates p&0.05). Results of the t testsshowed that only the intercept values obtained fromcomparing the Laplacian with the standard for atrial andendocardial pacing differed from zero (p&0.05).The results in Table 1 suggest an advantage of spatial
methods over the time derivative method based on com-parisons with the activation times from the visual assess-ment method, but only for the case of epicardial pacingwhere large numbers of fractionated electrograms arefound. The results of linear regression, used to comparethe activation times from visual assessment with isopo-tential maps with the time derivative, spatial gradient andsurface Laplacian, shown in Fig. 5, further illustrate thisadvantage. Activation times for a total of 395 EGs withmultipeaked time derivatives !from four hearts for thecase of epicardial pacing" were compared with the visu-
ally assessed time of arrival of the potential jump at theelectrode locations in the isopotential maps. Of theseEGs, 100 had activation times that differed by more than2 ms. Figure 5!A" compares activation times from the
FIGURE 5. Results of linear regression comparing activationtimes from the visually assessed time of arrival of the wavefront „Vmap… with the time derivative method „A…, the spatialgradient method „B…, and the Laplacian method „C….
788 PUNSKE et al.

time derivative method with those visually assessed(R2!0.67). Figures 5!B" and 5!C", which compare ac-tivation times from the spatial gradient and the Laplacianmethods with the visual method for the same 100 EGsshow much better correlation (R2!0.94 and 0.95, re-spectively".
DISCUSSION
Results from the first objective of the study demon-strated that the use of the minimum time derivativemethod for activation time determination resulted in iso-chronal maps containing abrupt changes in isochronalline density or other inconsistencies suggesting activationtime errors, for the case of epicardial pacing. Six of theseven cases of epicardial pacing in this study resulted inisochronal maps with errors similar to those presented inFigs. 1!G" and 2!A". The results of this study detailedthe recurring and predictable nature of the problems andshowed that errors in the maps were coincident withelectrograms having slow, fractionated downstrokes dur-ing the QRS interval and low amplitude, multipeakedtime derivatives. Differences were observed between ac-tivation times assessed as the minimum in low amplitudeand multipeaked derivatives and those assessed by thetime of arrival of the wave front in series of isopotentialmaps. The maximum observed difference was 23 ms.Additional evidence that suggested erroneous activationtimes came from the estimated values of local propaga-tion velocity on the epicardium that were not withinreported physiologic ranges.In fulfilling the second objective of the study, the
results also demonstrated that multipeaked time deriva-tives from epicardial unipolar electrograms occurred withthe highest frequency and in a reproducible pattern sur-rounding an epicardial pacing site. The number of mul-tipeaked time derivatives found decreased with increasedpacing depth and was minimal for the case of atrialpacing. Multipeaked time derivatives were also found tobe associated with low amplitude of the derivative, butnot low amplitude of the electrogram potentials.The third objective of this study was to investigate the
use of the spatial gradient and the surface Laplacian asalternative methods of activation time determination. Inassessing the spatial methods, the results showed thatboth methods provided a slight advantage over the timederivative method for cases of multipeaked time deriva-tives where the unipolar EG had a slow and fractionateddownstroke. This advantage was only realized for epicar-dial pacing where a larger number of slow, fractionatedEGs were found. The spatial methods provided a mea-sure of activation time determination that was unambigu-ous and was in agreement with the physical location ofthe depolarization wave front as determined by the iso-potential maps. The spatial approaches yielded isochro-
nal maps that did not contain apparent errors or incon-sistencies in the values. Epicardial propagation velocityvalues estimated from the isochronal maps created usingthe gradient and Laplacian methods in regions where thetime derivative methods showed inconsistencies were inbetter agreement with reported values.For deep intramural, endocardial, and atrial pacing the
spatial gradient method performed well but without ad-vantage over the time derivative method when comparedto the standard. However, results from the Laplacianmethod showed weaker correlations with the standard.The probable explanations for the degradation in theperformance of the Laplacian method for cases of deepintramural and endocardial pacing should include consid-eration of the spatial resolution and the assignment ofactivation times for Laplacian scalars without clear zerocrossings. The data for this study was collected with aspatial sampling of 1 or 2 mm in a uniform grid asrecommended by Bayly et al.3 Results from Coronelet al. suggested that the amplitude of the Laplacian dropsoff considerably with increased interelectrode spacing.The study by Coronel et al. did not suggest that thereduction in amplitude modifies the time of the zerocrossing.7 However, the reduced quality of some Laplac-ian signals and the lack of unambiguous zero crossingscould be indications that this study has reached or sur-passed the limits of adequate spatial sampling. In addi-tion, some of the Laplacian scalars were totally positiveor totally negative without a zero crossing, particularlyfor endo- to epicardial breakthrough. For these cases, themaximum derivative was chosen as the time of activa-tion. Values of the intercept from linear regression thatdiffered from zero in this study also suggest a bias in theLaplacian activation times for deep pacing and atrialstimulation. Work by Coronel et al. suggested that totallypositive and negative Laplacian signals indicate eitherbreakthrough sites or sites of wave front collision, whichmay provide even more useful information about localpropagation.7 However, interpretation of the actual acti-vation time for these signals requires additional study.Assessment of the actual mechanisms of the observed
fractionated EGs was outside the scope of this study;however, some considerations of the data presented herein conjunction with the possible mechanisms can be in-sightful. First, from the assessment of noise levels in therecorded signals and the effect that the noise had on thevalues of the time derivative as reported in the methodssection, we conclude that noise is not a significant con-tributing factor to fractionation in the recorded electro-grams and noise does not in any significant way contrib-ute to the presence of multipeaked time derivatives.Supporting this conclusion is the fact that the fraction-ation was primarily seen for the case of epicardial pacingin a reproducible pattern of density that was the same forsequential beats. If signal noise contributed to the gen-
789Spatial Methods for Activation Time Determination

eration of fractionated electrograms, then one wouldhave expected them to be more uniformly distributedthroughout the data set.Our results describing the location of fractionated EGs
in the cross-fiber direction from the pacing site are moreconsistent with the results of Spach and Dolber,32 whoshowed that fractionated EGs in normal human atriumcan be attributed to connective septa and lower densityof gap junctions that produce an uncoupling of adjacentmyocardial fibers and slow propagation only in the cross-fiber direction. The increased presence of uncouplingsepta was associated with aging and was not found inchildren.32 This is consistent with the fact that all of ourresults were from adult canine ventricles. Recent com-puter models that simulate propagation in normal tissuehave also reported the presence of fractionated EGs simi-lar to those observed in this study.13This study does not attempt to address pathophysi-
ologic conditions such as ischemia and myocardial inf-arction where fractionated electrograms are known tooccur.11,18 Having established these spatial methods asapplicable under normal conditions, it would be a naturalfuture development to apply them under pathophysi-ologic conditions. The challenge would then becomefinding a gold standard for activation time under theseconditions.28 Other methods that offer quantitative as-sessment of propagation during abnormal sequences likeischemia and VF have been reported3,4,29,30 that do notdetermine activation times explicitly and may be usefulwhen activation time is not a targeted parameter.In summary, this study investigated problems in nor-
mal, healthy hearts using the time derivative method ofactivation time determination for isochronal mapping.First, we demonstrated that slow, fractionated EGs withmultipeaked time derivatives were associated with errorsin isochronal maps, next we characterized the pattern ofdistribution of the fractionated EGs near the epicardialpacing site, and finally, investigated the use of spatialmethods of activation time determination as alternativesin these areas. The results confirmed that spatial methodsof activation time determination are advantageous for thecase of epicardial pacing where large numbers of frac-tionated EGs are found. For cases of deep intramural,endocardial, and atrial pacing the spatial methods offeredno advantage over the time derivative method. The re-sults of this study are significant because errors in acti-vation time assessment may lead to erroneous interpre-tation of propagation on the cardiac surface.
ACKNOWLEDGMENTS
This work was supported by an award from the NoraEccles Treadwell Foundation and the Richard A. andNora Eccles Harrison Fund for Cardiovascular Research.
APPENDIX
The time derivative was calculated at each time in-stant, t, by fitting the potentials to the quadratic functionshown in Eq. !A1" over 2n$1 points centered about thetime instant of interest
V! t "!at2$bt$c . !A1"
For the case of activation time determination n waschosen to be 2. A total of five points were used, includ-ing two points on both sides of the point at the time ofinterest, to calculate the derivative using a least squaresapproach.25 The optimum expressions of the constants a,b, and c were sought by setting the partial derivatives ofthe square of the error, (2 #Eq. A2$, with respect to eachconstant to zero
(2! )i!%n
n
!Vi%ati2%bti%c "2. !A2"
The resulting system of equations is shown as Eq.!A3":
a )i!%n
n
t i4$b )
i!%n
n
t i3$c )
i!%n
n
t i2! )
i!%n
n
Vit i2,
a )i!%n
n
t i3$b )
i!%n
n
t i2$c )
i!%n
n
t i! )i!%n
n
Vit i ,
a )i!%n
n
t i2$b )
i!%n
n
t i$c!2n$1 "! )i!%n
n
Vi . !A3"
Without any loss of generality, let t i!i . Then all oddpowered terms in Eq. !A3" drop out and expressions fora and b were determined #Eqs. !A4" and !A5"$:
b!
)i!%n
n
! iy i"
)i!%n
n
i2, !A4"
a!
!2n$1 " )i!%n
n
i2yi% )i!%n
n
i2 )i!%n
n
y i
!2n$1 " )i!%n
n
i4%# )i!%n
n
i2$ 2 . !A5"
790 PUNSKE et al.

The derivative evaluated at each time step t0!0 canthen be represented by Eq. !A6":
dVdt % t0!0
!2at$b! t0!0!b . !A6"
The activation time was then determined to be thetime where the minimum value of the derivative oc-curred. This activation time was then refined by, again,fitting the values of the derivative to a quadratic functionto determine the time where the function is a minimum.This enables calculated activation times to occur at timesother than strictly on sampled points.
REFERENCES
1Arisi, G., E. Macchi, S. Baruffi, S. Spaggiari, and B. Tac-cardi. Potential fields on the ventricular surface of the ex-posed dog heart during normal excitation. Circ. Res. 52:706–715, 1983.2Arisi, G., E. Macchi, C. Corradi, R. L. Lux, and B. Taccardi.Epicardial excitation during ventricular pacing. Relative in-dependence of breakthrough sites from excitation sequence incanine right ventricle. Circ. Res. 71:840–849, 1992.3Bayly, P. V., E. E. Johnson, S. F. Idriss, R. E. Ideker, and W.M. Smith. Efficient electrode spacing for examining spatialorganization during ventricular fibrillation. IEEE Trans.Biomed. Eng. 40:1060–1066, 1993.4Choi, B. R., W. Nho, T. Liu, and G. Salama. Life span ofventricular fibrillation frequencies. Circ. Res. 91:339–345,2002.5Chung, M. K., S. M. Pogwizd, D. P. Miller, and M. E. Cain.Three-dimensional mapping of the initiation of nonsustainedventricular tachycardia in the human heart. Circulation95:2517–2527, 1997.6Colli Franzone, P. C., L. Guerri, and B. Taccardi. Spread ofexcitation in a myocardial volume: Simulation studies in amodel of anisotropic ventricular muscle activated by pointstimulation. J. Cardiovasc. Electrophysiol. 4:144–160, 1993.7Coronel, R., F. J. Wilms-Schopman, J. R. de Groot, M. J.Janse, F. J. van Capelle, and J. M. de Bakker. Laplacianelectrograms and the interpretation of complex ventricularactivation patterns during ventricular fibrillation. J. Cardio-vasc. Electrophysiol. 11:1119–1128, 2000.8El-Sherif, N., M. Chinushi, E. B. Caref, and M. Restivo.Electrophysiological mechanism of the characteristic electro-cardiographic morphology of torsade de pointes tachyarrhyth-mias in the long-QT syndrome: Detailed analysis of ventricu-lar tridimensional activation patterns. Circulation 96:4392–4399, 1997.9Ershler, P. R., B. W. Steadman, K. B. Moore, and R. L. Lux.Systems for measuring and tracking electrophysiologic distri-butions. IEEE Eng. Med. Biol. Mag. 17:56–61, 1998.
10Franz, M. R. Current status of monophasic action potentialrecording: Theories, measurements and interpretations. Car-diovasc. Res. 41:25–40, 1999.
11Gardner, P. I., P. C. Ursell, J. J. Fenoglio, Jr., and A. L. Wit.Electrophysiologic and anatomic basis for fractionated elec-trograms recorded from healed myocardial infarcts. Circula-tion 72:596–611, 1985.
12Hofer, E., G. Urban, M. S. Spach, I. Schafferhofer, G. Mohr,and D. Platzer. Measuring activation patterns of the heart at amicroscopic size scale with thin-film sensors. Am. J. Physiol.266:H2136–H2145, 1994.
13Hooks, D. A., K. A. Tomlinson, S. G. Marsden, I. J. LeGrice,B. H. Smaill, A. J. Pullan, and P. J. Hunter. Cardiac micro-structure: implications for electrical propagation and defibril-lation in the heart. Circ. Res. 91:331–338, 2002.
14Hren, R., J. Nenonen, and B. M. Horacek. Simulated epicar-dial potential maps during paced activation reflect myocardialfibrous structure. Ann. Biomed. Eng. 26:1022–1035, 1998.
15 Ideker, R. E., W. M. Smith, S. M. Blanchard, S. L. Reiser, E.V. Simpson, P. D. Wolf, and N. D. Danieley. The assumptionsof isochronal cardiac mapping. Pacing Clin. Electrophysiol.12:456–478, 1989.
16Josephson, M. E., L. N. Horowitz, and A. Farshidi. Continu-ous local electrical activity. A mechanism of recurrent ven-tricular tachycardia. Circulation 57:659–665, 1978.
17Kimber, S., E. Downar, S. Masse, E. Sevaptsidis, T. Chen, L.Mickleborough, and I. Parsons. A comparison of unipolar andbipolar electrodes during cardiac mapping studies. PacingClin. Electrophysiol. 19:1196–1204, 1996.
18Lesh, M. D., J. F. Spear, and M. B. Simson. A computermodel of the electrogram: what causes fractionation? J. Elec-trocardiol. 21!Suppl":S69–S73, 1988.
19Lorente de No, R. A study of nerve physiology. In: Rock-efeller Institute Studies New York: Rockefeller UniversityPress, 1947, Vol. 132, p. 398.
20Lux, R. L., P. R. Ershler, and B. Taccardi. Measuring spatialwaves of repolarization in canine ventricles using high-resolution epicardial mapping. J. Electrocardiol.29!Suppl":130–134, 1996.
21MacLeod, R. S., C. R. Johnson, and M. A. Matheson. Visu-alization of cardiac bioelectricity—A case study. In: Visual-ization 1992. Boston, MA: IEEE Computer Society; 1992;pp. 411–418.
22Muzikant, A. L., and C. S. Henriquez. Paced activation map-ping reveals organization of myocardial fibers: a simulationstudy. J. Cardiovasc. Electrophysiol. 8:281–294, 1997.
23Plonsey, R. Bioelectric Phenomena. McGraw-Hill Series inBioengineering New York: McGraw-Hill Book, 1969.
24Pollard, A. E., K. W. Spitzer, and M. J. Burgess. Contribu-tions of the specialized conduction system to the activationsequence in the canine pulmonary conus. Am. J. Physiol.273:H446–H463, 1997.
25Press, W. H., B. P. Flannery, S. A. Teukolsky, and W. T.Vetterling. Numerical Recipes The Art of Scientific Comput-ing. Cambridge: Cambridge University Press; 1986.
26Pressler, M. L., P. N. Munster, and X.-D. Huang. Gap junc-tion distribution in the heart: Functional relevance. In: Car-diac Electrophysiology From Cell to Bedside, 2nd ed., editedby D. P. Zipes and J. Jalife. Philadelphia: W. B. Saunders,1995, pp. 144–151.
27Punske, B., Q. Ni, R. Lux, R. MacLeod, P. Ershler, T. Dust-man, Y. Vyhmeister, and B. Taccardi. Alternative methods ofexcitation time determination on the epicardial surface. WorldCongress on Medical Physics and Biomedical Engineering.Chicago, IL, 2000.
28Punske, B. B. Determining the local time of activation fromthe unipolar electrogram: New methods, new challenges. J.Cardiovasc. Electrophysiol. 11:1129–1131, 2000.
29Punske, B. B., W. E. Cascio, C. Engle, H. T. Nagle, L. S.Gettes, and T. A. Johnson. Quantitative characterization ofepicardial wave fronts during regional ischemia and elevatedextracellular potassium ion concentration. Ann. Biomed. Eng.26:1010–1021, 1998.
791Spatial Methods for Activation Time Determination
30Rogers, J. M., M. Usui, B. H. KenKnight, R. E. Ideker, andW. M. Smith. A quantitative framework for analyzing epicar-dial activation patterns during ventricular fibrillation. Ann.Biomed. Eng. 25:749–760, 1997.
31Spach, M. S., R. C. Barr, G. A. Serwer, J. M. Kootsey, and E.A. Johnson. Extracellular potentials related to intracellularaction potentials in the dog Purkinje system. Circ. Res.30:505–519, 1972.
32Spach, M. S., and P. C. Dolber. Relating extracellular poten-tials and their derivatives to anisotropic propagation at amicroscopic level in human cardiac muscle. Evidence forelectrical uncoupling of side-to-side fiber connections withincreasing age. Circ. Res. 58:356–371, 1986.
33Steinhaus, B. M.. Estimating cardiac transmembrane activa-
tion and recovery times from unipolar and bipolar extracel-lular electrograms: A simulation study. Circ. Res. 64:449–462, 1989.
34Taccardi, B., R. Lux, P. Ershler, R. MacLeod, C. Zabawa,and Y. Vymeister. Potential distributions and excitation timemaps recorded with high spatial resolution from the entireventricular surface of exposed dog hearts. Computers in Car-diology 1992. Durham, NC: IEEE Computer Society, 1992;pp. 1–4.
35Yashima, M., T. Ohara, J. M. Cao, Y. H. Kim, M. C. Fish-bein, W. J. Mandel, P. S. Chen, and H. S. Karagueuzian.Nicotine increases ventricular vulnerability to fibrillation inhearts with healed myocardial infarction. Am. J. Physiol.278:H2124–H2133, 2000.
792 PUNSKE et al.


