Embed Size (px)
Citation preview

RIVER RESEARCH AND APPLICATIONS
River Res. Applic. 22: 413–427 (2006)
Published online 21 February 2006 in Wiley InterScience(www.interscience.wiley.com). DOI: 10.1002/rra.912
SPATIAL PATTERNS OF FISH COMMUNITIES IN THE UPPER MISSISSIPPIRIVER SYSTEM: ASSESSING FRAGMENTATION BY LOW-HEAD DAMS
JOHN H. CHICK,a* MARK A. PEGGb and TODD M. KOELc
a Illinois Natural History Survey, Great Rivers Field Station, Brighton, IL, USAb Illinois Natural History Survey, Illinois River Biological Survey, Havana, IL, USA
c National Park Service, Yellowstone National Park, WY, USA
ABSTRACT
We assessed the similarity of fish communities among river reaches to assess community-level fragmentation by low-head damsin the Upper Mississippi River System (UMRS). The spatial coverage of standardized electrofishing sampling used in the LongTerm Resource Monitoring Program (LTRMP) was extended for three of the six regional trend areas (RTA; pools 4, 13, and theOpen River Reach) to include river reaches (outpools) immediately upstream and downstream from the standard RTA from 15June to 31 October 2000. Additionally, pools 19 and 20 were sampled in September 2000. Cluster analysis and non-metricmultidimensional scaling of community composition and structure data revealed two major groups, upper and lower reaches,and four (for composition) or five (for structure) sub-groupings of river reaches. In general, all outpools grouped with the nearestRTA for both community composition (no exception) and community structure (one exception). This suggests that fragmenta-tion of fish communities from low-head dams is minimal. Mantel correlations demonstrated strong inverse association betweenthe similarity of fish communities with the distance between reaches. Habitat variables measured during electrofishing collec-tions were significantly correlated with spatial variation of fish composition and community structure, but provided only mar-ginal improvements to correlations with distance between reaches alone. Furthermore, habitat variability among river reachesalso was related to distance between reaches. Determining the extent to which variation of fish communities is related to habitator demographic processes (e.g. migration, larval drift, source-sink dynamics) will be challenging for this system. Althoughlow-head dams on the UMRS may restrict movements for individuals and populations of certain fish species, we found littleevidence that these effects have led to substantial, community-level fragmentation. Copyright# 2006 John Wiley & Sons, Ltd.
key words: fish communities; fragmentation; low-head dams; spatial distribution; Mississippi River; ordination
INTRODUCTION
Large rivers are both extremely productive and extremely altered ecosystems. Perhaps the most obvious and wide-
spread anthropogenic alterations to river ecosystems, particularly in the northern hemisphere, is the construction of
dams (Dynesius and Nilsson, 1994). Alteration of rivers by damming is a major concern for fishes (Ormerod,
2003). Dams can affect fishes through alteration of flow patterns (Gehrke et al., 1995; Galat and Lipkin, 2000;
Lytle and Poff, 2004), changes in connectivity with the floodplain (Aarts et al., 2004; Hirzinger et al., 2004;
Koel, 2004), and by imposing barriers to movements that fragment fish populations (Corbacho and Sanchez,
2001; Morita and Yamamoto, 2002). Despite the fact that a majority of large rivers in the northern hemisphere
have been dammed, and the potential negative impacts of dams on fishes are well recognized, very little is under-
stood about community level responses by large-river fishes to the presence of dams (Dynesius and Nilsson, 1994;
Ormerod, 2003). Indeed, we are only now beginning to understand the importance of the main-channel habitat of
large rivers for fishes (Dettmers et al., 2001; Galat and Zweimuller, 2001).
The degree to which damming fragments fish communities has important implications for management and
monitoring of large rivers. Although large, un-dammed rivers are expected to show some longitudinal variation
Received 15 May 2004
Revised 20 May 2005
Copyright # 2006 John Wiley & Sons, Ltd. Accepted 21 June 2005
*Correspondence to: John H. Chick, Illinois Natural History Survey, Great Rivers Field Station 8450 Montclair Ave. Brighton, IL 62012, USA.E-mail: [email protected]

in fauna and function, they are usually thought of as a continuum (Naiman et al., 1987). On the other hand,
construction of large dams and reservoirs often fragments rivers into a series of distinct lotic and lentic ecosystems
that may have relatively little exchange of fauna (Dynesius and Nilsson, 1994; Andersson et al., 2000; Pegg and
Pierce, 2002; Pegg et al., 2003). Clearly, a fragmented river–reservoir system presents different management
issues than an un-dammed river continuum, and monitoring design should also vary between these two conditions.
For example, systemic-level probabalistic designs (Hunsaker and Carpenter, 1990; Noon, 2003) would probably be
more suitable for un-dammed rivers, whereas fragmented river/reservoir systems would likely require more loca-
lized focus (sensu Olsen and Schreuder, 1997; Fourqurean and Rutten, 2003) based on individual management
units or ecosystem segments.
The Upper Mississippi River is an example of a large-floodplain river that is both extremely productive and
extensively modified, primarily for navigation (Nielsen et al., 1986). To allow for commercial navigation, the
portion of the Mississippi River above Saint Louis Missouri has been divided by 26 locks and dams into a series
of navigation pools. In the remainder of the river, from Saint Louis downstream to the confluence with the Ohio
River, a navigable channel (3m depth) is maintained by wing dams and bank stabilization (Nielsen et al., 1986).
Unlike the large dams that create reservoirs on many rivers, the dams on the Upper Mississippi are low-head dams
with bottom release gates. During high-flow periods, most of these gates are raised above the surface of the water,
allowing free-flow conditions. Under low-flow conditions, the gates are lowered, which likely impedes movement
of fishes and other organisms (Knights et al., 2002; Zigler et al., 2004). Although these low-head locks and dams
do impede movement of fishes, and there is good evidence that the larger and older dams have fragmented popula-
tions of certain species (Nielsen et al., 1986), there is little information on the degree of fragmentation that has
occurred at the community level.
An important source of ecological information on the Upper Mississippi River is the Long Term Resource
Monitoring Program. The Long Term Resource Monitoring Program (LTRMP) was authorized by the Water
Resources Development Acts of 1986 and 1999 as an element of the US Army Corps of Engineers’ Environmental
Management Program (EMP). The primary mission of the LTRMP is to provide resource managers with the
information needed to maintain the Upper Mississippi River System (UMRS) as a viable multiple-use ecosystem
through standardized monitoring of water quality, aquatic vegetation, aquatic invertebrates, and fishes (US Army
Corps of Engineers, 1997). The design of the LTRMP is an attempt to balance the desire to detect large-scale,
systemic trends with the need for adequate resolution at local scales to gain insight into ecosystem function.
The design includes standardized monitoring at six regional trend analysis areas (RTA; Navigation Pools 4, 8,
13, 26, the Open River Reach, and the La Grange Reach of the Illinois River), each of the RTA consisting of
a 48–129 km river reach between two navigation dams (with the exception of the Open River Reach). Lubinski
et al. (2001) conducted a power analysis demonstrating that the present LTRMP design provides adequate
statistical power to detect inter-annual variation for most water quality parameters and many fishes within the
six RTA. Nevertheless, how well these six RTA reflect the overall biotic and abiotic conditions of the entire UMRS
remains unknown and will depend in part on how fragmented the UMRS fish communities are as a result of the
navigation dams.
This study was initiated to expand the spatial coverage of LTRMP fisheries electrofishing monitoring to outpools
immediately upstream and downstream of three RTA in an attempt to provide further insight into the ability of
LTRMP to make ecological inferences to the entire UMRS. The study design also allows for an assessment of
how fragmented fish communities in the UMRS are in relation to the locks and dams. If the locks and dams
severely fragment the UMRS fish community, we would not expect to see strong similarity between adjacent
RTA as would be the case for a river continuum. We present statistical analysis of this study, examining spatial
variation of community composition (the presence or absence of species) and community structure (relative abun-
dance of species) of UMRS fishes. Three major objectives are addressed.
1. Determine similarity of outpools relative to adjacent RTA in terms of community composition and structure of
fishes.
2. To determine groupings of river reaches based on community composition and structure of fishes.
3. Determine how river-reach groupings based on fish communities correspond to spatial variation of important
habitat factors.
414 J. H. CHICK, M. A. PEGG AND T. M. KOEL
Copyright # 2006 John Wiley & Sons, Ltd. River Res. Applic. 22: 413–427 (2006)
METHODS
Fish sampling
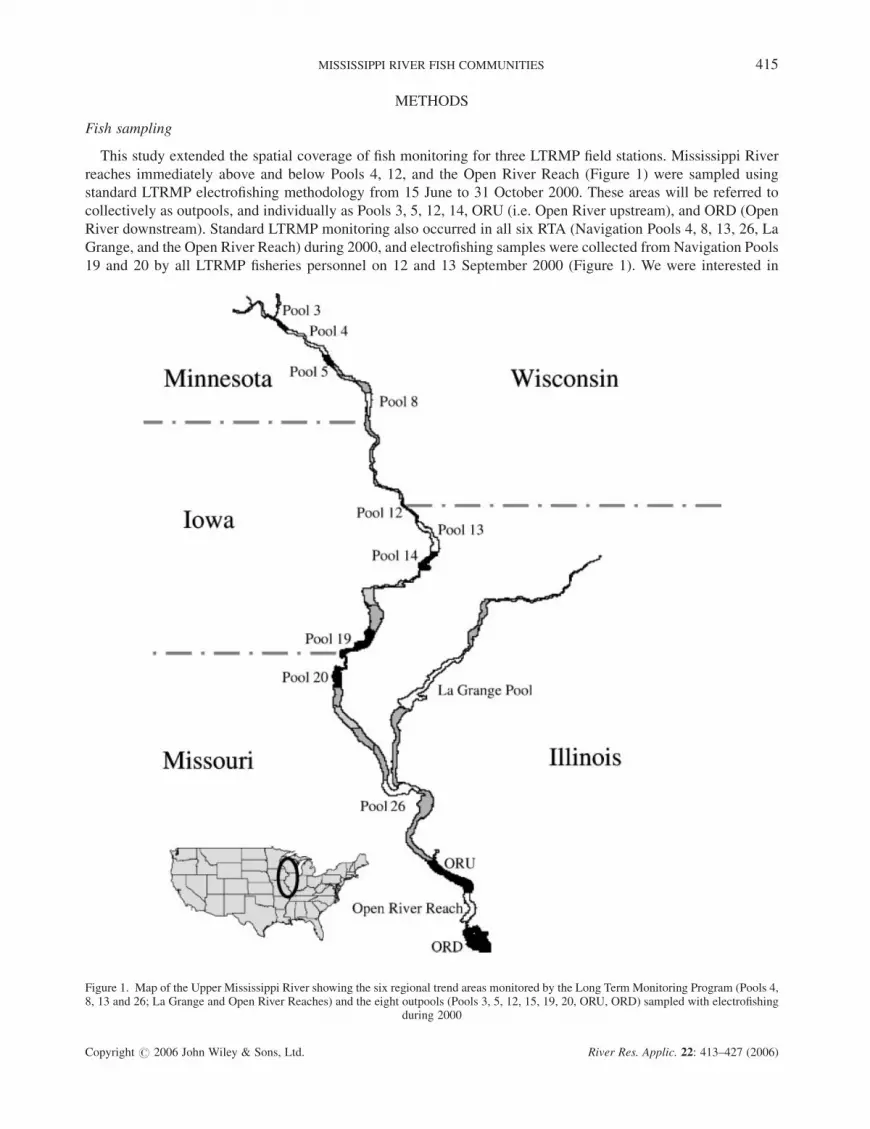
This study extended the spatial coverage of fish monitoring for three LTRMP field stations. Mississippi River
reaches immediately above and below Pools 4, 12, and the Open River Reach (Figure 1) were sampled using
standard LTRMP electrofishing methodology from 15 June to 31 October 2000. These areas will be referred to
collectively as outpools, and individually as Pools 3, 5, 12, 14, ORU (i.e. Open River upstream), and ORD (Open
River downstream). Standard LTRMP monitoring also occurred in all six RTA (Navigation Pools 4, 8, 13, 26, La
Grange, and the Open River Reach) during 2000, and electrofishing samples were collected from Navigation Pools
19 and 20 by all LTRMP fisheries personnel on 12 and 13 September 2000 (Figure 1). We were interested in
Figure 1. Map of the Upper Mississippi River showing the six regional trend areas monitored by the Long Term Monitoring Program (Pools 4,8, 13 and 26; La Grange and Open River Reaches) and the eight outpools (Pools 3, 5, 12, 15, 19, 20, ORU, ORD) sampled with electrofishing
during 2000
MISSISSIPPI RIVER FISH COMMUNITIES 415
Copyright # 2006 John Wiley & Sons, Ltd. River Res. Applic. 22: 413–427 (2006)

examining how similar fish communities in Pools 19 and 20 were compared to other UMRS reaches because Lock
and Dam 19 is believed to present a barrier to migrations of certain fishes (Kelner and Seitman, 2000).
Gutreuter et al. (1995) described standard LTRMP methodology in detail. Sampling locations were selected
using a stratified (by habitat type) random design (Lubinski et al., 2001). Electrofishing was conducted using
pulsed-DC output with two ring anodes and the boat hull serving as the cathode. Voltage and amperage were
adjusted for water temperature and conductivity to achieve a power output of 3000W. Electrofishing was
conducted along shorelines continuously for 15min at each sample collection site and two field staff collected fish
with dip nets. Data on water temperature, depth (average for each collection site), conductivity, and habitat were
collected with each sample (Table I). All fish were identified, measured, and enumerated following standard
LTRMP protocols (Gutreuter et al., 1995).
Statistical analysis
We examined spatial variation in fish community composition and structure among the six RTA and eight out-
pools. Community composition refers to the presence or absence of species, whereas community structure refers to
the abundance of species as measured by mean catch-per-unit-effort (CPUE¼ number per 15min weighted by the
area of each habitat strata). Both of these measures were examined because it is possible for communities to have
identical composition while having substantial and ecologically important differences in community structure.
Alternatively, communities could have some important differences in composition while still maintaining rela-
tively similar community structure (though large differences in composition will necessarily result in differences
in community structure). All analyses were conducted using SAS for Windows (SAS, 1999) and Primer for
Windows (Primer-E, 2001).
For both response variables (presence/absence, CPUE), we used cluster analysis and non-metric multidimen-
sional scaling (NMDS) to identify groupings of river reaches. These analyses were based on a Euclidian distance
matrix for community composition data, and a Bray–Curtis similarity matrix for community structure data.
Catch-per-unit-effort data were square-root transformed to better conform to multivariate normality assumptions.
This transformation dampens the influence of very abundant species for community structure analysis (Clarke and
Warwick, 1994). We also limited the community structure analysis to 16 species for which electrofishing had
power� 0.80 to detect a 20% inter-annual abundance change in at least one habitat strata of an RTA based on
a power analysis of LTRMP components (Lubinski et al., 2001; Table II). This conservative criterion was adopted
to help insure that the patterns of relative abundance used in these analyses reflect true ecological patterns rather
than sampling artifacts. Hybrids and fish not identified to species were omitted from all analyses. For analysis of
community composition, we omitted species that occasionally appear in electrofishing samples, but whose overall
Table I. Habitat variables routinely collected from each electrofishing site for the Long Term Resource Monitoring Program(Gutreuter et al., 1995)
Habitat factor Units Explanation
Secchi cmConductivity mS/cmFlow m/secTemperature �CDepth mEmergent/submersed vegetation 0, 1, 2, 3 0¼ 0% coverage; 1¼ 1–19% coverage; 2¼ 20–49%
coverage; 3¼ � 50% coverageVegetation density 0, 1, 2 0¼ no veg; 1¼ sparse; 2¼ denseSubstrate 1, 2, 3, 4 1¼ silt; 2¼ silt/clay/little sand; 3¼ sand/mostly
sand; 4¼ gravel/rock/hard clayWoody structure pres/abs presence/absence of woody structureRevetment pres/abs presence/absence of shoreline revetmentInlet/outlet pres/abs presence/absence on an inlet/outlet channel to a backwater lakeFlooded terrestrial vegetation pres/abs presence/absence of flooded terrestrial vegetation
416 J. H. CHICK, M. A. PEGG AND T. M. KOEL
Copyright # 2006 John Wiley & Sons, Ltd. River Res. Applic. 22: 413–427 (2006)

presence/absence is not reliably determined by this method based on the best professional judgement of LTRMP
field crews and supervisors.
Three criteria were used to determine the sub-grouping level in our cluster analysis. First, we used rarefaction
curves from the six RTA to visually determine the minimum number of individuals needed to reach the asymptote
of the rarefaction curve (i.e. the sampling effort needed to adequately describe species richness). Acceptable
sub-grouping levels should not isolate under-sampled reaches because this isolation could have resulted from
inadequate sampling. Second, we calculated the mean and range of Euclidian distance (community composition)
and Bray–Curtis similarity (community structure) between consecutive years for each RTA using LTRMP data
from 1994 to 2000. Although community composition and structure are expected to change through time, we
should not expect major differences to occur on average from each year to the next (i.e. we do not expect annual
extinction or colonization events to be the norm). Therefore, much of the variation between consecutive years in
community composition and structure data from LTRMP electrofishing is likely to arise from sampling artifacts
(i.e. the failure to capture a rare species in a given year and RTA despite its continued occurrence). Therefore, we
chose to establish the critical Euclidean distance or Bray–Curtis similarity for groupings at a level greater than the
range of year-to-year differences. Finally, we accepted only sub-grouping levels producing groups that were easily
illustrated using NMDS in either two or three dimensions with a stress value less than 0.05. Stress value is a
measure of ‘goodness of fit’ for NMDS, with small values indicating a better fit than large stress values (Clarke
and Warwick, 1994).
Because cluster analysis and NMDS are data exploration techniques, we used analysis of similarity (ANOSIM)
to test for significant variation in fish community composition and structure among groups (Clarke and Warwick,
1994). Analysis of similarity is analogous to univariate ANOVA in that it tests for significant differences among
groups. Unlike ANOVA, however, ANOSIM uses Monte Carlo simulation to determine significance rather than
probability inferences from an assumed statistical distribution. Nonetheless, our use of ANOSIM here is clearly a
post hoc test and results should be interpreted with caution. We used similarity breakdown analysis (the SIMPER
procedure in Primer) to determine the contribution of species to Bray–Curtis dissimilarity between community
structure groupings.
Table II. Mean abundance (square-root No./15min) of the 16 species used in community structure analysis, total catch (allspecies), and species richness from samples collected from 15 June through 31 October 2000. LG¼ the La Grange Reachof the Illinois River. OR¼Open River Reach. ORU¼Open River upstream. ORD¼Open River downstream. Common namesfor fishes follow Robins et al. (1991)
UMRS navigation pool
Species 3 4 5 8 12 13 14 19 20 LG 26 ORU OR ORD
Gizzard shad 7.50 6.30 3.53 2.18 3.45 4.12 2.94 2.61 2.74 6.98 4.51 3.23 5.36 4.14Emerald shiner 7.13 3.99 1.77 2.34 3.93 3.99 1.69 6.85 6.96 1.08 1.49 1.72 2.46 1.26Common carp 2.07 2.23 2.19 1.18 2.23 2.30 2.30 2.11 1.79 2.76 2.46 1.99 1.20 1.71Bluegill 0.52 2.97 3.09 6.28 3.19 3.00 3.76 1.48 0.17 1.75 0.84 0.05 0.09 0.08Freshwater drum 1.44 0.67 0.56 0.34 0.82 0.97 0.91 1.86 1.46 1.50 0.95 1.26 1.22 0.97Largemouth bass 0.05 1.43 1.21 2.66 1.88 2.27 2.24 1.22 0.12 1.23 0.26 0.00 0.04 0.02Spotfin shiner 1.91 1.06 1.12 2.62 1.18 1.14 0.21 1.21 1.53 0.00 0.10 0.08 0.00 0.00Bullhead minnow 1.16 0.75 0.89 3.08 2.03 1.46 0.89 0.81 0.36 0.11 0.13 0.00 0.01 0.02White bass 1.45 0.63 0.39 0.45 0.76 0.76 0.41 0.89 0.72 1.63 0.49 0.69 0.72 0.46Channel catfish 0.26 0.09 0.12 0.09 0.58 0.69 0.38 1.77 0.55 1.17 0.71 0.74 0.83 0.69Black crappie 0.08 0.92 0.90 0.95 0.43 1.14 1.01 0.10 0.08 0.37 0.06 0.02 0.00 0.00Smallmouth buffalo 0.22 0.20 0.15 0.23 0.84 0.24 0.12 0.22 0.63 1.68 0.59 0.08 0.42 0.40Shorthead redhorse 0.82 1.16 1.18 0.91 0.55 0.28 0.12 0.13 0.07 0.12 0.06 0.08 0.04 0.00Smallmouth bass 0.92 0.73 0.98 0.65 0.46 0.06 0.18 0.10 0.05 0.00 0.00 0.01 0.02 0.00Silver redhorse 0.14 0.84 1.09 0.84 0.00 0.00 0.03 0.00 0.00 0.00 0.00 0.00 0.00 0.00Bigmouth buffalo 0.02 0.10 0.19 0.00 0.42 0.41 0.15 0.13 0.00 1.05 0.16 0.01 0.17 0.10Total catch 17 905 19 097 10 686 10 855 7296 7418 4058 4357 3228 17 165 6943 1568 4894 2669Species richness 46 52 49 60 56 49 53 43 46 55 44 40 52 38
MISSISSIPPI RIVER FISH COMMUNITIES 417
Copyright # 2006 John Wiley & Sons, Ltd. River Res. Applic. 22: 413–427 (2006)

Finally, we used the electrofishing data to examine whether variation in fish community composition and
structure among reaches corresponded with variation in habitat factors. Two sources of habitat data were available
for comparisons: those measured directly in the field with each electrofishing collection (Table I), and a suite of
aquatic/geomorphic and land cover variables quantified for the Habitat Needs Assessment (HNA) query tool that
were available for a subset of reaches (Table III; DeHaan et al., 2000; Koel, 2001). For habitat variables measured
in the field, standardized (mean¼ 0, standard deviation¼ 1) Euclidean distance matrices were calculated and
Mantel tests were used to determine correlations with both the Euclidian matrix from fish community composition
data and the Bray–Curtis similarity matrix from community structure data. Because the aquatic/geomorphic and
land cover measures were all in hectares, a Bray–Curtis similarity matrix was calculated and used in Mantel tests.
A canonical Mantel test (BioEnv procedure in Primer-E, 2001; Clarke and Warwick, 1994) was used to determine
the combination of habitat variables that would provide the greatest correlation with community data. Because
many habitat variables can co-vary with latitude, we included distance between reaches in river miles in both
habitat data sets to help determine whether correlations with habitat reflect covariation with the distance between
reaches. For the La Grange Reach of the Illinois River, distance was the sum of river miles between a given reach
and Pool 26, and river miles between Pool 26 and the La Grange Reach. We also used a Mantel test to examine
whether habitat similarity (standardized Euclidian distance matrix for all habitat features measured in the field)
was correlated with distance between reaches.
RESULTS
Electrofishing
A total of 118 139 fishes were collected, representing 100 species. The species with the greatest overall abun-
dance were gizzard shad, emerald shiner, bluegill, and common carp, which together accounted for over 71% of the
total catch. The mean number of species captured in a river reach was 49, ranging from 38 to 60 (Table III).
Rarefaction curves suggest that sampling sufficient to collect at least 5000 individuals was needed to do an
adequate job of describing community composition of fishes within a given RTA (Figure 2). Because fewer than
5000 fishes were collected from several of the outpools (Table III), we rejected any sub-grouping level that isolated
these under-sampled reaches in our cluster analysis of community composition and community structure data.
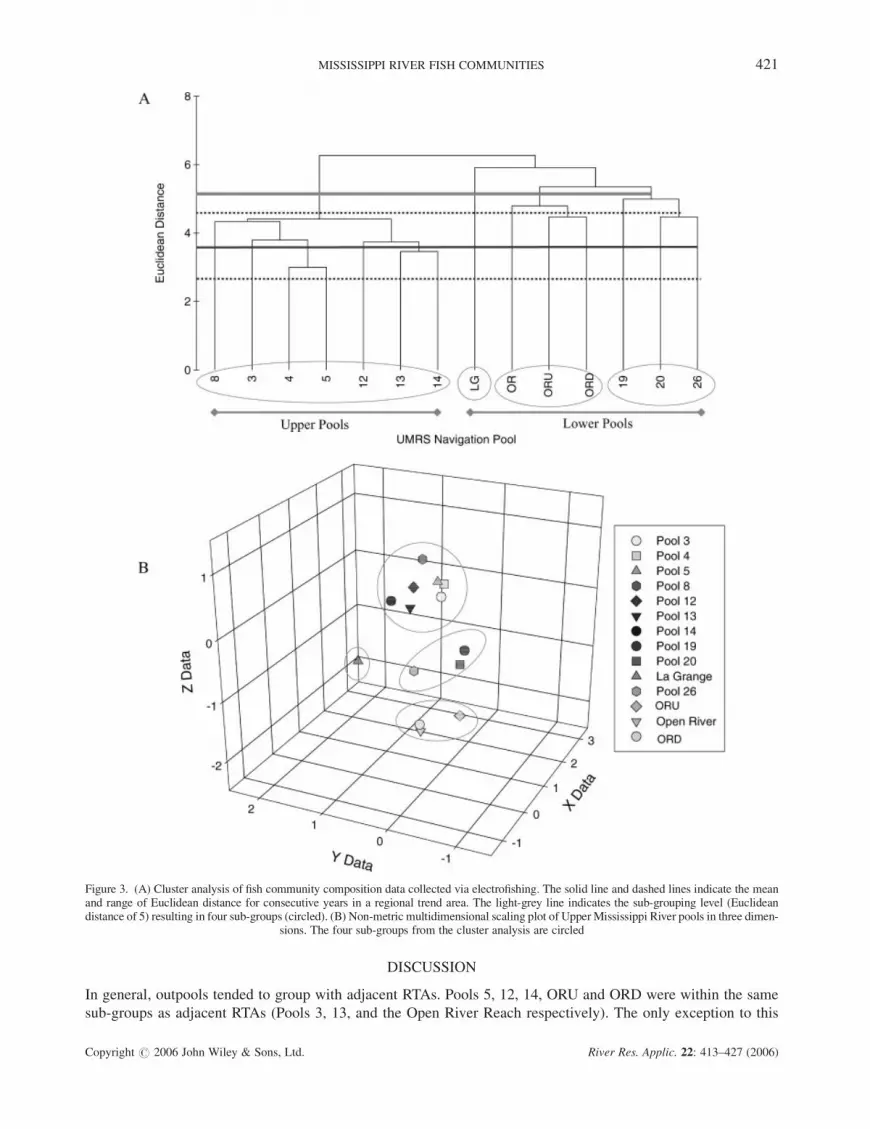
Cluster analysis of community composition data revealed two major groupings of river reaches: upper RTA and
outpools and lower RTA and outpools (Figure 3(A)). Twenty-eight species were captured only within lower RTA
and outpools, and 18 species were captured only within upper RTA and outpools. The average Euclidian distance
between consecutive years within an RTAwas 3.60, and ranged from 3.16 to 4.47. Therefore, we chose 5.0 as our
subgrouping distance, resulting in four subgroups: all upper reaches, the La Grange Reach, the Open River Reach
and ORU and ORD, and Pools 19, 20 and 26 (Figure 3(A)). These four groups were illustrated by NMDS in three
dimensions with a stress value¼ 0.02 (Figure 3(B)). Analysis of similarity revealed significant differences
between the two major groupings (global R¼ 0.83; P¼ 0.001), and among the four subgroups (global
R¼ 0.95; P¼ 0.001).
As with community composition, cluster analysis based on community structure of fishes revealed two major
groups, upper and lower RTA and their associated outpools. In this analysis, however, Pools 19 and 20 grouped
with the upper reaches rather than the lower reaches (Figure 4(A)). Six species accounted for more than 70% of the
dissimilarity between upper and lower groupings. Upper reaches were characterized by greater abundance of emer-
ald shiner, bluegill, largemouth bass, bullhead minnow, and spotfin shiner relative to lower reaches (Table III).
Lower reaches had greater abundance of gizzard shad compared with upper reaches.
The mean Bray–Curtis similarity value for consecutive years in a RTA was 85.7 ranging from 74.4 to 92.6
(Figure 4(A)). We chose a Bray–Curtis value of 70 for our sub-grouping distance, producing five subgroups: Pools
26, ORU, ORD, and the Open River Reach (subgroup A) the La Grange Reach (subgroup B); Pools 3, 19 and 20
(subgroup C); Pools 4, 5, and 12–14 (subgroup D); and Pool 8 (subgroup E). Non-metric multidimensional scaling
illustrates these five subgroups in three dimensions with a stress value¼ 0.03 (Figure 4(B)). Eleven species con-
tributed more than 70% to the dissimilarity among subgroups. Pool 8 (subgroup E) had the greatest abundance of
black crappie, bullhead minnow, bluegill, largemouth bass, and spotfin shiner. The La Grange Reach on the Illinois
418 J. H. CHICK, M. A. PEGG AND T. M. KOEL
Copyright # 2006 John Wiley & Sons, Ltd. River Res. Applic. 22: 413–427 (2006)

TableIII.
Surfacearea
(hectares)ofaquatic/geomorphichabitatvariablesas
defined
bytheHabitatNeedsAssessm
entQueryToolforUpper
MississippiRiver
Pools4–26
andopen
river
reaches
(OR).Habitatvariableswerethemainchannel(M
NC),tailwater
(TWZ),secondarychannel(SCH),tributary
channel(TRC),contiguousfloodplain
lake(CFL),contiguousfloodplain
shallowaquaticarea
(CFS),contiguousim
pounded
area
(CIM
),terrestrialisland(TIS),contiguousterrestrialfloodplain
(CTF),isolated
terrestrialfloodplain
(ITF),aquaticvegetation(submersedandfloatingleaved;AV),permanentlyflooded
emergentvegetation(PEV),grass
land(G
L),pioneerforest(PF),
floodplain
forest(FF),agriculture
(AG),developed
(DV)
Area(ha)
ofaquatic/geomorphic
habitat
typeandlandcover/use
type
Pool
MC
TWZ
SCH
TRC
CFL
CFS
CIM
IFL
TIS
CTF
ITF
AV
PEV
GL
PF
FF
AG
DV
41093
12
463
97
10320
1567
408
978
1848
8438
155
5676
4177
2310
441
12608
3526
3873
5337
22
278
59
155
733
2178
442
863
6025
81
4226
1713
3049
362
5362
4860
2192
8627
21
510
30
1125
1573
4024
832
2966
3478
281
6363
3408
3253
572
5718
279
4494
12
596
26
740
4401
545
864
435
1446
1645
737
2732
882
1310
117
4747
196
1981
13
1569
20
789
32
1242
1902
3556
1764
2414
8494
4914
10632
3329
3477
305
12915
4353
8084
14
561
22
599
24
668
00
520
1357
3107
3997
988
573
1067
184
7307
1951
4375
19
1350
30
1527
93
868
1282
1069
1537
2297
14033
34558
4175
1593
2700
477
15159
45713
10328
20
574
39
545
200
23
00
547
786
4829
42140
106
59
1152
184
6704
43819
3856
26
1467
28
1483
51
409
0245
1407
2530
18663
12023
1129
803
1784
644
16217
40169
5034
LG
5829
0441
686
13772
255
07026
2748
48689
64556
02009
4516
020809
15334
1017
OR
1509
0261
67
103
00
5829
451
14880
46567
04806
8294
038097
13180
3511
MISSISSIPPI RIVER FISH COMMUNITIES 419
Copyright # 2006 John Wiley & Sons, Ltd. River Res. Applic. 22: 413–427 (2006)

River (subgroup B) had the greatest abundance of bigmouth buffalo, common carp, smallmouth buffalo, and white
bass. Subgroup C had the greatest abundance of emerald shiner and freshwater drum. Analysis of similarity
revealed significant differences between the two major groupings (global R¼ 0.67; P¼ 0.001) and among the five
subgroups (global R¼ 0.99; P¼ 0.001).
Habitat correlations
Strong correlations between community composition (r¼ 0.80) and structure (r¼ 0.63) matrices with distance
between reaches suggest that fish communities in relatively close reaches are more similar than reaches separated
by larger distances (Figures 5(A), 5(B)). Habitat similarity also was correlated (r¼ 0.74) with distance between
reaches (Figure 5(C)) and most of the habitat variables measured during electrofishing sampling covaried with
river mile (Figure 6). These habitat variables were significantly correlated with both community composition
(r¼ 0.75; P� 0.0001) and community structure (r¼ 0.64; P¼ 0.0010). The canonical Mantel procedure revealed
that the strongest correlations (r¼ 0.90) with community composition were with a habitat matrix composed of
distance between reaches, water depth, conductivity, vegetation density and the frequency of woody structure
presence. The strongest correlations (r¼ 0.73) for community structure were with a habitat matrix comprised
of distance between reaches, flow, vegetation density, frequency of occurrence of woody structure and frequency
of occurrence of flooded terrestrial vegetation. Note that these correlations are only marginal improvements over
correlation with distance between reaches alone.
Mantel tests revealed significant correlations between HNA variables with both community composition
(r¼ 0.72; P¼ 0.0001) and community structure (r¼ 0.54; P¼ 0.0002). The canonical Mantel procedure found
the strongest correlations (r¼ 0.81) for community composition occurred with a land coverage matrix comprised
of side channels, terrestrial islands, aquatic vegetation, floodplain forest and agricultural. Similarly, the strongest
correlations (r¼ 0.63) for community structure occurred for a land coverage matrix comprised of side channels,
contiguous impounded areas, terrestrial islands, aquatic vegetation, floodplain forest and agricultural.
Figure 2. Rarefaction curves from electrofishing data for the six regional trend areas sampled in 2000. It appears that at least 5000 individualsneed to be sampled to adequately describe fish community composition (i.e. to reach the rarefaction curve asymptote)
420 J. H. CHICK, M. A. PEGG AND T. M. KOEL
Copyright # 2006 John Wiley & Sons, Ltd. River Res. Applic. 22: 413–427 (2006)
DISCUSSION
In general, outpools tended to group with adjacent RTAs. Pools 5, 12, 14, ORU and ORD were within the same
sub-groups as adjacent RTAs (Pools 3, 13, and the Open River Reach respectively). The only exception to this
Figure 3. (A) Cluster analysis of fish community composition data collected via electrofishing. The solid line and dashed lines indicate the meanand range of Euclidean distance for consecutive years in a regional trend area. The light-grey line indicates the sub-grouping level (Euclideandistance of 5) resulting in four sub-groups (circled). (B) Non-metric multidimensional scaling plot of Upper Mississippi River pools in three dimen-
sions. The four sub-groups from the cluster analysis are circled
MISSISSIPPI RIVER FISH COMMUNITIES 421
Copyright # 2006 John Wiley & Sons, Ltd. River Res. Applic. 22: 413–427 (2006)

Figure 4. (A) Cluster analysis of fish community structure data collected via electrofishing. The solid line and dashed lines indicate the meanand range of Bray–Curtis similarity for consecutive years in a regional trend area. The light-grey line indicates the sub-grouping level (Bray–Curtis similarity¼ 70) resulting in five sub-groups (circled). (B) Non-metric multidimensional scaling plot of Upper Mississippi River pools in
three dimensions. The five sub-groups from the cluster analysis are circled
422 J. H. CHICK, M. A. PEGG AND T. M. KOEL
Copyright # 2006 John Wiley & Sons, Ltd. River Res. Applic. 22: 413–427 (2006)

trend, the sub-grouping of Pools 3, 19 and 20 in our community structure analysis, may have arisen as a result of
similarity in habitat features and/or low sample sizes in Pools 19 and 20. Thus, our study provides little evidence
that the low-head navigation dams on the Upper Mississippi River have fragmented fish communities. Certainly,
the movements and migrations of some species are affected by these dams (Nielsen et al., 1986; Kelner and
Seitman, 2000; Knights et al., 2002; Zigler et al., 2004). These effects, however, apparently are not severe
and/or general enough to have caused substantial shifts in fish communities among adjacent navigation pools.
In fact, our results suggest a strong negative relation between the similarity of fish community composition and
Figure 5. Relationship of distance between reaches (river miles) with (A) community structure of fishes (Bray–Curtis similarity), (B) commu-nity composition of fishes (Euclidian distance) and (C) habitat composition (normalized Euclidian distance). Plotted are all possible pairwise
comparisons among the six regional trend areas and outpools
MISSISSIPPI RIVER FISH COMMUNITIES 423
Copyright # 2006 John Wiley & Sons, Ltd. River Res. Applic. 22: 413–427 (2006)

structure with distance between reaches. This spatial correlation pattern would not be expected in a severely
fragmented system (Pegg and Pierce, 2002).
Our analysis of both the community composition and community structure of fishes in the UMRS each yielded
two major groups, upper and lower river reaches. Two previous studies also classified the UMRS into upper and
lower reaches based on habitat variables (US Geological Survey, 1999; Koel, 2001). It is likely that geographic
Figure 6. Relationship of water depth, flow, conductivity, vegetation density, occurrence of woody structure and occurrence of flooded terres-trial vegetation with river mile (relative to Pool 3). All habitat measures were collected at the electrofishing sites sampled in 2000
424 J. H. CHICK, M. A. PEGG AND T. M. KOEL
Copyright # 2006 John Wiley & Sons, Ltd. River Res. Applic. 22: 413–427 (2006)

range limitations of fishes, habitat factors, and possibly historic barriers have all influenced the fish composition
and community structure differences between upper and lower reaches. Our analysis also revealed four or five
subgroups of reaches. The La Grange Reach of the Illinois River was a unique sub-group for both community
composition and structure analyses, which was an expected result for this tributary RTA. Pool 8 was a unique
sub-group in terms of community structure. This RTA had the greatest abundance of centrarchid species, which
may be related to the greater abundance of aquatic vegetation found in this reach (Figure 6). Based on the strength
of our analysis of similarity tests (i.e. global R values) and NMDS plots, the sub-groupings we identified appear to
provide an accurate description of the similarity of community composition and structure among the UMRS
reaches sampled. Although there were clear differences between the upper and lower groups based on community
structure and community composition, it is clear that more spatial structure exists in this system than a simple
dichotomy of upper and lower reaches.
Results from this study should be interpreted with caution because the data available for analysis were limited to
one year (covariation of communities through time cannot be addressed) and one sampling gear—boat electro-
fishing. Lubinski et al. (2001) reported that, among all gears used in the LTRMP, electrofishing generally had the
greatest statistical power to detect trends across all species and habitat types. Nevertheless, boat electrofishing does
not sample all species within the UMRS equally well. For example, electrofishing is conducted near the shoreline
and will not be effective for species that primarily occupy offshore habitats. Given the vast spatial extent of the
UMRS and the great diversity of habitat types and fish species it contains, it is unlikely that any single study could
fully address both the patterns and causes of spatial variation of fish communities within this system. Nevertheless,
we feel the present study provides a useful first step in addressing this issue.
Our attempts to correlate spatial variation of fish communities with habitat data were hindered by the confound-
ing of habitat similarity and distance between reaches. Both the composition and community structure of fishes
should vary as a function of distance between reaches because of zoogeography, immigration and emigration,
source-sink dynamics and similar histories of large-scale disturbances such as major floods and droughts (Drake,
1990, 1991; Hamrick and Nason, 1996; Pulliam, 1996). Because habitat similarity was also correlated with
distance between reaches, it is difficult to determine the influence of habitat on fish communities independent
of the spatial demographic processes listed above. Correlations with HNA variables suggest that floodplain
composition and connectivity may also have important influences on fish communities. As with other habitat
variables, however, there are distinct shifts in floodplain habitat from the upper portion of the system to the lower
reaches. For example, lower reaches of the Upper Mississippi River (i.e. below Pool 17) have a much greater
proportion of their floodplain converted to agriculture and far less submersed and floating-leaved vegetation
compared to upper reaches (Theiling et al., 2000). To gain a better understanding of the influence of habitat
on fish communities, future studies could attempt to account for both spatial proximity and habitat variation by
selecting pairs of study reaches that are relatively close in proximity but differ substantially in specific habitat
measures. Also, future analysis could devise an index of historic habitat alterations for each river reach to assess
whether fish community variation correlates with this index.
This study was not able to completely resolve where Pools 19 and 20 fit within the UMRS. Pools 19 and 20 were
similar to lower reaches in terms of community composition, but similar to upper reaches with regard to commu-
nity structure. Electrofishing collections from Pools 19 and 20 differed from all other reaches in that all data were
collected over a period of two days, rather than over a period of five months. Furthermore, our total catch of fishes
was relatively low in these two pools, suggesting that they may have been under-sampled. It is interesting, how-
ever, that Pools 19 and 20 grouped together in both the community composition and structure analyses because
Lock and Dam 19 is one of the largest and oldest dams on the river, and is known to be a barrier to migratory fishes
such as skipjack herring (Kelner and Seitman, 2000; Nielsen et al., 1986). Despite this barrier, our study suggests
overall fish communities within Pools 19 and 20 are relatively similar. An important caveat to this study is that only
three reaches in the pooled portion of the UMRS were sampled below Pool 14 (i.e. Pools 19, 20 and 26), whereas
seven upper UMRS reaches were sampled (Pools 3, 4, 5, 8, 12, 13 and 14). Studies including a greater number of
lower UMRS reaches might improve our understanding of spatial variation of fish communities.
Results of this study support the concept of maintaining the ability to make inferences at both local (i.e.
individual RTA) and regional scales (i.e. upper versus lower RTA). Our analysis of community similarity indicates
that fish communities in the UMRS exhibit substantial spatial structure. A probabilistic monitoring program
MISSISSIPPI RIVER FISH COMMUNITIES 425
Copyright # 2006 John Wiley & Sons, Ltd. River Res. Applic. 22: 413–427 (2006)

focused only on regional or systemic inferences about UMRS fish communities would need to stratify in accor-
dance with this spatial structure to match the sampling effort with the spatial distribution of distinct communities.
This will be difficult until future studies better define the exact spatial structure of UMRS fish communities and
populations. Furthermore, the ability to make inferences about the effects of habitat and management projects to
fish communities at local scales is an important attribute of the LTRMP, especially in light of the confounding of
habitat variation and distance between river reaches. These conclusions regarding the value of accommodating
multiple spatial scales in a monitoring program are not unique to the UMRS or aquatic ecosystems in general
(Olsen and Schreuder, 1997; Trexler et al., 2001; Ringold et al., 2003). Monitoring programs may find the
technique of meta-analysis (Arnqvist and Wooster, 1995; Osenberg, Sarnelle, Cooper, and Holt, 1999; Hughes
et al., 2002) useful for making inferences to larger scales from status and trend patterns at smaller scales.
ACKNOWLEDGEMENTS
We thank the LTRMP fish crews from the Minnesota Department of Natural Resources, the Wisconsin Department
of Natural Resources, Iowa Department of Natural Resources, Illinois Natural History Survey, and Missouri
Department of Conservation, who collected the data reported here. This study was funded by the U.S. Army Corps
of Engineers and administered by the U.S. Geological Survey, Upper Midwest Environmental Sciences Center.
Brian Ickes, members of the Long Term Resource Monitoring Program Analysis Team, and several anonymous
reviewers provided valuable comments on earlier versions of this manuscript. This is publication number 8 of the
National Great Rivers Research and Education Center.
REFERENCES
Aarts BGW, Van Den Brink FWB, Nienhuis PH. 2004. Habitat loss as the main cause of the slow recovery of fish faunas of regulated large rivers
in Europe: the transversal floodplain gradient. River Research and Applications 20: 3–21.
Andersson E, Nilsson C, Johansson ME. 2000. Effects of river fragmentation on plant dispersal and riparian flora. Regulated Rivers: Research
and Management 16: 83–89.
Arnqvist G, Wooster D. 1995. Meta-analysis: synthesizing research findings in ecology and evolution. Trends in Ecology and Evolution 10:
236–240.
Clarke KR, Warwick RM. 1994. Change in Marine Communities: an Approach to Statistical Analysis and Interpretation. Plymouth Marine
Laboratories: Plymouth.
Corbacho C, Sanchez JM. 2001. Patterns of species richness and introduced species in native freshwater fish faunas of a mediterranean-type
basin: the Guadiana River (southwest Iberian Peninsula). Regulated Rivers: Research and Management 17: 699–707.
DeHaan HC, Fox TJ, Korschgen CE, Theiling CH, Rohweder JJ. 2000. Habitat Needs Assessment GIS Query Tool Users Manual. US Geo-
logical Survey, Upper Midwest Environmental Sciences Center: La Crosse.
Dettmers JM, Gutreuter S, Wahl DH, Soluk DA. 2001. Patterns in abundance of fishes in main channels of the upper Mississippi River system.
Candian Journal of Fisheries and Aquatic Sciences 58: 933–942.
Drake JA. 1990. Communities as assembled structures: do rules govern patterns? Trends in Ecology and Evolution 5: 159–164.
Drake JA. 1991. Community assembly mechanics and the structure of an experimental species ensemble. American Naturalist 137: 1–26.
Dynesius M, Nilsson C. 1994. Fragmentation and flow regulation of river systems in the northern third of the world. Science 266:
753–762.
Fourqurean JW, Rutten LM. 2003. Competing goals of spatial and temporal resolution: seagrass communities on a regional scale. InMonitoring
Ecosystems: Interdisciplinary Approaches for Evaluating Ecoregional Initiatives, Busch DE, Trexler JC (eds). Island: Washington, DC;
257–288.
Galat DL, Lipkin R. 2000. Restoring ecological integrity of great rivers: historical hydrographs aid in defining reference conditions for the
Missouri River. Hydrobiologia 422/423: 29–48.
Galat DL, Zweimuller I. 2001. Conserving large-river fishes: is the highway analogy an appropriate paradigm? Journal of the North American
Benthological Society 20: 266–279.
Gehrke PC, Brown P, Schiller CB, Moffatt DB, Bruce AM. 1995. River regulation and fish communities in the Murray-Darling River System,
Australia. Regulated Rivers: Research and Management 11: 363–375.
Gutreuter S, Burkhardt R, Lubinski K. 1995. Long Term Resource Monitoring Program Procedure: Fish Monitoring, LGRMP 95-P002-1.
National Biological Service, Environmental Management Technical Center: Onalaska, WI.
Hamrick JL, Nason JD. 1996. Consequences of dispersal in plants. In Population Dynamics in Ecological Space and Time, Rhodes OE, Chesser
RK, Smith MH (eds). The University of Chicago Press: Chicago, IL; 203–236.
426 J. H. CHICK, M. A. PEGG AND T. M. KOEL
Copyright # 2006 John Wiley & Sons, Ltd. River Res. Applic. 22: 413–427 (2006)

Hirzinger V, Keckeis H, Nemeschkal HL, Schiemer F. 2004. The importance of inshore areas for adult fish distribution along a free-flowing
section of the Danube, Austria. River Research and Applications 20: 137–149.
Hughes TP, Baird AH, Dinsdale EA, Harriott VJ, Moltschaniwskj NA, Pratchett MS, Tanner JE, Willis BL. 2002. Detecting regional variation
using meta-analysis and large-scale sampling: latitudinal patterns in recruitment. Ecology 83: 436–451.
Hunsaker CT, Carpenter DE. 1990. Environmental Monitoring and Assessment Program: Ecological Indicators, EPA/600/3-90/060, BP91-
14196. Environmental Protection Agency: Research Triangle Park.
Kelner DE, Seitman BE. 2000. Relic populations of the ebony shell, Fusconaia ebena (Bivalvia: Unionidae), in the upper Mississippi River
drainage. Journal of Freshwater Ecology 15: 371–377.
Knights BC, Vallazza JM, Zigler SJ, Dewey MR. 2002. Habitat and movement of lake sturgeon in the Upper Mississippi River System, USA.
Transactions of the American Fisheries Society 131: 507–522.
Koel TM. 2001. Classification of Upper Mississippi River pools based on contiguous aquatic/geomorphic habitats. Journal of Freshwater Ecol-
ogy 16: 159–170.
Koel TM. 2004. Spatial variation in fish species richness of the Upper Mississippi River System. Transactions of the American Fisheries Society
133: 984–1003.
Lubinski K, Burkhardt R, Sauer J, Soballe D, Yin Y. 2001. Initial Analyses of Change Detection Capabilities and Data Redundancies in the
Long Term Resource Monitoring Program, LTRMP 2001-T001. U.S. Geological Survey, Upper Midwest Environmental Sciences Center:
La Crosse.
Lytle DA, Poff NL. 2004. Adaptation to natural flow regimes. Trends in Ecology and Evolution 19: 94–100.
Morita K, Yamamoto S. 2002. Effects of habitat fragmentation by damming on the persistence of stream-dwelling charr populations.
Conservation Biology 16: 1318–1323.
Naiman RJ, Melillo JM, Lock MA, Ford TE, Reice SR. 1987. Longitudinal patterns of ecosystem function and community structure in a
subarctic river continuum. Ecology 68: 1139–1156.
Nielsen LA, Sheehan RJ, Orth DJ. 1986. Impacts of navigation on riverine fish production in the United States. Polskie ArchiwumHydrobiologii
33: 277–294.
Noon BR. 2003. Conceptual issues in monitoring ecological resources. InMonitoring Ecosystems: Interdisciplinary Approaches for Evaluating
Ecoregional Initiatives, Busch DE, Trexler JC (eds). Island: Washington, DC; 27–72.
Olsen AR, Schreuder HT. 1997. Perspectives on large-scale natural resource surveys when cause–effect is a potential issue. Environmental and
Ecological Statistics 4: 167–180.
Ormerod SJ. 2003. Current issues with fish and fisheries: editor’s overview and introduction. Journal of Applied Ecology 40: 204–213.
Osenberg CW, Sarnelle O, Cooper SD, Holt RD. 1999. Resolving ecological questions through meta-analysis: goals, metrics, and models.
Ecology 80: 1105–1117.
Pegg MA, Pierce CL. 2002. Fish community structure in the Missouri and Yellowstone rivers in relation to flow characteristics. Hydrobiologia
479: 155–167.
PeggMA, Pierce CL, Roy A. 2003. Hydrological alteration along the Missouri River Basin: a time series approach. Aquatic Sciences 65: 63–72.
Primer-E Ltd. 2001. Primer for Windows Version 5.2.4. Plymouth.
Pulliam HR. 1996. Sources and sinks: empirical evidence and population consequences. In Population Dynamics in Ecological Space and Time,
Rhodes OE, Chesser RK, Smith MH (eds). The University of Chicago Press: Chicago, IL; 45–69.
Ringold PL, Mulder B, Alegria J, Czaplewski RL, Tolle T, Burnett K. 2003. Design of an ecological monitoring strategy for the forest plan in the
Pacific Northwest. In Monitoring Ecosystems: Interdisciplinary Approaches for Evaluating Ecoregional Initiatives, Busch DE, Trexler JC
(eds). Island: Washington, DC; 73–100.
Robins CR, Bailey RM, Bond CE, Brooker JR, Lachner EA, Lea RN, Scott WB. 1991. Common and Scientific Names of Fishes from the United
States and Canada, 5th ed, Special Publication (20). American Fisheries Society: Bethesda, MD; 1–183.
SAS Institute Inc. 1999. The SAS System for Windows. Release 8.01. Cary.
Theiling CH, Korschgen C, De Haan H, Fox T, Rohweder J, Robinson L. 2000. Habitat Needs Assessment for the Upper Mississippi River
System: Technical Report. U.S. Geological Survey, Upper Midwest Environmental Sciences Center: La Crosse.
Trexler JC, Loftus WF, Jordan CF, Chick JH, Kandl KL, McElroy TC, Bass OL. 2001. Ecological scale and its importance for freshwater fishes
in the Florida Everglades. In The Everglades, Florida Bay, and Coral Reefs of the Florida Keys: an Ecosystem Sourcebook, Porter JW, Porter
KG (eds). CRC Press: Boca Raton, FL; 153–181.
US Army Corps of Engineers. 1997. Upper Mississippi River System—Environmental Management Program Report to Congress, Public
Review Draft; 117 pp.
US Geological Survey. 1999. Ecological Status and Trends of the Upper Mississippi River System 1998: a Report of the Long Term Resource
Monitoring Program, LTRMP 99-T001. U.S. Geological Survey, Upper Midwest Environmental Sciences Center: La Crosse.
Zigler SJ, Dewey MR, Knights BC, Runstrom AL, Steingraeber MT. 2004. Hydrologic and hyraulic factors affecting passage of paddlefish
through dams in the Upper Mississippi River. Transactions of the American Fisheries Society 133: 160–170.
MISSISSIPPI RIVER FISH COMMUNITIES 427
Copyright # 2006 John Wiley & Sons, Ltd. River Res. Applic. 22: 413–427 (2006)