Embed Size (px)
Citation preview

Long Term Resource Monitoring Program
Technical Report 2005-T002
Spatial Temporal, and Environmental Trends of Fish Assemblages within Six Reaches of the Upper Mississippi River System
20050329 021 February 2005
DISTRIBUTION STATEMEMT A Approved for Public Release
Distribution Unlimited

Long Term Resource Monitoring Program Technical Reports provide Long Term Resource Monitoring Program
partners with scientific and technical support.
All reports in this series receive anonymous peer review.
Mention of trade names or commercial products does not constitute endorsement or recommendation for use by the U.S. Department of the Interior, U.S. Geological Survey.
^y Priineci on recycled paper

Spatial, Temporal, and Environmental Trends of Fish Assemblages within Six Reaches of the Upper Mississippi River System
by
Valerie A. Barko, Brian S. Ickes, David P. Herzog, Robert A. Hrabik, John H. Chick, and Mark A. Pegg
U.S. Geological Survey Upper Midwest Environmental Sciences Center
2630 Fanta Reed Road La Crosse, Wisconsin 54603
February 2005
Suggested citation:
Barko, V. A., B. S. Ickes, D. P. Herzog, R. A. Hrabik, J. H. Chick, and M. A. Pegg. 2005. Spatial, temporal, and environmental trends of fish assemblages within six reaches of the Upper Mississippi River System. U.S. Geological Survey, Upper Midwest Environmental Sciences Center, La Crosse, Wisconsin, February 2005. Technical Report LTRMP 2005-T002. 27 pp.
Additional copies of this report may be obtained from the National Technical Information Service, 5285 Port Royal Road, Springfield, VA 22161 (1-800-553-6847 or 703-487-4650). Also available to registered users from the Defense Technical Information Center, Attn: Help Desk, 8725 Kingman Road, Suite 0944, Fort Belvoir, VA 22060-6218 (1-800-225-3842 or 703-767-9050).

Contents
Page
Preface v Introduction 1 Materials and Methods 2
Field Methods 2 Statistical Methods—Ordination 3
Results and Discussion 8 Assemblage Structure 8 Ordination—Environmental Gradients/fish Assemblages 8 Ordination—^Temporal Shifts in Assemblages 12 Ordination—Assemblage/strata Relations by Reach 12 Ordination—Sampling Period 21
Conclusions and Recommendations 21
Acknowledgments 23 References 24
Tables
Number
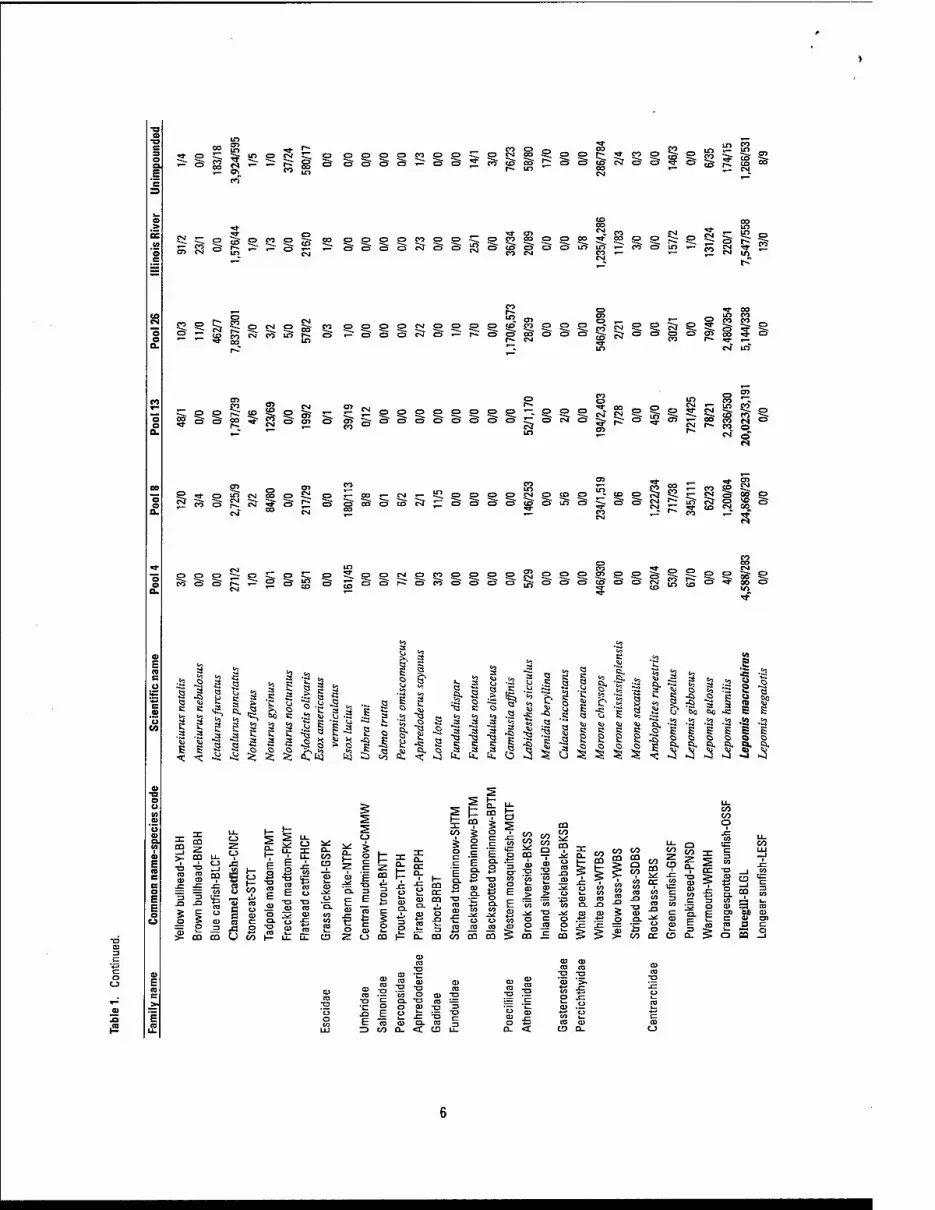
1. Abundance of each fish species (adult/young-of-the-year) collected by the Long Term Resource Monitoring Program in the Upper Mississippi River System from 1993 to 2001 using daytime electrofishing, mini-fyke netting, and small and large hoop netting 4
2. Summary statistics and number of samples (AO for environmental variables measured during fish sampling in the Upper Mississippi River System from 1993 to 2001 at six sampling reaches 9
3. Amount of variation of each environmental variable explained within the six sampling reaches of the Upper Mississippi River System based on partial canonical correspondence analyses 10

Figures Number Page
1. Geographic representation of the six Upper Mississippi River System Long Term Resource Monitoring Program sites sampled from 1993 to 2001 3
2. Partial canonical correspondence analysis (pCCA) of environmental gradients and species for the Upper Mississippi River System, given gear, year, and period 11
3. Partial canonical correspondence analysis (pCCA) of year and adult individuals for the Upper Mississippi River System, given gear, period, and physical habitats 13
4. Partial canonical correspondence analysis (pCCA) of year and young-of-the-year individuals for the Upper Mississippi River System, given gear, period, and physical habitat 14
5. Partial canonical correspondence analysis (pCCA) of strata and young-of-the-year individuals for the Upper Mississippi River System, given period, gear, and year 15
6. Partial canonical correspondence analysis (pCCA) of strata and adult individuals for the Upper Mississippi River System, given gear, period, and year 18
7. Partial canonical correspondence analysis (pCCA) of sampling periods 1,2, and 3 for the Upper Mississippi River System, given gear, year, and physical habitats 22

Preface
The Long Term Resource Monitoring Program (LTRMP) was authorized under the Water Resources Development Act of 1986 (Public Law 99-662) as an element of the U.S. Army Corps of Engineers' Environmental Management Program. The LTRMP is being implemented by the Upper Midwest Environmental Sciences Center, a U.S. Geological Survey science center, in cooperation with the five Upper Mississippi River System (UMRS) States of Illinois, Iowa, Minnesota, Missouri, and Wisconsin. The U.S. Army Corps of Engineers provides guidance and has overall Program responsibility. The mode of operation and respective roles of the agencies are outlined in a 1988 Memorandum of Agreement.
The UMRS encompasses the commercially navigable reaches of the Upper Mississippi River, as well as the Illinois River and navigable portions of the Kaskaskia, Black, St. Croix, and Minnesota Rivers. Congress has declared the UMRS to be both a nationally significant ecosystem and a nationally significant commercial navigation system. The mission of the LTRMP is to provide decision makers with information for maintaining the UMRS as a sustainable large river ecosystem given its multiple-use character. The long-term goals of the Program are to understand the system, determine resource trends and effects, develop management alternatives, manage information, and develop useful products.
This multiyear report supports Tasks 2.2.8 and 2.3.2 as specified in Goal 2, Monitor Resource Change, of the LTRMP Operating Plan (U.S. Fish and Wildlife Service 1993). This report was developed with funding provided by the LTRMP.

Spatial, Temporal, and Environmental Trends of Fish Assemblages within Six Reaches of the Upper Mississippi River System
by
Valerie A. Barko', Brian S. Ickes^ David P. Herzog', Robert A. Hrabik', John H. Chick\ and Mark A. Pegg^
'Missouri Department of Conservation, Open Rivers and Wetlands Field Station 3815 E. Jackson Blvd., Jackson, Missouri 63755
W.S. Geological Survey, Upper Midwest Environmental Sciences Center 2630 Fanta Reed Road, La Crosse, Wisconsin 54603
^Illinois Natural History Survey, Great Rivers Field Station 8450 Montclair, Brighton, Illinois 62012
^Illinois Natural History Survey, Illinois River Biological Station 704 N. Schrader Avenue, Havana, Illinois 62644
Abstract: We investigated differences in adult and young-of-the-year (YOY) fishes within each of the six Long Term Resource Monitoring Program study areas, using monitoring data from 1993 to 2001. Our objective was to investigate the relative roles of seasonal, annual, in situ, and physical habitat factors in explaining assemblage structure patterns within the Long Term Resource Monitoring Program study areas. Adult and YOY assemblage structure within each reach was dominated by one to three numerically abundant species. The percent of the total abundance for which these species accounted was 10-88% and varied among age classes and study areas. Physical habitat classes were only weaWy associated with differences in fish assemblage patterns within each study area. The amount of variation in fish abundance explained by physical habitats varied among the reaches. Differences among physical habitat classes accounted for 3-23% of the variation in the adult fish assemblage and for 3-20% of the difference in the YOY fish assemblage within each reach of our study area. Factors associated with interannual differences in environmental conditions were strongly correlated to patterns in assemblage structure within each of the six study areas. This was particularly true for YOY assemblages. Such a result would not have been attainable without long-term standardized data. Little is known regarding YOY assemblage patterns and dynamics in large river systems and long-term data sets are vital for continued investigation. The influence of environmental gradients on fish assemblage structure varied among the six study areas and explained 9-31% of the variation in assemblage structure. In the northern four reaches, water velocity was one of the primary factors associated with difi'erences in fish assemblage structure. In the Unimpounded Reach (Upper Mississippi River) and Illinois River study areas, river elevation was one of the primary factors associated with differences in assemblage structure. Depth of gear deployment was influential in explaining differences in assemblage structure patterns in all reaches except the Upper Mississippi River Pool 4 and the Illinois River study areas. In all study areas, the amount of variation in fish abundance patterns explained by sampling period was relatively low. However, assemblage structure differed among sampling periods. In the northern reaches, sampling periods 2 and 3 were the most similar.
Key words: fishes; Illinois River, impounded, long-term, LTRMP, Mississippi River, ordination, unimpounded, YOY
Introduction include channelization, the creation of wing dikes and levees, dredging, loss of low velocity
Large river systems worldwide have been physical habitats, exotic species introductions, subjected to anthropogenic disturbances agricultural pollution, and the creation of locks throughout the last century (Petts et al. 1989; and dams (Gehrke et al. 1995; Williams et al. Dynesius and Nilsson 1994). These changes 1996). As a resuh, North America's temperate
freshwater ecosystems are being depleted of species as rapidly as tropical forests (Ricciardi and Rasmussen 1999), and this loss has been exacerbated by landscape-level disturbances (i.e., erosion, sedimentation, river regulation, degraded water quality, etc.).
Natural floodplain rivers are among the most biologically productive and diverse ecosystems (Tockner and Standforth 2002). They are also among the most disturbed ecosystems, especially in north temperate regions (Welcomme 1979). Large floodplain rivers are generally regarded as having diverse physical habitat maintained by natural flows, providing the variety of lentic and lotic environments that support diverse fish faunas (Poff et al. 1997). This diversity, both biological and physical, may exist because of the channel-floodplain complex and the annual cycle of flooding (i.e., flood-pulse concept; Junk et al. 1989). Whereas the flood-pulse concept has yet to be validated in large temperate rivers, studies in Europe (Welcomme 1995) and North America (Hesse et al. 1993) indicate similar processes between temperate and tropical rivers. River- floodplain connectivity and habitat heterogeneity are maintained by natural hydrologic regimes and environmental gradients (Sparks et al. 1990; Ward 1998). However, altered hydrologic regimes, habitat modifications, exotic species invasions, and pollution are resulting in floodplain degradation and may prove to lower species diversity (Heiler et al. 1995; Theiling 1996; Pegg and Pierce 2002).
The Upper Mississippi River System (UMRS) is probably the most biologically productive and economically important large floodplain river system in the United States (Patrick 1998; U.S. Geological Survey 1999). Fishes inhabiting the UMRS occupy a broad range of macrohabitats, including the navigation channel (Dettmers et al. 2001). However, fish:habitat relations and assemblages across environmental gradients are just beginning to be explored (Pegg and Pierce 2001, 2002; Braaten and Guy 2002; Barko and Herzog 2003; Barko et al. 2004&).
Whereas a wealth of biological data is available on the Mississippi River (Patrick 1998), most studies conducted were largely area specific and not standardized. As navigation expanded on the
UMRS, concerns grew over the sustainability of the ecosystem. Consequently, the Environmental Management Program was created in 1986 in response to these concerns (Lubinski 1999). The Environmental Management Program includes a biological monitoring program for the UMRS known as the Long Term Resource Monitoring Program (LTRMP; Jackson et al. 1981; U.S. Fish and Wildlife Service 1993). Although the state of Illinois has maintained a longer Illinois River monitoring program (Bertrand 1997), the LTRMP is the largest systemic monitoring program in the basin. Understanding how fish assemblages are similar or different within the LTRMP study areas is critical for evaluating past and present stressors on fish resources throughout the UMRS, while understanding how assemblages respond to ecosystem changes over time is critically important for adaptive management of the UMRS.
Using LTRMP data, we investigated fish assemblages within five reaches of the UMR and one reach of the Illinois River to better understand patterns in assemblage structure and identify trends. The objectives of this study were to assess associations between fish species abundance, sampling periods, sampling years, environmental variables, and five physical habitat classes using ordination techniques.
Materials and Methods
Field Methods
We used data collected from 1993 to 2001 in five reaches of the UMR and one reach of the Illinois River (La Grange Pool; river mile [RM] 80-158) by the LTRMP (Gutreuter et al. 1995). Mississippi River study areas included Pool 4 (excluding Lake Pepin; RM 752-797), Pool 8 (RM 679-703), Pool 13 (RM 523-557), Pool 26 (RM 202-242), and the Unimpounded Reach (RM 29-80; Figure 1). Fishes were sampled annually from June 15 to October 30 in three annual sampling periods (1: June 15-July 31; 2: August 1-September 15; 3: September 16- October 30) using a stratified random sampling design developed by Gutreuter et al. (1995). At each site, measurements of water temperature.

La Grar)ge Pool
50 _l_
I II I M M I 0 50 100 200 Kilometers
Figure 1. Geographic representation of the six Upper IVIississippi River System Long Term Resource IVlonitoring Program sites sampled from 1993 to 2001.
Secchi transparency, depth of gear deployment, water velocity, and conductivity were made prior to fish sampling. Water temperature was measured to the nearest OA°C and conductivity was measured in |j,S/cm using a Labcomp digital conductivity meter. A Marsh-McBimey flow meter (model 201 D; Frederick, MD) was used to measure water velocity to the nearest 0.01 m/s. Depth of gear deployment was measured to the nearest 0.1 m using boat-mounted sonar. River elevation was obtained from the U.S. Geological Survey for each day of sampling.
Data collected from five physical habitat classes and four sampling gears common to all six study areas were used for analysis. Physical habitat was classified and stratified based on geomorphic features and included side channel border, backwater contiguous, main channel border, main channel border wing dike, and impounded (Gutreuter et al. 1995). Collection methods included active (daytime electrofishing)
and passive (mini-fyke netting, small and large hoop netting) techniques. See Gutreuter et al. (1997a-c) and Burkhardt et al. (1997, 1998, 2000, 2001,2004a,b) for annual gear allocations within and among the six study areas.
Statistical Methods—Ordination
We separated young-of-the-year (YOY) fishes from adult fishes using reported lengths for each species (Carlander 1969,1977; Becker 1983; Etnier and Stames 1993; Morrow and Kirk 1995; Pflieger 1997; Gido et al. 2000) following the methodology of Barko et al. (2004a) because adult and YOY fishes appear to exhibit different responses to physical habitats and environmental conditions in this system (Barko and Herzog 2003; Barko et al. 2004a,b). Hybrid individuals, larval fishes, and unidentified fishes were removed from the data set prior to analysis. We conducted separate ordination analyses for each study area, using all four gears combined, to enable us to identify reach-related trends
and determine whether the fish assemblages responded similarly to environmental and temporal variability. Ordination methods used in analysis included detrended correspondence (DCA), canonical correspondence (CCA), partial canonical correspondence (pCCA), and stepwise pCCA, with methodology following Barko et al. (2004Z7). All analyses were performed using CANOCO v. 4.5 (ter Braak and Smilauer 2002). An estimate of the amount of variation explained by each ordination analysis is provided by the sum of all canonical eigenvalues (Leps and Smilauer 2003). Caution must be used in interpretation, however, because the amount of variation explained is not equivalent to an 1^ value. For visual clarity, we only display abundant taxa (e.g., species weights >1) on ordination biplots by species codes listed in Table 1. Discussions on biplot interpretation can

E 'to
o CM
en
E o
'a. .9-x: 00 o
.£2 m to (U to
o.
a> CO
if CO CO
O) o - o- ■
O A
P o o °-
0= m E .E S E F o 0."° c >■ 3 -5 •& 03 >■ E XI 3
0}
O 0)
■^^ .s S B <S >- -=
■= ?
9 -o " S § = ■» o ro "2
:gr E S = « « i S g .2 ^ «
S-l i yj C CD
x: •— E S ■- E to c= o
o g" Q) •=
i 6 o ^ °? E <t U CO ^ I = S ^ E »2 ^ .^
M
00
CO
CD O O
gi 55 w ^ ^ " ^ ° 5 '- oJ
^ CM
f s CO
M M f^ CO
;S fH o t^ jH ::: c^ ^ r-
;n" CM
CM
CO
^ cz> go ^ oS a^
r- .0 ^ 005?'-
^ O CD C3 O
g3 CM if2 CM O p=r csT s^ ^ 00 *=* .— E O CM
CO CM
r-- Q Q
,r- CD »—
§ Sr S C: S? 5 «>
SS S 5° CJ 5 oS
CO
CO CD CD t-- o o §
00 CD
> Sr S 00 CO 5 ^ ir> a — —
°^ CNJ ^
f^ " ^ — £2 tn CD
^ -s Si if ^ a
s S F- -^ Si S ?J m 5? ir> "^ CM
CM C3 C3 9^ C3 1— PO CD CJ O T- O
CDCSIO«~CDO^O
■*■ ^
o »- C^ C7>
^ M
5 5 P^ ^ O O o P CD t3 C> CD
g s 5^° ^ "S-
^ SI
5-: c^
c*J jz ^-
g S g s ^ Sr O n O
O ^ C)
r— O ^ ^
^ s •a ■a c
I
OS,
I 3 3 -S -c j; ^ c c
■S- §- B.^> ^ Co Q,
5 s
CO ci
"5 ^ 9. ^
•S "5
a -^
K ,gj ^ ^ Bj ta -C ^ S 5 S :5 :5 5 ^
^ a -a
&3 --i --J
■5 ■£ ■£ ^ ^ -b
•a o. a. a -2 .3 •« "3 5 a; aj
I
I ^
<
QJ C/3 j^ _l
Q. >■ 2 c E OJ S o
m a. -a S, :^ E = - ^ <S 5 B B u. -E. " « OJ o) 03
O CO < _J
CD
s- a: S 2;
5 CQ
if
rr :n 0
D
>■ LU
Ul
< "Hi
op
C
00
CD
Cl) tl> >- c
to x: (O
3- Q> 0
?^ ^ <<> -^ 5^ "5 fc. 3: 00 Q g "- CD ??! «
CO I—
o te; tt:
CO
U E CQ
p. e- g fcj O) o ra > r-
:e :£^*
■ts -c
11 >-J § ^
= 5 >
Q- ^ CJ X r^ 00
:= s CO Q- CO CD CD 5 < CO O I—
liz w CO « -a CO TE
O iZ CD O4 CD CD OC 03
w 2 S .E CO CQ CO
E
E .2 < 3:

E 's 3
5 ^ ^ - 2- CO o cs 7:^ ^ o o ;> —
OO CO ,— r- go irj c?5 ^ ^ ^
m
o o T— o
o O CD C3
Fa 52 o? i:: ^ S ^ ^ & ,-- 5£ OT
^ CM
^ r- CM C3 ^ S? r? S & & &&&S&OC3CD
CO O O O O CD CO 05
0& o o oJ S «:r CO o C3
CM CO CD
7* ;?? «-
in S2 ?S CO tr Ci CO S B ^
o S go
in
00 ^ c> ■«*■ CO
CD <cr o CM ^-r^-J^CDCDOOCDcD CM r*. ^ in CM r- CO
^ ^ ^
wf OO r- -^- CD
S g s° is C\ g m FH g
J> •* O »— O £0 ^ & ^ O C3 O
". ^ "- t^ to CO £5i in in 2 !-
CT ^ ^ S 2 Ob CM ^
' £0 pi S^ "> "^ in CM *~
^ 9 ^ rsl ^ 5L z: ^ ^ 52 "^ CM
§ 2i c: 5 ^ r; g g § ° = S •^ 57? CO CO
CO O 5J- O ^ CD ": ^ S^ ^ s ^ CO \^ 00
§§^5 t~. O 03 Ln
?j ;=r r- 1^,
05 m CO CM CM O)
o IS I--
?• J? (^ ■»
C3 O oq
CJ "^ IT CM
^ ^ £ if CO r- -t
^ CM C3 ,_ CO C3 CO ;_
^ ^ 52 03" LB" O O g O CM
6 .s -s € ^
&0
■Si
II s <0 -O "G -Q •*! t^
,(0 to t^ t-S «^ t^
s- "§■ "S' "I* !• §- g g g ^ § g S ^ .2 >5 .2 5 a :?; £; S: fe: fe:
(-1 ;«
5 -t:
"I I
fe; fe;
S -5 V5 -a -a -3
<§■
CO o CD
^ C/1 00
LU z i
z 00 LJJ m iL
z z 00
CD
CO
a5 E=
GO
CO
a? r^ s .H" ^ Q. CO CD OO
S s
•S
g §
■? o S CO
5 CO 00
^ s o ri m a. XJ
^ c= ,„fl^
o E 0)
C -S T3 ■£ ■p = S ^ fc O _ 03 <» E E H S3 c 55 o c= J^ ■^ ^ Ol O =3 ^ 3 3 O — Q. CO 00 ca
•I ^ *= "3
^ u.
<? S 00
CO CJ w -^
" "o E ^; i_ x> «= 2 «% = .£= .t:
cj cc O n:
S CO '? S ^ OQ
^ CO I = ll
"- 5f ? OQ °- S ii O) op CQ i OJ
I 03 to O -^ I-
■;;; o o
•t CO -o ^ -^ 03
cc a CD
:r CO ;^ CO
a t ^ o CO z
O H 03
ca (/I V) oc CD 00 CO
^-- **■ !*' " 3 > _3 (S| r— O CO p
,^ CO CD r^ r-> rvi or* .-T^tS'^evJtD'Offtli^CDCD ^
O' f~^ 1-" i—" ^ OO O O CD O »— ^ ^ S^ S CD
CD CO CO CD OO 'd- OO CD O to e=> CD CD
£i o § ^ r-^ ^ ^ o in »— « cj t— i2 CM
CO o C; " & ^ 5^ ?=: ^ ^ S £2 CO lo r;:
C3 CM p ^ p ct cCr CD *— r^
tp CO p p p co" £:::i CD" CM
in m
OJ on ? ^ CM" 1X3
^ ^ CJ
o o S9 ^ J<g C3 OJ H- ^ S 5 ° ^
CO CD ■*- S O S O ^^ i ^ or
O 2 m CO "^ CM ^ M £0 _ --^ ^ CD (*1 ^ CO CO (S CD
f^ CO o CM o'
M
CM
ID CM
P! SI T-OOj^CMr-iii^^^ S'o&oS'rsT^CD O CD
CD CM p p
^ £2 S ^ " £D £i SI S c Ci S 5B e cN ^ iS Sr o vg s r-j ;r^ ^3- to CM 00 ,—" '^ CO v" TT
c> o ry ;^ <-■ CD
O CO O O CM 5
■i 3 S o
^ S -5 S
nil
tS tg (2 cS
.3 ■« S S I I S S g
III
3 ^ g o
S :S ^ § C? 60 00 -c tn Co to ;c
s i I s o o o o a, o, n, la, ^ _ 3 ^ ,3 ^ 5 ^
E S
o o
>- °? u. V _ 43
11 Q i fe S i 1 b; "S = <2 cj o?
a CO -a E
^ E
5 i ^ S -c S U CO
E ■o 3 E
f I a- m -=
CO ^ "?
rr
op
c cr
5 o cr EZ
E Q- O
O c c
*E a. o 3
CO
O- F cr -o tn
o CQ oc s CD S E CD
CD m T3 ■c n f/i
R o JC=
ja£ JH£ CD .^ tt
^ O CJ CO to CO CO ^ O JO
CD Z:OCQH-0-QQCOC!QCQ g m 1 m 5 5 :2 .9- -S S E 0) 43 O 1- 3 >- C/3 CC CD D.
s CO r- XJ
g g CD 'E ■^ C3.. CQ CO n (/) a i_ o 01 CO
en ? 05
CO c
^ o « -j
O- "O CO ^
E Z3 00 Q- < CD LL. a- <

o 2 c: a S ^ i ° i I
CM ^
«^ u^ O ^ O S CNT ^ & CD
C> ^ CO o o o ^ csT O
o ^ o »- »-
fe pSf ^ C^ ^
00 S So <^-
CD CO 2 '^^ 0& ^ ^ ^ CO CTJ in
CM in
r- CM
I— •— C3 CD
^ £2 ^ ^ ^ ^ CD C3 ^ C3 ^tf-Ca^J-CSOCMCO-r— ^
CD CD CD CM ^ ?j ^ CO CO
^ CD
o p o CO p^ S d 9? S E2 S Ss oo a? x; to — S
>" s ;s !^ c; & m .- g: S !S °-
CD C3 03 O O C^ ^ & ^ ^ CD ^ ^
O O CD CM O !C1 ^ 3" & OO CD °
^ fZ CD
a' s> cr p^ r*
CM CO
" o SI S5
C3 O £1^ p p & S -— C3 ^
rt T- rt
CD CO CD
to
in
OT
*-i .-^ c*' _ ^ ^ ;=; c o^oS-cDOin
(—■^OCOCDCOCDCDCM^ CD m r- CD CD *— in ??
m »—
^ IT- 5 i^, oo »— CO R. » 0> CM *— ^ ^»- ^ P^ CO cJ
m
CDCOOincMCr^COt— ^OO CO CD *- SI CD CO CD
in »— CD
r- en -^ i^- r: i2 2 S 5 S csT ^ [^ ir5 " m CM £ OT
CO CM "^ -d-
■= -S -^ ^ tij ty tt5 (1,
.2 -5
^
CD
00
E C/5
00
S fe Q. -T* t^ " CO > CQ
j= S- "Q. +-'0.0. 3 CO (o O 1- 1^ E " o m S J^ en .t; o »- x: (o "55
a CO
to XJ
CE p
e o o t
CD M a a>
tZ CO O
E- §
ra T3
to 2
9 a: Pea C ID CQ
p s s CD CD
CC O
CC a: D 00
a_ CO 03 ^ »i- ^ ? DI 03 ra =r a. t ■= .c CD ra X3
j "o ra
>- 03 "S C D3 ® c c ^ x: CD ^ o
CD 03
^ .^ jr CO O *- ™ S CQ ° l2 -^ O CO
o. o "E -fc gj- to 03
O o. o C = 03 CO 03 03 O — -^
S= Jj CQ CO
o CC a ■>- s o
CC rr LU >- T3
*r t: § CD f/1 ^ ffl -a
C/3
ir
03 cn
CD >■ 0)
i 1
O CO b

be found in Legendre and Legendre (1998) or Leps and Smilauer (2003).
Results and Discussion
Assemblage Structure
In all four gears combined, we collected 740,994 fishes comprising 122 species in 7,838 sampling episodes (i.e., Pool 4 = 714, Pool 8 = 1,885, Pool 13 = 1,546, Pool 26 = 1,701, Unimpounded Reach = 1,206, and Illinois River = 786; Table 1). Pool 8 had the most adult fish (67% of total catch), followed by Pool 26 (49%), Pool 4 (47%), Unimpounded Reach (44%), Pool 13 (42%), and the Illinois River reach (38%). The numerically abundant component of the adult and YOY assemblage (e.g., species accounting for >10% of total catch) differed among the age classes and reaches. In Pool 4, there were three numerically abundant adult species, emerald shiner (Notropis atherinoides; 26%), gizzard shad (Dorosoma cepedianum; 13%), and bluegill {Lepomis macrochirus; 12%), which accounted for 51% of the total adult abundance. Emerald shiner and gizzard shad comprised 86% of the YOY abundance (75% and 11%, respectively). In Pool 8, there were two numerically abundant adult species, bluegill (26%) and bullhead minnow {Pimephales vigilax; 10%), and two numerically abundant YOY species, emerald shiner (19%) and spotfin shiner {Cyprinella spiloptera; 23%). In Pool 13, there were also two numerically abundant adult species, bluegill (32%) and emerald shiner (16%), and two YOY species, gizzard shad (12%) and mimic shiner {Notropis volucellus; 41%). The numerically abundant component of the adult assemblage were gizzard shad (25%), common carp (Cyprinus carpio; 19%), and channel catfish (Jctalurus punctatus; 11%), whereas the numerically abundant component of the YOY assemblage were gizzard shad (49%) and channel shiner (Notropis wickliffi; 12%). Gizzard shad (25%) and channel catfish (14%) were the numerically abundant fishes of the Unimpounded Reach adult assemblage whereas freshwater drum (Aplodinotus grunniens; 36%),
gizzard shad (32%), and channel shiner (12%) were the numerically abundant fishes of the YOY assemblage. Gizzard shad (27%), common carp (18%), and bluegill (13%) were the numerically abundant adult species in the Illinois River, whereas gizzard shad alone accounted for 88% of the YOY abundance. Of the 10 numerically abundant species listed above, 7 (emerald shiner, gizzard shad, bluegill, bullhead minnow, common carp, channel catfish, and freshwater dram) are considered fluvial generalists (Kingsolving and Bain 1993; Galat et al. In press; Barko et al. 2004fc). Collectively, these seven fluvial generalists accounted for 64% of the total UMR fish abundance. The remaining three species are considered fluvial specialists (Barko et al. 2004Z7).
Ordination—Environmental Gradients/fisti Assemblages
The six environmental variables measured concurrently with fish sampling (Table 2) had varied effects on fish assemblages. These variables explained 23% of the variation in fish abundance in Pool 4, 23% of the variation in fish abundance in Pool 8, 17% of the variation in fish abundance in Pool 13, 31% of the variation in fish abundance in Pool 26, 30% of the variation in fish abundance in the Unimpounded Reach, and 9% of the variation in fish abundance in the Illinois River reach (Table 3). Because of shared variance among the variables, percentages listed in Table 3 may not sum to equal the overall percentages listed above. Water velocity was one of the primary factors (i.e., explained the most variation and had the longest arrow [s] on the ordination biplots) associated with differences in fish assemblage structure in the northern four study areas (Figure 2). In the Unimpounded Reach and the Illinois River reach, river elevation was one of the primary factors associated with differences in fish assemblage stracture (Figure 2). Depth of gear deployment was influential in explaining differences in assemblage stracture patterns in all study areas except Pool 4 and the Illinois River (Figure 2). Secchi transparency was most influential in Pool 4, whereas conductivity was most influential in the Illinois River reach (Figure 2).
8

X CD
E
CM CJ oo ^ ^ o
lO CO CNJ CM *— *- »—
CO oo wj CO Jl:
»— CM CM T-
CD O
to •-
O p^
to »— ^
w 2
CO — t Vi N a> Q-.!2 S
ES -5
•j _«
E CO
E' E
.s- 0)
o « > c (D CO
E
»— C5 «a- r-
p 5
CO V—
s
•- CD
■a '5.
o w
is o

•e ^
> e fV <0
^ m o i=
x: C o E=
CCI to
a. CO E CD
ta
^ 5 CD
0) e fn o. 0) b
E S
o g 0) m n
O o
•■P w V)
t— ^
E < CO a .a |2
a> a n ^ a.
E .c o s. tS a>
(S k. ts ?ft u.
5 c o IS
>
u 3
:> a.
o
o
B a Q cu
B. E uL
0} CD
$ o
CD
^
0) S3
> o.
u ^ to
? o a>
CA
B O
a > ^
c o s 0
T3
0}
"1
•B <=>
^ ri ^
»— CM
'-C R
V ^
•s t^ to in
O- S3
LZ = 3 o o a.
CO >
Is
CO ^
5:.>
"H '5.
.E S o o o
CM
§ a o CD
tr CD CsJ LO
o CD
V CNJ
i CD O
C3 o
CO en CO
O
V
p
s CM
g O o
o OO CM CM
p CD 05
CO OO
o o 0-
"o o CL.
10

3S!XV\O0d 2S!xv\O0d
Z sixvvOOd 3S!XVV03d
0)<
fc CO a> >-; w o >- II
> CO
— *~
St o o
II o (1) II
(O
=3 o: £ en ■•-' CO
BI
i2 rM
'OJ D) CM 'O) W tM
■x tn < X
I 22 1^ , "^ I- I ^ o
II o 0) II = <u ro = > to ^ > O) 0)
*(B DJ T— 'a> « «—
ll CO —
ZSjXVVOOd 2S!XVV00d
:? CO ^ . ^ to
m oo o CM C
Q CO t3 = Q. C
II ',' ^ 0) E c
(U 3 s§
o m o
*> > C 03 a>
0) O) CD 'S <u CD CO
< CO to tu
o ^ X .5" < tD
i-C ^^ >a- C=> CO
o '~. 'x >- o o < CO 1=
a. tU OT
P to o
o "o g n
0) ■a D) = c CD
a. ?> ^ > "^ c a> CO tu
^ o 00 x .S"
1 u
o 3
> £2';^
ll Q o "- x: Q- LU CO to
■a- tu CO
t ca
_o (U a.
T3
° -D M CD
.11 C to o
u CD & <=^ Si
CO ni .5" c
iZ >• tu =)
11

Ordination—Temporal Sfiifts in Assemblages
Between 1993 and 2001, the fish assemblages of the UMRS were subjected to floods of varying magnitude, as well as the introduction of exotic species, such as silver carp {Hypophthalmichthys molitrix) and bighead carp {H. nobilis; Chick and Pegg 2002). The effects of the 1993 flood seem to have resonated through 1994 and 1995, probably because it was an unusual summer flood and among the highest recorded floods throughout the system (Gutreuter et al. 1999; Figures 3 and 4). In the lower reaches of the UMRS, this was classified as a 500-year flood with record setting duration and discharge (Parrett et al. 1993). However, the extent of the influence of interannual variability on assemblage structure varied between age classes (i.e., YOY and adult) and among the study areas (Figures 3 and 4). For adults, sample years explained the most variation in the Unimpounded study area (12.2%; F = 3.7; P = 0.0005) followed by Pools 8 (11 %; F = 77.5; P = 0.002) and 26 (11%; F = 5.6; P = 0.0005), Pools 4 (9%; F = 2.9; P = 0.0005) and 13 (9%; F = 3.8; P = 0.005), and the Illinois River study area (8%; F = 12.2; P = 0.002). For YOY assemblages, sample year explained the most variation in Pool 13 (50%; F = 7.4; P = 0.0005), followed by Pool 4 (34%; F = 2.9; P = 0.0005), Pool 8 (32%; F= 15.1; P = 0.002), the Unimpounded study area (27%; F = 14.4; P = 0.002), Pool 26 (19%; F = 4.1; P = 0.0005), and the Illinois River study area (13%; F = 3.7; P = 0.0005). Interannual variability appears to influence YOY assemblage structure in the UMR to a greater extent than adult assemblage structure, especially in the upper study areas. For both adult and YOY assemblages, patterns were not strong, but temporal variability was evident based on the separation of the sample years in ordination space (Figures 3 and 4). In Pool 26 and the Unimpounded reach. Axis 1 separated the years 1994,1995, and 1996 from the other years indicating the adult assemblage present in the early years of sampling differed from the assemblage present in the later years in these lower UMR study areas (Figure 3). Within all study areas except the Unimpounded Reach, the YOY assemblage structure has shifted over
time because Axis 1 separates the earlier sample years (1993-1998) fi-om the later sample years (1999-2001; Figure 4). The underlying cause of the shift in abundance is unknown. Although some general patterns emerged, 9 years may not be enough time to identify the response of the fish assemblage to interannual variability within the system. Many species are long-lived and responses to changes in the system are not instantaneous and may not appear for several generations. Conversely, these findings may also suggest that temporal variability within the UMR may not affect assemblages as much as regional variability (e.g., localized variability within each reach) because assemblages and age classes did not respond to each year similarly within and among the study reaches.
Ordination—Assemblage/strata Relations by Reach
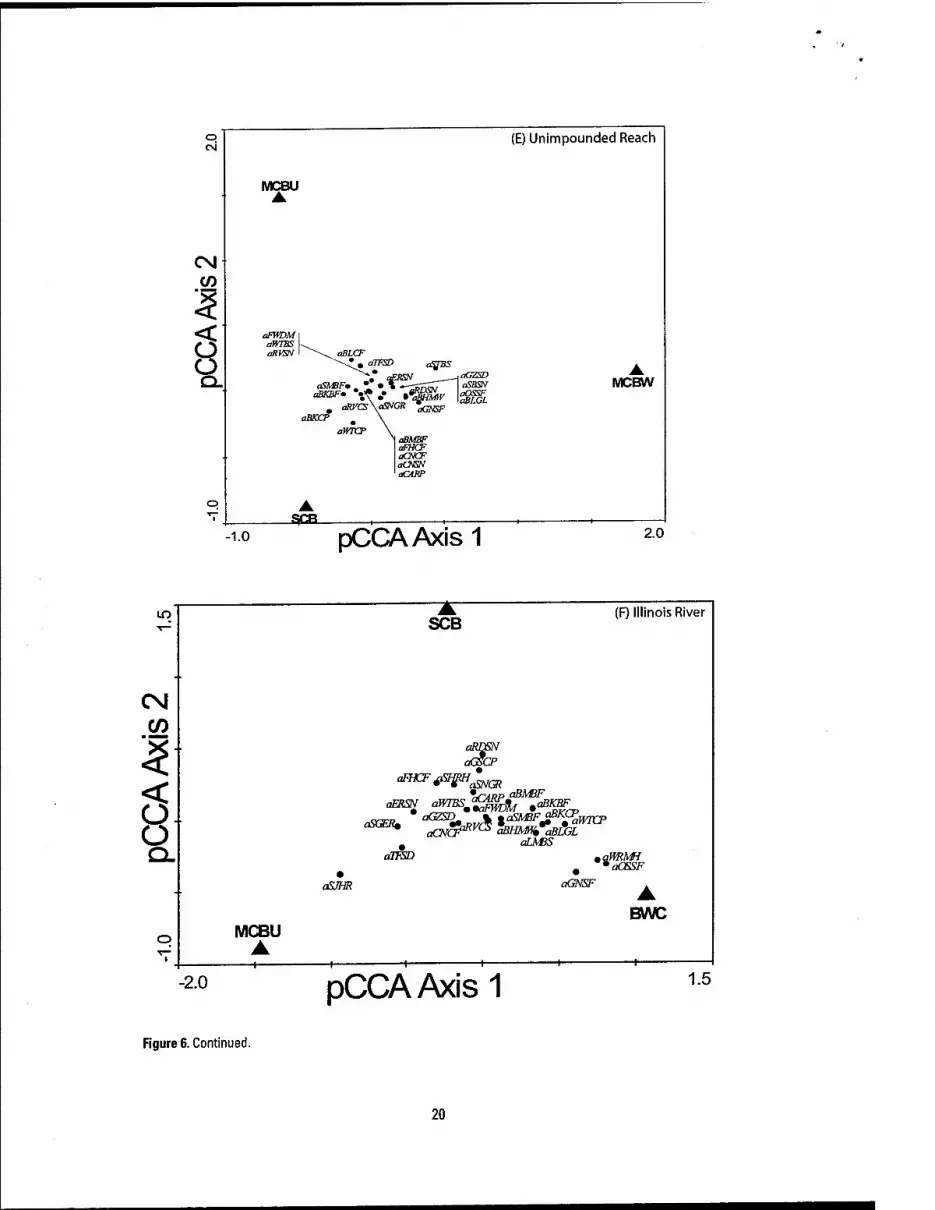
The physical habitats sampled by the LTRMP were separated in ordination space within all study areas based on fish abundance patterns; however, the amount of separation varied within and among the age classes and study areas (Figures 5 and 6). For adults, physical habitats explained the most variation in Pool 8 (23%; F = 61.33; P = 0.002), followed by Pool 4 (22%; F= 19.1; P = 0.0005), Pools 26 (19%; F= 60.55; P = 0.002) and 13 (19%: F = 16.1; P = 0.0005), Illinois River reach (12%; F = 47.2; P = 0.002), and the Unimpounded reach (3%; F = 4.07; P = 0.002). For YOY assemblages, physical habitats explained the most variation in Pool 8 (20%; F = 12.3; P = 0.002), Pool 26 (17%; F = 17.8; P = 0.002), Pool 13 (15%; F = 4.3; P = 0.0005), Pool 4 (10%; F = 2.3; P = 0.017), Illinois River reach (3%; F = 3.4; P = 0.0005), and the Unimpounded Reach (3%; F = 2.4; P = 0.002). The magnitude of association between abundance and particular physical habitat was also low for many species, which may indicate: (1) an unstable fauna represented by a few dominant generalists, suggesting that the UMRS is degraded and could be moving toward a system dominated by tolerant species (Kingsolving and Bain 1993), (2) physical habitat classes defined by the LTRMP are
12

8 I- S
it o
"5,
iil_ 3S!XVV00d
_£B:.9
' ESjxvvOOd
o St ^5.
CO
i2--
■n
8
00
2 S!xv VOOd
,$!.
"5.
.5> "5,
9.
I. sp(vV00d ZSjxvVOQd
j: ■x CNJ
m < o X
CO <r ■>- f- n ^ -o c Qu o (0 fN II
-o o s 0)
3 o CO
03 II >
C3) s: ^
.2 OJ "CM
^§ I- o go 2 "
C3.
E > 0}
5-<
o O-
<=> in o
4-t CO
Is Co
.!2 -a-
41 § II O CD
II JO ™ a>
£ ■" = ro CM to )_ « g to s. 0]
CD C/)
■s ^ to 3
o c5
(A
'x S II < n) -1 CD II
.52 15 >-= p-s
CD ,_ CM C3]
-a < " « c o ■^
<tj ■— > >- C OJ cu > «
CL CO CD
1.
o
X O o CO .StE < ^ <u „
^ CO o t^ o (_5 cn c
•^ o c: Crt
en < T- £
1^ oo u CM .- — O O
g CO 0)
O O
CO DL.
II II
CU 0) 3 3 3
CO cn CO CO
£ > > > <? c:
3 CD 03 03 U. 13 C3> O)
LL. UU 03 03
13

CO
i 1^
in
I "1^ M
m_ Zsixvvoocl
O Q.
8
to
8^ 8
05
m_
O)
ffi oocn O) OT05 T- o5 v: >>T- >>
gspcvvOOd
6 o Q.
■*
^ Q. ,s
h~ 05 >% CD
>. oO 4 OJ
K' •4 Q) o> en s. S>
^ CD-<
O" C'5 00 o f^
8) <5!, s. Q o)
>» ■^i
nn , -, ^sit
6 o a.
in
g
00
CO.
01
aiL.
o 8 <5!,
rr,Cn8
gSKVVOOd .aw
o Q.
ro o CM TD' '^ CO .2 sr '>S c c*^ <r
x: o CO 0) r^ a: 8? "S •<>. ? 3 ^ 8 '§
Uni
mpc
y199
g '^ 91 >>..
a> ^ 05
* >. >,
O) o>^ tn >. 8?
fin , , "■"-
6 o Q.
CD CM 8
^
cn<
^
C3).,
00 ^^
'5. ^S. ■4 ._
'O.M 8'^^ ^ >."'o
"^
sn . , an-
§
c m 0) ^ n c
CI] Ol
B a) 03 o CM « rn -^ •3 W
> be
g' 1
'w CO "S? § gl
S." I ca. "^ c => .i2 c «^ = i S2 ~ {/> o o ro ^ li
:> g m — II OJ
>- OJ CM OJ > M ^
i>CM g " = " s ^ = ■;; ° —
= "11 CO ^- ro ^DJ <u
S II 5 t^
° 15 r- < S-52 25
— <u O en • ^ ",:3o
(U CO CM
^:g °^
II — CD O 3
03 "Tz OO cn
^ °§ " -s'?: 11 ^ CO
03 'O
ZSjxvvOOd
14
o. 5 -2 < So 11 1- CO a> > ° CD .ra'cc _ 0) cu „
.JJ > CO c c > ■>< = O CO P = C CD ^ .. CO ^ ^■- ;r- " (D CX3 m — > CM O .2 c o i=> i s II " Q- tlj g g ^ CO -(o "TO
» m > > h« 4-' ^ ^ 3 -g 03 03 en [Q CD o) E ^ '03 *a)

CM
W
X
<
<
O O Q.
M C B W (A) Pool 4
M C B U
Jl '•• f " p YD S JM ilSH ^iWTBI '^CZSD
mlB 10 L
jp G \f fy
mjG D SN
»JS K SS
k.B W C
S C B
-1 .0 p C C A Axis 1 2 .0
o ■ MCBw (B) Poo! 8 A
MCBU
CM CO
<
< O O Q.
jRHDR
SCB ▲
jLGPII
ISFSH
ll"^^ • jlTOS mPK
/jrs.v* . . i"^'' JLXCR j„(»„„ j«?m iCDSH
BWC
tr> A
IMP 1 1 1 1 1
-2.0 pCCA Axis 1 1.5
Figure 5. Partial canonical correspondence analysis (pCCA) of strata and young-of-the-year individuals for the Upper Mississippi River System, given period, gear, and year. {A) Species scores for abundant species from Pool 4 (Axis 1 eigenvalue = 0.080, Axis 2 eigenvalue = 0.012); (B) Pool 8 (Axis 1 eigenvalue = 0.092, Axis 2 eigenvalue = 0.054);
15

in
CM
Oi
X
<
<\
O O Q.
M C B U
S C B
IM P
JPN SD
JR \'SN
JTl'M T
y5 ,V C « • jCARP
JRf'^S * JBKSS
(C) Pool 13
tsTs^i'"':^*"''-';'''-
linn u^ iWT It <i ^JG Z SD
jG D sa
mfL M B S
jLC PH^JWTBS
JM MS N ' tjE R S N JC X SN
JB H M W JU DDK
m)w TCP »JBKCP
JR RD R i-'"^ " JB LG L »jsrci
-1 .5
M C B W
pC C A A xis 1
JOS SF
B W C
1 .5
o
CM
CO
X
<
<■
O O Q.
o MCBW
-1.5
IM P
MCBU jCNSN jERSN
Jir TBS JRVCS JSFSfl
SCI
jSJHR
icucf-
jRVSN 'jg 1^^ f •jM^TF
JTFSD
JBLOL ' mJCDEY
*M'i^''mjCARP SMBF JBKCP
JoTsF '■^JFH'DM I JSBS.V
(D) Pool 26
BWC
pCCA Axis 1 2.5
Figure 5. Continued. (C) Pool 13 (Axis 1 eigenvalue = 0.083, Axis 2 eigenvalue = 0.051); (D) Pool 26 (Axis 1 eigenvalue = 0.102, Axis 2 eigenvalue = 0.035);
16

o' cvi (E) Unimpounded Reach
■
MCBU ▲
CM CO
^
6 jSJirm
JCDEYJWBS
jSVCB* *JSBSNjRKS
»jRVSN
▲ MCRW
o 1
▲ SCB , ,
-1.0 pCCAAxis 1 2.0
o" (F) Illinois River
• SCB
Csl CO
pCCA
• JSJHR jTFSD
o MCBU -1 1 1 1
BWC
—, 1
-1.5 pCCA Axis 1 2.0
Figure 5. Continued. (£) Unimpounded Reach (Axis 1 eigenvalue = 0.008, Axis 2 eigenvalue = 0.010); (F) Illinois River (Axis 1 eigenvalue = 0.029, Axis 2 eigenvalue = 0.004). See Table 1 for species codes. Backwater contiguous (BWC), impounded (IMP), main channel border unstructured (MCBU), main channel border wing dam (MCBW), and side channel border (SCB).
17
lO' (A) Pool 4
MCBW ▲
CM
3 <
Q.
Bwc^ I
aPOMir aBWFN aSrSN aBLGL oLMBS aWTCP an/DR
m oRVRH
oBKCP aNTPK aQLBK
aPNSD aYWm'
J qWLYE »aSHRH
aGDRH aBMBF aCNCF aLGPH
aRKBSMt^CF aSESN maRVSN SCB AMCBU
1 1
pCCAAxis 1
CO (B) Pool 8
McraA/
Csl .CO
1 BWC
am
aSPSK aNTPK aOSSF
aPGMIV oPAOg aWiyE
aYWPH ,„, •
\ aLMBS \ / aOt'SF aSHRH
^KCP/ oLNGR • ' aSVRH
aFVIOM oFHCF aCNCF oLGPH aERSN aSMBF
SCB aRVSN
A k
S MCE
—, , 1 1 f
lU
1 1
-1.5 pCCAAxis 1 2.5
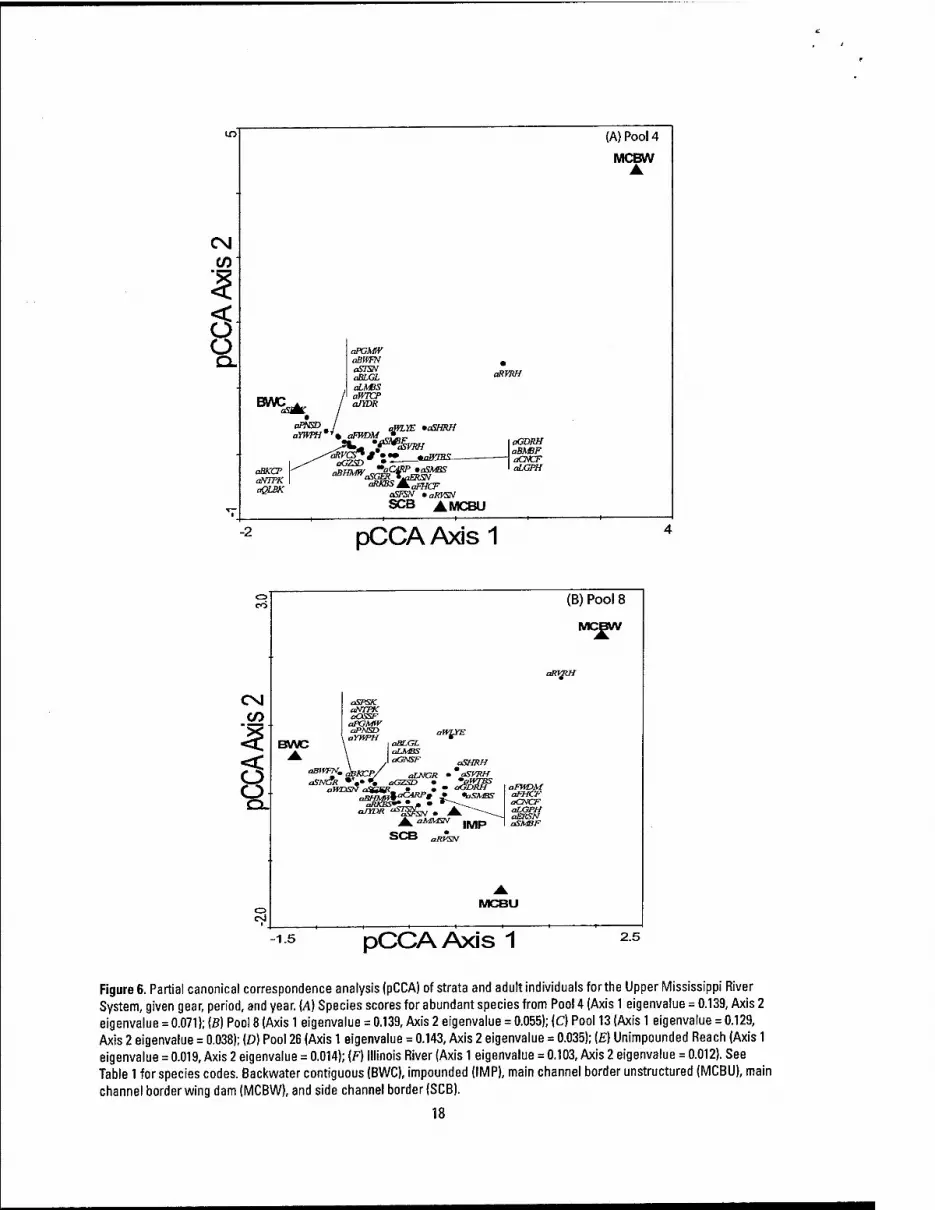
Figure 6. Partial canonical correspondence analysis (pCCA) of strata and adult individuals for the Upper Mississippi River System, given gear, period, and year. {A) Species scores for abundant species from Pool 4 (Axis 1 eigenvalue = 0.139, Axis 2 eigenvalue = 0.071); (B) Pool 8 (Axis 1 eigenvalue = 0.139, Axis 2 eigenvalue = 0.055); (C) Pool 13 (Axis 1 eigenvalue = 0.129, Axis 2 eigenvalue = 0.038); (D) Pool 26 (Axis 1 eigenvalue = 0.143, Axis 2 eigenvalue = 0.035); [E) Unimpounded Reach (Axis 1 eigenvalue = 0.019, Axis 2 eigenvalue = 0.014); (F) Illinois River (Axis 1 eigenvalue = 0.103, Axis 2 eigenvalue = 0.012). See Table 1 for species codes. Backwater contiguous (BWC), impounded (IMP), main channel border unstructured (MCBU), main
channel border wing dam (MCBW), and side channel border (SCB).
18

CO (C) Pool 13
T
CM CO
"!r5
Q.
oLom
^GL *,'^NrF\a}VrBS _ „,^„ aSPSK.'-BKg'^jj,^. .-^ :SW5A/ A
a»7CP oQSSF \aSGER,gSFSN ^ JLJ^ OBMAT^^IL:'^^ MCBU
2^
gpg aSHPH
A MCBW
o ^ 1 1 1 1 1 1
-1.5 pCCAAxis 1 2.0
o (N
▲
(D) Pool 26
BWC
CM CO X <.
< ^:is\' ▲
SCB
O "•^^,0,
O BCAKF
Q. amTF BSMBF •JtlGL
cC£SO oSJIiR nims
▲ IMP
A MCBU
A MCBW
in
V 1 1 1 1
-1.5 pCCA Axis 1
1.5
Figure 6. Continued.
19
o
CO
(E) Unimpounded Reach
MCBU
alXCP
V\ • •'qSHMV , aRVCS\a^GR ^GNSF
aBMBF aFHCF aCNCF aOiSN aCARP
_gm_ -1.0 pCCAAxis 1
MCBW
2.0
in
(M CO
-2.0
MCBU
SCB (F) Illinois River
aRDSN aCSCP
•rjnp oBf/BF aEBSN aWTBSji;^^, .oBKBF
aUvBS aim^
aSJHR
pCCAAxis 1
aOSSF oGNSF
BNC
1.5
Figure 6. Continued.
20

poor predictors of assemblage patterns, or (3) environmental conditions within these physical habitats are similar enough over the course of a sampling season that our approach did not discriminate their effects well. Baker et al. (1991) and Barko et al. (2004Z>) also reported low associations between fish species and Mississippi River physical habitats; patterns often indicative of a tolerant fauna. We are unsure if the low associations in the Unimpounded and Illinois River study areas are because of reduced habitat heterogeneity or merely reflect the disproportionate number of habitats sampled within the reaches (Unimpounded and Illinois River = 3; Pools 4, 8, 13, and 26 = 5).
Ordination—Sampling Period
In all reaches, the amount of variation explained by sampling period was relatively low. Sampling period explained the most variation in the Unimpounded study area (9%; F = 18.9; P = 0.002), Pool 8 (9%; F = 24.7; P = 0.002), and Pool 13 (9%; F = 11.7; P = 0.0005), followed by Pool 4 (7%; F=n.9;P = 0.002), Pool 26 (6%; F = 16.4; P = 0.002) and the Illinois River study area (6%; F = 20.6; P = 0.002). Although the amount of variation in fish abundance explained was low, Axis 1 separated sampling period 1 from sampling period 3 in all study areas, indicating that the assemblages present during these two periods were different (Figure 7). In Pools 4, 8, and 13 and along the same axis, the assemblage sampled in period 2 was more similar to the assemblage sampled in period 3 (because of their close proximity in ordination space) and sampling period 1 was the most unique based on assemblage structure (Figure 7). Conversely, in Pool 26, the Unimpounded and Illinois River study areas, the assemblage sampled in period 2 was more similar to the assemblage sampled in period 1; hence, the assemblage sampled in period 3 was the most unique. In all study areas. Axis 2 separated sampling period 2 from the other sampling periods. Therefore, although sampling period 2 grouped with one of the other sampling periods along Axis 1, the assemblage sampled during period 2 provides additional structure information that is different from that provided by sampling periods 1 and 3.
Conclusions and Recommendations
Our analyses identified several factors associated with differences in fish assemblage patterns within each of six LTRMP study areas. Based on our findings, we make the following programmatic recommendations:
1. The time series of UTRMP data is still relatively short and assessment of long- term trends in assemblage structure will require a longer time series. Our resuhs suggest that some of the largest shifts in assemblage structure, particularly for YOY assemblages, were associated with flood years. However, the effects of floods on assemblage structure varied among the six study areas. The source of this variation is potentially related to how different sections of the river convey floodwaters and how accessible off-channel areas are to fishes during floods. Maintenance of standardized long-term monitoring data is necessary for arriving at a deeper understanding of how fish assemblages respond to the present day configuration of the UMRS, and how floods, acting across this physical template, affect the maintenance of diverse and per- sistent fish faunas. Such understanding will have direct applied and adaptive manage- ment benefits for managing the UMRS as a nationally significant system.
2. Whereas interannual factors, probably asso- ciated with flood responses, were important in explaining abundance patterns in the UMRS fish assemblages, spatial factors were generally found to be better predictors of differences in fish assemblages. This finding suggests that there is a strong spatial component in the way that UMRS fish assemblages are presently structured, and how these assemblages change over time. Additional research is needed to clarify how spatial factors influence assemblage structure.
3. Aduh and YOY assemblage patterns differed in their response to environmental factors, interannual variability, and physical habitats. This suggests that future research
21

CO
-K
I
J_ (D > E CO o c
^£
■< s
^51
i^n , , zn-
§
gsjXVVOOd gsjxvvOOd
O- CO -D "~
ro o CM i_- D- w •^ ,:.; '5 >- CM **
iT °- 1^' <u .. o
Q)
S = " > to 2
•5> > = - £; ">
S •- 5 m ai Oi
> - -s
C3.=? x: O. O u
'in II ro .2 m » (O 3 DC
i: S =
00
•■ K
' SI
ZB_ 1
2^
6
2S!xvV00d
SI
zm_^
-DL
2'
__iah(
6
SSjxvvOOd
I" C CD
:D a:
hi
" a.
'2
rn . I , ;?-n-| 9
gsjxvVDOd
CO CM
■^ E- Q-
^ I ̂
^2 7-n , , ?rn-
ZspvVOOd
"' 2 'E
£ CO t:
£2—0) -C3 CD 3
to
CM = 46
Q. C
Q. <— C7> W 0)
■a CM .2 « ^^
.22 CM
> C3 m I,
O 03
II g 0)
°> CO .E l" _ r^r, :;= ^ ro C35
a>
II 0) CM oj .5" 2 3 oj ■>< ro ^ <
< ^■'^xi o o s,^^: (O o c3 :^s "
tn "3 5 ro
4 (A
x 7)
;Po
enva
l
c: ro S°-s o
OJ o- <= ^ T3
to
1 O o. vt 09 fo
llow
nv
alue
er
IAxi
M OJ .> A o
"ro o
ro .pJ EC
^
es w
ere
Axi
s 2
e ; I
llino
is
c o ro = en CD
C3 O II II 0) 01
k 4-' C CI
u. x: 01 09
22

on UMRS fish assemblage dynamics should differentiate among life stages.
4. Program partners should use the results of this research and other recently completed research to develop and prioritize additional research topics. Many of the analyses completed over the last year, whereas quantitatively intense, are largely qualitative assessments.
5. Continued quantitative monitoring of the UMR fish assemblage will allow us to identify trends not visible with the 10 years of data presently available. Specifically, (1) will assemblages redistribute themselves within the river and reaches based on future habitat alterations and disturbances (e.g., increased navigation, climate change, altered hydrology, invasive species, habitat restoration, etc.); (2) will assemblages in impounded sections become skewed towards a lacusterine assemblage rather than a riverine assemblage; (3) how will species and assemblages respond to invasive introductions; (4) what environ- mental variables should the LTRMP be measuring in addition to the present suite to better explain fish assemblage patterns; and (5) does the UMR fish assemblage demonstrate persistence or stability over longer time frames and do different areas of the UMRS demonstrate different stability thresholds?
Acknowledgments
This study was supported by the U.S. Army Corps of Engineers, U. S. Geological Survey, Upper Midwest Environmental Center, Long Term Resource Monitoring Program, Minnesota Department of Natural Resources, Wisconsin Department of Natural Resources, Iowa Department of Natural Resources, Illinois Namral History Survey, and the Missouri Department of Conservation. We thank M. Stopyro, S. DeLain, D. Magnusen, M. Blohowiak, T. Thome, G. La Plante, L. Johnson, M. Russell, N. Frohnauer, J. Tepley,
J. Strieker, and B. Schmidt for assistance with data collection in Pool 4. We thank A. Bartels, K. Mauel, E. Kramer, K. Hoff, J. Fischer, H. Langrehr, T. Dukerschein, L. Hodge-Richardson, M. Hargrove, B. Torrison, T. Clement, N. Frost, A. Schmidt, J. Zeigwied, J. Gutierrez, R. Greener, K. Callen, S. Hults, S. Skemp, P. Boma, B. Meier, and S. Weick for assistance with data collection in Pool 8. We thank S. Gritters, M. Steuck, M. Bowlers, E. Jones, J. Pence, K. Hanson, J. Martins, M. Boucher, D. Kirby, T. Boffeli, M. Daniels, M. Watters, M. Hubler, J. Hass, and J. Petersen for assistance with data collection in Pool 13. We thank E. Ratcliff, E. Gittinger, F. Cronin, D. Soergel, B. Kerans, J. Stone, R. Maher, J. Lamer, B. Lubinski, C. Theiling, and J. Utley for assistance with data collection in Pool 26. We thank M. Petersen, D. Ostendorf, J. Ridings, J. Crites, G. Lowes, J. Scott, D. Smith, K. Tilley, C. Beachum, B. Spane and J. Lopez for assistance with data collection in the Unimpounded UMR. We thank T. O'Hara, K. Irons, R Raibley, T. Cook, M. McClelland, E. Harms, P. Crabtree, E. Hopps, M. Perfetti, M. Ward, M. Hoeker, E. Gittingher, K. Stephenson, J. Arnold, D. Hanson, C. Carlock, B. Black, R. Atchison, J. Woodley, M. Gorelitz, K. Emme, M. Cripps, M. McDermot, C. Wagner, B. Cross, S. Pierce, A. Heberlean, K. Cowen, M. Strode, J. Moore, D. Osland, M. Schroeder, J. Haas, D. Blodgett, C. Smith, S. Wickman, N. Willis, J. Stevens, J. Pierce, T. Koel, E. Duttlinger, M. Blikshteyn, L. Corradin, C. Heffren, L. Gittingher, N. LeRoy, J. Esarey, K. Elkin, D. Gallagher, S. Whitney, K. Elderkin, M. Oest, A. Heintz, A.Williams, C. Ware, J. Dexter, A. Nealand, M. Irons, B. Ray, J. Merrick, D. Schoonover, J. Ellis, D. Schimmelphening for assistance with data collection in the Illinois River. We thank J. Sauer for providing Figure 1. We thank W. Popp, S. DeLain, T. Dukerschein, A. Bartels, M. Steuck, and M. Bowler for providing insight and discussion on their respective sampling reach. We thank C. Theiling, K. Cook, B. Johnson, J. Stewart, D. Ostendorf and anonymous Iowa Department of Natural Resource biologists for providing a review of this report.
23

References
Baker, J. A., K. J. Killgore, and R. L. Kasul. 1991. Aquatic habitat and fish communities in the Lower Mississippi River. Reviews in Aquatic Science 3:313-356.
Barko, V. A., and D. R Herzog. 2003. Relationships among side channels, fish assemblages, and environmental gradients in the unimpounded Upper Mississippi River. Journal of Freshwater Ecology 18(3):377-381.
Barko, V. A., D. R Herzog, R. A. Hrabik, and J. S. Scheibe. 2004fl. Relationships between fish assemblages and main channel border meso- habitats in the unimpounded Upper Mississippi River. Transactions of the American Fisheries Society 133:371-384.
Barko, V. A., M. W. Palmer, D. R Herzog, and B. Ickes. 2004^. Influential environmental gradients and spatiotemporal patterns of fish assemblages in the unimpounded Upper Mississippi River. American Midland Naturalist 152(2):369-385.
Becker, G. C. 1983. Fishes of Wisconsin. The University of Wisconsin Press, Madison.
Bertrand, B. A. 1997. Changes in the Mississippi River fishery along Illinois, 1976-1996. Journal of Freshwater Ecology 12(4):585-598.
Braaten, R J., and C. S. Guy. 2002. Life history attributes of fishes along the latitudinal gradient of the Missouri River. Transactions of the American Fisheries Society 131:931-945.
Burkhardt, R. W, S. DeLain, A. Bartels, M. C. Bowler, E. J. Gittinger, E. Ratcliff, D. P Herzog, K. S. Irons, and T. M. O'Hara. 2004a. 2001 annual status report: A summary offish data in six reaches of the Upper Mississippi River System. U.S. Geological Survey, Upper Midwest Environmental Sciences Center, La Crosse, Wisconsin. Web-based report LTRMP 2004-W002 available online at http:// www.umesc.usgs.gov/reports_publications/ ltrmp/fish/2001/fish-srs.html. (Accessed December 2004.)
Burkhardt, R. W, S. DeLain, A. Bartels, M. C. Bowler, E. Ratcliff, D. R Herzog, K. S. Irons, and T. M. O'Hara. 2004fc. 2000 annual status report: A summary of fish data in six reaches of the Upper Mississippi River System. U.S. Geological Survey, Upper Midwest Environmental Sciences Center, La Crosse, Wisconsin. Web-based report LTRMP 2004- W003 available online at http://www.umesc. usgs.gov/reports_publications/ltrmp/fish/2000/ fish-srs.html. (Accessed October 2004.)
Burkhardt, R. W, S. DeLain, E. Kramer, A. Bartels, M. C. Bowler, E. Ratcliff, D. R Herzog, K. S. Irons, and T M. O'Hara. 2001. 1999 annual status report: A summary offish data in six reaches of the Upper Mississippi River System. U.S. Geological Survey, Upper Midwest Environmental Sciences Center, La Crosse, Wisconsin. LTRMP 2001-P002. 14 pp. + Chapters 1-6.
Burkhardt, R. W. S. DeLain, E. Kramer, A. Bartels, M. C. Bowler, F. A. Cronin, M. D. Petersen, D. P. Herzog, T. M. O'Hara, K. S. Irons. 2000. 1998 annual status report: a summary of fish data in six reaches of the Upper Mississippi River System. U.S. Geological Survey, Upper Midwest Environmental Sciences Center, La Crosse, Wisconsin. LTRMP 2000-P004. 14 pp. + Chapters 1-6.
Burkhardt, R. W, M. Stopyro, E. Kramer, A. Bartels, M. C. Bowler, F. A. Cronin, D. W. Soergel, M. D. Petersen, D. P. Herzog, T. M. O'Hara, and K. S. Irons. 1998. 1997 annual status report: A summary of fish data in six reaches of the Upper Mississippi River System. U. S. Geological Survey, Environmental Management Technical Center, Onalaska, Wisconsin, June 1998. LTRMP 98-P008. 15 pp. + Chapters 1-6.
Burkhardt, R. W, S. Gutreuter, M. Stopyro, A. Bartels, E. Kramer, M. C. Bowler, F. A. Cronin, D. W. Soergel, M. D. Petersen, D. P Herzog, K. S. Irons, T. M. O'Hara, K. D. Blodgett, and R T. Raibley. 1997. 1996 Annual status report: a summary of fish data
24

in six reaches of the Upper Mississippi River System. U.S. Geological Survey, Upper Midwest Environmental Sciences Center, La Crosse, Wisconsin. LTRMP 97-POl 1. 15 pp. + Chapters 1-6.
Carlander, K. D. 1969. Handbook of freshwater fishery biology. Volume I. The Iowa State University Press, Ames. 752 pp.
Carlander, K. D. 1977. Handbook of freshwater fishery biology. Volume II. The Iowa State University Press, Ames. 431 pp.
Chick, J. H., and M. A. Pegg. 2002. Invasive carp in the Mississippi River Basin. Science 292:2250-2251.
Dettmers, J. M., S. Gutreuter, D. H. Wahl, and D. A. Soluk. 2001. Patterns in abundance of fishes in the main channels of the Upper Mississippi River System. Canadian Journal of Fisheries and Aquatic Sciences 58:933-942.
Dynesius, M., and C. Nilsson. 1994. Fragmentation and flow regulation of river systems in the northern third of the world. Science 266:753-762.
Etnier, D. A., and W. L. Stames. 1993. The fishes of Tennessee. The University of Tennessee Press, Knoxville.
Galat, D. L., C. R. Berry, W. M. Gardner, J. C. Hendrickson, G. E. MestI, G. J. Power, C. Stone, and M. R. Winston. Spatiotemporal patterns and changes in Missouri River fishes. In J. N. Rinne, R. M. Hughs, and R. Calamusso, editors. Historical changes in fish assemblages of large American rivers. American Fisheries Society Symposium. (In press)
Gehrke, R C, P Brown, C. B. Schiller, D. B. Moffatt, and A. M. Bruce. 1995. River regulation and fish communities in the Murray- Darling River System, Australia. Regulated Rivers: Research & Management 11:363-375.
Gido, K. B., W J. Matthews, and W C. Wolfinbarger. 2000. Long-term changes in a reservoir fish assemblage: stability in
an unpredictable environment. Ecological Applications 10:1517-1529.
Gutreuter, S., R. Burkhardt, and K. Lubinski. 1995. Long Term Resource Monitoring Program procedures: Fish monitoring. National Biological Service, Environmental Management Technical Center, Onalaska, Wisconsin, July 1995. LTRMP 95-P002-1. 42 pp. + Appendixes A-J
Gutreuter, S., A. D. Bartles, K. Irons, and M. B. Sandheinrich. 1999. Evaluation of the flood-pulse concept based on statistical models of growth of selected fishes of the upper Mississippi River. Canadian Journal of Fisheries and Aquatic Sciences 56:2282-2291.
Gutreuter, S. R. W. Burkhardt, M. Stopyro, A. Bartels, E. Kramer, M. C. Bowler, F. A. Cronin, D. W. Soergel, M. D. Petersen, D. R Herzog, K. S. Irons, T. M. O'Hara, K. D. Blodgett, andP T.Raibley. 1997a. 1995 annual status report: a summary of fish data in six reaches of the Upper Mississippi River System. U.S. Geological Survey, Upper Midwest Environmental Sciences Center, La Crosse, Wisconsin. LTRMP 97-P009. 15 pp. -i- Chapters 1-6.
Gutreuter, S. R. W. Burkhardt, M. Stopyro, A. Bartels, E. Kramer, M. C. Bowler, F. A. Cronin, D. W. Soergel, M. D. Petersen, D. R Herzog, K. S. Irons, T. M. O'Hara, K. D. Blodgett, andP TRaibley. 1991b. 1994 Annual status report: a summary of fish data in six reaches of the Upper Mississippi River System. U.S. Geological Survey, Upper Midwest Environmental Sciences Center, La Crosse, Wisconsin. LTRMP 97-P007. 15 pp. + Chapters 1-6.
Gutreuter, S. R. W. Burkhardt, M. Stopyro, A. Bartels, E. Kramer, M. C. Bowler, F. A. Cronin, D. W. Soergel, M. D. Petersen, D. R Herzog, K. S. Irons, T. M. O'Hara, K. D. Blodgett, and P TRaibley. 1997c. 1993 Annual status report: a summary of fish data in six reaches of the Upper Mississippi River System. U.S. Geological Survey, Upper Midwest Environmental Sciences Center,
25

La Crosse, Wisconsin. LTRMP 97-P008. 15 pp. + Chapters 1-6.
Heiler, G., T. Hein, F. Schiemer, and G. Bomette. 1995. Hydrological connectivity and flood pulses as the central aspects for the integrity of a river-floodplain system. Regulated Rivers: Research & Management ll(3,4):351-362.
Hesse, L. W., C. B. Stalnaker, N. G. Benson, and Z. R. Zuboy. 1993. Restoration planning for the rivers of the Mississippi River ecosystem. National Biological Survey, Washington, D.C. Biological Report 19. 502 pp.
Jackson, G. A., C. E. Korschgen, R A. Thiel, J. M. Besser, D. W. Steffeck, and M. H. Bockenhauer. 1981. A long term resource monitoring plan for the UMRS. Contract 14-16-009-81-903. Upper Mississippi River Basin Commission, Bloomington, Minnesota. 2 volumes.
Junk, W. J., R Bayley, and R. E. Sparks. 1989. The flood pulse concept in river floodplain systems. Pages 110-127 in D. P. Dodge, editor. Proceedings of the International Large River Symposium. Canadian Special Publication of Aquatic Sciences 106.
Kingsolving, A. D., and M. B. Bain. 1993. Fish assemblage recovery along a riverine disturbance gradient. Ecological Applications 3:531-544.
Legendre, P., and L. Legendre. 1998. Numerical ecology. 2nd edition. Elsevier Inc., Amsterdam, The Netherlands.
Leps, J., and P. Smilauer. 2003. Multivariate analyses of ecological data using CANOCO. Cambridge University Press, Cambridge.
Lubinski, K. 1999. Floodplain river ecology and the concept of river ecological health. Chapter 2. Pages 1-12 in K. Lubinski and C. Theiling, editors. Ecological status and trends of the Upper Mississippi River System 1998: a report of the Long Term Resource Monitoring Program. U.S. Geological Survey, Upper Midwest Environmental Sciences Center,
La Crosse, Wisconsin. April 1999. LTRMP 99- TOOl. 236 pp.
Morrow, J. V., and J. R Kirk. 1995. Age and growth of grass carp in Lake Guntersville, AL. Pages 187-194 in Proceedings of the 49th Annual Conference of the Southeastern Association of Fish and Wildlife Agencies, Nashville, Tennessee.
Parrett, C, N. B. Melcher, and R. W James. 1993. Flood discharges in the upper Mississippi River basin, 1993. In Floods in the upper Mississippi River Basin, 1993. U.S. Geological Survey Circular 1120-A.
Patrick, R. 1998. Rivers of the United States. The Mississippi River and tributaries. Volume 4, Parts A and B. John Wiley & Sons, New York.
Pegg, M. A., and C. L. Pierce. 2001. Growth rate responses of Missouri and Lower Yellowstone River fishes to a latitudinal gradient. Journal of Fish Biology 59:1529-1543.
Pegg, M. A., and C. L. Pierce. 2002. Classification of reaches in the Missouri and lower Yellowstone Rivers based on flow characteristics. River Research and Applications 18:31-42.
Petts, G. E., H. Moller, and A. L. Roux. 1989. Historical change of large alluvial rivers in western Europe. Wiley, Chichester. 355 pp.
Pflieger, W. L. 1997. The fishes of Missouri. Missouri Department of Conservation, Jefferson City, Missouri.
Poff, N. L., J. D. Allan, M. B. Bain, J. R. Karr, K. L. Prestegaard, B. D. Richter, R. E. Sparks, and J. C. Stromberg. 1997. The natural flow regime. Bioscience 47:769-784.
Ricciardi, A., and J. B. Rasmussen. 1999. Extinction rates of North American freshwater fauna. Conservation Biology 13:1220-1222.
Sparks, R. E., R B. Bayley, S. L. Kohler, and L. L. Osbome. 1990. Disturbance and recovery of large floodplain rivers. Environmental Management 14:699-709.
26

wV
ter Braak, C. J. F., and P. Smilauer. 2002. CANOCO reference manual and CanoDraw for Window's User's guide: software for canonical community ordination (v. 4.5). Microcomputer Power, Ithaca, New York.
Theiling, C. H. 1996. An ecological overview of the Upper Mississippi River System: implications for postflood recovery and ecosystem management. Pages 3-28 in D. L. Galat, and A. G. Frazier, editors. Overview of river-floodplain ecology in the Upper Mississippi River Basin. Volume 3 of J. A. Kelmelis, editor. Science for floodplain management into the 21st century. U.S. Government Printing Office, Washington, D.C.
Tockner, K., and J. A. Standford. 2002. Riverine floodplains: present state and future trends. Environmental Conservation 29:308-330.
U.S. Fish and Wildlife Service. 1993. Operating plan for the Upper Mississippi River System Long Term Resource Monitoring Program. Environmental Management Technical Center, Onalaska, Wisconsin, revised September 1993. EMTC 91-P002R. 179 pp. (NTIS #PB94- 160199)
U.S. Geological Survey. 1999. Ecological status and trends of the Upper Mississippi River System 1998. A report of the Long Term Resource Monitoring Program. U.S. Geological Survey, Upper Midwest Environmental Sciences Center, La Crosse, Wisconsin. LTRMP 99-TOOl. 236 pp.
Ward, J. V. 1998. Riverine landscapes: biodiversity patterns, dismrbance regimes, and aquatic conservation. Biological Conservation 83:269-278.
Welcomme, R. L. 1979. Fisheries ecology of floodplain rivers. Longman Publishers, London. 317 pp.
Welcomme, R. L. 1995. Relationships between fisheries and the integrity of river systems. Regulated Rivers: Research & Management 11:121-136.
Williams, L. R., C. S. Toepfer, and D. Martinez. 1996. The relationship between fish assemblages and environmental gradients in an Oklahoma prairie stream. Journal of. Freshwater Ecology 11:459^68.
27

REPORT DOCUMENTATION PAGE Form approved
0MB No. 0704-0188
Public reporting burden for this collection is estimated to average 1 hour per response, including time for reviewing instructions, searching existing data sources, qathering and maintaining the data needed, and completing and reviewing the coiiection of information. Send comments regarding this burden estimate or any other aspect of this coiiection of infomiation, including suggestions for reducing this burden, to Washington Headquarters Sen/ices, Directorate for Information Operations and Reports, 1215 Jefferson Davis Highway, Suite 1204, Ariington, VA 22202-4302, and to the Office of Management and Budget, Papera/ork Reduction Project (0704-0188) Washington, DC 20503.
1. AGENCY USE ONLY (Leave Blanl<)
2. REPORT DATE
February 2005
3. REPORT TYPE AND DATES COVERED
4. TITLE AND SUBTITLE
Spatial, Temporal, and Environmental Trends of Fish Assemblages within Six Reaches of the Upper
Mississippi River System
6. AUTHOR(S) Valerie A. Barko', Brian S. Ickes^ David R Herzog', Robert A. Hrabik', John H. Chick', and Mark A. Pegg^
7. PERFORMING ORGANIZATION NAME(S) AND ADDRESSES Missouri Department of Conservation, Open Rivers and Wetlands Field Station, 3815 E. Jackson Blvd., Jackson, Vlissouri 63755; ^U.S. Geological Survey, Upper Midwest Environmental Sciences Center, 2630 Fanta Reed Road, ja. Crosse, Wisconsin 54603; 'Illinois Natural History Survey, Great Rivers Field Station, 8450 Montclair, Brighton, llinois 62012; "Illinois Natural History Survey, Illinois River Biological Station,704 N. Schrader Avenue, Havana, [llinois 62644 — 9. SPONSORING/MONITORING AGENCY NAME(S) AND ADDRESSES
U.S. Geological Survey Upper Midwest Environmental Sciences Center 2630 Fanta Reed Road La Crosse, Wisconsin 54603
5. FUNDING NUMBERS
8. PERFORMING ORGANIZATION REPORT NUMBER
10. SPONSORING, MONITORING AGENCY REPORT NUMBER
2005-T002
11. SUPPLEMENTARY NOTES
12a. DISTRIBUTION/AVAILABILITY STATEMENT
Release unlimited. Available from National Technical Information Service, 5285 Port Royal Road, Springfield, VA 22161 (1-800-553-6847 or 703-487-4650. Available to registered users from the Defense Technical Information Center, Atm: Help Desk, 8725 Kingman Road, Suite 0944, Fort Belvoir, VA 22060-6218 (1-800-225-3842 or
703-767-9050).
12b. DISTRIBUTION CODE
13. ABSTRACT (Maximum 200 words)
We investigated differences in adult and young-of-the-year (YOY) fishes within each of the six Long Term Resource Monitoring Program study areas, using monitoring data from 1993 to 2001. Our objective was to investigate the relative roles of seasonal, annual, in situ, and physical habitat factors in explaining assemblage structure patterns within the Long Term Resource Monitoring Program study areas. Adult and YOY assemblage structure within each reach was dominated by one to three numerically abundant species. The percent of the total abundance for which these species accounted was 10-88% and varied among age classes and study areas. Physical habitat classes were only weakly associated with differences in fish assemblage patterns within each study area. The amount of variation in fish abundance explained by physical habitats varied among the reaches. Differences among physical habitat classes accounted for 3-23% of the variation in the adult fish assemblage and for 3-20% of the difference in the YOY fish assemblage within each reach of our study area. Factors associated with interannual differences in environmental conditions were strongly correlated to pattems in assemblage structure within each of the six study areas. This was particularly true for YOY assemblages. Such a result would not have been attainable without long-term standardized data. Little is known regarding YOY assemblage patterns and dynamics in large river systems and long-term data sets are vital for continued investigation. The influence of environmental gradients on fish assemblage structure varied among the six study areas and explained 9-31% of the variation in assemblage structure. In the northern four reaches, water velocity was one of die primary factors associated with differences in fish assemblage structure. In the Unimpounded Reach (Upper Mississippi River) and Illinois River study areas, river elevation was one of the primary factors associated with differences in assemblage structure. Depth of gear deployment was influential in explaining differences in assemblage stntcture pattems in all reaches except the Upper Mississippi River Pool 4 and the Illinois River study areas. In all study areas, the amount of variation in fish abundance pattems explained by sampling period was relatively low. However, assemblage stnicture differed among sampling periods. In the northern reaches, sampling periods 2 and 3 were the most similar ■
14. SUBJECT TERMS (Keywords)
fishes; Illinois River, impounded, long-term, LTRMP, Mississippi River, ordination, unimpounded, YOY
17. SECURITY CLASSIFICATION OF REPORT
Unclassified
18. SECURITY CLASSIFICATION OF THIS PAGE
Unclassified
19. SECURITY CLASSIFICATION OF ABSTRACT
Unclassified
15. NUMBER OF PAGES
27 pp.
16. PRICE CODE
20. LIMITATION OF ABSTRACT
NSrJ 7540-01-280-5500 Standard Form 298 (rev. 2-89) Prescribed by ANSI Std. Z39-18 298-102