Embed Size (px)
Citation preview
THE 1973 MISSISSIPPI RIVER BASIN FLOOD:
COMPILATION AND ANALYSES OF METEOROLOGIC, STREAMFLOW,
AND SEDIMENT DATA Report prepared jointly by the U.S. Geological Survey
and the National Oceanic and Atmospheric Administration
U.S. DEPARTMENT OF THE INTERIOR • U.S. DEPARTMENT OF COMMERCE
GEOLOGICAL SURVEY. PROFESSIONAL PAPER 937

THE 1973 MISSISSIPPI RIVER BASIN FLOOD: COMPILATION AND ANALYSES OF METEOROLOGIC, STREAMFLOW, AND SEDIMENT DATA By EDWIN H. CHIN of the National Weather Service, National Oceanic and Atmospheric Administration, and JOHN SKELTON and HAROLD P. GUY of the U.S. Geological Survey
GEOLOGICAL SURVEY PROFESSIONAL PAPER 937
Report prepared jointly by the U.S. Geological Survey and the National Oceanic and Atmospheric Administration
U N I T E D STAT E S G 0 V E R N M E N T P R I N T I N G 0 F F IC E , W AS H I N G T 0 N : 1 9 7 5
UNITED STATES DEPARTMENT OF THE INTERIOR THOMAS S. KLEPPE, Secretary
GEOLOGICAL SURVEY V. E. McKelvey, Director
UNITED STATES DEPARTMENT OF COMMERCE ROGERS C. B. MORTON, Secretary
NATIONAL OCEANIC AND ATMOSPHERIC ADMJNISTRATIC Robert M. White, Administrator
Library of Congress Cataloging in Publication Data
Chin, Edwin H The 1973 Mississippi River Basin flood. (Geological Survey professional paper ; 937) Bibliography: p. Includes index. Supt. of Docs. no.: I 19.16 :937 1. Mississippi River-Flood, 1973. I. Skelton, John, 1934- joint author. II. Guy, Harold P., joint author. III.
United States. Geological Survey. IV. United States. National Oceanic and Atmospheric Administration. V. Title. VI. Series: United States. Geological Survey. Professional paper ; 937.
GB1217,C45 551.4'8 75-61925
For sale by the Superintendent of Documents, U.S. Government Printing Office
Washington, D.C. 20402
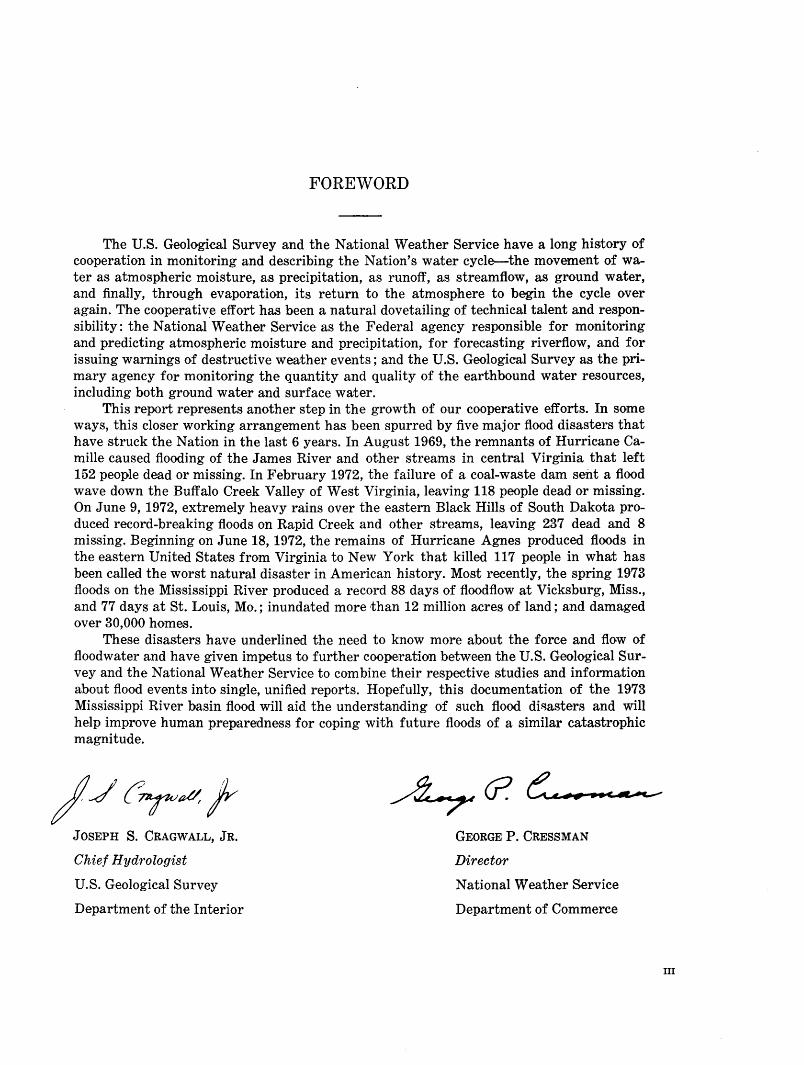
FOREWORD
The U.S. Geological Survey and the National Weather Service have a long history of cooperation in monitoring and describing the Nation's water cycle--the movement of water as atmospheric moisture, as precipitation, as runoff, as streamflow, as ground water, and finally, through evaporation, its return to the atmosphere to begin the cycle over again. The cooperative effort has been a natural dovetailing of technical talent and responsibility: the National Weather Service as the Federal agency responsible for monitoring and predicting atmospheric moisture and precipitation, for forecasting riverflow, and for issuing warnings of destructive weather events; and the U.S. Geological Survey as the primary agency for monitoring the quantity and quality of the earthbound water resources, including both ground water and surface water.
This report represents another step in the growth of our cooperative efforts. In some ways, this closer working arrangement has been spurred by five major flood disasters that have struck the Nation in the last 6 years. In August 1969, the remnants of Hurricane Camille caused flooding of the James River and other streams in central Virginia that left 152 people dead or missing. In February 1972, the failure of a coal-waste dam sent a flood wave down the Buffalo Creek Valley of West Virginia, leaving 118 people dead or missing. On June 9, 1972, extremely heavy rains over the eastern Black Hills of South Dakota produced record-breaking floods on Rapid Creek and other streams, leaving 237 dead and 8 missing. Beginning on June 18, 1972, the remains of Hurricane Agnes produced floods in the eastern United States from Virginia to New York that killed 117 people in what has been called the worst natural disaster in American history. Most recently, the spring 1973 floods on the Mis·sissippi River produced a record 88 days of floodflow at Vicksburg, Miss., and 77 days at St. Louis, Mo.; inundated more than 12 million acres of land; and damaged over 30,000 homes.
These disasters have underlined the need to know more about the force and flow of floodwater and have given impetus to further cooperation betw,een the U.S. Geological Survey and the National Weather Service to combine their respective studies and informa,tion about flood events into single, unified reports. Hopefully, this documentation of the 1973 Mississippi River basin flood will aid the understanding of such flood disasters and will help improve human preparedne·ss for coping wi,th future floods of a similar catastrophic magnitude.
JOSEPH S. CRAG WALL, JR.
Chief Hydrologist
U.S. Geological Survey
Department of the Interior
GEORGE P. CRESSMAN
Director
National Weather Service
Department of Commerce
III

Foreword ----------------------------------------Glossary ----------------------------------------Abstract ----------------------------------------Introduction ____________________________________ _
Purpose and scope ----------------------------Acknowledgments _____________________ --- ___ _
Conversion of English units to international sys-tem of units -------------------------------
Meteorological settings of the flood episode ________ _
Antecedent precipitation ----------------------Meteorological events associated with the flood __ _ Highlights for selected weeks -----------------
March 5-11 ----------------------------March 12-18 ---------------------------April 16-22 -----------------------·------
Precipitation events in the Mississippi basin during the spring of 1973 ---------------------------·-
Areal precipitation __________________________ _ Seasonal ,stratification of precipitation events ___ _ Storm combinations ---------------------------
The storm of April 19-22, 1973, over the central Mississippi Basin ------------------------·--
Storm history ______________________________ _ Parcel trajectories leading into the basin _______ _ Associated synoptic conditions -----------------Proximity soundings related to the storm ______ _ Polar jet axis and precipitation center ________ _ Precipitation centered at Moberly, Mo., and in other
locations ________________________ - _ ------- --
CONTENTS
Page
III VII
1 1 3 3
4 4 4 8
1& 15 15 19
19 25 25 25
27 27 30 37 38 40
41
Estimation of water loss in the Mississippi basin in
spring 1973 ----------------------------------Some concluding remarks (meteorology) ------------
Data at stream-gaging stations -------------------Magnitude and frequency of flood peaks and volumes __
The floods ---------------------------------------Mississippi River main stem ------------------
Flood peaks ----------------------------Flood duration and volume ---------------Suspended sediment ----------------------
Tributary streams-flooding and suspended sediment _______________________________ _
Tributary streams in Minnesota ----------Tributary streams in Wisconsin ----------Tributary streams in Iowa ----------------Tributary streams in Illinois ___________ _
Tributary streams in Missouri --------·--·-Tributary streams in Kentucky __________ _ Tributary streams in Tennessee ___ -· _____ _
Tributary streams in Arkansas ------------Tributary streams in Mississippi -----------Tributary streams in Louisiana ________ ---
Water and sediment discharge to Lake Pontchartrain and the Gulf of Mexico ------------------------
Selected references ------------------------------Index of stream-gaging station names ---------------
ILLUSTRATIONS [Plates 1-9 are in pocket]
PLATE 1. National Weather Service 24-hour precipitation maps at 7:00 a.m. e.s.t. for March 1973. 2. National Weather Service 24-hour precipitation maps at 7 :OC a.m. e.s.t. for April 1973. 3. National Weather Service 24-hour precipitation maps at 7:00a.m. e.s.t. for May 1973. 4. Daily surface weather maps at 7:00 a.m. e.s.t. for March 1973. 5. Daily surface weather maps at 7:00a.m. e.s.t. for April 1973. 6. Daily surface weather maps at 7:00 a.m. e.s.t. for May 1973. 7. Daily 500-mb height contours at 7:00 a.m. e.s.t. for March 1973. 8. Daily 500-mb height contours at 7: 00 a.m. e.s. t. for April 1973. 9. Daily 500-mb height contours at 7:00 a.m. e.s.t. for May 1973.
v
Page
45 49
50 50 52 52 52 55 58
67 67 67 67 69 71 71 73 74 74 74
74 79
137
VI CONTENTS
ILLUSTRATIONS
Page
FIGURE 1. Map of the Mississippi River basin, showing general area of flooding streams, spring 1973 --·--------- 2 2. Map showing total winter precipitation in 3-month period prior to March 1973 ------------------------- 5 3. Map showing total winter precipitation in 3-mon th period prior to March 1973 as a percentage of normal
winter precipitation _______________________ --- --- _ ----- __ -- _ ---- _______ -- ________________ -- ___ 5 4. Map showing total pr.ecipitation in February 1973 ------------------------------------------------ 6 5. Map showing total precipitation in February 1973 as a percentage of normal February precipitation ------ 6 6. Map showing depth of snow on the ground, March 5, 1973 ----------------------------------------- 7 7. Map showing depth of snow on the ground, March 19, 1973 ----------------------------------------- 8 8. Map showing mean 700-mb contours in decametres for March 1973; departure from normal mean 700-mb
height in metres for March 1973; mean 700-mb geostrophic windspeed for March 1973 ------------ 9 9. Map showing mean 700-mb contours in decametres for April 1973; departure from normal of mean 700-mb
height in metres for April 1973; mean 700-:mb geostrophic windspeed for April 1973 ------------- 10 10. Map showing temperature departure, March 1973, from 30-year mean March temperature -------------- 11 11. Map showing temperature departure, April 1973, from 30-year mean April temperature ---------------- 12 12. Map showing total precipitation in March 1973_ --------------------------------------------------- 12 13. Map showing total precipitation in March 1973 as a percentage of normal March precipitation --------- 13 14. Map showing total precipitation in April 1973 ----------------------------------------------------- 14 15. Map showing total pr.ecipitation in April 1973 as a percentage of normal April precipitation ----------- 14 16. Map showing mean percentage of possible sunshine, March 1973 ------------------------------------- 16 17. Map showing mean percentage of possible sunshine, April 1973 ------------------------------------- 16 18. Map showing mean sky cover, sunrise to sunset, March 1973 --------------------------------------- 17 19. Map showing mean sky cover, sunrise to sunset, April 1973 ---------------------------------------- 17 20. Map showing Palmer Index on March 31, 1973----------------------------------------------------- 18 21. Map showing Palmer Index on April 21, 1973 ----------------------------------------------------- 18 22. Graphs showing cumulative percentage departures of precipitation amounts from station normals, January
to May 1973 ------------------------------------------------------------------------------- 22 23. Graphs showing cumulative percentage departures of precipitation amounts from station normals, January
to May 1973 -------------------------------------------------------------------------------- 23 24. Graph showing dimensionless temporal patterns of four storms over the basin ------------------------ 26 25. Surface weather chart for 6:00 p.m. c.s.t., April 19, 1973 ------------------------------------------ 27 26. 850-mb chart for 6:00 p.m. c.s.t., April 19, 1973_ --------------------------------------------------- 28 27. 700-mb chart for 6:00 p.m. c.s.t., April 19, 1973---------------------------------------------------- 28 28. 500-mb chart for 6:00 p.m. c.s.t.~ April 19, 1973---------------------------------------------------- 29 29. Surface weather chart for 6:00 a.m. c.s.t., April 20, 1973 ------------------------------------------ 30 30. 850-mb chart for 6:00 a.m. c.s..t., April 20, 1973----------------------------------------------------- 31 31. 700-mb chart for 6:00 a.m. c.s.t., April 20, 1973 __ --------------------------------------------------- 31 32. 500-mb chart for 6:00 a.m. c.s.t., April 20, 1973 __ --------------------------------------------------- 32 33. Surface weather chart for 6:00 p.m., c.s.t., April 20, 1973 ------------------------------------------- 32 34. 850-mb chart for 6:00 p.m. c.s.t., April 20, 1973 __ --------------------------------------------------- 33 35. 700-mb chart for 6:00 p.m. c.s.t., April 20, 1973 __ --------------------------------------------------- 33 36. 500-mb chart for 6:00p.m. c.s.t., April 20, 1973 __ ·--------------------------------------------------- 34 37. Map showing 24-hour trajectories ending at 700-mb at 6:00p.m. c.s.t., April 20, 1973 ------------------ 35 38. Map showing 24-hour trajectories ending at 850-mb at 6:00 p.m. c.s.t., April 20, 1973 ----------------- 35 39. Map showing 24-hour surface trajectories ending at 6:00 p.m. c.s.t., April 20, 1973 ------------------- 36 40. Map showing 24-hour trajectories ending at 700-mb at 6:00 p.m. c.s.t., April 5, 1973 ------------------ 36 41. Map showing 12-hour net vertical displacement of air parcels reaching 700-mb at 6:00 a.m. c.s.t., April 21,
1973 --------------------------------------------------------------------------------------- 37 42. Map showing some synoptic features at 6:00 a.m. c.s.t., April 20, 1973, before the inception of a small line
in northern Missouri ------------------------------------------------------------------------ 38 43. Map presentation of analysis of precipitable water (in) from surface to 500 mb and lifted index for 6:00
a.m. c.s.t., April 21, 1973 -------------------------------------------------------------------- 39 44. Graph showing sounding for Little Rock, Ark., at 600 a.m. c.s.t., April 20, 1973 ----------------------- 40 45. Graph showing sounding for Peoria, Ill., at 6:00 p.m. c.s.t., April 20, 1973 ----------------------------- 41 46. U.S. cloud cover, April 20, 1973, 1800 G.m.t. from NOAA satellite photograph ---------------------- 42 47. Map showing position of jet axis at (a) 6:00a.m. c.s.t. April 20, 1973, (b) 6:00p.m., April 20, 1973, (c)
6:00 a.m. c.s.t., April 21, 1973. Precipitation center in northern Missouri with more than 4 inches in 12 hours ending 6:00a.m. c.s.t., April 21, 1973, also shown -------------------------------------- 43
48. Map of total storm rainfall April 19-22, 1973, near storm center at Moberly, Mo., showing area with 2
inches or more rain ------------------------------------------------------------------------- 44
FIGURE 49.
50. 51. 52. 53.
54.
55-58. 59-65.
66. 67. 68. 69. 70. 71. 72. 73.
74.
TABLE 1. 2.
3. 4. 5.
6.
7.
8. 9.
10. 11. 12.
CONTENTS
Graph showing mass curves of rainfall for (1) Moberly Radio KWIX, (2) Higbee 7S, (2) Hannibal Water-works, and ( 4) Columbia WSO for April 19-22, 1973 ----------------------------------------
Map of total rainfall April 16-22, 1973, showing areas with 2 inches or more rain -------------------Map showing location of flood determination and sediment data sites in the Mississippi River basin ----Graphs for determining flood-frequency for the Mississippi River -----------------------------------Graph showing comparison of monthly mean flows for October 1972-June 1973 with average monthly flows;
selected stations in the Mississippi River basin ----------------------------------------------Graph showing comparison of monthly mean flows for October 1972-June 1973 with average monthly flows;
selected stations in the Mississippi River basin -----------------------------------------------Photographs showing effects of Mississippi River flooding, spring 1973 -------------------------------Flood-crest profiles of Mississippi River ________ - _ ---- ____________________ ---- _ --- _______ --- _ ------Discharge hydrographs at selected gaging stations on the Mississippi River, March-May 1973 ---------Map showing data collection points in Lakes Ponchartrain and Borgne, La --------------------------Flood-crest profiles of Turtle and Little Turtle Creeks, Rock and Walworth Counties, Wis -------------Photograph showing effects of Turtle Creek flooding at Beloit, Wis., April 21, 1973 ------------------Flood-crest profiles of Big Creek and Skunk River in Iowa -----------------------------------------Flood-crest profiles of Rock River, Illinois and Wisconsin ------------------------------------------Flood-crest profiles of North Fabius and North Rivers, Mo -----------------------------------------Map showing extent of flooding during March 19 73 in the Mississippi River Delta region of northwest
Mississippi ______________________________ ---------- _- ---------------------------------------Graph showing March-June 1973 suspended sediment discharge at selected points in the Mississippi River
basin --------------------------------------------------------------------------------------
TABLES
VII
Page
44 46 51 53
54
55 56 57 61 64 68 69 70 72 73
75
78
Page
Record and near record monthly precipitation in the Mississippi River basin in spring 1973 ------------- 11 Average sky cover and percentage of possible sun shine for selected stations in the Mississippi River basin,
March and April 1973, versus climatological normals -------------------------------------------- 15 Weekly precipitation totals and cumulative departures (in) from normal, February 26-May 20, 1973 ____ 21 A sample of precipitation events in the Mississippi basin in March and April 1973 --------------------- 24 Comparison of past significant storm rainfalls within a 200-mile radius of Moberly, Mo., with the observed
rainfall at Moberly Radio KWIX in the storm of April 19-22, 1973 ------------------------------- 45 Comparison of the April 20-21, 1973, storm near Moberly, Mo., with the Illinois model 12-hour severe rain-
storm -------------------------------------------------------------------------------------- 45 Comparison of daily average solar radiation for March and April 1973 received at the surface with the
climatic normal solar radiation ---------------------------------------------------------------- 48 Comparison of evaporation for March and April 1973 with climatic mean monthly evaporation ----------- 48 Flood-crest elevations on the Mississippi River______________________________________________________ 62 Chloride and suspended-sediment data, Lake Pontchartrain, La ------------------------------------- 65 Summary of sediment and related streamflow data for 1973 Mississippi River flood -------------------- 76 Station descriptions and discharge and suspended-sediment data -------------------------------------- 82
GLOSSARY
Albedo. The ratio of the amount of radiation refleded by a body to the amount incident upon it, commonly expressed as a percentage.
Dew point (or dew point temperature). The temperature to which a give:n p.arcel of air must be cooled at constant pressure and constant water-vapor content in order for saturation to occur. Bed material. The sediment mixture of which the moving bed
is composed. Concentration of sediment, by weight. The ratio of the weight
of dry solids in a water-s·ediment mixture to the weight of the mixture in milligrams per litre.
Depth-integrating sediment sampler. An instrument that is moved vertically at an approximately constant rate between the water surface and a point a few inches above the streambed. It collects a representative water-sediment mixture at all points along the sampling vertical.
Discharge-weighted concentration. The dry weight of sediment in a unit volume of stream discharge, or the ratio of the discharge of dry weight of sediment to the discharge by weight of water s·ediment mixture.
Fine material. That part of the total stream s·edimen.t load composed of siz·es not found in appreciable quantities in the bed material; normally the silt and clay sizes (less than 0.062 mm).
VIII CONTENTS
Flood peak. The highest value of the stage or discharge attained by a flood.
Flood profile. A graph of the elevation of water surface of a river in a flood, plotted as ordinate, against distance, measured in the downstream direction, plotted as abscissa.
Flood stage. The approximate elevation of the stream when overbank flooding begins.
Front. The inte.rf.ace or transition zone between two airmasses of different density.
Jet stream. Relatively strong winds concentrated within a narrow stream in the atmosphere.
K Index. A measure of the airmass moisture content and stability,
K= (Ts5o-Tr;oo) +Ta, s5o- (T,oo-Ta, ,oo), T and Ta are temperature and dew point respectively in degrees Celsius ( o C); subscrip·ts denote pressure levels.
Lifted Index. Difference in oc between the obs·erved 500-mb temperature and the computed temperature which a parcel characterized by the mean temperature and dew point of the 50-mb thick surface layer would have if it were lifted from 25 mb above the surface to 500 mb.
Moist tongue. An extension or protrusion of moist air into a region of lower moisture content.
N-year precipitation (rain). A precipitation amount which can be expected to occur, on the average, once every N years.
Occluded cyclone. Any cyclone within which there has developed an occluded front.
Occluded front (occlusion). A composite of two fronts, formed as a cold front overtakes a warm front or quasistationary front. This is a common process in the late stages of cyclone development.
Particle size. The diameter of a particle measured by settling, sieving, micrometric, or direct measurement methods.
Particle size distribution. The relative amount of a sediment sample having a specific size, usually in terms of percent by weight finer than a given size, D percent.
Point-integrating sediment sampler. An instrument designed to co11ect a re,presentative sample of the water-sediment mixture at a selected depth in a stream vertical o:ver a specific time period.
Precipitable water. The total atmospheric water vapor contained in a vertical eolumn of unit cros~s~sedional area extending from the surface up to a specified pressure level, usually 500 mb.
Recurrence interval. Frequency of flooding is normally expressed by the Geological Survey in term.s of recurrence interval in years. This designation indicates that a flood of a given magnitude will be exceeded once in an average interval of time. For example, a 50-year flood discharge will be exceeded on the average of once in 50 years; in terms of probability, the11e is a 2-percent chance that such a flood will occur in any year.
Ridge. An elongated are'a of relatively high atmospheric pressure.
Saturation. The condition in which the partial pressure of water vapor is equal to its maximum possible partial pressure under the existing en:vironmental conditions.
Sediment. Solid particles: usually derived from rocks or earth material that have been or are being transported laterally or vertically from one or more places of origin.
Sediment discharge. The average quantity of sediment carried past any cross section of a stream per unit of time. The term may be qualified as, for example, susp·endedsediment dis·charge·, bedload discharge, bed-material load dis·charge, or total sediment discharge.
Sediment yield. The total sediment outflo·w from a watershed or past a given location in a spedfied pe·riod of time. It includes stream bedload as well as suspended load and is usua11y expres:sed in tons per yea.r.
Showalter Index. A measure of the local static stability of the atmosphere. It is determined by raising an air p·arcel from 850 mb dry-adiabatically to saturation~ then saturation-adiabatically to 500 mb. At ·500 mb the environment temperature minus the parcel temperature and expressed as a nondimensional numeral is the index.
Sounding. A single complete radiosonde obs·ervation of the upper atmosphere.
Squall line. Any non-frontal line· or narrow band of active thunderstorms; a mature~ instability line.
Suspended sediment. Organic and inorganic particulate matter that moves in suspension in streamflow and is maintained in suspension by the upward components of turbulent currents or by colloidal suspension.
Trough. An elongated area of relatively low atmo·spheric pressure.
Vapor pressure. The pressure exerted by the molecules of a given vapor; in meteorology, this. term is used exclusively to denote the partial pressure of water vapor.
THE 1973 MISSISSIPPI RIVER BASIN FLOOD: COMPILATION AND ANALYSES OF
METEOROLOGIC, STREAMFLOW, AND SEDIMENT DATA
By EDWIN H. CHIN of the National Weather Service, National Oceanic and Atmospheric Administration, and JoHN SKELTON and HAROLD P. Guy of the U.S. Geological Survey
ABSTRACT The severe 1973 :spring flood in the Mississippi River basin
had its beginnings in the mild, wet fall and winter of 1972. Many tributary streams and reservoir levels were well above normal throughout the basin when heavy spring rains began to fall. Frequent and prolonged warm rains associated with extratropical cyclones and frontal activities fell over large areas of the Mississippi basin in March and April 1973. The cumulative effect of these ·rainfalls led to the 1973 Mississippi River basin flood, characterized by its long duration, high volumes of runoff, and large coincident tonnage of sediment transported.
New records for consecutive day.s above flood stage were set for most main-stem gaging stations from southern Iowa to Louisiana. For example, the Mississippi River remained above flood stage for a record number of consecutive days at St. Louis, Mo. (77 days), Chester, Ill. (97 days), Thebes, Ill. (95 days), Memphis, Tenn. (63 days), and Vicksburg, Miss. (88 days). The total sediment discharge to the Gulf of Mexico during March through June was approximately 240 million tons, including 15 million into Lake Pontchartrain.
The 1973 main-stem flood stages were the highest ever observed in the reach of the Mississippi extending approximately 370 mi (595 km) upstream from Cape Girarde.au, Mo. At St. Louis, Mo., for example, the maximum stage of 43.23 ft (13.177 m) ·exceeded the stage of 41.32 ft (12.594 m) that was observed in June 1844, and the flood peak of April 1785 that may have reached 42 ft (12.80 m).
Peak stages and discharges far exceeding the estimated values for the 100-year flood occurred in April 1973 on many tributaries in Wisconsin, Iowa, Illinois, and Missouri. Most tributary streams throughout the Mississippi River basin experienced some degree of flooding during March-May 1973, contributing to the outstanding main-stem flooding which continued into June.
Described in this report are the meterological setting of the flood, an account of the general characteristics of associated precipitation, and an analysis of a sample of significant precipitation events with return periods exceeding 100 years. The storm of April 19-21, 1973, with precipitation centered in northern Missouri, is analyzed as a case study. An estimation of evapotranspiration based on relevant meteorological factors indicates a probable reduction of such loss during the flood episod.e.
This report also contains summaries of stream stages, discharges, and flood volumes for gaging stations where outstand-
ing flood events occurred and includes sediment data where available. The recurrence interval of the event is shown for many of the peaks and volumes. Also included are flood-profile data for the main stem and selected tributary streams.
INTRODUCTION
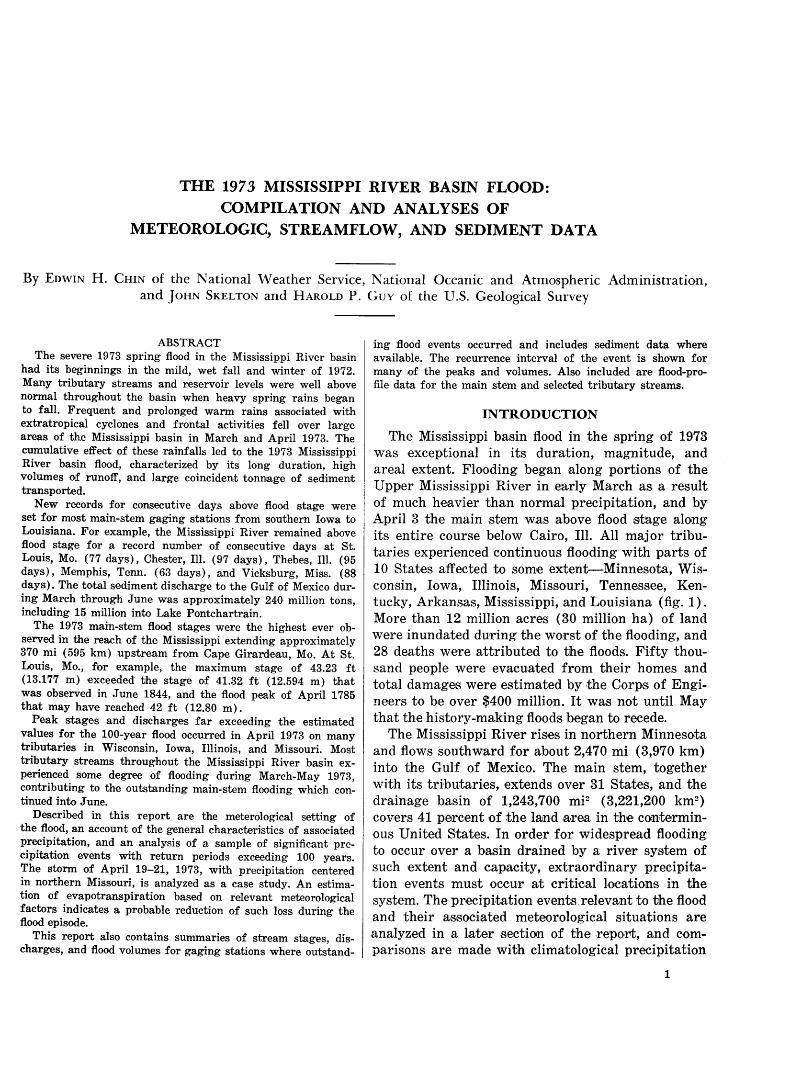
The Mississippi basin flood in the spring of 1973 was exceptional in its duration, magnitude, and areal extent. Flooding began .along portions of the Upper Mississippi River in early March as a result of much heavier than normal precipitation, and by April 3 the main stem was above flood st'age along its entire course below Cairo, Ill. All major tributaries experienced continuous flooding with parts of 10 Stat·es affected to som~e extent-Minnesota, Wisconsin, Iowa, Illinois, Missouri, Tennessee, Kentucky, Arkansas, Mississippi, and Louisiana (fig. 1). More than 12 million acres (30 million ha) of land were inundated during the worst of the flooding, and 28 deaths were attributed to the floods. Fifty thousand people were evacuated from their homes and total damages were estimated by the Corps of Engineers to be over $400 million. It was not until May that the history-making floods be·gan to recede.
The Mississippi River ris·es in northern Minnesota and flows southward for about 2,470 mi (3,970 km) into the Gulf of Mexico. The main stem, together with its tributaries, extends over 31 States, and the drainage basin of 1,243,700 mP (3,221,200 km2
)
covers 41 perc.ent of the land ,a.rea in the conterminous United States. In order for widespread flooding to occur over a basin drained by a rive'r sys~tem of such extent and capacity, extraordinary precipitation events must occur at ~critk,al locations in the system. The precipitation events.relevant to the flood and their as.soci:ated meteorological situations are analyzed in a later section of the .report, and comparisons are made with climatological precipitation
1
2 THE 1973 MISSISSIPPI RIVER BASIN FLOOD
40
EXPLANATION
-. ·- Mississippi River basin boundary
~ Area of flooding ~ streams
0 400 MILES I II II I I I 0 400 KILOMETRES
FIGURE 1.-The Mississippi River basin, showing general area of flooding streams, spring 1973.
events of various return periods. A cas.e study of cyclone and frontal systems associa:bed with tropical maritime airmass intrusion into the "heartland" of the basin is also presented later in the report. Estimation of water loss over the basin in March and April1973 is made.
The Mississippi basin .as a whole received above normal precipitation in every month except one from October 1972 through February 1973. As a consequence, tributary flooding over a part of the basin had been in progress prior to the onset of the mainstem flooding in early March 1973. The contributions of the antecedent precipitation, the snowmelt factor, and the unusually prolonged and sometimes heavy storm rainfalls that began in March 1973 are assessed in a later section.
The floods on the main stem of the Mississippi River and its major tributaries are described in some detail in this report. Upstream from Winona, Minn., the main-stem flooding was minor; recurrence intervals of peaks ·w·ere less than 10 years. However, from approxin1ately 420 mi (676 km) above Cairo, Ill., to Cape Girardeau, Mo., the maximum 1973 flood stages
s~et alltime high records. Further downstream, the main stem reached its highest stages since 1937.
National Weather Service forecasts and warnings of record and near-record flooding were timely and accurate during the record-breaking period. The forecast for the record crest of April 28 on the Mississippi River at St. Louis was made at a time when major levee failures were occurring upstream, producing additional complications in the forecast problem. As a result of thes·e forecasts and warnings, protective m·ea:sures were taken throughout the flood areas that have been estimated to hav·e averted over $500 million in additional losses. Undoubtedly, the warnings also prevented the loss of many lives.
An outstanding facet of the 1973 flood was the high volume of flow in the Mississippi River and many of its tributaries for an extended period of time.· At Vicksburg, Miss., the average runoff for the Mississippi River from October 1972 through June 1973 was much greater than any comparable period since records have been collected.
The record Mississippi River crests in late April 1973 were preceded by headwater floods on many
INTRODUCTION 3
tributary streams only a few days earlier. Such almost simultaneous events created lakes of water that could not drain from the land. These backwater areas allowed the relatively heavy sediment loads of the tributaries to partly settle out, thus helping to assure relatively low concentrations of suspended sediment in the Mississippi River main stem. However, backwater floods also caused much damage, particularly in the flat Missis1sippi Delta region.
An important feature of most floods is that of sedim,ent erosion, transport, and deposition, and the 1973 flooding was no exception. The main categories of visually apparent sediment damages during the flood were scour and deposition on roads, culverts, and bridges, streambank erosion, erosion and deposition on agricultural land, and deposition in structures and on furnishings. Erosion of the uplands by raindrop splash and overland runoff was caused by precipitation and fresh exposure of the land surface, whereas stream channel erosion was caused by flow intensity and perhaps some manmade channel controls.
This flood serves to illustrate that a flood plain is really an enlarged part of the associated river or stream. Those who are ,engaged in any activity on or near flood plains need to be aware that the risk of devastating floods in these areas, even though s.mall in any given year, is nevertheless a very real risk. Manmade controls in the form of reservoirs, diversions, and levees can reduce but never completely erase the threat.
PURPOSE AND SCOPE
This report is one of a continuing series of joint flood reports undertaken by the Department of the Interior, U.S. Geological Survey, and the Department of Commeroe, NOAA, National Weather Service. The cooperative effort represents a natural dovetailing of technical talent and responsibility. The National Weather Service is the agency responsible for monitoring and predicting atmospheric moisture and precipitation, for forecasting river stage, and for issuing warnings of destructive weather events. Therefore, its contribution to this report is in the area of meteorological events related to the flood. The Geological Survey is the primary agency for monitoring the quantity and quality of the terrestrial water resources, including both ground water and surface water. Therefore, its contribution is in the area of documenting the flood itself, the magnitude and frequency of the flood peaks and volumes, and the fluvial sediment data. The compilation of this information in one report will serve as a ready refer-
enee for this major event and hopefully will be of value in future water-management planning.
Basic precipitation data collected by the National Weather Service are published routinely by NOAA Environmental Data Service in the Climatological Data series and the Hourly Precipitation Data series each month and are readily available through the National Climatic Center in Asheville, N.C. Therefore, when treating precipitation in this report the emphasis is on utilizing these data to arrive at coherent information, such as daily isohyetal patterns and significant precipitation events associated with the flood. The daily surface weather maps and the 500 mb (millibar) charts included in this report should provide a basic fram,e of reference of the meteorological setting for the flood. More spec.ific analyses of meteorological events relevant to the flood are presented in the text.
Likewise, detailed streamflow and sediment data collected by the Geological Survey are published routinely in State reports, and again this report utilizes these data to assemble coherent information about the flow and sediment characteristics of the flood. Additional flood information is contained in files and publications of district offices of the Geological Survey in each State.
Flood data for 72 sites, including 24 sites having sediment data, are shown near the end of this report. The time period chosen for reporting flood information was March through May 1973 for tributary streams and main-stem stations on the Upper Mississippi River because the outstanding flood peaks and volumes occurred during this period. However, the base period was extended through June 1973 to include the periods of signific-ant flood runoff for some stations, mostly in the Lower Mississippi basin.
A tabulation of daily mean discharge is provided for many stations. For many sites on tributary streams, the stage, discharge, and sediment data are shown at selected times during significant flood events so that more accurate flood hydrographs can be drawn than would be possible by using only the daily mean values.
Flood-volume-duration data are presented for a number of sites where continuous streamflow records were available. These data can be useful in the planning, design, construction, and operation of projects that include the storage of flood waters. The recurrence intervals of the flood volumes and peak discharges .are al·so shown.
ACKNOWLEDGMENTS The meteorological and rainfall analyses contained
in this report are mainly based upon National
4 THE 1973 MISSISSIPPI RIVER BASIN FLOOD
Weather Service data or products and therefore represent the collective effort of many professional people. The author of the NOAA portion of this report is especially grateful to Mr. John F. :Miller, Chief, Water Management Information Division, for his interest in this work and his many helpful comments. Sincere thanks are also extended to Mr. Francis K. Schwarz of that same division and to Dr. Charles N. Hoffeditz of the Hydrologic Research Laboratory for their valuable discussions.
Much of the flood and sediment data appearing in this report were collected and reported as part of cooperative programs between the U.S. Geological Survey and the States of Minnesota, Wisconsin, Iowa, Illinois, Missouri, Tennessee, Kentucky, Arkansas, Mississippi, and Louisiana. Much additional data were furnished by the St. Paul, Rock Island, St. Louis, Kansas City, Memphis, Little Rock, 'licksburg, and New Orleans districts of the U.S. Army Corps of Engineers. Other Federal and State agencies, municipalities, and corporations also provided some data.
CONVERSION OF ENGLISH UNITS TO INTERNATIONAL SYSTEM OF UNITS
For use of those readers who may prefer to use metric units rather than English units, the conversion factors for the terms us~ed in this report are listed below :
Multiply English By To obtain units metric units
Inches (in.) 25.4 Millimetres (:mm). Feet (ft) 0.3048 Metres (m). Yards (yd) 0.9144 Metres (m). Miles (mi) 1.609 Kilometres (km) . Nautical ·miles 1.85 Kilometres (km) .
(nmi) Knots (kn) 1.85 Kilom·etres pc~r
hour (km/hr) . Acres 4,047 Square metres
(m!!). Acres 0.4047 Hectares (ha) . Square miles 2.590 Square kilometres
(mi2) (km2
).
Acre-feet 1,233 Cubic metre's (acre-ft) (ms).
Acre-feet 1.233 X 10- 3 Cubic hectometres (acre-ft) (hm3
).
Cubic feet per 0.02832 Cubic metres per second (fV/s) second (m3/s).
Gallons (gal) 3.785X10- 3 Cubic metres (m3).
Degrees Fahren- 5/9 (F -32) Degrees Celsius' heit (°F) (oC).
METEOROLOGICAL SETTINGS OF THE FLOOD EPISODE
ANTECEDENT PRECIPITATION
To provide some background for the flood event, antecedent precipitation since late fall 1972 will be briefly examined. Precipitation for October 1972 was more than twice the normal in parts of the southern Plains and the Lower Mississippi Valley. Cairo, Ill., had 7.05 in. (179 mm) of rain in October 1972, which was 4.17 in. (106 mm) above normal. November 1972 was another wet month for the Ohio River Valley, the Lower Missouri Riv·er VaHey, and coastal Louisiana. But, for other areas of the basin, it was nearly normal. December precipitation over the Mississippi basin was near normal or above, except for the relatively dry southern Plains. January precipitation was twice its normal in the Central Great Plains and below normal in the Ohio Valley but was about normal in other parts of the Mississippi basin (Environmental Data Service and Statistical Reporting Service, 1973).
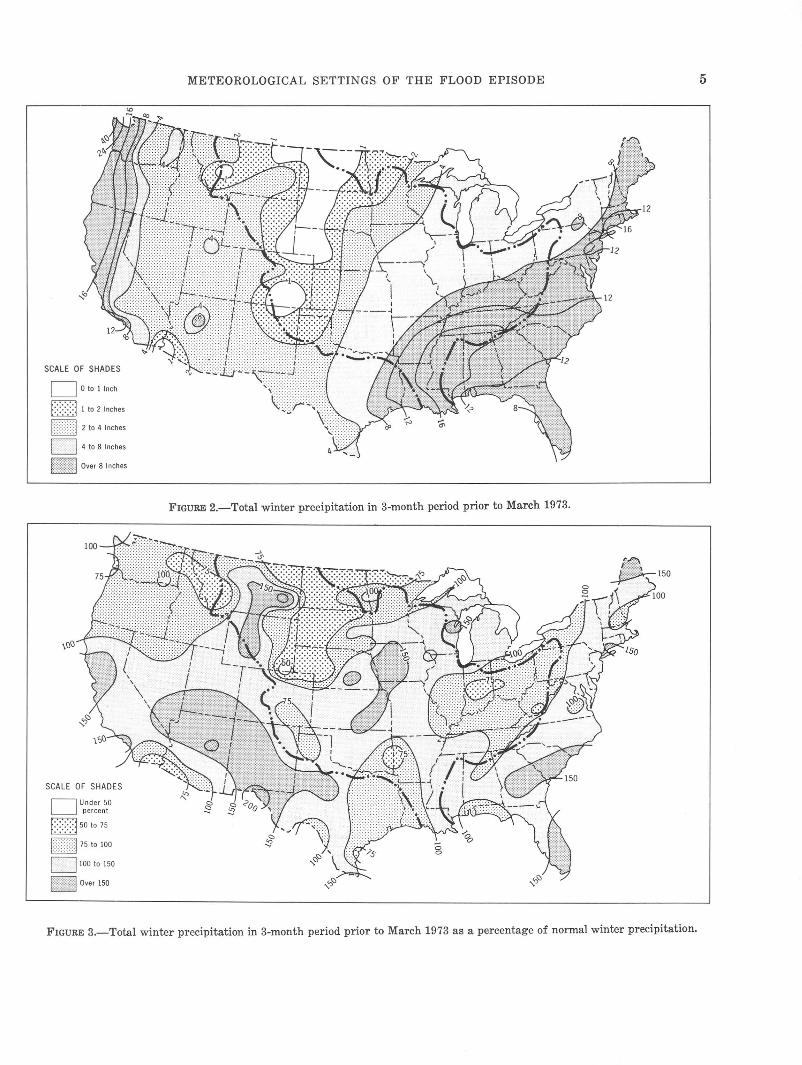
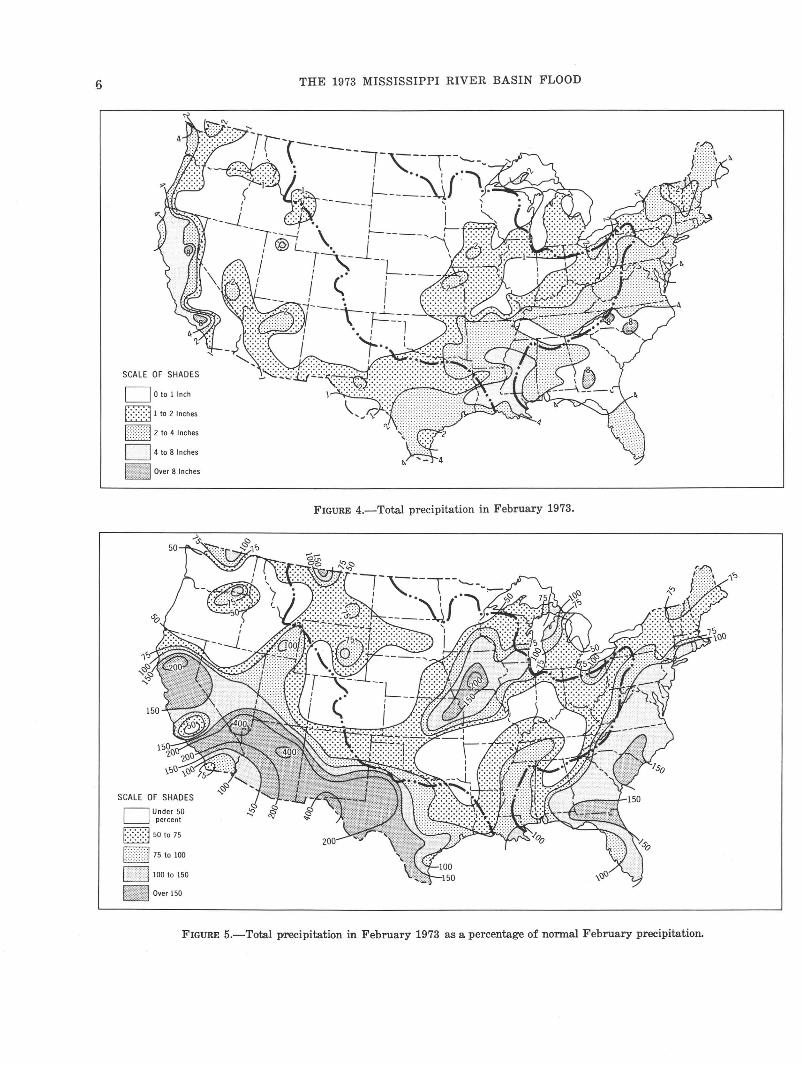
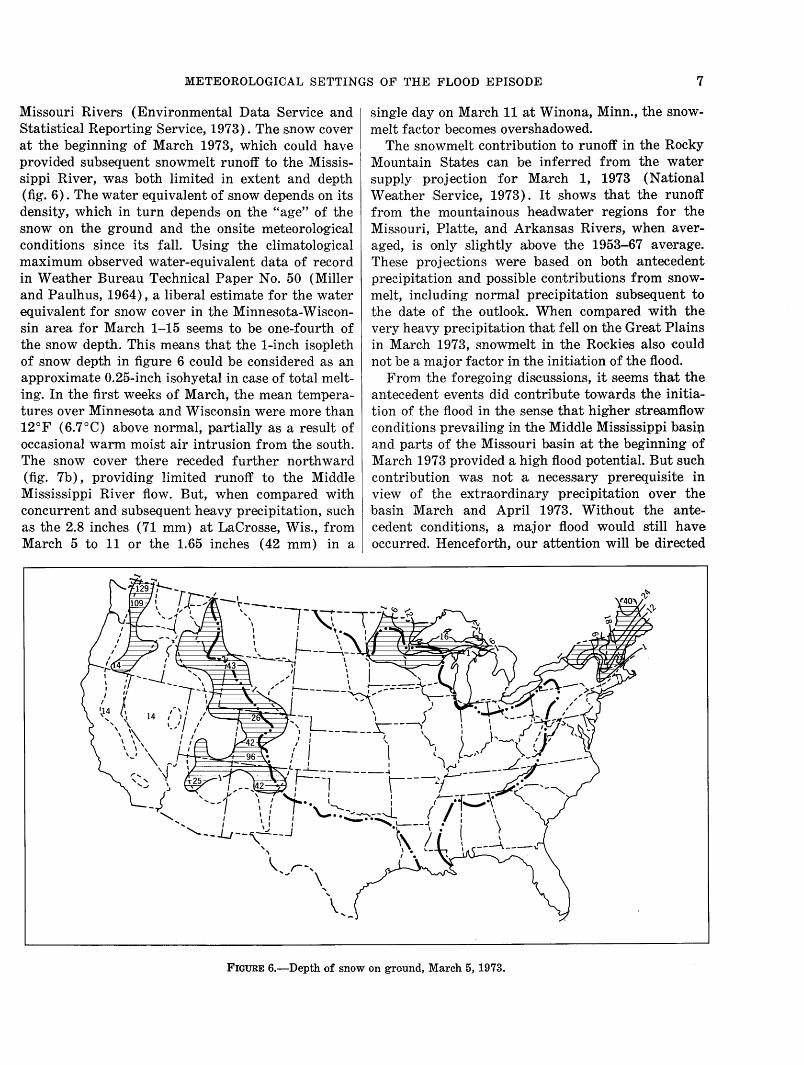
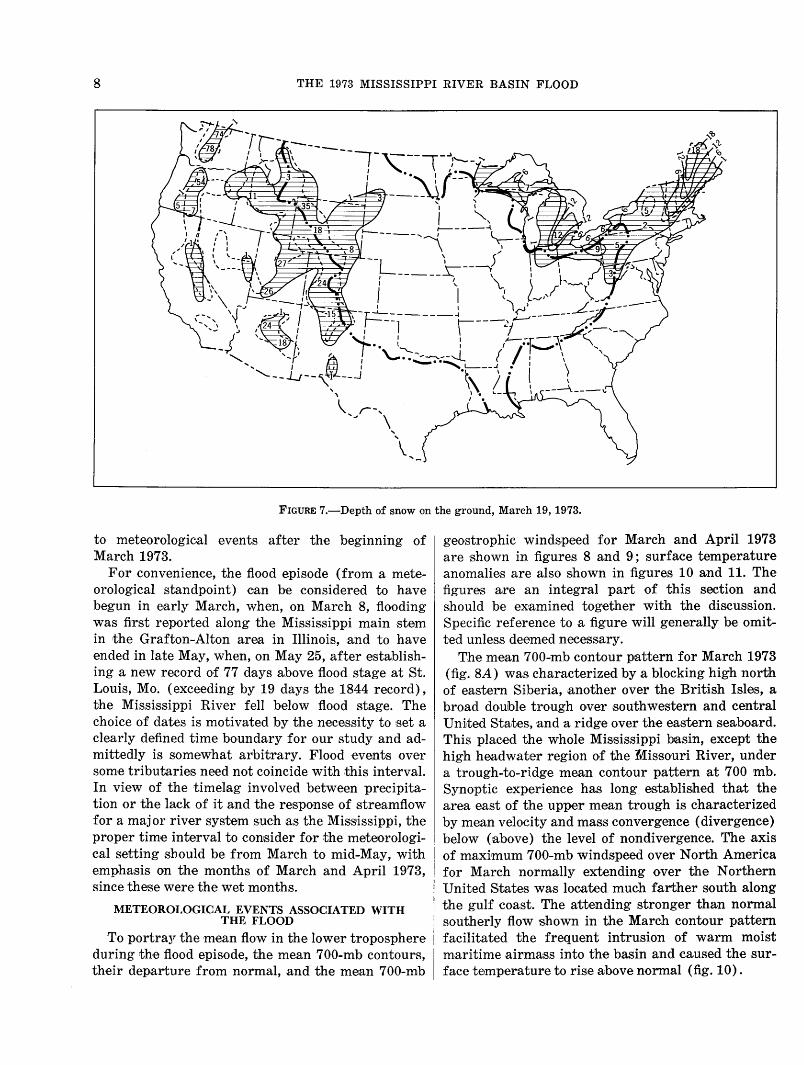
The amount of precipitation in the 3-month period prior to March 1, 1973, and this amount as a percentage of normal precipitation are shown in figures 2 and 3. It is evident that the winter season precipitation over the whole Missis,sippi basin averaged out close to the climatic normal. Since, in considering antecedent ·events, the immediate past should be given most w·eight, the precipitation map for February 1973 is also shown in figures 4 and 5. For about 90 percent of the basin area, February was a rather dry month ; and considerable areaiS in the Missouri and Mississippi Riv,er headwater region, Arkansas River basin, and Ohio River basin had less than 50 percent of normal precipitation.
Due to the heavier than normal precipitation in late f.all1972, some sections of the Mississippi River system did not fall to their normal low levels in the winter of 1972. Heavy rainfall and flooding occurred in the Cumberland and Lower Ohio tributaries in December. In January 1973, above-normal streamflow conditions persisted in large areas of the Missouri basin and the Middle Mississippi basin. Here, the term "above (below) normal" applies to streamflows within the highest (lowest) 25 percent of record for a specific month. But this area of abovenormal flow in the midS"ection of the country reduced considerably after a dry February.
Another relevant factor that should be examined is snowmelt. During the latter part of February 1973, there was sonH~ reduction of the snow cover over the headwater region~ ~f the Mississippi and
SCALE OF SHADES
D Oto linch
t::::::::~ 1 to 2 Inches
rrrn 2 to 4 Inches
D 4 to Slnches
Over 8 Inches
SCALE OF SHADES
D Under 50 percent
QJ5oto75
I/ )j 75 to 100
Owoto !50
(;~&1[1:] Over 150
METEOROLOGICAL SETTINGS OF THE FLOOD EPISODE
FIGURE 2.-Total winter precipitation in 3-month period prior to March 1973.
!50
FIGURE 3.-Total winter precipitation in 3-month period prior to March 1973 as a percentage of normal winter precipitation.
5
6
SCALE OF SHADES
O otollnch
Q 1 to 2 Inches
I (/J 2 to 4 Inches
D 4 to 8 Inches
Over 8 Inches
SCALE OF SHADES
D Under 50 percent
f::::::::j 50 to 75
k \/175 to 100
100 to 150
Over 150
THE 1973 MISSISSIPPI RIVER BASIN FLOOD
FIGURE 4.-Total precipitation in February 1973.
FIGURE 5.-Total pTecipitation in February 1973 as a percentage of normal February precipitation.
METEOROLOGICAL SETTINGS OF THE FLOOD EPISODE 7
Missouri Rivers (Environmental Data Service and Statistical Reporting Service, 1973). The snow cover at the beginning of March 1973, which could have provided subsequent snowmelt runoff to the Mississippi River, was both limited in extent and depth (fig. 6). The water equivalent of snow depends on its density, which in turn depends on the "age" of the snow on the ground and the onsite meteorological conditions since its fall. Using the climatological maximum observed water-equivalent data of record in Weather Bureau Technical Paper No. 50 (Miller and Paulhus, 1964), a liberal estimate for the water equivalent for snow cover in the Minnesota-Wisconsin area for March 1-15 seems to be one-fourth of the snow depth. This means that the l-inch isopleth of snow depth in figure 6 could be considered as an approximate 0.25-inch isohyetal in case of total melting. In the first weeks of March, the mean temperahires over Minnesota and Wisconsin were more than l2°F (6.7°C) above normal, partially as a result of occasional warm moist air intrusion from the south. The snow cover there receded further northward (fig. 7b), providing limited runoff to the Middle Mississippi River flow. But, when compared with concurrent and subsequent heavy precipitation, such as the 2.8 inches (71 mm) at LaCrosse, Wis., from March 5 to 11 or the 1.65 inches (42 mm) in a
single day on March 11 at Winona, Minn., the snowmelt factor becomes overshadowed.
The snowmelt contribution to runoff in the Rocky Mountain States can be inferred from the water supply projection for March 1, 1973 (National Weather Service, 1973). It shows that the runoff from the mountainous headwater regions for the Missouri, Platte, and Arkansas Rivers, when averaged, is only slightly above the 1953-67 average. These projections were based on both antecedent pr·ecipitation and possible contributions from snowmelt, including normal precipitation subsequent to the date of the outlook. When compared with the very heavy precipitation that fell on the Great Plains in March 1973, snowmelt in the Rockies also could not be a major factor in the initiation of the flood.
From the foregoing discussions, it seems that the antecedent events did contribute towards the initiation of the flood in the sense that higher streamflow conditions prevailing in the Middle Mississippi basi:p and parts of the Missouri basin !at the beginning of March 1973 provided a high flood potential. But such contribution was not a necessary prerequisite in view of the extraordinary precipitation over the basin March and April 1973. Without the antecedent conditions, a major flood would still have occurred. Henceforth, our attention will be directed
FIGURE 6.-Depth of snow on ground, March 5, 1973.
8 THE 1973 MISSISSIPPI RIVER BASIN FLOOD
FIGURE 7.-Depth of snow on the ground, March 19, 1973.
to meteorological events after the beginning of March 1973.
For convenience, the flood episode (from a meteorological standpoint) can be considered to have begun in early March, when, on March 8, flooding was first reported along the Mississippi main stem in the Grafton-Alton area in Illinois, and to have ended in late May, when, on May 25, after establishing a new record of 77 days above flood stage at St. Louis, Mo. (exceeding by 19 days the 1844 record), the Mississippi River fell below flood s.tage. The choice of dates is motivated by the necessity to set a clearly defined time boundary for our study and admittedly is somewhat arbitrary. Flood events over som·e tributaries need not coincide with this interval. In view of the time}ag involved between precipitation or the lack of it and the response of streamflow for a major riv·er system such as the Mississippi, the proper time interval to consider for the meteorological s.etting should be from March to mid-May, with emphasis on the months of March and April 1973, since these were the wet months.
METEOROLOGICAL EVENTS ASSOCIATED WITH THE FLOOD
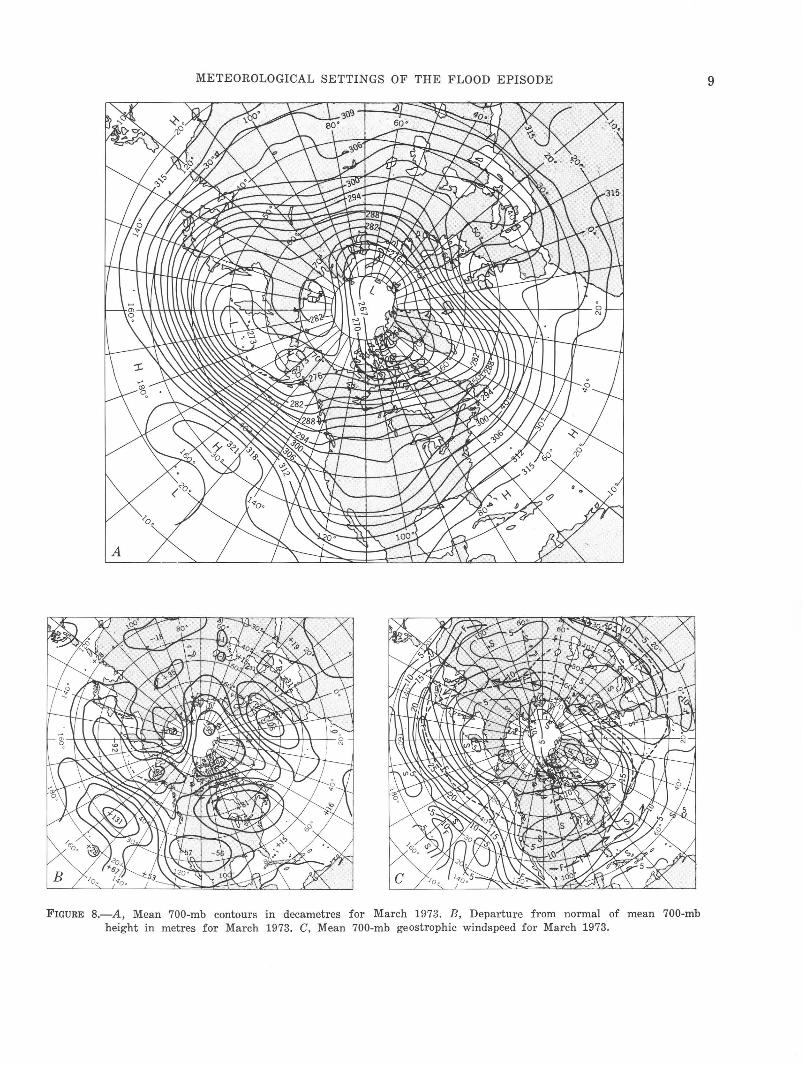
To portray the ·m·ean flow in the lower troposphere during the flood episode, the mean 700-mb contours, their departure from normal, and the mean 700-mb
geostrophic windspeed for March and April 1973 are shown in figures 8 and 9; surface temperature anomalies are also shown in figure·s 10 and 11. The figures a,re an integral part of this section and should be examined together with the diseus~sion. Specific reference to a figure will generally be omitted unless deemed necessary.
The mean 700-mb contour pattern for March 1973 (fig. SA) was characterized by a blocking high north of eastern Siberia, another over the British Isles, a broad doUJble trough over southwestern and central United States, and a ridge over the eastern seaboard. This placed the whole Misisissippi basin, except the high headwater region of the Idissouri River, under a trough-to-ridge mean contour pattern at 700 mb. Synoptic experience has long established that the area east of the upper mean trough is characterized by mean velocity and mass convergence (divergence) below (above) the level of nondivergence. The axis of maximum 700-mb windspeed over North America for March normally extending over the Northern United States was located much farther south along the gulf coast. The attending stronger than normal southerly flow shown in the March contour pattern facilitated the frequent intrusion of warm moist maritime airmass into the basin and caused the surface te,mperature to ris.e above normal (fig. 10).
METEOROLOGICAL SETTINGS OF THE FLOOD EPISODE
FIGURE 8.-A, Mean 700-mb contours in decametres for March 1973. B, Departure from normal of mean 700-mb height in metres for March 1973. C, Mean 700-mb geostrophic windspeed for March 1973.
9
10 THE 1973 MISSISSIPPI RIVER BASIN FLOOD
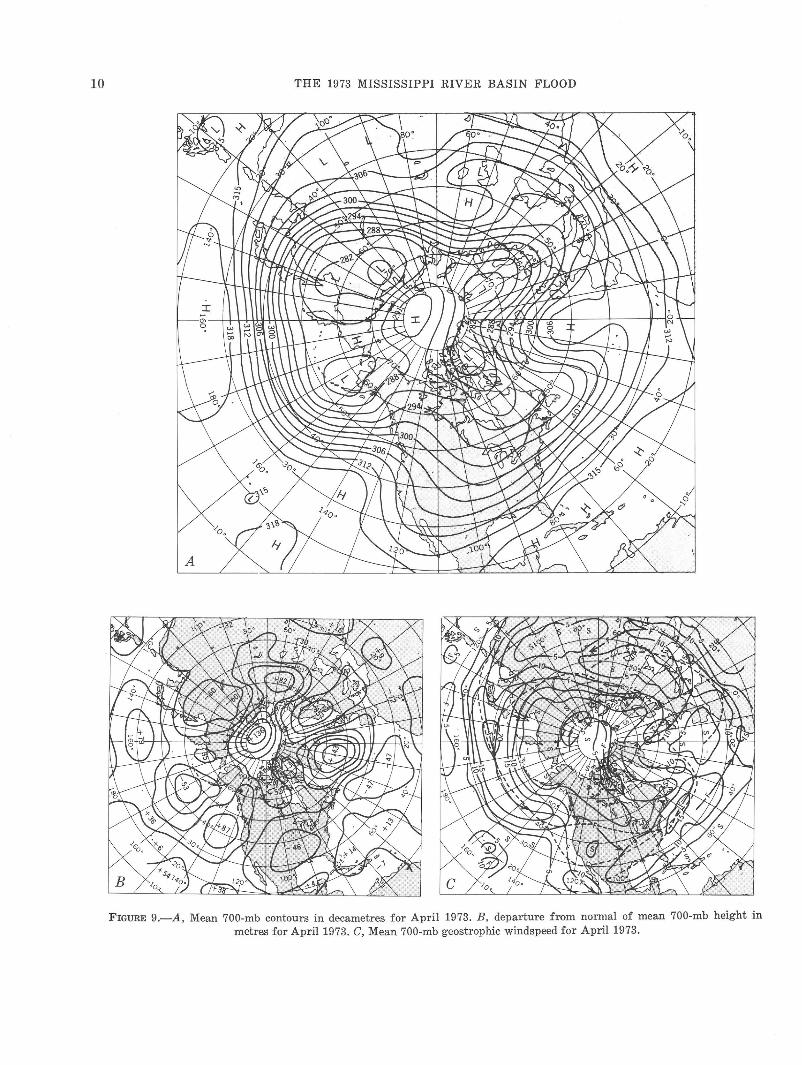
FIGURE 9.-A, Mean 700-mb contours in decametres for April 1973. B, departure from normal of mean 700-mb height in metres for April 1973. C, Mean 700-mb geostrophic windspeed for April 1973.
METEOROLOGICAL SETTINGS OF THE FLOOD EPISODE 11
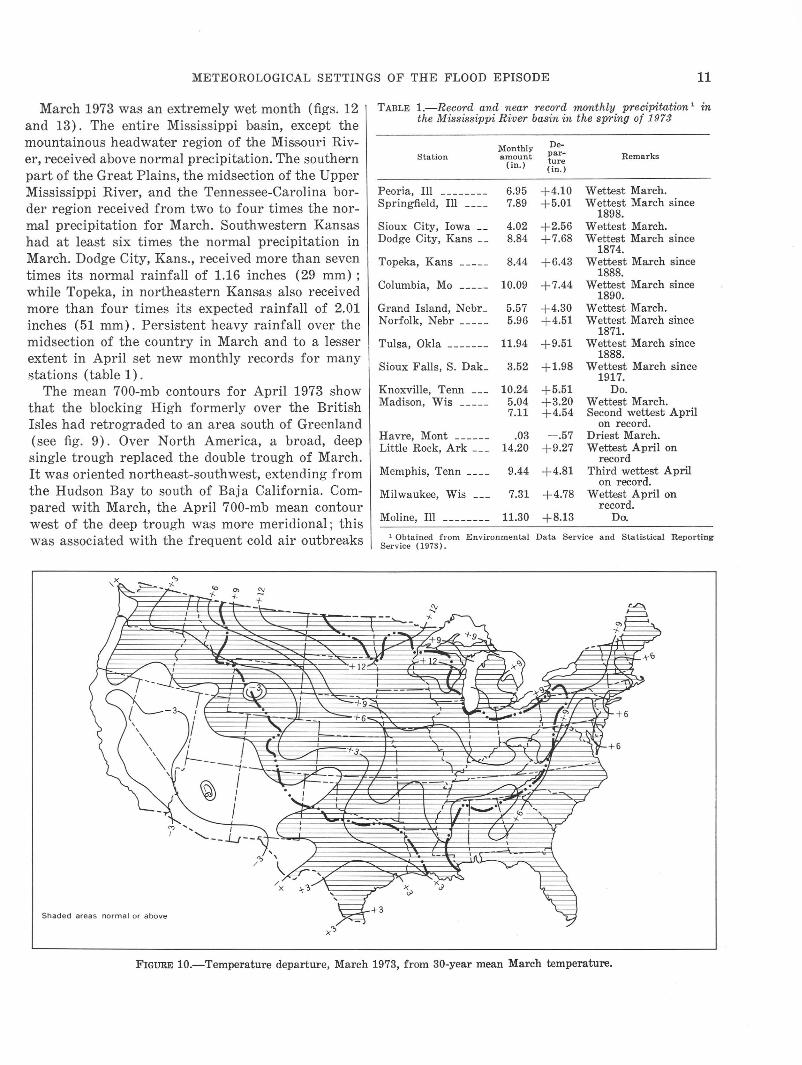
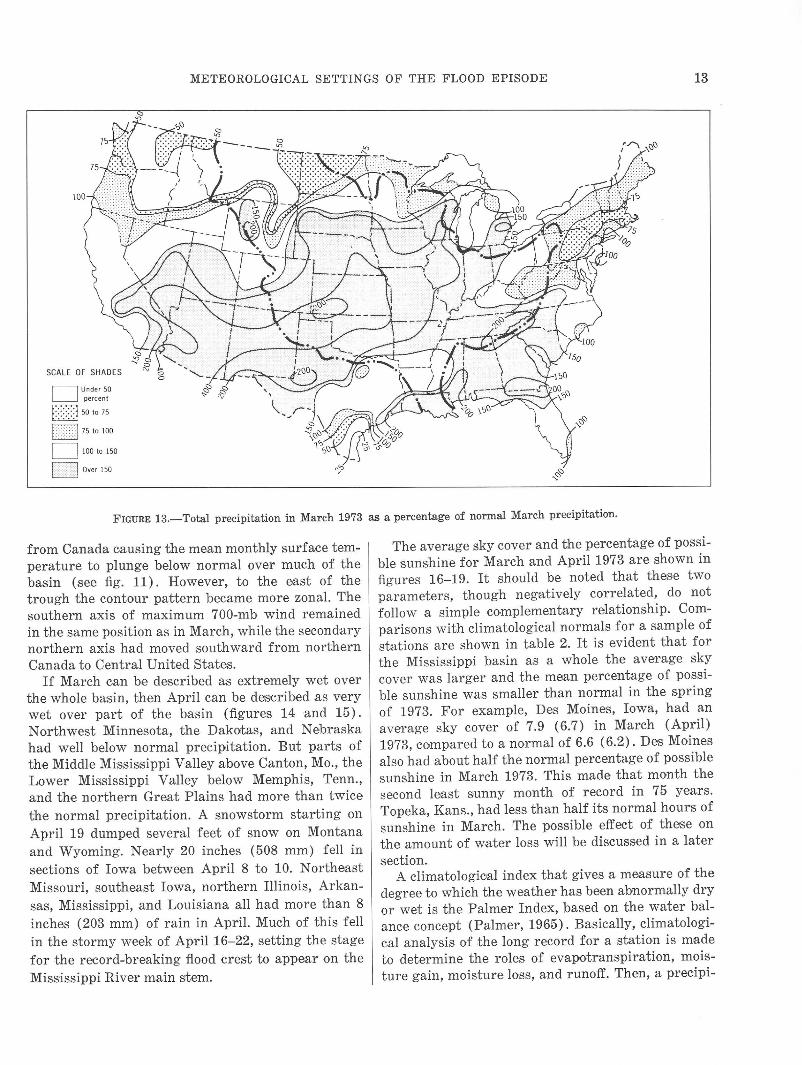
March 1973 was an extremely wet month (figs. 12 and 13). The entire Mississippi basin, except the mountainous headwater region of the Missouri River, rec,eived above normal precipitation. The southern part of the Great Plains, the midsection of the Upper Mississippi River, and the Tennessee-Carolina border region received from two to four times the normal precipitation for March. Southwestern Kansas had at least six times the normal precipitation in March. Dodge City, Kans., received more than seven times its normal rainfall of 1.16 inches (29 mm) ; while Topeka, in northeastern Kang,as also received more than four times its expected rainfall of 2.01 inches (51 mm). Persistent heavy rainfall over the midsection of the country in March and to a lesser extent in April set new monthly records for many stations (table 1).
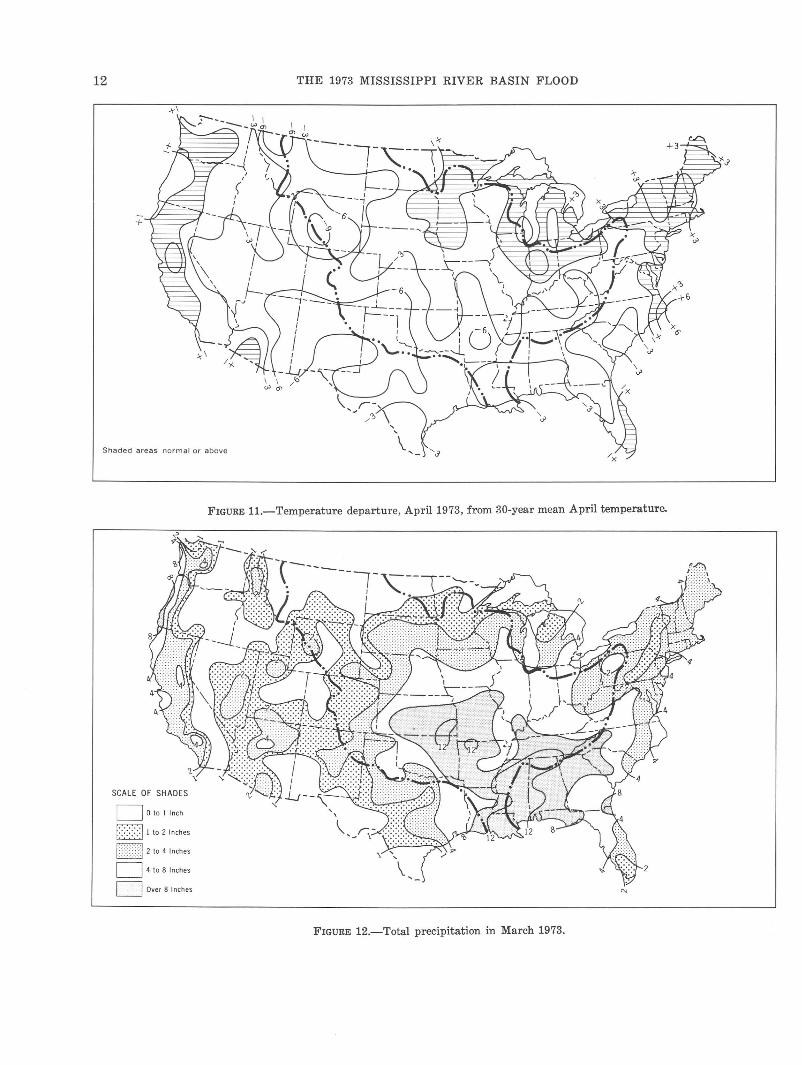
The mean 700-mb contours for April 1973 show that the blocking High formerly over the British Isles had retrograded to an area south of Greenland (see fig. 9). Over North America, a broad, deep single trough replaced the double trough of March. It was oriented northeast-southwest, extending from the Hudson Bay to south of Baja California. Compared with March, the April 700-mb mean contour west of the deep trough was more meridional ; this was associated with the frequent cold air outbreaks
3
..
Shaded area s normal or above
TABLE !.-Record and near record monthly precipitation 1 in the Mississippi River basin in the spring of 1973
Station
Peoria, Ill _______ _ Springfield, Ill ___ _
Sioux City, Iowa __ Dodge City, Kans __
Topeka, Kans
Columbia, Mo
Grand Island, N ebr _ Norfolk, Nebr ____ _
Tulsa, Okla ______ _
Sioux Falls, S. Dak_
Knoxville, Tenn __ _ Madison, Wis
Havre, Mont ___ __ _ Little Rock, Ark __ _
Memphis, Tenn __ _ _
Milwaukee, Wis __ _
Moline, Ill _______ _
Monthly amount
(in.)
6.95 7.89
Depar .. ture (in. )
+4.10 +5.01
4.02 +2.56 8.84 +7.68
8.44 +6.43
10.09 +7.44
5.57 +4.30 5.96 +4.51
11.94 +9.51
3.52 +1.98
10.24 + 5.51 5.04 +3.20 7.11 +4.54
.03 - .57 14.20 +9.27
9.44 +4.81
7.31 +4.78
11.30 +8.13
Remarks
Wettest March. Wettest March since
1898. Wettest March. Wettest March since
1874. Wettest March since
1888. Wettest March since
1890. Wettest March. Wettest March since
1871. Wettest March since
1888. Wettest March since
1917. Do.
Wettest March. Second wettest April
on record. Driest March. Wettest April on
record Third wettest April
on record. Wettest April on
record. Do.
1 Obtained from Environmental Data Service and Statistical Reporting Service (1973).
+ 6
+ 6
+3
FIGURE 10.-Temperature departure, March 1973, from 30-year mean March temperature.
12
Shaded areas normal or above
THE 1973 MISSISSIPPI RIVER BASIN FLOOD
' ' \.
FIGURE 11.-Temperature departure, April 1973, from 30-year mean April temperature.
SCALE OF
c=J otollnch
f::; ::::::jt to 2 Inches
b)))j 2 to 4 Inches
D 4 to 8 Inches
DOver Slnches
FIGURE 12.-Total precipitation in March 1973.
METEOROLOGICAL SETTINGS OF THE FLOOD EPISODE 13
SCALE OF SHADES
D Unde r 50 percent
[:?]50 to 75
75 to 100
D 100 to 150
D Over 150
FIGURE 13.-Total precipitation in March 1973 as a percentage of normal March precipitation.
from Canada causing the mean monthly surface temperature to plunge below normal over much of the basin (see fig. 11). However, to the east of the trough the contour pattern became more zonal. The southern axis of maximum 700-mb wind remained in the same position as in March, while the seconda.ry northern axis had moved southward from northern Canada to Central United States.
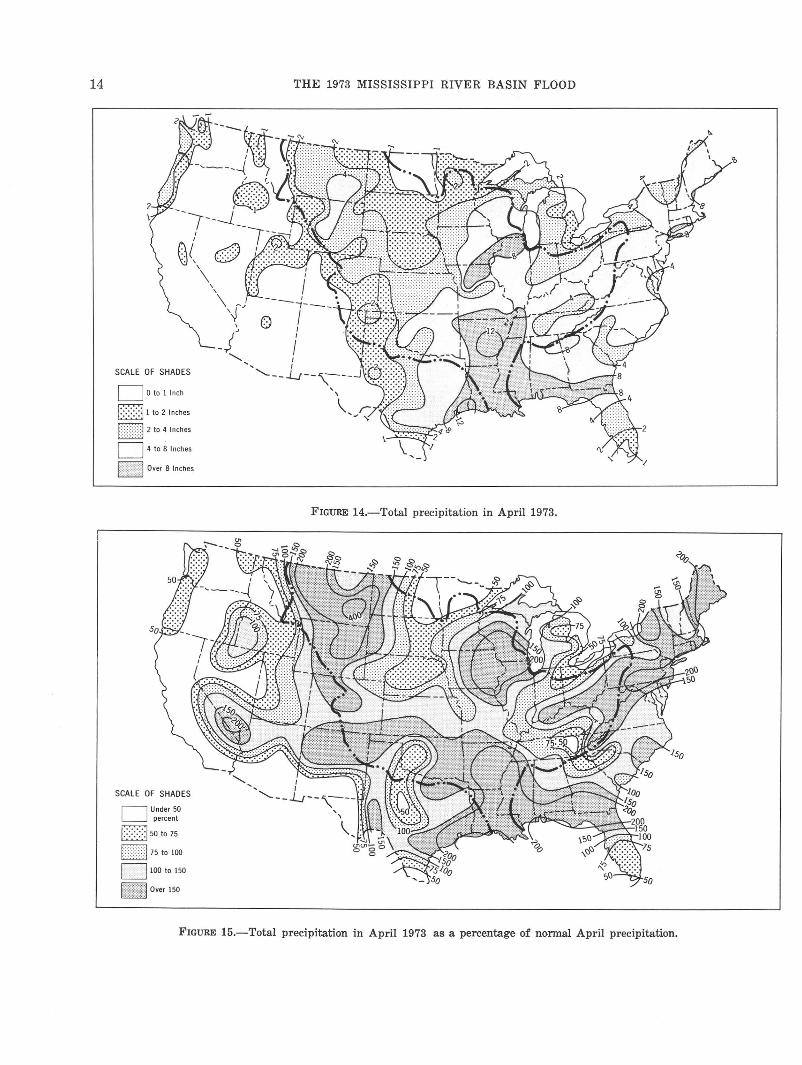
If March can be described as extremely wet over the whole basin, then April can be described as very wet over part of the basin (figures 14 and 15). Northwest Minnesota, the Dakotas, and Nebraska had well below normal precipitation. But parts of the Middle Mississippi Valley above Canton, Mo., the Lower Mississippi Valley below Memphis, Tenn., and the northern Great Plains had more than twice the normal precipitation. A snowstorm starting on April 19 dumped several feet of snow on Montana and Wyoming. Nearly 20 inches (508 mm) fell in sections of Iowa between April 8 to 10. Northeast Missouri, southeast Iowa, northern Illinois, Arkansas, Mississippi, and Louisiana all had more than 8 inches (203 mm) of rain in April. Much of this fell in the stormy week of April 16-22, setting the stage for the record-breaking flood crest to appear on the Mississippi River main stem.
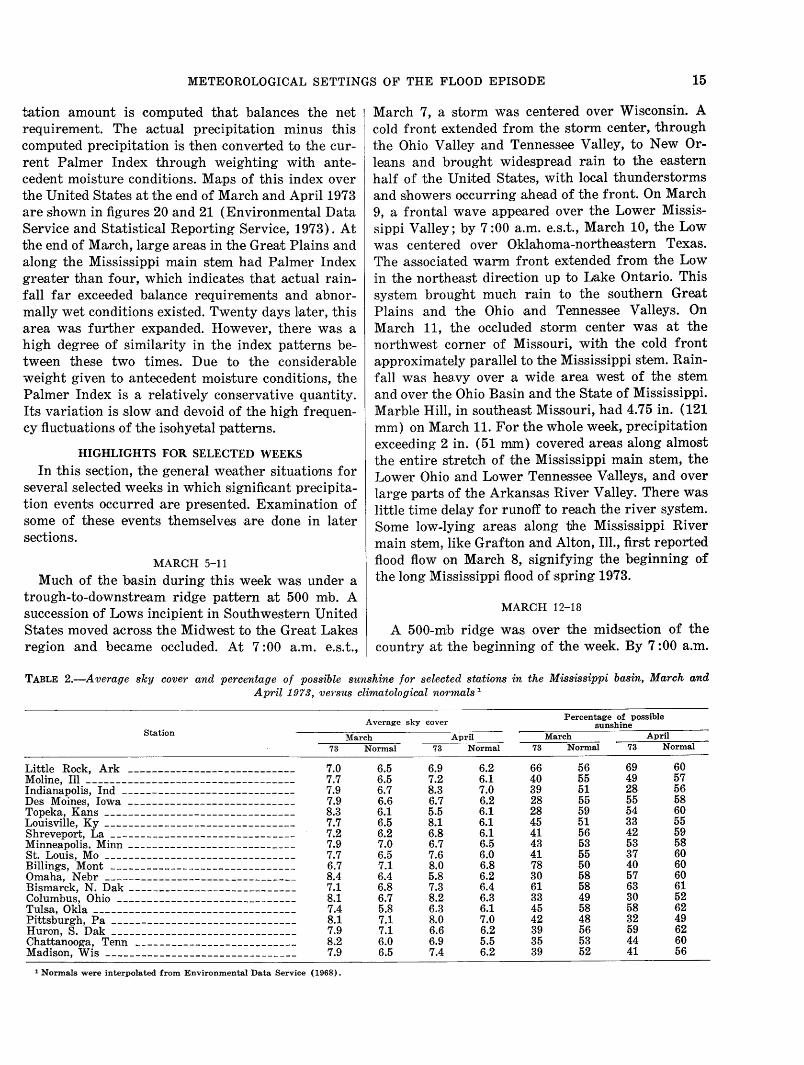
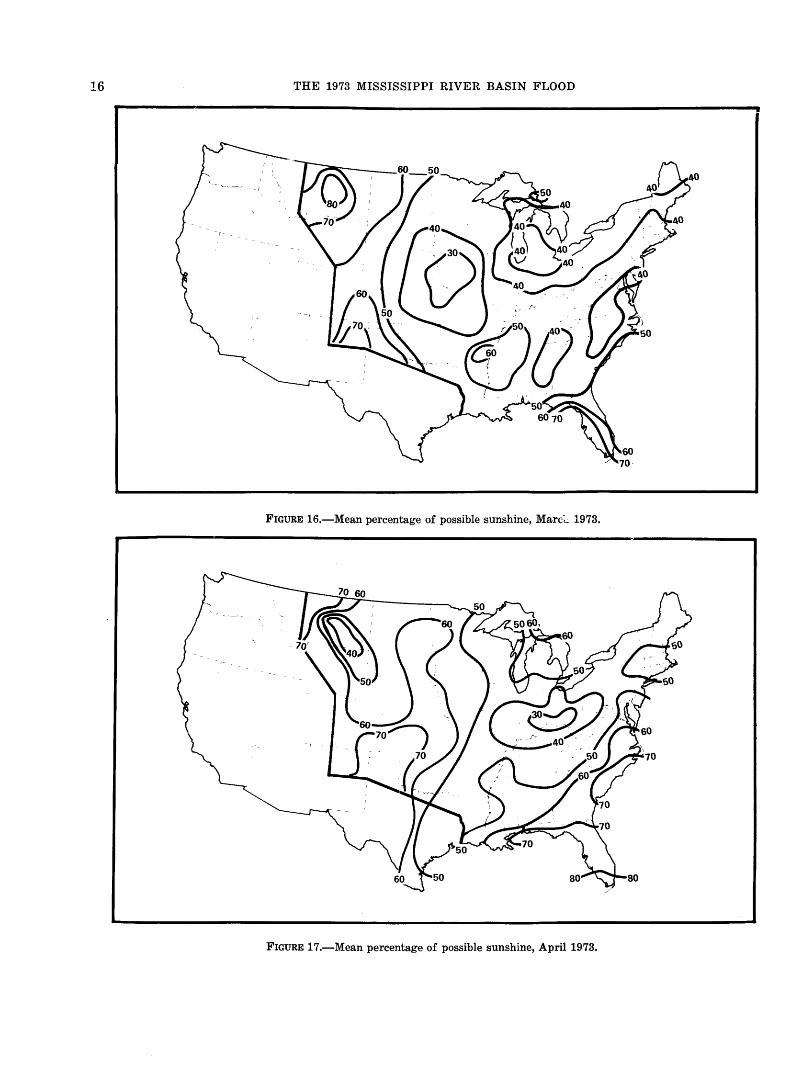
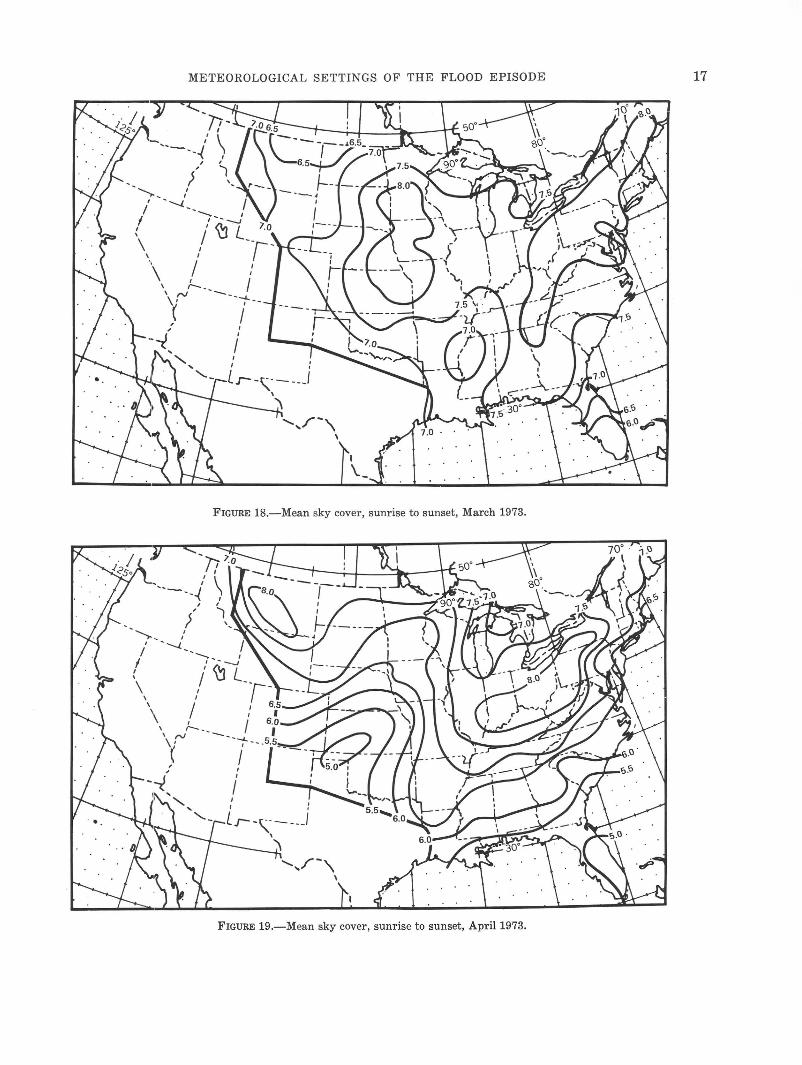
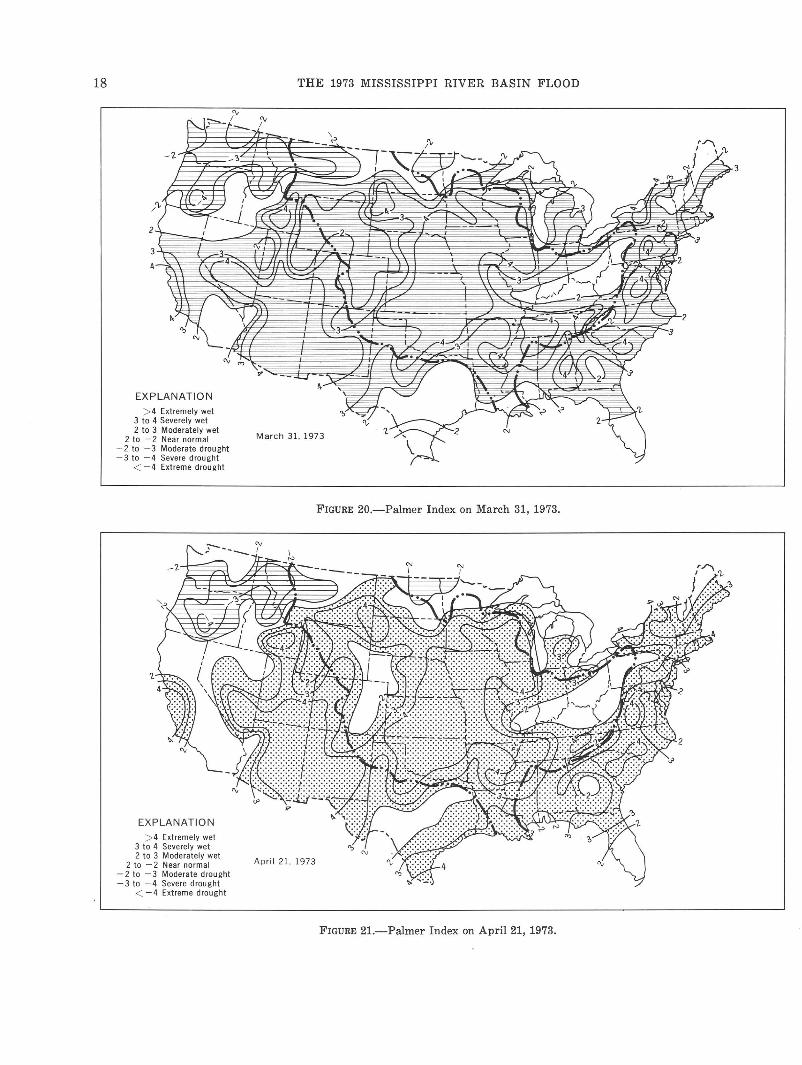
The average sky cover and the percentage of possible sunshine for March and April 1973 are shown in figures 16-19. It should be noted that these two parameters, though negatively correlated, do not follow a simple complementary r elationship. Comparisons with climatological normals for a sample of stations are shown in table 2. It is evident that for the Mississippi basin as a whole the average sky cover was larger and the mean percentage of possible sunshine was smaller than normal in the spring of 1973. For example, Des Moines, Iowa, had an average sky cover of 7.9 (6.7) in March (April) 1973, compared to a normal of 6.6 (6.2). Des Moines also had 'about half the normal percentage of possible sunshine in March 1973. This made that month the s·econd least sunny month of record in 75 yea.rs. Topeka, Kans., had less than half its normal hours of sunshine in March. The possible effect of these on the amount of water loss will be discussed in a later section.
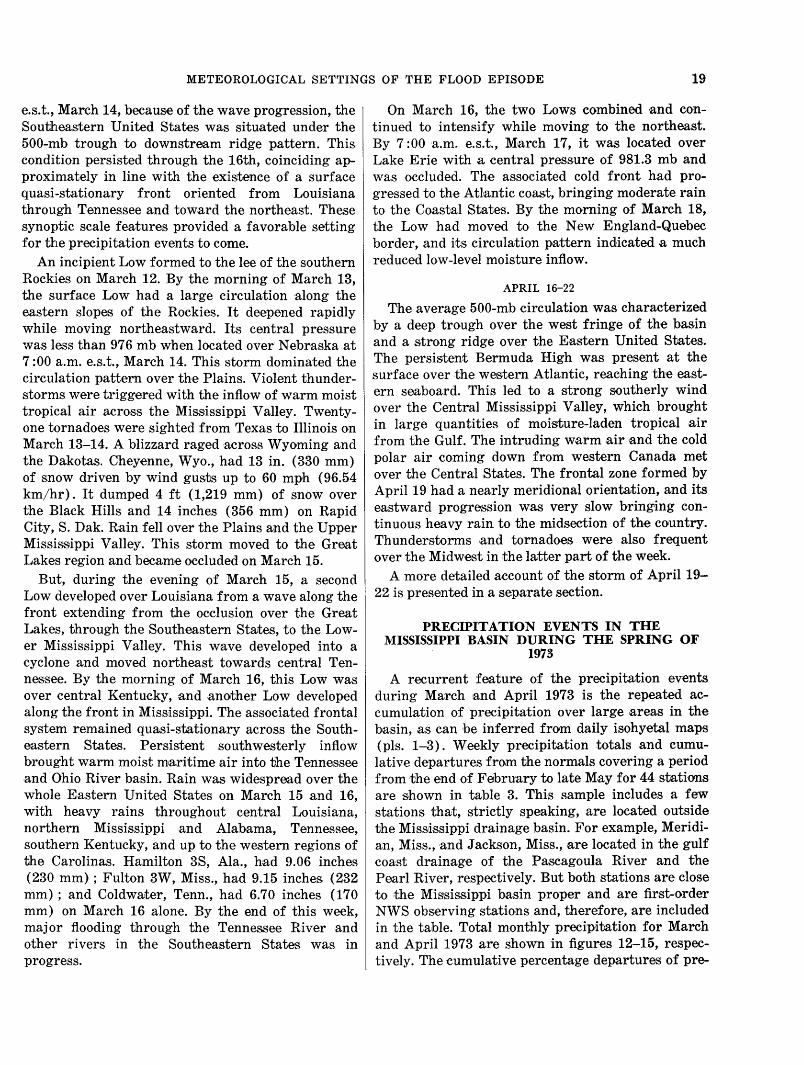
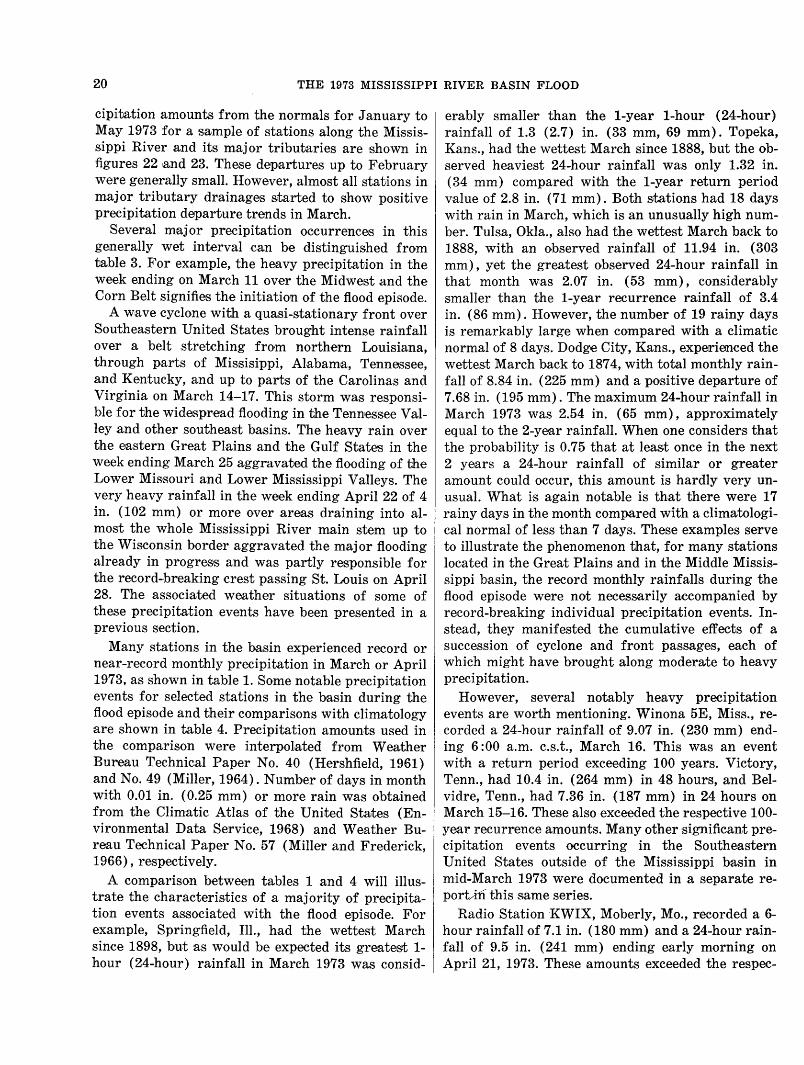
A climatological index that gives a measure of the degree to which the weather has been abnormally dry or wet is the Palmer Index, based on the water balance concept (Palmer, 1965). Basically, climatological analysis of the long record for a station is made to determine the roles of evapotranspiration, moisture gain, moisture loss, and runoff. Then, a precipi-
14
SCALE OF SHADES
O oto !Inch
~I to 2 Inches 1:::::::.::1 1: )) jz to 4 Inches
D 4 to S Inches
Over 8 Inches
SCALE OF SHADES
D Under 50 percent
I::::::;:;! 5o to 75
1/:) 175 to 100
Owo to 150
Over 150
THE 1973 MISSISSIPPI RIVER BASIN FLOOD
FIGURE 14.-Total precipitation in April 1973.
........ I ', I
'--lJ--'\--' '
"-
FIGURE 15.-Total precipitation in April 1973 as a percentage of normal April precipitation.
METEOROLOGICAL SETTINGS OF THE FLOOD EPISODE 15
tation amount is computed that balances the net requirement. The actual precipitation minus this computed precipitation is then converted to the current Palmer Index through weighting with antecedent moisture conditions. Maps of this index over the United States at the end of March and April1973 are shown in figures 20 and 21 (Environmental Data Service and Statistical Reporting Service, 1973). At the end of March, large areas in the Great Plains and along the Mississippi main stem had Palmer Index greater than four, which indicates that actual rainfall far exceeded balance requirements and abnormally wet conditions existed. Twenty days l~ater, this area was further expanded. However, there was a high degree of similarity in the index patterns between these two times. Due to the considerable weight given to antecedent moisture conditions, the Palmer Index is a relatively conservative quantity. Its variation is slow :and devoid of the high frequency fluctuations of the isohyetal patterns.
HIGHLIGHTS FOR SELECTED WEEKS
In this section, the general weather situations for s-everal selected weeks in which significant precipitation events occurred are presented. Examination of some of these events themselves are done in later sections.
MARCH 5-11
Much of the basin during this week was under a trough-to-downstream ridg.e pattern at 500 mb. A succession of Lows incipient in Southwestern United States moved acros·s the Midwest to the Great Lakes region ·and became occluded. At 7:00 a.m. e.s.t.,
March 7, a storm was centered over Wisconsin. A cold front extended from the storm center, through the Ohio VaHey and Tennessee Valley, to New Orleans and brought widespread rain to the eastern half of the United States, with local thunderstorms and showers occurring ahead of the front. On March 9, a frontal wave appeared over the Lower Mississippi Valley; by 7 :00 a.m. e.s.t., March 10, the Low was centered over Oklahoma-northeastern Texas. The associated warm front extended from the Low in the northeast direction up to Lake Ontario. This system brought much rain to the southern Great Plains and the Ohio and Tennessee Valleys. On March 11, the occluded storm center was at the northwest corner of Missouri, with the cold front approximately parallel to the Mississippi stem. Rainfall was heavy over a wide area west of the stem and over the Ohio Basin and the State of Mississippi. Marble Hill, in southeast Missouri, had 4.75 in. (121 mm) on March 11. For the whole week, precipitation exceeding 2 in. (51 mm) covered areas along almost the entire stretch of the Mississippi main stem, the Lower Ohio and Lower Tennessee V :alleys, and over large parts of the Arkansas River Valley. There was little time delay for runoff to reach the river system. Some low-lying areas along the Mississippi River main stem, like Grafton and Alton, Ill., first reported flood flow on March 8, signifying the beginning of the long Missis,sippi flood of spring 1973.
MARCH 12-18
A 500-mb ridge was over the midsection of the country at the beginning of the week. By 7:00 a.m.
TABLE 2.-A verage sky cover and percentage of possible sunshine for selected stations in the Mississippi basin, March and April1973, ve1·sus climatological normals 1
Average sky cover Percentage of uossible
sunshine-Station March April March April
73 Normal 73 Normal 73 Normal 73 Normal
Little Rock, Ark ---------------------------- 7.0 6.5 6.9 6.2 66 56 69 60 Moline, Ill ----------------------------------- 7.7 6.5 7.2 6.1 40 55 49 57 Indianapolis, Ind ----------------------------- 7.9 6.7 8.3 7.0 39 51 28 56 Des Moines, Iowa ---------------------------- 7.9 6.6 6.7 6.2 28 55 55 58 Topeka, Kans -------------------------------- 8.3 6.1 5.5 6.1 28 59 54 60 Louisville, Ky -------------------------------- 7.7 6.5 8.1 6.1 45 51 33 55 Shreveport, La ------------------------------- 7.2 6.2 6.8 6.1 41 56 42 59 Minneapolis, Minn ---------------------------- 7.9 7.0 6.7 6.5 43 53 53 58 St. Louis, Mo -------------------------------- 7.7 6.5 7.6 6.0 41 55 37 60 Billings, Mont ------------------------------- 6.7 7.1 8.0 6.8 78 50 40 60 Omaha, Nebr -------------------------------- 8.4 6.4 5.8 6.2 30 58 57 60 Bismarck, N. Dak ---------------------------- 7.1 6.8 7.3 6.4 61 58 63 61 Columbus, Ohio ------------------------------ 8.1 6.7 8.2 6.3 33 49 30 52 Tulsa, Okla ---------------------------------- 7.4 5.8 6.3 6.1 45 58 58 62 Pittsburgh, Pa ------------------------------- 8.1 7.1 8.0 7.0 42 48 32 49 Huron, s. Dak ------------------------------- 7.9 7.1 6.6 6.2 39 56 59 62 Chattanooga, Tenn --------------------------- 8.2 6.0 6.9 5.5 35 53 44 60 Madison, Wis -------------------------------- 7.9 6.5 7.4 6.2 39 52 41 56
1 Normals were interpolated from Environmental Data Service (1968).
16 THE 1973 MISSISSIPPI RIVER BASIN FLOOD
FIGURE 16.-Mean percentage of possible sunshine, Marc~~ 1973.
FIGURE 17.-Mean percentage of possible sunshine, April 1973.
I I
,
METEOROLOGICAL SETTINGS OF THE FLOOD EPISODE
I
' \ \
I I
.,\ ,' , t--_, I \ rJ ---..... \ I-
, I , ··~ ..
I I
I
\ \
\
'
\ rJ \• ( ,
' '~
, ,...__
FIGURE 18.-Mean sky cover, sunrise to sunset, March 1973.
FIGURE 19.-Mean sky cover, sunrise to sunset, April1973.
17
18
3
4
-2
EXPLANATION > 4 Extremely wet
3 to 4 Severely wet 2 to 3 Moderately wet
2 to -2 Near normal - 2 to -3 Moderate drought - 3 to - 4 Severe drought
< -4 Extreme drought
-2
EXPLANATION > 4 Extremely wet
3 to 4 Severely wet 2 to 3 Moderately wet
2 to -2 Near normal - 2 to -3 Moderate drought -3 to - 4 Severe drought
< -4 Extreme drought
THE 1973 MISSISSIPPI RIVER BASIN FLOOD
\ -- ~
--3 _ ,..
March 31 , 1973
FIGURE 20.- Palmer Index on March 31, 1973.
I _,.., -----
April 21, 1973
FIGURE 21.-Palmer Index on April 21, 1973.
3
2
3
METEOROLOGICAL SETTINGS OF THE FLOOD EPISODE 19
e.s.t., March 14, because of the wave progression, the Southeastern United States was situated under the 500-nlb trough to downstream ridge pattern. This condition persisted through the 16th, coinciding approximately in line with the existence of a surface quasi-stationary front oriented from Louisiana through Tennessee and toward the northeast. These synoptic scale features provided a favorable setting for the precipitation events to come.
An incipient Low formed to the lee of the southern Rockies on March 12. By the morning of March 13, the surface Low had a large circulation along the eastern slopes of the Rockies. It deepened rapidly while moving northeastward. Its central pressure was less than 976mb when located over Nebraska at 7 :00 a.m. e.s.t., March 14. This storm dominated the circulation pattern over the Plains. Violent thunderstorms were triggered with the inflow of warm moist tropical air across the Mis.s:issippi Valley. Twentyone tornadoes were sighted from Texas to Illinois on March 13-14. A blizzard raged across Wyoming and the Dakotas. Cheyenne, Wyo., had 13 in. (330 mm) of snow driven by wind gus,1Js up to 60 mph (96.54 km/hr). It dumped 4 ft (1,219 mm) of snow over the Black Hills and 14 inches (356 mm) on Rapid City, S.Dak. Rain fell over the Plains and the Upper Mississ:ippi Valley. This storm moved to th,e Great Lakes region and became occluded on March 15.
But, during the evening of March 15, a second Low developed over Louisiana from a wave along the front extending from the occlusion over the Great Lakes, through the Southeastern States, to the Lower Mississippi Valley. This w,ave developed into a cyclone and moved northeast towards central Tennessee. By the morning of March 16, this Low was over central Kentucky, :and another Low developed along the front in Mississippi. The associated frontal system remained quasi-stationary across the Southeastern States. Persistent southwesterly inflow brought warm moist maritime air into the Tennes~see and Ohio River basin. Rain was widespread over the whole Eastern United States on March 15 and 16, with heavy rains throughout central Louisiana, northern Mississippi and Alabama, Tennes,see, southern Kentucky, and up to the western regions of the Carolinas. Hamilton 3S, Ala., had 9.06 inches (230 mm) ; Fulton 3W, Miss., had 9.15 inches (232 mm) ; and Coldwater, Tenn., had 6.70 inches (170 mm) on March 16 alone. By the end of this week, major flooding through the Tennessee River and other rivers in the Southeastern States was in progress.
On March 16, the two Lows combined ,and continued to intensify while moving to the northeast. By 7:00 a.m. e.s.t., March 17, it was located over Lake Erie with a central pressure of 981.3 mb and was occluded. The associated cold front had progressed to the AUantic coast, bringing moderate rain to the Coastal States. By the morning of March 18, the Low had moved to the New England-Quebec border, and its circulation pattern indicated a much reduced low-level moisture inflow.
APRIL 16-22
The average 500-mb circulation was characterized by a deep trough over the west fringe of the basin and a strong ridge over the gastern United States. The persistent Bermuda High was present at the surface over the western Atlantic, reaching the eastern .seaboard. This led to a strong southerly wind over the Central Mississippi Valley, which brought in large quantities of moisture-laden tropical air from the Gulf. The intruding warm air ~and the cold polar air coming down from western Canada met over the Central States. The frontal zone formed by April 19 had a nearly meridional orientation, and its eastward progression was very slow bringing continuous heavy rain to the midsection of the country. Th unders,torms and tornadoes were also frequent over the Midwest in the latter part of the week.
A more detailed account of the storm of Aprill9-22 is presented in a separate section.
PRECIPITATION EVENTS IN THE MISSISSIPPI BASIN DURING THE SPRING OF
1973
A recurrent feature of the precipitation events during March and April 1973 is the repeated accumulation of precipitation over large areas in the basin, as can be inferred from daily isohY'etal maps (pis. 1-3). Weekly precipitation totals and cumulative departures from the normals covering a period from the end of February to late May for 44 stations are shown in table 3. This sample includes a few stations that, strictly speaking, are located outside the Mississippi drainage basin. For example, Meridian, Miss., and Jackson, Miss., are located in the gulf coast drainage of the Pascagoula River and the Pearl River, respectively. But both .stations are close to the Mississippi basin proper and are first-order NWS observing stations and, therefore, are included in the table. Total monthly precipitation for March and April 1973 are shown in figures 12-15, respectively. The cumulative percentage departures of pre-
20 THE 1973 MISSISSIPPI RIVER BASIN FLOOD
cipitation amounts from the normals for January to May 1973 for a s,a.mple of stations along the Mississippi River and its major tributaries are shown in figures 22 ~and 23. These departures up to February were generally small. However, almost all stations in major tributary drainages started to show positive precipitation departure trends in March.
Several major precipitation occurrences in this generally wet interval can be distinguished from table 3. For example, the heavy precipitation in the week ending on March 11 over the Midwest and the Corn Belt signifies the initiation of the flood episode.
A wave cyclone with a quasi-stationary front over Southeastern United States brought intense rainfall over a belt stretching from northern Louisiana, through parts of Mis.sisippi, Alabama, Tennessee, and Kentucky, and up to parts of the Carolinas and Virginia on March 14-17. This storm was responsible for the widespread flooding in the Tennessee Valley and other southeast basins. The heavy rain over the eastern Great Plains and the Gulf States in the week ending March 25 aggravated the flooding of the Lower Missouri and Lower Mississippi Valleys. The very heavy rainfall in the week ending April 22 of 4 in. (102 mm) or more over areas draining into almost the whole Mississippi River main stem up to the Wisconsin border aggravated the major flooding alre,ady in progres,s and was partly responsible for the record-breaking crest passing St. Louis on April 28. The associated weather situations of some of these precipitation events have been presented in a previous s·ection.
Many stations in the basin experienced record or near-record monthly precipitation in March or April 1973, as shown in table 1. Some notable precipitation events for selected stations in the basin during the flood episode and their comparisons with climatology are shown in table 4. Precipitation amounts used in the comparison were interpolated from Weather Bureau Technical Paper No. 40 (Hershfield, 1961) and No. 49 (Miller, 1964). Number of days in month with 0.01 in. (0.25 mm) or more rain was obtained from the Climatic Atlas of the United Sta,tes (Environmental Data Service, 1968) and Weather Bureau Technical Paper No. 57 (Miller and Frederick, 1966), respectively.
A comparison between tables 1 and 4 will illustrate the characteristics of a majority of precip·itation events associated with the flood episode. For example, Springfield, Ill., had the wettest March since 1898, but as would be expected its greatest 1-hour (24-hour) rainfall in March 1973 was consid-
erably smaller than the 1-year 1-hour (24-hour) rainfall of 1.3 (2.7) in. (33 mm, 69 mm). Topeka, Kans., had the wettest March since 1888, but the observed heaviest 24-hour rainfall was only 1.32 in. (34 mm) compared with the 1-year return period value of 2.8 in. (71 mm). Both stations had 18 days with rain in March, which is an unusually high number. Tulsa, Okla., also had the wettest March back to 1888, with an observed rainfall of 11.94 in. (303 mm), yet the greatest observed 24-hour rainfall in that month was 2.07 in. (53 mm), considerably smaller than the 1-year recurrenc·e rainfall of 3.4 in. (86 mm). However, the number of 19 rainy days is remarkably large when compared with a climatic normal of 8 days. Dodge City, Kans., experienced the wettest March back to 187 4, with total monthly rainfall of 8.84 in. (225 mm) and a positive departure of 7.68 in. (195 mm). The maximum 24-hour rainfall in March 1973 was 2.54 in. (65 mm), approximately equal to the 2-year rainfall. When one considers that the probability is 0.75 that at least once in the next 2 years a 24-hour rainfall of similar or greater amount could occur, this amount is hardly very unusual. What is again notable is that there were 17 rainy days in the month compared with a climatological normal of less than 7 days. These examples serve to illustrate the phenomenon that, for many stations located in the Great Plains and in the Middle Mississippi basin, the record monthly rainfalls during the flood episode were not necessarily accompanied by record-breaking individual precipitation events. Instead, they manifested the cumulative effects of a succession of cyclone and front passages, each of which might have brought along moderate to heavy preci pita tion.
However, several notably heavy precipitation events are worth mentioning. Winona 5E, Miss., recorded a 24-hour rainfall of 9.07 in. (230 mm) ending 6 :00 a.m. c.s.t., March 16. This was an event with a return period exceeding 100 years. Victory, Tenn., had 10.4 in. (264 mm) in 48 hours, and Belvidre, Tenn., had 7.36 in. (187 mm) in 24 hours on March 15-16. These also exceeded the respective 100-year recurrence amounts. Many other significant precipitation events occurring in the Southeastern United States outside of the Mississippi basin in mid-March 1973 were documented in a separate reportA11 this same series.
Radio Station KWIX, Moberly, Mo., recorded a 6-hour rainfall of 7.1 in. (180 mm) and a 24-hour rainfall of 9.5 in. (241 mm) ending early morning on April 21, 1973. These amounts exceeded the respec-
TABLE 3.-Weekly precipitation totals and cumulative departures from normal, in inches, February 26-May 20, .1973
March 4
Station ] 0
E-t
Fort Smith, Ark --------------- 2.1 Little Rock, Ark ------------- 1.6 Cairo, Ill --------------------- .5 Moline, Ill -------------------- .7 Peoria, Ill -------------------- .3 Evansville, Ind --------------- .6 Indianapolis, Ind -------------- .2 Burlington. Iowa -------------- .3 Des Moines, Iowa ------------- .1 Sioux City, Iowa -------------- .3 Dodge City, Kans ------------- .3 Goodland, Kans --------------- .4 Tol)eka, Kans ----------------- 1.6 Wichita, Kans ---------------- 2.2 Lexington, Ky ---------------- 1.1 Louisville, Ky ----------------- .9 New Orleans, La -------------- 2.0 Shreveport, La ---------------- .9 Minneapolis, Minn ------------ T Jackson. Miss ----------------- 1.1 Meridian, Miss ---------------- 1.4 Columbia, Mo ----------------- 1.2 Kansas City, Mo -------------- 1.3 St. Louis, Mo ----------------- .9 Billings, Mont ----------------- 0 Miles City, Mont -------------- 0 Grand Island, Nebr ----------- .4 Lincoln, Nebr ----------------- .6 Norfolk, Nebr ----------------- .2 N. Platte. Nebr --------------- .3 Omaha, Nebr ----------------- 2.2 Bismarck, N. Dak ------------ T Cincinnati, Ohio -------------- .9 Columbus, Ohio --------------- .9 Dayton, Ohio ----------------- .3 Oklahoma City, Okla ---------- .2 Tulsa, Okla ------------------- 3.3 Pittsburgh, Pa ---------------- .5 Sioux Falls, S. Dak ------------ T Chattanool!'ll.. Tenn ----------- 1.4 Memphis, Tenn --------------- 1.0 Nashville, Tenn --------------- 1.4 La Crosse, Wis --------------- .1 Madison, Wis ----------------- .3
QIQI >'"' .... :::J ........ <11'"' ,...,., a~ :::J.,
Q
1.2 .5
-.1 .3
-.1 -.1 -.4
0 -.2
0 .1 .2
1.3 1.9 .2
0 1.0
-.1 -.3 -.2
0 .7
1.0 .3
-0.2 -.1
.2
.3 0 .2
1.9 -.1
.3
.3 -.2 -.1
2.8 -.1 -.3
.1 -.1
.2 -.2
0
March 11
] ~
~4 ~7 2.6 ~3 2.3 2.2 1.2 2.2 1.0
.5 2.9
.1 ~4 &5 .5
1.1 3.1 .9 .5
1.1 2.8 3.6 1.5 ~4 ~1 T 1.3 1.2 1.1 .1
1.2 .2
1.0 .3
1.3 2.8 3.2
.5 1.3 L2 2.3 2.4 2.8 3.6
QIQI >'"' ~B <11'"' ..... ., :::Jj:l, s Ql :::J.,
Q
2.8 2.2 1.6 2.2 1.7 1.3
.2 1.7 .4 .2
2.8 .1
3.3 5.1
-.3 .1
3.1 0
-.1 -.3
1.4 3.9 2.1 2.2
-0.3 -.2
1.3 1.1
.8 .1
2.8 0
.6 0 .5
2.4 5.6
-.3 .7
2.1 1.2 1.5 2.2 3.2
March 18
] 0
E-t
QIQI >'"' ~.B <11'"' _., :::Jj:l, sv :::J.,
Q
0.8 2.8 1.8 3.0 1.1 1.6
.7 2.4 1.4 2.5 1.8 2.2 1.0 .5
.5 1.6
.7 .7 1.3 1.2
.4 2.9
.3 .2
.7 3.6
.2 5.0 1.8 .4 2.1 1.1 .5 2.3
1.1 .2 .4 0 .6 -1.0
2.7 2.6 1.1 4.5 1.3 2.9
.7 2.3 0.3 -0.2 T -.3
.4 1.4
.6 1.3
.8 1.3 .8 .7 .5 3.0 .4 .3
1.7 1.4 1.6 .9 1.6 1.5
.2 2.2
.3 5.4 2.5 1.5 1.1 1.5 7.5 8.3 2.2 2.3 4.0 4.3 1.9 3.7
.9 3.7
March 25
] 0
E-t
2.8 1.8 1.1 .8 .9
1.2 1.1 1.0 1.0 1.7 2.6
.8 2.7 2.0 1.2 1.5 5.5 2.3
.2 2.7 3.0 2.2 3.1 .7
1.0 .1
2.0 .2
2.0 .6
1.9 T 1.5
.4
.8 3.0 3.2
.2
.8
.6 1.0 1.7 T T
QIQI >'"' ~.B Qll'< ..... ., a~ :::J.,
Q
4.8 3.7 1.5 2.6 2.7 2.3
.8 1.9 1.2 2.6 5.2
.7 5.8 6.6
.5 1.5 6.5 1.5
-.2 .4
4.2 6.0 5.4 2.2 0.5
-.3 3.1 1.1 2.9 1.1 4.6
.1 1.9
.5 1.5 4.7 8.0 1.0 1.9 7.6 2.1 4.8 3.1 3.8
April 1
~ E-t
0.3 .6
1.1 2.3 2.4 1.2 1.3 2.0 1.6
.4 2.7 1.3 1.7 1.6 .6 .8
1.1 T
.2
.6 4.4 2.0 1.9
.9 0.2
T 1.4 2.0 1.2
.7 1.6 T 1.0 1.1
.8
.6 2.7
.7
.3 1.1 1.1
.4
.5 1.2
QIQI >'"' .... :::J ........ ~:; a~ :::J.,
Q
4.3 3.2 1.4 4.3 4.4 2.4 1.2 3.2 2.3 2.6 7.6 1.7 7.0 7.7 0 1.3 6.3
.5 -.4 -.2
7.2 7.3 6.6 2.3 0.4
-.5 4.1 2.7 3.7 1.5 5.8
-.1 1.8
.8 1.5 4.8
10.0 .9
1.8 7.4 2.0 4.0 3.1 4.0
For week ending: April 8 April 15
] 0
E-t
1.7 1.1 1.0 .7 .2 .9 .4 .7
1.3 .1 .2 .4 .2 .4
1.9 1.8 3.2 1.5
.2 1.7 2.3
.7 .2
1.7 0.4 T
.2
.3
.1
.2
.3 .2
1.4 1.0 1.0
.8 1.1 1.2 T 1.1
.5 1.3 1.3
.7
QIQI >'"' .... :::J .... .... <11'"' ..... ., ~~
Q
5.2 3.1 1.3 4.3 3.8 2.3 .7
3.1 1.7 2.3 7.5 1.8 6.6 7.6 .8
2.1 8.4
.9 -.6
.3 8.1 7.3 6.0 2.1 0.5
-.7 3.9 2.5 3.3 1.3 5.6
-.1 2.3 1.0 1.7 5.0
10.3 1.3 1.4 7.3 1.3 4.2 3.8 4.2
] 0
E-t
1.9 1.2 .3
2.2 1.0
.1
.4 1.4 1.9
.2
.4 T 2.2 .6 .2 .2
T 1.5
.8
.2
.1 1.8 1.6 1.3 0.2 T
.3 1.0
.2
.1 1.4 T
.4
.8
.5
.8 2.5
.3
.6 T
.6
.2 3.0 1.3
QIQI >'"' .... :::J .... .... CIS'"' .-.CIS
a~ :::J.,
Q
6.2 3.1 .6
5.8 3.9 1.4
.3 3.7 3.0 2.0 7.5 1.4 8.1 7.6 0 1.4 7.3 1.3
-.2 -.6
6.9 8.4 6.8 2.5 0.4
-.9 3.7 3.0 3.0 1.0 6.4
-.3 1.9 1.0 1.4 5.1
11.9 .9
1.5 6.2
.7 3.5 6.2 4.9
April 22 April 29
] 0
E-t
2.7 7.3 4.7 7.4 2.3 4.0 1.7 4.2
.8
.1
.9
.2 .5
1.1 .9
1.4 7.0 .5 .4
5.8 3.6 1.1 .5
2.3 1.2 3.7 .7 .9 .4 .5 .3 .4
2.2 .6 .9 .7
2.2 .2 .3 .6
5.4 2.5 1.0 2.7
~2! ~.a CIS'"' ..... ., :::Jj:l, ..... s Ql ~ :::J., 0 0 E-t
7.9 9.2 4.3
12.5 5.3 4.5 1.1 7.1 3.2 1.6 8.0 1.2 7.8 8.1
-.1 1.9
13.2 .7
-.2 4.1 9.2 8,7 6.5 3.9 1.3 2.5 3.5 3.3 2.9 1.0 6.1
-.2 3.3
.8 1.6 5.0
13.1 .4
1.2 5.8 5.0 5.2 6.5 7.0
0.6 4.7
.9 .1 .3 .4 .2 .2
T ,5
1.6 1.1 T
.5 2.6 2.1 .3
3.9 -.2
1.7 3.0 T T T 0.5
.5 .4 .2 .7 .6 .3 .2
1.7 1.3
.9 T 1.4 2.5
.2 3.4 2.9 2.9 1.5 .6
~j Qll'< _., :::Jp, sv :::J.,
Q
7.4 12.8
4.3 11.9
4.6 4.0
.4 6.5 2.6 1.5 9.1 1.9 6.8 8.0 1.6 3.1
12.4 3.5
-.5 4.8
11.0 7.9 5.6 3.0 1.5 2.7 3.3 2.9 3.1 1.1 5.8
-.3 4.2 1.3 1.7 4.2
13.5 2.2
.8 8.3 6.9 7.2 7.4 6.9
May 6
] 0
E-t
1.8 2.0 2.7 3.1
.8 1.2
.2 2.0 2.4 .9 .1
1.6 2.8 1.6 .8 .4 .2 .2
1.7 1.2
.7 1.4 3.4
.4 0.8
.4 .6
1.1 .4 .4
1.0 T .2 .1 .5 .5
2.9 .3
1.2 .2
2.3 1.1 2.2 2.4
QIQI >'"' :p.B Ill'"' ..... ., :::J~ sv :::J.,
Q
L1 1L6
6.1 1~2 ~4 ~3 ~a ~6 4.4 1.8 L6 LO L7 L9 1.6 2.6
11.6 2.7
.7 5.0 1~6
L4 8.1 2.5 2.0 ~8 L2 L3 2.9
.9 ~1 -~ 3.5
.5 1.4 L8
1L4 1.8 1.4 7.6 L2 ~4 L9 8.6
May 13
] 0
E-t
0.2 .4
2.1 1.1 1.5 1.9
.8
.8 1.1 .3 .3 .2
1.4 .1
1.6 1.8 2.0 1.1
.3 2.0 3.0
.6 1.1 2.6 T
.1 .2
1.4 .2
T 2.5
.1 .8 .4
1.2 T T 1.5 T 1.0 1.8 .8
1.2 1.5
QIQI >'"' .... :::J ........ cO'"' .-.CIS
a~ :::J.,
Q
7.1 12.7
7.3 14.4
5.0 5.3
-.4 7.5 4.7 1.4 8.2 2.7 9.1 8.1 2.4 3.5
12.6 2.7
.4 6.0
12.7 8.0 8.3 4.3 1.6 2.6 2.6 4.0 2.4
.3 7.8
-.9 3.4 0 1.8 2.7
14.2 2.5
.7 7.8 9.0 7.4 9.3 9.4
May 20
~ E-t
T 0.3 .1
T T T T 0 0 T 0 T 0 T .8 .1 .4
0 T .1 .1
T T T 0.1 T 0 .1
T T T T .8 .7 .8
0 0
.7 T 1.3 T .2
T .4
QIQI >'"' .... :::J ........ Ill'"' ..... ., :::lj:l, av :::J.,
Q
5.9 11.8
6.4 13.5
4.0 4.4
-.1.3 6.6 3.8 .7
7.5 2.2 8.1 7.2 2.3 2.7
12.0 1.6
-.3 5.2
11.9 7.0 7.3 3.5 1.3 2.2 1.7 3.3 1.6
-.4 7.0
-1.3 3.4
-.2 1.8 1.5
13.0 2.3
-.1 8.3 8.0 6.8 8.5 9.1
"'tt ~ t%.1 0 1-4 1-d 1-4
t-3 > t-3 1-4
0 z t%.1 < t%.1 z t-3 00 1-4
z t-3 ::t: t%.1
~ 1-4 00 00 1-4 00 00 1-4
1-d "'tt 1-4
t:d > 00 1-4 z '=' q ~ z c;':l
t-3 ::t: t%.1
00 1-d ~ 1-4
z c;':l
0 ~
...... co -::J C/o:)
~ ~
22
1-z w () a:: w a.. z u,j a:: ::::> 1-a:: <( a.. w 0
w > ~ <( _J
::::> ~ ::::> ()
THE 1973 MISSISSIPPI RIVER BASIN FLOOD
70or-------------------------------------------------------------
500
400
300
200
100
0
-100
-200
-100
-200
1. Minneapolis, Minn. 2. La Crosse, Wis. 3. Moline, Ill.
Jan
A
1. Port Gibson, Miss. 2. New Orleans, La.
c I
Feb March April May
1. St. Louis, Mo. 2. Cairo, Ill. 3. Memphis, Tenn.
B
1. Bismark, N. Dak. 2. Sioux Falls, S. Dak. 3. Sioux City, Iowa 4. Omaha, Neb. 5. Kansas City, Mo.
D
Jan Feb March April May
FIGURE 22.-Cumulative percentage departures of precipitation amounts from station normals, January to May 1973.
PRECIPITATION EVENTS IN THE MISSISSIPPI BASIN DURING THE SPRING OF 1973 23
1. Dodge City, Kans. 1. Des Moines, Iowa 700 2. Tulsa, Okla. 2. Burlington, Iowa
3. Little Rock, Ark.
600
500
400
300
I- 200 z LLJ () 0:::
100 LLJ Q..
z LLJ 0 0::: :::::> E I- F 0::: <( -100 Q.. LLJ 0
LLJ > 500 t= <(
1. Pittsburgh, Pa. _I
:::::> ~ 400 2. Cincinnati, Ohio :::::> 3. Evansville, Ind. ()
1. Chattanoga, Tenn. 2. Nashville, Tenn. 3. Lexington, Ky.
300
200
100
0
-100
G H
-200 Jan Feb March April May Jan Feb March April May
FIGURE 23.-Cumulative p.ercentages departures of precipitation amounts from station normals, January to May 1973.
tive 100-year values and were significant. The corresponding 24-hour probable maximum precipitation for Moberly, Mo., is 20.1 in. (511 mm) (Riedel and others, 1956). The observed precipitation reached 47
percent of the probable maximum precipitation. The maximum 1-hour rain at radio Station KWIX,
Moberly, Mo., on April 21 was about equal to the 1-year recurrence value (table 4) despite the very sig-
24 THE 1973 MISSISSIPPI RIVER BASIN FLOOD
TABLE 4.-A sample of precipitation events in the Mississippi basin in March and April 1973
Station
Eudora ---------------Little Rock -----------St. Charles ------------
Moline -----------------
Springfield -------------
Keosauqua -------------
Cimarron -------------Dodge City ------------Topeka ----------------
Hickman IE ----------Paducah Sewage Plant__
Latitude North
33°07' 34°44' 34°23'
41 °27'
39°50'
40°44'
37°48' 37°46' 39°04'
36°34' 37°06'
Morgan City ----------- 29°41'
Fort Adams ------------
Grenada Dam ---------Jackson --------------Winona 5E ------------
Columbia -------------Madison --------------Moberly Radio KWIX __
Grand Island ---------
Poteau -----------------Tulsa ------------------Wichita MT WL REF __
Sioux Falls ------------
Belvidere ---------------
Chattanooga ----------Knoxville -------------Victory ----------------
Clinton 2N -----------Madison --------------Milwaukee -------------
31 °05'
33°48' 32°19' 33°29'
38°49' 39°28' 39°24'
40°58'
35°04' 36°11' 34°44'
35°08'
35°02' 35°49' 35°06'
42°37' 43°08' 42°57'
Longitude West
91 °16' 92°14' 91 °08'
90°31'
89°40'
91 °58'
100°21' 99°58' 95°38'
89°10' 88°36'
91 °11'
91 °33'
89°46' 90°05' 89°38'
92°13' 92°13' 92°26'
98°19'
94°38' 95°54' 98°43'
96°44'
86°11'
85°12' 83°59' 87°51'
88°52' 89°20' 87°54'
Elevation (ft)
135 257 200
582
588
625
2,625 2,582
877
375 325
5
70
283 330 390
887 974 850
1,841
572 668
1,665
1,418
985
665 980 830
920 858 672
Duration (hr)
24 1
24
1 24
1 24
24
24 24 24
24 1
24
1 24
1 24 24 24 24
24 24 1 6
24 24
24
24 24 24
24
1 24 24 24 24 48
24 24 24
Observed rainfall Amount (in.) for specified return
Time of ending Amount period (yr.) 1 (CST) (in.) -1===-1---.:0~~1-0_0_
Arkansas
8:00a.m. 11:00 p.m. 8:00a.m.
Illinois
7:00p.m. 7:00p.m. 8:00p.m. 3:00a.m.
Iowa
6:00p.m.
Kansas
7:00a.m. 12:00 p.m. 1:00 p.m.
Kentucky
5:00p.m. 3:00p.m.
12M.
Louisiana
8:00p.m. 12:00 p.m.
Mississippi
10:00 a.m. 6:00p.m. 8:00a.m. 3:00p.m. 6:00a.m.
Missouri
11:00 p.m. 7:00a.m. 2:00a.m. 2:00a.m. 5:00a.m.
12:00 p.m.
Nebraska
8:00a.m.
Oklahoma
6:00p.m. 10:00 p.m.
9:00p.m.
South Dakota
4:00p.m.
Tennessee
1:00 a.m. 11:00 a.m.
3:00p.m. 6:00p.m. 1:00 p.m. 3:00p.m.
Wisconsin
6:00p.m. 4:00a.m.
10:00 P.m.
Mar. 16 Apr. 22 Apr. 20
Apr. 21 Apr. 21 Mar. 10 Mar. 7
Apr. 21
Mar. 24 Mar. 10 Mar. 4
Apr. 19 Apr. 19 Apr. 20
APr. 17 Apr. 17
Apr. 16 Mar. 24 Mar. 16 APr. 16 Mar. 16
Mar. 10 Apr. 21 APr. 21 Aor. 21 Aor. 21 Apr. 22
Mar. 24
APr. 23 Mar. 24 Mar. 30
Mar. 14
Mar. 16 Mar. 16 Mar. 16 Mar. 16 Mar. 15 Mar. 16
Apr. 21 Mar. 7 APr. 21
5.89 1.53 9.18
1.38 5.81 .48
1.82
4.20
3.10 2.54 1.32
5.22 1.6 3.5
3.1 8.5
2.55 6.63 7.38 4.98 9.07
1.79 9.00 1.5 7.1 9.5
11.7
1.31
4.95 2.07 3.55
1.08
1.35 7.36 6.53 4.85 6.48
10.40
4.39 2.52 3.04
3.6 1.6 3.5
1.3 2.7 1.3 2.7
2.8
1.9 2.1 2.8
3.2 1.3 3.1
2.2 4.4
1.9 4.2 3.6 3.8 3.7
2.9 2.9 1.4 2.1 2.9
2.0
3.4 3.4 2.8
2.1
6.2 2.6 6.0
2.2 4.8 2.2 4.7
4.8
4.0 4.1 5.2
5.1 2.2 4.9
8.7 3.7 8.3
3.1 6.6 3.I 6.5
6.8
3.9 6.0 7.6
6.9 3.1 6.8
3.4 4.4 8.9 13.2
3.1 4.1 7.9 11.0 6.2 8.5 6.8 9.6 6.2 8.5
5.1 7.3 5.0 7.2 2.4 3.4 3.7 5.4 5.1 7.2 9.2 13.0
4.0
6.4 6.1 5.6
4.0
6.0
9.3 8.9 8.5
5.9
1.37 2.3 3.2 7.1 7.1 6.9 7.3 8.9
3.2 5.2 3.2 5.2 2.9 5.0 3.3 5.4
2.4 2.4 2.3
6.3
3.9 4.0 3.8
5.6 5.9 5.5
Number of days in month with rain
::=:o.o1 inch ::=:o.5 inch Ob- Nor- Ob- Nor
served mal 2 served mal3
11 17
9
15
18
12
13 17 18
15 12
7
10 16 16 10 11
17 9
11
17
14 19
6
12
16
16 16 18
14 13 17
10.4 10.2
9.7
11.0
12.0
10.5
6.5 6.5 8.2
12.0 12.1
7.0
8.5 10.0 11.0
9.0 11.0
11.0 11.1 11.0
7.2
9.9 8.0 6.0
8.2
8 8 6
5
6
7
5 4 9
7 6
3
5 6 8 4 9
7 5 4
4
5 7 3
2
13.2 5
13.6 6 13.0 4 12.5 10
11.9 11.1 11.2
I) 3 3
4.5 4.2 4.1
2.5
2.3
2.6
0.8 .8
1.6
3.4 3.2
3.4
4.1 4.3 4.8 4.0 4.8
2.3 2.7 2.8
0.8
4.0 2.1 1.1
0.8
4.7
4.9 5.2 4.4
1.9 1.3 1.2
1 Interpolated from Environmental Data Service and Statistical Reporting Service (1973) for durations up to 24 hours and from Mason (1952) for durations exceeding 24 hours.
2 Interpolated from Environmental Data Service ( 1968) . 3 Interpolated from Miller (1964).
nificant 6- and 24-hour observed rainfall. The ·accompanying weather situation was a cas-e of thunderstorms imbedded within a quasistationary squall line, which in turn was associated with the cyclone seale weather system. These thunderstorms, fed by
the convergent inflow of moist air, regenerated and mainta;ined a precipitation rate exceeding 1 in./hr (inch per hour) for 5 hours within a 6-hour period ending 2 a.m., April 21.
Dimensionless temporal patterns of four ·storms
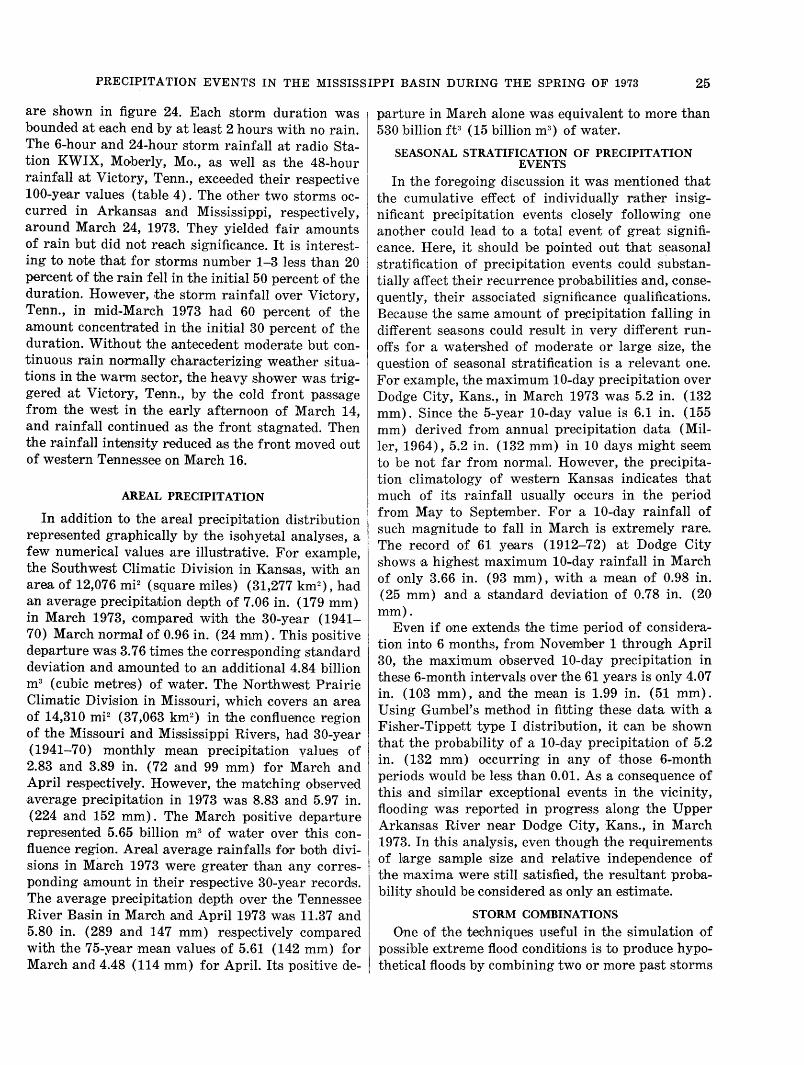
PRECIPITATION EVENTS IN THE MISSISSIPPI BASIN DURING THE SPRING OF 1973 25
are shown in figure 24. Each storm duration was bounded at each end by at least 2 hours with no rain. The 6-hour and 24-hour storm rainfall at radio Station KWIX, Moberly, Mo., as well as the 48-hour rainfall at Victory, Tenn., exceeded their respective 100-year values (table 4). The other two storms occurred in Arkansas and Mississippi, respectively, around March 24, 1973. They yielded fair amounts of rain but did not reach significance. It is interesting to note that for storms number 1-3 less than 20 percent of the rain fell in the initial 50 percent of the duration. However, the storm rainfall over Victory, Tenn., in mid-March 1973 had 60 percent of the amount concentrated in the initial 30 percent of the duration. Without the antecedent moderate but continuous rain normally characterizing weather situations in the warm sector, the heavy shower was triggered at Victory, Tenn., by the cold front pas,sage from the west in the early afternoon of March 14, and rainfall continued as the front stagnated. Then the rainfall intensity reduced as the front moved out of western Tennessee on March 16.
AREAL PRECIPITATION
In addition to the areal precipitation distribution represented graphically by the isohyetal analyses, a few numerical values are illustrative. For example, the Southw·est Climatic Division in Kansas, with an area of 12,076 mi2 (square miles) (31,277 km2 ), had an average precipita,tion depth of 7.06 in. (179 mm) in March 1973, compared with the 30-year (1941-70) March normal of 0.96 in. (24 mm). This positive departure was 3. 76 times the corresponding standard deviation and amounted to an additional 4.84 billion m3 (cubic metres) of water. The Northwest Prairie Climatic Division in Missouri, which covers an area of 14,310 mi2 (37,063 km2
) in the confluence region of the Missouri and Mississippi Rivers, had 30-year (1941-70) monthly mean precipitation values of 2.83 and 3.89 in. (72 and 99 mm) for March and April respectively. However, the matching observed ·average precipitation in 1973 was 8.83 and 5.97 in. (224 and 152 mm). The March positive departure represented 5.65 billion m3 of water over this confluenc·e region. Areal average rainfalls for both divisions in March 1973 were greater than any corresponding amount in their respective 30-year records. The average precipitation depth over the Tennessee River Basin in March and April 1973 wa1s 11.37 and 5.80 in. (289 and 147 mm) respectively co.mpared with the 75-year ·mean values of 5.61 (142 mm) for March and 4.48 (114 mm) for April. Its positive de-
parture in March alone was equivalent to more than 530 billion ft 3 (15 billion m3
) of water.
SEASONAL STRATIFICATION OF PRECIPITATION EVENTS
In the foregoing discussion it was mentioned that the cumulative effect of individually rather insignificant precipitation events closely following one another could lead to a total event of great significance. Here, it should be pointed out that seasonal stratification of precipitation events could substantially affect their recurrence probabilities and, consequently, their associated significance qualifications. Beeause the same amount of pr~ipitation falling in different seasons could result in very different runoffs for a watershed of moderate or large size, the question of seasonal stratification is a relevant one. For example, the maximum 10-day precipitation over Dodge City, Kans., in March 1973 was 5.2 in. (132 mm). Since the 5-year 10-day value is 6.1 in. (155 mm) derived from annual precipitation data (Miller, 1964), 5.2 in. (132 mm) in 10 days might seem to be not far from normal. However, the precipitation climatology of western Kansas indicates that much of its rainfall usually occurs in the period from May to September. For a 1 0-day rainfall of such magnitude to fall in March is extremely rare. The record of 61 years (1912-72) at Dodge City shows a highest maximum 10-day rainfall in March of only 3.66 in. (93 mm), with a mean of 0.98 in. (25 mm) and a standard deviation of 0.78 in. (20 mm).
Even if one extends the time period of consideration into 6 months, from November 1 through April 30, the maximum observed 10-day precipitation in these 6-month intervals over the 61 years is only 4.07 in. (103 mm), and the mean is 1.99 in. (51 mm). Using Gumbel's method in fitting these data with a Fisher-Tippett type I distribution, it can be shown that the probability of a 10-day precipitation of 5.2 in. (132 mm) occurring in any of those 6-month periods would be less than 0.01. As a consequence of this and similar exceptional events in the vicinity, flooding was reported in progress along the Upper Arkansas R.iver near Dodge City, ·Kans., in March 1973. In this analysis, even though the requirements of l1arge sample size and relative independence of the maxima were still satisfied, the resultant probability should be considered as only an estimate.
STORM COMBINATIONS
One of the techniques us,eful in the simulation of possible extreme flood conditions is to produce hypothetical floods by combining two or more past storms
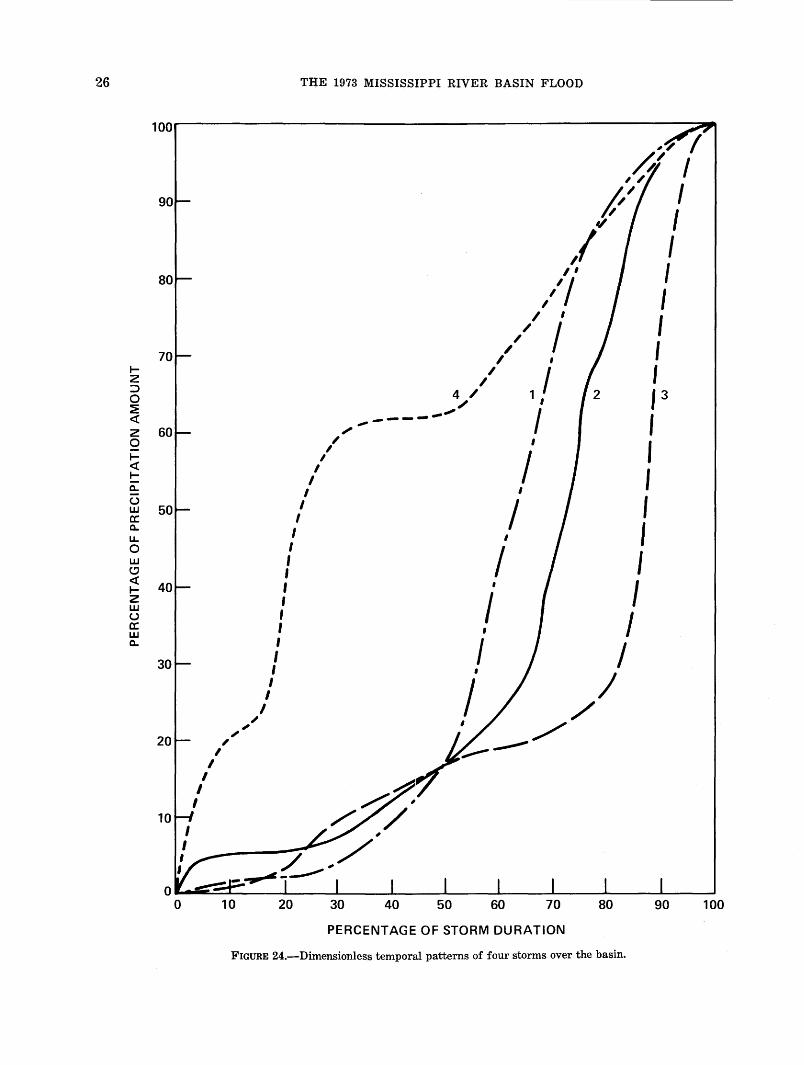
26 THE 1973 MISSISSIPPI RIVER BASIN FLOOD
100 ,"7 I
/4" I ,/
90 f/ I I 1/
,( I 80
I I I ,/I I I I I ,,' I
70 I I I 1- I
, I I 2 I ::::> 4 ., I 3 0
::E / I
<( ,. _____ .,
I I 2 60 ~
0 / I
I , 1- I I <( I
I 1- I a.. I I (.) I I I w 50 cr: I a.. I I u. I 0 I
I w I I (!) I <( 40 I ' I 1-
I 2 I w (.) I I cr: I ' w a.. I I I 30 I
I ' I I I I I / ~
~ / 20 ~ ,
~ _.,.,--I I
I I
I 10
100
PERCENTAGE OF STORM DURATION
FIGURE 24.-Dimensionless temporal patterns of four storms over the basin.
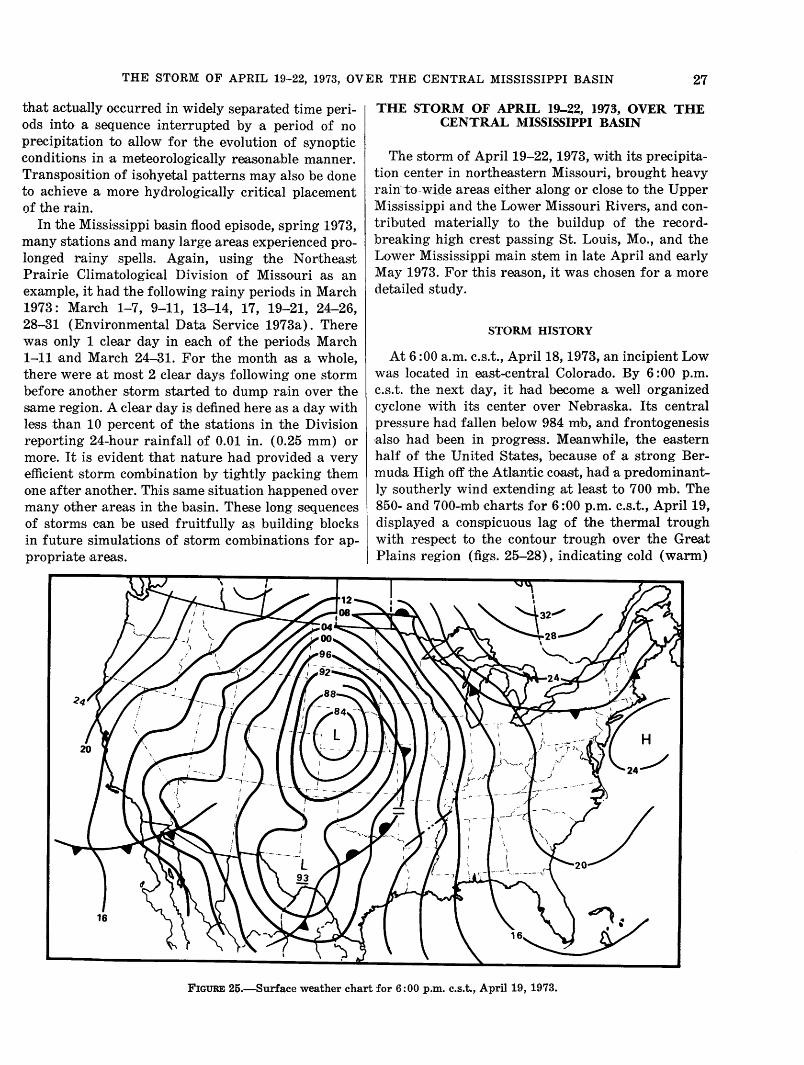
THE STORM OF APRIL 19-22, 1973, OVER THE CENTRAL MISSISSIPPI BASIN 27
that actually occurred in widely separated time periods into a sequence interrupted by a period of no precipitation to allow for the evolution of synoptic conditions in a meteorologically reasonable manner. Transposition of isohyetal patterns may also be done to achieve a more hydrologically critical placement of the rain.
In the Mississippi basin flood episode, spring 1973, many stations and many large areas exp·erienced prolonged rainy spells. Again, using the Northeast Prairie Climatological Division of Missouri as an example, it had the following rainy periods in March 1973: March 1-7, 9-11, 13-14, 17, 19-21, 24-26, 28-31 (Environmental Data Service 1973a). There was only 1 clear day in each of the periods March 1-11 and March 24-31. For the month a:s a whole, there were at most 2 clear days following one storm before another storm started to dump ra;in over the same region. A clear day is defined here as a day with less than 10 percent of the stations in the Division reporting 24-hour rainfall of 0.01 in. (0.25 mm) or more. It is evident that nature had provided a very efficient storm combination by tightly packing them one after another. This same situation happened over many other areas in the basin. These long sequences of storms c~an be used fruitfully as building blocks in future simulations of storm combinations for appropriate areas.
THE STORM OF APRIL 19-22, 1973, OVER THE CENTRAL MISSISSIPPI BASIN
The storm of April19-22, 1973, wi·th its precipitation center in northeastern Missouri, brought heavy rain-t-o-wide areas either along or close to the Upper Mississippi and the Lower Missouri Rivers, and contributed materially to the buildup of the recordbreaking high crest passing St. Louis, Mo., and the Lower Mississippi m·ain stem in late April and early May 1973. For this reason, it was chosen for a more detailed study.
STORM HISTORY
At 6:00a.m. c.s.t., April18, 1973, an incipient Low was located in east-central Colorado. By 6:00 p.m. c.s.t. the next day, it had become a well organized cyclone with its center over Nebraska. Its central pressure had fallen below 984 mb, and frontogenesis ~also had been in progress. Meanwhile, the eastern half of the United States, because of a strong Bermuda High off the Atlantic coast, had a predominantly southerly wind extending at least to 700mb. The 850- and 700-·mb charts for 6 :00 p.m. c.s.t., Apri119, displayed a conspicuous lag of the thermal trough with respect to the contour trough over the Great Plains region (figs. 25-28), indicating cold (warm)
FIGURE 25.-Surface weather chart for 6:00 p.m. c.s.t., April 19, 1973.
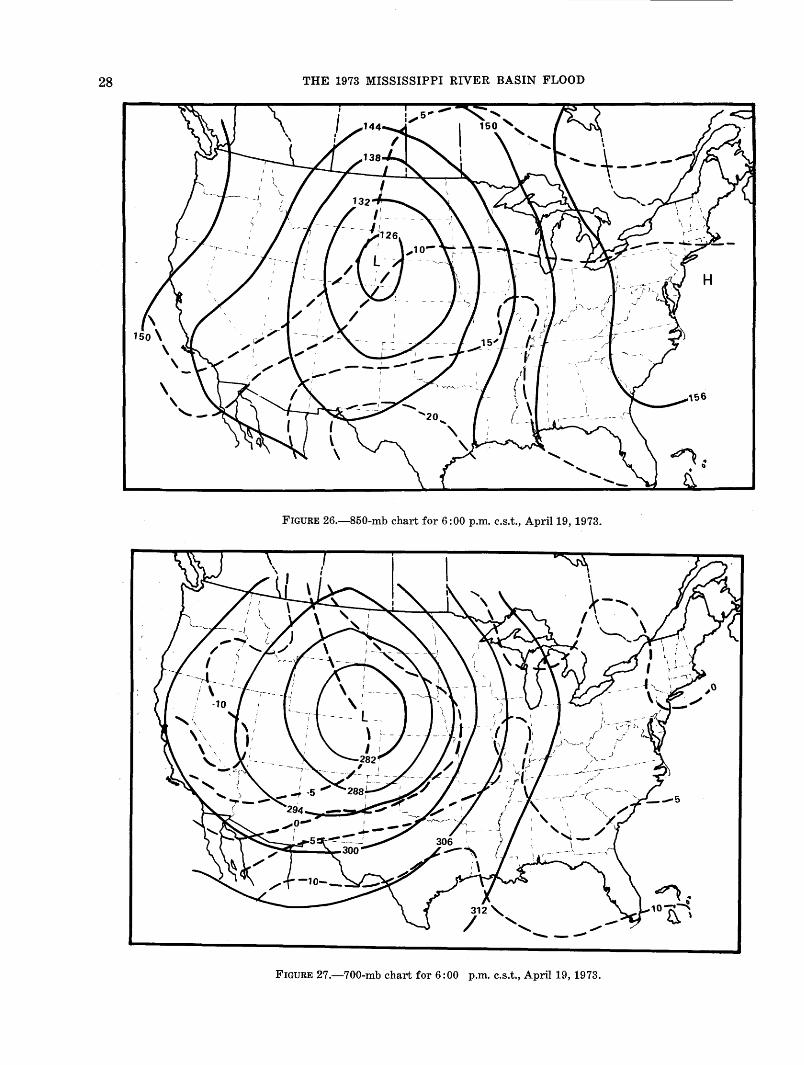
28 THE 1973 MISSISSIPPI RIVER BASIN FLOOD
FIGURE 26.-850-mb chart for 6:00p.m. c.s.t., April19, 1973.
312, / ....... , .,.,
.._, --FIGURE 27.-700-mb cham for 6:00 p.m. c.s.t., April19, 1973.
THE STORM OF APRIL 19-22, 1973, OVER THE CENTRAL MISSISSIPPI BASIN 29
FIGURE 28.-500-mb chart for 6:00p.m. c.s.t., Apri119, 1973.
advection behind (ahead of) the contour trough. The whole basin, except the Upper Mis,sissippi Valley and a part of the Ohio Valley, where a shortwave ridge was passing through, was underneath a 500-mb trough-to-ridge flow pattern (fig. 28).
Meanwhile, the weather syste.m rapidly developed. By 3:00 a.m. c.s.t., April 20, a meso-High was in existence just behind the cold front in eastern Iowa. An instability line, possibly associated with weak frontal wave perturbations, began to appear over northern Missouri. By 6:00 a.m. c.s.t., April 20, the Low was over the Dakotas. The frontal zone marking the boundary between the tropical maritime airmass to the east and cold polar airmass to the west became well established throughout the central Basin. The cold front extended from the Low center in the Dakotas through Minnesota, Iowa, ·and Missouri and then changed into a stationary front through Oklahoma to Texas. In the Central Mississippi Valley, wind was still predominantly from the south or southeast at the surface and veered with height. By 3:00 p.m. c.s.t., the instability line over northern Missouri had developed into a squall line and strong thunderstorm activities began. The front below Iowa was now classified as a warm front, but movement
was very minor. This squall line remained quasistationary about 70 mi (112.6 km) to the east of the front in northeastern Missouri for about 9 hours. The strong temperature gradient, the persistent convergent inflow of warm moist air, and the high instability along the quasistationary front and squall line also provided an environment favorable to the growth of severe storms of much smaller scale. Nine confirmed tornadoes were sighted on April 19, 16 tornadoes on April 20, and 3 on April 21 in Missouri alone. Many funnel clouds and tornadoes were also observed in Illinois and Iowa during this period. Numerous windstorms and hailstorms were also induced by the large-scale cyclone system. Hailstones with diameters reaching 2 in. (51 mm) fell in Henry County, Iowa, on April 19. A windstorm with gusts up to 85 mph ( 137 km/hr) hit western Iowa the same day, causing property losses and injuring five people.
The surface analysis and 850-, 700-, and 500-mb analyses for 6 :00 a.m. and 6 :00 p.m. c.s.t., April 20, 1973, are shown in figures 29-36. The 850-mb data (not shown in figures) clearly illustrates that the satur~ted (or nearly saturated) state of the air over the basin was due to the continuous intrusion of the
30 THE 1973 MISSISSIPPI RIVER BASIN FLOOD
warm moist maritime airmass into the Mississippi Valley from the Gulf of Mexico, indicated by the shape of the isotherm pattern. At 6:00 p.m. c.s.t., April 20, southerly winds at 850 mb reached a speed of about 50 knots (92.6 km/hr) over Little Rock, Ark., 45 knots (83.4 km/hr) over Monett, Mo., and 30 knots (55.6 km/hr) over Peoria, Ill., indicating moisture convergence over Missouri and Illinois. The antecedent rising motion in the warm intruding air, plus the apparent moisture convergence factor, !ed to an 850-mb relative humidity of 95 percent over Little Rock, Ark., and to complete saturation over the latter two stations.
The 700-mb analysis of 6 :00 p.m. c.s.t., April 20 (fig. 35), shows the same predominantly southerly inflow of warm moist air into the Mississippi basin but with wind direction shifted slightly towards the west. The warm advection over the valley along the main stem Mississippi River extended through a very deep layer, up to 300mb. The associated rising motion within this deep moist layer brought about widespread condensation and formed a cloud lane extending from Louisiana and eastern Texas up to Wisconsin.
PARCEL TRAJECTORIES LEADING INTO THE BASIN
To facilitate the identification of the airmass and the visualization of the ante-
cedent three-dimensional air movement, a set of past air parcel trajectories at three levels valid at 6 :00 p.m. c.s.t., April 20, are shown in figure 37. Solid (dashed) lines in figures 37 and 38 denote ascending (descending) trajectory. The three-digit numbers at origin points indicate the initial pressure levels in millibars. The numbers in parentheses specify the K indices.
The K index is a measure of the airmass moisture content and static stability and is given by:
K= (Ts5o-T5oo) +Td, s5o- (T,oo-Ta, •oo) (1)
Here, T is temperature in degrees Celsius; T d, the dew point temperature; and the subscripts denote pressure levels. The larger the K index of the airmass, the more unstable it is. A K index of 25 for Peoria, Ill. (fig. 37), indicates that airmass thunderstorms are possible. For comparison, a K index greater (less) than 35 (20) is associated with numerous (no) thunde·rstorms.
For example, the air parcel arriving at Peoria, Ill., at 700 mb at 6:00 p.m. c.s.t., April 20, originated at about lat 28°N., long 95°W. in the Gulf of Mexico at pressure level 782 mb 24 hours ago. During this period, it traveled northward and slowly rose to 700 mb. The pressure level at which the parcel was located 6 hours ago was 731mb, as labeled on this particular trajectory. The synoptic scale rising motion
FIGURE 29.-Surface weather chart for 6:00a.m. c.s.t., April 20, 1973.
THE STORM OF APRIL 19-22, 1973, OVER THE CENTRAL MISSISSIPPI BASIN
FIGURE 30.-850-mb chart for 6:00a.m. c.s.t., April20, 1973.
-10·--
FIGURE 31.-700-mb chart for 6:00a.m. c.s.t., April 20, 1973.
I I
I I
I
/ I
I I
31.
32 THE 1973 MISSISSIPPI RIVER BASIN FLOOD
FIGURE 32.-500-mb chart for' 6:00a.m. c.s.t., April20, 1973.
f
r-{
l.
I i \ (_
04 08 12
FIGURE 33.-Surface weather chart for 6:00p.m. c.s.t., April 20, 1973.
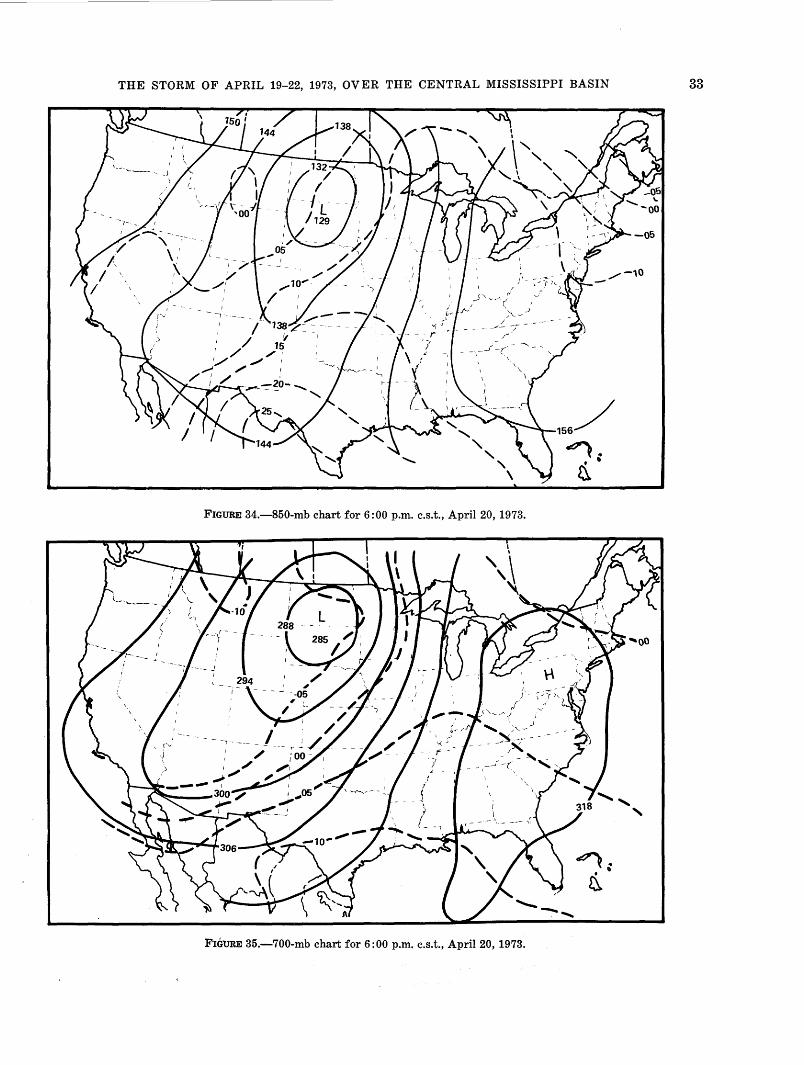
THE STORM OF APRIL 19-22, 1973, OVER THE CENTRAL MISSISSIPPI BASIN 33
~. • • [l
FIGURE 34.-850-mb chart for 6:00p.m. c.s.t., April 20, 1973.
FIGURE 35.-700-mb chart for 6:00 p.m. c.s.t., April 20, 1973.
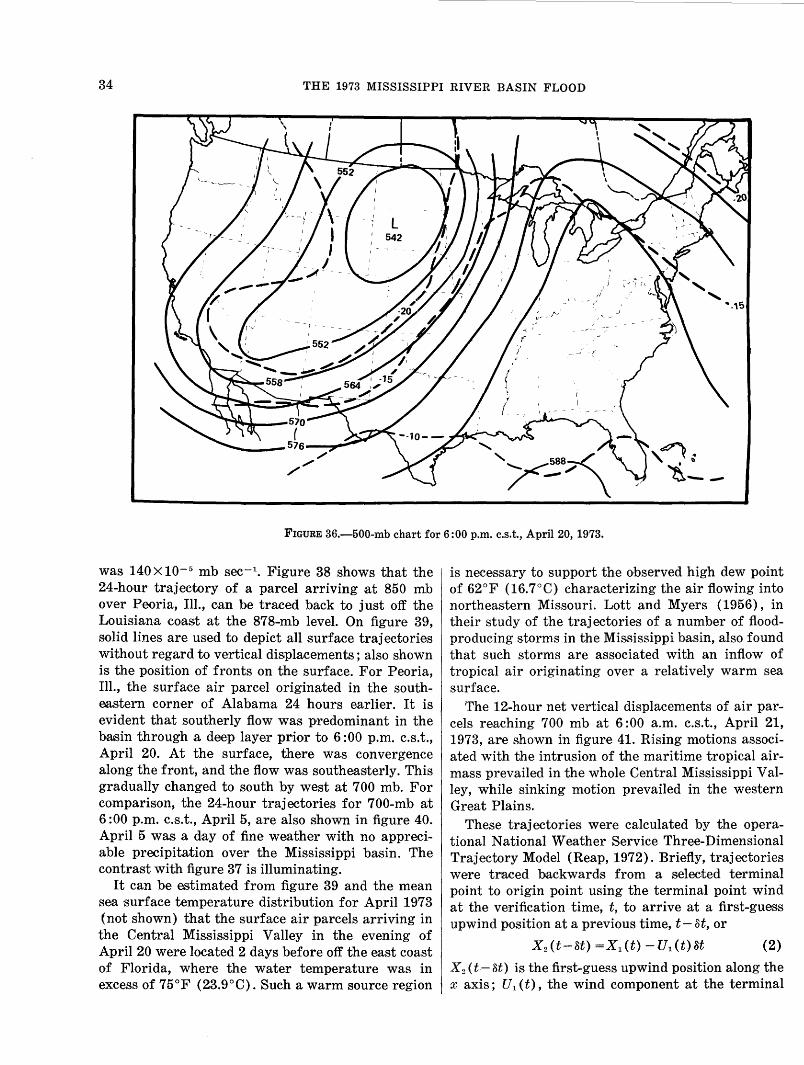
34 THE 1973 MISSISSIPPI RIVER BASIN FLOOD
FIGURE 36.-500-mb chart for 6:00p.m. c.s.t., April 20, 1973.
was 140 X 10-5 mb sec-1• Figure 38 shows that the
24-hour trajectory of a parcel arriving at 850 mb over Peoria, Ill., can be traced back to just off the Louisiana coast at the 878-mb level. On figure 39, solid lines are used to depict all surface trajectories without regard to vertical displacements; also shown is the position of fronts on the surface. For Peoria, Ill., the surface air parcel originated in the southeastern corner of Alabama 24 hours earlier. It is evident that southerly flow was predominant in the basin through a deep layer prior to 6 :00 p.m. c.s.t., April 20. At the surface, there was convergence along the front, and the flow was southeasterly. This gradually changed to south by west at 700 mb. For comparison, the 24-hour trajectories for 700-mb at 6:00 p.m. c.s.t., April 5, are also shown in figure 40. April 5 was a day of fine weather with no appreciable precipitation over the Mississippi basin. The contrast with figure 37 is illuminating.
It can he estimated from figure 39 and the mean sea surface temperature distribution for April 1973 (not shown) that the surface air parcels arriving in the Central Mississippi Valley in the evening of April 20 were located 2 days before off the east coast of Florida, where the water temperature was in excess of 75°F (23.9°C). Such a warm source region
is nece,ssary to support the observed high dew point of 62°F (16.7°C) characterizing the air flowing into northeastern Missouri. Lott and Myers (1956), in their study of the trajectories of a number of floodproducing storms in the Mississippi basin, also found that such storms are associated with an inflow of tropical air originating over a relatively warm sea surface.
The 12-hour net vertical displacements of air parcels reaching 700 mb at 6 :00 a.m. c.s.t., April 21, 1973, are shown in figure 41. Rising motions associated with the intrusion of the maritime tropical airmass prevailed in the whole Central Mississippi Valley, while sinking motion prevailed in the western Great Plains.
These trajectories were calculated by the operational National Weather Service Three-Dimensional Trajectory Model (Reap, 1972). Briefly, trajectories were traced backwards from a selected terminal point to origin point using the terminal point wind at the verification time, t, to arrive at a first-guess upwind position at a previous time, t-ot, or
x2 (t-ot) =Xl (t) - ul (t) st (2)
X 2 ( t.- ot) is the first-guess upwind position along the x axis ; U 1 ( t) , the wind component at the terminal
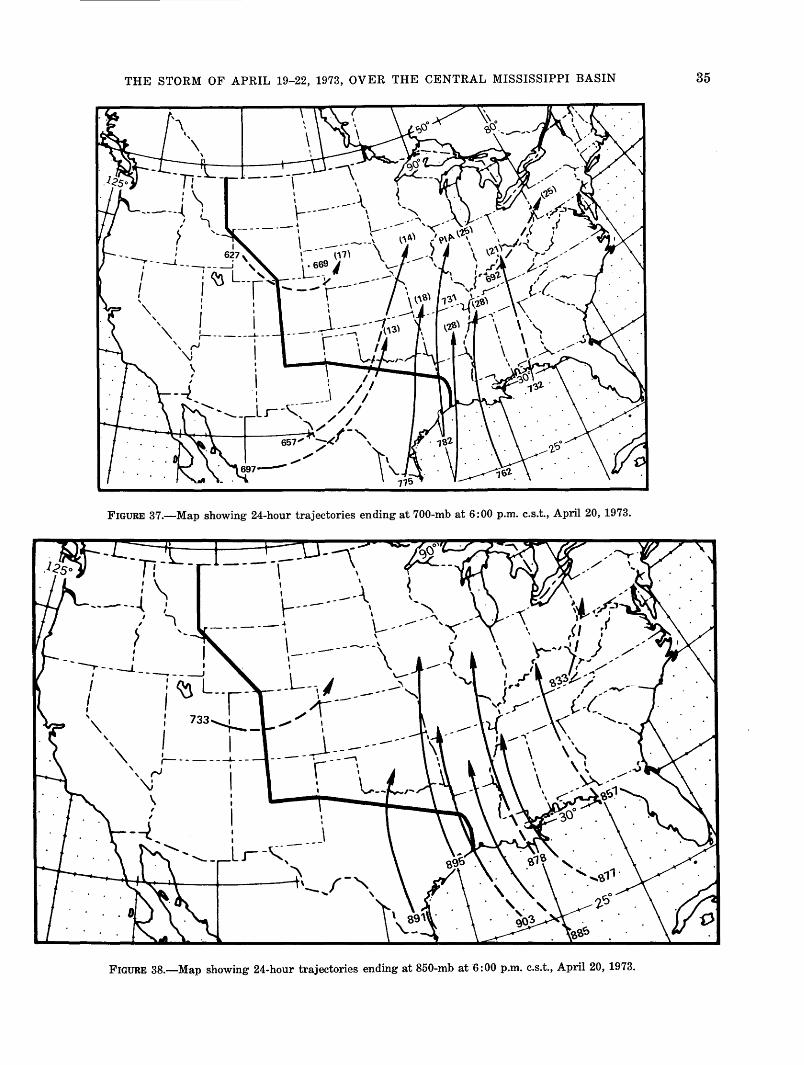
THE STORM OF APRIL 19-22, 1973, OVER THE CENTRAL MISSISSIPPI BASIN 35
FIGURE 37.-Map showing 24-hour trajectories ending at 700-mb at 6:00p.m. c.s.t., April 20, 1973.
I '
\_ ---\. ' .. ,----- \ ' \ --·""", --
1 \_..--- ""("
\
\ I
,----------'\ ) I _.-'\
L
'
'--- " -- I ---......._
I -- ' ,~--,. I
I
\ ---~----------- ., __ __.,
I -- _\
L.r-~-, ·~~~--~----1~ /-~ '- .... / '
FIGURE 38.-Map showing 24-hour trajectories ending at 850-mb at 6:00p.m. c.s.t., April 20, 1973.
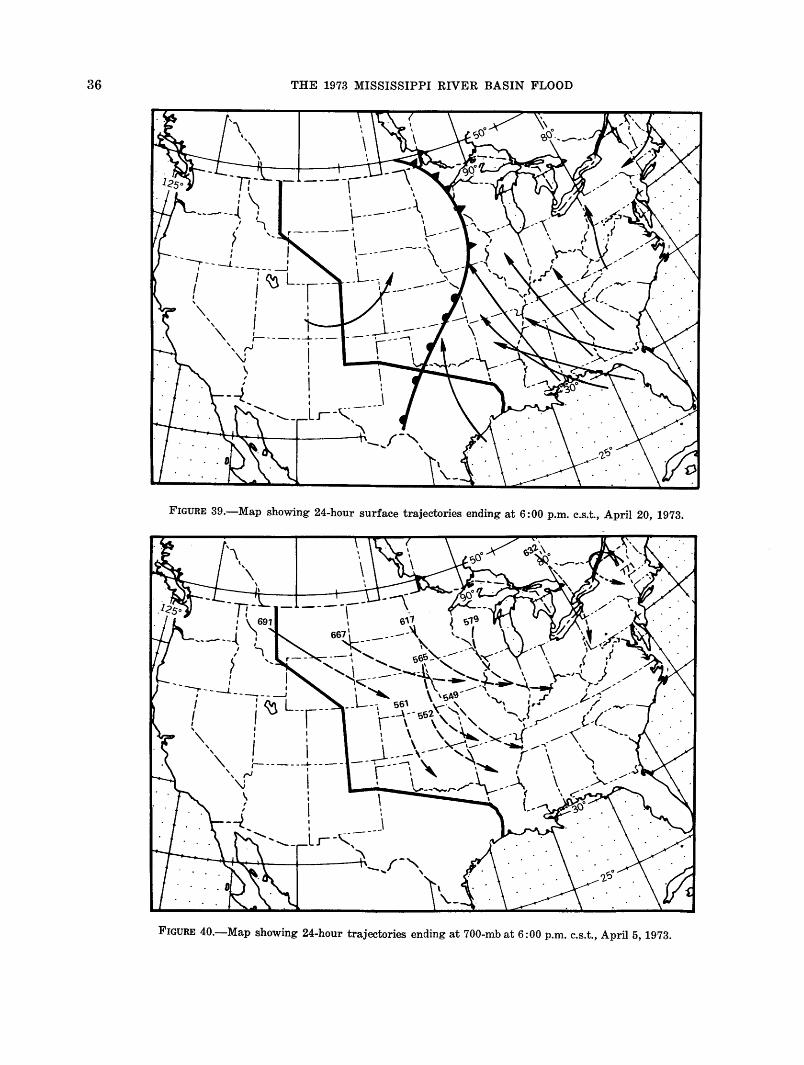
36 THE 1973 MISSISSIPPI RIVER BASIN FLOOD
FIGURE 39.-Map showing 24-hour surface trajectories ending at 6:00p.m. c.s.t., April 20, 1973.
FIGURE 40.-Map showing 24-hour trajectories ending at 700-mb at 6:00 p.m. c.s.t., April 5, 1973.
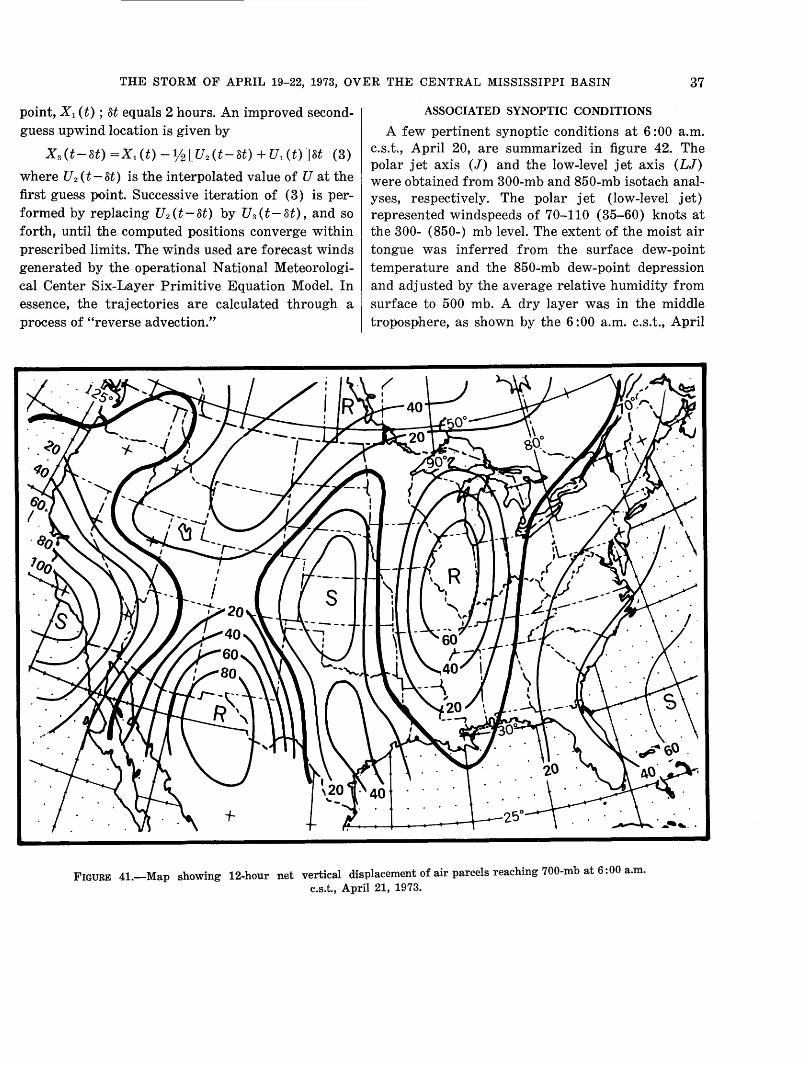
THE STORM OF APRIL 19-22, 1973, OVER THE CENTRAL MISSISSIPPI BASIN 37
point, X1 (t) ; ot equals 2 hours. An improved secondguess upwind location is given by
x 3 ( t- o t) = x 1 ( t) - V2 [ u 2 ( t - ot) + u 1 ( t) J st ( 3)
where Uz(t-ot) is the interpolated value of U at the first guess point. Successive iteration of (3) is performed by replacing U 2 (t-ot) by U 3 (t- st), and so forth, until the computed positions converge within prescribed limits. The winds used are forecast winds generated by the operational National Meteorological Center Six-Layer Primitive Equation ModeL In essence, the trajectories are calculated through a process of "reverse advection."
ASSOCIATED SYNOPTIC CONDITIONS
A few pertinent synoptic conditions at 6 :00 a.m. c.s.t., April 20, are summarized in figure 42. The polar jet axis (J) and the low-level jet axis (LJ) were obtained from 300-mb and 850-mb isotach analyses, respectively. The polar jet (low-level jet) represented windspeeds of 70-110 (35-60) knots at the 300- ( 850-) mb level. The extent of the moist air tongue was inferred from the surface dew-point temperature and the 850-mb dew-point depression and adjusted by the average relative humidity from surface to 500 mb. A dry layer was in the middle troposphere, as shown by the 6 :00 a.m. c.s.t., April
FIGURE 41.-Map showing 12-hour net vertical displacement of air parcels reaching 700-mb at 6:00a.m. c.s.t., April 21, 1973.
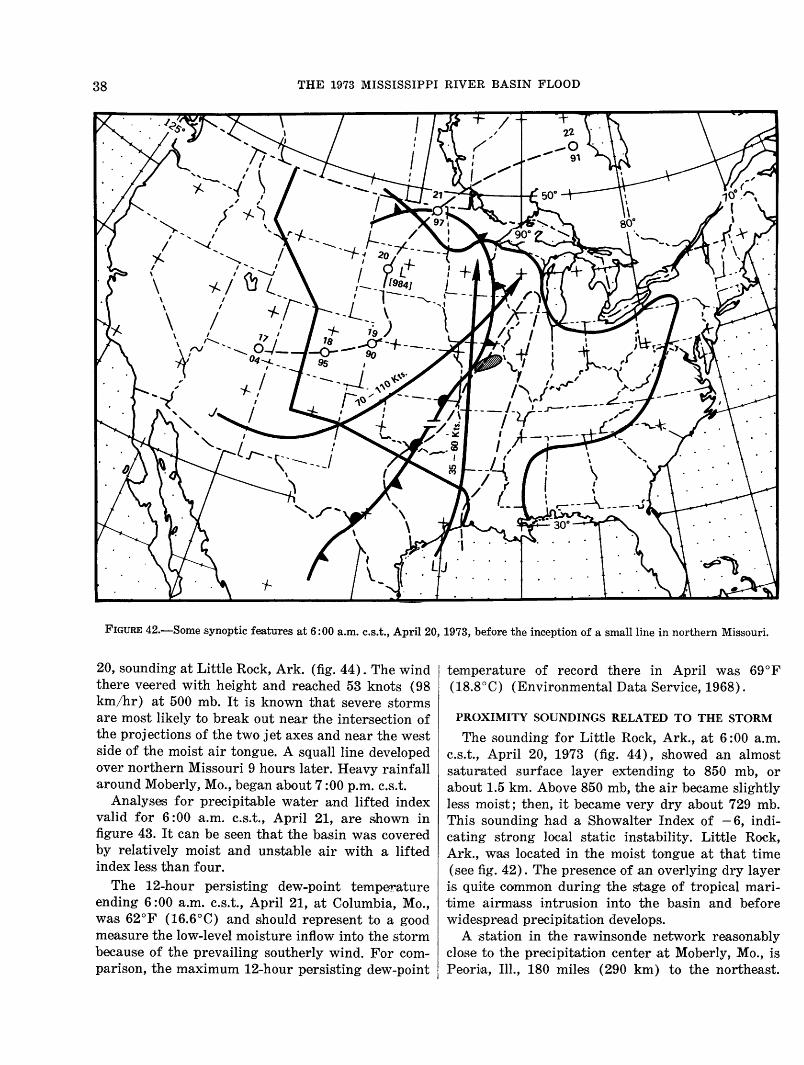
38 THE 1973 MISSISSIPPI RIVER BASIN FLOOD
FIGURE 42.-Some synoptic features at 6:00a.m. c.s.t., April20, 1973, before the inception of a small line in northern Missouri.
20, sounding at Little Rock, Ark. (fig. 44). The wind there veered with height and reached 53 knots (98 km/hr) at 500 mb. It is known that severe storms are most likely to break out near the intersection of the projections of the two jet axes and near the west side of the moist air tongue. A squall line developed over northern Missouri 9 hours later. Heavy rainfall around Moberly, Mo., began about 7:00p.m. c.s.t.
Analyses for precipitable water and lifted index valid for 6:00 a.m. c.s.t., April 21, are shown in figure 43. It can be seen that the basin was covered by relatively moist and unstable air with a lifted index less than four.
The 12-hour persisting dew-point te,mpe~:r."~ature ending 6:00 a.m. c.s.t., April 21, at Columbia, Mo., was 62°F (16.6°C) and should represent to a good moosure the low-level moisture inflow into the storm because of the prevailing southerly wind. For comparison, the maximum 12-hour persisting dew-point
temperature of record there in April was 69°F (18.8°C) (Environmental Data Service, 1968).
PROXIMITY SOUNDINGS RELATED TO THE STORM
The sounding for Little Rock, Ark., at 6:00 a.m. c.s.t., April 20, 1973 (fig. 44), showed an almost saturated surface layer extending to 850 mb, or about 1.5 km. Above 850 mb, the air became slightly less moist; then, it became very dry about 729 mb. This sounding had a Showalter Index of - 6, indicating strong local static instability. Little Rock, Ark., was located in the moist tongue at that time (see fig. 42). The presence of an overlying dry layer is quite common during the stage of tropical maritime airmass intrusion into the basin and before widesp~ead precipitation develops.
A station in the rawinsonde network reasonably close to the precipitation center at Moberly, Mo., is Peoria, Ill., 180 mile's (290 km) to the northeast.
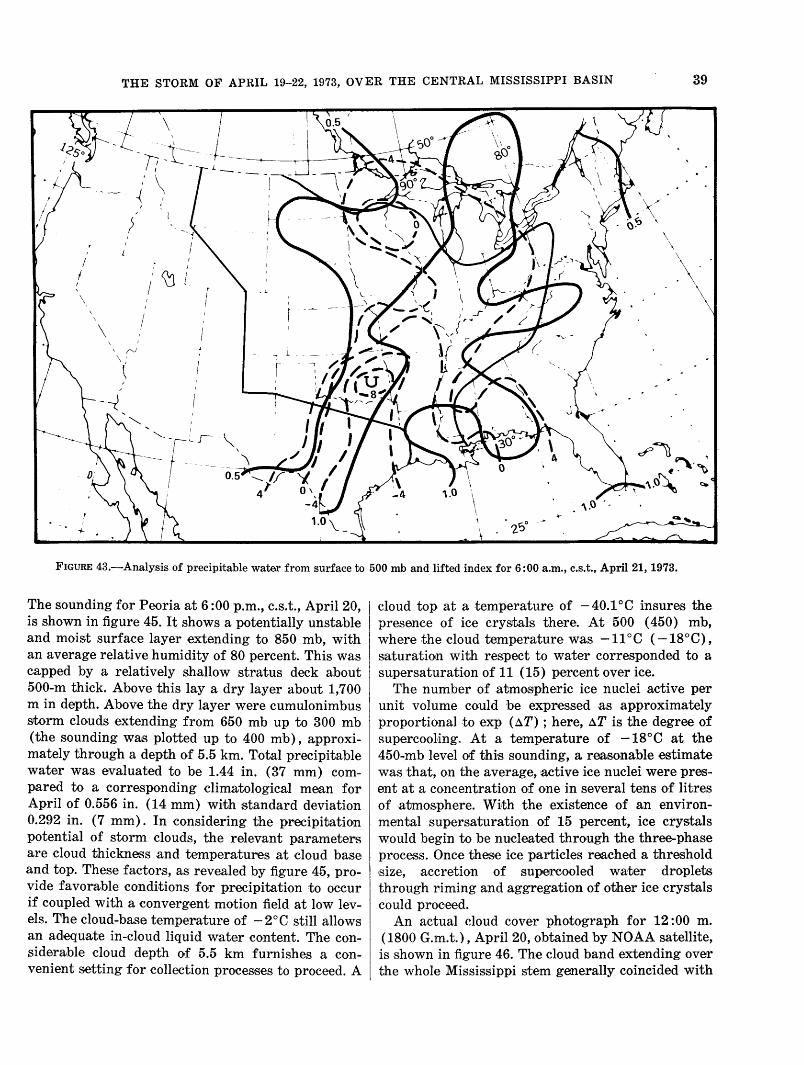
THE STORM OF APRIL 19-22, 1973, OVER THE CENTRAL MISSISSIPPI BASIN 39
I I
\
\ \ rJ
,~ (\, ! I u .
I r I
I .l.
'
r I
l
FIGURE 43.-Analy:sis of precipitable water from surface to 500mb and lifted index for 6:00a.m., c.s.t., April 21, 1973.
The sounding for Peoria at 6:00p.m., c.s.t., April 20, is shown in figure 45. It shows a potentially unstable and moist surface layer extending to 850 mb, with an average relative humidity of 80 percent. This was capped by a relatively shallow stratus deck about 500-m thick. Above this lay a dry layer about 1,700 m in depth. Above the dry layer were cumulonimbus storm clouds extending from 650 mb up to 300 mb (the sounding was plotted up to 400 mb), approximately through a depth of 5.5 km. Total precipitable water was evaluated to be 1.44 in. (37 mm) compared to a corresponding climatological mean for April of 0.556 in. (14 mm) with standard deviation 0.292 in. (7 mm). In considering the precipitation potential of storm clouds, the relevant parameters are cloud thickness and temperatures at cloud base and top. These factors, as revealed by figure 45, provide favorable condiUons for precipitation to occur if coupled with a convergent motion field at low levels. The cloud-base temperature of - 2°C still allows an adequate in-cloud liquid water content. The considerable cloud depth of 5.5 km furnishes a convenient s~etting for collection processes to proceed. A
cloud top at a temperature of -40.1 oc insures the presence of ice crystals there. At 500 ( 450) mb, where the cloud temperature was -11 oc ( -18°C), saturation with respect to water corresponded to a supersaturation of 11 (15) percent over ice.
The number of atmospheric ice nuclei active per unit volume could be expressed as approximately proportional to exp (6.T) ; here, 6.T is the degree of supercooHng. At a temperature of -18°C at the 450-mb level of this sounding, a reasonable ·estimate was that, on the average, active ice nuclei were present at a concentration of one in several tens of litres of atmosphere. Wi~th the existence of an environm.ental supersaturation of 15 percent, ice crystals would begin to be nucleated through the three-phase process. Once thes,e ice particles reached a threshold ,size, ,a,ccretion of superoooled water droplets through riming and aggregation of other ice crystals could proceed.
An actual cloud cover photograph for 12 :00 m. (1800 G.m.t.), April 20, obtained by NOAA satellite, is shown in figure 46. The cloud band extending over the whole Mississippi stem generally coincided with
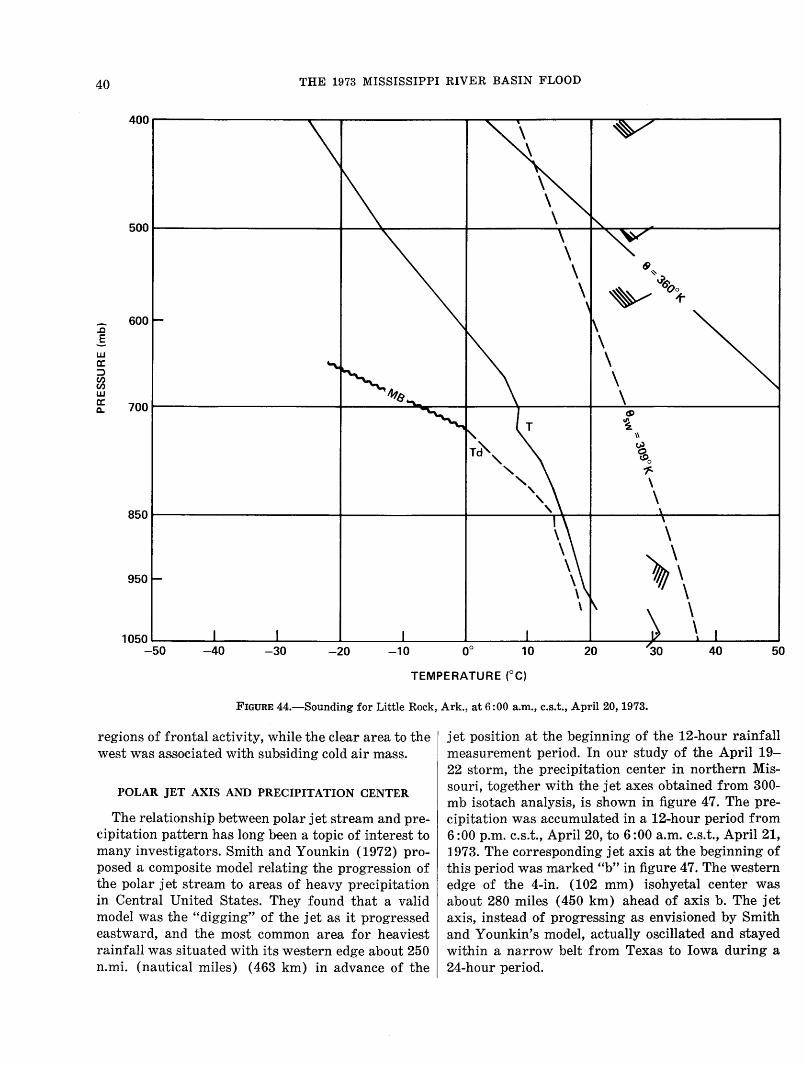
40 THE 1973 MISSISSIPPI RIVER BASIN FLOOD
..0 E w a: ::> ~
600 \ \ \ \
w a: CL 700~------------------~------~----+-----~------~~'~--------------~
CS>
T~
' ' ' '
~ \\
~ tPO "1-\ \ ' 850~--------------------~~------------~----------'~~-+--------~------------~
950
\
t\ \ \ \
1050~------~----~~----~~----~~----~~----~------~------~~---L_. ______ ~ -50 -40 -30 -20 -10 10 20 50
TEMPERATURE (°C)
FIGURE 44.-Sounding for Little Rock, Ark., at 6:00a.m., c.s.t., April 20,1973.
regions of frontal activity, while the clear area to the west was associated with subsiding cold air mass.
POLAR JET AXIS AND PRECIPITATION CENTER
The relationship between polar jet stream and precipitation pattern has long been a topic of interest to many investigators. Smith and Younkin (1972) proposed a composite model relating the progression of the polar jet stream to areas of heavy precipitation in Central United States. They found that a valid model was the "digging" of the jet as it progressed eastward, and the most common area for heaviest rainfall was situated with its western edge about 250 n.mi. (nautical miles) ( 463 km) in advance of the
jet position at the beginning of the 12-hour rainfall measurement period. In our study of the April 19-22 storm, the precipitation center in northern Missouri, together with the jet axes obtained from 300-mb isotach analysis, is shown in figure 4 7. The precipitation was accumulated in a 12-hour period from 6:00p.m. c.s.t., April 20, to 6:00a.m. c.s.t., April 21, 1973. The corresponding jet axis at the beginning of this period was marked "b" in figure 47. The western edge of the 4-in. (102 mm) isohyetal center was about 280 miles ( 450 km) ahead of axis b. The jet axis, instead of progressing as envisioned by Smith and Younkin's model, actually oscillated and stayed within a narrow belt from Texas to Iowa during a 24-hour period.
THE STORM OF APRIL 19-22, 1973, OVER THE CENTRAL MISSISSIPPI BASIN 41
500
0 ~
Vl 6'oo
1-600
' ..0 \V E w a: \ ::::> \ (/) (/) \ w 700 a: c..
TEMPERATURE (°C)
FIGURE 45.-Sounding for Peoria, 1\l., at 6:00p.m., c.s.t., April 20, 1973.
The presence of the jet axis implies the existence of a region in the vicinity with large vertical wind shear and high baroclinicity. A quasistationary jet, in turn, means that this region is subjected to persistent large upper tropospheric divergence and strong midtropospheric vertical motion and therefore is favorable for cyclone development and consequent precipitation.
PRECIPITATION CENTERED AT MOBERLY, MO., AND IN OTHER LOCATIONS
Isohyetal analysis for the precipitation center in northern Missouri is shown in figure 48. Mass rainfall curves for Moberly Radio KWIX and three other recording gages are shown in figure 49. The isohyetal
pattern had a northeast-southwest orientation approximately parallel to that of the quasistationary squall line and the front. Recorder traces at Higbee 7S, which is 15 mi (24 km) to the southwest of Moberly, shows that the most intense rate there was 1.75 in. ( 44 mm) in 30 minutes, between 10 :00 and 10 :30 p.m. c.s.t. on April 20. Across the pattern, precipitation amounts dropped off sharply. Columbia, Mo., located 30 mi ( 48 km) south of Moberly, received just 0.15 in. ( 4 mm) of rain in the 12-hour period ending 6:00a.m. c.s.t., April 21.
Between 8:00 p.m. c.s.t., April 20, and 2:00 a.m. c.s.t., April 21, Moberly Radio KWIX received 7.1 in. (180 mm) of rain at an average rate of 1.2 in. (30 mm) per hour. Because the lifetime of an individual

42 THE 1973 MISSISSIPPI RIVER BASIN FLOOD
THE STORM OF APRIL 19-22, 1973, OVER THE CENTRAL MISSISSIPPI BASIN 43
FIGURE 47.-Position of jet axis at (a) 6:00 a.m. c.s.t., April 20, 1973, (b) 6:00 p.m., April 20, 1973, (c) 6:00 a.m. c.s.t., April 21, 1973. Precipitation center in northern Missouri with more than 4 inches in 12 hours. ending 6:00 a.m. c.s.t., April 21, 1973, also shown.
convective cell is on the order of half an hour, to maintain such a persistent rain shower for 6 hours, new cells must be generated as the old ones decay. The spreading out of the cold and gusty downdraft from the raining mature cell had the effect of a local cold front, lifting incoming warm air from the south to condensation and releasing its potential instability to trigger further ~ertical growth into a full-blown new cell.
A complete depth-area-duration analysis for this storm has not been made at this time. A comparison between the observed point rainfall at Moberly Radio KWIX and the maximum average depths of rainfalls for 10 mi::! (26 km2
) areas and various durations for past significant storms over an area within 200 mi. (322 km) from Moberly, Mo., however, is presented (table 5). A significant storm is defined here as one with the 6-hour maximum average depth of rainfall over 10 mP (26 km2
) exceeding 7 in. (178 mm). These were compiled from historical files of the U.S. Army Corps of Engineers together with National Weather Service update data. All the storms listed were extratropical cyclones not associated with hurricane passage. It is evident that the
amount of rainfall of the Moberly storm was frequently exceeded in comparison, but it is most interesting to observe that it is exceptional for a storm to occur there in the spring season with such magnitude.
A comparison of this storm with the Illinois model 12-hour storm is presented in table 6. This is justified on the grounds that Mis,souri and Illinois are in the same general climatic regime. The Illinois model storm is a statistical composite for the characteristics of 12-hour periods of maximum rainfall in the 10 most severe rainstorms occurring in Illinois mostly in the summer during a 10-year period (Huff and Changnon, 1964). For the Moberly storm, its 12-hour features from 7 :00 p.m. c.s.t., April 20, to 7 :00 a.m. c.s.t., April 21, 1973, were used in this comparison. The winds aloft associated with the Moberly storm were more southerly and stronger. The higher positive departure of the dew point is a reflection of the greater variability of dew points in the spring season as compared with the predominantly summer season data of the Illinois storm. The synoptic scale dew-point departure and the inflow wind field measure the water vapor convergence into the storm and
44 THE 1973 MISSISSIPPI RIVER BASIN FLOOD
will affect the amount of precipitation. But precipitation amount is also dependent on the temporal and spatial distribution of the mesoscale storm vertical velocities which are not routinely measured. During the life cycle of the Moberly storm, the transient updraft profile could be such that a considerable proportion of the condensed liquid water was carried to the cloud-top divergence field and eventually reevaporated without further participation in the precipitation process. This offers a plausible explanation for its apparent lower precipitation efficiency compared with that of the Illinois model storm. It is interesting to note, however, that for both cases maximum rain occurred around midnight, when diurnal heating effect was completely overshadowed by storm dynamics.
Moberly, Mo., with an elevation of 850ft (259m) above mean sea level, is situated on a gentle ridge that separates the drainage basins between the Mississippi and Missouri Rivers. The surrounding regions are relatively flat. The steepest terrain gradient is towards the southeast, where the elevation ch:ang.es at ~an average slope of less than 1/1,000. Hence, it seems unlikely that orography could have had any significant effect in the distribution of storm precipitation in this case.
In addition to the heavy rain in northern Missouri, the storm also brought widespread heavy precipitation over the basin, as can be verified by the isohyetal maps (pis. 1-3). The northern Plains region,
94°
40 MILES 1--r-'~....--'-~
40 KILOMETRES
N
t IOWA
(
St LouiSe( I
J I
FIGURE 48.-Total storm rainfall April 19-22, 1973, near storm center at Moberly, Mo., showing area with 2 inches or more rain.
~ -5 ..: ...1 ...1 <( u..
11
10 r-
9
I sr-
7-
z Gr----------+----------~--------~r---~ <( a: Cl w 1-:s 5-::> :2: ::> (.) (.)
<( 4 r-
3 .-----
i-------
3~--------4---------~~1--------~--~ I
2r-
1 r-
00
~.-.../
I ,i I I I I I !
,-,./ ~-----------/ 4 •
;- --------- -..:a.'- -~J -_-.,:..-_----_---: _ •• -------~--------
00 00 n 00 n
APRil19 20 21 22
FIGURE 49.-Mass curves of rainfall for (1) Moberly Radio KWIX, (2) Higbee 78, (3) Hannibal Waterworks, and (4) Columbia WSO for April 19-22, 1973.
which was generally under the cold airmass, received heavy rain from April 19 to April 21; Shonkin 7S, Mont. (47°32' N., 110°35' W.), had 3.10 in. (79 mm) of rain on April 20; Bowman liSE, N.D. (46°02' N., 103°18' W.), had 1.78 in. (45 mm) on April 19; Faith 2W, S. Dak. ( 45°02' N., 102°05' W.), had 2.24 in. (57 mm) on Aprill9. These three amounts represent the greatest 1-day precipitation in April1973 for Montana, North Dakota, and South Dakota, respectively. However, the heaviest precipitation occurred in the warm sector region under the intruding tropical maritime airmass. For example, Clinton 2N, Wis. (42°37' N., 88°52' W.), recorded 4.39 in. (112 mm) of rain on April 21. Keosauque, Iowa ( 40°44' N., 91 °58' W.), had 4.20 in. (107 mm) on the same day. St. Charles, Ark. (34°23' N., 91 °08' W.), had 9.18 in. (23 em) on April 20; Hickman IE, Ky. (36°34' N., 89°10' W.), had 5.22 in. (133 mm)
ESTIMATION OF WATER LOSS IN THE MISSISSIPPI BASIN IN SPRING 1973 45
TABLE 5.-Comparison of past significant storm rainfalls 1 within a 200 mile radius of Moberly, Mo.,2 with the observed rainfall at Moberly Radio KWIX in the storm of April19-22, 1973
Date of storm Area Precipitation center
6
Maximum average depth (in.) for 10-square-mile area for
duration (hr) 12 24 48
July 6-7, 1898 -------------------Iowa, Nebr., Mo -----------------Blanchard, Iowa ----------------- 7.4 July 7-8, 1898 -------------------III., Mo -------------------------- Edgehill, Mo --------------------- 8.0 Aug. 22-26, 1906 ------------------Kans., Mo ------------------------Warsaw, Mo --------------------- 7.8
12.5 8.0 8.5 8.0
12.5 8.3 8.6
10.8 10.3 12.2 13.9
9.1 11.1 11.2 12.5 13.9
July 13-16, 1907 __________________ Nebr., Mo ------------------------Nemaha, Nebr ________________ .. __ 7.8 Sept. 6-9, 1915 ___________________ Kans., Mo _______________________ Moran, Kans --------------------- 8.1 10.3
12.1 13.7
.Tuly 9-12, 1922 __________________ Ill., Iowa. Mo., Kans _____________ Grant City, Mo ------------------10.8 Sept. 11-26, 1926 _________________ Kans., Nebr .. Iowa, Mo ___________ Neosho Falls, Kans ---------------13.4 Aug. 7-8, 1927 ____________________ Kans., Mo -~----------------------Caplinger Mills, Mo -------------- 7.6 June 28-29, 1933 _________________ Iowa, Ill., Mo ____________________ Gorin, Mo ------------------------ 7.5
7.8 8.2
7.8 9.0
10.9 11.0
9.1
June 3-4, 1943 ___________________ Mo., Kans ________________________ Ballard, Mo ---------------------- 9.0 10.1 9.9 8.7 9.2
June 25-26, 1944 -----------------Ill., Iowa, Wis --------------------Oxford Junction, Iowa ----------- 9.9 Aug. 1-2. 1944 ____________________ Mo ------------------------------Begnell. Mo ---------------------- 8.2
t~: \!Z~~t};;.=~~~=~~~~~~~~~~~~~i~;~~ -~~:.=~~~~=~~~~~~~~==~~=5P1f~~:~~~~~~=~~~~~~~==~~= :!:! 11.0 7.2
11.5 13.1 3 8.5
10.0 15.0
7.5 11.5 17.7 39.5
19.0 8.2
12.6 19.9
3 10.8 July 17-20, 1965 _________________ Mo., Kans., Iowa, Nebr ___________ Ridgeley, Mo _____________________ 11.7 Apr. 19-22, 1973 __________________ Mo., Til., Iowa --------------------Moberly Radio KWIX, Mo ________ 3 7.1
1 Obtained from U.S. Army Corps of Engineers and updated with National Weather Service data. . 2 Only major storms with precipitation centers within 200 miles from Moberly, Mo., storm durations longer than 24 hours, and maximum average
precipitation depths for 10 square miles in 6 hours exceeding 7 inches are included. a Observed rainfall in inches at maximum station.
TABLE 6.-Comparison of the April 20-21, 1973, storm near Moberly, Mo., with the Illinois model12-hour severe rainstorm
Parameter Moberly lllinois storm model
Squall line orientation, degrees __ 220-040 255-075 Orientation of surface isohyetal
pattern, degrees ------------ 245-065 265-085 850-mb wind; degrees, knots ___ 210, 40 245, 30 700-mb wind; degrees, knots ___ 215, 50 255, 30 500-mb wind; degrees, knots ___ 220, 70 270, 30 Surface dew point, departure
from normal, oF ------------ +18 +9 Starting time of rain, c.s.t ____ 7:00p.m. 7:00p.m. Time of maximum rain, c.s.t ___ 10:00 p.m. 9:30p.m.
2:00a.m. 3:30a.m. Maximum 12-hour point rainfall,
inches --------------------- 8.5 9.4
on April 19: Covington lW, Tenn. (35°34' N., 89° 40' W.), had 5.62 in. (143 mm) on April 20; and La Porte, Ind. (41 °36' N., 86°43' W.), had 2.95 in. (65 mm) on April 22. All these represent the greatest 1-day precipitation in the month of April 1973 for these States. It is evident that April 19-22 was indeed a very stormy period. Areas receiving 2 in. (51 mm) or more precipitation during the 7-day period April 16-22, 1973, are shown in figure 50. The critical placement of heavy precipitation in the Central Mississippi Valley along the main stem contributed materially to the subsequent record flood crests passing down the Mississippi River. The Low finally moved to northeast Canada by 7 :00 a.m. e.s.t., April 22. But the diffused remains of a foot-dragging frontal zone extending from Texas to New England lingered on, along which frontogenesis was soon to start again.
ESTIMATION OF WATER LOSS IN THE MISSISSIPPI BASIN IN SPRING 1973
The transformation of liquid water from the surface into water vapor in the atmosphere constitutes a vital link in the hydrologic cycle. Atmospheric water vapor is being replenished continuously either by direct evaporation from soil and free water surface or by transpiration through leaves of vegetation. This return flow is the reverse process of precipitation and will determine to a large extent the part of the total precipitation available for runoff and ground-water recharge over a time and space scale appropriate to the Mississippi basin flood of spring 1973. It is no accident that major floods are not as frequent in the Mississ,ippi Valley in the summer, which is the season of maximum water loss. Therefore, in considering the m~eteorological s·etting of this flood, a discussion of the water-loss process is j us.tified.
Evapotranspiration is the term used to describe the combined process of ·evaporation and transpiration. But the form·er is a physical process, whereas the latter involves plant biological functions and is very difficult to measure. Accordingly, the integrated effects of these two process.es as related to the flood episode will be discussed separately for convenience.
The rate of transpiration depends on many factors. A relatively warm air environment, low relative humidity, breezy winds, bright sunlight, and moist soil .are factors favorable to the transpiration process. For most plants, highest transpiration occurs during midday ,and early afternoon and drops off sharply as incident solar radiation becomes unavailable. In
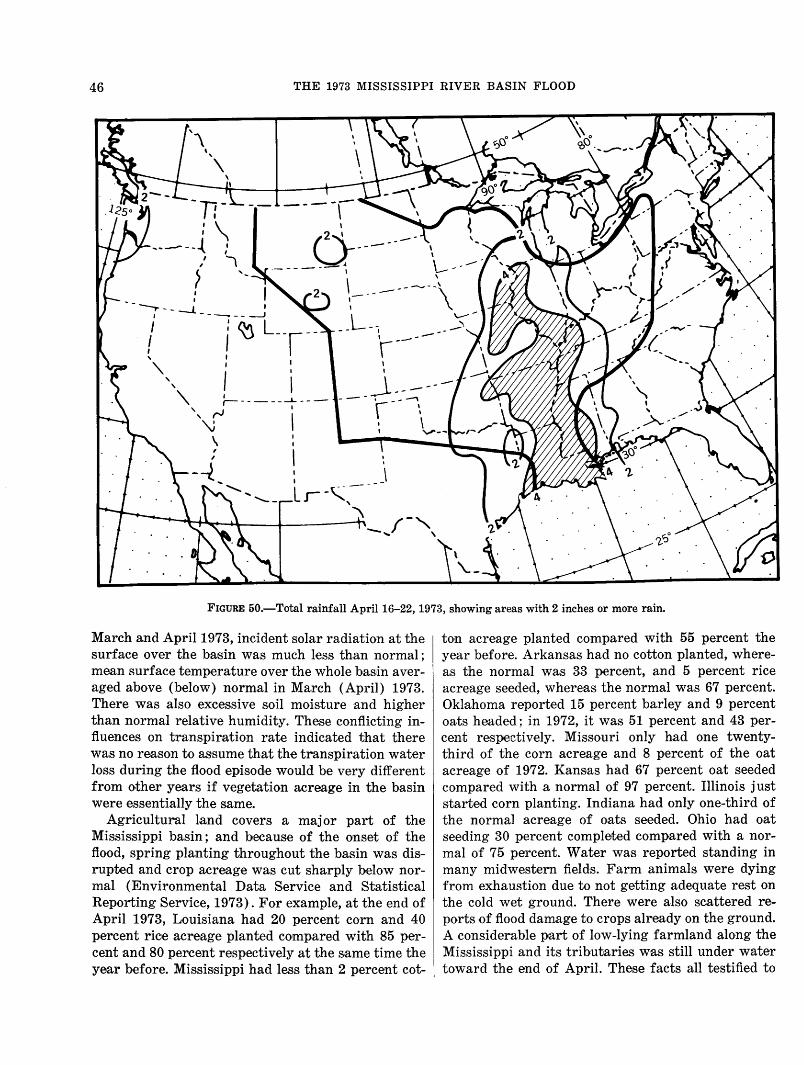
46 THE 1973 MISSISSIPPI RIVER BASIN FLOOD
I ____ ...
,
> 0 1 ---
------~ \_----
I I ;----l __ -., __ _j
' \- -------\ ..__-L - "\
-- -I -I : tv. L ! I u --~--, I
~r--, I ",, i \ \ --- -
---t----~ '\ t------~---' I
\ , r..J I 'J "-"'--
\
: -- _\ Lr-~-,
~~~~--~------'~ /-, - .... / '
FIGURE 50.-Total rainfall April 16-22, 1973, showing areas with 2 inches or more rain.
March and April 1973, incident solar radiation at the surface over the baiSin was much less than normal; mean surface te:mperature over the whole ba.s:in averaged above (below) normal in March (April) 1973. There was also excessive soil moisture and higher than normal relative humidity. These conflicting influences on transpiration rate indicated that there was no reason to assume that the transpiration water loss during the flood episode would be very different from other years if vegetation acreage in the basin were essentially the same.
Agricultural land covers a major part of the Mississippi basin; and because of the onset of the flood, spring planting throughout the basin was disrupted and crop acreage was cut sharply below normal (Environmental Data Service and Statistical Reporting Service, 1973). For example, at the end of April 1973, Louisiana had 20 percent corn and 40 percent rice acreage planted compared with 85 percent and 80 percent respectively at the same time the year before. Mississippi had less than 2 percent cot-
ton acreage planted compared with 55 percent the year before. Arkansas had no cotton planted, whereas the normal was 33 percent, and 5 percent rice acreage seeded, whereas the normal was 67 percent. Oklahoma reported 15 percent barley and 9 percent oats headed; in 1972, it was 51 percent and 43 percent respectively. Missouri only had one twentythird of the corn acreage and 8 percent of the oat acreage of 1972. Kansas had 67 percent oat seeded compared with a normal of 97 percent. Illinois just started corn planting. Indiana had only one-third of the norma] acreage of oats seeded. Ohio had oat seeding 30 percent completed compared with a normal of 75 percent. Water was reported standing in many midwestern fields. Farm animals were dying from exhaustion due to not getting adequate rest on the cold wet ground. There were also scattered reports of flood damage to crops already on the ground. A considerable part of low-lying farmland along the Mississippi and its tributaries was still under water toward the end of April. These facts all testified to
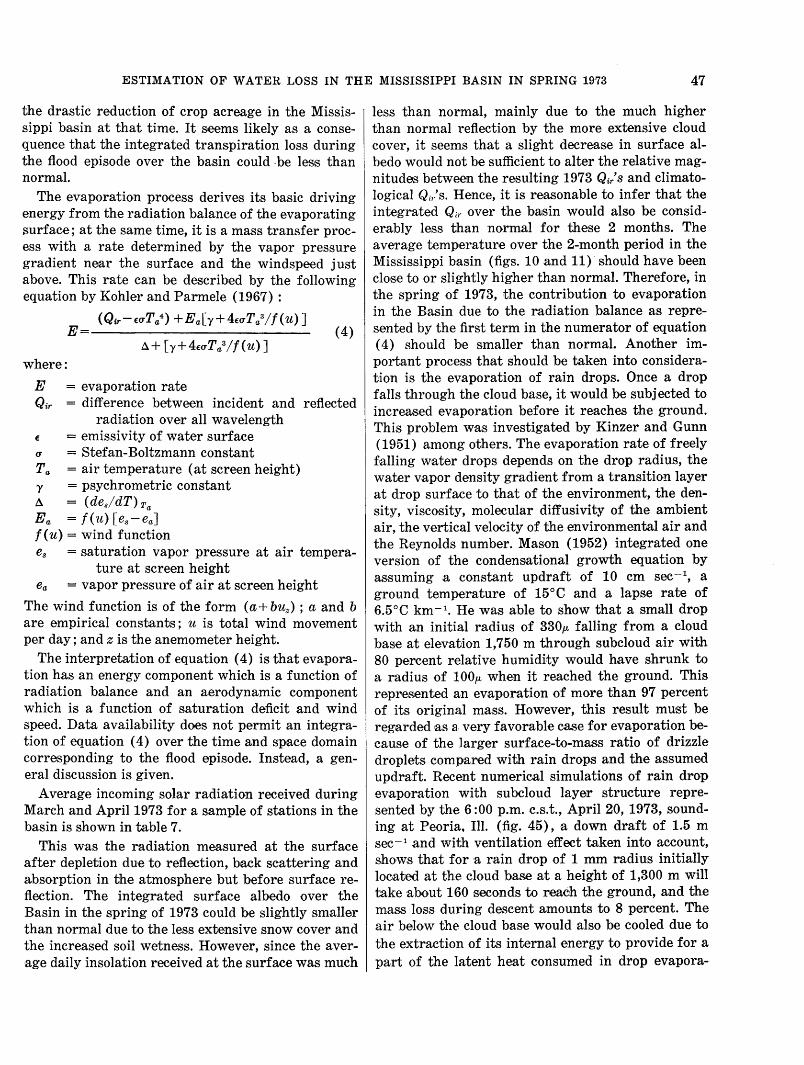
ESTIMATION OF WATER LOSS IN THE MISSISSIPPI BASIN IN SPRING 1973 47
the drastic reduction of crop acreage in the Mississippi basin at that time. It seems likely as a consequence that the integrated transpiration loss during the flood episode over the basin could ·be les's than normal.
The evaporation process derives its basic driving energy from the radiation balance of the evaporating surfaee; at the same time, it is a mass transfer process with a rate determined by the vapor pressure gradient near the surface and the windspeed just above. This rate can be described by the following equation by Kohler and Parmele (1967):
(Qir-w·Ta4) +Ea[y+4w·Ta3//(u)]
E (4)
where:
E = evapora.tion rate Qir = difference between incident and reflected
radiation over all wavelength t: = emissivity of water surface u = Stefan-Boltzmann constant Ta = air temperature (at screen height) y =psychrometric constant A = (des/dT) Ta
Ea = f(u) [es-ea] I ( u) = wind function es = saturation vapor pressure at air tempera
ture at screen height ea =vapor pressure of air at screen height
The wind function is of the form (a+ buz); a and b are empirical constants; u is total wind movement per day; and z is the anemometer height.
The interpretation of equation ( 4) is that evaporation has an energy component which is a function of radiation balanee and an aerodynamic component which is a function of saturation deficit and wind speed. Data availability does not permit an integration of equation (4) over the time and space domain corresponding to the flood episode. Instead, a general discussion is given.
Average incoming solar radiation received during March and April1973 for a sample of stations in the basin is shown in table 7.
This was the radiation measured at the surface after depletion due to reflection, back scattering and absorption in the atmosphere but before surface reflection. The integrated surface albedo over the Basin in the spring of 1973 could be slightly smaller than normal due to the less extensive snow cover and the increased soil wetness. However, since the average daily insolation reeeived at the surface was much
less than normal, mainly due to the much higher than normal reflection by the more extensive cloud cover, it seems that a slight decrease in surface albedo would not be sufficient to alter the relative magnitudes between the resulting 1973 Qir's and climatological Qi/s. Hence, it is reasonable to infer that the integrated Qir over the ba,sin would also be considerably less than normal for these 2 months. The average temperature over the 2-month period in the Mississippi basin (figs. 10 and 11) should have been close to or slightly higher than normal. Therefore, in the spring of 1973, the contribution to evaporation in the Basin due to the radiation balance as represented by the first term in the numerator of equation ( 4) should be smaller than normal. Another important proce·ss that should be taken into consideration is the evaporation of rain drops. Once a drop falls through the cloud base, it would be subjected to increased evaporation before it reaches the ground. This problem was investigated by Kinzer and Gunn (1951) among others. The evaporation rate of freely falling water drops depends on the drop radius, the water vapor density gradient from a transition layer at drop surface to that of the environment, the density, viscosity, molecular diffusivity of the ambient air, the vertical velocity of the ·environmental air and the Reynolds number. Mason (1952) integrated one version of the condensational growth equation by assuming a constant updraft of 10 em sec-t, a ground temperature of 15°C and a lapse rate of 6.5°C km- 1 • He was able to show that a small drop with an initial radius of 330p. falling from a cloud bas·e at elevation 1,750 m through subcloud air with 80 percent relative humidity would have shrunk to a radius of lOOp. when it reached the ground. This represented an evaporation of more than 97 percent of its original mass. However, this result must be regarded as a. very favorable case for evaporation because of the larger surface-to-mass ratio of drizzle droplets compa.red with rain drops and the assumed updraft. Recent numerical simulations of rain drop evaporation with subcloud layer structure represented by the 6:00p.m. c.s.t., April 20, 1973, sounding at Peoria. Ill. (fig. 45), a down draft of 1.5 m sec- 1 and with ventilation effect taken into account, shows that for a rain drop of 1 mm radius initially located at the cloud base at a height of 1,300 m will take about 160 seconds to reach the ground, and the mass loss during descent a.mounts to 8 percent. The air be<low the cloud base would also be cooled due to the extraction of its internal energy to provide for a part of the latent heat consumed in drop eva.pora-
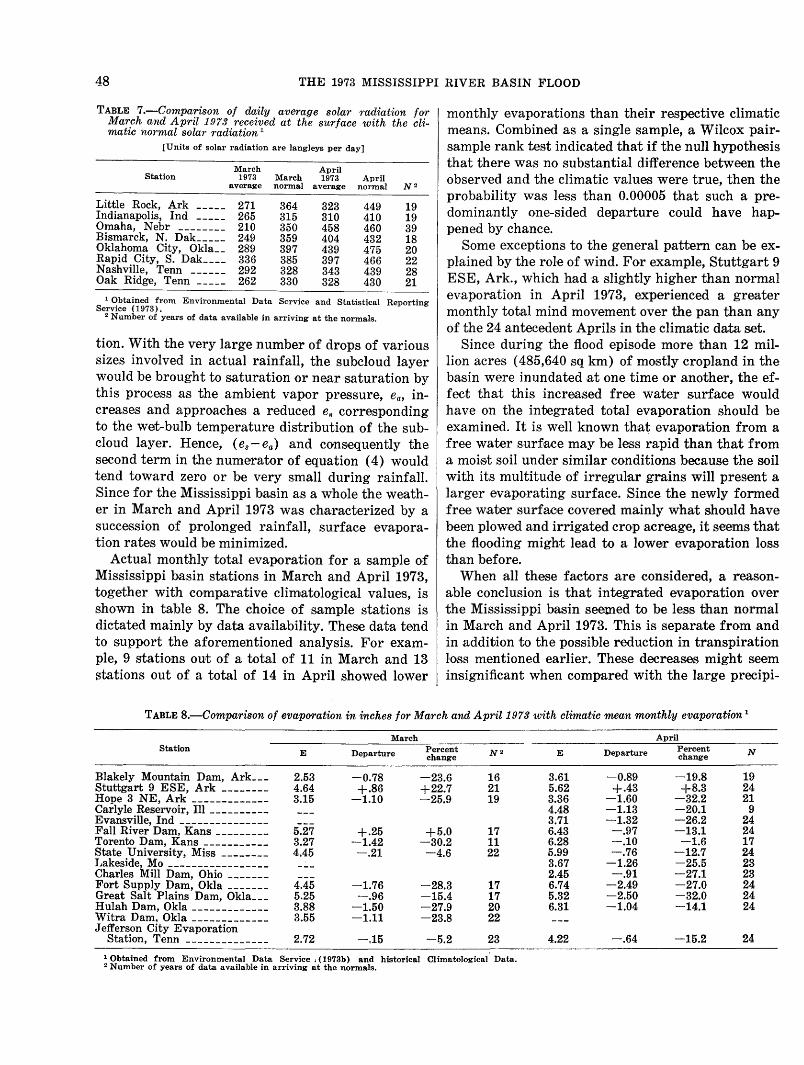
48 THE 1973 MISSISSIPPI RIVER BASIN FLOOD
TABLE 7.-Comparison of daily average solar radiation for March and April 1973 received at the surface with the eli-matic normal solar radiation 1
[Units of solar radiation are langleys per day]
March April Station 1973 March 1973 April
average normal average normal N2
Little Rock, Ark 271 364 323 449 19 Indianapolis, Ind _____ 265 315 310 410 19 Omaha, Nebr -------- 210 350 458 460 39 Bismarck, N. Dak _____ 249 359 404 432 18 Oklahoma City, Okla __ 289 397 439 475 20 Rapid City, S. Dak ____ 336 385 397 466 22 Nashville, Tenn ------ 292 328 343 439 28 Oak Ridge, Tenn _____ 262 330 328 430 21
1 Obtained from Environmental Data Service and Statistical Reporting Service (1973).
2 Number of years of data available in arriving at the normals.
tion. With the very large number of drops of various size1s involved in actual rainfall, the subcloud layer would be brought to saturation or near saturation by this process as the ambient vapor pressure, ea, increases and approaches a reduced e8 corresponding to the wet-bulb temperature distribution of the subcloud layer. Hence, ( es- ea) .and consequently the second term in the numerator of equation (4) would tend toward zero or be very small during rainfall. Since for the Mississippi basin as a whole the weather in March and April 1973 was characterized by a succession of prolonged rainfall, surface evaporation rates would be minimized.
Actual monthly total evaporation for a sample of Mississippi basin stations in March and April 1973, together with comparative clim1atological values, is shown in table 8. The choice of sample stations is dictated mainly by data availability. These data tend to support the aforementioned analysis. For example, 9 stations out of a total of 11 in March and 13 stations out of a total of 14 in April showed lower
monthly evaporations than their respective climatic means. Combined as a single sample, a Wilcox pairsample rank test indicated that if the null hypothesis that there was no substantial difference between the observed and the climatic values were true, then the probability was less than 0.00005 that such a predominantly one-sided departure could have happened by chance.
Some exceptions to the general pattern can be explained by the role of wind. For example, Stuttgart 9 ESE, Ark., which had a slightly higher than normal evaporation in April 1973, experienced a greater monthly total mind movement over the pan than any of the 24 antecedent Aprils in the climatic data set.
Sinc1e during the flood episode more than 12 million acres ( 485,640 sq km) of mostly cropland in the basin were inundated at one time or another, the effect that this increased free water surface would have on the integrated total evaporation should be examined. It is well known that evaporation from a free water sur£ac·e may be less rapid than that from a moi.s,t soil under similar conditions because the soil with its multitude of irregular grains will present a larger evaporating ·surface. Since the newly formed free water surfac1e covered mainly what should have been plowed and irrigated crop acreage, it seems that the flooding might lead to a lower evaporation loss than before.
When all these factors are considered, a reasonable conclusion is that integrated evaporation over the Mississippi basin seemed to be less than normal in March and April 1973. This is separate from and in addition to the possible reduction in transpiration loss mentioned earlier. These decreases might seem insignificant when compared with the large precipi-
TABLE B.-Comparison of evaporation in inches for March and April1973 with climatic mean monthly evaporation 1
March April Station E Departure Percent N2 E Departure Percent N change change
Blakely Mountain Dam, Ark ___ 2.53 -0.78 -23.6 16 3.61 -0.89 -19.8 19 Stuttgart 9 ESE, Ark -------- 4.64 +.86 +22.7 21 5.62 +.43 +8.3 24 Hope 3 NE, Ark ------------- 3.15 -1.10 -25.9 19 3.36 -1.60 -32.2 21 Carlyle Reservoir, Ill ---------- 4.48 -1.13 -20.1 9 Evansville, Ind --------------- 3.71 -1.32 -26.2 24 Fall River Dam, Kans --------- 5.27 +.25 +5.0 17 6.43 -.97 -13.1 24 Torento Dam, Kans ----------- 3.27 -1.42 -30.2 11 6.28 -.10 -1.6 17 State University, Miss -------- 4.45 -.21 -4.6 22 5.99 -.76 -12.7 24 Lakeside, Mo ----------------- 3.67 -1.26 -25.5 23 Charles Mill Dam, Ohio ------- 2.45 -.91 -27.1 23 Fort Supply Dam, Okla _______ 4.45 -1.76 -28.3 17 6.74 -2.49 -27.0 24 Great Salt Plains Dam, Okla ___ 5.25 -.96 -15.4 17 5.32 -2.50 -32.0 24 Hulah Dam, Okla ------------- 3.88 -1.50 -27.9 20 6.31 -1.04 -14.1 24 Witra Dam, Okla ------------- 3.55 -1.11 -23.8 22 J e:fferson City Evaporation
Station, Tenn -------------- 2.72 -,15 -5.2 23 4.22 -.64 -15.2 24
1 Obtained from Environmental Data Service , (1973b) and historical 2 Number of years of data available in arriving at the normals.
Climatological Data.
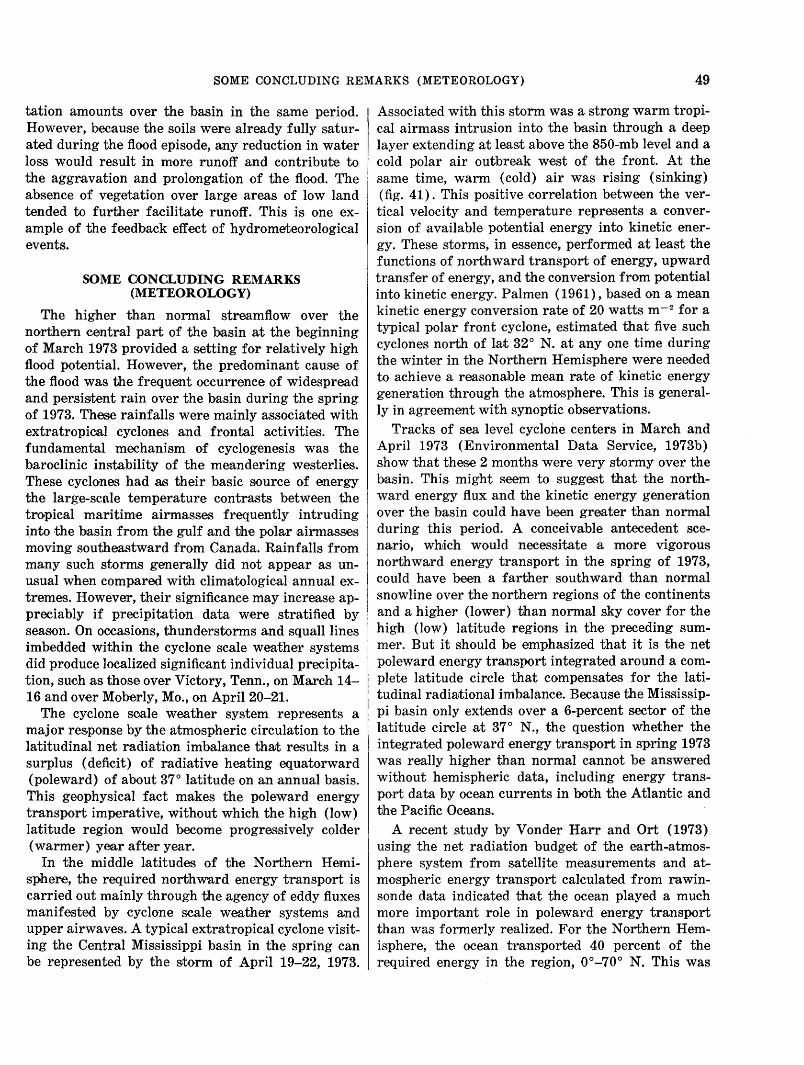
SOME CONCLUDING REMARKS (METEOROLOGY) 49
tation amounts over the basin in the same period. However, because the soils were already fully saturated during the flood episode, any reduction in water loss would result in more runoff and contribute to the aggravation and prolongation of the flood. The absence of vegetation over large areas of low land tended to further facilitate runoff. This is one example of the feedback effect of hydrometeorological events.
SOME CONCLUDING REMARKS (METEOROLOGY)
The higher than normal streamflow over the northern central part of the basin at the beginning of March 1973 provided a setting for relatively high flood potential. However, the predominant cause of the flood was the frequent occurrence of widespread and persistent rain over the basin during the spring of 1973. These rainfalls were mainly associated with extratropioal cyclones and frontal ·activities. The fundamental mechanis.m of cyclogenesis was the baroclinic instability of the meandering westerlies. These cyclones had as their basic source of ·energy the large-scale temperature contrasts between the tropical maritim·e airmas.ses frequently intruding into the basin from the gulf and the polar airmasses moving southeastward from Canada. Rainfalls from many such storms generally did not appear as unusual when compared with climatological annual extremes. However, their significance may increase appreciably if precipitation data were stratified by season. On occasions, thunderstorms and squall lines imbedded within the cyclone scale weather syste.ms did produce localized significant individual precipitation, such a:s those over Victory, Tenn., on March 14-16 and over Moberly, Mo., on April20-21.
The cyclone soale weather system represents a major res.ponse by the atmospheric circulation to the latitudinal net radiation imbalance that results in a surplus (deficit) of radiative heating equatorward (poleward) of about 37° latitude on an annual basis. This geophysical fact makes the poleward energy transport imperative, without which the high (low) latitude region would become progres.sively colder (warmer) year after year.
In the middle latitudes of the Northern Hemisphere, the required northward energy transport is carried out mainly through the agency of eddy fluxes mani£ested by cyclone scale weather sysrtems and upper airwaves. A typical extratropical cyclone visiting the Central Mississippi basin in the spring can be represented by the sto·rm of April 19-22, 1973.
Associated with this storm was a strong warm tropical airmass intrusion into the basin through a deep layer extending at least above the 850-mb level and a cold polar air outbreak west of the front. At the same time, warm (cold) air was rising (sinking) (fig. 41). This positive correlation between the vertical velocity and temperature represents a conver-sion of a vail able potential energy into kinetic energy. These storms, in essence, performed at least the functions of northward transport of energy, upward transfer of energy, and the conversion from potential into kinetic energy. Palmen (1961), based on a mean kinetic energy conversion rate of 20 watts m - 2 for a typical polar front cyclone, estimated that five such cyclones north of lart 32° N. at any one time during the winter in the Northern Hemisphere were needed to achieve a reasonable mean rate of kinetic energy generation through the atmosphere. This is generally in agreement with synoptic observations.
Tracks of sea level cyclone centers in March and April 1973 (Environmental Data Service, 1973b) show that these 2 months were very stormy over the basin. This might s·eem to suggest that the northward energy flux and the kinetic energy generation over the basin could have been greater than normal during this period. A conceivable antecedent scenario, which would necessitate a more vigorous northward energy transport in the spring of 1973, could have been a farther southward than normal snowline over the northern regions of the continents and a higher (lower) than normal sky cover for the high (low) latitude regions in the preceding summ·er. But it should be emphasized that it is the net poleward energy trans.port integrated around a complete latitude circle that compensates for the latitudinal radiational imbalance. Because the Mississippi basin only extends over a 6-percent sector of the latitude circle at 37° N., the question whether the integrat~ed poleward energy transport in spring 1973 was really higher than normal cannot be answered without hemispheric data, including energy transport data by ocean currents in both the Atlantic and the Pacific Oceans.
A recent study by Yonder Harr and Ort (1973) using the net radiation budget of the earth-atmosphere system from satellite measurements and atmospheric energy transport calculated from rawinsonde data indicated that the ocean played a much more important role in poleward energy transport than was formerly realized. For the Northern Hemisphere, the ocean transported 40 percent of the required energy in the region, 0°-70° N. This was
50 THE 1973 MISSISSIPPI RIVER BASIN FLOOD
the mean annual value so storage could be neglected in the calculation and balance relationships could be used. In view of this substantial role, any consideration of hemispheric poleward energy flux in March and April 1973 demands a detailed knowledge of poleward energy transport by oceans in the same period. The ocean storage of energy must also be known. Such information is not yet available.
The precipitation process is primarily controlled by atmospheric dynamics interacting with cloud microphysics. The extensive and persistent precipitation over the Mississippi basin in the spring of 1973 was, as mentioned earlier, associated with the numerous passages of extratropical cyclones and frontal activities. Spar (1973) carried out numerical experiments with the Mintz-Arkawa general circulation model and found that a sea-surface temperature anamoly of several degrees Celsius in the northern Pacific Ocean either persistent through a season or jus•t 1 month would induce marked changes in the monthly and seasonal precipitation over Eastern United States. However, the magnitude of the seasurface temperature anomaly required was much greater than that actually observed in the spring of 1973. Power spectrum analysis of meteorological time series by Sawyer (1970) disclosed the existence of large-scale atmospheric fluctuations with a time scale the order of a month. Such long-duration fluctuations in the motion field, as possibly exemplified by a blocking High over the eastern Pacific or a persistent trough over Western United States, would in turn affect the distribution of precipitation. A p·rolonged wet spell over a large area, such as that which occurred in March and April 1973 over the Mississippi basin, though very rare, could be expected to return in the future at irregular intervals.
A well-known proverb states that a picture is worth a thousand words. For the purpose of completing the documentation of the main features of the meteorological setting during the flood episode, daily isohyetal maps (pis. 1-3) and daily surface and 500-mb charts valid at 7:00a.m. e.s.t. (1200 G.m.t.) are presented (pis. 4-9). Days on which no significant area in the Mississippi basin received 0.5 in. (13 mm) or more we1re omitted from plates 1-3, though these lesser amounts may also have contributed to the flood runoff.
DATA AT STREAM-GAGING STATIONS
Gaging station information included in this report was selected on the basis of outstanding peak floods, volumes, stages, or the availability of significant
sediment data in drainage basins of all sizes. Figure 51 shows the location of the flood and sediment data collection sites. Detailed discharge data in table 12 (near the end of the report) make it possible to reproduce flood hydrographs for flood-control, s.ediment, and water-management studies. Some streams had normal discharges during part of the March through May base period; for these streams the periods of normal discharges are omitted and only flood data are presented.
Streamflow data included in table 12 of this report were generally obtained from automatic water-stage recording gages or readings of nonrecording gages by Geological Survey observers. At some gaged sites that are included in this report, the flooding was so severe that the automatic recorders were inundated or destroyed, and it was necessary to obtain floodstage data from non-automatic temporary gages. Also included are data collected at crest-stage partial-record stations, usually located on streams with small drainage areas, where only peak stages and discharges are collected.
Susp·ended-sediment conc,entration and discharge data are included with the streamflow data on a daily basis whenever available in sufficient quantity to construct a continuous record, otherwise it was tabulated on a periodic basis. Particle-size data are listed on a periodic basis. The suspended-sediment data were determined from samples collected in depthintegr,ating sampl,ers using techniques described by Guy and Norman (1970). For days when the published sediment discharge value differs from the value computed as the product of discharge times mean concentration times 0.0027, the reader can assume that the sediment discharge for that day was computed by the subdivided-day method (Porterfield, 1972). For periods when no samples are collected, daily loads of suspended sediment are estimated on the basis of water discharge and sediment concentrations observed immediately before and after the periods and suspended-sediment loads for other periods of similar discharge.
MAGNITUDE AND FREQUENCY OF FLOOD PEAKS AND VOLUMES
The estimated recurrence intervals (return periods) of spring 1973 flood peaks and volumes are shown in the gaging...,station data tabulations (table 12). Detailed flood-frequency reports containing data for numerous gaged sites and m·ethods for estimating frequency data at ungaged sites are available from district offices of the Geological Survey in each State.
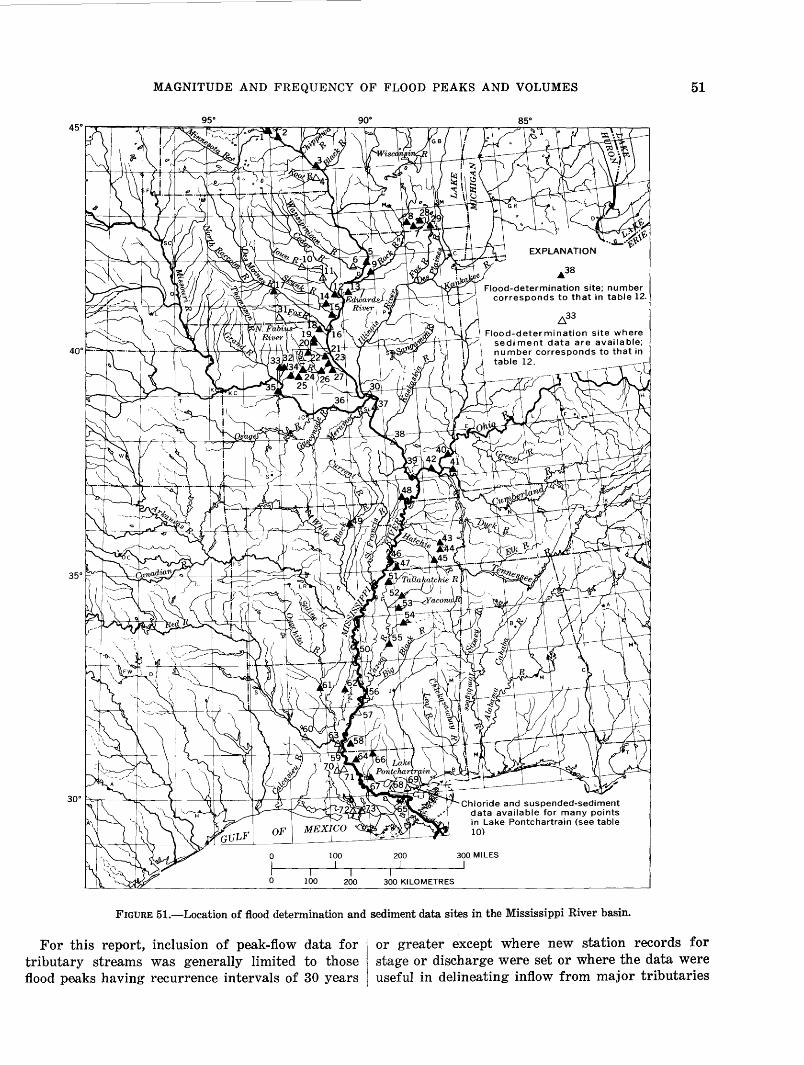
MAGNITUDE AND FREQUENCY OF FLOOD PEAKS AND VOLUMES 51
95"
_.38
Flood-determination site; number corresponds to that in table 12.
/:).33
't Flood-determination site where · sediment data are available;
number corresponds to that in table 12.
3o· hl~~=ll-~illL~DD?-A-~~~~~~t-=~~-chloride and suspended-sediment
0 100 200 300 KILOMETRES
data available for many points in Lake Pontchartrain (see table 10)
300 MILES
FIGURE 51.-Location of flood determination and sediment data sites in the Mississippi River basin.
For this report, inclusion of peak-flow data for tributary streams was generally limited to those flood peaks having recurrence intervals of 30 years
or greater except where new station records for stage or discharge were set or where the data were useful in delineating inflow from major tributaries
52 THE 1973 MISSISSIPPI RIVER BASIN FLOOD
such as the Ohio River. Data were also included for gaging stations where outs,tanding volumes of flow were recorded or where sediment data were available.
The flood-frequency estimates for most tributary station data were determined by comparison of the magnitude of the pe,ak-flow rate or volume with s:bation-frequency curve data. The frequency curves for gaging stations had already been determined by computer, mathematically fitting a Pearson Type III distribution to the logarithms of the annual flood data as described by the U.S. Water Resources Council (1967). For a few stations where fitting of the Pearson Type III distribution to flood data proved impractical, graphical methods described by Dalrymple (1960) were used.
Flood-frequency relationships for the Mississ,ippi River are presented in figure 52. Floodflows of the Mississippi River have been affected by manmade changes for many years, but an evaluation of the effects of these changes was not attempted for this report. The graphs shown were developed on the basis of actual flow data; these data include the effects of gradual changes caused by storage and levee systems in the basin. The frequency estimates shown for main-stem stations in table 12 are based on the relationships shown in figure 52.
The recurrence intervals of flood peaks and volumes varied considerably throughout the Missis,sippi River bas,in during the 1973 spring floods. In the upper reaches of the basin, especially in Missouri and Iowa, the recurrence intervals of both flood peaks and volumes on many tributary streams were in excess of 100 years. However, in the lower parts of the basin, flood volumes generally had higher recurrence intervals than flood peaks.
Because of considerable regulation and manmade changes on some of the major streams, recurrence intervals are not shown for flood peaks and volumes at all stations listed in table 12. H'owever, comparisons with past peak-flow events were shown· in the station manuscripts to provide some insight into the relative magnitude and return period of the event.
THE FLOODS
MISSISSIPPI RIVER MAIN STEM
The 1973 spring flood on the main stem of the Mississippi River had its beginnings in the early fall of 1972. Runoff from many tributaries throughout the basin wa:s above· normal frO.m October ·1972 through June 1973 producing above average flows on
the main stem during the period (figs. 53 and 54). During the winter, flood-control reservoirs filled, fields became saturated, water tables were unusually high, and bankfull stages were common on many major tributary streams in Iowa, Missouri1 Wisconsin, and Illinois; thus the stage was set for the devastating main-stem floods in the spring of 1973.
Selected photographs (figs. 55-58) illustrate some of the impacts of main-stem flooding during the spring of 1973. These are representative of thousands of photographs taken during the flooding by State and F·ederal agencies, newspapers, and private citizens.
FLOOD PEAKS
Upstream from Winona, Minn., the Mississippi River was not significantly affected by flooding in 1973. However, discharge records for three mainstem stations in this reach are included so that comparisons with past flood . events can be made. Although the main-stem flooding was not severe in this part of the basin (recurrence -intervals of peaks ranged from 3 to 7 years), it should be noted that the recurrence intervals of the peaks gradually increased in a downstream direction as ·tributary inflow became increasingly heavy.
The maximum 1973 flood stages were the highest ever observed in the reach of the Mississippi extending approximately 370 mi ( 595 km) upstream from Cape Girardeau, Mo. Downstream from Cape Girardeau, the river reached its highest stages since 1937. Flood-crest profiles are shown for the Mississippi River in figures 59-65. Table 9 de.sc,ribe's and tabulates the flood elevations used to plot the profiles and provides data on maximum flood elevation prior to 1973. Discharge hydrographs for the 1973 flood are shown for selected Mississippi River gaging stations in figure 66.
The most extensive flooding over the whole Mississippi River basin occurred during April 1973, when more than 12 million acres (30 million ha) of land were flooded and at least 50,000 people were forced from their homes. Flood stages were the highest ever observed at St. Louis, where the river reached its maximum crest of 43.23 ft (13.177 m) on April 28, exceeding the crest stage of 41.32 ft (12.594 m) that was observed at St. Louis on June 27, 1844, and the flood peak of April 1785 that may have reached 42 ft (12.80 m).
It is important to note that the peak stage of April 28, 1973, did not signify the greatest peak discharge of record; the peak discharge of 852,000 ft3 /s
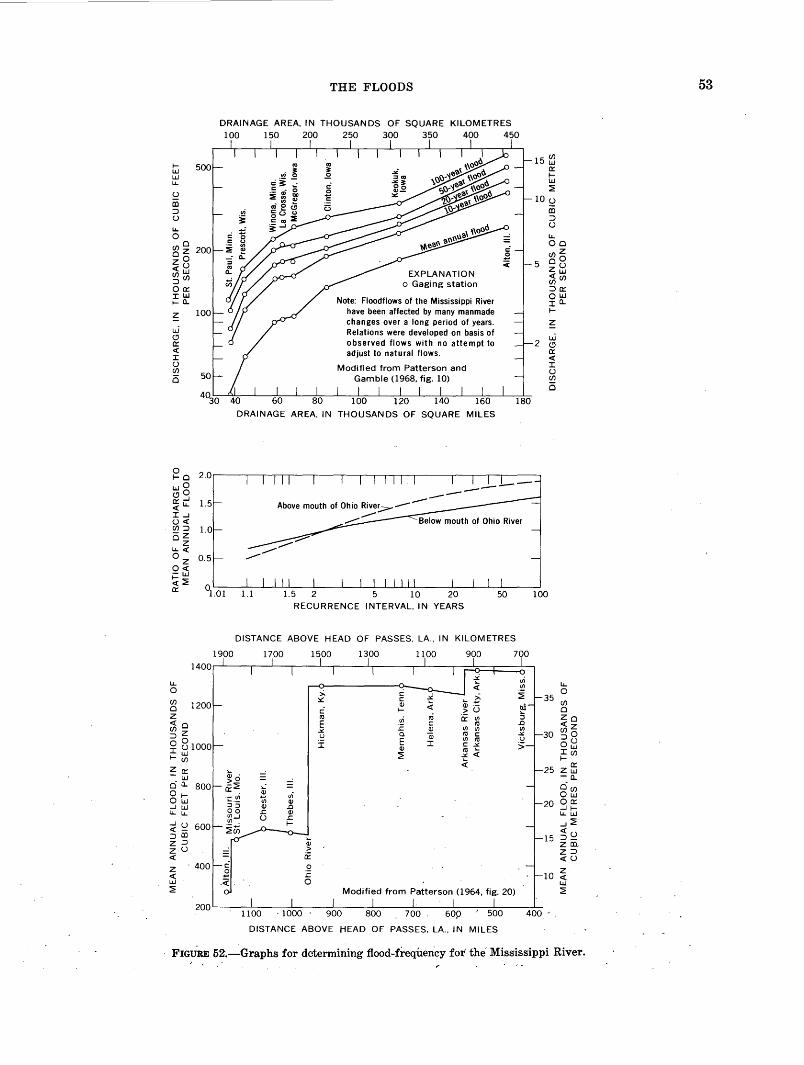
1-I.J.J LLJ 1.1..
S2 al ::> u 1.1.. 0 (/)0 oz zO ~~ ::>(/) oa::: ::CLLl t--0..
z
LLi (!) a::: <( ::r u (/)
0
1.1.. 0 (/)
0 z <(0
~z ~ 8woo ~--~ Za::: -w c) a..
8Gi ...JLLJ 1.1...1.1..
~ S2 600 ::>al z::> zU <(
z <( LLJ ::::E
. 400
THE FLOODS
DRAINAGE AREA, IN THOUSANDS OF SQUARE KILOMETRES 100 150 200 250 300 350 400 450
1900
EXPLANATION o Gaging station
Floodflows of the Mississippi River have been affected by many manmade changes over a long period of years. Relations were developed on basis of observed flows with no attempt to adjust to natural flows.
DRAINAGE AREA, IN THOUSANDS OF MILES
RECURRENCE INTERVAL, IN YEARS
DISTANCE ABOVE HEAD OF PASSES. LA., IN KILOMETRES
1700 1500 1300 1100 900 700
:>, c ::.::: c:
c Q)
I-ro vi ro- 1/)
E E c: 1/)
ro .:t:. Q) 1/)
u 0. Q) «l c:
i E ::r 1/) ro c: .:t:.
Q) ro .._ ::::E .:.::.<(
~
-
.Q
.I;
0 Modified from Patterson (1964, fig. 20)
DISTANCE ABOVE HEAD OF PASSES, LA., IN MILES
15 ~ a::: 1-I.J.J ::::E
lOu iD ::> ()
1.1.. 00 C/Jz
5 oo zu <(LLJ (/)(/)
::>a::: QLLJ :ca.. I-
~ u.i
2 (!) a::: <( ::r u (/)
0
35
30
25
20
15
1.1.. 0 (/) 0 zo <(z (/)0
6~ ::C(/) 1--
a::: ZLLJ -a.. 0(/) Ow oa::: ...JILI..LLJ ...J::::E
~S:? zm. Z::l <(()
10 ~ LLJ ::::E
FIGURE 52.-Graphs for determining flood-frequen,cy for' the Mississippi River.
53
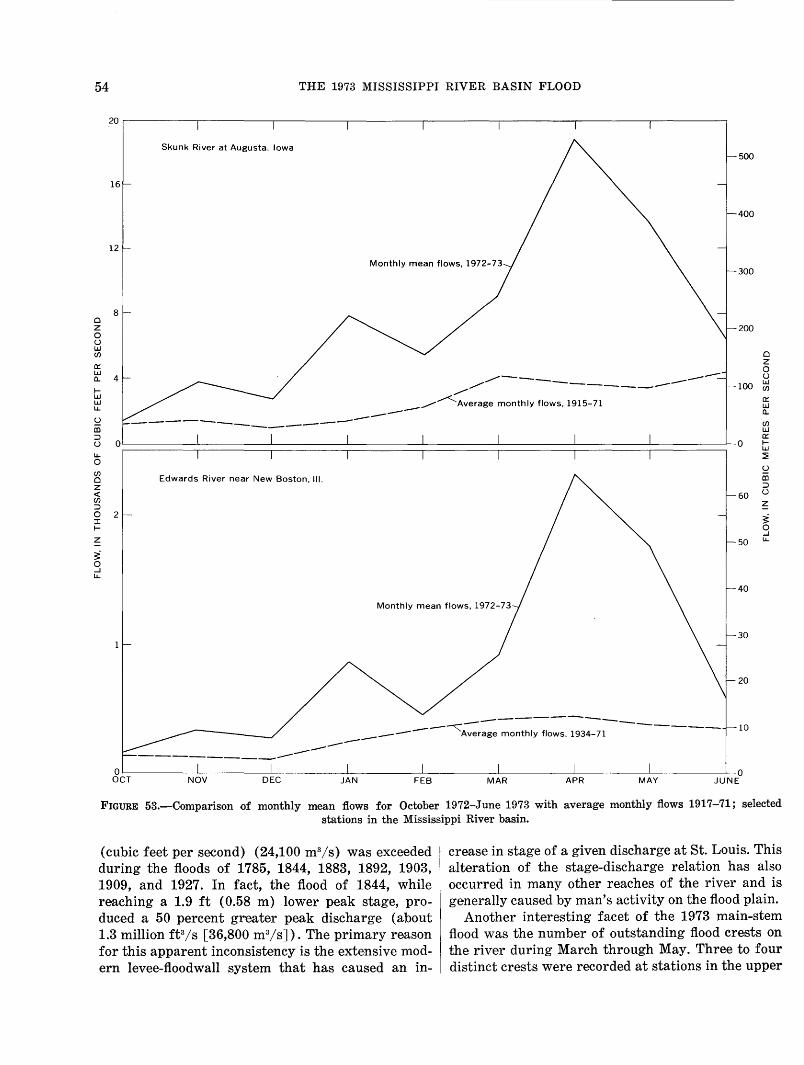
54
Cl z 0 (.) LLI (/)
0:: LLI
THE 1973 MISSISSIPPI RIVER BASIN FLOOD
20r---------,----------,---------.----------.----------~--------~--------~--------~
Skunk River at Augusta, Iowa
12
Monthly mean flows, 1972-73
8
500
400
300
200
Cl z 0 (.)
0.. 4 f-
..........---- --............ --------------
........... ~erage monthly flows, 1915-71 --100 ~
LLI LLI IJ..
::2 --------------------------0:: LLI 0..
(/) LLI CD
;:)
u o~======~========~========~======~~======~========~========~========:-o IJ..
0:: fLLI ~
0 (/) Cl z <( (/) ;:)
0 2 J: f-
z
~ 0 ...J IJ..
Edwards River near New Boston, 111. ::2 CD ;:)
60 (.)
50
40
Monthly mean flows, 1972-73
30
20
-------~--~------ ------------
--- Average monthly flows, 1934-71 10 --------
OOC~T~-------N~O-V ________ _L ________ ~--------~L_--------~---------L--------~-----------l_O DEC JAN FEB MAR APR MAY JUNE
FIGURE 53.-Comparison of monthly mean flows for October 1972-June 1973 with average monthly flows 1917-71; selected stations in the Mississippi River basin.
(cubic feet per second) (24,100 m3/s) was exceeded during the floods of 1785, 1844, 1883, 1892, 1903, 1909, and 1927. In fact, the flood of 1844, while reaching a 1.9 ft (0.58 m) lower peak stage, produced a 50 percent greater peak discharge (about 1.3 million ft3/s [36,800 m3/s]). The primary reason for this apparent inconsistency is the extensive modern levee-floodwall system that has caused an in-
crease in stage of a given discharge at St. Louis. This alteration of the stage-discharge relation has also occurred in many other reaches of the river and is generally caused by man's activity on the flood plain.
Another interesting facet of the 1973 main-stem flood was the number of outstanding flood crests on the rive·r during March through May. Three to four distinct crests were recorded at stations in the upper
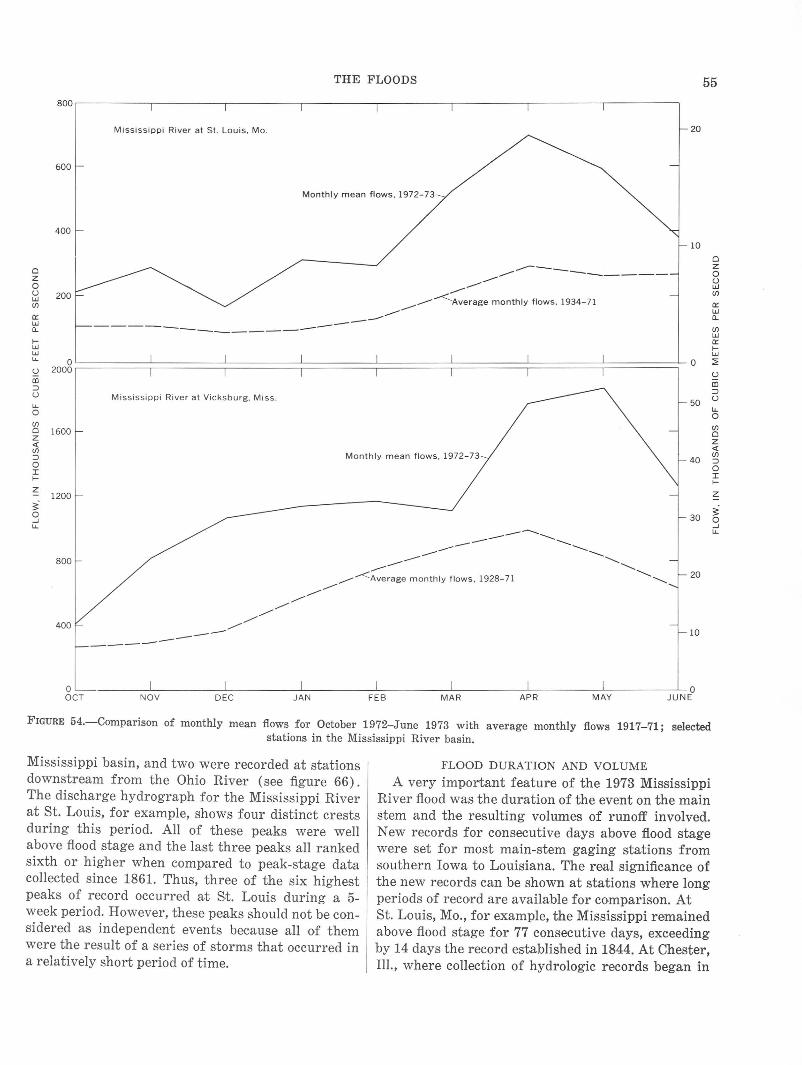
THE FLOODS
800 .---------.---------,---------,----------,--------~---------,--------~r-------~
0 z 0
600
400
~ 200 (f)
cr: w £l.
Mississippi River at St. Louis. Mo.
-----
Mont hly mean flows, 1972-73
------ ---------_.---<:Average monthly flows , 1934-71 ---------
20
10
55
0 z 0 u w (f)
cr: w £l.
(f) w cr: fw
o~========~========~==========~========~========~==========~=========f==========io!:::? ~ !:::? 2000 r m m
fw w "-
~ ~ U Mississippi River at Vicksburg, Miss. 50 u "-0 "-
0 (f)
0 z c( (f)
~ 0 I f-
Monthly mean flows, 1972-73
(f) 0 z c( (f)
40 ~ 0 I f-
z ~
~ 0 __J 30 ~ "-
____ -...... ___
-- ---- ------- ---........... -- ...................... _.........-<Average monthly flows. 1928-71 ........._ 20 ____________________________
------ 10
gCLT ___ _______ N~O-V--------~D~EC~------~J~AN~------~F~E~B~------~M~A~R~------~A~P~R~----~M~AY~------~J~U~N'~
FIGURE 54.-Comparison of monthly mean flows for October 1972-June 1973 with average monthly flows 1917-71; selected stations in the Mississippi River basin.
Mississippi basin, and two were recorded at stations downstream from the Ohio River (see figure 66). The discharge hydrograph for the Mississippi River at St. Louis, for example, shows four distinct crests during this period. All of these peaks were well above flood stage and the last three peaks all ranked sixth or higher when compared to peak-stage data collected since 1861. Thus, three of the s·ix highest peaks of record occurred at St. Louis during a 5-week period. However, thes·e peaks should not be considered as independent events because all of them were the result of a series of storms that occurred in a relatively short period of time.
FLOOD DURATION AND VOLUME
A very important feature of the 1973 Mississippi River flood was the duration of the event on the main stem and the resulting volumes of runoff involved. New records for consecutive days above flood stage were set for most main-stem gaging stations from southern Iowa to Louisiana. The real significance of the new records can be shown at stations where long periods of reco•rd are available for comparison. At St. Louis, Mo., for example, the Mississippi remained above flood stage fo·r 77 consecutive days, exceeding by 14 days the record established in 1844. At Chester, Ill., where collection of hydrologic records began in
__J
"-
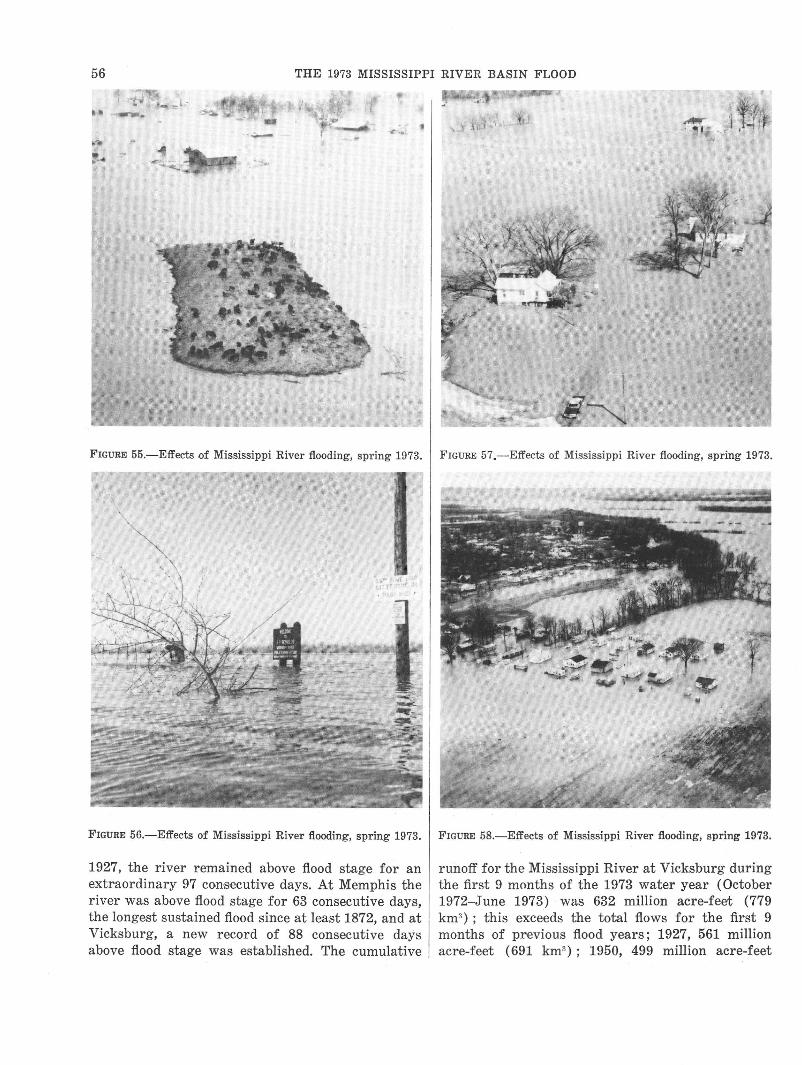
56 THE 1973 MISSISSIPPI RIVER BASIN FLOOD
... ~--................. ~.,..,.
FIGURE 55.-Effect.s of Mississippi River flooding, spring 1973.
FIGURE 56.-Effects of Mississippi River flooding, spring 1973.
1927, the river remained above flood stage for an extraordinary 97 consecutive days. At Memphis the river was above flood stage for 63 consecutive days, the longest sustained flood since at least 1872, and at Vicksburg, a new record of 88 consecutive days above flood stage was established. The cumulative
.........- "I ~"'ft . , • - .. ,• J=!; r
FIGURE 58.-Effects of Mississippi River flooding, spring 1973.
runoff for the Mississippi River at Vicksburg during the first 9 months of the 1973 water year (October 1972-June 1973) was 632 million acre-feet (779 km~ ) ; this exceeds the total flows for the first 9 months of previous flood years; 1927, 561 million acre-feet (691 kmR); 1950, 499 million acre-feet
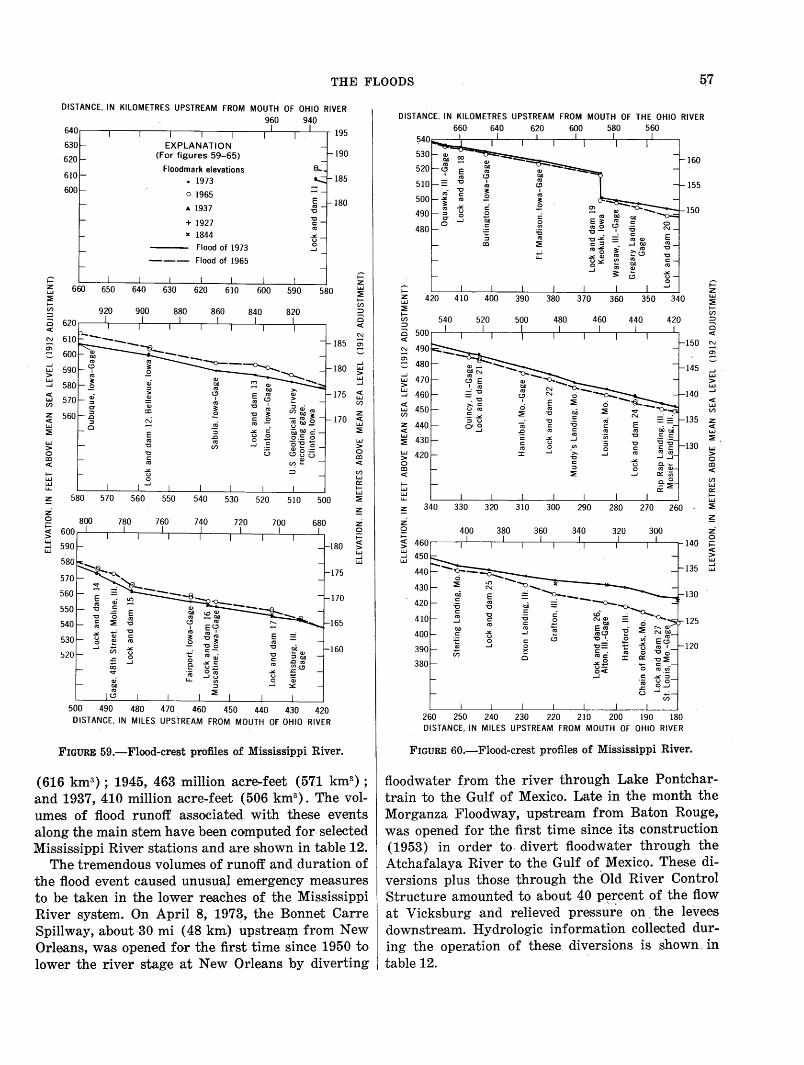
THE FLOODS &7 DISTANCE, IN KILOMETRES UPSTREAM FROM MOUTH OF OHIO RIVER
960 940 640 195
EXPLANATION (For figures 59-65) 190
Floodmark elevations • 1973 185
0 1965
... 1937 180
+ 1927 X 1844
Flood of 1973
--- Flood of 1965
t=' t=' z z LJ.J 610 600 590 580 LJ.J
::!E :::?!
1-1-(/)
(/) 920 900 880 860 ::J ::J
3 3 <(
<(
~ 185 ~
~ ~
-J 180 -J
1.1.1 LJ.J
> > LJ.J ~ -J
<( 175 <(
LJ.J 1.1.1 (/) (/)
z z <( 170 <(
1.1.1 LJ.J
::!E ::!E
1.1.1 LJ.J
> > 0 0 co co <( <(
1- (/)
LJ.J 1.1.1 LJ.J Ct: I..L. 1-
LJ.J
~ 560 550 540 530 520 510 500 ::!E
z ~ 0 780 760 740 z i= <( 0 > i= 1.1.1 -J 180
<(
1.1.1 > LJ.J -J LJ.J
175
170
165 .;;c.
~ -g E u
"' -..3 "' Vi .;;c. "'C ~ 160 u ....; "'C ~ QJ
.s= ..3 0 ~I:>D
00 ~ g .Cro
.... ~
.;;c. ~~ u ..3 ·a;
::.::
500 490 480 470 460 450 440 430 420 DISTANCE, IN MILES UPSTREAM FROM MOUTH OF OHIO RIVER
FIGURE 59.-Flood-crest profiles of Mississippi River.
(616 km3 ) ; 1945, 463 million acre-feet (571 km3) ;
and 1937, 410 million acre-feet (506 km3). The vol
umes of flood runoff associated with these events along the main stem have been computed for. selected Mississippi Rhner stations and a.re shown in table 12.
The tremendous volumes of runoff and duration of the flood event caused unusuaJ emergency measures to be taken in the lower reaches of the Mississippi River system. On April 8, 197~, the Bonnet Carre Spillway, about·30 mi (48 km.) upstrea~ from New Orleans, was opened for the first time since 1950 to lower the river stage at New Orleans by diverting
DISTANCE. IN KILOMETRES UPSTREAM FROM MOUTH OF THE OHIO RIVER
;::: z LJ.J ::!E 1-C/)
::J
3 <(
-J 1.1.1 > 1.1.1 -J
<( 1.1.1 (/)
z <( LJ.J ::!E LJ.J > 0 co <(
1-LJ.J
~
~
z 0 i= <( > LJ.J -J LJ.J
660 640 620 600 580 560
330 320 310 300 290 280 270 260
400 380 360 340 320 300
160
155
150
145 -J LJ.J > LJ.J
140 -J <( LJ.J (/)
135 z <( LJ.J ::!E
130 1.1.1
> 0 co <(
(/) LJ.J Ct: 1-LJ.J ::!E
~
z ,---,r--~-L--,--L~--~----~--~-L--~140 g
260 250 240 230 220 210 200 190 180 DISTANCE, IN MILES UPSTREAM FROM MOUTH OF OHIO RIVER
<( > ~
135 LJ.J
130
125
120
FIGURE 60.-Flood-crest profiles of Mississippi River.
floodwater f;rom the river through Lake Pontchartrain to the Gulf of Mexico. Late in the month the Morganza Floodway, upstream from Baton Rouge, was opened for the first time since its construction (1953) in order to. divert floodwater through the Atchafalaya River to the Gulf of Mexico. Th~se diversions plus those through the Old River Control Structure amounted to about 40 percent of the flow at Vicksburg and relieved pressure on, the levees downstream. Hydrologic information collected during the oper.ation of these diversions is shown. in table 12.
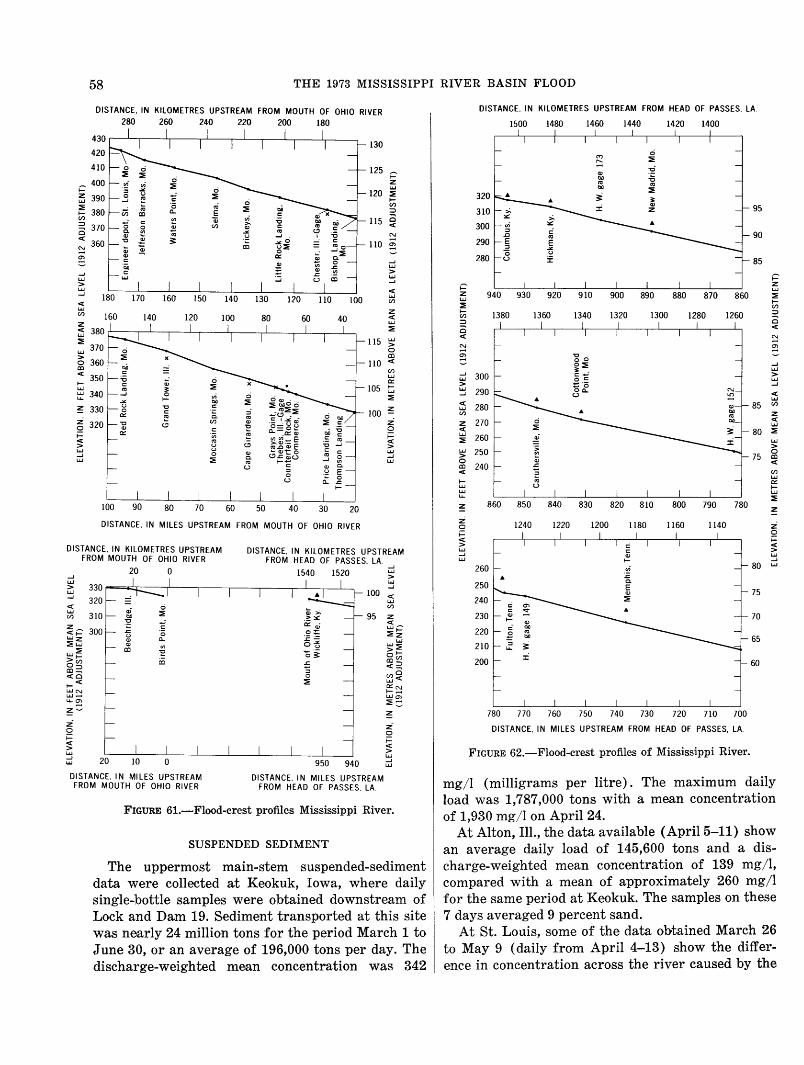
58 THE 1973 MISSISSIPPI RIVER BASIN FLOOD
DISTANCE. IN KILOMETRES UPSTREAM FROM MOUTH OF OHIO RIVER
420
410
~ 400 1-
;5 390
~ 380 (/)
3 370
C( 360 ~
c ...J u.J > u.J ...J
C( L.iJ (/)
z 160
280 260 240 220 200 180
130 120 110 100
140 120 100 80
~ 380c---,-~-,--~,---~---,~--~~~--~ ~ L.iJ 370
i::; 360 c:o C( 350 1-u.J
~ 340
~ 330
~ 320 ~ C( > L.iJ ...J L.iJ
100
en 0 t:ID ~
·= c. :::>
"' (/) <I>
c:: ~ -~ C!:)
<I> 0 :::!: ~
(.)
60
o<l>· :::!: ODO 0 ...;~~-~ C: I ....::.;:: ~
~~-~~ ~~-~~ -g -Q)-O C!:l..c:Q:;u "' ~--~
...J
Q.) :::> u 0
~ (.)
50 40 30 20
DISTANCE. IN MILES UPSTREAM FROM MOUTH OF OHIO RIVER
130
125
120
115
110
115
110
105
100
~ z u.J
~ 1-(/)
:::l
0 C(
~ ~
...J u.J > ~ C( u.J (/)
z C( u.J
~
L.iJ > 0 c:o C(
(/) L.iJ 0::: 1-
~ ~
z 0 ~ C( > L.iJ ...J u.J
DISTANCE. IN KILOMETRES UPSTREAM FROM MOUTH OF OHIO RIVER
20 0
DISTANCE. IN KILOMETRES UPSTREAM FROM HEAD OF PASSES, LA. _,
...J L.iJ > u.J ...J
C( 320
1540 1520 ~ L.iJ ...J
~ 310
~~ 300 wz ~u.J
~~ ~~ CCCI 1-C( L.i.JN w ..... 1..&..~ z~
z 0 ~ C( > L.iJ ...J L.iJ 20
Dl STANCE. IN MILES UPSTREAM FROM MOUTH OF OHIO RIVER
DISTANCE. IN MILES UPSTREAM FROM HEAD OF PASSE& LA.
FIGURE 61.-Flood-crest profiles Mississippi River.
SUSPENDED SEDIMENT
The uppermost main-stem suspended-sediment data were collected at Keokuk, Iowa, where daily single-bottle samples were obtained downstream of Lock and Dam 19. Sediment transported at this site was nearly 24 million tons for the period March 1 to June 30, or an average of 196,000 tons per day. The discharge-weighted mean concentration was 342
DISTANCE. IN KILOMETRES UPSTREAM FROM HEAD OF PASSES. LA.
1500 1480 1460 1440 1420 1400
320
310 95
300 90
290
280 85
~ ~ z
L.iJ z 940 920 910 900 890 880 870 860 :::!: L.iJ
~ 1-(/)
1- 1380 1360 1340 1320 1300 1280 1260 :::l (/)
:::l 0 0 C(
C( ~ ~ ~ ~ "0 .
0 0 0~ ...J
...J 3: - L.iJ
300 c::- > u.J 0 c:: L.iJ > :::·o ...J L.iJ 290 ca.. ...J (.) C(
L.iJ C( L.iJ 280 85 (/)
(/) z z 270 C(
L.iJ C( 80 :::!: L.iJ 260 ~ L.iJ
> L.iJ 250 0 > 75 c:o 0 C( c:o 240 C( (/)
u.J 1- 0::: L.iJ 1-L.iJ L.iJ 1..&.. ~
~ 860 850 840 830 820 810 800 790 780 ~
z 1240 1220 1200 1180 1160 1140 z 0 ~ 0 C( ~ > C(
~ > L.iJ
L.iJ ...J
260 80 L.iJ
250 75
240
230 70
220 65
210
200 60
780 770 760 750 740 730 720 710 700
DISTANCE. IN MILES UPSTREAM FROM HEAD OF PASSES, LA.
FIGURE 62.-Flood-crest profiles of Mississippi River.
mg/l (milligrams per litre). The maximum daily load was 1,787,000 tons with a mean concentration of 1,930 mg/1 on April 24.
At Alton, Ill., the data available (April5-11) show an average daily load of 145,600 tons and a discharge-weighted mean concentration of 139 mg/l, compared with a mean of approximately 260 mg/l for the same period at Keokuk. The samples on these 7 days averaged 9 percent sand.
At St. Louis, some of the data obtained March 26 to May 9 (daily from April 4-13) show the difference in concentration across the river caused by the
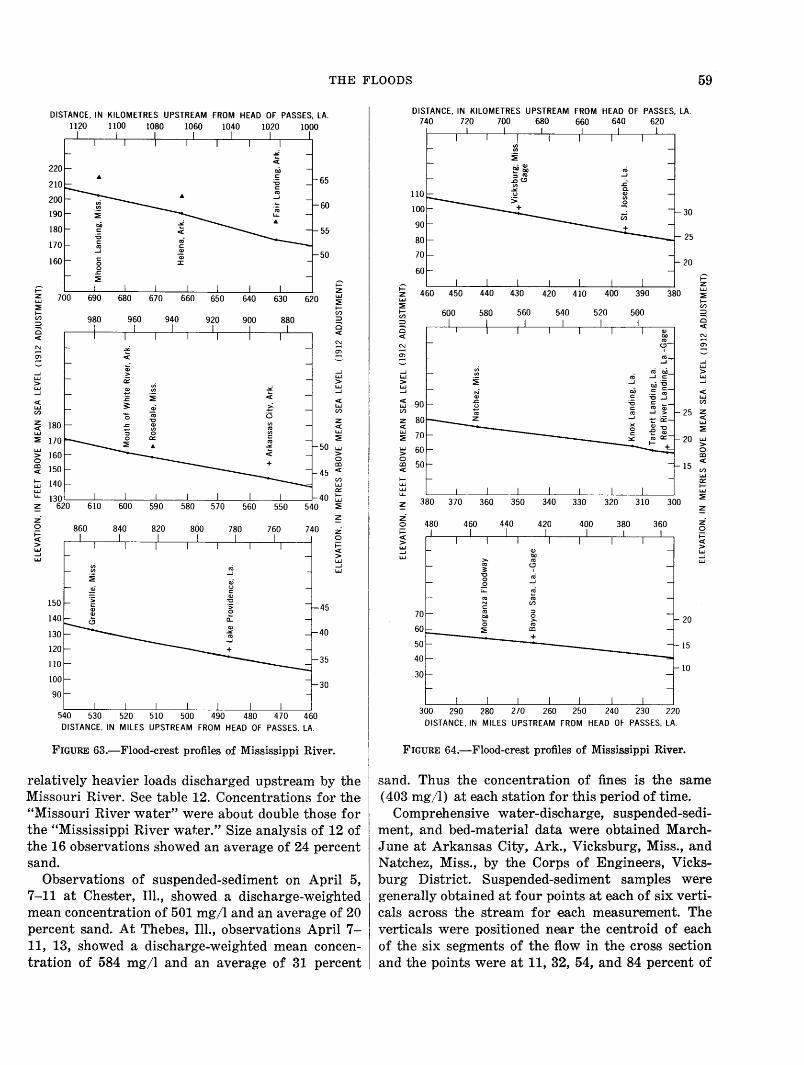
THE FLOODS 59
DISTANCE, IN KILOMETRES UPSTREAM FROM HEAD OF PASSES, LA. 1120 1100 1080 1060 1040 1020 1000
65
60
55
50
t=' t=' z
z 700 620 1.1.1 1.1.1 :::!: :::!: I-I- en en 980 960 940 920 900 880 :::J :::J 0 c ~ ~
~ ~ ~
~ .;c ~
....J ~ ....J 1.1.1 0:
1.1.1
> ~ >
1.1.1 2 ~ 1.1.1 ....J i .;c ....J
E ~ ~ 3: z5 1.1.1 1.1.1 eli en en 0 «; C3 z 180
"C V) z
~ e: ~
~ 1.1.1 0 1.1.1
:::!: a:: ~
:::!:
1.1.1 .;c 50 1.1.1
> > 0 + 0 c:l c:l ~ 150 45 ~ I- en 1.1.1 1.1.1
:::: a:: 40 I-
1.1.1
~ 560 550 540 :::!:
z ~ 0 860 840 820 800 780 760 740 z i= ~ 0 > i= ~ ~
> 1.1.1 1.1.1 ....J 1.1.1
150 45
130 40
110 35
30
540 520 510 500 490 480 470 460 DISTANCE, IN MILES UPSTREAM FROM HEAD OF PASSES, LA.
FIGURE 63.-Flood-crest profiles of Mississippi River.
relatively heavier loads discharged upstream by the Missouri River. See table 12. Concentrations for the "Missouri River water" were about double those for the "Mississippi River water." Size analysis of 12 of the 16 observations showed an average of 24 percent sand.
Observations of suspended-sediment on April 5, 7-11 at Chester, Ill., showed a discharge-weighted mean concentration of 501 mg/l and an average of 20 percent sand. At Thebes, Ill., observations April 7-11, 13, showed a discharge-weighted mean concentration of 584 mg/l and an average of 31 percent
DISTANCE, IN KILOMETRES UPSTREAM FROM HEAD OF PASSES, LA. 740 720 700 680 660 640 620
20
15
10
300 290 280 270 260 250 240 230 220 DISTANCE, IN MILES UPSTREAM FROM HEAD OF PASSES, LA.
FIGURE 64.-Flood-crest profiles of Mississippi River.
sand. Thus the concentration of fines is the same ( 403 mg/l) at each station for this period of time.
Comprehensive water-discharge, suspended-sediment, and bed-material data were obtained MarchJune at Arkansas City, Ark., Vicksburg, Miss., and Natchez, Miss., by the Corps of Engineers, Vicksburg District. Suspended-sediment samples were generally obtained at four points at each of six verticals across the stream for ~each measuflement. The verticals were pos,itioned near the centroid of each of the six segments of the flow in the cross section and the points were at 11, 32, 54, and 84 percent of
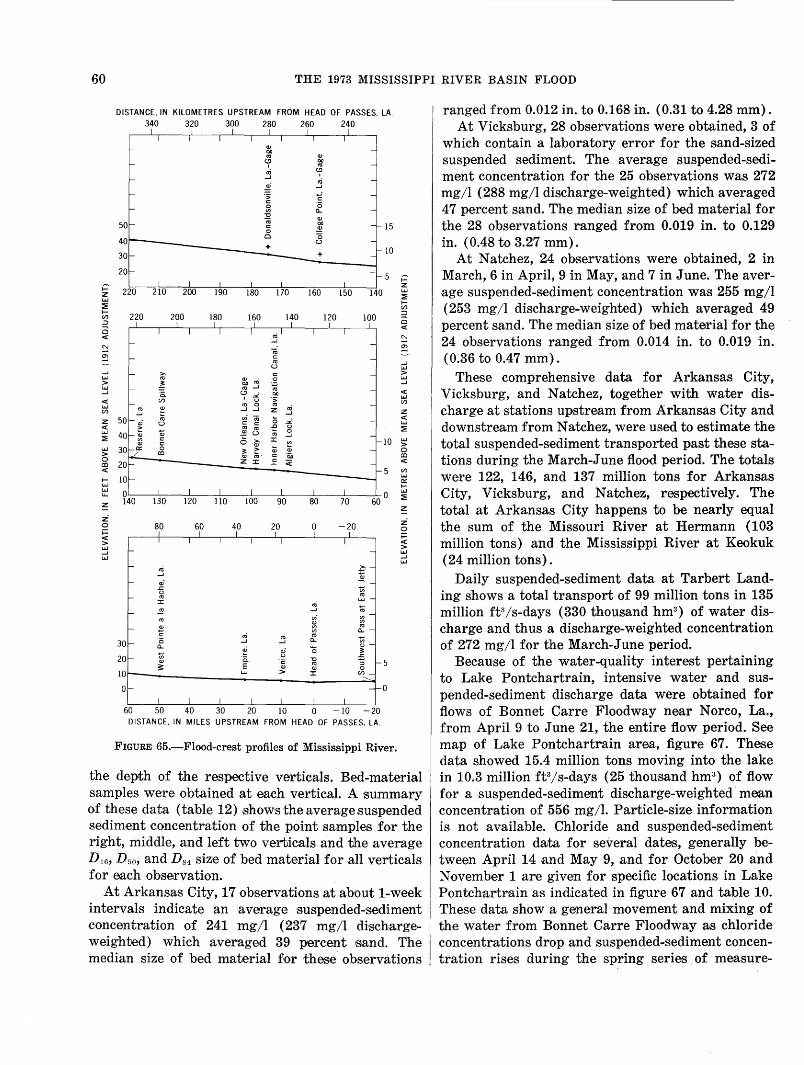
60 THE 1973 MISSISSIPPI RIVER BASIN FLOOD
DISTANCE. IN KILOMETRES UPSTREAM FROM HEAD OF PASSES, LA. 340 320 300 280 260 240
15
10
5 ~ ~ z
UJ z ~ UJ ~
~ V) ~
220 200 180 160 140 120 100 :::1
(/) c; :::l c; <(
<( s:: s:: ~
~ ~
"' ...J u UJ ...J >- c: > UJ "' Q) • 0 UJ > ~ tliJ "' ~
...J
~ "'...J <( ·c. (.!) - tliJ
•""' UJ <( (/) . u ·~ V) UJ Q) ~.3 z ro (/) ...J z z ~ cnro 0 i
<(
u c: c: UJ <( "' "' ~ ~ UJ Q) ~u .3 ~ c: 0 >- :I: (/) 10 UJ
c: Q) > UJ 0
~ > Q) Q) 0
> co ro· c: tiD co 0 z :I: c: ;;;: <( co <( 5 (/)
UJ ~ 0::: UJ ~
~ 60 °
UJ
110 90 70 ~
~ ~ z z-0 80 60 40 20 0 -20 0 ;:::: I I I I I I ;:::: <( I I I I I I I <( > ~ - - >
UJ UJ ...J
UJ - ro ~-
...J Q)
-
~ i--
:I: j LLJ-
~ "' -
~ ~-
- Q) a..-c: ro j ~-30- 0 ...J a.. a..
~ .~ 0 ;!:
20- (/) ·c. ~ .s::
~ c: -;-~5 E Q) Q) 0 10- LLI > :I: ~-or- --0
I I I I I I I 60 50 40 30 20 10 0 -10 -20
DISTANCE. IN MILES UPSTREAM FROM HEAD OF PASSE~ L~
FIGURE 65.-Flood-crest profiles of Mississippi River.
the depth of the respective verticals. Bed-material samples were obtained at each vertical. A summary of these data (table 12) .shows the average suspended sediment concentration of the point samples for the right, middle, and left two verticals and the average D16' D5o, and Dsi size of bed material for all verticals for each observation.
At Arkansas City, 17 observations at about 1-week intervals indicate an average ·suspended-sediment concentration of 241 mg/1 (237 mg/1 dischargeweighted) which averaged 39 percent 1sand. The median size of bed material for these observations
ranged from 0.012 in. to 0.168 in. (0.31 to 4.28 mm). At Vicksburg, 28 observations were obtained, 3 of
which contain a laboratory error for the sand-sized suspended sediment. The average suspended-sediment concentration for the 25 observations was 272 mg/l (288 mg/1 discharge-weighted) which averaged 47 percent sand. The median size of bed material for the 28 observations ranged from 0.019 in. to 0.129 in. (0.48 to 3.27 mm).
At Natchez, 24 observations were obtained, 2 in March, 6 in April, 9 in May, and 7 in June. The average suspended-sediment concentration was 255 mg/1 (253 mg/l discharge-weighted) which averaged 49 percent sand. The median size of bed material for the 24 observations ranged from 0.014 in. to 0.019 in. (0.36 to 0.47 mm).
These comprehensive data for Arkansas City, Vicksburg, and Natchez, together with water discharge at stations upstream from Arkansas City and downstream from Natchez, were used to estimate the total suspended-sediment transported past these stations during the March-June flood period. The totals were 122, 146, and 137 million tons for Arkansas City, Vicksburg, and Natchez, respectively. The total at Arkansas City happens to be nearly equal the sum of the Missouri River at Hermann (103 million tons) and the Mississippi River at Keokuk (24 million tons) .
Daily suspended-s.ediment data at Tarbert Landing shows a total transport of 99 million tons in 135 million ft3 /s-days (330 thousand hm3
) of water discharge and thus a discharge-weighted concentration of 272 mg/1 for the March-June period .
Because of the water-quality interest pertaining to Lake Pontchartrain, intensive water and suspended-sediment discharge data were obtained for flows of Bonnet Carre Floodway near Norco, La., from April 9 to June 21, the entire flow period. See map of Lake Pontchartrain area, figure 67. These data showed 15.4 million tons moving into the 'lake in 10.3 million ft3/s-days (25 thousand hm3
) of flow for a suspended-sediment discharge-weighted mean concentration of 556 mg/l. Particle-size information is not available. Chloride and suspended-sediment Goncentration data for several dates, generally between April 14 and May 9, and for October 20 and November 1 are given for specific locations in Lake Pontchartrain a:s indicated in figure 67 and table 10. These data show a general movement and mixing of the wate·r from Bonnet Carre Floodway a~S chloride concentrations drop and suspended-sediment concentration rises during the spring series. of measure-
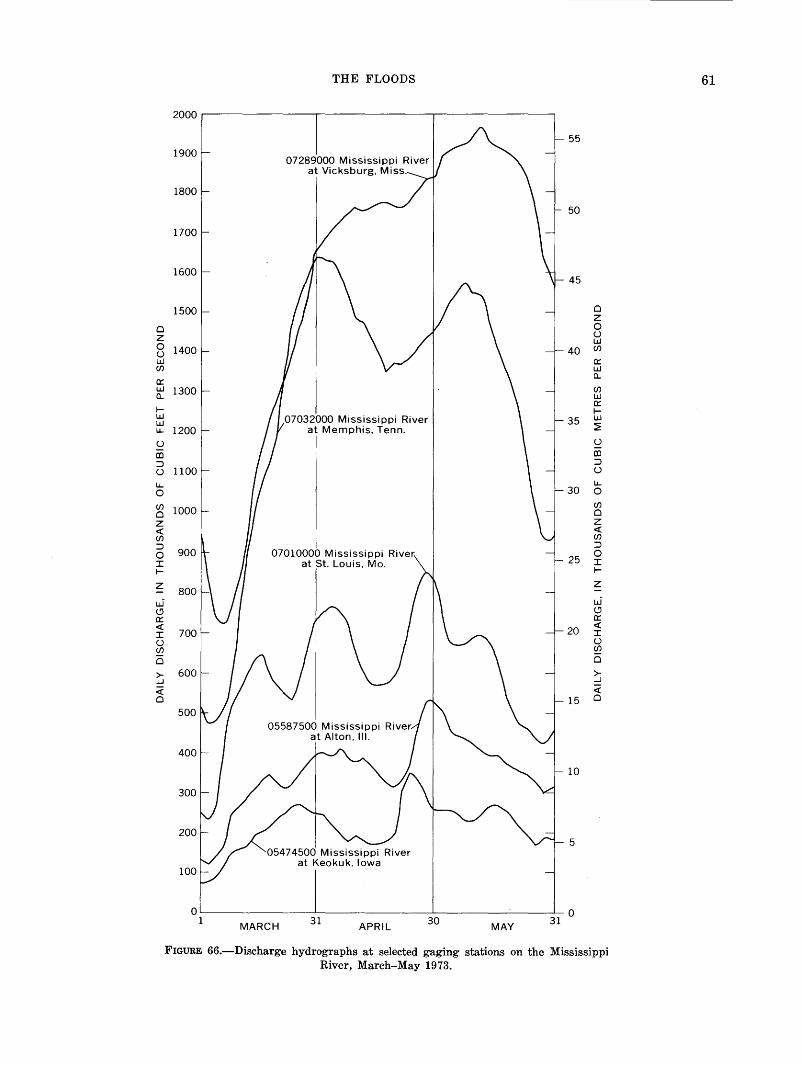
THE FLOODS
2000
55
1900
1800
50
1700
1600 45
1500 0 z
0 0 () z w
0 1400 40 (/) () w a:: (/) w
11. a:: w 1300 (/) 11. w
a:: ~ ~ w 07032000 Mississippi River 35 w w ~ lL. 1200 at Memphis, Tenn. () S2 OJ OJ ::J ::J () 1100 ()
lL. lL.
0 30 0
(/) (/)
0 1000 0 z z <{ <{ (/) (/)
::J ::J 0 900 07010000 Mississippi River.
25 0
I at St. Louis, Mo. I 1- ~
z z 800
LLi LLi (!) a:: <{ I () (/)
Ci >-_J
~ 0
(!) a::
20 <{
700 I ()
~ 0
600 >-_J
~ 15 0
500
400
10
300
200 5
QL_ ______________ L_--------------~--------------~0 1 MARCH 31
APRIL 30
MAY 31
FIGURE 66.-Discharge hydrographs at selected gaging stations on the Mississippi River, March-May 1973.
61
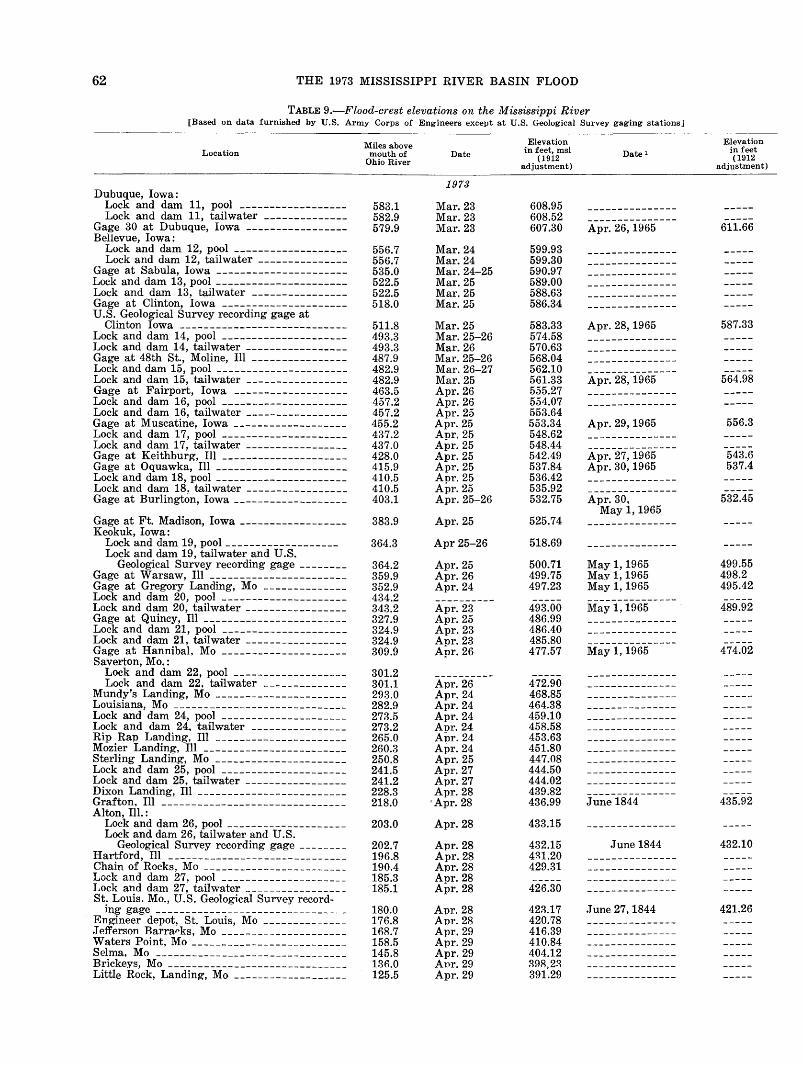
62 THE 1973 MISSISSIPPI RIVER BASIN FLOOD
TABLE 9.-Flood-crest elevations on the Mississippi River [Based on data furnished by U.S. Army Corps of Engineers except at U.S. Geological Survey gaging stations]
Location
Dubuque, Iowa: Lock and darn 11, pool -----------------Lock and dam 11, tailwater -------------
Gage 30 at Dubuque, Iowa ----------------Bellevue, Iowa:
Lock and dam 12, pool ------------------Lock and dam 12, tailwater --------------
Gage at Sabula, Iowa ---------------------Lock and dam 13, pool ---------------------Lock and dam 13, tailwater ---------------Gage at Clinton, Iowa --------------------U.S. Geological Survey recording gage at
Clinton Iowa ---------------------------Lock and dam 14, pool --------------------Lock and dam 14, tailwater ----------------Gage at 48th St., Moline, Ill ---------------Lock and dam 15, pool ---------------------Lock and dam 15, tailwater ----------------Gage at Fairport, Iowa ------------------Lock and dam 16, pool --------------------Lock and dam 16, tailwater ----------------Gage at Muscatine, Iowa ------------------Lock and dam 17, pool --------------------Lock and dam 17, tailwater ----------------Gage at Keithburg, Ill --------------------Gage at Oquawka, Ill ---------------------Lock and darn 18, pool ---------------------Lock and dam 18. tailwater ----------------Gage at Burlington, Iowa -------------------
Gage at Ft. Madison, Iowa -----------------Keokuk, Iowa:
Lock and dam 19, pool------------------Lock and darn 19, tailwater and U.S.
Geological Survey recording gage -------Gage at Warsaw, Ill ----------------------Gage at Gregory Landing, Mo -------------Lock and dam 20, pool --------------------Lock and dam 20, tailwater ----------------Gage at Quincy, Ill -----------------------Lock and dam 21, pool --------------------Lock and darn 21, tailwater ----------------Gage at Hannibal. Mo --------------------Saverton, Mo. :
Lock and dam 22, pool ------------------Lock and dam 22, tailwater -------------
Mundy's Landing, Mo ---------------------Louisiana, Mo ----------------------------Lock and dam 24, pool --------------------Lock and dam 24, tailwater ---------------Rip Rap Landing, Ill ---------------------Mozier Landing, Ill -----------------------Sterling Landing, Mo ---------------------Lock and dam 25, pool --------------------Lock and dam 25, tailwater ----------------Dixon Landing, Ill -------------------------Grafton, Ill ______________________________ _ Alton, Ill. :
Lock and dam 26, pool -------------------Lock and dam 26, tailwater and U.S.
Geological Survey recording gage _______ _ Hartford, Ill -----------------------------Chain of Rocks, Mo ----------------------- _ Lock and dam 27, pool -------------------- _ Lock and dam 27, tailwater ----------------St. Louis. Mo., U.S. Geological Survey record-
ing gage -------------------------------Engineer depot, St. Louis, Mo --------------Jefferson Barra,ks, Mo --------------------Waters Point, Mo -------------------------Selma, Mo --------------------------------Brickeys, Mo _____________________________ _ Little Rock, Landing, Mo -------------------
Miles above mouth of
Ohio River
583.1 582.9 579.9
556.7 556.7 535.0 522.5 522.5 518.0
511.8 493.3 493.3 487.9 482.9 482.9 463.5 457.2 457.2 455.2 437.2 437.0 428.0 415.9 410.5 410.5 403.1
383.9
364.3
364.2 359.9 352.9 434.2 343.2 327.9 324.9 324.9 309.9
301.2 301.1 293.0 282.9 273.5 273.2 265.0 260.3 250.8 241.5 241.2 228.3 218.0
203.0
202.7 196.8 190.4 185.3 185.1
180.0 176.8 168.7 158.5 145.8 1311.0 125.5
Date
1973
Mar. 23 Mar. 23 Mar. 23
Mar. 24 Mar. 24 Mar. 24-25 Mar. 25 Mar. 25 Mar. 25
Mar. 25 Mar. 25-26 Mar. 26 Mar. 25-26 Mar. 26-27 Mar. 25 Apr. 26 Apr. 26 Apr. 25 Apr. 25 Anr. 25 Apr. 25 Apr. 25 Apr. 25 Anr. 25 Apr. 25 Apr. 25-26
Apr. 25
Apr 25-26
Apr. 25 Apr. 26 Apr. 24
Apr. 23 Apr. 25 Apr. 23 Anr. 23 Apr. 26
Apr. 26 Apr. 24 Apr. 24 Apr. 24 Anr. 24 A:Pr. 24 Apr. 24 Apr. 25 Apr. 27 Apr. 27 Apr. 28
•Apr. 28
Apr. 28
Apr. 28 Apr. 28 Apr. 28 Anr. 28 Apr. 28
Apr. 28 Apr. 28 Apr. 29 Apr. 29 Apr. 29 Anr. 29 Apr. 29
Elevation in feet, msl
(1912 adjustment)
608.95 608.52 607.30
599.93 599.30 590.97 589.00 588.63 586.34
583.33 574.58 570.63 568.04 562.10 561.33 555.27 554.07 553.64 553.34 548.62 548.44 542.49 537.84 536.42 535.92 532.75
525.74
518.69
500.71 499.75 497.23
493.00 486.99 486.40 485.80 477.57
472.90 468.85 464.38 459.10 458.58 453.63 451.80 447.08 444.50 444.02 439.82 436.99
433.15
432.15 4R1.20 429.31
426.30
423.17 420.78 416.39 410.84 404.12 3!lR,2!-l 391.29
Date 1
Apr. 26, 1965
Apr. 28, 1965
Apr. 28, 1965
Apr. 29, 1965
Apr. 27, 1965 Apr. 30, 1965
Apr. 30, May 1,1965
May 1,1965 May 1,1965 May 1,1965
May 1,1965
May 1,1965
June 1844
June 1844
June 27,1844
Elevation in feet (1912
adjustment)
611.66
587.33
564.98
556.3
543.6 537.4
532.45
499.55 498.2 495.42
489.92
474.02
435.92
432.10
421.26
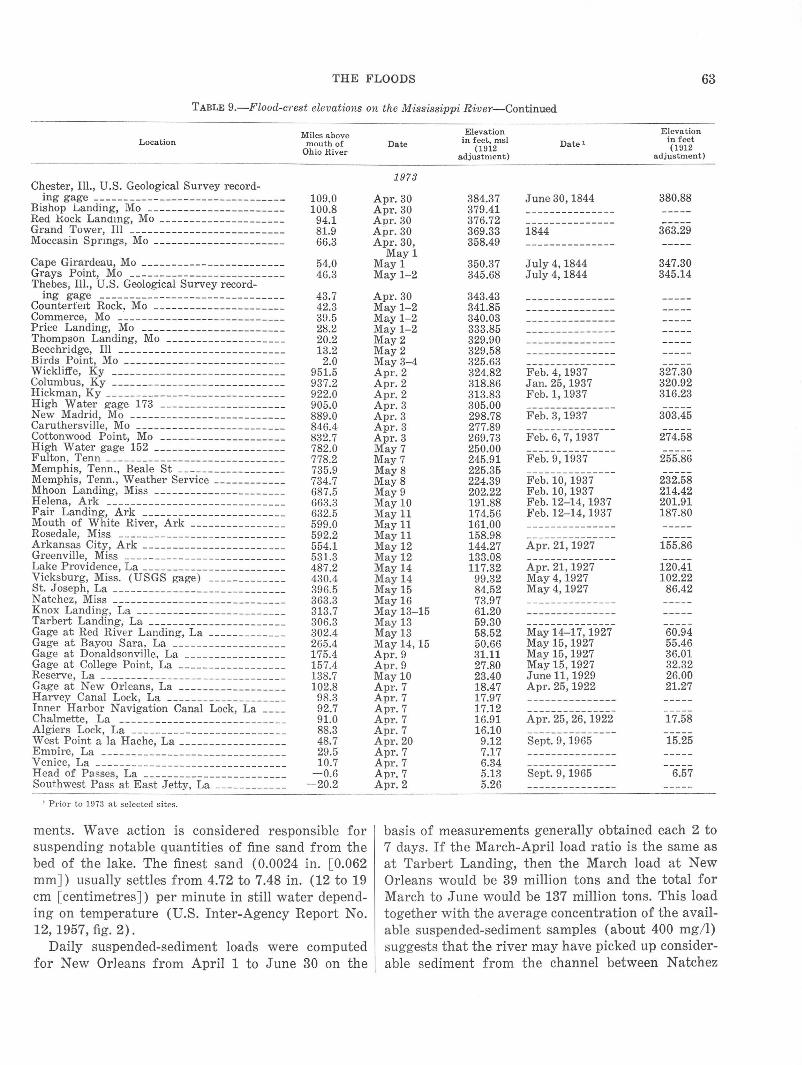
THE FLOODS 63
TABLE 9.-Flood-crest elevations on the Mississippi River-Continued
Location
Chester, Ill. , U.S. Geological Survey record-ing gage -------------------------------
Bishop Landing, Mo ----------------------Red Kock Lanamg, Mo --------------------Grand Tower, Ill -------------------------Moccasin Spnngs, Mo ----------------------
Cape Girardeau, Mo -----------------------Grays Point, Mo -------------------------Thebes, Ill., U.S. Geological Survey record-
ing gage ------------------------------Counterfeit Rock. Mo ------------------ ---Commerce, Mo --------------------- --- ---Price Landing, Mo -----------------------Thompson Landing, Mo -------------------Beechridge, Ill --------------------------- Birds Point, Mo --------------------------Wickliffe, Ky ---- --------------------- ---Columbus, Ky ----------------------------Hickman, Ky ---- -------------------------High Water gage 173 -------------------- New Madrid, Mo -------------------------Caruthersville, Mo -- ----------------------Cottonwood Point, Mo -------------------- High Water gage 152 -- -------------------Fulton, Tenn ----------- -- ----------------Memphis, Tenn., Beale St -- - -------- ------Memphis, Tenn., Weather Service -----------Mhoon Landing, Miss ---------------------Helena, Ark ----- -- - ---------- ----- ------Fair Landing, Ark -----------------------Mouth of White River, Ark ---------------Rosedale, Miss ---------------------------Arkansas City, Ark ---------------- -------Greenville, Miss --- -------- ----- ----------Lake Providence, La -----------------------Vicksburg, Miss. (USGS gage) ---- - -- -----St Joseph, La ----------------------------Natchez, Miss --------------------- - -- ----Knox Landing, La ------- ---- ---------- ---Tarbert Landing, La ----------------------Gage at Red River Landing, La ------------Gage at Bayou Sara, La ---- - -------------Gage at Donaldsonville, La ----------------Gage at College Point, La ------------- ----Reserve, La ------------------------------Gage at New Orleans, La -----------------Harvey Canal Lock, La -- - - ----------------Inner Harbor Navigation Canal Lock, La ___ _ Chalmette, La --------------------- ------Algiers Lock, La -------------- ---------- - West Point a la Hache, La -----------------Emoire, La --------------------- ---------Venice, La -- - ----------------------------Head of Pa sses, La -------------------- ---Southwest Pass at East Jetty, La ------------
J Prior to 1973 at selected sitcg.
Miles above mouth of
Ohio River
109.0 100.8 94.1 81.9 66.3
54.0 46.3
43.7 42.3 39.5 28.2 20.2 13.2
2.0 951.5 937.2 922.0 905.0 S89.0 846.4 S32.7 782.0 778.2 735.9 734.7 687.5 663.3 632.5 599.0 592.2 554.1 531.3 487.2 430.4 396.5 363.3 313.7 306.3 302.4 265.4 175.4 157.4 138.7 102.S 98.3 92.7 91.0 SS.3 48.7 29.5 10.7
-0.6 -20.2
ments. Wave action is considered responsible for suspending notable quantities of fine sand from the bed of the lake. The finest sand (0.0024 in. [0.062 mm]) usually settles from 4.72 to 7.48 in. (12 to 19 em [centimetres]) per minute in still water depending on temperature (U.S. Inter-Agency Report No. 12, 1957, fig. 2) 0
Daily suspended-sediment lo·ads were computed for New Orleans from April 1 to June 30 on the
Elevation
Date in feet, msl (1912
adjustment)
1973
Apr. 30 3S4.37 Apr. 30 379.41 Apr. 30 376.72 Apr. 30 369.33 Apr. 30, 35S.49
May1 May 1 350.37 May 1-2 345.6S
Apr. 30 343.43 May 1-2 341.S5 May 1-2 340.03 May 1-2 333.S5 May2 329.90 May2 329.5S May3-4 325.63 Apr. 2 324.S2 Apr. 2 31S.S6 Apr. 2 313.83 Apr. 3 305.00 Apr. 3 298.7S Apr. 3 277.89 Apr. 3 269.73 May7 250.00 May7 245.91 MayS 225.35 MayS 224.39 May9 202.22 May10 191.88 May 11 174.56 May11 161.00 May 11 158.98 May12 144.27 May12 133.08 May 14 117.32 May14 99.32 May15 84.52 May16 73.97 May 13-15 61.20 May 13 59.30 May13 58.52 May 14,15 50.66 Apr. 9 31.11 Apr. 9 27.80 May10 23.40 Apr. 7 18.47 Apr. 7 17.97 Apr. 7 17.12 Apr. 7 16.91 Apr. 7 16.10 Apr. 20 9.12 Apr. 7 7.17 Apr. 7 6.34 Apr. 7 5.13 Apr. 2 5.26
Date 1
June 30, 1S44 ---- ------ -------------- ------1S44 ---------------July 4,1S44 July 4, 1S44
--- ------------------------------------------------------------------------------------------------------Feb.4,1937 Jan.25,1937 Feb. 1,1937 ---------------Feb.3,1937 ---------------Feb.6,7,1937 ---------------Feb.9,1937 ---------------Feb. 10, 1937 Feb.10,1937 Feb.12-14,1937 Feb.12-14,1937 ----- -------------------------Apr. 21, 1927 ---------------Apr. 21, 1927 May4, 1927 May4, 1927 ------------------------- --------------------May 14-17, 1927 May 15,1927 May 15,1927 May 15,1927 June 11, 1929 Apr. 25, 1922 ------- -----------------------Apr. 25, 26, 1922 -- --- - -·--------Sept.9, 1965 ------------------------------Sept. 9, 1965 ---------------
Elevation in feet (1912
adjustment)
380.88
363.29
347.30 345.14
327.30 320.92 316.23
303.45
274.58
255.86
232.58 214.42 201.91 187.80
155.86
120.41 102.22
86.42
60.94 55.46 36.01 32.32 26.00 21.27
17.5S
15.25
6.57
basis of mea:mrements generally obtained each 2 to 7 days. If the March-April load ratio is the same as at Tarbert Landing, then the March load at New Orleans would be 39 million tons and the total for March to June would be 137 million tons. This load together with the average concentration of the available suspended-s·ediment samples (about 400 mg/ 1) suggests that the river may have picked up considerable sediment from the channel between Natchez
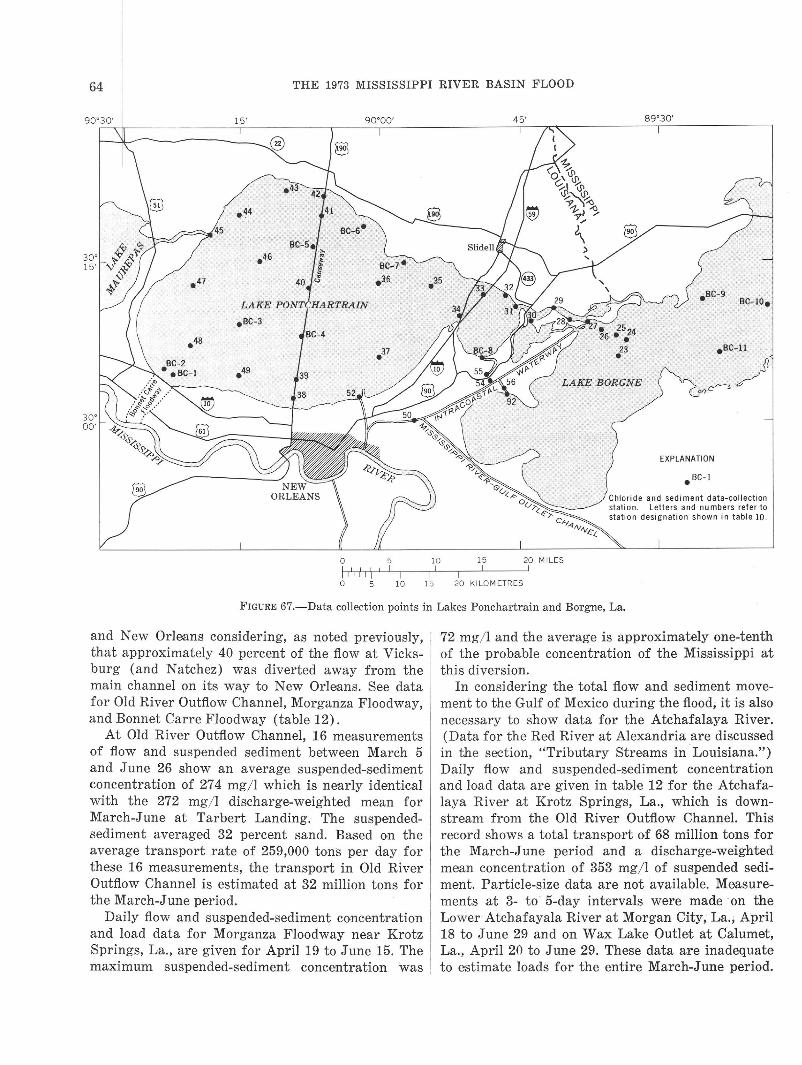
64 THE 1973 MISSISSIPPI RIVER BASIN FLOOD
0 5 10 15
45' 89"30'
.sc-u
LAKE BORGNE on~ ~
20 MILES
EXPLANATION
•BC-1
Chloride and sediment data-col lection station. Letters and numbers refer to station designation shown in table 10 .
0 10 15 20 KILOM ET RES
FIGURE 67.- Data collection points in Lakes Ponchartrain and Borgne, La.
and New Orleans considering, as noted previously, that approximately 40 percent of the flow at Vicksburg (and Natchez) was diverted away from the main channel on its way to New Orleans. See data for Old River Outflow Channel, Morganza Floodway, and Bonnet Carre Floodway (table 12).
At Old River Outflow Channel, 16 measurements of flow and suspended sediment between March 5 and June 26 show an average suspended-sediment concentration of 27 4 mg/ 1 which is nearly identical with the 272 mg/ 1 discharge-weighted mean for March-June at Tarbert Landing. The suspendedsediment averaged 32 percent sand. Based on the average transport rate of 259,000 tons per day for these 16 measurements, the transport in Old River Outflow Channel is estimated at 32 million tons for the March-June period.
Daily flow and suspended-sediment concentration and load data for Morganza Floodway near Krotz Springs, La., are given for April 19 to June 15. The maximum suspended-sediment concentration 'was
72 mg/ l and the average is approximately one-tenth of the probable concentration of the Mississippi at this diversion.
In considering the total flow and sediment movement to the Gulf of Mexico during the flood; it is also necessary to show data for the Atchafalaya River. (Data for the Red River at Alexandria are discussed in the section, "Tributary Streams in Louisiana.") Daily flow and suspended-sediment concentration and load data are given in table 12 for the Atchafalaya River at Krotz Springs, L.a., which is downstream from the Old River Outflow Channel. This record shows a total transport of 68 million tons for the March-June period and a discharge-weighted mean concentration of 353 mg/ l of suspended sediment. Particle-size data are not available. Measurements at 3- to · 5-day intervals were made ·on the LoweT Atchafayala River at Morgan City, La.; April 18 to June 29 and on Wax Lake Outlet at Calumet, La., April 20 to June 29. These data are inadequate to estimate loads for the entire March-June period.
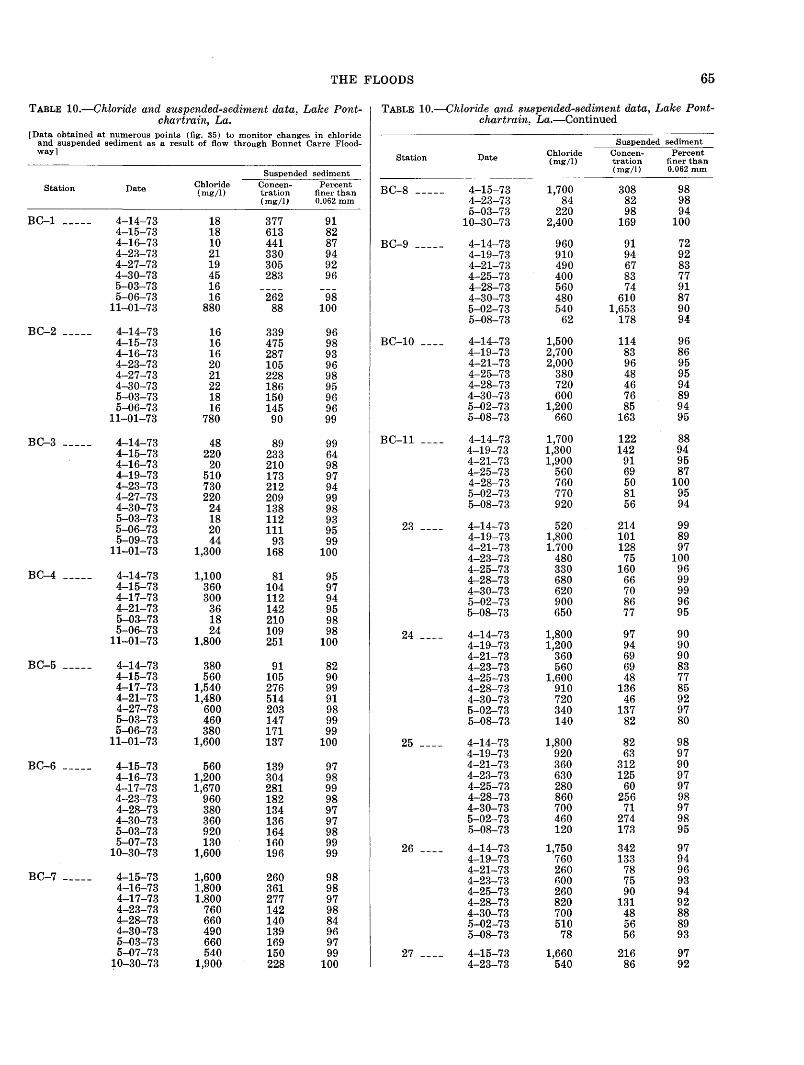
THE FLOODS 65
TABLE 10.-Chloride and suspended-sediment data~ Lake Pont- TABLE 10.-Chloride and susvended-sediment data, Lake Pont-chartrain, La. chartrain~ £a.-Continued
[Data obtained at numerous points (fig. 35) to monitor changes in chloride ~ended sediment and suspended sediment as a result of flow through Bonnet Carre Flood-
way] Station Date, Chloride Concen- Percent
(mg/1) tration finer than
Suspended sediment (mg/1) 0.062 mm
Station Date Chloride Concen- Percent BC-8 ----- 4-15-73 1,700 308 98 (mg/1) tration finer than
(mg/lJ 0.062 mm 4-23-73 84 82 98 5-03-73 220 98 94
BC-1 ----- 4-14-73 18 377 91 10-30-73 2,400 169 100 4-15-73 18 613 82 4-16-73 10 441 87 BC-9 ----- 4-14-73 960 91 72 4-23-73 21 330 94 4-19-73 910 94 92 4-27-73 19 305 92 4-21-73 490 67 83 4-30-73 45 283 96 4-25-73 400 83 77 5-03-73 16 4-28-73 560 74 91 5-06-73 16 262 98 4-30-73 480 610 87
11-01-73 880 88 100 5-02-73 540 1,653 90 5-08-73 62 178 94
BC-2 ----- 4-14-73 16 339 96 4-15-73 16 475 98 BC-10 ____ 4-14-73 1,500 114 96 4-16-73 16 287 93 4-19-73 2,700 83 86 4-23-73 20 105 96 4-21-73 2,000 96 95 4-27-73 21 228 98 4-25-73 380 48 95 4-30-73 22 186 95 4-28-73 720 46 94 5-03-73 18 150 96 4-30-73 600 76 89 5-06-73 16 145 96 5-02-73 1,200 85 94
11-01-73 780 90 99 5-08-73 660 163 95
BC-3 _____ 4-14-73 48 89 99 BC-11 ____ 4-14-73 1,700 122 88 4-15-73 220 233 64 4-19-73 1,300 142 94 4-16-73 20 210 98 4-21-73 1,900 91 95 4-19-73 510 173 97 4-25-73 560 69 87 4-23-73 730 212 94 4-28-73 760 50 100 4-27-73 220 209 99 5-02-73 770 81 95 4-30-73 24 138 98 5-08-73 920 56 94 5-03-73 18 112 93
23 ---- 4-14-73 520 214 99 5-06-73 20 111 95 5-09-73 44 93 99 4-19-73 1,800 101 89
11-01-73 1,300 168 100 4-21-73 1.700 128 97 4-23-73 480 75 100
BC-4 _____ 4-14-73 1,100 81 95 4-25-73 330 160 96 4-28-73 680 66 99
4-15-73 360 104 97 4-30-73 620 70 99 4-17-73 300 112 94 5-02-73 900 86 96 4-21-73 36 142 95 5-08-73 650 77 95 5-03-73 18 210 98 5-06-73 24 109 98 24 ---- 4-14-73 1,800 97 90
11-01-73 1,800 251 100 4-19-73 1,200 94 90 4-21-73 360 69 90
BC-5 ----- 4-14-73 380 91 82 4-23-73 560 69 83 4-15-73 560 105 90 4-25-73 1~600 48 77 4-17-73 1,540 276 99 4-28-73 910 136 85 4-21-73 1,480 514 91 4-30-73 720 46 92 4-27-73 600 203 98 5-02-73 340 137 97 5-03-73 460 147 99 5-08-73 140 82 80 5-06-73 380 171 99
11-01-73 1,600 137 100 25 ---- 4-14-73 1,800 82 98 4-19-73 920 63 97
BC-6 ----- 4-15-73 560 139 97 4-21-73 360 312 90 4-16-73 1,200 304 98 4-23-73 630 125 97 4--17-73 1,670 281 99 4-25-73 280 60 97 4-23-73 960 182 98 4-28-73 860 256 98 4-28-73 380 134 97 4-30-73 700 71 97 4-30-73 360 136 97 5-02-73 460 274 98 5-03-73 920 164 98 5-08-73 120 173 95 5-07-73 130 160 99
26 ---- 4-14-73 1,750 342 97 10-30-73 1,600 196 99 4-19-73 760 133 94
BC-7 ----- 4-15-73 1,600 98 4-21-73 260 78 96
260 4-23-73 600 75 93 4-16-73 1,800 361 98 4-25-73 260 90 94 4-17-73 1.800 277 97 4-28-73 820 131 92 4-23-73 760 142 98 4-30-73 700 48 88 4-28-73 660 140 84 5-02-73 510 56 89 4-30-73 490 139 96 5-08-73 78 56 93 5-03-73 660 169 97 5-07-73 540 150 99 27 ---- 4-15-73 1,660 216 97 ~0-30-73 1,900 228 100 4-23-73 540 86 92
66 THE 1973 MISSISSIPPI RIVER BASIN FLOOD
TABLE 10.-Chloride and suspended-sediment data, Lake Pont- TABLE 10.-Chlm·ide and suspended-sediment data. Lake Pont-chartrain, £a.-Continued chartrain, £a.-Continued -
Suspended sediment ~spended sediment
Station Date Chloride Concen- Percent Station Date Chloride Concen- Percent (mg/1) tration finer than (mg/1) tration finer than
(mg/1) 0.062 mm (mg/1) 0.062 mm
4-30-73 660 136 87 42 ---- 11-01-73 1.300 116 97 5-07-73 240 65 92
10-30-73 2,500 327 100 43 ---- 4-14-73 180 67 89 4-15-73 280 167 65
28 ____ 4-15-73 1!200 120 92 4-21-73 720 179 92 4-19-73 700 81 93 4-23-73 720 114 95 4-23-73 680 93 89 4-27-73 96 28 82 4-30-73 320 69 93 4-30-73 340 83 74 5-07-73 260 90 96 5-03-73 500 128 93
10-30-73 2!800 191 97 5-06-73 660 221 87 11-01-73 840 99 95
29 ---- 4-15-73 1,520 212 95 4-19-73 580 128 97 44 ---- 4-14-73 18 33 76 4-23-73 680 96 94 4-15-73 60 178 62 4-30-73 840 90 95 4-21-73 18 106 85 5-07-73 100 68 95 4-23-73 12 51 86
10-30-73 2,400 254 100 4-27-73 11 45 86 4-30-73 12 42 82
30 ---- 4-15-73 1,940 147 93 5-03-73 240 104 88 4-19-73 760 131 96 5-06-73 130 150 78 4-23-73 740 164 97 11-01-73 220 73 93 4-28-73 910 158 97 4-30-73 850 86 93 45 ---- 4-14-73 160 64 72 5-03-73 320 96 94 4-15-73 180 281 60 5-07-73 42 85 99 4-16-73 320 344 76
10-30-73 2,600 167 99 4-21-73 200 118 71 4-23-73 120 76 79
3L ___ 4-15-73 1,920 229 97 4--27-73 78 79 73 4-19-73 690 98 95 4-30-73 60 31 68 4-23-73 810 103 91 5-03-73 270 149 91 4-28-73 730 87 79 5-06-73 200 111 90 4-30-73 630 65 80 11-01-73 760 83 96 5-07-73 310 81 90
10-30-73 2,600 189 98 46 ---- 11-01-73 970 79 97
32 ---- 10-30-73 2,600 211 99 47 ---- 4-14-73 460 66 96 4-15-73 220 79 99
33 ---- 10-30-73 2,600 203 98 4-16-73 460
34 ---- 10-30-73 2,400 243 99 4-21-73 180 4-23-73 340
35 ---- 10-30-73 2,100 230 99 4-27-73 340 4-30-73 50
36 ---- 10-30-73 2,200 266 91 5-03-73 58 113 94 5-06-73 130 115 86
37 ---- 10-30-73 2,300 144 90 11-01-73 860 107 98
38 ---- 4-14-73 520 1,010 81 48 ---- 4-14-73 20 142 100 4-15-73 420 764 99 4-15-73 18 159 94 4-17-73 80 16 76 4-16-73 18 336 72 4-21-73 62 65 97 4-23-73 740 117 83 4-27-73 80 173 96 4-27-73 21 248 98 5-03-73 41 58 92 4-30-73 24 105 98 5-06-73 31 70 92 5-03-73 19 120 95 5-09-73 38 100 95
11-01-73 1,400 113 97 5-06-73 20 137 97 5-09-73 16 137 99
39 ---- 4-14-73 260 84 96 11-01-73 1,200 184 99 4-17-73 200 102 95 4-21-73 170 154 97 49 ---- 4-14-73 42 54 99 4-27-73 78 248 97 4-15-73 75 63 100 5-03-73 22 156 96 4-16-73 85 256 98 5-06-73 18 g2 96 4-19-73 22 230 99 5-09-73 22 68 91 4-23-73 100 166 97
11-01-73 1,800 99 98 4-27-73 28 96 97 4-30-73 36 182 97
40 ---- 4-14-73 780 172 94 5-03-73 30 63 92 -------- 860 206 93 5-06-73 34 148 96 4-17-73 100 184 98 5-09-73 16 124 98 4-21-73 270 241 96 11-01-73 1,100 222 99 5-03-73 270 164 97 5-06-73 190 155 91 50 ---- 4-15-73 1,100 152 97
11-01-73 1,900 ·233 99 4-16-73 1,400 98 89 4-19-73 260 52 98
41 ---- 11-01-73 1,100 47 91 4-23-73 200 180 97
THE FLOODS 67
TABLE 10.-Chloride and suspended-sediment data, Lake Pont-chartrain, £a.-Continued
Suspended sediment
Station Date Chloride concen- Percent (mg/1) tration finer than
(mg/l) 0.062 mm
4-30-73 82 306 92 5-03-73 36 66 95 5-07-73 58 108 95
52 ---- 4-17-73 310 65 97 10-30-73 2,200 364 99
54 ---- 4-15-73 1,800 333 98 4-19-73 680 139 98 4-23-73 100 89 100 4-30-73 530 131 95 5-03-73 140 95 95 5-07-73 28 86 78
55 ---- 4-15-73 1,800 322 99 4-23-73 260 91 99
10-30-73 2,600 274 99
56 ---- 4-15-73 1,800 185 96 4-19-73 750 4-23-73 290 4-30-73 680 81 91 5-07-73 78 95 95
10-30-73 2,700 274 99
92 ---- 10-30-73 2,700 367 87
Even though the conc-entrations of the available data are somewhat less than at Krotz Springs, the sum of the sediment discharge for Morgan City and Calumet appears to be roughly equal that of the river at Krotz Springs.
TRIBUTARY STREAMS-FLOODING AND SUSPENDED SEDIMENT
The following brief descriptions of tributary flooding are presented on a state-by-state basis, beginning with the State of Minnesota and proceeding in a downstream direction. The authors believe that this type of text presentation will be more convenient for the reader than a basin approach. Howeve;r, the gaging-station data for streamflow and sediment are shown in the traditional manner in all tabulations; that is, the stations are arranged in downstream order within the basins.
TRIBUTARY STREAMS IN MINNESOTA
Tributary inflow from Minnesota streams was not significant during the 1973 Mississippi River basin floods. Recurrence intervals of recorded flood peaks on these streams ranged from about 2 to 9 years, but most streams experienced only minor rises during the period. The data from these streams ar•e useful in delineating those areas of the Mississippi River basin where tributary inflow did not contribute to the major main-stem flooding downstream but these data are not included in this report.
The only gaging-station data included for this State, in addition to that for main-stem stations on the Mississippi, are for the Root River near Houston where daily suspended-sediment data are available from April 13 to June 30, 1973. The Root River data are typical of many tributaries draining to the Mississippi from Minnesota and Wisconsin. Rapid changes in suspended-sediment transport rate can be noted for many storms-the transport on April 14 was 356 tons (128 mg/1) and on April 16 it was 30,600 tons (1,660 mg/1).
TRIBUTARY STREAMS IN WISCONSIN
Outstanding peak discharges with recurrence intervals exceeding 100 years were recorded on the Fox River and its tributary, Sugar Creek, in the Illinois River basin in extreme southern Wisconsin and on Turtle and Little Turtle Creeks in the Rock Rive,r basin. The 1973 flood-crest profiles are shown for Little Turt,le Greek and the 100-year flood profile is shown for Turtle Creek in figure 68.
The major impact of this flooding was felt in the Beloit area where the record-breaking flood on Turtle Creek inundated a 40-square block area of Beloit and South Beloit (fig. 69). Factories, stores, homes, and a motel were hard hit. Hundreds of residents were temporarily left homeless, :ind production was halted or curtailed in sever'::tl plants.
Elsewhere in the State, 5- to 10-year recurrence interval floods were recorded on Mississippi River tributaries, and effects of the flooding were much less severe.
TRIBUTARY STREAMS IN IOWA
Numerous outstanding tributary floods occurred during March-May 1973 in Iowa. The largest of these floods occurred in late April in the Wapsipinicon, Iowa, Skunk, and Des Moines River basins of southeastern Iowa, at a time when the Mississippi River was approaching its second spring crest. This synchronization of flood events not only caused record stages on the Mississippi River but helped to keep the Mississippi above flood stage in excess of 2 months from Keithsburg, Ill., to the mouth.
A heavy snowstorm during April 8-10 caused an accumulation of 15 to 20 in. (381 to 508 mm) of wet snow in the lower part of the Wapsipinicon River basin and was a primary reason for record flooding 10 days later. Heavy rains accompanied by rapid snowmelt during April 20-22 produced a record flood at the gaging station near DeWitt on April 22; flood stage was exceeded at the De Witt station for
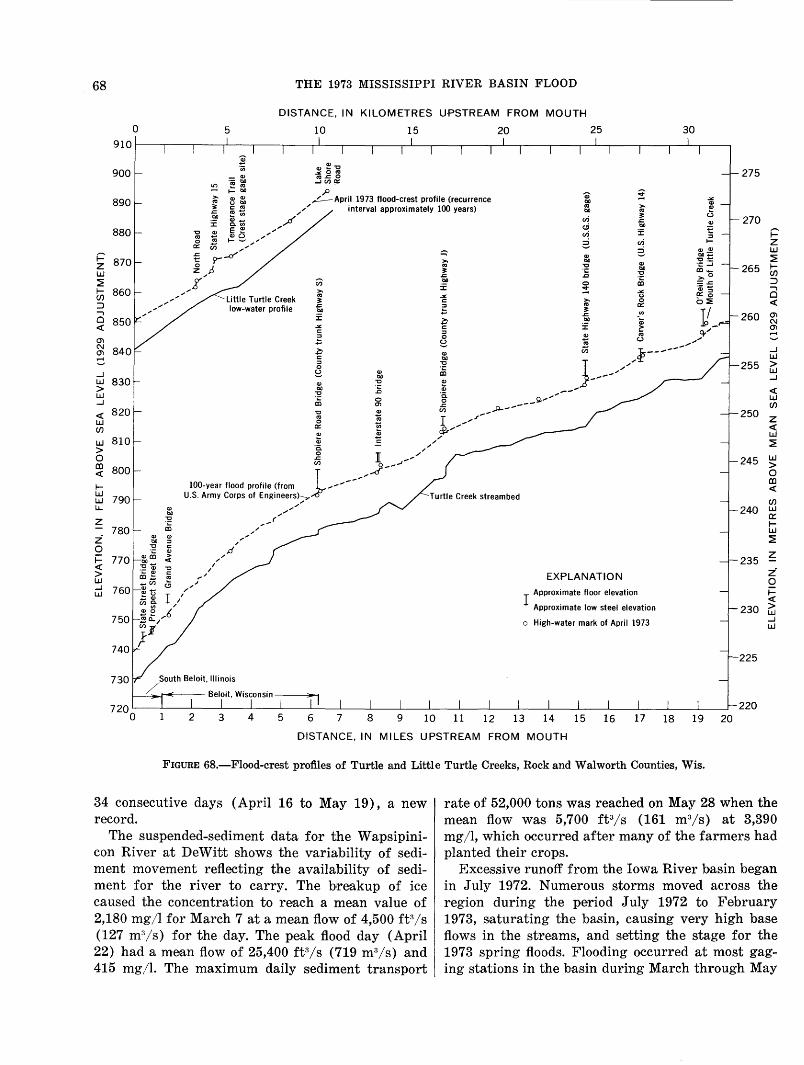
68 THE 1973 MISSISSIPPI RIVER BASIN FLOOD
DISTANCE, IN KILOMETRES UPSTREAM FROM MOUTH
0 5 10 15 20 25 30
900 ~ ·u; ~ ~~
- Q) «>-<= 0 ~ -~ ~ ...JC/)0:: ~ 1-t:>O ,P
275
890 ~ ~ ~ .,?.--April 1973 flood-crest profile (recurrence ! ~ t; ,/ interval approximately 100 years)
I=" z w ~ t;; 860 :::> ...., a <(
0'1 N 0'1 .......
...J w 830 > w ...J
<( 820 w (/)
w 810 > 0
~ 800
1-
~ 790 l.J....
z z 0
780
~ 770 <( > w ...J w 760
750
740
730
__ ...... .-" .,..
:I: ~ti /~ ~ -~ ~ t5 ;~ 0 .......... - .,"
0:: Cl) ,.-
~ rr-d' ~ _,.d
/X'
EXPLANATION
I Approximate floor elevation
Approximate low steel elevation
o High-water mark of April 1973
270 I=" z w ~
265 t;; :::> ...., a <(
260 g: 0'1 .......
...J w
255 ~ ...J
<( w (/)
250 z <( w ~
245 ~ 0 C£l <(
(/)
240 ~ 1-w ~
235 ~ z 0 ;= <(
230 ~
225
220
...J w
2 3 4 5 6 7 8 9 10 11 12 13 14 15 16 17 18 19 20
DISTANCE, IN MILES UPSTREAM FROM MOUTH
FIGURE 68.-Flood-crest profiles of Turtle and Little Turtle Creeks, Rock and Walworth Counties, Wis.
34 consecutive days (April 16 to May 19), a new record.
The suspended-sediment data for the Wapsipinicon River at DeWitt shows the variability of sediment movement reflecting the availability of sediment for the river to earry. The hreakup of ice caused the concentration to reach a mean value of 2,180 mg/1 for March 7 at a mean flow of 4,500 ft 3/s (127 m3/s) for the day. The peak flood day (April 22) had a mean flow of 25,400 ft3/s (719 m3/s) and 415 mg/l. The maximum daily s·ediment transport
rate of 52,000 tons was reached on May 28 when the mean flow was 5,700 ft 3/s (161 m 3/s) at 3,390 mg/1, which occurred after many of the farmers had planted their crops.
Excessive runoff from the Iowa River basin began in July 1972. Numerous storms moved across the region during the period July 1972 to February 1973, saturating the basin, causing very high base flows in the streams, and setting the stage for the 1973 spring floods. Flooding occurred at most gaging stations in the basin during March through May
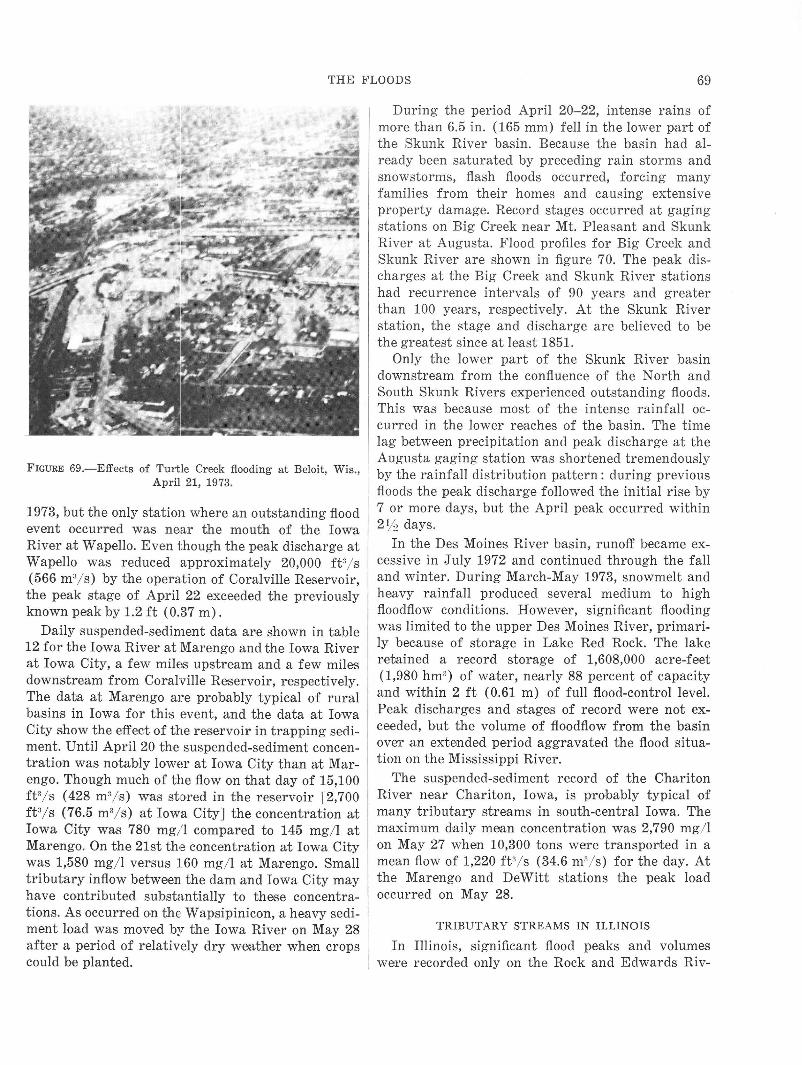
THE FLOODS 69
FIGURE 69.-Effects of Turtle Creek flooding at Beloit, Wis., April 21, 1973.
1973, but the only station where an outstanding flood event occurred was near the mouth of the Iowa River at Wapello. Even though the peak discharge at Wapello was reduced approximately 20,000 ft3 / s (566 m3/ s) by the operation of Coralville Reservoir, the peak stage of April 22 exceeded the previously known peak by 1.2 ft ( 0.37 m).
Daily suspended-sediment data are shown in table 12 for the Iowa River at Marengo ·and the Iowa River at Iowa City, a few milE~s upstream and a few miles downstream from Coralville Reservoir, respectively. The data at Marengo are probably typical of rural basins in Iowa for this event, and the data at Iowa City show the effect of the reservoir in trapping sediment. Until April 20 the suspended-sediment concentration was notably lownr at Iowa City than at Marengo. Though much of the flow on that day of 15,100 ft'/s (428 m3/s ) was stored in the r·eservoir [2,700 ft3/ s (76.5 m3/ s) at Iowa City] the concentration at Iowa City was 780 mg/ 1 compared to 145 mg/ 1 at Marengo. On the 21st the concentration at Iowa City was 1,580 mg/ l versus 160 mg/ 1 at Marengo. Small tributary inflow between the dam and Iowa City may have contributed substantially to these concentrations. As occurred on thE: Wapsipinicon, a heavy sediment load was moved by the Iowa River on May 28 after a period of relatively dry weather when crops could be planted.
During the period April 20-22, intense rains of more than 6.5 in. (165 mm) fell in the lower part of the Skunk River basin. Because the basin had already been saturated by preceding rain storms and snowstorms, flash floods occurred, forcing many families from their homes and causing extensive property damage. Record stages occurred at gaging stations on Big Creek near Mt. Pleasant and Skunk River at Augusta. Flood profiles for Big Creek and Skunk River are shown in figure 70. The peak discharges at the Big Creek and Skunk River stations had recurrence intervals of 90 years and greater than 100 years, respectively. At the Skunk River station, the stage and discharge are believed to be the greatest since at least 1851.
Only the lower part of the Skunk River basin downstream from the confluence of the North and South Skunk Rivers experienced outstanding floods. This was because most of the intense rainfall occurred in the lower reaches of the basin. The time lag between precipitation and peak discharge at the Augusta gaging station was shortened tremendously by the rainfall distribution pattern: during previous flood s the peak discharge followed the initial rise by 7 or more days, but the April peak occurred within 2 lj~ days.
In the Des Mojnes River basin, runoff became exC·essi ve in July 1972 and continued through the fall and winter. During March-May 1973, snowmelt and heavy rainfall produced several medium to high floodflow conditions. However, significant flooding was limited to the upper Des Moines River, primarily because of storage in Lake Red Rock. The lake retained a record storage of 1,608,000 acre-feet (1,980 hm3
) of water, nearly 88 percent of capacity and within 2 ft ( 0.61 m) of full flood-control level. Peak discharges and stages of record were not exceeded, but the volume of floodflow from the basin over an extended period aggravated the flood situation on the Mississippi River.
The suspended-sediment record of the Chariton River near Chariton, Iowa, is probably typical of many tributary streams in south-central Iowa. The maximum daily mean concentration was 2,790 mg/ l on May 27 when 10,300 tons were transported in a mean flow of 1,220 ft'/s (34.6 m~/s) for the day. At the Marengo and DeWitt stations the peak load occurred on May 28.
TRIBUTARY STREAMS IN ILLINOIS
In Illinois, significant flood peaks and volumes were recorded only on the Rock and Edwards Riv-
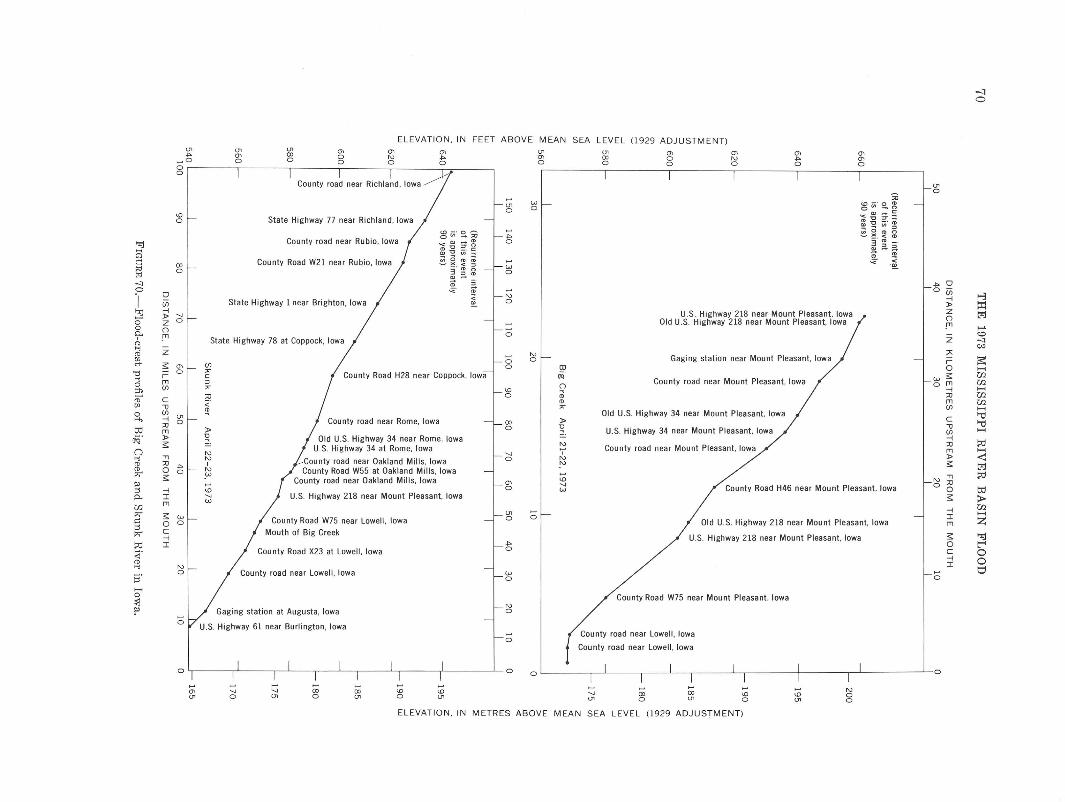
ELEVATION. IN FEET ABOVE MEAN SEA LEVEL (1929 ADJUSTMENT) U1 (]'I U1 0"1 .+::> O'o ()) 0
1--'0 0 0 0 ~ -
8 .
- w ~ 0
State Highway 77 near Richland , Iowa tO-· 0-i r County road near Rubio. Iowa i i ~ i t- ;3
~ 00 County Road W21 near Rubio , Iowa ~ §. ~ ~ f- w @ 0 ~1!~10 ~ s ~
0 ~ ~ f- -. 0 ""' N I iii State Highway 1 near Brighton, Iowa ~ o ~ _, ~ l> 0 z 8,. 0 I o C, "' State Highway 78 at Coppock, Iowa ... -(!) 2 ~---" N
~
"' 0
rfl 0 0 n- :S:m (fJ o ro ~ r 0 E County Road H28 near Coppock, Iowa oo
~ ~ ~ ~ ~ ......... ::0 0 ([) <tl c - ([) 00 '1J ~ A 0 (/) U1 -.: ,.... ;j o County road near Rome, Iowa oo l> ttl "' l> 0 '0
crq ' l> -g. Old U.S. Highway 34 near Rome, Iowa ;::, 0 :;;: N U.S. Highway 34 at Rome, Iowa ...., ,
;;1 ::;J ';" County road near Oakland Mills, Iowa 0 ~ ~ 0 ;3 :::; County Road W55 at Oakland Mills, Iowa _ .., :;;: _ County road near Oakland Mills, Iowa "' ~ ~ _, "' 0 w o. I ...., U.S. Highway 218 near Mount Pleasant. Iowa , w w. ~ :;;: ~~ .:: 0 County Road W75 near Lowell, Iowa o 0
~ S Mouth of Big Creek
~ I ~ ~ :;r County Road X23 at Lowell, Iowa 0
(!) ... :;;- County road near Lowell, Iowa ~ ~
...... 0
~ I / Gaging station at Augusta, Iowa f- 85
~ 00 0 "' 0
0 "' N 0 "' ~ 0 "' "' 0
~ tO v;· 2. ~ OQ)-!:;
~ ~ ~ ~ -. o ~ n
e §· ~ ~· ., __ - '" " -- < '< !!!.
U.S. Highway 218 near Mount Pleasant. Iowa / Old U.S. Highway 218 near Mount Pleasant, Iowa
Gaging station near Mount Pleasant. Iowa .I
County road near Mount Pleasant, Iowa , '" " ' "''""" " "'" """"' ""~·;;
U.S. Highway 34 near Mount Pleasant. Iowa
County road near Mount Pleasant, Iowa
County Road H46 near Mount Pleasant, Iowa
Old U.S. Highway 218 near Mount Pleasant. Iowa
U.S. Highway 218 near Mount Pleasant. Iowa
/ County Road W75 near Mount Pleasant. Iowa
-j
~ 0
~ 0 0 iii _,
l> z (l
!"'
z 7'. r= 0
f-W '5: 0"' _,
;o
"' (/)
c -c (/) _, ;o
"' l> :;;:
N-,
I 0 :0 0 :;;: _, I
"' :;;: 0 c _, I -0
I "' "'•":"" "'" '"""'""· ·~· 1 1 [c o I I I I I I o o
L_ ______ ,-J_ ________ _l __ _,----~-,--------+-------,-J---------~0
I--' I--' I--' I--' I--' I--' I--' ~
O'o ~ ~ ()) ()) ~ ~ ~ U1 0 U1 0 U1 0 U1 U1 00
0 00 ~ "' 0
ELEVATION, IN METRES ABOVE MEAN SEA LEVEL (1929 ADJUSTMENT) "' ~
N 0 0
-.:) 0
>-:3 ll: tz:j
...... 0:0 ~
"" ~ ...... w. w. ...... w. w. ...... "0 "0 ......
~ ...... < tz:j ~
ttl > w. ...... z ~ t"" 0 0 t:;
THE FLOODS 71
ers in the northwestern part of the State. At the gaging station on Rock River near Joslin, the recurrence interval of the peak discharge was only 17 years; however, flood volumes for 7-, 15-, and 30-day periods were the greatest in 34 years of record. For Edwards River near New Boston, the recurrence interval of the peak discharge exceeded 100 years ; the recurrence intervals of the 1- to 30-day flood volumes also exceeded 100 years and were the largest recorded in 39 years of data colleetion. Flood-crest profiles for the Rock River are shown in figure 71.
Minor flooding occurred on many tributary streams in northern and central Illinois, especially during April, and contributed to the exceptionally high stages on the Mississippi River main stem.
The major tributaries in the southeTn part of the State, Kaskaskia River and Big Muddy Rive~r, are partly controlled by reservoirs and did not contribute significantly to the Mississippi River flooding.
TRIBUTARY STREAMS IN MISSOURI
In addition to serious backwater flooding from the Mississippi River, severe headwater floods occurred on Mississippi River tributary streams in Missouri during the latter part of April 1973. Streams had been above normal for a considerable period of time prior to the intense April rains that saturated the area, cons.equently most of the rain that fell was discharged from the area as storm runoff.
During April 21-22, 1973, an unusually severe spring storm moved across central and northeastern Missouri. The resulting headwater flood peaks and volumes were extraordinary in the Fox, North and Middle Fabius, North, Salt, Lower Chariton, and East Fork Chariton River basins of northeastern Missouri. In addition, a record-breaking flood peak was observed during this period on Little River ditch 251 near Lilbourn in southeastern Missouri. Available flood-profile data for the downstream reaches of North Fabius and North Rivers are shown in figure 72.
As shown in table 12, the volumes of flood runoff from these basins for 1-, 3-, 7-, 15-, and 30-day periods have estimated recurrence intervals that are greater than 100 years in many instances; some of the flood volumes were nearly two times gre·ater than the 100-year event. Thus the volume of flood runoff in these basins wa,s just as significant as the extraordinarily high peak flows.
The gaging-station record on South Fork Salt River at Santa Fe was not included in table 12, be-
cause this tributary experienced only a moderate rise even though nearby streams reached record stages. This indicates that intense precipitation was not evenly distributed ove-r all parts of the area. In general, though, the entire northeastern parts of the State plus a small area in the southeast were hard hit by flooding during April 20-22.
When compared to historic records at long-time gaging stations, peak discharges and flood volumes were not exceptional on the Missouri River as a whole during March-May 1973. However, the lower reaches of the river received substantial amounts of storm runoff from uncontrolled tributary streams in Missouri, resulting in a peak stage of 33.7 ft (10.3 m) on the gage at Hermann, Mo. This was the second highest stage ever observed, surpassed only by the record stage of 35.5 ft (10.8 m) in 1844, but the peak discharge of 500,000 ft3/s (14,200 m 3/s) was only the sixth highest; the stage-discharge relationship has been altered by Federal and agricultural levees and by other activities of man on the flood plain. The duration of the flood in the lower reaches of the Missouri River (Hermann, Mo., to the mouth) was significant, as the river remained above flood stage for a record 73 consecutive days during March-May at Hermann and s~et new records for monthly mean discharges during J anua.ry through Apri11973.
Suspended-sediment data at Hermann show a total of 103 million tons transported past the station from March 1 to June 30. The discharge-weighted mean concentration was 1,376 mg/1 for this period. The percentage of sand-sized material in 17 obs.ervations during this period ranged from 20 to 78. The 100 million tons t~ansported during this 4-month period is considerably below that measured for several previous floods, partly because of upstream reservoir control ·and partly because of less runoff fro,m the Missouri basin. The 4 "wet" yea;rs of 1949-52 had sediment loads at Hermann for this March-June pe·riod of 218, 173, 249, and 170 million tons, respectively.
TRIBUTARY STREAMS IN KENTUCKY
Recurrence intervals of floods peaks in Kentucky ranged from 2 to 5 years, and flood problems were not severe. However, daily discharge data are presented in table 9 for gaging stations on the Ohio and Cumhedand Rivers so that the contribution from these extensive river systems can be evaluated and comparisons can be made with flood events of the past.
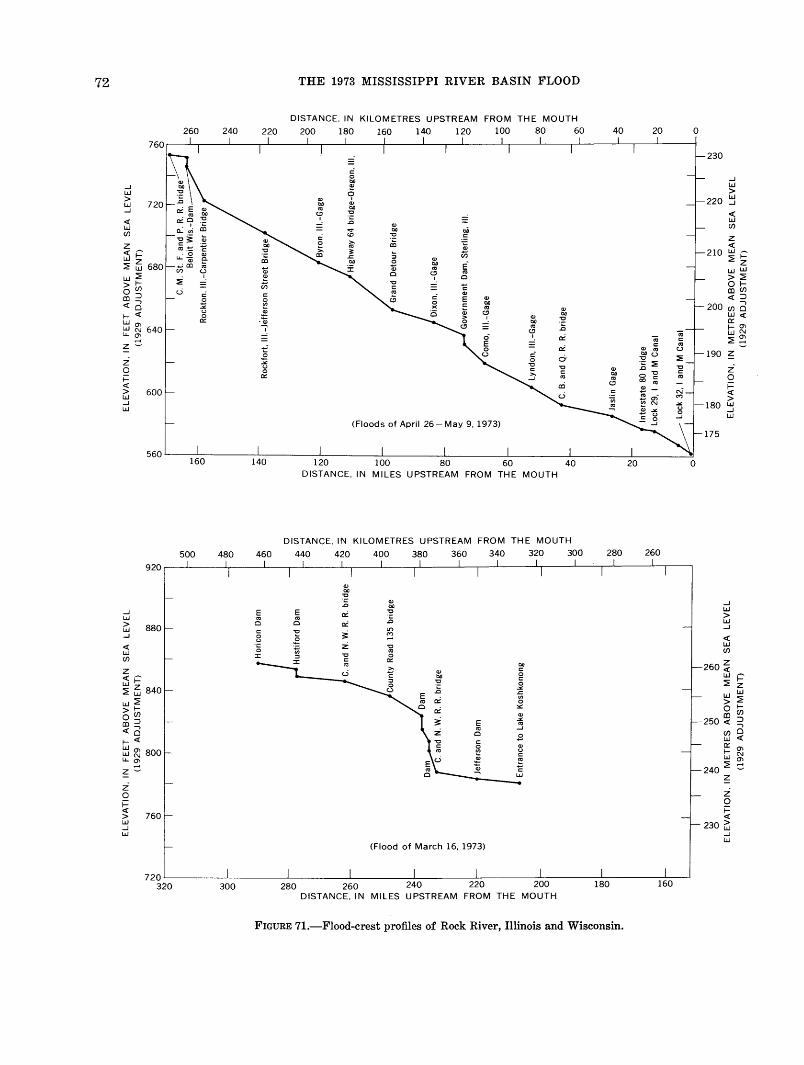
72 THE 1973 MISSISSIPPI RIVER BASIN FLOOD
DISTANCE, IN KILOMETRES UPSTREAM FROM THE MOUTH
260 240 220 200 180 160 140 120 100 80 60 40 20 0
230
~ 0 _J 00
_J Q) w w ~ > > Q) 220
w w ~
_J
_J 00
9 :-:! <( <( ..0 - w w Q) (/)
<:!" 00
~ (/) ;u c.D "'0
~ z
z :;:::; <( <(~ c: Q)
210 w~ Q) :; ill wl-- c. Q) ~~--~ ~ 680 ro B 00
~ z
'7 Q) Q) "' ww
w~ ~ c 9 c >~
>I- - ill 01--0(/)
~ c: (DC/)
ID ::J Q) c(::J <Co ~ ~ 00
200 ....,
~ "' Q) (/)0 1--c( 0 '7 Q)
00 W<( w 0:::
·~ 00 "'0 c::: ~ ~ 640 - "' ~ 1--01
9 ad wN
z:::::. - ~~ ...; - ad
z ~ 0 190 ~
0 u "'0 Q) z 0
~ i= 0::: ~ 0 <( C!l i= > 600 <( w > _J 180 w w _J
w
560 100 80 60 40 20 0
DISTANCE, IN MILES UPSTREAM FROM THE MOUTH
DISTANCE, IN KILOMETRES UPSTREAM FROM THE MOUTH
500 480 460 440 420 400 380 360 340 320 300 280 260
920
Q) 00 :-:!
Q) ..0 _J 00 w _J
~ ~ ad :-:! w ..0 > > c c ad w w 880 c: 1.0
_J
_J 8 ~ ~ <(
<( "§ z w w (/)
(/) :I:
z 260 ~ <(~ w ~ wl-- ~ ~ ~ 840
z w w
w~ > ~ >I-- 0 1--0(/) ID (/)
ID::J 250 <( ::J
<Co ....,
(/) 0 1--c( w <(
~ gj 800 c::: 01 1--w N
i..L.OI
240 ~ ~ z~
z ~
0 z i= 0 <(
760 i=
> <( w 230 Gj _J
w _J
w (Flood of March 16, 1973)
720 320 300 280 260 240 220 180
DISTANCE, IN MILES UPSTREAM FROM THE MOUTH
FIGURE 71.-Flood-crest profiles of Rock River, Illinois and Wisconsin.
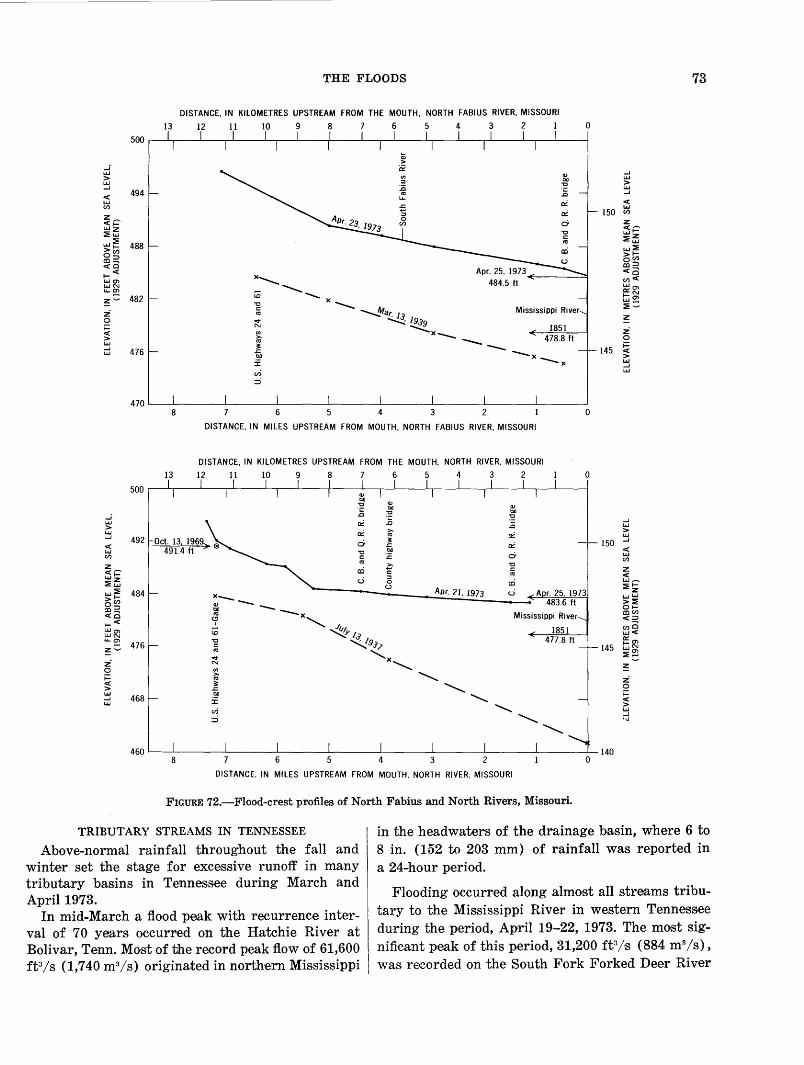
THE FLOODS 73
DISTANCE, IN KILOMETRES UPSTREAM FROM THE MOUTH, NORTH FABIUS RIVER, MISSOURI
13 12 11 10 9 8 7 6 5 4 3 2 1 0
500
Q)
> _j ~ 1.1.1 Q) .....1 > (/) 1.1.1 1.1.1 ::I tiD
.....1 ~ ~
>
494 1.1.1
C( ..c .....1
1.1.1 u... C(
en 0:: 1.1.1
~I=' 0:: 150 en 0 z
::?!~ <( ....... 1.1.11-
1.1.1::?! 488 ::?!z 1.1.1
>I- 1.1.1::?! oen co~
>I-oen <CO co:::l 1-C( x......._ ccc; I.LJCTl en< LLJN -...... ...........
LLJCTl u...~
482 <0 O:::N z~
l-en "'C
1.1.1...., x-...... z c: -......Mar. 13
::?!~ «l
0 '<!" ~1939 ~ i= N C( (/) ~X-- z > >- 0 1.1.1 ~ ---.....1 476 -- i= 1.1.1 .s:::. 145 C(
tiD --X > :I: --X 1.1.1
.....1
en 1.1.1
=i
470 8 6 5 4 3 2 0
DISTANCE, IN MILES UPSTREAM FROM MOUTH, NORTH FABIUS RIVER, MISSOURI
DISTANCE, IN KILOMETRES UPSTREAM FROM THE MOUTH, NORTH RIVER, MISSOURI
13 12 11 10 9 8 7 6 5 4 3 2 0
500
_j 1.1.1 > 1.1.1 .....1
C( 1.1.1 en z <( ....... 1.1.11-::?!~ 1.1.1::?! >I-oen co:::l <o 1-C( LLJcn I..&.JN u...~ z~
z 0
Q)
tiD "'C
0:: ~ 0:: >-
~ 0 .s:::. "'C tiD
:;; :.:: >-
a:i c: u ::I
0 u
Apr. 21, 1973
Q)
tiD "'C
.....1 :g L&.J
0:: > L&.J
0:: 150 .....1
C( 0 1.1.1
en ] z
C( a:i 1.1.1,......
::?EI-u A r. 25 1973 z
L;JL&.I
483.6 ft >::?! 01-co en C(:::l eno w<
145 ~~ L&.JCTl ::?!~
~ i= C( > 1.1.1
468 .....1
z 0 i= C(
L&.J > L&.J .....1 '<.l
140 0
DISTANCE, IN MILES UPSTREAM FROM MOUTH, NORTH RIVER. MISSOURI
FIGURE 72.-Flood-crest profiles of North Fabius and North Rivers, Missouri.
TRIBUTARY STREAMS IN TENNESSEE
Above-normal rainfall throughout the fall and winter set the stage for excessive runoff in many tributary basins in Tennessee during March and April1973.
In mid-March a flood peak with recurrence interval of 70 years occurred on the Hatchie River at Bolivar, Tenn. Most of the record peak flow of 61,600 ft3/s (1,740 m3/s) originated in northern Mississippi
in the headwaters of the drainage basin, where 6 to 8 in. (152 to 203 mm) of rainfall was reported in a 24-hour period.
Flooding occurred along almost all streams tributary to the Mississippi River in western Tenness.ee during the period, April 19-22, 1973. The most significant peak of this period, 31,200 ft3/s (884 m 3/s), was re-corded on the South Fork Forked Deer River
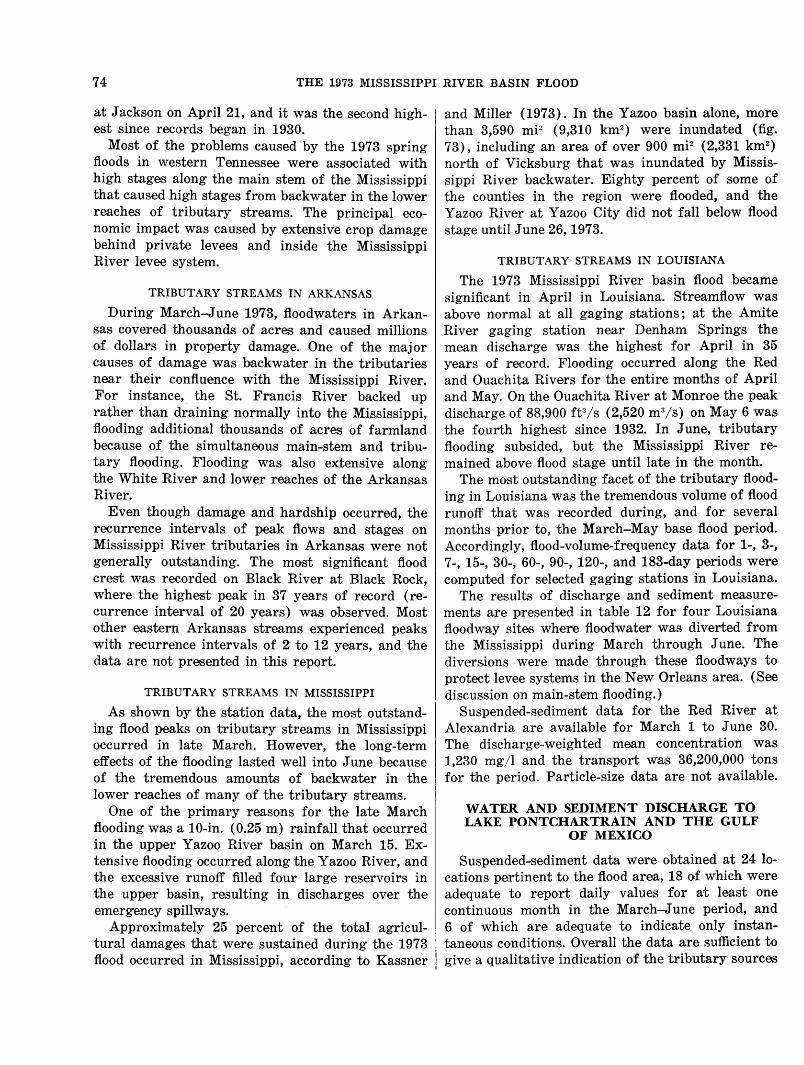
74 THE 1973 MISSISSIPPI RIVER BASIN FLOOD
at Jackson on April 21, and it was the second highest since records began in 1930.
Most of the problems caused by the 1973 spring floods in western Tennessee were associated with high stages along the main stem of the Mississippi that caused high stages from backwater in the lower reaches of tributary streams. The principal economic impact was caused by extensive crop damage behind private levees and inside the Mississippi River levee system.
TRIBUTARY STREAMS IN ARKANSAS
During Ma.rch-J une 1973, floodwaters in Arkansas covered thousands of acres and caused millions of dollars in property damage. One of the major causes of damage was backwater in the tributaries near their confluence with the Mississippi River. For instance, the St. Francis River backed up rather than draining normally into the Mississippi, flooding additional thousands of acres of farmland because of the simultaneous main-stem and tributary flooding. Flooding was also extensive along the White River and lower reaches of the Arkansas River.
Even though damage and hardship occurred, the recurrence intervals of peak flows and stages on Mississippi River tributaries in Arkansas were not generally outstanding. The most significant flood crest was recorded on Black River at Black Rock, whe·re the highest peak in 37 years of record ( recurrence interval of 20 years) was observed. Most other eastern Arkansas streams experienced peaks with recurrence intervals of 2 to 12 years, and the data are not presented in this report.
TRIBUTARY STREAMS IN MISSISSIPPI
As shown by the station data, the most outstanding flood peaks on tributary streams in Mississippi occurred in late March. However, the long-term effects of the flooding lasted well into June because of the tremendous amounts of backwater in the lower reaches of many of the tributary streams.
One of the primary reasons for the late March flooding was a 10-in. (0.25 m) rainfall that occurred in the upper Yazoo River basin on March 15. Extensive flooding occurred along the Yazoo River, and the excessive runoff filled four large reservoirs in the upper basin, resulting in discharges over the emergency spillways.
Approximately 25 percent of the total agricultural damages that were sustained during the 1973 flood occurred in Mississippi, according to Kassner
and Miller (1973). In the Yazoo basin alone, more than 3,590 mP (9,310 km2
) were inundated (fig. 73), including an area of over 900 mi2 (2,331 km2
)
north of Vicksburg that was inundated by Mississippi River backwater. Eighty percent of some of the counties in the region were flooded, and the Yazoo River at Yazoo City did not fall below flood stage until June 26, 1973.
TRIBUTARY STREAMS IN LOUISIANA
The 1973 Mississippi River basin flood became significant in April in Louisiana. Streamflow was above normal at all gaging stations; at the Amite Rive:r gaging station near Denham Springs the mean discharge was the highest for April in 35 years of record. Flooding occurred along the Red and Ouachita Rivers for the entire months of April and May. On the Ouachita River at Monroe the peak discharge of 88,900 ft3/s (2,520 m 3/s) on May 6 was the fourth highest since 1932. In June, tributary flooding subsided, but the Mississippi River remained above flood stage until late in the month.
The most outstanding facet of the tributary flooding in Louisiana was the tremendous volume of flood runoff that was recorded during, and for several months prior to, the March-May base flood period. Accordingly, flood-volume-frequency data for 1-, 3-, 7-, 15-, 30-, 60-, 90-, 120-, and 183-day periods were computed for selected gaging stations in Louisiana.
The results of discharge and sediment measurements are presented in table 12 for four Louisiana floodway sites where floodwater was diverted from the Mississippi during March through June. The diversions were made through these floodways to protect levee systems in the New Orleans area. (See discussion on main-stem flooding.)
Suspended-sediment data for the Red River at Alexandria are available for March 1 to June 30. The discharge-weighted mean concentration was 1,230 mg/1 and the transport wa;s 36,200,000 tons for the period. Particle-size data are not available.
WATER AND SEDIMENT DISCHARGE TO LAKE PONTCHARTRAIN AND THE GULF
OF MEXICO
Suspended-sedim.ent data were obtained at 24 locations pertinent to the flood area, 18 of which were adequate to report daily values for at least one continuous month in the March-June period, and 6 of which are adequate to indicate only instantaneous conditions. Overall the data are sufficient to give a qualitative indication of the tributary sources
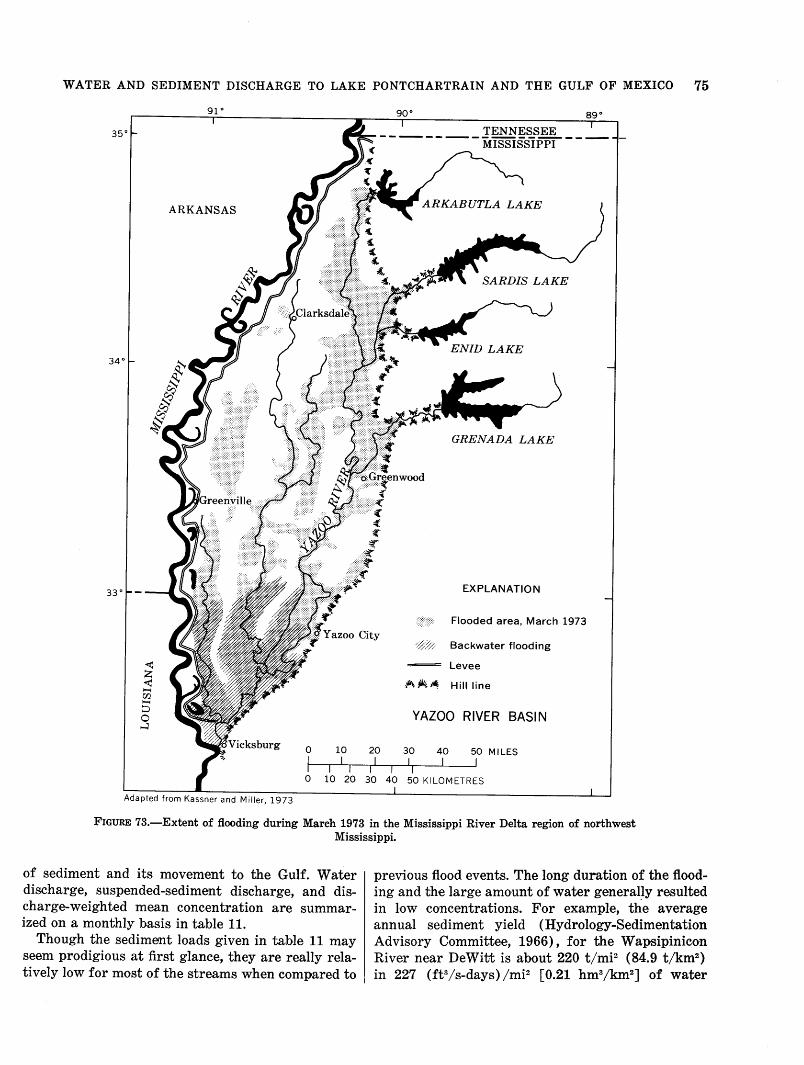
WATER AND SEDIMENT DISCHARGE TO LAKE PONTCHARTRAIN AND THE GULF OF MEXICO 75
91°
ARKANSAS
EXPLANATION
Flooded area, March 1973
~:;;; Backwater flooding
Levee
~~ ~ ~~ Hill line
YAZOO RIVER BASIN
0 10 20 30 40 50 MILES I I I I I I
I I I I 1
0 10 20 30 40 50 KILOMETRES
Adapted from Kassner and Miller, 1973
FIGURE 73.-Extent of flooding during March 1973 in the Mississippi River Delta region of northwest Mississippi.
of sediment and its movement to the Gulf. Water discharge, suspended-sediment discharge, and discharge-weighted mean concentration are summarized on a monthly basis in table 11.
Though the sediment loads given in table 11 may seem prodigious at first glance, they are really relatively low for most of the streams when compared to
previous flood events. The long duration of the flooding and the large amount of water general~y resulted in low concentrations. For example, the average annual sediment yield (Hydrology-Sedimentation Advisory Committee, 1966), for the Wapsipinicon River near DeWitt is about 220 t/mi2 (84.9 t/km2
)
in 227 (ft3/s-days) /mi2 [0.21 hm3/km2] of water
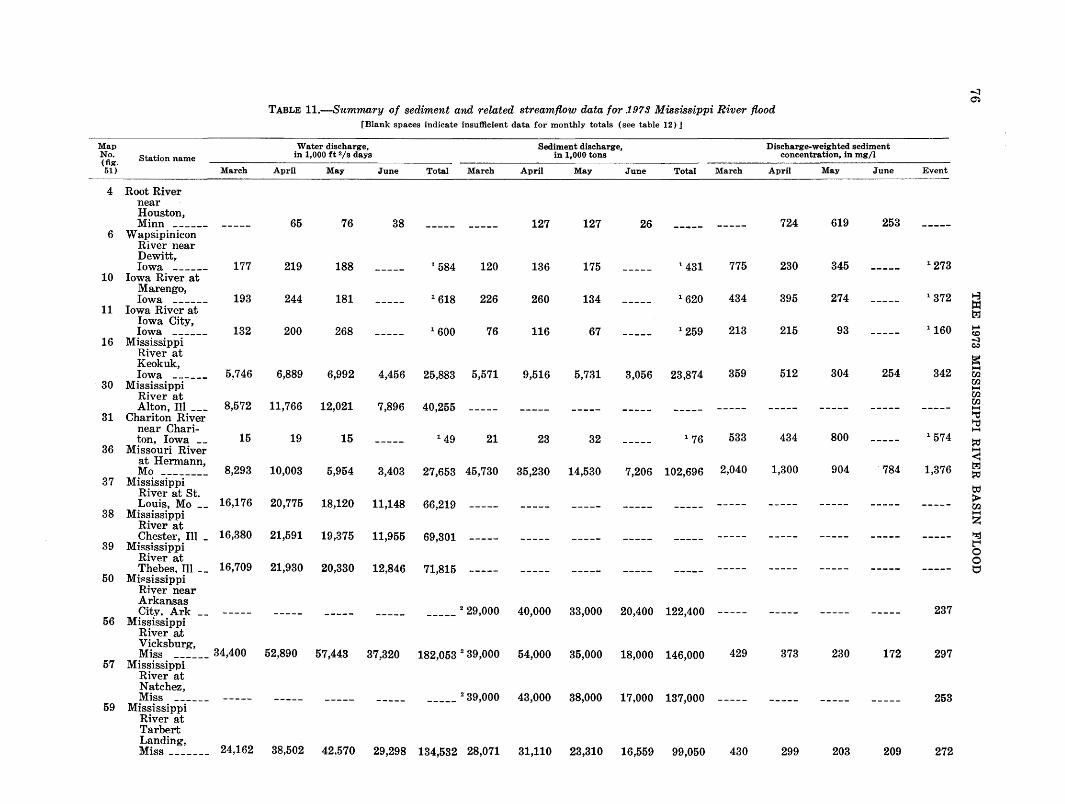
-l ~
TABLE 11.-Summary of sediment and related streamflow data for .1973 Mississippi River flood (Blank spaces indicate insufficient data for monthly totals (see table 12)]
Map Water discharge, Sediment discharge, Discharge-weighted sediment No. Station name in 1,000 ft a;s days in 1,000 tons concentration, in mg/1 (fig. 51) March April May June Total March April May June Total March April May June Event
4 Root River near Houston, Minn ------ ----- 65 76 38 ----- ----- 127 127 26 ----- ----- 724 619 253
6 Wapsipinicon River near Dewittr
1 273 Iowa 177 219 188 ----- 1 584 120 136 175 ----- 1 431 775 230 345 -----10 Iowa River at
Marengo, 274 1 372 ~ Iowa 193 244 181 ----- 1 618 226 260 134 ----- 1 620 434 395 ----- t:t= 11 Iowa River at t_1j
Iowa City, 93 1 160 ..... Iowa 132 200 268 ----- 1 600 76 116 67 ----- 1 259 213 215 ----- co
16 MississippT ___ -::J C!:)
River at a: Keokuk, 359 304 254 342
1-4 Iowa 5.746 6,889 6,992 4,456 25,883 5,571 9,516 5,731 3,056 23,874 512 00
30 Mississippi 00 1-4
River at 00 Alton, Ill ___ 8,572 11,766 12,021 7,896 40,255 00 ----- ----- ----- ----- ----- ----- ----- ----- ----- ----- 1-4
31 Chariton River "t1 "t1 near Chari- 1-4
ton, Iowa __ 15 19 15 ----- 1 49 21 23 32 ----- 1 76 533 434 800 ----- 1 574 l?:l 36 Missouri River 1-4
at Hermann, < 8,293 10,003 5,954 2,040 1,300 904 784 1,376 t.%.1
Mo -------- 3,403 27,653 45,730 35,230 14,530 7,206 102,696 l?:l 37 Mississippi
td River at St. Louis, Mo __ 16,176 20,775 18,120 11,148 66,219 ----- ----- ----- ----- > ----- ----- ----- ----- ----- ----- 00
38 Mississippi 1-4
River at z Chester, Ill _ 16,380 21,591 19,375 11,955 69,301 ----- ----- ----- ----- ----- ----- ----- ----- ----- ----- l'1j
39 Mississippi ~ 0 River at 0
Thebes, Ill __ 16,709 21,930 20,330 12,846 71,815 ----- ----- ----- ----- ----- ----- ----- ----- ----- ----- t::1 50 Mif'!sissippi
River near Arkansas City, Ark __ ----- ----- ----- ----- -----
2 29,000 40,000 33,000 20,400 122,400 ----- ----- ----- ----- 237
56 Mississippi River at Vicksburg, Miss ______ 34,400 52,890 57,443 37,320 182,053 2 39,000 54,000 35,000 18,000 146,000 429 373 230 172 297
57 Mississippi River at Natchez, Miss ----- ----- ----- ----- -----
2 39,000 43,000 38,000 17,000 137,000 ----- ----- ----- ----- 253 59 Mississi p-p(---
River at Tarbert Landing,
24,162 38,502 Miss _______ 42.570 29,298 134,532 28,071 31,110 23,310 16,559 99,050 430 299 203 209 272
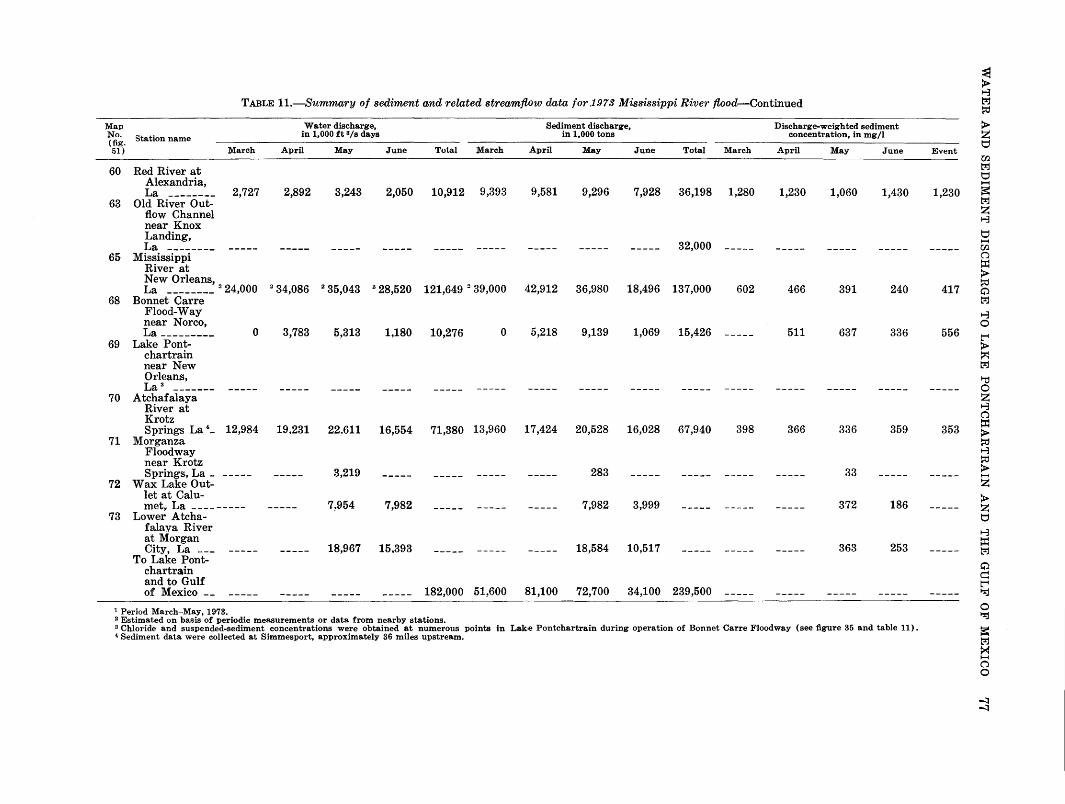
~ > t-3
TABLE 11.-Summary of sediment and related streamflow data for .1973 Mississippi River flood-Continued t_:2=j
~
Map Water discharge, Sediment discharge, Discharge-weighted sediment > No. Station name in 1,000 ft 3/s days in 1,000 tons concentration, in mg/1 z (fig.
April March April t:1 51) March May June Total May June Total March April May June Event
rn 60 Red River at
t_:2=j
t:1 Alexandria, ~
La -------- 2,727 2,892 3,243 2,050 10,912 9,393 9,581 9,296 7,928 36,198 1,280 1,230 1,060 1,430 1,230 a= 63 Old River Out- t_:2=j
flow Channel z near Knox
t-3
Landing, t:1 32,000 ~
La -------- ----- ----- ----- ----- ----- ----- ----- ----- ----- ----- ----- ----- ----- ----- rn 65 Mississippi 0
River at ::Il New Orleans, >
121,649 2 39,000 42,912 ~ La --------
2 24,000 2 34,086 2 35,043 2 28,520 36,980 18,496 137,000 602 466 391 240 417 C)
68 Bonnet Carre t_:2=j
Flood-Way t-3 near Norco, 0 La--------- 0 3,783 5!313 1,180 10,276 0 5,218 9,139 1,069 15,426 ----- 511 637 336 556 t"4
69 Lake Pont- > chart rain ~ near New t_:2=j
Orleans, ~ La 3 ----- ----- ----- ----- ----- ----- ----- ----- ----- ----- ----- ----- ----- ----- ----- 0
70 Atchafalaya z River at t-3 Krotz 0
::Il Springs La 4 _ 12,984 19,231 22.611 16,554 71,380 13,960 17,424 20,528 16,028 67,940 398 366 336 359 353 >
71 Morganza ~ Flood way t-3 near Krotz ~
Springs, La _ ----- 3,219 283 33 > ----- ----- ----- ----- ----- ----- ----- ----- ----- ----- ----- ~
72 Wax Lake Out- z let at Calu- > met,. La ____ ----- ----- 7!954 7,982 ----- ----- ----- 7,982 3,999 ----- ----- ----- 372 186 ----- z
73 Lower Atcha- t:1 falava River t-3 at Morgan
253 ::Il City, La --- ----- ----- 18,967 15,393 ----- ----- ----- 18,584 10,517 ----- ----- ----- 363 ----- t_:2=j
To Lake Pont-C)
chartrain d and to Gulf t"4 of Mexico -- ----- ----- ----- ----- 182,000 51!600 81,100 72,700 34,100 239,500 ----- ----- ----- ----- ----- 1-:tj
1 Period March-May, 19'73. 0 2 Estimated on basis of periodic measurements or data from nearby stations. 1-:tj
a Chloride and suspended-sediment concentrations were obtained at numerous points in Lak.e Pontchartrain during operation of Bonnet Carre Floodway (see figure 35 and table 11). a= 4 Sediment data were collected at Simmesport, approximately 36 miles upstream. t_:2=j
><I ~
0 0
-=1 -=1
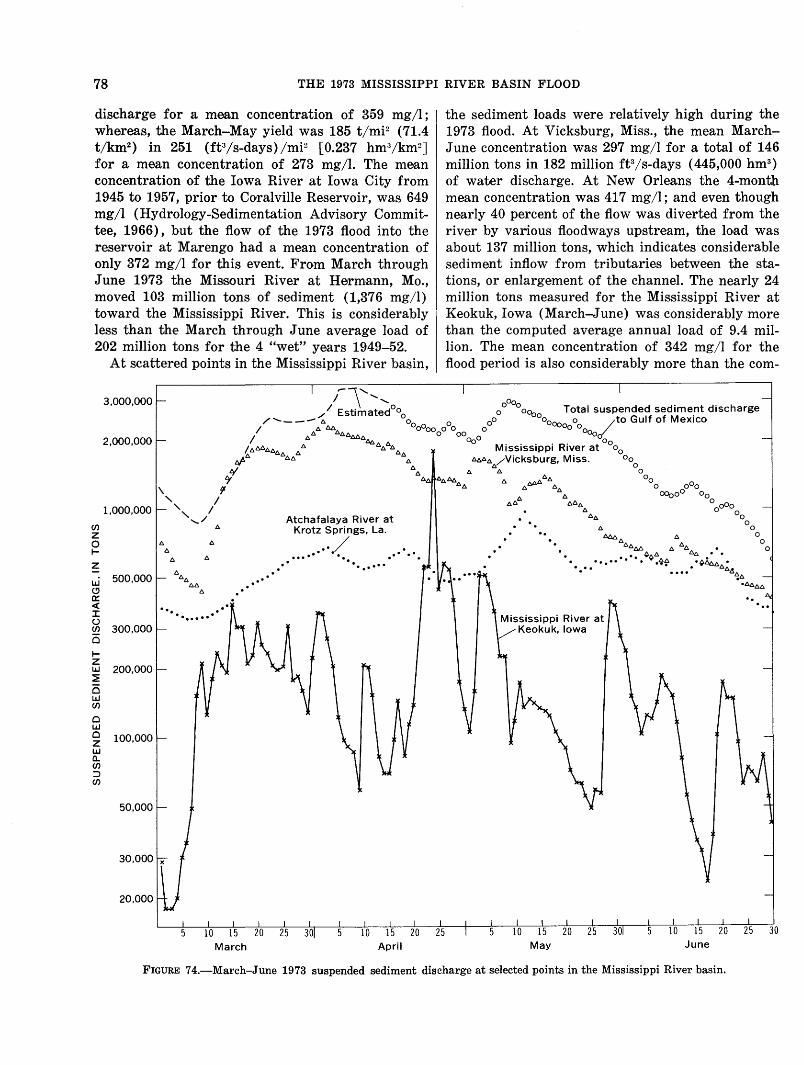
78 THE 1973 MISSISSIPPI RIVER BASIN FLOOD
discharge for a mean concentration of 359 mg/1 ; whereas, the March-May yield was 185 t/miZ (71.4 t/km2
) in 251 (ft3/s-days) /mi2 [0.237 hm3/km2]
for a mean concentration of 273 mg/1. The mean concentration of the Iowa River at Iowa City from 1945 to 1957, prior to Coralville Reservoir, was 649 mg/1 (Hydrology-Sedimentation Advisory Committee, 1966), but the flow of the 1973 flood into the reservoir at Marengo had a mean concentration of only 372 mg/1 for this event. From March through June 1973 the Missouri River at Hermann, Mo., moved 103 million tons of sediment (1,376 mg/1) toward the Mississippi River. This is considerably less than the March through June average load of 202 million tons for the 4 "wet" years 1949-52.
At scattered points in the Mis.sissippi River basin,
en z 0 1-
z
3,000,000
2,000,000
1,000,000
LLJ 500,000 (.!) Q: <( J:
~ 300,000 0 1-z LLJ 200,000 :E 0 LLJ en 0 LLJ
~ 100,000 LLJ a.. en ::::> en
50,000
20,000
March April
the sediment loads were relatively high during the 1973 flood. At Vicksburg, Miss., the mean MarchJune concentration was 297 mg/1 for a total of 146 million tons in 182 million ft3/s-days ( 445,000 hm3
)
of water discharge. At New Orleans the 4-month mean concentration was 417 mg/1; and even though nearly 40 percent of the flow was diverted from the river by various floodways upstream, the load was about 137 million tons, which indicates considerable sediment inflow from tributaries between the stations, or enlargement of the channel. The nearly 24 million tons measured for the Mississippi River at Keokuk, Iowa (March-June) was considerably more than the computed average annual load of 9.4 million. The mean concentration of 342 mg/l for the flood period is also considerably more than the com-
Mississippi River at /Keokuk, Iowa
May
30 June
FIGURE 74.-March-June 1973 suspended sediment discharge at selected points in the Mississippi River basin.
SELECTED REFERENCES 79
puted long-term average of 154 mg/1. The MarchJune temporal distribution of the sediment load for Keokuk and other selected points in the basin is shown in figure 7 4 on a daily basis.
The sediment discharge to the Gulf during the flood can be estimated using data collected at the stations Bonnet Carre Floodway near Norco, La. (via Lake Pontcha;rtl'lain), Wax Lake Outlet 1at Calumet, La., Lower Atchafalaya River at Morgan City, La., and Mississippi River at New Orleans, La. See figure 7 4 and table1s 11 and 12. Data prior to wbout April 15 were not obtained at the Calumet and Morgan City stations and therefore estimates of the sediment discharge of the flood March 1 to April 15 were ba.sed on data at Vicksburg and the Atchafalaya at Krotz Springs.
The total March through June water discharge of the flood to the Gulf of Mexico was approximately 182 'million ft3/'s-days ( 445,000 hm3
) including 10 million (24,500 hm3
) into and through Lake Pontchartrain. The total sediment discharge during this period was approximately 240 million tons including 15 million into Lake Pontchartrain.
SELECTED REFERENCES
Anderson, D. B., and Burmeister, I. L., 1970, Floods of March-May 1965 in the Upper Mississippi River basin: U.S. Geol. Survey Water-Supply Paper 1850-A, 448 p.
Dalrymple, Tate, 1960, Flood frequency analyses: U.S. Geol. Survey Water-Supply Paper 1543-A, 80 p.
Environmental Data Service, 1968, Climatic atlas of the United States: Washington, U.S. Govt. Priting Office, 80 p.
--- 1973a, Hourly presipitation data: v. 23, no. 3-5, Asheville, N.C., National Climatic Center.
--- 1973b, Climatological data: v. 79, no. 3-5, Asheville, N.C., National Climatic Center.
Environmental Data Service and Statistical Reporting Service, 1973, Weekly weather and crop bulletin: v. 60, no. 1-23, Washington, Agricultural Climatology Service Office.
Guy, H. P., and Norman, V. W., 1970, Field methods for measurement of fluvial sediment: U.S. Geol. Survey Techniques of Water Resources Inv., book 3, chap. C2, 59 p.
Hershfield, D. M., 1961, Rainfall frequency atlas of the United States for durations from 30 minutes to 24 hours and return periods from 1 to 100 years: U.S. Weather Bur. Tech. Paper no. 40, 115 p.
Huff, F. A., and Changnon, S. A., Jr., 1964, A model 10-inch rainstorm: .Jour. of Applied Meteorology, v. 3, no. 5, 587-599.
Hydrology-Sedimentation Advisiory Committee, 1966, Fluvial sediment in the Upper Mississippi River basin: App. G. Upper Mississippi River comprehensive basin study, F. J. Mack, Corps of Engineers, Rock Island, Ill., Chairman, 116 p.
Kassner, H. A., and Miller, R. P., 1973, Flood of '73: Water Spectrum, Dept. of the Army, Corps of Engineers, v. 5, no. 2, p. 30-36.
Kinzer, G. D., and Gunn, R., 1951, The evaporation, temperature and thermal relaxation time of freely falling water drops: Jour. of Meterology, v. 8, no. 2, p. 71-83.
Kohler, M. A., and Parmele, L. H., 1967, Generalized estimate of freewater evaporation: Water Resource Research, v. 3, no. 4, fourth quarter, p. 997-1005.
Lott, G. A., and Myers, V. A., 1956, Meterology of flood-producing storms in the Mississippi River basin: Hydrometeorological Rept. no. 34, 226 p.
Mason, J. B., 1952, The production of rain and drizzle by coalescence in stratiform clouds: Quarterly Jour. of Royal Meteorol. Soc., v. 78, no. 337, p. 377-386.
Miller, J. F., 1964, Two- to ten-day precipitation for return periods of 2 to 100 years in the contiguous United States: U.S. Weather Bur. Tech. Paper no. 49, 29 p.
Miller, J. F., and Frederick, R. H., 1966, Normal monthly number of days with precipitation of 0.5, 1.0, 2.0, and 4.0 inches or more in the conterminous United States: U.S. Weather Bur. Tech. Paper no. 57, 52 p.
Miller, J. F., and Pauhus, J. L. H., 1964, Frequency of maximum water equivalent of March snowcover in northern central United States: U.S. Weather Bur. Tech. Paper no. 50, 24 p.
National Weather Service, 1973, Water supply outlook for the western United States: v. 25, no. 3, 16 p.
Palmen, E., 1961, On the mechanism of the vertical heat flux and generation of kinetic energy in the atmosphere: Tell us, v. 18, no. 4, fourth quarter, p. 838-845.
Palmer, W. C., 1965, Meteorological drought: U.S. Weather Bur. Research Paper no. 45, 58 p.
Patterson, J. L., 1964, Magnitude and frequency of floods in the United States, Part 7, Lower Mississippi River basin: U.S. Geol. Survey Water-Supply Paper 1681, 636 p.
Patterson, J. L., and Gamble, C. R., 1968, Magnitude and frequency of floods in the United States, Part 5, Hudson Bay and Upper Mississippi River basins: U.S. Geol. Survey Water-Supply Paper 1678, 546 p.
Porterfield, George, 1972, Computation of fluvial-sediment discharge: U.S. Geol. Survey Techniques of Water Resources Inv., book 3, c·hap. C3, 66 p.
Reap, R. M., 1972, An operational three-dimensional trajectory model: Jour. of Applied Meteorology, v. 11, no. 8, p. 1193-1202.
Riedel, J. T., Appleby, J. F., and Schloemer, R. W., 1956, Seasonal variation of the probable maximum precipitation east of the 105th meridian for areas from 10 to 1,000 square miles and duration.s of 6, 12, 24, and 48 hours: Hydrometeorological Rept. no. 33, 58 p.
Sawyer, J. S., 1970, Observational characteristics of atmospheric fluctuation with a time scale of a month: Quarterly Jour. of Royal Meteorol. Soc., v. 96, no. 410, p. 610-625.
Smith, W., and Younkin, R. J., 1972, An operationally useful relationship between the polar jet stream and heavy precipitation: Monthly Weather Review, v. 100, no. 6, p. 434-440.
Spar, J., 1973, Supplementary notes on sea-surface temperature anomalies and model-generated meteorological histories: Monthly Weather Review, v. 101, no. 10, p. 767-773.
U.S. Inter-Agency Committee on Water Resources, Subcommittee on Sedimentation, 1957, Some fundamentals of particle-size analysis, report 12 of a study of methods used in measurement and analysis of sediment loads in streams: 55 p.

80 THE 1973 MISSISSIPPI RIVER BASIN FLOOD
U.S. Water Resources Council, 1967, A uniform technique for determining floodflow frequencies: U.S. Water Resources Council, Bull. 15, 15 p.
Vander Harr, T. H., and Ort, A. H., 1973, New estimate of annual poleward energy transport by northern hemisphere oceans: Jour. of Physical Oceanography, v. 3, no. 2, p. 169-172.

TABLE 12
82 THE 1973 MISSISSIPPI RIVER BASIN FLOOD
TABLE 12.-Station descriptions and dischm·ge and suspended-sediment data This table presents information for gaging stations where outstanding flood events were experienced and where sediment data are available during
the spring 1973 flood. The ma.p numbers (in parenthesis at top of each manuscript) are the same as the numbers on the station location map (fig. 51) for each station and
will aid in identifying the site. The station numbers immediately follow the map numbers and are nationwide identification numbers used by the U.S. Geological Survey to locate the
stations in downstream order. Stations in this table are arranged in downstream order; however, an alphabetical listing with station numbers is provided in the station index.
Location provides an exact geographical reference to the gaged site. Under drainage area is the most recently determined area of the basin based on the most accurate maps available at the time of the determination. Gage provides a description of the type of gage used to collect the data and gives the datum of the gage. Bankfull or flood stage shows the approximate elevation of the stream when flooding begins. Where significant, a tabulation of the number of days
this stage was exceeded during the spring 1973 floods is included along with a comparison to previous floods. Maxima provides information on maximum stage and discharge during the flood period. Also included for many stations are suspended-sediment data
and recurrence intervals in years for flood peaks smaller than the estimated 100-year peak. Whenever 1973 peaks exceeded the estimated 100-year peak, the statement "discharge exceeded the 100-year flood" is shown. Where applicable, historic flood information is listed for comparative purposes.
Remarks includes statements about regulation in the basin, diversions, cooperation, or other pertinent information.
MISSISSIPPI RIVER MAIN STEM (1) 05331000 Mississippi River at St. Paul, Minn.
Location.-Lat 44°56'40", long 93°05'20", in SE14NEt~ sec. 6, T. 28 N., R. 22 W., Ramsey County, on left bank in St. Paul, 300ft (91 m) upstre·am from Robert Str·eet Bridge, 6 mi (10 km) downstream from Minnesota River, and at mile 839.3 (1,350.4 km) upstream from Ohio River. Auxiliary water-stage recorder 5.6 mi (9.0 km) downstream from base gage.
Drainage area.-36,800 mi2 (95,300 km2), approximately.
Gage.-Base gage: Water-stage recorder. Datum of gage is 683.62 ft (208.367 m) above mean sea level, datum of 1929. Auxiliary gage: Water-stage recorder. Datum of gage is 684.16 ft (208.532 m) above mean sea level, datum of 1912.
Flood stage.-14.00 ft (4.27 m). Maxima.-March-May 1973: Discharge, 51,800 fe;s (1,470 m 3/s) 4:00 p.m., Mar. 20 [gage height, 11.19 ft (3.41 m) ]. Recur
rence interval of discharge is 3 years (based on figure 52). Period of record: 1851-70, 1872 to current year. Maximum discharge, 171,000 ft'1/s (4,840 m'1/s) Apr. 16, 1965 [gage
height 26.01 ft (7.928 m) from :floodmark) ]. Remarks.-Flood:flow not materially affected by artificial storage.
Mean discharge, in cubic feet per second, .1973 Day March April May Day March April May Day March April May
1 ---- 7,090 33,500 16,700 11 19,400 22.100 26,100 21 51,300 21,700 16,600 2 ---- 7,260 32,600 20,700 12 23,500 20:700 25,900 22 50,200 22,200 17,200 3 ---- 7,810 31,900 21,800 13 29,400 18,700 25,900 23 48,500 22,200 16,400 4 ---- 7,530 30.800 23,100 14 34,200 19.100 26,000 24 46,700 21,200 16,300 5 ---- 8,920 29 .. 600 23,400 15 38,000 18-,800 24,900 25 44,800 20,500 17,100 6 ---- 10,900 28;700 24,600 16 41,700 18,700 23,200 26 43,000 20.200 17,500 7 ---- 11,600 27.500 24,400 17 45,600 18,600 21,700 27 41,200 19~100 18,800 8 ---- 13,700 26.200 25,000 18 48,800 28,900 20,200 28 39,400 18,800 20,600 9 ---- 15,000 24~200 25,800 19 50,600 20.900 19,000 29 37,500 18,000 21,900
10 ---- 17,100 22,500 26,100 20 51,600 20~500 17,700 30 34,900 17,700 22,700 31 33,700 23,300
Monthly mean discharge, in cubic feet per second ------------------------------------ 31,300 23,200 22,000 Runoff, in acre-feet ---------------------------------------------------------------- .98 .70 .69
MISSISSIPPI RIVER MAIN STEM (2) 05344500 Mississippi River at Prescott, Wis.
Location.-Lat 44°44'45", long 92°48'00", in sec. 9, T. 26 N., R. 20 W., Pierce County, on left bank at Prescott, 200ft (61 m) downstream from St. Croix River, 300 ft (91 m) south of Chicago, Burlington & Quincy Railroad bridge, 800ft (244m) south of bridge on U.S. Highway 10, and at mile 811.4 (1,305.5 km) upstream from Ohio River. Auxiliary water-stage recorder 10.7 mile (17.2 km) downstream from base gage.
Drainage are·a.-44,800 mF (116,000 km2), approximately.
Gage.-Base gage: Water-stage recorder. Datum of gage is 619.50 ft (197.968 m) above mean sea level, datum of 1929. Auxiliary gage: Water-gage recorder. Datum of gage is 650.00 ft (198.120 m) ·above mean sea level, datum of 1929.
Bankfull stage.-39.00 ft (11.887 m). Maxima.-March-May 1973: Discharge, 78,300 ft3s (2,220 m/3s) 2:00p.m. Mar. 20 [gage height, 33.83 ft (10.311 m)]. Recur
rence interval ·of discharge is 4 years (based on figure 30). Period of record: June 1928 to current year. Maximum discharge, 228,000 ft3/s (6,460 m3 /s) Apr. 18, 1965 [gage height,
43.11 ft (13.140 m) from gmph based on gage readings)]. Remarks.-Flood:flow not materially affected by art.ificial s.torage.
Mean discharge, in cubic feet per second, .1973 Day March April May Day March April May Day March April May
1 ---- 9,900 47,900 29,400 11 28,100 32.500 37,100 21 77.000 32,000 26,700 2 ---- 10,900 46,800 30,100 12 31,500 31,500 36,600 22 74;200 32,200 26,400 3 ---- 11,600 45,200 30,500 13 36,000 29,800 36,400 23 70,900 32,800 25,900 4 ---- 11,800 43,200 31,800 14 43,800 28,800 36,400 24 67.800 33,000 25,300 5 ---- 16,100 40,600 33,300 15 53,000 28,400 35,900 25 6(900 32,900 26,300 6 ---- 16,400 39.500 34,400 16 61.700 28,800 34,700 26 62,100 32,200 28,300 7 ---- 17,900 38,900 35,700 17 68,200 27,400 32,300 27 59,800 31,100 31,900 8 ---- 20,400 37,100 36,200 18 73,700 28,900 31,100 28 58,100 30,400 35,300 9 ---- 21,900 36,000 35,900 19 76,700 30,700 29,400 29 55,400 29,700 37,500
10 ---- 25,600 33,600 36,800 20 78,000 31,100 27,800 30 53,100 29,200 38,400 31 49,700 38,700
Monthly mean discharge, in cubic feet per second ------------------------------------ 45,400 34,100 32,700 Runoff, in inches ------------------------------------------------------------------ 1.17 .85 .84
THE FLOODS 83
TABLE 12.-Station descriptions and discharge and suspended-sediment data-Continued
MISSISSIPPI RIVER MAIN STEM
(3) 05378500 Mississippi River at Winona, Minn.
Location.-Lat 44°03'20", long 91 °38'15", in sec. 23, T. 107 N., R. 7 W., Winona County, on right bank at Winona. pumping station in Winona, 9lh miles (15.3 km) upstream from Trempealeau River and at mile 725.7 (1,167.7 km) upstream from the Ohio River. Auxiliary digital water-stage recorder at navigation dam 5A in sec. 9, T. 107 N., R. 7 W., 2.7 miles (4.3 km) upstream.
Drainage area.-59,200 mi2 (153,300 km2), approximately.
Gage.-Base gage: Water-stage recorder. Datum of gage is 639.64 ft (194.962 m) above mean sea level, datum of 1929. Auxiliary gage: Water-stage recorder. Datum of gage is 640.00 ft (195.072 m) above mean s•ea level, datum of 1912.
Flood stage.-13 ft (3.97 m). Maxima.-March-May 1973: Discharge, 136,000 f~/s (3,850 m3/s) 0100 hours Mar. 20 [gage height, 14.58 ft (4.444 m)]. Recur
J.·ence interval of discharge is 7 years (based on figure 52). Period of record: June 1928 to current year. Maximum discharge, 268,000 ft3/s (7,590 m3/s) Apr. 19, 1965 [gage height,
20.77 ft (6.331 m) from fl.oodmark)]. Remarks.-Floodfl.ow not materially affected by artificial storage.
Mean discharge, in cubic feet per second, .1973
Day March April May Day March April May Day March April May
1 ---- 17,700 71,400 50,100 11 54,300 53,100 69,600 21 130,000 63,600 50,900 2 ---- 19,300 69,000 55,000 12 65,300 61.000 69,300 22 123,000 62.300 47,800 3 ---- 22,300 67.000 63,100 13 78,400 49-.900 69,200 23 113,000 59:700 47,500 4 ---- 26,500 65:100 72,100 14 82,500 45AOO 69,100 24 106,000 56~700 46,100 5 ---- 27,900 63.000 76,900 15 93,100 46~100 68,000 25 99,600 54,300 44,100 6 ---- 31,400 6t800 84,400 16 109,000 51.300 65,200 26 93,200 54.200 45,700 7 ---- 36,100 6o;ooo 87,600 17 120,000 53;200 62,300 27 88,000 51;900 46,400 8 ---- 42,000 58.000 82,200 18 129,000 58.300 58,800 28 82,900 50,000 54,500 9 ---- 45,300 57;100 75,100 19 134,000 59.700 56,000 29 80,500 46.500 59,800
10 ---- 47,300 56,300 71,300 20 135,000 60~300 53,200 30 77,400 46;700 63,700 31 74,400 64,700
Monthly mean discharge, in cubic feet per second ------------------------------------ 76,900 56,800 62,300 Runoff, in inches ------------------------------------------------------------------ 1.50 1.07 1.21
ROOT RIVER BASIN (4) 05385000 Root River near Houston, Minn.
Location.-Lat 43°46'05", long 9r35'11", in sec. 32, T. 104 N .. R. 6 W., Houston County, on right bank 1 mile (1.6 km) west of Houston, and 2.5 miles ( 4.0 km) upstream from South Fork.
Drainage area.-1,270 mi2 (3,290 km2), approximately.
Gage.-Water-stage recorder. Datum of gage is 671.86 ft (204.783 m) above mean sea level, datum of 19·29. Bankfull stage.-12 ft (3.7 m). approximately. Maxima.-March-May 1973: Discharge, 11,700 ft3/s (331 m3/s), 4:00p.m., Apr. 17 [gage height, 10.48 ft (3.194 m)]. Recur
rence interval of discharge, 2 years. Period of record: May 1909 to Sept. 1917, May to November 1929, March 1930 to current year. Maximum discharge, 37,000
ft3/s (1,050 m3/s) Apr. 1, 1952 [gage height, 13.90 ft (4.237 m)]; maximum gage height, 18.32 ft (5.584 m) Mar. 2, 1965 (backwater from ice).
Remarks.-Floodfl.ow not affected by artificial storage. Station data included in this report primarily for sediment analysis.
Mean water discharge and suspended-sedrunent concentration and discharge
March April May June sediment Suspended Susoended Susoended
Susnended sediment sediment ~ediment
Mean Mean Dis- Mean Mean Dis- Mean Mean Dis- Mean Mean Dis-Day dis- concen- charge Day dis- concen- charge Day dis- concen- charge Day dis- concen- charge
charge tration (tons/ charge tration (tons/ charge tration (tons/ charge tration (tons/ (ft a;s) {mgjl) day) (ft 3/s) (mg/l) day) (ft 3 /s) (mgjl) day) (ft 3/s) (mgfl) day)
1 660 1 1,130 150 458 1 2,210 1,280 8,010 1 1.560 184 775 2 1,610 2 1,170 187 591 2 6,350 2,120 36,300 2 1,460 167 658 3 2,600 3 1,370 245 906 3 6,620 1.200 21,400 3 1,390 170 638 4 3,930 4 1,390 205 769 4 4,480 800 9,680 4 1,410 176 670 5 3,430 5 1,230 220 731 5 3,250 485 4,260 5 1,830 228 1,130 6 2,430 6 1,140 178 548 6 2,770 345 2,580 6 1,630 538 2,370 7- 3,980 7 1,070 135 390 7 2,570 290 2,010 7 1.500 295 1,190 8 4,000 8 1,040 141 396 8 3.530 495 4,720 8 1,380 217 809 9 2,500 9 1,060 160 458 9 5,250 778 11,000 9 1,300 193 677
10 1,950 10 1,030 175 487 10 3.410 538 4,950 10 1,230 178 591 11 7,360 11 935 154 389 11 2,700 345 2,520 11 1.180 179 570 1.2 9,430 12 982 112 297 12 2,330 258 1,620 12 1,160 230 720 13 4,260 985 11,400 13 988 88 235 13 2,080 175 983 13 1,120 222 671 14 3,810 1.260 13.000 14 1,030 128 356 14 1,920 210 1,090 14 1.090 170 500 15 5.250 1,640 23,200 15 2,370 433 3,170 15 1,790 240 1,160 15 1,050 143 405 16 3,900 1,010 10,600 16 6,860 1.660 30.700 16 1.670 195 879 16 1.070 140 404 17 2.880 610 4,740 17 10.600 1,560 44,600 17 1.570 158 670 17 1,060 149 426 18 2,300 400 2,480 18 5~700 1.0!'10 15.900 18 1.500 168 680 18 1.330 329 1,n20 19 1.920 350 1,810 19 3,670 700 6,940 19 1.430 200 772 19 1.640 662 2,930 20 1,660 330 1,480 20 2.960 465 5,720 20 1,370 198 7::12 20 1.720 5!'12 2,470 21 1.510 245 999 21 2.530 440 3,010 21 1,330 180 646 21 1,390 372 1,400 22 1,430 220 849 22 2,240 345 2,090 22 1,350 171 623 22 1,210 237 774 23 1,340 221 800 23 1,990 320 1,720 23 1,340 147 532 23 1.120 177 535
84 THE 1973 MISSISSIPPI RIVER BASIN FLOOD
TABLE 12.-Station descriptions and discharge and suspended-sediment data-Continued
Mean water discharge and suspended-sedinwnt concentration and discharge-Continued
March April May Suspended Suspended Suspended sediment sediment sediment
Mean Mean Dis- Mean Mean Dis- Mean Mean Dis-Day dis- concen- charge Day dis- concen- charge Day dis- concen- charge Day charge tration (tons/ charge tration (tons/ charge tration (tons/
(ft a;s) (mg/1) day) (ft a;s) (mgjl) day) (ft a;s) (mgjl) day)
24 1,280 195 674 24 1,790 280 1,350 24 1,300 162 569 24 25 1,250 215 726 25 1,650 225 1,000 25 1,290 150 522 25 26 1,280 178 615 26 1,540 200 832 26 1.270 120 411 26 27 1.320 180 642 27 1,440 180 700 27 1,280 298 1,030 27 28 1;250 168 567 28 1,360 180 661 28 1.660 420 1,880 28 29 1,180 140 446 29 1,430 510 1,970 29 2;070 388 2,170 29 30 1,130 148 452 30 1.600 360 1,560 30 2,.rno 302 1,790 30 31 1.120 148 448 31 ----- 31 1.770 210 1,000 31 --------
Total ==:::_ 83,990 Total 65,295 126,934 Total 75,640 127,189 Total -------Monthly Monthly Monthly
mean mean mean Monthly dis- dis- dis- mean charge - 2,709 charge - 2,177 4,231 charge - 2,440 4,103 discharge
Maxi- Maxi- Maxi-mum 9,430 mum 10,600 44,600 mum --- 6,620 36,300 Maximum __ --
Mini- Mini- Mini-mum 660 mum 935 235 mum ___ 1,270 411 Minimum ____
MISSISSIPPI RIVER MAIN STEM (5) 05420500 Mississippi River at Clinton, Iowa
June Suspended sediment
Mean Mean Dis-dis- concen- charge
charge tration (tons/ (ft a;s) (mg/1) day)
1,060 193 552 1,010 228 622
973 188 494 986 177 471 969 161 421 932 160 403 905 169 413
37,695 26,009
1,257 867
1,830 2,93Q
905 403
Location.-Lat 41 °46'53", long 90°15'04", in NW% s.ec. 34, T. 81 N., R. 6 E., Clinton County, on right bank at foot of Seventh Avenue in Camanche, 5.0 miles (8.0 km) upstre,am from Wapsipinicon River, 6.4 miles (10.3 km) downstream from Clinton, 10.6 miles (17.1 km) downstream from dam 13, and at mile 511.8 (82.3.5 km) upstre·am from Ohio River. Prior to June 6, 1969, at site 400 ft (122 m) downstream.
Drainage area.-85,600 mP (222,000 km2), approximately, at Fulton-Lyons Bridge where discharge ·me,asurements are made.
Gage.-Water-stage recorder. Datum of gage is 562.68 ft (171.505 m) above mean sea level, datum of 1929. June 1873 to May 31, 1934, .staff gage in stone well and June 1, 1934, to Sept. 30, 1939, water-stage recorder 14.8 miles (23.8 km) downstream at Le Claire, at datum 0.07 ft (0.021 m) lower. Oct. 1, 1939, to Sept. 30, 1955, water-stage recorder 10.6 miles (17.1 km) upstream at dam 13, at datum 5.48 ft (1.670 m) higher. Auxiliary water-s.tage recorder ·at dam 13 since Oct. 1, 1958. Pre,se~t gage used as auxiliary gage Oct. 1, 1939, to Sept. 30, 1955.
Flood stage.-16 ft (4.9 m). Maxima.-March-May 1973: Daily discharge, 207,000 ft3/s (5,860 m3/s) Mar. 25; gage height, 20.65 ft (6.294 m), 11:00 a.m.,
Mar. 25. Recurrence interval of discharge is 20 years (bas,ed on figure 52). June 1873 to February 1973: Daily discharge, 307,000 f~ Is ( 8,690 m3 Is).
Ap·r. 28, 1965; gage height, 24.65 ft (7.513 m) Apr. 28, 1965. Maximum stage known s~ince at least 1828 that of Apr. 28, 1965.
Mean stage, in feet and discharge in cubic feet per second in .1973 March April May
Day Stage Discharge Stage Discharge Stage Discharge
1 ---------- 9.90 39,000 16.98 148,000 15.65 125,000 2 ---------- 10.05 40,000 16.49 140,000 15.47 124,000 3 ---------- 10.37 45,000 16.05 133,000 15.92 129.000 4 ---------- 10.62 51,200 15.67 127,000 15.67 123:ooo 5 ---------- 10.67 51,800 15.25 120,000 15.08 115,000 6 ---------- 10.64 54,000 14.68 110,000 14.75 112,000 7 ---------- 11.94 71,600 14.31 106,000 14.77 114.000 8 ---------- 12.76 80,300 14.10 103,oop 15.46 126:ooo 9 ---------- 12.13 71,500 14.02 102,000 16.42 143;ooo
10 ---------- 11.85 68,500 14.10 103,000 17.40 158.000 11 ---------- 12.38 79,800 14.11 103,000 18.06 168:ooo 12 ---------- 13.70 98,100 14.12 103,000 18.42 173.000 13 ---------- 14.25 105,000 13.98 102,000 18.59 174~000 14 ---------- 14.79 114,000 13.80 98,700 18.58 172,000 15 ---------- 15.31 124,000 13.76 98,200 18.42 168,000 16 ---------- 15.99 136,000 14.15 106,000 18.11 163.000 17 ---------- 16.65 146,000 14.93 118,000 17.71 157:ooo 18 ---------- 17.30 157.000 15.51 125,000 17.29 150.000 19 ---------- 17.91 167.000 15.57 125,000 16.88 144~000 20 ---------- 18.45 175,000 15.47 123,000 16.44 137,000 21 ---------- 18.98 184,000 15.91 130,000 15.91 129.000 22 ---------- 19.58 192,000 17.07 145,000 15.42 122.000 23 ---------- 20.13 200,000 17.95 156,000 14,65 1o9;ooo 24 ---------- 20.44 205,000 18.16 160,000 14.04 101.000 25 ---------- 20.60 207,000 18.16 162,000 13.80 97:600 26 ---------- 20.47 203,000 1$.06 161,000 13.38 90:700 27 ---------- 20.11 197,000 17.84 159,000 13.03 86:ooo 28 ---------- 19.62 188,000 17.44 153.000 13.07 87;500 29 ---------- 18.99 178,000 16.90 145,000 13.55 92.800 30 ---------- 18.30 167,000 16.25 134,000 13.60 92;8oo 31 ---------- 17.61 157,000 13.60 93.800
]dean -------------------- 127,500 126,600 128,300 Inches ------------------- 1.72 1.65 1.73 Acre-feet ---------------- 7~840,000 7,535,000 7,889,000
THE FLOODS 85
TABLE 12.-Station descriptions and discharge and suspended-sediment data-Continued
Period
~arch-1~ay 1973 ------------------1874-1972 ------------------------Recurrence interval~ in years, for
1973 1lood volumes ---------------
Highest mean discharge, in cubic feet per second, for the indicated number of consecutive days 1 3 7 15 30
207,000 307,000
20
205,000 304,000
10
199,000 296,000
10
WAPSIPINICON RIVER BASIN
182,000 271,000
10
150,000 224,000
7
(6) 05422000 Wapsipinicon River near DeWitt, Iowa
Location.-Lat 41 °46'01", long 90°32'05", in SW14NE14 sec. 6, T. 80 N., R. 4 E., Clinton County, on left bank 5 ft (1.5 m) upstream from bridge on U.S. Highway 61, 0.9 mile (1.4 km) downstream from Silver Cre,ek, 4.0 miles (6.4 km) south of water tower in DeWitt, 6.2 miles (10.0 km) upstream from Brophy Creek, and 18.2 miles (29.3 km) upstream from mouth.
Drainage area.-2,330 mi2 ( 6,030 km2
).
Gage.-'Water-stage recorder. Datum of gage is 598.81 ft (182.517 m) above mean sea level. Flood stage.-10 ft (3.0 m). Flood stage was exceeded continuously from Apr. 16 to ~ay 19, 1973. ~axima.-~arch-May 1973: Discharge, 27,000 fe;s (765 m3/s) 11:45 a.m. Apr. 22 [gage height, 12.76 ft (3.889 m)]. Recur
rence interval of discharge is 12 years. June 1934 to February 1973: Discharge, 26,000 ft3/s (736 m3/s) June 27, 1944 [gage height, 12.07 ft (3.679 m)]; maxi
mum gage height, 12.30 ft (3.749 m) July 9, 1969.
Suspended sediment
Date Gage Discharge Concentration Discharge
Hour height (cfs) (mg/1) (tons/day) (ft)
Apr. 20 -------------------------- 12:00 p.m. 11.50 10,200 128 3,530 Apr. 21 --------------------------- 6:00a.m. 11.75 11,900 155 4,980
9:00a.m. 11.87 11,900 172 5,990 12:00m. 12.03 14,500 193 7.560
3:00p.m. 12.16 16,000 215 9:230 6:00p.m. 12.35 18,800 265 13;500 9:00p.m. 12.51 21,800 360 21,200
12:00 p.m. 12.65 24,600 403 26.800 Apr. 22 --------------------------- 6:00a.m. 12.66 24,800 420 28:100
11:45 a.m. 12.76 27,000 437 31~900 6:00p.m. 12.71 25,800 415 28,900
12:00 p.m. 12.63 24,200 355 23,200 Apr. 23
1 -------------------------- 6:00a.m. 12.51 21,800 305 18,000
12:00 m. 12.42 20,000 255 13,800 6:00p.m. 12.33 18,400 232 11,500
12:00 p.m. 12.26 17,300 210 9,810
1A seven-vertical suspended-sediment sample at 11:40 a.m. contained 76 percent clay, 12 percent silt, and 12 percent sand.
Mean water discharge and suspended-sediment concentration and discharge
March April May Suspended Suspended Suspended sediment sediment sediment
Mean Mean Dis- Mean Mean Dis- Mean Mean Dis-Day dis- eoncen- charge Day dis- concen- charge Day dis- concen- charge charge tration (tons/day) charge tration {tons/day) charge tration (tons/day) (ft 3/s) (mg/l) (ft s;s) (mg/1) (ft 3/s) (mg/1)
1 1,900 182 930 1 4,080 627 6,910 1 5,300 155 2,220 2 2,300 402 2,500 2 4,790 382 4,940 2 8,230 1,370 30,400 3 2,600 682 4,790 3 4,390 265 3,140 3 9,190 638 15,800 4 2.400 229 1,480 4 3,770 160 1,630 4 7,750 283 5,920 5 2,500 161 1,090 5 3,470 137 1,280 5 7,000 204 3,860 6 2,600 173 1,210 6 3,230 101 880 6 5,590 172 2,600 7 4,500 2.180 26,500 7 3,050 109 900 7 5,490 174 2,580 8 5,800 936 14,700 8 2,900 79 620 8 6,250 301 5,080 9 5,400 487 7,100 9 3,430 226 2,090 9 6,650 212 3,810
10 5,000 332 4,480 10 4,560 381 4,690 10 6,890 125 2,330 11 6,130 586 9,700 11 3,800 249 2,550 11 7,320 97 1,920 12 7.260 489 9,600 12 3,530 282 2,690 12 7,860 60 1,270 13 7.470 248 5,000 13 3,680 490 4,87() 13 8.530 61 1,400 14 7;770 219 4,590 14 3,730 280 2,820 14 9;170 70 1,730 15 8,200 150 3,320 15 4,120 327 3,640 15 9,010 76 1,850 16 8,300 107 2,400 16 5,130 483 6,690 16 8,430 75 1,71() 17 8,640 80 1,870 17 6,240 309 5,210 17 7,810 101 2,130 18 8,870 70 1,680 18 6,740 162 2,950 18 7,070 79 1,510 19 8,810 64 1,520 19 7,330 133 2,630 19 5,660 171 2,610 20 9,050 67 1,640 20 8,540 85 1,960 20 3,900 135 1,420 21 9,290 61 1,530 21 15.500 223 9,330 21 3,270 134 1,180 22 8,990 48 1,170 22 25,400 415 28,500 22 3,110 83 670
86
Day
23 24 25 26 27 28 29 30 31
Total Monthly
mean dis-charge _
Maxi-mum
Mini-mum
THE 1973 MISSISSIPPI RIVER BASIN FLOOD
TABLE 12.-Station descriptions and discharge and suspended-sediment data-Continued
Mean water discharge and suspended-sediment concentTation and discharge-Continued
March April May Suspended Suspended sediment sediment
Mean Mean Dis- Mean Mean Dis- Mean dis- concen- charge Day dis- concen- charge Day dis-
charge tration (tons/day) charge tration (tons/day) charge (ft 3/s) (mg/1) (ft a;s) (mg/l) (ft a;s)
8,310 54 1,210 23 20.200 268 14,600 23 2,970 7,550 66 1,350 24 15:900 175 7,510 24 2,890 6,450 92 1,600 25 13,000 115 4,040 25 2,850 4,970 128 1,720 26 10,500 137 3,380 26 2,820 3,940 126 1,340 27 8,930 73 1,760 27 3,470 3,400 102 940 28 7.820 81 1,710 28 5,700 3,150 96 820 29 6~350 76 1,300 29 5,950 2,950 89 710 30 4,760 72 920 30 6,010 2,930 210 1,660 31 31 6.070
177,430 120,150 218,870 136,140 188~210
5,724 3,876 7,296 4,538 6,071
9,290 26,500 25,400 28,500 9,190
1,900 710 2~900 620 2~820
Suspended sediment
Mean Dis-concen- charge tration (tons/day) (mg/1)
135 1,080 95 740
121 930 142 1,080 227 2,130
3~390 52,200 740 11,900 362 5,900 305 5,000
174,960
5,644
52,200
670
Period Highest mean discharge, in cubic feet per second, for the indicated number of consecutive days 1 3 7 15 ~0
March-May 1973 ------------------ 25,400 20,400 15,600 11,200 9,260 1935-72 21,300 20,400 17,200 14,000 11,000 Recurrenc-e-~t~;;;l,-i~y~;;;,---------
for 1973 flood volumes------------ 50 35 20 15 20
ROCK RIVER BASIN (7) 05431400 Little Turtle Creek at Aliens Grove, Wis.
Location.-Lat 42°34'46", long 88°45'33", in NE14 sec. 6, T. 1 N., R. 15 E., Walworth County, at bridge on country road, 0.2 mi ( 0.3 km) south of All ens Grove.
Drainage area.-41.8 mi2 (108.3 km2).
Gage.-Crest stage only. Bankfull stage.-12.5 ft (3.81 m). Maxima.-March-May 1973: Discharge, 8,400 ft3/s (238 m3/s) Apr. 21 [gage height, 18.28 ft (5.572 m)]. Discharge exceeded
the 100-year flood. 1962 to February 1973: Discharge, 2,440 ft3/s (69.1 m3/s) Feb. 19, 1971 [gage height, 15.5.5 ft (4.740 m)].
ROCK RIVER BASIN (8) 05431500 Turtle Creek near Clinton, Wis.
Location.-Lat 42°35'47", long 88°51'50", in SEtA, s·ec. 29, T. 2 N., R. 14 E., Rock County, on left bank 15 ft (5 m) downstream from bridge on State Highway 140, 2.7 mi (4.3 km) north of Clinton, 11 mi (18 km) northeast of Beloit, and 16 mi (26 km) upstream from mouth.
Drainage area.-202 mi2 (523 km2).
Gage.-Digital recorder tape punched at 60-minute intervals. Datum of gage is 817.00 ft (249.022 m) above mean sea level (levels by Corps of E:ngineers).
Bankfull stage.-8.0 ft (2.44 m). Maxima.-March-May 1973: Discharge, 16,500 ft3/s (467 m3/s) 8:00a.m., Apr. 21 [~age height, 12.85 ft (3.917 m)]. Dis
charge exceeded the 100-year flood. 1938 to February 1973: Discharge, 10,700 fe;s (303 m3/s) in February 1938 [gage height, 12.09 ft (3.685 m) from floodmarks)]
Mean discharge, in cubic feet per second, .1973 Day March April May Day March April May Day March April May
1 194 291 1,030 11 432 261 461 21 203 6.400 227 2 296 359 1,030 12 410 315 433 22 176 2.080 289 3 370 335 1,690 13 394 455 384 23 167 1~160 254 4 292 321 818 14 691 560 311 24 162 996 251 5 280 311 604 15 530 537 278 25 158 846 305 6 700 278 560 16 437 568 234 26 151 754 277 7 1,700 261 652 17 424 530 224 27 142 696 342 8 587 260 860 18 381 437 221 28 141 637 525 9 418 258 624 19 349 398 255 29 144 709 447
10 394 272 487 20 302 380 239 30 143 1~060 444 31 148 348
Monthly mean discharge, in cubic feet per second. --------------------------------------- 365 758 486 Runoff, in inches --------------------------------------------------------------------- 2.26 4.55 3.01
THE FLOODS
TABLE 12.-Station descriptions and discharge and suspended-sediment data-Continued
Gage height, in feet, and discharge, in cubic feet per second, at indicated time, 1973
Date Hour Gage Dis-height charge Date Hour
6:00a.m. 3.78 382 10:00 a.m. 3.75 371
8:00p.m. 3.72 360 10:00 p.m. 3.76 375
2:00a.m. 6:00a.m.
!O:OOa.m.
Apr. 20 ------------ Apr. 22 ------------
12:00 p.m. 4.53 698 2:00a.m. 7.22 2,500
6:00p.m. 12:00 p.m. Apr. 21 ------------
4:00a.m. 8.51 4,030 Apr. 23 ------------ 6:00a.m. 6:00a.m. 10.16 6,470 12:00 m. 8:00a.m. 12.49 14,700 9:00a.m. 12.33 13,900
10:00 a.m. 12.01 12,400
6:00p.m. 12:00 p.m.
12:00 m. 11.18 9,160 2:00p.m. 10.45 7,200 4:00p.m. 9.82 5,670 6:00p.m. 9.34 4,620 8:00p.m. 9.03 4,050
10:00 p.m. 8.73 3,580 12:00 p.m. 8.51 3,260
87
Gage Dis-height charge
8.28 2,920 8.04 2,600 7.70 2,200
7.09 1,660 6.78 1,450 6.56 1,310 6.46 1,250 6.34 1,170 6.23 1,120
Period Highest mean discharge, in cubic feet per second, for the indicated number of consecutive days 1 3 7 15 30
March--May 1973 -----------------1940-71 -------------------------Recurrence interval, in years, for
1973 flood volumes ---------------
6,400 4,130
>100
3,210 3,330
>100
ROCK RIVER BASIN
1,850 2,160
50
(9) 05446500 Rock River near Joslin, Ill.
1,370 1,360
80
938 744
>100
Location.-Lat 41 °33'35", long 90°10'55", in NE% sec. 18, T. 18 N., R. 3 E., Rock Island County, on right bank at downstream side of bridge on State Highway 92, 1.8 milers (2.9 km) east of Joslin, 12 miles (19 km) downstream from Rock Creek, and 27 miles ( 43 km) upstream from mouth.
DI'Iaina,ge area.-9,5·51 mi2 (24,737 km2), revised.
Gage.--Water-stage recorder. Datum of gage is 564.06 ft (171.925 m) above mean s.ea level (levels by Corps of Enginee·rs). Maxim:a.-March-May 1973: Discharge, 41;500 ft2/s (1,180 m3/s) 11:00 a.m. Apr. 23 [gage height, 17.74 ft (5.407 m)]. Recur-
rence interval of discharge is 17 years. 1989 to February 1973: Discharge, 46f2.00 fe;s (1,310 m3/s) Mar. 22, 1948 [gage height, 14.46 ft (4.407 m) 1; gage height,
17.69 (5.392 m) Feb. 23, 1971 (backwater from ice). Maximum stage known since 1892, that of Apr. 23, 1973.
Mean discharge, in cubic feet per second, .1973
Day March April May Day March April May Day March April May
1 9,340 14,900 25,400 11 23,500 17,200 32,100 21 20,600 20.500 21,600 2 10,200 16,100 28,000 12 22,700 17.100 30,900 22 19,700 33;1oo 21,200 3 11,200 17,400 32,700 13 22,500 17~100 29,900 23 19,100 40,400 20,900 4 11,600 18,100 34,300 14 22,100 17'.100 28,900 24 18,400 39,800 20,100 5 11,800 18.000 33,200 15 22,300 17:100 27.900 25 17,800 41,100 19,600 6 12,100 17.500 31,300 16 23,200 17;400 26,500 26 ---- 17,500 39.700 19,300 7 14,900 17.200 29,700 17 23,700 17,700 25.ROO 27 ---- 16.900 34",400 19,700 8 20,200 16~600 29,500 18 23.100 18,000 24,000 28 16.200 30,300 20,700 9 24,300 16.400 30.500 19 22,200 18,100 23,000 29 ---- 15,300 27,600 21,900
10 24,700 17,000 32,200 20 23,700 17,700 25,300 30 ---- 14,800 25,700 22.200 31 ---- 14,200 22,000
Monthly mean discharge, in cubic feet per second ------------------------------------- 18.310 22.560 26,030 Runoff, in inches ------------------------------------------------------------------- 2.22 2.64 3.15
Period Highest mean discharge, in cubic feet per second, for the indicated number of consecutive days 1 '3 7 10 30
March--May 1973 ------------------ 41,100 19·40-72 ---------------------- 44,700
Recurr·ence interval, in years, for 1973 flood volumes --------------- 20
40,400 41,800
20
lOW A RIVER BASIN
37,000 35,800
25
(10) 05453100 Iowa River at Marengo, Iowa
33,100 29,500
30
30,400 24,200
80
Location.-Lat 41 °48'41", long 92°03'42", in SW1,4NE1,4 sec. 24, T. 81 N., R. 11 W., Iowa County, on right bank 10ft (3 m) downstream from abandoned highway bridge, 0.7 mile (1.1 km) downstream from Big He•ar Creek, 0.8 mile (1.3 km) north of Marengo, 4.9 miles (7.9 km) upstream from Hilton Cre~k, and at mile 139.4 (224.3 km).
88 THE 1973 MISSISSIPPI RIVER BASIN FLOOD
TABLE 12.-Station descriptions and discharge and suspended-sediment data--Continued
Drainage area.-2,794 mi2 (7,236 km2).
Gage.-Wa.ter-stage recorder. Datum of gage is 720.52 ft (219.614 m) above mean sea level. Flood srtage.-14 ft (4.3 m). Maxima.-March-May 1973: Discharge, 16,600 fe;s (470 m3/s) 6:15p.m., Apr. 16 [gage height, 17.73 ft (5.404 m)]. Recur-
renee interval of discharge is 3 years. [gage height, 19.21 ft ( 5.855 m)] Maxi-October 1956 to February 1973: Discharge, 30,800 ft3/s (8.72 m3/s) Mar. 31, 1960
mum gage height, 19.79 ft (6.032 m) July 12, 1969. Remarks.-Station data included in this report primarily for sediment analysis.
Mean water discharge and suspended-sediment concentration and discharge
March April May Suspended Suspended Suspended sediment sediment sediment
Mean Mean Dis- Mean Mean Dis- Mean Mean Dis-Day dis- ~oncen- charge Day dis- concen- charge Day dis- concen- charge
charge tration (tons/ charge tration (tons/ charge tration (tons( (ft a;s) (mgjl) day) (ft a;s) (mg/1) day) (ft a;s) (mg/1) day)
1 3,940 801 8,520 1 5,700 !100 13,900 1 5,090 388 5,330 2 4,460 756 9,100 2 5.890 258 4,100 2 5.810 711 11,200 3 4,990 998 13,400 3 5:760 296 4,600 3 5;780 432 6,740 4 5,260 842 12,000 4 5.430 193 2,830 4 5,770 205 3,190 5 5,300 784 11,200 5 5.060 308 4,210 5 5,840 147 2,320 6 5,240 580 8,210 6 4.650 166 2,080 6 5.940 117 1,880 7 5,780 839 13,100 7 4:250 187 2,140 7 6.330 109 1,860 8 6,040 664 10,800 8 3:92o 173 1,830 8 7,020 287 5,440 9 6,040 642 10,500 9 3,640 170 1,670 9 6,700 266 4,810
10 6,090 398 6,540 10 2,960 437 3,490 10 6.560 200 3,540 11 6,780 404 7,400 11 2.910 417 3,280 11 6;740 130 2,370 12 7,520 616 12,500 12 3;650 447 4,410 12 8.040 88 1,910 13 7,740 1.440 30,100 13 5,170 635 8,860 13 8,340 !10 2,030 14 7,850 1:o5o 22,300 14 6.840 1,900 36,200 14 7,730 142 2,960 15 8,410 152 3,450 15 10.900 2,160 61,400 15 7,130 98 1,890 16 8,490 121 2,770 16 15.300 600 24,800 16 6,570 122 2,160 17 8.390 117 2,650 17 15.600 530 22,300 17 6,000 153 2,480 18 8,540 75 1,730 18 15,900 240 10,300 18 5,010 208 2,810 19 8,520 134 3,080 19 15,600 170 7,160 19 4,120 240 2,670 20 8,160 171 3,770 20 15,100 145 5,910 20 3,660 242 2,390 21 7,660 88 1,820 21 14,500 160 6,260 21 3,400 202 1,850 22 7.240 65 1,270 22 13,400 165 5,970 22 3,260 219 1,930 23 6,680 151 2,720 23 11,600 90 2,820 23 3,210 219 1,900 24 6,020 218 2,540 24 10,100 92 2,510 24 3,070 222 1,840 25 5,170 174 2,430 25 8.940 126 3,040 25 2,960 204 1,630 26 4,720 329 4,190 26 7.930 110 2,360 26 2,870 214 1,660 27 4,540 326 4,000 27 7,110 131 2,510 27 5.570 498 7,490 28 4,440 310 3,720 28 6,320 194 3,310 28 8,820 1,100 26,200 29 4,270 327 3,770 29 5.420 205 3,000 29 8,400 448 10,200 30 4,060 309 3,390 30 4.660 232 2,920 30 7.820 250 5,280 31 ------- 4,350 188 2,210 31 31 7,330 218 4,310
Total 192,690 226,180 244,210 260,170 180,890 134,270 Monthly _____
mean discharge _ 6,216 7,300 8,140 8,670 5,835 4,330
Maximum __ 8,540 30,100 15,900 61,400 8,820 26,200 Minimum -- 3,940 1,270 2,910 1,670 2,870 1,630
Gage height, water discharge, and suspended-sediment concentration and discharge
Suspended sediment Susuended sediment Gage Dis- Concen- Dis- Gage Dis- Concen- Dis-
Date Time height charge tration charge Date Time height charge tration charge (ft) (cfs) (mg/1) tons/ (ft) (cfs) (mg/1) tons/
day day
Apr. 14 ___ 6:00a.m. 14.18 6,010 1,200 19,500 Apr. 19 ____ 12:00 m. 17.51 15,600 180 7,580 12:00 m. 14.57 6,620 1,950 34,900 12:00 p.m. 17.46 15,400 160 6,650 12:00 p.m. 15.60 8,850 2,650 63,300 Apr. 20 ____ 12:00 m. 17.33 14,900 145 5,830
Apr. 15 1 ___ 6:00a.m. 16.19 10,600 3,600 103,000 12:00 p.m. 17.39 15,200 145 5,950
12:00 m. 16.24 10,700 2,200 63,600 Apr. 21 ____ 12:00 m. 17.20 14,400 155 6,030 6:00p.m. 16.44 11,400 1,100 33,900 12:00 p.m. 17.07 13,900 190 7,130
12:00 p.m. 16.83 12,900 700 24,400 Apr. 22 ____ 12:00 m. 16.98 13.500 165 6,010 Apr. 16 ____ 6:00a.m. 17.22 14,500 600 23,500 12:00p.m. 16.74 12,600 120 4,080
12:00 m. 17.54 15,800 590 25,200 Apr. 23 ____ 12 :00 m. 16.48 11.500 90 2,790 6:15p.m. 17.73 16,700 600 27,100 12:00 p.m. 16.28 10,800 90 2,620
12:00 p.m. 17.53 15,700 600 25,400 Apr. 17 ____ 12:00 m. 17.45 15,400 530 22,000
12:00 p.m. 17.61 16,100 370 16,10(} Apr. 18 ____ 12:00 m. 17.60 16,000 240 10,400
12:00 p.m. 17.52 15,700 200 8,480 1 One-vertical suspended-sediment sample at 7: 00 a.m. contained 29 percent clay, 63 percent silt, and 8 percent sand.
THE FLOODS 89
TABLE 12.-Station descriptions and discharge and suspended-sediment data--Continued
IOWA RIVER BASIN (11) 05454500 Iowa River at Iowa City, Iowa
Location.-Lat 41°39'24", long 9r3.2'27", in SE:L4SE14 sec. 9, T. 79 N., R. 6 W., Johnson County, on right bank 25ft (7.6 m) downstream from Hydraulics Laboratory of University of Iowa in Iowa City, 175 ft (53 m) downstream from University Dam, 0.8 mHe (1.3 km) upstream from Ralston Creek, 3.6 miles (5.8 km) do·wns1tream from Clear C~eek, and at mile 74.2 (119.4 km).
Drainag·e area.-3,271 m2 (8,472 km2).
Gage.--Water-stage recorder. Datum of gage is 29.0 ft (8.8 m) above Iowa City datum, and 617.27 ft (188.14 m) above mean sea li~vel, datum of 192,9. June 1, 1903, to July 21, 1906, chain gage 1,200 ft (366 m) upstream at datum 13.05 ft (3.98 m) higher. Nov. 29, 1907, to Oct. 29, 1913, staff gage 200 ft (61 m) upstream at different datum. Oct. 30, 1913, to Nov. 18, 1921, chain gage 2,600 ft (792 m) downstream at datum 10.2 ft (3.11 m) higher. Nov. 19, 1921, to Sept. 30, 1922, water-stage recorder at present site at datum 11.0 ft (3.35 m) higher. Oct. 1, 1930, to Sept. 30, 1934, at present site at Iowa City datum. Oct. 1, 1934 to Sept. 30, 1972, at datum 10.00 ft (3.05 m) higher.
Maxima.-March-May 1973: Discharge, 11,300 ft3/s (320 m3/s) 10:45 a.m., hours May 1, [gage height, 22.04 ft (6.718 m)]. June 1903 to Fehruary 1973: Discharge, 42,500 ft3/s 1,204 m3/s) June 8, 1918, [gage height, 19.6 ft (6.0 m) 1 from graph based on gage readings, site and datum then in use. Maximum stage kno·wn since 1850, about 34ft (10.4 m) June 1851 [discharge, about 70,000 ft3/s (1,980 m3/s~)]. March-May 1973: Sediment concentration, maximum daily, 1,580 mg/1 April 21. Sediment discharge, maximum daily, 20,300 tons (18,400 t) April 21. October 1943 to February 1973: 8ediment concentration, maximum daily, 7,800 mg/l June 13, 1953. Sediment discharge, maximum daily, 177,000 tons (161,000t) May 23, 1944.
Remark.s.-Flow regulated by Coralville Lake [capacity 476,000 ac-ft (587 hm3)] since Sept. 7, 1958. Station data included in
this report primarily for sediment analysis.
Mean water discharge and suspended-sediment concentration and discharge
March April May Suspended Suspended Suspended sediment sediment sediment
Mean Mean Dis- Mean Mean Dis- Mean Mean Dis-
Dal7 dis- concen- charge Day dis- concen- charge Day dis- concen- charge charge tration (tons/ charge tration (tons/ charge tration (tons/ (ft 3/s) (mg/1) day) (ft 3/s) (mg/l) day) (ft 3/s) (mg/1) day)
1 5,650 241 3,680 1 4,830 139 1,810 1 10.800 103 3,000 2 6,050 216 3,530 2 3,920 92 974 2 9,690 143 3,740 3 6,000 191 3,090 3 5,960 78 1,260 ~ 8,080 177 3,860 4 5,600 164 2,480 4 7,570 65 1,330 4 8,080 86 1,880 5 5,510 139 2,070 5 8.530 56 1,290 5 8,980 72 1,750 6 5.610 270 4,090 6 8,780 48 1,140 6 10,200 73 2,010 7 6,250 504 8,510 7 9,180 51 1,260 7 10,700 105 3,030 8 6,000 187 3,030 8 9,130 57 1,410 8 9,640 163 4,240 9 6,030 130 2,120 9 9.180 63 1,560 9 9,580 155 4,010
10 6,170 165 2,750 10 9,040 68 1,660 10 9,460 139 3,550 11 6,790 363 6,650 11 9,050 73 1,780 11 9,690 134 3,510 12 6,680 244 4,400 12 9.080 81 1,990 12 10,200 129 3,550 13 5,980 145 2,340 13 8.220 110 2,440 13 10,200 123 3,~90 14 5,080 526 7,210 14 7,350 175 3,470 14 10,100 117 3,190 15 5,160 158 2,200 15 5.440 295 4,330 15 10,100 100 2,730 16 4,150 102 1,140 16 4,090 276 3,050 16 10,000 83 2,240 17 1,650 90 401 17 3,390 198 1,810 17 6,230 202 3,400 18 1,350 81 295 18 2,990 164 1,320 l8 8,510 47 1,080 19 1,350 72 262 19 2,320 138 864 19 9,910 38 1,020 20 1,340 63 228 20 2.700 780 5,690 20 9,850 37 984 21 1,330 52 187 21 4,750 1,580 20,300 21 9.920 36 964 22 1,340 48 174 22 3,350 1,120 10,100 22 9,890 36 961 23 1,330 46 165 23 1,920 490 2,540' 23 8,990 41 995 24 1,330 44 158 24 4.090 465 5,1!'!0 24 8,130 42 922 25 1,400 53 200 25 5,940 705 11,300 25 6,410 40 692 26 1,430 53 205 26 7,830 450 9,510 26 6,340 40 685 27 1,730 41 192 27 9,720 228 5,980 27 7,610 41 842 28 3,430 62 574 28 '10,500 157 4,450 28 6,120 113 1,870 29 5,060 219 2,990 29 10.400 116 3,260 29 4,010 85 920 30 7,340 281 5,570 30 10,500 94 2,660 30 ------- 4,930 69 918 31 ---·---- 7.820 257 5,430 31 31 ------- 5,610 111 1,680
Total 131,940 76,321 199,750 115,668 267,960 67,613 Monthly
mean dis-charge 4,260 2,460 6,660 3,860 8,640 2,180
Maximum __ 7,820 8,510 10,500 20,300 10,800 4,240 Minimum -- 1,330 158 1,920 864 4,010 685
lOW A RIVER BASIN (12) 05465500 Iowa River at Wapello, Iowa
Location.-Lat 41 °10'48", long 9r10'57", in NW1,4SE.:14 s~ec. 27, T. 74 N., R. 3 W., Louisa County, on right bank 30ft (9 m) downstream from bridge on State Highway 99 at east edge of Wapello, 13.0 miles (20.9 km) downstream from Ced.ar River, and at mile 16.0 (2.5.7 km).
Drainage area.-12,499 mi2 (32.372 km2).
Gage.--Water-stage recorder. Datum of gage is 538.98 ft (164.281 m) above mean sea level, adjustment of 1912. Oct. 1, 1914 to Apr. 15, 1934, nonre.cording gage and Apr. 16, 1934 to Sept. 30, 1972, water-stage recorder at datum 10ft (3.05 m) higher.
Flood stage.-20 ft (6.1 m). Flood stage was exceeded for 47 days during the 3-month report period. Maxima.-March-May 1973: Dischare:e, 92,000 ft3/s (2.600 m3/s) 12:00 p.m., Apr. 22 [gage height, 28.63 ft (8.726 m) ].
Octobe·r 1914 to February 1973: Discharge, 94,000 ft3/s (2,660 m3/s) June 18, 1947. [gage height, 16.14 ft (4.919 m), datum then in use]; maximum gage height, 17.40 ft (5.304 m) July 15 1969, datum then in us;e,
Remarks.-High flows regulated by CoralviUe Lake [capacity 476·.000 acre-ft (587 hm3)] since Se·pt. 17, 1958. Recurrence inter
vals of flood peaks and volume•s a.re not shown because of reservoir effect.
90 THE 1973 MISSISSIPPI RIVER BASIN FLOOD
TABLE 12.-Station descriptions and discharge and suspended-sediment data-Continued
Mean discharge, in cubic feet per second, .1973
Day March April May Day March April May Day March April May
1 13,400 24,700 29,900 11 ---- 28,900 24,000 42,200 21 33,500 53,600 22,100 2 13,600 25,200 37,500 12 31,400 22,500 38,500 22 30,900 81,300 21,600 3 15,600 23,200 41,100 13 33,500 22.800 37,500 23 28,200 84,200 21,100 4 15,300 21,700 41,500 14 34,600 23;8oo 38,500 24 24,300 69,800 20,200 5 15,600 21,000 34,200 15 34,700 24,600 39,500 25 21,200 53,000 19,300 6 17,000 21,400 29,000 16 33,800 25,700 39,000 26 19,400 40.600 17,200 7 22,000 21,200 29,000 17 32,100 27,400 35,700 27 18,200 34;1oo 19,500 8 25,800 20.900 33,200 18 32,400 30,800 30,200 28 16,700 30,500 27,900 9 27,000 23;100 38,100 19 ---- 35.900 35,500 24,300 29 16,900 28.100 31,900
10 26,600 26,300 42,700 20 ---- 36:200 36,400 22,700 30 ---- 18,000 27;ooo 33,700 31 ---- 20,500 33,400
Monthly mean discharge, in cubic ft per second -------------------------------------- 24,940 33,480 31,360 Runoff in acre-feet ---------------------------------------------------------------- 1,534,000 1,992,000 1,928,000
Gage height, in feet, and discharge in cubic feet per second, at indicated time, .1973
Hour Gage Q Date Hour Gage Q Date Hour Gage Q height height height Date
6:00a.m. 22.24 41,400 Apr. 22 _ 3:00p.m. 27.31 80,400 Apr. 24 6:00a.m. 26.56 74,100 6:00a.m. 23.08 46,600 8:00p.m. 28.20 88,100 12:00 m. 26.04 69,600
12:00 m. 23.99 53,200 12:00 p.m. 28.63 92,000 6:00p.m. 25.56 65,800 6:00p.m. 24,81 59,800 12:00 p.m. 25.05 61,700
12:00 p.m. 25.97 69,100 23 - 4:00a.m. 28.19 88,000
Apr. 21 _
22 -12:00 m. 27.76 84,300 25 - 12:00 m. 23.91 52,600
6:00a.m. 26.99 77,700 6:00p.m. 27.40 81,200 12:00 p.m. 22.94 45,600 10:00 a.m. 27.53 82,300 12:00 p.m. 26.98 77,600
Period Highest mean discharge, in cubic feet per second, for the indicated number of consecutive days 1
March-May 1973 ----------------- 84,200 1915-72 -------------------------- 92,400 Recurrence interval, in years, for
1973 flood volumes ---------------
3
78,400 80,700
EDWARDS RIVER BASIN
7
60,300 64,300
(13) 05466500 Ewards River near New Boston, III.
15
46,200 56~500
30
41,700 49,000
Location.-Lat 41 °11'15", long 90°58'05", at quarter corn·e·r between se.cs. 2'1 and 281 T. 14 N., R. 5 W., Mercer County, on left bank at downstream side of bridge on State Highway 17, 1.5 miles (2.4 km) northeast of Ne·W Boston and 5 mile·s (8 km) upstream from mouth.
Drainage area.-445 mi2 (1,153 km2).
Gage.-Water-stage recorder. Datum of gage is 529.92 ft (161.520 m) above mean sea level (levels by Oorps of Engineers). M.axima.-March-May 1973: Discharge, 18,000 ft3/s (510 m3/s) 8:45 a.m., Apr. 22 [gage height, 23.33 ft (7.111 m)]. Di.s'-
charge exceeded the· 100-year flood. 1934 to Fehruary 1973: Discharge, 7,280 ft3/s (206 m3/s) Apr. 26, 1950, May 12, 1951; gage height, 21.53 ft (6.562 rn)
Feb. 21, 1971 (backwater from ice).
Mean discharge, tn cubic feet per second, .1973
Day March April May Day March April May Day March Al;)ril May
1 293 1,990 3,140 11 1,770 2,180 2,200 21 586 4,280 685 2 293 1,960 4,120 12 1,650 1,320 1,800 22 646 14,000 685 3 346 1,560 4,230 13 1,220 882 1,500 23 522 8,560 685 4 394 1~000 4,000 14 1,140 752 1,300 24 502 6,960 645 5 440 852 2,500 15 1,480 688 1,150 25 522 5,090 800 6 502 740 1,700 16 ---- 1,160 918 1,020 26 600 2.500 1,200 7 1,870 656 1,300 17 ---- 849 942 954 27 538 1;700 1,500 8 2,170 606 2,400 18 762 732 900 28 484 1,200 2,000 9 2,860 1,570 2,430 19 ---- 678 670 800 29 486 1,000 1,730
10 1,940 2,120 2,770 20 ---- 630 678 760 30 502 1,100 930 31 708 735
Monthly mean discharge, in cubic feet per second ------------------------------------ 918 2,307 1,696 Runoff, in inches ------------------------------------------------------------------- 2.44 5.93 4.51
Period Highest mean discharge, in cubic feet per second, for the indicated number of consecutive days 1 3 7 15 30
March-May 1973 ------------------ 14,000 9,840 6,160 4,290 2,910 1935-72 -------------------------- 7,280 6,210 4,000 2,310 1,780 Recurrence interval, in years, for
1973 flood volumes --------------- >100 >100 >100 >100 >100
THE FLOODS 91
TABLE 12.-Station descriptions and discharge and suspended-sediment data-Continued
SKUNK RIVER BASIN (14) 05473500 Big Creek near Mount Pleasant, Iowa
Location.-Lat 4r00'52", long 91°34'49", in NW14NW14 sec. 29, T. 72 N., R. 6 W., Henry County, on left bank 12ft (4 m) downstream from bridge on county highway, 100ft (30m) downstream from Lynn Creek, 0.7 mile (1.1 km) downstream from Brandywine Greek, and 3.7 miles (6.0 km) northwest of courthouse at Mount Pleasant.
Df!ainage area.-106 mi2 (275 km2).
Gage.--Waterstage recorder and concrete control. Datum of gage is 630.53 ft (192.186 m) above mean sea level. Bankfull stage.-17 ft (5.2 m). Maxi:r:na.-March-May 1973: Discharge, 10,500 ft3/s (297 m3/s) 3:00 a.m., Apr. 22 [gage height, 25.58 (7.797 m) ], from
ratmg curve extended above 6,200 f~ Is ( 176 m3 Is) on basis of contracted-opening measurement at gage height 18.51 ft (5.6•12 ~) and contracted-opening measurements of 1973 peak flow at .sites 2 miles (3 km) upstream [63 mi2 (163 km2
)]
and 6 miles (10 km) downstream [115 mi2 (298 km2) ]. Recurrence interval of discharge is 90 years.
Oetober 19'55 to February 1973: Discharge( 6,150 ft3/s (174 ma/s) Sept. 21, 1965 [gage height, 18.51 ft (5.642 m), from flood.marks) ], from rating curve extended as explained above. Flood of Aug. 3, 1948 reached a stage of 27 ft [ (8.2 m) (discharge not determined) ] .
Remarks.-Flood-profile data available elsewhere in this report.
Mean discharge, in cubic feet per second, .1973
Ds.y March April May Day March April May Day March April May
1 65 1,510 650 11 ---- 751 400 170 21 70 4.720 39 2 144 602 2,500 12 ---- 402 288 125 22 62 7~680 41 3 184 332 488 13 ---- 281 197 101 23 57 815 39 4 166 258 267 14 ---- 805 152 85 24 57 354 37 5 169 207 191 15 ---- 395 123 72 25 162 260 42 6 259 162 193 16 ---- 206 254 61 26 245 196 39 7 937 123 441 17 ---- 154 194 53 27 155 152 2,710 8 448 97 730 18 ---- 115 143 48 28 119 121 1,690 9 316 1,500 344 19 ---- 95 116 47 29 132 105 424
10 458 867 234 20 ---- 83 982 41 30 162 94 271 31 858 193
Monthly mean discharge, in cubic feet per second ------------------------------------ 275 767 399 Runoflf, in inches ________________________________________________ --------- __ - ------- 2.99 8.07 4.34 Runoflf, in acre-feet ----------------------------------------------------------------- 16,880 45,630 24,530
Gage height, in feet, and discharge in cubic feet per second, at indicated time, .1973
Dat«~ Hour Gage Q Date Hour Gage Q Date Hour Gage Q height height height
Apr. :20 _ 12:00 p.m. 3.05 106 Apr. 21 _ 6:00a.m. 14.44 3,860 Apr. 22 _ 5:00a.m. 25.39 10,400 6:00a.m. 3.02 101 12:00 m. 14.83 4,060 8:00a.m. 24.37 9,650 9:00a.m. 3.64 209 3:00p.m. 15.18 4,230 12:00m. 22.01 8,160 9:30a.m. 4.31 330 6:00p.m. 16.11 4,700 4:00p.m. 18.90 6,290
10:00 a.m. 6.30 764 7:00p.m. 17.29 5,320 8:00p.m. 15.76 4,520 11:00 a.m. 8.18 1,290 8:00p.m. 18.69 6,160 !O:OOp.m. 13.77 3,530 1:00 p.m. 9.36 1,670 9:00p.m. 20.71 7,380 !2:00p.m. 10.90 2,290 2:00p.m. 9.31 1,650 10:00 p.m. 22.33 8,350 4:00p.m. 8.62 1,430 11:00 p.m. 23.63 9,130 23 - 3:00a.m. 7.91 1,240 7:00p.m. 7.70 1,150 12:00 p.m. 24.59 9,800 6:00a.m. 7.03 986 9:00p.m. 9.54 1,750 12:00m. 5.89 688
12:00 p.m. 11.74 2,630 22 - 2:00a.m. 25.45 10,400 6:00p.m. 5.15 521 3:00a.m. 25.58 10,500 12:00 p.m. 4.73 432
21 - 2:00a.m. 13.10 3,190
Period Highest mean discharge, in cubic feet per second, for the indicated number of consecutive days
March-May 1973 ------------------1956-'72 --------------------------Recurrence interval, in years, for
1973 flood volumes ---------------
1 3 7 15 80
7,680 5,460
100
4,460 3,810
50
SKUNK RIVER BASIN
2,140 2,100
30
(15) 054 7 4000 Skunk River at Augusta, Iowa
1,230 1,410
30
839 1,040
25
Location.-Lat 40°45'13", long 91°16'40", in NE.1,4NE1,4 sec. 26, T. 69 N., R.. 4 W., Des Moines County, on left bank 300ft (91 m) upstream from bridge on State Highway 394 at Augusta, 2.0 miles (3.2 km) upstream from L<mg Creek and at mile 12.:5 (20.1 km).
Drainage area.-4,303 mi2 (11,144 km2).
Gage .. -Water-stage recorder. Datum of gage is 521.24 ft. (158.874 m) above mean sea level. Prior to Nov. 15, 1913, nonrecording gage at site 400ft (122 m) upstream at datum about 0.7 ft (0.2 m) higher. May 27, 1915, to Jan. 14, 1935, nonrecording gage at s.ite 400 ft (122 m) up,stream at present datum.
Flood stage.-15 ft (4.6 m). Maxima.-March-May 1973: Discharge, 66,800 f~/s (1,890 m3/s) 1:30 a.m., Apr. '23 [gage height, 27.05 ft (-8.245 m)]. Dis
charge exceeded the 100-year flood.
92 THE 1973 MISSISSIPPI RIVER BASIN FLOOD
TABLE 12.-Station descriptions and discharge and suspended-sediment data-Continued
September to November 1913, October 1914 to February 1973: Discharge, 51,000 ft3/s (1,440 m3/,s) Apr. 3, 1960, [gage height, 25.00 ft (7.620 m) ].
Remarkls.-Peak stage or April 1973 flood occurred within 60 hours after torrential rains in the lower part of the basin. That for the April 1960 flood occurred 7 days after the initial rise in stage. Flood-profile data available elsewhere in this report. Stage and discharge for April 1973 flood are believed to be the greate,st since 1851.
Mean discharge, in cubic feet per second, .1973
Day March April May Day March April May Day March April May
1 5,400 16,900 10,700 11 13.400 13,400 12,000 21 ---- 7.820 33,600 5,510 2 5,550 17,000 23,600 12 14:500 10.600 10,500 22 ---- 7:200 60,200 5,040 3 6.180 15,000 25,900 13 11.800 1o;5oo 10,000 23 ---- 6,660 62,600 4,740 4 6~560 12,200 24,200 14 12~900 11.300 9,880 24 ---- 6,250 49,100 4,420 5 6,460 10,800 20,800 15 12.800 11:3oo 9,790 25 ~--- 6,540 34.900 4,360 6 6,550 9,790 14,100 16 11~000 11.400 9,360 26 7,940 22~600 4,530 7 12,300 8,520 13,500 17 10.300 13;300 8,420 27 9,370 16,000 15,700 8 14;1oo 7,530 16,800 18 9:480 14,100 7,630 28 8,330 12,400 25,800 9 11.100 11,600 17,100 19 8,810 13,900 6,790 29 7,650 9,730 26,400
10 1o;2oo 18,100 14,500 20 8,300 16,500 5,980 30 7.180 8,340 24,600 31 9~210 23,300
Monthly mean discharge, in cubic feet per second ------------------------------------ 9,092 18,770 13,420 Runoff, in inches ------------------------------------------------------------------- 2.44 4.87 3.60 Runoff, in acre-feet ----------------------------------------------------------------- 559,000 1,117,000 825,200
Gage height, in feet, and discharge in cubic feet per second~ at indicated time, .1973
Date Hour Gage Q Date Hour Gage Q Date Hour Gage Q height height height
Apr. 21 _ 6:00a.m. 17.45 23,300 Apr. 22 - 9:00p.m. 26.95 66,100 Apr. 24 _ 6:00a.m. 24.63 52,200 6:00a.m. 19.17 28,200 12:00 p.m. 27.03 66,600 12:00 m. 24.01 49,100
12:00 m. 20.48 33,000 6:00p.m. 23.40 46,000 6:00p.m. 21.88 38,800 23 - 1:30a.m. 27.05 66,800 12:00 p.m. 22.66 42,400
12:00 p.m. 23.65 47,300 4:00a.m. 27.03 66,600 8:00a.m. 26.82 65,300 25 - 12:00 m. 20.95 34,900
22 - 6:00a.m. 25.40 56,800 12:00 m. 26.46 63,200 12:00 p.m. 19.02 27,700 12:00 m. 26.15 61,300 6:00p.m. 25.85 59,500 6:00p.m. 26.78 65,100 12:00 p.m. 25.24 55,800
Period Highest mean discharge, in cubic feet per second, for the indicated number of consecutive days 3 7 11) 30
March-May 1973 ------------------ 62,600 1915-72 --------------------------- 50,100 Recurrence interval, in year.s,for
1973 flood volumes --------------- >100
57,300 45,700
>100
39,900 37,000
>100
MISSISSIPPI RIVER MAIN STEM (16) 05474500 Mississippi River at Keokuk, Iowa
25,500 25,500
>100
20,700 21,000
>100
Location.-Lat 41 °2:3'37", long 91 °22'27", in SE14SW14 sec. 30, T. 65 N., R. 4 W., Lee County, near right bank in tailwater of dam and powerplant of Union Electric Co. at Keokuk, 0.2 mile (0.3 km) upstream from bridg'le on U.S. Hig:hway 136, 2.7 mile1s (4.3 km) upstream from Des Moines River, and at mile 364.2 (586.0 km) upstream from Ohio River.
Drainawe area.-119,000 mi2 (308,000 km2), approximately.
Gage.-Water-stage recorder. Datum of gage is 477.41 ft (145.515 m) above mean sea level (levels by Co~rps of E,ngineers; 477.83 ft (145.643 m) above mean sea level, adjustment of 1912; 477.34 ft (145.493 m) above mean gulf level; :and 484.65 ft (147.721 m) above Memphis datum. Jan. 1, 1878, to May 1913, nonrecording gage at Galland (formerly Na.shville), 8 miles (13 k:m) upstream; zero of g'lage was set to low-water mark of 1864, or 496.94 ft (151.467 m) abo<ve mean sea level, adjustment of 1912.
Flood S·tage.-16 ft (4.9 m). M.axima.-March-May 1973: Daily discharge, 344,000 ft3/s (9,740 m~/s) Apr. 24. gage height, 23.35 ft (71.17 m), Apr. 24.
R,e,currence interval of discharge is 100 years (based on figure 52). January 1878 to February 1973: Daily dis'C:harge, 327,000 ffl/s (9,260 m3/s) May 1, 1965; gag'le height, 22.14 ft (6.748 m)
May 1,1965. Flood of June 6, 1851, reached a stage of 21.0 ft (6.40 m), present site and datum; estimated as 13.5 f,t (4.11 m) at
Galland [discharge, 360,000 ffl/s (10,200 m3/s) }. Remarks.-Minor flow regulation by powerplant above station1 since 1913, and reservoirs and navigation dams above station
since about 1935. Discharge computed from records of operation of turbines in powerpl,ant and spillway gates in dam. Flood-volume data are not available for this station.
THE FLOODS
TABLE 12.-Station descriptions and discharge and suspended-sediment data-Continued
Mean water discharge and suspended-sediment concentration and discharge
93
March April May June Suspended Suspended Suspended Suspended sediment 1 sediment 1 sediment 1 sediment 1
Mean Mean Mean Mean Mean eon- Dis- Mean con- Dis- Mean eon- Dis- Mean eon- Dis-
Day dis- een- charge Day dis- cen- charge Day dis- cen- charge Day dis- een- charge charge tra- (tons/ charge tra- (tons/ charge tra- (tons/ charge tra- (tons/ (ft 3fs) tion day) (ft 3/s) tion day) (ft 3/s) tion day) (ft 3/s) tion day)
(mg/l) (mg/1) (mg/1) (mg/1)
1 73,600 147 29,000 1 251,000 530 359,000 1 249,000 157 106,000 1 180,000 490 238,000 2 72,000 95 18,000 2 234,000 529 329,000 2 258,000 227 158,000 2 175,000 315 149,000 3 77,300 85 18,000 3 234,000 430 272,000 3 260,000 730 512,000 :l 172,000 287 133,000 4 84,000 86 20,000 4 219,000 343 203,000 4 256,000 748 517,000 4 177,000 216 103,000 5 88,400 125 30,000 5 204,000 224 123,000 5 251,000 689 467,000 5 182,000 254 125,000 6 101,000 128 35,000 6 195,000 186 98,000 6 242,000 538 352,000 6 186,000 241 121,000 7 115,000 158 49,000 7 190,000 177 91,000 7 231,000 364 227,000 7 192,000 272 141,000 8 134,000 419 152,000 8 179,000 181 87,000 8 222,000 374 224,000 8 194,000 358 188,000 9 148,000 553 221,000 9 180,000 122 59,000 9 220,000 158 94,000 9 194.000 317 166,000
10 155,000 302 126,000 10 189,000 417 213,000 10 223,000 195 117,000 10 187,000 302 152,000 11 158.000 424 181,000 11 184,000 418 208,000 11 232,000 276 173,000 11 177,000 243 116,000 12 16f.ooo 541 235,000 12 179,000 320 154,000 12 244,000 211 139,000 12 166,000 178 80,000 13 164".000 471 209,000 13 173,000 176 82,000 13 254,000 214 147,000 13 154,000 135 56,000 14 174;ooo 415 195,000 14 171,000 153 71,000 14 261,000 201 142,000 14 146,000 108 43,000 15 191,000 748 386,000 15 167,000 155 70,000 15 264.000 186 133,000 15 136,000 96 35,000 16 196.000 580 307,000 16 170,000 214 98,000 16 266,000 182 131,000 16 128,000 92 32,000 17 2oo:ooo 573 309,000 17 171.000 317 146,000 17 263,000 175 124,000 17 130,000 68 24,000 18 207,000 377 211,000 18 176;ooo 176 84,000 18 255,000 151 104,000 18 141,000 97 37,000 19 217,000 392 230,000 19 183,000 229 113,000 19 248,000 142 95,000 19 150,000 250 101,000 20 229.000 525 325,000 20 196,000 265 140,000 20 233,000 142 89,000 20 149.000 441 177,000 21 238;ooo 396 254,000 21 244,000 2,030 1,337,000 21 218,000 121 71,000 21 145:ooo 380 149,000 22 249,000 345 232,000 22 309,000 654 546,000 22 205,000 116 64,000 22 131,000 420 149,000 23 248,000 307 206,000 23 336,000 616 559,000 23 196,000 119 63,000 23 124,000 277 93,000 24 254,000 289 199,000 24 343,000 1,930 1,787,000 24 186,000 109 55,000 24 121,000 189 62,000 25 266,000 284 204,000 25 342,000 484 447,000 25 174,000 104 49,000 25 114,000 235 72,000 26 265,000 435 311,000 26 329,000 647 575,000 26 165,000 134 60,0'00 26 110,000 237 70,000 27 267,000 249 180,000 27 310,000 646 541,000 27 189,000 114 58,000 27 114,000 209 64,000 28 263,000 261 185,000 28 290,000 509 399,000 28 185,000 441 220,000 28 98,000 316 84,000 29 258.000 230 160,000 29 273,000 236 174,000 29 182,000 798 392,000 29 93,000 216 54,000 30 248,000 194 130,000 30 258,000 188 131,000 30 179,000 770 372,000 30 90,000 171 42,000 31 --- 245,000 339 224,000 31
9~16~000 31 --- 181.000 564 276,000 31
Total 5,746,300 5,571,000 6,889,000 Total - 6,992,000 5,731,000 4,456,000 3,056,000 Monthly
mean dis-charge 185,400
Maxi-180,000 229,600 317,000 226,000 185,000 149,000 102,000
mum 267,000 Mini-
386,000 343,000 1,787,000 266,000 517,000 194,000 238,000
mum 72,000 18,000 167,000 59,000 165,000 49,000 90,000 24,000
1 Daily sediment concentrations are values determined from a single-bottle sample taken near midstream.
DES MOINES RIVER BASIN (17) 05488100 Lake Red Rock near Pella, Iowa
Location.-Lat 4P22'11", long 92°58'48", in NE%,NW% sec. 19, T. 76, N., R. 18 W., Marion County, at outlet wo'l'ks near right end of Red Rock Dam on Des Moines River, 1.4 miles (2.3 km) upstream from Lalre Greek, 4.5 miles (7.2 km) south-west of Pella .and at mile 142.3 (229.0 km).
Drainage area.-12,323 mi2 (3.1,917 km2).
Gage.-Water-stage reoorder. Datum of gage is at mean sea level (levels by Corps ·Of Engine.ers). Maxima.-Ma:roh-May 1973: Contents, 1,700,000 acre-ft (2.10 km3
) 10:00 a.m., May 14 [elevation, 777.95 ft (237.119 m)]. March 1969 to February 1973: Contents, 1,010,000 acre-f.t (1.2·5 km3
) Aug. 2, 1969, [elevation, 764.83 ft (23.3.120 m)]. Remarks.-Reservoir ·storage began in March 1969. The storage capacity of the reservoir at full flood-control pool level [780 ft
(238 m)] is 1,880,000 acre-ft (2.26 km3) that of conservation pool level [725ft (221 m)] is 90,000 acre-ft (111 hm8
).
Elevation, in feet, and contents in acre-feet, .1973
Date Time Elevation Contents Date Time Elevation Contents
Jan. 31 ____ 12:00 p.m. 731.54 160,000 Apr. 30 ____ 12:00 p.m. 774.33 1,470,000 Feb. 28 ____ 12:00 p.m. 728.09 121,000 May 14 ____ 10:00 a.m. 777.95 1~700,000 Mar. 31 ____ 12:00 p.m. 764.62 1,996,000 May 31 ____ 12:00 p.m. 775.23 1:520,000
FOX RIVER BASIN (18) 05495000 Fox River at Wayland, Mo.
Location.-Lat 40°23'33", long 91°35'50", in NW% sec. 31, T. 65 N., R. 6 W., Clark County, on left bank 00 ft (27m) downstream from bridge on U.S. Highway 136, 0.8 mile (1.3 km) west of Wayland, and 5 miles (8.0 km) downstream from Brush Creek.
Drainage area.-400 mi2 (1,036 km2), approximately.
Gage.-Digital water-stage recorder. Datum orf gage is 501.52 ft (152.863 m) above mean sea level, datum of 1929. Flood stage.-15 ft (4.6 m). Maxima.-March-May 1973: Discharge, 26,400 ft3/s (748 m3/s) 6:00p.m., Apr. 22 [gage height, 21.71 ft (6.6,17 m)]. Discharge
exceded the 100-year flood. February 1922 to February 1973: Discharge, 25,000 ft3/s (708 m3/s) June 29, 1933 [gage height,-21.53 ft (6.562 m) from
floodmarks]. .
94 THE 1973 MISSISSIPPI RIVER BASIN FLOOD
TABLE 12.-Station descriptions and discharge and suspended-sediment data-Continued
Mean discharge, in cubic feet per second, .1973
Day March April May Day March April May Day March
1 134 4,270 2,820 11 2,480 975 446 21 188 2 219 5.430 5,800 12 1,950 1,130 334 22 179 3 302 2;350 8,260 13 943 1,860 268 23 161 4 302 674 3,870 14 2,910 1,890 223 24 146 5 241 500 654 15 1,460 1,240 194 25 1,500 6 256 393 492 16 640 1,490 176 26 2,690 7 1,900 306 1,130 17 370 1.790 159 27 1,960 8 1,680 249 2,790 18 269 1~080 146 28 686 9 679 2.250 2,350 19 216 465 135 29 566
10 718 2~530 705 20 192 841 125 30 422 31 1,440
Monthly mean discharge, in cubic feet per second ------------------------------------ 897 Runoff, in inches ----------------------------------------------------------------- 2.59
Gage height, in feet, and discharge, in cubic feet per second, at indicated time, .1973
Date Hour
Apr. 20 _ 12:00 m. 6:00p.m. 8:00p.m.
10:00 p.m. 12:00 p.m.
21 _ 6:00a.m. 12:00m. 6:00p.m.
12:00 p.m.
22 _ 6:00a.m. 8:00a.m.
10:00 a.m.
Gage height
4.29 4.67 9.78
12.39 15.02
16.19 16.66 17.48 18.89
19.67 20.02 21.00
Dis- Date Hour charge
352 Apr. 22 - 12:00 m. 424 2:00p.m.
1,740 4:00p.m. 2,730 6:00p.m. 4,220 8:00p.m.
10:00 p.m. 5,290 12:00 p.m. 5,760 6,820 23 - 6:00a.m. 9,320 10:00 a.m.
12:00 m. 12,300 6:00p.m. 13,700 12:00 p.m. 20,000
Gage Dis- Date Hour height charge
21.40 23,600 Apr. 24 _ 6:00a.m. 21.60 25,400 12:00 m. 21.69 26,200 3:00p.m. 21.71 26,400 6:00p.m. 21.68 26,100 12:00 p.m. 21.63 25,700 21.57 25,100 25 - 6:00a.m.
12:00 m. 21.34 23,100 6:00p.m. 21.00 20,000 12:00 p.m. 20.57 16,800 19.75 12,600 26 - 12:00 m. 18.80 9,100 12:00 p.m.
April May
6,200 114 19,900 112 17,500 110
4,340 116 758 106 528 259 430 6,440 367 6,850 331 6,920 426 4,300
1,500 2,750 1,868
7.67 5.39
Gage Dis-height charge
17.73 7,200 15.03 4,220 10.60 2,030
8.35 1,300 7.20 990
6.62 845 6.23 748 5.86 662 5.55 600
5.17 524 4.90 470
Period Highest mean discharge, in cubic feet per second, for the indicated number of consecutive days 1 3 7 11) 30
March-May 1973 ------------------ 19,900 1923-72 -------------------------- 15,200 Recurrence interval, in years, for
1973 flood volumes --------------- 100
14,530 11,300
>100
FABIUS RIVER BASIN
7,150 5,520
>100
(19) 05497000 North Fabius River at Monticello, Mo.
4,280 3,270
>100
2,910 2,340
>100
Location.-Lat 40°06'30", long 91 °42'51", in SW14SE14 sec. 6, T. 61 N., R. 7 W., Lewis Gounty, on right bank upstream from bridge on State Highway 16, 1 mile (1.6 km) south of Monticello, and 19 miles (30.6 km) upstream from Middle Fabius River.
Drainage area.-452 mi2 (1,171 km2).
Gage.-Digital water-stage recorder. Datum of gage is 540.73 ft (164.815 m) above mean sea level, datum of 1929. Flood stage.-22 ft (6.7 m). Maxima.-March-May 1973: Discharge, 20,700 fe;s (586 m 3/s) 12:00 p.m. Apr. 22 [gage height, 33.03 ft (10.068m)] Dis
charge exceeded the 100-year flood. February 192.2 to February 1973: Discharge, 17,400 ft3/s (493 m3/s) June 30, 1933 [gage height, 30.8 ft (9.39 m), from
floodmarks]. Maximum stage since at least 1874, that of June 30, 1933.
Mean discharge, in cubic feet per second, .1973
Day March April May Day March April May Day March April May
1 166 6,700 2,440 11 ---- 4,050 1,270 368 21 255 7,790 46 2 261 7.020 6,440 12 ---- 2,580 2,850 235 22 243 16,400 45 3 390 2;100 10,100 13 ---- to8o 3,930 178 23 203 17,900 42 4 311 929 3,360 14 ---- 3.520 2,490 135 24 195 7,680 40 5 231 677 695 15 ---- 2~840 1.660 107 25 3,350 1,130 37 6 278 551 570 16 ---- 772 2;610 93 26 6,870 622 132 7 2.560 449 1,640 17 ---- 468 2~690 81 27 3,200 465 5,970 8 2~300 375 4,440 18 ---- 350 883 69 28 948 375 11,400 9 730 1,350 3,310 19 ---- 283 550 61 29 1,080 279 11,100
10 872 1,370 720 20 ---- 259 1,800 53 30 ---- 678 243 2,190 31 ---- 2,350 515
Monthly mean discharge, in cubic feet per second ------------------------------------ 1,409 3,171 2,149 Runoff, in inches ------------------------------------------------------------------- 3.59 7.83 5.48
Date
Apr. 20 _
21 -
THE FLOODS
TABLE 12.-Station descriptions and discharge and suspended-sediment data-Continued
Gage height, in feet, and discharge, in cubic feet per second, at indicated time, .1973
Hour Gage height
6 00 a.m. 7.67 3 00 p.m. 7.58 4 00 p.m. 9.85 6 00 p.m. 15.9 9 00 p.m. 19.6
12 00 p.m. 21.25
4:00a.m. 21.75 8:00a.m. 21.5
12:00m. 22.25 6:00p.m. 23.48
12:00 p.m. 25.6
Discharge Date Hour
458 Apr. 435
1,000 3,250 5,420 6,600
7,000 6,800 7,420 8,580
10,900
22 _ 12:00 m. 6:00p.m. 8:00p.m.
10:00 p.m. 12:00 p.m.
23 _ 2:00a.m. 4:00a.m. 6:00a.m.
12:00m. 6:00p.m.
12:00 p.m.
Date Gage Dis-height charge
30.0 16,500 Apr. 24 -32.1 19,400 32.5 20,000 32.85 20,500 33.03 20,700
32.95 20,600 32.80 20,400 32.55 20,000 31.46 18,400 29.61 16,000 27.49 13,200
25 -
26 -
Hour
8:00a.m. 12:00 m.
3:00p.m. 8:00p.m.
12:00 p.m.
6:00a.m. 12:00 m.
6:00p.m. 12:00 p.m.
12:00 m. 12:00 p.m.
95
Gage Dis-height charge
24.59 9,750 22.78 7,900 20.30 5,910 16.68 3,410 14.08 2,040
12.09 1,260 11.20 1,000 10.64 855 10.21 745
9.70 615 9.33 522
Period Highest mean discharge, in cubic feet per second, for the indicated number of consecutive days 1 3 7 15 30
~arch-~ay 1973 ------------------1923-72 ---------------------------Recurrence interval, in years, for
1973 flood volumes ---------------
17,900 14,800
>tOO
14,000 12,300
>100
FABIUS RIVER BASIN
7,620 6,510
100
(20) 05498000 Middle Fabius River near Monticello, Mo.
5,130 4,820
100
3,600 3,390
80
Location.-Lat 40°05'37", long 91 °44'08", in SE% sec. 12, T. 61 N., R. 8 W., Lewis County, on left bank on downstream end of bridge pier on State Highway 16, 2.5 miles (4.0 km) southwest of ~onticello, 8 mHes (12.9 km) downstream from Radish Branch, and 17 miles (27.4 km) upstream from mouth.
Drainage area.-393 mi2 (1,018 km2).
Gage.-Digital water-stage recorder. Datum of gage is 540.46 ft (164.732 m) above mean sea level. Flood stage.-13 ft. (4.0 m) ~axima.-~arch-~ay 1973: Discharge 17,700 ff1/s (501 m 3/s) 12:30 a.m. Apr. 23 [gage height, 27.14 ft (8.272 m)].
Discharge exceeded the 100-year flood. July 1945 to February 1973: Discharge, 16,200 f~/s (459 m3/s) June 7, 1947 [gage height, 26.28 ft (8.010 m)]. ~aximum stage since 1930, 26.6 ft (8.11 m), from floodmark, date unknown [discharge, 16,800 ft3/s (476 m3/s) ]. Flood of
June 17, 1945, reached a stage of 23.3 ft (7.10 m), from floodmarks.
Mean discharge, in cubic feet per second, .1973
Day March April May Day March April May Day March April May
1 214 4,180 232 11 2,250 1,030 485 21 174 6,580 87 2 298 4,340 1,970 12 2,480 1,770 312 22 167 12,200 85 3 277 4,930 2,990 13 2,060 2,280 228 23 150 15,100 82 4 238 1~940 4,920 14 3,230 2,430 180 24 165 8.970 79 5 226 623 1,720 15 2,300 1,980 150 25 3,070 2~190 79 6 310 432 502 16 1,130 1,910 132 26 4,080 484 145 7 1,650 315 1,520 17 440 2,100 119 27 4,110 329 5,480 8 1,960 247 3,070 18 285 1,170 108 28 3,980 242 6,040 9 1,120 1,040 2,800 19 224 500 101 29 1,160 193 9,040
10 902 1,140 1,190 20 194 761 93 30 639 156 7,230 31 2,750 873
Monthly mean discharge, in cubic feet per second ------------------------------------ 1,362 2,719 1,679
Runoff, in inches ------------------------------------------------------------------- 4.00 7.72 4.93
Gage height, in feet, and discharge, in cubic feet per second, at indicated time, .1973
Date Hour Gage Dis- Date Hour Gage Dis- Date Hour Gage Dis-height charge height charge height charge
Apr. 20 _ 8:00a.m. 5.59 362 Apr. 22 _ 2 00 p.m. 25.03 13,500 Apr. 23 - 12:00 p.m. 23.85 11,600 6:00p.m. 5.55 352 4 00 p.m. 25.90 15,200 8:00p.m. 6.43 609 6 00 p.m. 26.49 16,400 24 - 6:00a.m. 22.77 10,100
10:00 p.m. 12.18 2,500 8 00 p.m. 26.86 17,100 12:00m. 21.66 8,860 12:00 p.m. 16.86 4,820 10 00 p.m. 27.06 17,500 12:00p.m. 19.30 6,670
11 00 p.m. 27.11 17,600 21 - 4:00a.m. 18.90 6,320 25 - 6:00a.m. 14.40 3,500
10:00 a.m. 19.72 7,050 23 - 3 00 a.m. 27.14 17,700 12:00m. 7.56 948 8:00p.m. 19.20 6,580 2 00 a.m. 27.11 17,600 6:00p.m. 6.94 762
12:00 p.m. 19.60 6,940 4 00 a.m. 27.02 17,400 12:00p.m. 6.47 621 8 00 a.m. 26.61 16,600
22 - 6:00a.m. 21.21 8,410 12 OOm. 25.98 15,400 26 - 12:00a.m. 6.02 477 12:00m. 23.97 11,800 6 00 p.m. 24.94 13,300 12:00 p.m. 5.73 390
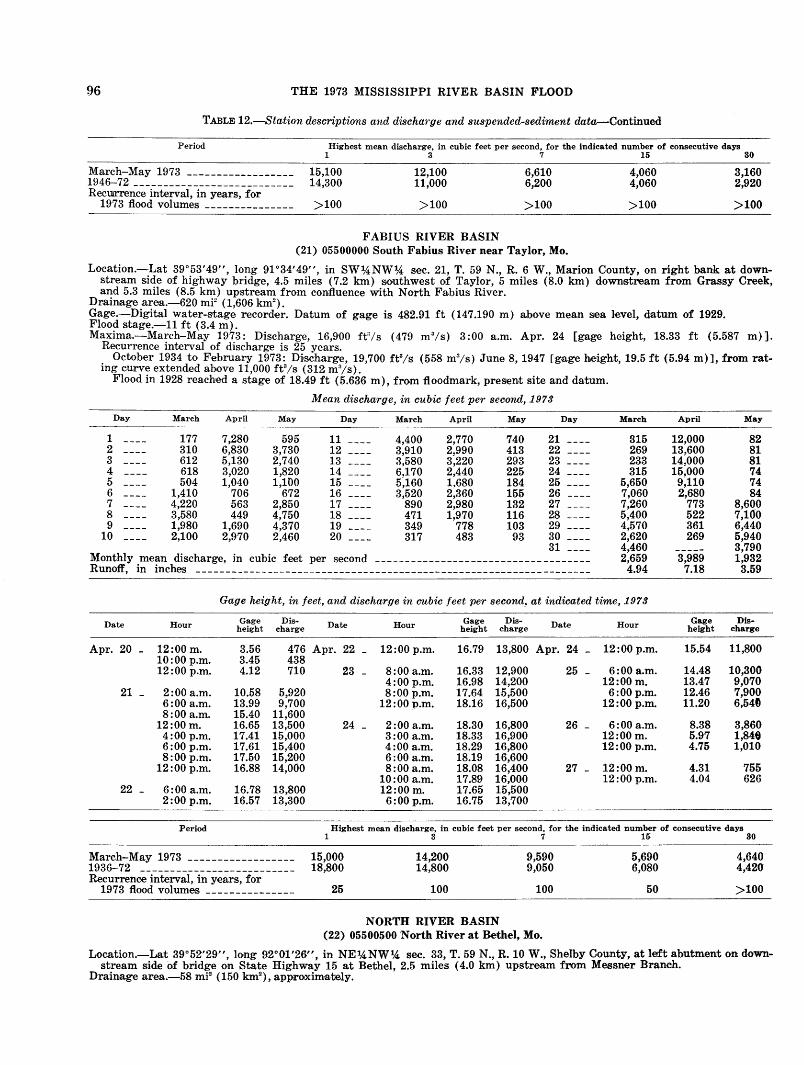
96 THE 1973 MISSISSIPPI RIVER BASIN FLOOD
TABLE 12.-Station descriptions and discha1'ge and suspended-sediment data-Continued
Period Highest mean discharge, in cubic feet per second, for the indicated number of consecutive days 1 3 7 15 30
~arch-~ay 1973 ------------------1946-72 --------------------------RecUJrrence interval, in years, for
1973 flood volumes ---------------
15,100 14,300
>100
12,100 11,000
>100
FABIUS RIVER BASIN
6,610 6,200
>100
(21) 0!j.500000 South Fabius River near Taylor, Mo.
4,060 4,060
>100
3,160 2,920
>100
Location.-Lat 39°53'49", long 91°34'49", in SW1,4NW~ sec. 21, T. 59 N., R. 6 W., Marion County, on right bank at downstream side of highway bridge, 4.5 miles (7.2 km) southwest of Taylor, 5 miles (8.0 km) downstream from Grassy Creek, and 5.3 miles (8.5 km) upstream from confluence with No·rth Fabius River.
Drainage area.-620 mF ( 1,606 km2).
Gage.-Digital water-stage recorder. Datum of gage is 482.91 ft (147.190 m) above mean sea level, datum of 1929. Flood stage.-11 ft (3.4 m). ~axima.-~arch-~ay 1973: Discharge, 16,900 ft'1/s (479 m 3/s) 3:00 a.m. Apr. 24 [gage height, 18.33 ft (5.587 m) ].
Recurrence interval of discharge is 25 years . . October 1934 to February 1973: Di,scharge, 19,700 fe;s (558 m3/s) June 8, 1947 [gage height, 19.5 ft (5.94 m)], from ratmg curve extended above 11,000 ft3/s (312 m 3/s).
Flood in 1928 reached a stage of 18.49 ft (5.636 m), from floodmark, present site and datum.
Mean discharge, in cubic feet per second, 1973
Day March April May Day March April May Day March April May
1 177 7,280 595 11 4,400 2,770 740 21 315 12,000 82 2 310 6,830 3,730 12 3,910 2.990 413 22 269 13.600 81 3 612 5,130 2,740 13 3,580 3~220 293 23 233 14:ooo 81 4 618 3,020 1,820 14 6.170 2,440 225 24 315 15:ooo 74 5 504 1,040 1,100 15 5~160 1.680 184 25 5,650 9~110 74 6 1,410 706 672 16 3,520 2,360 155 26 7,060 2,680 84 7 4,220 563 2,850 17 890 2,980 132 27 7,260 773 8,600 8 3,580 449 4,750 18 471 1,970 116 28 5,400 522 7,100 9 1,980 1,690 4,370 19 349 778 103 29 4,570 361 6,440
10 2,100 2,970 2,460 20 317 483 93 30 2,620 269 5,940 31 4,460 3,790
Monthly mean discharge, in cubic feet per second ------------------------------------ 2,659 3,989 1,932 Runoff, in inches ------------------------------------------------------------------ 4.94 7.18 3.59
Gage height, in feet, and discharge in cubic feet per second, at indicated time, .1973
Hour Gage Dis- Date Hour Gage Dis- Date Hour Gage Dis-height charge height charge height charge Date
Apr. 20 _ 12:00 m. 3.56 476 Apr. 22 _ 12:00 p.m. 16.79 13,800 Apr. 24 - 12:00 p.m. 15.54 11,800 !O:OOp.m. 3.45 438 12:00 p.m. 4.12 710 23 - 8:00a.m. 16.33 12,900 25 - 6:00a.m. 14.48 10,300
21 -4:00p.m. 16.98 14,200 12:00m. 13.47 9,070
2:00a.m. 10.58 5,920 8:00p.m. 17.64 15,500 6:00p.m. 12.46 7,900 6:00a.m. 13.99 9,700 12:00 p.m. 18.16 16,500 12:00 p.m. 11.20 6,54ft 8:00a.m. 15.40 11,600
12:00 m. 16.65 13,500 24 - 2:00a.m. 18.30 16,800 26 - 6:00a.m. 8.38 3,860 4:00p.m. 17.41 15,000 3:00a.m. 18.33 16,900 12:00 m. 5.97 1,8MJ 6:00p.m. 17.61 15,400 4:00a.m. 18.29 16,800 12:00 p.m. 4.75 1,010 8:00p.m. 17.50 15,200 6:00a.m. 18.19 16,600
12:00 p.m. 16.88 14,000 8:00a.m. 18.08 16,400 27 - 12:00 m. 4.31 755 10:00 a.m. 17.89 16,000 12:00 p.m. 4.04 626
22 - 6:00a.m. 16.78 13,800 12:00 m. 17.65 15,500 2:00p.m. 16.57 13,300 6:00p.m. 16.75 13,700
Period Highest mean discharge, in cubic feet per second, for the indicated number of consecutive days
March-~ay 1973 ------------------1936-72 -------------------------Recurrence interval, in years, for
1973 flood volumes ---------------
1
15,000 18,800
25
3
14,200 14,800
100
NORTH RIVER BASIN
7
9,590 9,050
100
(22) 05500500 'North River at Bethel, Mo.
15
5,690 6,080
50
30
4,640 4,420
>100
Location.-Lat 39°52'29", long 9-2°01'26", in NE~NW~ sec. 33, T. 59 N., R.lO W., Shelby County, at left abutment on downstream side of bridge on State Highway 15 at Bethel, 2.5 miles (4.0 km) upstream from Messner Branch.
Drainage area.-58 mF (150 km2), approximately.
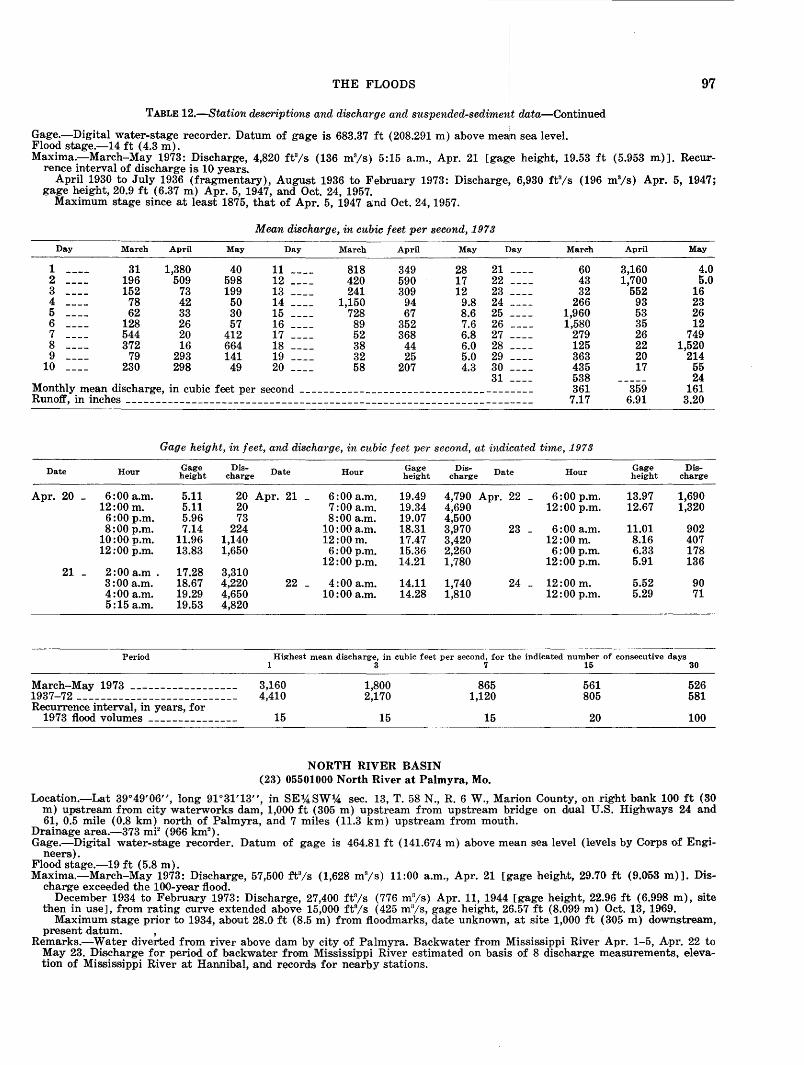
THE FLOODS
TABLE 12.-Station descriptions and discharge and suspended-sediment data-Continued
Gage.-Digital water-stage recorder. Datum of gage is 683.37 ft (208.291 m) above mean sea level. Flood s·tage.-14 ft (4.3 m).
97
Maxima.-March-May 1973: Discharge, 4,820 ft3/s (136 m3/s) 5:15 a.m., Apr. 21 [gage height, 19.53 ft (5.953 m)]. Recurrence interval of discharge is 10 years.
April 1930 to July 1936 (fragmentary), August 1936 to February 1973: Discharge, 6,930 ft3/s (196 m 3/s) Apr. 5, 1947; gage height, 20.9 ft (6.37 m) Apr. 5, 1947, and Oct. 24, 1957.
Maximum stage since at least 1875, that of Apr. 5, 1947 a:nd Oct. 24, 1957.
Mean discharge, in cubic feet per second, 1973
Day March April May Day March April May Day March April May
1 31 1,380 40 11 818 349 28 21 60 3,160 4.0 2 196 509 598 12 420 590 17 22 43 1,700 5.0 3 152 73 199 13 241 309 12 23 32 552 16 4 78 42 50 14 1,150 94 9.8 24 266 93 23 5 62 33 30 15 728 67 8.6 25 1,960 53 26 6 128 26 57 16 89 352 7.6 26 1,580 35 12 7 544 20 412 17 52 368 6.8 27 279 26 749 8 372 16 664 18 38 44 6.0 28 125 22 1,520 9 79 293 141 19 32 25 5.0 29 363 20 214
10 230 298 49 20 58 207 4.3 30 435 17 55 31 ---- 538 24
Monthly mean discharge, in cubic feet per second --------------------------------------- 361 359 161 Runoff, in inches ____________________________________________________________________ 7.17 6.91 3.20
Gage height, in feet, and discharge, in cubic feet per second, at indicated time, .1973
Date Hour Gage Dis- Date Hour Gage Dis- Date Hour Gage Dis-height charge height charge height charge
Apr. 20 - 6:00a.m. 5.11 20 Apr. 21 _ 6:00a.m. 19.49 4,790 Apr. 22 - 6:00p.m. 13.97 1,690 12:00m. 5.11 20 7:00a.m. 19.34 4,690 12:00 p.m. 12.67 1,320
6:00p.m. 5.96 73 8:00a.m. 19.07 4,500 8:00p.m. 7.14 224 10:00 a.m. 18.31 3,970 23 - 6:00a.m. 11.01 902
10:00p.m. 11.96 1,140 12:00 m. 17.47 3,420 12:00 m. 8.16 407 12:00 p.m. 13.83 1,650 6:00p.m. 15.36 2,260 6:00p.m. 6.33 178
12:00 p.m. 14.21 1,780 12:00 p.m. 5.91 136 21 - 2:00a.m. 17.28 3,310
3:00a.m. 18.67 4,220 22 - 4:00a.m. 14.11 1,740 24 - 12:00 m. 5.52 90 4:00a.m. 19.29 4,650 10:00 a.m. 14.28 1,810 12:00 p.m. 5.29 71 5:15a.m. 19.53 4,820
Period Highest mean discharge, in cubic feet per second, for the indicated number of consecutive days
March-May 1973 ------------------1937-72 --------------------------Recurrence interval, in years, for
1973 flood volumes ---------------
1 '3 7 16 30
3,160 4,410
15
1,800 2,170
15
NORTH RIVER BASIN
865 1,120
15
(23) 05501000 North River at Palmyra, Mo.
561 805
20
526 581
100
Location.-Lat 39°49'06", long 91 °31'13", in SE14,SW14 sec. 13, T. 58 N., R. 6 W., Marion County, on right bank 100ft (30 m) upstream from city waterworks dam, 1,000 ft (305 m) upstream from upstream bridge on dual U.S. Highways 24 and 61, 0.5 mile (0.8 km) north of Palmyra, and 7 miles (11.3 km) upstream from mouth.
Drainage area.-373 mi2 (966 km2).
Gage.-Digital water-stage recorder. Datum of gage is 464.81 ft (141.674 m) above me·an sea level (levels by Corps of Engineers).
Flood stage.-19 ft (5.8 m). Maxima.-March-May 1973: Discharge, 57,500 ft3/s (1,628 m3/s) 11:00 a.m., Apr. 21 [gage height, 29.70 ft (9.05~3 m)]. Dis
charge exceeded the 100-year flood. December 1934 to February 1973: Discharge, 27,400 ft3/s (776 m3/s) Apr. 11, 1944 [gage height, 2.2.96 ft (6.998 m), site
then in use], from rating curve extended above 15,000 fe;s (425 m3/s, gage height, 26.57 ft (8.099 m) Oct. 13, 1969. Maximum stage prior to 1934, about 28.0 ft (8.5 m) from fl.oodmarks, date unknown, at site 1,000 ft (305m) doiW'Ilstrea:m,
present datum. , Remarks.-W·ater diverted from river above dam by city of Palmyra. Backwater from Mis.sis,sippi River Apr. 1-5, Apr. 22 to
May 23. Dis.charge for period of backwater froon Mississippi River estimated on basis of 8 discharge measurements, elevation of Mississippi River at Hannibal, and records for nearby stations.
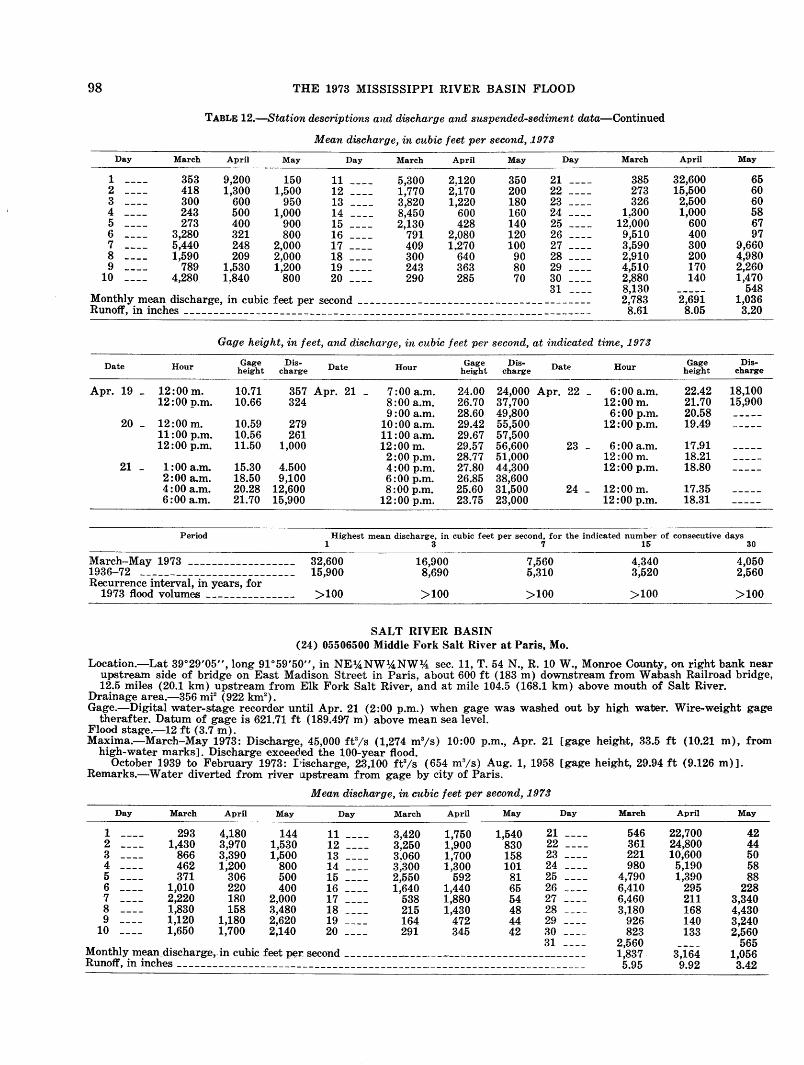
98 THE 1973 MISSISSIPPI RIVER BASIN FLOOD
TABLE 12.-Station descriptions and discharge and suspended-sediment data-Continued
Mean discharge, in cubic feet per second, .1973
Day March April May Day March April May Day March April May
1 353 9,200 150 11 5,300 2.120 350 21 385 32,600 65 2 418 1,300 1,500 12 1,770 2;170 200 22 273 15,500 60 3 300 600 950 13 3,820 1,220 180 23 326 2.500 60 4 243 500 1,000 14 8,450 600 160 24 1.300 1:ooo 58 5 273 400 900 15 2,130 428 140 25 12:ooo 600 67 6 3,280 321 800 16 791 2,080 120 26 9;510 400 97 7 5,440 248 2,000 17 409 1~270 100 27 3,590 300 9,660 8 1,590 209 2,000 18 300 640 90 28 2,910 200 4,980 9 789 1.530 1,200 19 243 363 80 29 4,510 170 2,260
10 4,280 1~840 800 20 290 285 70 30 2,880 140 1,470 31 8,130 548
Monthly mean discharge, in cubic feet per second -----------------------------------~~~~ 2,783 2,691 1,036 Runoff, in inches ----------------- __________________ ------------ _____________ -------- 8.61 8.05 3.20
Gage height, in feet, and dischm·ge, in cubic feet per second, at indicated time, .1973
Date Hour Gage .Dis- Date Hour Gage Dis- Date Hour Gage Dis-height charge height charge height charge
Apr. 19 - 12:00 m. 10.71 357 Apr. 21 _ 7:00a.m. 24.00 24,000 Apr. 22 _ 6:00a.m. 22.42 18,100 12:00 p.m. 10.66 324 8:00a.m. 26.70 37,700 12:00m. 21.70 15,900
9:00a.m. 28.60 49,800 6:00p.m. 20.58 20 - 12:00 m. 10.59 279 10:00 a.m. 29.42 55,500 12:00 p.m. 19.49
11:00 p.m. 10.56 261 11:00 a.m. 29.67 57,500 12:00 p.m. 11.50 1,000 12:00 m. 29.57 56,600 23 - 6:00a.m. 17.91
2:00p.m. 28.77 51,000 12:00 m. 18.21 21 - 1:00 a.m. 15.30 4.500 4:00p.m. 27.80 44,300 12:00 p.m. 18.80
2:00a.m. 18.50 9,100 6:00p.m. 26.85 38,600 4:00a.m. 20.28 12,600 8:00p.m. 25.60 31,500 24 - 12:00 m. 17.35 6:00a.m. 21.70 15,900 12:00 p.m. 23.75 23,000 12:00 p.m. 18.31
Period Highest mean discharge, in cubic feet per second, for the indicated number of consecutive days 1 3 7 16 30
March-May 1973 ------------------ 32,600 1936-72 -------------------------- 15,900 Recurrence interval, in years, for
1973 flood volumes --------------- >100
16,900 8,690
>100
SALT RIVER BASIN
7,560 5,310
>100
(24) 05506500 Middle Fork Salt River at Paris, Mo.
4,340 3,520
>100
4,050 2,560
>100
Location.-Lat 39°29'05", long 91 °59'50", in NKL~NW1,4NW'4 sec. 11, T. 54 N., R. 10 W., Monroe County, on right bank near upstream side of bridge on East Madison Street in Paris, about 600ft (183m) downstream from Wa:bash Railroad bridge, 12.5 mile.s (20.1 km) upstream from Elk Fork Salt River, and at mile 104.5 (168.1 km) above mouth of Salt River.
Drainage area.-356 mF (922 km2).
Gage.-Digital water-stage rec-order until Apr. 21 (2:00 p.m.) when gage was washed out by high water. Wire-weight gage therafter. Datum of gage is 621.71 ft (189.49·7 m) above mean sea level.
Flood stage.-12 ft (3.7 m). Maxima.-March-May 1973: Discltarge, 45,000 ft3/s (1,274 m 3/s) 10:00 p.m., Apr. 21 [gage height, 33.5 ft (10.21 m), from
high-wate·r marks]. Discharge exceeil.ed the 100-year flood. October 1939 to February 1973: I~scharge, 22,100 fe;s (654 m3/s) Aug. 1, 1958 [gage height, 29.94 ft (9.126 m) ].
Remarks.-Water diverted from river 11pstream from gage by city of Paris.
Mean discharge, in cubic feet per second, .1973
Day March April May Day March April May Day March April May
1 293 4,180 144 11 3,420 1,750 1,540 21 546 22,700 42 2 1,430 3,970 1,530 12 3,250 1,900 830 22 361 24,800 44 3 866 3.390 1,500 13 3,060 1,700 158 23 221 10,600 50 4 462 1;200 800 14 3,300 1,300 101 24 980 5,190 58 5 371 306 500 15 2,550 592 81 25 4,790 1,390 88 6 1,010 220 400 16 1,640 1,440 65 26 6,410 295 228 7 2,220 180 2,000 17 538 1,880 54 27 6,460 211 3,340 8 1,830 158 3,480 18 215 1,430 48 28 3,180 168 4,430 9 1,120 1,180 2,620 19 164 472 44 29 926 140 3,240
10 1,650 1,700 2,140 20 291 345 42 30 823 133 2,560 31 ---- 2,560 565
Monthly meandischarg.e,.in cubic feet per second--------------------------------·-------- 1,837 3,164 1,056 Runoff, in inches _____________________________________________________________________ 5.95 9.92 3.42
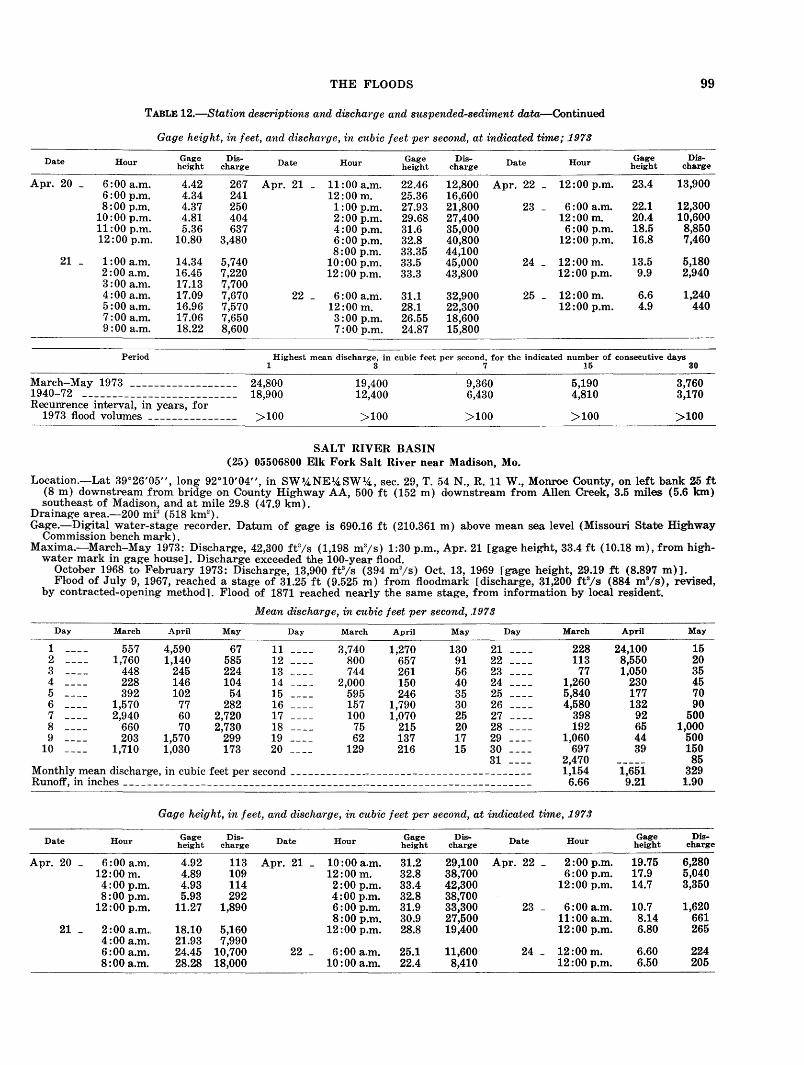
Date
Apr. 20 _
21 -
THE FLOODS
TABLE 12.-Station descriptions and discharge and suspended-sediment data-Continued
Hour
6:00a.m. 6:00p.m. 8:00p.m.
10:00 p.m. 11:00 p.m. 12:00 p.m.
1:00 a.m. 2:00a.m. 3:00a.m. 4:00a.m. 5:00a.m. 7:00a.m. 9:00a.m.
Gage height, in feet, and discha1·ge, in cubic feet per second, at indicated time; .1973
Gage Dis-height charge Date Hour
4.42 267 Apr. 21 _ 11:00 a.m. 4.34 241 12:00 m. 4.37 250 1:00 p.m. 4.81 404 2:00p.m. 5.36 637 4:00p.m.
10.80 3,480 6:00p.m. 8:00p.m.
14.34 5,740 10:00 p.m. 16.45 7,220 12:00 p.m. 17.13 7,700 17.09 7,670 22 - 6:00a.m. 16.96 7,570 12:00 m. 17.06 7,650 3:00p.m. 18.22 8,600 7:00p.m.
Gage Dis-height charge
22.46 12,800 25.36 16,600 27.93 21,800 29.68 27,400 31.6 35,000 32.8 40,800 33.35 44,100 33.5 45,000 33.3 43,800
31.1 32,900 28.1 22,300 26.55 18,600 24.87 15,800
Date
Apr. 22 _
23 -
24 -
25 -
Hour
12:00 p.m.
6:00a.m. 12:00 m. 6:00p.m.
12:00 p.m.
12:00 m. 12:00 p.m.
12:00 m. 12:00 p.m.
99
Gage Dis-height charge
23.4 13,900
22.1 12,300 20.4 10,600 18.5 8,850 16.8 7,460
13.5 5,180 9.9 2,940
6.6 1,240 4.9 440
Period Highest mean discharge, in cubic feet per second, for the indicated number of consecutive days 1 3 7 15 30
~arch-~ay 1973 ------------------1940-72 -------------------------Recul'!rence interval, in years, for
1973 flood volumes ---------------
24,800 18,900
>100
19,400 12,400
>100
SALT RIVER BASIN
9,360 6,430
>100
(25) 05506800 Elk Fork Salt River near Madison, Mo.
5,190 4,810
>100
3,760 3,170
>100
Location.-Lat 39°26'05", long 92°10'04", in SW%NE%SWt~, sec. 29, T. 54 N., R. 11 W., ~onroo County, on left bank 25ft (8 m) downstream from bridge on County Highway AA, 500ft (152m) downstream from Allen Creek, 3.5 miles (5.6 km) southeast of Madison, and at mile 29.8 (47.9 km).
Drainage area.-200 mi2 (518 km2).
Gage.-Digital water-stage recorder. Datum of gage is 690.16 ft (210.361 m) above mean sea level (Missouri State Highway Commission bench mark).
Maxima.~March-May 1973: Discharge, 42,300 ft3/s (1,198 m 3/s) 1:30 p.m., Apr. 21 [gage height, 33.4 ft (10.18 m), from highwater mark in gage house]. Discharge exceeded the 100-year flood.
October 1968 to F·ebruary 1973: Discharge, 13,900 fe;s (394 m 3/s) Oct. 13, 1969 [gage height, 29.19 ft (8.897 m)]. Flood of July 9, 1967, reached a stage of 31.2.5 ft (9.525 m) from floodmark [discharge, 31,200 ft3/S (884 m 3/s), revised,
by contracted-opening method]. Flood of 1871 reached nearly the same stage, from information by local resident.
Mean discharge, in cubic feet per second, .1973
Day March April May Day March April May Day March April May
1 557 4,590 67 11 3,740 1,270 130 21 228 24,100 15 2 1,760 1,140 585 12 800 657 91 22 113 8,550 20 3 448 245 224 13 744 261 56 23 77 1,050 35 4 228 146 104 14 2,000 150 40 24 1,260 230 45 5 392 102 54 15 595 246 35 25 5,840 177 70 6 1,570 77 282 16 157 1,790 30 26 4,580 132 90 7 2,940 60 2,720 17 100 1,070 25 27 398 92 500 8 660 70 2,730 18 75 215 20 28 192 65 1,000 9 203 1,570 299 19 62 137 17 29 1,060 44 500
10 1,710 1,030 173 20 129 216 15 30 697 39 150 31 2,470 85
Monthly mean discharge, in cubic feet per second----------------------------------------- 1,154 1,651 329 Runoff, in inches ________________________________________ .- ___________________________ 6.66 9.21 1.90
Gage height, in feet, and discharge, in cubic feet per second, at indicated time, .1973
Date Hour Gage Dis- Date Hour Gage Dis'" Date Hour Gage Dis-height charge height charge height charge
Apr. 20 _ 6:00a.m. 4.92 113 Apr. 21 _ 10:00 a.m. 31.2 29,100 Apr. 22 _ 2:00p.m. 19.75 6,280 12:00 m. 4.89 109 12:00 m. 32.8 38,700 6:00p.m. 17.9 5,040 4:00p.m. 4.93 114 2:00p.m. 33.4 42,300 12:00 p.m. 14.7 3,350 8:00p.m. 5.93 292 4:00p.m. 32.8 38,700
12:00 p.m. 11.27 1,890 6:00p.m. 31.9 33,300 23 - 6:00a.m. 10.7 1,620 8:00p.m. 30.9 27,500 11:00 a.m. 8.14 661
21 - 2 00 a.m .. 18.10 5,160 12:00 p.m. 28.8 19,400 12:00 p.m. 6.80 265 4 00 a.m. 21.93 7,990 6 00 a.m. 24.45 10,700 22 - 6:00a.m. 25.1 11,600 24 - 12:00 m. 6.60 224 8 OOa.m. 28.28 18,000 10:00 a.m. 22.4 8,410 12:00 p.m. 6.50 205
100 THE 1973 MISSISSIPPI RIVER BASIN FLOOD
TABLE 12.-Station descriptions and discharge and suspended-sediment data-Continued
SALT RIVER BASIN (26) 05507500 Salt River near Monroe City, Mo.
Location.-Lat 39°32'25", long 9r40'20", in NE1A,NW14 sec. 22, T. 55 N., R. 7 W., Ralls County, on left bank on downstream side of old bridge pier, 135ft (41 m) up.stream from highway bridge at Joanna, 2,500 ft (762 m) doWil'stream from Indian Creek, 2 miles (3.2 km) upstream from Lick Creek, 8 miles (12.9 km) southea.st of Monroe City, and at mile 63.5 (102.2 km).
D~ainage area.-2,230 mF (5,780 km2), approximately.
Gage.-Digital water-stage recorder. Datum of gage is 520.04 ft (158.508 m) above se~a level, datum of 192.9. Flood stage.-26 ft ( 7.9 m). Maxima.-March-May 1973: Discharge, 102,000 ft3/s (2,889 m 3/s) at approximately 1:00 p.m. on Apr. 22 [gage height, 39.1
ft (11.92 m) from high-water marks obtained by levels]. Discharge exceeded the 100-year flood. Octobe·r 1939 to Fetbruary 1973: Discharge, 89,500 ft3/s (2,535 m3/s) Oct. 14, 1969 [gage height, 37.40 ft (11.400 m), from
floodmarks]. Flood in June 1928 reached a stage of about 36ft (11 m), from information by local residents.
Mean discharge, in cubic feet per second, .1973
Day March April May Day March April May Day March April May
1 694 31,500 1,440 11 28,400 11,400 4,110 21 2,750 35,500 324 2 6,090 30,300 4,710 12 24,500 10,200 2,050 22 2,290 94,000 358 3 6,470 16,700 7,560 13 13,400 8,610 1,390 23 1,530 67,000 364 4 3,440 9,860 6,620 14 18,200 7,120 1,030 24 3,040 42,000 528 5 3,810 2,930 2,500 15 15,200 5,090 852 25 26,600 25,000 497 6 13,300 2,070 2,150 16 9,660 8,400 723 26 37,700 8,000 1,050 7 30,000 1,720 10,900 17 3,900 12,000 620 27 34,500 3,000 9,330 8 23,700 1,460 21,700 18 1,780 7,770 524 28 20,200 2,000 15,900 9 8,850 6,300 14,500 19 1,300 3,530 449 29 13,000 1,500 12,500
10 10,300 11,900 9,040 20 1,650 2,590 374 30 8,910 1,240 13,300 31 ---- 14,500 12,400
Monthly mean discharge, in cubic feet per second ----------------------------------------- 12,570 15,690 5,155 Runoff, in inches ___________________________________________ -------- __________________ 6.50 7.85 2.67
Gage height, in feet, and discharge, in cubic feet per second, at indicated time, .1973
Date Hour Gage Dis- Date Hour Gage Dis- Date Hour Gage Dis-height charge height charge height charge
Apr. 20 _ 12:00 m. 6.29 2,570 Apr. 21 _ 2:00p.m. 26.53 38,700 Apr. 22 _ 9:00a.m. 38.8 100,000 12:00 p.m. 6.18 2,450 4:00p.m. 27.51 41,200 1:00 p.m. 39.1 102,000
6:00p.m. 29.19 45,500 6:00p.m. 38.9 101,000 21 - 1:00 a.m. 9.55 6,680 8:00p.m. 30.97 50,800 12:00 p.m. 37.6 91,000
2:00a.m. 14.39 13,300 9:00p.m. 31.91 53,600 3:00a.m. 18.09 19,600 10:00 p.m. 32.77 57,800 23 - 6:00a.m. 36.0 79,500 4:00a.m. 20.37 24,100 11:00 p.m. 33.49 61,900 12:00m. 34.2 66,900 6:00a.m. 23.11 30,200 12:00 p.m. 34.19 66,800 5:00p.m. 32.50 56,400 8:00a.m. 24.92 34,700 12:00 p.m. 30.9 50,600
10:00 a.m. 25.68 36,600 22 - 1:00 a.m. 34.73 70,600 12:00 m. 26.05 37,500 6:00a.m. 37.7 91,800 24 - 9:00a.m. 28.41 43,200
Highest mean discharge, in cubic feet per second, for the indicated number of consecutive days Period 1 3 7 16 30
March-May 1973 ------------------ 94,000 1940-72 -------------------------- 66,200 Recurrence interval, in years, for
1973 flood volumes --------------- >100
67,700 51,500
100
SALT RIVER BASIN
39,200 33,500
100
(27) 05508000 Salt River near New London, Mo.
22,700 21,800
50
18,600 14,500
50
Location.-Lat 39°36'44', long 91 °24'30", in NE%,NW14 sec. 36, T. 56 N., R. 5 W., Ralls County, on left bank 180ft (55 m) upstream from up·stream bridge on dual U.S. Highway 61, 2 miles (3.2 km) north of New London, 8 miles (12.9 km) upstream from Spencer Creek and at mile 35.5 (57.1 km).
Drainage area.-2,480 mi2 (6,420 km2), approximately ..
Gage.-Digi.tal water-stage recorder. Datum of gage is 477.03 ft (145.39·9 m) above mean sea level, datum of 1929. Flood stage.-19 ft (5.8 m). Maxima.-March-May 1973: DiSIC'harge, 107,000 f~/s (3,030 rn3/s) at approximately 11:00 p.m. on Apr. 22 [gage height, 31.8
ft (9.69 m), from high-water mark in gage hou.se]. Discharge exceeded the 100-year flood. February 1922 to February 1973: Discharge, 79,500 ft3/s (2,251 m 3/s) Oct. 14, 1969 [gage height, 30.6:2 ft (9.333 m)]. Flood of July 14, 1858, reached a stage of 27.6 ft (8.41 m), present site and datum, based on comparison of JuDe 1928
flood crest at stone marker 1 mile ( 1.6 km) downstream from gage.
THE FLOODS 101
TABLE 12.-Station descriptions and discharge and suspended-sediment data-Continued
Mean discharge, in cubic feet per second, .1973
Day March April May Day March April May Day March April May
1 742 26,800 1,960 11 25,300 13,200 8,210 21 2,600 40,000 634 2 3,680 32,800 5,370 12 21,800 11,700 3,380 22 1,720 98,200 718 3 7,440 26,400 7,770 13 15,000 9,600 2,140 23 1,500 91,000 834 4 4,640 13,900 8,420 14 17,200 8,070 1,610 24 9,940 58,700 571 5 3,840 4,970 4,580 15 16,500 6,080 1,330 25 27,400 39,700 731 6 9,880 2,510 2,780 16 9,390 7,050 1,150 26 36,200 20,200 625 7 26,800 1,890 7,710 17 3,040 12,500 1,030 27 35,400 4,000 8,060 8 30,400 1,540 20,500 18 1,680 9,900 912 28 21,300 2,600 16,100 9 17,500 5,580 19,000 19 1,580 4,920 813 29 13,900 1,950 14,600
10 10,200 13,000 12,300 20 2,910 2,720 708 30 9,540 1,730 13,600 31 ---- 15,200 14,100
Monthly mean discharge, in cubic feet per second---------------------------------------- 13,040 19,110 5,879 Runoff, in inches-------------------------------------------------------------------- 6.06 8.60 2.73
Gage height, in feet, and dischm·ge, in cubic feet pe1· second, at indicated time, .1973
Hour Gage Dis- Date Hour Gage Dis- Date Hour Gage Dis-height charge height charge height charge
Date
Apr. 20 _ 6:00a.m. 6.56 3,000 Apr. 21 _ 12:00 m. 21.71 27,100 Apr. 24 12:00 m. 27.53 58,000 12:00 m. 6.16 2,600 1:00 p.m. 24.63 39,200 6:00p.m. 26.81 52,700 6:00p.m. 5.85 2,300 6:00p.m. 28.2 63,400 12:00 p.m. 26.12 47,800
11:00 p.m. 5.72 2,200 12:00 p.m. 29.9 78,800 12:00 p.m. 7.17 3,610 25 - 12:00 m. 24.72 39,600
21 -22 - 12:00 m. 31.4 101,000 12:00 p.m. 23.08 32,300
1:00 a.m. 11.47 8,660 11:00 p.m. 31.8 107,000 2:00a.m. 15.98 15,000 26 - 12:00 m. 19.06 20,100 3:00a.m. 18.00 18,000 23 - 11:00 a.m. 30.98 94,500 12:00 p.m. 11.84 9,180 4:00a.m. 19.25 20,500 12:00 p.m. 29.23 72,100 6:00a.m. 20.32 23,000 27 - 6:00a.m. 7.57 4,010 8:00a.m. 20.85 24,600 24 - 6:00a.m. 28.35 64,600 12:00 m. 6.92 3,360
11:00 a.m. 21.33 26,000 12:00 p.m. 6.88 3,320
Period Highest mean discharge, in cubic feet per second, for the indicated number of consecutive days 1
March-May 1973 ------------------ 98,000 1923-72 -------------------------- 62,600 Recurrence interval, in years, for
1973 flood volumes --------------- >100
3
82,600 50,500
>100
ILLINOIS RIVER BASIN
7
50,300 37,200
>100
(28) 05545100 Sugar Creek at Elkhorn, Wis.
15
28,000 23,500
>100
30
21,300 16,000
>100
Location.-Lat 42°41'05", long 88°30'50", in SWl-4 sec. 29, T. 3 N., R. 17 E., Walwo:vth County, at culvert on State Highway 11, 2 miles (3 km) northeast of Elkhorn.
Drainage a:vea.-6.68 mF (17.30 km2).
Gage.~Crest s·tage only. Bankfull stage.-12.0 ft (3.66 m). M.axima.-March-May 1973: Discharge, 900 ft3/s (2.5.5 m3/s) Apr. 21 [gage height, 17.47 ft (5.325 m)]. Di·SICh:arge exceeded
the 100-year flood. 1962 to February 1973: Discharge, 225 f~/s (6.37 m 3/s) Apr. 16, 1972 [gage height, 12.57 ft (3.832 m)}.
ILLINOIS RIVER BASIN (29) 05546500 Fox River at Wilmot, Wis.
Location.-Lat 42°30'40", long 88°10'45", in SW14, sec. 30, T. 1 N., R. .20 E., Kenosha County, on right bank 100ft (30 m) downstream from bridge on County Trunk G, 300ft (91 m) upstream from Wilmont Dam, 1.0 mi (1.6 km) north of Wisconsin-Illinois State lines, and 6.0 mi (9.6 km) upstream from Fox chain of lakes.
Drainage area.-868 mi2 (2,248 km2).
Gage.-Water-stage recorder and concrete dam. Datum of gage is 735.22 ft (224.095 m) above mean sea level. Prior to Sept. 1, 1956, nonrecording gage and concrete dam.
Bankfull stage.-8.00 ft (2.438 m). M.axima.-Marc·h-May 1973: Discharge, 6,560 ft3/s (185 m3/s) 3:00p.m., Apr. 23 [gage height, 7.65 ft (2.332 m) ]. Recurrence
interval of discharge is 35 years. 1940 to February 1973: Discharge, 7,520 f~ js (213 m 3 /s) Mar. 31, 1960 [gage height, 9.25 ft (.2.819 m) 1.
102 THE 1973 MISSISSIPPI RIVER BASIN FLOOD
TABLE 12.-Station descriptions and discha'rge and suspended-sediment data-Continued
Mean discharge, in cubic feet per second, 1973
Day March April May Day March April May Day March April May
1 688 1,040 3,530 11 1,900 1,310 2,430 21 1,630 2,280 1,250 2 973 1,280 3,810 12 1,880 1,380 2,190 22 1,520 4,530 1,240 3 1,310 1,380 3,920 13 1,840 1,520 2,020 23 1,410 6,430 1,270 4 1,350 1,400 3,670 14 1,850 1,720 1,880 24 1,310 6,140 1,290 5 1,390 1,420 3,170 15 2,130 2,030 1,770 25 1,250 5,510 1,270 6 1,550 1,400 2,770 16 2,320 2,350 1,670 26 1,190 4,960 1,310 7 1,700 1,340 2,500 17 2,300 2,500 1,570 27 1,130 4,570 1,320 8 1,900 1,260 2,410 18 2,170 2,440 1,450 28 1,040 4,170 1,510 9 2,010 1,250 2,540 19 2,000 2,370 1,320 29 989 3,750 1,800
10 1,960 1,260 2,620 20 1,790 2,150 1,300 30 934 3,500 1,850 31 966 1,760
Monthly mean discharge, in cubic feet per second --------------- ------------------------- 1,561 2,621 2,078 Runoff, in inches ----- _______________________________________________________________ 2.07 3.37 2.76
Period Highest mean discharge, in cubic feet per second, for the indicated number of consecutive days 1 3 7 16 30
March-May 1973 ------------------1940-71 -------------------------Recum-ence interval, in years, for
1973 flood volumes ---------------
6,430 7,100
35
6,030 6,790
50
5,190 6,100
35
MISSISSIPPI RIVER MAIN STEM (30) 05587500 Mississippi River at Alton, Ill.
4,290 4,420
40
3,300 3,100
50
Location.-Lat 38°53'06", long 90°10'51", in NE% sec. 14, T. 5 N., R. 10 W., Madison County, near left bank in downstream end of illftermediate lock wall of lock .and dam 26 at Aiton, 300 ft (91 m) downstream from Mi.ssouri & Illinois Bridge & Belt Railroad bridge, 7.7 miles (12.4 km) upstream from Missouri River, and at mile 202.7 (326.1 km) uptstream from Ohio River.
Drainage area.-171,500 mi2 ( 444,200 km2
), approximately. Gage.-Digital water-stage recorder. Digital water-stage recorder at auxiliary gage (Hartford), 5.9 miles (9.5 km.) down
stream. Datum of both gages is at mean sea level (levels by Corps of Engineer:s). Flood sta.ge.-421.0 ft (128.3 m). Flood stage. was exceeded for 79 consecutive days (Mar. 12 to May 21). Previous record was
32 days (June 9 to July 11, 1947). Maxima.-March-June 1973: Discharge, 535,000 ft3/s (15,150 m3/s) 3:00 p.m., Apr. 29, including undetermined ·amount of
overflow :f.rom Missouri River; gage height, 432.15 ft (131.719 m) 12:00 m., Apr. 28. Recurrence interval of discharge is 100 years (based on figure 52).
October 1927 to February 1973: Discharge, 437,000 ft3/s (12,380 m3/s) May 24, 1943 [gage height, 42.9.91 ft (131.037 m) ], includes 90,000 ffl/s (2,549 m3 /s) floodwater overflow from Missouri River.
Flood in June 1844 reached a stage of 432.10 ft (131.704 m), present datum. Remarks.-Natural flow of stream affected by many reservoirs and navigation dams in upper Mississippi River basin.
Water temperature, stage, water discharge, and suspended-sediment data for given time
Water Suspended sediment Date Hour 1 temperature Stage Discharge Concentration Discharge Percent
(oC) (ft) (1,000 ft3js) (mg/l) (1,000 t/day) sand
April 5 ---------------- 4:45p.m. 11.5 429.2 400 213 230 6 6 ---------------- 7:10p.m. 11.0 429.0 409 156 172 8 7 ---------------- 9:10a.m. 10.0 428.6 399 133 143 8 8 ---------------- 9:30a.m. 9.4 428.0 384 95 98 10 9 ---------------- 2:30p.m. 7.5 427.4 385 97 101 13
10 ---------------- 10:00 a.m. 5.0 426.6 376 154 156 9 11 ---------------- 11:20 a.m. 8.5 425.7 382 115 119 11
1 Time shown is for temperature and suspended-sediment sample.
THE FLOODS 103
TABLE 12.-Station desc'riptions and disch,ayge and suspended-sediment data-Continued
Mean gage height, in feet, and discharge, in cubic feet per second, .1973
March April May June Day Stage Discharge Stage Discharge Stage Discharge Stage Discharge
1 -------------- 407.80 126,000 428.18 394,000 430.21 518,000 420.98 319,000 2 -------------- 407.50 124,000 428.43 399,000 429.18 502,000 420.75 321,000 3 -------------- 407.28 121,000 428.73 404,000 427.95 475,000 420.18 317,000 4 -------------- 407.60 123,000 429.00 393,000 427.19 455,000 419.07 305,000 5 -------------- 408.94 142,000 429.16 400,000 426.91 447,000 418.52 294,000 6 -------------- 410.39 158,000 429.00 409,000 426.83 443,000 418.41 288,000 7 -------------- 414.33 163,000 428.63 399,000 426.91 443,000 418.40 284,000 8 -------------- 417.44 217,000 427.96 384,000 427.06 438,000 418.24 283,000 9 -------------- 418.85 249,000 427.38 385,000 427.11 428,000 417.80 282,000
10 -------------- 419.63 269,000 426.60 376,000 427.19 420,000 417.33 280,000 11 -------------- 420.80 262,000 425.69 382,000 427.26 410,000 416.93 278,000 12 -------------- 421.94 275,000 424.98 384,000 427.33 404,000 416.57 275,000 13 -------------- 422.70 288,000 424.31 374,000 427.26 400,000 416.07 270,000 14 -------------- 423.58 288,000 423.78 363,000 427.05 392,000 415.46 263,000 15 -------------- 424.40 307,000 423.48 347,000 426.61 387,000 414.83 254,000 16 -------------- 425.00 315,000 423.56 346,000 425.85 390,000 414.51 248,000 17 -------------- 425.33 334,000 423.59 336,000 424.75 389,000 414.22 242,000 18 -------------- 425.15 352,000 423.61 326,000 423.60 376,000 413.52 233,000 19 -------------- 424.52 342,000 423.68 321,000 422.80 368,000 413.68 237,000 20 -------------- 423.95 327,000 423.86 318,000 422.15 363,000 415.52 257,000 21 -------------- 423~7 325,000 424.02 309,000 421.51 358,000 416.40 271,000 22 -------------- 422.67 322,000 424.94 328,000 420.90 348,000 415.91 272,000 23 -------------- 422.25 313,000 426.48 353,000 420.69 344,000 415.14 264,000 24 -------------- 422.05 322,000 428.16 373,000 420.57 341,000 414.09 252,000 25 -------------- 421.92 323,000 429.48 419,000 420.09 333,000 413.03 240,000 26 -------------- 422.78 326,000 430.62 464,000 419.47 322,000 412.02 228,000 27 -------------- 424.38 358,000 431.57 504,000 418.92 310,000 411.52 220,000 28 -------------- 425.90 357,000 432.11 523,000 418.58 299,000 411.37 216,000 29 -------------- 426.90 373,000 431.98 527,000 418.99 299,000 410.89 208,000 30 -------------- 427.46 380,000 431.38 526,000 419.66 307,000 410.03 195,000 31 -------------- 427.83 392,000 420.22 314,000 Monthly mean discharge, in
cubic feet per second ------- 276,500 392,200 387,800 263,200 Runoff in inches------------- 1.86 2.55 2.61 1.71 Runoff in thousands of acre-feet 17,000 23,340 23,850 15,660
Period Highest mean discharge, in cubic feet per second, for the indicated number of consecutive days 1 '3 7 16 30
March-June 1973 -----------------1934-72 -------------------------Recurrence interval, in years, or
1973 flood volumes ---------------
527,000 434,000
>100
525,000 416,000
>100
CHARITON RIVER BASIN
511,000 387,000
>100
(31) 06903400 Chariton River near Chariton, Iowa
474,000 365,000
>100
428,000 359,000
>100
Location.-Lat 40°57'12", long 93°15'37", in SW1,4NE1,4 sec. 15, T. 71 N., R. 21 W., Lucas County, on right bank 15· ft (4.6 m) downstream from bridge on County Highway S43, 0.4 mile (0.6 km) downstream from Wolf Creek, and 5.0 miles (8.0 km) southeast of Chariton.
Drainage area.-182 mi2 (471 km2).
Gage.-Water-stage recorder. Datum of gage is 917.96 ft (279.79 m) above mean sea level (levels by U.S. Weather Bureau from a Corp of Engineers bench mark).
Flood stage.-18 ft (5.5 m). Maxima.-March-May 1973: Discharge, 2, 7 40 ffl Is ( 78 m3 Is) 6:00 p.m., Apr 16 [gage heigih:t, 18.02 ft ( 5.4·9 m)]. Recurrence
interval of discharge is 2 years. October 1965 to February 1973: Discharge, 6,3·20 ft3/s (179 m3/s) Aug. 8, 1970 [gage height, 20.15 ft (6.14 m)]. Flood in March 1960 reached a stage of about 23ft (7.0 m) [discharge, about 15,000 ft3/s (425 m3/s·)]. March-May 1973: Sediment concentration, maximum daily, 2,800 mg/l May .27. Sediment discharge, maximum daily, 10,400 tons (9,430 t) May 27. Octobe·r 1969 to February 1973: Sediment concentration, maximum daily, 3,780 mg/l May 19, 1971. Sediment discharge, maximum daily, 21,600 tons (19,600 t) Aug. 8, 1970.
Remarks.-S.tation data included in this report primarily for sediment analysis.
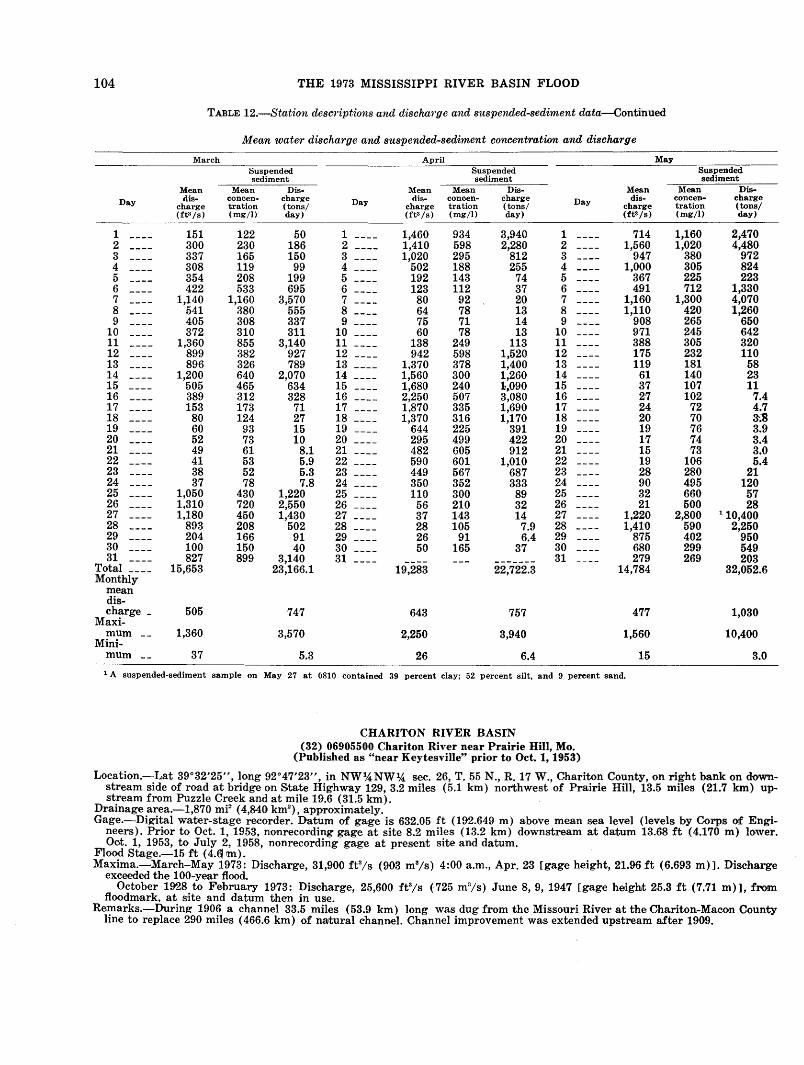
104 THE 1973 MISSISSIPPI RIVER BASIN FLOOD
TABLE 12.-Station desc1'iptions and discharge and suspended-sediment data-Continued
Mean water discharge and suspended-sediment concentration and discharge
March April May Suspended Suspended sediment sediment
Mean Mean Dis- Mean Mean Dis- Mean Day dis- concen- charge Day dis- concen- charge Day dis-
charge tration (tons/ charge tration (tons/ charge (ft3/s) (mg/1) day) (ft3/s) (mg/1) day) (ft3js)
1 151 122 50 1 1,460 934 3,940 1 714 2 300 230 186 2 1,410 598 2,280 2 1,560 3 337 165 150 3 1,020 295 812 3 947 4 308 119 99 4 502 188 255 4 1,000 5 354 208 199 5 192 143 74 5 367 6 422 533 695 6 123 112 37 6 491 7 1,140 1,160 3,570 7 80 92 20 7 1,160 8 541 380 555 8 64 78 13 8 1,110 9 405 308 337 9 75 71 14 9 908
10 372 310 311 10 60 78 13 10 971 11 1,360 855 3,140 11 138 249 113 11 388 12 899 382 927 12 942 598 1,520 12 175 13 896 326 789 13 1,370 378 1,400 13 119 14 1,200 640 2,070 14 1,560 300 1,260 14 61 15 505 465 634 15 1,680 240 1.090 15 37 16 389 312 328 16 2,250 507 3,080 16 27 17 153 173 71 17 1,870 335 1,690 17 24 18 80 124 27 18 1~370 316 1,170 18 20 19 60 93 15 19 644 225 391 19 19 20 52 73 10 20 295 499 422 20 17 21 49 61 8.1 21 482 605 912 21 15 22 41 53 5.9 22 590 601 1,010 22 19 23 38 52 5.3 23 449 567 687 23 28 24 37 78 7.8 24 350 352 333 24 90 25 1,050 430 1,220 25 110 300 89 25 32 26 1,310 720 2,550 26 56 210 32 26 21 27 1,180 450 1,430 27 37 143 14 27 1,220 28 893 208 502 28 28 105 7.9 28 1,41'0 29 204 166 91 29 26 91 6.4 29 875 30 100 150 40 30 50 165 37 30 680 31 827 899 3,140 31 31 279
Total ____ 15,653 23,166.1 19,283 22,722.3 14,784 Monthly
mean dis-charge _
Maxi-505 747 643 757 477
mum Mini-
1,360 3,570 2,250 3,940 1,560
mum 37 5.3 26 6.4 15 1 A suspended-sediment sample on May 27 at 0810 contained 39 percent clay; 52 percent silt, and 9 percent sand.
CHARITON RIVER BASfN (32) 06905500 Chariton River near Prairie Hill, Mo.
(Published as "near Keytesville" prior to Oct. 1, 1953)
Suspended sediment
Mean Dis-concen- charge tration (tons/ (mg/1) day)
1,160 2,470 1,020 4,480
380 972 305 824 225 223 712 1,330
1,300 4,070 420 1,260 265 650 245 642 305 320 232 110 181 58 140 23 107 11 102 7.4
72 4.7 70 3-.~ 76 3.9 74 3.4 73 3.0
106 5.4 280 21 495 120 660 57 500 28
2,800 1 10,400 590 2,250 402 950 299 549 269 203
32,052.6
1,030
10,400
3.0
Location.-Lat 39°32'25", long 92°47'23", in NW%NW14 sec. 26, T. 55 N., R. 17 W., Chariton County, on right bank on downstream side of road at bridge on State Highway 129, 3.2 miles (5.1 km) northwest of Prairie Hill, 13.5 miles (21.7 km) up.stream from Puzzle Creek and at mile 19.6 (31.5 km).
Drainage area.-1,870 mi2 ( 4,840 km2
), approximately. Gage.-Digital water-stage recorder. Datum of gage is 632.05 ft (192.649 m) above me:an sea level (levels by Corps of Engi
neers). Prior to Oct. 1, 1953, nonrecording gage at site 8.2 miles (13.2 km) downstream at datum 13.68 ft (4.170 m) lower. Oct. 1, 1953, to July 2, 1958, nonrecording gage at present site and datum.
Flood Stage.-15 ft (4.tl rm). Maxima.-March-May 1973: Discharge, 31,900 ft3/s (903 m3/s) 4:00a.m., Apr. 23 [gage height, 21.96 ft (6.693 m) ]. Discharge
exceeded the 100-year flood. October 19'28 to February 1973: Discharge, 25,600 fe;s (725 m3/s) June 8, 9, 1947 [gage height 25.3 ft (7.71 m)], from
floodmark. at site and datum then in use. Remarks.-During 1906 a channel 33.5 miles (53.9 km) long was dug from the Missouri Rive·r at the· Chariton-Macon County
line to rep·lace 290 miles ( 466.6 km) of natural channel. Channel improvement was extended upstream after 1909.
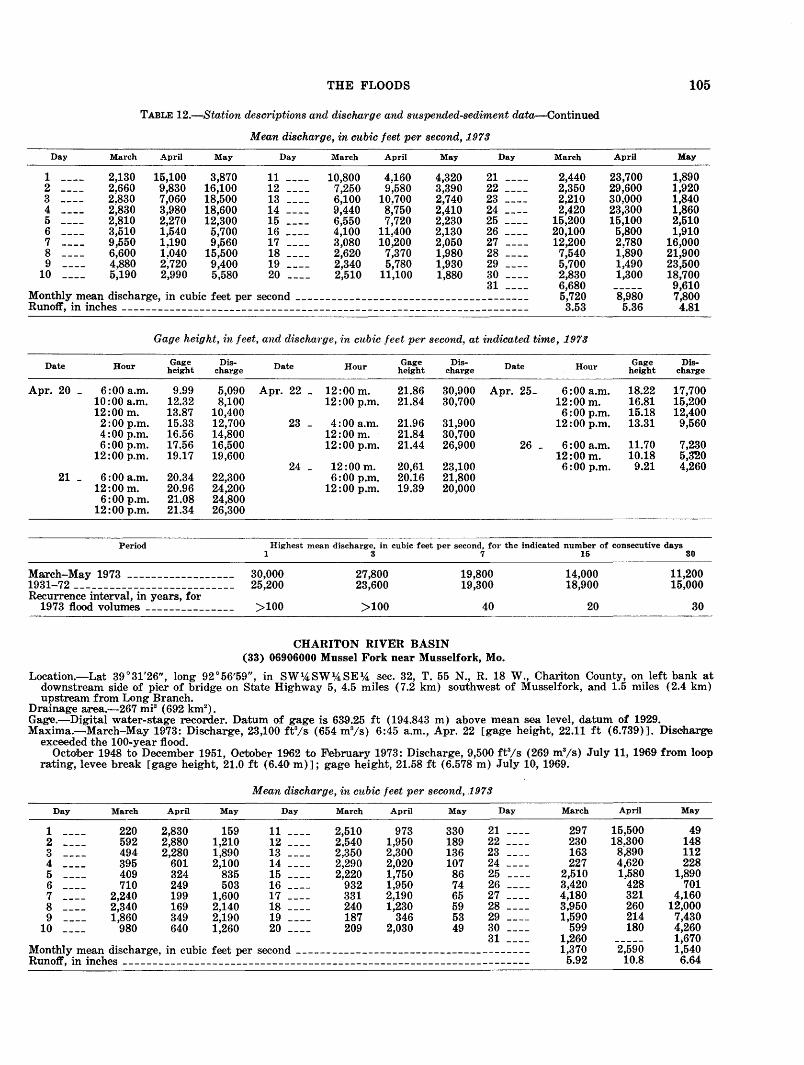
THE FLOODS 105
TABLE 12.-Station descriptions and discharge and suspended-sediment data-Continued
Mean discharge, in cubic feet per second, .1973
Day March April May Day March April May Day March April May
1 2,130 15,100 3,870 11 10,800 4,160 4,320 21 2,440 23,700 1,890 2 2.660 9,830 16,100 12 7,250 9,580 3,390 22 2,350 29.600 1,920 3 2~830 7,060 18,500 13 6,100 10.700 2,740 23 2,210 so:ooo 1,840 4 2~830 3,980 18,600 14 9,440 8;750 2,410 24 2,420 23:300 1,860 5 2,810 2.270 12,300 15 6,550 7.720 2,230 25 15,200 15,100 2,510 6 3,510 t540 5,700 16 4,100 11:400 2,130 26 20,100 5,800 1,910 7 9,550 t190 9,560 17 3,080 10~200 2,050 27 12,200 2.780 16,000 8 6,600 1~040 15,500 18 2,620 7,370 1,980 28 7,540 1:890 21,900 9 4,880 2;720 9,400 19 2,340 5,780 1,930 29 5,700 1,490 23,500
10 5;190 2,990 5,580 20 2,510 11,100 1,880 30 2,830 1,300 18,700 31 ---- 6,680 9,610
Monthly mean discharge, in cubic feet per second --------------------------------------- 5,720 8,980 7,800 Runoff, in inches _______________________________________________________________ ----- 3.53 5.36 4.81
Gage height, in feet, and discha.rge, in cubic feet per second~ at indicated time, .1973
Date Date Hour Gage Dis-height charge Hour Gage Dis-
height eharge Date Hour Gage Dis-height charge
Apr. 20 _ 6:00a.m. 9.99 5,090 Apr. 22 _ 12:00 m. 21.86 30,900 Apr. 25- 6:00a.m. 18.22 17,700 10:00 a.m. 12.32 8,100 12:00 p.m. 21.84 30,700 12:00 m. 16.81 15,200 12:00 m. 13.87 10,400 6:00p.m. 15.18 12,400
2:00p.m. 15.33 12,700 23 - 4:00a.m. 21.96 31,900 12:00 p.m. 13.31 9,560 4:00p.m. 16.56 14,800 12:00 m. 21.84 30,700
6:00a.m. 11.70 7,230 12:00m. 10.18 5,~0
6:00p.m. 17.56 16,500 12:00 p.m. 19.17 19,600
12:00 p.m. 21.44 26,900 26 -
24 - 12:00 m. 20,61 23,100 6:00p.m. 9.21 4,260 21 - 6:00a.m. 20.34 22,300 6:00p.m. 20.16 21,800
12:00m. 20.96 24,200 12:00 p.m. 19.39 20,000 6:00p.m. 21.08 24,800
12:00 p.m. 21.34 26,300
Period Highest mean discharge, in cubic feet per second, for the indicated number of consecutive days 1 3 7 15 30
March-May 1973 ------------------ 30,000 1931-72 --------------------------- 25,200 ~urrenceinterval, in years, for
1973 flood volumes --------------- >100
27,800 23,600
>100
CHARITON RIVER BASIN
19,800 19,300
40
(33) 06906000 Mussel Fork near Musselfork, Mo.
14,000 18,900
20
11,200 15,000
30
Location.-Lat 39°31'26", long 92°56'59", in SW1,4SW 1,4SE%, sec. 32, T. 55 N., R. 18 W., Chariton County, on left bank at downstream side of pier of bridge on State Highway 5, 4.5 miles (7.2 km) southwest of Musselfork, and 1.5 miles (2.4 km) upstream from Long Branch.
Drainage area.-267 mi2 (692 km2).
Gage.-Digital water-stage recorder. Datum of gage is 639.25 ft (194.843 m) above mean sea level, datum of 1929. Maxima.-March-M·ay 1973: Discharge, 23,100 fe;s (654 m3/s) 6:45 a.m., Apr. 22 [gage height, 22.11 ft (6.739)]. Discharge
exceeded the 100-year flood. OctO!ber 1948 to December 1951, October 1962 to ~bruary 1973: Discharge, 9,500 ffl/s (269 rn3/s) July 11, 1969 from loop
rating, levee break [gage height, 21.0 ft (6.40 m)]; gage height, 21.58 :ft (6.578 m) July 10, 1969.
Mean discharge, in cubic feet per second, .1973
Day March April May Day March April May Day March April May
1 220 2,830 159 11 2,510 973 330 21 297 15,500 49 2 592 2,880 1,210 12 2,540 1,950 189 22 230 18.300 148 3 494 2,280 1,890 13 2,350 2,300 136 23 163 8:890 112 4 395 601 2,100 14 2,290 2;020 107 24 227 4,620 228 5 409 324 835 15 2,220 1,750 86 25 2,510 1~580 1,890 6 710 249 503 16 932 1,950 74 26 3,420 428 701 7 2,240 199 1,600 17 331 2,190 65 27 4,180 321 4,160 8 2,340 169 2,140 18 240 1,230 59 28 3,950 260 12,000 9 1,860 349 2,190 19 187 346 53 29 1,590 214 7,430
10 980 640 1,260 20 209 2,030 49 30 599 180 4,260 31 1,260 1,670
Monthly mean discharge, in cubic feet per second --------------------------------------- 1,370 2,590 1,540 Runoff, in inches -------------------------------------------------------------------- 5.92 10.8 6.64
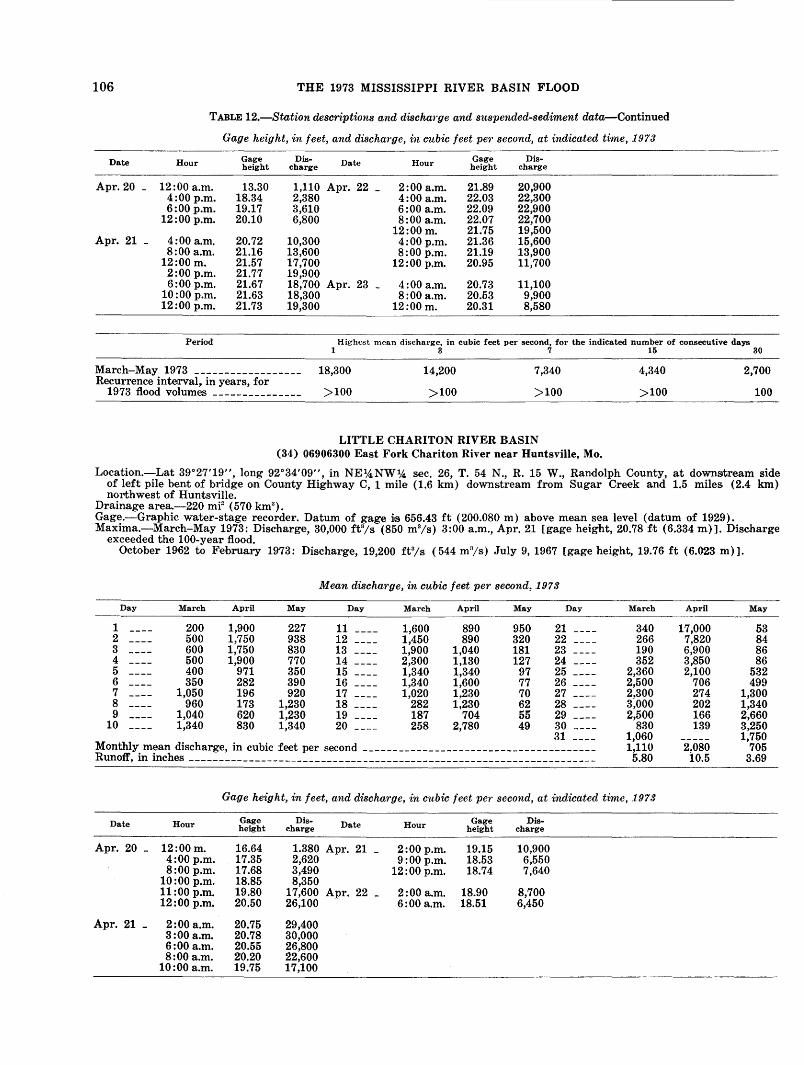
106
Date
Apr. 20 _
Apr. 21 _
THE 1973 MISSISSIPPI RIVER BASIN FLOOD
TABLE 12.-Station descriptions and dischm·ge and suspended-sediment data-Continued
Gage height, in feet, and discharge, in cubic feet pe1· second, at indicated time, .1973
Hour Gage height
Dis- Date Hour Gage Dis-charge height charge
12:00 a.m. 13.30 1,110 Apr. 22 _ 2:00a.m. 21.89 20,900 4:00p.m. 18.34 2,380 4:00a.m. 22.03 22,300 6:00p.m. 19.17 3,610 6:00a.m. 22.09 22,900
12:00 p.m. 20.10 6,800 8:00a.m. 22.07 22,700 12:00 m. 21.75 19,500
4:00a.m. 20.72 8:00a.m. 21.16
12:00 m. 21.57 2:00p.m. 21.77
10,300 4:00p.m. 21.36 15,600 13,600 8:00p.m. 21.19 13,900 17,700 12:00 p.m. 20.95 11,700 19,900
6:00p.m. 21.67 10:00 p.m. 21.63
18,700 Apr. 23 - 4:00a.m. 20.73 11,100 18,300 8:00a.m. 20.53 9,900
12:00 p.m. 21.73 19,300 12:00 m. 20.31 8,580
Period Highest mean discharge, in cubic feet per second, for the indicated number of consecutive days 1 3 7 15 30
March-May 1973 ------------------ 18,300 Recurrence interval, in years, for
1973 flood volumes --------------- >100
14,200
>100
7,340
>100
LITTLE CHARITON RIVER BASIN (34) 06906300 East Fork Chariton River near Huntsville, Mo.
4,340
>100
2,700
100
Location.-Lat 39°27'19", long 92°34'09", in NE 1,4NW% sec. 26, T. 54 N., R. 15 W., Randolph County, at downstream side of left pile be.nt of bridge on County Highway C, 1 mile (1.6 km) downstream from Sugar Greek and 1.5 miles (2.4 km) northwest of Huntsville.
Drainage area.-220 mi2 (570 km2).
Gage.-Graphic water-stage recorder. Datum of gage i:s 6·56.43 ft (200.080 m) above mean sea level (datum of 192,9). Maxima.-Ma.rch-May 1973: Discharge, 30,000 ft3/s (850 m3/s) 3:00a.m., Apr. 21 [gage height, 20.78 ft (6.334 m) ]. Discharge
exceeded the 100-year flood. October 1962 to February 1973: Discharge, 19,200 ft3/s ( 544 m:1/s) July 9, 1967 [gage height, 19.76 ft (6.023 m) ].
Mean discharge, in cubic feet per second, .1973
Day March April May Day March April May Day March April May
1 200 1,900 227 11 1,600 890 950 21 340 17,000 53 2 500 1.750 938 12 1,450 890 320 22 266 7,820 84 3 600 1;750 830 13 1,900 1,040 181 23 190 6,900 86 4 500 1,900 770 14 2,300 1,130 127 24 352 3,850 86 5 400 971 350 15 1,340 1,340 97 25 2,360 2,100 532 6 350 282 390 16 1,340 1,600 77 26 2,500 706 499 7 1,050 196 920 17 1;020 1.230 70 27 2.300 274 1,300 8 960 173 1,230 18 282 1;230 62 28 a;ooo 202 1,340 9 1,040 620 1,230 19 187 704 55 29 2,500 166 2,660
10 1,340 830 1,340 20 258 2,780 49 30 830 139 3,250 31 ---- 1,060 1,750
Monthly mean discharge, in cubic feet per second --------------------------------------- 1,110 2.080 705 Runoff, in inches --------- _____________________ -------- ______________________________ 5.80 i0.5 3.69
Gage height, in feet, and discharge, in cubic feet per second, at indicated time, .1973
Date Hour Gage Dis- Date Hour Gage Dis-height charge height charge
Apr. 20 _ 12:00m. 16.64 1.380 Apr. 21 _ 2:00p.m. 19.15 10,900 4:00p.m. 17.35 2,620 9:00p.m. 18.53 6,550 8:00p.m. 17.68 3,490 12:00 p.m. 18.74 7,640
10:00 p.m. 18.85 8,350 11:00 p.m. 19.80 17,600 Apr. 22 _ 2:00a.m. 18.90 8,700 12:00 p.m. 20.50 26,100 6:00a.m. 18.51 6,450
Apr. 21 _ 2 00 a.m. 20.75 29,400 3 OOa.m. 20.78 30,000 6 00 a.m. 20.55 26,800 8 OOa.m. 20.20 22,600
10 00 a.m. 19.75 17,100
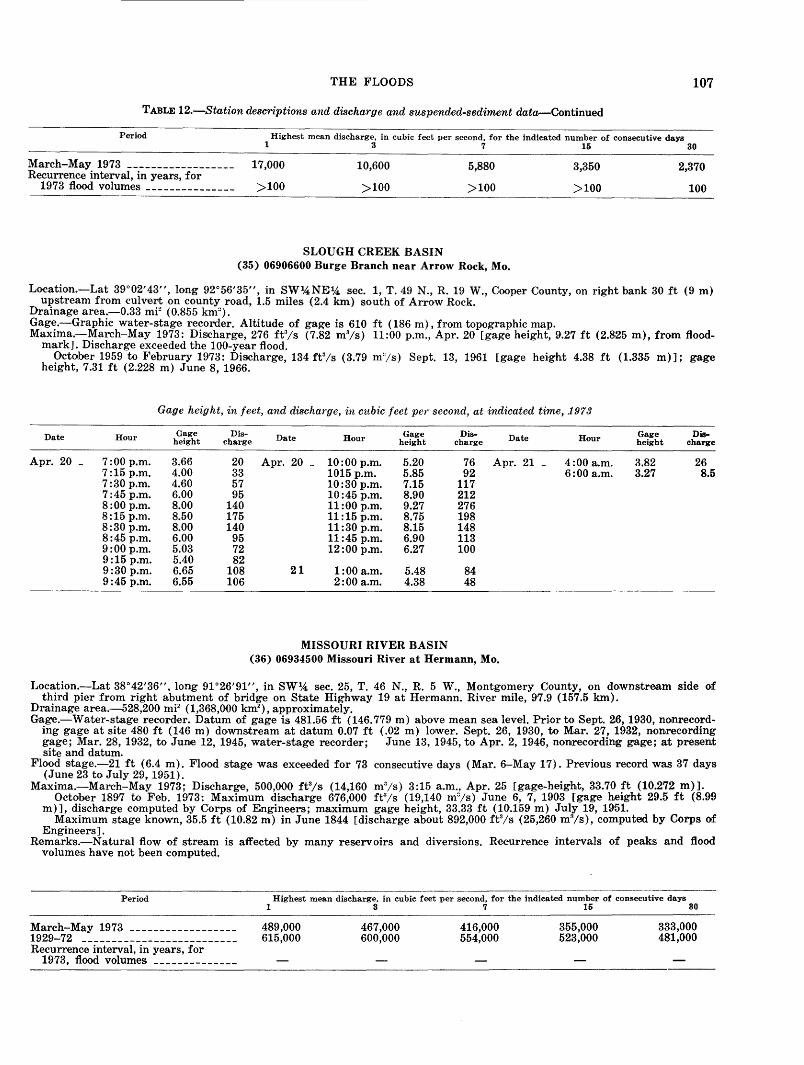
THE FLOODS 107
TABLE 12.-Station descriptions and discharge and suspended-sediment data-Continued
Period Highest mean discharge, in cubic feet per second, for the indicated number of consecutive days 1 3 7 15 30
]darch-]day 1973 ------------------ 17,000 Recurrence interval, in years, for
1973 flood volumes --------------- >100
10,600
>100
SLOUGH CREEK BASIN
5,880
>100
(35) 06906600 Burge Branch near Arrow Rock, Mo.
3,350
>100
2,370
100
Location.-Lat 39°02'43", long 92°56'35", in SW14NE14 sec. 1, T. 49 N., R. 19 W., Cooper County, on right bank 30ft (9 m) upstream from culvert on county road, 1.5 miles (2.4 km) south of Arrow Rock.
Drainage area.-0.33 mF (0.855 km~). Gage.-Graphic water-stage recorder. Altitude of gage is 610 ft ( 186 m), from topographic map. ]daxima.-March-May 1973: DiSJCharge, 276 ft3/s (7.82 m3/s) 11:00 p.m., Apr. 20 [gage height, 9.27 ft (2.825 m), from flood
mark]. Discharge exceeded the 100-year flood. October 1959 to February 1973: Discharge, 134 ft3/s (3.79 m:/s) Se·pt. 13, 1961 [gage height 4.38 ft (1.335 m)]; gage
height, 7.31 ft (2.228 m) June 8, 1966.
Gage height, in feet, and discharge, in cubic feet per second, at indicated time, .1973
Date Hour Gage Dis- Date Hour Gage Dis- Date Hour Gage Dis-height charge height charge height charge
Apr. 20 _ 7:00p.m. 3.66 20 Apr. 20 _ 10:00 p.m. 5.20 76 Apr. 21 4:00a.m. 3.82 26 7:15p.m. 4.00 33 1015 p.m. 5.85 92 6:00a.m. 3.27 8.5 7:30p.m. 4.60 57 10:30 p.m. 7.15 117 7:45p.m. 6.00 95 10:45 p.m. 8.90 212 8:00p.m. 8.00 140 11:00 p.m. 9.27 276 8:15p.m. 8.50 175 11:15 p.m. 8.75 198 8:30p.m. 8.00 140 11:30 p.m. 8.15 148 8:45p.m. 6.00 95 11:45 p.m. 6.90 113 9:00p.m. 5.03 72 12:00 p.m. 6.27 100 9:15p.m. 5.40 82 9:30p.m. 6.65 108 21 1:00 a.m. 5.48 84 9:45p.m. 6.55 106 2:00a.m. 4.38 48
MISSOURI RIVER BASIN (36) 06934500 Missouri River at Hermann, Mo.
Location.-Lat 38°42'36", long 9P26'91", in SW14 sec. 25, T. 46 N., R. 5 W., Montgomery County, on downstream side of third pier from right abutment of bridge on State Highway 19 at Hermann. Rive.r mile, 9·7.9 (157.5 km).
Drainage area.-528,200 mi2 (1,368,000 km~), approximately. Gage.-Water-stage recorder. Datum of gage is 481.56 ft (146. 779 m) above mean sea level. Prior to Sept .. 26, 1930, nonrecord
ing gage at site 480ft (146m) downstream at datum 0.07 ft (.02 m) lower. Sept. 2.6, 1930, to Mar. 27, 1932, no.nrecording gage; Mar. 28, 1932, to June 12, 1945, water-stage recorder; June 13, 1945, to Apr. 2, 1946, nonrecording gage; at present site and datum.
Flood stage.-21 ft (6.4 m). Flood stage was exceeded for 73 consecutive days (Mar. 6-May 17). Previous record wa:s 37 days (June 23 to July 29, 1951).
Maxima.-March-May 1973; Discharge, 500,000 ft3/s (14,160 m3/s) 3:15 a.m., Apr. 25 [gage-he·ight, 33.70 ft (10.272 m)]. October 1897 to Feb. 1973: Maximum discharge 676,000 ft3/s (19,140 m3/s) June 6, 7, 1903 [gage height 29.5 ft (8.99
m)], discharge computed by Corps of E;ngineers; maximum gage height, 33.33 ft (10.159 m) July 19, 1951. Maximum stage known, 35.5 ft (10.82 m) in June 1844 [discharge about 892,000 fe;s (25,260 m3/s), computed by Corps of
Engineers] . Remarks.-N atural flow of stream is affected by many reservoirs and diversions. Recurrence intervals of peaks and flood
volumes have not been computed.
Period
March-May 1973 ------------------1929-72 --------------------------Recurrence interval, in years, for
1973, flood volumes --------------
Highest mean discharge, in cubic feet per second, for the indicated number of consecutive days 1 3 7 15 30
489,000 615,000
467,000 600,000
416,000 554,000
355,000 523,000
333,000 481,000
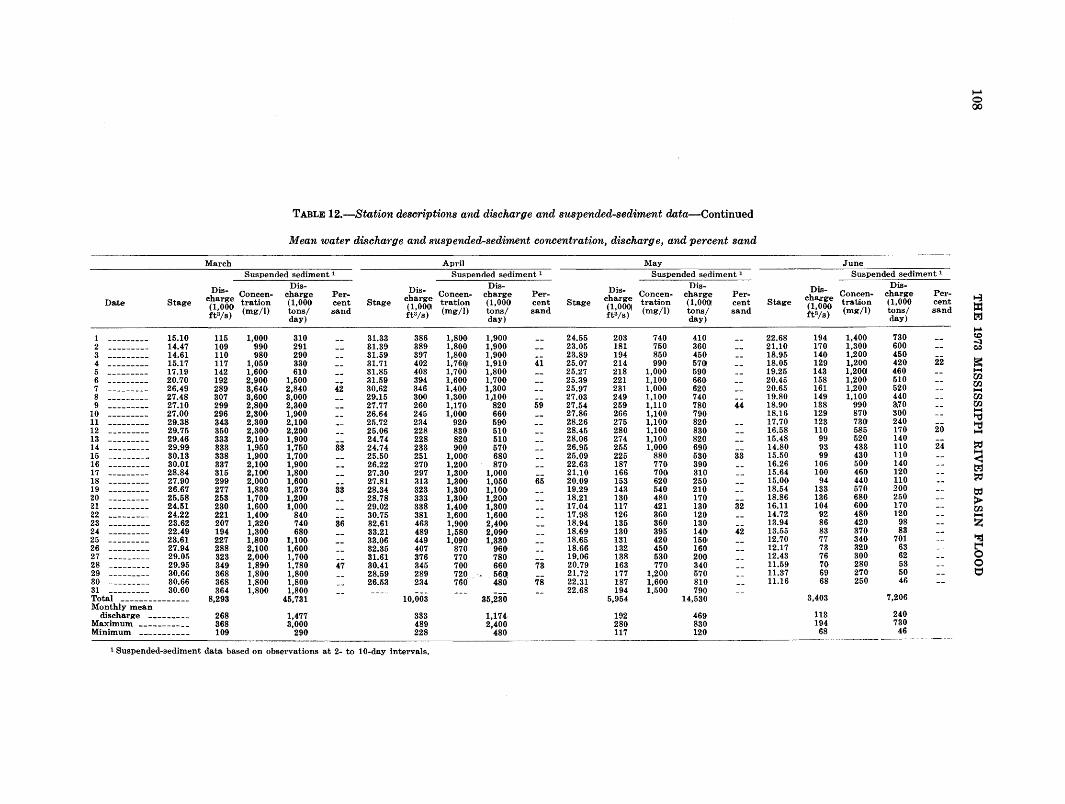
TABLE 12.-Station descriptions and discharge and suspended-sediment data-Continued
Mean water discha1·ge and suspended-sediment concentration, discharge, and percent sand
March April May Suspended sediment 1 Suspended sediment 1 Suspended sediment 1
Dis- C Dis-
Dis- C Dis-
Dis- Concen-Dis-
charge on':en- charge Per- charge onc.en- charge Per- charge . charge Per-Date Stage (1 OOO tration (1,000 cent Stage (1 OOO tratmn (1,000 cent Stage (1 0001 tratmn (1,0001 cent
ft3/s) (mg/1) tons/ sand ft:i/s) (mg/l) tons/ sand na;s) (mg/1) tons/ sand day) day) day)
1 --------- 15.10 115 1,000 310 -- 31.33 386 1,800 1,900 -- 24.55 203 740 410 --2 --------- 14.47 109 990 291 -- 31.39 389 1,800 1,900 -- 23.05 181 750 360 --3 --------- 14.61 110 980 290 -- 31.59 397 1,800 1,900 23.89 194 850 450 --4 --------- 15.17 117 1,050 330 -- 31.71 402 1,760! 1,910 41 25.07 214 990 570, --5 --------- 17.19 142 1,600 610 -- 31.85 403 1,700 1,800 -- 25.27 218 1,000 590 --6 --------- 20.70 192 2,900 1,500 31.59 394 1,600 1,700 -- 25.39 221 1,100 660 --7 --------- 26.49 289 3,640 2,840 42 30.62 346 1,400 1,300 -- 25.97 231 1,000 620 --8 --------- 27.48 307 3,600 3,000 -- 29.15 300 1,300 1,100 27.03 249 1,100 740 9 --------- 27.10 299 2,800 2,300 -- 27.77 260 1,170 820 59 27.54 259 1,110 780 44
10 --------- 27.00 296 2,300 1,900 -- 26.64 245 1,000 660 -- 27.86 266 1,100 790 11 --·------- 29.38 343 2,300 2,100 -- 25.72 234 920 590 -- 28.26 275 1,100 820 --12 --------- 29.75 350 2,300 2,200 -- 25.06 228 830 510 -- 28.45 280 1,100 830 --13 --------- 29.46 333 2,100· 1,900 24.74 228 820 510 -- 28.06 274 1,100 820 --14 --------- 29.99 333 1,950 1,750 33 24.74 233 900 570 -- 26.95 255 1,000 690 15 -----·---- 30.13 338 1,900 1,700 -- 25.50 251 1,0001 680 -- 25.09 225 880 530 33 16 --------- 30.01 337 2,100 1,900 -- 26.22 270 1,200 870 -- 22.63 187 770 390 --17 --------- 28.84 315 2,100 1,800 -- 27.30 297 1,300 1,000 21.10 166 700 310 --18 --------·- 27.90 299 2,000 1,600 27.81 313 1,300 1,050 65 20.09 153 620 250 --19 --------- 26.67 277 1,830 1,370 33 28.34 323 1,300 1,100 -- 19.29 143 540 210 --20 --------- 25.58 253 1,700 1,200 -- 28.78 333 1,300 1,200 -- 18.21 130 480 170 21 --·------- 24.51 230 1,600 1,000 -- 29.02 338 1,400 1,300 -- 17.04 117 421 130 32 22 --------- 24.22 221 1,400 840 30.75 381 1,600 1,600 -- 17.98 126 360 120 --23 --------- 23.62 207 1,320 740 36 32.61 463 1,900 2,400 -- 18.94 135 360 130 24 --------- 22.49 194 1,300 680 -- 33.21 489 1,580 2,090 -- 18.69 130 395 140 42 25 --------- 23.61 227 1,800 1,100 -- 33.06 449 1,090 1,330 -- 18.65 131 420 1501 --26 --------- 27.94 288 2,100 1,600 -- 32.35 407 870 960 -- 18.66 132 450 160 --27 --------- 29.05 323 2,000 1,700 31.61 376 770 780 19.06 138 530 200 --28 --------- 29.95 349 1,890 1,780 47 30.41 345 700 660 73 20.79 163 770 340 --29 --------- 30.66 368 1,800 1,800 -- 28.59 289 720 560, 21.72 177 1,200 570 --30 --------- 30.66 368 1,800 1,800 -- 26.53 234 760 480 78 22.31 187 1,600 810 --31 30.60 364 1,800 1,800 --- -- 22.68 194 1,500 790 Total --------------- 8,293 45,731 10,003 as,2so 5,954 14,530 Monthly mean
discharge --------- 268 1,477 333 1,174, 192 469 Maximum ----------- 368 3,000 489 2,400 280 830 Minimum --·--------- 109 290 228 480 117 120
1 Suspended-sediment data based on observations at 2- to 10-day intervals.
Stage
22.68 21.10 18.95 18.05 19.25 20.45 20.65 19.80 18.90 18.16 17.70 16.58 15.48 14.80 15.50 16.26 15.64 15.00 18.54 18.86 16.11 14.72 13.94 13.55 12.70 12.17 12.43 11.59 11.37 11.16
June Suspended sediment 1
Dis- C Dis-
charge on':en- charge Per-(1 000 tratnon (1,000 cent na;s) (mg/1) tons/ sand
day)
194 1,400 730 --170 1,300 600 --140 1,200 450 129 1,200 420 22 143 1,2001 460 --158 1,200 510 --161 1,200 520 --149 1,100 440 --138 990 &70 --129 870 300 --123 730 240 110 585 170 20
99 520 140 93 433 110 24 99 430 110 --
106 500 140 --100 460 120 --
94 440 110 --133 570 200 --136 680 250 104 600 170 -·-
92 480 120 --86 420 98 --83 370 83 --77 340 701 ·--73 320 63 --76 300 62 --70 280 53 --69 270 50 --68 250 46
3,403 7,206
113 240 194 730
68 46
..-0 00
1-3
= ~ ~ co -::J ~
~ ..... 00 00 ..... 00 00 ..... t-el t-el ..... ~ ..... < ~ ~
1:1:1 > 00 ..... z ~ t"'4 0 0 t:1
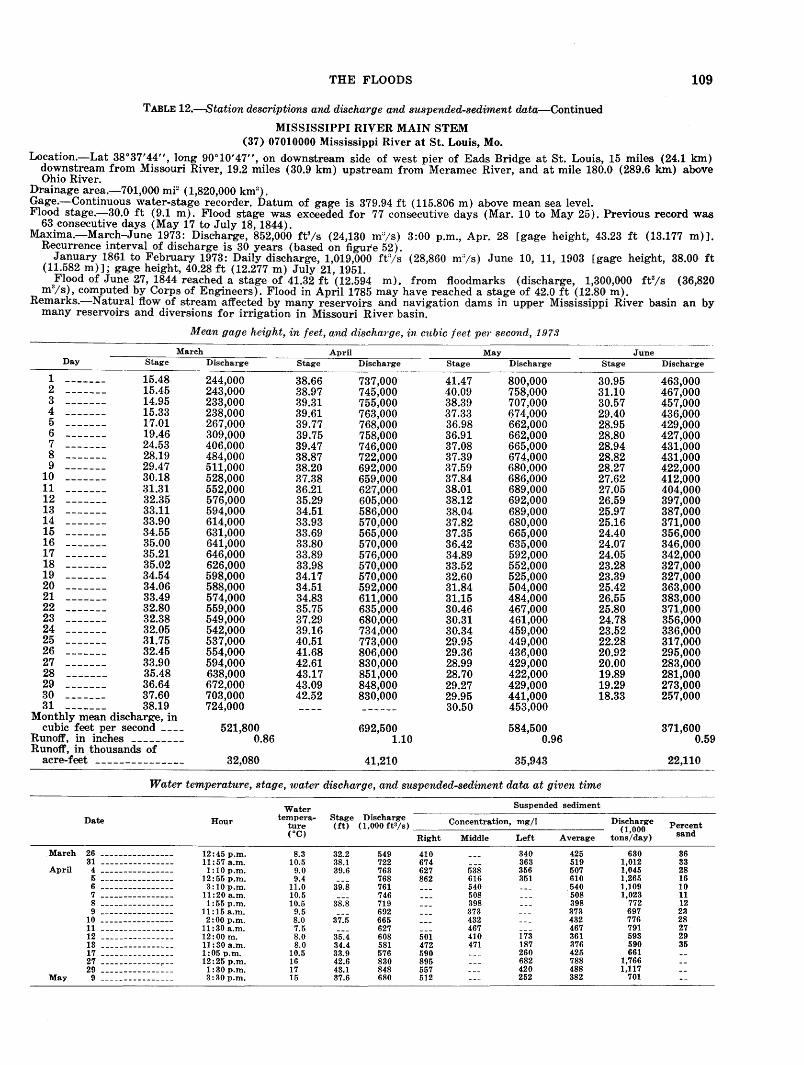
THE FLOODS
TABLE 12.-Station descriptions and discharge and suspended-sediment data-Continued
MISSISSIPPI RIVER MAIN STEM (37) 07010000 Mississippi River at St. Louis, Mo.
109
Location.-Lat 38°37'44", long 90°10'47", on downstream side of west pier of Eads Bridge at St. Louis, 15 miles (24.1 km) downstream from Missouri River, 19.2 miles (30.9 km) upstream from Merame·c River, and at mile 180.0 (289.6 km) above Ohio River.
Drainage area.-701,000 mi2 (1,820,000 km2).
Gage.-Continuous water-stage recorder. Datum of gage is 379.94 ft (115.806 m) above mean sea level. Flood stage.-30.0 ft (9.1 m). Flood stage was exceeded for 77 consecutive days (Mar. 10 to May 25). Previous record was
63 consecutive days (May 17 to July 18, 1844). Maxima.-March-June 1973: Discharge, 852,000 ft3/s (24,130 m:;/s) 3:00 p.m., Apr. 28 [gage height, 43.23 ft (13.177 m)].
Recurrence interval of discharge is 30 years (based on figure 52). January 1861 to February 1973: Daily discharge, 1,019,000 ft~/s (28,860 m:/s) June 10, 11, 1903 [gage height, 38.00 ft
(11.582 m)]; gage height, 40.28 ft (12.277 m) July 21, 1951. Flood of June .27, 1844 reached a stage of 41.32 ft (12.594 m). from floodmarks (discharge, 1,300,000 fe;s (36,820
m 3/S), computed by Corps. of Engineers). Flood in April1785 may have reached a stage of 42.0 ft (12.80 m).
Remarks.-Natural flow of stream affected by many reservoirs and navigation dams in upper Mis.sissippi River ba:sin an by many reservoirs and diversions for irrigation in Missouri River basin.
Mean gage height, in feet, and discharge, in cubic feet pe1· second, .1973
March April May June Day Stage Discharge Stage Discharge Stage Discharge Stage Discharge
1 15.48 244,000 38.66 737,000 41.47 800,000 30.95 463,000 2 15.45 243,000 38.97 745,000 40.09 758,000 31.10 467,000 3 14.95 233,000 39.31 755,000 38.39 707,000 30.57 457,000 4 15.33 238,000 39.61 763,000 37.33 674,000 29.40 436,000 5 17.01 267,000 39.77 768,000 36.98 662,000 28.95 429,000 6 19.46 309,000 39.75 758,000 36.91 662,000 28.80 427,000 7 24.53 406.000 39.47 746,000 37.08 665,000 28.94 431,000 8 28.19 484;ooo 38.87 722,000 37.39 674,000 28.82 431,000 9 29.47 511,000 38.20 692,000 37.59 680,000 28.27 422,000
10 30.18 528,000 37.38 659,000 37.84 686,000 27.62 412,000 11 31.31 552,000 36.21 627,000 38.01 689,000 27.05 404,000 12 32.35 576,000 35.29 605,000 38.12 692,000 26.59 397,000 13 33.11 594,000 34.51 586,000 38.04 689,000 25.97 387,000 14 33.90 614,000 33.93 570,000 37.82 680,000 25.16 371,000 15 34.55 631,000 33.69 565,000 37.35 665,000 24.40 356,000 16 35.00 641,000 33.80 570,000 36.42 635,000 24.07 346,000 17 35.21 646,000 33.89 576,000 34.89 592,000 24.05 342,000 18 35.02 626,000 33.98 570,000 33.52 552,000 23.28 327,000 19 34.54 598,000 34.17 570,000 32.60 525,000 23.39 327,000 20 34.06 588,000 34.51 592,000 31.84 504,000 25.42 363,000 21 33.49 574,000 34.83 611,000 31.15 484,000 26.55 383,000 22 32.80 559,000 35.75 635,000 30.46 467,000 25.80 371,000 23 32.38 549,000 37.29 680,000 30.31 461,000 24.78 356,000 24 32.05 542,000 39.16 734,000 30.34 459,000 23.52 336,000 25 31.75 537,000 40.51 773,000 29.95 449,000 22.28 317,000 26 32.45 554,000 41.68 806,000 29.36 436,000 20.92 295,000 27 33.90 594,000 42.61 830,000 28.99 429,000 20.00 283,000 28 35.48 638,000 43.17 851,000 28.70 422,000 19.89 281,000 29 36.64 672,000 43.09 848,000 29.27 429,000 19.29 273,000 30 37.60 703,000 42.52 830,000 29.95 441,000 18.33 257,000 31 38.19 724,000 30.50 453,000
Monthly mean discharge, in cubic feet per second ____ 521,800 692,500 584,500 371,600
Runoff, in inches --------- 0.86 1.10 0.96 0.59 Runoff, in thousands of
acre-feet --------------- 32,080 41,210 35,943 22,110
Water temperature, stage, water discharge, and suspended-sediment data at given time
Water Suspended sediment
Date Hour tempera- Stage Discharge Concentration, mg/1 Discharge ture (ft) (1,000 ft3/s) (1,000 Percent ("C) Right Middle Left Average tons/day) sand
March 26 ---------------- 12:45 p.m. 8.3 32.2 549 410 340 425 630 36 31 ---------------- 11:57 a.m. 10.5 38.1 722 674 363 519 1,012 33
April 4 ---------------- 1:10p.m. 9.0 39.6 763 627 538 356 507 1,045 28 5 ---------------- 12:55 p.m. 9.4 768 862 616 351 610 1,265 16 6 ---------------- 3:10p.m. 11.0 39.8 761 540 540 1,109 10 7 ---------------- 11:20 a.m. 10.5 746 508 508 1,023 11 8 ---------------- 1:55 p.m. 10.5 38.8 719 398 398 772 12 9 ---------------- 11:15 a.m. 9.5 692 373 373 697 23
10 ---------------- 2:00p.m. 8.0 37.5 665 432 432 776 28 11 ---------------- 11:30 a.m. 7.5 627 467 467 791 27 12 ---------------- 12:00 m. 8.0 35.4 608 501 410 173 361 593 29 13 ---------------- 11:30 a.m. 8.0 34.4 581 472 471 187 376 590 35 17 ---------------- 1:05 p.m. 10.5 33.9 576 590 260 425 661 27 ------------·-,.-- 12:25 p.m. 16 42.6 830 895 682 788 1,766 29 ---------------- 1:30 p.m. 17 43.1 848 557 420 488 1,117
May 9 ---------------- 3:30p.m. 15 37.6 680 512 252 382 701
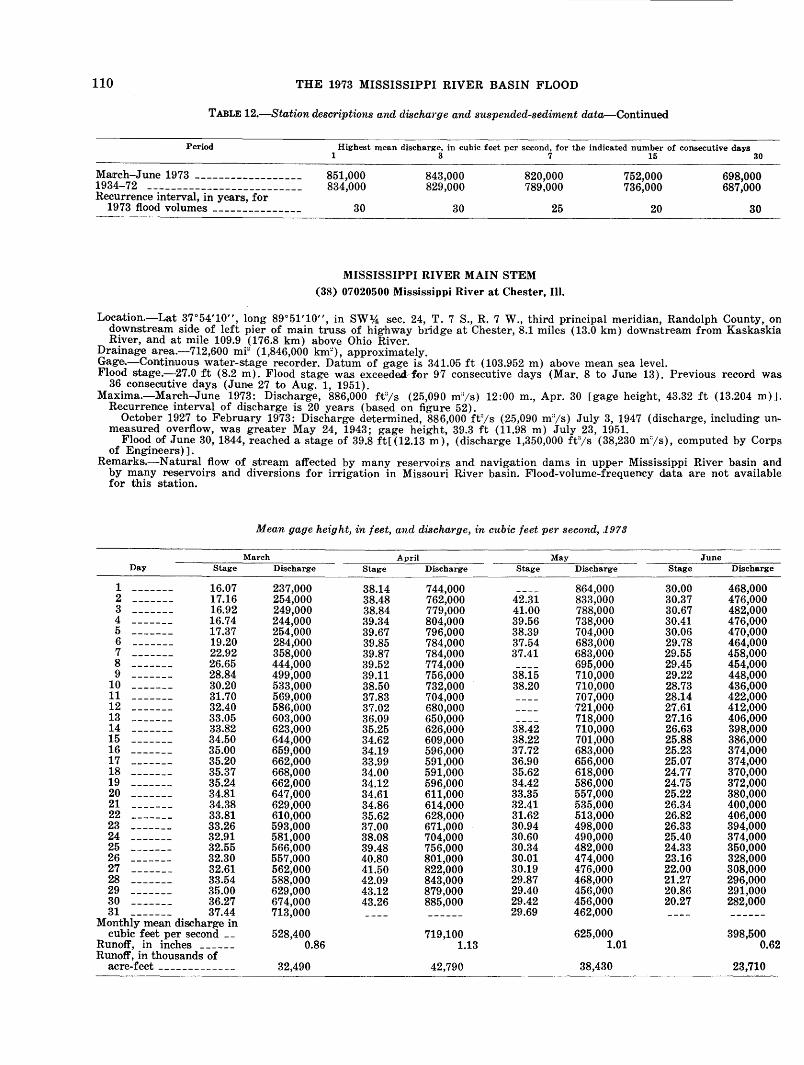
110 THE 1973 MISSISSIPPI RIVER BASIN FLOOD
TABLE 12.-Station descriptions and discha?·ge and suspended-sediment data-Continued
Period Highest mean discharge, in cubic feet per second, for the indicated number of consecutive days 1 3 7 16 30
March-June 1973 ------------------1934-72 -------------------------Recurrence interval, in years, for
1973 flood volumes ---------------
851,000 834,000
30
843,000 829,000
30
820,000 789,000
25
MISSISSIPPI RIVER MAIN STEM
(38) 07020500 Mississippi River at Chester, Ill.
752,000 736,000
20
698,000 687,000
30
Location.-Lat 37°54'10", long 89°51'10", in SW% sec. 24, T. 7 S., R. 7 W., third principal meridian, Randolph County, on downstream side of left pier of main truss of highway bridge at Chester, 8.1 miles (13.0 km) downstream from Kaskaskia River, and at mile 109.9 (176.8 km) above Ohio River.
Drainage area.-712,600 mF (1,846,000 km~), approximately. Gage.-Continuous water-stage recorder. Datum of gage is 341.05 ft (103.952 m) above mean sea level. Flood stage.-27.0 ft (8.2 m). Flood stage was exceeded-for 97 consecutive days (Mar. 8 to June 13). Previous record was
36 conse,CIUtive days (June 27 to Aug. 1, 1951). Maxima.-March-June 1973: Discharge, 886,000 ft3/s (25,090 m'is) 12:00 m., Apr. 30 [gage height, 43.32 ft (13.204 m) J.
Recurrence interval of discharge is 20 years (based on figure 52). October 1927 to February 1973: Discharge' determined, 886,000 ft'is (25,090 m'is) July 3, 1947 (discharge, including un
measured overflow, was greater May 24, 1943; gage height, 39.3 ft (11.98 m) July 23, 1951. Flood of June 30, 1844, reached a stage of 39.8 ft[(12.13 m), (discharge 1,350,000 fe;s (38,230 m'is), computed by Corps
of Engineers) ] . Remarks.-N atural flow of stream affected by many res,ervo,irs and navigation dams in upper Mississippi River basin and
by many reservoirs and diversions for irrigation in Missouri River basin. Flood-volume-frequency data are not available for this station.
Mean gage height, in feet, and discharge, in cubic feet per second, .1973
March April May June Day Stage Discharge Stage Discharge Stage Discharge Stage Discharge
1 16.07 237,000 38.14 744,000 864,000 30.00 468,000 2 17.16 254,000 38.48 762,000 42.31 833,000 30.37 476,000 3 16.92 249,000 38.84 779,000 41.00 788,000 30.67 482,000 4 16.74 244,000 39.34 804,000 39.56 738,000 30.41 476,000 5 17.37 254,000 39.67 796,000 38.39 704,000 30.06 470,000 6 19.20 284,000 39.85 784,000 37.54 683,000 29.78 464,000 7 22.92 358,000 39.87 784,000 37.41 683,000 29.55 458,000 8 26.65 444,000 39.52 774,000 695,000 29.45 454,000 9 28.84 499,000 39.11 756,000 38.15 710,000 29.22 448,000
10 30.20 533,000 38.50 732,000 38.20 710,000 28.73 436,000 11 31.70 569,000 37.83 704,000 707,000 28.14 422,000 12 32.40 586,000 37.02 680,000 721,000 27.61 412,000 13 33.05 603,000 36.09 650,000 718,000 27.16 406,000 14 33.82 623,000 35.25 626,000 38.42 710,000 26.63 398,000 15 34.50 644,000 34.62 609,000 38.22 701,000 25.88 386,000 16 35.00 659,000 34.19 596,000 37.72 683,000 25.23 374,000 17 35.20 662,000 33.99 591,000 36.90 656,000 25.07 374,000 18 35.37 668,000 34.00 591,000 35.62 618,000 24.77 370,000 19 35.24 662,000 34.12 596,000 34.42 586,000 24.75 372,000 20 34.81 647,000 34.61 611,000 33.35 557,000 25.22 380,000 21 34.38 629,000 34.86 614,000 32.41 535,000 26.34 400,000 22 33.81 610,000 35.62 628,000 31.62 513,000 26.82 406,000 23 33.26 593,000 37.00 671,000 30.94 498,000 26.33 394,000 24 32.91 581,000 38.08 704,000 30.60 490,000 25.40 374,000 25 32.55 566,000 39.48 756,000 30.34 482,000 24.33 350,000 26 32.30 557,000 40.80 801,000 30.01 474,000 23.16 328,000 27 32.61 562,000 41.50 822,000 30.19 476,000 22.00 308,000 28 33.54 588,000 42.09 843,000 29.87 468,000 21.27 296,000 29 35.00 629,000 43.12 879,000 29.40 456,000 20.86 291,000 30 36.27 674,000 43.26 885,000 29.42 456,000 20.27 282,000 31 37.44
Monthly mean discharg-e in 713,000 29.69 462,000
398,500 cubic feet per second __ 528,400 719,100 625,000 Runoff, in inches ______ 0.86 1.13 1.01 0.62 Runoff, in thousands of
acre-feet ------------- 32,490 42,790 38,430 23,710
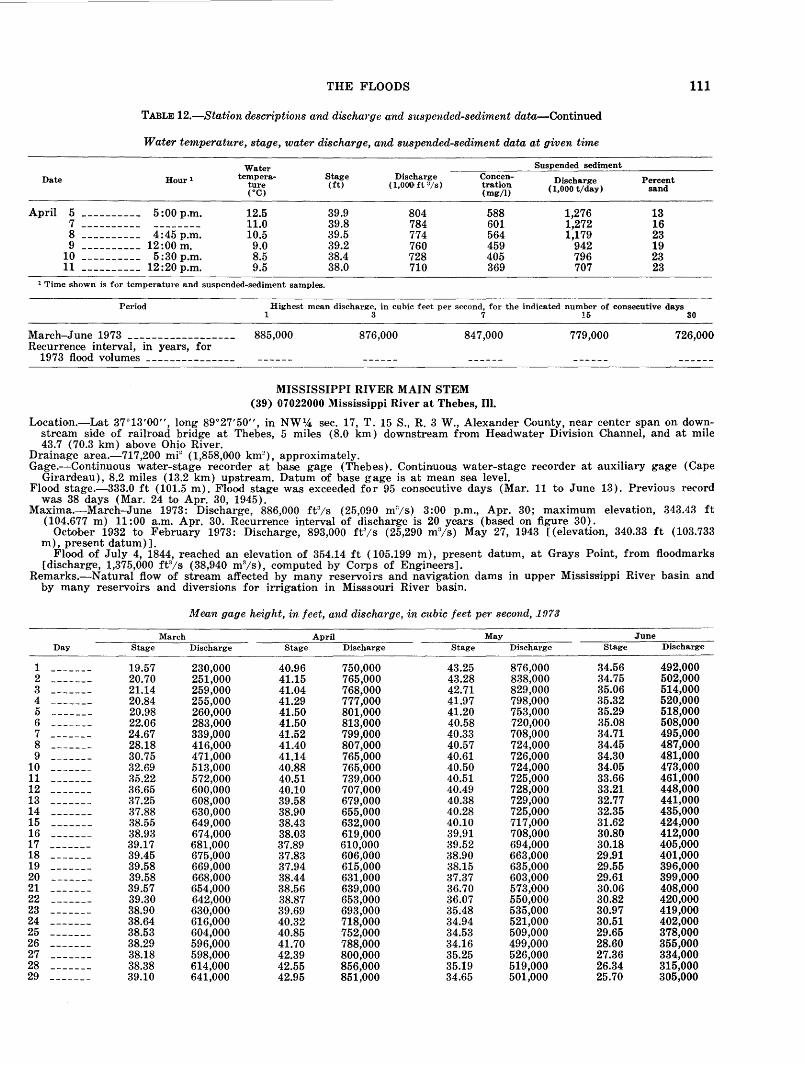
THE FLOODS 111
TABLE 12.-Station descriptions and discharge and suspended-sediment data-Continued
Water temperature, stage, water discharge, and suspended-sediment data at given time
Water Suspended sediment
Date Hour 1 tempera- Stage Discharge Concen- Discharge Percent ture (ft) (l,OOOfta/s) tration (1,000 t/day) sand (oC) (mg/1)
April 5 ---------- 5:00p.m. 12.5 39.9 804 588 1,276 13 7 ---------- -------- 11.0 39.8 784 601 1,272 16 8 ---------- 4:45p.m. 10.5 39.5 774 564 1,179 23 9 ---------- 12:00 m. 9.0 39.2 760 459 942 19
10 ---------- 5:30p.m. 8.5 38.4 728 405 796 23 11 ---------- 12:20 p.m. 9.5 38.0 710 369 707 23
1 Time shown is for temperature and suspended-sediment samples.
Period Highest mean discharge, in cubic feet per second, for the indicated number of consecutive days 1 3 7 15 30
]darch-June 1973 ------------------ 885,000 876,000 847,000 779,000 726,000 Recurrence interval, in years, for
1973 flood volumes ---------------
MISSISSIPPI RIVER MAIN STEM (39) 07022000 Mississippi River at Thebes, Ill.
Location.-Lat 37°13'00", long 89°27'50", in NW 14 sec. 17, T. 15 S., R. 3 W., Alexander County, near center span on downstream side of railroad bridge at Thebes, 5 miles (8.0 km) downstre,am from Headwater Division Channel, and at mile 43.7 (70.3 km) above Ohio River.
Drainage area.-717 ,200 mi2 ( 1,858,000 km~), approximately.
Gage.~Continuous water-stage recorder at bas,e gage (Thebes). Continnous water-stage recorder at auxiliary gage (Cape Girard'eau), 8.2 miles (13.2 km) upstream. Datum of base gage is at mean sea lev·el.
Flood stage.-333.0 ft (101.5 m). Flood stage was exceeded for 95 consecutive days (Mar. 11 to June 13). Previous record was 38 days (Mar. 24 to Apr. 30, 1945).
]daxima.-]darch-June 1973: Discharge, 886,000 ffl/s (25,090 m3/S) 3:00 p.m., Apr. 30; maximum elevation, 343.43 ft (104.677 m) 11:00 a.m. Apr. 30. Recurrence interval of discharge is 20 years (based on figure 30).
October 1932 to February 1973: Discharge, 893,000 ffl/s (25,290 m 3/s) May 27, 1943 [(elevation, 340.33 ft (103.733 m), present datum)].
Flood of July 4, 1844, reached an elevation of 354.14 ft ( 105.199 m), present datum, at Grays Point, from floodmarks [discharge, 1,375,000 ft3/s (38,940 m 3/s), computed by Corps of Engineers].
Remarks.-Natural flow of stream affected by many reservoirs and navigation dams in upper Mississippi River basin and by many reservoirs and diversions for irrigation in Misssouri River basin.
Mean gage height, in feet, and discharge, in cubic feet per second, .1973
March April May June Day Stage Discharge Stage Discharge Stage Discharge Stage Discharge
1 19.57 230,000 40.96 750,000 43.25 876,000 34.56 492,000 2 20.70 251,000 41.15 765,000 43.28 838,000 34.75 502,000 3 21.14 259,000 41.04 768,000 42.71 829,000 35.06 514,000 4 20.84 255,000 41.29 777,000 41.97 798,000 35.32 520,000 5 20.98 260,000 41.50 801,000 41.20 753,000 35.29 518,000 6 22.06 283,000 41.50 813,000 40.58 720,000 35.08 508,000 7 24.67 339,000 41.52 799,000 40.33 708,000 34.71 495,000 8 28.18 416,000 41.40 807,000 40.57 724,000 34.45 487,000 9 30.75 471,000 41.14 765,000 40.61 726,000 34.30 481,000
10 32.69 513,000 40.88 765,000 40.50 724,000 34.05 473,000 11 35.22 572,000 40.51 739,000 40.51 725,000 33.66 461,000 12 36.65 600,000 40.10 707,000 40.49 728,000 33.21 448,000 13 37.25 608,000 39.58 679,000 40.38 729,000 32.77 441,000 14 37.88 630,000 38.90 655,000 40.28 725,0.00 32.35 435,000 15 38.55 649,000 38.43 632,000 40.10 717,000 31.62 424,000 16 38.93 674,000 38.03 619,000 39.91 708,000 30.80 412,000 17 39.17 681,000 37.89 610,000 39.52 694,000 30.18 405,000 18 39.45 675,000 37.83 606,000 38.90 663,000 29.91 401,000 19 39.58 669,000 37.94 615,000 38.15 635,000 29.55 396,000 20 39.58 668,000 38.44 631,000 37.37 603,000 29.61 399,000 21 39.57 654,000 38.56 639,000 36.70 573,000 30.06 408,000 22 39.30 642,000 38.87 653,000 36.07 550,000 30.82 420,000 23 38.90 630,000 39.69 693,000 35.48 535,000 30.97 419,000 24 38.64 616,000 40.32 718,000 34.94 521,000 30.51 402,000 25 38.53 604,000 40.85 752,000 34.53 509,000 29.65 378,0()0 26 38.29 596,000 41.70 788,000 34.16 499,000 28.60 355,000 27 38.18 598,000 42.39 800,000 35.25 526,000 27.36 334,000 28 38.38 614,000 42.55 856,000 35.19 519,000 26.34 315,000 29 39.10 641,000 42.95 851,000 34.65 501,000 25.70 305,000
112 THE 1973 MISSISSIPPI RIVER BASIN FLOOD
TABLE 12.-Station descriptions and discharge and suspended-sediment data-Continued
Mean gage height, in feet, and discharge, in cubic feet per second, .1973-Continued
March April May June Day Stage Discharge Stage Discharge Stage Discharge Stage Discharge
30 39.60 693,000 43.32 878,000 34.31 488,000 25.18 297,000 31 40.54 717,000 34.39 486,000 Monthly mean discharge, in
cubic feet per second ____ 539,000 731,000 655,800 428,200 Runoff, in inches _________ 0.87 1.14 1.05 0.67 Runoff, in thousands of
acre-feet -------------- 33,140 43,500 40,320 25,480
Water temperature, stage, discharge, and suspended-sediment data at given time
Water Suspended sediment Date Hourl temperature Stage Discharge Concentration Discharge Percent
(oC) (ft) (1,000 ft3js) (mg/1) (1,000 t/,day) sand
April 7 ---------- 6:45p.m. 10.5 41.5 799 704 1,519 14 8 ---------- 8:00a.m. 9.5 41.4 807 720 1,569 28 9 ---------- 6:00p.m. 9.0 41.1 765 591 1,221 30
10 ---------- 9:00a.m. 8.0 40.9 765 623 1,287 36 11 ---------- 8:15a.m. 8.5 40.5 739 425 848 38 13 ---------- 12:40 p.m. 9.0 39.6 679 400 733 42
1 Time shown is for temperature and suspended-sediment samples.
Highest mean discharge, in cubic feet per second, for the indicated number of consecutive days 1 3 7 15 30
March-June 1973 ------------------1934-72 --------------------------Recurrence interval, in years, for
1973 flood volumes ---------------
878,000 886,000
20
868,000 863,000
20
OHIO RIVER BASIN
847,000 813,000
20
(40) 03384500 Ohio River at Golconda, Ill.
793,000 767,000
20
743,000 713,000
30
Location.-Lat 37°21'28", long 88°28'27", Pope County, on right bank at lock and dam 51, at Golconda, 0.5 mile (0.8 km) upstream from McGilligan Greek, 0.7 mile (1.1 km) downstream from Lusk Creek, and at mile 903.1 (1,453.1 km).
Drainage area.-143,900 mi2 (372,700 km2), approximately.
Gage.-Nonrecording gage read hourly. Datum of gage is 294.6 ft (89.79 m) above me•an sea level, Ohio River datum. Auxiliary nonrecording gage read hourly at lock and dam 50, 26.3 miles (42.3 km) upstream.
Flood stage.-Periods when river exceeded flood stage of 40 ft (12.2 m) for selected floods, are shown in the following tabu-lation:
1937: Jan. 13 to Feb. 15 (34 days) 1945: Feb. 28 to Apr. 6 (38 days) 1950: Jan. 8 to Mar. 4 (56 days) 1964: Mar. 10 to 31 (22 days) 1973: Mar. 20 to Apr. 5 (17 days)
May 2 to 10 (9 days) Maxima.-March-May 1973: Discharge, 601,000 ft3/s (17,000 m 3/s) Mar. 26, 4:00 p.m., gage height, 45.7 :ft (13.93 m) Mar.
26, 27. 1937 to February 1973: DisiCharge 1,470,000 ft3/s (41,600 m 3/s). Feb. 2, 3, 1937; gage height, 62.6 ft (19.08 m) Feb. 1-3,
1937. Remarks.-Flow partly regulated by many dams and reservoirs.
Mean gage height, in feet, and discharge, in cubic feet per second, .1973
March April May Day Stage Discharge Stage Discharge Stage Discharge
1 16.30 121,000 43.26 509,000 39.13 472,000 2 16.08 117,000 42.61 493,000 40.18 490,000 3 15.80 115,000 41.85 474,000 41.07 506,000 4 15.86 110,000 40.94 447,000 41.81 538,000 5 15.67 109,000 39.92 420,000 42.34 546,000 6 16.34 120,000 38.92 401,000 42.65 549,000 7 18.22 148,000 38.47 403,000 42.58 547,000 8 21.30 198,000 38.54 414,000 42.31 533,000 9 24.00 242,000 38.70 427,000 41.45 499,000
10 26.14 262,000 39.01 434,000 40.14 452,000 11 28.89 290,000 39.00 444,000 38.51 404,000
THE FLOODS 113
TABLE 12.-Station descriptions and discharge and suspended-sediment data-Continued
Mean gage height, in feet, and discharge, in cubic feet per second, .1973-Continued
March April May Day Stage Discharge Stage Discharge Stage Discharge
12 30.64 312,000 39.00 449,000 37.04 372,000 13 31.85 325,000 38.90 452,000 36.02 354,000 14 32.66 331,000 38.69 452,000 35.42 344,000 15 32.58 333,000 38.55 449,000 35.10 339,000 16 32.91 316,000 38.21 442,000 34.34 327,000 17 34.62 319,000 37.74 427,000 33.41 300,000 18 36.65 338,000 37.44 412,000 31.98 273,000 19 38.68 377,000 36.94 398,000 30.20 239,000 20 40.17 420,000 37.12 401,000 28.21 211,000 21 41.48 460,000 36.54 409,000 26.47 186,000 22 42.60 492,000 36.72 417,000 24.81 158,000 23 43.48 527,000 37.60 429,000 23.37 152,000 24 44.35 555,000 38.11 435,000 22.18 145,000 25 45.09 580,000 38.39 436,000 21.77 154,000 26 45.56 599,000 38.70 447,000 21.94 160,000 27 45.64 594,000 38.63 456,000 24.22 189,000 28 45.31 579,000 38.51 458,000 26.16 238,000 29 44.84 567,000 38.40 456,000 28.43 283,000 30 44.30 547,000 38.54 459,000 30.54 311,000 31 43.84 523,000 31.24 312,000 Monthly mean discharge, in
cubic feet per second ____ 352,500 438,300 341,400 Runoff, in inches --------- 2.82 3.40 2.74
CUMBERLAND RIVER BASIN (41) 03438220 Cumberland River near Grand Rivers, Ky.
Location.-Lat 37°01'18", long 88°13'16", Lyon County, on right bank in powerhouse at Barkley Dam, 1.5 miles (2.4 km) northeast of Grand Rivers, and at mile 30.6 (49.2 km).
Drainage area.-17,598 mi2 (45,579 km2).
Gage.-Water-stage recorder. Datum of gage is 300.00 ft (91.440 m) above mean sea level. Auxiliary water-stage recorder 11.0 miles (17.7 km) downstream, and at mile 19.6 (31.5 km). Prior to June 27, 1964 base gage 27.8 mile:s (44.7 km) downstream at mile 2.8 (4.5 km), at datum 0.44 ft (0.134 m) lower.
Maxima.-March-May 1973: Discharge, 126,000 ft3js, (3,570 m 3/s) Mar. 17, 12:00 p.m., gage height, 39.72 ft (12.107 m) Mar. 25, 0615 hours.
1939 to February 1973: Discharge, 201,000 ft3/s (5,690 m 3/s) Feb. 18, 1950; gage height, 43.10 ft (13.137 m) Feb. 13, 1950 (former site and datum).
Flood of January to February 1937 reached a stage of 51.1 ft[ (15.58 m) (former site and datum) J; 60.3 ft (18.38 m) pres,ent site and datum (from river profile).
Remarks.-Regulation by hydroelectric and navigation dams in the Cumberland River basin. Barkley-Kentucky canal diverts water from or to Kentucky Lake in Tennes&ee River basin.
Mean discharge, in cubic feet per second, .1973
Day March April May Day March April May
1 41,900 78,100 52,700 16 89,300 71,200 70,000 2 44,300 70,700 51,600 17 114,000 71,600 69,500 3 45,700 69,500 50,600 18 122,000 71,700 69,300 4 63,200 68,300 54,400 19 121,000 65,300 62,300 5 63,500 68,500 59,500 20 118,000 55,100 54,500 6 63,100 69,000 61,400 21 106,000 54,600 55,700 7 62,500 69,200 61,800 22 96,200 54,800 57,200 8 61,100 68,800 61,200 23 91,400 63,400 58,000 9 65,500 68,000 61,800 24 92,100 72,300 59,000
10 67,700 68,500 64,200 25 83,200 70,100 59,700 11 76,000 68,300 67,000 26 71,700 59,800 59,500 12 82,200 68,300 68,800 27 71,800 53,200 59,000 13 81,800 68,200 71,700 28 73,000 52,500 56,900 14 66,900 68,500 72,300 29 73,100 53,000 65,300 15 62,900 70,600 72,300 30 78,500 52,500 72,900
31 84,800 64,300 Monthly mean discharge in cfs -------------------------------------------- 78,520 65,450 62,080 Runoff in inches ________________________________________________ --- __ ---- 5.15 4.15 4.07
114 THE 1973 MISSISSIPPI RIVER BASIN FLOOD
TABLE 12.-Station descriptions and discha1·ge and suspended-sediment data-Continued
OHIO RIVER BASIN (42) 03611500 Ohio River at Metropolis, Ill.
Location.-Lat 37°08'51", long 88°44'27", McCraken County, near center of span on downstream side of pier of Paducah & Illinois Railroad bridge at Metropolis, 9.5 miles (15.3 km) downstream from Tennessee River, 37 miles (59.5 km) upstream from mouth, and at mile 944.1 (1,520 km).
Drainage area.-203,000 mF (526,000 km2), approximately.
Gage.-Water-stage recorder. Datum of gage 276.27 ft (84.207 m) above mean sea level. Auxiliary water-stage recorder, 18 miles (29 km) downstream.
Flood stage.-Periods when river exceeded flood stage of 43 ft (13.1 m) for selected floods, are shown in the following tabulation:
1937: Jan. 9 to Feb. 23 ( 46 days) 1945: Felb. 23 to Apr. 17 (54 days) 1950: Jan. 6 to Mar 6 (60 days) 1964: Mar. 9 to Apr. 1 (24 days) 1973: Mar. 13 to May 20 (69 days)
Maxima.-March-May 1973: Discharge, 990,000 fta;s (28,000 ma/s) Mar. 26, 2:00 p.m., [gage height, 50.22 ft (15.307 m) J. 1928 to February 1973: Discharge, 1,780,000 ft:l/s (50,400 m 3/s) Feb. 1, 1937 [total discharge, including overflow
through Bay Greek and Cache River Valleys, 1,850,000 ff/s (52,400 m3/s)]; maximum gage height, 66.60 ft (20.300 m) Feb. 2, 1937.
Remarks.-Flow regulated by many dams a.nd reservoirs.
Mean gage height, in feet, and discharge, in cubic feet per second, .1973
March April May Day Stage Discharge Stage Discharge Stage Discharge
1 24.20 213,000 54.40 883,000 50.26 620,000 2 24.18 214,000 54.02 860,000 51.11 667,000 3 24.34 212,000 53.50 840,000 51.56 706,000 4 25.04 228,000 52.93 800,000 51.97 745,000 5 25.19 229,000 52.33 761,000 52.18 768,000 6 25.50 234,000 51.65 714,000 52.20 780,000 7 26.65 250,000 51.05 683,000 52.15 785,000 8 29.31 285,000 50.80 682,000 52.15 785,000 9 32.93 340,000 50.69 674,000 51.82 764,000
10 -------. 36.24 392,000 50.58 693,000 51.30 734,000 11 39.39 443,000 50.36 682,000 50.54 686,000 12 41.77 505,000 50.13 687,000 49.73 650,000 13 43.17 531,000 49.74 677,000 48.88 604,000 14 44.10 535,000 49.37 678,000 48.35 601,000 15 44.25 516,000 49.05 675,000 48.00 598,000 16 45.30 583,000 48.69 665,000 47.67 596,000 17 47.72 704,000 48.27 659,000 47.05 583,000 18 49.60 757,000 48.08 654,000 46.18 546,000 19 51.31 823,000 47.79 638,000 44.98 505,000 20 52.17 843,000 47.92 631,000 43.49 455,000 21 53.01 879,000 47.40 595,000 41.85 397,000 22 53.69 918,000 47.31 598,000 40.38 372,000 23 54.10 936,000 47.88 630,000 38.84 337,000 24 54.53 956,000 48.81 668,000 37.47 326,000 25 54.98 976,000 49.25 670,000 36.55 331,000 26 55.20 989,000 49.50 660,000 36.33 342,000 27 55.11 980,000 49.29 619,000 37.55 398,000 28 54.90 967,000 49.20 585,000 39.23 436,000 29 54.72 949,000 49.25 576,000 40.50 495,000 30 54.54 931,000 49.65 585,000 42.08 559,000 31 54.55 906,000 42.99 593,000 Monthly mean discharge,
573,000 in cubic feet per second __ 620,100 680,700 Runoff, in inches --------- 3.52 3.74 3.26
OBION RIVER BASIN (43) 07027500 South Fork Forked Deer River at Jackson, Tenn.
Location.-Lat 35°35'38", long 88°48'52", Madison County, on right hank 20ft (6.1 m) downstream from bridge on U.S. Highway 45, 0.6 mile (1.0 km) downstream from Meridian Creek, and 1.4 miles (2.3 km) south of the po•st offic·e in Jackson.
Drainage area.-495 mi2 (1,282 km2).
Gage.-Water-1stage recorder. Datum of gage is 330.76 ft (100.816 m) above mean sea level, datum of 1929, supplementary adjustment of 1955.
Flood .stage.-17 ft (5.2 m). Flood stage was exceeded for 2 days in March and for 8 days in April. Maxima.-March-May 1973: Discharge, 31,200 ft3/s (884 m 3/s) 7:00a.m., April 21 [gage height, 22.28 ft (6.791 m) 1. Recur
rence interval of discharge is 35 years. 1929 to February 1973: Discharge 43,600 ft3/s (1,230 mn/s) Jan. 21, 1935 [gage heig.ht 24.0 ft (7.32 m)].
THE FLOODS 115
TABLE 12.-Station descriptions and discha1·ge and suspended-sediment data-Continued
Mean discharge, in cubic feet per second, .1973
Day March April May Day March April May Day March April May
1 468 2,140 1,010 11 2,930 1,100 1,160 21 2,210 29,300 535 2 510 1,800 3,010 12 3,250 853 1,080 22 1,260 16,100 402 3 1,140 1,560 3,620 13 2,820 700 772 23 1,060 8,640 629 4 892 1,120 3,610 14 2,440 610 610 24 924 7,530 667 5 940 899 2,970 15 3,110 568 523 25 1,280 6,180 655 6 820 721 2,160 16 4,070 646 473 26 1,510 4,460 465 7 3,060 1,350 2,150 17 5,280 856 479 27 1,300 3,640 1,970 8 3,150 2,060 3,220 18 5,830 1,230 431 28 1,100 2,760 2,740 9 2,300 1,740 2,700 19 4,380 2,910 413 29 1,030 1,530 2,070
10 1,620 1,510 1,590 20 3,470 16,700 727 30 1,180 1,100 2,160 31 2,520 1,590
Monthly mean discharge, in cubic feet per second --------------------------------------- 2,189 4,077 1,503 Runoff, in inches ______ --- ________________________ -- _ ------- __________ -- _ --- _-- ------ 5.10 9.19 3.50
Gage height, in feet, and discha-rge, in cubic feet per second, at indicated time; .1973
Date Hour Gage Dis- Date Hour Gage Dis- Date Hour Gage Dis-height charge height charge height charge
Apr. 18 _ 2:00a.m. 7.35 865 Apr. 20 _ 8:00a.m. 19.35 12,100 Apr. 22 _ 2:00p.m. 19.75 14,500 12:00 m. 7.72 976 10:00 a.m. 19.74 14,400 6:00p.m. 19.32 11,900 6:00p.m. 8.72 1,280 12:00 m. 20.11 16,700 12:00 p.m. 18.78 9,120 8:00p.m. 10.45 1,800 2:00p.m. 20.53 19,200 23 - 2:00a.m. 18.63 8,520
10:00 p.m. 12.30 2,350 4:00p.m. 20.95 21.700 6:00a.m. 18.72 8,880 12:00 p.m. 12.98 2,550 6:00p.m. 21.30 24,100 10:00 a.m. 18.85 9,400
19 - 2:00a.m. 13.35 2,660 8:00p.m. 21.61 26,300 4:00p.m. 18.63 8,520 4:00a.m. 13.50 2,710 10:00 p.m. 21.87 28,100 12:00 p.m. 18.42 7,770 6:00a.m. 13.49 2,710 12:00 p.m. 22.05 29,400 24 - 2:00a.m. 18.40 7,700 8:00a.m. 13.44 2,690 21 - 2:00a.m. 22.17 30,400 12:00m. 18.36 7,560
10:00 a.m. 12.99 2,560 4:00a.m. 22.24 30,900 12:00 p.m. 18.21 7,080 12:00 m. 12.26 2,340 6:00a.m. 22.27 31,200 25 - 2:00a.m. 18.16 6,930 2:00p.m. 11.54 2,120 7:00a.m. 22.28 31,200 12:00 m. 17.90 6,200 4:00p.m. 10.89 1,930 8:00a.m. 22.27 31,200 12:00 p.m. 17.46 5,220 6:00p.m. 13.33 2,660 10:00 a.m. 22.25 31,000 26 - 12:00m. 16.91 4,400 8:00p.m. 16.13 3,680 2:00p.m. 22.14 30,100 12:00 p.m. 16.51 3,970
10:00 p.m. 16.93 4,420 6:00p.m. 21.90 28,300 27 - 12:00 a.m. 16.07 3,640 12:00 p.m. 17.78 5,900 12:00 p.m. 21.36 25,500 !2:00p.m. 15.34 3,290
20 - 2:00a.m. 18.31 7,380 22 - 2:00a.m. 21.14 23,000 28 - 12:00m. 13.80 2,800 4:00a.m. 18.62 8,480 6:00a.m. 20.68 20,100 12:00 p.m. 11.11 1,990 6:00a.m. 18.96 9,900 10:00 a.m. 20.20 17,200 29 - 12:00 m. 9.45 1,500
12:00 p.m. 8.59 1,240
OBION RIVER BASIN (44) 07028950 Turkey Creek at Fairview, Tenn.
Location.-Lat 35°46'07", long 88°49'59", Madison County, at bridge on U.S. Highway 45 E, 0.6 mile (1.0 km) northeast of Fairview.
Drainage area.~13.3 mF (34.4 km2).
Gage.-Water-stage and rainfall recorders. Gage set to arbitrary datum. Flood stage.-13 ft ( 4.0 m). Maxima.~March-May 1973: Discharge, 5,400 ft3/s (153 m3/s) April 19 [gage height 15.10 ft (4.602 m)]. Recurrence in
terval of discharge is 25 years. 1967 to February 1973: Discharge, 6,360 fe;s (180 m'1/s) July 16,1972 [gage height, 15.42 ft (4.700 m)].
HATCHIE RIVER BASIN ( 45) 07029500 Hatchie River at Bolivar, Tenn.
Location.-Lat 35°16'31", long 88°58'36", Hardeman Count'y, on left bank on upstream end of bridge pier on Sltate Highway 18, .250 ft (76 m) upstream from Illinois Central Gulf Railroad bridge, 0.6 mile (1.0 km) downstream from Sp·ring Creek, and 1.5 miles (2.4 km) northeast of Bolivar.
Drainage area.-1,480 mF (3,833 km2).
Gage.-Water-stage recorder. Datum of gage is 323.49 ft ( 98.600 m) above mean sea level, datum of 1929, supplementary adjustment of 1955.
Flood stage.-15 ft (4.6 m). Flood stage was exceeded for 10 consecutive days in March and for 14 consecutive days in April and May.
Maxima.-March-May 1973: Discharge, 61,600 fe /s (1, 7 40 m 3/ s). March 18 [gage height, 21.66 ft ( 6.602 m)]. Recurrence
inte·rval of discharge is 70 years. 1929 to February 1973: Discharge 56,300 ft3/s (1,590 m 3/s) Feb. 15, 1948 [gage height 21.53 ft (6.562 m)].
116 THE 1973 MISSISSIPPI RIVER BASIN FLOOD
TABLE 12.-Station descriptions and discharge and suspended-sediment data-Continued
Mean discharge, in cubic feet per second, .1973
Day March April May Day March April May Day March April May
1 1,950 6,130 9,300 11 5,650 5,390 5,950 21 25,400 15,100 2,010 2 1,800 6,130 8,700 12 6,100 5,080 5,650 22 16,300 11,900 2,090 3 1,960 6,340 9,380 13 6,130 4,870 5,180 23 12,000 14,600 2,050 4 2,330 6,820 8,320 14 6,100 4,660 4,700 24 9,380 15,800 2,240 5 2,540 7,020 7,380 15 8,080 4,440 4,250 25 8,180 15,000 2,550 6 2,710 6,710 6,900 16 ---- 16,200 4,290 3,670 26 7,240 13,800 2,740 7 4,580 6,590 7,650 17 37,900 4,190 2,730 27 6,650 14,100 4,750 8 4,750 6,520 8,180 18 59,300 4,390 2,090 28 6,180 13,600 8,110 9 4,720 6,230 7,590 19 ---- 51,200 4,980 1,800 29 5,940 12,200 7,660
10 4,370 5,790 6,880 20 ---- 37,900 17,200 1,860 30 5,760 10,600 6,860 31 ---- 6,170 6,300
Monthly mean discharge, in cubic feet per second --------------------------------------- 12,110 8,682 5,342 Runoff, in inches-------------------~------------------------------------------------ 9.44 6.55 4.16
Gage height, in feet, and discharge, in cubic feet per second, at indicated time, .1973
Date Hour Gage Dis- Date Hour Gage Dis- Date Hour Gage Dis-Height charge Height charge Height charge
Mar. 14 _ 2:00a.m. 14.55 6,080 Mar. 17 _ 10:00 p.m. 21.04 51,600 Mar. 20 _ 4:00a.m. 20.31 41,900 12:00 m. 14.53 6,020 12:00 p.m. 21.15 53,400 8:00a.m. 20.16 40,300 12:00 p.m. 14.78 6,650 18 - 2:00a.m. 21.33 56,300 12:00m. 19.90 37,600
15 - 6:00a.m. 14.98 7,150 4:00a.m. 21.41 57,700 4:00p.m. 19.66 35,400 12:00 m. 15.17 7,710 6:00a.m. 21.50 59,000 8:QO p.m. 19.41 33,200 6:00p.m. 15.50 8,900 8:00a.m. 21.57 60,100 12:00 p.m. 19.24 31,700
12:00 p.m. 16.09 11,400 10:00 a.m. 21.65 61,400 21 - 4:00a.m. 19.00 29,500 16 - 6:00a.m. 16.68 14,100 12:00 m. 21.62 60,900 8:00a.m. 18.70 27,100
12:00 m. 17.09 16,000 1:00 p.m. 21.66 61,600 12:00m. 18.46 25,200 6:00p.m. 17.54 18,300 2:00p.m. 21.60 60,600 4:00p.m. 18.24 23,400
12:00 p.m. 18.18 22,900 4:00p.m. 21.65 61,400 8:00p.m. 17.98 21,300 17 - 2:00a.m. 18.46 25,200 6:00p.m. 21.58 60,300 12:00 p.m. 17.80 20,000
4:00a.m. 18.77 27,700 8:00p.m. 21.62 60,1)00 22 - 4:00a.m. 17.58 18,600 6:00a.m. 18.99 29,400 10:00 p.m. 21.56 60,000 8:00a.m. 17.36 17,300 8:00a.m. 19.32 32,400 12:00 p.m. 21.47 58,500 12:00 m. 17.13 16,200
10:00 a.m. 19.66 35,400 19 - 2:00a.m. 21.44 58,000 4:00p.m. 16.98 15,400 12:00 m. 19.90 37,600 4:00a.m. 21.39 57,200 8:00p.m. 16.78 14,500
2:00p.m. 20.13 39,900 8:00a.m. 21.14 53,200 12:00 p.m. 16.62 13,800 4:00p.m. 20.46 43,600 12:00 m. 21.01 51,200 23 - 12:00m. 16.21 11,900 6:00p.m. 20.65 46,100 4:00p.m. 20.88 49,300 12:00 p.m. 15.92 10,600 8:00p.m. 20.83 48,600 8:00p.m. 20.62 45,700 24 - 12:00 m. 15.60 9,300
12:00 p.m. 20.49 43,900 12:00 p.m. 15.40 8,500
Period Highest mean discharge, in cubic feet per second, for the indicated number of consecutive days 1 3 7 15 30
March-May 1973 ------------------ 59,200 49,300 34,200 20,000 13,100 1930-72 -------------------------- 55,100 49,300 37,600 22,600 16,200 Recurrence interval, in, years, for
1973 flood volum~ --------------- 50 40 30 25 15
MISSISSIPPI RIVER MAIN STEM
(46) 07032000 Mississippi River at Memphis, Tenn.
Location.-Lat 35°07'37", long 90°04'25", on left bank 50 feet (15 m) downstream from Harahan Bridge at Memphis, Shelby County, 1.3 miles (2.1 km) downstream from Be:ale S·treet gage, 3.5 miles (5.6 km) downstream from Wolf River, 70 miles (113 km) up·stream from St. Francis. River and at mile 734.8 (1,182.3 km).
Drainage area.-H32,800 mi2 (2,416,000 km2), approximately.
Gage.-Water-stage recorder. Datum of gage is 183.91 ft (56.056 m) above mean sea level, datum of 1929, 184.21 ft (56 .. 147 m) above mean Gulf level (1912 Mis·sistsippi River Commission), and 190.86 ft (58.174 m) on Memphis datum (1881 Missis,sip.pi River Commission). Prior to April 16, 1934, Beale Street staff gage 1.3 miles (2.1 km) upstream at same· datum. April 16 to December 21, 1934, staff gage 1,000 ft (305 m) downstream at same datum.
Flood stage.-34.0 ft (10.4 m). 1973 flood exceeded flood stage for 63 consecutive days (MaTch 24 to May 25). Maxima.-March-June 1973: Discharge, 1,633,000 ft3/s (46,200 m 8/s) April1-2 [gage height, 40.03 ft (12.201 m)]. Maximum
sta~e was 40.48 ft (12.338 m) May 8. Recurrence interval of di.s.charge is 20 years (based on figure 30). January 1933 to February 1973: Discharge, 1,980,000 fe;s (56,100 m 3/s) Feb. 8, 1937; maximum gage height, 48.69 ft
(14.841 m), Feb. 10, 1937. Maximum stage known prior to 1937, about 45.2 ft (13.78 m) on Apr. 9, 1913.
Remarks .. -Streamflow is affected by many reservoirs, navigation dams, and diversions.
THE FLOODS 117
TABLE 12.-Station descriptions and discharge and suspended-sediment data-Continued
Stage, in feet, and discharge in cubic feet per second
March April May June Day Stage Discharge Stage Discharge Stage Discharge Stage Discharge
1 14.81 504,000 40.03 1,630,000 38.57 1,440,000 28.40 944,000 2 14.22 490,000 40.02 1,630,000 39.18 1,490,000 28.70 947,000 3 13.72 478,000 40.05 1,620,000 39.40 1,510,000 29.05 952,000 4 13.58 477,000 40.28 1,620,000 39.65 1,520,000 29.29 953,000 5 13.73 483,000 40.31 1,610,000 39.86 1,540,000 29.42 967,000 6 13.98 492,000 40.29 1,590,000 39.98 1,540,000 29.60 984,000 7 14.47 508,000 40.24 1,570,000 40.32 1,560,000 29.70 998,000 8 14.80 527,000 40.10 1,540,000 40.43 1,570,000 29.77 997,000 9 16.10 576,000 40.00 1,520,000 40.35 1,540,000 29.72 992,000
10 18.13 650,000 39.68 1,480,000 40.18 1,550,000 29.60 983,000 11 21.07 756,000 39.30 1,480,000 40.10 1,560,000 29.45 974,000 12 23.14 838,000 39.06 1,480,000 39.95 1,540,000 29.30 963,000 13 24.97 890,000 38.80 1,460,000 39.65 1,520,000 29.20 954,000 14 26.73 949,000 38.51 1,430,000 39.30 1,490,000 29.00 943,000 15 28.04 992,000 38.25 1,410,000 38.95 1,470,000 28.67 926,000 16 29.59 1,050,000 38.05 1,390,000 38.36 1,430,000 28.07 899,000 17 30.33 1,070,000 37.60 1,360,000 37.85 1,390,000 27.10 860,000 18 31.12 1,090,000 37.39 1,350,000 37.38 1,370,000 25.90 816,000 19 32.00 1,120,000 37.24 1,340,000 36.87 1,340,000 24.70 774,000 20 32.93 1,150,000 37.70 1,370,000 36.45 1,320,000 23.71 741,000 21 34.00 1,200,000 37.53 1,360,000 35.95 1,300,000 23.00 716,000 22 35.09 1,260,000 37.49 1,370,000 35.13 1,240,000 22.50 701,000 23 36.37 1,330,000 37.72 1,390,000 34.43 1,210,000 22.30 695,000 24 37.59 1,400,000 37.61 1,380,000 33.27 1,140,000 22.39 699,000 25 38.20 1,460,000 37.65 1,390,000 32.25 1,080,000 22.61 706,000 26 38.80 1,510,000 37.74 1,410,000 30.60 1,010,000 22.71 709,000 27 39.11 1,530,000 37.92 1,430,000 29.37 967,000 22.45 700,000 28 39.37 1,550,000 38.13 1,440,000 28.30 931,000 21.74 681,000 29 39.55 1,580,000 38.28 1,440,000 27.82 918,000 20.55 644,000 30 39.65 1,610,000 38.43 1,440,000 27.83 925,000 19.42 607,000 31 39.82 1,620,000 28.06 940,000
Monthly mean discharge, in cubic feet per second ---------
Runoff, in thousands of 1,005,000 1,464,000 1,334,000 848,000
acre-feet ----------- 61,770 87,140 82,020 50,430
Period Highest mean discharge, in cubic feet per second, for the indicated number of consecutive days 1 3 7 15 30
March-June 1973 ------------------ 1,633,000 1,627,000 1,621,000 1,583,000 1,497,000 1934-72 ---------------------- 1,970,000 1,960,000 1,950,000 1,900,000 1,750,000
Recurrence interval, in years, for 1973 flood volumes --------------- 20 30 30 40
NONCONNAH CREEK BASIN (47) 07032200 Nonconnah Creek near Germantown, Tenn.
Location.-Lat 35°02'59", long 89°49'08", Shelby County, on left bank at downstream side of bridge on Winche·ster Road, 2.6 miles (4.2 km) south of Germantown and 17.3 miles (27.8 km) upstream from mouth.
Drainage area.-68.2 mi2 (176.6 km2).
Gage.-Water-stage reoorder. Datum of gage is 262.9'2 ft (80.138 m) above mean sea level, datum of 1929, supplemenrtary adjustment of 1955.
Bankfull stage.-Approximately 25 ft (7.6 m). Maxima.-March-May 1973: Discharge, 8,2'60 ft3/s (.234 m 3/s) 1:15 a.m., Apr. 20 [gage height 25.08 (7.644 m) I. Recurrence
inteTVal of discharge is 25 ye·ars. 1969 to February 1973: Discharge 7,260 ft3 /s (206 m3/s) Dec. 10, 1972 [gage height 23.43 ft (7.141 m)].
Mean discharge, in cubic feet pm· second, .1973 -----------------
Day March April May Day March April May Day March Apt·il May
1 6.6 56 16 11 1,570 16 14 21 12 439 1.6 2 268 19 1,450 12 187 11 14 22 7.8 306 1.3 3 82 13 657 13 36 6.6 7.0 23 5.8 2,840 3.2 4 26 12 151 14 502 5.0 4.2 24 181 1,570 2.4 5 28 10 41 15 1,190 4.3 3.2 25 163 729 1.0 6 1,010 9.0 25 16 1,210 54 2.8 26 51 136 .86 7 1,090 232 1,230 17 380 14 2.4 27 23 175 846 8 136 142 831 18 62 735 2.2 28 16 51 148 9 30 232 99 19 27 723 1.9 29 15 25 11
10 537 46 22 20 18 4,080 1.9 30 13 17 3.3 31 436 1.7
Monthly mean discharge, in cubic feet per second _________________ _: _____________________ 301 424 181 Runoff, in inches -------------------------------------------------------------------- 5.07 6.91 3.04
118 THE 1973 MISSISSIPPI RIVER BASIN FLOOD
TABLE 12.-Station descriptions and discharge and suspended-sediment data-Continued
Date Hour
Apr. 19 _ 2:00 a.m. 12:00 m. 6:00p.m. 8:00p.m.
10:00 p.m. 12:00 p.m.
20 _ 3:00a.m. 2:00a.m. 4:00a.m. 6:00a.m. 8:00a.m.
10:00 a.m. 12:00 m.
2:00p.m. 4:00p.m. 6:00p.m. 8:00p.m.
Gage height, in feet, and discharge, in cubic feet per second, at indicated time, .1973
Gage height
7.18 6.30 6.08 7.87
14.64 21.57 25.08 24.82 23.63 22.52 21.70 20.19 16.82 12.61 10.73
9.90 9.18
Discharge
488 190 125 711
2,860 6,160 8,260 8,090 7,380 6,710 6,240 5,400 3,770 2,130 1,570 1,320 1,100
Date Hour
Apr. 20 _ 10:00 p.m. 12:00 p.m.
21 _ 2:00a.m. 4:00a.m.
12:00 m. 12:00 p.m.
22 _ 2:00a.m. 12:00 m. 4:00p.m.
12:00 p.m. 23 _ 2:00a.m.
4:00a.m. 6:00a.m. 8:00a.m.
10:00 a.m. 12:00m.
2:00p.m.
Gage height
9.09 8.96 8.65 8.32 6.72 6.07 6.02 5.92 7.21 8.22 8.14 7.90
13.52 18.94 20.05 19.60 18.72
Discharge
1,080 1,040
945 846 327 122 110
90 498 816 792 720
2,430 4,770 5,330 5,100 4,660
ST. FRANCIS RIVER BASIN
Date Hour
Apr. 23 _ 4:00p.m. 6:00p.m. 8:00p.m.
10:00 p.m. 12:00 p.m.
24 _ 2:00a.m. 12:00m.
2:00p.m. 4:00p.m. 5:45p.m. 6:00p.m. 8:00p.m.
10:00 p.m. 12:00 p.m.
25 _ 2:00a.m. 12:00 m. 12:00 p.m.
(48) 07042500 Little River ditch 251 near Lilbourn, Mo.
Gage height
16.85 13.68 11.20
9.87 9.06 8.72 7.86 9.51
14.41 15.20 15.20 14.87 13.17 10.61
9.30 7.95 6.51
Discharge
3,780 2,490 1,710 1,310 1,0,70
966 708
1,200 2,760 3,080 3,080 2,950 2,310 1,530 1,140
735 254
Location.-Lat 36°33'19", long 89°40'10", on line between sees. 8 and 17, T. 2.2 N., R. 13 E., New Madrid County, on right bank 150 ft (46 m) upstream from bridge on U.S. Highway 62, 3.7 miles (6.0 km) southwest of Lilbourn, and 4 mile's (6.4 km) northwest of Marston.
Drainage area.-235 mi2 ( 609 km2
).
Gage.-Digital water-stage recorde·r. Datum of gage is 263.46 ft (80.303 m) above mean sea level (levels by Missouri State Hi~hway Commission). Prior to Oc.t. 27, 1967, nonrecording gage at pres.ent site and datum.
Flood .sitage.-14 ft (4.3 m). Maxima.-March-M.ay 1973: Discharge, 5,200 ft3/s (147 m 3/s) 3:15 a.m., Apr. 20 [gage height 13.00 ft (3.962 m) j, Maxi
mum gage height, 13.07 ft (3.984 m) 0600 hours Apr. 23. Di,scharge exceeded the 100-year flood. October 1945 to February 1973: Discharge, 3,530 ft3/s (100 m 3/s) March 10, 1964 [gage height, 15.00 ft (4.572 m) ].
Maximum gage height, 15.16 ft (4.6.21 m) Feb. 15, 19·50. Flood in, .June 1945 reached a stage of 15.6 ft ( 4.75 m), from floodmark [discharge, 3,200 ft3 /s (90.6 m~/s)].
1 2 3 4 5 6 7 8 9
10
Day March
280 270 260 260 250 250 500 374 300 400
April
963 889 743 786 605 535 605 723 740 696
May
1,080 3,760 2,670 1,710 1,050
856 1,270 1,370
964 814
Mean discharge, in cubic feet per second, .1973
Day
11 12 ----13 14 ----15 16 17 18 19 20
March
3,000 2,500 2,040 1,260 1,180
942 887 795 680 719
April
563 509 464 433 422 426 425
1,090 2,100 4,410
May
1,280 955 703 618 574 560 528 510 499 480
21 22 23 24 25 26 27 28 29 30
Day March
817 703 603 556 575 564 507 482 475 483
31 Monthly mean discharge, in cubic feet per second ---------------------------------------
1,810 797
3.91 Runoff, in inches --------------------------------------------------------------------
Date Hour
Apr. 18 _ 2:00a.m. 8:00a.m.
12:00 m. 2:00p.m. 6:00p.m.
12:00 p.m.
19 _ 2 00 a.m. 10 00 a.m. 12 OOm. 2 00 p.m. 4 00 p.m.
Gage height, in feet, and discharge, in cubic feet per second, at indicated time, 1973
Gage height
3.54 4.55 6.14 6.63 7.09 6.84
6.63 5.72 6.68 9.46
11.36
Discharge
462 765
1,240 1.390 1,530 1,450
1,390 1,120 1,000 2,360 3,620
Date Hour
Apr. 19 _ 6 00 p.m. 8 00 p.m.
10 00 p.m. 12 00 p.m.
20 _ 2 00 a.m. 6 OOa.m.
12 OOm. 6 00 p.m.
10 00 a.m. 12 00 p.m.
Gage height
12.38 12.72 12.89 12.94
12.96 13.00 12.90 12.78 12,65 12.57
Discharge
4,580 4,920 5,090 5,140
4,500 4,540 4,440 4,320 4,190 4,120
Date Hour
Apr. 21 _ 2:00a.m. 8:00a.m. 2:00p.m. 8:00p.m.
10:00 p.m. 12:00 p.m.
22 _ 4:00a.m. 6:00a.m.
10:00 a.m. 6:00p.m.
12:00 p.m.
April
3,150 2,930 3,980 3,110 2,080 1,290 1,070
906 820 736
1,270 6.05
Gage height
12.40 12.11 11.98 11.61 11.40 11.18
10.60 10.32 11.75 12.19 12.68
May
455 450 582
1,020 639 499
1,080 1,010 1,010 1,020
918 998
4.90
Discharge
3,510 3,240 3,130 2,840 2,690 2,560
2,340 2,240 2,920 3,290 3,730
THE FLOODS 119
TABLE 12.-Station descriptions and discharge and suspended-sediment data-Continued
Gage height, in feet, and discharge, in cubic feet per second, at indicated time, .1973
Date Hour Gage Dis- Date Hour Gage Dis-height charge height charge
Apr. 23 _ 2:00a.m. 12.92 3,910 Apr. 25 _ 12:00m. 9.15 2,080 12:00 m. 13.07 4,050 6:00p.m. 8.20 1,750
6:00p.m. 13.07 4,050 12:00 p.m. 7.29 1,440 8:00pm .. 12.90 3,890
12:00 p.m. 12.70 3,710
24 - 6:00a.m. 12.48 3,490 12:00m. 12.09 3,140 6:00p.m. 11.62 2,780
12:00 p.m. 10.93 2,430
25 - 6:00a.m. 10.01 2,380
May 1 - 6:00a.m. 4.23 670 May 3 - 10:00 a.m. 10.44 2,840 12:00m. 4.46 740 12:00 m. 10.21 2,680
6:00p.m. 6.67 830 6:00p.m. 9.56 2,400 8:00p.m. 7.92 1,820 10:00 p.m. 9.14 2,250
10:00 p.m. 8.92 2,170 12:00 p.m. 10.12 2,620 4 - 8:00a.m. 7.86 1.800
12:00m. 7.61 1,710 2 - 2:00a.m. 11.09 3,380 6:00p.m. 6.86 1,460
4:00a.m. 11.53 3,780 12:00 p.m. 6.22 1,270 12:00m. 11.90 4,110 10:00 p.m. 11.45 3,700
Period Highest mean discharge, in cubic feet per second, for the indicated number of consecutive days 1 3 7 15 30
March-May 1973 ---------------- 4,410 3,500 3,110 2,270 1,610 1946-72 -------------------- 3,490 3,460 3,220 2,840 2,140
Recur.rence interval, in years, for 1973 flood volumes ------------- >100 20 10 10 10
WHITE RIVER BASIN (49) 07072500 Black River at Black Rock, Ark.
Location.-Lat 36°06'15", long 9'1°05'50", in NW14 sec. 21, T. 17 N., R. 1 W., Lawrence County, on right bank 900' ft (274 m) downstream from St. Louis-San Francisco Railway bridge at Black Rock, 3.7 mile-s (6.0 km) downstream from S'Pring River, and at mile 68.3 (109.9 km).
Drainage are,a.-7,369 mi2 (19,090 km2).
Gage.-Nonrecording gage read twice daily, more often during rises .. Datum of gage is 229.56 ft (69.970 m) abo;ve mean sea level. Prior to Aug. 1, 1946, at site 900ft (274 m) upstream at same datum.
Flood sta.ge.-20 ft ( 6.1 m). Maxima.-March-May 1973: Dis.charge, 105,000 ft3/s; (2.,970 m 3/s) 2:00 a.m. April 24 [gage height, 29.94 ft (8.912· m)].
Recurrence interval of discharge is 20 years. 1929 to 1931; 1940 to Feb. 1973: Discharge, 103,000 ft3
/ s (2,9.20 m 3/s) Jan. 25, 1949 [gage height, 28.5 ft (8.69 m) ]. Remarks.-Flow slightly regulated by Clearwater Lake (Missouri), 189 miles (304 km) upstream, since June 3, 1948 [capa
city, 413,700 acre~-ft ( 510 hm3)].
Mean discharge, in cubic feet per second, .1973
Day March April May Day March April May Day March April May
1 8,850 33,800 46,600 11 40,200 26,400 37,000 21 33,000 50,200 19,700 2 8,530 29,400 52,800 12 43,900 24,600 38,000 22 29,500 51,500 18,600 2 8,380 26,800 49,900 13 34,400 23,900 37,400 23 27,200 84,700 19,500 4 8,280 25,800 40,100 14 33,300 23,100 34,700 24 25,600 98,900 20,000 5 8,250 25,000 35,700 15 38,600 22,900 32,000 25 26,700 87,500 18,900 6 8,410 24,000 37,200 16 43,500 23,800 29,600 26 28,000 86,800 17,600 7 15,000 23,400 42,900 17 43,500 23,800 26,800 27 26,000 83,300 22,500 8 15,500 23,300 45,400 18 41,000 24,900 24,600 28 24,300 73,500 34,600 9 15,000 25,000 45,600 19 38,300 30.000 22,800 29 23,700 63,700 30,500
10 24,500 27,900 40,000 20 35,600 46;400 21,100 30 23,500 54,100 25,000 31 32,100 22,200
Monthly mean discharge, in cubic feet per second ------------------------------- 26,210 42,280 31,910 Runoff, in inches ____________________________________________________________ 4.13 6.44 5.02
120 THE 1973 MISSISSIPPI RIVER BASIN FLOOD
TABLE 12.-Station descriptions and discharge and suspended-sediment data-Continued
MISSISSIPPI RIVER MAIN STEM (50) 07265450 Mississippi River near Arkansas City, Ark.
Location.-Lat 33°33'55", long 91 °14'35", sec. 18, T. 13 S., R.1 W., on right bank 3 miles (4.8 km) southwest of Arkansas City, and at mile 554.1 (891.5 km) above He1ad of Passes.
Drainage area.-1,130,600 mF (2,928,300 km2) 22,240 mi2 (57,600 km2
) non-contributing. Gage.-Staff gage. Datum of gage is 96.66 ft (29.462 m) above mean sea level, datum of 1929, supplementary adjustment
of 1941. Flood stage.-44 ft (13.4 m). Maxima.-March-June 1973: Discharge, 1,880,000 ft3
/ (53,200 m 3/s) May 12 [gage height 47.62 ft (14.515 m)]. November 1879 to February 1973: iDscharge, 2,159,000 fe;s (61,100 m3/s) Feb. 16, 19·37 [maximum gage height, 53.86
ft (16.417 m) on Felb. 17, 1937, a dis,charge of about 2,472,000 ft3/s (70,000 m3/s) occurred in early May, 1927]. Remarks.-Stati:on was included for Uise in sediment analysis.
Average velocity, water temperature, stage, water discharge, suspended sediment, and bed material
Average Water Suspended sediment Bed material Date veioctiy tempera- Stage Discharge Concentration, mg/1 Discharge p cent (mm)
(fps) ture (ft) (1,000 ft!l/s) (1 000 er (oC) Right Middle Left Average ton;/day) sand Dta Dso DB4
March 2 ------------------- 4.53 6.5 23.82 662 191 258 172 207 388 36 0.26 0.34 2.42 5 ------------------- 4.10 8.0 22.24 597 194 276 143 204 328 43 .26 .34 .45
12 ------------------- 5.50 10.5 27.47 870 524 551 454 510 1,272 25 .29 .41 .67 30 ------------------- 7.88 12.0 42.01 1,680 263 273 252 262 1,229 35
April 2 ------------------- 8.04 13.0 42.98 1,730 230 240 263 244 1,241 42 .27 .36 .49 9 ---·----·------------ 7.75 12.0 44.08 1,790 185 236 248 223 1,148 40 .26 .36 .48
16 ------------------- 7.32 115 43.76 1,700 216 288 309 271 1,316 43 .56 4.28 6.32 25 ------------------- 7.19 14:5 44.89 1,760 184 195 252 210 1,050 51 .29 .66 2.83 30 -------------·------ 7.40 15.5 46.04 1,820 212 228 381 274 1,435 51 .29 .38 .51
May 8 ------------------- 7.10 17.0 47.13 1,840 178 214 344 245 1,261 45 .21 2.20 3.00 14 ------------------- 6.98 18.5 47.401 1,810 175 212 250 212 1,099 47 .26 .37 .67j 23 ------------------- 6.86 19 0 44.78 1,670 134 182 186 167 805 40 .36 1.36 4.09 28 ------------------- 6.50 2o:o 41.76 1,480 143 163 182 163 695 42 .22 .31 .53
June 4 ------------------- 5.46 21.0 36.55 1,200 206 246 227 226 736 37 .26 .35 .50 12 ------------------- 5.31 23.0 36.66 1,170 190 207 249 215 689 35 .29 .37 .50 18 ------------------- 5.27 25.0 34.82 1,090 206 221 208 212 624 38 .27 .35 .48 25 ------------------- 4.94 26.0 30.09 877 191 362 218 257 654 18 .30 .38 .51
YAZOO RIVER BASIN (51) 07272000 Sardis Lake near Sardis, Miss.
Location.-Lat 34°23'57", long 89°47'10", in NE%SW% sec. 12, T. 8 S., R. 6 W., Chickasaw meridian, Panola County, in gatehouse of dam on Little Tallahatchie River, 7.5 mile,s (12.1 km) southeast of Sardis,, and 25.7 miles (41.4 km) upstream from head of Panola-Quitman Floodway.
Drainage area.~1,545 mi2 ( 4,000 km2
).
Gage.-·Water-s,tage recorder. Datum of gage is at mean s1ea level (levels by Corps of Engineers.). Prior to Oct. 1, 19·58, at datum 219.43 ft (66.882 m) above mean sea level.
Maxima.-March-May 1973: Contents, 1,840,700 acre-ft (2.270 hm3) April 28 (elevation 2'85.83 or 87.12,1 m).
1939 to F·ebruary 1973: Contents, 1,394,100 acre-ft (1,720 hm3) May 14, 1970 (elevation, 278.32 ft or 84.832 m).
Remarks.-Re·servoir is formed by hydraulic-fill earth dam, with concrete spillway and outlet tunnel on opposite ends of dam. Storage began Aug. 26, 1939; dam completed Aug. 1, 1940. Capacity, 1,569,900 acre-ft (1,940 hm3
) at elevation 281.4 ft of 85.77 m (crest of spillway), of which about 1,478,000 acre-ft (1,820 hm3
) is available for flood-contml storage and about 108,000 acre-ft (133 hm3
) of s.tora.ge is' maintained in conservation pool f·or incidental recreational purposes at elevation 236.0 ft or 71.9·3 m (16.6 ft or 5.06 m above sill of outlert tunnel). Water below elervation 219.4 ft (66.87 m) cannot be withdrawn through outlet tunnel. Figures given herein re pTesent total contents.
[Elevation, in feet, and contents, in thousands of acre-ft, at 8:00 a.m., 1973]
March April May Day Elevation Contents Elevation Contents Elevation Contents
1 -------------- 273.8 1,160.4 284.4 1,747.4 285.4 1,810.7 2 -------------- 273.6 1,153.7 284.4 1,748.7 285.2 1,798.0 3 -------------- 273.6 1,151.3 284.3 1,745.5 285.0 1,787.8 4 -------------- 273.6 1,150.8 284.2 1,739.3 284.9 1,781.5 5 -------------- 273.6 1,151.8 284.1 1,732.3 284.8 1,774.5
6 -------------- 273.6 1,152.3 284.0 1,726.7 284.6 1,765.1 7 -------------- 273.6 1,153.2 283.9 1,721.1 284.5 1,755.6 8 -------------- 273.8 1,160.9 283.9 1,720.5 284.4 1,751.8 9 -------------- 273.9 1,168.1 284.0 1,722.3 284.4 1,748.7
10 -------------- 274.0 1,169.1 283.9 1,716.7 284.3 1,743.0
11 -------------- 274.0 1,172.5 283.8 1,714.3 284.2 1,735.5 12 -------------- 274.4 1,189.1 283.7 1,708.1 284.1 1,729.2 13 -------------- 274.9 1,217.2 283.6 1,702.6 284.0 1,726.1 14 -------------- 275.2 1,230.7 283.5 1,695.8 283.9 1,717.4 15 -------------- 276.1 1,278.4 283.4 1,688.5 283.8 1,710.6
16 -------------- 279.3 1,448.2 283.3 1,681.7 283.6 1,702.0 17 -------------- 282.4 1.630.3 283.3 1,681.7 283.5 1,692.8
THE FLOODS 121
TABLE 12.-Station descriptions and discha'tge and suspended-sediment data-Continued
March April May Day Elevation Contents Elevation Contents Elevation Contents
18 -------------- 284.0 1,721.7 283.3 1,684.2 283.4 1,684.8 19 -------------- 284.2 1,739.3 283.4 1,690.9 283.2 1,676.2 20 -------------- 284.2 1,739.9 283.6 1,700.1 283.1 1,668.3
21 -------------- 284.2 1,738.6 283.6 1,701.4 283.0 1,662.8 22 -------------- 284.2 1,736.1 283.6 1,698.9 282.9 1,656.1 23 -------------- 284.1 1,733.0 283.7 1,705.7 282.8 1,648.3 24 -------------- 284.1 1,728.6 284.8 1,772.0 282.7 1,642.9 25 -------------- 284.1 1,733.0 285.3 1,808.2 282.6 1,641.7
26 -------------- 284.2 1,739.3 285.6 1,826.7 282.6 1,637.5 27 -------------- 284.3 1,741.8 285.8 1,836.3 282.5 1,632.1 28 -------------- 284.2 1,739.3 285.8 1,840.7 282.6 1,641.7 20 -------------- 284.2 1,734.2 285.8 1,836.3 282.8 1,652.5 30 -------------- 284.1 1,733.0 285.6 1,824.7 282.8 1,651.3 31 -------------- 284.2 1,738.6 282.7 1,646.5
YAZOO RIVER BASIN (52) 07274500 Enid Lake near Enid, Miss.
Location.-Lat 34°09'29", long 89°54'14", in SW1,4.NE.1.4 s'ec. 2, T. 11 S., R. 7 W., Chickasaw meridian, Yaloibusha County, in gatehous'e of dam on Yocona River, 0.8 mile (1.3 km) upstream from U.S. Highway 51, 2.8 miles' (4.5 km) upstream from Illinois Central Railroad bridge, 3.2 miles (5.1 km) northeast of Enid, and 13.5 miles (21.7 km) upstream from the mouth of Yocona River.
Drainage area.-560 mF (1,450 km2).
Gage.-Water-stage recorder. Datum of gage is. at mean sea level (levels by Corps of Engineers). Prior to May 24, 1952, nonrecording gage at same site. Prior to Oct. 1, 1958, at datum 200.00 ft (60.9·60 m) above mean s'ea level.
Maxima.-March-May 1973: Contents, 752,600 acre-ft (927 hm3) April 27 (elevation, 271.17 ft or 82.653 m).
1951 to February 1973: Contents, 642,000 acre-ft (792 hm 3) May 13, 1970 (elevation, 267.35 ft or 81.488 m).
Remarks.-Re:servoir is formed by rolled-filled earth dam with concrete spillway and outlet tunnel. Storage began July 16, 1951. Capacity, 660,000 acre-ft (814 hm3
) at elevation 268.0 ft or 81.68 m (cre·st of spillway) of which about 602,400 acre-ft (743 hm3
) is. available for flood control and about 57,600 acre-ft (71.0 hm3) of storage is maintained in conserva
tion pool for incidental recreational purposes at elevation 2 30.0 ft or 70.10 m (25 ft or 7.6 m above sill of outlet tunnel). Water below elevation 205.0 ft (62.48 m) cannot be: withdrawn through outlet tunnel. F'igures given herein represent total contents.
[Elevation, in feet, and contents, in thousands of acre-ft, at 8:00 a.m., 1973]
March April May Day Elevation Contents Elevation Contents Elevation Contents
1 -------------- 256.2 381.9 269.6 704.4 270.8 742.0 2 -------------- 256.2 380.4 269.6 705.2 270.7 738.7 3 -------------- 256.3 382.7 269.5 704.1 270.7 737.2 4 -------------- 256.3 382.9 269.4 700.9 270.6 734.2 5 -------------- 256.4 384.9 269.3 698.0 270.5 731.8
6 -------------- 256.4 384.3 269.2 694.8 270.3 727.6 7 -------------- 256.8 393.4 269.2 694.2 270.3 727.0 8 -------------- 256.9 395.4 269.2 695.1 270.3 727.0 9 -------------- 256.9 395.6 269.1 691.9 270.3 725.2
10 -------------- 256.9 395.2 269.1 690.4 270.2 722.9
11 -------------- 257.7 410.6 269.0 689.3 270.1 719.9 12 -------------- 258.5 427.6 268.9 685.2 270.1 720.2 13 -------------- 258.7 431.S 268.8 683.3 270.0 717.2 14 -------------- 258.7 432.6 268.7 679.3 269.9 713.7 15 -------------- 261.0 481.8 268.6 675.6 269.7 709.3
16 -------------- 264.4 563.7 268.5 675.3 269.6 704.4 17 -------------- 266.7 623.8 268.6 676.1 269.4 698.5 18 -------------- 267.7 652.2 268.6 677.3 269.2 692.7 19 --------------· 268.0 658.9 268.8 682.1 268.9 686.1 20 -------------- 268.1 663.1 268.8 683.0 268.9 686.1
21 -------------- 268.2 666.5 268.8 681.3 268.8 682.1 22 -------------- 268.3 669.3 268.6 678.4 268.6 676.4 23 -------------- 268.4 671.6 268.6 677.3 268.4 670.2 24 -------------- 268.5 673.0 269.4 698.5 268.5 675.0 25 -------------- 268.9 685.0 270.5 731.2 268.4 671.9
122 THE 1973 MISSISSIPPI RIVER BASIN FLOOD
TABLE 12.-Station descriptions and dischm·ge and suspended-sediment data-Continued
March April May Day Elevation Contents Elevation Contents Elevation Contents
26 -------------- 269.0 689.6 270.8 742.3 268.3 667.1 27 -------------- 268.2 692.7 271.1 750.8 268.1 664.0 28 -------------- 269.2 694.2 271.2 752.0 268.5 673.0 29 -------------- 269.2 695.6 271.1 749.5 268.4 672.2 30 -------------- 269.3 696.8 270.9 745.3 268.3 668.5 31 -------------- 269.5 704.1 268.1 664.0
YAZOO RIVER BASIN (53) 07278000 Arkabutla Lake near Arkabutla, Miss.
Location.-Lat 34°45'26", long 90°07'27", in SW1,4, sec. 2, T. 4 S., R. 9 W., Chickasaw meridian, De Soto County, in gatehouse of dam on Coldwater River, 4 miles (6.4 km) north of Arkabutla, and 54.3 miles (87.4 km) upstream from the mouth of Coldwater River.
D:vainage area.-1,000 mF (2,590 km2), approximately.
Gage.-Water-stage re,corder. Datum of gage is at mean sea level (levels by Corps of Engineers). Prior to July 1, 1942, nonrecording gage .at same site. Prior to Oct. 1, 1958, at datum 191.18 ft (58.272 m) above mean sea level.
Maxima.-March-May 1973: Contents, 702,800 acre-ft (867 hma) April 25 (elevation, 243.08 ft or 74.091 m). 1941 to February 1973: Contents, 649,900 acre-ft (801 hm3
) May 21, 1953 (elevation, 241.74 ft or 73.682 m). Remarks.-Re,servoir is formed by rolled-filled earth dam with concrete spillway and outlet tunnel. Storage began Aug.
14, 1941. Dam c-ompleted Aug. 31, 1945. Capacity, 525,300 acre-ft (648 hma) at elevation 238.3 ft or 72.63 m (cre,st of spillway), of which about 493,800 acre-ft (609 hm3
) is available for fiood-·control storage and about 31,500 acre-ft (38.8 hm3
) is maintained in conservation pool for incidental recreational purposes at elevation 209.3 ft or 63.79 m (18 ft or 5.5 m above sill of outlet gate·s,). Water below elevation 191.3 ft (58.31 m) cannot be withdrawn through outlet tunnel. Figures given herein represent total contents.
[Elevation, in feet, and contents, in thousands of acre-ft, at 8:00 a.m., 1973]
March April May Day Elevation Contents Elevation Contents Elevation Contents
1 -------------- 228.0 251.4 236.7 473.6 241.5 641.0 2 -------------- 227.7 246.8 236.7 474.5 241.4 636.0 3 -------------- 228.1 254.3 236.7 474.8 241.5 641.4 4 ------------·-- 228.1 253.7 236.7 473.6 241.5 639.1 5 -------------- 228.0 251.0 236.6 471.7 241.3 632.6
6 -------------- 227.7 246.6 236.6 469.9 241.1 626.2 7 -------------- 228.3 259.0 236.5 468.6 241.1 626.2 8 -------------- 229.5 283.2 236.6 469.6 241.6 643.7 9 -------------- 229.4 281.7 236.6 469.6 241.5 640.2
10 -------------- 229.4 281.0 236.5 468.6 241.3 633.7
11 -------------- 230.0 296.1 236.5 468.0 241.2 627.7 12 -------------- 231.2 323.0 236.4 464.9 241.0 622.7 13 -------------- 231.1 321.6 236.3 462.1 240.8 616.0 14 -------------- 231.0 318.2 236.2 457.8 240.7 609.4 15 -------------- 231.5 330.3 236.0 452.9 240.5 602.4
16 -------------- 233.1 371.1 236.0 451.4 240.3 595.8 17 -------------- 234.4 406.7 236.0 452.0 240.1 587.8 18 -------------- 234.9 419.7 236.1 454.4 239.9 581.3 19 -------------- 235.2 428.1 236.5 467.7 239.7 574.2 20 -------------- 235.3 432.8 238.8 542.5 239.5 568.6
21 -------------- 235.4 435.4 240.3 594.4 239.4 562.3 22 -------------- 235.5 437.2 240.6 606.5 239.2 555.3 23 -------------- 235.5 438.2 241.1 625.4 239.0 548.7 24 -------------- 235.6 439.5 242.4 677.2 238.8 544.6 25 -------------- 236.0 451.1 243.1 702.8 238.7 538.1
26 -------------- 236.1 456.6 243.0 698.3 238.4 530.3 27 -------------- 236.2 459.1 242.7 687.1 238.4 531.0 28 -------------- 236.3 461.2 242.4 675.6 238.7 539.1 29 -------------- 236.3 462.8 242.1 664.1 238.5 533.0 30 -------------- 236.4 464.9 241.8 652.5 238.3 526.6 31 -------------- 236.5 468.6 238.2 52{).9
THE FLOODS 123
TABLE 12.-Station descriptions and discharge and suspended-sediment data-Continued
YAZOO RIVER BASIN (54) 07284500 Grenada Lake near Grenada, Miss.
Location.-Lat 33°48'31", long 89°46'14', in NE14NE 14 sec. 4, T. 22 N., R. 5 E., Choctaw meridian, Grenada County, at gatehouse of dam on Yalobusha River, 2.2 miles (3.5 km) upstream from Batupan Creek, 3 miles (5 km) northeast of Grenada, and 63.6 miles (102.3 km) upstream from mouth of Yalobusha River.
Drainage area.-1,320 mi2 (3,418 km2), approximately.
Gage.-Water-stage recorder. Datum of gage is at mean sea level (levels by Corps of Engineers). Prior to Dec. 19, 1953, non.reco·rding gage at same site. Prior to Oct. 1, 1958, at datum 160.00 ft (48.768 m) above mean sea lev·ei.
Maxima.-March-May, 1973: Co·n:tents, 1,575,600 acre-ft (1,940 hm'1) April 28 (elevation 234.48 ft or 71.470 m). 1953 to February 1973: Contents, 1,189,800 acre-ft April 15, 16, 1962 (elevation, 228.62 ft or 69.683 m).
Remarks.-Reservoir is formed by a rolled-fill earth dam with concrete spillway and outlet tunnel. Storage began June 30, 1953. Capacity, 1,337,400 acre-ft (1,650 hm3
) at elevation 231.0 ft or 70.41 m (crest of spillway), of which about 1,251,700 acre-ft (1,540 hm3
) is available for flood-control storage and about 85,700 acre-ft (106 hma) of storage is maintained in conservation pool for incidental recreational purposes at elevation 193.0 ft or 58.83 m (.24 ft or 7.3 m above .sill of outlet gates). Water below 169.0 ft (51.51 m) cannot be withdrawn through outlet tunnel. Figures given herein represent total contents.
[Elevation, in feet, and contents, in thousands of acre-ft, at 8:00 a.m., 1973]
March April May Day Elevation Contents Elevation Contents Elevation Contents
1 -------------- 220.7 777.3 232.9 1,464.1 234.2 1,558.3 2 -------------- 220.6 772.4 233.0 1,468.9 234.2 1,553.3 3 -------------- 220.5 770.2 232.9 1,466.2 234.2 1,565.5 4 -------------- 220.5 770.2 232.9 1,461.4 234.3 1,564.8 5 -------------- 220.5 770.7 232.8 1,456.6 234.2 1,559.1
6 -------------- 220.5 769.3 232.7 1,451.8 234.2 1,552.6 7 -------------- 220.7 777.3 232.8 1,455.3 234.2 1,553.3 8 -------------- 220.8 784.4 233.0 1,469.6 234.4 1,567.7 9 -------------- 220.8 784.0 233.0 1,471.0 234.4 1,567.0
10 -------------- 220.8 782.6 233.0 1,469.6 234.3 1,561.2
11 -------------- 221.3 804.4 232.9 1,462.8 234.2 1,554.0 12 -------------- 222.2 849.5 232.8 1,454.6 234.2 1,554.0 13 -------------- 222.6 865.2 232.7 1,451.8 234.2 1,553.3 14 -------------- 222.7 872.4 232.6 1,444.4 234.1 1,546.8 15 -------------- 223.3 900.2 232.5 1,436.9 234.0 1,539.7
16 -------------- 226.4 1,059.4 232.5 1,438.9 233.8 1,529.8 17 -------------- 230.3 1,294.7 232.7 1,451.8 233.7 1,520.6 18 -------------- 231.3 1,357.7 232.8 1,457.3 233.6 1,512.2 19 -------------- 231.4 1,366.2 233.1 1,477.3 233.4 1,501.0 20 -------------- 231.5 1,370.8 233.1 1,478.7 233.5 1,503.1
21 -------------- 231.6 1,374.0 233.0 1,471.7 233.4 1,500.3 22 -------------- 231.6 1,377.3 232.9 1,464.1 233.3 1,491.2 23 -------------- 231.6 1,378.0 232.8 1,460.0 233.2 1,482.2 24 -------------- 231.7 1,381.3 233.2 1,484.9 233.1 1,476.6 25 -------------- 232.1 1,410.5 234.0 1,539.0 233.0 1,469.6
26 -------------- 232.4 1,430.8 234.2 1,555.5 232.9 1,464.1 27 -------------- 232.5 1,437.6 234.4 1,572.0 232.8 1,455.3 28 -------------- 232.5 1,438.9 234.5 1,575.6 232.8 1,453.9 29 -------------- 232.6 1,441.7 234.4 1,572.0 232.7 1,449.1 30 -------------- 232.7 1,448.4 234.3 1,565.5 232.6 1,441.0 31 -------------- 232.8 1,458.7 232.4 1,432.2
YAZOO RIVER BASIN (55) 07287000 Yazoo River at Greenwood, Miss.
Location.-Lat 33°31'17", long 90°11'03", in NE%SW 14 sec. 10, T. 19 N., R. 1 E., Choctaw me·ridian, Leflore County, on left bank 110 ft (33.5 m) downstream from bridge on U.S. Highways 49E and 82 (old) in Greenwood, 0.4 mile (0.6 km) downstream from Palusha Bayou, 3 miles (4.8 km) downstream from confluence of Little Tallahatchie and Yalobusha Rivers·, and at mile 170.8 (274.8 km).
Drainage area.-7,450 mi2 (19,300 km2), approximately.
Gage.-Water-stage recorder, and nonrecording gage read twice daily. Datum of gage is 92.07 ft (28.063 m) above mean sea level. Prior to Oct. 1, 1940, nonrecording gages. on highway bridges 110 ft (33 m) upstream at various datums.
*Flood stage.-35 feet (10.7 m). Maxima.-March-May 1973: Discharge, 43.800 ft3 /s (1,240 m 3/s) Mar. 20, 21 gage height, 38.37 ft (11.695 m) Mar. 2.1.
1907 to February 1973: Discharge, 72,900 fe;s (2,060 m3/s) Jan. 19, 1932 (gage height, 40.10 ft (12.2.22 m). Maximum stage known, 41.2 ft ( 12.56 m) in 1882, c-aused by ·OVerflow from Mississippi River (discharge not deter
mined), from reports of Mis.sissippi :&iver Commission.
124 THE 1973 MISSISSIPPI RIVER BASIN FLOOD
TABLE 12.-Station description and discharge and suspended-sediment data-Continued
Remarks.-Flow partly regulated since Aug. 26, 1939, by Sardis Lake on Little Tallahatchie River (see sta 07272000), Enid Lake on Yocona River (see station 07274500), Arkabutla Lake on Coldwater River (see station 07278000), and Grenada Lake on Yalobusha River (see station 07284500). Station data are included to show outflow from upstream impoundments; peak discharge was not exceptional.
*From reports of U.S. Department of Commerce, NOAA.
[Gage height, in feet, and discharge, in cubic feet per second, 1973]
March April May Day Gage Discharge Gage Discharge Gage Discharge
height height height
1 -------------- 31.6 20,500 36.9 33,700 34.3 27,700 2 -------------- 31.6 20,200 36.6 32,100 34.4 28,100 3 -------------- 31.6 20,000 36.4 30,700 34.9 28,600 4 -------------- 31.6 20,300 36.1 30,500 35.2 29,100 5 -------------- 31.7 20,500 35.8 30,400 35.4 29,700
6 -------------- 31.7 20,500 35.6 29,900 35.5 30,200 7 -------------- 32.2 21,000 35.4 29,300 35.8 30,800 8 -------------- 32.2 21,300 35.3 28,500 36.1 31,200 9 -------------- 32.2 21,800 35.2 27,800 36.2 31,500
10 -------------- 32.2 21,900 34.9 27,200 36.2 31,700
11 -------------- 33.5 22,700 34.6 26,400 36.3 81,900 12 -------------- 33.6 23,000 34.4 25,600 36.4 32,400 13 -------------- 33.7 23,400 34.1 24,900 36.5 32,500 14 -------------- 33.7 24,400 33.8 24,100 36.5 32,600 15 -------------- 34.1 26,900 33.5 24,000 3.6.4 32,600
16 -------------- 36.0 27,800 33.4 23,800 36.3 32,300 17 -------------- 36.5 32,500 33.4 23,700 36.2 31,500 18 -------------- 37.3 39,200 33.2 24,000 36.0 30,400 19 -------------- 38.1 41,000 33.2 23,800 35.8 29,800 20 -------------- 38.3 42,600 33.0 23,700 35.7 28,900
21 -------------- 38.4 43,800 32.8 23,600 35.5 28,500 22 -------------- 38.~ A." '!flO 32.6 23,400 35.3 27,600 23 -------------- 38.2 41,900 32.4 23,100 35.1 27,100 24 -------------- 38.0 40,200 32.5 23,100 34.9 26,800 25 -------------- 38.0 39,900 33.0 24,200 34.7 26,500
26 -------------- 37.9 39,000 33.3 25,400 34.6 26,300 27 -------------- 37.8 38,200 33.6 26,400 34.4 25,800 28 -------------- 37.6 37,500 33.8 26,700 34.3 25,300 29 -------------- 37.4 36,80() 34.0 27,000 34.1 25,100 30 -------------- 37.2 35,500 34.1 27,300 33.9 24,900 31 -------------- 37.1 34,500 33.7 24,800 Monthly mean discharge, in
cubic feet per second ----------- 30,380 26,480 29,100 Runoff, in acre-feet -------------- 1,868,000 1,575,000 1,790,000
MISSISSIPPI RIVER MAIN STEM (56) 07289000 Mississippi River at Vicksburg, Miss.
Location.-Lat 32°18'45", long 90°54'25", in T. 16 N., R. 3 E., Washington meridian, Warren County, over cavity of fourth pier from left bank at combined highway and railway bridge of Vicksburg Bridge Commiss,ion of Warren County, at southern city limits of Vicksburg, 1.5 miles (2.4 km) downstream from Yazoo diversion canal and at mile 430.4 (692.5 km).
Drainage area.-1,144,500 mi2 (2,964,300 km2), ap·proximately.
Gage.-Water-stage recorder (hridge gage) maintained by Geological Survey. Jan. 1, 1963, to Dec. 31, 1967, supplementary water-stage recorder on left bank near downstre·am side of bridge, and since Jan. 1, 1968, on left bank at site 1.1 miles (1.8 km) upstream, maintained by Corps o! Engineers. Datum of gage is 46.22 ft (14.088 m) above mean sea level (Corps of Engineers bench mark) or 46.16 ft (14.070 m) above mean gulf level. Gages used hy Mis,sissippi River Commission: D!ec. 10, 1871, to S.ept. 30, 1929, nonrecoTding gage at mouth of Yazoo diversion canal, 1.5 miles (2.4 km) upstream from bridge gage; since Octoher 1929, nonrecording gage on Yazoo diversion canal, 1,600 ft (490 m) upstream from mouth. Gages used by U.S. Weather Bureau: May 18·, 1873, to Oct. 29,. 1919, nonrecording gage 0.5 mile' (0.8 km) upstream from bridge g.age; Oct. 30, 1919, to· Nov. 30. 1922, nonreading gage at mouth of Ya.,oo Canal; Dec. 1, 1922, to Aug. 31, 1934, nonrecording gage on Yazoo diversion canal; Sept. 1, 1934, to Dec. 31, 1962, nonrecording g.age at bridge; Jan. 1, 1963, to Dec. 31, 19·67, watersta.ge recordeT on left bank near downstream side of bridge and s:ince Jan. 1, 1968, on left bank at site 1.1 miles (1.8 km) upstream.
All gages at same datum, but re,adings differ dille to slope of water surface between them. Flood stage.-43.0 ft (13.11 m). Flood stage was exceeded for 88 consecutive days (Mar. 24-June 19) Maxima.-March-May 1973: Discharge, 1,962,000 ft3/s (55.600 m 3/S) May 12; maximum gage height, 58.10 ft (16.185 m)
May 14 at supplementary recorder. Recurrence interval of discharge is 25 years (bas·ed on figure 30).
THE FLOODS 125
TABLE 12.-Station descriptions and discharge and suspended-sediment data-Continued
1928 to February 1973: Discharge, 2,080,000 ft3/s (58,900 m3/s) Feb 17, 1937; maximum gage height, 53.2 ft (16.22 m) Feb. 21, 1937;
Maximum stage known since at least 1871, 58.4 ft (17.80 m), (Corps of Engineers gage on Yazoo diversion canal), approximate,ly 56.0 ft (17.07 m) May 4, 1927 (Geological Survey gage).
Remarks.-Natural flow of stream affected by many reservoirs and navigation dams.
[Gage height, in feet, and discharge, in cubic feet per second, 1973]
March April May June Day Gage Discharge Gage Discharge Gage Discharge Gage Discharge height height height height
1 ------------ 34.5 945 48.2 1,670 51.6 1,870 48.2 1,512 2 ------------ 33.0 898 48.6 1,688 51.7 1,892 47.5 1,479 3 ------------ 31.1 842 48.8 1,705 51.8 1,897 46.8 1,440 4 ------------ 29.5 790 49.2 1,720 52.0 1,904 46.3 1,409 5 ------------ 28.3 747 49.4 1,731 52.1 1,911 45.8 1,377
6 ------------ 27.4 727 49.6 1,742 52.2 1,909 45.4 1,362 7 ------------ 27.0 721 50.0 1,755 52.4 1,907 45.1 1,361 8 ------------ 27.0 720 50.1 1,770 52.6 1,916 45.0 1,359 9 ------------ 27.2 761 50.3 1,783 52.7 1,930 44.9 1,344
10 ------------ 27.6 790 50.3 1,780 52.8 1,938 44.9 1,348
11 ------------ 28.7 823 50.3 1,779 52.9 1,952 44.9 1,354 12 ------------ 30.2 853 50.4 1,779 53.0 1,962 44.8 1,345 13 ------------ 31.8 921 50.3 1,780 53.1 1,940 44.7 1,330 14 ------------ 33.7 987 50.3 1,784 53.1 1,927 44.6 1,309 15 ------------ 35.4 1,048 50.2 1,790 53.1 1,930 44.5 1,288
16 ------------ 37.6 1,126 50.2 1,796 53.0 1,934 44.2 1,272 17 ------------ 38.6 1,158 50.2 1,797 53.0 1,931 44.0 1,271 18 ------------ 39.4 1,190 50.4 1,799 52.8 1,913 43.7 1,270 19 ------------ 40.4 1,234 50.2 1,793 52.7 1,900 43.3 1,250 20 ------------ 41.1 1,253 50.1 1,788 52.6 1,876 42.8 1,211
21 ------------ 41.6 1,280 50.0 1,783 52.4 1,846 42.4 1,181 22 ------------ 42.2 1,307 50.1 1,760 52.2 1,847 41.8 1,148 23 ------------ 42.8 1,337 50.2 1,745 51.9 1,855 41.1 1,113 24 ------------ 43.3 1,365 50.3 1,760 51.6 1,820 40.4 1,079 25 ------------ 44.2 1,394 50.5 1,792 51.4 1,785 39.6 1,039
26 ------------ 44.9 1,432 50.8 1,810 51.1 1,752 38.8 1,010 27 ------------ 45.5 1,465 51.0 1,822 50.7 1,685 38.1 984 28 ------------ 46.0 1,510 51.1 1,836 50.4 1,642 37.6 971 29 ------------ 46.6 1,556 51.3 1,842 49.8 1,622 37.0 959 30 ------------ 47.2 1,600 51.4 1,851 49.3 1,599 36.4 948 31 ------------ 47.7 1,654 48.7 1,560 Monthly mean discharge, in
thousands of cubic feet per 'Second ------------------Runoff, in thousands
1,111 1,774 1,850 1,244
of acre-feet -------------- 68,300 105,580 113,760 74,030
[Highest mean discharge, in thousands of cubic feet per second, for the following number of consecutive days]
Period 3 7 15 30 60 90 120 183
1932-67 -------------------- 2,080 2,070 2,060 2,030 1,940 1,740 1,560 1,450 1,200 1973 flood ------------------ 1,960 1,950 1,940 1,930 1,890 1,820 1,680 1,510 1,380 Recurrence interval, in years,
for 1973 flood volumes ______ 25 35 40 45 50 90 >100 >100 >100
126 THE 1973 MISSISSIPPI RIVER BASIN FLOOD
TABLE 12.-Station descriptions and discharge and suspended-sediment data-Continued
A vemge velocity, water temperature, stage, water discharge, suspended sediment, and bed material for given days
Suspended sediment Bed material Date
Average velocity
(fps)
Water tempera
ture Stage
(ft) Discharge Concentration, mg/1 Discharge (mm)
(1,000 ft3/sl ------------- (1 000 Percent ----------Average tons';day) sand
March 5 ------------------- 5.50 12 ------------------- 5.97 19 ---------·---------- 7.34 26 ------------------- 7.73
April 2 ------------------- 8.66 9 ------------------- 8.71
18 ------------------- 8.65 21 ------------------- 8 79 23 ------------------- 8:75 28 ------------------- 9.07 30 ------------------- 9.03
May 2 ------------------- 9.17 7 ------------------- 9.26 9 ------------------- 9.18
14 ------------------- 8.84 16 ------------------- 8.82 21 ------------------- 8.55 23 ------------------- 8 67 28 ___________________ 8:43
30 ---- ---·------------ 8.28 June 4 ------------------- 7.68
6 ------------------- 7.63 11 -----------------·-- 7.62 13 ------------------- 7.51 18 ------------------- 7.18 20 ------------------- 6.94 25 ------------------- 6.36 27 ------------------- 6.14
(oC)
9.0 12.0 13.0 12.0 13.5 13.0 13.5 15.0 15.0 16.0 16.0 18.0 18.5 18.5 19.0 19.0 20.0 20.5 21.0 21.0 23.0 23.5 24.0 24.5 26.0 26.5 27 0 28:o
30.23 32.07 42 17 46:79 50.41 52.17 52.41 52.03 52.16 53.09 53.45 53.70 54 34 54:75 55.05 55.01 54.33 53.88 52.43 51.35 48.33 47.46 46 92 46:75 45.78 44.94 41.65 40.15
759 869
1,256 1,435 1,752 1,790 1,796 1,786 1,755 1,840 1,852 1,888 1,899 1,917 1,911 1,911 1,831 1,843 1,623 1,51)0 1,429 1,385 1,377 1,353 1,292 1,231 1,057 1,000
Right
282 405 694 598 755 652 502 427 430 398 349
421
314 403 292 333
256 245 231 280 245 226 230 198 212
Middle Left
218 346 505 408 492 406 364 289 241 232 242
264
275 238 206 168
167 155 137 184 171 159 157 161 163
261 335 423 296 3tf3 247 219 173 150 167 167
170
150 159 124 116
93 120 128 142 143 119 122 135 141
MISSISSIPPI RIVER BASIN
254 363 541 434 534 435 361 296 273 265 253
285
247 267 207 205
172 174 166 203 186 168 169 165 171
(57) 07290880 Mississippi River at Natchez, Miss.
520 850
1,833 1,682 2,524 2,102 1,755 1,431 1,297 1,321 1,264
1,463
1,271 1,378 1,025 1,024
721 669 618 754 681 587 565 470 464
34 25 39 47 66 62 61 62 60 61 57
54
50 60 58 59
52 37 40 40 33 36 32 21 19
0.42 .33 .51 .35 .32 .34 .41 .36 .89 .56 .37 .76 .36
1.58 .38 .38
1.28 1.14 .89 .88 .55 .60
1.56 1.88
.44
.96 1.66 1.41
0.65 .44
1.14 .48 .52 .54 .80 .52
1.62 1.16
.52 1.92
.48 2.97 1.05
.57 2.38 2.77 2.08 2.44 1.72 2.45 2.75 3.27 2.40 2.35 3.1""5 2.75
DB4
1.18 .61
2.90 2.61 3.92 3.30 2.56 1.97 2.90 4.11 1.64 7.40
.65 5.48 4.50 2.24 4.73 5.60 6.77 5.49 5.11 4.96 5.00 5.94 4.88 4.33 5.64 4.80
Location.-Lat 31°33'37", long 91°2:5'07", at bridge on U.S. Highway 84, at Natchez at mile 359 (578 km). Drainage area.-1,149,400 mi2 (2,976,900 km2
); 22,240 mP (57,600 km2) is noncontributing.
Gage.-Wire-weight gage. Datum of gage is 17.28 ft (5.267 m) above mean s~ea level. 1871 to date. Stages. prior to 1941 0.3 miles (0.5 km) upstream at same datum.
Maxima.-March-May 1973: Discharge, 2,017,000 ft3/s (57,100 m 3/s) May 18 [gage height, 56.7 ft (17.28 m) May 13]. 1871-Feb. 1973; Discharge, 2,046,000 :ft3 /s (57,900 m 3/s) Feb. 19, 1937 [gage height, 58.04 ft (17,691 m) Feb. 21, 1937].
Remarks.-Station data included in this report primarily for sediment analysis.
Average velocity, water temperature, stage, water discharge, suspended sediment, and bed material for given days
Average Water Suspended sediment Bed material Date velocity tempera- Stage Discharge Concentration, mg/1 Discharge Percent (mm)
(fps) ture (:ft) (1,000 ft3/s) (1,000 (oC) Right Middle Left Average tons/day) sand Dt6 Dao DB4
March 7 -------------·------ 4.57 8.5 30.77 713 187 340 363 297 572 37 0.28 0.38 0.51 15 ------------------- 5.80 12.0 35.75 951 565 454 510 509 1,307 37 .31 .42 .54 28 ---------------·---- 7.13 11.5 46.63 1,425 354 421 360 379 1,456 45 .31 .44 .59
April 3 ------------------- 8.01 13.5 49.47 1,51l8 266 235 276 260' 1,098 45 .31 .44 .58 10 -------------·------ 7.69 12.0 51.65 1,762 247 286 408 314 1,493 59 .31 .45 .63 17 ------------------- 7.78 12.0 51.92 1,729 300 318 310 310 1,444 59 .25 .36 1.39 20 ------------------- 8.10 14.0 51.51 1,720 360 358 258 325 1,509 66 .26 .36 .49 24 ------------------- 7.71 14.5 51.19 1,1:6!) 212 314 287 271 1,219 65 .30 .42 .57 27 ------------------- 7.89 15.5 51.90 1,798 250 330 308 296 1,437 63 .28 .40 .58
May 1 --------------------- 8.22 16.0 52.30 1,866 264 247 214 241 1,218 48 .27 .38 .51 4 ------------------- 8.27 16.5 53.04 1,878 258 252 278 262 1,332 58 .25 .37 1.16 8 ---·---------------- 7.87 18.0 53.62 1,881 259 272 314 282 1,431 66 .26 .36 .52
11 ------------------- 8.08 18.5 53.78 1,913 231 288 207 243 1,251 57 .30 .42 .60 15 ------------------- 8.04 18.5 54.01 1,922 278 314 266 287 1,485 62 .27 .39 .55
May 18 -------·------------ 8.41 18.5 53.77 2,028 240 298 226 255 1,39!5 60 .28 .39 .54 22 ------------------- 7.50 20.0 53.27 1.876 152 227 191 190 962 55 27 .39 .51l 25 ------------------- 7.97 20.5 52.80 1,922 162 240 172 191 992 55 :28 .40 .56 29 ------------------- 7.30 20.5 51.75 1,722 172 191 237 201 931 60 .26 .37 .51
June 1 ------------------- 6.61 21.5 50.54 1,112::! 158 182 190 177 727 55 .29 .47 1.47 5 ------------------- 6.10 22.0 48.66 1,378 160 208 191 186 693 53 .29 .40 .55 8 ------------------- 6.43 23.0 47.67 1,340 173 205 209 196 709 40 .25 35 .46
12 ---------·---------- 6.13 23.5 47.29 1,268 183 186 200 189 6!!0 37 .28 :36 .50 14 ~-------~---------- 6.18 24.0 47.26 1,26'i 160 226 171 185 636 38 .27 .36 .50 19 ------------------- 6.07 25.5 46.43 1,2:\7 126 181 186 165 549 41 .26 .36 .50 21 -----·-------------- 5.86 25.5 46.02 1,197 121 173 173 156 503 40 .29 .44 2.02
BUFFALO RIVER BASIN
(58) 07295000 Buffalo River near Woodville, Miss.
Location.-Lat 31°13'35", long 91°17'45", in SW14, sec. 21, T. 3 N., R. 2 W., Washington meridian, Wilkinson County, near center of span on downstream side of bridge on U.S. Highway 61, 1.5 miles (2.4 km) downstream from Fords Creek, 2.8
miles (4.5 km) west of Wilkinson, and 8.5 miles (13.7 km) north of Woodville.
THE FLOODS 127
TABLE 12.-Station descriptions and discharge and suspended-sediment data-Continued
Drainage area.-182 mi2 (471 km2).
Gage.-Water-stage recorder. Datum of gage is 94.52 ft (28.810 m) above mean sea level. Prior to June 1, 1942, nom·ecording gage at same site. Prior to Oct. 1, 1964, at datum 3.00 ft (0.914 m) higher.
Maxima.-March-May 1973: Dis,charge, 65,000 ft3/s (1840 m~/s) March 25 (gage height\ 22.3 ft or 6.80 m); Recurrance interval of discharge is 40 years.
1942 to February 1973: Dis.charge, 44,800 fe; (1270 m3/s) Oct. 4, 1964 (gage height, 20.19 ft or 6.154 m). 1 From floog mark.
[Mean discharge, in cubic feet per second, 1973]
Date
1 ----------------------------------------------------2 3 4 5
6 ----------------------------------------------------7 8 9
10
11 ----------------------------------------------------12 13 14 15
16 ----------------------------------------------------17 18 19 20
21 ----------------------------------------------------22 23 24 25
26 ----------------------------------------------------27 ----------------------------------------------------28 ----------------------------------------------------29 ----------------------------------------------------30 ----------------------------------------------------31 ----------------------------------------------------Monthly mean discharge, in cubic feet per second -----------Runoff, in inches ----------------------------------------
March
138 239 175
1,260 419
795 1,570
498 538 329
4,570 829 473 375 317
1,130 633 327 262 487
324 223 194
12,400 30,700
1,680 760 570 655 452 981
2,074 13.14
April
408 327 295 270 260
250 3,080
631 434 330
245 206 187 172 161
3,500 4,170 4,000
788 531
421 362 324 302
2,250
1,360 502 321 274 261
887 5.44
[Highest mean discharge, in cubic feet per second, for the following number of consecutive days]
Period 3 7 15 30 60 90
1943-71 -------------------- 25,400 13,100 6,860 3,420 2,170 1,310 1,120 1973 flood ------------------ 30,700 14,900 6,760 3,540 2,310 1,560 1,240 Recurrence interval, in yerurs,
for 1973 flood volumes _____ 40 40 40 35 35 40 40
MISSISSIPPI RIVER MAIN STEM (59) 07295100 Mississippi River at Tarbert Landing, Miss.
May
260 1,070 1,800
421 300
282 2,870 1,170
521 393
346 337 342 270 250
233 217 204 192 182
174 169 161
2,500 610
353 302 366 261 234 247 550 3.48
120
930 1,040
40
183
801 916
35
Location.-Lat 31°00'30", long 91°37'25", Lot 6, T. 1 N., R. 5 W., Wilkinson County rear left bank at Tarbert Landing, 2¥2 miles (3.9 km) up.stream from lower Old River at mile 306.3 (492.8 km).
Drainage area.-1,128,900 mF (2,923,900 km2), contributing.
Gage.-Staff gage. Datum of gage is mean sea level. Maxima.-March-May 1973: Discharge, 1,498,000 ft3js (42,400 m3/s) May 16 [elevation, 54.61 ft (16.645 m)]. Recurrence·
interval of discharge is 40 years. 1932-Fe·bruary 1973: Discharge, 1,997,000 ft3/s (56,000 m~/s) observed on Feb. 19, 1957.
Remarks.-Discharge below the outflow channel were used for the duration table and are for Red River Landing from 1929'-62 and Tarbert Landing from 1964-71. Stage data for this station are collected at Red River Landin~, mile, 301 (484. km). The discharge data are collected upstream from the diversions that are used to control flood stages m the lower basm.
128 THE 1973 MISSISSIPPI RIVER BASIN FLOOD
TABLE 12.-Station descriptions and discharge and suspended-sediment data-Continued
Mean discharge, in cubic feet per second, .1973
March April May June Suspend sediment Suspend sediment Suspend sediment Suspend sediment
Mean Mean Dis- MeanJ Mean Dis- Mean Mean Dis- Meallj Mean Dis-Day discharge concen- charge Day discharge concen- charge Day discharge concen- charge Day discharge concen- charge
(1,000 f3/s) tration (1,000 (1,000 f3js) tration (1,000 (1,000 f3/s) tration (1,000 (1,000 f3js) tration (1,000 (mg/1) tons/day) (mg/1) tons/day) (mg/1) tons/day) (mg/1) tons/day)
1 759 343 702 1 ------ 1,090 361 1,064 1 ---- 1,360 200 732 1 ------ 1,220 170 558 2 722 359 699 2 ------ 1,110 348 1,044 2 ---- 1,390 205 772 2 ------ 1,190 172 553 3 686 375 695 3 ------ 1,150 350 1,092 3 ---- 1,330 219 783 3 ------ 1,160 174 546 4 654 391 691 4 ------ 1,180 356 1,135 4 ---- 1,330 227 815 4 ------ 1,130 177 538 5 620 410 686 5 ------ 1,210 362 1,179 5 ---- 1,400 212 802 5 ------ 1,070 191 552 6 594 426 684 6 ------ 1,240 368 1,232 6 ---- 1,390 203 762 6 ------ 1,090 200 588 7 580 439 688 7 ------ 1,270 373 1,283 7 ---- 1,370 195 724 7 ------ 1,050 215 606 8 565 453 691 8 ------ 1,290 381 1,329 8 ---- 1,320 190 678 8 ------ 1,050 208 592 9 559 462 698 9 ------ 1,290 391 1,364 9 ---- 1,450 174 680 9 ------ 1,030 205 569
10 563 469 713 10 ------ 1,270 367 1,258 10 ---- 1,390 209 786 10 ------ 1,040 199 556 11 582 467 734 11 ------ 1,290 340 1,184 11 ---- 1,350 250 914 11 ------ 1,010 195 534 12 591 470 750 12 ------ 1,350 310 1,130 12 ---- 1,430 236 910 12 ------ 1,010 260 711 13 618 468 781 13 ------ 1,300 249 854 13 ---- 1,420 229 878 13 992 349 936 14 660 461 821 14 ------ 1,340 185 672 14 ---- 1,430 221 852 14 978 303 801 15 709 452 865 15 ------ 1,340 213 766 15 ---- 1,430 226 870 15 983 261 692 16 745 447 899 16 ------ 1,390 239 895 16 ---- 1,500 225 912 16 ------ 1,000 222 602 17 780 443 932 17 ------ 1,360 276 1,013 17 ---- 1,440 234 912 17 979 194 512 18 800 444 959 18 ------ 1,410 311 1,181 18 ---- 1,440 239 9·30 18 957 169 436 19 814 448 984 19 ------ 1,320 290 1,035 19 ---- 1,400 233 881 19 975 191 502 20 833 449 1,009 20 ------ 1,370 258 954 20 ---- 1,430 222 855 20 964 219 569 21 857 448 1,037 21 ------ 1,230 245 817 21 ---- 1,410 215 817 21 937 211 533 22 868 454 1,063 22 ------ 1,290 255 885 22 ---- 1,390 208 780 22 910 204 500 23 887 456 1,091 23 ------ 1,300 269 943 23 ---- 1,370 182 673 23 878 197 467 24 945 446 1,138 24 ------ 1,280 287 991 24 ---- 1,360 159 585 24 856 208 492 25 983 445 1,180 25 ------ 1,290 304 1,053 25 ---- 1,300 163 571 25 856 227 525 26 995 450 1,210 26 ------ 1,240 308 1,036 26 ---- 1,370 159 589 26 850 206 472 27 ---- 1,010 436 1,183 27 ------ 1,280 304 1,052 27 ---- 1,300 163 573 27 ------ 819 189 417 28 ---- 1,020 420 1,159 28 ------ 1,260 278 945 28 ---- 1,350 161 587 28 811 190 410 29 ---- 1,040 404 1,135 29 ------ 1,360 243 892 29 ---- 1,300 164 575 29 744 180 360 30 ---- 1,050 390 1,109 30 ------ 1,430 215 831 30 ---- 1,220 169 557 30 763 210 430 31 ---- 1,070 375 1,085 31 ------ ---- 31 ---- 1,210 170 555 31 Total __ 24,162 28,071 38,502 31,110 42,570 23,310 29,298 16,559 Monthly mean dis-charge 779
Maxi-906 1,284 1,0•37 1,373 752 977 552
mum_ 1,072 1,210 1,433 1,364 1,498 930 1,216 936 Mini_ mum_ 559 684 1,093 672 1,207 555 744 360
Period Highest mean discharge, in cubic feet per second, for the indicated number of consecutive days 1 3 7 15 30 60 90 120 183
Oct. 1972-June 1973 1,498,000 1,460,000 1,440,000 1,418,000 1,388,000 1,336,000 1,233,000 1,109,000 1,024,000 1929-71 --------------- 1,520,000 1,520,000 1,510,000 1,500,000 1,470,000 1,400,000 1,300,000 1,210,000 Recurrence interval, in 1,010,000
year.s, for 1973 flood volumes ------------- 40 30 25 25 22 30 30 22 45
RED RIVER BASIN
(60) 07355500 Red River at Alexandria, La.
Location.-Lat 31 °18'46", long 92°26'34", in SE%. sec. 10, T. 4 N., R. 1 W., Rapides Parish, at old bridge on U.S. Hiwhwa.y 165 between Alexandria and Pineville, and 1.7 miles (2.7 km) downstream from Bayou Rigolette.
Drainage area.-67,500 mi2 (175,000 km2), of which 5,936 mF (15,400 km2
) abov·e Denison Dam is noncontributing. Gage-height record.-Nonrecording. Datum of gage is 44.26 ft (13.490 m) above mean sea level, da.tum of 1929, sup•plemen
tary adjustment of 1941. Discharge record.-Stage-discharge relation variable; prior to 1928, peak discharge based on occasional discharge measure
ments, and since 1928 on loop curves defined by frequent discharge measurements. Discharge meaf!urements furnished by Mississippi River Commission and Corps of Engineers.
Maxima.-March-May 1973: Discharge, 142,000 ft3/s (4,020 m 3/s) Apr. 30 [gage height, 35.00 ft (10.668 m)]. Recurrence interval of discharge is 3 years.
1872-February 1973: Discharge, 233,000 ft3/s (6,600 m3/s) Apr. 16-18, 1945 [gage height, 45.2 ft 13.777 m)]. Remarks.-Regulation by Lake Texamo since October 1943 and Texarkana Reservoir since July 1953. Gage he·ights avail
able from Missis1sippi River Commission since January 1872; fvom U.S. Weather Bureau since 1890; from U.S. Corps of Engineers since January 1932. Station data included in this report primarily for sediment analys.is.
THE FLOODS 129
TABLE 12.-Station descriptions and discharge and suspended-sediment data-Continued
Mean water discharge and suspended-sediment concentration and discharge
March April May June Suspended Suspended Suspended Suspended sediment sediment sediment sediment
Mean Mean Dis- Mean Mean Dis- Mean Mean Dis- Mean Mean Dis-dis- concen- charge dis- concen- charge dis- concen- charge dis- concen- charge Day charge tration (1,000 Day charge tration (1,000 Day charge tration (1,000 Day charge tration (1,000 (1,000 (mg/l) tons/day) (1,000 (mg/1) tons/day) (1,000 (mg/1) tons/day) (1,000 (mg/1) tons/day) ft 3/s) ft 3/s) ft 3/s) ft 3/s)
1 29 503 36 1 105 1,350 390 1 141 1,410 536 1 a a 550 49 2 29 503 48 2 104 1,330 380 2 140 1,410 532 2 31 502 42 3 29 503 38 3 103 1,300 365 3 137 1,390 514 3 30 460 36 4 30 503 38 4 102 1,290 361 4 134 1,300 470 4 29 437 33 5 33 550 46 5 95 1,220 323 5 135 1,240 453 5 26 399 28 6 45 657 71 6 94 1,180 299 6 134 1,170 425 6 27 399 28 7 63 870 141 7 94 1,140 280 7 135 1,120 404 7 30 444 36 8 75 1,020 207 8 93 1,100 262 8 134 1,060 383 8 37 611 61 9 83 1,110 252 9 84 1,060 240 9 127 1,080 370 9 52 940 132
10 86 1,120 265 10 80 1,010 219 10 120 1,090 354 10 62 1,350 240 11 85 1,150 274 11 76 970 199 11 120 1,090 349 11 80 1,830 385 12 84 1,150 270 12 73 934 184 12 121 1,090 353 12 88 2,400 570 13 83 1,140 265 13 70 877 161 13 121 1,090 357 13 97 2,210 579 14 84 1,150 271 14 68 871 60 14 121 1,090 356 14 107 2,040 589 15 91 1,190 293 15 62 828 143 15 121 1,090 355 15 109 2,020 599 16 111 1,300 357 16 65 826 145 16 121 1,110 363 16 110 1,970 590 17 117 1,390 420 17 70 862 163 17 120 1,130 366 17 111 1,910 572 18 124 1,460 474 18 73 891 178 18 120 1,040 334 18 109 1,820 537 19 128 1,510 509 19 78 916 193 19 119 960 306 19 104 1,710 481 20 131 1,540 532 20 90 1,010 231 20 115 873 271 20 94 1,460 371 21 131 1,550 540 21 101 1,130 294 21 105 765 219 21 90 1,300 316 22 124 1,510 506 22 107 1,230 342 22 98 669 177 22 80 1,220 274 23 118 1,460 466 23 109 1,300 377 23 85 736 173 23 75 1,150 239 24 114 1,400 421 24 112 1,390 421 24 76 799 164 24 69 1,070 202 25 111 1,390 409 25 120 1,510 490 25 66 801 147 25 67 1,050 192 26 107 1,370 391 26 128 1,630 565 26 60 796 129 26 67 1,030 186 27 104 1,340 373 27 132 1,580 563 27 52 770 106 27 66 1,010 180 28 102 1,340 368 28 136 1,530 561 28 47 816 108 28 60 938 152 29 102 1,340 369 29 139 1,470 551 29 43 801 93 29 54 864 126 30 102 1,340 372 30 142 1,410 541 30 39 693 73 30 46 795 103 31 104 1,340 381 31 31 35 593 36 31 Total ___ 2,756 9,393 2,905 9,581 2 29 503 38 2,037 7,928 Monthly
mean dis-charge 89 303 97 '319 105 300 68 264
Maxi-mum_ 131 540 142 565 141 536 111 59§
Mini-mum_ 27 36 62 143 35 56 26 28
RED RIVER BASIN (61) 07367000 Ouachita River at Monroe, La.
Looa.tion.-Lat 32°30'19", long 92°07'32", in lot 50, T. 18 N ., R. 3 E., at bridge on U.S. Highway 80 miles (8.8 km) upstream from lock and dam No. 4.
at Monroe and 5%
Drainage area.-15,298 mF (39,622 km2).
Gage.-Nonrecording. Datum of gage is 31.40 ft (9.571 m) above mean sea level, datum of 1929, supplementary adjus.tment of 1941. Prior to Jan. 6, 1937, gage at various sites within a half a mile (0.8 km).
Maxima.-March-May 1973: Maximum daily discharge, 88,900 fe;s (2,520 m3/s) May 5, 6; gage height, 48.8 ft (14.874 m) May 10. Recurrence interval of discharge is 45 years ..
1874-February 19·73: Discharge, 101,000 ft3/s (2,860 m3/s) Feb. 2, 3, 1932 [gage height, 50.45 ft (15.377 m) May 23, 1958].
Remarks.-Records of peak stages furnished by Mississippi River Commission and U.S. Weather Bureau since June 1884 and by Corps of Engineers .since January 1932. Record from 1938 to date by U.S. Geological Survey.
Discharge, in cubic feet per second
Day March April May
1 -------------------------------------------- 51,500 65,000 83,600 2 -------------------------------------------- 51,300 65,100 86,000 3 -------------------------------------------- 51,100 65,100 87,900 4 -------------------------------------------- 50,900 65,100 88,800 5 -------------------------------------------- 50,800 65,100 88,900
6 -------------------------------------------- 50,500 65,100 88,900 7 -------------------------------------------- 50,400 65,100 88,000 8 -------------------------------------------- 50,200 64,500 87,600 9 -------------------------------------------- 50,000 64,400 85,000
10 -------------------------------------------- 49,900 64,200 83,200
11 -------------------------------------------- 50,000 63,200 82,400 12 -------------------------------------------- 50,200 62,400 81,200
130 THE 1973 MISSISSIPPI RIVER BASIN FLOOD
TABLE 12.-Station descriptions and discharge and suspended-sediment data-Continued
Discharge, in cubic feet per second-Continued
Day
13 --------------------------------------------14 15
16 --------------------------------------------17 18 19 20
21 --------------------------------------------22 23 24 25
26 --------------------------------------------27 --------------------------------------------28 --------------------------------------------29 --------------------------------------------30 --------------------------------------------31 --------------------------------------------Monthly mean discharge, in cubic feet per second ___ _ Runoff, in inches --------------------------------
March
50,300 50,400 51,800
53,100 54,200 55,700 56,900 58,100
59,200 60,100 60,800 61,200 62,000
62,700 63,100 63,900 64,500 64,600 64,800 55,620
4.19
April
61,500 60,700 60,000
59,700 59,700 59,900 59,900 59,800
60,000 69,900 69,800 60,000 60,800
63,000 68,200 73,000 75,200 79,200
63,820 4.61
May
80,200 79,100 78,000
76,900 75,900 74,600 73,100 71,900
70,200 68,900 67,800 66,000 64,200
62,700 60,600 59,300 58,100 57,000 56,000 75,230
5.67
Period Highest mean discharge, in cubic feet per seco111d for the indicated number of consecutive days 1 3 7 15 30 60 90 120 183
Oct.-June 1973 --------------1937-71 -------------------Recurrence interval, in years,
for 1973 flood volumes _____ _
88,900 97,200
45
88,900 96,100
50
88,000 94,500
60
84,700 92,100
60
RED RIVER BASIN
77,900 85,600
50
(62) 07370000 Bayou Macon near Delhi, La.
69,900 72,000
45
63,800 63,900
23
60,600 59,900
30
54,200 51,800
35
Location.-Lat 32°27'25", long 91°28'30", in E, 1h sec. 18, T. 17 N., R. 10 E., Richland-Madison Paris:h line, near right bank on downstream side of bridge on U.S. Highway 80, 0.2 mile ( 0.3 km) upstream from Illinois Central Railroad bridge, and 1 mile e1ast of Delhi.
Drainage area.-782 mi2 (2,025 km2).
Gage.-Water-stage recorder. Datum of gage is 50.05 ft (15.255 m) abov'e me,an sea level (levels by Corps· of Engineers). Prior to Mar. 14, 1949, nonrecording gage; Mar. 14, 1949, to Oct. 1, 1963, water-srtage recorder; all gages within 2,000 ft (610 m) downstream at same datum. Auxiliary water-Ertage recorder 7.7 miles (12.4 km) downstream at datum 46.05 ft (14.036 m) above means sea lev·eL Feb. 16, 1945, to Oct. 26, 1962, auxiliary nonrecording gage; Oct. 27, 1962, to Nov. 10, 1964, auxiliary water-stage recorder; and Nov. 11, 1964, to May 10, 1965, auxiliary nonrecording gage at site 0.2 mile (0.3 km) upstream May 11, 19·65, to Mar. 9, 1972, nonrecording gage. Prior to Oct. 1, 1964, at datum 2.00 ft (0.610 m) lower.
Maxima.-March-May 1973: Discharge, 8,780 fe; (249 m3/s) 5:00p.m., March 17 [gage height, 22.78 ft (6.943 m) 0815 hours March 18]. Recurrence interval of discharge is 25 years.
1935-February 1973: Discharge, 9,050 ft3/s (2.56 m3/s) F'eb. 13, 1966 [gage height, 26.00 ft (7.925 m) May 6, 7, 1958]. Maximum stage known, 37.5 ft (11.43 m) in March 1882, from records of U.S. WeatheT Bureau (affected by ove.rflow
from Mississippi River).
MISSISSIPPI RIVER BASIN (63) 07373286 Old River Outflow Channel near Knox Landing, La.
Location.-Lat 3P04'40", long 91°35'50", at bridge on State Highway 131 at Old River Control Structure, one-half mile (0.8 km) from Head of Channel and at mile 312 (502 km. ).
Gage-height record.-Water-stage recorder. Datum of gage is mean sea l'evel. March 31, 19·61 to date. Discharge record.-Computed daily since 1962. Maxima.-March-May 1973: Discharge, 510,000 ft3/s: (14,400 m 3/s April16 [elevation, 59.3 ft (18.07 m) May 15].
1961-February 1973: Discharge, 390,000 ft3/s (11,000 m 3/s) Feb. 18,1969 [elevation, 47.85 ft (14.585 m) Mar. 23, 1962].
Water discharge and suspended-sediment data for given days
Suspended sediment Discharge Concen- Discharge Percent (1,000 tration (tons/day) sand
ft3/s) (mg/1) Date
March 5 ---------------------------------- 222 264 158 26 19 294 503 399 21 21 307 519 430 33
Date
28 April 4
11 26
May 2 12 19 23 30
June 5 12 19 26
THE FLOODS
TABLE 12.-Station descriptions and discharge and suspended-sediment data-Continued
Water discharge and suspended-sediment data for given days-Continued
Suspended sediment Discharge Concen- Discharge (1,000 tration (tons/day)
ft 3/s) (mg/l)
---------------------------------- 364 402 395 ---------------------------------- 424 563 644 ---------------------------------- 452 308 376 ---------------------------------- 424 151 173 ---------------------------------- 395 206 220 ---------------------------------- 394 196 208 ---------------------------------- 375 149 151 ---------------------------------- 360 168 163 ---------------------------------- 356 149 143 ---------------------------------- 325 213 187 ---------------------------------- 310 173 145 ---------------------------------- 316 166 142 ---------------------------------- 308 253 210
MISSISSIPPI RIVER DELTA (64) 07373450 Thompson Creek at Jackson, La.
131
Percent sand
37 62 47 35 30 22 20 23 22 32 31 33 33
Location.-Lat 30°50'25", long 91 °13'35", in lot 75, T. 2 S., R. 1 W., St. Helena meridian at bridge on State Highway 10, 0.5 mile (0.8 km) west of Jackson, 0.5 mile (0.8 km) upstream from West Fork Thompson Creek, and 1.0 mile (1.6 km) upstream from Vaughn Creek.
Drainage area.-99.3 mi2 (257.2 km2).
Gage.-Crest-stage gage. M.axima.-March-May 1973: Discharge, 40,000 fe;s (1,130 m3/s) March 24 [gage height, 92.26 ft (28.121 m)]. Recurrence
interval of discharge is 25 years. 1949-59, 1972 to Feb. 1973: Discharge, 36,500 fe;s (1,030 m 3/s) Apr. 13, 1955 [gage height, 91.72 ft (27.956 m) ].
MISSISSIPPI RIVER BASIN (65) 07374510 Mississippi River at New Orleans (Carrollton), La.
Location.-Lat 29° 56'05", long 90°08'10", at Corps of Engineers depot dock. Drainage area.-1,129,910 mF (2,926,470 km2
), contributing. Gage-height record.-Water-stage recorder. Datum of gage is mean sea l~evel. 1872 to date. Prior to 1957 at site 0.7 mile
(1.1 km) upSJtream at same datum. Discharge record.-Intermittently 1851, 1852, 1879 to 1950, 1969, and 1971; computed daily, 1928 to 1936 and 1938 to 1944. Maxima.-March-May 1973: Discharge, 1,257,000 ft3/s (35,600 m 3/s) April 15 [gage height, 18.47 ft (5.630 m), April 7].
1872-Feb. 1973: Discharge,, 1,557,000 fe;s (44,100 m3/ May 16, 1927. Maximum gage height, 21.27 ft (6.483 m) April
25, 1922. Remarks.-N atural flow is affected by tid·es. and diversions. up stream during floods.
Mean water discharge and suspended-sediment concentration and discharge April Suspended sediment 1 May Suspended sediment 1 June Suspended sediment 1
Discharge Concen- Discharge Percent Discharge Concen- Discharge Percent Discharge Concen- Discharge Percent Date (1,000 tration (1,000 sand Date (1,000 tration (1,000 sand Date (1,000 tration (1,000 sand ft3/s) (mg/1) tons/day) ft3/s) (mg/1) tons/day) ft3/s) (mg/1) tons/day)
1 1,040 1,220 1 1,050 1,000 1 1,080 830 2 1,050 1,290 2 1,047 353 998 16 2 1,069 280 807 17 3 1,070 1,290 3 1,080 1,100 3 1,050 760 4 1,090 1,340 4 1,100 1,200 4 1,030 710 5 1,110 1,400 5 1,127 421 1,280 17 5 1,008 247 673 16 6 1,152 475 1,477 13 6 1,160 1,300 6 1,000 660 7 1,180 1,500 7 1,190 1,400 7 990 640 8 1,200 1,600 8 1,238 452 1,512 18 8 970 630 9 1,224 519 1,714 13 9 1,220 1,600 9 960 610
is 10 1,229 553 1,836 16 10 1,191 484 1,557 15 10 941 234 595 11 1,240 1,800 11 1,170 1,500 11 910 630 12 1,248 503 1,695 12 12 1,146 440 1,360 13 12 875 287 677 17 13 1,230 1,700 13 1,160 1,300 13 890 740 14 1,207 546 1,778 11 14 1,166 403 1,270 14 14 920 800 15 1,220 1,700 15 1,160 1,300 15 940 780 16 1,230 1,600 16 1,146 391 1,211 13 16 960 710 17 1,240 473 1,583 17 17 1,140 1,200 17 965 255 6G5 18 18 1,200 1,500 18 1,136 370 1,134 18 18 980 590 19 1,150 455 1,414 14 19 1,140 1,100 19 1,000 510 20 1,100 1,400 20 1,137 380 1,165 21 20 980 540 21 1,063 454 1,303 20 21 1,130 1,200 21 952 217 559 17 22 1,070 1,300 22 1,120 1,200 22 970 560 23 1,087 411 1,205 17 23 1,107 384 1,148 17 23 960 530· 24 1,070 1,200 24 1,100 1,100 24 940 520 25 1,062 391 1,122 20 25 1,100 1,100 25 910 500 26 1,070 1,200 26 1,096 355 1,051 14 26 880 490 27 1,082 453 1,323 18 27 1,100 1,000 27 860 480 28 1,070 1,200 28 1,099 323 957 19 28 860 460 29 1,052 395 1,122 16 29 1,100 940 29 850 440 30 1,050 1,100 30 1,097 310 917 15 30 820 400 31 ---- ---- 31 1,090 880 31 ----Total __ 34,086 42,912 Total __ 35,043 36,980 Total __ 28,520 18,496 Monthly Monthly Monthly mean mean mean dis- dis- dis-charge _ 1,136 1,430 charge_ 1,130 1,193 charge_ 951 617
Maxi- Maxi- Maxi-mum -- 1,040 1,836 mum _ 1,238 1,600 mum - 1,080 830
Mini- Mini- Mini-mum -- 1,248 1,100 mum - 1,047 880 mum - 820 400
1 Suspended-sediment data based on water discharge measurements and sam ple observations at 1 to 5 day intervals.
132 THE 1973 MISSISSIPPI RIVER BASIN FLOOD
TABLE 12.-Station descriptions and discharge and suspended-sediment data-Continued
MISSISSIPPI RIVER DELTA (66) 07377000 Amite River near Darlington, La.
Location.-Lat 30o 53'20", long 90° 50' 40", in lot 72, T. 2 S., R. 4 E., St. Helena meridian, St. Helena Parish near center of span on downstream side of State Highway 10, 1.5 miles (2.4 km) upstream from Collins Creek, and 4.0 miles (6.4 km) west of Darlington.
Drainage area.-580 mi2 ( 1,502 km2
).
Gage.-Water-stage recorder. Datum of gage is 145.81 ft (44.443 m) above mean sea level. Mar 17, 1949, to Oct. 23, 1950, crest-stage gage; Oct. 24, 1950, to Jan. 12, 1951, nonrecording gage; Jan. 13, 1951, to May 28, 1963 water-stage recorder at former channel 700ft (213m) to the left; and July 30, 1963, to Feb. 12, 1964, nonrecording gage at presernt site. Prior to Oct. 1, 1963, datum 2.99 ft (0.911 m) higher.
Maxima.-March-May 1973: Discharge, 62,100 ft3/s (1,760 m3/s) March 25 [gage height, 20.19 ft (6.154 m) ]. Recurrence interval of discharge is 16 years.
1949-February 1973: Discharge, 55,700 ft3/s (1,580 m3/s) Apr. 13, 1955 [gage height, 18.18 ft (5.541 m), site and datum then in use].
MISSISSIPPI RIVER DELTA (67) 07378500 Amite River near Denham Springs, La.
Location.-Lat 30°27' 50", long 90° 59'25", in lot 2, T. 7 S., R. 2 E., St. Helena meridian, Livingston Parish, on right bank at downtown side of bridge on U.S. Highway 190, 1,000 ft (305 m) downstream from Comite River, 2.3 miles (3.7 km) south we Sit of town of Denham Springs, and 15 miles (24 km) east of Baton Rouge. Drainage are:a.-1,280 mi2 (3,320 km2
).
Gage.-Water-stage recorder. Datum of gage is 3.87 ft (1.180 m) above mean sea level. Prior to Aug. 8, 1939, nonrecording gage at same site and datum. Auxiliary water-stage recorder 3.0 miles (4.8 km) downstream at datum 3.12 ft (0.951 m) above mean sea level (Corps of Engineers bench mark). Oct. 1, 1945, to Dec. 23, 1952, nonrecording gage at same site and datum.
Maxima.~March-May 1973: Discharge, 61,800 ft3/s (1,750 m3/s) 5:00 a.m., March 27 [gage height, 32.63 ft (9.946 m) 0730 hours]. Recurrence, interval of discharge is 16 years.
1939-February 1973: Discharge, 67,000 ft3/s (1,900 m3/s) May 20, 1953 [gage height, 32.46 ft (9.894 m)].
Day
1 -------------------------------2 3 4 5
6 -------------------------------7 8 9
10
11 -------------------------------12 13 14 15
16 17 18 19 20
21 -------------------------------22 23 24 25
26 -------------------------------27 -------------------------------28 -------------------------------29 -------------------------------30 -------------------------------31 -------------------------------Monthly mean discharge, in cubic feet
per second ---------------------Runoff, in inches ------------------
Discharge in cubic feet per second
March
954 1,820 1,310 3,220 4,530
4,540 4,430 4,520 4,500 4,580
4,420 6,780 8,110 7,400 4,660
2,810 3,930 5,200 4,450 3,810
3,870 3,790 2,630 5,530
24,800
45,500 56,300 31,200 12,400
5,550 5,530
9,130 8.22
April May
7,370 2,130 7,460 1,910 5,960 1,980 3,810 3,070 2,510 4,740 2,110 5,080 5,900 6,900 9,150 10,700 9,000 10,000 6,510 8,100
3,950 5,360 2,400 3,280 1,960 2,420 1,740 3,480 1,590 3,900 2,910 2,950
14,200 1,810 28,900 1,510 35,500 1,350 27,700 1,240
17,300 1,150 9,820 1,090 4,260 1,030 2,870 1,020 2,410 1,310
5,570 2,520 6,840 1,740 6,700 1,210 4,950 1,040 2,890 950
893
8,140 3,090 7.10 2.78
THE FLOODS 133
TABLE 12.-Station descriptions and discharge and suspended-sediment data-Continued
Period Highest mean discharge, in cubic feet per second, for the indicated number of consecutive days 1 3 7 1& 30 60 90 120 183--
56,300 44,300 25,900 15,000 13,200 9,050 7,170 6,010 5,040 63,500 51,000 31,700 18,400 15,000 8,810 7,700 6,510 5,660
17 14 9 8 30 35 23 23 35
Oct. 1972-June 1973 ----------------1939-72 -------------------------Recurrence interval, in years, for 1973
flood volumes --------------------------~~------~----------------------~-----------------------------------
MISSISSIPPI RIVER DELTA (68) 07380231 Bonnet Carre Floodway near Norco, La.
Location.-Lat 30°03'50", long 90°2.3'05", St. Charles Parish, at bridge on Interstate Highway 10, 4.5 miles (7.2 krn) north of Norco, La.
Drainage are·a.-Indeterrninate. Measured discharge in cubic feet per second, 1973
Date Dischrage
April 10 ------------------------- 109,000 13 ------------------------- 179~00 16 ------------------------- 173,000
May 2 ------------------------- 156,000
Mean water discharge and suspended-sediment concentration and discharge
April May June Suspended sediment ~~pended sediment Suspended sediment
Mean Mean D~ Mean Mean Dis- Mean Mean Dis-
Day discharge concen- charge Day discharge concen- charge Day discharge concen- charge
(1,000 tration (1,000 (1,000 tration (1,000 (1,000 tration ( 1,000 ft3/s) (mg/1) tons/day) ft3/s) (mg/1) tons/day) ft3/s) (mg/1) tons/day)
1 0 0 1 156 601 253 1 119 436 140 2 0 0 2 154 532 221 2 109 455 134 3 0 0 3 160 479 207 3 101 367 100 4 0 0 4 163 643 283 4 93 422 106 I) 0 0 5 16& 640 28& 5 8& 37& 86 6 0 0 6 168 637 289 6 77 351 73 7 0 0 7 179 699 338 7 72 340 66 8 8 93 9 8 186 754 379 8 66 314 56 9 67 337 61 9 190 803 412 9 60 272 44
10 113 502 153 10 192 771 400 10 56 304 46 11 158 661 282 11 195 752 396 11 52 292 u 12 171 730 337 12 191 768 396 12 50 289 39 13 170 856 393 13 192 801 415 13 48 286 37 14 169 809 369 14 195 739 389 14 47 252 32 15 171 710 328 15 192 667 346 15 41 226 25 16 173 623 291 16 189 709 362 16 34 196 18 17 175 546 258 17 185 676 338 17 27 178 13 18 177 479 229 18 180 755 367 18 20 148 8 19 159 522 224 19 176 751 357 19 14 106 4 20 140 508 192 20 176 541 257 20 7 53 1 21 139 536 201 21 177 584 279 21 2 15 0 22 141 592 225 22 171 708 327 22 (} 0 23 133 590 212 23 170 571 262 23 0 0 24 137 535 198 24 163 516 227 24 0 0 25 141 486 185 25 165 483 215 25 0 0 26 140 500 189 26 162 478 209 26 0 0 27 142 552 200 27 159 554 238 27 0 0 28 152 565 232 28 152 485 199 28 0 0 29 154 459 191 29 145 442 173 29 0 0 30 150 657 266 30 137 452 167 30 0 0 31 31 128 443 153 31 To~f------- 3,783 5,218 5,313 9,139 1,180 1,069 Monthly _____
mean discharge _ 126 174 171 29"5 39 36
Maximum __ 177 393 195 415 119 140 Minimum -- 0 0 128 153 0 I}
MISSISSIPPI RIVER DELTA (70) 07381500 Atchafalaya River at Krotz Springs, La.
Location.-Lat 30°32'48", long 91°45'04", in sec. 7, T. 6 S., R.7 E., Louisiana meridian, in fireJt pier from west bank on bridge .on U.S. Highway 190, half a mile (0.8 krn) north of town of Krotz Springs, 0.6 mile (1.0 krn) up·strearn from New Orleans, Texas & Mexico Railway Go. bridg-e·, 10 miles (16 krn) upstream from Bayou Courtableau, and 42 miles (68 krn) downstream from confluence of Red River and Old River (head of Atchafalaya River).
Drainage are.a.-Indeterrninate. Gage.-Water-stage recorder (digital). Datum of g-age is at rn ean e-ulf level, and 0.03 ft ( .009 rn) below mean sea level, datum
of 19·29. supplementary adjustJrn.ent of 1941 (levels bv Coros of Engineers). Since July 1, 196·3, auxiliary water-stage· recorder 35.6 miles (57 .3 krn) upstream, at datum 5. 73 ft ( 1. 7 46 rn) aho>ve mean sea level.
Maxirna.-March-Mav 197~: Dis.charge. 781.000 ft~/s (22100 rn 3/s) May 12 [gage height, 48.70 ft (14.844 rn) at Sirnrne•slport]. 1934-February 1973: Discharge, 624.000 ft3/s (17,700 rn3 /s) March 6, 1950 [gag-e height, 37.8 ft (11.52 rn) Feb. 28. 1937].
Rernarks.-Diseharges us1ed for the duration table are for Krotz Springs from 1934-64 and for Sirntnesoort [35.6 miles (57.3 krn) upstream] from 1965-73. The flow is g-o;verned bv dive·rsions from the Mise.is.sippi River at Old River control structure. The recurrence intervals are not determined because of the irregular diversion patterns. Sediment dat.a were collected at Simmesport.
134
1 2 3 4 5 6 7
8 9
10 11 12 13 14 15 16 17 18 19 20 21 22 23 24 25 26 27 28 2!l 30 31
Mean dis
Day charge (1,000 ft:!/s)
408 404 387 371 354 339 336 335 334 331 335 343 349 357 377 401 414 425 433 441 447 454 465 484 500 515 528 524 521 532 540
Total __ 12,984 Monthly mean dis-charge_ 419
Maxi_ mum_ 540
Mini-mum _ 331
THE 1973 MISSISSIPPI RIVER BASIN FLOOD
TABLE 12.-Station descriptions and discharge and suspended-sediment data-Continued
Mean water discharge and suspended-sediment concentration and discharge
March Suspended sediment
Mean Dis-concen- charl!'<> tration (1,000 (mg/1) tons/day)
336 335 341 348 356 363 368 373 337 383 386 389 393 395 396 396 398 401 405 408 412 415 418 420 422 425 429 432 435 436 438
370 1 365 2 356 3 349 4 340 5 332 6 334 7 337 8 340 9 342 10 349 11 360 12 370 13 381 14 403 15 429 16 445 17 460 18 473 19 486 20 497 21 509 22 525 23 549 24 570 25 591 26 611 27 611 28 612 29 626 30 638 31
13,950
450
638
332
Day
Mean dis
charge (1,000 fP/s)
550 560 571 572 573 582 597 606 613 620 626 634 630 626 679 691 710 730 668 686 674 648 596 688 641 683 674 692 687 724
19,231
641
730
550
April Suspended sediment
Mean Dis-concen- charge tration ( 1,000 (mg/1) tons/day)
438 440 441 423 407 389 372 356 341 327 329 331 334 327 334 336 336 337 346 347 332 320 311 289 280 264 265 265 267 266
651 1 665 2 680 654 4 629 5 612 6 600 7 583 8 565 9 548 10 556 11 566 12 568 13 569 14 612 15 626 16 645 17 665 18 624 19 642 20 605 21 560 22 500 23 536 24 484 25 486 26 483 27 496 28 495 29 519 30
31 17,424
581
680
483
Mean dis
Day charge (1,000 ft:!/s)
772 719 682 685 725 720 709 727 731 740 759 781 727 742 736 763 749 760 739 739 737 727 730 749 727 767 733 704 706 687 689
22,611
729
781
682
May Suspended sediment
Mean Dis-concen- charge tration (1,000 (mg/1) tons/day)
267 268 286 302 316 334 354 372 393 414 436 458 442 418 399 377 360 342 327 311 296 282 268 273 281 284 293 301 308 316 324
520 520 2 527 3 559 4 618 5 649 6 678 731 775 9 828 10 893 11 965 12 867 13 838 14 792 15 776 16 728 17 701 18 652 19 620 20 589 21 554 22 529 23 552 24 551 25 588 26 579 27 573 28 587 29 587 30 602 31
20,528
662
965
520
Day
Mean dis
cha--ge (1,000 ft:l/s)
661 674 648 601 625 620 579 607 606 549 562 570 542 552 574 528 530 539 546 550 534 515 503 513 463 492 475 472 472 452
16,554
552
674
452
June Suspended sediment
Mean Dis-concen- charge tration (1,000 (mg/1) tons/day)
333 340 350 359 368 363 363 354 349 351 344 339 356 369 381 404 421 436 453 426 402 380 359 336 323 300
595 618 612 583 621 608 567 580 571 520 522 521 521 550 591 576 602 635 668 632 580 529 488 466 404 398 380 370 370 350
16,028
534
668
398
Highest mean discharge, in cubic feet per second, for the indicated number of consecutive days Period 1 3 7 15 30 60 90 120 183
Oct. 1972-.Tune 1973 ------------------ 781 000 760.000 751,000 745,000 732,000 694,000 647,000 59B,OOO 52n.OOO Recu:!!~~:~nt~~~~~.-i;~~~~~ -f~~-1973 _____ 6_1_9_:__,o_o_o __ 6_1_9..:...,o_o_o_6_1_5-'-,o-o_o __ 60_8~,_oo_o __ 59_0~,_oo_o __ 5_4_0_,__,o_o_o_4_9_2--'-,o-o_o._4_5_7-=-'o_o_o __ 40_8__.:.,_00_0
flood volumes ----------------------
MISSISSIPPI RIVER DELTA
(71) 07381530Morganza Floodway near Krotz Springs, La.
Location.-Lat 30°3.3'16", long 91°41'51", Pointe Coupee Parish, c:;.t bridge on U.S. Highway 190, 5 miles (8 km) east of the town of Krotz Springs, La.
Drainage area.-Indeterminate. Remarks.-This was the first time the Morganza Floodway was useci. since it was constructed.
THE FLOODS
TABLE 12.-Station descriptions and discharge and suspended-sediment data-Continued
Measured discharge and suspended-sediment concentration and discharge
April Suspended sediment
Day
1 2 3 4 6 6 7 8 9
10 11 ---------12 13 14 16 16 17 18 19 20 21 22 23 24 26 26 27 28 29 30 31 ---------
Measured
discharge (ft3/s)
76,800 141,000
99,800 78,100 68,400 59,100 65,600 63,400 62,000 61,000 65,000 67,100
Mean concentration (mg/1)
40 40 35 32 27 30 25 23 26 26 19 17
Total -------------------------Mean monthly discharge --------Maximum ---------------------Minimum ----------------------
Discharge (1,000
tons/day)
8,920 15,400 9,300 6,680 4,930 4,760 3,820 4,010 4,360 4,280 3,310 3,020
3,219,300 104,000 142,000 66,900
Day
1 2 3 4 6 6 7 8 9
10 11 12 13 14 15 16 17 18 19 20 21 22 23 24 25 26 27 28 29 30 31
May
Measured
discharge (ft3/s)
66,900 75,000 74,300 75,300 74,400 77.100 70,800 74,800 78,800 76,100 78,800 79,800 81,500 85,000 95,700
108,000 122,000 137,000 139,000 140,000 140,000 142,000 132,000 133,000 131,000 131,000 125,000 124,000 120,000 119,000 112,000
Suspended sediment -Mean D~
concen- charge tration ( 1,000 (mg/1) tons/day)
14 18 19 22 25 21 23 23 23 31 33 30 27 31 25 34 24 26 38 33 36 31 31 72 32 43 48 33 49 34 29
2,S10 3,720 3,880 4,420 5,110 4,450 4,400 4,840 4,810 6,450 7,290 6,570 5,940 7,120 6,460 9,960 7,820 9,490
14,400 12,400 13,800 11,800 10,900 25,800 11,200 15,300 16,100 11,000 15,700 10,900
8,770 283,410
9,140 25,800 2,610
MISSISSIPPI RIVER DELTA
Day
1 2 3 4 5 6 7 8 9
10 11 12 13 14 15 16 17 18 19 20 21 22 23 24 25 26 27 28 29 30 31
(72) 07381590 Wax Lake Outlet at Calumet, La.
June
Measured
discharge (ft3/s)
107,000 104,000
94,100 90,600 84,100 77,900 60,800 68,500 58,000 53,900 44,100 37,900 28,300 23,200 20,200
135
Suspended sediment Mean
concentration (mg/1)
39 37 29 32 26 27 28 29 25 28 28 25 26 29 28
Discharge
(tons/day)
11,200 10,400
7,370 7,750 5,800 5,600 4,600 4,580 3,920 4,070 '3,330 2,560 1,980 1,790 1,520
Location.-Lat 29°42'09", long 91 °22'07", St. Mary Parish, at bridge on U.S. Highway 90, 0.5 mile (0.8 km) west of Calu-met, and 4.0 miles (6.4 km) west of Patterson, La.
Drainage area.-Indeterminate. Gage.-Water-stage re·corder and staff. Datum of gage is 0.14 ft (0.043 m) below me·an sea level. Discharge record.-Discharge, 1942 to 1946, 1949 to 1955. and intermittently 1957 to date. Maxima.-March-June 1973: Gage height, 11.18 ft (3.408 m) May 27.
1942 to February 1973: Gage height, 8.4 ft (2.56 m) [affected by hurricane] June 27, 1957.
Measured discharge, .1973
Date Gage height
(ft) Discharge
(ft 3/s) Date Gage height
(ft)
April
May
10 -----------13 18 20 24
27 -----------1 4 8
11 -----------15 17
7.5 7.9 8.9 8.8 9.3 9.3 9.6 9.7
10.2 10.2 10.3 10.4
214,000 213,000 210,000 224,000 226,000 238,000 241,000 238,000 246,000 266,000 245,000 257,000
May
June
22 -----------25 29 31
5 8
12
15 -----------19 -----------21
26 -----------29
10.5 10.9 10.9 10.8 10.2 9.6 8.8 8.3 7.9 7.7 7.3 6.9
Discharge (ft a;s)
269,000 267,000 272,000 257,000 234,000 236,000 209,000 185,000 194,000 191,0b0 183,000 176,000
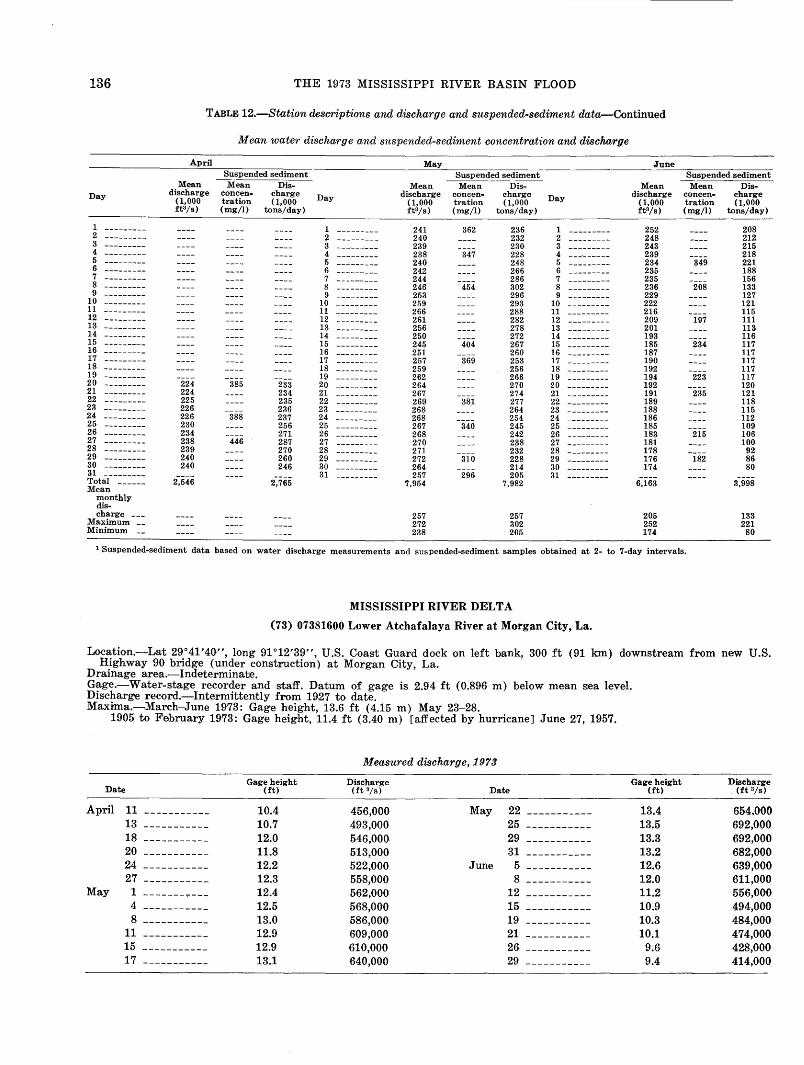
136 THE 1973 MISSISSIPPI RIVER BASIN FLOOD
TABLE 12.-Station descriptions and discharge and suspended-sediment data-Continued
Mean water discharge and suspended-sediment concentration and discharge
April May June ~uspended sediment Suspended sediment Suspended sediment
Mean Mean Dis- Mean Mean Dis- Mean Mean Dis-Day discharge concen- charge Day discharge concen- charge Day discharge concen- charge
(1,000 tration (1,000 (1,000 tration (1,000 (1,000 tration (1,000 ft3/s) (mg/1) tons/day) ft3/s) (mg/1) tons/day) ft3/s) (mg/1) tons/day)
1 1 --------- 241 362 236 1 252 208 2 2 240 232 2 248 212 3 3 239 230 3 243 215 4 --------- 4 238 347 228 4 239 218 5 5 240 248 5 234 349 221 6 6 242 266 6 235 188 7 7 --------- 244 286 7 --------- 235 156 8 8 246 454 302 8 236 208 133 9 9 253 296 9 229 127
10 10 259 293 10 222 121 11 11 266 288 11 216 115 12 12 261 282 12 209 197 111 13 --------- 13 256 278 13 201 113 14 14 250 272 14 193 116 15 15 --------- 245 404 267 15 185 234 117 16 16 251 260 16 187 117 17 17 257 369 253 17 190 117 18 18 259 256 18 192 117 19 19 262 266 19 194 223 117 20 224 385 233 20 264 270 20 192 120 21 224 234 21 267 274 21 191 235 121 22 225 235 22 269 381 277 22 189 118 23 --------- 226 236 23 268 264 23 188 115 24 --------- 226 388 237 24 268 254 24 --------- 186 112 25 230 256 25 267 340 245 25 --------- 185 109 26 234 271 26 268 242 26 183 215 106 27 238 446 287 27 270 238 27 181 100 28 239 270 28 271 232 28 178 92 29 240 260 29 272 310 228 29 176 182 86 30 240 246 30 --------- 264 214 30 174 80 31 31 257 296 205 31 Total ------ 2,546 2,765 7,954 7,982 6,163 3,998 Mean
monthly dis-charge --- 257 257 205 133
Maximum __ 272 302 252 221 Minimum -- 238 205 174 80
1 Suspended-sediment data based on water discharge measurements and suspended-sediment samples obtained at 2- to 7-day intervals.
MISSISSIPPI RIVER DELTA
(73) 07381600 Lower Atchafalaya River at Morgan City, La.
Location.-Lat 29°41'40", long 91 °12'39", U.S. Coast Guard dock on left bank, 300 ft (91 Ion) downstream from new U.S. Highway 90 bridge (under construction) at Morgan City, La.
Drainage area.-Indeterminate. Gage.-Water-stage recorder and staff. Datum of gage is 2.94 ft (0.896 m) below mean s:ea level. Discharge record.-Intermittently from 1927 to date. Maxima.-March-June 1973: Gage height, 13.6 ft (4.15 m) May 23-28.
1905 to February 1973: Gage height, 11.4 ft (3.40 m) [affected by hurricane] June 27, 1957.
Date
April
May
11 -----------13 -----------18 -----------20 24 27 1
4 -----------8 -----------
11 15 17
Gage height (ft)
10.4 10.7 12.0 11.8 12.2 12.3 12.4 12.5 13.0 12.9 12.9 13.1
Measured discharge, .1973
Discharge (ft a;s) Date
456,000 493,000 546,000 513,000 522,000 558,000 562,000 568,000 586,000 609,000 610,000 640,000
May
June
22 -----------25 29
31 -----------5 8
12 -----------15 19
21 -----------26 -----------29
Gage height (ft)
13.4 13.5 13.3 13.2 12.6 12.0 11.2 10.9 10.3 10.1
9.6 9.4
Discharge (ft a;s)
654,000 692,000 692,000 682,000 639,000 611,000 556,000 494,000 484,000 474,000 428,000 414,000
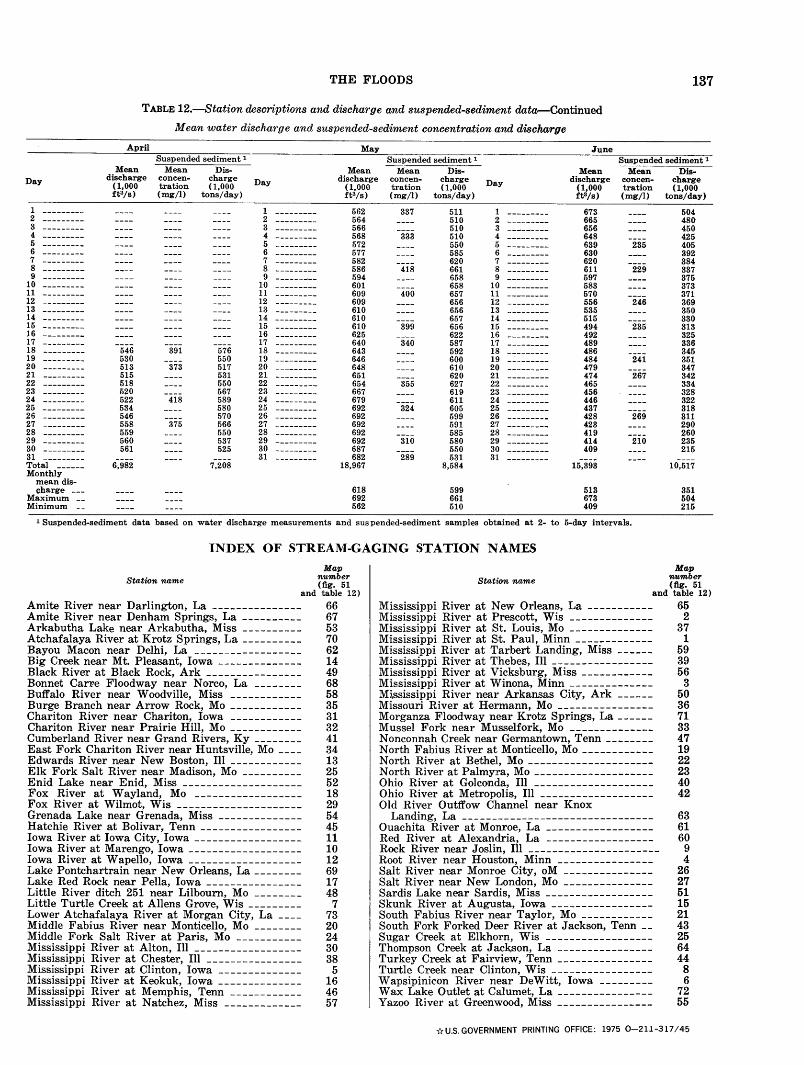
THE FLOODS 137
TABLE 12.-Station descriptions and discharge and suspended-sediment data-Continued
Mean water discharge and suspended-sediment concentration and discharge
April May June Suspended sediment 1 Suspended sediment 1 Suspended sediment 1
Mean Mean Dis- Mean Mean Dis- Mean Mean Dis-Day discharge concen- charge Day discharge concen- charge Day discharge concen- charge
( 1,000 tration (1,000 (1,000 tration (1,000 (1,000 tration (1,000 ft3/s) (mg/1) tons/day) ft3/s) (mg/1) tons/day) ft3/s) (mg/1) tons/day)
1 1 562 337 511 l 673 504 2 --------- 2 --------- 564 510 2 --------- 665 480 3 3 566 510 3 --------- 656 450 4 --------- 4 --------- 568 333 510 4 648 425 5 --------- 5 572 550 l'i ---·------ 639 235 405 6 --------- 6 577 585 6 630 392 7 7 582 620 '7 --------- 620 384 8 --------- 8 586 418 661 8 611 229 337 9 9 594 658 9 597 375
10 10 601 658 10 --------- 583 373 11 11 --------- 609 400 657 11 570 371 12 --------- 12 609 656 12 556 246 369 13 --------- 13 610 656 13 --------- 535 350 14 14 610 657 14 --------- 515 330 15 15 610 399 656 11) --------- 494 235 313 16 --------- 16 625 622 16 492 325 17 17 640 340 587 1'7 -----·---- 489 336 18 --------- 546 391 576 18 643 592 18 486 345 19 --------- 530 550 19 646 600 19 --------- 484 241 351 20 513 373 517 20 648 610 20 479 347 21 --------- 515 531 21 651 620 21 474 267 342 22 --------- 518 550 22 --------- 654 355 627 22 465 334 23 520 567 23 667 619 23 --------- 456 328 24 522 418 589 24 679 611 24 --------- 446 322 25 --------- 534 580 25 692 324 605 25 --------- 437 318 26 --------- 546 570 26 692 599 26 428 269 311 27 --------- 558 375 566 27 692 591 2'7 423 290 28 559 550 28 692 585 28 419 260 29 --------- 560 537 29 692 310 580 29 --------- 414 210 235 30 --------- 561 525 30 687 550 30 --------- 409 215 31 31 682 289 531 31 Total 6,982 7,208 18,967 8,584 15,393 10,517 Monthly
mean dis-charge --- 618 599 513 351
Maximum -- 692 661 673 504 Minimum -- 562 510 409 215
1 Suspended-sediment data based on water discharge measurements and suspended-sediment samples obtained at 2- to 5-day intervals.
INDEX OF STREAM-GAGING STATION NAMES
Station name Map
numbeT (fig. 51
and table 12)
Amite River near Darlington, La --------------- 66 Amite River near Denham Springs, La ---------- 67 Arkabutha Lake near Arkabutha, Miss ---------- 53 Atchafalaya River at Krotz Springs, La ---------- 70 Bayou Macon near Delhi, La ------------------ 62 Big Creek near Mt. Pleasant, Iowa -------------- 14 Black River at Black Rock, Ark ---------------- 49 Bonnet Carre Floodway near Norco, La ________ 68 Buffalo River near Woodville, Miss ------------ 58 Burge Branch near Arrow Rock, Mo ------------ 35 Chariton River near Chariton, Iowa ------------ 31 Chariton River near Prairie Hill, Mo ------------ 32 Cumberland River near Grand Rivers, Ky ________ 41 East Fork Chariton River near Huntsville, Mo ____ 34 Edwards River near New Boston, Ill ------------ 13 Elk Fork Salt River near Madison, Mo ---------- 25 Enid Lake near Enid, Miss -------------------- 52 Fox River at Wayland, Mo ------------------ 18 Fox River at Wilmot, Wis --------------------- 29 Grenada Lake near Grenada, Miss -------------- 54 Hatchie River at Bolivar, Tenn ----------------- 45 Iowa River at Iowa City, Iowa ------------------ 11 Iowa River at Marengo, Iowa ------------------- 10 Iowa River at Wapello, Iowa ------------------- 12 Lake Pontchartrain near New Orleans, La________ 69 Lake Red Rock near Pella, Iowa ---------------- 17 Little River ditch 251 near Lilbourn, Mo ________ 48 Little Turtle Creek at Aliens Grove, Wis _________ 7 Lower Atchafalaya River at Morgan City, La ____ 73 Middle Fabius River near Monticello, Mo ________ 20 Middle Fork Salt River at Paris, Mo ----------- 24 Mississippi River at Alton, Ill ------------------ 30 Mississippi River at Chester, Ill ---------------- 38 Mississippi River at Clinton, Iowa -------------- 5 Mississippi River at Keokuk, Iowa -------------- 16 Mississippi River at Memphis, Tenn ------------ 46 Mississippi River at Natchez, Miss ------------- 57
Station name Map
number (fig. 51
and table 12)
Mississippi River at New Orleans, La ----------- 65 Mississippi River at Prescott, Wis -------------- 2 Mississippi River at St. Louis, Mo -------------- 37 Mississippi River at St. Paul, Minn ------------- 1 Mississippi River at Tarbert Landing, Miss ------ 59 Mississippi River at Thebes, Ill ----------------- 39 Mississippi River at Vicksburg, Miss ------------ 56 Mississippi River at Winona, Minn -------------- 3 Mi.ssissippi River near Arkansas City, Ark ------ 50 Missouri River at Hermann, Mo ---------------- 36 Morganza Floodway near Krotz Springs, La------ 71 Mussel Fork near Musselfork, Mo -------------- 33 Nonconnah Creek near Germantown, Tenn -------- 47 North Fabius River at Monticello, Mo ------------ 19 North River at Bethell, Mo --------------------- 22 North River at Palmyra, Mo -------------------- 23 Ohio River at Golconda, Ill -------------------- 40 Ohio River at Metropolis, Ill ------------------- 42 Old River Outffow Channel near Knox
Landing, La -------------------------------Ouachita River at Monroe, La -----------------Red River at Alexandria, La -----------------Rock River near Joslin, Ill ---------------------Root River near Houston, Minn ---------------Salt River near Monroe City, oM --------------Salt River near New London, Mo --------------Sardis Lake near Sardis, Miss -----------------Skunk River at Augusta, Iowa ----------------South Fabius River near Taylor, Mo -----------South Fork Forked Deer River at Jackson, Tenn __ Sugar Creek at Elkhorn, Wis -----------------Thompson Creek at Jack;son, La ---------------Turkey Creek at Fairview, Tenn ---------------Turtle Creek near Clinton, Wis ----------------Wapsipinicon River near DeWitt, Iowa --------Wax Lake Outlet at Calumet, La ---------------Yazoo River at Greenwood, Miss ----------------
63 61 60
9 4
26 27 51 15 21 43 25 64 44
8 6
72 55
frU.S.GOVERNMENT PRINTING OFFICE: 1975 0-211-317/415