Embed Size (px)
Citation preview

1
Annals of Forest Science (2013) DOI: 10.1007/s13595-013-0304-x
Spatially-explicit competition in a mixed planting of
Araucaria cunninghamii and Flindersia brayleyana
Jerome K VANCLAY 1, David LAMB
2, Peter D. ERSKINE
2 & David M. CAMERON
1
1. Southern Cross University, Forest Research Centre, Lismore NSW 2480, Australia. [email protected]
2. The University of Queensland, Centre for Mined Land Rehabilitation, Brisbane Qld 4072, Australia.
Abstract
Context: A 20 year old Nelder wheel planted with hoop pine (Araucaria cunninghamii Aiton ex
D.Don) and Queensland maple (Flindersia brayleyana F.Muell.) in 18 spokes and 8 rings represents
nominal point densities of 3580, 2150, 1140, 595, 305, 158, 82 and 42 stems/ha and offers an
opportunity to examine competition and spatial interaction between these two species.
Aims: To evaluate the intra- and inter-specific competition between two contrasting tree species, and
determine the distance over which competition can be observed.
Methods: Competition was estimated using Hegyi’s index, implemented using the Simile visual
modelling environment, and calibrated using non-linear least squares with PEST.
Results: Interactions were detected between pairs of stems closer than Dij<40(di+dj) where D is
distance (cm) and d is stem diameter (cm dbh). F. brayleyana trees surrounded by A. cunninghamii
trees suffer negligible competition whereas A. cunninghamii surrounded by F. brayleyana trees
experience strong competition.
Conclusion: Forty times diameter offers a useful guide to the extent of competition in even-aged
stands planted with these species. Competition can be observed empirically when pairs of trees are
closer than 40 times the sum of their diameters, but the intensity of the competition may vary
considerably with species.
Keywords: Araucaria cunninghamii; Clinal spacing trial; Flindersia brayleyana; Hegyi index; Hoop
pine; interspecific competition; Nelder wheel; Queensland maple

2
Introduction
Competition is a fundamental process that shapes plant growth and provides the basis for density
management of tree plantations. Despite the importance of understanding competition in production
forests, relatively few studies have reported details of inter- and intraspecific competition in mixed
stands, and most publications deal with competition in a generic way by examining non-spatial
measures (e.g., stand density as measured by stand basal area) and intra-specific competition in
monocultural plantings (e.g., Mitchell 1975; Strub et al. 1975).
In recent years ecologists have begun exploring the potential of polycultures to increase ecosystem
productivity (Yanai 1992; Tilman et al. 1997; Hooper et al. 2005; Jones et al. 2005; Bristow et al.
2006a; Erskine et al. 2006). Forest owners have also shown increased interest in the use of tree
polycultures, because of their capacity to generate a wider range of goods and services than
monocultures (Nichols et al. 2006; Lamb 2011). However, if the task of managing competition in a
monoculture is difficult then it is even more so in mixtures, where there are many more ways in which
competition can be manifested (Forrester et al. 2011). It is useful to recognise two broad categories of
beneficial mixtures. In one such category, the dominant process is that of facilitation, such as when a
nitrogen fixing species is planted together with a non-nitrogen fixer on an infertile soil. In this case,
the growth of the latter species – and sometimes that of the whole stand – can be improved by the
nitrogen-fixing species and the nitrogen it adds to the ecosystem (Forrester et al. 2006). In the second
category, the species are complementary and occupy different ecological niches. This means they
avoid or minimize competition and so increase overall productivity (Sheil et al. 2006; Pretzsch 2010).
In such cases the key issue is finding truly complementary species and managing stands to maximize
complementarity and minimize inter-specific competition.
This study seeks to contribute to an understanding of both intra- and inter-specific competition by
examining spatial interactions in a two-species Nelder (1962) trial in the humid subtropics.
Specifically, it seeks to calibrate the responses of the two species to intra-and inter-specific
competition and the implications this has for the management of simple polyculture plantations.
Literature
Despite extensive literature on competition in plantation trees (e.g., Berger et al. 2008; Harrington et
al. 2009; Binkley et al. 2010; Conteras et al. 2011; Weiskittel et al. 2011), relatively few studies have
attempted to estimate inter-specific competition in binary mixtures in a spatially-explicit way (Mead
1979; Jones et al. 2005; Vanclay 2006b; Perot and Picard 2012). This is an important step to
understanding competition in mixed-species plantings, and towards a paradigm of strong and weak
competitors (Vanclay 1994, p.162). Much of the work on competition has focused on spatial indices

3
for monospecific plantings (e.g., Strub et al. 1975; Fox et al. 2007; Burkhart and Tome 2012) and
non-spatial indices for complex forests (e.g., Vanclay 1994; Peltoniemi and Makipaa 2011), and
relatively few publications deal with spatial indices in even-aged polycultures (e.g., Coates et al.
2009; Kaitaniemi and Lintunen 2010).
Many variants of forest competition indices have been proposed and tested (e.g., Strub et al. 1975;
Martin and Ek 1984; Daniels et al. 1986; Pukkala and Kolstrom 1987; Tome and Burkhart 1989;
Biging and Dobbertin 1995; Soares and Tome 1999; Ledermann and Stage 2001; Miina and Pukkala
2002; Radtke et al. 2003; Woodall et al. 2003; Stadt et al. 2007; Oheimb et al. 2011). A recent
classification and review offered by Weiskittel et al. (2011) illustrates the utility of Hegyi-type indices
(Hegyi 1974; Holmes and Reed 1991; Mailly et al. 2003; Vanhellemont et al. 2010) that rely on the
relative size of potential competitors and the distance between them.
Many experiment designs offer a weak basis for testing competition indices because regular
rectangular plantings provide a limited range of inter-tree distances (Vanclay 2006a), and unthinned
stands may be confounded by the high correlation between size and competition. An analysis of
species interactions in a mixed planting of Acacia peregrina and Eucalyptus pellita (Vanclay 2006b;
Bristow et al. 2006b) demonstrated the ability of competition indices to reveal species interactions,
but the blocked experimental design and the rectangular spacing employed in that trial created
difficulties in establishing the spatial extent of competition. The present study draws on the wide
range of spacing in a Nelder (1962) design to examine more closely the spatial extent of competition
in mixed plantings. Vanclay (2006a) reviewed a variety of experimental designs of interest in
studying competition, and whilst Nelder designs have been extensively studied (Stape and Binkley
2010; Parrott et al. 2012), the current trial retains interest because it is one of very few long-
established mixed-species planting with a binary mixture.
The present study deals with Hoop pine (Araucaria cunninghamii Aiton ex D.Don) and Queensland
maple (Flindersia brayleyana F.Muell.). These two species have been planted widely in Queensland
(Vanclay 2006c; Manson et al. 2013), and hoop pine has become an important plantation species
(Lamb et al. 2001). Elsewhere in southern Queensland, several ad hoc plantings with alternate row
plantings have shown these two species can form a stable mixture over periods of up to 50 years
(Lamb and Lawrence 1993). This apparent complementarity appears to be associated, at least in part,
with the difference in canopy architecture (hoop having persistent branches and a deep crown, while
maple has a shallow green crown). There is also some evidence that hoop pine has a deeper root
system than maple (Lamb and Lawrence 1993). One of these alternate-row plantings exhibited
increased height, bole length, diameter and smaller branch sizes in maple when compared with a
monocultural planting of maple nearby, while hoop pine appeared similar to surrounding hoop
plantation in respect of these and other mensurational parameters. This observation was part of the

4
motivation to examine this apparent synergism using a Nelder design by arranging species in spokes
to provide monocultural and polycultural comparisons. Earlier reports based on this trial include an
examination of early growth pasture production within the Nelder plot (Lamb and Borschmann 1998;
Woldring 1998), and soil and foliar analyses (Lamb and Borschmann 1998). This work showed that
maple suppressed grasses more than hoop, even at relatively low densities (Costantini 1989; Woldring
1998; Xu et al. 2002), and that the height-diameter-density relationship remained stable over time
(Vanclay 2009).
The physiology of both species was monitored between August 1992 and December 1994, and
revealed that density effects on maximum photosynthetic rates were most apparent in maple, with
greater rates occurring in trees planted at low tree densities (<158 stems ha-1
) than at high tree
densities (>2150 stems ha-1
). In contrast, hoop had higher rates of photosynthesis at intermediate
densities (305 - 1140 stems ha-1
) than at either high or low planting densities (Lamb and Borschmann
1998; Snell 1998). Hoop maintained high water potentials when surrounding individuals of maple
displayed low potentials, apparently due to the deeper rooting system in hoop, which, when coupled
with low stomatal conductance, contributes to greater drought resistance (Lamb and Borschmann
1998; Snell 1998). The ability of maple to compete for soil moisture either between individuals of the
same species or with individuals of deeper rooted species is diminished when planted at high density
during seasonal droughts (Lamb and Borschmann 1998).
Material and Methods
A Nelder trial with two species was established on a uniform one-hectare site at Mt Mee (27°S,
153°E) in south east Queensland, Australia, in June 1990. The site is former pasture on a deep
kraznozem soil derived from basalt (Lamb and Borschmann 1998), and appears free of the variability
that may confound productivity studies (Skovsgaard and Vanclay 2013). The two species, Hoop pine
(Araucaria cunninghamii Aiton ex D.Don) and Queensland maple (Flindersia brayleyana F.Muell.),
were arranged to allow an evaluation of monospecific growth as well as growth in mixed stands of
various compositions (i.e., with alternate species on one or two sides, Figure 1). The design involved
18 spokes (each at 20 degrees) and 8 rings of trees at radii of 4.33, 6.2, 8.55, 11.9, 16.45, 23, 31.8 and
44.3 metres, creating nominal point densities (assuming the area tessellated in annular sectors) of
3580, 2150, 1140, 595, 305, 158, 82 and 42 stems/ha respectively. In addition, there were two internal
‘buffer’ rings with 6 and 9 trees, at radii of 0.7, 2.52 m, corresponding to 7400 and 3140 stems/ha –
these were not part of the formal design, and did not involve the full complement of 18 spokes.

5
-50
50
-50 50
Hoop
Maple
Figure 1. Mt Mee Nelder trial with hoop pine (Araucaria cunninghamii) and Queensland maple
(Flindersia brayleyana). The innermost 2 rings (with 6 and 9 trees) are ‘buffers’, not part of the
formal design. Symbol size is indicative of stem diameter. Ring numbers are shown for outermost
four rings.
The plot was initially measured biannually during 1990-96, and then in 1997, 1998, 2002, 2003, 2005
and 2010. Diameter (either root collar or diameter at breast height of 1.3 m) was recorded at all
measures, but tree heights were recorded less frequently and only in the early years. Only some of
these measurements were used in this analysis: intervals were selected to attain diameter increments
that were large relative to expected measurement precision. The seven measure dates chosen for use
in subsequent analysis were 13 July 1992, 19 July 1993, 3 August 1995, 11 August 1998, 1 October
2002, 5 February 2005 and 9 July 2010. These dates provided intervals of 1, 2, 3, 4.1, 2.3 and 5.4
years. Analyses were based on stem diameter, because of the measurement frequency, because the
precision of diameter measurement is generally greater than of height measurement, and because the
diameter growth response to competition is more immediate than the height response (Richardson et
al. 1999). Selected measurements were used to derive estimates of periodic annual diameter increment
during the period immediately following these measures (except for the 2010 measure at 20 years
after planting). Competition indices were estimated from potential competitor trees within the
neighbourhood defined for each subject tree.
m
8
7
6
5

6
Figure 2. Google Earth image of Mt Mee Nelder trial, 20 July 2009 (© 2012 Google, © 2012
GeoEye, 27.096°S, 152.734°E), showing the two species, survival, and proximity of other plantings.
Competition was modelled using the simulation software Simile (Muetzelfeldt and Massheder 2003;
Simulistics 2012), a generic modelling package that is well-suited to studying spatial interactions
between individuals (Vanclay 2006b; Vanclay et al. 2006). Models were formulated and examined
using Simile, and parameters were estimated by non-linear least-squares using PEST (Doherty 2005),
which uses the Gauss-Marquardt- Levenberg method with Tikhonov regularisation (Doherty and
Skahill 2006).
Although early survival of the plantings in the trial was good, eight trees were dead or missing by the
2010 remeasure (one in 2002, one in 2003, one in 2005, and five in 2010), and the proximity of
adjacent plantings compromised the design slightly, as is evident in 2009 satellite imagery (Figure 2).
The weak correlation (r=0.021, P=0.5) between tree size (dbh in 2010) of trees in the outer ring and
the distance to adjacent plantings provides further support for the notion that these plantings
compromise the design only slightly. Figure 2 illustrates the supplementary plantings in the vicinity of
the Nelder planting, to the east and the south-west of the main Nelder design. These rectangular
plantings were not always measured, so measurements taken in 2006 and 2010 were used to
interpolate missing data. Interpolated diameters were used to calculate competition experienced by
other trees, but were not used directly in any analysis.

7
Figure 3. Mean diameter of the two species in the Nelder trial (left and centre), with lines
representing the 8 different ‘rings’ in experiment. The rightmost graph shows the growth rates of trees
at the widest spacing: the solid line is mean annual increment (MAI, dbh/age), dashed line is periodic
annual increment (PAI, ∆dbh/∆age). Vertical bars show ±1 standard error.
An established approach to estimating competition is to rely on the assumption that observed growth
can be estimated as the product of potential growth modified by a competition index (e.g., Arney
1985; Vanclay 1994; Pretzsch and Biber 2010), typically
Growth = f(tree size) × f(competition experienced)
However, growth of the wide-spaced trees has been remarkably constant during these first 20 years
for both species in these trials (Figure 3), so the size-related component of growth is subsumed within
the constant term, and our analysis deals with the competition term.
Various approaches have been used to define the relevant neighbourhood. Many researchers rely on
constant radii (e.g., 3 m by Hegyi 1974; 5 m by Kaitaniemi and Lintunen 2010; 6 m by Miina and
Pukkala 2002; 8 m by Stadt et al. 2007; 11 m by Contreras et al. 2011) while a few define the
neighbourhood in terms of tree size (e.g., proportional to crown radius, Lorimer 1983; or to tree
height, Vanclay 2006b). Hegyi (1974) proposed an index Hj = Σi(di/dj)/Dij where di is the diameter of
the competitor i, dj is the diameter of the victim j, and Dij is the distance between trees i and j, for all
trees where Dij<a(di+dj). This index is analogous to the intuition used by field foresters who rely on
relative size and separation of trees to gauge likely impact from potential competitors. An alternative
index that was examined in some detail was proposed by Miina and Pukkala (2002): Mj = Πi{1-exp(-
cDijb/di)}, for all hi<ahj, where di and hi are the diameter and height of the competitor i, and Dij is the
distance between trees i and j. Miina’s index differs from most competition indices in that it indicates
resource availability (cf. inverse of competition), depends only on the size and distance of potential
competitors, can be computed for bare ground (Figure 4), and offers utility for understorey studies. In
contrast, Hegyi’s index is a classical competition index that can be computed only for competing pairs
of trees. However, Miina’s index is inherently constrained between zero and one, and may be ill-
suited to situations where interacting species exhibit complementarity (e.g., Forrester et al. 2011).

8
Figure 4. Indicative competition at age 20 based on the Miina index (black indicates high resource
availability; white shows low availability). Competition from trees not part of the Nelder design is
evident at top right and bottom left.
Empirical testing revealed that the Hegyi index performed better than Miina’s index in the present
study, and that the Hegyi index performed best when the search radius was expressed as a multiple of
stem diameter rather than a fixed radius. There is little to discriminate between the two indices
empirically: both are highly correlated with observed increments (r>0.76) and with each other
(r=0.95). However, the Hegyi index offered a stronger correlation, and avoided two drawbacks of the
Miina index, namely the larger number of parameters to be estimated, and the multicollinearity
(Belsley et al. 2004) that existed between these parameters.
9
Results
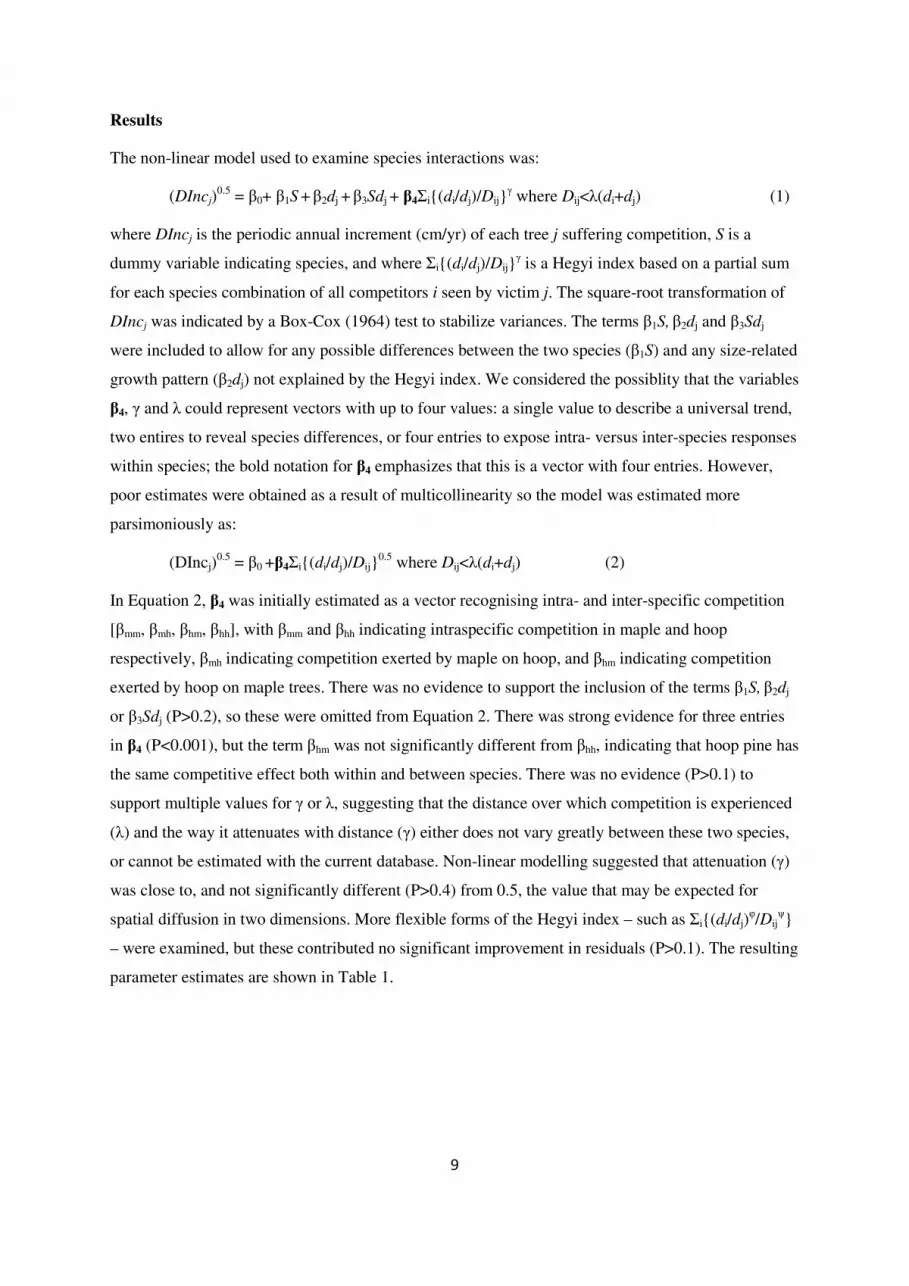
The non-linear model used to examine species interactions was:
(DIncj)0.5
= β0+ β1S + β2dj + β3Sdj + β4Σi{(di/dj)/Dij}γ where Dij<λ(di+dj) (1)
where DIncj is the periodic annual increment (cm/yr) of each tree j suffering competition, S is a
dummy variable indicating species, and where Σi{(di/dj)/Dij}γ is a Hegyi index based on a partial sum
for each species combination of all competitors i seen by victim j. The square-root transformation of
DIncj was indicated by a Box-Cox (1964) test to stabilize variances. The terms β1S, β2dj and β3Sdj
were included to allow for any possible differences between the two species (β1S) and any size-related
growth pattern (β2dj) not explained by the Hegyi index. We considered the possiblity that the variables
β4, γ and λ could represent vectors with up to four values: a single value to describe a universal trend,
two entires to reveal species differences, or four entries to expose intra- versus inter-species responses
within species; the bold notation for β4 emphasizes that this is a vector with four entries. However,
poor estimates were obtained as a result of multicollinearity so the model was estimated more
parsimoniously as:
(DIncj)0.5
= β0 +β4Σi{(di/dj)/Dij}0.5
where Dij<λ(di+dj) (2)
In Equation 2, β4 was initially estimated as a vector recognising intra- and inter-specific competition
[βmm, βmh, βhm, βhh], with βmm and βhh indicating intraspecific competition in maple and hoop
respectively, βmh indicating competition exerted by maple on hoop, and βhm indicating competition
exerted by hoop on maple trees. There was no evidence to support the inclusion of the terms β1S, β2dj
or β3Sdj (P>0.2), so these were omitted from Equation 2. There was strong evidence for three entries
in β4 (P<0.001), but the term βhm was not significantly different from βhh, indicating that hoop pine has
the same competitive effect both within and between species. There was no evidence (P>0.1) to
support multiple values for γ or λ, suggesting that the distance over which competition is experienced
(λ) and the way it attenuates with distance (γ) either does not vary greatly between these two species,
or cannot be estimated with the current database. Non-linear modelling suggested that attenuation (γ)
was close to, and not significantly different (P>0.4) from 0.5, the value that may be expected for
spatial diffusion in two dimensions. More flexible forms of the Hegyi index – such as Σi{(di/dj)φ/Dij
ψ}
– were examined, but these contributed no significant improvement in residuals (P>0.1). The resulting
parameter estimates are shown in Table 1.

10
Table 1. Parameter estimates for Equation 2, calibrated for the Mt Mee data.
Parameter Symbol Estimate s.e. Student’s t P Sig
Intercept β0 1.599 0.0106 151.4 <0.0001 ***
Horizon λ 40.06 0.0001 10116 <0.0001 ***
Attenuation γ 0.510 0.0356 14.3 <0.0001 ***
Competition m-m † βmm -0.0308 0.0097 3.2 0.0008 ***
Competition m-h ‡ βmh -0.0149 0.0022 6.9 <0.0001 ***
Competition h-* βh* -0.0077 0.0053 1.5 0.07 -
† calibrated relative to βh*, ‡ calibrated relative to βmm , the intra-specific competition observed in maple.
The estimates from Equation 2 and Table 1 can be synthesised as
(DInc)0.5
= 1.599 -0.0386Hmm -0.0534Hmh -0.0077Hh* (3)
where Hmm, Hmh and Hh* are partial sums respectively of intraspecific competition in maple (Hmm), of
interspecific competition caused by maple to hoop (Hmh), and of competition caused by hoop (Hh*),
computed as Hmm = Σj Σi{(di/dj)/Dij}0.5
for all Dij<40(di+dj) where i and j are both maple trees, etc.
Whilst Equation 3 is a simple empirical summary of the observed increments, it offers a surprisingly
good correlation (Figure 5), given that it spans a 20-year period and wide range of tree sizes (Figure
3) and stand density (42 – 7400 stems/ha).
0
0.4
0.8
1.2
1.6
2
0 0.4 0.8 1.2 1.6
Ob
serv
ed
in
cre
me
nt
(cm
/yr)
0.5
Equation 3 prediction (cm/yr)0.5
hoop
maple
Linear (hoop)
Linear (maple)
Figure 5. Observed and predicted increments from Equation 3.

11
Equation 2 allowed a thorough analysis of several formulations of competition, revealed the lack of
statistical support for these formulations, and established that the parsimonious formulation for
competition is Equation 3. No temporal or spatial pattern was evident in the residuals: spatial and
temporal variables such as measure date, x,y coordinates and spoke identifier exhibited no trend with
the residuals and were all statistically non-significant (P>0.1).
Table 1 reveals several important aspects about competition in the present study. A simple Hegyi
index Σi{(di/dj)/Dij}0.5
for all possible Dij<40(di+dj) explains much of the variation (67%) in growth
rate. There is no evidence that the parameter estimates λ=40 and γ=0.5 differ between these two
species. The limit of competition λ=40d corresponds approximately to three times the crown
radius,consistent with the observations of Lorimer (1983). The limit of competition λ=40d lies on a
broad plateau, with a wide range 26<λ<52 offering a coefficient of determination better than 66%
(Figure 6). The spatial extent of this competition observed in these subtropical species is substantially
greater than that commonly assumed in the computation of comparable indices for temperate species
(e.g., Hegyi 1974; Kaitaniemi and Lintunen 2010; Miina and Pukkala 2002; Stadt et al. 2007).
The relationship βc between the Hegyi index and observed tree growth (DInc0.5
) shows that maple
exerts strong competition on both maple and hoop neighbours (1.4 times the intraspecific
competition), but that hoop pine behaves quite differently, with less competitive influence (only 20%
of the maple intraspecific competition).
Discussion
As expected, the Hegyi index performed better than point estimates of stand basal area and the basal
area of larger trees (BAL; Vanclay 1989, Biging and Dobbertin 1995). Basal area and BAL offered
stronger correlations when the unit area adjustment was based on the distance between trees (Dij)
rather than (more conventionally) on the search area. However, in both formulations, total stand basal
area performed better than BAL (Figure 6), indicating that two-sided competition (i.e., for water and
nutrients) dominates in this planting, rather than one-sided competition for light. The optimal radius
for the Hegyi index was 40 times stem diameter with an average of 29 neighbourhood trees. This
distance is larger than those often reported in forestry studies, but is consistent with crown
observations of Lorimer (1983), and with comparable work examining tree-crop interactions (e.g.,
Woodall and Ward 2002, who observed reductions in wheat yields up to 30 m from Pinus radiata
trees). During the final measurement interval, the largest trees included in the analysis were 43 cm
dbh, and the most distant pair of competitors were 33 m apart.

12
0.5
0.55
0.6
0.65
0.7
10 20 30 40 50 60
Co
eff
icie
nt
of
de
term
ina
tio
n (
R2)
Relative distance (multiple of Di + Dj)
Hegyi (6 vars)
Hegyi (4 vars)
Basal area
BAL
Figure 6. Relative efficiency of four measures of competition: Equation 2 using a Hegyi index with
six estimated parameters, a generic Hegyi index with four parameters and no differentiation of
species, conventional stand basal area (BA m2/ha), and basal area in larger trees (BAL m
2/ha). BA and
BAL were computed using distance to competitors (i.e., Σidi2/Dij
2) rather than using the usual fixed
search area (Σidi2/r
2 where r is the search radius) which results in weaker correlations.
Equation 3 describes the relative levels of competition observed in the trial, and is not intended for
prediction or extrapolation. The square-root formulation of this equation confers desirable statistical
properties, but limits the ability to extrapolate because extreme densities lead to problematic negative
outcomes (not observed in the present data).
The strongly contrasting responses observed for interspecific competition (the effect of maple on hoop
is seven times the effect of hoop on maple, Equation 3) is somewhat surprising and warrants careful
consideration. One indicator suggesting a cautious interpretation is the high correlation (-0.8) between
parameter estimates of interspecific competition: thus if maple-to-hoop competition is overestimated,
hoop-to-maple competition may be underestimated. However, several indicators support the
implication that hoop competes only weakly with maple. The most compelling indicator is that partial
residuals after fitting Hegyi indices for intraspecific competition show a substantial unexplained trend
for hoop revealing interspecific competition not yet accommodated, and a near-zero trend for maple
reflecting the minimal effect that hoop has on maple growth. These competitive differences may be
explained in part by the different growth habits of the trees: as with most gymnosperms (Pallardy and
Kozlowski 2008), hoop pine demonstrates strong apical dominance and under the range of light

13
conditions in the Nelder wheel they maintained conical tree form. Lower branches that were heavily
shaded remained on the hoop pine even in the denser plantings. Conversely, maple demonstrated a
great range of growth plasticity and rapidly shed branches that became shaded. This habit and a dense
canopy near the top of the tree would have allowed the maple to shade surrounding hoop pines. Both
hoop and maple can tolerate a broad range of light conditions (Thompson et al. 1988) but the
plasticity of maple appears to be particularly advantageous when competing with hoop pine.
It is somewhat surprising that tree size (dj) is not significant (P>0.2) in Equation 1, because it is well
established that in general, tree size influences growth. The conventional suggestion that collinearity
between tree size and competition precludes reliable estimates of both parameters does not apply in
the present case, as weak correlations exist between competition and both tree size (0.13) and
diameter increment (0.67), in contrast to the strong correlation with the Hegyi index (Figure 6).
Nonetheless, is does seem likely that the co-development of tree size and competition hampers
interpretation, and that it may be insightful to impose systematic thinning on a Nelder or other clinal
spacing trial, to reveal further insights into the interplay between competition and tree growth.
Twenty years is a long time to await experimental results, but it is only at this point that the trial is
about to exhibit density-related mortality. The twenty-year life of the trial has also provided a strong
database for predicting plantation performance, as the current size of the widely-spaced trees
approximates the sizes desired in commercial plantings. Earlier results (Lamb and Borschmann 1998)
have been informative, but it appears that it is only now, near the twentieth anniversary, that the plot
offers definitive insights regarding density-induced mortality. This highlights the need to re-examine
the overall approach to forest research and the desirability of prioritising those studies requiring
rigorous evaluation at the planning stage and long-term support throughout their life rather than what
has become accepted as a standard 3-4 year term.
Conclusion
The Mt Mee Nelder trial provided a robust database that allowed an examination of inter- and intra-
specific competition between hoop pine and Queensland maple in a polyculture. The mixture
remained stable over 20 years but the analysis showed there were differences between the two species
in intra- and inter-specific competition. Measurable competition was found to extend 40 times the
diameter, with competition existing between pairs of trees for which separation Dij<40(di+dj) where D
is distance (cm) and d is stem diameter (cm).Maple was the more competitive of the two species and
has high levels of intra- and inter-specific competition. In contrast intra-specific competition between
hoop pines is modest and the competition experienced by maple from hoop competitors is negligible.
This means the hoop and maple mixture at this site is not complementary and forms a win-lose
14
relationship rather than a win-win partnership. The combination of a long-established Nelder trial,
coupled with individual tree modelling, has enabled new insights into the dynamics of these two
species in mixed plantings.
Acknowledgements
The trial was established on land generously made available by Don and Audrey Pickering, with
funding provided to Greening Australia (Queensland) by the National Afforestation Program. Planting
was carried out by volunteers from Greening Australia and Men of the Trees. Subsequent funding for
remeasurement was provided by the Rural Industries Research and Development Corporation
(RIRDC) through Project UQ-18A. Stanley Rance, Geoff Borschmann and Jim Johnston played
important roles in the design, establishment and early maintenance of the trial. We also acknowledge
help received in monitoring the trial by students from the University of Queensland.
References
Arney, J.D. (1985) A modeling strategy for the growth projection of managed stands. Can. J. For. Res. 15, 511-
518.
Belsley, D.A., Kuh, E. & Welsch, R.E. (2004) Regression diagnostics: identifying influential data and sources
of multicollinearity. Wiley 292 pp.
Berger, U., Piou, C., Schiffers, K., & Grimm, V. (2008). Competition among plants: concepts, individual-based
modelling approaches, and a proposal for a future research strategy. Perspectives in Plant Ecology,
Evolution and Systematics, 9, 3, 121-135.
Biging, G.S. & Dobbertin, M. (1995) Evaluation of competition indices in individual tree growth models. Forest
Science 41, 360-377.
Binkley, D., Stape, J.L., Bauerle, W.L. & Ryan, M.G. (2010) Explaining growth of individual trees: Light
interception and efficiency of light use by Eucalyptus at four sites in Brazil. Forest Ecology and
Management 259, 1704-1713.
Box, G.E.P. & Cox, D.R. (1964) An analysis of transformations. Journal of the Royal Statistical Society, B, 26,
211-234.
Bristow, M., Nichols, J.D. & Vanclay, J.K. (2006a) Improving productivity in mixed-species plantations. Forest
Ecology and Management 233, 193-194.
Bristow, M., Vanclay, J.K., Brooks, L. & Hunt, M. (2006b) Growth and Species Interactions of Eucalyptus
pellita in a Mixed and Monoculture Plantation in the Humid Tropics of North Queensland. Forest
Ecology and Management 233, 285-294.
Burkhart, H.E. & Tome, M. (2012) Modelling Forest Trees and Stands. Springer, Dordrecht. 447 pp.
Coates, K.D., Canham, C.D. & LePage, P.T. (2009) Above- versus below-ground competitive effects and
responses of a guild of temperate tree species. Journal of Ecology 97, 118–130.
Contreras, M. A., Affleck, D., & Chung, W. (2011). Evaluating tree competition indices as predictors of basal
area increment in western Montana forests. Forest Ecology and Management, 262, 11, 1939-1949.
Costantini, A. (1989) Definition of a plant zone for weed management during the establishment of Araucaria
cunninghamii plantations. Forest Ecology and Management 29, 15-27.
Daniels, R.F., Burkhart, H.E. & Clason, T.R. (1986) A comparison of competition measures for predicting
growth of loblolly pine trees. Canadian Journal of Forest Research 16, 1230-1237.
Doherty, J. (2005) PEST: Model-independent Parameter Estimation User Manual, 5th
ed. Watermark Numerical
Computing, 336 pp.
Doherty, J., & Skahill, B. E. (2006). An advanced regularization methodology for use in watershed model
calibration. Journal of Hydrology 327, 3, 564-577.

15
Erskine, P.D., Lamb, D. & Bristow, M. (2006) Tree species diversity and ecosystem function: Can tropical
multi-species plantations generate greater productivity? For. Ecol. Manage. 233, 205–210.
Forrester, D.I., Bauhus, J., Cowie, A.L. & Vanclay, J.K. (2006) Mixed-Species Plantations of Eucalyptus with
Nitrogen Fixing Trees: A Review. Forest Ecology and Management 233, 211-230.
Forrester, D.I., Vanclay, J.K. & Forrester, R.I. (2011) The balance between facilitation and competition
interactions in mixtures of Eucalyptus and Acacia changes as stands develop. Oecologia 166, 265-
272.
Fox, J.C., Bi. H. & Ades, P.K. (2007) Spatial dependence and individual-tree growth models: I. Characterising
spatial dependence. Forest Ecology and Management 245, 10-19.
Harrington, T.B., Harrington, C.A. & DeBell, D.S. (2009) Effects of planting spacing and site quality on 25-
year growth and mortality relationships of Douglas-fir (Pseudotsuga menziesii var. menziesii). Forest
Ecology and Management 258, 18-25.
Hegyi, F. (1974) A simulation model for managing jack-pine stands. In: Fries, G. (ed.), Growth Models for Tree
and Stand Simulation. Royal College of Forestry, Stockholm, Sweden. Res. Note 30, pp. 74-90.
Holmes, M.J. & Reed, D. (1991) Competition indices for mixed species northern hardwoods. Forest Science 37,
1338-1349.
Hooper DU, Chapin FS, Ewel JJ, Hector A, Inchausti P, Lavorel S, Lawton JH, Lodge DM, Loreau M, Naeem
S, Schmid B, Setala H, Symstad AJ, Vandermeer J, Wardle DA (2005) Effects of biodiversity on
ecosystem functioning: A consensus of current knowledge. Ecological Monographs 75:3-35.
Jones, H. E., McNamara, N., & Mason, W. L. (2005). Functioning of mixed-species stands: evidence from a
long-term forest experiment. Chapter 6 in M. Scherer-Lorenzen, C. Körner & E.-D. Schulze (eds)
Forest Diversity and Function: Temperate and Boreal Systems, Springer. Pp. 111-130.
Kaitaniemi, P. & Lintunen, A. (2010) Neighbour identity and competition influence tree growth in Scots pine,
Siberian larch, and silver birch. Annals of Forest Science 67, 604, 1-7.
Lamb, D. (2011) Regreening the Bare Hills: Tropical Forest Restoration in the Asia-Pacific region. Springer,
Dordrecht.
Lamb, D. & Borschmann, G.A. (1998) Agroforestry with high-value trees. Rural Industries Research and
Development Corporation, Publication 98/142, 59 pp.
https://rirdc.infoservices.com.au/downloads/98-142.pdf Lamb, D. & Lawrence, P. (1993) Mixed species plantations using high-value rainforest trees in Australia. In H.
Leith and M. Lohman (eds) Restoration of Tropical Rainforest Ecosystems. pp. 101-108. Kluwer
Academic Publishers.
Lamb, D., Keenan, R.J. & Gould, K. (2001) Historical background to plantation development in the tropics: a
north Queensland case study. Chapter 2 in S.R. Harrison & J.L. Herbohn (eds) Sustainable farm
forestry in the tropics: Social and economic analysis and policy. Elgar, pp. 9-20.
Ledermann, T., & Stage, A. R. (2001) Effects of competitor spacing in individual-tree indices of competition.
Canadian Journal of Forest Research 31, 12, 2143-2150.
Lorimer, C.G. (1983) Tests of age-independent competition indices for individual trees in natural hardwood
stands. Forest Ecology and Management 6, 343-360.
Mailly, D., Turbis, S. & Pothier, D. (2003) Predicting basal area increment in a spatially explicit individual tree
model: a test of competition measures with black spruce. Can. J. For. Res. 33, 435–443.
Manson, D. G., Schmidt, S., Bristow, M., Erskine, P. D., & Vanclay, J. K. (2013) Species-site matching in
mixed species plantations of native trees in tropical Australia. Agroforestry systems 87, 1, 233-250.
Martin, G.L. & Ek, A.R. (1984) A Comparison of Competition Measures and Growth Models for Predicting
Plantation Red Pine Diameter and Height Growth. Forest Science 30, 731-43.
Mead, R. (1979) Competition experiments. Biometrics 35, 41-54.
Mitchell, K.J. (1975) Dynamics and simulated yield of Douglas-fir. For. Sci. Monog. 17. 39 p.
Miina, J. & Pukkala, T. (2002) Application of ecological field theory in distance-dependent growth modelling.
Forest Ecology and Management 161, 101-107.
Muetzelfeldt, R. & Massheder, J. (2003) The Simile visual modelling environment. Europ. J. Agronomy 18,
345-358.
Nelder, J.A. (1962) New kinds of systematic designs for spacing experiments. Biometrics 18, 283–307.
Nichols, J.D., Bristow, M. & Vanclay, J.K. (2006) Mixed Species Plantations: Prospects and Challenges. Forest
Ecology and Management 233, 383-390.
Oheimb, G.v., Lang, A.C., Bruelheide, H., Forrester, D.I., Wasche, I., Yu, M. & Hardtle, W. (2011) Individual-
tree radial growth in a subtropical broad-leaved forest: The role of local neighbourhood competition.
Forest Ecology and Management 261, 499-507.
Parrott, D.L., Brinks, J.S. & Lhotka, J.M. (2012) Designing Nelder wheel plots for tree density experiments.
New Forests 43, 245-254.

16
Pallardy, S.G. & Kozlowski, T.T. (2008) Physiology of woody plants. Academic Press, 454 pp
Peltoniemi, M. & Makipaa, R. (2011) Quantifying distance-independent tree competition for predicting Norway
spruce mortality in unmanaged forests. For. Ecol. Manage. 261, 30-42.
Perot, T., & Picard, N. (2012). Mixture enhances productivity in a two-species forest: evidence from a modeling
approach. Ecological research 27, 1, 83-94.
Pretzsch, H. (2010) Forest Dynamics, Growth and Yield. Springer.
Pretzsch, H., & Biber, P. (2010) Size-symmetric versus size-asymmetric competition and growth partitioning
among trees in forest stands along an ecological gradient in central Europe. Canadian Journal of
Forest Research 40, 2, 370-384.
Pukkala, T. & Kolstrom, T. (1987) Competition indices and the prediction of radial growth in Scots pine. Silva
Fennica 21, 55-67.
Radtke, P.J., Westfall, J.A. & Burkhart, H.E. (2003) Conditioning a distance-dependent competition index to
indicate the onset of inter-tree competition. Forest Ecology and Management 175, 17-30.
Richardson, B., Kimberley, M.O., Ray J.W. & Coker, G.W. (1999) Indices of interspecific plant competition for
Pinus radiata in the central north island of New Zealand. Can. J. For. Res. 29, 898–905.
Sheil, D., A. Salim, J. Chave, J.K. Vanclay & W.D. Hawthorne, 2006. Illumination-size relationships of 109
coexisting tropical forest trees. Journal of Ecology 94, 494-507.
Simulistics (2012) Simile at a glance. Simulistics Limited. http://www.simulistics.com/overview.htm
Skovsgaard, J.P. & J.K. Vanclay (2013) Forest site productivity: Spatial and temporal variability in natural site
conditions. Forestry 86, 305-315.
Snell, A.J. (1998) Physiological aspects of growing cabinet timber species in plantations. In D. Lamb & G.A.
Borschmann (eds) Agroforestry with high-value trees. Rural Industries Research and Development
Corporation, Publication 98/142, pp. 46-47.
Soares, P. & Tome, M. (1999) Distance-dependent competition measures for eucalyptus plantations in Portugal.
Ann. For. Sci. 56, 307-319.
Stadt, K.J., Huston, C., Coates, K.D., Feng, Z., Dale, M.R.T. & Lieffers, V.J. (2007) Evaluation of competition
and light estimation indices for predicting diameter growth in mature boreal mixed forests. Ann. For.
Sci. 64, 477-490.
Stape, J.L. & Binkley, D. (2010) Insights from full-rotation Nelder spacing trials with Eucalyptus in São Paulo,
Brazil. Southern Forests 72, 2, 91-98.
Strub, M.R., Vasey, R.B. & Burkhart, H.E. (1975) Comparison of Diameter Growth and Crown Competition
Factor in Loblolly Pine Plantations. Forest Science 21, 427-431.
Thompson, W.A., Stocker, G.E. & Kriedemann, P.E. (1988) Growth and Photosynthetic Response to Light and
Nutrients of Flindersia brayleyana F. Muell., A Rainforest Tree With Broad Tolerance to Sun and
Shade. Australian Journal of Plant Physiology 15, 2, 299-315.
Tilman, D., Knops, J., Wedin, D., Reich, P., Ritchie M. & Siemann, E. (1997) The influence of functional
diversity and composition on ecosystem processes. Science 277, 1300–1302.
Tome, M. & Burkhart, H.E. (1989) Distance-dependent competition measures for predicting growth of
individual trees. Forest Science 35, 816-831.
Vanclay, J.K. (1989) Site productivity assessment in rainforests: an objective approach using indicator species.
In: Wan Razali Mohd, H.T. Chan & S. Appanah (eds) Proceedings of the Seminar on Growth and
Yield in Tropical Mixed/Moist Forests, 20-24 June 1988, Kuala Lumpur. Forest Research Institute
Malaysia, p. 225-241.
Vanclay, J.K. (1994) Modelling Forest Growth and Yield: Applications to Mixed Tropical Forests. CAB
International, Wallingford, U.K.
Vanclay, J.K. (2006a) Experiment designs to evaluate inter- and intra-specific interactions in mixed plantings of
forest trees. Forest Ecology and Management 233, 366-374.
Vanclay, J.K. (2006b) Spatially-explicit competition indices and the analysis of mixed-species plantings with
the Simile modelling environment. Forest Ecology and Management 233, 295-302.
Vanclay, J.K. (2006c) Can the lessons from the Community Rainforest Reforestation Program in eastern
Australia be learned? International Forestry Review 8, 2, 256-264.
Vanclay, J.K. (2009) Tree diameter, height and stocking in even-aged forests. Annals of Forest Science 66, 702.
Vanclay, J.K. & Sands, P.J. (2009) Calibrating the self-thinning frontier. For. Ecol. Manage. 259, 81-85.
Vanclay, J.K., Prabhu, R. & Sinclair, F. (2006) Realizing Community Futures: A practical guide to harnessing
natural resources. Earthscan, London.
Vanhellemont, M., Verheyen, K., Staelens, J. & Hermy, M. (2010) Factors affecting radial growth of the
invasive Prunus serotina in pine plantations in Flanders. Eur J Forest Res 129, 367–375.
Weiskittel, A.R., Hann, D.W., Kershaw, J.W. & Vanclay, J.K. (2011) Forest Growth and Yield Modeling.
Wiley, NY.

17
Woldring, O. (1998) Pasture productivity below rainforest trees: an agroforestry trial. In D. Lamb & G.A.
Borschmann (eds) Agroforestry with high-value trees. Rural Industries Research and Development
Corporation, Publication 98/142. pp. 47-48.
Woodall, C.W., Fiedler, C.E. & Milner, K.S. (2003) Intertree competition in uneven-aged ponderosa pine
stands. Can. J. For. Res. 33, 1719–1726.
Woodall, G.S., & Ward, B.H. (2002) Soil water relations, crop production and root pruning of a belt of trees.
Agricultural water management 53, 1, 153-169.
Xu, Z.H., Bubb, K.A. & Simpson, J.A. (2002) Effects of nitrogen fertilisation and weed control on nutrition and
growth of a four-year-old Araucaria cunninghamii plantation in subtropical Australia. Journal of
Tropical Forest Science 14, 2, 213-222.
Yanai, R.D. (1992). Competitive interactions between Norway spruce and Scots pine at Gisburn Forest, NW
England. Forestry 65, 4, 435-451.