Embed Size (px)
Citation preview
Spatiotemporal Frequency Responses
of Cat Retinal Ganglion Cells
L. J . FRISHMAN, A . W . FREEMAN, J. B . TROY,D . E . SCHWEITZER-TONG, and C. ENROTH-CUGELL
From the Departments of Neurobiology and Physiology and of Engineering Sciencesand Applied Mathematics, Northwestern University, Evanston, Illinois 60201
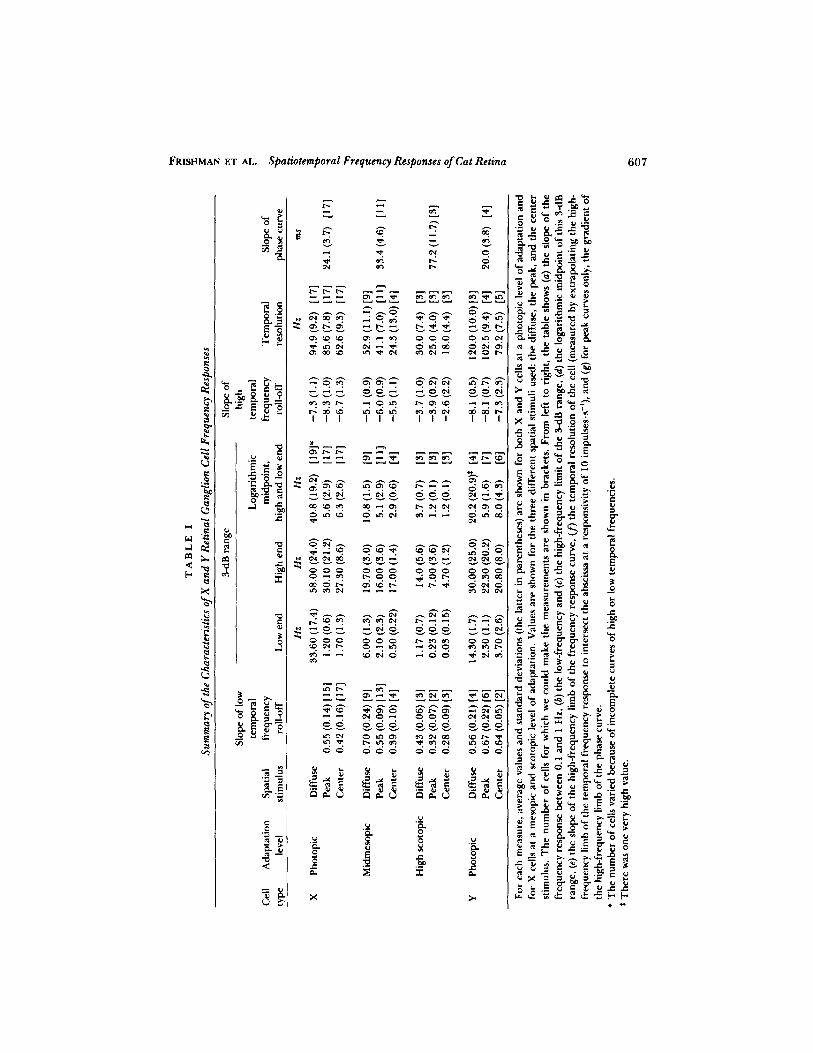
ABSTRACT Spatiotemporal frequency responses were measured at differentlevels of light adaptation for cat X and Y retinal ganglion cells. Stationarysinusoidal luminance gratings whose contrast was modulated sinusoidally intime or drifting gratings were used as stimuli . Under photopic illumination,when the spatial frequency was held constant at or above its optimum value, anX cell's responsivity was essentially constant as the temporal frequency waschanged from 1 .5 to 30 Hz. At lower temporal frequencies, responsivity rolledoff gradually, and at higher ones it rolled off rapidly. In contrast, when thespatial frequency was held constant at a low value, an X cell's responsivityincreased continuously with temporal frequency from a very low value at 0.1Hz to substantial values at temporal frequencies higher than 30 Hz, from whichresponsivity rolled off again . Thus, 0 cycles -deg' became the optimal spatialfrequency above 30 Hz. For Y cells under photopic illumination, the spatiotem-poral interaction was even more complex. When the spatial frequency was heldconstant at or above its optimal value, the temporal frequency range over whichresponsivity was constant was shorter than that of X cells . At lower spatialfrequencies, this range was not appreciably different . As for X cells, 0 cyclesdeg ' was the optimal spatial frequency above 30 Hz. Temporal resolution(defined as the high temporal frequency at which responsivity had fallen to 10impulses -s') for a uniform field was ^-95 Hz for X cells and ^-120 Hz for Ycells under photopic illumination . Temporal resolution was lower at loweradaptation levels. The results were interpreted in terms of a Gaussian center-surround model . For X cells, the surround and center strengths were nearlyequal at low and moderate temporal frequencies, but the surround strengthexceeded the center strength above 30 Hz. Thus, the response to a spatiallyuniform stimulus at high temporal frequencies was dominated by the surround.In addition, at temporal frequencies above 30 Hz, the center radius increased .
INTRODUCTION
Spatial frequency responses of cat retinal ganglion cells having center-surroundreceptive fields have been reported in several studies (e.g ., Enroth-Cugell andAddress reprint requests to Dr . Laura J . Frishman, Dept. of Physiology, S-762, University ofCalifornia, San Francisco, San Francisco, CA 94143-0444 . Dr . Freeman's present address isDept. of Physiology, F13, University of Sydney, New South Wales 2006, Australia.
J. GEN. PHysioL. CThe Rockefeller University Press - 0022-1295/87/04/0599/30x1 .00
599Volume 89
April 1987
599-628
600
THE JOURNAL OF GENERAL PHYSIOLOGY " VOLUME 89 - 1987
Robson, 1966; Derrington and Lennie, 1982 ; Linsenmeier et al ., 1982 ; Enroth-Cugell et al ., 1983 ; Dawis et al ., 1984) . In some studies (Enroth-Cugell andRobson, 1966 ; Linsenmeier et al ., 1982), spatial frequency responses weremeasured only for relatively low temporal frequencies (2-4 Hz), and it was foundthat, under these conditions, Rodieck's (1965) difference-of-Gaussians model ofthe receptive field satisfactorily accounted for the responses . In Rodieck's model,both the center and surround mechanisms of the receptive field are assumed tohave Gaussian spatial distributions of sensitivity to light, with the surroundhaving a greater spatial spread: the output of the cell is modeled as the scalardifference of signals from the center and surround mechanisms .While the difference-of-Gaussians model provides an adequate prediction of
the spatial frequency responses of X retinal ganglion cells for contrast modulatedat low temporal frequencies, Enroth-Cugell et al . (1983) have shown that themodel must be revised to account for their responses to contrast modulated athigher temporal frequencies . In particular, they showed that in order to modelthe spatial frequency responses of X cells to sinusoidal luminance gratings whosecontrasts were modulated at a range of temporal frequencies (0.5-32 Hz), vectoraddition of signals from the center and surround mechanisms was needed . Thismodel will be referred to as the Gaussian center-surround model.We have now extended the investigation of the spatiotemporal frequency
responses of X and Y cells to temporal frequencies beyond 32 Hz. For X cells,data from photopic, midmesopic, and high scotopic adaptation levels are in-cluded, and the usefulness of the Gaussian center-surround model as a descriptionof photopic X cell responses at temporal frequencies up to 90 Hz has beenevaluated .
METHODS
Our methods for optic tract and intraocular recordings from cats have been described indetail elsewhere (Enroth-Cugell et al ., 1980, 1983) and will be reviewed only briefly here .Surgical anesthesia was induced either with halothane or ketamine hydrochloride andfollowed during surgery by thiamylal sodium . Atropine sulfate was injected to minimizesalivation caused by the anesthestics, and dexamethasone was administered to inhibitinflammatory reactions . During recording, anesthesia was maintained with ethyl carba-mate and paralysis was maintained with gallamine triethiodide . The expired C02, meanarterial blood pressure, and heart rate were kept at normal levels . The subscapulartemperature was held between 38 and 39'C .
After local application of atropine and phenylephrine hydrochloride, contact lenseswith 4-mm-diam pupils were fitted to the eyes . The lens power required to bring thestimulus pattern into focus on the retina was determined by direct ophthalmoscopy and,in later experiments, by bringing the vessels around the area centralis into good focususing the illumination technique of Pettigrew et al. (1979) . During the experiments, thisrefraction was tested and corrected if necessary with spherical spectacle lenses to obtainthe best possible spatial resolution from X cells with receptive fields in the most centralretinal locations .
RecordingExtracellular action potentials from single cells were recorded either from the optic tractwith tungsten microelectrodes (Levick, 1972) or from the retinal surface with micropi-
FRISHMAN ET AL .
Spatiotemporal Frequency Responses ofCat Retina
601
pettes . The micropipettes were filled with 3 M NaCl and thick-slurry beveled (Lederer etal ., 1979) to an impedance of 10 Mil at 60 Hz.
Visual StimulationThe cats faced a tangent screen with a mean luminance of -20 cd. M-2, and images ofthe optic disk and other retinal landmarks were projected onto it and traced there(Pettigrew et al ., 1979) . Light spots or black and white cardboard wands were used againstthis background to locate the centers of the receptive fields; the locations were thenmarked on the tangent screen . All subsequent visual stimulation ofthe cell was performedwith patterns presented on the screen ofa cathode ray tube(Joyce Electronics, Cambridge,England).The display subtended 31' x 22* as viewed with a mirror, and had a frame rate of
200 Hz in a few early experiments and 250 Hz in later ones. The mean luminance of thescreen was fixed, for each experiment, at a luminance between 200 and 440 cd.Iris ;lower luminances were obtained by placing calibrated neutral density filters in front ofthe screen . Stimulus patterns were of constant luminance in the vertical direction, withluminance modulated in the horizontal direction to form an edge or a sinusoidal grating.The contrast of these patterns is defined as the difference between maximum andminimum luminances divided by their sum . The patterns were either stationary, withcontrast modulated sinusoidally over time, or they drifted across the receptive field of acell . Regardless of the contrast, spatial configuration, or mode of modulation of thestimulus, the space- and time-averaged luminance of the screen remained constant. Theentire visual stimulation and data collection system was checked with an electronic devicethat simulates a retinal X cell center response (Schweitzer-Tong, 1983) .
Response MeasurementWhether the stimulus was stationary, with contrast modulated sinusoidally in time, ordrifting, the amplitude ofthe cell's discharge rate was measured at the temporal frequencyof stimulation (the fundamental Fourier component of the response) and at twice thatfrequency (the second harmonic) . For the fundamental component, the temporal phaseangle of the response relative to the stimulus was also determined. Fourier analysis wasperformed over the integral number of periods of the stimulus that fell within trials of10.24 s when the frame rate of the stimulator was driven by the computer at 200 Hz, andtrials of 8.19 s when it was driven at 250 Hz. The occurrence times of impulses weremeasured to the nearest 5 ms when 200 Hz was used, and to the nearest 4 ms when 250Hz was used . When stimulus conditions were altered, responses were not collected untila steady state had been reached .
It is appropriate to state precisely how the terms relating to response are to be usedthroughout this article. "Frequency response" refers to the fundamental Fourier compo-nent of a cell's discharge normalized with regard to contrast. Its magnitude, termed"responsivity° (Enroth-Cugell et al ., 1983), is the amplitude of the fundamental Fouriercomponent divided by the contrast of the stimulus that elicited the response . Its phase isreferenced to the temporal phase of the stimulus and is given in degrees . The responsephase is positive when the response leads the stimulus and is negative when the responselags the stimulus .
Experimental ProtocolIn this article, we deal only with X and Y retinal ganglion cells (Enroth-Cugell and Robson,1966), which presumably correspond to the brisk-sustained and brisk-transient cells,respectively, of Cleland and Levick (1974) . When a unit was first isolated, the type of
602 THEJOURNAL OF GENERAL PHYSIOLOGY " VOLUME 89 - 1987
center, on or off, was determined, and the position of the center was marked on thetangent screen . Then the mirror was adjusted so that the projection of the center of thereceptive field was aligned with the middle of the cathode ray tube screen . Precisehorizontal positioning was accomplished by rotating the mirror to null the fundamentalcomponent of the unit's discharge in response to sinusoidal modulation of the contrast ofan edge centered on the screen . This position served as an origin for the horizontallocation of the gratings. X and Y cells were differentiated by the "modified null test"(Hochstein and Shapley, 1976).
All spatial and temporal frequency response measurements were made for mean-to-peak amplitudes of the fundamental between 8 and 16 impulses - s- ' . A minimum of 20.48s of discharge was used for each measurement .
The Gaussian Center-Surround ModelRodieck (1965) introduced the difference-of-Gaussians model for the receptive fields ofcat retinal ganglion cells and used it to simulate successfully responses to spot and barstimuli . Enroth-Cugell and Robson (1966) employed the same model to interpret an Xcell's response to gratings drifting across its receptive fields at a fixed low temporalfrequency . The model assumes separability of spatial and temporal parameters of thereceptive field. Later, Enroth-Cugell et al . (1983) found that in order to account forresponses measured at temporal frequencies up to 16 or 32 Hz, some spatiotemporalinteraction had to be incorporated into the model. They achieved this by assuming thatthe signal caused by the surround mechanism was delayed a few milliseconds relative tothat caused by the center mechanism . This surround-center delay could be incorporatedeither via a transport delay or by a single-stage low-pass filter with a time constant of afew milliseconds . Either formulation of the Gaussian center-surround model adequatelypredicted X ganglion cell responses for all spatial frequencies at temporal frequencies inthe range 1-16 Hz . In both formulations, Enroth-Cugell et al . assumed that the ratio ofsurround to center strength did not change with temporal frequency . We have nowobserved that a model that fixes the ratio of center to surround strength does notadequately describe the response of X cells to higher temporal frequencies . This can beseen by comparing the predicted ratio of surround to center strength in Fig . 8A ofEnroth-Cugell et al . with the results of our decompositions of frequency responses intocenter and surround components in Figs . 11 and 12.
Although a model with the precise temporal characteristics for center and surroundmechanisms proposed by Enroth-Cugell et al . (1983) is inadequate to describe our data,we were interested to assess the usefulness of the Gaussian center-surround model in amore general framework . As in all previous models, we assume the X cell receptive fieldto be a linear, stable, and time-invariant system . The input to the model is a space- andtime-varying luminance pattern ; the response, which is the time-varying impulse rate of aganglion cell, is assumed to result from the vector sum of signals from the center andsurround components . Since all the spatial stimuli used to measure frequency responsesin this study were gratings for which luminance varied in only one spatial dimension, thespatiotemporal frequency response can be represented as :
R~u, w) = Rc(u, w) + R,(u, w),
where u is spatial frequency, w is temporal frequency, and Rc and R, are the spatiotemporalfrequency responses of the center and surround mechanisms, respectively . Modulation ofthe luminance at any point in the stimulus was a sinusoidal function of time, so that theresponse and its components were also temporal sinusoids ofthe same frequency . As such,they have both amplitude and phase, and can be presented in complex polar notation :
FRISHMAN ET AL .
Spatiotemporal Frequency Responses ofCat Retina
603
IRs(u, w)le'P,(u.w) = IR,(u, w)Ie'P(�.w) + IR.(u, w)Ie'P.(-),
(2)
where i = ~, the fences represent absolute magnitude, and Pg, Pc , and P, are theresponse phases of the cell, its center, and its surround mechanisms, respectively.
It is assumed that the spatial distributions perpendicular to the grating bars of theresponsivity of the center and surround components are Gaussian, with coincident peaksbut different spatial extents. Further, the phases of the center and surround signals areassumed to be independent of the spatial frequency:
where
IR~u, w)Ie'PWu.w) = Sc(w)e'P,(w)-I--(w)1t + S.(w)e'P,(w)-1-.(w)12 ,
Sc(w) = IRc(o, w) I and S,(w) = I R.(0, w) I
represent the center and surround responsivities to a spatially uniform field (i .e., thecenter and surround strengths), and r,(w) and r,(w) are the radii of the center andsurround spatial responsivity distributions and are assumed here to vary with temporalfrequency.
Fitting the Model to Experimental DataThe model has six parameters at each temporal frequency: center and surround radii,center and surround strengths, and center and surround phases. To find the best-fittingparameters for a data sample from an individual cell, the values of these parameters werechosen to minimize thesumofsquared errors. Theerror value used for each measurementof the cell's response was the magnitude of the difference between the experimental andmodel frequency responses divided by the cell's responsivity (since the responsivity wasshown by Enroth-Cugell et al ., 1983, to be proportional to the standard deviation of themeasurement). The best fit was obtained by a fine and complete search of the whole errorsurface for plausible values of center and surround radii .
RESULTS
Our majorgoal was to characterize the spatiotemporal frequency responses of Xand Y retinal ganglion cells. We sampled the spatiotemporal frequency responsesurface quite coarsely in terms of spatial frequency but finely in terms of temporalfrequency. We chose three spatial frequencies for each cell, as described below.Foreach of these spatial frequencies, we measured temporal frequency responsesat octave steps from 0.1 to -25 Hz,and at every 4 Hz for higher temporalfrequencies. In all cells, we measured spatial frequency responses at 2 Hz atoctave or smaller steps for spatial frequencies in the range 0.01 cycles - deg1 toa spatial frequency beyond that for which responsivity was maximal. In some Xcells, we also measured spatial frequency responses in similar steps at highertemporal frequencies. We feel that, together with the results of the earlier studyby Enroth-Cugell et al . (1983) of X cell spatiotemporal frequency responses inthe range 0.5-32 Hz, a detailed description of the photopic spatiotemporalfrequency response surface for X cells has now been obtained . We present datafrom 36 X and 7 Y cells from 17 cats. The receptive fields of the X cells werelocated between 1 ° and 34 ° from the area centralis; 24 X cells were within thecentral 10 ° . The receptive fields of the Y cells lay between 3 ° and 36° from thearea centralis; four were within the central 10' .
604
Choices ofSpatial Stimuli
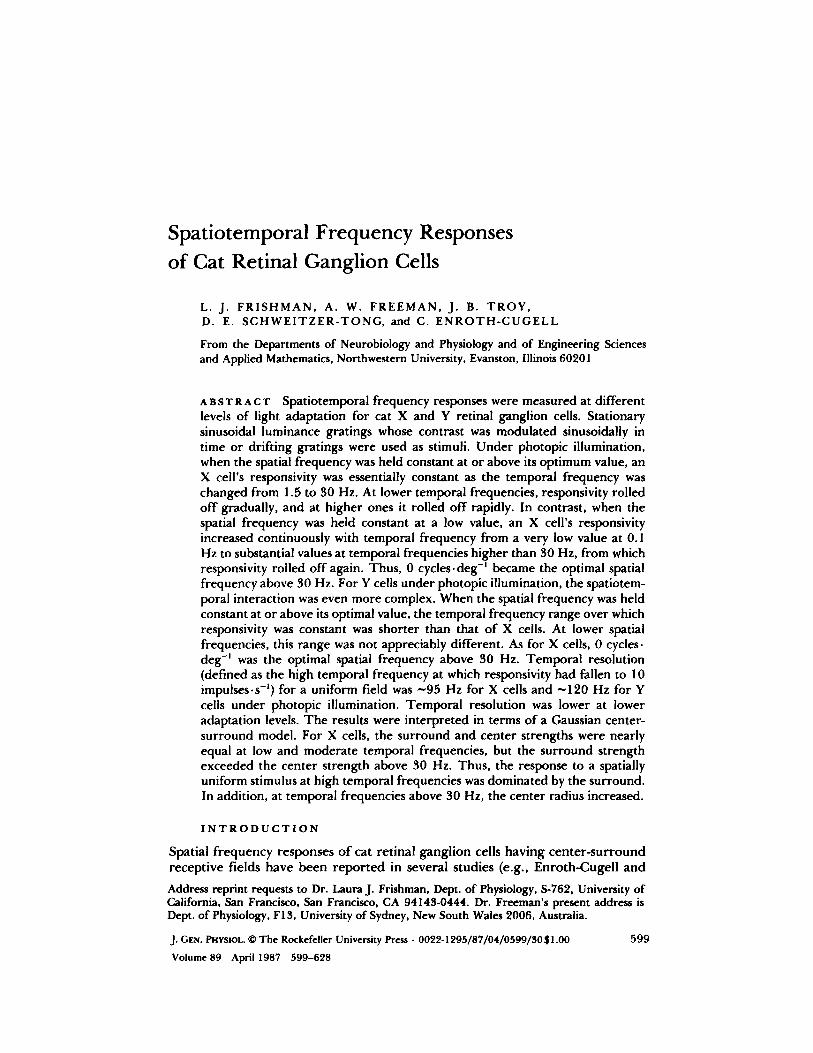
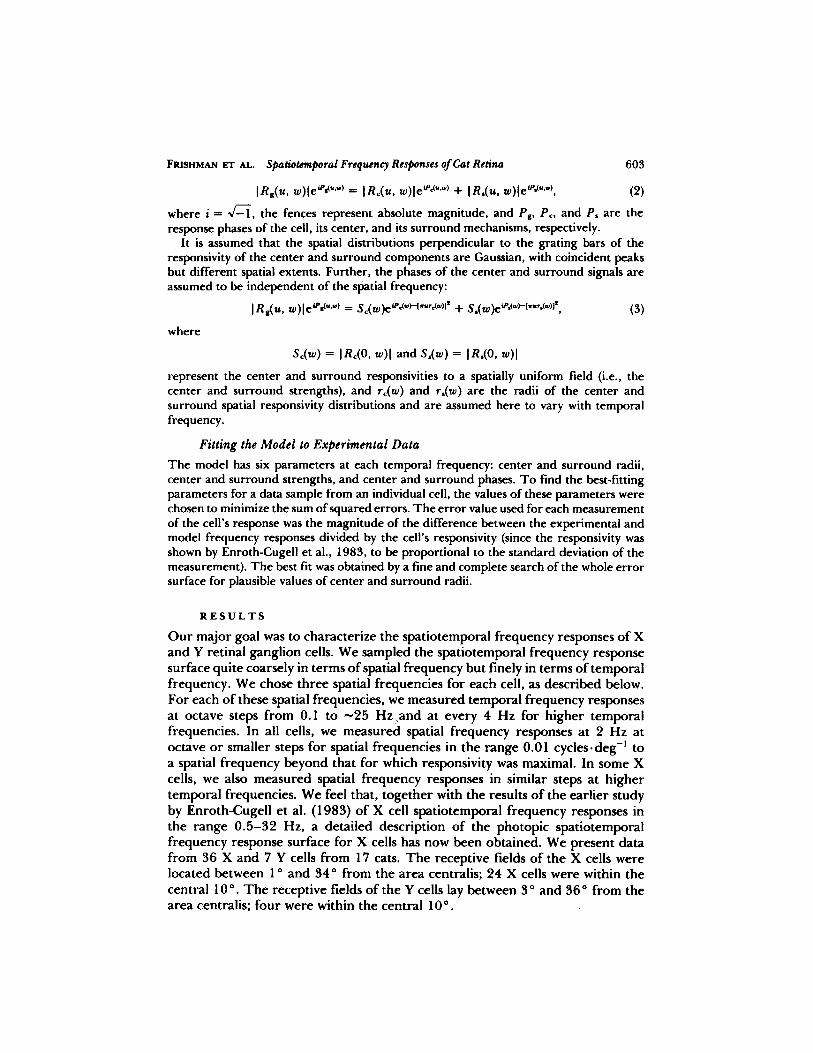
For each cell, X or Y, we measured first the spatial frequency response withsinusoidal gratings drifting at 2 Hz. The resulting curve was used to select threespatial frequencies, as illustrated in Fig. 1 . The first was the frequency thatmaximized the cell's responsivity, which will be referred to as the "peak" stimulus.It should be noted that, as will be shown, the peak stimulus is not a cell's optimalspatial frequency at all temporal frequencies. The second, the "center" stimulus,was selected from the high-frequency limb of the curve at a spatial frequency for
NdN7aE
T
NCOdmN2
THE JOURNAL OF GENERAL PHYSIOLOGY " VOLUME 89 " 1987
Spatial frequency (cycles " deg-1 )
FIGURE 1 . Method for choosing stimulus spatial frequencies. The circles showresponsivities for an on-center X cell (13X8) as a function of the spatial frequencyof gratings drifting at 2 Hz . (Responsivity is the amplitude of the fundamentalFourier component of the impulse rate divided by the stimulus contrast .) Thecontinuous curve is the best fit of the Gaussian center-surround model described inthe Methods. The dashed curves show the responsivities of the center and surroundcomponents of the model. The "diffuse" stimulus was a grating with a spatialfrequency of 0.01 cycles-deg ', the "peak" stimulus had a spatial frequency thatmaximized responsivity, and the "center" had a spatial frequency that was chosento give a responsivity between two and four times less than that with the peakstimulus . The mean luminance of the screen was 340 cd- m-2 , and the cat had a 4-mm-diam artificial pupil.
which the cell's responsivity was two to four times below maximum. It haspreviously been shown that, at these high spatial frequencies, the cell's responseis essentially dueto its center signal alone (e.g ., Enroth-Cugell and Robson, 1966 ;Linsenmeier et al ., 1982). This can be seen in Fig. 1, where the dashed curvesrepresent the relative contributions to the cell's response ofcenter and surroundcomponents as a function of spatial frequency. The third, the "diffuse" stimulus,maximized the signals from both the center and the surround . We used either auniform field that filled the entire screen of the stimulator and whose luminancewas modulated sinusoidally in time or a drifting 0.01 cycles - deg' grating.
FRISHMAN ET AL .
Spatiotemporal Frequency Responses ofCat Retina
Drifting and stationary grating stimuli of the same spatial frequency yielded thesame frequency response measurements.
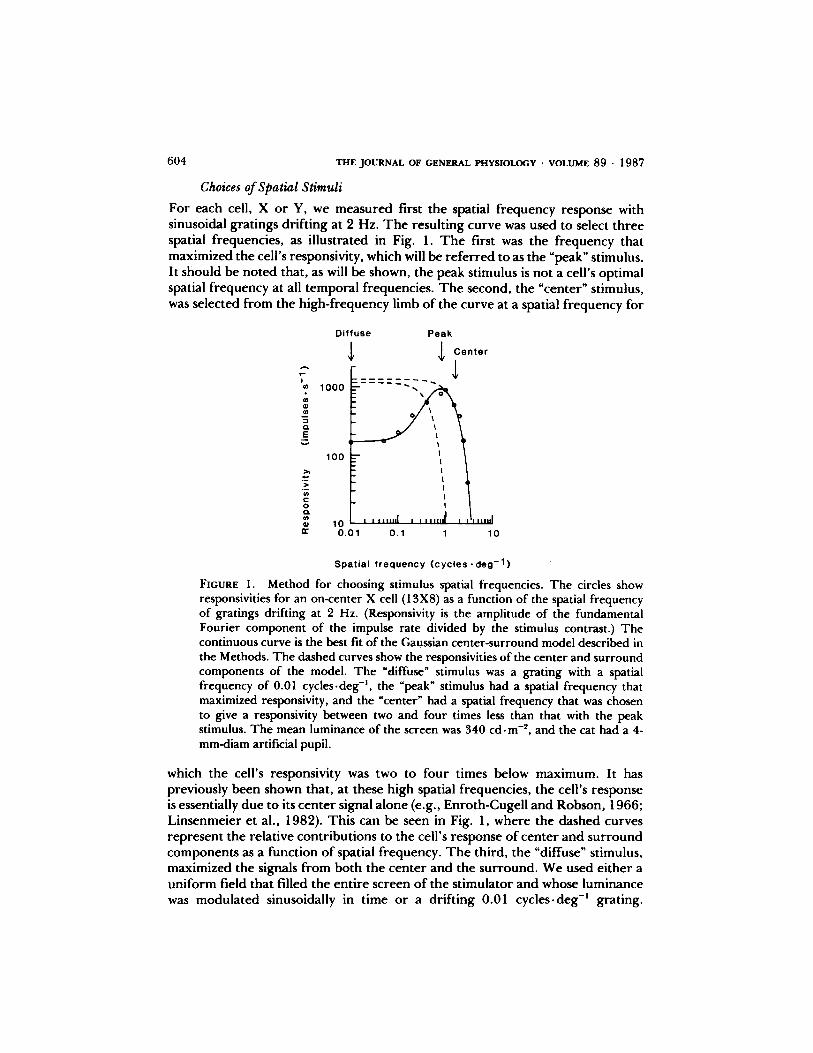
Photopic Spatiotemporal Frequency ResponsesPhotopic spatiotemporal frequency responses for an on-center X cell are shownin Fig. 2 . Except for a vertical displacement in responsivity, the temporal
Oadcc
Temporal frequency (Hz)
605
FIGURE 2.
Photopic spatiotemporal frequency response of an on-center X cell .The upper plot shows the responsivity of an X cell (IOX3) stimulated with diffuse(0.01 cycles -deg', circles), peak (1.4 cycles -deg', triangles), and center (2.4 cycles .deg', squares) spatial frequencies drifted at a range of temporal frequencies . Thelower plot shows the corresponding phase data in degress of phase advance relativeto the stimulus . In this figure as well as in Figs . 3, 4, and 6, the lines simply connectthe data points and do not represent a fitted model. The inset in the lower plotshows the phase data for the peak stimulus plotted on linear-linear axes and the
is a linear regression fit to these data . The mean luminance of theen was 340 cd -m'2.
frequency responses for peak and center stimuli were quite similar. Typical ofthe X cells we studied, responsivity changed little over a considerable range oftemporal frequencies. This is evident from estimates of bandwidth, which canbe read from the curves as the frequency difference in octaves between theupper and lower frequencies for which responsivity has declined 3 dB frommaximum . For the peak stimulus, the 3-dB range was from 0.5 to 16 Hz
606
THE JOURNAL OF GENERAL PHYSIOLOGY " VOLUME 89 " 1987
(bandwidth, 5 octaves) and, for the center stimulus, it was from 1 to 28 Hz(bandwidth, 4.8 octaves) . The average ranges for the 17 X cells for which wemeasured curves with the peak stimulus and the 18 X cells for which we measuredcurves with the center stimulus are given in Table 1. The frequencies at thelogarithmic midpoints of these ranges are also given. Clearly, these measurementsdiffered little for peak and center stimuli. The relationship between the responsephase and the temporal frequency measured with these two stimuli was alsosimilar. For all stimuli, the response phase was a linear function of the temporalfrequency at midrange to high temporal frequencies (see inset) . The phasegradient can be used as a measure of the cell's visual latency. If the system beingstudied acted as a pure delay, its responsivity would not vary with temporalfrequency, and its phase would be proportional to temporal frequency . Thefrequency range over which the response conformed to these requirements wassufficiently wide that the interpretation of the phase gradient as a latency is auseful one. With the peak stimulus, the slope of this relationship was -9.8 degHz-1 , i.e ., a latency of 27 .2 ms. The average latency is given in the table.
In order to quantify the response attenuation seen at temporal frequenciesabove and below the 3-dB range, we measured the slopes on double-logarithmicaxes of the relationships between responsivity and temporal frequency for therange 0.1-1 .0 Hz and of the high-frequency limb . The roll-off was muchshallower at low frequencies. Although, for the cell whose frequency responsesare illustrated in Fig. 2, the slope was similar for peak and center stimuli (0.48and 0 .52, respectively), for the entire sample it was a little steeper for the peakstimulus, as shown in Table I. At the high-frequency end, the slopes were in therange -6 to -8 for both spatial patterns .The responsivity for the diffuse stimulus was much smaller than that for the
peak stimulus over a broad range of temporal frequencies. In addition, between0.1 and 1 Hz, the roll-off in responsivity was steeper than for the other spatialpatterns . For the cell illustrated in Fig. 2, the slope on double-logarithmiccoordinates was 0.6 . An average value for the slope with the diffuse stimuluscould not be reported in the table, however, since for most cells responsivitieswere so low at temporal frequencies of <0.5 Hz that we had insufficient datapoints (see Fig. 3) to quantify the roll-off. This strong attenuation of the responsesof X cells to diffuse stimuli under photopic conditions has been noted previously(Derrington and Lennie, 1982).The responsivities measured for the diffuse stimulus displayed an interesting
dependence on the temporal frequency around and past 40 Hz that was alsoevident, but to a much lesser extent, in the curves measured with the peak andcenter stimuli . A small dip in responsivity occurred near 40 Hz, followed by amarked increase in responsivity . As a result of this increase, the diffuse stimulusbecame the cell's optimal stimulus at some high temporal frequency and remainedso for all higher temporal frequencies. The response phase for the diffusestimulus led those for peak and center stimuli at all temporal frequencies. Thesefeatures of the temporal frequency response of X cells measured for diffusestimuli were observed first in the course of the study reported in Enroth-Cugellet al . (1983) .
FRISHMAN ET AL.
Spatiotemporal Frequency Responses ofCat Retina
607
.° ur-7r o14 A
c "d_ v
R L .G = LCa> O.,vn
-0 Okv v 3 u v y
~u
R H
oLV 00 on ,~ O ai V; O W ~ eh r0 ~+ _v ~ ro v
a~c~c o~--an o00 o~nci a -o 60°0
v m00c .n aN o ~n 00enci .., o v a~e4 or v v v
ms r~sv E~°
0. Leo ro- eou
m o en a~ a .: o cv cu .n n on °.b
~--~ o o-~ .:o y oow ._ 0 00 .Eu _ot E Q' c an an n r o! lc -. ., an
R . u i.~ w c- 00 cO .O cC .r; an a5 0v 00 00 t-N C N
L . ~S O °~
ro
Uu v
.c c o0
x o; o cc Lei a cc r " _,E w
050
. E CIS Vv -~ vo c o 6°
E u '> .cQ
a Le0 uo o a~ ao ., o~
o ui cirai
cy ci w o 0o 00 a 3 y ct a' --
.~ -. Ina ou y wWa ro
v ,0; '. O O ~D V~ cp c0 CV ~ C O L. Iby v l7asa La_uF c x °o°a°n. o, n0°o cs E ~' .d 00 o cr a~ c0 n .. r v o 04 oV) Cl) N an N N
v qV, w ro {0
roc cc an a,~ a~ Cu ~~ 1n r-. o v v E v u o0vZ
O O O j r 3 a wV O = r° H Q' ~ r Or.~ c0 c~ r o ~n .. . cv o ao a~ Cci w C"d "-" t0 GV O CV a~ O A
E>
c s °U .C G 'O w ~, yv
0 oOl on
o v °" E ~ Ewo ~ ~ 4
to 0(Mc~cwo
3.= i-
`S > rv u c~, E o. o 0 0 0 0 0 0 0 0 0 0 0 .p L .- u v u c..o .n c4 o in m an ell 00 o r a c .~ 3 a~nc rus . ~nw .000 0 0 0 0 0 0 0 0 0 0 0 0 , w, a 7ro
A 77
rh y` R CAav.U
~R
wC ~~" r
AaC
~R rC
_C u
> s00 LO 7ro Lu C r ~.y
A ° o v v E o v >Aav.U U AaU -
oL .E_Ns
0 b
0 u y'G.v E C ~w V VVC C O O C >~
av.a
O~g
vO
fd vE y F
v 41 ~ O' ~. .ca
;v~
aoS
0a c -; c r E 3v v ao c v
p. o' t v vv C v v L tk
r0d; oyi
CV Oai t~ Ow M r GV
i n i
608
THE JOURNAL OF GENERAL PHYSIOLOGY " VOLUME 89 " 1987
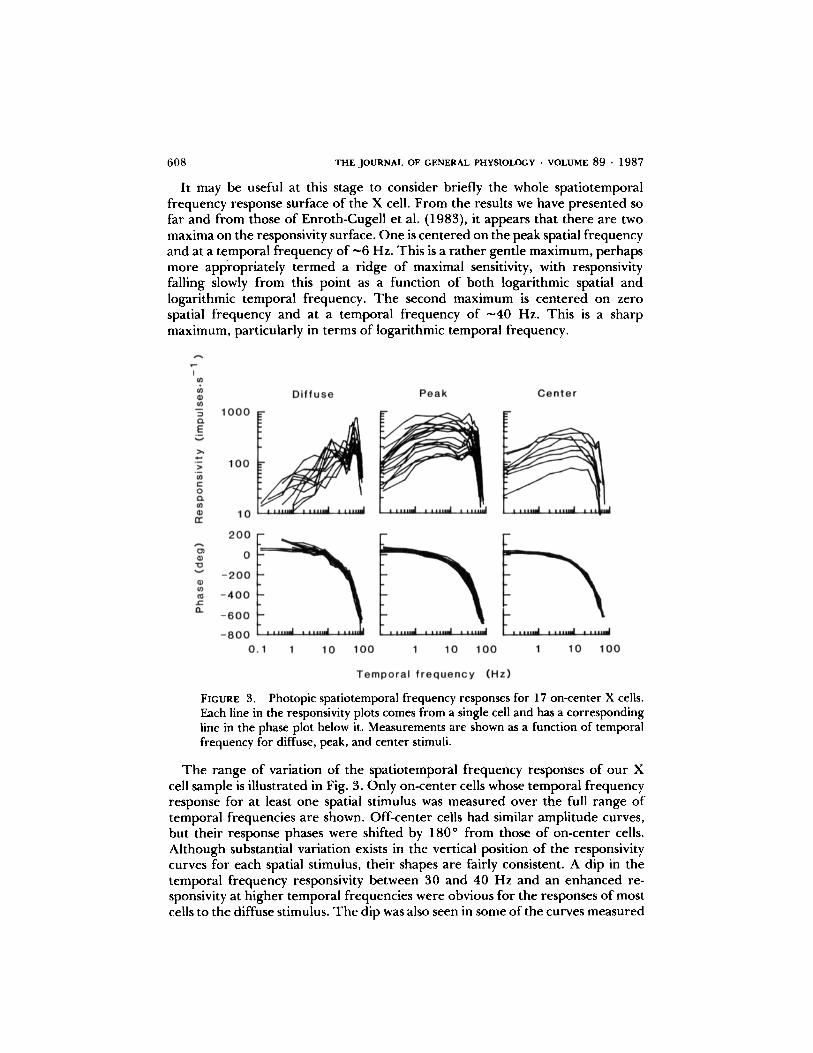
It may be useful at this stage to consider briefly the whole spatiotemporalfrequency response surface of the X cell . From the results we have presented sofar and from those of Enroth-Cugell et al . (1983), it appears that there are twomaxima on the responsivity surface. One is centered on the peak spatial frequencyand at a temporal frequency of ^-6 Hz. This is a rather gentle maximum, perhapsmore appropriately termed a ridge of maximal sensitivity, with responsivityfalling slowly from this point as a function of both logarithmic spatial andlogarithmic temporal frequency. The second maximum is centered on zerospatial frequency and at a temporal frequency of "̂40 Hz. This is a sharpmaximum, particularly in terms of logarithmic temporal frequency .
FIGURE 3.
Photopic spatiotemporal frequency responses for 17 on-center X cells .Each line in the responsivity plots comes from a single cell and has a correspondingline in the phase plot below it. Measurements are shown as a function of temporalfrequency for diffuse, peak, and center stimuli.
The range of variation of the spatiotemporal frequency responses of our Xcell sample is illustrated in Fig. 3. Only on-center cells whose temporal frequencyresponse for at least one spatial stimulus was measured over the full range oftemporal frequencies are shown. Off-center cells had similar amplitude curves,but their response phases were shifted by 180* from those of on-center cells .Although substantial variation exists in the vertical position of the responsivitycurves for each spatial stimulus, their shapes are fairly consistent . A dip in thetemporal frequency responsivity between 30 and 40 Hz and an enhanced re-sponsivity at higher temporal frequencies were obvious for the responses of mostcells to the diffuse stimulus . Thedip was also seen in some of the curves measured
FRISHMAN ET AL.
Spatiotemporal Frequency Responses ofCat Retina
609
for the peak stimulus, and even in a couple of the curves measured for the centerstimulus . The phase curves for each spatial stimulus showed little variation acrosscells . For the diffuse stimulus, the phase curves tended to show a small kink atabout the temporal frequencies for which responsivity dipped . This can be seenin Fig. 2 for cell 10X3; the kink's presence among the population of X cells isobscured by the overlapping of curves in Fig. 3.
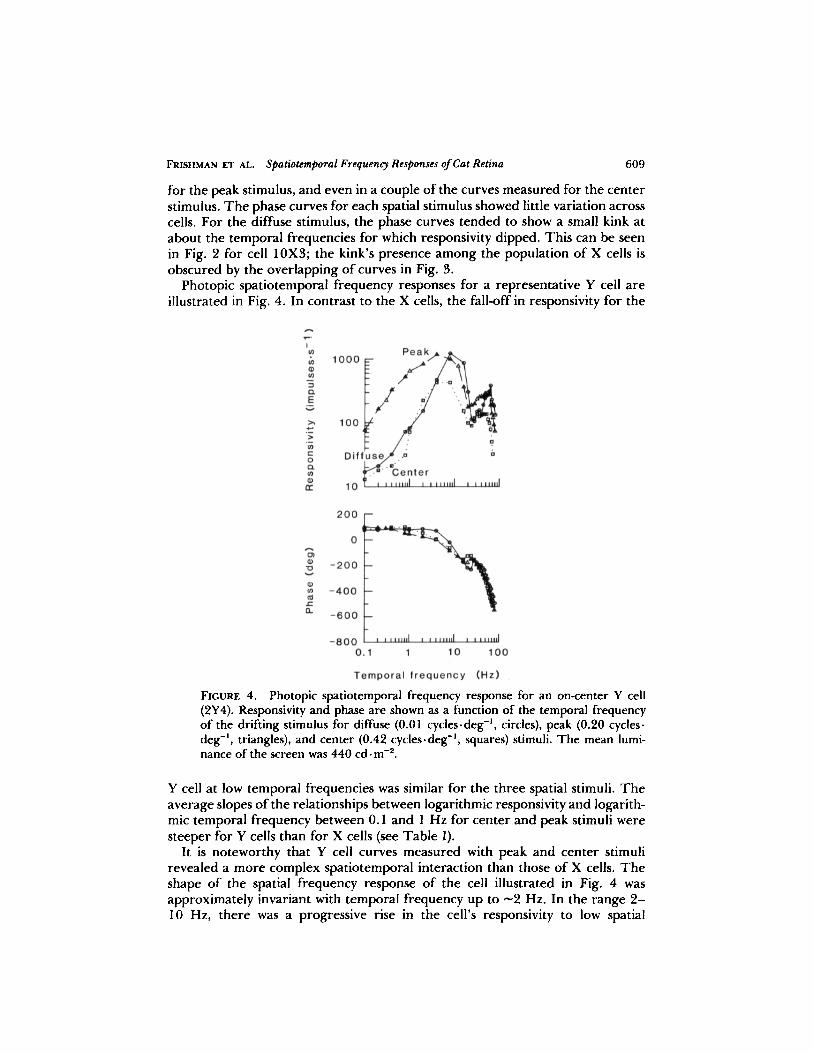
Photopic spatiotemporal frequency responses for a representative Y cell areillustrated in Fig. 4. In contrast to the X cells, the fall-off in responsivity for the
FIGURE 4. Photopic spatiotemporal frequency response for an on-center Y cell(2Y4). Responsivity and phase are shown as a function of the temporal frequencyof the drifting stimulus for diffuse (0.01 cycles-deg ', circles), peak (0.20 cyclesdeg', triangles), and center (0.42 cycles-deg ', squares) stimuli. The mean lumi-nance of the screen was 440 cd . M-2.
Y cell at low temporal frequencies was similar for the three spatial stimuli. Theaverage slopes of the relationships between logarithmic responsivity and logarith-mic temporal frequency between 0.1 and 1 Hz for center and peak stimuli weresteeper for Y cells than for X cells (see Table 1) .
It is noteworthy that Y cell curves measured with peak and center stimulirevealed a more complex spatiotemporal interaction than those of X cells. Theshape of the spatial frequency response of the cell illustrated in Fig. 4 wasapproximately invariant with temporal frequency up to .̂2 Hz. In the range 2-10 Hz, there was a progressive rise in the cell's responsivity to low spatial
61 0 THEJOURNAL OF GENERAL PHYSIOLOGY " VOLUME 89 " 1987
frequencies, and from 10 to 20 Hz, "zero" spatial frequency was the optimalstimulus . For another band of temporal frequencies beyond this (20-45 Hz), thepeak stimulus was once again optimal . Finally, the diffuse stimulus becameoptimal once more at even higher temporal frequencies and remained so untilthe limit of temporal resolution was reached . It appears from Fig . 4 that thespatiotemporal frequency response surface of Y cells has two maxima, as is thecase with X cells, but the Y cell maxima are both sharply tuned in terms oflogarithmic temporal frequency .One obvious result of the sharper maxima in the Y cells' temporal frequency
response is that their 3-dB ranges were shorter . For the cell illustrated in Fig . 4,the range for the curve measured with the peak stimulus was from 2.2 to 10 .4Hz (bandwidth, 2 .2 octaves), and the range for the curve measured with thecenter stimulus was from 3 .7 to 10.8 Hz (bandwidth, 1 .5 octaves) . The averagevalues for the small sample of Y cells studied are shown in the table . Althoughthe 3-dB ranges for the Y cells were shorter, the logarithmic midpoints of theranges for the peak and center curves were similar to those of X cells .As the temporal frequency increased, the amount by which the Y cells' response
lagged the stimulus increased, as was the case for X cells . The gradient of therelationship between the response phase and the temporal frequency (on linearaxes) for the peak stimulus for the cell in Fig . 4 was -7 .7 deg . Hz-' (i .e ., 21 .4ms) . For Y cells, the kink in the phase curve that occurred around 20 or 30 Hzand corresponded to the dip in the responsivity curve was much more pro-nounced than it was for X cells .The slope of the high temporal frequency limb was about the same for Y cells
as for X cells, and did not vary appreciably with the choice of stimulus; it wasabout -8 on double-logarithmic axes for most cells (see Table I for more details) .For one Y cell, the spatiotemporal frequency response was more like thatmeasured from X cells .
Photopic Temporal ResolutionWe measured temporal resolution by extrapolating the nearly straight high-frequency limbs of the temporal frequency responses to intersect a horizontalline drawn at a responsivity equal to 10 impulses-s- ' . The value of the abscissacorresponding to this point of intersection was taken as the high-frequencyresolution . This extrapolation is similar to that used by other investigators toestimate spatial resolution from spatial frequency responses (e.g ., So and Shapley,1981 ; Linsenmeier et al ., 1982): it represents the highest temporal frequency atwhich a sinusoidal grating stimulus of unity contrast can produce a fundamentalFourier component at an amplitude of 10 impulses - s-' .A source of uncertainty in estimates of temporal resolution for the peak
stimulus was that, during a recording session, a cell's peak spatial frequency wasnot known precisely . In fact, this could only be determined, after a recordingsession, when the spatial frequency responses measured for contrasts modulatedat 2 Hz were fitted with the Gaussian center-surround model. Any error in thespatial frequency selection is reflected in a vertical displacement of the temporalfrequency responsivities and a resultant error in the estimate of temporal reso-
FRISHMAN ET AL .
Spatiotemporal Frequency Responses ofCat Retina
611
lution . Since our errors in selection were always small and we know that thetemporal frequency responses are invariant as a function of spatial frequency forspatial frequencies close to the peak spatial frequency, we normalized the tem-poral frequency responsivities so that, for each cell, the responsivity at 2 Hz wasat the maximum predicted by the Gaussian center-surround model . Estimates oftemporal resolution with and without this normalization were usually negligiblydifferent, which showed that the frequency selection for the peak stimulus duringa recording session had generally been appropriate .
Normalization across cells of the responsivities measured for center stimuliwas also performed before temporal resolution was determined. This is againjustified by the invariance of the shape of the temporal frequency response withspatial frequency for high spatial frequencies . The 2-Hz responsivity for eachcell was normalized to be half the maximum responsivity predicted by theGaussian center-surround model fitted to the 2-Hz spatAs noted earlier, during the recording sessions, spatial frequenciesresponsivities between one-quarter and one-half that of peak responsivitybeen selected for the center stimulus . Temporal frequency responses measuredfor diffuse stimuli required no normalization .The absolute temporal resolution (obtained with the diffuse stimulus) for X
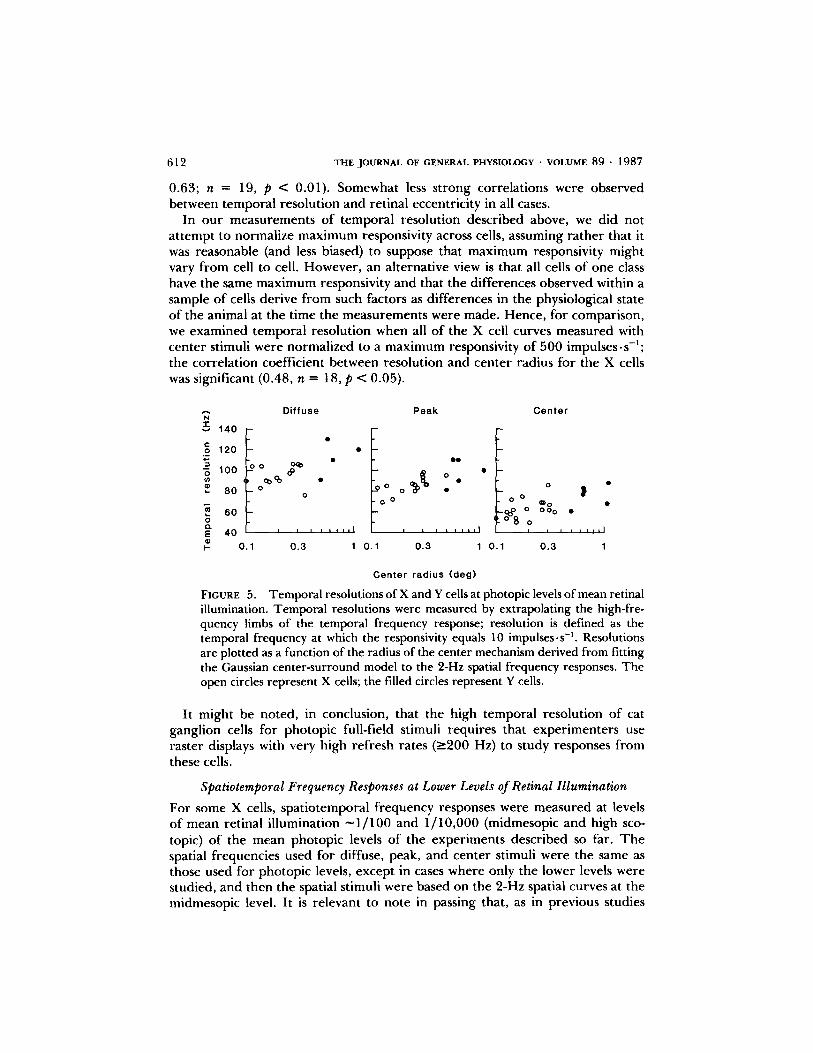
cells ranged from -80 to 100 Hz. For one Y cell, it was as high as 130 Hz. Theaverage values of temporal resolution for all spatial stimuli are presented inTable I . Having observed that the temporal resolutions for each stimulus formwere variable across cells, we were interested to determine the extent to whichthis variation was systematic . We found a relationship between temporal resolu-tion and the radius of a cell's receptive field center . The center radius is a veryuseful metric for standardizing ganglion cell properties, since it provides ameasure of the spatial scale on which the retinal image is sampled locally (by thatclass of ganglion cells) and it takes into account (at least for scotopic adaptationlevels) the state of light adaptation in that cell (Enroth-Cugell and Shapley, 1973) .It is a good metric to use in a retina such as the cat's, where sampling of imagesis inhomogeneous . However, since the center radius appears to change at hightemporal frequencies (see below), it is important that it be determined for allcells at low temporal frequency . It was convenient for us to estimate the centerradius from fits of the Gaussian center-surround model to the 2-Hz spatialfrequency responses we measured for all cells, and, in Fig. 5, temporal resolutionis plotted against this estimate .Temporal resolutions determined from responses evoked by peak and center
stimuli were positively correlated with center radius . The Pearson productmoment correlation coefficient for the X cells alone for the curves measuredwith the peak stimuli was 0.69 (n = 17, p < 0.01), and for the X and Y cellscombined, it was 0.77 (n = 21, p < 0 .001) . The correlation coefficient was lowerfor the curves measured with the center stimuli, 0.44 (n = 18, not significant)for X cells, but it was 0.69 (n = 23, p < 0.01) when all cells were included .Temporal resolution for diffuse stimuli was barely correlated with the receptivefield center radius (correlation coefficient, 0.17 ; n = 16) for X cells alone, butwhen Y cells were included, the correlation was higher (correlation coefficient,
61 2 THE JOURNAL OF GENERAL PHYSIOLOGY " VOLUME 89 " 1987
0.63 ; n = 19, p < 0.01) . Somewhat less strong correlations were observedbetween temporal resolution and retinal eccentricity in all cases.
In our measurements of temporal resolution described above, we did notattempt to normalize maximum responsivity across cells, assuming rather that itwas reasonable (and less biased) to suppose that maximum responsivity mightvary from cell to cell . However, an alternative view is that all cells of one classhave the same maximum responsivity and that the differences observed within asample of cells derive from such factors as differences in the physiological stateof the animal at the time the measurements were made. Hence, for comparison,we examined temporal resolution when all of the X cell curves measured withcenter stimuli were normalized to a maximum responsivity of 500 impulses - s-1 ;
the correlation coefficient between resolution and center radius for the X cellswas significant (0 .48, n = 18, p < 0 .05) .
Diffuse
Peak
CenterN
0 120
0 100 -9 1 8
0N (*
0
0 O %
0
O
0 0_
80
0
0 0
®0-0
0
0 00
F
0 .1
0.3
1 0.1
0.3
1 0.1
0.3
1
Center radius (deg)
FIGURE 5 .
Temporal resolutions of XandY cells at photopic levels ofmean retinalillumination . Temporal resolutions were measured by extrapolating the high-fre-quency limbs of the temporal frequency response ; resolution is defined as thetemporal frequency at which the responsivity equals 10 impulses -s-' . Resolutionsare plotted as a function of the radius of the center mechanism derived from fittingthe Gaussian center-surround model to the 2-Hz spatial frequency responses . Theopen circles represent X cells ; the filled circles represent Y cells .
It might be noted, in conclusion, that the high temporal resolution of catganglion cells for photopic full-field stimuli requires that experimenters useraster displays with very high refresh rates (?200 Hz) to study responses fromthese cells.
Spatiotemporal Frequency Responses at Lower Levels ofRetinal IlluminationFor some X cells, spatiotemporal frequency responses were measured at levelsof mean retinal illumination ~1/100 and 1/10,000 (midmesopic and high sco-topic) of the mean photopic levels of the experiments described so far. Thespatial frequencies used for diffuse, peak, and center stimuli were the same asthose used for photopic levels, except in cases where only the lower levels werestudied, and then the spatial stimuli were based on the 2-Hz spatial curves at themidmesopic level. It is relevant to note in passing that, as in previous studies
FRISHMAN ET AL .
Spatiotemporal Frequency Responses ofCat Retina
61 3
(Enroth-Cugell et al ., 1977 ; Kirby and Schweitzer-Tong, 1981 ; Derrington andLennie, 1982), we found no systematic change in the center radius of the cells'receptive fields as retinal illumination was reduced from photopic to scotopiclevels .
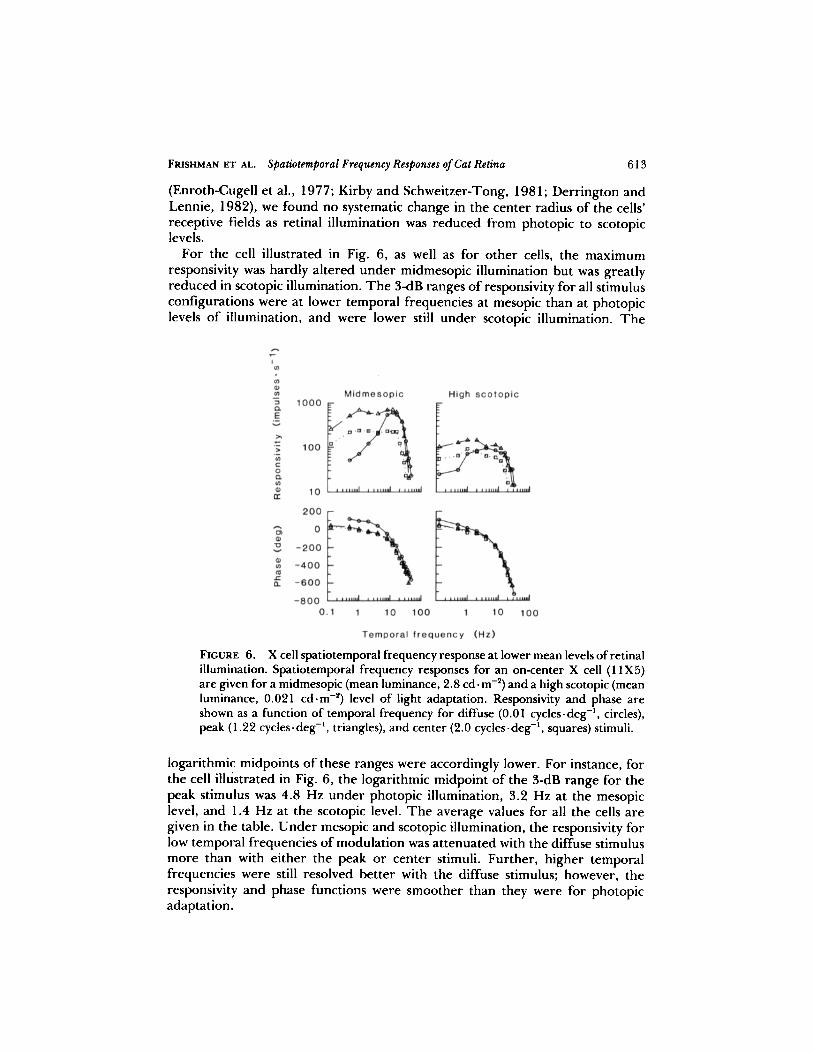
For the cell illustrated in Fig. 6, as well as for other cells, the maximumresponsivity was hardly altered under midmesopic illumination but was greatlyreduced in scotopic illumination . The 3-dB ranges of responsivity for all stimulusconfigurations were at lower temporal frequencies at mesopic than at photopiclevels of illumination, and were lower still under scotopic illumination . The
FIGURE 6.
Xcell spatiotemporal frequency response at lower mean levels ofretinalillumination . Spatiotemporal frequency responses for an on-center X cell (11X5)are given for a midmesopic (mean luminance, 2.8 cd . m-2 ) and a high scotopic (meanluminance, 0.021 cd . m-2) level of light adaptation . Responsivity and phase areshown as a function of temporal frequency for diffuse (0.01 cycles - deg ', circles),peak (1 .22 cycles-deg-', triangles), and center (2 .0 cycles -deg', squares) stimuli .
logarithmic midpoints of these ranges were accordingly lower. For instance, forthe cell illustrated in Fig. 6, the logarithmic midpoint of the 3-dB range for thepeak stimulus was 4.8 Hz under photopic illumination, 3.2 Hz at the mesopiclevel, and 1 .4 Hz at the scotopic level . The average values for all the cells aregiven in the table. Under mesopic and scotopic illumination, the responsivity forlow temporal frequencies of modulation was attenuated with the diffuse stimulusmore than with either the peak or center stimuli. Further, higher temporalfrequencies were still resolved better with the diffuse stimulus; however, theresponsivity and phase functions were smoother than they were for photopicadaptation .
61 4
N
C0
0NN
200aEdH
THE JOURNAL OF GENERAL PHYSIOLOGY " VOLUME 89 " 1987
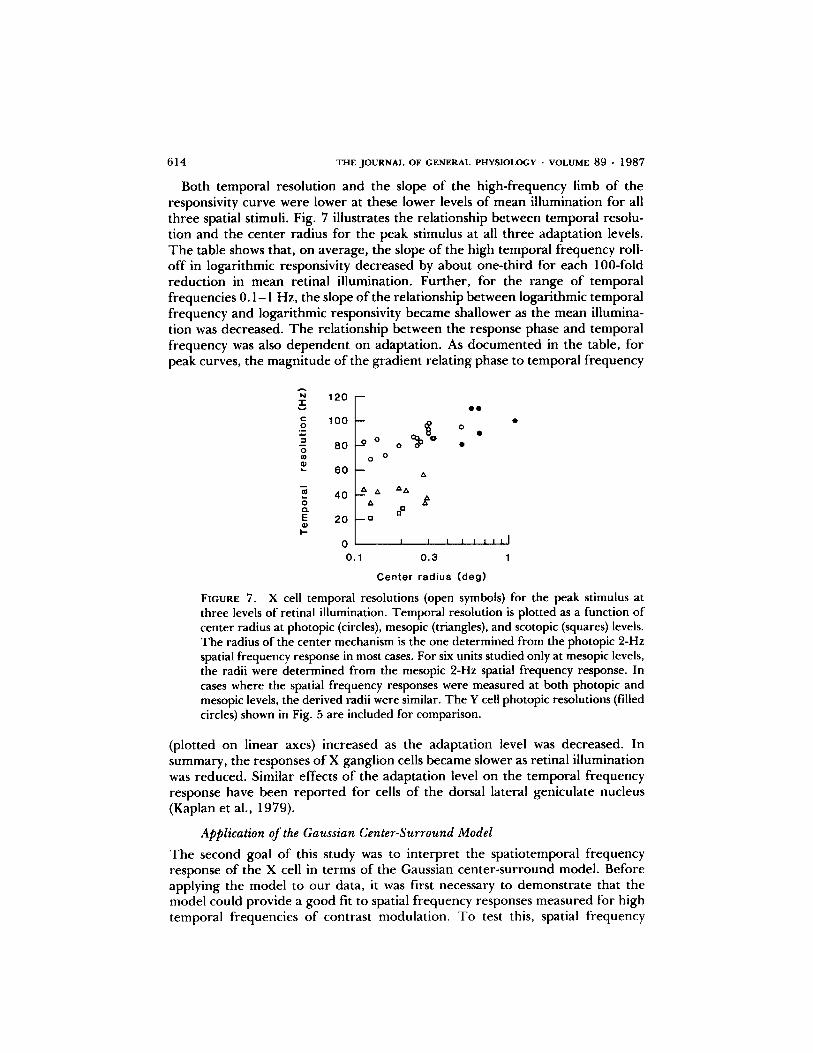
Both temporal resolution and the slope of the high-frequency limb of theresponsivity curve were lower at these lower levels of mean illumination for allthree spatial stimuli . Fig. 7 illustrates the relationship between temporal resolu-tion and the center radius for the peak stimulus at all three adaptation levels .The table shows that, on average, the slope of the high temporal frequency roll-off in logarithmic responsivity decreased by about one-third for each 100-foldreduction in mean retinal illumination . Further, for the range of temporalfrequencies 0.1-1 Hz, the slope of the relationship between logarithmic temporalfrequency and logarithmic responsivity became shallower as the mean illumina-tion was decreased . The relationship between the response phase and temporalfrequency was also dependent on adaptation . As documented in the table, forpeak curves, the magnitude of the gradient relating phase to temporal frequency
120
100
80
60
40
20
D D0
000
Center radius (deg)FIGURE 7 . X cell temporal resolutions (open symbols) for the peak stimulus atthree levels of retinal illumination . Temporal resolution is plotted as a function ofcenter radius at photopic (circles), mesopic (triangles), and scotopic (squares) levels .The radius of the center mechanism is the one determined from the photopic 2-Hzspatial frequency response in most cases . For six units studied only at mesopic levels,the radii were determined from the mesopic 2-Hz spatial frequency response . Incases where the spatial frequency responses were measured at both photopic andmesopic levels, the derived radii were similar. The Y cell photopic resolutions (filledcircles) shown in Fig. 5 are included for comparison .
(plotted on linear axes) increased as the adaptation level was decreased . Insummary, the responses of X ganglion cells became slower as retinal illuminationwas reduced. Similar effects of the adaptation level on the temporal frequencyresponse have been reported for cells of the dorsal lateral geniculate nucleus(Kaplan et al ., 1979).
Application of the Gaussian Center-Surround ModelThe second goal of this study was to interpret the spatiotemporal frequencyresponse of the X cell in terms of the Gaussian center-surround model . Beforeapplying the model to our data, it was first necessary to demonstrate that themodel could provide a good fit to spatial frequency responses measured for hightemporal frequencies of contrast modulation . To test this, spatial frequency
FRISHMAN ET AL.
Spatiotemporal Frequency Responses ofCat Retina
61 5
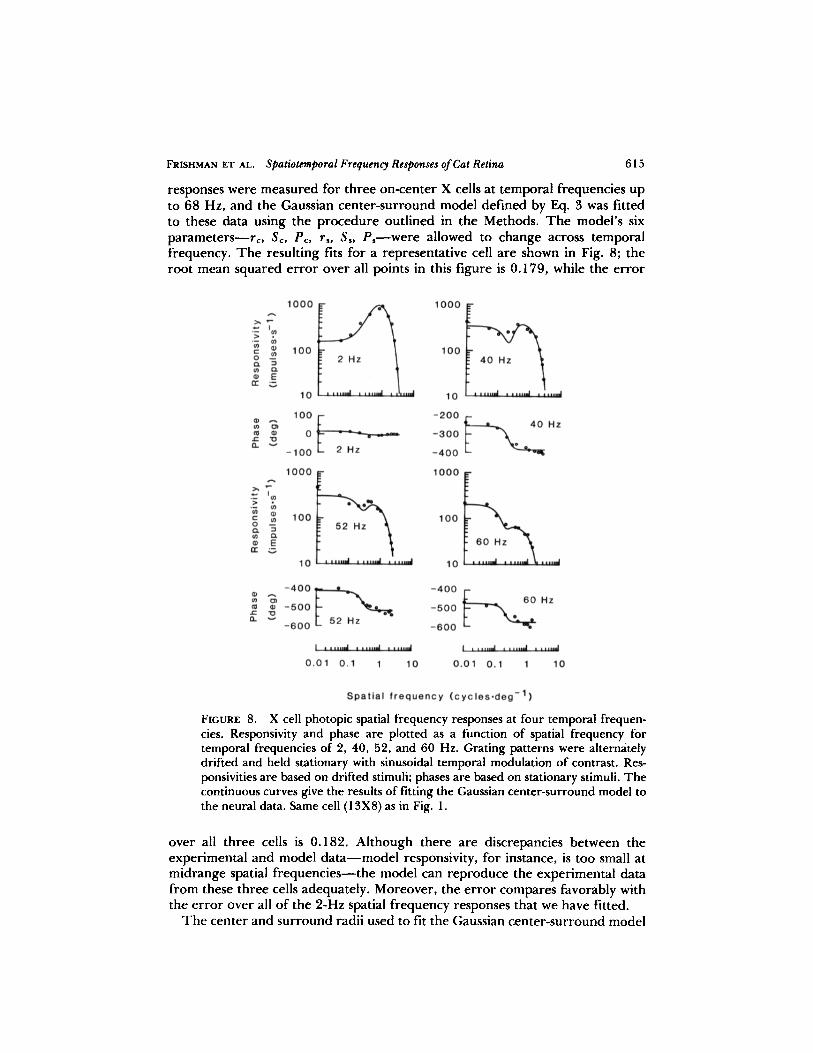
responses were measured for three on-center X cells at temporal frequencies upto 68 Hz, and the Gaussian center-surround model defined by Eq . 3 was fittedto these data using the procedure outlined in the Methods. The model's sixparameters-rc, SC, PC, rs , S� Pswere allowed to change across temporalfrequency. The resulting fits for a representative cell are shown in Fig. 8; theroot mean squared error over all points in this figure is 0 .179, while the error
FIGURE 8.
Xcell photopic spatial frequency responses at four temporal frequen-cies . Responsivity and phase are plotted as a function of spatial frequency fortemporal frequencies of 2, 40, 52, and 60 Hz . Grating patterns were alternatelydrifted and held stationary with sinusoidal temporal modulation of contrast . Res-ponsivities are based on drifted stimuli; phases are based on stationary stimuli . Thecontinuous curves give the results of fitting the Gaussian center-surround model tothe neural data . Same cell (13X8) as in Fig. 1 .
over all three cells is 0.182 . Although there are discrepancies between theexperimental and model data-model responsivity, for instance, is too small atmidrange spatial frequencies-the model can reproduce the experimental datafrom these three cells adequately . Moreover, the error compares favorably withthe error over all of the 2-Hz spatial frequency responses that we have fitted .The center and surround radii used to fit the Gaussian center-surround model
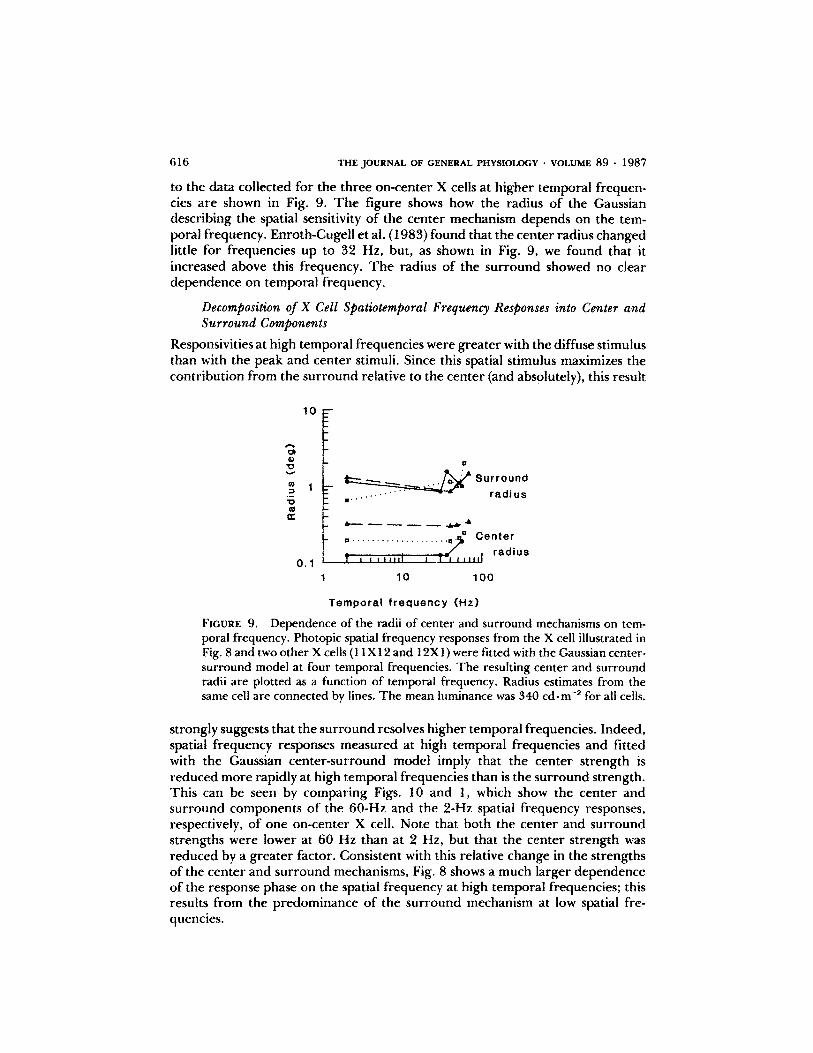
616 THEJOURNAL OF GENERAL PHYSIOLOGY " VOLUME 89 - 1987
to the data collected for the three on-center X cells at higher temporal frequen-cies are shown in Fig. 9. The figure shows how the radius of the Gaussiandescribing the spatial sensitivity of the center mechanism depends on the tem-poral frequency. Enroth-Cugell et al . (1983) found that the center radius changedlittle for frequencies up to 32 Hz, but, as shown in Fig. 9, we found that itincreased above this frequency. The radius of the surround showed no cleardependence on temporal frequency.
Decomposition of X Cell Spatiotemporal Frequency Responses into Center andSurround Components
Responsivities at high temporal frequencieswere greater with the diffuse stimulusthan with the peak and center stimuli. Since this spatial stimulus maximizes thecontribution from the surround relative to the center (and absolutely), this result
Temporal frequency (Hz)
FIGURE 9.
Dependence of the radii of center and surround mechanisms on tem-poral frequency. Photopic spatial frequency responses from the X cell illustrated inFig. 8andtwo otherXcells (11X12 and 12X1) were fitted with the Gaussian center-surround model at four temporal frequencies. The resulting center and surroundradii are plotted as a function of temporal frequency. Radius estimates from thesame cell are connected by lines . The mean luminance was 340 cd-m2 for all cells.
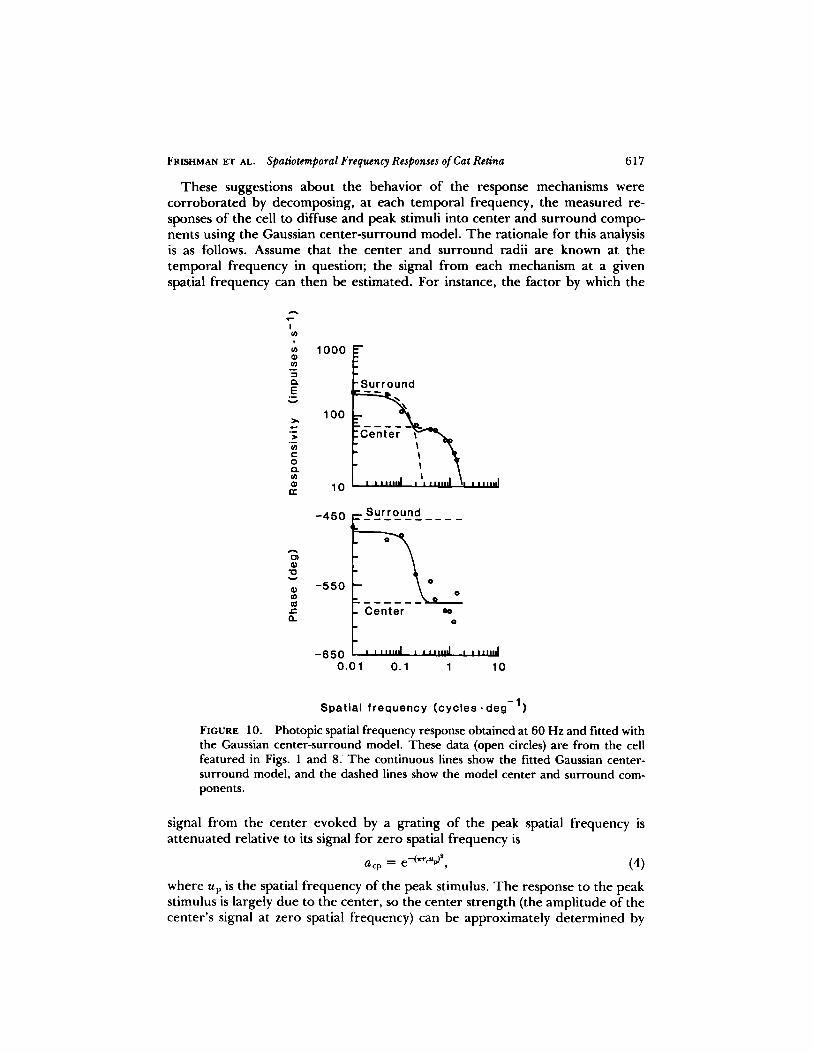
strongly suggests that the surround resolves higher temporal frequencies. Indeed,spatial frequency responses measured at high temporal frequencies and fittedwith the Gaussian center-surround model imply that the center strength isreduced more rapidly at high temporal frequencies than is the surround strength .This can be seen by comparing Figs. 10 and 1, which show the center andsurround components of the 60-Hz and the 2-Hz spatial frequency responses,respectively, of one on-center X cell . Note that both the center and surroundstrengths were lower at 60 Hz than at 2 Hz, but that the center strength wasreduced by a greater factor . Consistent with this relative change in the strengthsof the center and surround mechanisms, Fig. 8 shows a much larger dependenceof the response phase on the spatial frequency at high temporal frequencies; thisresults from the predominance of the surround mechanism at low spatial fre-quencies .
FRISHMAN ET AL .
Spatiotemporal Frequency Responses ofCat Retina
617
These suggestions about the behavior of the response mechanisms werecorroborated by decomposing, at each temporal frequency, the measured re-sponses of the cell to diffuse and peak stimuli into center and surround compo-nents using the Gaussian center-surround model . The rationale for this analysisis as follows. Assume that the center and surround radii are known at thetemporal frequency in question ; the signal from each mechanism at a givenspatial frequency can then be estimated . For instance, the factor by which the
vN
VlN
aE
1000
~Surround
100__Z-_Centr 1
tr 10
-450 . Surround --- -
ord
myldLa
-550
_ Center0
00
0
-650 1 111111111
112111111
111111111
0.01 0 .1 1 10
Spatial frequency (cycles -deg-1 )
FIGURE 10 .
Photopic spatial frequency response obtained at 60 Hz and fitted withthe Gaussian center-surround model. These data (open circles) are from the cellfeatured in Figs . 1 and 8. The continuous lines show the fitted Gaussian center-surround model, and the dashed lines show the model center and surround com-ponents.
signal from the center evoked by a grating of the peak spatial frequency isattenuated relative to its signal for zero spatial frequency is
a cp = e-(rrcu~4n
(4)where up is the spatial frequency of the peak stimulus . The response to the peakstimulus is largely due to the center, so the center strength (the amplitude of thecenter's signal at zero spatial frequency) can be approximately determined by
61 8
THEJOURNAL OF GENERAL PHYSIOLOGY " VOLUME 89 " 1987
dividing the cell's responsivity to the peak stimulus by a,p; the center phase isessentially equal to the phase of the peak response . (Responses to the peak ratherthan to the center stimulus were chosen for the decomposition because theresponses extended to higher temporal frequencies, thus allowing an analysisover a larger range of frequencies.) The frequency response for the diffusestimulus is equal, or nearly equal, to the sum of the center and surround signalsfor zero spatial frequency . The surround signal for zero spatial frequency canbe well approximated by the difference between the diffuse frequency responseand the center signal .More rigorously, Eq . 3 and equations for the "attenuation" factors (such as Eq .
4) give the cell's response to the diffuse spatial frequency (ud) :
and to the peak stimulus :IRs(ud)Ie'Pg(ad) = a,dSce'` + awSse°,
IRg(uv)Ie"g(y = awS,e'~ + a,QSse`P,.
(6)
These are two complex equations that can be split into four real equations, withone equation each for the cosine and sine components of the diffuse and peakresponses . Assuming that the spatial parameters rc and rs are known, Eqs. 5 and6 represent four equations that are linear in four unknowns: the cosine and sinecomponents of the center and surround signals. These equations were solved toobtain the center and surround strengths and phases at each temporal frequencyused .
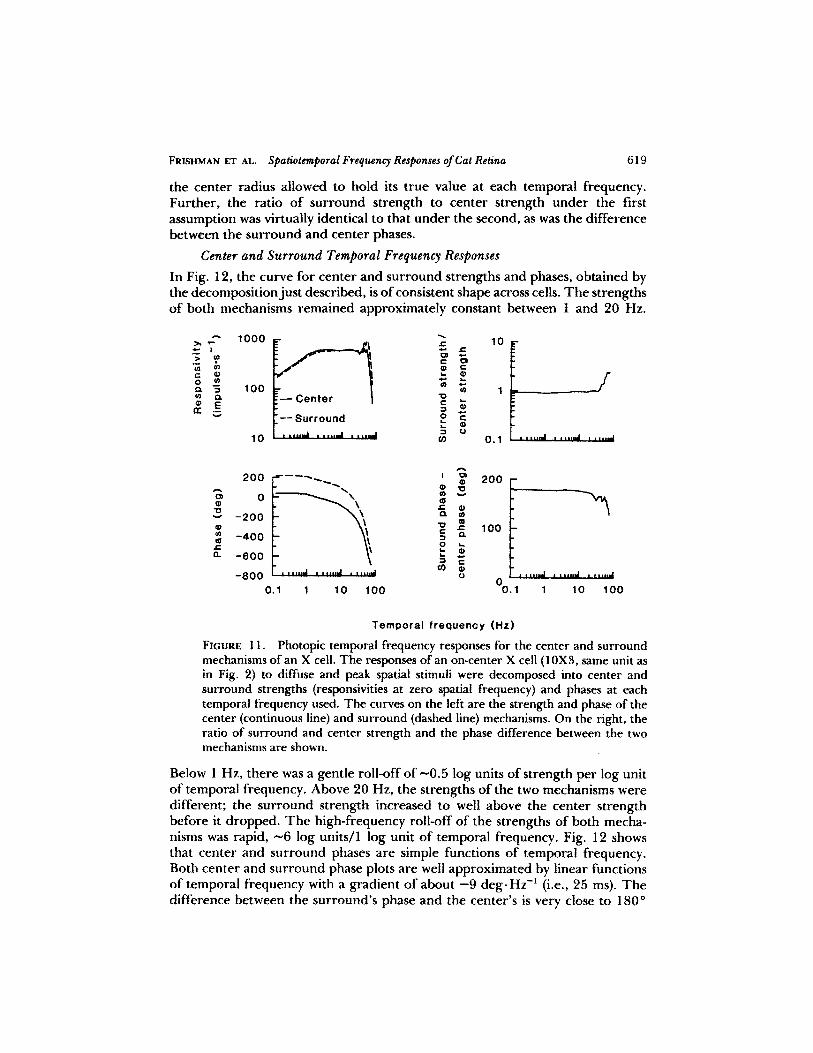
Fig. 11 shows the result for the cell whose frequency responses are shown inFig. 2. The resulting strengths and phases for the center and surround compo-nents are shown on the left . Thetwo plots on the right show the ratio of surroundto center strength and the difference between the surround and center phases .Fig. 12 illustrates the consistency of these results across 10 on-center units .The results in Figs . 11 and 12 were generated assuming that the center and
surround radii for each cell were fixed at their 2-Hz values . Given the findingillustrated in Fig. 9 that the center radius increases with temporal frequencyabove ^-30 Hz, the consequences of this assumption must be considered . Theresult of underestimating the center radius is that the amount of attenuation atthe peak spatial frequency for the center mechanism and hence the centerstrength are underestimated . With the center strength underestimated, thesurround strength must also be underestimated and the phase of the estimatedsurround signal will lag the true surround signal . However, since we hadmeasured the spatial frequency responses at high temporal frequencies in threecells and could consequently estimate how the center radius changed as a functionof temporal frequency, we were able to determine, for these three cases, theimpact of the errors resulting from the assumption of an invariant center radiusupon estimates of frequency responses of the center and surround mechanisms .With the data from these cells, we obtained qualitatively similar estimates of thefrequency responses of center and surround mechanisms from decompositionsof the frequency responses measured for peak and diffuse stimuli made (a) withthe assumption that the center radius was fixed at its 2-Hz value, and (b) with
FRISHMAN ET AL .
Spatiotemporal Frequency Responses ofCat Retina
619
the center radius allowed to hold its true value at each temporal frequency.Further, the ratio of surround strength to center strength under the firstassumption was virtually identical to that under the second, as was the differencebetween the surround and center phases .
In Fig . 12, the curve for center and surround strengths and phases, obtained bythe decompositionjust described, is ofconsistent shape across cells . The strengthsof both mechanisms remained approximately constant between I and 20 Hz.
Center and Surround Temporal Frequency Responses
aacm
LCOv
wcNyLUCmU
200 r----.._
E m 200100a)
,° -200
1
âc t 100
-400
o' °L
~
L Na -600
c°'
1 . ..~r . . ...~ . . . ..~-800
a0.1 1 10 100
0.1 1 10 100
Temporal frequency (Hz)
FIGURE 11 .
Photopic temporal frequency responses for the center and surroundmechanisms of an X cell . The responses of an on-center X cell (10X3, same unit asin Fig . 2) to diffuse and peak spatial stimuli were decomposed into center andsurround strengths (responsivities at zero spatial frequency) and phases at eachtemporal frequency used . The curves on the left are the strength and phase of thecenter (continuous line) and surround (dashed line) mechanisms . On the right, theratio of surround and center strength and the phase difference between the twomechanisms are shown.
Below 1 Hz, there was a gentle roll-off of -0.5 log units of strength per log unitof temporal frequency . Above 20 Hz, the strengths of the two mechanisms weredifferent; the surround strength increased to well above the center strengthbefore it dropped . The high-frequency roll-off of the strengths of both mecha-nisms was rapid, ^-6 log units/I log unit of temporal frequency . Fig. 12 showsthat center and surround phases are simple functions of temporal frequency.Both center and surround phase plots are well approximated by linear functionsof temporal frequency with a gradient of about -9 deg-Hz-- ' (i .e ., 25 ms). Thedifference between the surround's phase and the center's is very close to 180"
620
THE JOURNAL OF GENERAL PHYSIOLOGY " VOLUME 89 - 1987
at the lowest temporal frequency and decreases to -170° at 20 Hz; behavior isless uniform across cells above this temporal frequency .
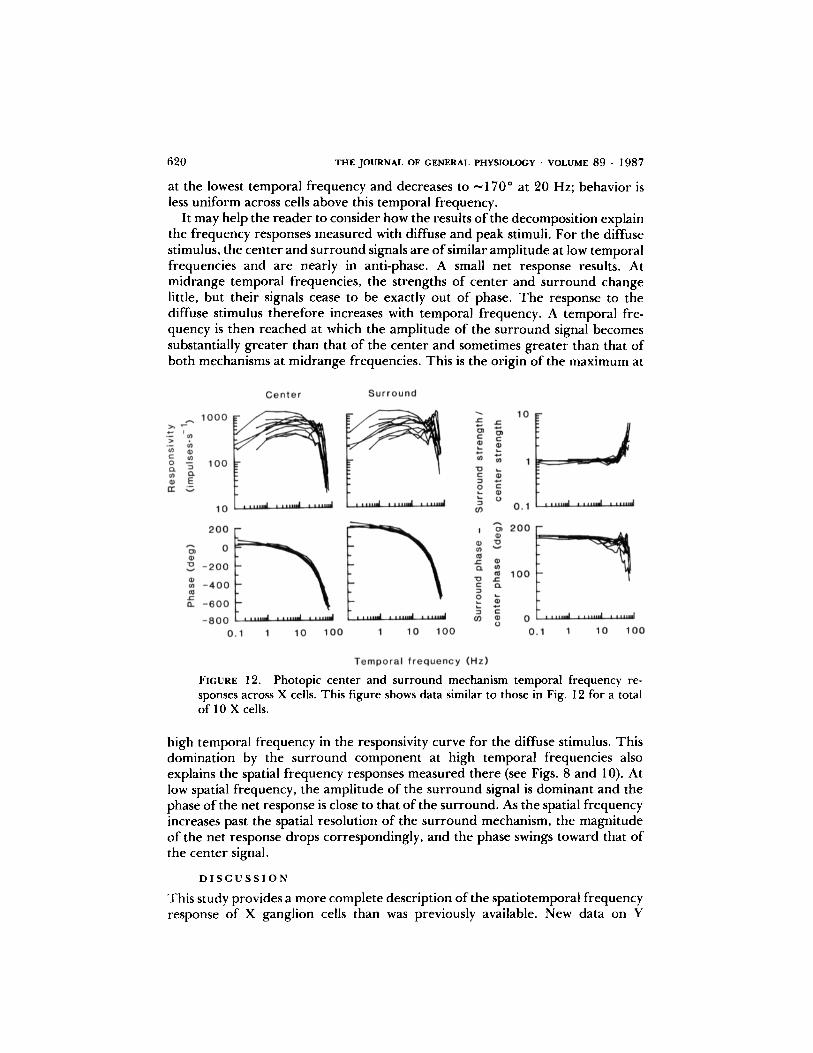
It may help the reader to consider how the results of the decomposition explainthe frequency responses measured with diffuse and peak stimuli. For the diffusestimulus, the center and surround signals are ofsimilar amplitude at low temporalfrequencies and are nearly in anti-phase . A small net response results. Atmidrange temporal frequencies, the strengths of center and surround changelittle, but their signals cease to be exactly out of phase. The response to thediffuse stimulus therefore increases with temporal frequency . A temporal fre-quency is then reached at which the amplitude of the surround signal becomessubstantially greater than that of the center and sometimes greater than that ofboth mechanisms at midrange frequencies. This is the origin of the maximum at
FIGURE 12 . Photopic center and surround mechanism temporal frequency re-sponses across X cells . This figure shows data similar to those in Fig. 12 for a totalof 10 X cells .
high temporal frequency in the responsivity curve for the diffuse stimulus . Thisdomination by the surround component at high temporal frequencies alsoexplains the spatial frequency responses measured there (see Figs . 8 and 10). Atlow spatial frequency, the amplitude of the surround signal is dominant and thephase of the net response is close to that of the surround . As the spatial frequencyincreases past the spatial resolution of the surround mechanism, the magnitudeof the net response drops correspondingly, and the phase swings toward that ofthe center signal .
DISCUSSIONThis study provides a more complete description of the spatiotemporal frequencyresponse of X ganglion cells than was previously available . New data on Y
FRISHMAN ET AL .
Spatiotemporal Frequency Responses ofCat Retina
621
ganglion cells at photopic levels and X cells at lower levels of retinal illuminationare also reported . In the first part of the Discussion, retinal mechanisms thatmight underlie photopic spatiotemporal frequency responses are considered . Ina later section, the relevance of our observations to vision is discussed, and finally,a possible model for the photopic spatiotemporal frequency response of X cellsis described .
Mechanisms Underlying the Spatiotemporal Frequency Response
Frequency responses at low temporalfrequencies . Two possible causes of thelower responsivities obtained for contrast modulation below 1 Hz are (a) lightadaptation and (b) contrast gain control (Shapley and Victor, 1978). The rolloff on double-logarithmic axes has a fractional slope that becomes steeper as thecell is light-adapted from scotopic, through mesopic, to photopic illumination .There is some evidence that, within the scotopic range, the slope of the roll-offincreases with mean illumination (Enroth-Cugell and Shapley, 1973). Any light-adaptational effect probably occurs early in the retina, since some attenuation atlow temporal frequencies was found in horizontal cells in cat (Foerster et a1 .,1977x, b) and turtle (Tranchina et al ., 1984).Thecontrast gain control is also known to attenuate responses to low temporal
frequencies of contrast modulation and to act more strongly in Y cells than in Xcells. We found more attenuation in the Y cell responsivity than in that of X cellsat low and midrange temporal frequencies. In addition, the attenuation observedfor Y cells was stronger than that observed by previous investigators, whereasthat for X cells was similar (e.g ., Lennie, 1980; Derrington and Lennie, 1982).We may have seen more attenuation in Y cells because our average responsecriterion was higher by ^-2 impulses -s-' than the criteria used by Lennie (1980)and Derrington and Lennie (1982), and thus presumably required higher con-trast and enhanced the contrast gain effect .
Frequency responses at high temporal frequencies . The enhanced responsivityat high temporal frequencies between 40 and 60 Hz was observed at photopiclevels where rods were saturated, but not at mesopic or scotopic levels . Thisstrongly suggests that the origin of the enhancement is in the "cone" pathway.Foerster et al . (1977x, b) found similar enhanced responses in cat horizontal cellsunder photopic conditions . Hence, the cellular origin of the enhancement ofganglion cell responsivity is probably early in the pathway.One possibility may be a negative feedback loop in which cones excite horizon-
tal cells and horizontal cells in turn inhibit cones, as is the case for the turtleretina (Baylor et al ., 1971). If both cones and horizontal cells act as low-passfilters, then the complete loop could act as a second-order filter and produce aresonant peak, as suggested by Foerster et al . This feedback might also accountfor the greater enhancement of responses seen in cat horizontal cells (Foersteret al ., 1977x, b) and in our ganglion cells for large stimuli .A contributing factor to the response enhancement may be the reduced
antagonism between center and surround signals that would occur if the twomechanisms were more nearly coherent at high temporal frequencies. A similarmechanism for the amplification of signals was described for Limulus eye byRatliff et al . (1970) . However, the fact, according to our decompositions, that
622 THEJOURNAL OF GENERAL PHYSIOLOGY " VOLUME 89 " 1987
the responsivity of the surround surpasses that of the center and that both signalsare rapidly attenuated at high temporal frequencies where the center andsurround are most coherent implies that changes in signal amplitude are at leastas important in describing the cell's peak in responsivity . In fact, the decompo-sitions of photopic frequency responses show that the phases of the surroundand center were still separated by >120' where responsivity peaked .
The roll-off at high temporal frequencies . The roll-off of responsivity of ^-7log units for each log unit of temporal frequency agrees well with the horizontalcell data of Foerster et al . (1977 a), who found log-log gradients of about -6 fortheir medium-bandwidth cells and up to -7 for their wide-bandwidth cells . Thissuggests that the retinal elements that determine the high-frequency roll-off arecones or horizontal cells . There is evidence from other species of qualitativelysimilar low-pass filtering by receptors (e.g ., Fuortes and Hodgkin, 1964; Bayloret al ., 1974) and at the receptor bipolar synapse (Ashmore and Copenhagen,1980).
Spatiotemporal resolution . We found a trade-offbetween spatial andtemporalresolution ; when one improved, the other deteriorated . First, as the 2-Hz centerradius increased across our sample of cells, temporal resolution improved (Fig .5) . Second, in individual (on-center) X cells, increasing the temporal frequencyabove 32 Hz resulted in larger center radii (Fig . 9), an example of spatiotemporalinteraction in the cells' receptive fields . Detwiler et al . (1978, 1980) found asimilar trade-off in the network of turtle rods, as did Molenaar et al . (1983) incone-driven responses of cat horizontal cells. The mechanism that Detwiler et al .proposed was inductance-like behavior in the receptor membrane, possiblycaused by voltage-dependent membrane conductances . Such voltage-dependentconductances have been shown directly in the rods of toads (Torre and Owen,1981) and salamander (Baylor et al ., 1984).
In our experiments, temporal resolution increased for individual cells whenwe decreased the spatial frequency of the stimulus, and our decompositionsindicated that the surround resolved higher temporal frequencies than thecenter . Maffei et al . (1970), on the other hand, concluded that it was the centerand not the surround that determined the temporal resolution . However, theyused spot stimuli, which may not have stimulated the surround mechanism asadequately as our gratings . Marcus (1979), on the other hand, used a stimulusmore likely to generate a considerable surround signal and he found that thecell's response did increase at high temporal frequencies.The high temporal resolutions at photopic levels for diffuse light that we
observed have been reported previously for cat horizontal cells (Foerster et al .,1977x), and flicker fusions of up to 80 Hz also have been reported for retinalganglion cells (Enroth, 1953 ; Ogawa et al ., 1966). In addition, Jones and Berkeley(1983), who measured evoked potentials from the optic tract, dorsal lateralgeniculate nucleus, and visual cortex, reported flicker resolutions of up to 90 Hzfor large photopic spot stimuli .
Relation to VisionBoth X and Y cells respond poorly to low spatial frequencies at very low temporalfrequencies (e.g ., <1 Hz). In cats, the existing behavioral studies of contrast
FRISHMAN ET AL.
Spatiotemporal Frequency Responses ofCat Retina
623
(Blake and Camisa, 1977; Loop and Berkeley, 1975) provcient data to address this issue. However, it has been known for a long time thatthe combination of low spatial and temporal frequencies in humans leads to verypoor contrast sensitivity (Robson, 1966; Kelly, 1974).The responsivities for X and Y cells measured with the peak stimulus at
photopic levels, and for X cells at mesopic levels, were optimal at -5 or 6 Hz. Asimilar result was found under comparable stimulus conditions by previousinvestigators (Lennie, 1980 ; Derrington and Lennie, 1982), and this result doesnot appear to be altered a great deal at the dorsal lateral geniculate nucleus(Troy, 1983) or in areas 17 and 18 of the visual cortex (Movshon et al ., 1978).Further, the optimal temporal frequencies observed in Blake and Camisa's (1977)behavioral study under high mesopic conditions were also similar.With respect to temporal resolution in behavioral studies on cat, Loop and
Berkeley (1975) found that, for a 15° patch of light, contrast sensitivity droppedto a value of unity at ^-50 Hz, and extrapolations of Blake and Camisa's (1977)temporal contrast sensitivity curves for spatial frequencies of 0.25 and 0.5 cyclesdeg' yield similar results . Our most appropriate data for comparison are theresolutions measured with diffuse stimuli at midmesopic adaptation levels . Underthese circumstances, on average, X cells had temporal resolutions of -53 Hz.While this comparison is necessarily a rough one (including the assumption thatour X cell data cover the same retinal eccentricities used by the animal forperforming the task), it suggests that, for spatially uniform fields, temporalresolution might be preserved from the retina up to the point where flickerdetection occurs in cats .Our findings, based on X cells, show that for all three spatial stimuli, temporal
resolution increases slightly with center radius (Fig . 5) and hence with retinaleccentricity (e.g ., Cleland and Levick, 1974 ; Stone and Fukuda, 1974; Clelandet al ., 1979). We know of no behavioral data for the cat that test this issue, butin psychophysical studies in humans, Kelly (1984) found that within the central12°, the temporal frequency contrast sensitivity does not depend on eccentricity,provided that it is measured with the optimal spatial frequency for that eccen-tricity; this is in agreement with previous findings by Virsu et al . (1982) . Thisissue clearly needs to be studied in cats .
Modeling the Temporal Frequency Response
Center-surround decomposition. Consistent results were obtained in threeprevious studies in which X cell spatial frequency responses were measured atmore than one temporal frequency and were analyzed using the difference-ofGaussians or the Gaussian center-surround model. In the temporal frequencyranges modeled-0.16-20 .4 Hz for Derrington and Lennie (1982), 0.5-32 Hzfor Enroth-Cugell et al . (1983), and 1-16 Hz for Dawis et al . (1984)-centerand surround radii showed no consistent change with temporal frequency .Enroth-Cugell et al . (1983) also showed that the ratio of center and surroundstrength is a flat function of temporal frequency over the frequency range thatthey studied. Further, the surround-center phase difference decreased on aver-age by ~30° . We also found that the ratio of surround to center strengthchanged little up to -30 Hz, and that the phase difference between mechanisms
624
THE JOURNAL OF GENERAL PHYSIOLOGY " VOLUME 89 " 1987
decreased by between ^ " 10° and 40° at that frequency. Thus, up to -30 Hz,our data would be fitted adequately by the existing Gaussian center-surroundmodel (e.g., Enroth-Cugell et al ., 1983). It was our findings past this frequencythat led us to apply a more general model in which the center and surround radiiare allowed to vary with temporal frequency.
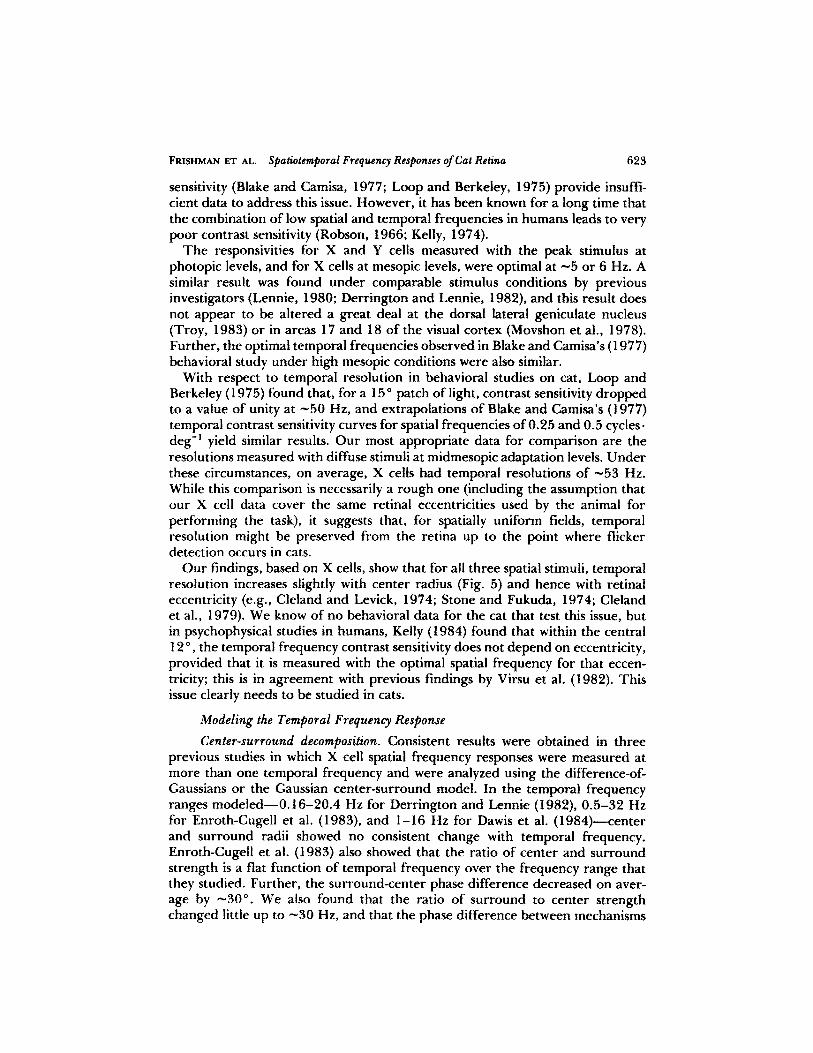
A modelfor the temporalfrequency response. Assuming that theXcell receptivefield is adequately described by the Gaussian center-surround model, the tem-poral frequency response of an X cell can be quantitatively modeled by finding
..Comv
N
Lo .
1000
100
10
0
-200
-400
-600
I
~ i nnul
t t nnui
~, i onul- JL---s
I
1 I ii [fill
I I I 111111
1 1 [Iuul
0.1 1 10 100
Temporal frequency (Hz)
FIGURE 13 .
Fit of a model with six first-order low-pass filters, one second-orderfilter, a transitional lead, and a time delay to the temporal photopic frequencyresponse measured with the peak stimulus for the unit (13X8) that was featured inFigs . 1, 8, and 10 . For this particular cell, the corner frequencies for the six low-pass filters were at 46 Hz and the corner frequency for the second-order filter wasat 53 Hz . The second-order filter had a damping constant of 0.17. The parametersgand T of the transitional lead were 9and 4 s, respectively . The time delay was 15ms and the overall gain was 800 impulses " s' .
two linear systems, one that emulates the center mechanism'stemporal frequencyresponse and another that emulates that of the surround . The shape of thecenter's temporal frequency response above 1 Hz suggests a cascade of about sixfirst-order low-pass filters and one second-order filter (the second-order filterbeing added to fit the slight enhancement at 40-50 Hz). The surround's temporalfrequency response, which is more enhanced than the center's at 40-50 Hz,requires a lower damping constant for the second-order filter . The surround's
FRISHMAN ET AL .
Spatiotemporal Frequency Responses ofCat Retina
625
model has an additional short delay of a few milliseconds (Enroth-Cugell et al .,1983), but is otherwise similar to that of the center . As the frequency decreasesbelow 1 Hz, the use of the low-pass filters alone would require that both thecenter and surround strengths (i .e ., responsivities at zero spatial frequency)approach a constant value, and that the center phase approach 0° and thesurround phase 180° for an on-center cell . In fact, the strengths of both modelsdecrease at the rate of ^"0.5 log unit per log unit of temporal frequency andtheir phases are advanced by -40° over the above values . To account for theseobservations, an additional element has to be added to both the center andsurround pathways; a suitable choice, suggested by Dr. J . G . Robson, would bea transitional lead (an element with frequency response [1 + (ir2rw)/(g + ir2rw)j, where r is a time constant, w is temporal frequency, and g is aconstant >1). With all these elements, the model still does not account for thechange in the response phase that occurs over the temporal frequency range thatwe studied, which suggests that there is another component in both pathwaysthat produces a phase delay without observable amplitude attenuation : a puredelay of ^-10-15 ms (or, equivalently, a cascade of low-pass filters with very highcorner frequencies) is a candidate for this component. A pure delay could arisefrom synaptic and transport delays ; a delay of 3-4 ms might be due to the factthat the site of recording was mainly in the optic tract in these experiments .The adequacy of our model for the center signal, complete with six first-order
low-pass filters, one second-order filter, a transitional lead, and a pure delay, isillustrated in Fig . 13, where it is fitted to a photopic temporal frequency responseof an X cell stimulated with the peak spatial frequency . The closeness of the fitbrings us to the conclusion that a model of the general form described abovecan predict our spatiotemporal frequency response measurements . That such acomplex form of model is needed doubtless reflects the sophisticated signalprocessing undertaken by the neurons in the retina .
We are grateful to Dr . John Robson for sharing his observations with us.
This work was supported by National Eye Institute (NEI) grant RO1 EY00206 to C.E.-C ., NEINew Investigator Award 5 R23 EY03738 to D.S.T ., and NEI Postdoctoral FellowshipF32EY05297 to L.J .F . A .W.F . was supported by grant F05 TW03177 from the Fogarty Centerof the National Institutes of Health, and J.B.T . was supported by NATO/SERC grant B/RF/5881 and National Science Foundation grant BNS 82-13858 .
Original version received 21 May 1986 and accepted version received 27 October 1986.
REFERENCES
Ashmore, J . F ., and D . R . Copenhagen . 1980 . Differen t postsynaptic events in two types ofretinal bipolar cell . Nature . 288:84-86 .
Baylor, D. A., M . G . F . Fuortes, and P . M . O'Bryan . 1971 . Receptive fields of cones in theretina of the turtle .Journal ofPhysiology. 214:265-294 .
Baylor, D . A ., A . L . Hodgkin, and T. D . Lamb. 1974 . Reconstruction of the electrical responsesof turtle cones to flashes and steps of light. Journal ofPhysiology . 242:759-791 .
Baylor, D . A ., G . Matthews, and B . J . Nunn . 1984 . Location and function of voltage sensitive
626
THE JOURNAL OF GENERAL PHYSIOLOGY " VOLUME 89 " 1987
conductances in retinal rods of the salamander Ambystoma tigrinum. Journal of Physiology.354:203-233 .
Blake, R., and J . M . Camisa . 1977. Temporal aspects of spatial vision in the cat . ExperimentalBrain Research. 28:325-333 .
Cleland, B . G., T . H . Harding, and U . Tulunay-Keesey. 1979 . Visual resolution and receptivefield size : examination of two kinds ofretinal ganglion cell . Science . 205 :1015-1017 .
Cleland, B . G ., and W. R . Levick,-1974 . Brisk and sluggish concentrically organized ganglioncells in the cat's retina . Journal ofPhysiology. 240:421-456 .
Dawis, S ., R . Shapley, E. Kaplan, and D. Tranchina. 1984 . The receptive field organization ofX-cells in the cat : spatiotemporal coupling and asymmetry . Vision Research. 24:549-564 .
Derrington, A . M., and P. Lennie . 1982 . The influence of temporal frequency and adaptationlevel on receptive field organization on retinal ganglion cells in cat . Journal of Physiology.333:343-366 .
Detwiler, P . B ., A . L . Hodgkin, and P . A. McNaughton . 1978 . A surprising property ofelectrical spread in the network of rods in the turtle's retina . Nature . 274:562-565 .
Detwiler, P . B., A . L. Hodgkin, and P. A. McNaughton . 1980 . Temporal and spatial charac-teristics of the voltage response of rods in the retina of the snapping turtle. Journal ofPhysiology. 300:213-250 .
Enroth, C . 1953 . Spike frequency and flicker fusion frequency in retinal ganglion cells . ActaPhysiologica Scandinavica. 29:19-21 .
Enroth-Cugell, C., T . K . Goldstick, and R . A . Linsenmeier. 1980 . The contrast sensitivity ofcat retinal ganglion cells at reduced oxygen tensions . Journal ofPhysiology. 304:59-81 .
Enroth-Cugell, C ., B . G . Hertz, and P. Lennie. 1977 . Cone signals in the cat's retina . JournalofPhysiology. 269:273-296 .
Enroth-Cugell, C ., andJ . G . Robson . 1966 . The contrast sensitivity of retinal ganglion cells ofthe cat . Journal ofPhysiology. 187:517-552 .
Enroth-Cugell, C ., J . G . Robson, D . E . Schweitzer-Tong, and A. B . Watson . 1983 . Spatio-tempora l interactions in cat retinal ganglion cells showing linear spatial summation . JournalofPhysiology. 341 :279-307 .
Enroth-Cugell, C ., and R . M . Shapley. 1973 . Adaptatio n and dynamics of cat retinal ganglioncells . Journal ofPhysiology . 233 :271-309 .
Foerster, M. H., W. A . van de Grind, and O .J . Grusser . 1977 a . Frequency transfer propertiesof three distinct types of cat horizontal cells. Experimental Brain Research . 29:347-366.
Foerster, M. H ., W . A. van de Grind, and O.J . Grusser . 19776 . The response ofcat horizontalcells to flicker stimuli of different area, intensity and frequency . Experimental Brain Research .29:367-385 .
Fuortes, M . G . F ., and A. L . Hodgkin . 1964. Change s in time scale and sensitivity in theommatidia of Limulus. Journal ofPhysiology. 172:239-263 .
Hochstein, S ., and R . M . Shapley . 1976 . Quantitative analysis of retinal ganglion cell classifi-cations.Journal ofPhysiology. 262:237-264 .
Jones, K . R ., and M. A . Berkley . 1983 . Loss of temporal sensitivity in dorsal lateral geniculatenucleus and area 18 of the cat following monocular deprivation . Journal ofNeurophysiology.49:254-268 .
Kaplan, E., S . Marcus, and Y . T . So . 1979 . Effect s of dark adaptation on spatial and temporalproperties ofreceptive fields in cat lateral geniculate nucleus . Journal ofPhysiology. 294:561-580 .
Kelly, D . H . 1974 . Spatio-temporal frequency characteristics of colour-vision mechanisms .Journal ofthe Optical Society ofAmerica. 64:983-990 .
FRISHMAN ET AL.
Spatiotemporal Frequency Responses ofCat Retina
627
Kelly, D . H . 1984 . Retinal inhomogeneity . I . Spatiotemporal contrast sensitivity . Journal oftheOptical Society ofAmerica . A 1 :107-113 .
Kirby, A. W., and D . E . Schweitzer-Tong. 1981 . GABA-antagonist s alter spatial summation inreceptive field centres of rod- but not cone-driven cat retinal ganglion Y-cells . Journal ofPhysiology . 320:303-308 .
Lederer, W. J ., A. J . Spindler, and D. A . Eisner . 1979 . Thick slurry bevelling : a new techniquefor bevelling extremely fine microelectrodes and micropipettes . Pflugers Archiv . 381:287-288 .
Lennie, P . 1980 . Perceptual signs of parallel pathways. Philosophical Transactions of the RoyalSociety ofLondon, Series B. 290:23-37.
Levick, W. R . 1972. Another tungsten microelectrode . Medical Biologyand Engineering. 10:510-515 .
Linsenmeier, R . A ., L . J . Frishman, H . G . Jakiela, and C . Enroth-Cugell . 1982 . Receptive fieldproperties of X and Y cells in the cat retina derived from contrast sensitivity measurements .Vision Research . 22:1173-1183 .
Loop, M. S ., and M. A . Berkley . 1975 . Temporal modulation sensitivity of the cat . 1 . Behavioralmeasures . Vision Research . 15:555-561 .
Maffei, L ., L . Cervetto, and A. Fiorentini . 1970 . Transfer characteristics of excitation andinhibition in cat retinal ganglion cells.Journal ofNeurophysiology. 33:276-284 .
Marcus, S . 1979 . Effects of contrast and spatial configuration upon the tuning characteristicsof cat retinal and LGN cells . Ph.D. thesis . The Rockefeller University, New York . 222 pp .
Molenaar, J ., W . A . Van de Grind, and R. Eckhorn . 1983 . Dynamic properties ofcat horizontalcell light responses. Vision Research. 23:257-266 .
Movshon, J . A ., 1 . D . Thompson, and D . J . Tolhurst . 1978 . Spatia l and temporal contrastsensitivity of neurons in areas 17 and 18 of the cat's visual cortex . Journal of Physiology .283:101-120.
Ogawa, T., P. O . Bishop, and W. R. Levick . 1966 . Temporal characteristics of responses tophotic stimulation by single ganglion cells in the unopened eye of the cat . Journal ofNeurophysiology. 29:1-30 .
Pettigrew, J . D ., M . L . Cooper, and G . G . Blasdel. 1979 . Improved use of tapetal reflection foreye-position monitoring . Investigative Ophthalmology and Visual Science . 18:490-495 .
Ratliff, F ., B . W . Knight, and N . Milkman . 1970 . Superposition of excitatory and inhibitoryinfluences in the retina of Limulus: effect of delayed inhibition . Proceedings of the NationalAcademy ofSciences . 67:1558-1564 .
Robson, J . G . 1966 . Spatial and temporal contrast sensitivity functions of the human visualsystem . Journal ofthe Optical Society ofAmerica . 56:1141-1142 .
Rodieck, R . W . 1965 . Quantitative analysis ofcat retinal ganglion cell response to visual stimuli .Vision Research. 5:583-601 .
Schweitzer-Tong, D . E . 1983 . The photoneuromine: an artificial visual neuron for dynamictesting ofcomputer-controlled experiments . Behavioral Research Methods and Instrumentation .15:9-12 .
Shapley, R . M ., and J . D . Victor . 1978 . The effect of contrast on the transfer properties of catretinal ganglion cells .Journal ofPhysiology. 285:275-298 .
So, Y . T ., and R . Shapley . 1981 . Spatial tuning of cells in and around the lateral geniculatenucleus of the cat: X and Y relay cells and perigeniculate interneurons . Journal of Neuro-physiology. 45 :107-120 .
Stone,J ., and Y . T . Fukuda . 1974 . Propertie s of cat retinal ganglion cells : a comparison of W-cells with X- and Y-cells .Journal ofNeurophysiology. 37:722-748 .
628
THE JOURNAL OF GENERAL PHYSIOLOGY " VOLUME 89 - 1987
Torre, V., and W. G . Owen . 1981 . Ionic basis of high-pass filtering of small signals by thenetwork of retinal rods in the toad . Proceedings of the Royal Society of London, Series B .212:253-261 .
Tranchina, D., J . Gordon, and R . M . Shapley . 1984 . Retina l light adaptation : evidence for afeedback mechanism . Nature. 310:314-316 .
Troy,J . B . 1983 . Spatio-temporal interaction in neurones of the cat's dorsal lateral geniculatenucleus.Journal ofPhysiology. 344:419-432 .
Virsu, V ., J . Rovamo, P . Laurinen, and R . Nasanen . 1982 . Temporal contrast sensitivity andcortical magnification . Vision Research . 22:1211-1217 .


![1995 Agenda Llatinoamericana [cat]](https://img.pdfslide.net/doc/110x75/63602831ef4a3767a80c1858/1995-agenda-llatinoamericana-cat.jpg)


