Embed Size (px)
Citation preview

SPE-184324-MS
Sensitivity Analysis of a Single Mixed Refrigerant Liquefaction Process ofNatural Gas
D. C. Una, and M. K. Oduola, Centre for Gas, Refining and Petrochemicals, University of Port Harcourt;B. S. Odagme, University of Port Harcourt, Centre for Gas, Refining and Petrochemicals, University of PortHarcourt
Copyright 2016, Society of Petroleum Engineers
This paper was prepared for presentation at the SPE Nigeria Annual International Conference and Exhibition held in Lagos, Nigeria, 2–4 August 2016.
This paper was selected for presentation by an SPE program committee following review of information contained in an abstract submitted by the author(s). Contentsof the paper have not been reviewed by the Society of Petroleum Engineers and are subject to correction by the author(s). The material does not necessarily reflectany position of the Society of Petroleum Engineers, its officers, or members. Electronic reproduction, distribution, or storage of any part of this paper without the writtenconsent of the Society of Petroleum Engineers is prohibited. Permission to reproduce in print is restricted to an abstract of not more than 300 words; illustrations maynot be copied. The abstract must contain conspicuous acknowledgment of SPE copyright.
Abstract
The demand for greater efficiency and large capacity for liquefaction process is inevitable for optimiza-tion. This study presents the sensitivity analysis of the factors that affects liquefaction processes of naturalgas. Some of these factors are the natural gas pressure, temperature and composition on the single mixedrefrigerant liquefaction process was simulated using ASPEN HYSYS 8.6 software. The effects of theseparameters on specific power, power consumption and refrigerant flow rate of the process were simula-tions and examined. At constant pressure, temperature decreased from 15 to 5°C resulted in a 15%decrease in specific power and an increase from 15 to 25 °C resulted to 40% increase. At constanttemperature, a decrease in natural gas pressure from 60 to 30bar and increase in specific power from 0.387to 0.452 kWh/kg-LNG was observed which amounts to a 16.80% increase and when increased from 60to 90bar specific power decreases from 0.387 to 0.348kWh/kg-LNG about 10.08 % decrease. Thus, whennatural gas is supplied at a given pressure and temperature, a decrease in supply pressure will increasepower consumption and an increase in supply pressure will decrease power consumption. The usefulexergy for the system was about 26% of the total energy (46.42MW) available, indicating that about 74%of energy supplied by the compressor ended up as losses in different components in the processliquefaction cycle. However, the largest loss occurred in LNG heat exchanger and cooler which were to25 and 24% respectively. The simulation results showed that, natural gas supplied at 150MMScf, 60barand 15°C gave rise to LNG production of about 0.95MTPA.
IntroductionThe global energy demand is increasing and the natural gas (NG) has obtained relevance as a clean fuel.At distances greater than 4000 km from the source of production, the most profitable way of transportationfor the NG is as liquefied natural gas (LNG). Between years 2000-2010 the natural gas consumptionincreased 31.4% and LNG represents 30.5% of the global NG trade in 2010 (Shahrooz et al, 2012). Witha world market in full development and a global perspective with a strong trend towards globalization andfree trade, it is evident the importance of gas liquefaction processes.

LNG is obtained when the NG is cooled until its bubble point (or even below) at atmospheric pressure,which corresponds to -161°C. At this point, its density is 55% lower than the water and its volume isreduced 600 times (Sultan, 2011). The volume reduction favours not only the transport (using LNGcarriers) but also the storage in tanks.
Liquefaction of natural gas is purely based on the principle of refrigeration that is applying thermo-dynamic refrigeration cycle where a refrigerant by means of successive expansion and compressionfunctions, transport heat from the process side. Liquefied natural gas (LNG) plants are large refrigeratorswhich use pure refrigerants (propane) and mixed refrigerants (methane, ethane, propane and nitrogen) tocool and liquefy the natural gas stream serving as feed to the process plant.
The appropriate production of LNG with least energy consumed and maximum efficiency is veryimportant. LNG is often regarded as relatively clean source of energy. During the preparation process,about 500kWh energy/t of LNG is consumed for compression and liquefaction where a considerableportion of the invested exergy is preserved in the product with a final temperature of about -161°C whichis much lower than the ambient temperature and seawater temperature (Shahrooz et al, 2012). Liquefac-tion process reduces LNG volume 600-fold which makes transportation to long distance convenient. Withincreasing demand for cleaner fuels, LNG has become more significant as energy resource. Exergy andenergy efficiency are important to LNG production as feed gas is consumed for the liquefaction process.
Single mixed refrigerant process for LNG production is considered in this study because it is one ofthe simplest and most basic processes currently in operation in the industry. It has higher efficiency, beingcurrently in operation in onshore LNG production plants and also has higher production capacity per train.But the challenges are they are sensitive to changes in feed gas conditions as they rely on smalltemperature differences between the composite cooling and warming streams to give reasonable processefficiency.
The mixed refrigerant used in this process contains methane, ethane, propane, pentane and nitrogen.Mixed refrigerant is compressed and passes through the main exchanger where it is condensed. It is thenexpanded across a Joule-Thomson valve and evaporated as it returns counter-currently through theexchanger back to the compressor. SMR process is simple and requires small equipment number but itscapacity is limited to 1.2 MTPA per train, though the setup reduces capital costs significantly. There isa considerable amount of refrigerant used in the process to facilitate the cooling of the natural gas whichleads to a lot of compression work needed. Its low production capacity can be considered a disadvantagebecause more trains will be required to produce in high capacities.
Production of LNG demands greater efficiency and large capacity for liquefaction processes, thermo-dynamic analysis on the liquefaction process must be performed. Entropy generation due to temperaturedifference between feed natural gas and refrigerants flow in LNG heat exchangers must be determined andreduced in order to lower input power requirement. For these challenges to be determined and solved,sensitivity analysis must be carried out on different process parameters.
This study aims at carrying out a sensitivity analysis of the SMR liquefaction process and establishesa benchmarking of the process considering exergy analysis and process design. Sensitivity analysis willconsider the effects of various parameters such as natural gas pressure, temperature and composition ontotal energy consumption Exergy analyses will also be performed to determine the locations, types ofenergy loss, energy consumed during LNG production process and ways to reduce such losses in orderto achieve greater energy system efficiency.
Single mixed refrigerant liquefaction process was simulated using Peng- Robinson equation of state ofAspen Hysys 6.0. The sensitivity and exergy analysis will be limited to only Single mixed refrigerantliquefaction process. Major plant equipment such as the compressors, heat exchangers will also beanalysed to determine where most exergy losses occur. With the aid of this analysis, the potential forimproving the thermodynamic efficiency of components and the overall system as well as the interactionsamong components and their effect on the exergy destruction within each component will be estimated.
2 SPE-184324-MS

Liquefied Natural Gas Production ProcessGenerally natural gas liquefaction plants consist of two main sections, pre-treatment and liquefaction
1. Pre-treatment of natural gasPrior to liquefaction natural gas often has to be pre-treated. Such pre-treatment typically consistsof mercury removal, gas sweetening and drying. Depending on the downstream processing stepsand the concentration of the sour gas components, it may be necessary to remove H2S and CO2
from the natural gas.2. Liquefaction of natural gas
Liquefaction of gas is done by refrigerating the gas to the temperature below its critical conditions.Natural gas has a critical point at -80 to -90°C and its liquefaction cannot be done by pressurizationand expansion alone (Shukri, 2007). The process requires a refrigeration cycle that removes energyfrom natural gas in the form of sensible and latent heat. Selection of best refrigeration cycle forliquefaction of natural gas can be done after thorough study of local conditions. The simplifiedtypical natural gas liquefaction process consists of a cooling water condenser, expander, main heatexchanger, compressor and a gas turbine driver. The refrigerant is compressed in the compressorto a high pressure at which it can be condense at the cooling water temperature in the condenser.The pressure of the refrigerant is then let down in an expander or flash valve to a low pressure.Its temperature also decreases as a result of reduction in pressure. The refrigerant is sent throughthe main heat exchangers where it cools and liquefies the natural gas to produce LNG (Frank etal, 2008)
Exergy Analysis of Natural Gas Liquefaction ProcessExergy analysis is described as thermodynamic analysis technique that is based on the second law ofthermodynamic providing alternative way of assessing and comparing thermodynamic processes realis-tically and significantly. Exergy analysis gives information which on how the actual performance of athermodynamic system reaches an ideal state. It shows thermodynamic losses also and the effect of builtenvironment on natural environment. Exergy analysis can describe how to design more energy efficientsystems by reducing different thermodynamic losses in the system (Kanoglu, 2010).
The exergy or useful available work, of a stream is therefore expressed as (Remeljeja, 2004),
1
The major losses are within the compression system (Compressors), heat transfer in heat exchangers(LNG heat exchanger and after coolers), losses due to refrigerant let-down and super heating of refrigerant(compressor discharge temperature). The losses can be categorized in three groups; heat transfer losswhich includes losses in LNG heat exchangers and after coolers, process losses & compressor losses(Remeljeja, 2004)
Basis For Simulation of SMR Liquefaction ProcessThe simulation was aimed at obtaining an optimal efficient process based on the simulated constraints.The processes were simulated based on the assumptions on Table 1.0.
Table 1.0—Natural Gas and SMR inlet temperature, pressure and flow rate
PARAMETER INLET TEMP. (°C) INLET PRESSURE (Bar) FLOW RATE (MMSCFD)
Natural Gas 15.0 60.0 150.0
Single MixedRefrigerant
15.0 30.0 530.0
SPE-184324-MS 3

Molar fractions of natural gas composition used in the simulation of thermodynamic parameters of theliquefaction process are presented in Table 2.0 and it’s the reference composition. The other compositionused to analyze the effect of natural gas composition on the proposed liquefaction processes for LNGSMR process are presented in Table (3.0 to 7.0) and termed as Composition A to E.
The effects of natural gas pressure, temperature and composition on the proposed Natural gasliquefaction process were investigated in the simulation. During the simulations the effects were analyzedby examining specific power, energy consumption and refrigerant flow rate of the process.
The process was simulated using the mass and energy balance software, Hysys with the Peng–Robinson equation of state. The refrigerant composition is as given in Table 8.0 which comprises mainlymethane and ethane.
Table 2.0—Natural Gas Composition Reference
Component C1 C2 C3 iC4 nC4 N2 CO2
Mole fraction 0.90043 0.07321 0.00346 0.000008 0.000001 0.0229 0.000005
Table 3.0—Natural gas Composition A
Component C1 C2 C3 iC4 nC4 N2 CO2
Mole fraction 0.9146 0.0570 0.0129 0.00000 0.0020 0.0133 0.000005
Table 4.0—Natural gas Composition B
Component C1 C2 C3 iC4 nC4 N2 CO2
Mole fraction 0.8738 0.067 0.035 0.006 0.009 0.005 0.000005
Table 5.0—Natural gas Composition C
Component C1 C2 C3 iC4 nC4 N2 CO2
Mole fraction 0.97 0.008 0.013 0.003 0.004 0.002 0.000005
Table 6.0—Natural gas Composition D
Component C1 C2 C3 iC4 nC4 N2 CO2
Mole fraction 0.88 0.06 0.03 0.005 0.005 0.02 0.000005
Table 7.0—Natural gas Composition E
Component C1 C2 C3 iC4 nC4 N2 CO2
Mole fraction 0.82 0.112 0.04 0.012 0.009 0.007 0.000005
Table 8.0—SMR process Refrigerant composition
Component C1 C2 C3 iC4 nC4 N2 Total
Mole fraction 0.42 0.31 0.01 0.17 0.11 0.11 1.0
4 SPE-184324-MS

SMR Simulation ProcessThe single mixed refrigerant (SMR) process with single compressor was simulated and the effect ofnatural gas pressure, temperature and composition on the processes analyzed also useful exergy andexergy losses on the process are determined. The process flow diagram of the simulated SMR is presentedin Figure 1.0 using the properties as given on Table 1.0
Based on the selected patent conditions and parameters, the liquefaction process was built on Hysysusing natural gas with composition presented in Table-1 and supplied at pressure of 60bar, temperatureof 15°C and flow rate of 150 mmscfd. The process was optimized by varying refrigerant flow rate toobtain the proposed minimum approach temperatures and LMTD. After optimization of the processes thekey parameter recorded were �UA� values of LNG heat exchangers, power consumption, refrigerant flowrate and specific power. The simulated process based on above conditions was taken as benchmark duringvariation of other parameters to analyse the effect of pressure, temperature and composition on theprocess.
The calculated �UA� value of all LNG heat exchangers was kept constant during variation of naturalgas pressure, temperature and composition. The reason for keeping the calculated �UA� value constant isthat, in real plant the designed �UA�of LNG heat exchanger cannot be changed unless you modify orreplace heat exchanger. The optimization of processes was performed by varying refrigerant flowrate andrefrigerant evaporating pressure to ensure�UA�values of LNG heat exchangers are kept constant as in thebenchmarked process.
Effect of Natural Gas Temperature To analyze the effect of natural gas temperature on the bench-marked process, the temperature of natural gas was varied between (5°C) and 30°C) and the effect ofnatural gas temperature on specific power, power consumption and refrigerant flow rate when natural gasis supplied at 60bar was determined and presented in graphs. The same procedure was done to analyse thesame effects when natural gas is supplied at different pressures between (20 and 150bar).
Effect of Natural Gas Pressure, Specific Power, Power Consumption and Refrigerant Flow Rate Inother to analyse the effect of natural gas pressure, simulation started by supplying natural gas at atemperature of 15°C and varying natural gas pressure between 20 and 150bar, the graphs showing itseffect on specific power, power consumption and refrigerant flow rate are drawn and presented in resultsection of each process.
Figure 1.0—Simulation of the Single Mixed Refrigerant process flow
SPE-184324-MS 5

The same procedure was performed to analyse the same effects when natural gas is supplied at differenttemperatures (between 5 and 30°C) and for each temperature natural gas pressure was varied between 10and 150bar and its effect on specific power, power consumption and refrigerant flow rate was determinedand presented in graphs in result section.
The effect of natural gas composition on processes has been analysed. The compositions were analysedby looking at its effect on process power consumption, refrigerant flow rate and specific power. Allcompositions were analysed by supplying natural gas at 60bar, 15°C and molar flowrate of 150mmscfd.
Results and Discussion
Effect of Natural Gas Temperature on Smr Process
1. The effect of natural gas temperature on specific powerConsidering 15°C as reference point, the graph shows the effect of natural gas temperature onspecific power supplied at 60bar. It can be deduced that at given natural gas pressure andtemperature, an increase in natural gas supply temperature increases specific power and a decreasein natural gas supply temperature decreases specific power.
When Natural gas temperature was decreased from 15 to 5°C, SMR process specific powerdecreased from 0.39 to 0.33kWh/kg-LNG, this amounts to 15% decrease. When the natural gassupply temperaturewas increased from 15 to 25°C, its specific power increased from 0.39 to 0.54kWh/kg-LNG which amounts to 40% increase.
2. The effect of natural gas temperature on power consumptionThe graph on figure 3.0 shows that when natural gas supplytemperature decreases from 15 to 5°C,SMR process power consumption decreasesfrom 46.4 to 39.4 MW which amounts to a 15.10%decrease and when supply temperature increases from 15 to 25°C, its power consumption increasesfrom 46.4 to 64.2 MW which amounts to a 39.19% increase.
Figure 2.0—The effect of natural gas temperature on specific power at 60bar
6 SPE-184324-MS
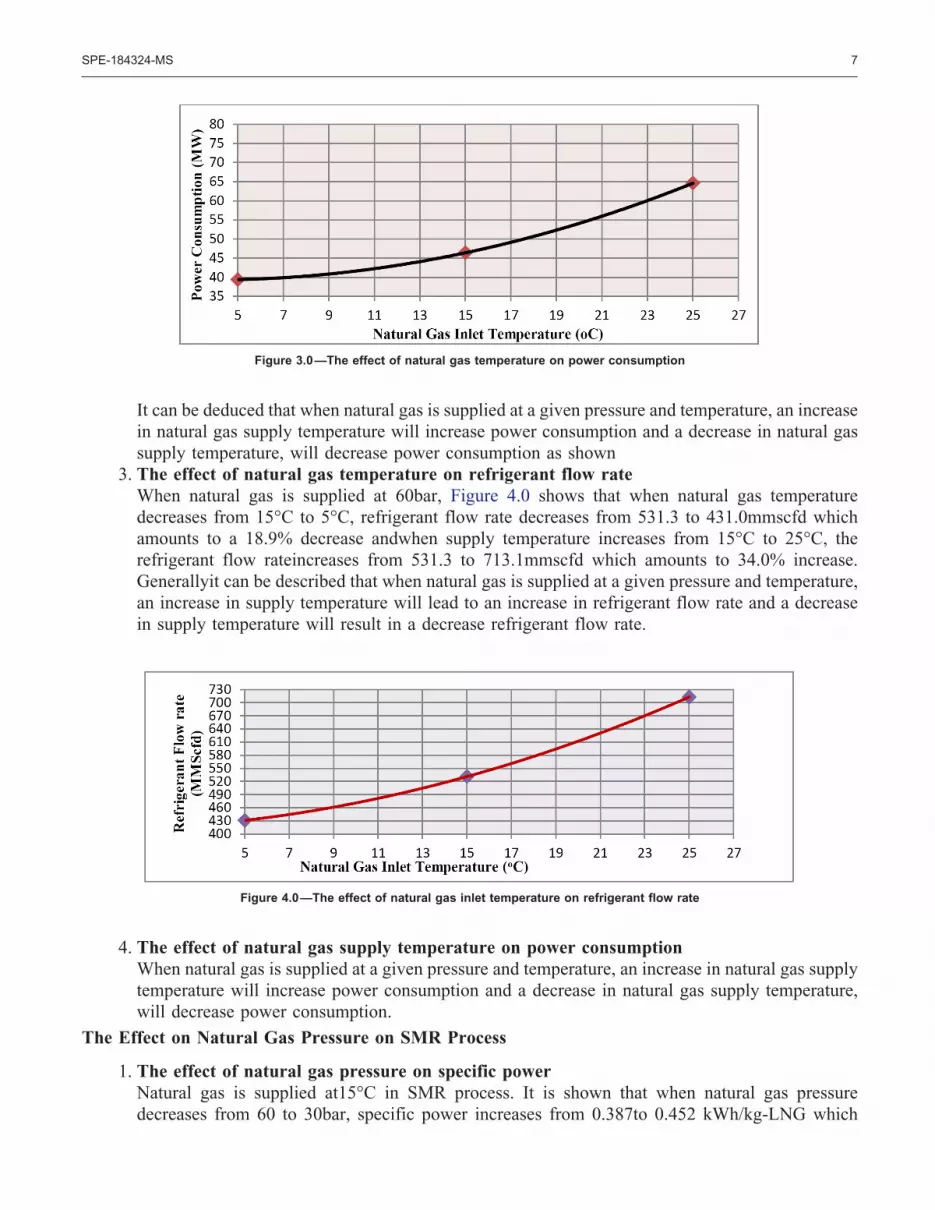
It can be deduced that when natural gas is supplied at a given pressure and temperature, an increasein natural gas supply temperature will increase power consumption and a decrease in natural gassupply temperature, will decrease power consumption as shown
3. The effect of natural gas temperature on refrigerant flow rateWhen natural gas is supplied at 60bar, Figure 4.0 shows that when natural gas temperaturedecreases from 15°C to 5°C, refrigerant flow rate decreases from 531.3 to 431.0mmscfd whichamounts to a 18.9% decrease andwhen supply temperature increases from 15°C to 25°C, therefrigerant flow rateincreases from 531.3 to 713.1mmscfd which amounts to 34.0% increase.Generallyit can be described that when natural gas is supplied at a given pressure and temperature,an increase in supply temperature will lead to an increase in refrigerant flow rate and a decreasein supply temperature will result in a decrease refrigerant flow rate.
4. The effect of natural gas supply temperature on power consumptionWhen natural gas is supplied at a given pressure and temperature, an increase in natural gas supplytemperature will increase power consumption and a decrease in natural gas supply temperature,will decrease power consumption.
The Effect on Natural Gas Pressure on SMR Process
1. The effect of natural gas pressure on specific powerNatural gas is supplied at15°C in SMR process. It is shown that when natural gas pressuredecreases from 60 to 30bar, specific power increases from 0.387to 0.452 kWh/kg-LNG which
Figure 3.0—The effect of natural gas temperature on power consumption
Figure 4.0—The effect of natural gas inlet temperature on refrigerant flow rate
SPE-184324-MS 7

amounts to a 16.80% increase and when natural gaspressure increases from 60 to 90bar specificpower decreases from 0.387 to 0.348kWh/kg-LNG which amounts to a 10.08 % decrease.
Generally, when natural gas is supplied at a given pressure and temperature, specific power willincrease when supply pressure decreases and decrease when supply pressure increases.
2. The effect of natural gas pressure on power consumptionThe effect of NG pressure on power consumption when natural gas is supplied at 15°C in SMRprocess as shows that when natural gas is supplied at a given pressure and temperature, a decreasein supply pressure will increase power consumption and an increase will decrease power con-sumption.
3. The effect of natural gas pressure on refrigerant flow rate.The effect of NG pressure on refrigerant flow rate when natural gas is supplied at 15°C shows thata decrease in supply pressure will increase refrigerant flow rate and an increase in supply pressurewill decrease refrigerant flow rate.
Figure 5.0—The effect of natural gas pressure on specific power when natural gas supplied at inlet temperature of 15°C
Figure 6.0—The effect of natural gas pressure on power consumption when natural gas supplied at inlet temp. of 15°C
8 SPE-184324-MS

When natural gas pressure decreases from 60 to 30bar, the refrigerant flow rate increases from531.3 to 554.7mmscfd which amounts to a 4.42% increase and when natural gas pressure increasesfrom 60 to 90bar, refrigerant flow rate decreases from 531.3to 505.6mmscfd which amounts to a4.9% decrease.
The Effect of Natural Gas Composition
1. The effect of natural gas composition on specific power and power consumptionThe natural gas composition used for simulating the benchmarked process is termed as compo-sition-reference and its results were used as reference point to the other compositions. Table 9.0shows the effect of composition on specific power. The effect may be an increase or a decreaseon the specific.
The measures to decrease the exergy losses of the LNG heat exchangers mainly include increasing heattransfer area and recovering cold energy. This study utilized an optimized process for its exergy losscalculation on the heat exchanger.
The amount of useful energy in megawatt (MW) and losses are presented in Table 10.0.
Figure 7.0—The effect of natural gas pressure on refrigerant flow rate
Table 9.0—The effect of natural gas composition on specific power & Power Consumption
CompositionSpecific power(kWh/kg-LNG) Power Consumption
Composition-Reference 0.386 46.42
Composition A 0.383 46.68
Composition B 0.366 48.58
Composition C 0.385 45.95
Composition D 0.376 47.80
Composition E 0.355 49.85
Table 10.0—Distribution of exergy Losses and useful exergy
Total Exergy Supplied 46.42 MW
Useful Exergy 12.34 MW
Compressor losses 8.44 MW
LNG HE Losses 11.91 MW
Cooler Losses 11.41 MW
Valve losses 2.32 MW
SPE-184324-MS 9

The useful exergy and distribution of exergy losses on different components in the process are asshown in figure 4.8, useful exergy accounts for about 26% which indicates that about 74% of energysupplied by the compressor end up as losses in different components in the process liquefaction cycle. Thelargest loss occurs in LNG heat exchanger and cooler which amountsto 25 and 24% respectively
Exergy Analysis for Single Mixed Refrigerant ProcessComposite curve is often employed to analyse the multi-flow heat exchanger. All of the heat flows in themulti-flow heat exchanger are expressed by hot composite curve while all of the cold flows are expressedby the cold composite curve. The exergy loss of the multi-flow heat exchanger is reflected by thetemperature difference between the hot and cold composite curves. The exergy losses will increase withthe raising of the temperature difference between the hot and cold composite curves. The hot and coldcomposite curves for the LNG heat exchanger is expressed in Figure 8.0 and 9.0
Figure 8.0—Hot and cold composite curves for LNG HE for NG @ 15°C and SMR @ 5°C
Figure 9.0—Hot and cold composite curves for LNG HE for NG@ 30°C and SMR @ 5°C
10 SPE-184324-MS

Temperature difference between the hot and cold composite curves of Figure 8.0 is small whencompared to the temperature differences between the hot and cold composite curves of Figure 9.0. Itindicates that the exergy loss of Figure 8.0 is larger than that of Figure 9.0
It is evident from 10.0 that reducing the losses in the compression equipment and the associated aftercoolers would produce the greatest effect in decreasing the total losses of this liquefaction process. Themain measures to decrease the loss of the compressor consist of adopting multi-stage compression andassociated after cooling, selecting reasonable inlet parameters and compression ratio for the compressor.With multi-stage compression, the outlet temperature of the compressors is decreased and thus thetemperature difference of heat transfer in the after coolers is smaller. The exergy loss of the cooler isdecreased because of the reduced temperature difference of heat transfer.
Conclusions
1. Natural gas supply temperature and pressure has significant impact on liquefaction process. Theimpacts may be positive or negative depending on increase or decrease of supply temperature orpressure. The impacts of these parameters on the process’s specific power, power consumptionaffects the overall energy demand/consumption for liquefaction process.
2. At a given natural gas pressure and temperature, an increase in natural gas supply temperatureincreases specific power and a decrease in natural gas supply temperature decreases specificpower. An increase in natural gas supply temperature will increase power consumption and adecrease in natural gas supply temperature, will decrease power consumption.
3. When natural gas is supplied at a given pressure and temperature, specific power will increasewhen supply pressure decreases and specific power will decrease when supply pressure increases.Likewise, a decrease in supply pressure will increase power consumption and an increase in supplypressure will decrease power consumption.
4. The analysis of the effect of natural gas composition shows that a change in natural gascomposition may lead to increase or decrease of processes specific power, power consumptions orrefrigerant flow rates.
Figure 10.0—Distribution of Exergy losses on different components and useful exergy
SPE-184324-MS 11

5. Energy efficiency is important to LNG production as feed gas is consumed in order to carry outthe liquefaction process. The exergy analysis of the proposed process shows that shows that usefulexergy accounts for about 26% which indicates that about 74% of energy supplied by thecompressor end up as losses in different components in the process liquefaction cycle. The largestloss occurs in LNG heat exchanger and after-cooler (cooler) which amounts to 25 and 24%respectively.
ReferencesFrank D, Jin-kuk K. Simon P. & Robin S. (2008). Optimal design of mixed refrigerant cycles. Manchester.Kanoglu M. & Ibrahim D. (2010). Refrigeration Systems and Applications. Ontario: John Wiley & Sons.Remeljeja C. & Hoadly A. (2004). An exergy analysis of small-scale liquefied Natural gas (LNG) liquefaction processes.
Australia.Shahrooz A, Bezhan S. & Majid S. (2012). Thermodynamic Analysis of Liquified natural Gas (LNG) proroduction cycle
in APCI process. Journal of Thermal Science, (pp. 1–2)Shukri M. (2007). Single mixed refrigerant process has appeal for growing offshore market. LNG Journal.Sultan P. (2011). Sensitivity Analysis of Proposed LNG liquefaction Processes for LNG FPSO. Norway: Norwegian
University of Science and Technology.
12 SPE-184324-MS


