Embed Size (px)
Citation preview
Species richness and exotic species invasion in middle Tennesseecedar glades in relation to abiotic and biotic factors1
M. Shea Cofer2, Jeffrey L. Walck3, and Siti N. HidayatiDepartment of Biology, Middle Tennessee State University, Murfreesboro, TN 37132
COFER, M. S., J. L. WALCK, AND S. N. HIDAYATI (Department of Biology, Middle Tennessee StateUniversity, Murfreesboro, TN 37132). Species richness and exotic species invasion in middle Tennessee cedarglades in relation to abiotic and biotic factors. J. Torrey Bot. Soc. 135: 540–553. 2008.—Abiotic factors,particularly area, and biotic factors play important roles in determining species richness of continentalislands such as cedar glades. We examined the relationship between environmental parameters and speciesrichness on glades and the influence of native species richness on exotic invasion. Field surveys of vascularplants on 40 cedar glades in Rutherford County, Tennessee were conducted during the 2001–2003 growingseasons. Glades were geo-referenced to obtain area, perimeter, distance from autotour road, and degree ofisolation. Amount of disturbance also was recorded. Two-hundred thirty two taxa were found withAndropogon virginicus, Croton monanthogynus, Juniperus virginiana, Panicum flexile, and Ulmus alata presenton all glades. The exotics Ligustrum sinense, Leucanthemum vulgare, and Taraxacum officinale occurred onthe majority of glades. Lobelia appendiculata var. gattingeri, Leavenworthia stylosa, and Pediomelumsubacaule were the most frequent endemics. Richness of native, exotic and endemic species increased withincreasing area and perimeter and decreased with increasing isolation (P # 0.03); richness was unrelated todistance to road (P $ 0.20). Perimeter explained a greater amount of variation than area for native andexotic species, whereas area accounted for greater variation for endemic species. Slope of the relationshipbetween area and total richness (0.17) was within the range reported for continental islands. Disturbed gladescontained a higher number of exotic and native species than nondisturbed ones, but they were larger (P #
0.03). Invasion of exotic species was unrelated to native species richness when glade size was statisticallycontrolled (P 5 0.88). Absence of a relationship is probably due to a lack of substantial competitiveinteractions. Most endemics occurred over a broad range of glade sizes emphasizing the point that glades ofall sizes are worthy of protection.
Key words: competition, disturbance, diversity-resistance hypothesis, endemic species, stress.
Area is one of the most influential aspects in
species richness of continental and oceanic
islands (MacArthur and Wilson 1967). Other
factors, such as habitat heterogeneity, eleva-
tion, isolation, or disturbance, are important
as well but are often closely correlated with
area (Fox and Fox 2000). Some studies have
partitioned species into categories to examine
the role abiotic factors play in determining
richness of endemic vs. nonendemic, specialist
vs. generalist, or exotic vs. native species
(Krauss et al. 2004). For example, Moody
(2000) found that native, exotic, and endemic
species richness increased with island size.
However, the variance that remained after
consideration of island size was explained
largely by island isolation for native species
but weakly so for endemic and exotic ones.
On the other hand, species richness of
habitats also can be influenced by the invasion
of species, especially exotic ones. The number
of exotic species establishing in a community
often is dependent on native species richness
(Herben et al. 2004). Ecological models predict
that stressful (nonproductive) environments
harboring high endemism, such as cedar
glades, might easily be invaded by exotics
(Huston 1994, Bruno et al. 2003), and
empirical evidence on non-rock outcrop com-
munities supports this contention (Borges et
al. 2006, Seabloom et al. 2006). Community
invasibility is commonly assessed by examin-
ing the relationship of native vs. exotic species
richness (Herben et al. 2004).
Cedar glades are natural openings in the
eastern deciduous forest biome, where calcar-
1 Although the research described in this articlehas been funded in part by the United StatesEnvironmental Protection Agency through grant/cooperative agreement 832331 to JLW, it has notbeen subjected to the Agency’s required peer andpolicy review and therefore does not necessarilyreflect the views of the Agency and no officialendorsement should be inferred. Additional fundingwas provided by the Faculty Research and CreativeActivity Grant Program at Middle Tennessee StateUniversity.
3 Author for correspondence. Email: [email protected]
2 We appreciate T. Sutarso for statistical advice.The kind assistance of T. Hogan and K. Hurt(Stones River National Battlefield) is gratefullyacknowledged.
Received for publication June 7, 2007, and inrevised form April 1, 2008.
Journal of the Torrey Botanical Society 135(4), 2008, pp. 540–553
540
eous bedrock is at or near the soil surface. The
vegetation of glades consists of the following
assemblages: 1) C4 summer annual grasses, 2)
C3 winter annual, summer annual, and/or
perennial herbaceous dicots, 3) cryptogams, or
4) some combination of these groups. Twenty-
one plant taxa are endemic or nearly so to
them (Quarterman 1989, Baskin and Baskin
1999, 2003). The glade environment is charac-
terized by full sunlight, high soil moisture in
winter, summer drought, soil-depth controlled
vegetation zonation, and substrate-controlled
soil chemistry (Ware 2002). Due to shallow
soil, woody plant establishment is limited
except for deep soil pockets in crevices of the
bedrock. As such, cedar glades are continental
islands containing long-persisting (edaphic
climax) plant communities.
With regards to cedar glades, no study has
examined species richness in relation to area or
other abiotic factors. The few studies conduct-
ed on other rock outcrop communities have
shown that 1) area is an important factor in
species richness, and 2) the slope of the
species-area curve may differ between total
vs. specialist species (Wyatt and Fowler 1977,
Redei et al. 2003, also see Harrison et al.
2006). Moreover, no study heretofore has
examined the interplay between exotic inva-
sion and native species richness on a rock
outcrop community. Cedar glades are defined
by edaphic characteristics, and sources of
variability that may influence species richness
are relatively limited: size (area and perimeter),
isolation, and disturbance (both on-site and
distance from a road). On the other hand,
properties about the edge vs. center of cedar
glades also may be important with respect to
what kind of plants can invade them and to
the persistence of characteristics that maintain
them as cedar glades.
To this end, we compiled lists of species
from a set of cedar glades in the Central Basin
of Tennessee. This region is ideal for a study
on species richness since cedar glades are very
numerous and it is one of the six hotspots of
endemism in southeastern United States (Ba-
skin and Baskin 1999, Estill and Cruzan 2001).
Species were partitioned for analyses based on
nativity, endemism, growth habit and herba-
ceous life cycle. Environmental parameters
(size, degree of isolation, amount of distur-
bance, distance from a road) also were
recorded. From this data set, four aspects of
species richness on cedar glades were ad-
dressed. First, we examined the frequency of
species found among the glades, paying
specific attention to exotic ones. Second, we
analyzed the relationship between species
richness and environmental parameters. Third,
the influence of native species richness on
exotic invasion on glades was assessed. And
fourth, we determined the dependence of
endemic species for certain sizes of glades.
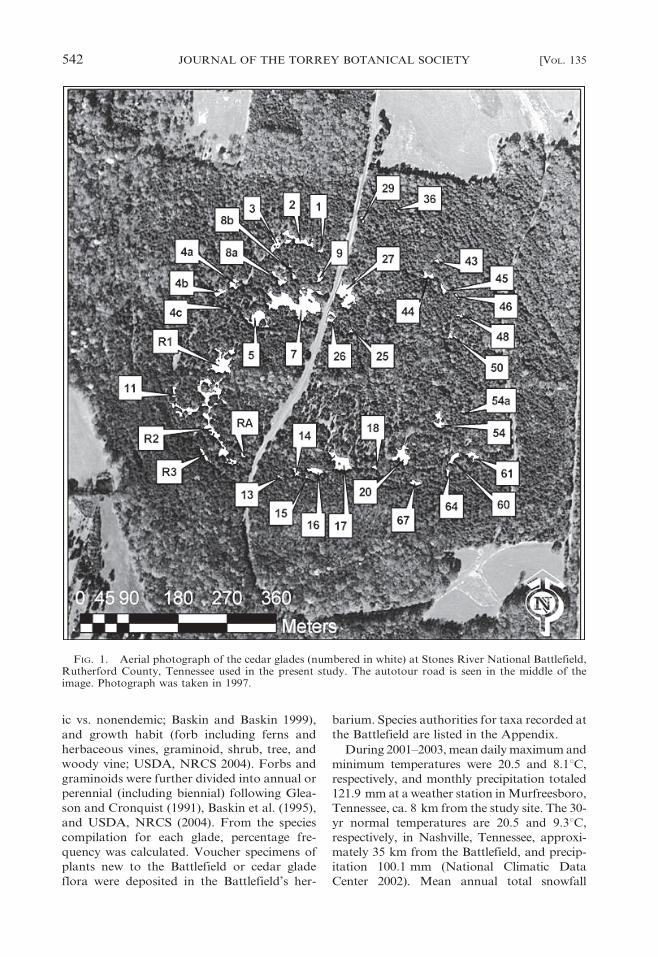
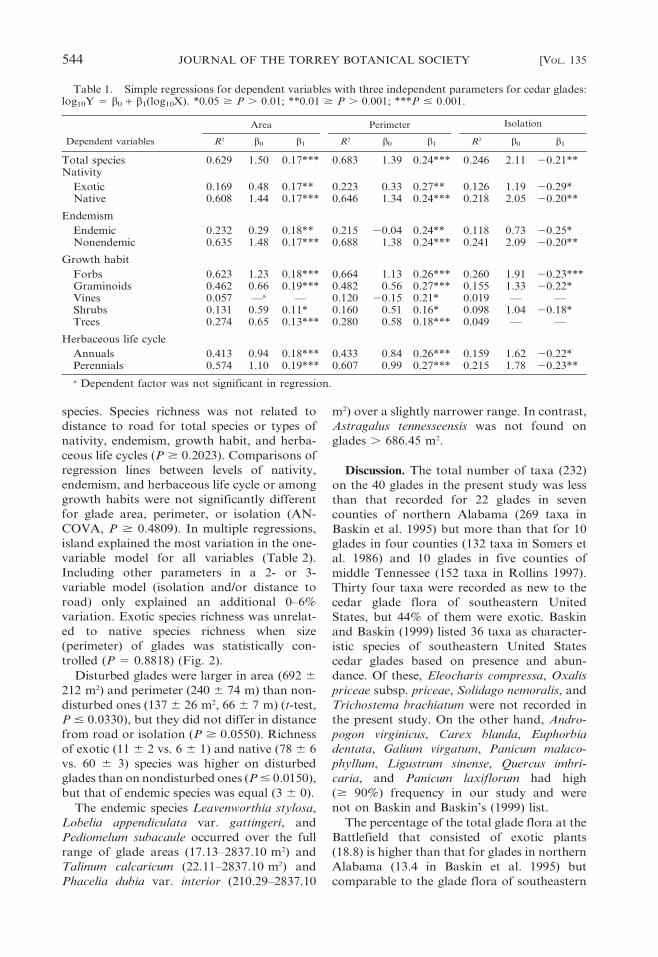
Materials and Methods. STUDY SITE. The
main area of the Stones River National
Battlefield, hereafter referred to as the Battle-
field, in Rutherford County, Tennessee con-
sists of oak-hickory and red cedar forests with
many cedar glades. The Battlefield was chosen
for the present study due to the consistency of
bedrock and soil types and to the amount of
size variation among glades. Forty glades over
approximately 25 ha were included in the
present study (Fig. 1). All of the glades were
located on Ordovician-aged Ridley Limestone
(Wilson 1964) and primarily on the Gladeville-
Rock outcrop-Talbott soil association (True et
al. 1977). The glades form a circular pattern
around a slightly elevated hill (Fig. 1). They
had ca. 127 m of wooded buffer to the nearest
fields, 413 m to major roads and 153 m to
urbanized/industrialized areas.
This section of the park has a history of
disturbance. The Battle of Stones River was
fought during winter 1862–1863, and mention
of cedar glades is made in personal letters by
solders and in official correspondence (Hogan et
al. 1995). Before and after the Battle, until the
establishment of the park (late 1920s–early
1930s), the land was used for farming, as wood
lots, grazing lands, or home sites. Aerial and
ground photographs during the 1920s and 1930s
show large cleared tracts; fence rows, unpaved
roads and glades are apparent. Since the 1930s,
much of the land surrounding the glades has
become densely forested but signs of distur-
bances still remain, e.g., a network of trails.
PLANT SURVEYS. All vascular plants on each
glade were tallied monthly during the 2001–
2003 growing seasons (February to Novem-
ber). Surveys were done by walking along the
edge of the glade (i.e., at the boundary of the
forest and glade opening) and then crisscross-
ing the glade at 0.5–1 m intervals. Nomencla-
ture followed USDA, NRCS (2004). Taxa were
classified based on nativity (native vs. exotic;
sensu USDA, NRCS 2004), endemism (endem-
2008] COFER ET AL.: SPECIES RICHNESS ON CEDAR GLADES 541
ic vs. nonendemic; Baskin and Baskin 1999),
and growth habit (forb including ferns and
herbaceous vines, graminoid, shrub, tree, and
woody vine; USDA, NRCS 2004). Forbs and
graminoids were further divided into annual or
perennial (including biennial) following Glea-
son and Cronquist (1991), Baskin et al. (1995),
and USDA, NRCS (2004). From the species
compilation for each glade, percentage fre-
quency was calculated. Voucher specimens of
plants new to the Battlefield or cedar glade
flora were deposited in the Battlefield’s her-
barium. Species authorities for taxa recorded at
the Battlefield are listed in the Appendix.
During 2001–2003, mean daily maximum and
minimum temperatures were 20.5 and 8.1uC,
respectively, and monthly precipitation totaled
121.9 mm at a weather station in Murfreesboro,
Tennessee, ca. 8 km from the study site. The 30-
yr normal temperatures are 20.5 and 9.3uC,
respectively, in Nashville, Tennessee, approxi-
mately 35 km from the Battlefield, and precip-
itation 100.1 mm (National Climatic Data
Center 2002). Mean annual total snowfall
FIG. 1. Aerial photograph of the cedar glades (numbered in white) at Stones River National Battlefield,Rutherford County, Tennessee used in the present study. The autotour road is seen in the middle of theimage. Photograph was taken in 1997.
542 JOURNAL OF THE TORREY BOTANICAL SOCIETY [VOL. 135
during the study period (2.5 cm) was much
lower than the 57-year normal (25.4 cm).
ENVIRONMENTAL PARAMETERS. Glades were
delineated during the 2005 growing season by
walking around their edge (i.e., along the tree
line bordering the glade) as well as around tree
islands in the glade using a TrimbleH GPS
PathfinderH Pro XR unit with a TSCe data
collector, ensuring an accuracy of , 1 m. Geo-
referenced data were imported into ArcMap
(ESRI 2004) to obtain area and perimeter (as a
measure of the amount of edge) for each glade,
distance of each glade from the autotour road,
and distance from edge of each glade to the
nearest edge of an adjacent glade (as a
measure of isolation). Area of tree islands
was removed for calculation of total glade
area. The glades were spatially corrected when
necessary and overlayed onto a 0.5 m resolu-
tion digital orthophoto quarter-quadrangle
map of the Battlefield. In addition, ground
truthing was conducted by tracing a 1.5 3
1.5 m plot in the field with the GPS unit and
determining its area with the software.
Glades were classified as disturbed if they
contained a hiking trail, logs to prevent
trespassing from the autotour road or from
trails, outplanted Astragalus bibullatus for a
restoration project, ‘‘graffiti’’ (i.e., flagstone
moved to make words), gravel or dirt piles,
and/or an eradication project for Ligustrum
sinense. Nondisturbed glades did not have
these features.
STATISTICAL ANALYSES. Means were com-
pared by t-tests or one-way analyses of
variances (ANOVAs) followed by protected
least significant difference tests (PLSDs, P 5
0.05). Pearson correlations were calculated
among the four parameters (area, perimeter,
distance from road, isolation), and simple
regressions were done between them and
species richness based on total inventory,
nativity, endemism, growth habit, and herba-
ceous life cycle (SAS 2003). Regression lines
were compared by analyses of covariances
(ANCOVAs). We chose R2 selection proce-
dure for multiple regressions, but glade area
and perimeter were combined by averaging
them into one variable termed island due to
multicollinearity. Standardized residuals from
the regression of native species richness vs.
perimeter were obtained and then regressed
against exotic species richness. The use of
residuals controlled for the most important
explanatory variable, so that comparing glades
of different sizes could be nearly equivalent
(Lonsdale 1999). Independent and dependent
variables were log10 transformed for all
analyses so as to calculate scale-independent
slopes (z-values) for comparison with other
studies.
Results. PLANT SURVEYS. Two-hundred thir-
ty two taxa occurred on the 40 glades (mean 6
SE: 75 6 4) with Andropogon virginicus,
Croton monanthogynus, Juniperus virginiana,
Panicum flexile, and Ulmus alata being present
on all of them (Appendix). The number of
native species (67 6 3) was greater than that of
exotics (8 6 1) (t-test, P , 0.0001); Ligustrum
sinense, Leucanthemum vulgare, and Taraxa-
cum officinale occurred on the majority of
glades. Nonendemic species (72 6 3) outnum-
bered endemic ones (3 6 0) (P , 0.0001), and
Lobelia appendiculata var. gattingeri, Leaven-
worthia stylosa, and Pediomelum subacaule
were the most frequent endemics. Number of
species varied among growth habits: forbs (45
6 2) . graminoids (13 6 1) . trees (9 6 0) 5
shrubs (7 6 0) . vines (2 6 0) (PLSD, P 5
0.05). Among herbaceous plants, perennials
(34 6 2) were more abundant than annuals (24
6 1) (t-test, P , 0.0001).
ENVIRONMENTAL PARAMETERS. Area (range:
17.13–2837.10 m2) and perimeter (17.22–
1205.24 m) of glades were positively correlated
(r 5 0.977, P , 0.0001), whereas they were
negatively correlated with isolation (5.66–
82.79 m) (r 5 20.451 and 20.472, respective-
ly; P # 0.0035). Distance to road (0–187 m)
was not correlated with area, perimeter, or
isolation (P $ 0.0947).
Richness of total species, native and exotic
species, and nonendemic and endemic species
increased significantly with increasing glade
area and perimeter and decreased significantly
with increasing isolation (Table 1). Except for
vines with glade area and isolation and trees
with isolation, all types of growth habits and
herbaceous life cycles also increased with area
and perimeter and decreased with isolation.
Glade perimeter explained a slightly higher
amount of variation among total and nonen-
demic species and types of nativity, growth
habits, and herbaceous life cycles than area. In
contrast, glade area accounted for slightly
greater variation than perimeter for endemic
2008] COFER ET AL.: SPECIES RICHNESS ON CEDAR GLADES 543
species. Species richness was not related to
distance to road for total species or types of
nativity, endemism, growth habit, and herba-
ceous life cycles (P $ 0.2023). Comparisons of
regression lines between levels of nativity,
endemism, and herbaceous life cycle or among
growth habits were not significantly different
for glade area, perimeter, or isolation (AN-
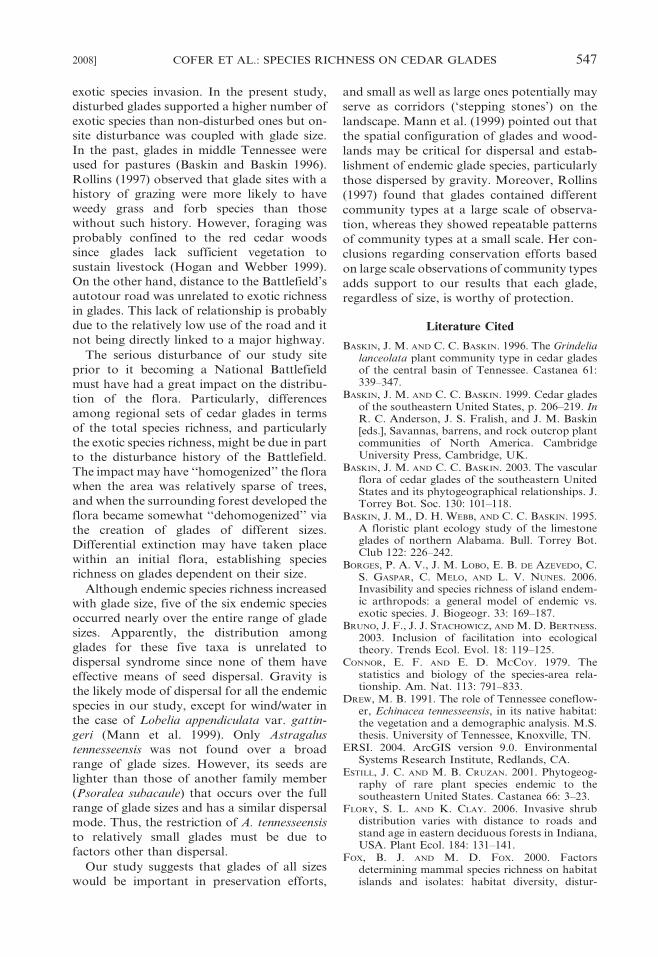
COVA, P $ 0.4809). In multiple regressions,
island explained the most variation in the one-
variable model for all variables (Table 2).
Including other parameters in a 2- or 3-
variable model (isolation and/or distance to
road) only explained an additional 0–6%
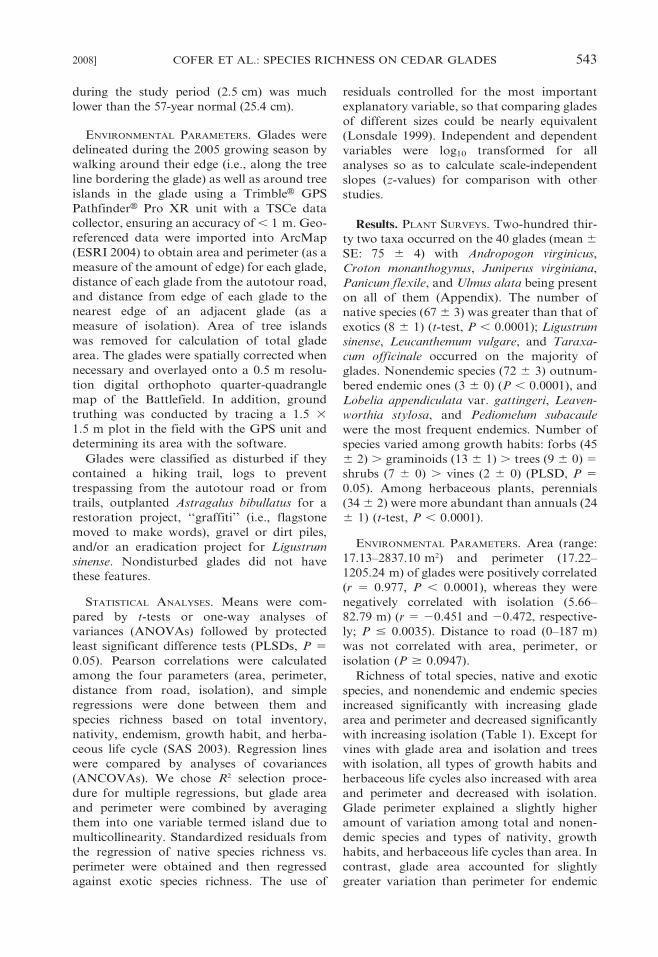
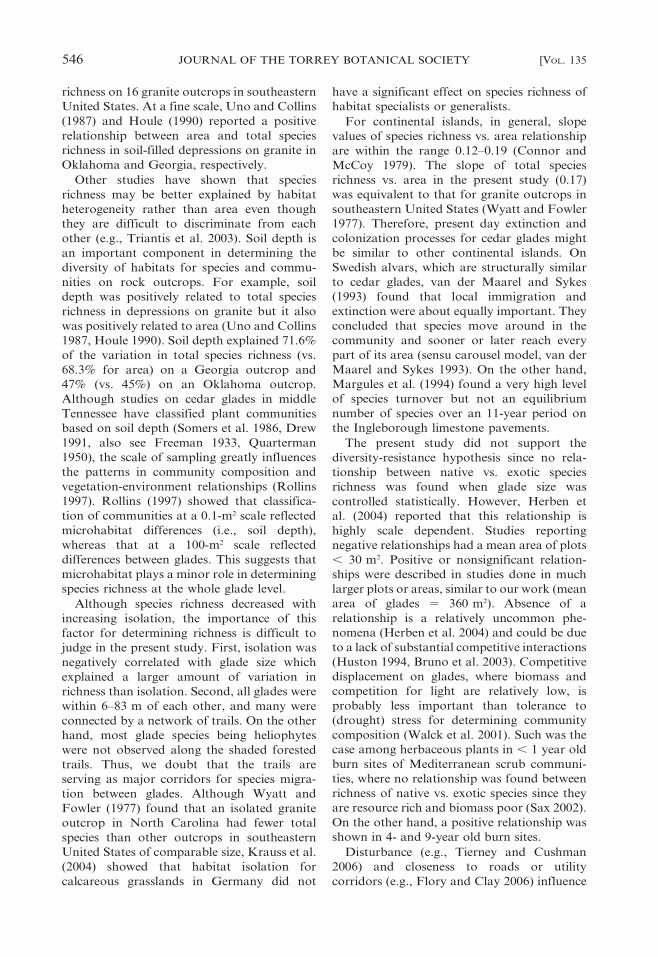
variation. Exotic species richness was unrelat-
ed to native species richness when size
(perimeter) of glades was statistically con-
trolled (P 5 0.8818) (Fig. 2).
Disturbed glades were larger in area (692 6
212 m2) and perimeter (240 6 74 m) than non-
disturbed ones (137 6 26 m2, 66 6 7 m) (t-test,
P # 0.0330), but they did not differ in distance
from road or isolation (P $ 0.0550). Richness
of exotic (11 6 2 vs. 6 6 1) and native (78 6 6
vs. 60 6 3) species was higher on disturbed
glades than on nondisturbed ones (P # 0.0150),
but that of endemic species was equal (3 6 0).
The endemic species Leavenworthia stylosa,
Lobelia appendiculata var. gattingeri, and
Pediomelum subacaule occurred over the full
range of glade areas (17.13–2837.10 m2) and
Talinum calcaricum (22.11–2837.10 m2) and
Phacelia dubia var. interior (210.29–2837.10
m2) over a slightly narrower range. In contrast,
Astragalus tennesseensis was not found on
glades . 686.45 m2.
Discussion. The total number of taxa (232)
on the 40 glades in the present study was less
than that recorded for 22 glades in seven
counties of northern Alabama (269 taxa in
Baskin et al. 1995) but more than that for 10
glades in four counties (132 taxa in Somers et
al. 1986) and 10 glades in five counties of
middle Tennessee (152 taxa in Rollins 1997).
Thirty four taxa were recorded as new to the
cedar glade flora of southeastern United
States, but 44% of them were exotic. Baskin
and Baskin (1999) listed 36 taxa as character-
istic species of southeastern United States
cedar glades based on presence and abun-
dance. Of these, Eleocharis compressa, Oxalis
priceae subsp. priceae, Solidago nemoralis, and
Trichostema brachiatum were not recorded in
the present study. On the other hand, Andro-
pogon virginicus, Carex blanda, Euphorbia
dentata, Galium virgatum, Panicum malaco-
phyllum, Ligustrum sinense, Quercus imbri-
caria, and Panicum laxiflorum had high
($ 90%) frequency in our study and were
not on Baskin and Baskin’s (1999) list.
The percentage of the total glade flora at the
Battlefield that consisted of exotic plants
(18.8) is higher than that for glades in northern
Alabama (13.4 in Baskin et al. 1995) but
comparable to the glade flora of southeastern
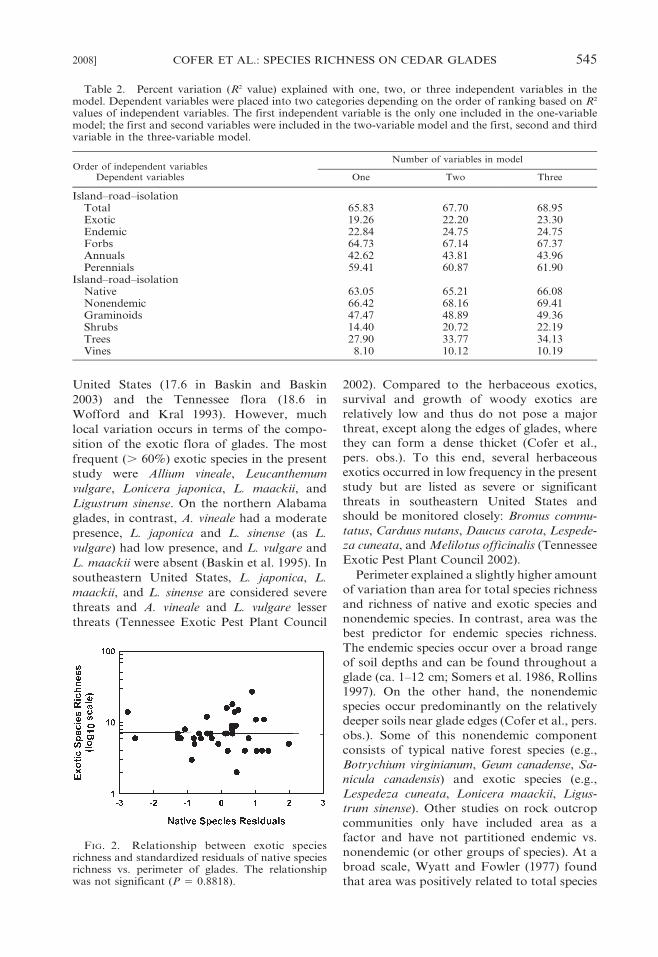
Table 1. Simple regressions for dependent variables with three independent parameters for cedar glades:log10Y 5 b0 + b1(log10X). *0.05 $ P . 0.01; **0.01 $ P . 0.001; ***P # 0.001.
Dependent variables
Area Perimeter Isolation
R2 b0 b1 R2 b0 b1 R2 b0 b1
Total species 0.629 1.50 0.17*** 0.683 1.39 0.24*** 0.246 2.11 20.21**Nativity
Exotic 0.169 0.48 0.17** 0.223 0.33 0.27** 0.126 1.19 20.29*Native 0.608 1.44 0.17*** 0.646 1.34 0.24*** 0.218 2.05 20.20**
Endemism
Endemic 0.232 0.29 0.18** 0.215 20.04 0.24** 0.118 0.73 20.25*Nonendemic 0.635 1.48 0.17*** 0.688 1.38 0.24*** 0.241 2.09 20.20**
Growth habit
Forbs 0.623 1.23 0.18*** 0.664 1.13 0.26*** 0.260 1.91 20.23***Graminoids 0.462 0.66 0.19*** 0.482 0.56 0.27*** 0.155 1.33 20.22*Vines 0.057 —a — 0.120 20.15 0.21* 0.019 — —Shrubs 0.131 0.59 0.11* 0.160 0.51 0.16* 0.098 1.04 20.18*Trees 0.274 0.65 0.13*** 0.280 0.58 0.18*** 0.049 — —
Herbaceous life cycle
Annuals 0.413 0.94 0.18*** 0.433 0.84 0.26*** 0.159 1.62 20.22*Perennials 0.574 1.10 0.19*** 0.607 0.99 0.27*** 0.215 1.78 20.23**
a Dependent factor was not significant in regression.
544 JOURNAL OF THE TORREY BOTANICAL SOCIETY [VOL. 135
United States (17.6 in Baskin and Baskin
2003) and the Tennessee flora (18.6 in
Wofford and Kral 1993). However, much
local variation occurs in terms of the compo-
sition of the exotic flora of glades. The most
frequent (. 60%) exotic species in the present
study were Allium vineale, Leucanthemum
vulgare, Lonicera japonica, L. maackii, and
Ligustrum sinense. On the northern Alabama
glades, in contrast, A. vineale had a moderate
presence, L. japonica and L. sinense (as L.
vulgare) had low presence, and L. vulgare and
L. maackii were absent (Baskin et al. 1995). In
southeastern United States, L. japonica, L.
maackii, and L. sinense are considered severe
threats and A. vineale and L. vulgare lesser
threats (Tennessee Exotic Pest Plant Council
2002). Compared to the herbaceous exotics,
survival and growth of woody exotics are
relatively low and thus do not pose a major
threat, except along the edges of glades, where
they can form a dense thicket (Cofer et al.,
pers. obs.). To this end, several herbaceous
exotics occurred in low frequency in the present
study but are listed as severe or significant
threats in southeastern United States and
should be monitored closely: Bromus commu-
tatus, Carduus nutans, Daucus carota, Lespede-
za cuneata, and Melilotus officinalis (Tennessee
Exotic Pest Plant Council 2002).
Perimeter explained a slightly higher amount
of variation than area for total species richness
and richness of native and exotic species and
nonendemic species. In contrast, area was the
best predictor for endemic species richness.
The endemic species occur over a broad range
of soil depths and can be found throughout a
glade (ca. 1–12 cm; Somers et al. 1986, Rollins
1997). On the other hand, the nonendemic
species occur predominantly on the relatively
deeper soils near glade edges (Cofer et al., pers.
obs.). Some of this nonendemic component
consists of typical native forest species (e.g.,
Botrychium virginianum, Geum canadense, Sa-
nicula canadensis) and exotic species (e.g.,
Lespedeza cuneata, Lonicera maackii, Ligus-
trum sinense). Other studies on rock outcrop
communities only have included area as a
factor and have not partitioned endemic vs.
nonendemic (or other groups of species). At a
broad scale, Wyatt and Fowler (1977) found
that area was positively related to total species
FIG. 2. Relationship between exotic speciesrichness and standardized residuals of native speciesrichness vs. perimeter of glades. The relationshipwas not significant (P 5 0.8818).
Table 2. Percent variation (R2 value) explained with one, two, or three independent variables in themodel. Dependent variables were placed into two categories depending on the order of ranking based on R2
values of independent variables. The first independent variable is the only one included in the one-variablemodel; the first and second variables were included in the two-variable model and the first, second and thirdvariable in the three-variable model.
Order of independent variablesNumber of variables in model
Dependent variables One Two Three
Island–road–isolationTotal 65.83 67.70 68.95Exotic 19.26 22.20 23.30Endemic 22.84 24.75 24.75Forbs 64.73 67.14 67.37Annuals 42.62 43.81 43.96Perennials 59.41 60.87 61.90
Island–road–isolationNative 63.05 65.21 66.08Nonendemic 66.42 68.16 69.41Graminoids 47.47 48.89 49.36Shrubs 14.40 20.72 22.19Trees 27.90 33.77 34.13Vines 8.10 10.12 10.19
2008] COFER ET AL.: SPECIES RICHNESS ON CEDAR GLADES 545
richness on 16 granite outcrops in southeastern
United States. At a fine scale, Uno and Collins
(1987) and Houle (1990) reported a positive
relationship between area and total species
richness in soil-filled depressions on granite in
Oklahoma and Georgia, respectively.
Other studies have shown that species
richness may be better explained by habitat
heterogeneity rather than area even though
they are difficult to discriminate from each
other (e.g., Triantis et al. 2003). Soil depth is
an important component in determining the
diversity of habitats for species and commu-
nities on rock outcrops. For example, soil
depth was positively related to total species
richness in depressions on granite but it also
was positively related to area (Uno and Collins
1987, Houle 1990). Soil depth explained 71.6%
of the variation in total species richness (vs.
68.3% for area) on a Georgia outcrop and
47% (vs. 45%) on an Oklahoma outcrop.
Although studies on cedar glades in middle
Tennessee have classified plant communities
based on soil depth (Somers et al. 1986, Drew
1991, also see Freeman 1933, Quarterman
1950), the scale of sampling greatly influences
the patterns in community composition and
vegetation-environment relationships (Rollins
1997). Rollins (1997) showed that classifica-
tion of communities at a 0.1-m2 scale reflected
microhabitat differences (i.e., soil depth),
whereas that at a 100-m2 scale reflected
differences between glades. This suggests that
microhabitat plays a minor role in determining
species richness at the whole glade level.
Although species richness decreased with
increasing isolation, the importance of this
factor for determining richness is difficult to
judge in the present study. First, isolation was
negatively correlated with glade size which
explained a larger amount of variation in
richness than isolation. Second, all glades were
within 6–83 m of each other, and many were
connected by a network of trails. On the other
hand, most glade species being heliophytes
were not observed along the shaded forested
trails. Thus, we doubt that the trails are
serving as major corridors for species migra-
tion between glades. Although Wyatt and
Fowler (1977) found that an isolated granite
outcrop in North Carolina had fewer total
species than other outcrops in southeastern
United States of comparable size, Krauss et al.
(2004) showed that habitat isolation for
calcareous grasslands in Germany did not
have a significant effect on species richness of
habitat specialists or generalists.
For continental islands, in general, slope
values of species richness vs. area relationship
are within the range 0.12–0.19 (Connor and
McCoy 1979). The slope of total species
richness vs. area in the present study (0.17)
was equivalent to that for granite outcrops in
southeastern United States (Wyatt and Fowler
1977). Therefore, present day extinction and
colonization processes for cedar glades might
be similar to other continental islands. On
Swedish alvars, which are structurally similar
to cedar glades, van der Maarel and Sykes
(1993) found that local immigration and
extinction were about equally important. They
concluded that species move around in the
community and sooner or later reach every
part of its area (sensu carousel model, van der
Maarel and Sykes 1993). On the other hand,
Margules et al. (1994) found a very high level
of species turnover but not an equilibrium
number of species over an 11-year period on
the Ingleborough limestone pavements.
The present study did not support the
diversity-resistance hypothesis since no rela-
tionship between native vs. exotic species
richness was found when glade size was
controlled statistically. However, Herben et
al. (2004) reported that this relationship is
highly scale dependent. Studies reporting
negative relationships had a mean area of plots
, 30 m2. Positive or nonsignificant relation-
ships were described in studies done in much
larger plots or areas, similar to our work (mean
area of glades 5 360 m2). Absence of a
relationship is a relatively uncommon phe-
nomena (Herben et al. 2004) and could be due
to a lack of substantial competitive interactions
(Huston 1994, Bruno et al. 2003). Competitive
displacement on glades, where biomass and
competition for light are relatively low, is
probably less important than tolerance to
(drought) stress for determining community
composition (Walck et al. 2001). Such was the
case among herbaceous plants in , 1 year old
burn sites of Mediterranean scrub communi-
ties, where no relationship was found between
richness of native vs. exotic species since they
are resource rich and biomass poor (Sax 2002).
On the other hand, a positive relationship was
shown in 4- and 9-year old burn sites.
Disturbance (e.g., Tierney and Cushman
2006) and closeness to roads or utility
corridors (e.g., Flory and Clay 2006) influence
546 JOURNAL OF THE TORREY BOTANICAL SOCIETY [VOL. 135
exotic species invasion. In the present study,
disturbed glades supported a higher number of
exotic species than non-disturbed ones but on-
site disturbance was coupled with glade size.
In the past, glades in middle Tennessee were
used for pastures (Baskin and Baskin 1996).
Rollins (1997) observed that glade sites with a
history of grazing were more likely to have
weedy grass and forb species than those
without such history. However, foraging was
probably confined to the red cedar woods
since glades lack sufficient vegetation to
sustain livestock (Hogan and Webber 1999).
On the other hand, distance to the Battlefield’s
autotour road was unrelated to exotic richness
in glades. This lack of relationship is probably
due to the relatively low use of the road and it
not being directly linked to a major highway.
The serious disturbance of our study site
prior to it becoming a National Battlefield
must have had a great impact on the distribu-
tion of the flora. Particularly, differences
among regional sets of cedar glades in terms
of the total species richness, and particularly
the exotic species richness, might be due in part
to the disturbance history of the Battlefield.
The impact may have ‘‘homogenized’’ the flora
when the area was relatively sparse of trees,
and when the surrounding forest developed the
flora became somewhat ‘‘dehomogenized’’ via
the creation of glades of different sizes.
Differential extinction may have taken place
within an initial flora, establishing species
richness on glades dependent on their size.
Although endemic species richness increased
with glade size, five of the six endemic species
occurred nearly over the entire range of glade
sizes. Apparently, the distribution among
glades for these five taxa is unrelated to
dispersal syndrome since none of them have
effective means of seed dispersal. Gravity is
the likely mode of dispersal for all the endemic
species in our study, except for wind/water in
the case of Lobelia appendiculata var. gattin-
geri (Mann et al. 1999). Only Astragalus
tennesseensis was not found over a broad
range of glade sizes. However, its seeds are
lighter than those of another family member
(Psoralea subacaule) that occurs over the full
range of glade sizes and has a similar dispersal
mode. Thus, the restriction of A. tennesseensis
to relatively small glades must be due to
factors other than dispersal.
Our study suggests that glades of all sizes
would be important in preservation efforts,
and small as well as large ones potentially may
serve as corridors (‘stepping stones’) on the
landscape. Mann et al. (1999) pointed out that
the spatial configuration of glades and wood-
lands may be critical for dispersal and estab-
lishment of endemic glade species, particularly
those dispersed by gravity. Moreover, Rollins
(1997) found that glades contained different
community types at a large scale of observa-
tion, whereas they showed repeatable patterns
of community types at a small scale. Her con-
clusions regarding conservation efforts based
on large scale observations of community types
adds support to our results that each glade,
regardless of size, is worthy of protection.
Literature Cited
BASKIN, J. M. AND C. C. BASKIN. 1996. The Grindelialanceolata plant community type in cedar gladesof the central basin of Tennessee. Castanea 61:339–347.
BASKIN, J. M. AND C. C. BASKIN. 1999. Cedar gladesof the southeastern United States, p. 206–219. InR. C. Anderson, J. S. Fralish, and J. M. Baskin[eds.], Savannas, barrens, and rock outcrop plantcommunities of North America. CambridgeUniversity Press, Cambridge, UK.
BASKIN, J. M. AND C. C. BASKIN. 2003. The vascularflora of cedar glades of the southeastern UnitedStates and its phytogeographical relationships. J.Torrey Bot. Soc. 130: 101–118.
BASKIN, J. M., D. H. WEBB, AND C. C. BASKIN. 1995.A floristic plant ecology study of the limestoneglades of northern Alabama. Bull. Torrey Bot.Club 122: 226–242.
BORGES, P. A. V., J. M. LOBO, E. B. DE AZEVEDO, C.S. GASPAR, C. MELO, AND L. V. NUNES. 2006.Invasibility and species richness of island endem-ic arthropods: a general model of endemic vs.exotic species. J. Biogeogr. 33: 169–187.
BRUNO, J. F., J. J. STACHOWICZ, AND M. D. BERTNESS.2003. Inclusion of facilitation into ecologicaltheory. Trends Ecol. Evol. 18: 119–125.
CONNOR, E. F. AND E. D. MCCOY. 1979. Thestatistics and biology of the species-area rela-tionship. Am. Nat. 113: 791–833.
DREW, M. B. 1991. The role of Tennessee coneflow-er, Echinacea tennesseensis, in its native habitat:the vegetation and a demographic analysis. M.S.thesis. University of Tennessee, Knoxville, TN.
ERSI. 2004. ArcGIS version 9.0. EnvironmentalSystems Research Institute, Redlands, CA.
ESTILL, J. C. AND M. B. CRUZAN. 2001. Phytogeog-raphy of rare plant species endemic to thesoutheastern United States. Castanea 66: 3–23.
FLORY, S. L. AND K. CLAY. 2006. Invasive shrubdistribution varies with distance to roads andstand age in eastern deciduous forests in Indiana,USA. Plant Ecol. 184: 131–141.
FOX, B. J. AND M. D. FOX. 2000. Factorsdetermining mammal species richness on habitatislands and isolates: habitat diversity, distur-
2008] COFER ET AL.: SPECIES RICHNESS ON CEDAR GLADES 547
bance, species interactions and guild assemblyrules. Global Ecol. Biogeogr. 9: 19–37.
GLEASON, H. A. AND A. CRONQUIST. 1991. Manual ofvascular plants of northeastern United States andadjacent Canada. 2nd ed. The New YorkBotanical Garden, Bronx, NY. 910 p.
HARRISON, S., H. D. SAFFORD, J. B. GRACE, J. H.VIERS, AND K. F. DAVIES. 2006. Regional andlocal species richness in an insular environment:serpentine plants in California. Ecol. Monogr.76: 41–56.
HERBEN, T., B. MANDAK, K. BIMOVA, AND Z.MUNZBERGOVA. 2004. Invasibility and speciesrichness of a community: a neutral model and asurvey of published data. Ecology 85: 3223–3233.
HOGAN, T. L. AND M. WEBBER. 1999. Vascular floraof Stones River National Battlefield includingnotes on natural communities and rare species.Unpubl. Report submitted to the National ParkService, Washington, DC.
HOGAN, T., R. SUTTER, AND N. RUDD. 1995.Vascular plant inventory, baseline and photopoint monitoring, and rare species monitoring ofthe calcareous glades of Stones River NationalBattlefield. Unpubl. Report submitted to theNational Park Service, Washington, DC.
HOULE, G. 1990. Species-area relationship duringprimary succession in granite outcrop plantcommunities. Am. J. Bot. 77: 1433–1439.
HUSTON, M. A. 1994. Biological diversity: thecoexistence of species on changing landscapes.Cambridge University Press, New York, NY.681 p.
KRAUSS, J., A. KLEIN, I. STEFFAN-DEWENTER, AND T.TSCHARNTKE. 2004. Effects of habitat area,isolation, and landscape diversity on plantspecies richness of calcareous grasslands. Biodi-vers. Conserv. 13: 1427–1439.
LONSDALE, W. M. 1999. Global patterns of plantinvasions and the concept of invasibility. Ecology80: 1522–1536.
MACARTHUR, R. H. AND E. O. WILSON. 1967. Thetheory of island biogeography. Princeton Uni-versity Press, Princeton, NJ. 203 p.
MANN, L. K., A. W. KING, V. H. DALE, W. W.HARGROVE, R. WASHINGTON-ALLEN, L. R.POUNDS, AND T. L. ASHWOOD. 1999. The role ofsoil classification in geographic informationsystem modelling of habitat pattern: threatenedcalcareous ecosystems. Ecosystems 2: 524–538.
MARGULES, C. R., A. O. NICHOLLS, AND M. B.USHER. 1994. Apparent species turnover, proba-bility of extinction and the selection of naturereserves: a case study of the Ingleboroughlimestone pavements. Conserv. Biol. 8: 398–409.
MOODY, A. 2000. Analysis of plant species diversitywith respect to island characteristics on the ChannelIslands, California. J. Biogeogr. 27: 711–723.
NATIONAL OCEANIC AND ATMOSPHERIC ADMINISTRA-
TION. 2002. Comparative climatic data for theUnited States through 2002. National ClimaticData Center, Asheville, NC. 145 p.
QUARTERMAN, E. 1989. Structure and dynamics ofthe limestone cedar glade communities in Ten-nessee. J. Tennessee Acad. Sci. 64: 155–158.
REDEI, T., Z. BOTTA-DUKAT, J. CSIKY, A. KUN, AND
T. TOTH. 2003. On the possible role of local
effects on the species richness of acidic andcalcareous rock grasslands in northern Hungary.Folia Geobot. 38: 453–467.
ROLLINS, S. C. 1997. Calcareous glade communitiesin the Central Basin of Tennessee: the effects ofscale on community classification. M.A. thesis.University of North Carolina, Chapel Hill, NC.
SAX, D. F. 2002. Native and naturalized plantdiversity are positively correlated in scrubcommunities of California and Chile. Divers.Distrib. 8: 193–210.
SEABLOOM, E. W., J. W. WILLIAMS, D. SLAYBACK, D.M. STOMS, J. H. VIERS, AND A. P. DOBSON. 2006.Human impacts, plant invasion, and imperiled,plant species in California. Ecol. Appl. 16:1338–1350.
SOMERS, P., L. R. SMITH, P. B. HAMEL, AND E. L.BRIDGES. 1986. Preliminary analyses of plantcommunities and seasonal changes in cedarglades of middle Tennessee. Assoc. SoutheasternBiol. Bull. 33: 178–192.
[SAS] STATISTICAL ANALYSIS SYSTEMS. 2003. The SASsystem for Windows, version 9.1. SAS InstituteInc., Cary, NC.
TENNESSEE EXOTIC PEST PLANT COUNCIL. 2002.Invasive exotic pest plants in Tennessee. J.Tennessee Acad. Sci. 77: 45–48.
TIERNEY, T. A. AND J. H. CUSHMAN. 2006. Temporalchanges in native and exotic vegetation and soilcharacteristics following disturbances by feralpigs in a California grassland. Biol. Invasions 8:1073–1089.
TRIANTIS, K. A., M. MYLONAS, K. LIKA, AND K.VARDINOYANNIS. 2003. A model for the species-area-habitat relationship. J. Biogeogr. 30: 19–27.
TRUE, J. C., W. C. JACKSON, E. P. DAVIS, C. F.WHARTON, AND O. G. SPROUSE. 1977. Soil surveyof Rutherford County, Tennessee. USDA SoilConservation Service, Washington, DC. 95 p.
UNO, G. E. AND S. L. COLLINS. 1987. Primarysuccession on granite outcrops in southwesternOklahoma. Bull. Torrey Bot. Club 114: 387–392.
USDA, NRCS. 2004. The PLANTS database,Version 3.5 (http://plants.usda.gov). Data com-piled from various sources by M. W. Skinner.National Plant Data Center, Baton Rouge, LA.
VAN DER MAAREL, E. AND M. T. SYKES. 1993. Small-scale plant species turnover in a limestonegrassland: the carousel model and some commentson the niche concept. J. Veg. Sci. 4: 179–188.
WALCK, J. L., J. M. BASKIN, AND C. C. BASKIN. 2001.Why is Solidago shortii narrowly endemic and S.altissima geographically widespread? A compre-hensive comparative study of biological traits. J.Biogeogr. 28: 1221–1237.
WARE, S. 2002. Rock outcrop plant communities(glades) in the Ozarks: a synthesis. SouthwesternNat. 47: 585–597.
WILSON, C. W., JR. 1964. Geologic map of theMurfreesboro Quadrangle, Tennessee. GM 315-SW. Tennessee Division of Geology, Nashville, TN.
WOFFORD, B. E. AND R. KRAL. 1993. Checklist of thevascular plants of Tennessee. Sida, Bot. Misc.No. 10.
WYATT, R. AND N. FOWLER. 1977. The vascular floraand vegetation of the North Carolina graniteoutcrops. Bull. Torrey Bot. Club 104: 245–253.
548 JOURNAL OF THE TORREY BOTANICAL SOCIETY [VOL. 135
Appendix
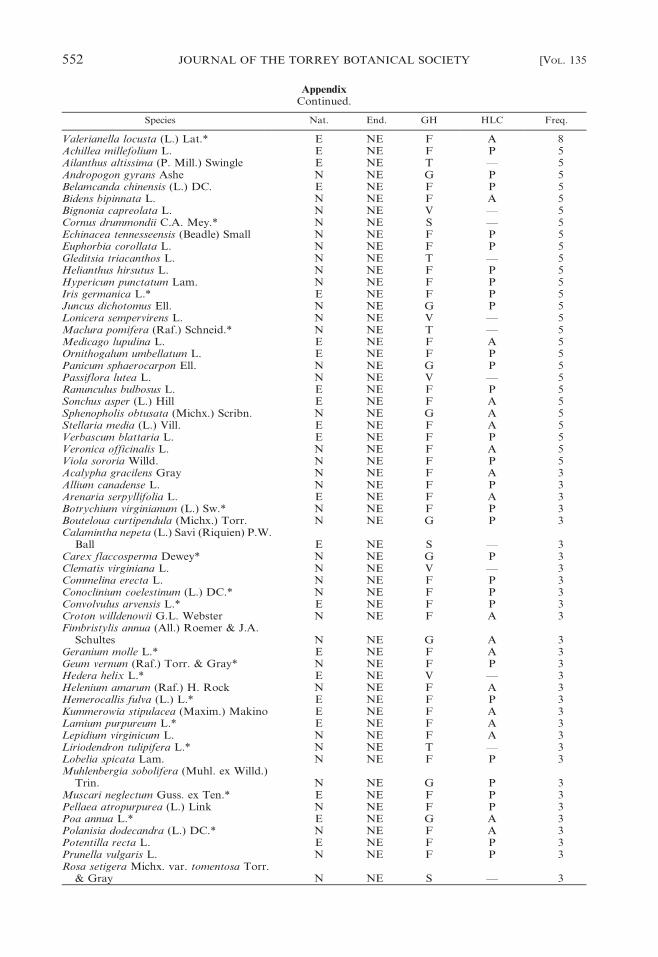
Taxa recorded on 40 cedar glades at Stones River National Battlefield, Rutherford County, Tennessee.Nat. 5 nativity (E, exotic; N, native), End. 5 endemism (E, Endemic; NE, nonendemic), GH 5 growthhabit (F, forb; G, graminoid; S, shrub; T, tree; V, vine), HLC 5 herbaceous life cycle (A, annual; P,perennial; —, not applicable), Freq. 5 frequency among the 40 glades. An asterisk (*) indicates that thetaxon is new to the flora of cedar glades (cf. Baskin and Baskin 2003).
Species Nat. End. GH HLC Freq.
Andropogon virginicus L. N NE G P 100Croton monanthogynus Michx. N NE F A 100Juniperus virginiana L. N NE T — 100Panicum flexile (Gattinger) Scribn. N NE G A 100Ulmus alata Michx. N NE T — 100Carex blanda Dewey N NE G P 98Euphorbia dentata Michx. N NE F A 98Galium virgatum Nutt. N NE F A 98Panicum malacophyllum (Nash.) Gould N NE G P 98Rhus aromatica Ait. N NE S — 98Ruellia humilis Nutt. N NE F P 98Senecio anonymus (Wood) W.A. Weber &
A. Love N NE F P 98Houstonia purpurea L. N NE F P 95Ligustrum sinense Lour. E NE S — 95Quercus imbricaria Michx.* N NE T — 95Scutellaria parvula Michx. N NE F P 95Sporobolus vaginiflorus (Torr. ex Gray)
Wood N NE G A 95Celtis laevigata Willd. N NE T — 90Dalea gattingeri (Heller) Barneby N NE F P 90Panicum laxiflorum Lam. N NE G P 90Acalypha virginica L. N NE F A 88Oxalis dillenii Jacq. N NE F P 88Galium pilosum Ait. N NE F P 85Hypericum frondosum Michx. N NE S — 85Leucanthemum vulgare Lam. E NE F P 85Lobelia appendiculata var. gattingeri (Gray)
McVaugh N E F A 85Verbena simplex Lehm. N NE F P 85Verbesina virginica L. N NE F P 85Delphinium carolinianum Walt. ssp.
calciphilum Warnock N NE F P 83Hypericum sphaerocarpum Michx. N NE F P 83Plantago virginica L. N NE F A 83Sanicula canadensis L. N NE F P 83Aristida longespica Poir. N NE G A 80Fraxinus americana L. N NE T — 80Heliotropium tenellum (Nutt.) Torr. N NE F A 78Leavenworthia stylosa Gray N E F A 78Prunus serotina Ehrh.* N NE T — 78Symphoricarpos orbiculatus Moench N NE S — 78Chamaesyce maculata (L.) Small N NE F A 75Forestiera ligustrina (Michx.) Poir. N NE S — 75Isanthus brachiatus (L.) B.S.P. N NE F A 75Erigeron strigosus Muhl. ex Willd. N NE F P 73Panicum capillare L. N NE G A 73Pediomelum subacaule (Torr. & Gray)
Rydb. N E F P 73Allium vineale L. E NE F P 70Manfreda virginica (L.) Salisb. ex Rose N NE F P 65Sedum pulchellum Michx. N NE F A 65Taraxacum officinale G.H. Webber ex
Wiggers E NE F P 65Lonicera maackii (Rupr.) Herder* E NE S — 63
2008] COFER ET AL.: SPECIES RICHNESS ON CEDAR GLADES 549
Species Nat. End. GH HLC Freq.
Croton capitatus Michx. N NE F A 60Quercus stellata Wangenh N NE T — 60Tridens flavus (L.) A.S. Hitchc. N NE G P 60Carex hirsutella Mackenzie* N NE G P 58Chamaesyce nutans (Lag.) Small N NE F A 58Geum canadense Jacq. N NE F P 58Sisyrinchium albidum Raf. N NE F P 58Conyza canadensis (L.) Cronq.* N NE F A 55Lonicera japonica Thunb. E NE V — 55Galactia volubilis (L.) Britt. N NE F P 53Minuartia patula (Michx.) Mattf. N NE F A 53Rosa carolina L. N NE S — 50Eragrostis frankii C.A. Mey. ex Steud. N NE G A 48Juglans nigra L. N NE T — 48Frangula caroliniana (Walt.) Gray N NE S — 45Glandularia canadensis (L.) Nutt. N NE F P 45Quercus muehlenbergii Engelm. N NE T — 45Rudbeckia triloba L. N NE F P 45Carya sp. N NE T — 43Cercis canadensis L. N NE T — 43Euphorbia spathulata Lam. N NE F A 43Nothoscordum bivalve (L.) Britt. N NE F P 43Smilax bona-nox L. N NE V — 43Bromus commutatus Schrad. E NE G A 40Carduus nutans L. E NE F P 40Diodia teres Walt. N NE F A 40Houstonia pusilla Schoepf N NE F A 40Lactuca serriola L. E NE F A 40Leucospora multifida (Michx.) Nutt. N NE F A 40Oxalis violacea L. N NE F P 40Quercus shumardii Buckl. N NE T — 40Rubus argutus Link* N NE S — 40Sabatia angularis (L.) Pursh N NE F A 40Valerianella radiata (L.) Dufr. N NE F A 40Viola egglestonii Brainerd N NE F P 38Ophioglossum engelmannii Prantl N NE F P 35Danthonia spicata L. Beauv. ex Roemer &
J.A. Schultes N NE G P 33Acer saccharum Marsh. N NE T — 33Opuntia humifusa (Raf.) Raf. N NE S — 33Salvia lyrata L. N NE F P 33Ambrosia artemisiifolia L. N NE F A 30Asclepias verticillata L. N NE F P 30Chaerophyllum tainturieri Hook. N NE F A 30Desmanthus illinoensis (Michx.) MacM. ex.
B.L. Robins. & Fern. N NE F P 30Galium circaezans Michx.* N NE F P 30Mecardonia acuminata (Walt.) Small N NE F P 30Parthenocissus quinquefolia (L.) Planch. N NE V — 30Carex umbellata Schkuhr ex Willd.* N NE G P 28Diospyros virginiana L. N NE T — 28Leavenworthia uniflora (Michx.) Britt. N NE F A 28Oenothera triloba Nutt. N NE F P 28Talinum calcaricum Ware N E F P 28Carex debilis Michx.* N NE G P 25Geranium carolinianum L. N NE F A 25Lespedeza cuneata (Dum.-Cours.) G. Don E NE F P 25Penstemon tenuiflorus Pennell N NE F P 25Polygala verticillata L. N NE F A 25Pyrrhopappus carolinianus (Walt.) DC. N NE F A 23Toxicodendron radicans (L.) Kuntze N NE V — 23Lespedeza procumbens Michx. N NE F P 20Paspalum setaceum Michx. N NE G P 20
AppendixContinued.
550 JOURNAL OF THE TORREY BOTANICAL SOCIETY [VOL. 135
Species Nat. End. GH HLC Freq.
Vitis sp. N NE V — 20Asclepias sp. N NE F P 18Carex albicans Willd. ex Spreng. N NE G P 18Cyperus squarrosus L. N NE G A 18Daucus carota L. E NE F P 18Eragrostis spectabilis (Pursh) Steud. N NE G P 18Viburnum rufidulum Raf. N NE S — 18Aster pilosus Willd. N NE F P 15Astragalus tennesseensis Gray ex Chapman N E F P 15Carex oligocarpa Schkuhr ex Willd. N NE G P 15Cuphea viscosissima Jacq. N NE F A 15Draba verna L. E NE F A 15Juncus tenuis Willd. N NE G P 15Pseudognaphalium obtusifolium (L.)
Hilliard & Burtt. N NE F A 15Sphenopholis nitida (Biehler) Scribn.* N NE G P 15Berchemia scandens (Hill) K. Koch N NE V — 13Cerastium brachypetalum Desportes ex.
Pers.* E NE F A 13Juncus filipendulus Buckl. N NE G P 13Melica mutica Walt. N NE G P 13Melilotus officinalis (L.) Lam. E NE F P 13Phacelia dubia (L.) Trel. var. interior Fern. N E F A 13Solanum carolinense L. N NE F P 13Solidago altissima L. N NE F P 13Veronica arvensis L. E NE F A 13Viola bicolor Pursh N NE F A 13Ageratina altissima (L.) King & H.E.
Robins. N NE F P 10Aristida oligantha Michx. N NE G A 10Brickellia eupatorioides (L.) Shinners N NE F P 10Cardamine hirsuta L. E NE F A 10Carex crawei Dewey N NE G P 10Cirsium discolor (Muhl. ex Willd.) Spreng N NE F P 10Crepis pulchra L. E NE F A 10Digitaria ischaemum (Schreb.) Schreb. ex
Muhl.* E NE G A 10Galium aparine L. N NE F A 10Myosotis verna Nutt. N NE F A 10Plantago pusilla Nutt. N NE F A 10Potentilla simplex Michx. N NE F P 10Scleria pauciflora Muhl. ex Willd. N NE G P 10Senna marilandica (L.) Link N NE F P 10Setaria parviflora (Poir.) Kerguelen N NE G P 10Trifolium campestre Schreb. E NE F A 10Triodanis perfoliata (L.) Nieuwl. N NE F A 10Agrimonia pubescens Wallr.* N NE F P 8Evolvulus nuttallianus J.A. Schultes N NE F P 8Geranium dissectum L.* E NE F A 8Hypoxis hirsuta (L.) Coville N NE F P 8Isoetes butleri Engelm. N NE G P 8Krigia virginica (L.) Willd. N NE F A 8Matelea carolinensis (Jacq.) Woods N NE F P 8Melilotus alba Medikus E NE F P 8Passiflora incarnata L. N NE F P 8Physalis sp. N NE F P 8Polymnia canadensis L. N NE F P 8Rhus glabra L. N NE S — 8Spiranthes cernua (L.) L.C. Rich. N NE F P 8Spiranthes lacera (Raf.) Raf. N NE F P 8Sporobolus compositus (Poir.) Merr. N NE G P 8Thalictrum thalictroides (L.) Eames &
Boivin N NE F P 8
AppendixContinued.
2008] COFER ET AL.: SPECIES RICHNESS ON CEDAR GLADES 551
Species Nat. End. GH HLC Freq.
Valerianella locusta (L.) Lat.* E NE F A 8Achillea millefolium L. E NE F P 5Ailanthus altissima (P. Mill.) Swingle E NE T — 5Andropogon gyrans Ashe N NE G P 5Belamcanda chinensis (L.) DC. E NE F P 5Bidens bipinnata L. N NE F A 5Bignonia capreolata L. N NE V — 5Cornus drummondii C.A. Mey.* N NE S — 5Echinacea tennesseensis (Beadle) Small N NE F P 5Euphorbia corollata L. N NE F P 5Gleditsia triacanthos L. N NE T — 5Helianthus hirsutus L. N NE F P 5Hypericum punctatum Lam. N NE F P 5Iris germanica L.* E NE F P 5Juncus dichotomus Ell. N NE G P 5Lonicera sempervirens L. N NE V — 5Maclura pomifera (Raf.) Schneid.* N NE T — 5Medicago lupulina L. E NE F A 5Ornithogalum umbellatum L. E NE F P 5Panicum sphaerocarpon Ell. N NE G P 5Passiflora lutea L. N NE V — 5Ranunculus bulbosus L. E NE F P 5Sonchus asper (L.) Hill E NE F A 5Sphenopholis obtusata (Michx.) Scribn. N NE G A 5Stellaria media (L.) Vill. E NE F A 5Verbascum blattaria L. E NE F P 5Veronica officinalis L. N NE F A 5Viola sororia Willd. N NE F P 5Acalypha gracilens Gray N NE F A 3Allium canadense L. N NE F P 3Arenaria serpyllifolia L. E NE F A 3Botrychium virginianum (L.) Sw.* N NE F P 3Bouteloua curtipendula (Michx.) Torr. N NE G P 3Calamintha nepeta (L.) Savi (Riquien) P.W.
Ball E NE S — 3Carex flaccosperma Dewey* N NE G P 3Clematis virginiana L. N NE V — 3Commelina erecta L. N NE F P 3Conoclinium coelestinum (L.) DC.* N NE F P 3Convolvulus arvensis L.* E NE F P 3Croton willdenowii G.L. Webster N NE F A 3Fimbristylis annua (All.) Roemer & J.A.
Schultes N NE G A 3Geranium molle L.* E NE F A 3Geum vernum (Raf.) Torr. & Gray* N NE F P 3Hedera helix L.* E NE V — 3Helenium amarum (Raf.) H. Rock N NE F A 3Hemerocallis fulva (L.) L.* E NE F P 3Kummerowia stipulacea (Maxim.) Makino E NE F A 3Lamium purpureum L.* E NE F A 3Lepidium virginicum L. N NE F A 3Liriodendron tulipifera L.* N NE T — 3Lobelia spicata Lam. N NE F P 3Muhlenbergia sobolifera (Muhl. ex Willd.)
Trin. N NE G P 3Muscari neglectum Guss. ex Ten.* E NE F P 3Pellaea atropurpurea (L.) Link N NE F P 3Poa annua L.* E NE G A 3Polanisia dodecandra (L.) DC.* N NE F A 3Potentilla recta L. E NE F P 3Prunella vulgaris L. N NE F P 3Rosa setigera Michx. var. tomentosa Torr.
& Gray N NE S — 3
AppendixContinued.
552 JOURNAL OF THE TORREY BOTANICAL SOCIETY [VOL. 135

Species Nat. End. GH HLC Freq.
Scleria triglomerata Michx.* N NE G P 3Sida spinosa L. N NE F P 3Spiraea xvanhouttei (Briot) Carr.* E NE S — 3Valerianella umbilicata (Sullivant) Wood N NE F A 3Yucca filamentosa L. N NE F P 3
AppendixContinued.
2008] COFER ET AL.: SPECIES RICHNESS ON CEDAR GLADES 553


