Embed Size (px)
Citation preview

Echocardiographic parameters for cardiac dyssynchrony Arita T et al.
1
Speckle-tracking strain echocardiography for detecting cardiac dyssynchrony in a
canine model of dyssynchrony and heart failure
Takeshi Arita MD1, George P. Sorescu MD1,3, Brian T. Schuler MD1, Laura S. Schmarkey
BS3, John D. Merlino MD, FACC1,3, Jakob Vinten-Johansen PhD, FAHA2,3, Angel R.Leon
MD, FACC 1,3, Randolph P. Martin MD, FACC, FASE1, Dan Sorescu MD, FACC 1
1 Division of Cardiology, Department of Medicine 2 Division of Cardiothoracic Surgery,
Department of Surgery, 3Carlyle Fraser Heart Center, Emory University School of Medicine,
Emory University, Atlanta, GA 30322
Address correspondence to:
Dan Sorescu, M.D, FACC
Emory University School of Medicine
Division of Cardiology
1639 Pierce Drive, WMB Room 319
Atlanta, GA 30322
Telephone: (404) 727-3364
Fax: (404) 727-3585
Email: [email protected]
Running title: Echocardiographic parameters for dyssynchrony
Page 1 of 41
Copyright Information
Articles in PresS. Am J Physiol Heart Circ Physiol (April 20, 2007). doi:10.1152/ajpheart.00168.2007
Copyright © 2007 by the American Physiological Society.

Echocardiographic parameters for cardiac dyssynchrony Arita T et al.
2
Total word count: 5477
Authors have nothing to disclose pertinent to this study.
Page 2 of 41
Copyright Information

Echocardiographic parameters for cardiac dyssynchrony Arita T et al.
3
Abstract
Background: Multiple echocardiographic criteria have been proposed to diagnose
mechanical dyssynchrony in patients with heart failure without being validated against a
model of cardiac dyssynchrony with heart failure. This study examines which of these
methods can detect dyssynchrony in a canine model.
Methods: Adult mongrel dogs underwent His bundle ablation and right ventricular pacing for
4 weeks at either 110 bpm to induce dyssynchrony without heart failure (D group, n=12) or
170 bpm to induce dyssynchrony with heart failure (DHF group, n=9). To induce heart
failure with narrow QRS, atria were paced at 190 bpm for 4 weeks (HF group, n=8). Tissue
Doppler imaging (TDI) and 2D echocardiography were performed at baseline and end of the
study. Standard deviation of time to peak systolic velocity (color coded TDI), time to peak S
wave on pulse wave TDI, time to peak radial and circumferential strain by speckle tracking
analysis (Err, Ecc respectively) as well as septal to posterior wall motion delay on M-mode
were obtained.
Results: In D group, only Err and Ecc were increased by dyssynchrony. In contrast, all the
echocardiographic parameters of dyssynchrony appeared significantly augmented in the DHF
group. Receiver operator curve analysis showed good sensitivity of Err (90%) and Ecc to
(100%) detected dyssynchrony without heart failure and excellent sensitivity and specificity
of Err and Ecc to detect dyssynchrony with heart failure
Conclusion: Radial strain by speckle tracking is more accurate than TDI velocity to detect
cardiac dyssynchrony in a canine model of dyssynchrony with or without heart failure.
Keywords: echocardiography, heart failure, dyssynchrony, tissue Doppler, strain
Page 3 of 41
Copyright Information

Echocardiographic parameters for cardiac dyssynchrony Arita T et al.
4
Introduction
Cardiac resynchronization therapy (CRT) improves clinical status and promotes
reverse remodeling in patients with advanced heart failure(5). CRT corrects the mechanical
dyssynchrony that worsens systolic(18, 21) and diastolic dysfunction(19, 29) and creates
functional mitral regurgitation(11). However, those same clinical trial results suggest that
30-35% of patients with systolic dysfunction and ventricular conduction delay with QRS
exceeding 120 milliseconds (msec) fail to respond to CRT. Absence of dyssynchrony in the
presence of wide QRS may explain the observed failure to respond. Conversely, detecting
dyssynchrony independent of QRS duration may identify other potential responders.
Therefore, optimizing patient selection for CRT depends on accurate detection of cardiac
dyssynchrony. Methods to detect mechanical dyssynchrony include magnetic resonance
imaging(26), radionuclear scintigraphy(12), invasive conductance catheter recordings(23)
and echocardiography. Preliminary clinical studies suggest echocardiography with tissue
Doppler imaging (TDI) as an effective and practical modality to assess mechanical
dyssynchrony by analyzing time to peak systolic velocity(4, 6, 22, 28). However, the physical
properties of Doppler imaging limit assessment of motion and deformation to the longitudinal
axis lying parallel to the transducer, whereas ventricular motion occurs in three dimensions.
Recent developments in speckle-tracking(13) allow assessment of radial and circumferential
strain on B-mode echocardiography similar to tagged magnetic resonance imaging(1, 7).
Whether conventional echocardiography, TDI, or novel speckle-tracking accurately detect
mechanical dyssynchrony remains undetermined; the various clinically utilized
echocardiography-Doppler techniques have not undergone extensive testing in an
experimental model of dyssynchrony. The present study tests the accuracy of detecting
dyssynchrony of multiple echocardiography parameters in an experimental canine model of
Page 4 of 41
Copyright Information

Echocardiographic parameters for cardiac dyssynchrony Arita T et al.
5
dyssynchrony with or without heart failure, with specific attention to a comparison between
novel speckle-tracking-derived radial and circumferential strain and widely-adopted
TDI-derived longitudinal velocity methods.
Methods
Animal models
The experimental procedures complied with the “Guiding Principles in the Use and Care of
Animals” published by the National Institutes of Health (NIH publication No. 85-23, revised
1996) and were approved by The Institutional Animal Care and Use Committee of Emory
University. (see online supplemental data)
Adult mongrel dogs underwent atrioventricular junction ablation followed by
implantation of a dual chamber pacing system. Atrioventricular pacing (atrioventricular
interval of 150 msec) at 110 beats per minute induced dyssynchrony and wide QRS without
heart failure (D: n=12) and right ventricular pacing at 170 bpm induced dyssynchrony and
wide QRS with heart failure (DHF group: n=9). A third group underwent implantation of a
dual chamber pacing system without junctional ablation and received atrial pacing at 190
bpm for 4 weeks to induce heart failure with narrow QRS (HF group: n=8). Intracardiac
recordings confirmed the absence of intrinsic atrioventricular conduction in the animals that
underwent junctional ablation. We measured QRS duration on surface lead II.
Echocardiography
We performed tissue Doppler and two-dimensional echocardiography (Vivid-7,
General Electric, Vingmed, Norway) at baseline and four weeks after pacing with animals
under general anesthesia (closed chest). All the echocardiographic images were obtained at
Page 5 of 41
Copyright Information

Echocardiographic parameters for cardiac dyssynchrony Arita T et al.
6
intrinsic normal sinus rhythm both at baseline and four weeks after. One cardiologist (D.S.)
obtained the images, and a second investigator (T.A.) analyzed them offline. We derived the
ventricular volumes and ejection fractions using the Simpson biplane method. Color-coded
tissue Doppler image were obtained on apical two-, three-, four-chamber views with a frame
exceeding 150 frames per second (see supplemental video). Pulse wave tissue Doppler
images were obtained on apical two-, three- and four- chamber views. We excluded
foreshortened apical image view for measurement. TDI involved sampling a region of interest
in the basal six and mid six segments. The speckle-tracking analysis utilized two-dimensional
images obtained in the mid-level short axis with a frame rate of 70-110 per second. We
generated the mid-short axis level images at the level of both papillary muscles perpendicular
to the long axis of the ventricle. We recorded and stored at least three clips of 3-5
consecutive cardiac cycles of each apical and short axis image for off-line digital analysis. All
the measured parameters except speckle-tracking analysis were calculated as the average of
three consecutive beats.
Assessment of dyssynchrony
Color-coded tissue Doppler (Figure 1A). We measured longitudinal dyssynchrony as the
standard deviation of time from onset of QRS to peak systolic velocity (TPVs-SD) within the
ejection phase across 12 (6 basal and 6 mid) segments according to a previously described
method (28).
Pulse wave tissue Doppler image (Figure 1B). We also used an alternative method to assess
longitudinal dyssynchrony by calculating the standard deviation of time from onset of QRS to
peak S wave (pkS-SD) using pulse wave tissue Doppler image in the 12 segments(6).
Page 6 of 41
Copyright Information

Echocardiographic parameters for cardiac dyssynchrony Arita T et al.
7
M-mode (Figure 1C). We defined the septal-to-posterior wall motion delay (SPWMD) as
the time difference between the peak inward excursions of the interventricular septum and
left posterior wall on M-mode images obtained from the mid-short axis view(17).
Speckle-tracking of short axis B-mode image (Figure 1D,E) Analysis of mid-level short
axis images used dedicated software (EchoPac PC, BTO5.0.1, GE Vingmed, Norway) to
determine radial and circumferential dyssynchrony. After tracing the endocardial border at
the end systole, we set the region of interest from the endocardium to the epicardial edge.
Automatic speckle-tracking analyzed each short axis image to track motion of speckles
contained within the region of interest on a frame to frame basis. The software automatically
computed distances between adjacent speckles to obtain the radial and circumferential strain
curves as a function of time. Assessing radial and circumferential dyssynchrony involved
exporting the strain data for automatic processing on a customized program (Matlab,
MathWorks; Natick , Massachusetts) to calculate the standard deviation of time from onset of
QRS to peak radial and circumferential strain (Err, Ecc respectively) across the six mid-level
segments.
Reproducibility of echocardiographic analysis
We used the Bland-Altman method and standard error of the mean to assess inter-
and intra-observer variability.
Intraobserver variability: Bland-Altman analysis computed the limits of agreement for time
to peak systolic velocity, time to peak S wave, SPWMD, time to peak radial strain and time to
peak circumferential strain of 5.2±20.9 msec, -4.3±14.4 msec, -2.6±28.9 msec, -1.4±15.8
Page 7 of 41
Copyright Information

Echocardiographic parameters for cardiac dyssynchrony Arita T et al.
8
msec and 11.6±76.4 msec respectively. The variability for each parameter measured 7.0%,
6.8%, 14.4%, 2.3% and 10.4% respectively. Inter-observer variability: To determine the
inter-observer variability, two independent observers (TA and GPS) performed independent
analysis of the same echocardiographic images. Time to peak systolic velocity, time to
peak S wave, SPWMD, time to peak radial strain and time to peak circumferential strain
showed an average difference of -1.3±19.4 msec, 0.25±24.5 msec, -6.2±23.0 msec, -6.2±33.4
msec and -4.7±81.0 msec respectively. The variability for each parameter measured 9.8%,
7.9%, 17.3%, 6.3% and 15.4% respectively.
Statistical analysis
All the data appear as mean ± SD. For statistical analysis, we used the
Wilcoxon-t-test or Mann-Whitney-U-test to analyze differences in the means. Receiver
operating curve (ROC) analysis was performed to obtain the cut-off point for determining
intraventricular mechanical dyssynchrony with or without heart failure. Area under the curve
(AUC) was computed for each significant parameter. In ROC analysis, the DHF and D served
as separate positive controls with the combined baseline group serving as a negative control.
The relationship between dyssynchrony parameters and basic echocardiographic parameters
was analyzed using linear regression and is expressed as a Pearson’s correlation coefficient
followed by stepwise multivariate regression analysis. Statistical analysis was performed with
commercial software (SPSS 13.0, SPSS Inc, IL, USA). We defined the two-sided p value of <
0.05 as statistically significant.
Results
Baseline characteristics
Page 8 of 41
Copyright Information

Echocardiographic parameters for cardiac dyssynchrony Arita T et al.
9
Figure 2 and Table 1 contain the results of the ablation and pacing intervention in the
three groups of animals. RV pacing after His-bundle ablation increased the QRS duration
from 91.2±12.9 msec to 166.7±14.6 msec but did not affect ejection fraction (D group).
Rapid atrial pacing caused systolic dysfunction (LVEF reduced from 58.7±6.0% to
22.2±4.7 %), but produced no significant change in QRS duration (HF group). Rapid RV
pacing and His-bundle ablation worsened left ventricular ejection fraction (58.4 ± 9.4 to 21.4
± 7.6 %) and prolonged QRS duration (93.7±6. to 166.1±17.5 msec ) to produce
dyssynchrony and heart failure (group DHF).
Echocardiographic parameters of dyssynchrony
a. Color-coded and pulse wave tissue Doppler analysis of longitudinal dyssynchrony.
Junctional ablation or rapid pacing alone did not change the color tissue Doppler-derived
TPVs-SD in the D and HF groups. The combination of ablation and rapid RV pacing
increased TPVs-SD in the DHF group (Table 2 and Figure 3A). Rapid atrial pacing-induced
heart failure (HF with narrow QRS) and the ablation/rapid RV pacing combination (DHF,
heart failure with wide QRS) increased the pulse wave tissue Doppler-derived time to peak
velocity (pkS-SD); dyssynchrony alone (D) did not affect the pkS-SD (Table 2 and Figure
3B). Applying multiple published color-coded and pulse wave tissue Doppler methods
found no statistical significant difference in time to peak longitudinal velocity in the D group;
ablation and rapid RV pacing (DHF group) did affect some parameters (see online
supplemental table 1)
b. M mode measurement of dyssynchrony.
The M mode-derived SPWMD did not change as a result of either dyssynchrony or heart
Page 9 of 41
Copyright Information

Echocardiographic parameters for cardiac dyssynchrony Arita T et al.
10
failure alone but did increase with the combination of dyssynchrony and heart failure (Table 2
and Figure 3C).
c. Radial and circumferential strain analysis from short axis.
The Err increased significantly in all three groups (Table 2 and Figure 3D). The DHF group
demonstrated the greatest change in the Err (>5-fold increase in mean SDV, p=0.001), with
less change in the HF and D groups (2- fold increase, p=0.019 and >3- fold, p=0.018,
increase over baseline respectively). The DHF group showed significantly greater Err than
the D and HF groups (both p<0.001). The results suggest that Err detects dyssynchrony
irrespective of heart failure and may also reflect the degree of dyssynchrony.
The circumferential short axis strain increased in all three groups (Table 2 and Figure 3E).
Circumferential dyssynchrony increased in the D and DHF groups (p=0.03 and p<0.001
respectively). However, the lack of difference in the changes detected in the HF and DHF
groups (p=0.20) suggests that compared to radial strain analysis, circumferential strain
analysis has sensitivity but lacks specificity in detecting dyssynchrony.
Receiver-operator curves (ROC) for echocardiographic parameters of dyssynchrony
Using the D as the positive control for dyssynchrony shows that Err (AUC=0.819)
and Ecc (AUC=0.874) effectively detect dyssynchrony, without heart failure (Table 3A).
Using DHF group as a positive control shows that radial and circumferential dyssynchrony
detect dyssynchrony in heart failure (DHF) better (AUC=1) than tissue Doppler and M-mode
derived parameters (Table 3B). Tissue Doppler and M-mode parameters appear insensitive
while radial and circumferential dyssynchrony appear more sensitive and specific for
Page 10 of 41
Copyright Information

Echocardiographic parameters for cardiac dyssynchrony Arita T et al.
11
detecting dyssynchrony independent of QRS duration. All parameters detect dyssynchrony
with adequate sensitivity and specificity in heart failure associated with prolonged QRS but
radial dyssynchrony had the best overall sensitivity and specificity.
Detecting dyssynchrony in heart failure with narrow QRS
Adopting cut-off values from the ROC analysis (using DHF as positive control)
yields the following results: With cut-off point for Err >63.94 msec, 37.5% (3 of 8) of heart
failure animals demonstrated radial dyssynchrony; with a cut off value for Ecc of >107.69
msec, 50% (4 of 8) showed circumferential dyssynchrony but was less specific.
Relationship between echocardiographic dyssynchrony parameters and global cardiac
function
The longitudinal dyssynchrony parameters (i.e. TPVs-SD and pkS-SD) correlated
with EF, EDV and ESV, but not with QRS duration during univariate analysis. The radial
strain-derived dyssynchrony parameter correlated with EF, ESV, EDV and QRS. The
circumferential strain-derived dyssynchrony parameter and SPWMD correlated with EF, ESV
and QRS, but not EDV (Table 4A). Multivariate analysis showed that TPVs-SD and pkS-SD
independently correlated with EF (p<0.001) but not with QRS duration. In contrast,
SPWMD and Err correlated both with EF and QRS duration (p<0.01) and Ecc correlated with
EF, EDV and QRS duration (p<0.01) (Table 4B).
Discussion
Differences among various parameters to assess dyssynchrony
Page 11 of 41
Copyright Information

Echocardiographic parameters for cardiac dyssynchrony Arita T et al.
12
Preliminary clinical reports demonstrate the value of echocardiography for assessing
cardiac dyssynchrony and predicting response to CRT(2, 17, 28). However, these clinical
parameters to measure mechanical dyssynchrony lack testing in an animal model for cardiac
dyssynchrony. Because of large variability of clinical variables in human, to better test the
sensitivity and specificity of widely used echocardiography measures of dyssynchrony we
designed an experimental model of dyssynchrony and heart failure using the same
echocardiographic technology used in human. We used three canine groups: HF with
narrow QRS (fast atrial pacing with intact AV node), dyssynchrony without HF (wide QRS,
RV pacing only without heart failure), and the combination of both (RV pacing with heart
failure- wide QRS and heart failure). We chose a model of RV apical pacing after
His-bundle ablation for its similarity with dyssynchrony encountered in humans with
spontaneous LBBB (3). Although this may not reflect the whole spectrum of human disease,
nonetheless induces dyssynchronous mechanical activation of the heart and is therefore
useful as positive control for cardiac dyssynchrony. RV pacing induced mechanical
dyssynchrony independent of ventricular size and function(20). Rapid RV pacing after
atrioventricular block induced both dyssynchrony and heart failure. Rapid atrial pacing
produced cardiomyopathy without ECG criteria of dyssynchrony. We used the model to test
various conventional echocardiographic and Doppler parameters and a novel speckle-tracking
method to determine their accuracy in detecting dyssynchrony.
Our results suggest that radial or circumferential strain measured by the novel
speckle-tracking in short axis images detects dyssynchrony with or without heart failure
better than the tissue Doppler-derived echocardiographic parameters (time to peak systolic
velocity). Radial and circumferential strain analysis may be superior to measures of
Page 12 of 41
Copyright Information

Echocardiographic parameters for cardiac dyssynchrony Arita T et al.
13
longitudinal velocity for several reasons. First, the contraction of the ventricle occurs in a
more circumferential rather than longitudinal direction due to the helical architecture of
myocardial fibers(14)-(10). Second, Waldman(25) showed that the amplitude of
longitudinal strain did not change significantly during epicardial pacing while circumferential
and radial strain did change. Third, strain data reflect cardiac deformation, while velocity
data reflect cardiac motion(8); tethering, translational motion or rotation of the heart may
affect time to peak velocity in a given myocardial segment. The peaks of the velocity and
strain curves do not coincide. Peak systolic velocity occurs in early to mid phase of
contraction; however, peak strain for each myocardial segment occurs at the end of segmental
contraction.
Pulse wave tissue Doppler detected dyssynchrony, but not in the absence of heart
failure. Pulse wave tissue Doppler has excellent temporal resolution compared to color-coded
tissue Doppler(16). The multivariate regression analysis demonstrated that both
color-coded and the pulse wave tissue Doppler indices correlated better with ejection fraction
(systolic dysfunction) and less with QRS duration. Yu reported that TPVs-SD correlated with
left ventricular end systolic volume in heart failure patients with narrow and wide QRS
duration during multivariate regression analysis(27). His results and ours suggest that data
from global ventricular size and function, and not the timing of the altered sequence of
contraction affect longitudinal velocity.
The SPWMD has also been proposed to quantitatively assesses dyssynchrony in
patients with heart failure(17). Since the acquisition measures the timing of excursion points,
the angle of acquisition and translation can affect the measurement and distort displacement.
Page 13 of 41
Copyright Information

Echocardiographic parameters for cardiac dyssynchrony Arita T et al.
14
Factors that independently affect septal movement such as right ventricular pressure overload
or prior cardiac surgery could impact radial septal motion and decrease the reliability of this
measurement for the detection of dyssynchrony. Also, although relatively easy to obtain,
the low reproducibility of the SPWMD, as shown in our study and also by Marcus et al(15),
limits its value in clinical use.
Radial or circumferential strain from speckle-tracking analysis
Speckle-tracking analysis provides angle-independent information on motion and
deformation in any direction of a cardiac coordinate system. Several studies demonstrated its
validity against sonomicrometry(1) and tagged MRI(7). Speckle-tracking echocardiography
offers higher temporal resolution than MRI making it suitable for assessing the timing of
cardiac motion. Speckle-tracking offers easier access, less cost, and consumes less time
compared to tagged MRI. In our study, the processing and analysis of echocardiographic data
was automatically performed by a software and therefore independent of operator. The
limitations of speckle-tracking include its dependence on the angle of acquisition in the short
axis. In the present study, this limitation impacted more the measurement of circumferential
(especially posterior wall) rather than radial strain, and might explain the observed large
variability in circumferential strain determination even in the assumingly normal ventricles
(baseline dog). With less variability and similar accuracy in detecting dyssynchrony the
radial strain derived from short axis views was superior to circumferential strain. Our
observations agree with Suffoletto who reported that speckle tracking derived-radial
dyssynchrony has high sensitivity and specificity in predicting response in CRT in humans
(24). That analysis used the difference in time to peak radial strain between two segments
(anteroseptal and posterior wall) to measure dyssynchrony. We used the standard deviation
Page 14 of 41
Copyright Information

Echocardiographic parameters for cardiac dyssynchrony Arita T et al.
15
in time to peak radial strain across six segments in the mid-short axis view to achieve greater
accuracy. We observed that the difference in time to peak radial strain between the
anteroseptal and posterior wall segments increased in D (p=0.047, AUC=0.776) and also in
DHF (p=0.0019, AUC=0.977). However, differences were lower than those calculated
using the SD in the six segment model (Table 3A and 3B).
Mechanical dyssynchrony with narrow QRS
The atrial pacing cardiomyopathy model in this study produced a valid
representation of heart failure with normal QRS duration (fast atrial pacing with normal AV
node conduction). In our study, 30% of the animals with HF and normal QRS duration
displayed radial or circumferential dyssynchrony according to the criteria derived from
analysis of the DHF group. However, although this method is very sensitive to detect
mechanical dyssynchrony per se, it does not identify the threshold value which defines the
response to cardiac resynchronization therapy in subjects with heart failure and normal QRS.
Whether echocardiography and tissue Doppler imaging can detect dyssynchrony accurately
enough to predict CRT response remains to be determined and further studies are required to
test this notion. Our results suggest that longitudinal velocity-derived parameters do not
detect dyssynchrony well; therefore the role of these methods in expanded clinical application
of CRT in the narrow QRS population remains unproven.
Finally, our data suggest that systolic dysfunction may beget intraventricular
mechanical dyssynchrony. Severe systolic dysfunction caused radial dyssynchrony of
similar magnitude to that observed in D group and this was further enhanced in DHF group.
The pattern of mechanical dyssynchrony caused by systolic dysfunction likely differs from
Page 15 of 41
Copyright Information

Echocardiographic parameters for cardiac dyssynchrony Arita T et al.
16
that associated with ECG-defined dyssynchrony (such as in left bundle branch block)(9).
Whether CRT corrects heart failure-related dyssynchrony with normal QRS duration as
effectively as it improves dyssynchrony in heart failure associated with left bundle branch
block needs further testing in prospective human clinical studies.
Limitations of our study
The current study suggests that speckled-tracking derived strain analysis is more
sensitive and specific than velocity-based echocardiographic methods to detect cardiac
dyssynchrony in a canine model of cardiomyopathy with dyssynchrony. The purpose of our
study was to generate a relative homogenous model of dyssynchrony (electrical
dyssynchrony with left ventricular systolic dysfunction) so we can compare various
echocardiographic methods that have been proposed in the human studies to detect
dysynchrony. Therefore to induce dyssynchrony we chose a model of right ventricular
pacing with non-ischemic cardimyopathy. Obviously, our current results cannot be
automatically extrapolated to all various subgroups of cardiac dyssynchrony encountered in
human heart failure (for example ischemic cardiomyopathy). One limitation of this model is
that we were unable to analyze speckle-tracking derived longitudinal strain because the
quality of our echocardiographic images from apical views in dogs was inadequate to
perform this analysis. In humans, with the current technology this can be performed reliably
and reproducibly. Furthermore, the specific cutoffs for various dyssynchrony parameters
need to be validated against response to cardiac resynchronization therapy in humans.
Nonetheless our study suggests that speckle-tracking strain analysis is superior to
longitudinal velocity data and provides the scientific basis to design further studies in which
radial, circumferential or longitudinal strain are compared to longitudinal velocity to test
Page 16 of 41
Copyright Information

Echocardiographic parameters for cardiac dyssynchrony Arita T et al.
17
response from cardiac resynchronization therapy, especially in patients with narrow QRS and
heart failure.
Conclusion
We demonstrated that radial and circumferential strains derived by speckle-tracking in short
axis images accurately identify mechanical dyssynchrony in the presence or absence of left
ventricular dysfunction. The majority of the animals with heart failure and narrow QRS
showed mechanical dyssynchrony during speckle-tracking analysis. Prospective randomized
clinical studies will need to determine whether speckle-tracking radial or circumferential
strain detects dyssynchrony in humans with heart failure accurately enough to identify
appropriate candidates for CRT.
Acknowledgements
The Carlyle Fraser Heart Center provided the research grant to support this study. The authors
would also like to express our gratitude to Maria Alexandra Pernetz RDCS and Jing-Ping Sun
MD for their critical reading of the manuscript.
Page 17 of 41
Copyright Information

Echocardiographic parameters for cardiac dyssynchrony Arita T et al.
18
References
1. Amundsen BH, Helle-Valle T, Edvardsen T, Torp H, Crosby J, Lyseggen E, Stoylen
A, Ihlen H, Lima JA, Smiseth OA, and Slordahl SA. Noninvasive myocardial strain
measurement by speckle tracking echocardiography: validation against sonomicrometry and
tagged magnetic resonance imaging. J Am Coll Cardiol 47: 789-793, 2006.
2. Ansalone G, Giannantoni P, Ricci R, Trambaiolo P, Laurenti A, Fedele F, and Santini
M. Doppler myocardial imaging in patients with heart failure receiving biventricular pacing
treatment. Am Heart J 142: 881-896, 2001.
3. Askenazi J, Alexander JH, Koenigsberg DI, Belic N, and Lesch M. Alteration of left
ventricular performance by left bundle branch block simulated with atrioventricular
sequential pacing. Am J Cardiol 53: 99-104, 1984.
4. Bax JJ, Bleeker GB, Marwick TH, Molhoek SG, Boersma E, Steendijk P, van der
Wall EE, and Schalij MJ. Left ventricular dyssynchrony predicts response and prognosis after
cardiac resynchronization therapy. J Am Coll Cardiol 44: 1834-1840, 2004.
5. Bax JJ, Abraham T, Barold SS, Breithardt OA, Fung JW, Garrigue S, Gorcsan J, 3rd,
Hayes DL, Kass DA, Knuuti J, Leclercq C, Linde C, Mark DB, Monaghan MJ,
Nihoyannopoulos P, Schalij MJ, Stellbrink C, and Yu CM. Cardiac resynchronization therapy:
Part 1--issues before device implantation. J Am Coll Cardiol 46: 2153-2167, 2005.
6. Bordachar P, Lafitte S, Reuter S, Sanders P, Jais P, Haissaguerre M, Roudaut R,
Garrigue S, and Clementy J. Echocardiographic parameters of ventricular dyssynchrony
validation in patients with heart failure using sequential biventricular pacing. J Am Coll
Cardiol 44: 2157-2165, 2004.
7. Cho GY, Chan J, Leano R, Strudwick M, and Marwick TH. Comparison of
two-dimensional speckle and tissue velocity based strain and validation with harmonic phase
magnetic resonance imaging. Am J Cardiol 97: 1661-1666, 2006.
8. D'Hooge J, Heimdal A, Jamal F, Kukulski T, Bijnens B, Rademakers F, Hatle L,
Suetens P, and Sutherland GR. Regional strain and strain rate measurements by cardiac
Page 18 of 41
Copyright Information

Echocardiographic parameters for cardiac dyssynchrony Arita T et al.
19
ultrasound: principles, implementation and limitations. Eur J Echocardiogr 1: 154-170, 2000.
9. Helm RH, Leclercq C, Faris OP, Ozturk C, McVeigh E, Lardo AC, and Kass DA.
Cardiac dyssynchrony analysis using circumferential versus longitudinal strain: implications
for assessing cardiac resynchronization. Circulation 111: 2760-2767, 2005.
10. Ingels NB, Jr., Hansen DE, Daughters GT, 2nd, Stinson EB, Alderman EL, and
Miller DC. Relation between longitudinal, circumferential, and oblique shortening and
torsional deformation in the left ventricle of the transplanted human heart. Circ Res 64:
915-927, 1989.
11. Kanzaki H, Bazaz R, Schwartzman D, Dohi K, Sade LE, and Gorcsan J, 3rd. A
mechanism for immediate reduction in mitral regurgitation after cardiac resynchronization
therapy: insights from mechanical activation strain mapping. J Am Coll Cardiol 44:
1619-1625, 2004.
12. Kerwin WF, Botvinick EH, O'Connell JW, Merrick SH, DeMarco T, Chatterjee K,
Scheibly K, and Saxon LA. Ventricular contraction abnormalities in dilated cardiomyopathy:
effect of biventricular pacing to correct interventricular dyssynchrony. J Am Coll Cardiol 35:
1221-1227, 2000.
13. Leitman M, Lysyansky P, Sidenko S, Shir V, Peleg E, Binenbaum M, Kaluski E,
Krakover R, and Vered Z. Two-dimensional strain-a novel software for real-time quantitative
echocardiographic assessment of myocardial function. J Am Soc Echocardiogr 17: 1021-1029,
2004.
14. MacGowan GA, Shapiro EP, Azhari H, Siu CO, Hees PS, Hutchins GM, Weiss JL,
and Rademakers FE. Noninvasive measurement of shortening in the fiber and cross-fiber
directions in the normal human left ventricle and in idiopathic dilated cardiomyopathy.
Circulation 96: 535-541, 1997.
15. Marcus GM, Rose E, Viloria EM, Schafer J, De Marco T, Saxon LA, and Foster E.
Septal to posterior wall motion delay fails to predict reverse remodeling or clinical
improvement in patients undergoing cardiac resynchronization therapy. J Am Coll Cardiol 46:
Page 19 of 41
Copyright Information

Echocardiographic parameters for cardiac dyssynchrony Arita T et al.
20
2208-2214, 2005.
16. Nikitin NP, and Witte KK. Application of tissue Doppler imaging in cardiology.
Cardiology 101: 170-184, 2004.
17. Pitzalis MV, Iacoviello M, Romito R, Guida P, De Tommasi E, Luzzi G, Anaclerio M,
Forleo C, and Rizzon P. Ventricular asynchrony predicts a better outcome in patients with
chronic heart failure receiving cardiac resynchronization therapy. J Am Coll Cardiol 45:
65-69, 2005.
18. Prinzen FW, Hunter WC, Wyman BT, and McVeigh ER. Mapping of regional
myocardial strain and work during ventricular pacing: experimental study using magnetic
resonance imaging tagging. J Am Coll Cardiol 33: 1735-1742, 1999.
19. Prinzen FW, Van Oosterhout MF, Vanagt WY, Storm C, and Reneman RS.
Optimization of ventricular function by improving the activation sequence during ventricular
pacing. Pacing Clin Electrophysiol 21: 2256-2260, 1998.
20. Prinzen FW, Augustijn CH, Allessie MA, Arts T, Delhaas T, and Reneman RS. The
time sequence of electrical and mechanical activation during spontaneous beating and ectopic
stimulation. Eur Heart J 13: 535-543, 1992.
21. Rosenqvist M, Bergfeldt L, Haga Y, Ryden J, Ryden L, and Owall A. The effect of
ventricular activation sequence on cardiac performance during pacing. Pacing Clin
Electrophysiol 19: 1279-1286, 1996.
22. Sogaard P, Egeblad H, Pedersen AK, Kim WY, Kristensen BO, Hansen PS, and
Mortensen PT. Sequential versus simultaneous biventricular resynchronization for severe
heart failure: evaluation by tissue Doppler imaging. Circulation 106: 2078-2084, 2002.
23. Steendijk P, Tulner SA, Schreuder JJ, Bax JJ, van Erven L, van der Wall EE, Dion
RA, Schalij MJ, and Baan J. Quantification of left ventricular mechanical dyssynchrony by
conductance catheter in heart failure patients. Am J Physiol Heart Circ Physiol 286:
H723-730, 2004.
24. Suffoletto MS, Dohi K, Cannesson M, Saba S, and Gorcsan J, 3rd. Novel
Page 20 of 41
Copyright Information
Echocardiographic parameters for cardiac dyssynchrony Arita T et al.
21
speckle-tracking radial strain from routine black-and-white echocardiographic images to
quantify dyssynchrony and predict response to cardiac resynchronization therapy. Circulation
113: 960-968, 2006.
25. Waldman LK, and Covell JW. Effects of ventricular pacing on finite deformation in
canine left ventricles. Am J Physiol 252: H1023-1030, 1987.
26. Wyman BT, Hunter WC, Prinzen FW, and McVeigh ER. Mapping propagation of
mechanical activation in the paced heart with MRI tagging. Am J Physiol 276: H881-891,
1999.
27. Yu CM, Lin H, Zhang Q, and Sanderson JE. High prevalence of left ventricular
systolic and diastolic asynchrony in patients with congestive heart failure and normal QRS
duration. Heart 89: 54-60, 2003.
28. Yu CM, Zhang Q, Fung JW, Chan HC, Chan YS, Yip GW, Kong SL, Lin H, Zhang Y,
and Sanderson JE. A novel tool to assess systolic asynchrony and identify responders of
cardiac resynchronization therapy by tissue synchronization imaging. J Am Coll Cardiol 45:
677-684, 2005.
29. Zile MR, Blaustein AS, Shimizu G, and Gaasch WH. Right ventricular pacing
reduces the rate of left ventricular relaxation and filling. J Am Coll Cardiol 10: 702-709,
1987.
Page 21 of 41
Copyright Information
Echocardiographic parameters for cardiac dyssynchrony Arita T et al.
22
Figure legends
Figure 1:
(A) Color-coded TDI: time from onset of QRS to peak systolic velocity (TPVs) was
measured (apical four chamber view).
(B) Pulse wave TDI: The time from onset of QRS to peak systolic velocity was measured.
(C) Septal-to-posterior wall motion delay (SPWMD) obtained as timing difference between
most inward excursion point of interventricular septum and posterior wall in M mode
(D) Radial strain curve by speckle tracking analysis; the time to peak radial strain (tErr) was
obtained from two-dimensional image of short axis. Upper panel shows radial strain
waveform obtained from control animal (at baseline), lower panel shows radial strain
waveform obtained from an animal with dyssynchrony and heart failure.
(E) Circumferential strain curve by speckle tracking analysis; the time to peak circumferential
strain (tEcc) was obtained from two-dimensional image of short axis. Upper panel shows
circumferential strain waveform obtained from control animal (at baseline), lower panel
shows circumferential strain waveform obtained from an animal with dyssynchrony and heart
failure
Figure 2: Shown are the results of left ventricular ejection fraction and QRS duration for
each group before implant (pre) and 4 weeks after (post) . (A) Ejection fraction (B) QRS
duration on surface EKG for the same groups. (* P<0.05 post vs pre) (D=dyssynchrony
without heart failure, HF= heart failure with narrow QRS, DHF=dyssynchrony with heart
failure)
Figure 3: Parameters of dyssynchrony by echocardiography for each group. (A) Standard
Page 22 of 41
Copyright Information

Echocardiographic parameters for cardiac dyssynchrony Arita T et al.
23
deviation of (SD) of time to peak systolic velocity by color-coded tissue Doppler image (B)
Standard deviation of time to peak S wave by pulse wave (PW) tissue Doppler image (C)
Septal-to-posterior wall motion delay (SPWMD) on M-mode tracings (D) Standard deviation
of time to peak radial strain by speckle-tracking analysis of B-mode mid short axis image. (E)
Standard deviation of time to peak circumferential strain by speckle-tracking analysis of
B-mode mid short axis image. (* P<0.05 post vs pre) (D=dyssynchrony without heart failure,
HF= heart failure with narrow QRS, DHF=dyssynchrony with heart failure)
Page 23 of 41
Copyright Information

Echocardiographic parameters for cardiac dyssynchrony Arita T et al.
24
Table 1. Basic characteristics (* P<0.05 vs pre, † P<0.05 HF or DHF vs D, ‡ P<0.05 DHF
vs HF )
D (n=12) HF (n=8) DHF (n=9)
pre post pre post pre post
EF(%) 59.7±5.8 60.1±9.9 58.7±6.0 22.2±4.7*† 58.4±9.4 21.4±7.6*†
EDV(ml) 46.8±13.0 41.8±12.8 48.5±12.1 62.7±19.3† 49.6±10.0 71.3±18.3*†
ESV(ml) 19.2±7.2 17.2±9.2 20.5±7.4 48.7±15.9*† 20.5±6.1 56.2±16.3*†
QRS(msec) 91.2±12.9 166.7±14.6* 93.0±9.2 93.4±15.3† 93.7±6.7 166.1±17.5*‡
PQ (msec) 126.5±14.6 122.6±33.3 148.9±18.6 131.4±35.2 126.8±29.9 130.3±33.5
HR (bpm) 82.0±12.0 86.8±17.0 72.1±7.8 101.0±16.9* 80.0±19.8 113.2±15.8*†
Page 24 of 41
Copyright Information

Echocardiographic parameters for cardiac dyssynchrony Arita T et al.
25
Table 2. Dyssynchrony parameters analysis by echocardiography (* P<0.05 vs pre, †
P<0.05 HF or DHF vs D, ‡ P<0.05 DHF vs HF )
D HF DHF
pre post pre post pre post
TPVs
(msec) 17.7±5.2 22.4±10.9 24.9±11.5 35.5±8.3† 21.8±5.4 42.0±13.4*†
pkS
(msec) 16.2±10.3 21.8±9.2 19.7±11.6 36.3±10.2*† 19.3±4.7 35.4±10.1*†
SPWMD
(msec) 74.4±34.0 139.2±110.2 85.5±37.8 127.8±122.7 75.4±40.8 253.2±118.7*†
Err
(msec) 16.6.6±12.0 53.1±32.2* 24.5±22.5 52.0±26.6* 27.3±16.5
137.5±39.7*
†‡
Ecc
(msec) 48.9±23.0 95.9±40.7* 60.1±35.7 116.4±40.3* 31.8±26.0 139.0±22.7*†
Page 25 of 41
Copyright Information

Echocardiographic parameters for cardiac dyssynchrony Arita T et al.
26
Table 3A. Receiver operator curve analysis (D as positive control)
Variables AUC p value 95%CI Cut-off(msec) Sensitivity Specificity
TPVs 0.514 0.886 0.295-0.734
pkS 0.576 0.477 0.375-0.776
SPWMD 0.690 0.069 0.511-0.869
Err 0.819 0.003 0.661-0.976 26.6 90.0 70.4
Ecc 0.874 0.001 0.755-0.993 43.8 100 59.3
Page 26 of 41
Copyright Information

Echocardiographic parameters for cardiac dyssynchrony Arita T et al.
27
Table 3B. Receiver operator curve analysis (DHF as positive control)
Variables AUC p value 95%CI Cut-off(msec) Sensitivity Specificity
TPVs 0.904 <0.001 0.787-1.021 28.20 88.9 86.2
pkS 0.931 0.001 0.838-1.023 23.03 100.0 83.3
SPWMD 0.877 0.001 0.685-1.068 190.00 77.8 100.0
Err 1.000 <0.001 1.000-1.000 63.94 100.0 100.0
Ecc 1.000 <0.001 1.000-1.000 107.69 100.0 100.0
Page 27 of 41
Copyright Information

Echocardiographic parameters for cardiac dyssynchrony Arita T et al.
28
Table 4A. Univariate analysis for relationship between dyssynchrony parameters and
basic characteristics
TPVs pkS SPWMD Err Ecc
r p r p r p r p r p
EF -0.688 <0.001 -0.666 <0.001 -0.427 0.001 -0.657 <0.001 -0.610 <0.001
EDV 0.505 <0.001 0.501 <0.001 0.196 0.153 0.345 0.011 0.103 0.465
ESV 0.665 <0.001 0.655 <0.001 0.349 0.009 0.565 <0.001 0.399 0.003
QRS .0.286 0.030 0.188 0.195 0.462 <0.001 0.612 <0.001 0.470 <0.001
Page 28 of 41
Copyright Information

Echocardiographic parameters for cardiac dyssynchrony Arita T et al.
29
Table 4B. Multivariate stepwise regression analysis for relationship between
dyssynchrony parameters and basic characteristics.
TPVs pkS SPWMD Err Ecc
beta p beta p beta p beta p beta p
EF -0.684 <0.001 -0.666 <0.001 -0.357 0.003 -0.569 <0.001 -0.798 <0.001
EDV 0.153 0.217 0.158 0.25 -0.121 0.399 -0.100 0.311 -0.426 <0.001
ESV 0.268 0.196 0.313 0.146 -0.223 0.354 -0.167 0.309 0.022 0.968
QRS 0.162 0.106 0.145 0.187 0.4 0.001 0.516 <0.001 0.394 <0.001
Page 29 of 41
Copyright Information

Page 30 of 41
Copyright Information

Figure 1B
Page 31 of 41
Copyright Information
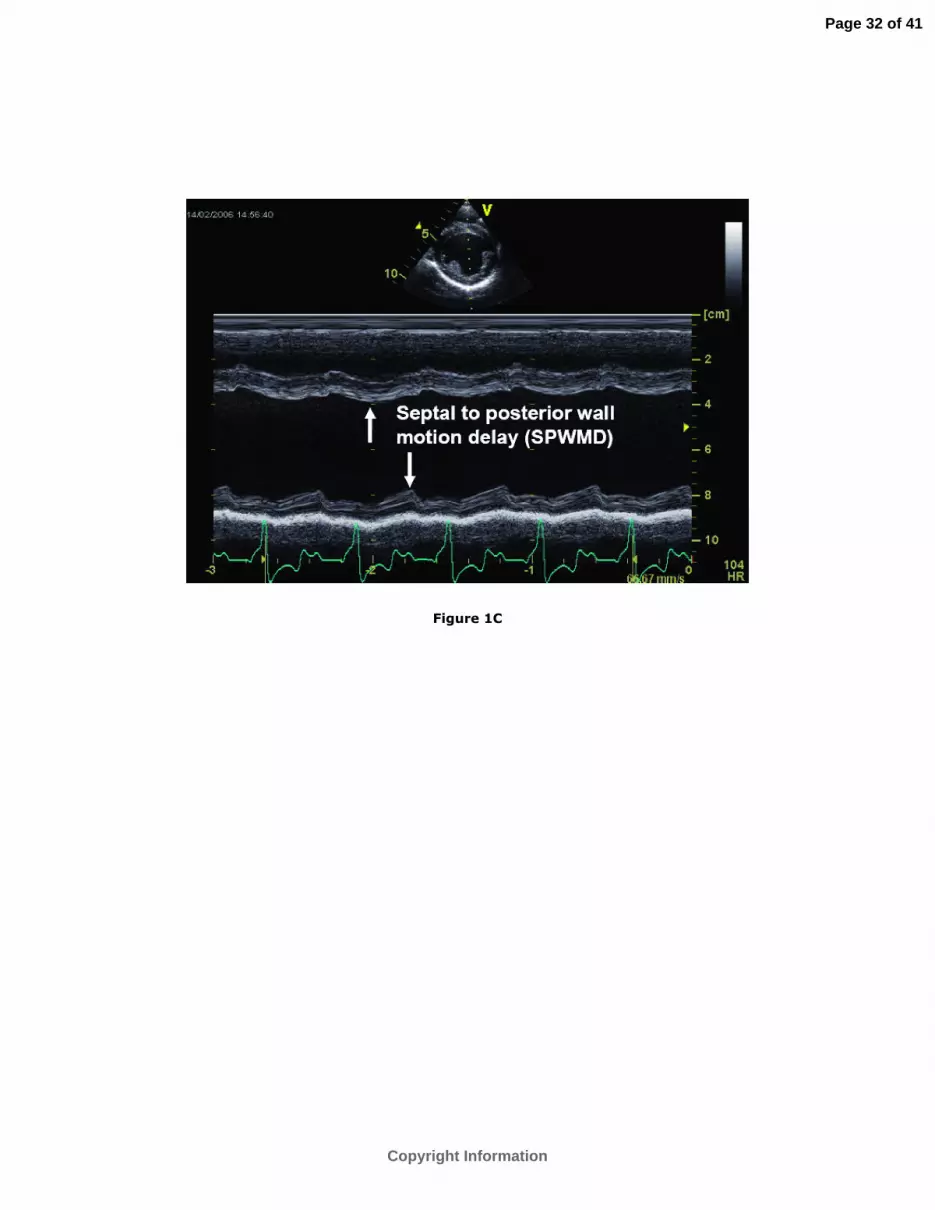
Figure 1C
Page 32 of 41
Copyright Information

Figure 1D
Page 33 of 41
Copyright Information

Figure 1E
Page 34 of 41
Copyright Information

Figure 2A
Page 35 of 41
Copyright Information

Figure 2B
Page 36 of 41
Copyright Information

Figure 3A
Page 37 of 41
Copyright Information

Figure 3B
Page 38 of 41
Copyright Information

Figure 3C
Page 39 of 41
Copyright Information

Figure 3D
Page 40 of 41
Copyright Information

Figure 3E
Page 41 of 41
Copyright Information


