Embed Size (px)
Citation preview
Spectral cytopathology of cervical samples: detectingcellular abnormalities in cytologically normal cellsJennifer M Schubert1, Benjamin Bird1, Kostas Papamarkakis1, Milos Miljkovic1, Kristi Bedrossian2, Nora Laver2 andMax Diem1
Spectral cytopathology (SCP) is a novel spectroscopic method for objective and unsupervised classification of individualexfoliated cells. The limitations of conventional cytopathology are well recognized within the pathology community.In SCP, cellular differentiation is made by observing molecular changes in the nucleus and the cytoplasm, which may ormay not produce morphological changes detectable by conventional cytopathology. This proof of concept study showsSCP’s potential as an enhancing tool for cytopathologists by aiding in the accurate and reproducible diagnosis of cellsin all states of disease. Infrared spectra are collected from cervical cells deposited onto reflectively coated glass slides.Each cell has a corresponding infrared spectrum that describes its unique biochemical composition. Spectral data areprocessed and analyzed by an unsupervised chemometric algorithm, principal component analysis. In this blind study,cervical samples are classified by analyzing the spectra of morphologically normal looking squamous cells from normalsamples and samples diagnosed by conventional cytopathology with low-grade squamous intraepithelial lesions. SCPdiscriminated cytopathological diagnoses amongst 12 different cervical samples with a high degree of specificity andsensitivity. SCP also correlated two samples with abnormal spectral changes: these samples had a normal cytopatho-logical diagnosis but had a history of abnormal cervical cytology. The spectral changes observed in the morphologicallynormal looking cells are most likely because of an infection with human papillomavirus (HPV). HPV DNA testing wasconducted on five additional samples, and SCP accurately differentiated these samples by their HPV status. SCP tracksbiochemical variations in cells that are consistent with the onset of disease. HPV has been implicated as the cause ofthese changes detected spectroscopically. SCP does not depend on identifying the sparse number of morphologicallyabnormal cells within a large sample to make an accurate classification, as does conventional cytopathology. Thesefindings suggest that the detection of cellular biochemical variations by SCP can serve as a new enhancing screeningmethod that can identify earlier stages of disease.Laboratory Investigation (2010) 90, 1068–1077; doi:10.1038/labinvest.2010.72; published online 5 April 2010
KEYWORDS: cervical cancer; cytopathology; human papillomavirus; infrared micro-spectroscopy; spectral cytopathology
In the past 10 years, infrared spectroscopic methods haveemerged for the diagnosis of disease in cells and tissues. Thespectroscopic approach is based on infrared micro-spectro-scopy (IR-MSP), coupled to unsupervised multivariatemethods of analysis, such as principal component analysis(PCA, see below). This combination of IR-MSP and PCA isreferred henceforth as spectral cytopathology (SCP). Thestandard to which SCP results are placed in juxtaposition isconventional cytopathology, which relies on the well-trainedeyes of a cytopathologist to differentiate between normal andabnormal cell types. This methodology, first introduced by
Papanicolaou in the early 1920s, uses exfoliated cells from theanatomical region of interest that are subsequently stainedand examined under a microscope for morphologicalchanges.1,2 The cytopathologist’s task is to positively identifyand diagnose a small number of cells within a sample con-taining approximately 10 000 cells that may show subtlemorphological changes in the early stages of dysplasia todirect patient care in the clinic.
The prevalence of cervical cancer decreased 75% between1955 and 1992 as a direct result of the cervical cancerscreening methods introduced by Papanicalou. However, the
Received 30 June 2009; revised 15 January 2010; accepted 8 February 2010
1Laboratory for Spectral Diagnosis, Department of Chemistry and Chemical Biology, Northeastern University, Boston, MA, USA and 2Cytopathology, Department ofPathology, Tufts Medical Center, Boston, MA, USACorrespondence: J Schubert, Department of Chemistry and Chemical Biology, Northeastern University, 360 Huntington Avenue, 102 Hurtig Hall, Boston,MA 02115, USA.E-mail: [email protected]
Laboratory Investigation (2010) 90, 1068–1077
& 2010 USCAP, Inc All rights reserved 0023-6837/10 $32.00
1068 Laboratory Investigation | Volume 90 July 2010 | www.laboratoryinvestigation.org
American Cancer Society estimates that 11 270 women will bediagnosed with invasive cervical cancer in 2009.3 A review bythe US Department of Health and Human Service’s Agencyfor Healthcare Research and Quality that evaluated cervicalcytology, found the specificity of the Pap smear screening tobe 0.98, 95% confidence interval (CI) 0.97–0.99, and thesensitivity to be 0.51, 95% CI 0.37–0.66.4 The low accuracybecause of false-negative results is widely recognized andacknowledged within the pathology community. False-nega-tive results are primarily because of a low number of ab-normal cells in a sample, but may also be the result of poorsample collection; a gradual transition of cells from a normalmorphology to an abnormal morphology; biological con-taminants such as blood and infectious organisms; samplepreparation; and the inherent subjectivity of the diagnosis.Consequences of false-negative test results are compoundedby low rates of interobserver reproducibilty in accuratelygrading dysplasia of the uterine cervix.5,6 These results affectpatient care, and frequently require follow-up testing interms of another Pap test and, in the case of atypical squa-mous cells of undetermined significance (ASCUS) a humanpapillomavirus (HPV) DNA test. Current research has shownthat combined Pap screening and HPV DNA testing mayoffer an improvement in sensitivity to over 99%. AlthoughHPV DNA testing is the state of the art in terms of treatingand tracking the course of the disease in infected women, co-testing would not be cost-effective.7
These diagnostic challenges are not limited to cervicalsmears alone; cytological diagnoses from other body siteshave equal or worse sensitivity. In a study of the accuracy ofurinary cytology in daily practice, it was found that the di-agnostic sensitivity of high-grade transitional cell neoplasmswas roughly 79% whereas the sensitivity in low-grade tran-sitional cell neoplasms was confirmed at approximately26%.8 The accuracy of clinical diagnosis was also studied ininterstitial lung diseases and for patients who underwentsurgical lung biopsy, in these cases the diagnoses were 62%accurate.9 The accuracy rate is dependent on the presence ofdiagnostic morphological features and on adequate tissuesamples.
To overcome some of the inherent obstacles of conven-tional cytopathology, a significant amount of research hasbeen focused on applying SCP to procure a more objectivediagnosis of cells. The aim of these studies is to develop asynergistic methodology using SCP that would assist cyto-pathologists in improving the overall accuracy of cytologicaldiagnoses through collaborative work between bio-spectro-scopists and cytopathologists.
The study by Wong10–12 in the early 1990s claimed thatIR-spectroscopy could differentiate between normal, dys-plastic, and cancerous cervical cells in pellets based ondecreased glycogen peaks and increased symmetric and anti-symmetric phosphate stretching intensities. However, follow-up studies undertaken by other groups indicated that thespectral changes observed by Wong were not related to the
molecular composition of dysplastic cells, but to confound-ing contributions made by different cell types present withina smear. Benign variations such as inflammation, metaplasia,the ratio of non-dividing to dividing cells, and the overalldivisional activity of the cells will also dramatically changethe IR spectrum collected.13–19 As these problems were re-cognized, it also became apparent that other contaminatesmay affect the spectra, including blood, mucus, micro-organisms, and semen.20
Today, advances in instrumentation technology permit thecollection of a spectrum from an individual cell, opposed tocells in pellet form. In 2006, initial studies explored thespectral variance among individual cells from homogeneouscell samples.21,22 A model system using individual cells fromcanines was used to examine effects of cellular maturation.Homogeneous squamous cells were exfoliated from thecervix of both estrus and non-estrus dogs. Unsupervisedstatistical analysis using PCA showed distinct separationbetween these two states of maturation. These observed dif-ferences are due to hormones that initiate cells to maturewhen canines are in estrous.21
The aim of this research paper is to establish a primaryproof of concept for SCP as a potential diagnostic tool forcytopathologists evaluating gynecological samples. Althoughhundreds of samples have been analyzed by SCP to date, onlya small number of samples with sufficient patient back-ground information were incorporated into this preliminarystudy. However, over 3000 cells were included from 17 pa-tient samples, which is statistically significant. The method ofanalysis, PCA, is not a diagnostic algorithm, but an un-supervised classification algorithm that does not requiretraining or validation data: PCA simply identifies quantifi-able spectral differences and classifies the data accuratelywithout user input. Therefore, in terms of this proof ofconcept study with a limited number of patient samples, PCAis a suitable classification algorithm.
SCP is unique in that it takes a snapshot of a cell’s bio-chemical composition. This snapshot encompasses all thebiochemical processes in the cell at the time of exfoliation.This includes, but is not limited to, any defining hormonalinfluences or inherent viral infections, which may not bereflected in the cell’s morphology. The cervical samples usedin the SCP analysis were correlated with cytopathologicalinterpretations. Non-diagnostic, or normal looking, cellswere selected from samples with a cytological diagnosis oflow-grade dysplasia. We show that SCP has the sensitivityrequired to differentiate these cervical cells, from normalcells of healthy patients based on the infrared analysis oftheir biochemical composition. DNA testing was performedon five additional samples, diagnosed with normal cyto-pathology and low-grade squamous intraepithelial lesion(LSIL) to confirm the presence of any high-risk HPV(hrHPV) strains. Morphologically normal cells of hrHPVþsamples (one LSIL sample, one normal cytology sample) weredifferentiated from cells of cytologically normal hrHPV– samples
Spectral cytopathology of cervical samples
JM Schubert et al
www.laboratoryinvestigation.org | Laboratory Investigation | Volume 90 July 2010 1069
by PCA. This study parallels oral cytology studies in ourlaboratory that distinguish cells from a normal sample tothose in a sample diagnosed as reactive or cancerous.23
MATERIALS AND METHODSSample PreparationAll cervical samples were obtained in collaboration with theCytopathology Division of the Pathology Department atTufts Medical Center (Boston, MA, USA) after routine test-ing and follow-up had been performed. Samples on cytolo-gical brushes were perserved in SurePaths solution(Burlington, NC, USA), and adequate cellularity remainedfor SCP analysis. Subsequently, cells were vortexed off thebrushes, filtered to remove debris, and deposited onto ‘low-e’microscope slides (Kevley Technologies, Chesterland, OH,USA) using cytocentrifugation (CytoSpin, Thermo,Waltham, MA, USA). Ethical approval for this study wasprovided by a local institutional review board and supportedby the National Institute of Health (NIH).
Data CollectionInfrared spectral data were collected from a 4mm� 4mmarea of the sample deposited on a low-e slide in imagingmode using one of two Perkin Elmer Spectrum One/Spot-light 400 imaging IR micro-spectrometers (Sheldon, CT,USA) in the Laboratory for Spectral Diagnosis at North-eastern University. The instrument optical bench, the infra-red microscope, and an external microscope enclosure boxwere purged with a continuous stream of dry air (�40 1Cdew point). Inside the purge chamber, the relative humidityis below the limits of detectability using standard commercialhygrometers (o5% relative humidity). The following dataacquisition parameters were used: 4 cm�1 spectral resolution,
6.25 mm� 6.25 mm pixel size, Norton–Beer apodization, onelevel of zero-filling, no atmospheric background correction.Two co-added interferograms for each pixel were Fouriertransformed to yield spectral vectors, each covering the 4000–700 cm�1 range at 2 cm�1 intervals. Background spectra forall 16 detector elements were collected using 128 co-addedinterferograms. Data were collected in reflectance mode. Rawdata sets consist of 409 600 spectra, occupy ca. 2.54 GByteeach and are stored in native instrument data format (.fsm).
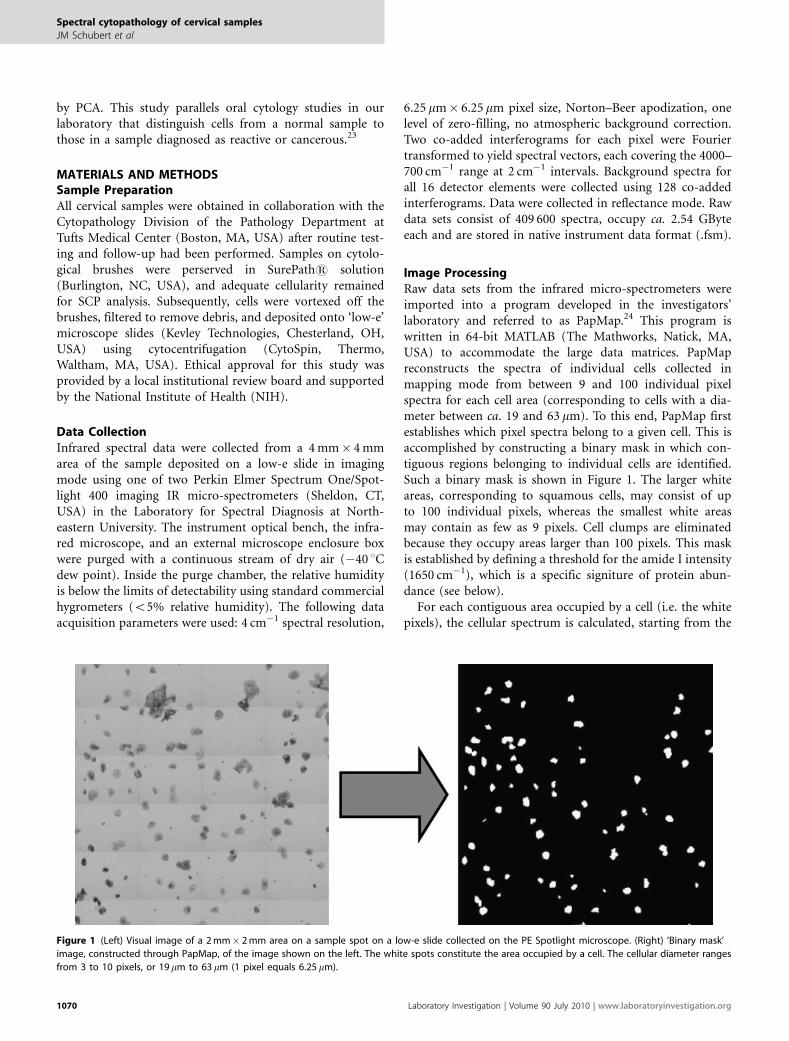
Image ProcessingRaw data sets from the infrared micro-spectrometers wereimported into a program developed in the investigators’laboratory and referred to as PapMap.24 This program iswritten in 64-bit MATLAB (The Mathworks, Natick, MA,USA) to accommodate the large data matrices. PapMapreconstructs the spectra of individual cells collected inmapping mode from between 9 and 100 individual pixelspectra for each cell area (corresponding to cells with a dia-meter between ca. 19 and 63 mm). To this end, PapMap firstestablishes which pixel spectra belong to a given cell. This isaccomplished by constructing a binary mask in which con-tiguous regions belonging to individual cells are identified.Such a binary mask is shown in Figure 1. The larger whiteareas, corresponding to squamous cells, may consist of upto 100 individual pixels, whereas the smallest white areasmay contain as few as 9 pixels. Cell clumps are eliminatedbecause they occupy areas larger than 100 pixels. This maskis established by defining a threshold for the amide I intensity(1650 cm�1), which is a specific signiture of protein abun-dance (see below).
For each contiguous area occupied by a cell (i.e. the whitepixels), the cellular spectrum is calculated, starting from the
Figure 1 (Left) Visual image of a 2mm� 2mm area on a sample spot on a low-e slide collected on the PE Spotlight microscope. (Right) ‘Binary mask’
image, constructed through PapMap, of the image shown on the left. The white spots constitute the area occupied by a cell. The cellular diameter ranges
from 3 to 10 pixels, or 19 mm to 63 mm (1 pixel equals 6.25mm).
Spectral cytopathology of cervical samples
JM Schubert et al
1070 Laboratory Investigation | Volume 90 July 2010 | www.laboratoryinvestigation.org
spectrum with the largest amide I intensity. This spectrum ispresumably from the nucleus of the cell, which always showsthe strongest protein intensity. Subsequently, all spectraidentified by the binary mask to be associated with a cell areco-added and subject to several constraints, to preventvery weak spectra with poor signal-to-noise contaminatingthe cell spectrum and to prevent spectra from the edgesof a cell, which may be contaminated by scattering25–27 tobe co-added. The co-added cellular spectra, as well as thecoordinates of each cell, are exported for further dataanalysis.
After infrared data collection, the cells on a slide aremanually stained using standard cytological stain combina-tions: Protocol OG6 (Fisher Scientific, Kalamazoo, MI, USA);EA-50 (Surgipath Medical Industries, Richmond, IL, USA);Hemotoxylin 1, Clarifier 1, and Bluing (Richard-Allan Sci-entific, Kalamazoo, MI, USA). Tap water and solutions ofethanol are used in the washing steps. Finally, to avoid de-gradation, slides are dipped in xylene and cover-slipped forcytological analysis. Next, visual images at 40� magnifica-tion of each stained cell are collected at the coordinates in-dicated by the PapMap algorithm, using an Olympus BX40microscope fitted with a computer-controlled stage and aQImaging GO3 3MB digital color camera. The images andcellular spectra are linked and stored in a database for easyidentification. The cell images are diagnosed by a cyto-pathologist, and the resulting medical diagnosis is correlatedto spectral and cytologic data.
Data AnalysisData were pre-processed as follows: the spectral range foranalysis of cervical cells was restricted to 3100–2800 and1700–1200 cm�1, because the 2800 to 1700 cm�1 is devoid ofspectral information. Subsequently, second derivatives of thespectral intensities vs wavenumber were calculated, using anine-point sliding window28 and vector normalized.
The spectral range from 1700 to 1200 cm�1 was chosen forsubsequent analysis because it eliminated confounding effectscaused by glycogen contribution. Glycogen shows a triad ofspecific peaks between 1250 and 1000 cm�1, and could beused to follow cyclic changes.29,30 However, variations inglycogen abundance in cells can be caused by a number ofconditions, and it is difficult to correlate these causes in adiagnostic application. The 1700–1480 cm�1 spectral regioncontains two dominate protein peaks, known as the amide I(1650 cm�1, C¼O stretching) and amide II (B1550 cm�1,C–N stretching and N–H deformation) vibrations in theprimary protein structure. Changes in these peaks, with re-gards to band shape, position, and appearance of shoulders,are due to overall changes in the abundance of specificproteins. The region between 1480–1200 cm�1 containsspectral bands related to other biochemical components,including DNA and RNA, phosphates and phospholipids. Anincrease in intensity of the DNA band may be indicativeof a viral infection because of its high replication rate. The
3100–2800 cm�1 region contains the C–H stretchingvibrations of mainly lipids and phospholipids.
At this point, PCA, an unsupervised method of multi-variate analysis, was performed. The term ‘unsupervisedanalysis’ means that training data and validation data are notneeded to accurately classify data. For a detailed explanationof PCA, the reader is referred to Adams.31 PCA was carriedout using the PLS Toolbox 402 (Eigen Vector Research,Wenatchee, WA, USA) in MATLAB. The results from PCAare presented in the form of ‘scores plots’, in which thespectrum of each cell is represented by a dot in a coordinatesystem that indicates the contributions of principal compo-nent (PC) 2 and 3 to the spectrum of the cell. The PCs areobtained from the eigenvectors of the correlation matrix ofthe data set, and represent a totally unbiased decompositionof cellular spectra. Although this method is not suitable fordiagnostic purposes, we use it at this stage to determinewhether or not there are systematic changes in cellularspectra and to classify these spectral changes.
Sample SelectionThe cyclic fluctuations of estrogen and progesterone, thehormones influencing the proliferation and differentiation ofthe cervical epithelium, cause inevitable biochemical effectsthat make diagnosis by SCP more difficult because the phaseof the menstrual cycle has to be considered. Therefore, allcervical samples used in this study were from patients whowere taking hormonal contraceptives. Hormonal contra-ceptives prevent pregnancy by maintaining the patient’shormone levels to that of the ovulation–luteal phase of atypical cycle. For this study, it is assumed that all patientshave a similar estrogen and progestrone profile.
Superficial squamous cells from five samples diagnosedby a cytopathologist as ‘negative for intraepithelial lesionor malignancy’ (referred to as normal for the remainderof this paper) and from five samples diagnosed by a cyto-pathologist with ‘epithelial cell abnormality: LSIL, encom-passing HPV’ were scrutinized by SCP. Two additionalsamples that had a normal cytopathological diagnosis at thetime of sample collection, but had a recent history of cervicaldisease, were also included. As data were acquired for un-stained cells, both morphologically normal and abnormalcells are included in the data sets from LSIL samples.However, PCA was executed in two steps: first, normal cellsfrom normal samples were compared with morphologicallynormal looking cells from LSIL samples (Figure 2); second,cells with morphological abnormalities were compared withmorphologically normal looking cells from LSIL samples(Figure 3).
An additional study evaluated the presence of hrHPVstrains (16, 18, 31, 33, 35, 39, 45, 51, 52, 56, 58, 59, 68) byperforming a DNA test using the Digene Hybrid Capture IItechnique (Qiagen, Valencia, CA, USA). Five samples wereincluded in this study (all on hormonal contraceptives): fourhad a normal cytopathological diagnosis, and one was
Spectral cytopathology of cervical samples
JM Schubert et al
www.laboratoryinvestigation.org | Laboratory Investigation | Volume 90 July 2010 1071
diagnosed with low-grade dysplasia. Three of the normalsamples were hrHPV negative. The dysplastic sample and oneof the normal samples were hrHPV positive. Only morpho-logically normal looking cells were analyzed. Figure 4 showsthe PCA results.
The investigators acknowledge the low number of samplesin this proof of concept study. This paper reports partial
results from a much larger study involving well over 100patients; however, only those patients for whom the hor-monal status was known accurately were included. Thus, the3000 cellular spectra from 17 patient samples represent a dataset, which is devoid of confounding hormonal influences. Inthe first part of the study (Figures 2 and 3), we show thespectral differentiation of truly normal cells from patients
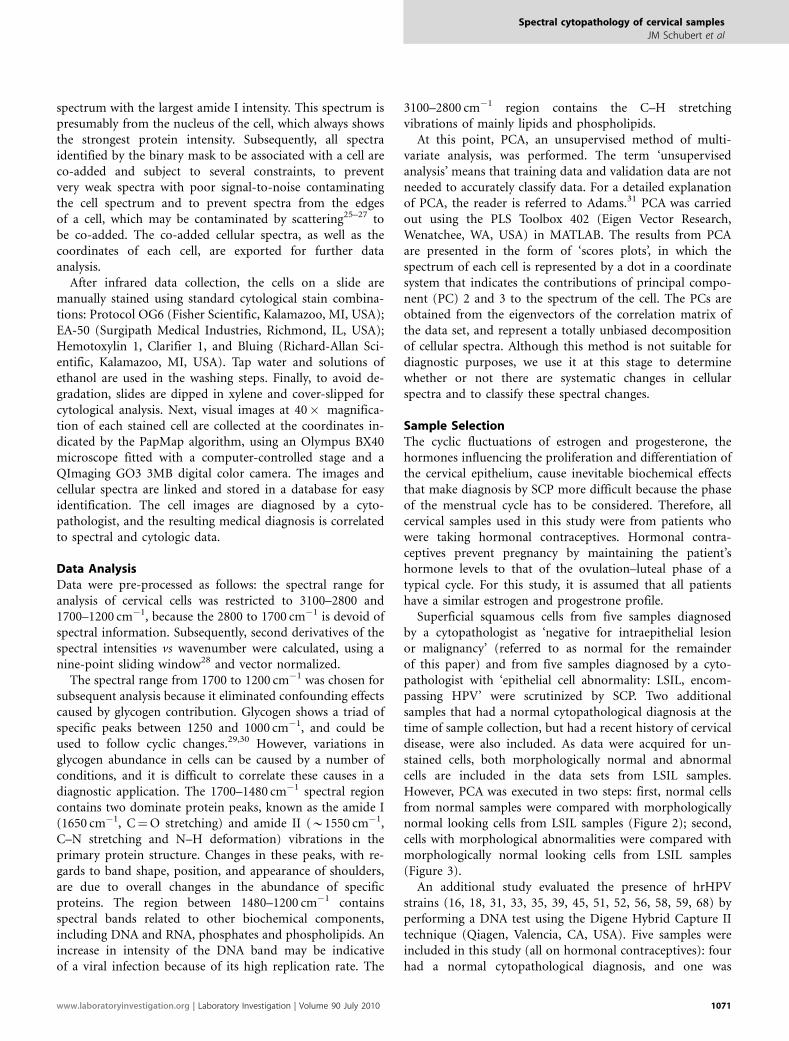
Figure 2 (a) PCA scores plot of cervical cells from five normal samples (blue), five abnormal samples (red), and two samples from patients with a history of
an abnormal Pap test (yellow). The number of cells included from each sample is listed in Table 1. Each symbol represents the spectrum of an individual cell.
There is a separation of the blue and red classes along PC2. The cellular spectra from samples of patients with a history of abnormal cervical cytology
(yellow) co-cluster with the abnormal samples (red). All cells were morphologically normal as shown in (b–d), representing high-resolution 40� images of
cells from each classification. (e) Mean second derivative vector normalized spectra of the normal samples and abnormal samples for the spectral range
3100–2800 and1700–1200 cm�1.
Spectral cytopathology of cervical samples
JM Schubert et al
1072 Laboratory Investigation | Volume 90 July 2010 | www.laboratoryinvestigation.org
diagnosed as normal and from morphologically normallooking cells from patients diagnosed as LSIL or history ofLSIL. In the second part of the study (Figure 4), we provideevidence that the spectral differences between healthy sam-ples and diseased samples is due to the presence of hrHPV.The same trends were observed in a study of oral cellssubmitted previously.23
RESULTSFigure 2a depicts a PCA-based scores plot that blindly dif-ferentiates the majority of cells into two classes: cells fromnormal samples (Table 1, samples 1–5, blue) and morpho-logically normal looking cells from abnormal samples (Table 1,samples 6–10, red). In addition, two samples, shown inyellow (Table 1, samples 11–12), were diagnosed by the cy-topathologist as normal, but had a recent history of abnormalcervical cytology. SCP classified both of these samples withthe abnormal samples. Table 1 outlines the original cytolo-gical diagnosis as well as the number of individual cells usedfrom each sample in the SCP analysis. Representative cellsfrom each classification: normal, morphologically normallooking cells from abnormal samples, and samples with ahistory of abnormal Pap test results, are depicted in Figures2b–d, respectively.
Figure 2e depicts the mean cellular spectral changes of thesecond derivative spectra between the normal samples and
the abnormal samples. The most notable spectral changes arein the amide I and amide II manifolds. The term ‘manifold’ isused here because these bands are superpositions of theprotein spectral features of hundreds of cellular proteins, andtherefore, do not represent the vibrations of one, but mul-tiple proteins. Small variations in the peak height ratio forthe amide I and amide II bands are apparent. More sig-nificantly, there is a discernable change in the ratio of theamide I and its low-frequency component at 1624 cm�1.These differences may be interpreted in terms of a change inthe proteome of the cells. Changes in band shape and peakposition are also apparent in the rest of the spectral regionanalyzed. This figure is the first report of biochemical com-positional changes between morphologically normal lookingcells from normal and diseased cervical samples. Excellentspectral quality, and the averaging of hundreds of individualcells, allow for the characterization of these spectral differ-ences, which are directly related to the discrimination ofclasses shown in Figure 2a.
Conventional cytopathology requires the identification ofabnormal cells, which may be few, within a sample ofthousands of non-diagnostic cells, to make a diagnosis. SCPdoes not rely on the chance of picking out diagnostic sparsecells. In fact, the infrared spectral signatures for cells showingmorphological abnormalities and normal looking cells fromthe same abnormal samples are nearly indistinguishable,
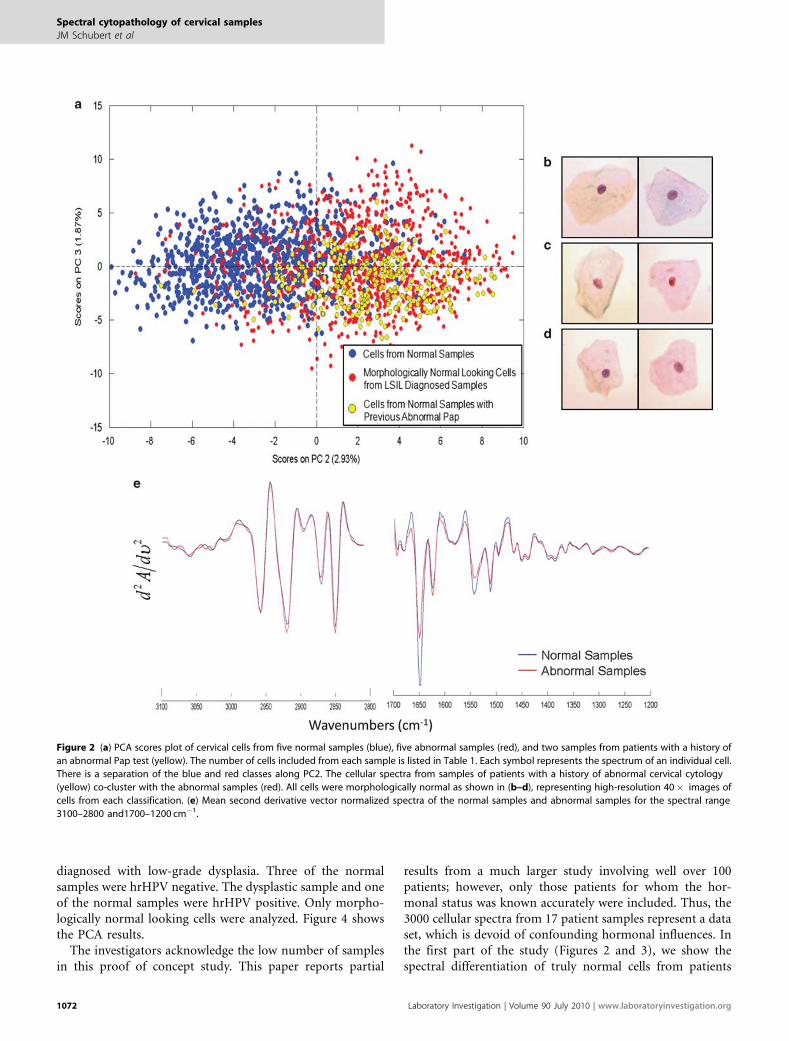
Figure 3 (a) PCA scores plot of eight cells that show morphological abnormalities (green) and the morphologically normal looking cells (red) from the same
two samples. (b, c) Representative high-resolution 40� images of a morphologically normal looking cell and a morphologically abnormal cell, respectively.
Spectral cytopathology of cervical samples
JM Schubert et al
www.laboratoryinvestigation.org | Laboratory Investigation | Volume 90 July 2010 1073
but quite different from those of normal cells from healthypatients. Figure 3a depicts a PCA-based scores plot in whicheight morphologically abnormal cells from two samples di-agnosed with LSIL were compared with the morphologicallynormal looking cells from the same samples. These eightcells, with reactive and atypical morphological features, co-cluster with the morphologically normal looking cells. High-resolution images of representative cells from each classifi-cation are shown in Figures 3b and c. Although these cells areundoubtedly very different, the spectral patterns of the cellsshowing abnormal morphologies and morphologically nor-mal looking cells are nearly equivalent.
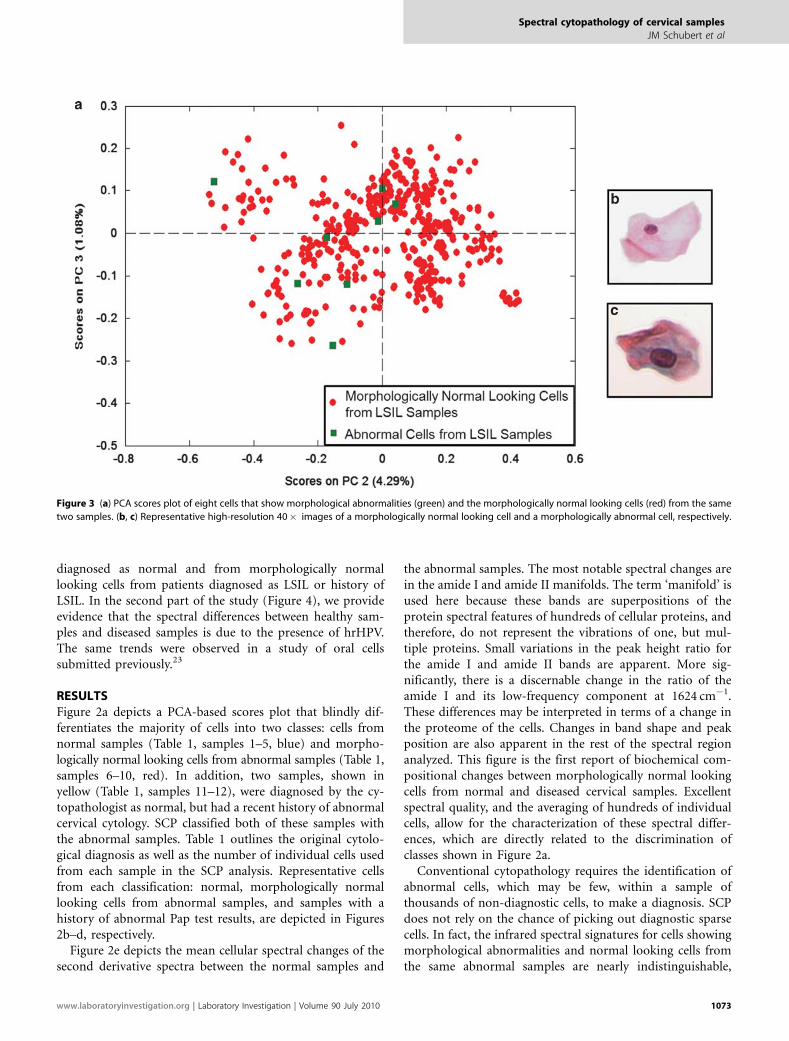
The PCA scores plot in Figure 4 shows for the first timethat there are quantifiable differences between hrHPV-infected and hrHPV-negative cells, even when analyzing onlynormal looking cells. The three hrHPV– samples withcorresponding normal cytology (Table 1, samples 13–15,blue circles) cluster away from the two hrHPVþ samples(Table 1, samples 16–17). One of these hrHPVþ samples(sample 16, black squares) had a normal cytological diagnosiswith no known history of cervical disease. The most notablespectral changes shown in Figure 4b are in the amide I andamide II regions; however, there are some distinct changes inthe DNA, RNA, and phosphate bands as well as in the C–Hstretching region.
DISCUSSIONIn the first part of this preliminary study, SCP was used tosuccessfully differentiate cytologically indistinguishablesquamous cells from normal samples and LSIL samples, andshow how cells showing abnormal patterns are not necessaryfor SCP an accurate diagnosis. In the second part of thisstudy, SCP distinguished spectral differences between cellsbased on hrHPV status.
Studies have shown that HPV DNA can be found in 99.7%of all cervical cancers,32 and it has been proven that infectionof hrHPV is a necessary prerequisite for the development ofcervical cancer.33 Cervical dysplasia is commonly an earlymanifestation of HPV infection, typically appearing 4–24months after exposure. Invasive cervical cancer is a rare andlate manifestation of HPV infection, with an average detec-tion period of 10–20, even 30 years.34
The PCA scores plot in Figure 2a undeniably illustrates thepower of SCP, because there is a strong separation of the redand blue classes along PC2. PC2 is directly related to the mostsignificant spectral differences between normal healthy cellsand morphologically normal looking cells from abnormalsamples. These changes are described in the mean secondderivative spectra in Figure 2e: a dramatic increase of theamide I low-frequency component and the decrease in theamide I to amide II peak height ratio. The source of these
Figure 4 (a) PCA scores plot of five samples that were tested for hrHPV DNA: three samples with normal cytology were hrHPV negative (blue circles), one
sample with normal cytology was hrHPV positive (black squares), and one sample was diagnosed by cytology with low-grade dysplasia and was hrHPV
positive (red squares). The samples differentiate along PC2 based on their HPV status. (b) Mean second derivative vector normalized spectra for each class
for the spectral range 3100–2800 and 1700–1200 cm�1.
Spectral cytopathology of cervical samples
JM Schubert et al
1074 Laboratory Investigation | Volume 90 July 2010 | www.laboratoryinvestigation.org
changes in the protein composition may be the result of aviral infection, HPV, or other, disease-specific changes inprotein content. These samples were not tested for HPVDNA, but there is strong evidence that cervical abnormalitiesare due to viral infection. Similar results have been observedin oral SCP studies of patients infected with the herpessimplex virus: although the majority of the cells are mor-phologically normal, a progression of disease can be observedranging from healthy normal cells, to morphologically nor-mal infected cells, and finally, cells infected with the herpessimplex virus.23 Although the cells from the abnormalsamples used in this analysis were morphologically normal,they showed abnormal spectral changes in the majority ofthe cells using SCP. Some morphologically normal lookingcells did co-cluster with the normal cells in Figure 2a. This isexpected because all cells may not show the same biochemicalchanges.
The biochemistry of the cells in the samples with a historyof cellular abnormality (yellow) in Figure 2a deserves furtherinvestigation. These samples were initially diagnosed asnormal by the cytopathologist, but classified with the
abnormals by SCP analysis. With a clinical history of pre-viously abnormal Pap tests, it is possible that these samplesare still infected with HPV. Studies have shown that someHPV infections are cleared by the body’s immune systemwithin 2 years.3 In cases wherein a lesion was detected duringmorphological analysis, an HPV DNA test was positive at theprevious cytologically normal Pap screening test. The HPVDNA remained positive in one or more follow-up Papscreening tests while the cytological evaluation was nor-mal.34–39 Therefore, the SCP classification is most likely not afalse-positive in these two instances, but rather a confirma-tion for the sensitivity of the technique in detecting a latentinfection.
In general, it is not the actual infection of HPV, but rathera persistent infection by the virus that is risky. HPV infectsthe basal layer cells of immature metaplastic epithelium inthe transformation zone. HPV can remain in these cells aslow copy episomal viral genomes (50–100 per cell), which arereplicated only once per cycle. Therefore, these infected cellscan provide a reservoir of virus in morphologically normallooking cells. Normally, the virus is cleared in a year or two,but can persist in this stable episomal state for extendedperiods of time. This is a non-productive or latent infec-tion.40 In the two cases with a history of abnormal Pap testresults, SCP has shown its potential in monitoring such latentinfections, which possibly could lead to cervical cancer if theyare not shed from the cervical epithelium.
Figure 3 illustrates that the cells, which show morpholo-gical patterns of abnormality show the same spectral patternsas the cells with normal morphology from abnormal samples.SCP reaches the same diagnosis as the cytopathologistwithout the presence of any diagnostic cells and using onlyunstained cells. Only eight cells from two samples diagnosedwith LSIL were identified as reactive or atypical—there wereno characteristic low-grade dysplastic cells identified fromany of the samples, which would have been present in theoriginal sample screened by the cytopathologist. In Figure 3a,the eight morphologically abnormal cells were analyzed inconjunction with the morphologically normal looking cellsfrom the same two samples. The scores plot shows co-clus-tering of the two groups; therefore, there are no statisticallysignificant spectral differences between these two groups. Thedrastic differences in morphology are shown in Figures 3band c. This analysis shows strong evidence that SCP canaccurately classify samples without cells showing morpholo-gical changes as conventional cytopathology requires. SCPwould not only improve the sensitivity of the Pap test, butpotentially also improve patient care.
In another blind test, PCA accurately differentiated cellsbased on hrHPV status, Figure 4a. By performing additionalDNA testing on five other samples, we were able to con-fidently attribute the spectral changes to the presence ofhrHPV strains. Four of the samples precisely correlated withtheir cytological diagnosis; however, one sample with anormal cytological diagnosis, with no known history of
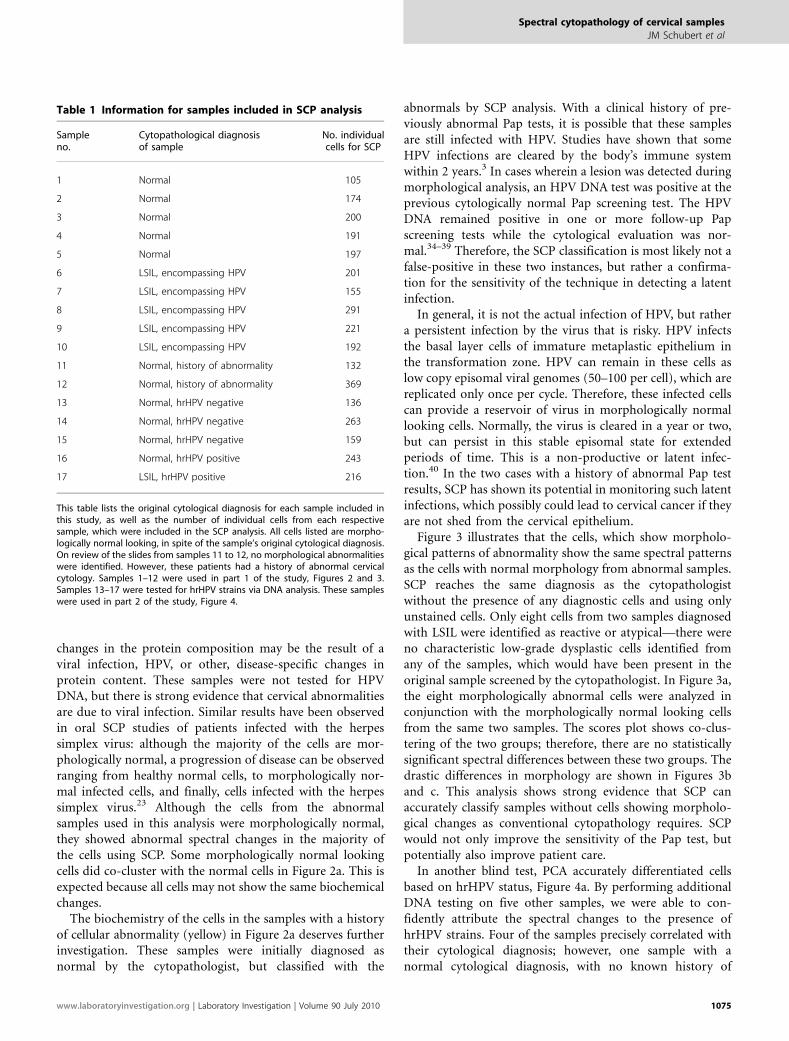
Table 1 Information for samples included in SCP analysis
Sampleno.
Cytopathological diagnosisof sample
No. individualcells for SCP
1 Normal 105
2 Normal 174
3 Normal 200
4 Normal 191
5 Normal 197
6 LSIL, encompassing HPV 201
7 LSIL, encompassing HPV 155
8 LSIL, encompassing HPV 291
9 LSIL, encompassing HPV 221
10 LSIL, encompassing HPV 192
11 Normal, history of abnormality 132
12 Normal, history of abnormality 369
13 Normal, hrHPV negative 136
14 Normal, hrHPV negative 263
15 Normal, hrHPV negative 159
16 Normal, hrHPV positive 243
17 LSIL, hrHPV positive 216
This table lists the original cytological diagnosis for each sample included inthis study, as well as the number of individual cells from each respectivesample, which were included in the SCP analysis. All cells listed are morpho-logically normal looking, in spite of the sample’s original cytological diagnosis.On review of the slides from samples 11 to 12, no morphological abnormalitieswere identified. However, these patients had a history of abnormal cervicalcytology. Samples 1–12 were used in part 1 of the study, Figures 2 and 3.Samples 13–17 were tested for hrHPV strains via DNA analysis. These sampleswere used in part 2 of the study, Figure 4.
Spectral cytopathology of cervical samples
JM Schubert et al
www.laboratoryinvestigation.org | Laboratory Investigation | Volume 90 July 2010 1075
cervical disease, was hrHPV positive. This sample clusteredwith the other hrHPV positive sample diagnosed with low-grade dysplasia. This result is not only important to showthat SCP can distinguish HPV infection, but also shows thatSCP has the potential to provide more diagnostic informa-tion than standard cytology alone.
The most notable spectral changes observed in Figure 4bare in the protein amide I and amide II bands (1670–1610and 1550–1500 cm�1, respectively), which most likely can beattributed to a degradation of cellular proteins and increasedproduction of viral proteins. Changes in the DNA and RNAregions are due to the high replication rate of the viralgenome.
This proof of concept study shows that SCP can be usedsuccessfully to detect abnormalities using morphologicallyun-differentiable cervical cells. Samples were used from pa-tients who were taking hormonal contraceptives to eliminatevariance because of the menstrual cycle. SCP reveals intrinsicspectral changes in the biochemical composition that dif-ferentiates cells from normal samples and morphologicallynormal looking cells from LSIL samples. SCP does not re-quire the identification of a few abnormal cells to classify cellsprecisely, but rather detects biochemical compositionalchanges in cells that still show normal morphology. AlthoughHPV DNA testing is currently the state of the art for diag-nostic cytopathology, SCP differentiated cells based on theirindividual hrHPV status. In conclusion, there is substantialevidence that SCP has the potential to provide an objective,unsupervised and unbiased method of detecting and classi-fying exfoliated cells as a novel tool in diagnostic cyto-pathology. Studies including a wider patient population arecurrently underway for patients not taking hormonal con-traceptives and from samples diagnosed with more pro-gressive diseases, mainly high-grade dysplasia and carcinomain situ, as well as ASCUS.
ACKNOWLEDGEMENT
We gratefully acknowledge the National Institute of Health (CA090346) for
supporting this research.
DISCLOSURE/CONFLICT OF INTEREST
The authors declare no conflict of interest.
1. Papanicolaou GN, Traut H. The diagnostic value of vaginal smears incarcinoma of the uterus. Am J Obstet Gynecol 1941;42:193–206.
2. Papanicolaou GN. New cancer diagnosis. Proc Third Race BettermentConference, January 2–6, 1928. 1928; 528–534.
3. Cervical Cancer. June 2009. Available from: www.cancer.org/docroot/CRI/content/CRI_2_4_IX_what_are_the_key_statistics_for_cervical_cancer_8.asp?rnav¼ cri.
4. Evaluation of Cervical Cytology. Summary, Evidence Report/Technology Assessment June 2009. Available from: http://www.ahrq.gov/clinic/epcsums/cervsumm.htm.
5. Solomon D, Davey D, Kurman R, et al. The 2001 Bethesda systemterminology for reporting results of cervical cytology. JAMA2002;287:2114–2119.
6. Stoler MH, Schiffman M. Interobserver reproducibility of cervicalcytologic and histologic interpretations. JAMA 2001;285:1500–1505.
7. Brink AATP, Zielinski GD, Steenbergen RDM, et al. Clinical relevance ofhuman papillomavirus testing in cytopathology. Cytopathology2005;16:7–12.
8. Bastacky S, Ibrahim S, Wilczynski SP, et al. The accuracy of urinarycytology in daily practice. Cancer 1999;87:118–128.
9. Raghu G, Mageto YN, Lockhart D, et al. The accuracy of the clinicaldiagnosis of new-onset idiopathic pulmonary fibrosis and otherinterstitial lung disease. Chest 1999;116:1168–1174.
10. Wong PTT, Papavassiliou ED, Rigas B. Phosphodiester stretching bandsin the infrared spectra of human tissues and cultured cells. ApplSpectrosc 1991;45:1563–1567.
11. Wong PTT, Wong RK, Caputo TA, et al. Infrared spectroscopy ofexfoliated human cervical cells: evidence of extensive structural changesduring carcinogenesis. Proc Nat Acad Sci USA 1991;88:10988–10992.
12. Wong PTT, Lacelle S, Fung MFK, et al. Characterization of exfoliatedcells and tissues from human endocervix and ectocervix by FTIR andATR/FTIR spectroscopy. Biospectroscopy 1995;1:357–364.
13. Cohenford M, Godwin T, Cahn F, et al. Infrared spectroscopy of normaland abnormal cervical smears: evaluation by principal componentanalysis. Gynecol Oncol 1997;66:59–65.
14. Cohenford M, Rigas B. Cytologically normal cells from neoplasticcervical samples display extensive structural abnormalities on IRspectroscopy: implications for tumor biology. Proc Nat Acad Sci USA1998;95:15327–15332.
15. Wood BR, Quinn MA, Burden FR, et al. An investigation into FTIRspectroscopy as a biodiagnostic tool for cervical cancer.Biospectroscopy 1996;2:143–153.
16. Wood BR, Quinn MA, Tait B, et al. A FTIR microspectroscopic study ofcell types and potential confounding variables in screening for cervicalmalignancies. Biospectroscopy 1998;4:75–91.
17. Boydston-White S, Gopen T, Houser S, et al. Infrared spectroscopy ofhuman tissue V. Infraredspectroscopic studies of myeloid leukemia(ML-1) cells at different phases of the cell cycle. Biospectroscopy1999;5:219–227.
18. Chiriboga L, Xie P, Yee H, et al. Infrared spectroscopy of human tissue. I.Differentiation and maturation of epithelial cells in the human cervix.Biospectroscopy 1998;4:47–53.
19. Chiriboga L, Xie P, Vigorita V, et al. Infrared spectroscopy of human tissue.II. A comparative study of spectra of biopsies of cervical squamousepithelium and of exfoliated cervical cells. Biospectroscopy 1998;4:55–59.
20. Chiriboga L, Xie P, Yee H, et al. Infrared spectroscopy of humantissue IV. Detection of dysplastic and neoplastic changes of humancervical tissue via infrared microspectroscopy. Cell Mol Biol 1998;44:219–229.
21. Romeo MJ, Mohlenhoff B, Jennings M, et al. Infrared micro-spectroscopic studies of epithelial cells. Biochim Biophys Acta2006;1758:915–922.
22. Romeo MJ, Mohlenhoff B, Diem M. Infrared microspectroscopy ofhuman cells: causes for the spectral variance of oral mucosa (buccal)cells. Vib Spectrosc 2006;42:9–14.
23. Papamarkakis K, Bird B, Schubert JM, et al. Cytopathology by opticalmethods: spectral cytopathology of the oral mucosa. Lab Invest 2010;90:589–598.
24. Diem M, Miljkovic M, Romeo M, et al. Method of reconstituting cellularspectra from spectral mapping data. USA 2009.
25. Bassan P, Byrne HJ, Bonnier F, et al. Resonant Mie scattering infraredspectroscopy of biological materials - understanding the 0dispersionartefact0. Analyst 2009;134:1586–1593.
26. Bassan P, Byrne HJ, Lee J, et al. Reflection contributions to thedispersion artefact in FTIR spectra of single biological cells. Analyst2009;134:1171–1175.
27. Bassan P, Kohler A, Martens H, et al. Resonant Mie scattering (RMieS)correction of infrared spectra from highly scattering biologicalsamples. Analyst 2010;135:268–277.
28. Savitzky A, Golay MJE. Smoothing and differentiation of data bysimplified least squares procedures. Anal Chem 1964;36:1627–1639.
29. Tay SK, Singer A. The effects of oral contraceptive steroids, menopauseand hormone replacement therapy on the cervical epithelium. In:Jordan JA, Singer A (eds). The Cervix, 2nd edn. Blackwell Publishing:Malden, 2006, pp 128–144.
30. Romeo MJ, Wood BR, McNaughton D. Observing the cyclical changesin cervical epithelium using infrared microspectroscopy. Vib Spectrosc2002;28:167–175.
Spectral cytopathology of cervical samples
JM Schubert et al
1076 Laboratory Investigation | Volume 90 July 2010 | www.laboratoryinvestigation.org
31. Adams MJ. Chemometrics in Analytical Spectroscopy, 2nd edn, RoyalSociety of Chemistry: Cambridge, 2004.
32. Walboomers JMM, Jacobs MV, Manos MM, et al. Human papillmoavirusis a necessary cause of invasive cervical cancer worldwide. J Pathol1999;189:12–19.
33. Bosch FX, Lorincz A, Munoz N, et al. The causal relation betweenhuman papillomavirus and cervical cancer. J Clin Pathol 2002;55:244–265.
34. Woodman CBJ, Collins S, Winter H, et al. Natural history of cervicalhuman papillomavirus infection in young women: a longitudinalcohort study. Lancet 2001; 1931–1936.
35. Winer RL, Kiviat NB, Hughes JP, et al. Development and duration ofhuman papillomavirus lesions, after initial infection. J Infect Dis2005;191:731–738.
36. Zielinski GD, Snijders PFJ, Rozendaal L, et al. HPV presence precedesabnormal cytology in women developing cervical cancer and signalsfalse negative smears. Br J Cancer 2001;85:398–404.
37. Hildesheim A, Schiffman MH, Gravitt PE, et al. Persistence of type-specific human papillomavirus infection among cytologically normalwomen. J Infect Dis 1994;169:235–240.
38. Wallin K, Wiklund F, Angstrom T, et al. Type specific persistence ofhuman papillomavirus DNA before the development of invasivecervical cancer. New Engl J Med 1999;341:1633–1638.
39. Bulk S, Rozendaal L, Zielinski GD, et al. High-risk humanpapillomavirus is present in cytologically false-negative smears: ananalysis of ‘normal’ smears preceeding CIN2/3. J Clin Pathol2008;61:385–389.
40. DeMay RM. The Pap Test. ASCP Press: Chicago, 2005.
Spectral cytopathology of cervical samples
JM Schubert et al
www.laboratoryinvestigation.org | Laboratory Investigation | Volume 90 July 2010 1077