Embed Size (px)
Citation preview
Journal of Food and Drug Analysis, Vol. 17, No. 2, 2009, Pages 93-99
93
藥物食品分析 第十七卷 第二期
Spectrophotometric Determination of Lisinopril in Pharmaceuticals Using Ninhydrin- a Modified ApproachKanaKapura Basavaiah1*, Kalsang Tharpa1, salmara ganeshBhaT hiriyanna2
and KanaKapura Basavaiah vinay2
1. Department of Chemistry, University of Mysore, Manasagangotri, Mysore-570006, India. 2. Process Analytical Laboratory, Advinus Therapeutics Pvt Ltd., Peenya II Phase, Bangalore-560005, India.
(Received: October 22, 2008; Accepted: March 13, 2009)
aBsTracT
An accurate and precise spectrophotometric method is presented for the determination of lisinopril based on the formation of a yellow colour product with ninhydrin in the presence of bicarbonate with an absorption maximum at 420 nm. The reaction proceeds quantitatively at 97 ± 1°C in 10 min. The calibration curve is linear over the range of 5.0-50.0 µg/mL and is described by the regres-sion equation A = (-) 0.0175 + 0.0079 C with a regression coefficient (r) of 0.9979 (n = 6). The calculated molar absorptivity and Sandell sensitivity values are 2.02 × 10³ L/mol/cm and 0.219 µg/cm2, respectively. The limits of detection (LOD) and quantifica-tion (LOQ) calculated as per ICH guidelines are 0.68 and 2.07 µg/mL, respectively. The within-day accuracy expressed as relative error was better than 2.5% with precision (RSD) ranging from 1.02 to 1.93%. The between-day accuracy ranged from 1.5-3.0% with a precision less than 4%. The method was successfully applied to the analysis of three brands of tablets containing lisino-pril. The results obtained were in agreement with those obtained by the BP method. Accuracy was also checked by placebo blank and synthetic mixture analyses besides a recovery study via standard addition procedure. The method was also used to check the stability of lisinopril in solution.
Key words: lisinopril, ninhydrin, spectrophotometry, pharmaceuticals
inTroducTion
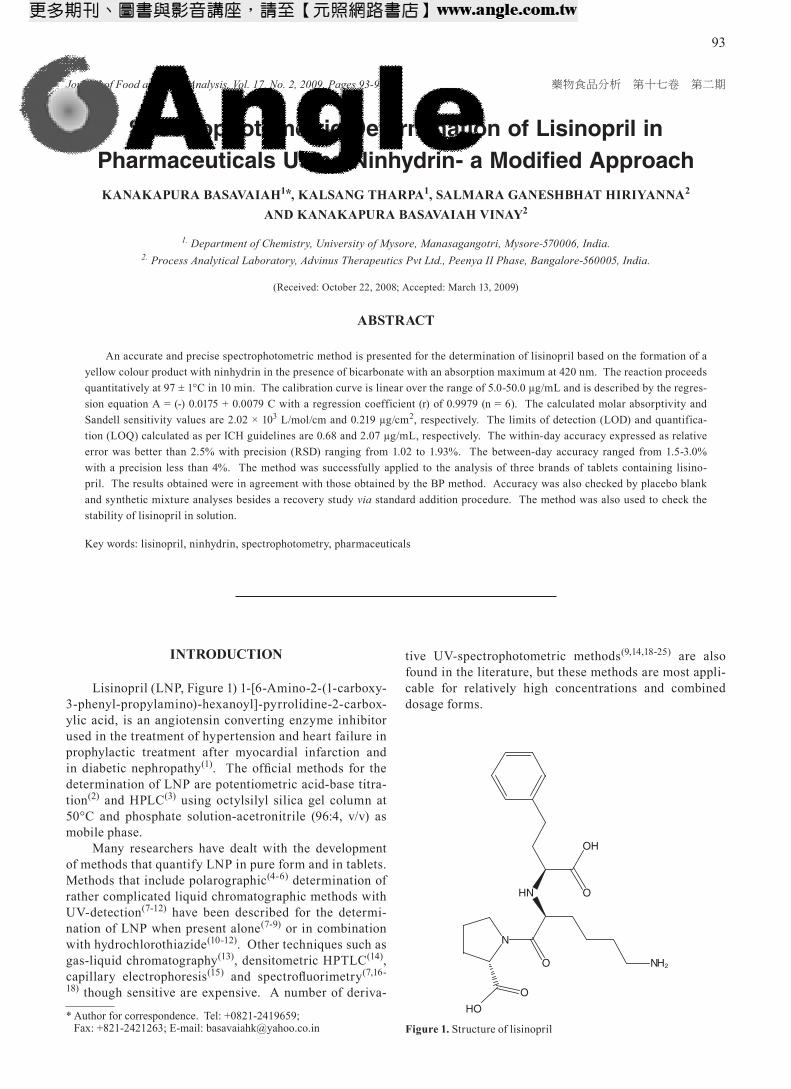
Lisinopril (LNP, Figure 1) 1-[6-Amino-2-(1-carboxy-3-phenyl-propylamino)-hexanoyl]-pyrrolidine-2-carbox-ylic acid, is an angiotensin converting enzyme inhibitor used in the treatment of hypertension and heart failure in prophylactic treatment after myocardial infarction and in diabetic nephropathy(1). The official methods for the determination of LNP are potentiometric acid-base titra-tion(2) and HPLC(3) using octylsilyl silica gel column at 50°C and phosphate solution-acetronitrile (96:4, v/v) as mobile phase.
Many researchers have dealt with the development of methods that quantify LNP in pure form and in tablets. Methods that include polarographic(4-6) determination of rather complicated liquid chromatographic methods with UV-detection(7-12) have been described for the determi-nation of LNP when present alone(7-9) or in combination with hydrochlorothiazide(10-12). Other techniques such as gas-liquid chromatography(13), densitometric HPTLC(14), capillary electrophoresis(15) and spectrofluorimetry(7,16-18) though sensitive are expensive. A number of deriva-
tive UV-spectrophotometric methods(9,14,18-25) are also found in the literature, but these methods are most appli-cable for relatively high concentrations and combined dosage forms.
* Author for correspondence. Tel: +0821-2419659; Fax: +821-2421263; E-mail: [email protected] Figure 1. Structure of lisinopril
O
HO
N
NH2
HN
OH
O
O
Journal of Food and Drug Analysis, Vol. 17, No. 2, 2009
94
Visible spectrophotometry is the technique of choice even today because of its inherent simplicity, sensitiv-ity, selectivity, accuracy, precision and cost-effectiveness. LNP in pharmaceuticals has been assayed based on reac-tion with N-bromosuccinimide and cloram(26), chloranil, dichlone and acetyl acetone-HCHO(18), π-acceptors(27) sodium hypochlorite-phenylhydrazine(7), 1-fluoro-2,4-dini-trobenzene(28) and ascorbic acid(29). Most of these methods
employ organic solvents as reaction medium, require longer heating times, use expensive reagents, and/or are less sensi-tive (Table 1). Of the various regents used in the assay of LNP in pharmaceuticals, ninhydrin has been employed by quite a few researchers. For example, Rehman et al.(29) used ninhydrin in DMF medium for kinetic spectrophoto-metric determination of LNP by initial rate and fixed-time procedures. Both methods showed linear response over 10-
Table 1. Comparison of current visible spectrophotometry methods
Sl. No. Reagent/Reaction Rangeµg/mL
ε,L/mol/cm LOD Remarks Ref. No.
1. Reaction of the LNP with sodium hypochlo-rite and phenyl hydrazine to form a condensa-tion product. λmax=362 nm
NA Measurement at a shorter wavelength
7
2. a. Reaction between LNP and chloranil in aqueous solution of pH 9.5. λmax=346 nm
b. LNP with dichlone, formation of purple colour. λmax=580 nm
c. Condensation reaction with acetylacetone and formaldehyde. λmax=356 nm
pH dependent 18
3. a. Reaction between LNP and N-bromosuc-cinimide in acetone. λmax= 353 nm
b. Charge transfer complex reaction between LNP and chloranil in 1,4-dioxan-acetoni-trile.
10-200
24-600
1.4 × 10³
7.28 × 10²
NA Less sensitive, use of organic solvents, measure at shorter wavelength.
26
4. a. Charge transfer complex reaction between LNP and 7,7,8,8 tetracyanoquinodimethane in polar media. λmax=743 nm
b. Charge transfer complex reaction between LNP and p-chloranilic acid in polar media. λmax= 525 nm
2-26
25-300
1.432 × 10⁴
1.192 × 10⁴
NA Expensive chemicals used, and use of organic solvent.
27
5. LNP derivatization reaction with 1-f luoro-2,4-dinitrobenzene in acetonitrile at pH 8.2 in dark at 60°C for 45 min, follow by acidifi-cation with HCl.a. λmax= 356.5 nmb. λmax= 405.5 nm
20-120 0.014 mg/L 0.023 mg/L
Less sensitive 28
6. a. Two kinetic methods were described based on the reaction of LNP with ninhydrin in DMF medium at RT. λmax=595 nm(1). Initial-rate method(2). Rate-constant (10 min) method
b. LNP reacts with ascorbic acid in DMF medium. λmax=530 nm
10-5010-40
5.0-50.0
4.55 × 10³
NA Kinetic studies; organic solvent used, rate is critically dependent on experimental variables.
29
7. Reaction between LNP and ninhydrin in the presence of DMF. λmax=600 nm
10-150 4.083 × 10³ NA Organic solvent used 30
8. Reaction between LNP and ninhydrin in acetone. λmax=410 nm
10-40 NA NA Organic solvent used 31
9. Reaction between LNP and ninhydrin in aqueous medium in the presence of saturated NaHCO3. λmax=420 nm
5.0-50.0 2.02 × 10³ 0.68 µg/mL More greener method This work
NA: Not Available.
Journal of Food and Drug Analysis, Vol. 17, No. 2, 2009
95
50 µg/mL LNP. The reagent in the same organic solvent medium (DMF) but involving heating was used by Raza et al. (30) to quantify LNP in 10-150 µg/mL range. Rajashek-aran and Udayavani(31) assayed LNP in the 10-40 µg/mL range by measuring the coloured product formed between ninhydrin and LNP in acetone medium at elevated temper-ature. The common feature of all the three methods using ninhydrin(29-31) is the use of organic solvent as the reaction medium which quite often is undesirable.
The scientific references found in the CAS and SCI database, relating to green analytical chemistry or environ-mentally-friendly analytical methods have been growing significantly in recent years(32). The recent development of new analytical methods with good characteristics such as selectivity and sensitivity are not sufficient; modern analyti-cal methods need to be green(33,34). Hence, the purpose of the present study was to improve these methods with respect to two experimental objectives: (i) decrease the heating time, (ii) avoid the use of organic solvent. Both factors are of great significance in reducing time and cost of analysis. In the present study, sodium bicarbonate was used as the reaction medium and no organic solvent was employed. In addition, the heating time was relatively short (10 min) compared to the reported methods using ninhydrin(29-31). These modifications resulted in increased linear range (5-50 µg/mL) and sensitivity (ε = 2.02 × 10³ L/mol/cm) compared to many existing spectrophotometric methods.
maTerials and meThods
I. Apparatus
A Systronics model 106 digital spectrophotometer provided with 1 cm matched quartz cells was used for absorbance measurements.
II. Reagents and Materials
All chemicals were of analytical reagent grade and distilled water was used to prepare solutions.
(I) 0.5% Ninhydrin
500 mg of chemical (Merck, Mumbai, India) was dissolved in water and made up to 100 mL with water.
(II) Sodium Bicarbonate (Saturated Solution)
Approximately 25 g of the chemical (Loba chemie, Mumbai, India) was taken in a beaker containing 100 mL of water and stirred with a magnetic stirrer for twenty minutes. The solution was decanted and filtered using quantitative filter paper.
(III) Standard Drug Solution
Pharmaceutical grade LNP was kindly provided by Cipla Pvt. Ltd., India and was used as received. A stock standard solution equivalent to 500 µg/mL LNP was prepared by dissolving 50 mg of pure drug in water and diluting to 100 mL in calibrated flask with water. The stock solution was diluted appropriately to reach working concentration of 100 µg/mL with water.
III. Methods
Different aliquots (0.0, 0.5,…..5.0 mL) of 100 µg/mL LNP solution were accurately measured and transferred into a series of 10 mL volumetric flasks. The total volume was brought to 5 mL with water. One mL of 0.5% ninhy-drin and then 1 mL of saturated solution of NaHCO3 were added to each flask, and the total volume was brought to 9 mL with water. All flasks were kept in a boiling water bath for 10 minutes, and cooled to room temperature before making up to the mark with water. Absorbance was measured at 420 nm versus reagent blank. A calibra-tion graph was prepared by plotting the measured absor-bance versus concentration. The concentration of the unknown solution was read from the calibration graph or computed from the regression equation derived from the Beer’s law data.
IV. Procedure for Commercial Tablets
Twenty tablets were weighed accurately and ground into a fine powder. Powder equivalent to 10 mg of LNP was weighed accurately and transferred into a 100 mL volumetric flask with 60 mL of water. The content was shaken for 15-20 min, diluted to volume with water, and filtered using a Whatman No. 42 filter paper. First 10 mL portion of filtrate was discarded and subsequent portions were subjected to analysis.
resulTs and discussion
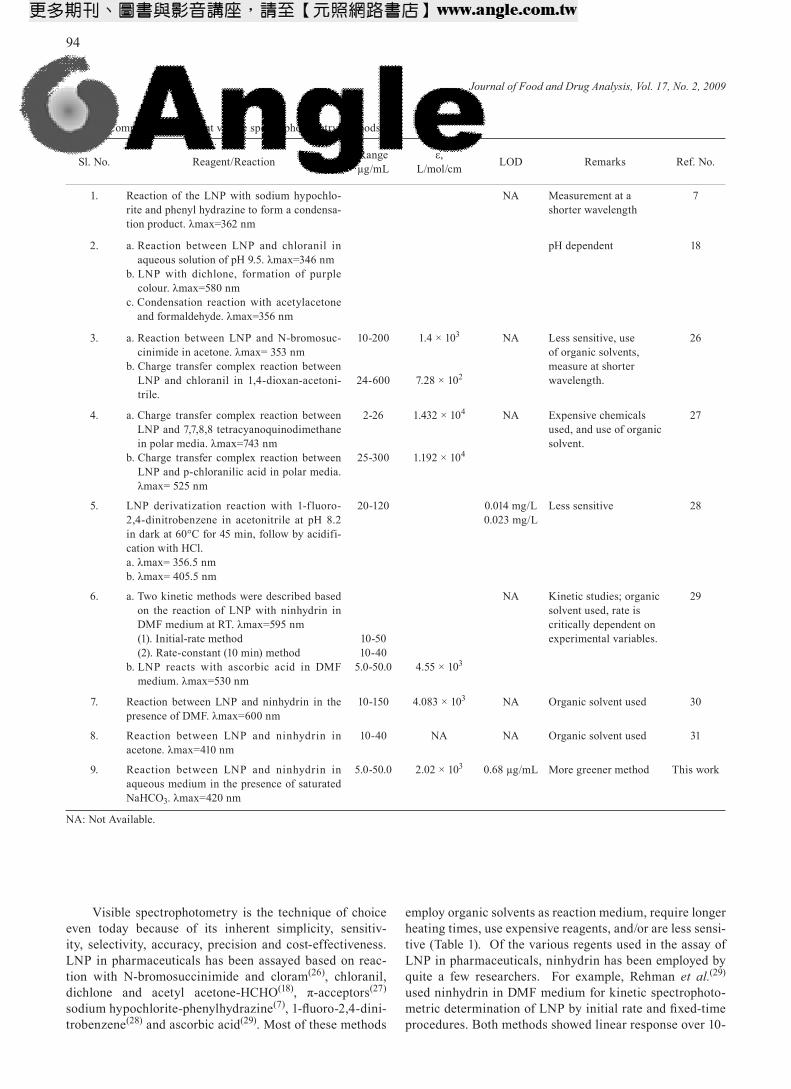
Ninhydrin forms purple color product with primary amine, which is the basis for quantification of compounds containing primary amino groups. All reactions were carried in organic solvents such as DMF, DMSO, acetone or methanol. The present authors found that ninhydrin forms yellow color product with LNP, having both prima-ry and secondary amines, in the presence of saturated solution of NaHCO3 and without employing any organic solvents. The blank showed higher absorbance at 340 nm compared at 420 nm for a given ninhydrin concentration (Figure 2). The blank absorbance was negligible at 420 nm, and hence all absorbance measurements were made at 420 nm against reagent blank instead of 340 nm. The yellow color product forms slowly in ambient tempera-ture (nearly 5-6 hours), whereas it takes only ten minutes for reaction to complete when the reaction flask was kept in a boiling water bath.
Journal of Food and Drug Analysis, Vol. 17, No. 2, 2009
96
I. Optimization of Reaction Conditions
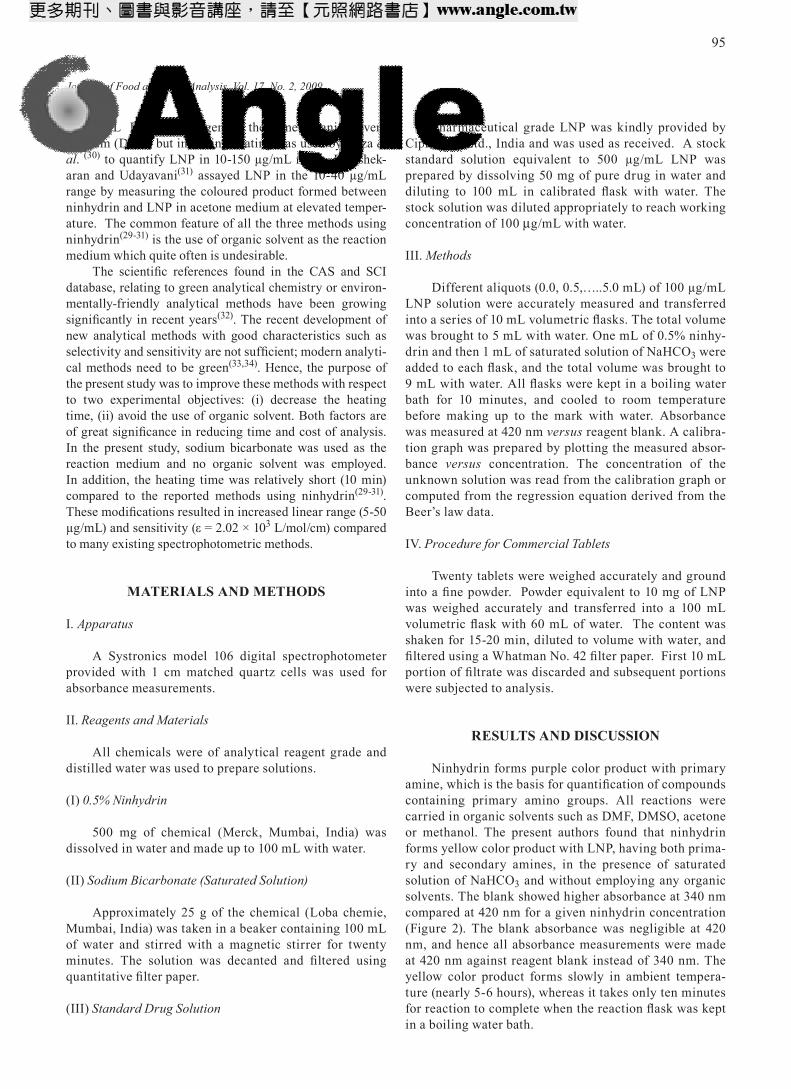
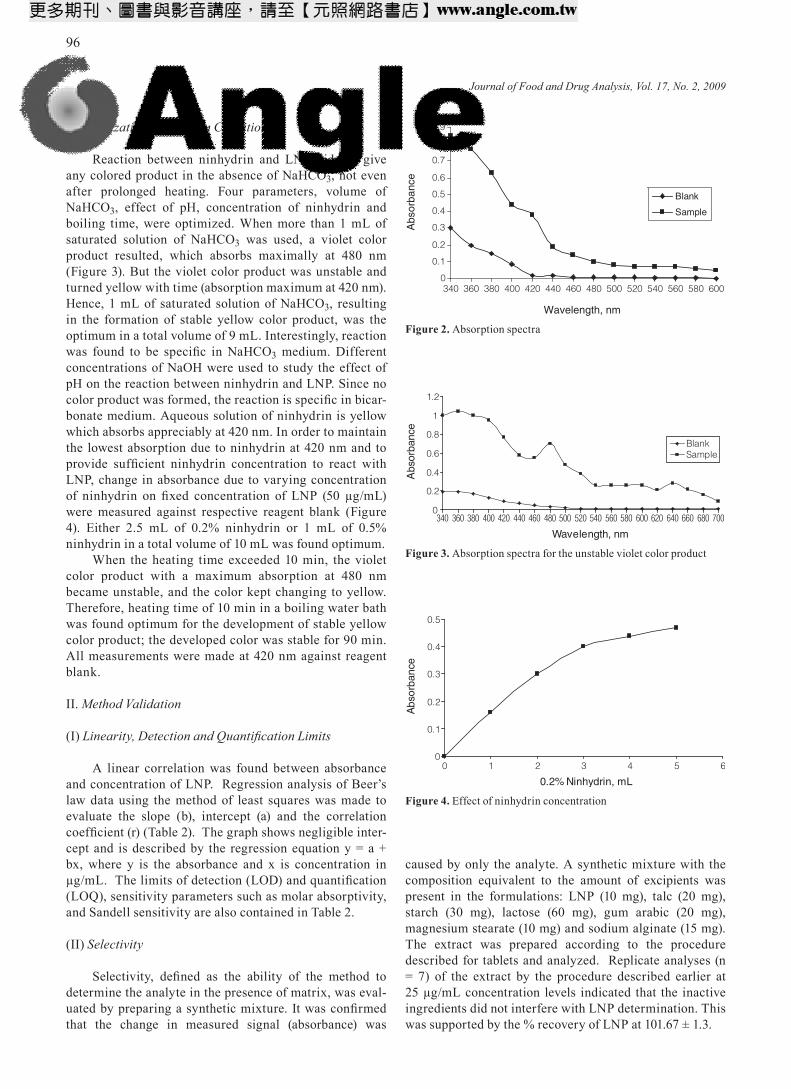
Reaction between ninhydrin and LNP did not give any colored product in the absence of NaHCO3, not even after prolonged heating. Four parameters, volume of NaHCO3, effect of pH, concentration of ninhydrin and boiling time, were optimized. When more than 1 mL of saturated solution of NaHCO3 was used, a violet color product resulted, which absorbs maximally at 480 nm (Figure 3). But the violet color product was unstable and turned yellow with time (absorption maximum at 420 nm). Hence, 1 mL of saturated solution of NaHCO3, resulting in the formation of stable yellow color product, was the optimum in a total volume of 9 mL. Interestingly, reaction was found to be specific in NaHCO3 medium. Different concentrations of NaOH were used to study the effect of pH on the reaction between ninhydrin and LNP. Since no color product was formed, the reaction is specific in bicar-bonate medium. Aqueous solution of ninhydrin is yellow which absorbs appreciably at 420 nm. In order to maintain the lowest absorption due to ninhydrin at 420 nm and to provide sufficient ninhydrin concentration to react with LNP, change in absorbance due to varying concentration of ninhydrin on fixed concentration of LNP (50 µg/mL) were measured against respective reagent blank (Figure 4). Either 2.5 mL of 0.2% ninhydrin or 1 mL of 0.5% ninhydrin in a total volume of 10 mL was found optimum.
When the heating time exceeded 10 min, the violet color product with a maximum absorption at 480 nm became unstable, and the color kept changing to yellow. Therefore, heating time of 10 min in a boiling water bath was found optimum for the development of stable yellow color product; the developed color was stable for 90 min. All measurements were made at 420 nm against reagent blank.
II. Method Validation
(I) Linearity, Detection and Quantification Limits
A linear correlation was found between absorbance and concentration of LNP. Regression analysis of Beer’s law data using the method of least squares was made to evaluate the slope (b), intercept (a) and the correlation coefficient (r) (Table 2). The graph shows negligible inter-cept and is described by the regression equation y = a + bx, where y is the absorbance and x is concentration in µg/mL. The limits of detection (LOD) and quantification (LOQ), sensitivity parameters such as molar absorptivity, and Sandell sensitivity are also contained in Table 2.
(II) Selectivity
Selectivity, defined as the ability of the method to determine the analyte in the presence of matrix, was eval-uated by preparing a synthetic mixture. It was confirmed that the change in measured signal (absorbance) was
caused by only the analyte. A synthetic mixture with the composition equivalent to the amount of excipients was present in the formulations: LNP (10 mg), talc (20 mg), starch (30 mg), lactose (60 mg), gum arabic (20 mg), magnesium stearate (10 mg) and sodium alginate (15 mg). The extract was prepared according to the procedure described for tablets and analyzed. Replicate analyses (n = 7) of the extract by the procedure described earlier at 25 µg/mL concentration levels indicated that the inactive ingredients did not interfere with LNP determination. This was supported by the % recovery of LNP at 101.67 ± 1.3.
Figure 2. Absorption spectra
0
0.1
0.2
0.3
0.4
0.5
0.6
0.7
0.8
0.9
340 360 380 400 420 440 460 480 500 520 540 560 580 600
Wavelength, nm
Abs
orba
nce
Blank
Sample
Figure 3. Absorption spectra for the unstable violet color product
0
0.2
0.4
0.6
0.8
1
1.2
340 360 380 400 420 440 460 480 500 520 540 560 580 600 620 640 660 680 700
Wavelength, nm
Abs
orba
nce
BlankSample
Figure 4. Effect of ninhydrin concentration
0
0.1
0.2
0.3
0.4
0.5
0 1 2 3 4 5 6
0.2% Ninhydrin, mL
Abs
orba
nce
Journal of Food and Drug Analysis, Vol. 17, No. 2, 2009
97
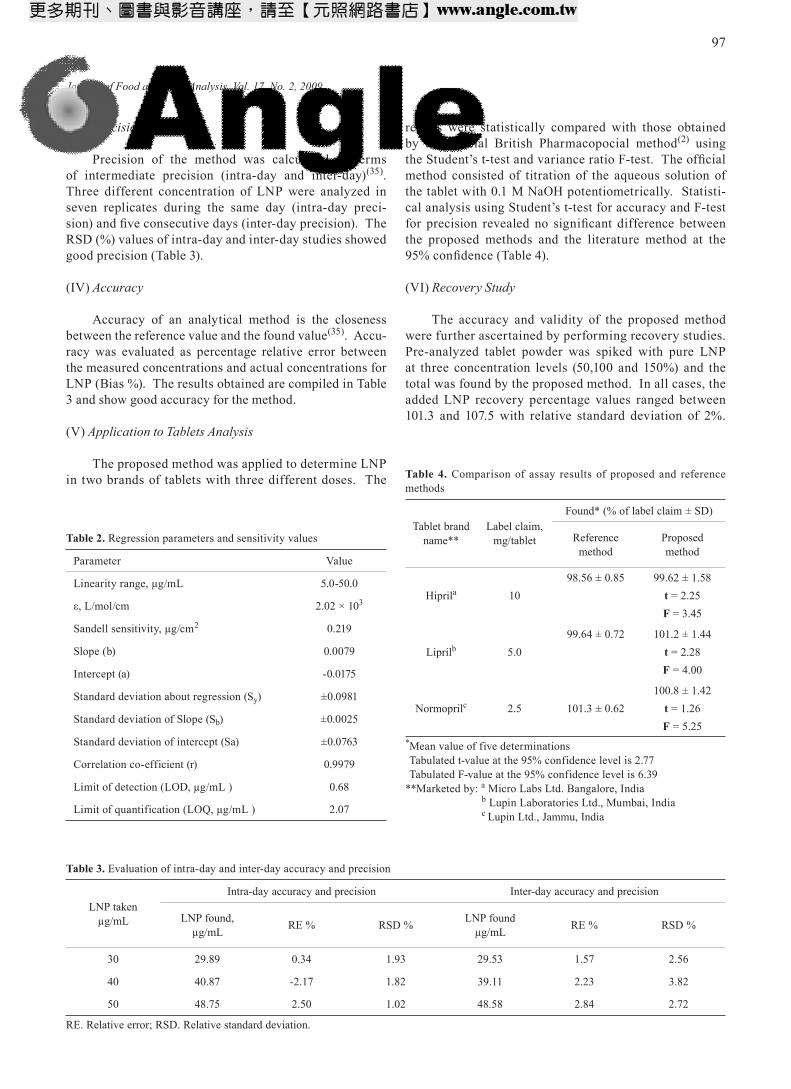
(III) Precision
Precision of the method was calculated in terms of intermediate precision (intra-day and inter-day)(35). Three different concentration of LNP were analyzed in seven replicates during the same day (intra-day preci-sion) and five consecutive days (inter-day precision). The RSD (%) values of intra-day and inter-day studies showed good precision (Table 3).
(IV) Accuracy
Accuracy of an analytical method is the closeness between the reference value and the found value(35). Accu-racy was evaluated as percentage relative error between the measured concentrations and actual concentrations for LNP (Bias %). The results obtained are compiled in Table 3 and show good accuracy for the method.
(V) Application to Tablets Analysis
The proposed method was applied to determine LNP in two brands of tablets with three different doses. The
results were statistically compared with those obtained by the official British Pharmacopocial method(2) using the Student’s t-test and variance ratio F-test. The official method consisted of titration of the aqueous solution of the tablet with 0.1 M NaOH potentiometrically. Statisti-cal analysis using Student’s t-test for accuracy and F-test for precision revealed no significant difference between the proposed methods and the literature method at the 95% confidence (Table 4).
(VI) Recovery Study
The accuracy and validity of the proposed method were further ascertained by performing recovery studies. Pre-analyzed tablet powder was spiked with pure LNP at three concentration levels (50,100 and 150%) and the total was found by the proposed method. In all cases, the added LNP recovery percentage values ranged between 101.3 and 107.5 with relative standard deviation of 2%.
Table 2. Regression parameters and sensitivity values
Parameter Value
Linearity range, µg/mL 5.0-50.0
ε, L/mol/cm 2.02 × 10³
Sandell sensitivity, µg/cm2 0.219
Slope (b) 0.0079
Intercept (a) -0.0175
Standard deviation about regression (Sy) ±0.0981
Standard deviation of Slope (Sb) ±0.0025
Standard deviation of intercept (Sa) ±0.0763
Correlation co-efficient (r) 0.9979
Limit of detection (LOD, µg/mL ) 0.68
Limit of quantification (LOQ, µg/mL ) 2.07
Table 3. Evaluation of intra-day and inter-day accuracy and precision
LNP taken µg/mL
Intra-day accuracy and precision Inter-day accuracy and precision
LNP found, µg/mL RE % RSD % LNP found
µg/mL RE % RSD %
30 29.89 0.34 1.93 29.53 1.57 2.56
40 40.87 -2.17 1.82 39.11 2.23 3.82
50 48.75 2.50 1.02 48.58 2.84 2.72
RE. Relative error; RSD. Relative standard deviation.
Table 4. Comparison of assay results of proposed and reference methods
Tablet brand name**
Label claim, mg/tablet
Found* (% of label claim ± SD)
Reference method
Proposed method
Hiprila 1098.56 ± 0.85 99.62 ± 1.58
t = 2.25F = 3.45
Liprilb 5.099.64 ± 0.72 101.2 ± 1.44
t = 2.28F = 4.00
Normoprilc 2.5 101.3 ± 0.62100.8 ± 1.42
t = 1.26F = 5.25
*Mean value of five determinations Tabulated t-value at the 95% confidence level is 2.77 Tabulated F-value at the 95% confidence level is 6.39**Marketed by: a Micro Labs Ltd. Bangalore, India b Lupin Laboratories Ltd., Mumbai, India c Lupin Ltd., Jammu, India
Journal of Food and Drug Analysis, Vol. 17, No. 2, 2009
98
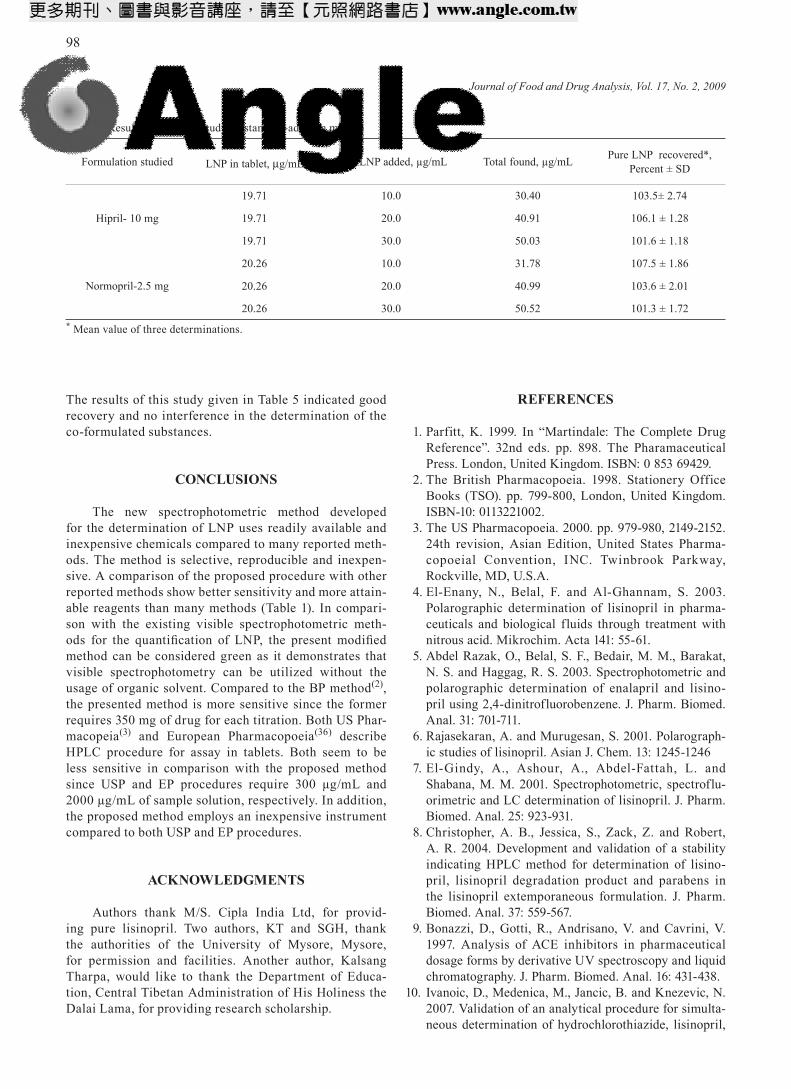
The results of this study given in Table 5 indicated good recovery and no interference in the determination of the co-formulated substances.
conclusions
The new spectrophotometric method developed for the determination of LNP uses readily available and inexpensive chemicals compared to many reported meth-ods. The method is selective, reproducible and inexpen-sive. A comparison of the proposed procedure with other reported methods show better sensitivity and more attain-able reagents than many methods (Table 1). In compari-son with the existing visible spectrophotometric meth-ods for the quantification of LNP, the present modified method can be considered green as it demonstrates that visible spectrophotometry can be utilized without the usage of organic solvent. Compared to the BP method(2), the presented method is more sensitive since the former requires 350 mg of drug for each titration. Both US Phar-macopeia(3) and European Pharmacopoeia(36) describe HPLC procedure for assay in tablets. Both seem to be less sensitive in comparison with the proposed method since USP and EP procedures require 300 µg/mL and 2000 µg/mL of sample solution, respectively. In addition, the proposed method employs an inexpensive instrument compared to both USP and EP procedures.
acKnowledgmenTs
Authors thank M/S. Cipla India Ltd, for provid-ing pure lisinopril. Two authors, KT and SGH, thank the authorities of the University of Mysore, Mysore, for permission and facilities. Another author, Kalsang Tharpa, would like to thank the Department of Educa-tion, Central Tibetan Administration of His Holiness the Dalai Lama, for providing research scholarship.
reFerences
1. Parfitt, K. 1999. In “Martindale: The Complete Drug Reference”. 32nd eds. pp. 898. The Pharamaceutical Press. London, United Kingdom. ISBN: 0 853 69429.
2. The British Pharmacopoeia. 1998. Stationery Office Books (TSO). pp. 799-800, London, United Kingdom. ISBN-10: 0113221002.
3. The US Pharmacopoeia. 2000. pp. 979-980, 2149-2152. 24th revision, Asian Edition, United States Pharma-copoeial Convention, INC. Twinbrook Parkway, Rockville, MD, U.S.A.
4. El-Enany, N., Belal, F. and Al-Ghannam, S. 2003. Polarographic determination of lisinopril in pharma-ceuticals and biological fluids through treatment with nitrous acid. Mikrochim. Acta 141: 55-61.
5. Abdel Razak, O., Belal, S. F., Bedair, M. M., Barakat, N. S. and Haggag, R. S. 2003. Spectrophotometric and polarographic determination of enalapril and lisino-pril using 2,4-dinitrofluorobenzene. J. Pharm. Biomed. Anal. 31: 701-711.
6. Rajasekaran, A. and Murugesan, S. 2001. Polarograph-ic studies of lisinopril. Asian J. Chem. 13: 1245-1246
7. El-Gindy, A., Ashour, A., Abdel-Fattah, L. and Shabana, M. M. 2001. Spectrophotometric, spectroflu-orimetric and LC determination of lisinopril. J. Pharm. Biomed. Anal. 25: 923-931.
8. Christopher, A. B., Jessica, S., Zack, Z. and Robert, A. R. 2004. Development and validation of a stability indicating HPLC method for determination of lisino-pril, lisinopril degradation product and parabens in the lisinopril extemporaneous formulation. J. Pharm. Biomed. Anal. 37: 559-567.
9. Bonazzi, D., Gotti, R., Andrisano, V. and Cavrini, V. 1997. Analysis of ACE inhibitors in pharmaceutical dosage forms by derivative UV spectroscopy and liquid chromatography. J. Pharm. Biomed. Anal. 16: 431-438.
10. Ivanoic, D., Medenica, M., Jancic, B. and Knezevic, N. 2007. Validation of an analytical procedure for simulta-neous determination of hydrochlorothiazide, lisinopril,
Table 5. Results of recovery study by standard-addition method
Formulation studied LNP in tablet, µg/mL Pure LNP added, µg/mL Total found, µg/mL Pure LNP recovered*, Percent ± SD
Hipril- 10 mg
19.71 10.0 30.40 103.5± 2.74
19.71 20.0 40.91 106.1 ± 1.28
19.71 30.0 50.03 101.6 ± 1.18
Normopril-2.5 mg
20.26 10.0 31.78 107.5 ± 1.86
20.26 20.0 40.99 103.6 ± 2.01
20.26 30.0 50.52 101.3 ± 1.72* Mean value of three determinations.
Journal of Food and Drug Analysis, Vol. 17, No. 2, 2009
99
and their impurities. Acta Chromatogr. 18: 143-156.11. Nevin, E. R. K. and Murat, K. 1999. Comparison of
high-performance liquid chromatography and absor-bance ratio methods for the determination of hydro-chlorothiazide and lisinopril in pharmaceutical formu-lations. Anal. Lett. 32: 1131-1141.
12. Sane, R. T., Valiyare, G. R., Deshmukh, U. M., Singh, S. R. and Sodhi, R. 1992. Simultaneous HPLC deter-mination of lisinopril and hydrochlorothiazide from its pharmaceutical preparations. Indian Drugs 29: 558-560.
13. Avadhanulu, A. B. and Pantulu, A. R. R. 1993. Gas liquid chromatographic estimation of lisinopril in its pharmaceutical dosage forms. Indian Drugs 30: 646-649.
14. El-Gindy, A., Ashour, A., Abdel-Fattah, L. and Shabana, M. M. 2001. Spectrophotometric and HPTLC-densitometric determination of lisinopril and hydro-chlorothiazide in binary mixtures. J. Pharm. Biomed. Anal. 25: 923-931.
15. Hillaert, S., De Grauwe, K. and Van den, B. W. 2001. Simultaneous determination of hydrochlorothiazide and several inhibitors of angiotensin-converting enzyme by capillary electrophoresis. J. Chromatogr. A. 924: 439-449.
16. Esra, S. A., Lale, E. and Olcay, S. 2003. A new spectro-fluorimetric method for the determination of lisinopril in tablets. Il Farmaco 58: 165-168.
17. Zacharis, C., Tzanavaras, P., Themelis, D., Theodoridis, G., Economou, A. and Rigas, P. 2004. Rapid spectro-fluorimetric determination of lisinopril in pharmaceu-tical tablets using sequential injection analysis. Anal. Bioanal. Chem. 379: 759-763.
18. El-Yazbi, F. A, Abdine, H. H. and Shaalan, R. A. 1999. Spectrophotometric and spectrofluorometric methods for the assay of lisinopril in single and multicomponent pharmaceutical dosage forms. J. Pharm. Biomed. Anal. 19: 819-827.
19. Durisehvar, O. and Hulya, S. 1999. Determination of lisinopril from pharmaceutical preparations by deriva-tive UV spectrophotometry. J. Pharm. Biomed. Anal. 21: 691-695.
20. Beata, S. 2005. Estimation of the applicability of dif-ferential spectroscopic method for the determination of lisinopril in tablets and for its evaluation of its stability. Acta Pol. Pharm. 61: 327-334.
21. Erk, N. 1998. Comparative study of the ratio-spectra derivative spectrophotometry, derivative spectropho-tometry and Vierordt’s method applied to the analysis of lisinopril and hydrochlorothiazide in tablets. Spectrosc. Lett. 31: 633-645.
22. Prasad, C. V. N., Saha, R. N. and Parimoo, P. 1999. Simultaneous determination of amlodipine-enalapril maleate and amlodipine-lisinopril in combined tablet preparations by derivative spectrophotometry. Pharm. Pharmacol. Commun. 5: 383-388.
23. Jain, H. K. and Agrawal, R. K. 2000. Spectrophotomet-
ric methods for simultaneous determination of amlo-dipine besylate and lisinopril in tablets. Indian Drugs 37: 196-199.
24. Ozer, D. and Senel, H. 1999. Determination of lisino-pril from pharmaceutical preparations by derivative UV spectrophotometry. J. Pharm. Biomed. Anal. 21: 691-695.
25. Mashru, R. C. and Parikh, P. P. 2000. Development of a method for simultaneous determination of amlodipine besylate and lisinopril in their combined dosage forms. East. Pharm. 43: 111-112.
26. Rahman, N., Siddiqui, M. R. and Azmi, S. N. H. 2007. Spectrophotometric determination of lisinopril in com-mercial dosage forms using N-bromosuccinimide and chloranil. Chem. Anal. (Warsaw) 52: 465-480.
27. Rahman, N., Anwar, N. and Kashif, M. 2005. Applica-tion of pi-acceptors to the spectrophotometric deter-mination of lisinopril in commercial dosage forms. Il Farmaco. 60: 605-611
28. Paraskevas, G., Atta-Politou, J. and Koupparis, M. 2002. Spectrophotometric determination of lisinopril in tablets using 1-fluoro-2,4-dinitrobenzene reagent. J. Pharm. Biomed. Anal. 29: 865-872.
29. Nafisur, R., Manisha, S. and Md. Nasrul, H. 2005. Optimized and validated spectrophotometric methods for the determination of lisinopril in pharmaceutical formulations using ninhydrin and ascorbic acid. J. Braz. Chem. Soc. 16: 1001-1009
30. Asad, R., Tariq, M. A. and Atta, U. R. 2005. Spectro-photometric determination of lisinopril in pure and pharmaceutical formulations. J. Chin. Chem. Soc. 52: 1055-1059.
31. Rajasekaran, A. and Udayavani, S. 2001. Spectropho-tometric determination of lisinopril in pharmaceutical formulations. J. Indian Chem. Soc. 78: 485-486.
32. Armenta, S., Garrigues, S. and Dela Guardia, M. 2008. Green analytical Chemistry. Tr. Ana. Chem. 27: 497-511.
33. Sharma, R. K., Mittal, S., Koel, M. 2003. Analysis of trace amounts of metal ions using silica-based chelating resins: a green analytical method. Crit. Rev. Anal. Chem. 33: 183-197.
34. Vidotti, E. C., Almeida, V. C. and Oliveira, C. C. 2004. Exploiting the bead injection concept for sequential determination of copper and mercury ions in river-water samples. Talanta. 64: 993-999.
35. International Conference on Hormonisation of Technical Requirements for Registration of Pharma-ceuticals for Human Use. ICH Harmonised Tripartite Guideline, Validation of Analytical Procedures: Text and Methodology Q2 (R 1), Complementary Guideline on Methodology dated 06 November 1996, incorpo-rated in November 2005, London.
36. European Pharmacopoeia. 16th. July 2007. Publisher: European Directorate for Quality medicine and health care. Monograph number 1120, pp. 2277. ISBN: 9789287160577


![Spectrophotometric Determination of Trace Amounts of Molybdenum with 3'-methoxy-4'-hydroxy Phenylflurone [J]](https://img.pdfslide.net/doc/110x75/6331d11c83bb92fe98041c2e/spectrophotometric-determination-of-trace-amounts-of-molybdenum-with-3-methoxy-4-hydroxy.jpg)


