Embed Size (px)
Citation preview
Spot-Tailed Earless Lizard Update: January 2017
Travis LaDuc UT Austin Brad Wolaver UT Austin Mike Duran The Nature Conservancy Ben Labay UT Austin Jon Paul Pierre UT Austin Ian Wright UT Austin Gautam Surya UT Austin Cody Shank UT Austin Photo by Mike Duran
Roel Lopez Texas A&M Wade Ryberg Texas A&M Toby Hibbitts Texas A&M Matt Fujita UT Arlington Corey Roelke UT Arlington
Thursday, January 26, 2017
Goals and Agenda
Update of scien7fic progress since Sept. 2016
Discussion of ongoing research
Findings So Far
1. Field data update for 2016 2. Insect survey update 3. Gene7cs status 4. Habitat modeling
1. Status 2. Road bias 3. Ground-‐truthing
+ possible addi7onal research…
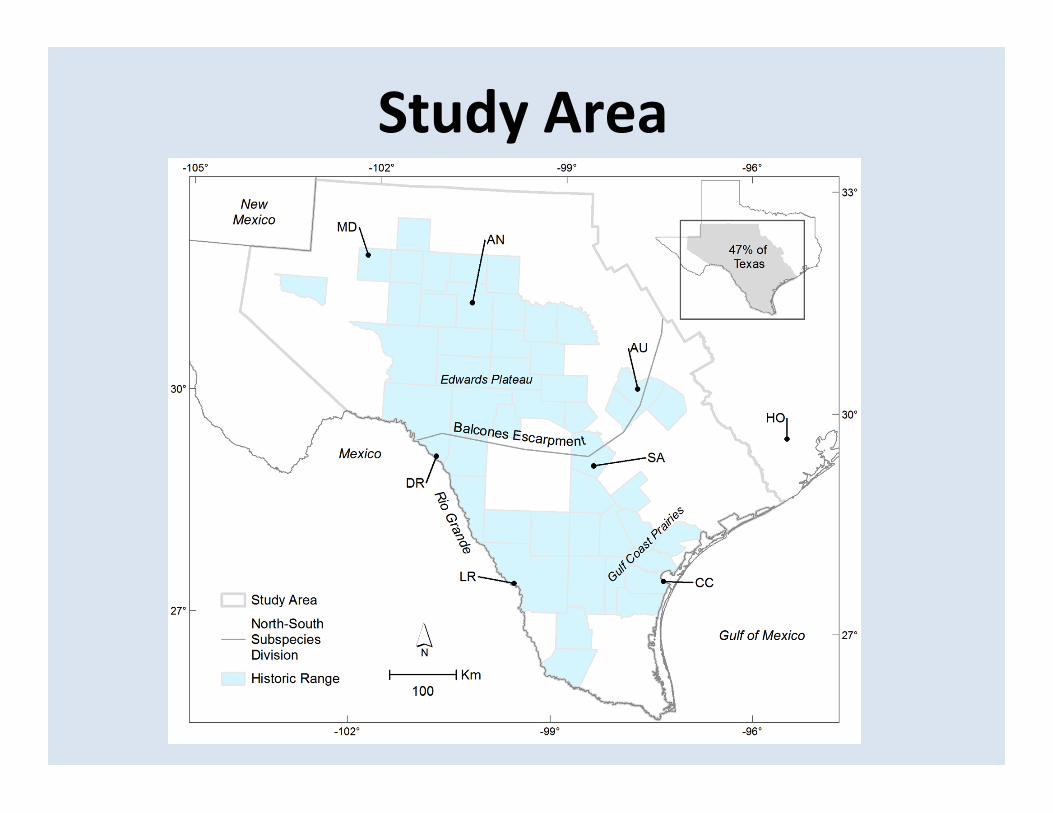
Study Area
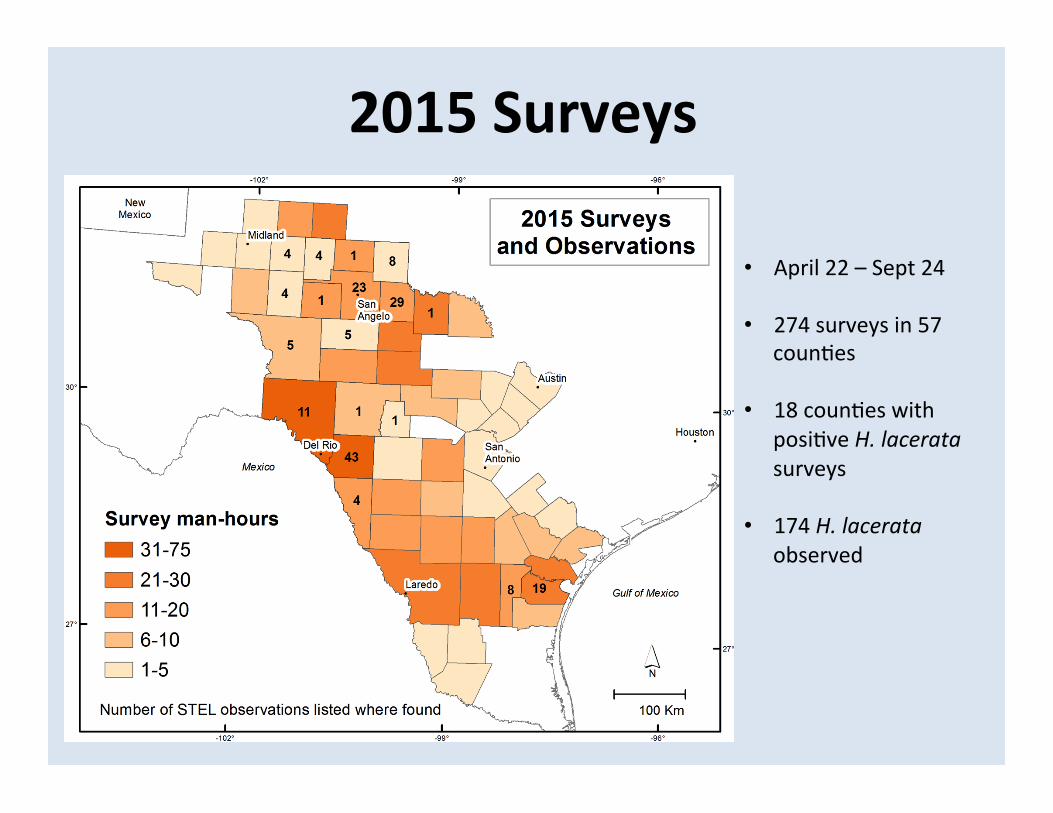
• April 22 – Sept 24 • 274 surveys in 57
coun7es • 18 coun7es with
posi7ve H. lacerata surveys
• 174 H. lacerata
observed
2015 Surveys
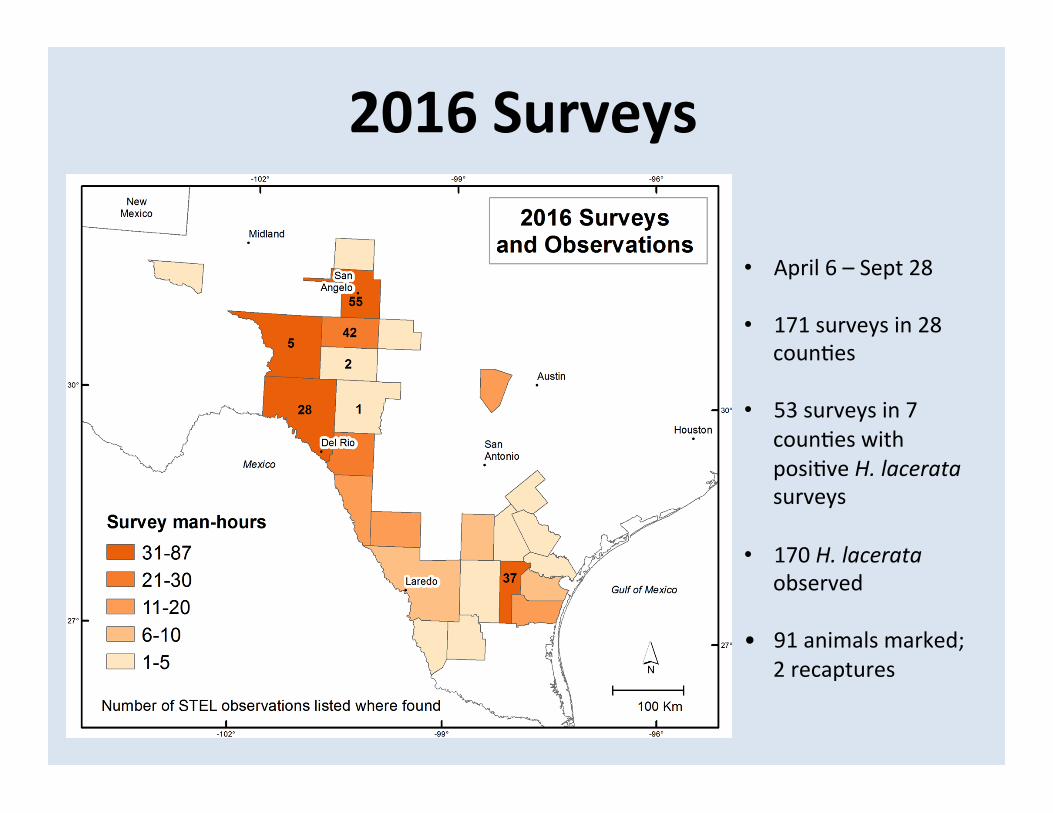
• April 6 – Sept 28 • 171 surveys in 28
coun7es • 53 surveys in 7
coun7es with posi7ve H. lacerata surveys
• 170 H. lacerata
observed • 91 animals marked;
2 recaptures
2016 Surveys
2016 Surveys
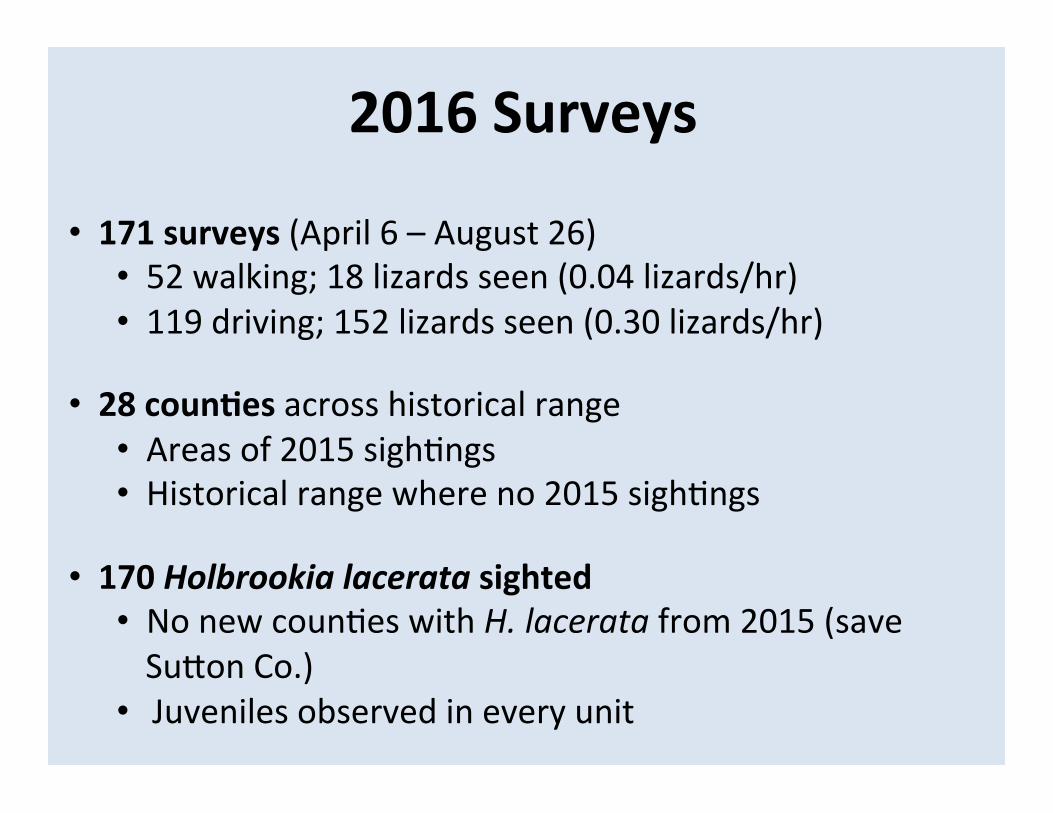
• 171 surveys (April 6 – August 26) • 52 walking; 18 lizards seen (0.04 lizards/hr) • 119 driving; 152 lizards seen (0.30 lizards/hr)
• 28 coun<es across historical range
• Areas of 2015 sigh7ngs • Historical range where no 2015 sigh7ngs
• 170 Holbrookia lacerata sighted
• No new coun7es with H. lacerata from 2015 (save Su[on Co.)
• Juveniles observed in every unit
2016 Surveys
• Mark-‐recapture: • 91 individuals iden7fied (all photographed, 61 toe-‐clipped)
• Two recaptures • Combina7on road and walking surveys
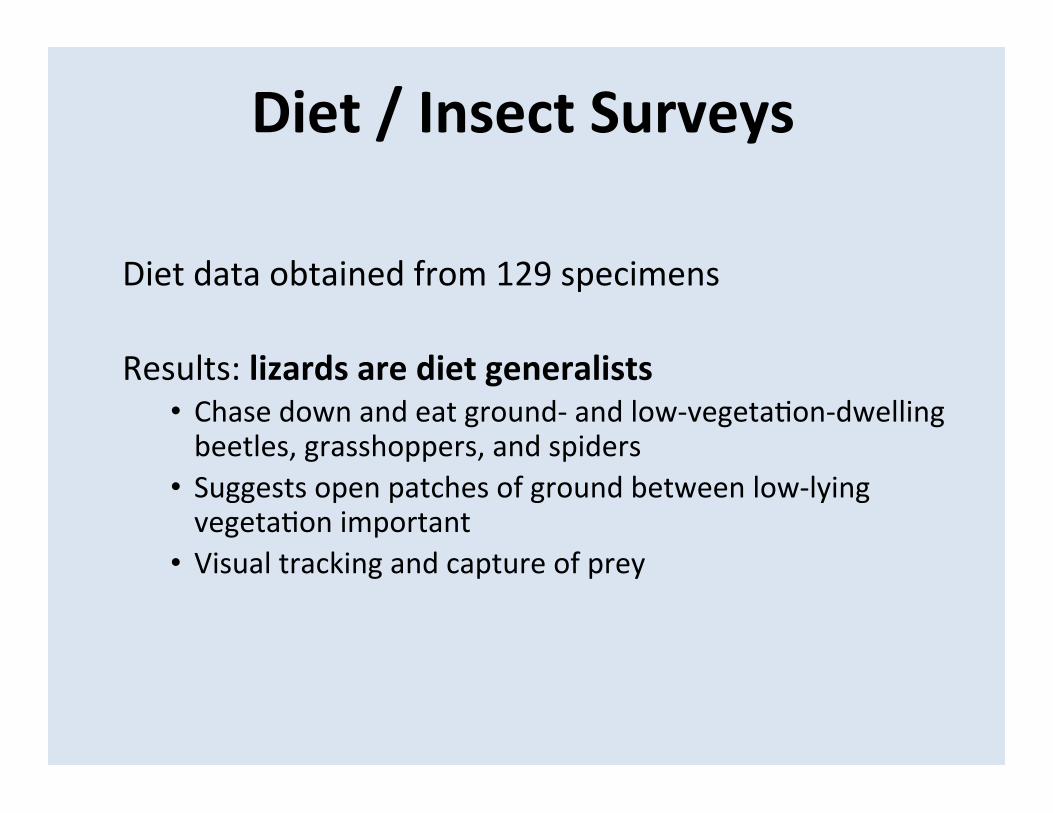
Diet / Insect Surveys
Diet data obtained from 129 specimens
Results: lizards are diet generalists • Chase down and eat ground-‐ and low-‐vegeta7on-‐dwelling beetles, grasshoppers, and spiders
• Suggests open patches of ground between low-‐lying vegeta7on important
• Visual tracking and capture of prey
Diet / Insect Surveys Diet: prey volume
redacted – unpublished data
redacted – unpublished data
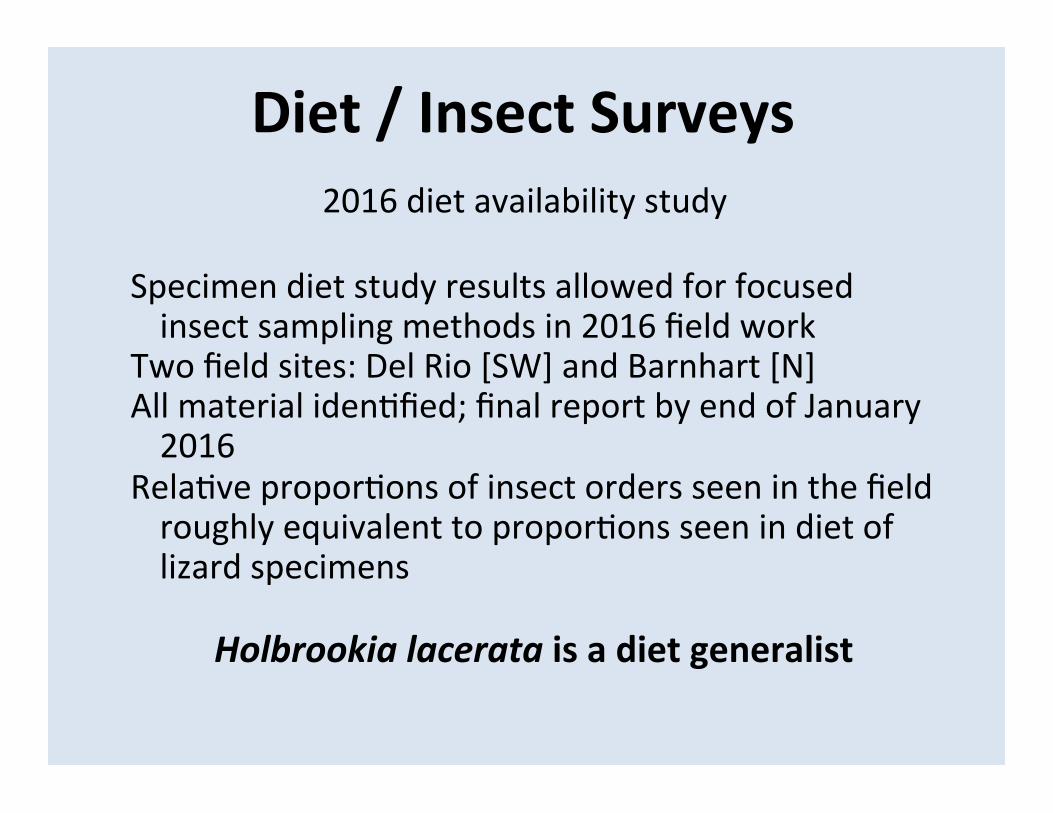
Diet / Insect Surveys 2016 diet availability study
Specimen diet study results allowed for focused insect sampling methods in 2016 field work
Two field sites: Del Rio [SW] and Barnhart [N] All material iden7fied; final report by end of January 2016
Rela7ve propor7ons of insect orders seen in the field roughly equivalent to propor7ons seen in diet of lizard specimens
Holbrookia lacerata is a diet generalist
Gene<cs – TAMU 2015
redacted – unpublished data
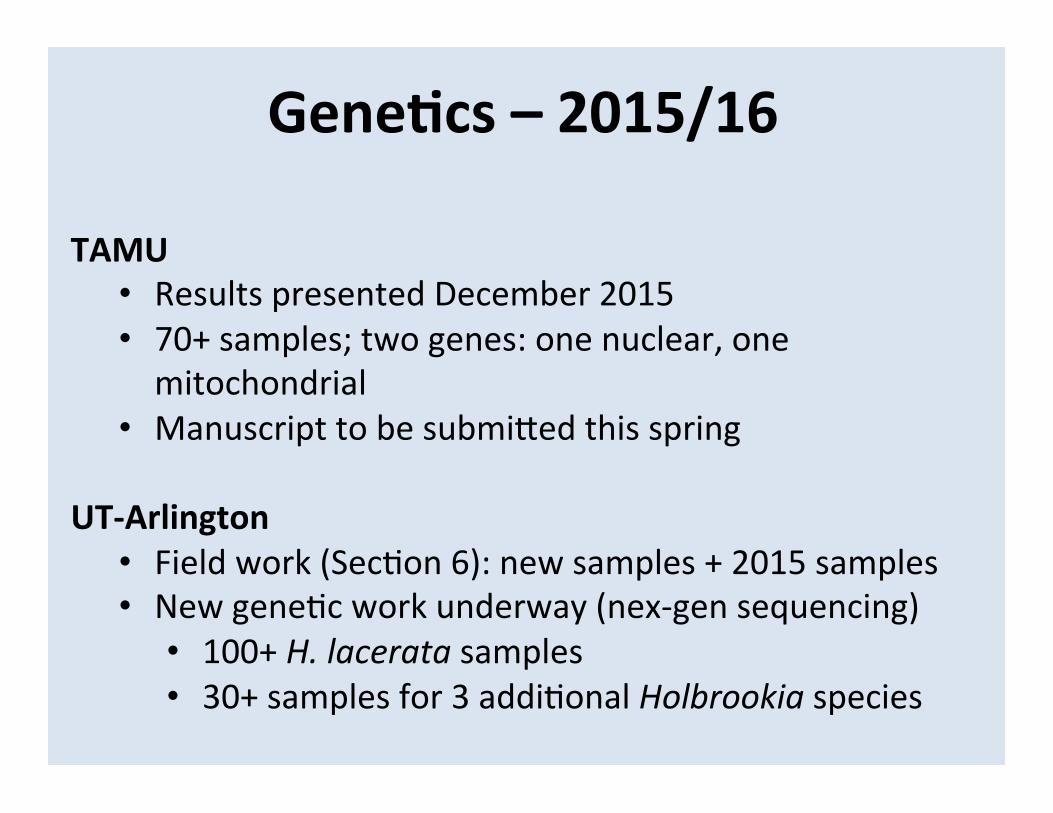
TAMU
• Results presented December 2015 • 70+ samples; two genes: one nuclear, one mitochondrial
• Manuscript to be submi[ed this spring
UT-‐Arlington • Field work (Sec7on 6): new samples + 2015 samples • New gene7c work underway (nex-‐gen sequencing)
• 100+ H. lacerata samples • 30+ samples for 3 addi7onal Holbrookia species
Gene<cs – 2015/16
• Models in general can be used either to predict or to explain
• The purpose of the model helps inform the choice of predictor variables, selec7on of survey data, model algorithm, and other decisions that affect model output
• In this case, we are more interested in predic<on -‐ specifically, spa<al predic<on.
Habitat Model: Background
• Survey data – Bias and autocorrela7on
• Choice of predictor variables – Type of variables used – In case of climate, emissions spectrum and circula7on model
• Modelling algorithm used • Choice of threshold value used to classify habitat
Habitat Model: Uncertainty
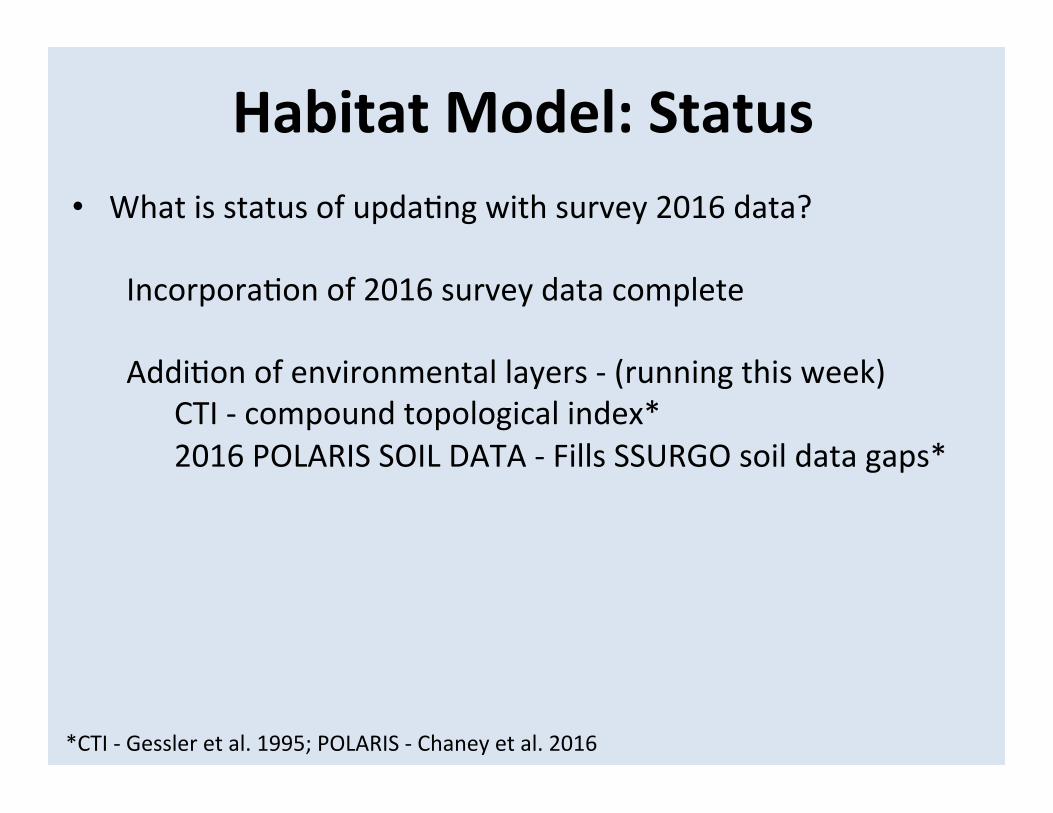
Habitat Model: Status • What is status of upda7ng with survey 2016 data?
Incorpora7on of 2016 survey data complete
Addi7on of environmental layers -‐ (running this week) CTI -‐ compound topological index* 2016 POLARIS SOIL DATA -‐ Fills SSURGO soil data gaps*
*CTI -‐ Gessler et al. 1995; POLARIS -‐ Chaney et al. 2016
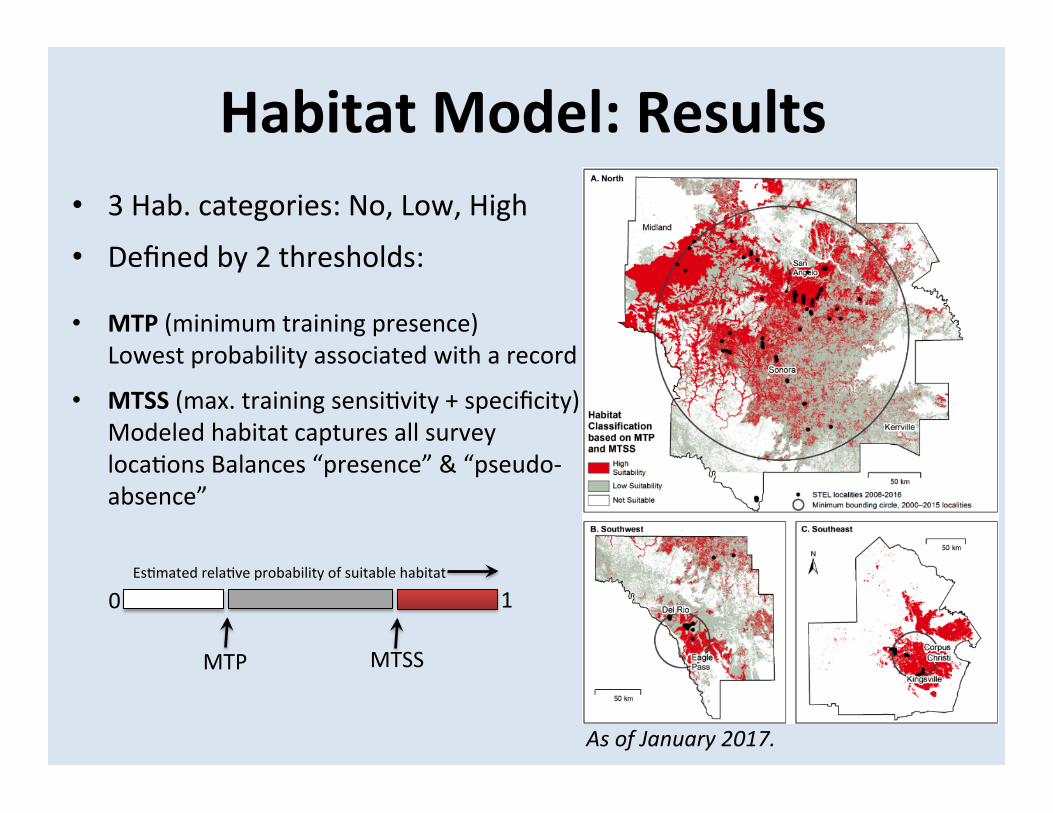
Habitat Model: Results • 3 Hab. categories: No, Low, High • Defined by 2 thresholds:
• MTP (minimum training presence) Lowest probability associated with a record
• MTSS (max. training sensi7vity + specificity) Modeled habitat captures all survey loca7ons Balances “presence” & “pseudo-‐absence”
MTP MTSS
0 1 Es7mated rela7ve probability of suitable habitat
As of January 2017.
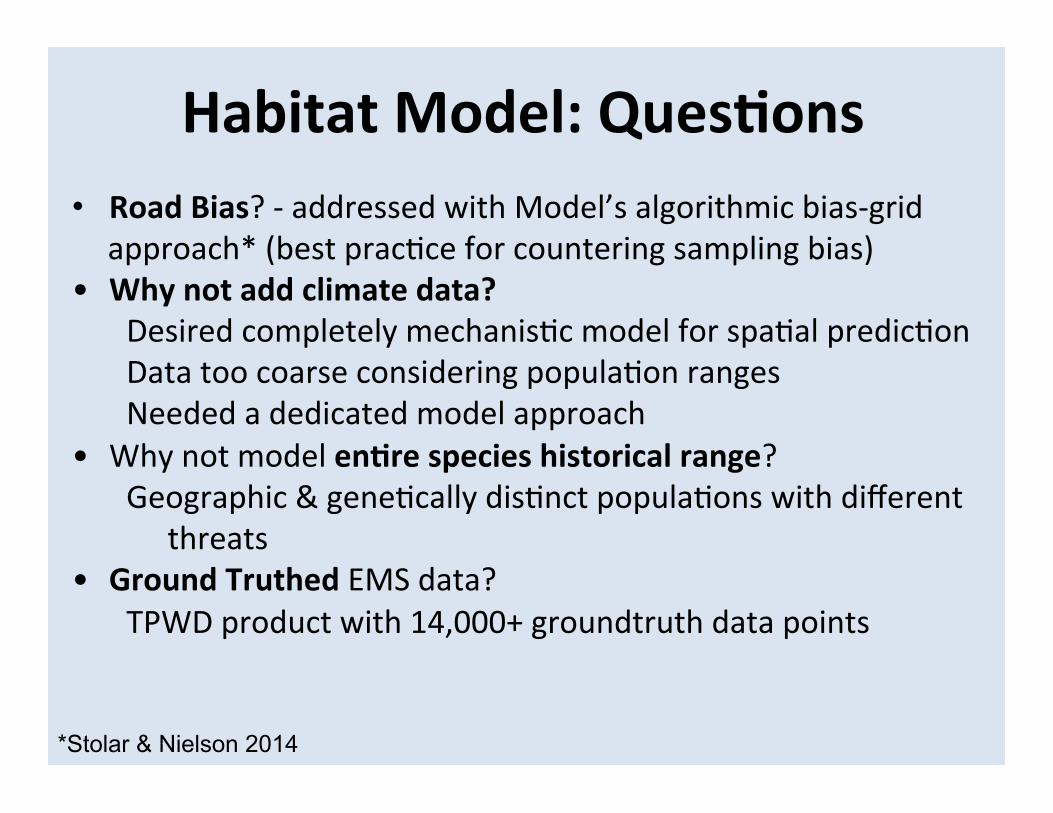
Habitat Model: Ques<ons • Road Bias? -‐ addressed with Model’s algorithmic bias-‐grid
approach* (best prac7ce for countering sampling bias) • Why not add climate data?
Desired completely mechanis7c model for spa7al predic7on Data too coarse considering popula7on ranges Needed a dedicated model approach
• Why not model en<re species historical range? Geographic & gene7cally dis7nct popula7ons with different
threats • Ground Truthed EMS data?
TPWD product with 14,000+ groundtruth data points
*Stolar & Nielson 2014
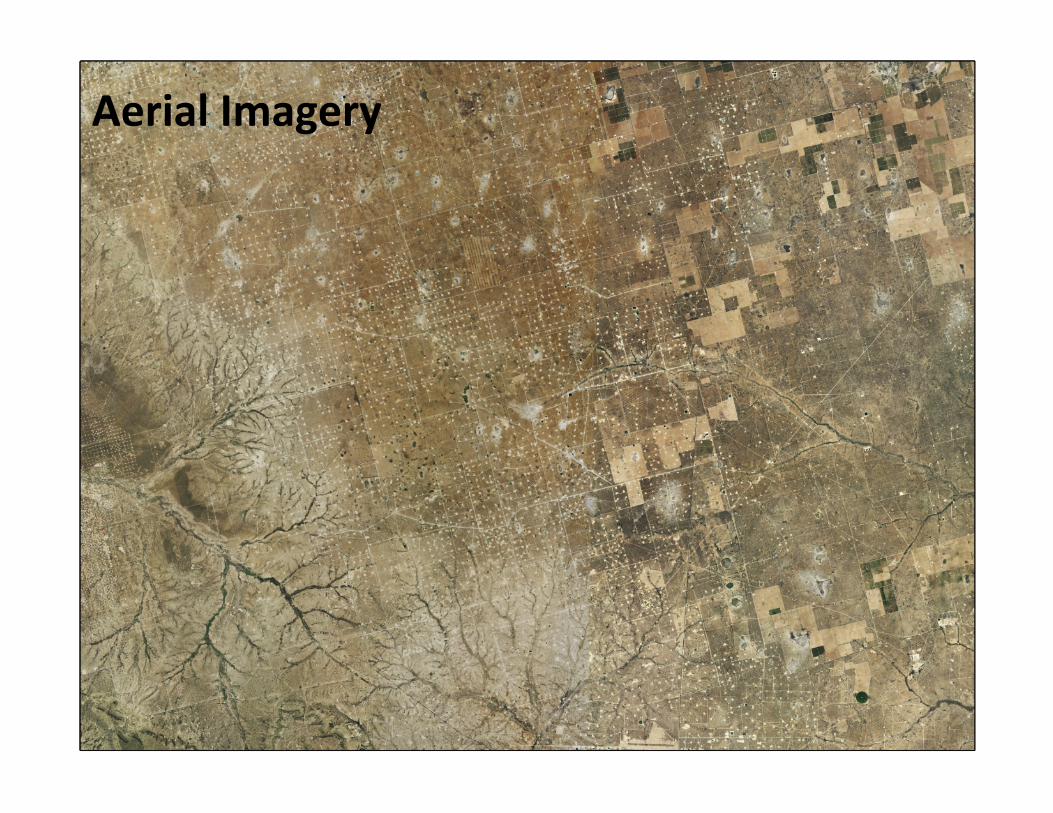
Aerial Imagery
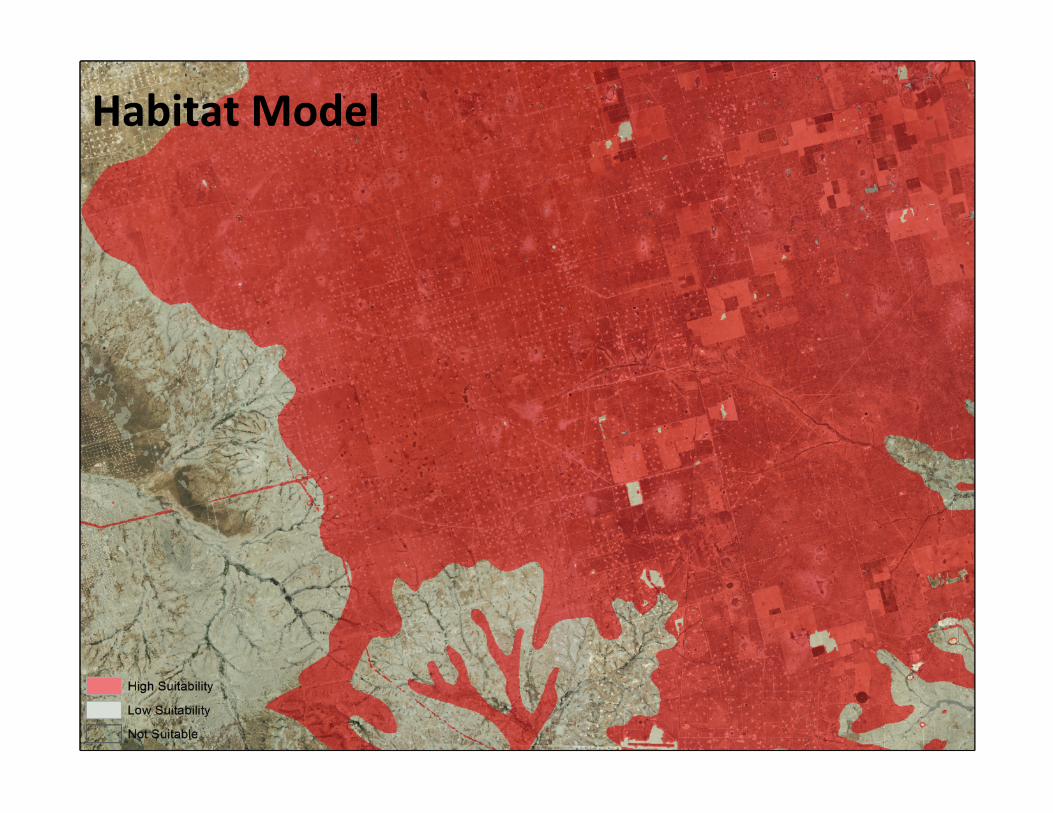
Habitat Model
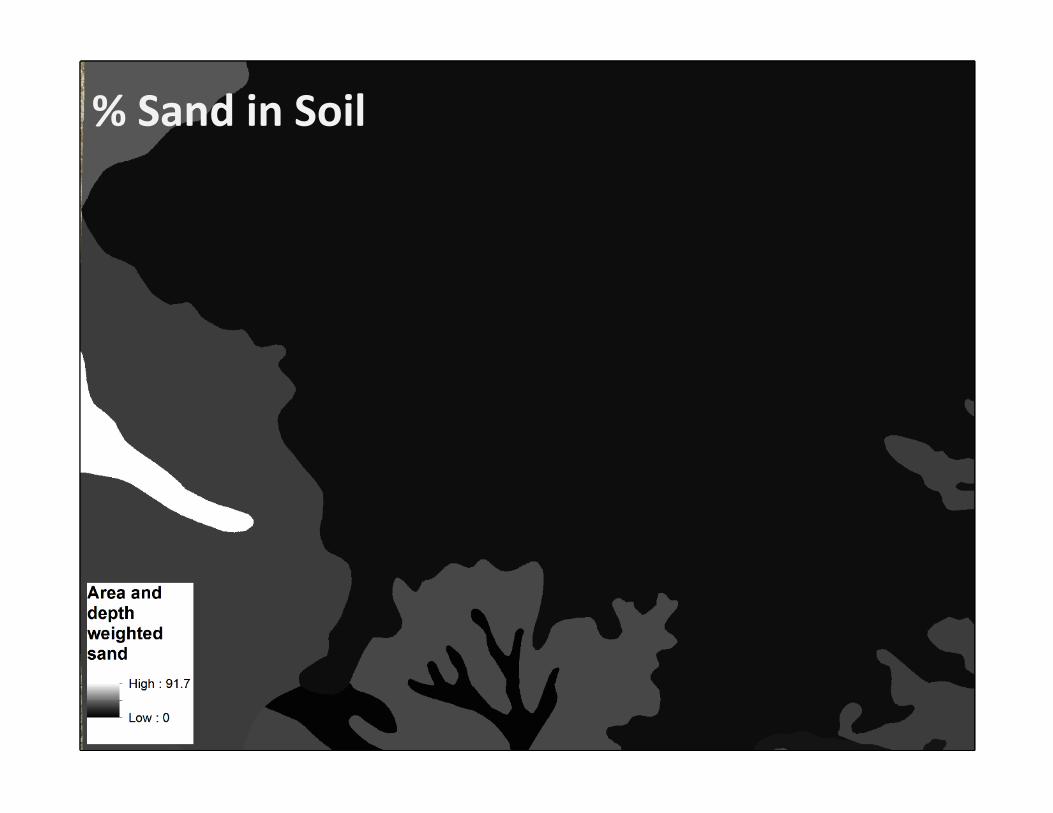
% Sand in Soil
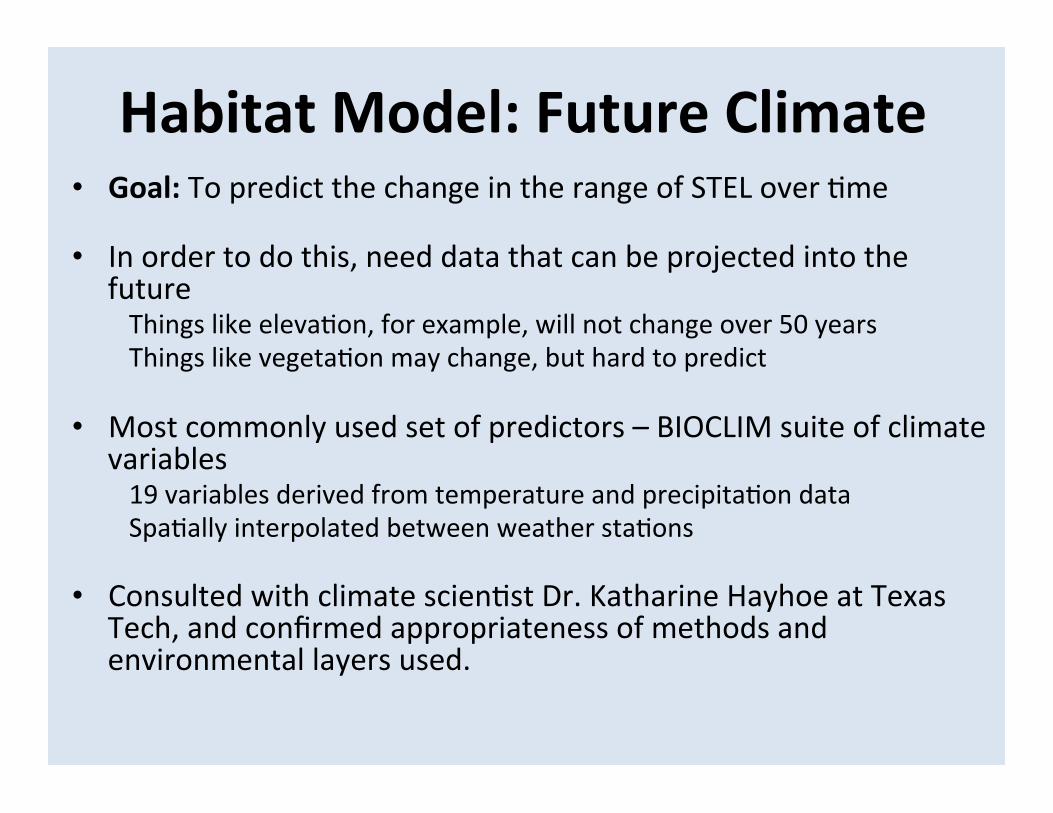
Habitat Model: Future Climate • Goal: To predict the change in the range of STEL over 7me • In order to do this, need data that can be projected into the
future Things like eleva7on, for example, will not change over 50 years Things like vegeta7on may change, but hard to predict
• Most commonly used set of predictors – BIOCLIM suite of climate
variables 19 variables derived from temperature and precipita7on data Spa7ally interpolated between weather sta7ons
• Consulted with climate scien7st Dr. Katharine Hayhoe at Texas
Tech, and confirmed appropriateness of methods and environmental layers used.
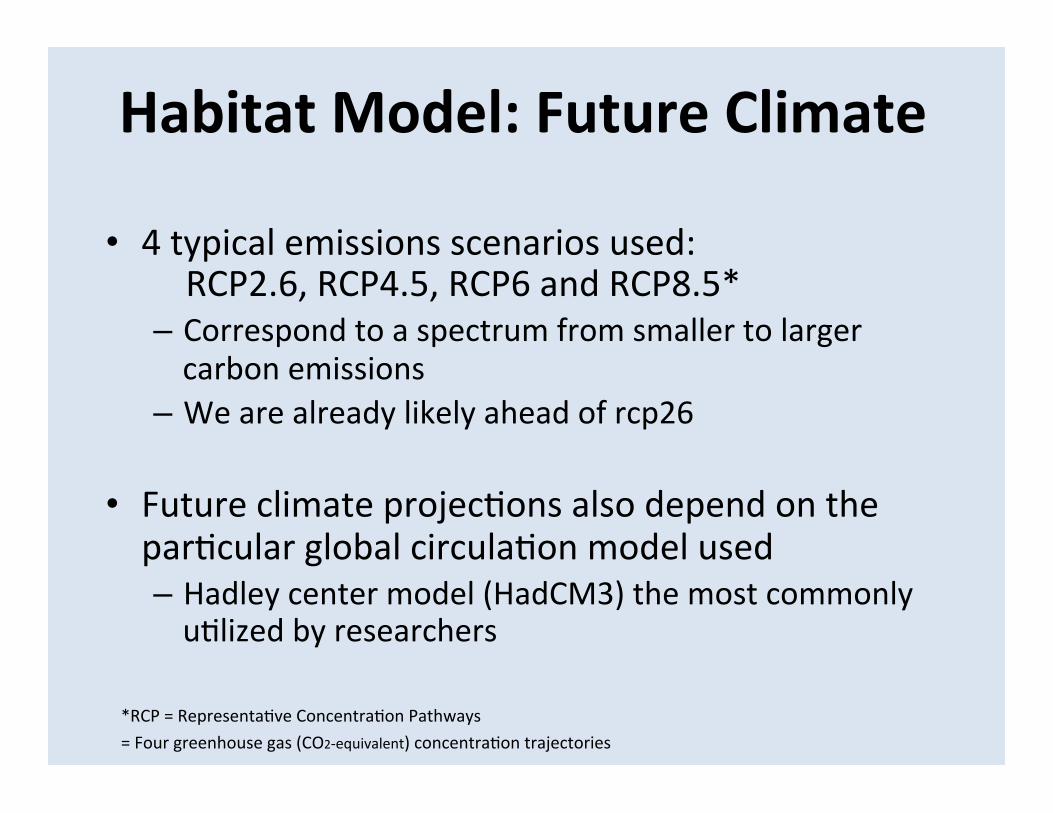
• 4 typical emissions scenarios used: RCP2.6, RCP4.5, RCP6 and RCP8.5*
– Correspond to a spectrum from smaller to larger carbon emissions
– We are already likely ahead of rcp26
• Future climate projec7ons also depend on the par7cular global circula7on model used – Hadley center model (HadCM3) the most commonly u7lized by researchers
Habitat Model: Future Climate
*RCP = Representa7ve Concentra7on Pathways = Four greenhouse gas (CO2-‐equivalent) concentra7on trajectories
What do we need to learn?
Threat assessment • What types of habitat does the species u7lize?
we have general characteriza7on, needs refinement • Refine poten7al causal effects of landscape-‐scale changes on
the species
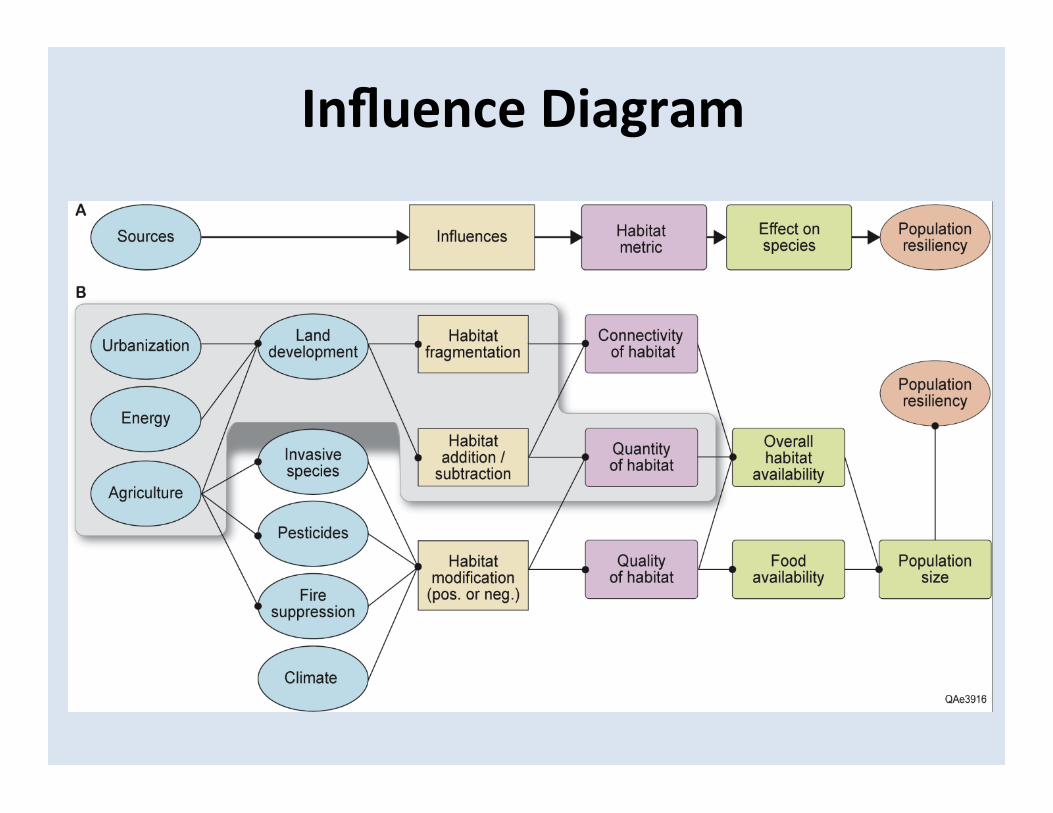
Influence Diagram
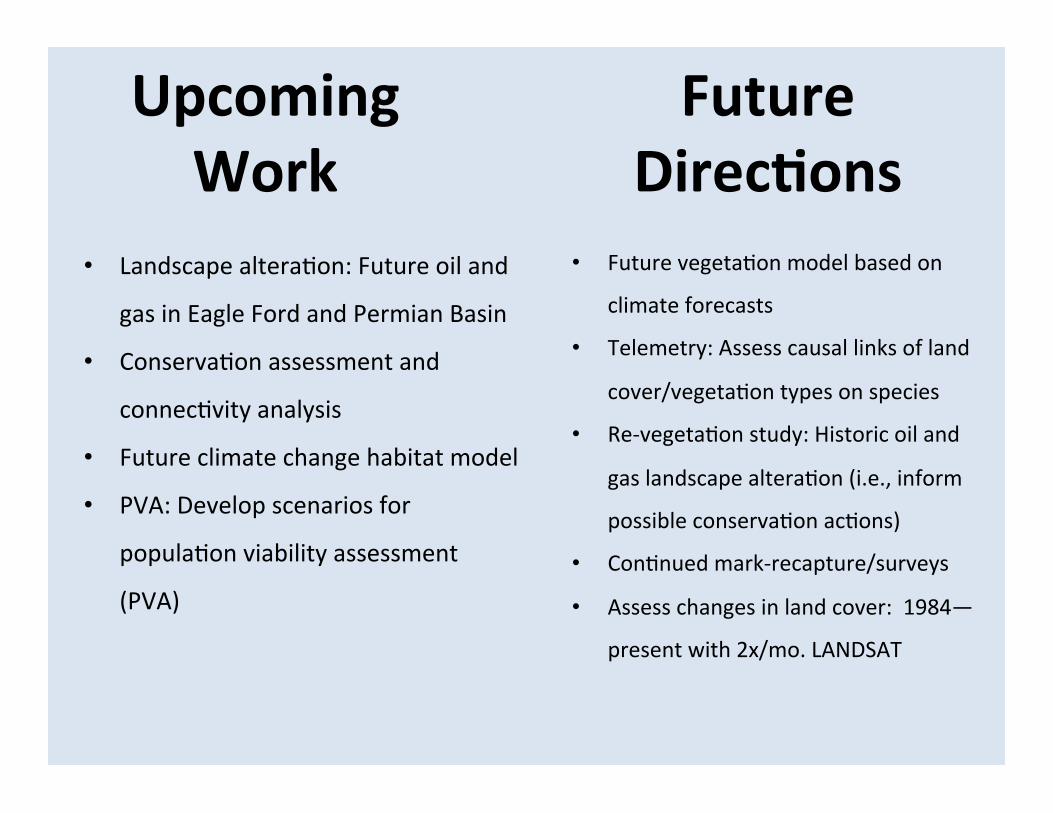
• Future vegeta7on model based on
climate forecasts
• Telemetry: Assess causal links of land
cover/vegeta7on types on species
• Re-‐vegeta7on study: Historic oil and
gas landscape altera7on (i.e., inform
possible conserva7on ac7ons)
• Con7nued mark-‐recapture/surveys
• Assess changes in land cover: 1984—
present with 2x/mo. LANDSAT
Upcoming Work
Future Direc<ons
• Landscape altera7on: Future oil and
gas in Eagle Ford and Permian Basin
• Conserva7on assessment and
connec7vity analysis
• Future climate change habitat model
• PVA: Develop scenarios for
popula7on viability assessment
(PVA)

Thanks for your comments
Ques<ons?


