Embed Size (px)
Citation preview
SRC PE Software
Monitoring and Troubleshooting Guide
Release
4.7.x
Published: 2014-06-12
Copyright © 2014, Juniper Networks, Inc.

Juniper Networks, Inc.1194 North Mathilda AvenueSunnyvale, California 94089USA408-745-2000www.juniper.net
Copyright © 2014, Juniper Networks, Inc. All rights reserved.
Juniper Networks, Junos, Steel-Belted Radius, NetScreen, and ScreenOS are registered trademarks of Juniper Networks, Inc. in the UnitedStates and other countries. The Juniper Networks Logo, the Junos logo, and JunosE are trademarks of Juniper Networks, Inc. All othertrademarks, service marks, registered trademarks, or registered service marks are the property of their respective owners.
Juniper Networks assumes no responsibility for any inaccuracies in this document. Juniper Networks reserves the right to change, modify,transfer, or otherwise revise this publication without notice.
SRC PE Software Monitoring and Troubleshooting GuideRelease 4.7.xCopyright © 2014, Juniper Networks, Inc.All rights reserved.
Revision HistoryJune 2014—Revision 1
The information in this document is current as of the date on the title page.
YEAR 2000 NOTICE
Juniper Networks hardware and software products are Year 2000 compliant. Junos OS has no known time-related limitations through theyear 2038. However, the NTP application is known to have some difficulty in the year 2036.
SOFTWARE LICENSE
The terms and conditions for using this software are described in the software license contained in the acknowledgment to your purchaseorder or, to the extent applicable, to any reseller agreement or end-user purchase agreement executed between you and Juniper Networks.By using this software, you indicate that you understand and agree to be bound by those terms and conditions.
Generally speaking, the software license restricts the manner in which you are permitted to use the software and may contain prohibitionsagainst certain uses. The software license may state conditions under which the license is automatically terminated. You should consultthe license for further details.
For complete product documentation, please see the Juniper Networks Web site at www.juniper.net/techpubs.
ENDUSER LICENSE AGREEMENT
The Juniper Networks product that is the subject of this technical documentation consists of (or is intended for use with) Juniper Networkssoftware. Use of such software is subject to the terms and conditions of the End User License Agreement (“EULA”) posted athttp://www.juniper.net/support/eula.html. By downloading, installing or using such software, you agree to the terms and conditions ofthat EULA.
Copyright © 2014, Juniper Networks, Inc.ii
Abbreviated Table of Contents
About the Documentation . . . . . . . . . . . . . . . . . . . . . . . . . . . . . . . . . . . . . . . . . . xv
Part 1 Monitoring and Troubleshooting the SRCSoftware andCSeriesControllers
Chapter 1 Overview of Monitoring and Troubleshooting Tools . . . . . . . . . . . . . . . . . . . . . 3
Part 2 Using Logging for the SRC Software and C Series Controllers
Chapter 2 Configuring Logging for SRC Components . . . . . . . . . . . . . . . . . . . . . . . . . . . . . 7
Chapter 3 Configuring Logging for SRC Components with the CLI . . . . . . . . . . . . . . . . 25
Chapter 4 Configuring Logging for SRC Components (C-Web Interface) . . . . . . . . . . 39
Part 3 Using Simulated Router Drivers and Simulated Subscribers forTesting
Chapter 5 Configuring a Simulated Router Driver for Testing (SRC CLI) . . . . . . . . . . . 45
Chapter 6 Configuring a Simulated Router Driver for Testing (C-Web Interface) . . . . 47
Chapter 7 Using Simulated Subscribers for Testing (SRC CLI) . . . . . . . . . . . . . . . . . . . 49
Part 4 Using SNMP for Monitoring and Troubleshooting
Chapter 8 Creating Custom SNMP Monitors . . . . . . . . . . . . . . . . . . . . . . . . . . . . . . . . . . . 59
Chapter 9 Configuring SNMP Chassis Alarms . . . . . . . . . . . . . . . . . . . . . . . . . . . . . . . . . . . 71
Chapter 10 Configuring the SNMP Traps (SRC CLI) . . . . . . . . . . . . . . . . . . . . . . . . . . . . . . 79
Chapter 11 Understanding Traps . . . . . . . . . . . . . . . . . . . . . . . . . . . . . . . . . . . . . . . . . . . . . . 85
Part 5 Monitoring the SRC Software and the C Series Controller withthe C-Web Interface and the SRC CLI
Chapter 12 Monitoring with the SRC CLI and the C-Web Interface . . . . . . . . . . . . . . . . . 107
Chapter 13 Monitoring the System (SRC CLI) . . . . . . . . . . . . . . . . . . . . . . . . . . . . . . . . . . . 111
Chapter 14 Monitoring the System (C-Web Interface) . . . . . . . . . . . . . . . . . . . . . . . . . . . . 117
Chapter 15 Monitoring SAE Data (SRC CLI) . . . . . . . . . . . . . . . . . . . . . . . . . . . . . . . . . . . . 125
Chapter 16 Monitoring SAE Data (C-Web Interface) . . . . . . . . . . . . . . . . . . . . . . . . . . . . . 153
Chapter 17 Monitoring and Troubleshooting the NIC (SRC CLI) . . . . . . . . . . . . . . . . . . . 179
Chapter 18 Monitoring the NIC (C-Web Interface) . . . . . . . . . . . . . . . . . . . . . . . . . . . . . . 189
Chapter 19 Monitoring NTP (SRC CLI) . . . . . . . . . . . . . . . . . . . . . . . . . . . . . . . . . . . . . . . . . 195
Chapter 20 Monitoring NTP (C-Web Interface) . . . . . . . . . . . . . . . . . . . . . . . . . . . . . . . . . 199
iiiCopyright © 2014, Juniper Networks, Inc.
Chapter 21 Monitoring Redirect Server (SRC CLI) . . . . . . . . . . . . . . . . . . . . . . . . . . . . . . 203
Chapter 22 Monitoring the Redirect Server and Filtered Traffic (C-Web Interface) . . 205
Chapter 23 Troubleshooting Network Connectivity (SRC CLI) . . . . . . . . . . . . . . . . . . . . 207
Chapter 24 Monitoring Network Connectivity (C-Web Interface) . . . . . . . . . . . . . . . . . . 211
Chapter 25 Monitoring Activity for SRC Components . . . . . . . . . . . . . . . . . . . . . . . . . . . . 213
Part 6 Index
Index . . . . . . . . . . . . . . . . . . . . . . . . . . . . . . . . . . . . . . . . . . . . . . . . . . . . . . . . . . . 223
Copyright © 2014, Juniper Networks, Inc.iv
SRC 4.7.x Monitoring and Troubleshooting Guide
Table of Contents
About the Documentation . . . . . . . . . . . . . . . . . . . . . . . . . . . . . . . . . . . . . . . . . . xv
SRC Documentation and Release Notes . . . . . . . . . . . . . . . . . . . . . . . . . . . . . xv
Audience . . . . . . . . . . . . . . . . . . . . . . . . . . . . . . . . . . . . . . . . . . . . . . . . . . . . . . xv
Documentation Conventions . . . . . . . . . . . . . . . . . . . . . . . . . . . . . . . . . . . . . . xv
Documentation Feedback . . . . . . . . . . . . . . . . . . . . . . . . . . . . . . . . . . . . . . . . xvii
Requesting Technical Support . . . . . . . . . . . . . . . . . . . . . . . . . . . . . . . . . . . . xvii
Self-Help Online Tools and Resources . . . . . . . . . . . . . . . . . . . . . . . . . . xviii
Opening a Case with JTAC . . . . . . . . . . . . . . . . . . . . . . . . . . . . . . . . . . . . xviii
Part 1 Monitoring and Troubleshooting the SRCSoftware andCSeriesControllers
Chapter 1 Overview of Monitoring and Troubleshooting Tools . . . . . . . . . . . . . . . . . . . . . 3
Monitoring and Troubleshooting Tools Overview . . . . . . . . . . . . . . . . . . . . . . . . . . . 3
Part 2 Using Logging for the SRC Software and C Series Controllers
Chapter 2 Configuring Logging for SRC Components . . . . . . . . . . . . . . . . . . . . . . . . . . . . . 7
Logging for SRC Components Overview . . . . . . . . . . . . . . . . . . . . . . . . . . . . . . . . . . 7
Categories and Severity Levels for Event Messages . . . . . . . . . . . . . . . . . . . . . . . . . 7
Defining Categories . . . . . . . . . . . . . . . . . . . . . . . . . . . . . . . . . . . . . . . . . . . . . . . 8
Defining Severity Levels . . . . . . . . . . . . . . . . . . . . . . . . . . . . . . . . . . . . . . . . . . . 18
Defining Filters . . . . . . . . . . . . . . . . . . . . . . . . . . . . . . . . . . . . . . . . . . . . . . . . . . 19
Enabling Network Device-Specific Filtering for SAE Debug Logs (SRC
CLI) . . . . . . . . . . . . . . . . . . . . . . . . . . . . . . . . . . . . . . . . . . . . . . . . . . . . . . . 20
Rotating Log Files . . . . . . . . . . . . . . . . . . . . . . . . . . . . . . . . . . . . . . . . . . . . . . . . . . . 22
Configuration Overview . . . . . . . . . . . . . . . . . . . . . . . . . . . . . . . . . . . . . . . . . . 24
Chapter 3 Configuring Logging for SRC Components with the CLI . . . . . . . . . . . . . . . . 25
Configuration Statements for SRC Component Logging . . . . . . . . . . . . . . . . . . . . 25
Configuring an SRC Component to Store Log Messages in a File (SRC CLI) . . . . . 26
Configuring System Logging (SRC CLI) . . . . . . . . . . . . . . . . . . . . . . . . . . . . . . . . . . 28
Configuration Statements for the Logrotate Utility (SRC CLI) . . . . . . . . . . . . . . . 30
Configuring the Logrotate Utility (SRC CLI) . . . . . . . . . . . . . . . . . . . . . . . . . . . . . . 32
Configuring the Global Options for the Logrotate Utility . . . . . . . . . . . . . . . . . 35
Configuring Log Rotation Options for Specific Logging Configuration
Files . . . . . . . . . . . . . . . . . . . . . . . . . . . . . . . . . . . . . . . . . . . . . . . . . . . . . . 35
Configuring Logging Rotation Options for System and SRC Components
(SRC CLI) . . . . . . . . . . . . . . . . . . . . . . . . . . . . . . . . . . . . . . . . . . . . . . . . . . 36
vCopyright © 2014, Juniper Networks, Inc.
Chapter 4 Configuring Logging for SRC Components (C-Web Interface) . . . . . . . . . . 39
Before You Configure Logging for SRC Components . . . . . . . . . . . . . . . . . . . . . . . 39
Configuring ACP to Store Log Messages in a File (C-Web Interface) . . . . . . . . . . . 39
Configuring the SAE to Store Log Messages in a File (C-Web Interface) . . . . . . . 40
Configuring NIC to Store Log Messages in a File (C-Web Interface) . . . . . . . . . . . 40
Configuring the SNMP to Store Log Messages in a File (C-Web Interface) . . . . . . 41
Configuring JPS to Store Log Messages in a File (C-Web Interface) . . . . . . . . . . . . 41
Part 3 Using Simulated Router Drivers and Simulated Subscribers forTesting
Chapter 5 Configuring a Simulated Router Driver for Testing (SRC CLI) . . . . . . . . . . . 45
Simulated Router Drivers for the SRC Software Overview . . . . . . . . . . . . . . . . . . . 45
Configuring Simulated Router Drivers (SRC CLI) . . . . . . . . . . . . . . . . . . . . . . . . . . 45
Chapter 6 Configuring a Simulated Router Driver for Testing (C-Web Interface) . . . . 47
Configuring a Simulated Router Driver for Testing (C-Web Interface) . . . . . . . . . . 47
Chapter 7 Using Simulated Subscribers for Testing (SRC CLI) . . . . . . . . . . . . . . . . . . . 49
Simulated Subscribers Overview . . . . . . . . . . . . . . . . . . . . . . . . . . . . . . . . . . . . . . 49
Commands to Manage Simulated Subscribers . . . . . . . . . . . . . . . . . . . . . . . . . . . 49
Logging In Simulated Subscribers (SRC CLI) . . . . . . . . . . . . . . . . . . . . . . . . . . . . . 50
Logging In Authenticated DHCP Subscribers . . . . . . . . . . . . . . . . . . . . . . . . . 50
Logging In Authenticated Interface Subscribers . . . . . . . . . . . . . . . . . . . . . . . . 51
Logging In Unauthenticated DHCP Subscribers . . . . . . . . . . . . . . . . . . . . . . . 52
Logging In Unauthenticated Interface Subscribers . . . . . . . . . . . . . . . . . . . . . 52
Viewing Subscriber Sessions (SRC CLI) . . . . . . . . . . . . . . . . . . . . . . . . . . . . . . . . . 53
Logging Out Simulated Subscribers (SRC CLI) . . . . . . . . . . . . . . . . . . . . . . . . . . . 53
Logging Out Subscribers by DN . . . . . . . . . . . . . . . . . . . . . . . . . . . . . . . . . . . . 54
Logging Out Subscribers by IP Address . . . . . . . . . . . . . . . . . . . . . . . . . . . . . . 54
Logging Out Subscribers by Login Name . . . . . . . . . . . . . . . . . . . . . . . . . . . . . 54
Logging Out Subscribers by Session ID . . . . . . . . . . . . . . . . . . . . . . . . . . . . . . 55
Part 4 Using SNMP for Monitoring and Troubleshooting
Chapter 8 Creating Custom SNMP Monitors . . . . . . . . . . . . . . . . . . . . . . . . . . . . . . . . . . . 59
SNMP Monitoring on C Series Controllers . . . . . . . . . . . . . . . . . . . . . . . . . . . . . . . . 59
Configuration Statements for Customized SRC SNMP Monitors . . . . . . . . . . . . . . 61
Configuring an SNMP Alarm on a C Series Controller (SRC CLI) . . . . . . . . . . . . . . 62
Defining an Alarm for an SNMP Monitor That Compares Object Values (SRC
CLI) . . . . . . . . . . . . . . . . . . . . . . . . . . . . . . . . . . . . . . . . . . . . . . . . . . . . . . . . . . 63
Defining an Alarm to Monitor the Status of an Object (SRC CLI) . . . . . . . . . . . . . 64
Defining an Alarm for an SNMP Monitor That Compares Values Against
Thresholds (SRC CLI) . . . . . . . . . . . . . . . . . . . . . . . . . . . . . . . . . . . . . . . . . . . . 65
Defining a Discontinuity Check to Validate Delta Values (SRC CLI) . . . . . . . . . . . 65
Configuring an SNMPv3 Security Name for SNMP Monitoring (SRC CLI) . . . . . . . 66
Defining Events for Which SNMP Sends Notifications (SRC CLI) . . . . . . . . . . . . . 66
Defining Events That Set Values for SNMP MIB Objects (SRC CLI) . . . . . . . . . . . . 67
Example: SNMP Monitoring of Multiple MIB Objects . . . . . . . . . . . . . . . . . . . . . . . 68
Copyright © 2014, Juniper Networks, Inc.vi
SRC 4.7.x Monitoring and Troubleshooting Guide
Chapter 9 Configuring SNMP Chassis Alarms . . . . . . . . . . . . . . . . . . . . . . . . . . . . . . . . . . . 71
SNMP Chassis Alarms on a C Series Controller . . . . . . . . . . . . . . . . . . . . . . . . . . . . 71
Configuring SNMP Chassis Alarms (SRC CLI) . . . . . . . . . . . . . . . . . . . . . . . . . . . . . 72
Defining Alarm Thresholds for Battery Voltage Sensors . . . . . . . . . . . . . . . . . . . . . 72
Defining Alarm Thresholds for CPU Sensors . . . . . . . . . . . . . . . . . . . . . . . . . . . . . . 73
Defining Alarm Thresholds for CPU Core Voltage Sensors . . . . . . . . . . . . . . . 73
Defining Alarm Thresholds for CPU DIMM Voltage Sensors . . . . . . . . . . . . . . 74
Defining Alarm Thresholds for CPU Temperature Sensors . . . . . . . . . . . . . . . 75
Defining Alarm Thresholds for Fan Speed Sensors . . . . . . . . . . . . . . . . . . . . . . . . . 75
Defining Alarm Thresholds for System Temperature Sensors . . . . . . . . . . . . . . . . 76
Defining Alarm Thresholds for Voltage Sensors . . . . . . . . . . . . . . . . . . . . . . . . . . . 77
Chapter 10 Configuring the SNMP Traps (SRC CLI) . . . . . . . . . . . . . . . . . . . . . . . . . . . . . . 79
SNMP Traps Overview . . . . . . . . . . . . . . . . . . . . . . . . . . . . . . . . . . . . . . . . . . . . . . . 79
MIBs . . . . . . . . . . . . . . . . . . . . . . . . . . . . . . . . . . . . . . . . . . . . . . . . . . . . . . . . . . 79
Configuration MIBs . . . . . . . . . . . . . . . . . . . . . . . . . . . . . . . . . . . . . . . . . . 80
Traps . . . . . . . . . . . . . . . . . . . . . . . . . . . . . . . . . . . . . . . . . . . . . . . . . . . . . . . . . 80
SNMP Traps and Informs . . . . . . . . . . . . . . . . . . . . . . . . . . . . . . . . . . . . . . . . . 81
Configuration Statements for the SNMP Traps . . . . . . . . . . . . . . . . . . . . . . . . . . . . 81
Configuring Performance Traps (SRC CLI) . . . . . . . . . . . . . . . . . . . . . . . . . . . . . . . 82
Configuring Event Traps (SRC CLI) . . . . . . . . . . . . . . . . . . . . . . . . . . . . . . . . . . . . . 83
Chapter 11 Understanding Traps . . . . . . . . . . . . . . . . . . . . . . . . . . . . . . . . . . . . . . . . . . . . . . 85
Performance Traps . . . . . . . . . . . . . . . . . . . . . . . . . . . . . . . . . . . . . . . . . . . . . . . . . 85
R/AV . . . . . . . . . . . . . . . . . . . . . . . . . . . . . . . . . . . . . . . . . . . . . . . . . . . . . . . . . 86
Trap Numbers in Performance Traps . . . . . . . . . . . . . . . . . . . . . . . . . . . . . . . . . . . 86
Decoding Trap Numbers for Raised Trap Actions . . . . . . . . . . . . . . . . . . . . . . . . . . 87
Decoding Trap Numbers for Clear Trap Actions . . . . . . . . . . . . . . . . . . . . . . . . . . . 87
SRC Performance Traps . . . . . . . . . . . . . . . . . . . . . . . . . . . . . . . . . . . . . . . . . . . . . 88
SAE Performance Traps . . . . . . . . . . . . . . . . . . . . . . . . . . . . . . . . . . . . . . . . . . 88
Accounting Performance Traps . . . . . . . . . . . . . . . . . . . . . . . . . . . . . . . . . . . . 90
Authentication Performance Traps . . . . . . . . . . . . . . . . . . . . . . . . . . . . . . . . . 92
NIC Performance Traps . . . . . . . . . . . . . . . . . . . . . . . . . . . . . . . . . . . . . . . . . . 93
Router Driver Performance Traps . . . . . . . . . . . . . . . . . . . . . . . . . . . . . . . . . . . 94
System Management Performance Traps . . . . . . . . . . . . . . . . . . . . . . . . . . . . 96
Policy Engine Performance Traps . . . . . . . . . . . . . . . . . . . . . . . . . . . . . . . . . . 96
SRC Redirector Performance Traps . . . . . . . . . . . . . . . . . . . . . . . . . . . . . . . . . 97
SRC ACP Performance Traps . . . . . . . . . . . . . . . . . . . . . . . . . . . . . . . . . . . . . . 97
JPS Performance Traps . . . . . . . . . . . . . . . . . . . . . . . . . . . . . . . . . . . . . . . . . . 98
Chassis Performance Traps . . . . . . . . . . . . . . . . . . . . . . . . . . . . . . . . . . . . . . . 98
Event Traps . . . . . . . . . . . . . . . . . . . . . . . . . . . . . . . . . . . . . . . . . . . . . . . . . . . . . . . 99
Alarm State Transitions . . . . . . . . . . . . . . . . . . . . . . . . . . . . . . . . . . . . . . . . . . . . . 102
Part 5 Monitoring the SRC Software and the C Series Controller withthe C-Web Interface and the SRC CLI
Chapter 12 Monitoring with the SRC CLI and the C-Web Interface . . . . . . . . . . . . . . . . . 107
Monitoring with the SRC CLI and the C-Web Interface . . . . . . . . . . . . . . . . . . . . . 107
SRC Monitoring Options . . . . . . . . . . . . . . . . . . . . . . . . . . . . . . . . . . . . . . . . . . . . . 107
viiCopyright © 2014, Juniper Networks, Inc.
Table of Contents
Chapter 13 Monitoring the System (SRC CLI) . . . . . . . . . . . . . . . . . . . . . . . . . . . . . . . . . . . 111
Viewing Information About a C Series Controller (SRC CLI) . . . . . . . . . . . . . . . . . . 111
Viewing Information About Components Installed (SRC CLI) . . . . . . . . . . . . . . . . 113
Viewing Information About Boot Messages (SRC CLI) . . . . . . . . . . . . . . . . . . . . . 113
Viewing Information About Security Certificates (SRC CLI) . . . . . . . . . . . . . . . . . 115
Chapter 14 Monitoring the System (C-Web Interface) . . . . . . . . . . . . . . . . . . . . . . . . . . . . 117
Viewing Information About the System (C-Web Interface) . . . . . . . . . . . . . . . . . . 117
Viewing the System Date and Time (C-Web Interface) . . . . . . . . . . . . . . . . . . . . . 118
Viewing Information About Components Installed (C-Web Interface) . . . . . . . . . 119
Viewing Information About Boot Messages (C-Web Interface) . . . . . . . . . . . . . . 119
Viewing Information About Security Certificates (C-Web Interface) . . . . . . . . . . 120
Viewing Information About System Disk Status (C-Web Interface) . . . . . . . . . . . 121
Viewing Information About the Users on the System (C-Web Interface) . . . . . . . 121
Viewing Information About the Juniper Networks Database in Community Mode
(C-Web Interface) . . . . . . . . . . . . . . . . . . . . . . . . . . . . . . . . . . . . . . . . . . . . . . 122
Viewing Statistics for the Juniper Networks Database (C-Web Interface) . . . . . . 123
Viewing Information About the SRC CLI (C-Web Interface) . . . . . . . . . . . . . . . . . 123
Viewing Information About the SRC CLI (C-Web Interface) . . . . . . . . . . . . . 123
Viewing Information About SRC CLI User Permissions (C-Web
Interface) . . . . . . . . . . . . . . . . . . . . . . . . . . . . . . . . . . . . . . . . . . . . . . . . . 124
Chapter 15 Monitoring SAE Data (SRC CLI) . . . . . . . . . . . . . . . . . . . . . . . . . . . . . . . . . . . . 125
Viewing SAE Data with the CLI . . . . . . . . . . . . . . . . . . . . . . . . . . . . . . . . . . . . . . . . 125
Viewing Information About the Directory Blacklist (SRC CLI) . . . . . . . . . . . . 125
Viewing Information About SAE Device Drivers (SRC CLI) . . . . . . . . . . . . . . 126
Viewing the Synchronization Status of SAE Session Stores (SRC CLI) . . . . . 127
Viewing Information About SAE Interfaces (SRC CLI) . . . . . . . . . . . . . . . . . . 128
Viewing Information About SAE Licenses (SRC CLI) . . . . . . . . . . . . . . . . . . . 128
Viewing Information About Policies on the SAE (SRC CLI) . . . . . . . . . . . . . . 129
Viewing Login Registrations (SRC CLI) . . . . . . . . . . . . . . . . . . . . . . . . . . . . . . 130
Viewing Equipment Registrations (SRC CLI) . . . . . . . . . . . . . . . . . . . . . . . . . . 131
Viewing Information About Services (SRC CLI) . . . . . . . . . . . . . . . . . . . . . . . 131
Viewing Information About Threads (SRC CLI) . . . . . . . . . . . . . . . . . . . . . . . 134
Viewing Information About Subscriber Sessions (SRC CLI) . . . . . . . . . . . . . . . . . 134
Viewing General Information About Subscriber Sessions (SRC CLI) . . . . . . 135
Viewing Information About Subscriber Sessions by DN (SRC CLI) . . . . . . . . 135
Viewing Information About Subscriber Sessions by IP Address, VPN Identifier,
or both (SRC CLI) . . . . . . . . . . . . . . . . . . . . . . . . . . . . . . . . . . . . . . . . . . . 136
Viewing Information About Subscriber Sessions by Login Name (SRC
CLI) . . . . . . . . . . . . . . . . . . . . . . . . . . . . . . . . . . . . . . . . . . . . . . . . . . . . . . 137
Viewing Information About Subscriber Sessions by Service Name (SRC
CLI) . . . . . . . . . . . . . . . . . . . . . . . . . . . . . . . . . . . . . . . . . . . . . . . . . . . . . . 138
Viewing Information About Subscriber Sessions by Session ID (SRC CLI) . . 139
Viewing Information About Subscriber Sessions by Accounting User Identifier
(SRC CLI) . . . . . . . . . . . . . . . . . . . . . . . . . . . . . . . . . . . . . . . . . . . . . . . . . 140
Viewing the Number of Active Service Sessions (SRC CLI) . . . . . . . . . . . . . . 141
Viewing Subscriber Session Count Used by a Managed Router (SRC
CLI) . . . . . . . . . . . . . . . . . . . . . . . . . . . . . . . . . . . . . . . . . . . . . . . . . . . . . . 142
Copyright © 2014, Juniper Networks, Inc.viii
SRC 4.7.x Monitoring and Troubleshooting Guide
Viewing SAE SNMP Information with the CLI . . . . . . . . . . . . . . . . . . . . . . . . . . . . 142
Viewing Statistics About the Directory (SRC CLI) . . . . . . . . . . . . . . . . . . . . . 143
Viewing Statistics for Directory Connections (SRC CLI) . . . . . . . . . . . . . . . . 143
Viewing SNMP Information for Client Licenses (SRC CLI) . . . . . . . . . . . . . . 145
Viewing SNMP Information for Local Licenses (SRC CLI) . . . . . . . . . . . . . . . 145
Viewing SNMP Information for Licenses on Virtual Routers (SRC CLI) . . . . . 145
Viewing SNMP Information for Policies (SRC CLI) . . . . . . . . . . . . . . . . . . . . 146
Viewing SNMP Information for the SAE Server Process (SRC CLI) . . . . . . . . 146
Viewing Statistics for RADIUS Clients (SRC CLI) . . . . . . . . . . . . . . . . . . . . . . 147
Viewing SNMP Information for RADIUS Clients (SRC CLI) . . . . . . . . . . . . . . 147
Viewing SNMP Information for Routers and Devices (SRC CLI) . . . . . . . . . . 148
Viewing Statistics for Device Drivers (SRC CLI) . . . . . . . . . . . . . . . . . . . . . . . 148
Viewing Statistics for Specific Device Drivers (SRC CLI) . . . . . . . . . . . . . . . . 149
Viewing Statistics for Subscriber and Service Sessions (SRC CLI) . . . . . . . . 150
Monitoring Statistics for Subscriber and Service Sessions (SRC CLI) . . . . . . 151
Chapter 16 Monitoring SAE Data (C-Web Interface) . . . . . . . . . . . . . . . . . . . . . . . . . . . . . 153
Viewing SAE Data (C-Web Interface) . . . . . . . . . . . . . . . . . . . . . . . . . . . . . . . . . . 153
Viewing Information About the Directory Blacklist (C-Web Interface) . . . . . 153
Viewing Information About Services (C-Web Interface) . . . . . . . . . . . . . . . . 154
Viewing Information About Licenses (C-Web Interface) . . . . . . . . . . . . . . . . 155
Viewing Information About Policies (C-Web Interface) . . . . . . . . . . . . . . . . . 155
Viewing Information About Device Drivers (C-Web Interface) . . . . . . . . . . . 156
Viewing Information About Interfaces (C-Web Interface) . . . . . . . . . . . . . . . 157
Viewing Equipment Registrations (C-Web Interface) . . . . . . . . . . . . . . . . . . 158
Viewing Login Registrations (C-Web Interface) . . . . . . . . . . . . . . . . . . . . . . . 159
Viewing Information About Threads (C-Web Interface) . . . . . . . . . . . . . . . . 160
Viewing Information About Subscriber Sessions (C-Web Interface) . . . . . . . . . . 161
Information about Subscriber Sessions . . . . . . . . . . . . . . . . . . . . . . . . . . . . . 161
Viewing Information About Subscriber Sessions by DN (C-Web
Interface) . . . . . . . . . . . . . . . . . . . . . . . . . . . . . . . . . . . . . . . . . . . . . . . . . 162
Viewing Information About Subscriber Sessions by IP Address (C-Web
Interface) . . . . . . . . . . . . . . . . . . . . . . . . . . . . . . . . . . . . . . . . . . . . . . . . . 163
Viewing Information About Subscriber Sessions by Login Name (C-Web
Interface) . . . . . . . . . . . . . . . . . . . . . . . . . . . . . . . . . . . . . . . . . . . . . . . . . 164
Viewing Information About Subscriber Sessions by Service Name (C-Web
Interface) . . . . . . . . . . . . . . . . . . . . . . . . . . . . . . . . . . . . . . . . . . . . . . . . . 165
Viewing Information About Subscriber Sessions by Session ID (C-Web
Interface) . . . . . . . . . . . . . . . . . . . . . . . . . . . . . . . . . . . . . . . . . . . . . . . . . 166
Viewing SNMP Information (C-Web Interface) . . . . . . . . . . . . . . . . . . . . . . . . . . . 167
Viewing SNMP Statistics for the Directory (C-Web Interface) . . . . . . . . . . . . 167
Viewing SNMP Statistics for Directory Connections (C-Web Interface) . . . . 168
Viewing SNMP Statistics for Client Licenses (C-Web Interface) . . . . . . . . . 169
Viewing SNMP Statistics for Licenses by Device (C-Web Interface) . . . . . . . 170
Viewing SNMP Statistics for Local Licenses (C-Web Interface) . . . . . . . . . . . 171
Viewing SNMP Statistics About Policies (C-Web Interface) . . . . . . . . . . . . . 172
Viewing SNMP Statistics About Server Processes (C-Web Interface) . . . . . 173
Viewing SNMP Statistics About RADIUS (C-Web Interface) . . . . . . . . . . . . . 174
Viewing SNMP Statistics About RADIUS Clients (C-Web Interface) . . . . . . . 174
ixCopyright © 2014, Juniper Networks, Inc.
Table of Contents
Viewing SNMP Statistics for Devices (C-Web Interface) . . . . . . . . . . . . . . . . 175
Viewing SNMP Statistics for Specific Devices (C-Web Interface) . . . . . . . . . 176
Viewing SNMP Statistics for Subscriber Sessions and Service Sessions
(C-Web Interface) . . . . . . . . . . . . . . . . . . . . . . . . . . . . . . . . . . . . . . . . . . . 177
Chapter 17 Monitoring and Troubleshooting the NIC (SRC CLI) . . . . . . . . . . . . . . . . . . . 179
SRC CLI Commands to View Statistics About NIC Operations . . . . . . . . . . . . . . . 179
Viewing Statistics for the NIC Process (SRC CLI) . . . . . . . . . . . . . . . . . . . . . . . . . 180
Viewing Statistics for a NIC Host (SRC CLI) . . . . . . . . . . . . . . . . . . . . . . . . . . . . . . 181
Viewing Statistics for NIC Resolvers (SRC CLI) . . . . . . . . . . . . . . . . . . . . . . . . . . . 181
Viewing Statistics for NIC Agents (SRC CLI) . . . . . . . . . . . . . . . . . . . . . . . . . . . . . 183
SRC CLI Commands to View NIC Resolution Data . . . . . . . . . . . . . . . . . . . . . . . . 184
Viewing Data for NIC Resolvers (SRC CLI) . . . . . . . . . . . . . . . . . . . . . . . . . . . . . . 184
Viewing Data for NIC Agents (SRC CLI) . . . . . . . . . . . . . . . . . . . . . . . . . . . . . . . . . 186
Troubleshooting NIC Data Resolution (SRC CLI) . . . . . . . . . . . . . . . . . . . . . . . . . . 187
Chapter 18 Monitoring the NIC (C-Web Interface) . . . . . . . . . . . . . . . . . . . . . . . . . . . . . . 189
Viewing Hosts (C-Web Interface) . . . . . . . . . . . . . . . . . . . . . . . . . . . . . . . . . . . . . 189
Viewing Host Statistics (C-Web Interface) . . . . . . . . . . . . . . . . . . . . . . . . . . 189
Viewing Host Process Statistics (C-Web Interface) . . . . . . . . . . . . . . . . . . . 190
Viewing Resolvers (C-Web Interface) . . . . . . . . . . . . . . . . . . . . . . . . . . . . . . . . . . 190
Viewing Resolvers (C-Web Interface) . . . . . . . . . . . . . . . . . . . . . . . . . . . . . . 190
Viewing Resolver Statistics (C-Web Interface) . . . . . . . . . . . . . . . . . . . . . . . . 191
Viewing Agents (C-Web Interface) . . . . . . . . . . . . . . . . . . . . . . . . . . . . . . . . . . . . 192
Viewing Agents (C-Web Interface) . . . . . . . . . . . . . . . . . . . . . . . . . . . . . . . . . 192
Viewing Agent Statistics (C-Web Interface) . . . . . . . . . . . . . . . . . . . . . . . . . 193
Chapter 19 Monitoring NTP (SRC CLI) . . . . . . . . . . . . . . . . . . . . . . . . . . . . . . . . . . . . . . . . . 195
Viewing NTP Peers (SRC CLI) . . . . . . . . . . . . . . . . . . . . . . . . . . . . . . . . . . . . . . . . 195
Viewing Statistics for NTP (SRC CLI) . . . . . . . . . . . . . . . . . . . . . . . . . . . . . . . . . . 196
Viewing Internal Variables for NTP (SRC CLI) . . . . . . . . . . . . . . . . . . . . . . . . . . . . 196
Chapter 20 Monitoring NTP (C-Web Interface) . . . . . . . . . . . . . . . . . . . . . . . . . . . . . . . . . 199
Viewing NTP Peers (C-Web Interface) . . . . . . . . . . . . . . . . . . . . . . . . . . . . . . . . . 199
Viewing Statistics for NTP (C-Web Interface) . . . . . . . . . . . . . . . . . . . . . . . . . . . 200
Viewing NTP Status (C-Web Interface) . . . . . . . . . . . . . . . . . . . . . . . . . . . . . . . . 200
Chapter 21 Monitoring Redirect Server (SRC CLI) . . . . . . . . . . . . . . . . . . . . . . . . . . . . . . 203
Viewing Statistics for the Redirect Server (SRC CLI) . . . . . . . . . . . . . . . . . . . . . . 203
Viewing Statistics About Filtered Traffic (SRC CLI) . . . . . . . . . . . . . . . . . . . . . . . 203
Chapter 22 Monitoring the Redirect Server and Filtered Traffic (C-Web Interface) . . 205
Viewing Statistics for the Redirect Server (C-Web Interface) . . . . . . . . . . . . . . . 205
Viewing Information for Filtered Traffic (C-Web Interface) . . . . . . . . . . . . . . . . . 206
Chapter 23 Troubleshooting Network Connectivity (SRC CLI) . . . . . . . . . . . . . . . . . . . . 207
Commands to Troubleshoot Connections to Remote Hosts Overview . . . . . . . . 207
Testing Connectivity to Remote Hosts (SRC CLI) . . . . . . . . . . . . . . . . . . . . . . . . . 207
Viewing the Route Information (SRC CLI) . . . . . . . . . . . . . . . . . . . . . . . . . . . . . . 208
Viewing Routing Table Information (SRC CLI) . . . . . . . . . . . . . . . . . . . . . . . . . . . 209
Viewing Interface Information (SRC CLI) . . . . . . . . . . . . . . . . . . . . . . . . . . . . . . . 209
Copyright © 2014, Juniper Networks, Inc.x
SRC 4.7.x Monitoring and Troubleshooting Guide
Chapter 24 Monitoring Network Connectivity (C-Web Interface) . . . . . . . . . . . . . . . . . . 211
Viewing Information About the Routing Table (C-Web Interface) . . . . . . . . . . . . 211
Viewing Information About System Interfaces (C-Web Interface) . . . . . . . . . . . . 212
Chapter 25 Monitoring Activity for SRC Components . . . . . . . . . . . . . . . . . . . . . . . . . . . . 213
Monitoring Activity on C Series Controllers . . . . . . . . . . . . . . . . . . . . . . . . . . . . . . 213
Collecting Data with the Activity Monitor (SRC CLI) . . . . . . . . . . . . . . . . . . . . . . . 214
Collecting Data with the Activity Monitor (C-Web Interface) . . . . . . . . . . . . . . . . 216
Viewing Graphs (C-Web Interface) . . . . . . . . . . . . . . . . . . . . . . . . . . . . . . . . . . . . 216
Viewing Graphs from a Web Page . . . . . . . . . . . . . . . . . . . . . . . . . . . . . . . . . . . . . 216
Viewing Graphs for a Preset Time Period from a Web Page . . . . . . . . . . . . . . 217
Viewing Graphs for Specified Time Periods from a Web Page . . . . . . . . . . . 218
Part 6 Index
Index . . . . . . . . . . . . . . . . . . . . . . . . . . . . . . . . . . . . . . . . . . . . . . . . . . . . . . . . . . . . 223
xiCopyright © 2014, Juniper Networks, Inc.
Table of Contents

Copyright © 2014, Juniper Networks, Inc.xii
SRC 4.7.x Monitoring and Troubleshooting Guide
List of Tables
About the Documentation . . . . . . . . . . . . . . . . . . . . . . . . . . . . . . . . . . . . . . . . . . xv
Table 1: Notice Icons . . . . . . . . . . . . . . . . . . . . . . . . . . . . . . . . . . . . . . . . . . . . . . . . . xvi
Table 2: Text Conventions . . . . . . . . . . . . . . . . . . . . . . . . . . . . . . . . . . . . . . . . . . . . xvi
Part 2 Using Logging for the SRC Software and C Series Controllers
Chapter 2 Configuring Logging for SRC Components . . . . . . . . . . . . . . . . . . . . . . . . . . . . . 7
Table 3: SAE Categories and Severity Levels . . . . . . . . . . . . . . . . . . . . . . . . . . . . . . . 8
Table 4: Named Severity Levels . . . . . . . . . . . . . . . . . . . . . . . . . . . . . . . . . . . . . . . . 18
Table 5: Examples of Filters for Event Messages . . . . . . . . . . . . . . . . . . . . . . . . . . 20
Table 6: SAE Debug Device Filter Formatting Rules . . . . . . . . . . . . . . . . . . . . . . . . . 21
Table 7: Sample Combinations of Conditions for the device-filter-key
Expression . . . . . . . . . . . . . . . . . . . . . . . . . . . . . . . . . . . . . . . . . . . . . . . . . . . . . 22
Chapter 3 Configuring Logging for SRC Components with the CLI . . . . . . . . . . . . . . . . 25
Table 8: Logrotate Options . . . . . . . . . . . . . . . . . . . . . . . . . . . . . . . . . . . . . . . . . . . 32
Table 9: Options for Specifying How Log Files are Created . . . . . . . . . . . . . . . . . . 35
Part 4 Using SNMP for Monitoring and Troubleshooting
Chapter 8 Creating Custom SNMP Monitors . . . . . . . . . . . . . . . . . . . . . . . . . . . . . . . . . . . 59
Table 10: Example Table for juniSaeRouterTable Object . . . . . . . . . . . . . . . . . . . . 68
Chapter 11 Understanding Traps . . . . . . . . . . . . . . . . . . . . . . . . . . . . . . . . . . . . . . . . . . . . . . 85
Table 11: Symbols in Performance Traps Tables . . . . . . . . . . . . . . . . . . . . . . . . . . . 85
Table 12: Performance Traps–SAE . . . . . . . . . . . . . . . . . . . . . . . . . . . . . . . . . . . . . 88
Table 13: Performance Traps–Accounting . . . . . . . . . . . . . . . . . . . . . . . . . . . . . . . 90
Table 14: Performance Traps–Authentication . . . . . . . . . . . . . . . . . . . . . . . . . . . . 92
Table 15: Performance Traps–NIC . . . . . . . . . . . . . . . . . . . . . . . . . . . . . . . . . . . . . . 93
Table 16: Performance Traps–Router Drivers . . . . . . . . . . . . . . . . . . . . . . . . . . . . . 94
Table 17: Performance Traps–System Management Event . . . . . . . . . . . . . . . . . . 96
Table 18: Performance Traps–Policy Engine . . . . . . . . . . . . . . . . . . . . . . . . . . . . . . 96
Table 19: Performance Traps–SRC Redirector . . . . . . . . . . . . . . . . . . . . . . . . . . . . 97
Table 20: Performance Traps–SRC ACP . . . . . . . . . . . . . . . . . . . . . . . . . . . . . . . . . 97
Table 21: Performance Traps–JPS . . . . . . . . . . . . . . . . . . . . . . . . . . . . . . . . . . . . . . 98
Table 22: Performance Traps–Chassis . . . . . . . . . . . . . . . . . . . . . . . . . . . . . . . . . . 99
Table 23: Event Traps . . . . . . . . . . . . . . . . . . . . . . . . . . . . . . . . . . . . . . . . . . . . . . . . 99
Table 24: Alarm State Transitions . . . . . . . . . . . . . . . . . . . . . . . . . . . . . . . . . . . . . 102
xiiiCopyright © 2014, Juniper Networks, Inc.
Part 5 Monitoring the SRC Software and the C Series Controller withthe C-Web Interface and the SRC CLI
Chapter 12 Monitoring with the SRC CLI and the C-Web Interface . . . . . . . . . . . . . . . . . 107
Table 25: Comparison of SRC Monitoring Options . . . . . . . . . . . . . . . . . . . . . . . . 108
Chapter 13 Monitoring the System (SRC CLI) . . . . . . . . . . . . . . . . . . . . . . . . . . . . . . . . . . . 111
Table 26: Output Fields for show component . . . . . . . . . . . . . . . . . . . . . . . . . . . . 113
Chapter 17 Monitoring and Troubleshooting the NIC (SRC CLI) . . . . . . . . . . . . . . . . . . . 179
Table 27: Commands to Display NIC Statistics . . . . . . . . . . . . . . . . . . . . . . . . . . . 179
Table 28: Output Fields for show nic statistics process . . . . . . . . . . . . . . . . . . . . 180
Table 29: Output Fields for show nic statistics test . . . . . . . . . . . . . . . . . . . . . . . . 181
Table 30: Output Fields for show nic statistics resolver . . . . . . . . . . . . . . . . . . . . 182
Table 31: Output Fields for show nic statistics agent . . . . . . . . . . . . . . . . . . . . . . 183
Table 32: Commands to Display NIC DataTable 23: Commands to Display NIC
Data . . . . . . . . . . . . . . . . . . . . . . . . . . . . . . . . . . . . . . . . . . . . . . . . . . . . . . . . . 184
Table 33: Output Fields for show nic data resolver . . . . . . . . . . . . . . . . . . . . . . . . 185
Table 34: Output Fields for show nic data agent . . . . . . . . . . . . . . . . . . . . . . . . . . 187
Chapter 19 Monitoring NTP (SRC CLI) . . . . . . . . . . . . . . . . . . . . . . . . . . . . . . . . . . . . . . . . . 195
Table 35: Output Fields for show ntp associations command . . . . . . . . . . . . . . . 195
Copyright © 2014, Juniper Networks, Inc.xiv
SRC 4.7.x Monitoring and Troubleshooting Guide
About the Documentation
• SRC Documentation and Release Notes on page xv
• Audience on page xv
• Documentation Conventions on page xv
• Documentation Feedback on page xvii
• Requesting Technical Support on page xvii
SRCDocumentation and Release Notes
For a list of related SRC documentation, see http://www.juniper.net/techpubs/.
If the information in the latest SRC Release Notes differs from the information in the SRC
guides, follow the SRC Release Notes.
Audience
This documentation is intended for experienced system and network specialists working
with routers running Junos OS and JunosE software in an Internet access environment.
We assume that readers know how to use the routers, directories, and RADIUS servers
that they will deploy in their SRC networks. If you are using the SRC software in a cable
network environment, we assume that you are familiar with the PacketCable Multimedia
Specification (PCMM) as defined by Cable Television Laboratories, Inc. (CableLabs) and
with the Data-over-Cable Service Interface Specifications (DOCSIS) 1.1 protocol. We
also assume that you are familiar with operating a multiple service operator (MSO)
multimedia-managed IP network.
Documentation Conventions
Table 1 on page xvi defines the notice icons used in this guide. Table 2 on page xvi defines
text conventions used throughout this documentation.
xvCopyright © 2014, Juniper Networks, Inc.
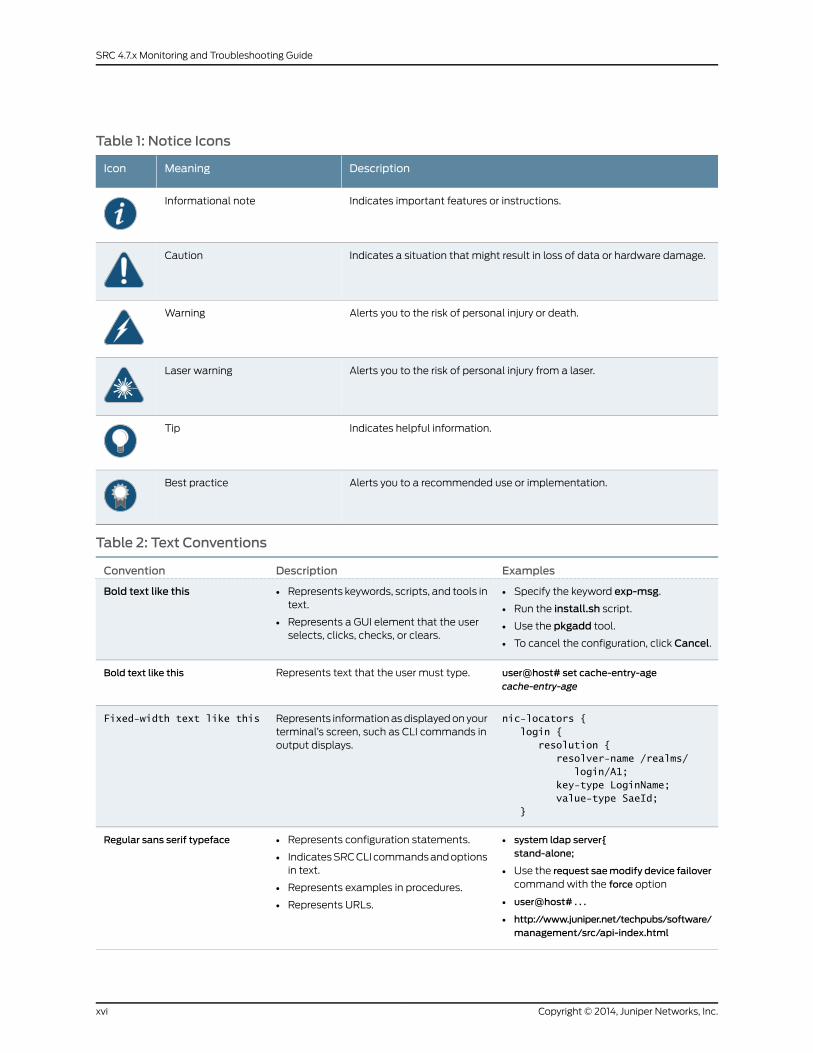
Table 1: Notice Icons
DescriptionMeaningIcon
Indicates important features or instructions.Informational note
Indicates a situation that might result in loss of data or hardware damage.Caution
Alerts you to the risk of personal injury or death.Warning
Alerts you to the risk of personal injury from a laser.Laser warning
Indicates helpful information.Tip
Alerts you to a recommended use or implementation.Best practice
Table 2: Text Conventions
ExamplesDescriptionConvention
• Specify the keyword exp-msg.
• Run the install.sh script.
• Use the pkgadd tool.
• To cancel the configuration, click Cancel.
• Represents keywords, scripts, and tools intext.
• Represents a GUI element that the userselects, clicks, checks, or clears.
Bold text like this
user@host# set cache-entry-agecache-entry-age
Represents text that the user must type.Bold text like this
nic-locators { login { resolution { resolver-name /realms/ login/A1; key-type LoginName; value-type SaeId; }
Represents information as displayed on yourterminal’s screen, such as CLI commands inoutput displays.
Fixed-width text like this
• system ldap server{stand-alone;
• Use the request saemodify device failovercommand with the force option
• user@host# . . .
• http://www.juniper.net/techpubs/software/management/src/api-index.html
• Represents configuration statements.
• Indicates SRC CLI commands and optionsin text.
• Represents examples in procedures.
• Represents URLs.
Regular sans serif typeface
Copyright © 2014, Juniper Networks, Inc.xvi
SRC 4.7.x Monitoring and Troubleshooting Guide
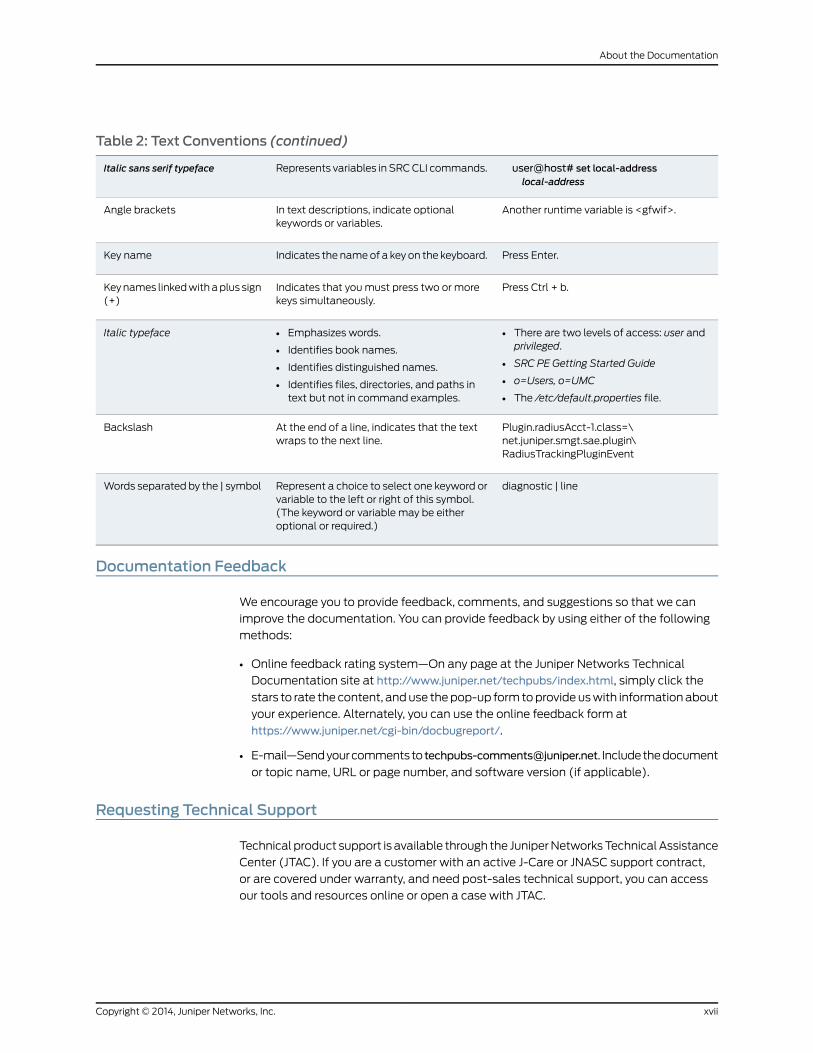
Table 2: Text Conventions (continued)
user@host# set local-addresslocal-address
Represents variables in SRC CLI commands.Italic sans serif typeface
Another runtime variable is <gfwif>.In text descriptions, indicate optionalkeywords or variables.
Angle brackets
Press Enter.Indicates the name of a key on the keyboard.Key name
Press Ctrl + b.Indicates that you must press two or morekeys simultaneously.
Key names linked with a plus sign(+)
• There are two levels of access: user andprivileged.
• SRC PE Getting Started Guide
• o=Users, o=UMC
• The /etc/default.properties file.
• Emphasizes words.
• Identifies book names.
• Identifies distinguished names.
• Identifies files, directories, and paths intext but not in command examples.
Italic typeface
Plugin.radiusAcct-1.class=\net.juniper.smgt.sae.plugin\RadiusTrackingPluginEvent
At the end of a line, indicates that the textwraps to the next line.
Backslash
diagnostic | lineRepresent a choice to select one keyword orvariable to the left or right of this symbol.(The keyword or variable may be eitheroptional or required.)
Words separated by the | symbol
Documentation Feedback
We encourage you to provide feedback, comments, and suggestions so that we can
improve the documentation. You can provide feedback by using either of the following
methods:
• Online feedback rating system—On any page at the Juniper Networks Technical
Documentation site at http://www.juniper.net/techpubs/index.html, simply click the
stars to rate the content, and use the pop-up form to provide us with information about
your experience. Alternately, you can use the online feedback form at
https://www.juniper.net/cgi-bin/docbugreport/.
• E-mail—Send your comments to [email protected]. Include the document
or topic name, URL or page number, and software version (if applicable).
Requesting Technical Support
Technical product support is available through the Juniper Networks Technical Assistance
Center (JTAC). If you are a customer with an active J-Care or JNASC support contract,
or are covered under warranty, and need post-sales technical support, you can access
our tools and resources online or open a case with JTAC.
xviiCopyright © 2014, Juniper Networks, Inc.
About the Documentation
• JTAC policies—For a complete understanding of our JTAC procedures and policies,
review the JTAC User Guide located at
http://www.juniper.net/us/en/local/pdf/resource-guides/7100059-en.pdf.
• Product warranties—For product warranty information, visit
http://www.juniper.net/support/warranty/.
• JTAC hours of operation—The JTAC centers have resources available 24 hours a day,
7 days a week, 365 days a year.
Self-Help Online Tools and Resources
For quick and easy problem resolution, Juniper Networks has designed an online
self-service portal called the Customer Support Center (CSC) that provides you with the
following features:
• Find CSC offerings: http://www.juniper.net/customers/support/
• Search for known bugs: http://www2.juniper.net/kb/
• Find product documentation: http://www.juniper.net/techpubs/
• Find solutions and answer questions using our Knowledge Base: http://kb.juniper.net/
• Download the latest versions of software and review release notes:
http://www.juniper.net/customers/csc/software/
• Search technical bulletins for relevant hardware and software notifications:
http://kb.juniper.net/InfoCenter/
• Join and participate in the Juniper Networks Community Forum:
http://www.juniper.net/company/communities/
• Open a case online in the CSC Case Management tool: http://www.juniper.net/cm/
To verify service entitlement by product serial number, use our Serial Number Entitlement
(SNE) Tool: https://tools.juniper.net/SerialNumberEntitlementSearch/
Opening a Casewith JTAC
You can open a case with JTAC on the Web or by telephone.
• Use the Case Management tool in the CSC at http://www.juniper.net/cm/.
• Call 1-888-314-JTAC (1-888-314-5822 toll-free in the USA, Canada, and Mexico).
For international or direct-dial options in countries without toll-free numbers, see
http://www.juniper.net/support/requesting-support.html.
Copyright © 2014, Juniper Networks, Inc.xviii
SRC 4.7.x Monitoring and Troubleshooting Guide
PART 1
Monitoring and Troubleshooting the SRCSoftware and C Series Controllers
• Overview of Monitoring and Troubleshooting Tools on page 3
1Copyright © 2014, Juniper Networks, Inc.

Copyright © 2014, Juniper Networks, Inc.2
SRC 4.7.x Monitoring and Troubleshooting Guide
CHAPTER 1
Overview of Monitoring andTroubleshooting Tools
• Monitoring and Troubleshooting Tools Overview on page 3
Monitoring and Troubleshooting Tools Overview
The SRC software provides the following tools to help you monitor and troubleshoot
your SRC environment:
• Logging support for SRC components
• System log server on C Series Controllers
• NIC test commands to troubleshoot NIC configuration
• Router simulation to facilitate application testing
• Subscriber simulation to facilitate application testing
• SNMP agent to monitor SRC components as well as system performance. The agent
can send data to SNMP network management systems.
• SNMP trap notification to SNMP management systems
• SRC CLI to monitor specified SRC components and C Series Controllers
• C-Web interface to monitor specified SRC components and C Series Controllers
The SRC software also includes various sample and test clients for the dynamic service
activator, the SAE remote interface, and the SAE plug-in interface.
RelatedDocumentation
• Logging for SRC Components Overview on page 7
• Monitoring with the SRC CLI and the C-Web Interface on page 107
• SRC Monitoring Options on page 107
• SNMP Traps Overview on page 79
3Copyright © 2014, Juniper Networks, Inc.

Copyright © 2014, Juniper Networks, Inc.4
SRC 4.7.x Monitoring and Troubleshooting Guide
PART 2
Using Logging for the SRC Software andC Series Controllers
• Configuring Logging for SRC Components on page 7
• Configuring Logging for SRC Components with the CLI on page 25
• Configuring Logging for SRC Components (C-Web Interface) on page 39
5Copyright © 2014, Juniper Networks, Inc.

Copyright © 2014, Juniper Networks, Inc.6
SRC 4.7.x Monitoring and Troubleshooting Guide
CHAPTER 2
Configuring Logging for SRCComponents
• Logging for SRC Components Overview on page 7
• Categories and Severity Levels for Event Messages on page 7
• Rotating Log Files on page 22
Logging for SRC Components Overview
SRC components and applications generate event messages that you can save in
logs—either by writing the messages to text files or by using the system log facilities. You
can use these logs to monitor the SRC components and troubleshoot problems.
Each SRC component has its own logging configuration. For example, the license server,
the NIC, the SAE, and SNMP each have logging configuration. The C Series Controller
includes a system log server that you can configure to manage messages generated on
that platform. You can use the CLI and the C-Web interface to configure logging on a C
Series Controller and to configure the system log server on a C Series Controller.
When you enable logging to a file, by default SRC components and applications write
log files to the /opt/UMC/<component-directory>/var/log folder for a component, such
as /opt/UMC/sae/var/log.
All log files with the file extension .log in a var/log directory are “Rotating Log Files” on
page 22.
RelatedDocumentation
C Series Controller Log Server Overview•
• The system log Protocol—draft-ietf-syslog-protocol-16.txt (July 2006 expiration)
• Configuring the SRC SNMP Agent (SRC CLI)
• Configuration Statements for SRC Component Logging on page 25
• Categories and Severity Levels for Event Messages on page 7
Categories and Severity Levels for Event Messages
In the logging configuration, you can specify a filter for each type of log. This filter can
include an expression that defines the categories and severity levels of event messages
7Copyright © 2014, Juniper Networks, Inc.
that the software saves. You can also enable network device-specific filtering for service
activation engine (SAE) debug logs.
Defining Categories
The category of an event message defines the SRC component that generated the event
message. If you want to view only event logs in a specific category, you can define a
variable <category>, which is a text string that matches the name of a category. This
variable is not case sensitive. To view the names of categories for event messages, view
a log file for one of the default filters.
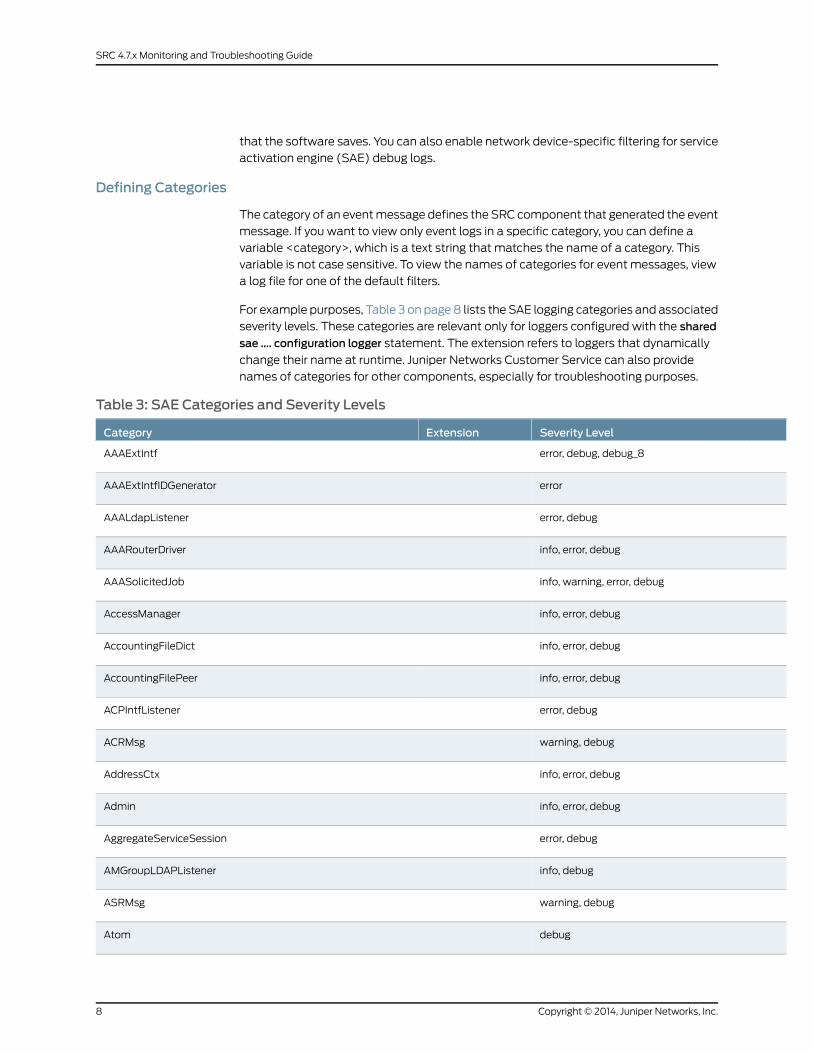
For example purposes, Table 3 on page 8 lists the SAE logging categories and associated
severity levels. These categories are relevant only for loggers configured with the shared
sae …. configuration logger statement. The extension refers to loggers that dynamically
change their name at runtime. Juniper Networks Customer Service can also provide
names of categories for other components, especially for troubleshooting purposes.
Table 3: SAE Categories and Severity Levels
Severity LevelExtensionCategory
error, debug, debug_8AAAExtIntf
errorAAAExtIntfIDGenerator
error, debugAAALdapListener
info, error, debugAAARouterDriver
info, warning, error, debugAAASolicitedJob
info, error, debugAccessManager
info, error, debugAccountingFileDict
info, error, debugAccountingFilePeer
error, debugACPIntfListener
warning, debugACRMsg
info, error, debugAddressCtx
info, error, debugAdmin
error, debugAggregateServiceSession
info, debugAMGroupLDAPListener
warning, debugASRMsg
debugAtom
Copyright © 2014, Juniper Networks, Inc.8
SRC 4.7.x Monitoring and Troubleshooting Guide
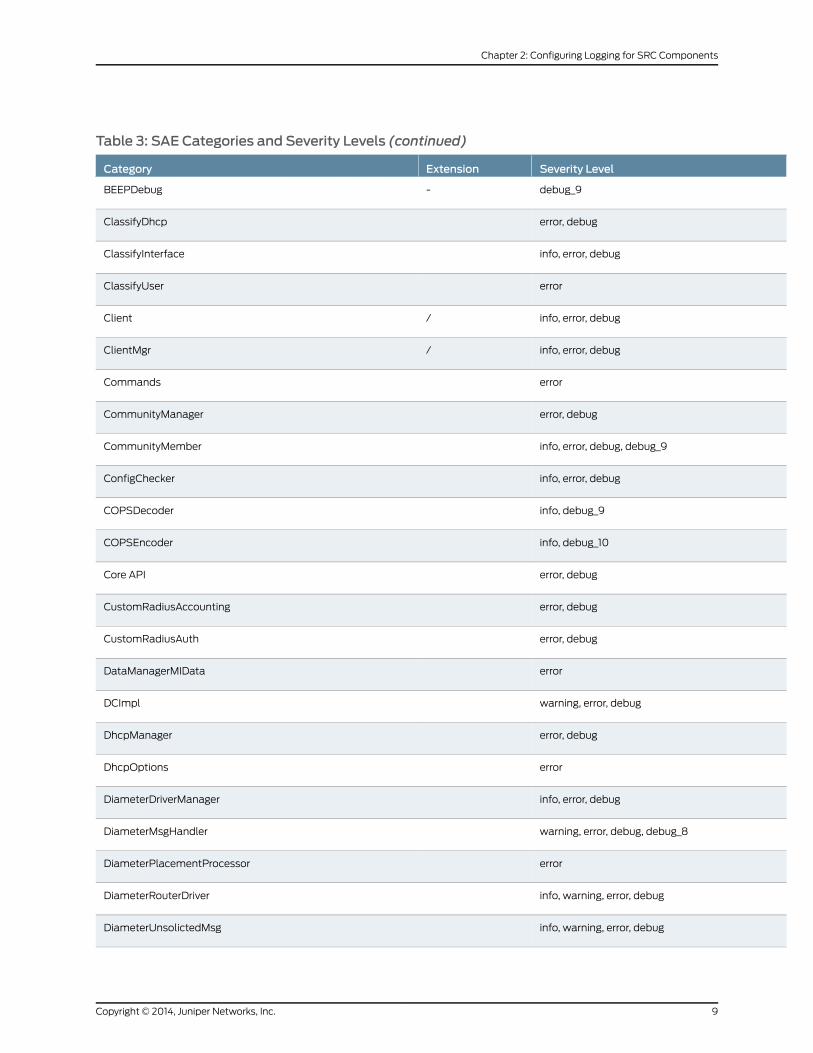
Table 3: SAE Categories and Severity Levels (continued)
Severity LevelExtensionCategory
debug_9-BEEPDebug
error, debugClassifyDhcp
info, error, debugClassifyInterface
errorClassifyUser
info, error, debug/Client
info, error, debug/ClientMgr
errorCommands
error, debugCommunityManager
info, error, debug, debug_9CommunityMember
info, error, debugConfigChecker
info, debug_9COPSDecoder
info, debug_10COPSEncoder
error, debugCore API
error, debugCustomRadiusAccounting
error, debugCustomRadiusAuth
errorDataManagerMIData
warning, error, debugDCImpl
error, debugDhcpManager
errorDhcpOptions
info, error, debugDiameterDriverManager
warning, error, debug, debug_8DiameterMsgHandler
errorDiameterPlacementProcessor
info, warning, error, debugDiameterRouterDriver
info, warning, error, debugDiameterUnsolictedMsg
9Copyright © 2014, Juniper Networks, Inc.
Chapter 2: Configuring Logging for SRC Components
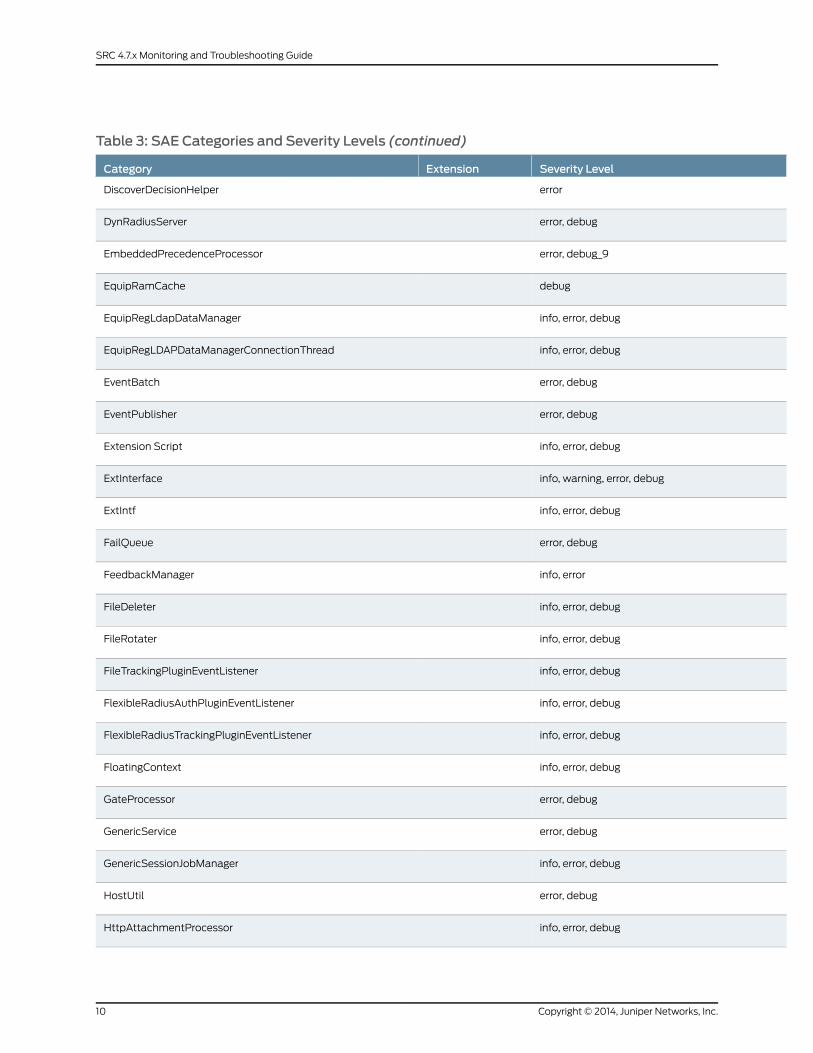
Table 3: SAE Categories and Severity Levels (continued)
Severity LevelExtensionCategory
errorDiscoverDecisionHelper
error, debugDynRadiusServer
error, debug_9EmbeddedPrecedenceProcessor
debugEquipRamCache
info, error, debugEquipRegLdapDataManager
info, error, debugEquipRegLDAPDataManagerConnectionThread
error, debugEventBatch
error, debugEventPublisher
info, error, debugExtension Script
info, warning, error, debugExtInterface
info, error, debugExtIntf
error, debugFailQueue
info, errorFeedbackManager
info, error, debugFileDeleter
info, error, debugFileRotater
info, error, debugFileTrackingPluginEventListener
info, error, debugFlexibleRadiusAuthPluginEventListener
info, error, debugFlexibleRadiusTrackingPluginEventListener
info, error, debugFloatingContext
error, debugGateProcessor
error, debugGenericService
info, error, debugGenericSessionJobManager
error, debugHostUtil
info, error, debugHttpAttachmentProcessor
Copyright © 2014, Juniper Networks, Inc.10
SRC 4.7.x Monitoring and Troubleshooting Guide
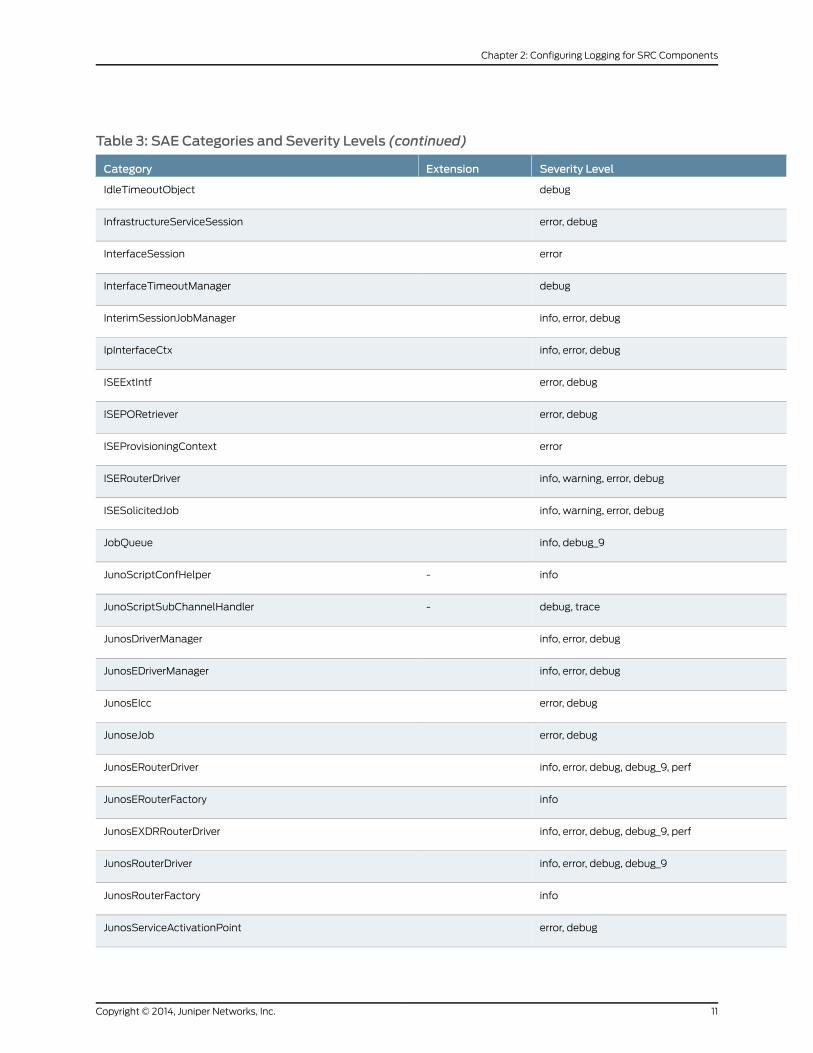
Table 3: SAE Categories and Severity Levels (continued)
Severity LevelExtensionCategory
debugIdleTimeoutObject
error, debugInfrastructureServiceSession
errorInterfaceSession
debugInterfaceTimeoutManager
info, error, debugInterimSessionJobManager
info, error, debugIpInterfaceCtx
error, debugISEExtIntf
error, debugISEPORetriever
errorISEProvisioningContext
info, warning, error, debugISERouterDriver
info, warning, error, debugISESolicitedJob
info, debug_9JobQueue
info-JunoScriptConfHelper
debug, trace-JunoScriptSubChannelHandler
info, error, debugJunosDriverManager
info, error, debugJunosEDriverManager
error, debugJunosEIcc
error, debugJunoseJob
info, error, debug, debug_9, perfJunosERouterDriver
infoJunosERouterFactory
info, error, debug, debug_9, perfJunosEXDRRouterDriver
info, error, debug, debug_9JunosRouterDriver
infoJunosRouterFactory
error, debugJunosServiceActivationPoint
11Copyright © 2014, Juniper Networks, Inc.
Chapter 2: Configuring Logging for SRC Components
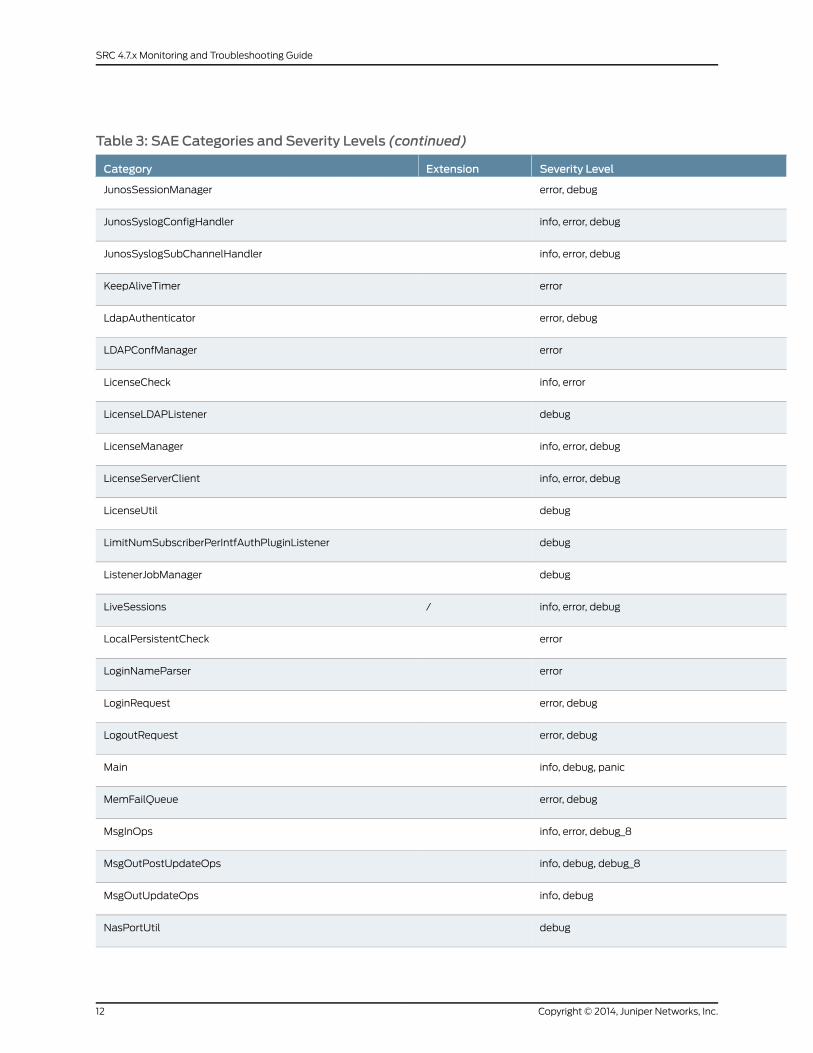
Table 3: SAE Categories and Severity Levels (continued)
Severity LevelExtensionCategory
error, debugJunosSessionManager
info, error, debugJunosSyslogConfigHandler
info, error, debugJunosSyslogSubChannelHandler
errorKeepAliveTimer
error, debugLdapAuthenticator
errorLDAPConfManager
info, errorLicenseCheck
debugLicenseLDAPListener
info, error, debugLicenseManager
info, error, debugLicenseServerClient
debugLicenseUtil
debugLimitNumSubscriberPerIntfAuthPluginListener
debugListenerJobManager
info, error, debug/LiveSessions
errorLocalPersistentCheck
errorLoginNameParser
error, debugLoginRequest
error, debugLogoutRequest
info, debug, panicMain
error, debugMemFailQueue
info, error, debug_8MsgInOps
info, debug, debug_8MsgOutPostUpdateOps
info, debugMsgOutUpdateOps
debugNasPortUtil
Copyright © 2014, Juniper Networks, Inc.12
SRC 4.7.x Monitoring and Troubleshooting Guide
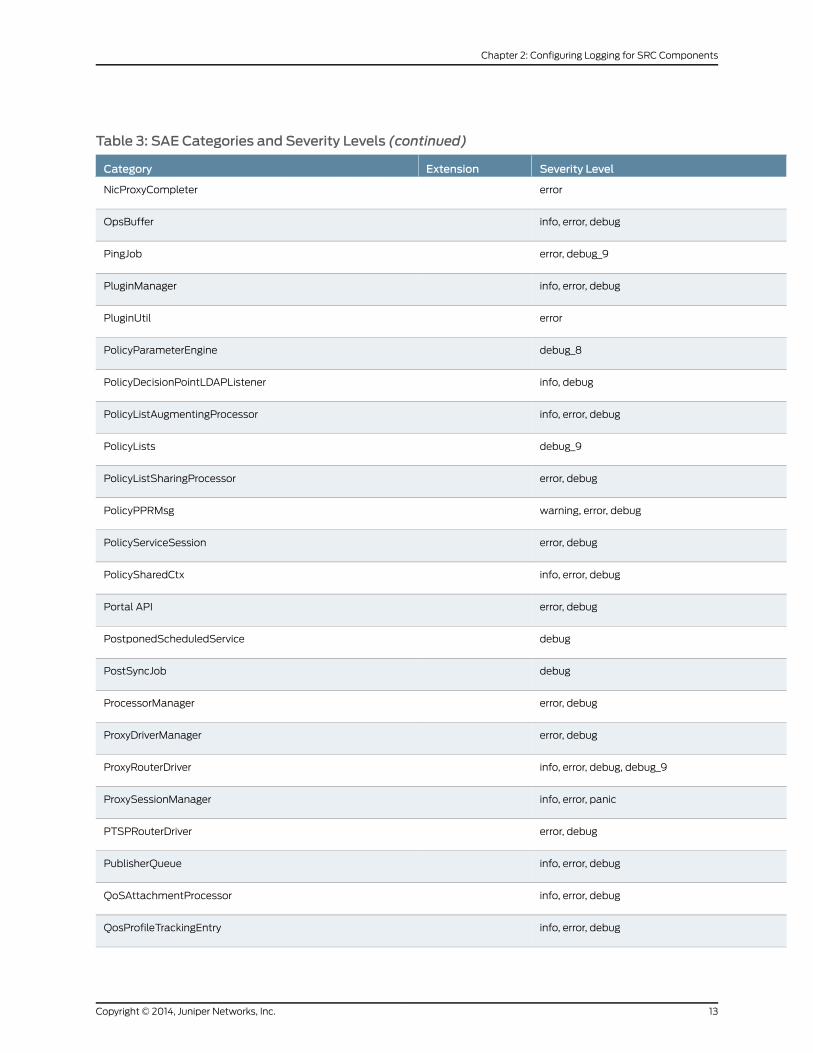
Table 3: SAE Categories and Severity Levels (continued)
Severity LevelExtensionCategory
errorNicProxyCompleter
info, error, debugOpsBuffer
error, debug_9PingJob
info, error, debugPluginManager
errorPluginUtil
debug_8PolicyParameterEngine
info, debugPolicyDecisionPointLDAPListener
info, error, debugPolicyListAugmentingProcessor
debug_9PolicyLists
error, debugPolicyListSharingProcessor
warning, error, debugPolicyPPRMsg
error, debugPolicyServiceSession
info, error, debugPolicySharedCtx
error, debugPortal API
debugPostponedScheduledService
debugPostSyncJob
error, debugProcessorManager
error, debugProxyDriverManager
info, error, debug, debug_9ProxyRouterDriver
info, error, panicProxySessionManager
error, debugPTSPRouterDriver
info, error, debugPublisherQueue
info, error, debugQoSAttachmentProcessor
info, error, debugQosProfileTrackingEntry
13Copyright © 2014, Juniper Networks, Inc.
Chapter 2: Configuring Logging for SRC Components
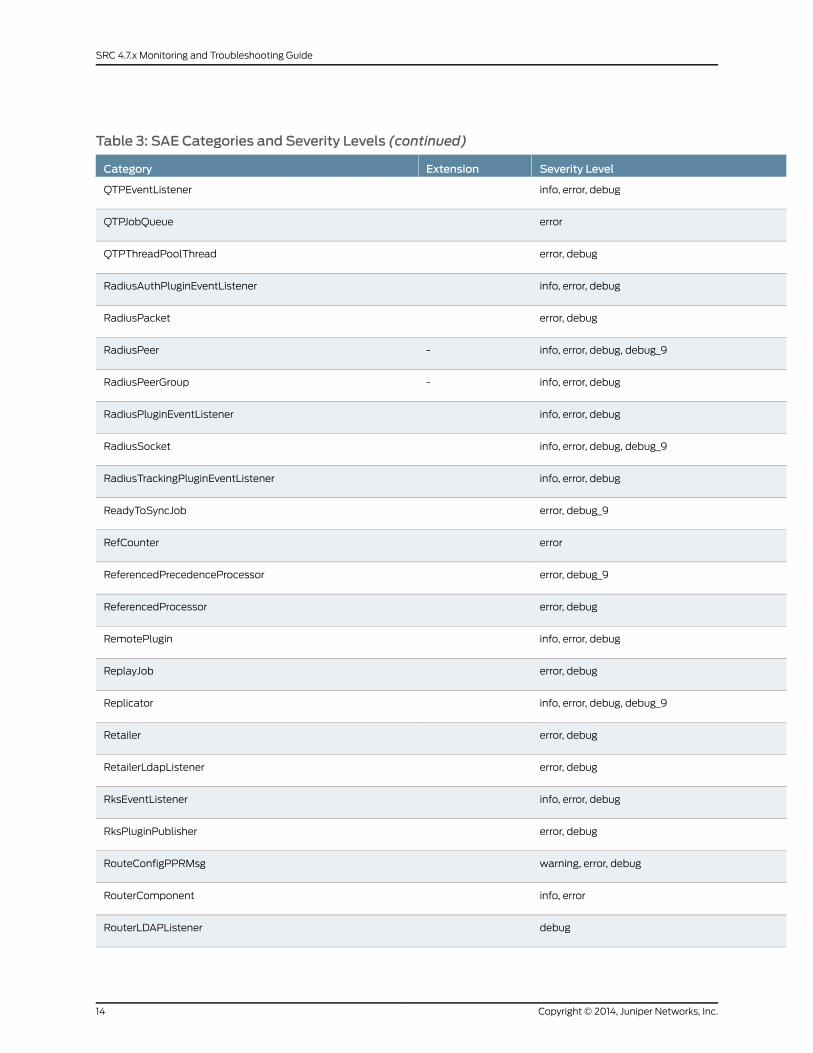
Table 3: SAE Categories and Severity Levels (continued)
Severity LevelExtensionCategory
info, error, debugQTPEventListener
errorQTPJobQueue
error, debugQTPThreadPoolThread
info, error, debugRadiusAuthPluginEventListener
error, debugRadiusPacket
info, error, debug, debug_9-RadiusPeer
info, error, debug-RadiusPeerGroup
info, error, debugRadiusPluginEventListener
info, error, debug, debug_9RadiusSocket
info, error, debugRadiusTrackingPluginEventListener
error, debug_9ReadyToSyncJob
errorRefCounter
error, debug_9ReferencedPrecedenceProcessor
error, debugReferencedProcessor
info, error, debugRemotePlugin
error, debugReplayJob
info, error, debug, debug_9Replicator
error, debugRetailer
error, debugRetailerLdapListener
info, error, debugRksEventListener
error, debugRksPluginPublisher
warning, error, debugRouteConfigPPRMsg
info, errorRouterComponent
debugRouterLDAPListener
Copyright © 2014, Juniper Networks, Inc.14
SRC 4.7.x Monitoring and Troubleshooting Guide
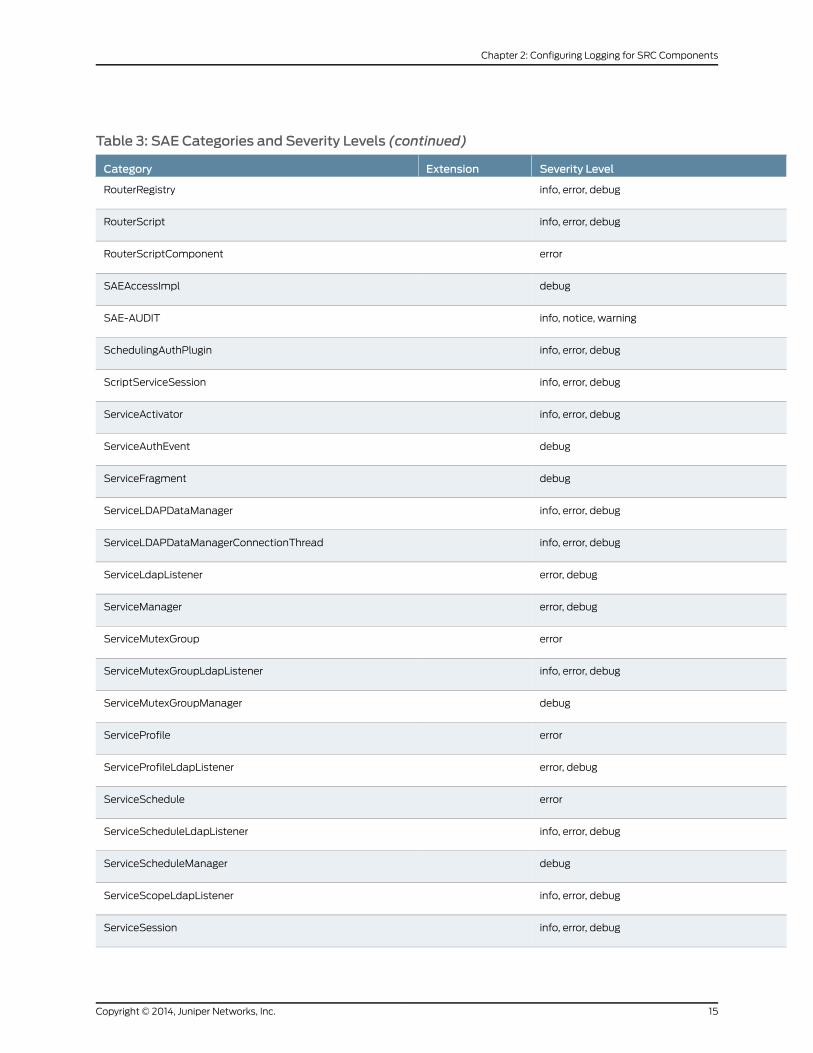
Table 3: SAE Categories and Severity Levels (continued)
Severity LevelExtensionCategory
info, error, debugRouterRegistry
info, error, debugRouterScript
errorRouterScriptComponent
debugSAEAccessImpl
info, notice, warningSAE-AUDIT
info, error, debugSchedulingAuthPlugin
info, error, debugScriptServiceSession
info, error, debugServiceActivator
debugServiceAuthEvent
debugServiceFragment
info, error, debugServiceLDAPDataManager
info, error, debugServiceLDAPDataManagerConnectionThread
error, debugServiceLdapListener
error, debugServiceManager
errorServiceMutexGroup
info, error, debugServiceMutexGroupLdapListener
debugServiceMutexGroupManager
errorServiceProfile
error, debugServiceProfileLdapListener
errorServiceSchedule
info, error, debugServiceScheduleLdapListener
debugServiceScheduleManager
info, error, debugServiceScopeLdapListener
info, error, debugServiceSession
15Copyright © 2014, Juniper Networks, Inc.
Chapter 2: Configuring Logging for SRC Components
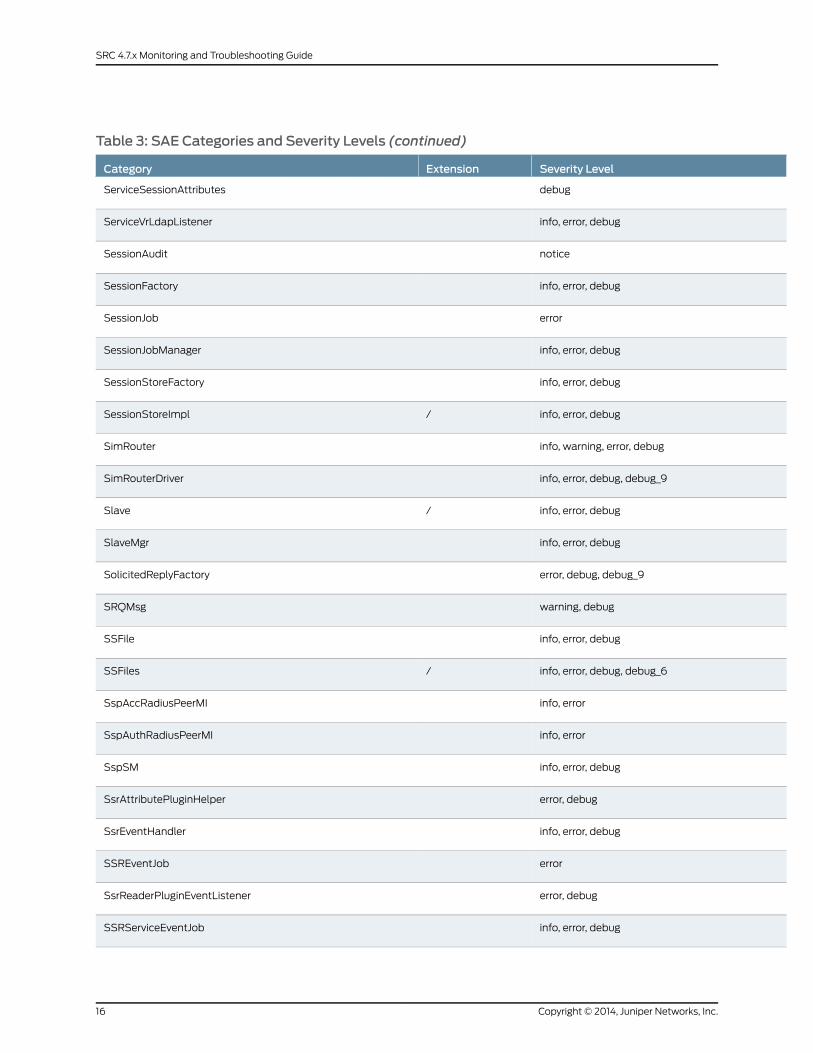
Table 3: SAE Categories and Severity Levels (continued)
Severity LevelExtensionCategory
debugServiceSessionAttributes
info, error, debugServiceVrLdapListener
noticeSessionAudit
info, error, debugSessionFactory
errorSessionJob
info, error, debugSessionJobManager
info, error, debugSessionStoreFactory
info, error, debug/SessionStoreImpl
info, warning, error, debugSimRouter
info, error, debug, debug_9SimRouterDriver
info, error, debug/Slave
info, error, debugSlaveMgr
error, debug, debug_9SolicitedReplyFactory
warning, debugSRQMsg
info, error, debugSSFile
info, error, debug, debug_6/SSFiles
info, errorSspAccRadiusPeerMI
info, errorSspAuthRadiusPeerMI
info, error, debugSspSM
error, debugSsrAttributePluginHelper
info, error, debugSsrEventHandler
errorSSREventJob
error, debugSsrReaderPluginEventListener
info, error, debugSSRServiceEventJob
Copyright © 2014, Juniper Networks, Inc.16
SRC 4.7.x Monitoring and Troubleshooting Guide
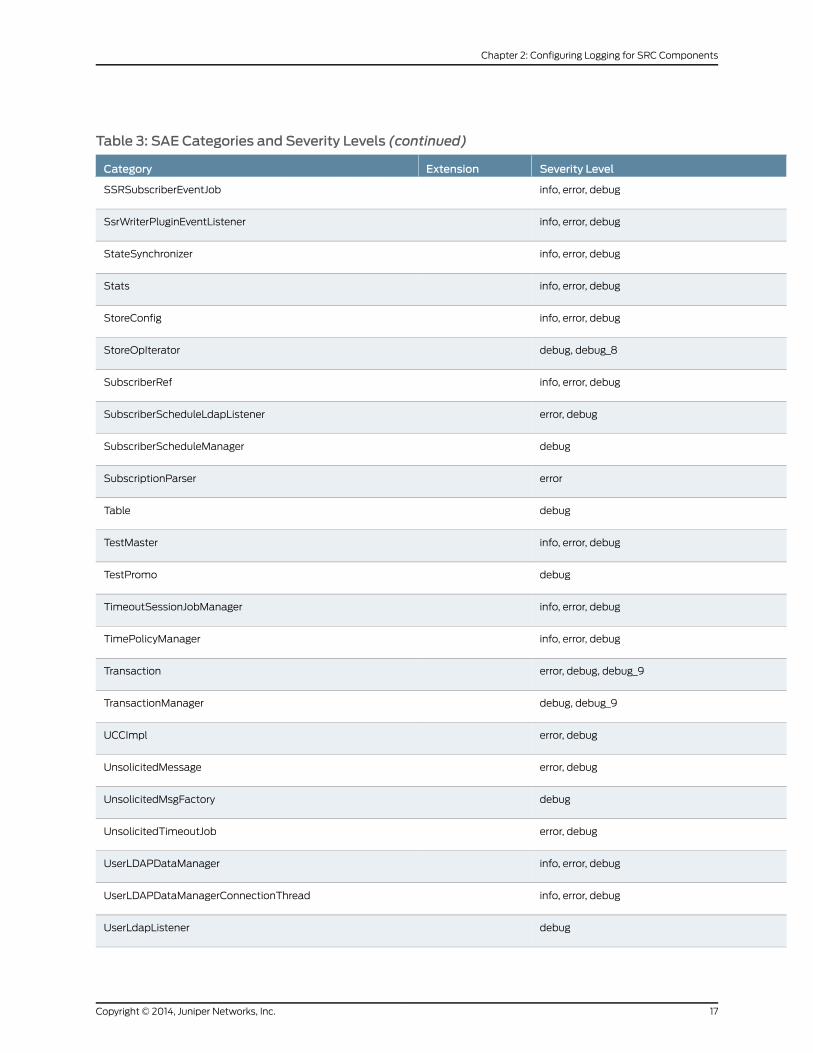
Table 3: SAE Categories and Severity Levels (continued)
Severity LevelExtensionCategory
info, error, debugSSRSubscriberEventJob
info, error, debugSsrWriterPluginEventListener
info, error, debugStateSynchronizer
info, error, debugStats
info, error, debugStoreConfig
debug, debug_8StoreOpIterator
info, error, debugSubscriberRef
error, debugSubscriberScheduleLdapListener
debugSubscriberScheduleManager
errorSubscriptionParser
debugTable
info, error, debugTestMaster
debugTestPromo
info, error, debugTimeoutSessionJobManager
info, error, debugTimePolicyManager
error, debug, debug_9Transaction
debug, debug_9TransactionManager
error, debugUCCImpl
error, debugUnsolicitedMessage
debugUnsolicitedMsgFactory
error, debugUnsolicitedTimeoutJob
info, error, debugUserLDAPDataManager
info, error, debugUserLDAPDataManagerConnectionThread
debugUserLdapListener
17Copyright © 2014, Juniper Networks, Inc.
Chapter 2: Configuring Logging for SRC Components
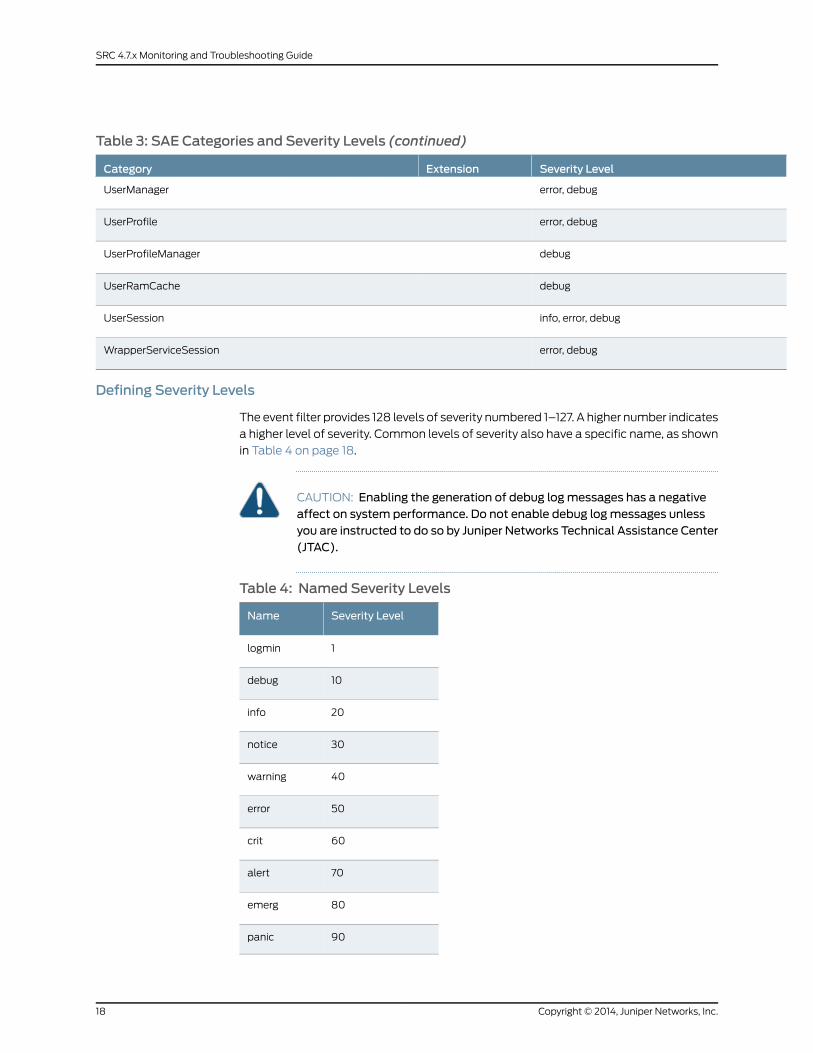
Table 3: SAE Categories and Severity Levels (continued)
Severity LevelExtensionCategory
error, debugUserManager
error, debugUserProfile
debugUserProfileManager
debugUserRamCache
info, error, debugUserSession
error, debugWrapperServiceSession
Defining Severity Levels
The event filter provides 128 levels of severity numbered 1–127. A higher number indicates
a higher level of severity. Common levels of severity also have a specific name, as shown
in Table 4 on page 18.
CAUTION: Enabling the generation of debug logmessages has a negativeaffect on system performance. Do not enable debug logmessages unlessyou are instructed to do so by Juniper Networks Technical Assistance Center(JTAC).
Table 4: Named Severity Levels
Severity LevelName
1logmin
10debug
20info
30notice
40warning
50error
60crit
70alert
80emerg
90panic
Copyright © 2014, Juniper Networks, Inc.18
SRC 4.7.x Monitoring and Troubleshooting Guide
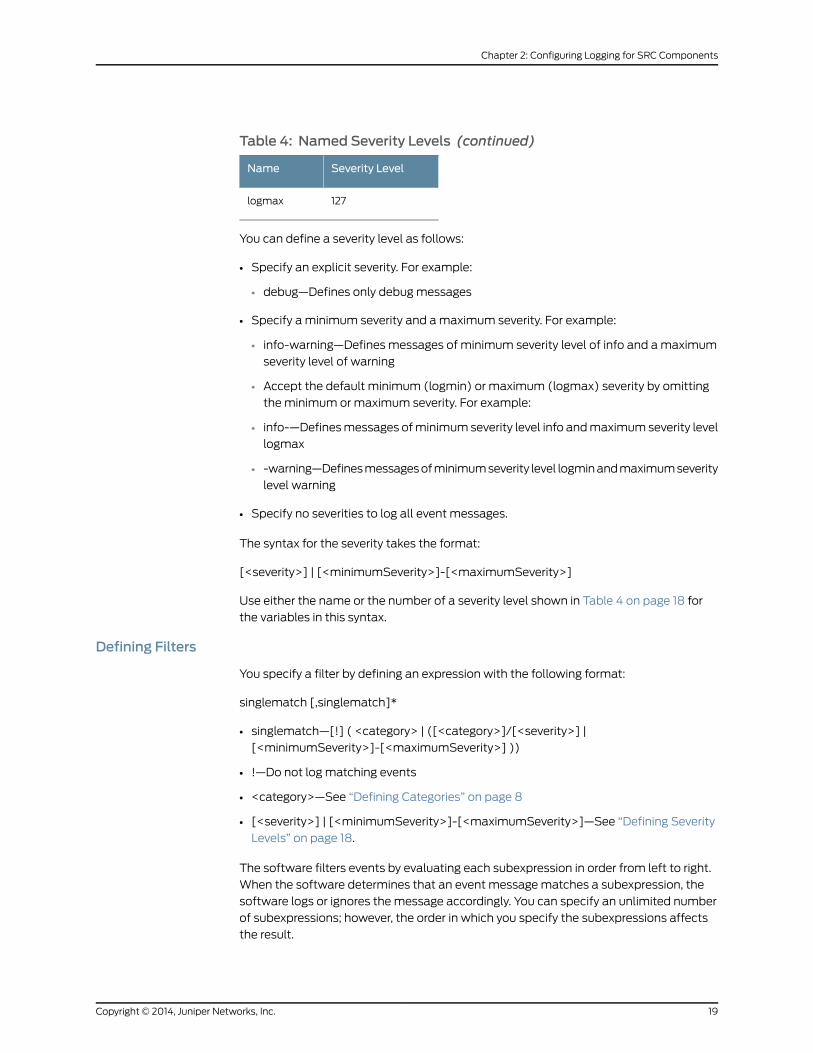
Table 4: Named Severity Levels (continued)
Severity LevelName
127logmax
You can define a severity level as follows:
• Specify an explicit severity. For example:
• debug—Defines only debug messages
• Specify a minimum severity and a maximum severity. For example:
• info-warning—Defines messages of minimum severity level of info and a maximum
severity level of warning
• Accept the default minimum (logmin) or maximum (logmax) severity by omitting
the minimum or maximum severity. For example:
• info-—Defines messages of minimum severity level info and maximum severity level
logmax
• -warning—Defines messages of minimum severity level logmin and maximum severity
level warning
• Specify no severities to log all event messages.
The syntax for the severity takes the format:
[<severity>] | [<minimumSeverity>]-[<maximumSeverity>]
Use either the name or the number of a severity level shown in Table 4 on page 18 for
the variables in this syntax.
Defining Filters
You specify a filter by defining an expression with the following format:
singlematch [,singlematch]*
• singlematch—[!] ( <category> | ([<category>]/[<severity>] |
[<minimumSeverity>]-[<maximumSeverity>] ))
• !—Do not log matching events
• <category>—See “Defining Categories” on page 8
• [<severity>] | [<minimumSeverity>]-[<maximumSeverity>]—See “Defining Severity
Levels” on page 18.
The software filters events by evaluating each subexpression in order from left to right.
When the software determines that an event message matches a subexpression, the
software logs or ignores the message accordingly. You can specify an unlimited number
of subexpressions; however, the order in which you specify the subexpressions affects
the result.
19Copyright © 2014, Juniper Networks, Inc.
Chapter 2: Configuring Logging for SRC Components
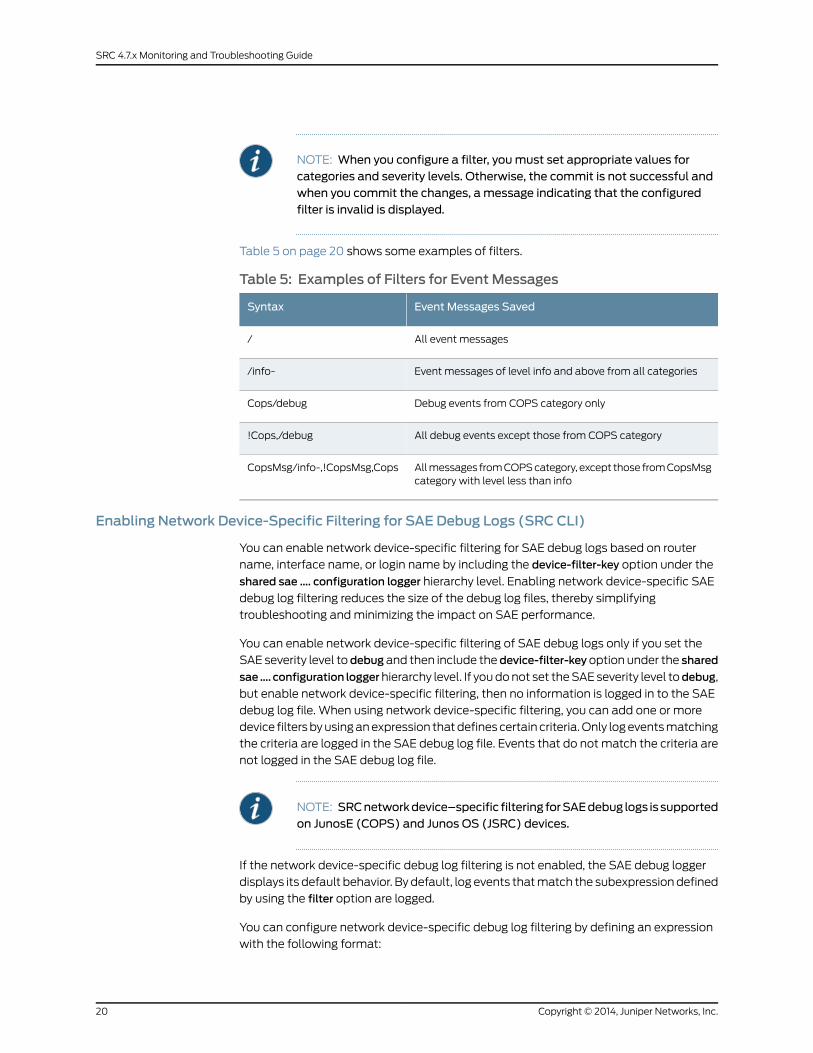
NOTE: When you configure a filter, youmust set appropriate values forcategories and severity levels. Otherwise, the commit is not successful andwhen you commit the changes, a message indicating that the configuredfilter is invalid is displayed.
Table 5 on page 20 shows some examples of filters.
Table 5: Examples of Filters for Event Messages
Event Messages SavedSyntax
All event messages/
Event messages of level info and above from all categories/info-
Debug events from COPS category onlyCops/debug
All debug events except those from COPS category!Cops,/debug
All messages from COPS category, except those from CopsMsgcategory with level less than info
CopsMsg/info-,!CopsMsg,Cops
Enabling Network Device-Specific Filtering for SAE Debug Logs (SRC CLI)
You can enable network device-specific filtering for SAE debug logs based on router
name, interface name, or login name by including the device-filter-key option under the
shared sae …. configuration logger hierarchy level. Enabling network device-specific SAE
debug log filtering reduces the size of the debug log files, thereby simplifying
troubleshooting and minimizing the impact on SAE performance.
You can enable network device-specific filtering of SAE debug logs only if you set the
SAE severity level todebug and then include thedevice-filter-keyoption under the shared
sae…. configuration loggerhierarchy level. If you do not set the SAE severity level todebug,
but enable network device-specific filtering, then no information is logged in to the SAE
debug log file. When using network device-specific filtering, you can add one or more
device filters by using an expression that defines certain criteria. Only log events matching
the criteria are logged in the SAE debug log file. Events that do not match the criteria are
not logged in the SAE debug log file.
NOTE: SRCnetworkdevice–specific filtering forSAEdebug logs issupportedon JunosE (COPS) and Junos OS (JSRC) devices.
If the network device-specific debug log filtering is not enabled, the SAE debug logger
displays its default behavior. By default, log events that match the subexpression defined
by using the filter option are logged.
You can configure network device-specific debug log filtering by defining an expression
with the following format:
Copyright © 2014, Juniper Networks, Inc.20
SRC 4.7.x Monitoring and Troubleshooting Guide
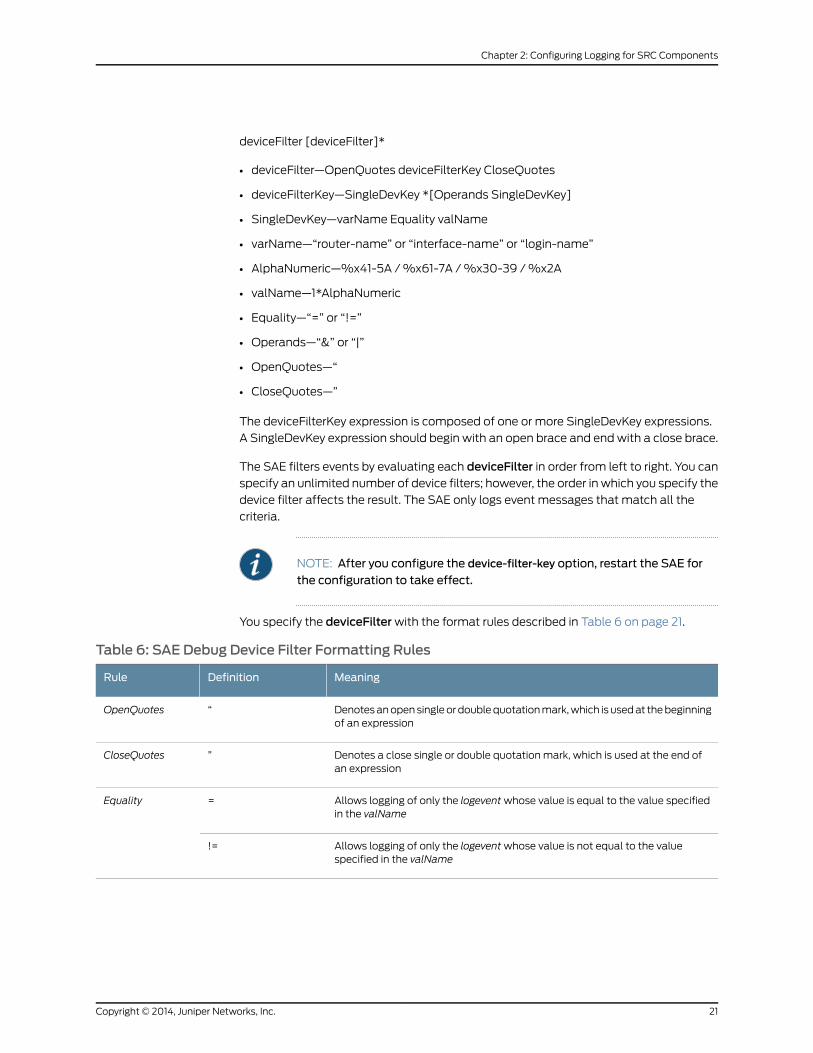
deviceFilter [deviceFilter]*
• deviceFilter—OpenQuotes deviceFilterKey CloseQuotes
• deviceFilterKey—SingleDevKey *[Operands SingleDevKey]
• SingleDevKey—varName Equality valName
• varName—“router-name” or “interface-name” or “login-name”
• AlphaNumeric—%x41-5A / %x61-7A / %x30-39 / %x2A
• valName—1*AlphaNumeric
• Equality—“=” or “!=”
• Operands—“&” or “|”
• OpenQuotes—“
• CloseQuotes—”
The deviceFilterKey expression is composed of one or more SingleDevKey expressions.
A SingleDevKey expression should begin with an open brace and end with a close brace.
The SAE filters events by evaluating each deviceFilter in order from left to right. You can
specify an unlimited number of device filters; however, the order in which you specify the
device filter affects the result. The SAE only logs event messages that match all the
criteria.
NOTE: After you configure the device-filter-key option, restart the SAE for
the configuration to take effect.
You specify the deviceFilter with the format rules described in Table 6 on page 21.
Table 6: SAE Debug Device Filter Formatting Rules
MeaningDefinitionRule
Denotes an open single or double quotation mark, which is used at the beginningof an expression
“OpenQuotes
Denotes a close single or double quotation mark, which is used at the end ofan expression
”CloseQuotes
Allows logging of only the logevent whose value is equal to the value specifiedin the valName
=Equality
Allows logging of only the logevent whose value is not equal to the valuespecified in the valName
!=
21Copyright © 2014, Juniper Networks, Inc.
Chapter 2: Configuring Logging for SRC Components
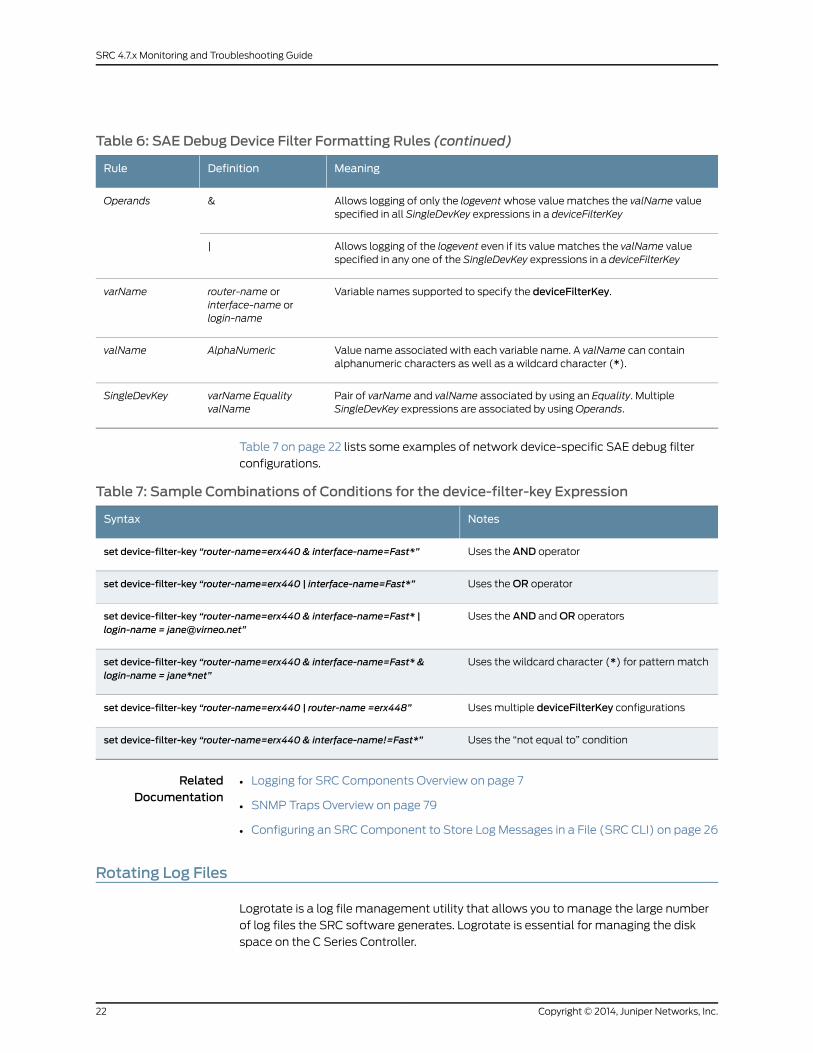
Table 6: SAE Debug Device Filter Formatting Rules (continued)
MeaningDefinitionRule
Allows logging of only the logevent whose value matches the valName valuespecified in all SingleDevKey expressions in a deviceFilterKey
&Operands
Allows logging of the logevent even if its value matches the valName valuespecified in any one of the SingleDevKey expressions in a deviceFilterKey
|
Variable names supported to specify the deviceFilterKey.router-name orinterface-name orlogin-name
varName
Value name associated with each variable name. A valName can containalphanumeric characters as well as a wildcard character (*).
AlphaNumericvalName
Pair of varName and valName associated by using an Equality. MultipleSingleDevKey expressions are associated by using Operands.
varName EqualityvalName
SingleDevKey
Table 7 on page 22 lists some examples of network device-specific SAE debug filter
configurations.
Table 7: Sample Combinations of Conditions for the device-filter-key Expression
NotesSyntax
Uses the AND operatorset device-filter-key “router-name=erx440 & interface-name=Fast*”
Uses the OR operatorset device-filter-key “router-name=erx440 | interface-name=Fast*”
Uses the AND and OR operatorsset device-filter-key “router-name=erx440 & interface-name=Fast* |login-name = [email protected]”
Uses the wildcard character (*) for pattern matchset device-filter-key “router-name=erx440 & interface-name=Fast* &login-name = jane*net”
Uses multiple deviceFilterKey configurationsset device-filter-key “router-name=erx440 | router-name =erx448”
Uses the “not equal to” conditionset device-filter-key “router-name=erx440 & interface-name!=Fast*”
RelatedDocumentation
Logging for SRC Components Overview on page 7•
• SNMP Traps Overview on page 79
• Configuring an SRC Component to Store Log Messages in a File (SRC CLI) on page 26
Rotating Log Files
Logrotate is a log file management utility that allows you to manage the large number
of log files the SRC software generates. Logrotate is essential for managing the disk
space on the C Series Controller.
Copyright © 2014, Juniper Networks, Inc.22
SRC 4.7.x Monitoring and Troubleshooting Guide

The following SRC components support the logrotate utility:
• Third-Generation Partnership Project (3GPP) gateway
• SRC Admission Control Plug-in (ACP)
• Activity Monitor
• SNMP agent
• Web application server
• Command-line interface (CLI)
• Diameter server
• Dynamic Service Activator
• IP Multimedia Subsystem (IMS)
• Juniper Policy Server (JPS)
• License server
• Monitoring Agent application
• Network information collector (NIC)
• Service activation engine (SAE)
• Subscriber information collector (SIC)
• Session State Registrar (SSR)
• C-Web interface
You can use logrotate to regularly rotate log files by removing the oldest log files from
your system and creating new log files. You can rotate files based on size. You can rotate
log files daily, weekly, or monthly. Logrotate can also be used to compress log files.
Logrotate usually runs automatically through the Cron utility.
When a new log file is opened to replace an older log file that contains content, a number
is appended to the name of the older file. For example, sae_debug.log.4 is an older log
file than sae_debug.log.1; whereas sae_debug.log is the active log file for SAE.
On C Series Controllers, the software compresses log files and appends the .gz suffix;
for example, sae_debug.log.4.gz. Log files are stored in the
/opt/UMC/component-name/var/log directory; for example, /opt/UMC/sae/var/log.
You can configure components to send log messages to the system log server on the
platform on which the SRC software is running.
If you plan to filter log messages, you should be familiar with severity levels and filters
for logging before you configure system logging for a component.
23Copyright © 2014, Juniper Networks, Inc.
Chapter 2: Configuring Logging for SRC Components
Configuration Overview
You can specify any number of log rotation configuration files on the command line.
Configuration options that you specify for a group of log files are considered local options
and they override global options of the same name.
Both global and local options can be set in the /etc/logrotate.conf file. You set global
options under the [edit system logrotate logrotate.conf] hierarchy level. You set local
options for specific logging configuration files such as the /var/log/wtmp file under the
[edit system logrotate logrotate.conf logfilesname]hierarchy level. You can also configure
log rotation for system and SRC components under the [edit system logrotate file-name
logfiles] hierarchy level.
RelatedDocumentation
• Logging for SRC Components Overview on page 7
• Configuring an SRC Component to Store Log Messages in a File (SRC CLI) on page 26
• Configuration Statements for the Logrotate Utility (SRC CLI) on page 30
• Configuring the Logrotate Utility (SRC CLI) on page 32
Copyright © 2014, Juniper Networks, Inc.24
SRC 4.7.x Monitoring and Troubleshooting Guide
CHAPTER 3
Configuring Logging for SRCComponentswith the CLI
• Configuration Statements for SRC Component Logging on page 25
• Configuring an SRC Component to Store Log Messages in a File (SRC CLI) on page 26
• Configuring System Logging (SRC CLI) on page 28
• Configuration Statements for the Logrotate Utility (SRC CLI) on page 30
• Configuring the Logrotate Utility (SRC CLI) on page 32
Configuration Statements for SRC Component Logging
Use the following configuration statements to configure logging for SRC components.
You access these statements from the hierarchy for a component, such as:
• [edit shared acp configuration]
• [edit shared sae configuration]
• [edit shared nic scenario scenario-name ]
• [edit snmp agent]
• [edit slot 0 jps]
logger name {file-logger {device-filter-key device-filter-key;filter filter ;filename filename ;rollover-filename rollover-filename ;maximum-file-sizemaximum-file-size ;
}syslog-logger {filter filter ;port port ;syslog-host syslog-host ;syslog-facility syslog-facility ;format format ;
}}
25Copyright © 2014, Juniper Networks, Inc.
NOTE: The device-filter-key option is available only on the SAE component.
For detailed information about each configuration statement, see SRC PE CLI Command
Reference.
RelatedDocumentation
Configuring System Logging (SRC CLI) on page 28•
• Configuring an SRC Component to Store Log Messages in a File (SRC CLI) on page 26
• Before You Configure Logging for SRC Components on page 39
• Logging for SRC Components Overview on page 7
• Categories and Severity Levels for Event Messages on page 7
Configuring an SRC Component to Store LogMessages in a File (SRC CLI)
Use the following statements to configure an SRC component to store log messages in
a file:
logger name file {device-filter-key device-filter-key;filter filter;filename filename;rollover-filename rollover-filename;maximum-file-sizemaximum-file-size;
}
If you plan to filter log messages, you should be familiar with severity levels and filters
for logging before you configure system logging for a component. See “Categories and
Severity Levels for Event Messages” on page 7.
To configure component logging to a file:
1. From configuration mode, access the configuration statement that configures the
logging destination for the component.
[edit]user@host# component-hierarchy logger name file
For example:
[edit]user@host# edit shared sae configuration logger sae-file-log-1 file
[edit]user@host# edit snmp agent logger snmp-file-log-1 file
[edit]user@host# edit slot 0 jps logger jps-file-log-1 file
2. Specify the filter to define which event messages the software logs or disregards.
Copyright © 2014, Juniper Networks, Inc.26
SRC 4.7.x Monitoring and Troubleshooting Guide
[edit shared sae configuration logger sae-file-log-1 file]user@host# set filter filter
If you do not specify a filter, logging to the specified file is disabled.
Filters can specify the logging level, such as debug, or can specify expressions.
NOTE: When you configure a filter, youmust set appropriate values forcategories and severity levels. Otherwise, the commit is not successfuland when you commit the changes, a message indicating that theconfigured filter is invalid is displayed.
3. (Optional) Enable network device-specific filtering for SAE debug logs based on router
name, interface name, or login name.
For more information about format rules used to define the expression while enabling
network device-specific filtering, see the table SAE Debug Device Filter FormattingRules in “Categories and Severity Levels for Event Messages” on page 7.
[edit shared sae configuration logger sae-file-log-1 file]user@host# set device-filter-key device-filter-key
NOTE:• SRC network device–specific filtering for SAE debug logs is supportedon JunosE (COPS) and Junos OS (JSRC) devices.
• The device-filter-key option is available only on the SAE component.
• You can enable network device-specific filtering of SAEdebug logs onlyif you set the SAE severity level to debug and then include the
device-filter-key option under the shared sae …. configuration logger
hierarchy level.
• After you configure the device-filter-key option, restart the SAE for the
configuration to take effect.
4. Specify the absolute path of the filename that contains the current log files.
[edit shared sae configuration logger sae-file-log-1 file]user@host# set filename filename
Make sure that the user under which the J2EE application server or Web application
server runs has write access to this folder. If this user does not have write access to
the default folder, configure the component or application to write logs in folders to
which the user has write access.
5. (Optional) Specify the absolute path of the filename that contains the log history.
[edit shared sae configuration logger sae-file-log-1 file]user@host# set rollover-filename rollover-filename
27Copyright © 2014, Juniper Networks, Inc.
Chapter 3: Configuring Logging for SRC Components with the CLI
When the log file reaches the maximum size, the software closes the log file and
renames it. If a previous rollover file exists, the software overwrites it. The software
then reopens the log file and continues to save event messages in it.
NOTE: On a C Series Controller, log files are rotated according to thesettings in the logrotate utility. The logrotate utility specifies how oftenlog files are rotated and whether they are compressed.
6. (Optional) Specify the maximum size of the log file and the rollover file.
[edit shared sae configuration logger sae-file-log-1 file]user@host# setmaximum-file-sizemaximum-file-size
NOTE: Themaximum file size is specified in KB. Maximum size of the logfile is 10,000,000 KB.
Do not set the maximum file size to a value greater than the available disk space.
RelatedDocumentation
Configuring System Logging (SRC CLI) on page 28•
• Saving System Log Messages to a File (SRC CLI)
• Sending System Log Messages to Other Servers (SRC CLI)
• Before You Configure Logging for SRC Components on page 39
• Logging for SRC Components Overview on page 7
Configuring System Logging (SRC CLI)
Use the following statements to configure the SRC software to send log messages to
the system logging facility:
logger name syslog {filter filter;host host;facility facility;format format;port port;
}
You can configure components to send log messages to the system log server on the
platform on which the SRC software is running.
If you plan to filter log messages, you should be familiar with severity levels and filters
for logging before you configure system logging for a component. See “Categories and
Severity Levels for Event Messages” on page 7.
To configure component logging to the system log server:
Copyright © 2014, Juniper Networks, Inc.28
SRC 4.7.x Monitoring and Troubleshooting Guide
1. From configuration mode, access the configuration statement that configures the
logging destination for the component. For example:
[edit]user@host# component-hierarchy logger name syslog
For example:
[edit]user@host# edit shared sae configuration logger sae-sys-1 syslog
[edit]user@host# edit snmp agent logger snmp-sys-1 syslog
[edit]user@host# edit slot 0 jps logger jps-sys-1 syslog
2. (Optional) Specify the filter to define which event messages the software logs or
disregards.
[edit shared sae configuration logger sae-sys-1 syslog]user@host# set filter filter
Filters can specify the logging level, such as debug, or can specify expressions.
3. (Optional) Change the IP address or name of a host that collects event messages by
means of a standard system logging daemon.
[edit shared sae configuration logger sae-sys-1 syslog]user@host# set host host
By default, the host is loghost for the system log server on the local host. (Configuration
in the /etc/hosts file sets loghost to localhost.)
Make sure that the user under which the J2EE application server or Web application
server runs has write access to this folder. If this user does not have write access to
the default folder, configure the component or application to write logs in folders to
which the user has write access.
4. (Optional) Specify the type of system log in accordance with the system logging
protocol, a value of 0–23.
[edit shared sae configuration logger sae-sys-1 syslog]user@host# set facility facility
5. (Optional) Specify the Message Format string that indicates how the information in
an event message is printed.
[edit shared sae configuration logger sae-sys-1 syslog]user@host# set format format
Specify a Message Format string as defined in
http://java.sun.com/j2se/1.4.2/docs/api/java/text/MessageFormat.html
29Copyright © 2014, Juniper Networks, Inc.
Chapter 3: Configuring Logging for SRC Components with the CLI
The fields available for events are:
• 0—Time and date of the event
• 1—Name of the thread generating the event
• 2—Text message of the event
• 3—Category of the event
• 4—Priority of the event
6. (Optional) Specify the port used for system logging, a value of 0–65535.
[edit shared sae configuration logger sae-sys-1 syslog]user@host# set port port
RelatedDocumentation
Configuring an SRC Component to Store Log Messages in a File (SRC CLI) on page 26•
• Saving System Log Messages to a File (SRC CLI)
• Configuration Statements for SRC Component Logging on page 25
• Before You Configure Logging for SRC Components on page 39
• Logging for SRC Components Overview on page 7
Configuration Statements for the Logrotate Utility (SRC CLI)
Use the following statements to configure the logrotate utility:
system logrotate file-name{}system logrotate file-name logfiles name {compress;delay-compress;copy;daily;weekly;monthly;rotate rotate;size size;no-create;copy-truncate;if-empty;missing-ok;filenames filenames;shared-scripts;pre-rotate pre-rotate;post-rotate post-rotate;first-action first-action;last-action last-action;
}system logrotate file-name logfiles name create {default;modemode;
Copyright © 2014, Juniper Networks, Inc.30
SRC 4.7.x Monitoring and Troubleshooting Guide
owner owner;group group;
}system logrotate logrotate.conf {compress;delay-compress;copy;daily;weekly;monthly;rotate rotate;size size;no-create;copy-truncate;if-empty;missing-ok;
}system logrotate logrotate.conf create {default;modemode;owner owner;group group;
}system logrotate logrotate.conf logfiles name {compress;delay-compress;copy;daily;weekly;monthly;rotate rotate;size size;no-create;copy-truncate;if-empty;missing-ok;filenames filenames;shared-scripts;pre-rotate pre-rotate;post-rotate post-rotate;first-action first-action;last-action last-action;
}system logrotate logrotate.conf logfiles name create {default;modemode;owner owner;group group;
}
RelatedDocumentation
Logging for SRC Components Overview on page 7•
• Rotating Log Files on page 22
• Configuring the Logrotate Utility (SRC CLI) on page 32
31Copyright © 2014, Juniper Networks, Inc.
Chapter 3: Configuring Logging for SRC Components with the CLI
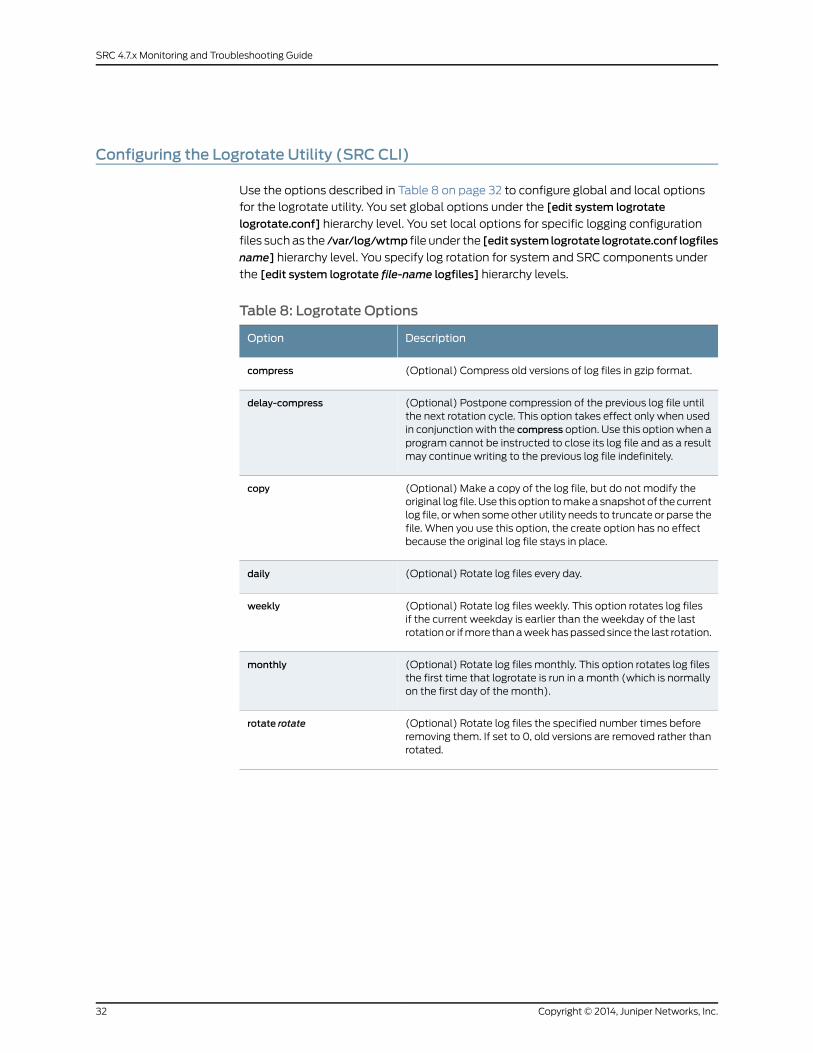
Configuring the Logrotate Utility (SRC CLI)
Use the options described in Table 8 on page 32 to configure global and local options
for the logrotate utility. You set global options under the [edit system logrotate
logrotate.conf] hierarchy level. You set local options for specific logging configuration
files such as the /var/log/wtmp file under the [edit systemlogrotate logrotate.conf logfiles
name] hierarchy level. You specify log rotation for system and SRC components under
the [edit system logrotate file-name logfiles] hierarchy levels.
Table 8: Logrotate Options
DescriptionOption
(Optional) Compress old versions of log files in gzip format.compress
(Optional) Postpone compression of the previous log file untilthe next rotation cycle. This option takes effect only when usedin conjunction with the compress option. Use this option when aprogram cannot be instructed to close its log file and as a resultmay continue writing to the previous log file indefinitely.
delay-compress
(Optional) Make a copy of the log file, but do not modify theoriginal log file. Use this option to make a snapshot of the currentlog file, or when some other utility needs to truncate or parse thefile. When you use this option, the create option has no effectbecause the original log file stays in place.
copy
(Optional) Rotate log files every day.daily
(Optional) Rotate log files weekly. This option rotates log filesif the current weekday is earlier than the weekday of the lastrotation or if more than a week has passed since the last rotation.
weekly
(Optional) Rotate log files monthly. This option rotates log filesthe first time that logrotate is run in a month (which is normallyon the first day of the month).
monthly
(Optional) Rotate log files the specified number times beforeremoving them. If set to 0, old versions are removed rather thanrotated.
rotate rotate
Copyright © 2014, Juniper Networks, Inc.32
SRC 4.7.x Monitoring and Troubleshooting Guide
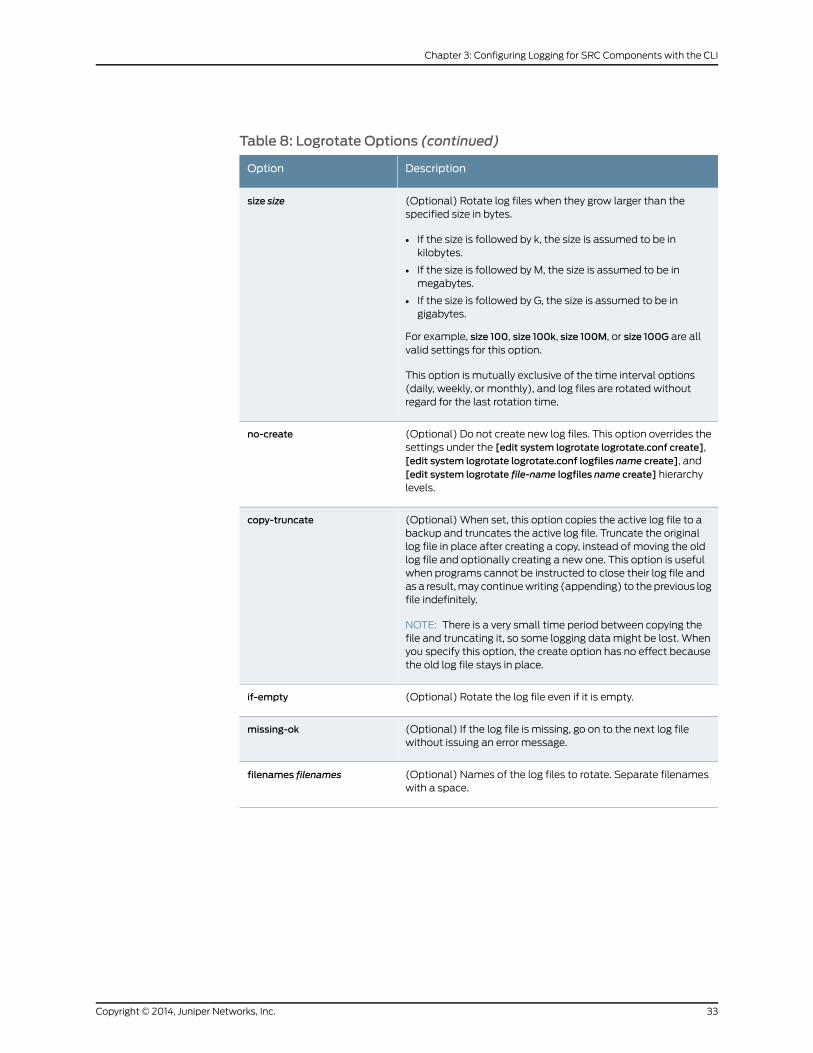
Table 8: Logrotate Options (continued)
DescriptionOption
(Optional) Rotate log files when they grow larger than thespecified size in bytes.
• If the size is followed by k, the size is assumed to be inkilobytes.
• If the size is followed by M, the size is assumed to be inmegabytes.
• If the size is followed by G, the size is assumed to be ingigabytes.
For example, size 100, size 100k, size 100M, or size 100G are allvalid settings for this option.
This option is mutually exclusive of the time interval options(daily, weekly, or monthly), and log files are rotated withoutregard for the last rotation time.
size size
(Optional) Do not create new log files. This option overrides thesettings under the [edit system logrotate logrotate.conf create],[edit system logrotate logrotate.conf logfiles name create], and[edit system logrotate file-name logfiles name create] hierarchylevels.
no-create
(Optional) When set, this option copies the active log file to abackup and truncates the active log file. Truncate the originallog file in place after creating a copy, instead of moving the oldlog file and optionally creating a new one. This option is usefulwhen programs cannot be instructed to close their log file andas a result, may continue writing (appending) to the previous logfile indefinitely.
NOTE: There is a very small time period between copying thefile and truncating it, so some logging data might be lost. Whenyou specify this option, the create option has no effect becausethe old log file stays in place.
copy-truncate
(Optional) Rotate the log file even if it is empty.if-empty
(Optional) If the log file is missing, go on to the next log filewithout issuing an error message.
missing-ok
(Optional) Names of the log files to rotate. Separate filenameswith a space.
filenames filenames
33Copyright © 2014, Juniper Networks, Inc.
Chapter 3: Configuring Logging for SRC Components with the CLI
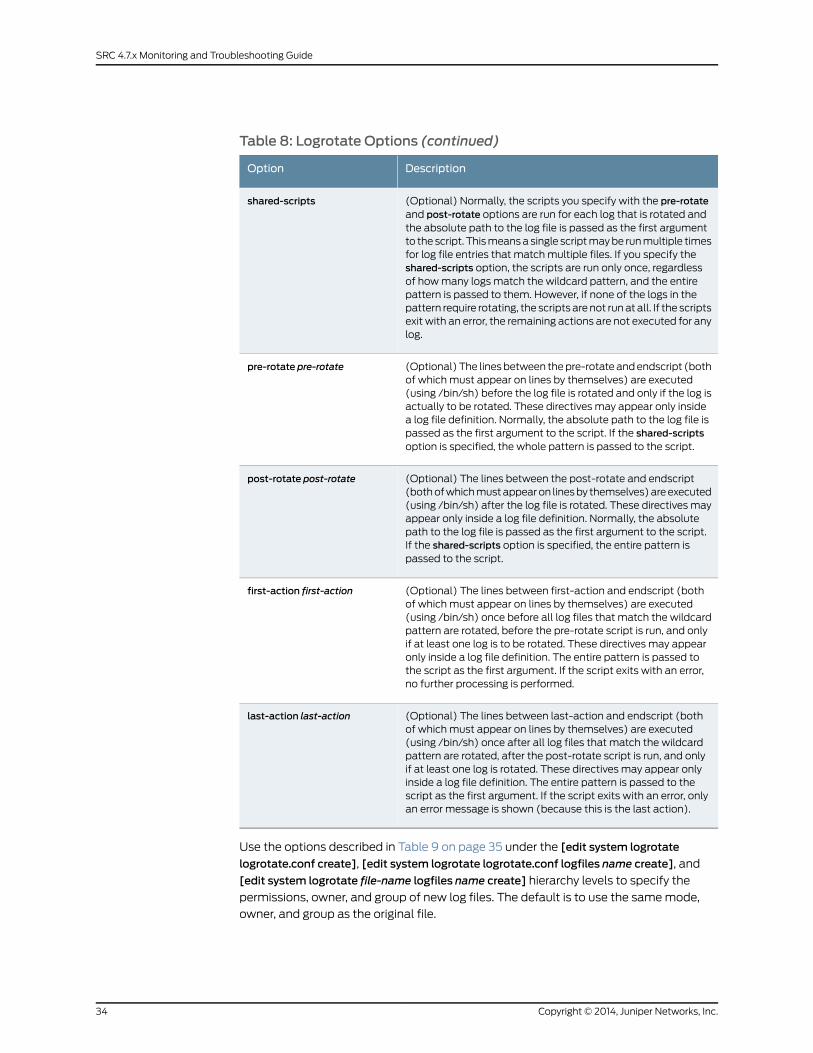
Table 8: Logrotate Options (continued)
DescriptionOption
(Optional) Normally, the scripts you specify with the pre-rotateand post-rotate options are run for each log that is rotated andthe absolute path to the log file is passed as the first argumentto the script. This means a single script may be run multiple timesfor log file entries that match multiple files. If you specify theshared-scripts option, the scripts are run only once, regardlessof how many logs match the wildcard pattern, and the entirepattern is passed to them. However, if none of the logs in thepattern require rotating, the scripts are not run at all. If the scriptsexit with an error, the remaining actions are not executed for anylog.
shared-scripts
(Optional) The lines between the pre-rotate and endscript (bothof which must appear on lines by themselves) are executed(using /bin/sh) before the log file is rotated and only if the log isactually to be rotated. These directives may appear only insidea log file definition. Normally, the absolute path to the log file ispassed as the first argument to the script. If the shared-scriptsoption is specified, the whole pattern is passed to the script.
pre-rotate pre-rotate
(Optional) The lines between the post-rotate and endscript(both of which must appear on lines by themselves) are executed(using /bin/sh) after the log file is rotated. These directives mayappear only inside a log file definition. Normally, the absolutepath to the log file is passed as the first argument to the script.If the shared-scripts option is specified, the entire pattern ispassed to the script.
post-rotate post-rotate
(Optional) The lines between first-action and endscript (bothof which must appear on lines by themselves) are executed(using /bin/sh) once before all log files that match the wildcardpattern are rotated, before the pre-rotate script is run, and onlyif at least one log is to be rotated. These directives may appearonly inside a log file definition. The entire pattern is passed tothe script as the first argument. If the script exits with an error,no further processing is performed.
first-action first-action
(Optional) The lines between last-action and endscript (bothof which must appear on lines by themselves) are executed(using /bin/sh) once after all log files that match the wildcardpattern are rotated, after the post-rotate script is run, and onlyif at least one log is rotated. These directives may appear onlyinside a log file definition. The entire pattern is passed to thescript as the first argument. If the script exits with an error, onlyan error message is shown (because this is the last action).
last-action last-action
Use the options described in Table 9 on page 35 under the [edit system logrotate
logrotate.conf create], [edit system logrotate logrotate.conf logfiles name create], and
[edit system logrotate file-name logfiles name create] hierarchy levels to specify the
permissions, owner, and group of new log files. The default is to use the same mode,
owner, and group as the original file.
Copyright © 2014, Juniper Networks, Inc.34
SRC 4.7.x Monitoring and Troubleshooting Guide
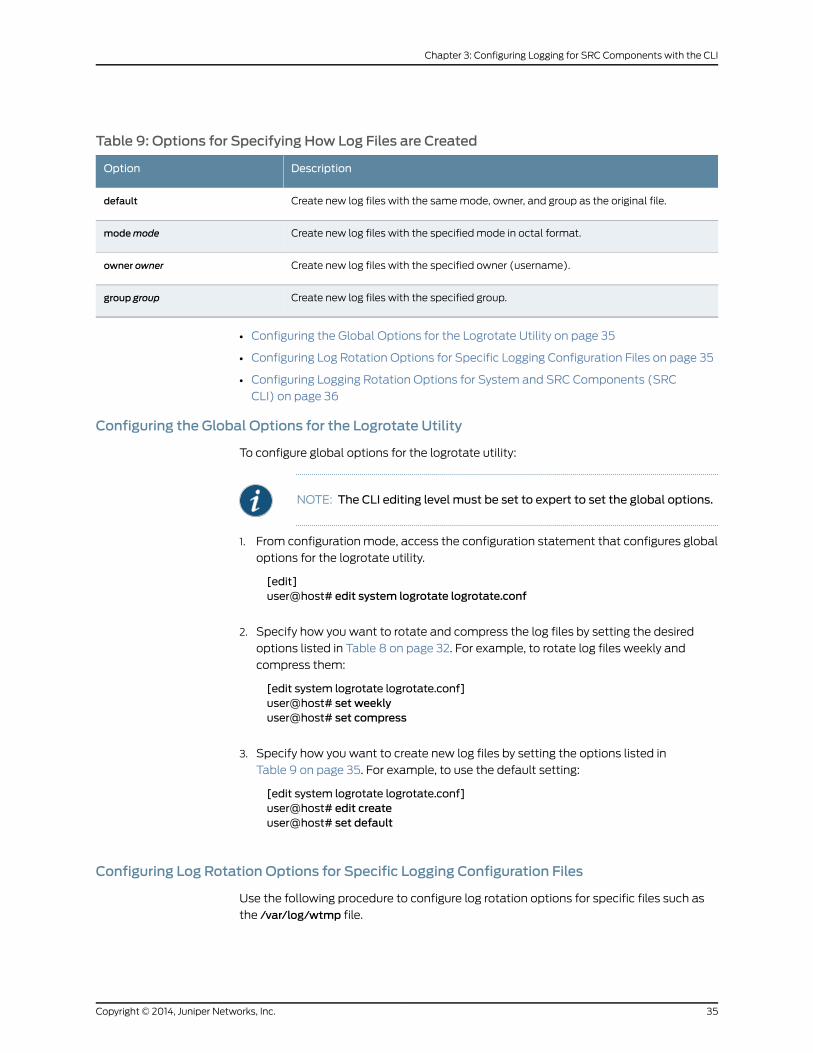
Table 9: Options for Specifying How Log Files are Created
DescriptionOption
Create new log files with the same mode, owner, and group as the original file.default
Create new log files with the specified mode in octal format.modemode
Create new log files with the specified owner (username).owner owner
Create new log files with the specified group.group group
• Configuring the Global Options for the Logrotate Utility on page 35
• Configuring Log Rotation Options for Specific Logging Configuration Files on page 35
• Configuring Logging Rotation Options for System and SRC Components (SRC
CLI) on page 36
Configuring the Global Options for the Logrotate Utility
To configure global options for the logrotate utility:
NOTE: The CLI editing level must be set to expert to set the global options.
1. From configuration mode, access the configuration statement that configures global
options for the logrotate utility.
[edit]user@host# edit system logrotate logrotate.conf
2. Specify how you want to rotate and compress the log files by setting the desired
options listed in Table 8 on page 32. For example, to rotate log files weekly and
compress them:
[edit system logrotate logrotate.conf]user@host# set weeklyuser@host# set compress
3. Specify how you want to create new log files by setting the options listed in
Table 9 on page 35. For example, to use the default setting:
[edit system logrotate logrotate.conf]user@host# edit createuser@host# set default
Configuring Log Rotation Options for Specific Logging Configuration Files
Use the following procedure to configure log rotation options for specific files such as
the /var/log/wtmp file.
35Copyright © 2014, Juniper Networks, Inc.
Chapter 3: Configuring Logging for SRC Components with the CLI
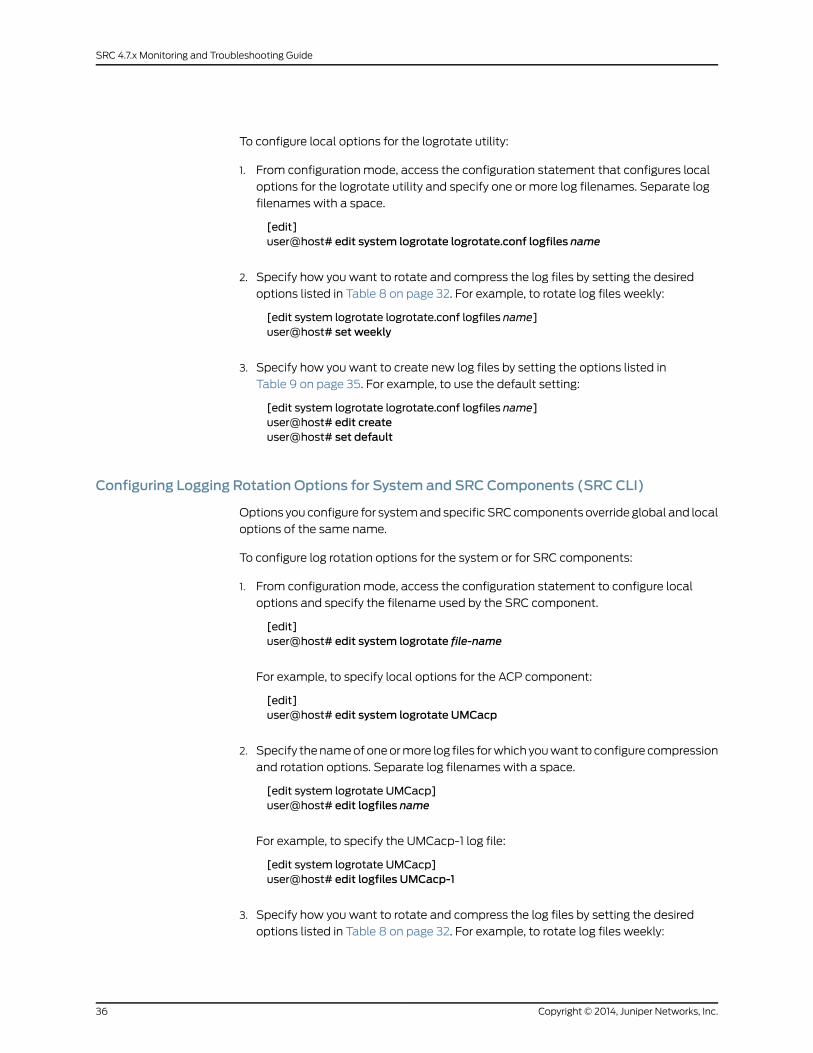
To configure local options for the logrotate utility:
1. From configuration mode, access the configuration statement that configures local
options for the logrotate utility and specify one or more log filenames. Separate log
filenames with a space.
[edit]user@host# edit system logrotate logrotate.conf logfiles name
2. Specify how you want to rotate and compress the log files by setting the desired
options listed in Table 8 on page 32. For example, to rotate log files weekly:
[edit system logrotate logrotate.conf logfiles name]user@host# set weekly
3. Specify how you want to create new log files by setting the options listed in
Table 9 on page 35. For example, to use the default setting:
[edit system logrotate logrotate.conf logfiles name]user@host# edit createuser@host# set default
Configuring Logging Rotation Options for System and SRC Components (SRC CLI)
Options you configure for system and specific SRC components override global and local
options of the same name.
To configure log rotation options for the system or for SRC components:
1. From configuration mode, access the configuration statement to configure local
options and specify the filename used by the SRC component.
[edit]user@host# edit system logrotate file-name
For example, to specify local options for the ACP component:
[edit]user@host# edit system logrotate UMCacp
2. Specify the name of one or more log files for which you want to configure compression
and rotation options. Separate log filenames with a space.
[edit system logrotate UMCacp]user@host# edit logfiles name
For example, to specify the UMCacp-1 log file:
[edit system logrotate UMCacp]user@host# edit logfiles UMCacp-1
3. Specify how you want to rotate and compress the log files by setting the desired
options listed in Table 8 on page 32. For example, to rotate log files weekly:
Copyright © 2014, Juniper Networks, Inc.36
SRC 4.7.x Monitoring and Troubleshooting Guide
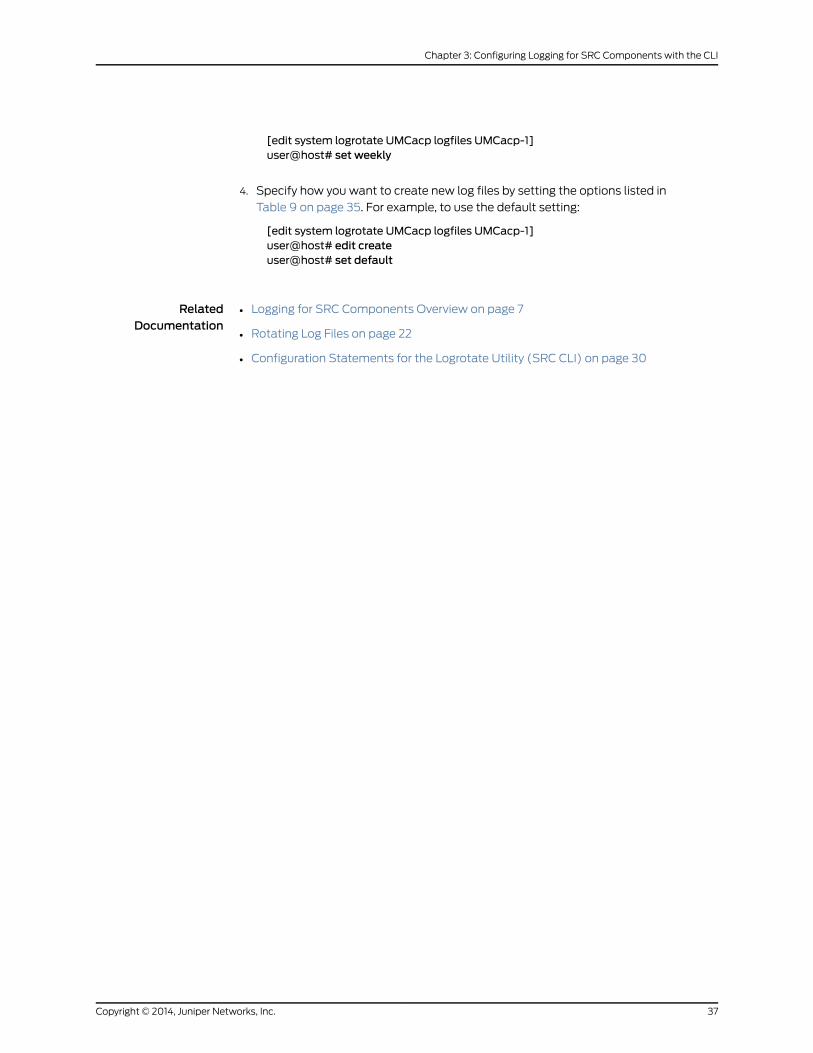
[edit system logrotate UMCacp logfiles UMCacp-1]user@host# set weekly
4. Specify how you want to create new log files by setting the options listed in
Table 9 on page 35. For example, to use the default setting:
[edit system logrotate UMCacp logfiles UMCacp-1]user@host# edit createuser@host# set default
RelatedDocumentation
• Logging for SRC Components Overview on page 7
• Rotating Log Files on page 22
• Configuration Statements for the Logrotate Utility (SRC CLI) on page 30
37Copyright © 2014, Juniper Networks, Inc.
Chapter 3: Configuring Logging for SRC Components with the CLI

Copyright © 2014, Juniper Networks, Inc.38
SRC 4.7.x Monitoring and Troubleshooting Guide
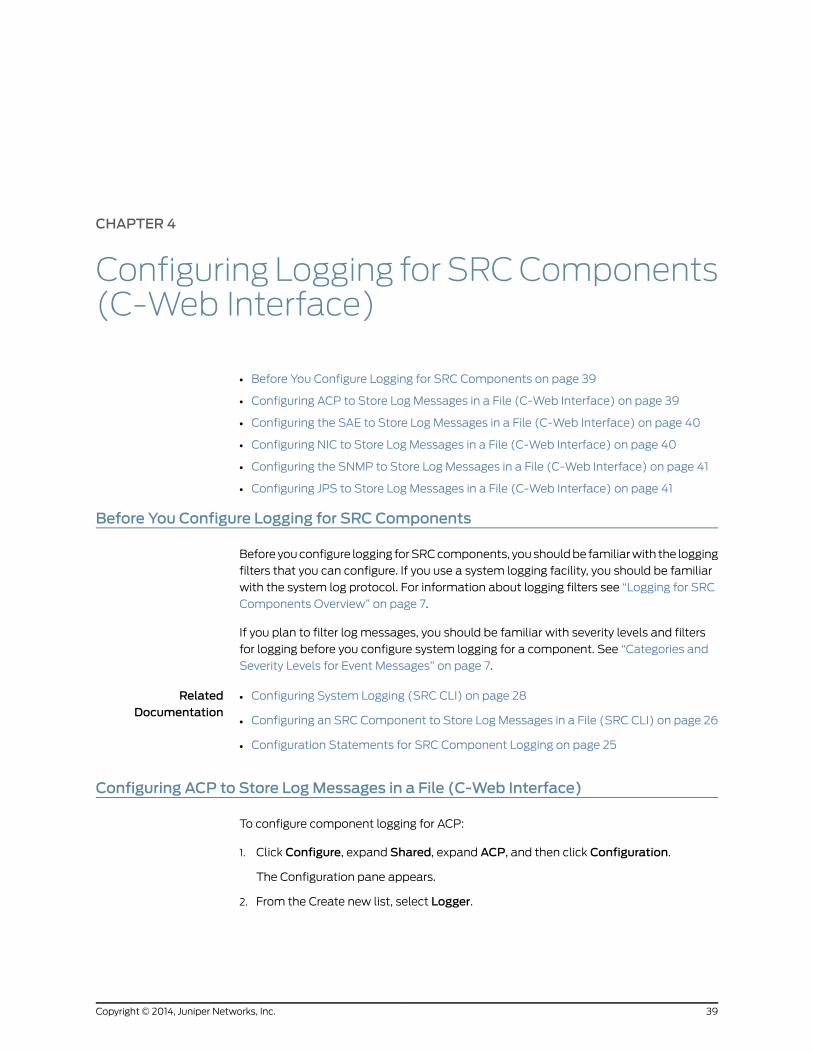
CHAPTER 4
Configuring Logging for SRCComponents(C-Web Interface)
• Before You Configure Logging for SRC Components on page 39
• Configuring ACP to Store Log Messages in a File (C-Web Interface) on page 39
• Configuring the SAE to Store Log Messages in a File (C-Web Interface) on page 40
• Configuring NIC to Store Log Messages in a File (C-Web Interface) on page 40
• Configuring the SNMP to Store Log Messages in a File (C-Web Interface) on page 41
• Configuring JPS to Store Log Messages in a File (C-Web Interface) on page 41
Before You Configure Logging for SRC Components
Before you configure logging for SRC components, you should be familiar with the logging
filters that you can configure. If you use a system logging facility, you should be familiar
with the system log protocol. For information about logging filters see “Logging for SRC
Components Overview” on page 7.
If you plan to filter log messages, you should be familiar with severity levels and filters
for logging before you configure system logging for a component. See “Categories and
Severity Levels for Event Messages” on page 7.
RelatedDocumentation
Configuring System Logging (SRC CLI) on page 28•
• Configuring an SRC Component to Store Log Messages in a File (SRC CLI) on page 26
• Configuration Statements for SRC Component Logging on page 25
Configuring ACP to Store LogMessages in a File (C-Web Interface)
To configure component logging for ACP:
1. Click Configure, expand Shared, expand ACP, and then click Configuration.
The Configuration pane appears.
2. From the Create new list, select Logger.
39Copyright © 2014, Juniper Networks, Inc.
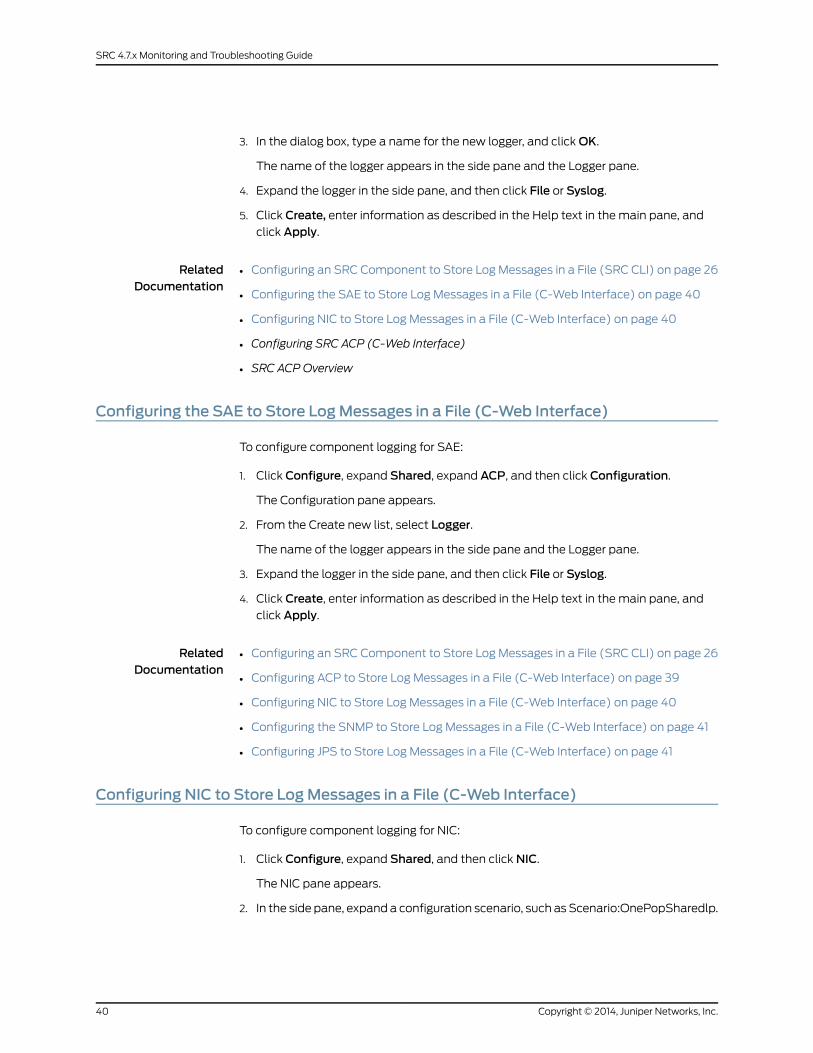
3. In the dialog box, type a name for the new logger, and click OK.
The name of the logger appears in the side pane and the Logger pane.
4. Expand the logger in the side pane, and then click File or Syslog.
5. Click Create, enter information as described in the Help text in the main pane, and
click Apply.
RelatedDocumentation
Configuring an SRC Component to Store Log Messages in a File (SRC CLI) on page 26•
• Configuring the SAE to Store Log Messages in a File (C-Web Interface) on page 40
• Configuring NIC to Store Log Messages in a File (C-Web Interface) on page 40
• Configuring SRC ACP (C-Web Interface)
• SRC ACP Overview
Configuring the SAE to Store LogMessages in a File (C-Web Interface)
To configure component logging for SAE:
1. Click Configure, expand Shared, expand ACP, and then click Configuration.
The Configuration pane appears.
2. From the Create new list, select Logger.
The name of the logger appears in the side pane and the Logger pane.
3. Expand the logger in the side pane, and then click File or Syslog.
4. Click Create, enter information as described in the Help text in the main pane, and
click Apply.
RelatedDocumentation
Configuring an SRC Component to Store Log Messages in a File (SRC CLI) on page 26•
• Configuring ACP to Store Log Messages in a File (C-Web Interface) on page 39
• Configuring NIC to Store Log Messages in a File (C-Web Interface) on page 40
• Configuring the SNMP to Store Log Messages in a File (C-Web Interface) on page 41
• Configuring JPS to Store Log Messages in a File (C-Web Interface) on page 41
Configuring NIC to Store LogMessages in a File (C-Web Interface)
To configure component logging for NIC:
1. Click Configure, expand Shared, and then click NIC.
The NIC pane appears.
2. In the side pane, expand a configuration scenario, such as Scenario:OnePopSharedlp.
Copyright © 2014, Juniper Networks, Inc.40
SRC 4.7.x Monitoring and Troubleshooting Guide
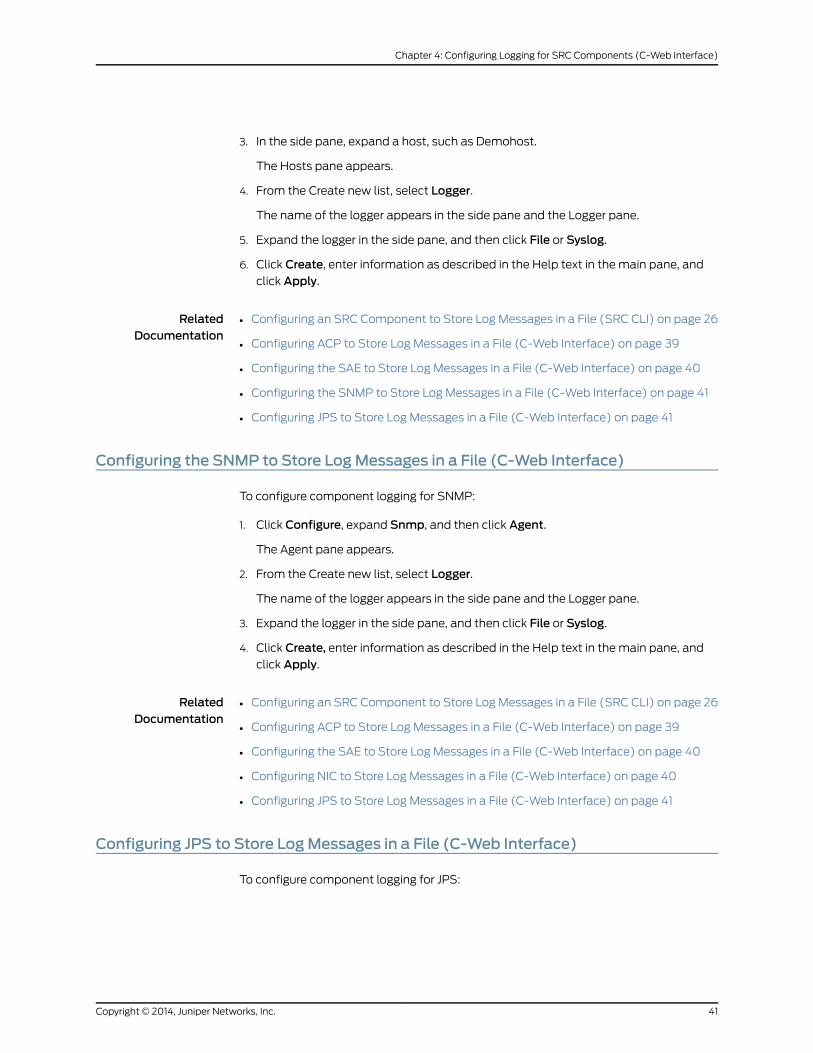
3. In the side pane, expand a host, such as Demohost.
The Hosts pane appears.
4. From the Create new list, select Logger.
The name of the logger appears in the side pane and the Logger pane.
5. Expand the logger in the side pane, and then click File or Syslog.
6. Click Create, enter information as described in the Help text in the main pane, and
click Apply.
RelatedDocumentation
Configuring an SRC Component to Store Log Messages in a File (SRC CLI) on page 26•
• Configuring ACP to Store Log Messages in a File (C-Web Interface) on page 39
• Configuring the SAE to Store Log Messages in a File (C-Web Interface) on page 40
• Configuring the SNMP to Store Log Messages in a File (C-Web Interface) on page 41
• Configuring JPS to Store Log Messages in a File (C-Web Interface) on page 41
Configuring the SNMP to Store LogMessages in a File (C-Web Interface)
To configure component logging for SNMP:
1. Click Configure, expand Snmp, and then click Agent.
The Agent pane appears.
2. From the Create new list, select Logger.
The name of the logger appears in the side pane and the Logger pane.
3. Expand the logger in the side pane, and then click File or Syslog.
4. Click Create, enter information as described in the Help text in the main pane, and
click Apply.
RelatedDocumentation
Configuring an SRC Component to Store Log Messages in a File (SRC CLI) on page 26•
• Configuring ACP to Store Log Messages in a File (C-Web Interface) on page 39
• Configuring the SAE to Store Log Messages in a File (C-Web Interface) on page 40
• Configuring NIC to Store Log Messages in a File (C-Web Interface) on page 40
• Configuring JPS to Store Log Messages in a File (C-Web Interface) on page 41
Configuring JPS to Store LogMessages in a File (C-Web Interface)
To configure component logging for JPS:
41Copyright © 2014, Juniper Networks, Inc.
Chapter 4: Configuring Logging for SRC Components (C-Web Interface)
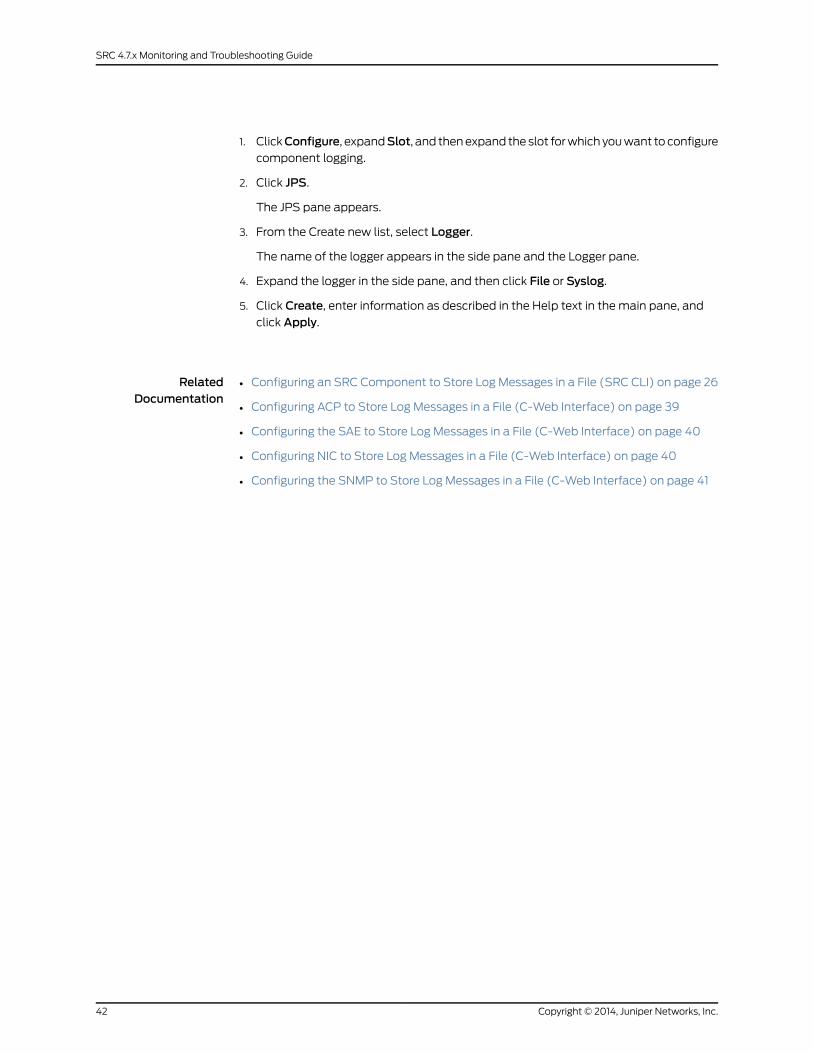
1. ClickConfigure, expandSlot, and then expand the slot for which you want to configure
component logging.
2. Click JPS.
The JPS pane appears.
3. From the Create new list, select Logger.
The name of the logger appears in the side pane and the Logger pane.
4. Expand the logger in the side pane, and then click File or Syslog.
5. Click Create, enter information as described in the Help text in the main pane, and
click Apply.
RelatedDocumentation
• Configuring an SRC Component to Store Log Messages in a File (SRC CLI) on page 26
• Configuring ACP to Store Log Messages in a File (C-Web Interface) on page 39
• Configuring the SAE to Store Log Messages in a File (C-Web Interface) on page 40
• Configuring NIC to Store Log Messages in a File (C-Web Interface) on page 40
• Configuring the SNMP to Store Log Messages in a File (C-Web Interface) on page 41
Copyright © 2014, Juniper Networks, Inc.42
SRC 4.7.x Monitoring and Troubleshooting Guide
PART 3
Using Simulated Router Drivers andSimulated Subscribers for Testing
• Configuring a Simulated Router Driver for Testing (SRC CLI) on page 45
• Configuring a Simulated Router Driver for Testing (C-Web Interface) on page 47
• Using Simulated Subscribers for Testing (SRC CLI) on page 49
43Copyright © 2014, Juniper Networks, Inc.

Copyright © 2014, Juniper Networks, Inc.44
SRC 4.7.x Monitoring and Troubleshooting Guide
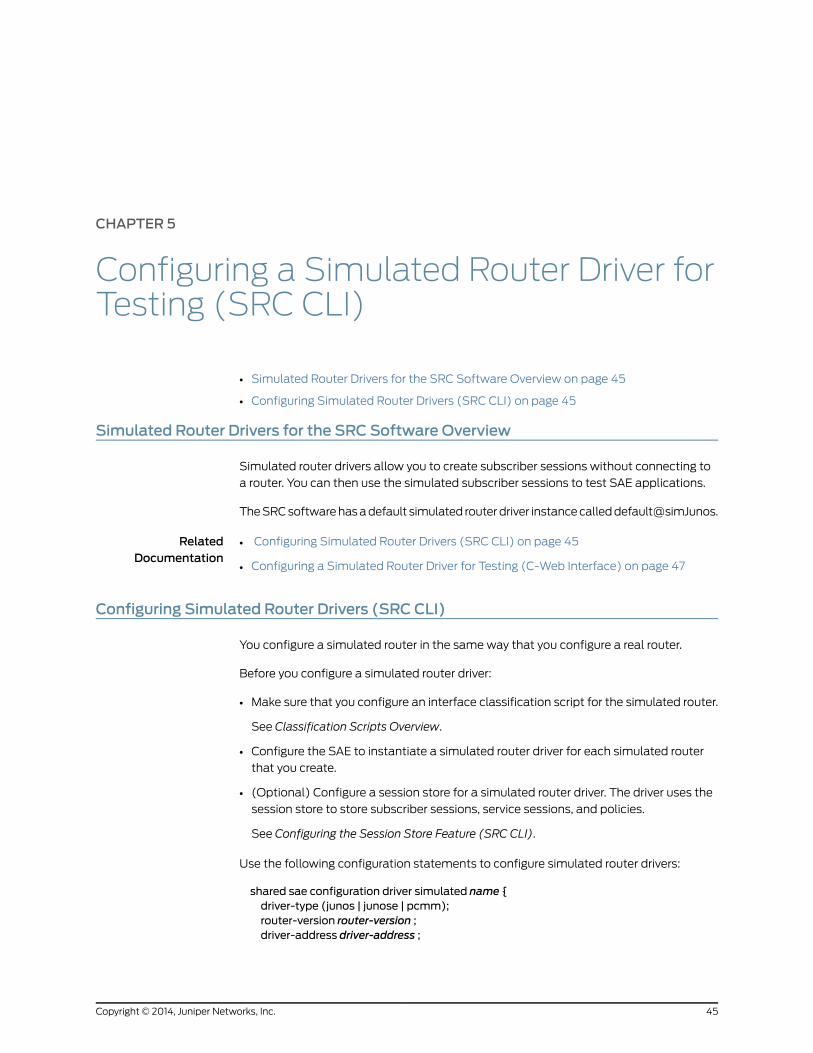
CHAPTER 5
Configuring a Simulated Router Driver forTesting (SRC CLI)
• Simulated Router Drivers for the SRC Software Overview on page 45
• Configuring Simulated Router Drivers (SRC CLI) on page 45
Simulated Router Drivers for the SRC Software Overview
Simulated router drivers allow you to create subscriber sessions without connecting to
a router. You can then use the simulated subscriber sessions to test SAE applications.
The SRC software has a default simulated router driver instance called default@simJunos.
RelatedDocumentation
Configuring Simulated Router Drivers (SRC CLI) on page 45•
• Configuring a Simulated Router Driver for Testing (C-Web Interface) on page 47
Configuring Simulated Router Drivers (SRC CLI)
You configure a simulated router in the same way that you configure a real router.
Before you configure a simulated router driver:
• Make sure that you configure an interface classification script for the simulated router.
See Classification Scripts Overview.
• Configure the SAE to instantiate a simulated router driver for each simulated router
that you create.
• (Optional) Configure a session store for a simulated router driver. The driver uses the
session store to store subscriber sessions, service sessions, and policies.
See Configuring the Session Store Feature (SRC CLI).
Use the following configuration statements to configure simulated router drivers:
shared sae configuration driver simulated name {driver-type (junos | junose | pcmm);router-version router-version ;driver-address driver-address ;
45Copyright © 2014, Juniper Networks, Inc.

transport-router transport-router ;}
To configure simulated router drivers:
1. From configuration mode, access the configuration statement that configures
simulated router drivers. In this sample procedure, west-region is the name of the SAE
group, and default@simjunos is the name of the simulated router driver.
[edit]user@host# edit shared sae groupwest-region configuration driver simulateddefault@simJunos
2. Configure the type of device that the simulated driver simulates.
[edit shared sae group west-region configuration driver simulated default@simJunos]user@host# set driver-type (junos | junose | pcmm)
3. (Optional) Configure the version of the router software to simulate. This is the software
version that is sent by the router.
[edit shared sae group west-region configuration driver simulated default@simJunos]user@host# set router-version router-version
4. Configure the IP address of the device driver.
[edit shared sae group west-region configuration driver simulated default@simJunos]user@host# set driver-address driver-address
5. (Optional) Configure the name of a virtual router that is used to connect to the SAE.
This value is passed to the router initialization script. It is not supported on the device
running Junos OS.
[edit shared sae group west-region configuration driver simulated default@simJunos]user@host# set transport-router transport-router
6. (Optional) Verify the configuration of the simulated driver.
[edit shared sae group west-region configuration driver simulated default@simJunos]
user@host# showdriver-type junos;router-version 8.4;driver-address 10.10.90.5;
For information about setting up SAE groups, see Configuring an SAE Group.
RelatedDocumentation
• Configuring a Simulated Router Driver for Testing (C-Web Interface) on page 47
• Simulated Router Drivers for the SRC Software Overview on page 45
Copyright © 2014, Juniper Networks, Inc.46
SRC 4.7.x Monitoring and Troubleshooting Guide
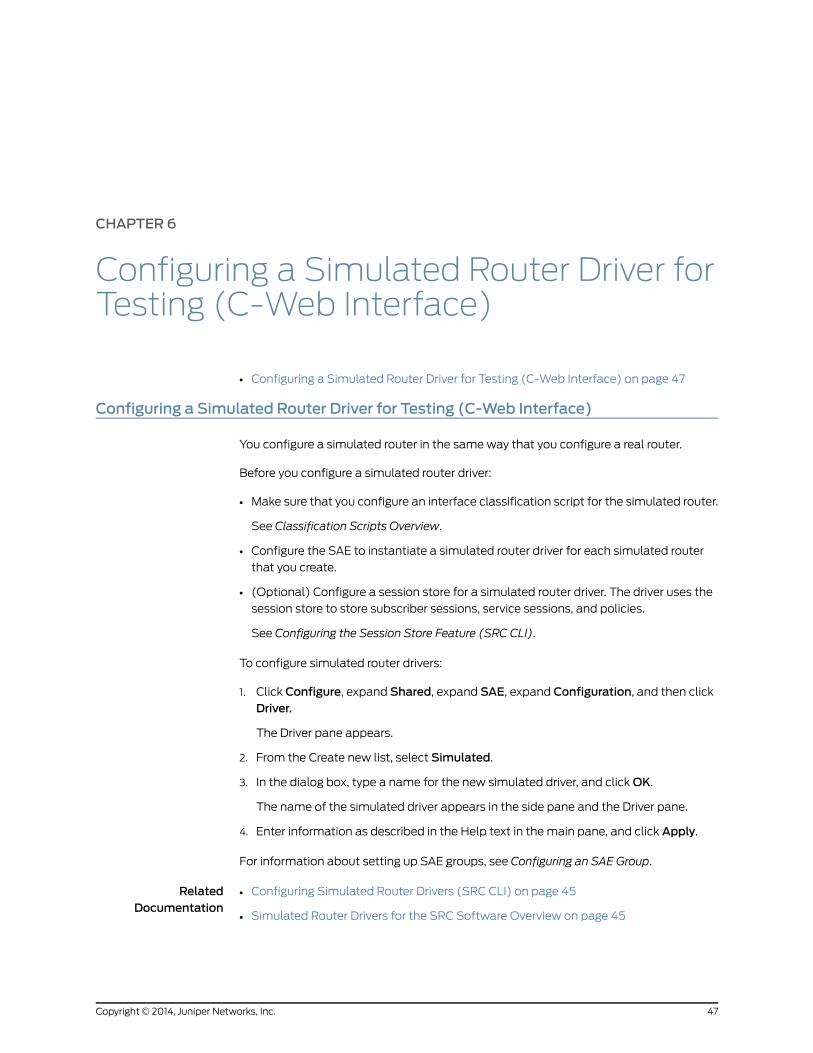
CHAPTER 6
Configuring a Simulated Router Driver forTesting (C-Web Interface)
• Configuring a Simulated Router Driver for Testing (C-Web Interface) on page 47
Configuring a Simulated Router Driver for Testing (C-Web Interface)
You configure a simulated router in the same way that you configure a real router.
Before you configure a simulated router driver:
• Make sure that you configure an interface classification script for the simulated router.
See Classification Scripts Overview.
• Configure the SAE to instantiate a simulated router driver for each simulated router
that you create.
• (Optional) Configure a session store for a simulated router driver. The driver uses the
session store to store subscriber sessions, service sessions, and policies.
See Configuring the Session Store Feature (SRC CLI).
To configure simulated router drivers:
1. Click Configure, expand Shared, expand SAE, expand Configuration, and then click
Driver.
The Driver pane appears.
2. From the Create new list, select Simulated.
3. In the dialog box, type a name for the new simulated driver, and click OK.
The name of the simulated driver appears in the side pane and the Driver pane.
4. Enter information as described in the Help text in the main pane, and click Apply.
For information about setting up SAE groups, see Configuring an SAE Group.
RelatedDocumentation
• Configuring Simulated Router Drivers (SRC CLI) on page 45
• Simulated Router Drivers for the SRC Software Overview on page 45
47Copyright © 2014, Juniper Networks, Inc.

Copyright © 2014, Juniper Networks, Inc.48
SRC 4.7.x Monitoring and Troubleshooting Guide
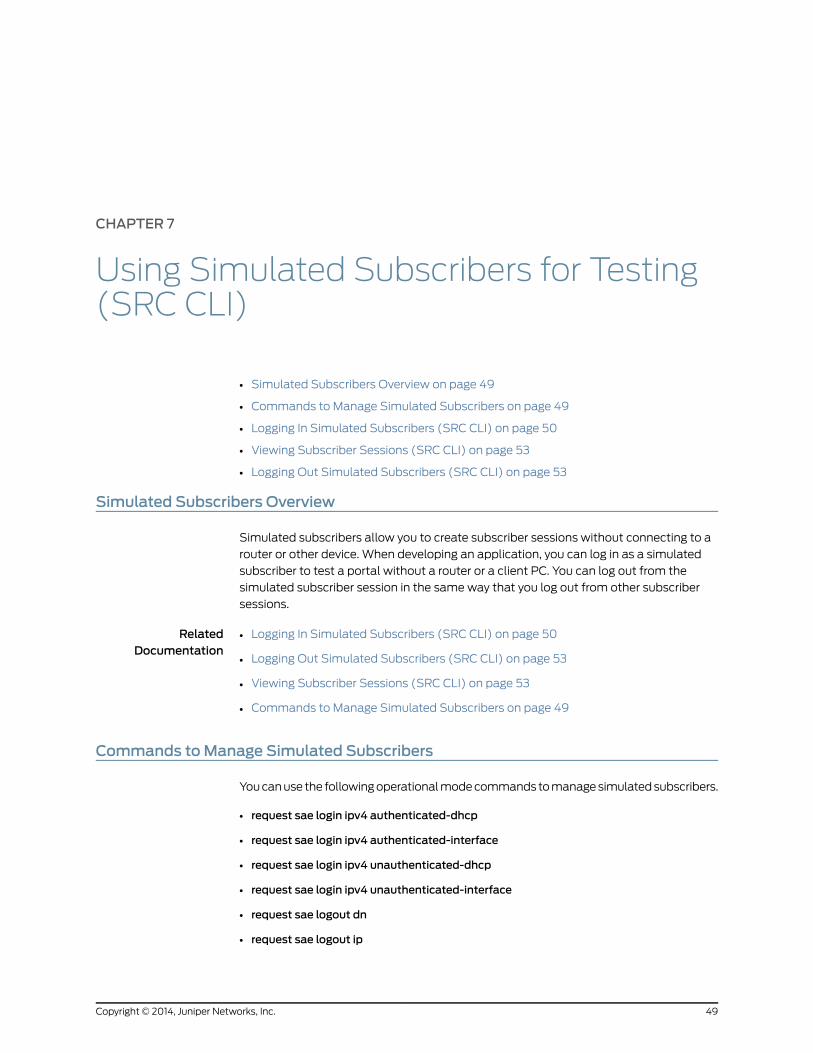
CHAPTER 7
Using Simulated Subscribers for Testing(SRC CLI)
• Simulated Subscribers Overview on page 49
• Commands to Manage Simulated Subscribers on page 49
• Logging In Simulated Subscribers (SRC CLI) on page 50
• Viewing Subscriber Sessions (SRC CLI) on page 53
• Logging Out Simulated Subscribers (SRC CLI) on page 53
Simulated Subscribers Overview
Simulated subscribers allow you to create subscriber sessions without connecting to a
router or other device. When developing an application, you can log in as a simulated
subscriber to test a portal without a router or a client PC. You can log out from the
simulated subscriber session in the same way that you log out from other subscriber
sessions.
RelatedDocumentation
Logging In Simulated Subscribers (SRC CLI) on page 50•
• Logging Out Simulated Subscribers (SRC CLI) on page 53
• Viewing Subscriber Sessions (SRC CLI) on page 53
• Commands to Manage Simulated Subscribers on page 49
Commands toManage Simulated Subscribers
You can use the following operational mode commands to manage simulated subscribers.
• request sae login ipv4 authenticated-dhcp
• request sae login ipv4 authenticated-interface
• request sae login ipv4 unauthenticated-dhcp
• request sae login ipv4 unauthenticated-interface
• request sae logout dn
• request sae logout ip
49Copyright © 2014, Juniper Networks, Inc.
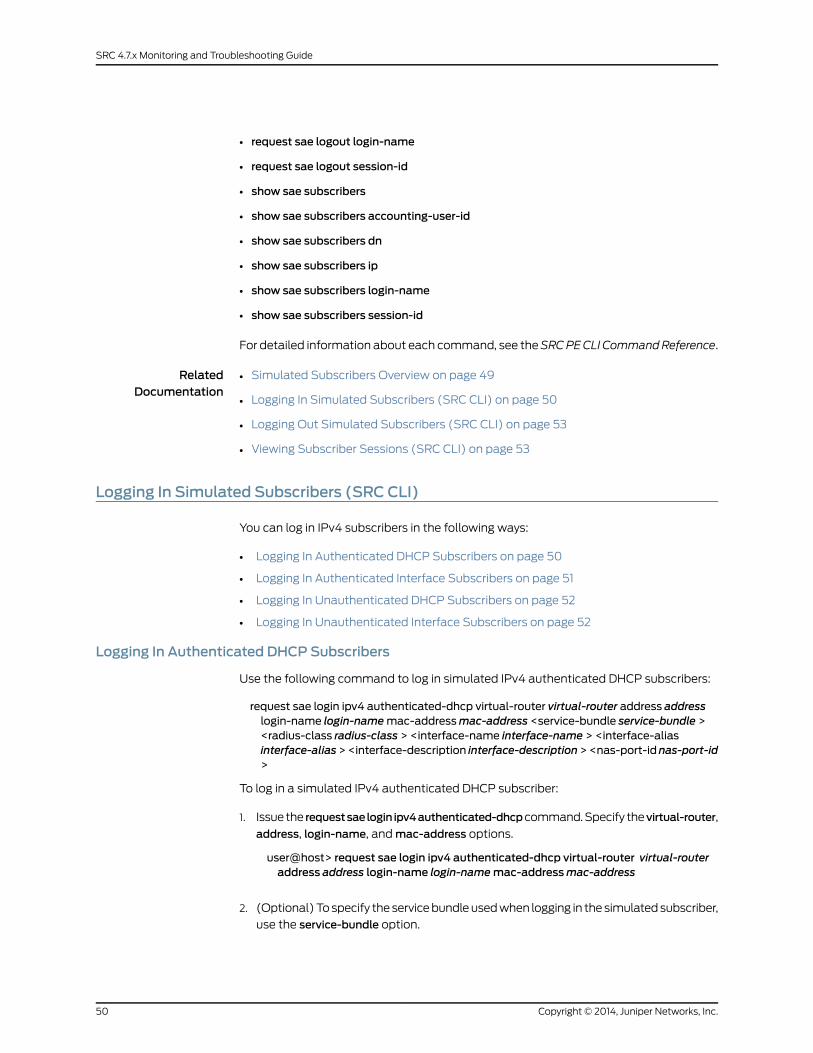
• request sae logout login-name
• request sae logout session-id
• show sae subscribers
• show sae subscribers accounting-user-id
• show sae subscribers dn
• show sae subscribers ip
• show sae subscribers login-name
• show sae subscribers session-id
For detailed information about each command, see theSRCPECLI CommandReference.
RelatedDocumentation
Simulated Subscribers Overview on page 49•
• Logging In Simulated Subscribers (SRC CLI) on page 50
• Logging Out Simulated Subscribers (SRC CLI) on page 53
• Viewing Subscriber Sessions (SRC CLI) on page 53
Logging In Simulated Subscribers (SRC CLI)
You can log in IPv4 subscribers in the following ways:
• Logging In Authenticated DHCP Subscribers on page 50
• Logging In Authenticated Interface Subscribers on page 51
• Logging In Unauthenticated DHCP Subscribers on page 52
• Logging In Unauthenticated Interface Subscribers on page 52
Logging In Authenticated DHCP Subscribers
Use the following command to log in simulated IPv4 authenticated DHCP subscribers:
request sae login ipv4 authenticated-dhcp virtual-router virtual-router address addresslogin-name login-namemac-addressmac-address <service-bundle service-bundle ><radius-class radius-class > <interface-name interface-name > <interface-aliasinterface-alias><interface-description interface-description><nas-port-idnas-port-id>
To log in a simulated IPv4 authenticated DHCP subscriber:
1. Issue the requestsaelogin ipv4authenticated-dhcpcommand. Specify thevirtual-router,
address, login-name, and mac-address options.
user@host> request sae login ipv4 authenticated-dhcp virtual-router virtual-routeraddress address login-name login-namemac-addressmac-address
2. (Optional) To specify the service bundle used when logging in the simulated subscriber,
use the service-bundle option.
Copyright © 2014, Juniper Networks, Inc.50
SRC 4.7.x Monitoring and Troubleshooting Guide
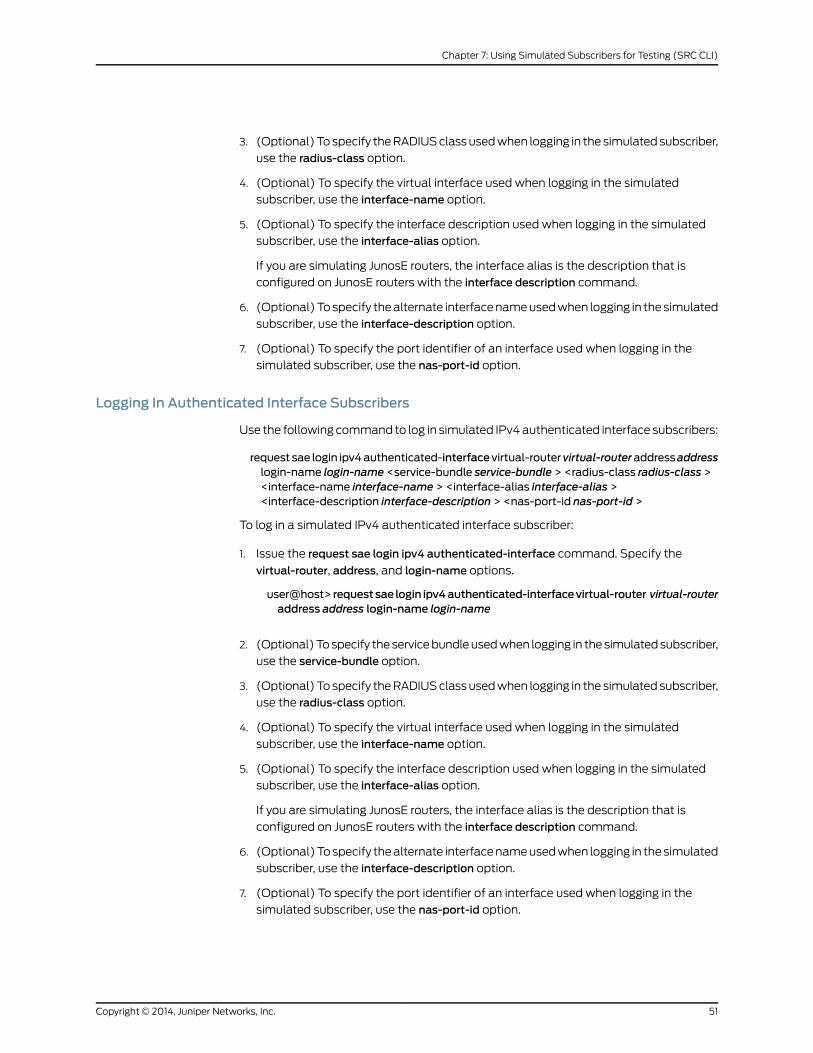
3. (Optional) To specify the RADIUS class used when logging in the simulated subscriber,
use the radius-class option.
4. (Optional) To specify the virtual interface used when logging in the simulated
subscriber, use the interface-name option.
5. (Optional) To specify the interface description used when logging in the simulated
subscriber, use the interface-alias option.
If you are simulating JunosE routers, the interface alias is the description that is
configured on JunosE routers with the interface description command.
6. (Optional) To specify the alternate interface name used when logging in the simulated
subscriber, use the interface-description option.
7. (Optional) To specify the port identifier of an interface used when logging in the
simulated subscriber, use the nas-port-id option.
Logging In Authenticated Interface Subscribers
Use the following command to log in simulated IPv4 authenticated interface subscribers:
request sae login ipv4authenticated-interfacevirtual-routervirtual-routeraddressaddresslogin-name login-name <service-bundle service-bundle > <radius-class radius-class ><interface-name interface-name > <interface-alias interface-alias ><interface-description interface-description > <nas-port-id nas-port-id >
To log in a simulated IPv4 authenticated interface subscriber:
1. Issue the request sae login ipv4 authenticated-interface command. Specify the
virtual-router, address, and login-name options.
user@host> requestsae login ipv4authenticated-interfacevirtual-router virtual-routeraddress address login-name login-name
2. (Optional) To specify the service bundle used when logging in the simulated subscriber,
use the service-bundle option.
3. (Optional) To specify the RADIUS class used when logging in the simulated subscriber,
use the radius-class option.
4. (Optional) To specify the virtual interface used when logging in the simulated
subscriber, use the interface-name option.
5. (Optional) To specify the interface description used when logging in the simulated
subscriber, use the interface-alias option.
If you are simulating JunosE routers, the interface alias is the description that is
configured on JunosE routers with the interface description command.
6. (Optional) To specify the alternate interface name used when logging in the simulated
subscriber, use the interface-description option.
7. (Optional) To specify the port identifier of an interface used when logging in the
simulated subscriber, use the nas-port-id option.
51Copyright © 2014, Juniper Networks, Inc.
Chapter 7: Using Simulated Subscribers for Testing (SRC CLI)

Logging In Unauthenticated DHCP Subscribers
Use the following command to log in simulated IPv4 unauthenticated DHCP subscribers:
request sae login ipv4 unauthenticated-dhcp virtual-router virtual-router address addressmac-addressmac-address <login-name login-name > <service-bundle service-bundle> <radius-class radius-class > <interface-name interface-name > <interface-aliasinterface-alias><interface-description interface-description><nas-port-idnas-port-id>
To log in a simulated IPv4 unauthenticated DHCP subscriber:
1. Issue the request sae login ipv4 unauthenticated-dhcp command. Specify the
virtual-router, address, and mac-address options.
user@host> request sae login ipv4unauthenticated-dhcpvirtual-router virtual-routeraddress addressmac-addressmac-address
2. (Optional) To specify the fully-qualified name used to log in the simulated subscriber,
use the login-name option.
3. (Optional) To specify the service bundle used when logging in the simulated subscriber,
use the service-bundle option.
4. (Optional) To specify the RADIUS class used when logging in the simulated subscriber,
use the radius-class option.
5. (Optional) To specify the virtual interface used when logging in the simulated
subscriber, use the interface-name option.
6. (Optional) To specify the interface description used when logging in the simulated
subscriber, use the interface-alias option.
If you are simulating JunosE routers, the interface alias is the description that is
configured on JunosE routers with the interface description command.
7. (Optional) To specify the alternate interface name used when logging in the simulated
subscriber, use the interface-description option.
8. (Optional) To specify the port identifier of an interface used when logging in the
simulated subscriber, use the nas-port-id option.
Logging In Unauthenticated Interface Subscribers
Use the following command to log in simulated IPv4 unauthenticated interface
subscribers:
requestsae login ipv4unauthenticated-interfacevirtual-routervirtual-router interface-nameinterface-name <address address > <login-name login-name > <service-bundleservice-bundle > <radius-class radius-class > <interface-alias interface-alias ><interface-description interface-description > <nas-port-id nas-port-id >
To log in a simulated IPv4 authenticated interface subscriber:
1. Issue the request sae login ipv4 authenticated-interface command. Specify the
virtual-router and interface-name options.
Copyright © 2014, Juniper Networks, Inc.52
SRC 4.7.x Monitoring and Troubleshooting Guide
user@host> requestsae login ipv4authenticated-interfacevirtual-router virtual-routerinterface-name interface-name
2. (Optional) To specify the IP address from which you log in the simulated subscriber,
use the address option.
3. (Optional) To specify the fully-qualified name used to log in the simulated subscriber,
use the login-name option.
4. (Optional) To specify the service bundle used when logging in the simulated subscriber,
use the service-bundle option.
5. (Optional) To specify the RADIUS class used when logging in the simulated subscriber,
use the radius-class option.
6. (Optional) To specify the interface description used when logging in the simulated
subscriber, use the interface-alias option.
If you are simulating JunosE routers, the interface alias is the description that is
configured on JunosE routers with the interface description command.
7. (Optional) To specify the alternate interface name used when logging in the simulated
subscriber, use the interface-description option.
8. (Optional) To specify the port identifier of an interface used when logging in the
simulated subscriber, use the nas-port-id option.
RelatedDocumentation
Logging Out Simulated Subscribers (SRC CLI) on page 53•
• Viewing Subscriber Sessions (SRC CLI) on page 53
• Commands to Manage Simulated Subscribers on page 49
• Simulated Subscribers Overview on page 49
Viewing Subscriber Sessions (SRC CLI)
Purpose View all subscriber sessions.
Action user@host> show sae subscribers
RelatedDocumentation
Logging Out Simulated Subscribers (SRC CLI) on page 53•
• Logging In Simulated Subscribers (SRC CLI) on page 50
Logging Out Simulated Subscribers (SRC CLI)
You can view subscribers who are logged in and then log out subscribers who are
accessible:
• Logging Out Subscribers by DN on page 54
• Logging Out Subscribers by IP Address on page 54
53Copyright © 2014, Juniper Networks, Inc.
Chapter 7: Using Simulated Subscribers for Testing (SRC CLI)
• Logging Out Subscribers by Login Name on page 54
• Logging Out Subscribers by Session ID on page 55
Logging Out Subscribers by DN
To log out subscribers who are accessible by DN:
1. Issue the showsaesubscribersdncommand to view the subscribers who are accessible
by DN.
2. Issue the request sae logout dn command to log out all subscribers who are accessible
by DN.
3. To log out specific subscribers, use the filter option and specify all or part of the DN
for the subscribers that you want to log out.
user@host> request sae logout dn filter filter
4. To specify that no confirmation is requested before the software logs out the
subscribers, use the force option.
user@host> request sae logout dn forceuser@host> request sae logout dn filter filter force
Logging Out Subscribers by IP Address
To log out subscribers who are accessible by IP address:
1. Issue theshowsaesubscribers ipcommand to view the subscribers who are accessible
by IP address.
2. Issue the request sae logout ip command to log out all subscribers who are accessible
by IP address.
3. To log out specific subscribers, use the filter option and specify the IP address for the
subscribers that you want to log out.
user@host> request sae logout ip filter filter
4. To specify that no confirmation is requested before the software logs out the
subscribers, use the force option.
user@host> request sae logout ip forceuser@host> request sae logout ip filter filter force
Logging Out Subscribers by Login Name
To log out subscribers who are accessible by login name:
1. Issue theshowsaesubscribers login-namecommand to view the subscribers accessible
by login name.
2. Issue the request sae logout login-namecommand to log out all subscribers accessible
by login name.
3. To log out specific subscribers, use the filter option and specify all or part of the login
name for the subscribers that you want to log out.
Copyright © 2014, Juniper Networks, Inc.54
SRC 4.7.x Monitoring and Troubleshooting Guide
user@host> request sae logout login-name filter filter
4. To specify that no confirmation is requested before the software logs out the
subscribers, use the force option.
user@host> request sae logout login-name forceuser@host> request sae logout login-name filter filter force
Logging Out Subscribers by Session ID
To log out subscribers who are accessible by session ID:
1. Issue the showsaesubscriberssession-idcommand to view the subscribers accessible
by session ID.
2. Issue the request sae logout session-id command to log out all subscribers accessible
by session ID.
3. To log out specific subscribers, use the filteroption and specify all or part of the session
ID for the subscribers that you want to log out.
user@host> request sae logout session-id filter filter
4. To specify that no confirmation is requested before the software logs out the
subscribers, use the force option.
user@host> request sae logout session-id forceuser@host> request sae logout session-id filter filter force
RelatedDocumentation
• Logging In Simulated Subscribers (SRC CLI) on page 50
• Viewing Subscriber Sessions (SRC CLI) on page 53
• Commands to Manage Simulated Subscribers on page 49
• Simulated Subscribers Overview on page 49
55Copyright © 2014, Juniper Networks, Inc.
Chapter 7: Using Simulated Subscribers for Testing (SRC CLI)

Copyright © 2014, Juniper Networks, Inc.56
SRC 4.7.x Monitoring and Troubleshooting Guide
PART 4
Using SNMP for Monitoring andTroubleshooting
• Creating Custom SNMP Monitors on page 59
• Configuring SNMP Chassis Alarms on page 71
• Configuring the SNMP Traps (SRC CLI) on page 79
• Understanding Traps on page 85
57Copyright © 2014, Juniper Networks, Inc.

Copyright © 2014, Juniper Networks, Inc.58
SRC 4.7.x Monitoring and Troubleshooting Guide
CHAPTER 8
Creating Custom SNMPMonitors
• SNMP Monitoring on C Series Controllers on page 59
• Configuration Statements for Customized SRC SNMP Monitors on page 61
• Configuring an SNMP Alarm on a C Series Controller (SRC CLI) on page 62
• Defining an Alarm for an SNMP Monitor That Compares Object Values (SRC
CLI) on page 63
• Defining an Alarm to Monitor the Status of an Object (SRC CLI) on page 64
• Defining an Alarm for an SNMP Monitor That Compares Values Against Thresholds
(SRC CLI) on page 65
• Defining a Discontinuity Check to Validate Delta Values (SRC CLI) on page 65
• Configuring an SNMPv3 Security Name for SNMP Monitoring (SRC CLI) on page 66
• Defining Events for Which SNMP Sends Notifications (SRC CLI) on page 66
• Defining Events That Set Values for SNMP MIB Objects (SRC CLI) on page 67
• Example: SNMP Monitoring of Multiple MIB Objects on page 68
SNMPMonitoring on C Series Controllers
You can create custom SNMP monitors to detect changes in MIB objects. Use custom
monitors to generate an alarm and take action in response to an alarm.
To configure a monitor, you define a condition that when met generates an SNMP
notification. You can define a monitor for any single MIB object (of type integer) supported
on a C Series Controller. These MIBs include Juniper Networks enterprise-specific objects
as well as standard MIB objects.
You can configure the following for custom monitors:
• Alarms—Define an alarm condition and an event to generate in response to the alarm.
An alarm identifies the object to be monitored, the frequency with which the monitor
retrieves a sample value for the object, and a condition that triggers an event.
• Events—Define the type of action (SNMP set or notification) to be taken in response
to an alarm condition. If you do not define an event for an alarm, SNMP sends the
notifications based on the monitor type.
59Copyright © 2014, Juniper Networks, Inc.
The SRC software supports the following types of alarm conditions for monitors:
• Boolean test—Compares a sample value with a specified value or range of values.
• Existence test—Monitors when an object appears, disappears, or changes value.
• Threshold test—Monitors when an object's value rises above or falls below specified
values.
A monitor supports only one type of alarm condition, or test, at a time. Each alarm can
use one of the following sampling methods:
• Absolute value—Uses the actual value of the object.
Existence tests support only absolute values.
• Delta value—Uses the difference between two sample values.
By using the delta value sampling method, you can configure SNMP to detect a
discontinuity in values to prevent false alarms caused by the value of a MIB object
being reset. At the end of a polling interval before the SNMP agent calculates a delta
value, SNMP checks the value of a MIB object called a discontinuity marker. If the value
of the discontinuity marker changes, SNMP does not perform the test for the associated
condition until the next polling interval.
For alarms that do not have a configured event, SNMP sends the following notifications
that are defined in RFC 2981—Event MIB (October 2000):
• Boolean or existence test—mteTriggerFired
• Threshold test (rising value)—mteTriggerRising
• Threshold test (falling value)—mteTriggerfalling
The default configuration for SNMP custom monitors assesses all objects in a MIB branch
based on the object identifier specified for the monitor. For this type of monitor, you can
configure SNMP notification MIB objects located in the same row as the object that
generates the event, as well as for a single object. You can create sophisticated monitors
by monitoring an entire branch, then creating notifications for multiple objects.
See the information about SRC MIBs on the Juniper Web site at
http://www.juniper.net/techpubs/software/management/src.
Also, see information about the disman event MIB in RFC 2981—Event MIB (October
2000).
RelatedDocumentation
SNMP Traps Overview on page 79•
• Configuring an SNMP Alarm on a C Series Controller (SRC CLI) on page 62
• Configuring an SNMPv3 Security Name for SNMP Monitoring (SRC CLI) on page 66
• Configuration Statements for Customized SRC SNMP Monitors on page 61
• Example: SNMP Monitoring of Multiple MIB Objects on page 68
Copyright © 2014, Juniper Networks, Inc.60
SRC 4.7.x Monitoring and Troubleshooting Guide
Configuration Statements for Customized SRC SNMPMonitors
Use the following configuration statements to configure the SNMP custom monitoring
at the [edit] hierarchy level.
snmpmonitor {security-name security-name;
}snmpmonitor alarm name{interval interval;sample-type (absolute-value | delta-value);ignore-startup-alarm;event event;variable variable;strict-oid;
}snmpmonitor alarm name boolean-test {comparison (equal | unequal | less | less-or- equal | greater | greater-or-equal);value value;
}snmpmonitor alarm name existence-test {type (present | absent | changed);
}snmpmonitor alarm name threshold-test {rising-threshold rising-threshold;falling-threshold falling-threshold;
}snmpmonitor alarm name delta-discontinuity-check {variable variable;
}snmpmonitor event namenotification {oid oid;strict-object [strict-object...];wildcarded-object [wildcarded-object...];
}snmpmonitor event name snmp-set {variable variable;value value;strict-oid;
}
For detailed information about each configuration statement, see the SRC PE CLI
Command Reference.
RelatedDocumentation
Configuring an SNMP Alarm on a C Series Controller (SRC CLI) on page 62•
• Example: SNMP Monitoring of Multiple MIB Objects on page 68
• Configuring an SNMPv3 Security Name for SNMP Monitoring (SRC CLI) on page 66
• SNMP Monitoring on C Series Controllers on page 59
61Copyright © 2014, Juniper Networks, Inc.
Chapter 8: Creating Custom SNMP Monitors
Configuring an SNMPAlarm on a C Series Controller (SRC CLI)
You can configure SNMP to establish alarms for custom monitors.
NOTE: Configure only onemonitor test at a time.
To configure an SNMP alarm:
1. Specify an SNMP username.
See “Configuring an SNMPv3 Security Name for SNMP Monitoring (SRC CLI)” on
page 66.
2. From configuration mode, access the configuration statements that configures an
alarm. For example:
[edit]user@host# edit snmpmonitor alarm saeHeapUsage
where saeHeapUsage is the name of the alarm.
3. Specify the number of seconds between which SNMP samples the value of an object.
For example:
[edit snmpmonitor alarm saeHeapUsage]user@host# set interval 60
4. Specify whether to sample the actual value of the object or the difference between
two values. For example, to use the actual of the object:
[edit snmpmonitor alarm saeHeapUsage]user@host# set sample-type absolute-value
If you set the sample type to delta-value, you can configure a discontinuity check.
See “Defining a Discontinuity Check to Validate Delta Values (SRC CLI)” on page 65.
5. (Optional) Indicate that an alarm not be sent when the alarm is initially activated.
[edit snmpmonitor alarmsaeHeapUsage]user@host# set ignore-startup-alarm
6. (Optional) Specify the name of the event to be generated in response to an alarm
condition. For example:
[edit snmpmonitor alarm saeHeapUsage]user@host# set event saeHeapUsageEvent
7. Specify the name or object identifier (OID) of the MIB variable to be monitored. For
example:
[edit snmpmonitor alarm saeHeapUsage]user@host# set variable juniSdxSaeHeapUsed.0
8. (Optional) Specify whether to monitor the SNMP object instance identified by a
variable attribute. To monitor the SNMP object instance specified by the variable
attribute:
Copyright © 2014, Juniper Networks, Inc.62
SRC 4.7.x Monitoring and Troubleshooting Guide
[edit snmpmonitor alarm saeHeapUsage]user@host# set strict-oid
Do not enable the strict-oidoption when you monitor a column of an SNMP MIB table.
An alarm for a column monitors the column on all entries of the table. If an entry for
an object in the column passes an alarm test, an event is generated for that object.
9. Configure a Boolean, existence, or threshold test for the alarm.
RelatedDocumentation
Defining an Alarm for an SNMP Monitor That Compares Object Values (SRC CLI) on
page 63
•
• Defining an Alarm to Monitor the Status of an Object (SRC CLI) on page 64
• Defining an Alarm for an SNMP Monitor That Compares Values Against Thresholds
(SRC CLI) on page 65
• Configuration Statements for Customized SRC SNMP Monitors on page 61
• SNMP Monitoring on C Series Controllers on page 59
Defining an Alarm for an SNMPMonitor That Compares Object Values (SRC CLI)
You can configure a monitor to compare a sample value to a specified value or range of
values by using one of the following types of comparisons:
• equal
• unequal
• less
• less-or-equal
• greater
• greater-or-equal
NOTE: Configure only onemonitor test at a time.
Before you define an alarm type, configure the associated SNMP alarm.
See “Configuring an SNMP Alarm on a C Series Controller (SRC CLI)” on page 62.
To configure a monitor to compare a sample to a specified value or range of values:
1. From configuration mode, access the configuration statements that configure SNMP
monitoring for a Boolean test. For example:
[edit]user@host# edit snmpmonitor alarm saeHeapUsage boolean-test
where saeHeapUsage is the name of the alarm.
63Copyright © 2014, Juniper Networks, Inc.
Chapter 8: Creating Custom SNMP Monitors
2. Specify the type of Boolean test. For example:
[edit snmpmonitor alarm saeHeapUsage boolean-test]user@host# set comparison greater
3. Define the value that the test uses. For example:
[edit snmpmonitor saeHeapUsage boolean-test]user@host# value 14000000
RelatedDocumentation
Defining an Alarm to Monitor the Status of an Object (SRC CLI) on page 64•
• Defining an Alarm for an SNMP Monitor That Compares Values Against Thresholds
(SRC CLI) on page 65
• Configuring an SNMP Alarm on a C Series Controller (SRC CLI) on page 62
• Configuration Statements for Customized SRC SNMP Monitors on page 61
• SNMP Monitoring on C Series Controllers on page 59
Defining an Alarm toMonitor the Status of an Object (SRC CLI)
You can configure a monitor to identify when a MIB object appears, disappears, or changes
value. If the test criteria are met, the test is considered to be successful.
NOTE: Configure only onemonitor test at a time.
Before you define an alarm type, configure the associated SNMP alarm.
See “Configuring an SNMP Alarm on a C Series Controller (SRC CLI)” on page 62.
To configure an alarm to monitor the status of an object:
• Specify the type of alarm: present, absent, or changed. For example for an alarm named
existence-alarm:
[edit snmpmonitor alarm existence-alarm existence-test]user@host# set type present
RelatedDocumentation
Defining an Alarm for an SNMP Monitor That Compares Object Values (SRC CLI) on
page 63
•
• Defining an Alarm for an SNMP Monitor That Compares Values Against Thresholds
(SRC CLI) on page 65
• Configuring an SNMP Alarm on a C Series Controller (SRC CLI) on page 62
• Configuration Statements for Customized SRC SNMP Monitors on page 61
• SNMP Monitoring on C Series Controllers on page 59
Copyright © 2014, Juniper Networks, Inc.64
SRC 4.7.x Monitoring and Troubleshooting Guide
Defining an Alarm for an SNMPMonitor That Compares Values Against Thresholds(SRC CLI)
You can configure a monitor to compare a sample value for a MIB object to a threshold
encountered as the value rises and a threshold encountered as the value falls.
NOTE: Configure only onemonitor test at a time.
Before you define an alarm type, configure the associated SNMP alarm.
See “Configuring an SNMP Alarm on a C Series Controller (SRC CLI)” on page 62.
To configure an alarm for a monitor that compares a sample value to an upper threshold
value and a lower threshold value:
1. Define the upper threshold against which to compare a rising sample value. For
example:
[edit snmpmonitor alarm thresholds threshold-test]user@host# set rising-threshold 2
2. Define the lower threshold against which to compare a falling sample value. For
example:
[edit snmpmonitor alarm threshold-alarm]user@host# set falling-threshold 1
RelatedDocumentation
Defining an Alarm for an SNMP Monitor That Compares Object Values (SRC CLI) on
page 63
•
• Defining an Alarm to Monitor the Status of an Object (SRC CLI) on page 64
• Configuring an SNMP Alarm on a C Series Controller (SRC CLI) on page 62
• Configuration Statements for Customized SRC SNMP Monitors on page 61
• SNMP Monitoring on C Series Controllers on page 59
Defining a Discontinuity Check to Validate Delta Values (SRC CLI)
You can configure a monitor to use a discontinuity check to prevent sending false alarms
when the value of the monitored object is reset between two samples.
Use a discontinuity check when the sampling type for a monitor is delta-value and the
test type is Boolean or threshold. You define a variable, called a discontinuity marker (a
MIB object used to validate the delta, or difference, between values). Typically, the marker
object is of the TimeTicks, DateAndTime, or Timestamp type.
To define a discontinuity check:
1. Configure an SNMP alarm with the sample type set to delta-value.
65Copyright © 2014, Juniper Networks, Inc.
Chapter 8: Creating Custom SNMP Monitors
See “Configuring an SNMP Alarm on a C Series Controller (SRC CLI)” on page 62.
2. From configuration mode, access the configuration statements that configures a
discontinuity check. For example, for an alarm named ifErrorsDelta:
[edit]user@host# edit snmpmonitor alarm ifErrorsDelta delta-discontinuity-check
3. Specify the name or object identifier (OID) of the discontinuity marker. For example:
[edit snmpmonitor alarm sequence-check ifErrorsDelta delta-discontinuity-check]user@host# set variable ifTable.ifEntry.ifLastChange
RelatedDocumentation
Defining Events That Set Values for SNMP MIB Objects (SRC CLI) on page 67•
• Example: SNMP Monitoring of Multiple MIB Objects on page 68
• Configuration Statements for Customized SRC SNMP Monitors on page 61
• SNMP Monitoring on C Series Controllers on page 59
Configuring an SNMPv3 Security Name for SNMPMonitoring (SRC CLI)
To configure an SNMPv3 security name to access a monitored MIB object:
1. From configuration mode, access the configuration statements that configure SNMP
monitoring.
[edit]user@host# edit snmpmonitor
2. Specify an SNMPv3 security name.
[edit snmpmonitor]user@host# set security-name your-security-name
RelatedDocumentation
Configuring an SNMP Alarm on a C Series Controller (SRC CLI) on page 62•
• Configuration Statements for Customized SRC SNMP Monitors on page 61
• SNMP Monitoring on C Series Controllers on page 59
Defining Events forWhich SNMPSends Notifications (SRC CLI)
NOTE: Do not define an event notification and an SNMP set for the sameevent.
To define an event for which SNMP sends a notification:
1. From configuration mode, access the configuration statements that configure SNMP
event notification and provide a name for the event. For example:
[edit]user@host# edit snmpmonitor event routerErrorEvent notification
Copyright © 2014, Juniper Networks, Inc.66
SRC 4.7.x Monitoring and Troubleshooting Guide
2. Specify the object identifier (OID) object identifier of the notification object. For
example:
[edit snmpmonitor event routerErrorEvent notification]user@host# set oid juniSdxMibs.24.2.1
3. (Optional) Allow wildcards in the OID to include instances of subidentifiers that
correspond to the monitored object. For example:
[edit snmpmonitor event routerErrorEvent notification notification]user@host# set wildcarded-object [juniSaeRouterMsgErrors,juniSaeRouterMsgTimeouts]
Alternatively, you can configure event notification to use a specific OID.
RelatedDocumentation
Configuring an SNMP Alarm on a C Series Controller (SRC CLI) on page 62•
• Example: SNMP Monitoring of Multiple MIB Objects on page 68
• Configuration Statements for Customized SRC SNMP Monitors on page 61
• SNMP Monitoring on C Series Controllers on page 59
Defining Events That Set Values for SNMPMIB Objects (SRC CLI)
You can configure SNMP to set the value of a MIB object in response to an SNMP event.
NOTE: Do not define an event notification and an SNMP set for the sameevent.
To define an event that sets the value for a MIB variable in response to an SNMP event:
1. From configuration mode, access the configuration statements that configure an
SNMP set for an event.
[edit]user@host# edit snmpmonitor event event-name snmp-set
2. Specify the object identifier (OID) of the MIB variable to set.
[edit snmpmonitor event event-name snmp-set]user@host# set oidOID
3. Specify the value for the object.
[edit snmpmonitor event event-name snmp-set]user@host# set value value
4. (Optional) Specify whether the software monitors only the OID specified by the
variable option. If you do not set this option, the index of the object triggering the alarm
is appended to the variable to be set.
[edit snmpmonitor event event-name snmp-set]user@host# set strict-oid
67Copyright © 2014, Juniper Networks, Inc.
Chapter 8: Creating Custom SNMP Monitors
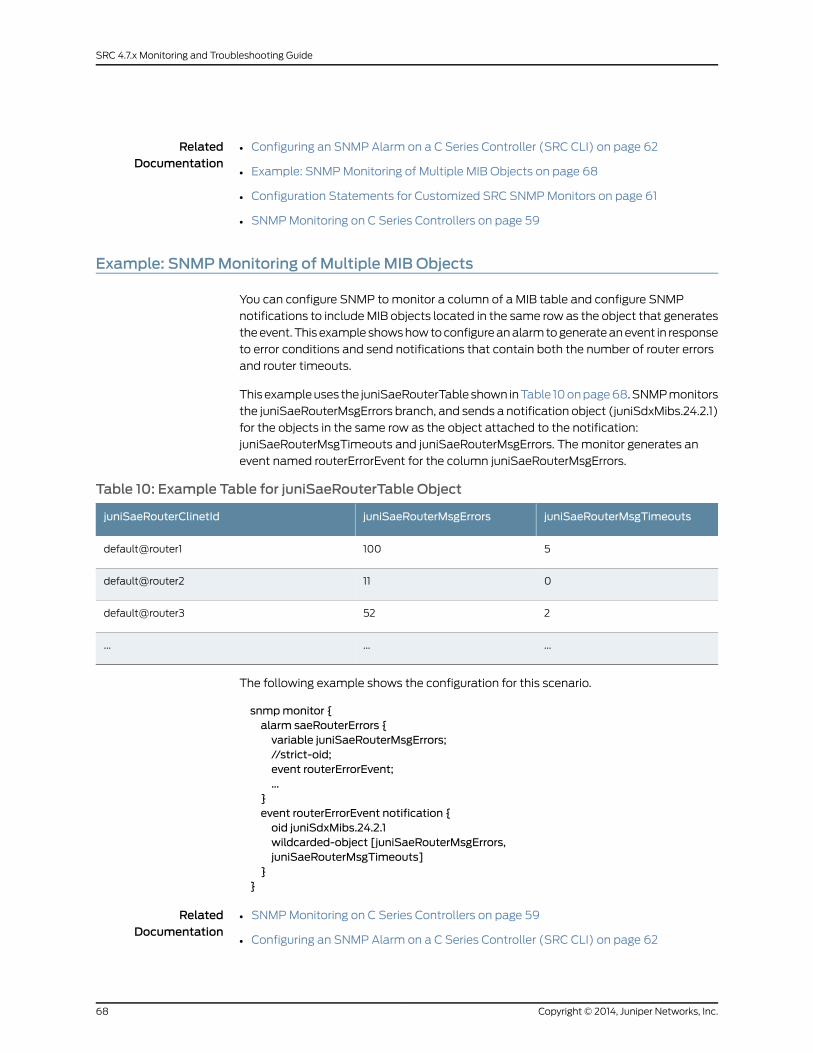
RelatedDocumentation
Configuring an SNMP Alarm on a C Series Controller (SRC CLI) on page 62•
• Example: SNMP Monitoring of Multiple MIB Objects on page 68
• Configuration Statements for Customized SRC SNMP Monitors on page 61
• SNMP Monitoring on C Series Controllers on page 59
Example: SNMPMonitoring of Multiple MIB Objects
You can configure SNMP to monitor a column of a MIB table and configure SNMP
notifications to include MIB objects located in the same row as the object that generates
the event. This example shows how to configure an alarm to generate an event in response
to error conditions and send notifications that contain both the number of router errors
and router timeouts.
This example uses the juniSaeRouterTable shown in Table 10 on page 68. SNMP monitors
the juniSaeRouterMsgErrors branch, and sends a notification object (juniSdxMibs.24.2.1)
for the objects in the same row as the object attached to the notification:
juniSaeRouterMsgTimeouts and juniSaeRouterMsgErrors. The monitor generates an
event named routerErrorEvent for the column juniSaeRouterMsgErrors.
Table 10: Example Table for juniSaeRouterTable Object
juniSaeRouterMsgTimeoutsjuniSaeRouterMsgErrorsjuniSaeRouterClinetId
5100default@router1
011default@router2
252default@router3
.........
The following example shows the configuration for this scenario.
snmpmonitor {alarm saeRouterErrors {variable juniSaeRouterMsgErrors;//strict-oid;event routerErrorEvent;…
}event routerErrorEvent notification {oid juniSdxMibs.24.2.1wildcarded-object [juniSaeRouterMsgErrors,juniSaeRouterMsgTimeouts]
}}
RelatedDocumentation
• SNMP Monitoring on C Series Controllers on page 59
• Configuring an SNMP Alarm on a C Series Controller (SRC CLI) on page 62
Copyright © 2014, Juniper Networks, Inc.68
SRC 4.7.x Monitoring and Troubleshooting Guide

• Configuration Statements for Customized SRC SNMP Monitors on page 61
69Copyright © 2014, Juniper Networks, Inc.
Chapter 8: Creating Custom SNMP Monitors

Copyright © 2014, Juniper Networks, Inc.70
SRC 4.7.x Monitoring and Troubleshooting Guide
CHAPTER 9
Configuring SNMP Chassis Alarms
• SNMP Chassis Alarms on a C Series Controller on page 71
• Configuring SNMP Chassis Alarms (SRC CLI) on page 72
• Defining Alarm Thresholds for Battery Voltage Sensors on page 72
• Defining Alarm Thresholds for CPU Sensors on page 73
• Defining Alarm Thresholds for Fan Speed Sensors on page 75
• Defining Alarm Thresholds for System Temperature Sensors on page 76
• Defining Alarm Thresholds for Voltage Sensors on page 77
SNMPChassis Alarms on a C Series Controller
You can configure SNMP to establish built-in chassis alarms that monitor the sensors
on C Series Controllers. The chassis alarms are preconfigured SNMP monitors that detect
changes in the MIB objects described in Juniper-SDX-CHASSIS-TRAP-MIB (Chassis Trap
MIB). The chassis alarms are configured to use the Boolean test condition and absolute
value sampling method. Each time you start the SNMP agent and you have enabled
chassis alarms, the initial action is to raise the clear trap for all chassis sensors.
You cannot delete chassis alarms, but you can disable them. You can modify the time
interval between which SNMP samples the value for the chassis alarms. You can also
define the alarm thresholds for each chassis alarm.
NOTE: If you want to use the built-in chassis alarms, youmust delete anycustom SNMPmonitors that you configured to detect changes in theJuniper-SDX-CHASSIS-TRAP-MIBMIB objects.
To configure the chassis alarms, youmust set the editing level to expert.
RelatedDocumentation
Configuring SNMP Chassis Alarms (SRC CLI) on page 72•
• SNMP Monitoring on C Series Controllers on page 59
71Copyright © 2014, Juniper Networks, Inc.
Configuring SNMPChassis Alarms (SRC CLI)
To configure SNMP chassis alarms:
1. Set the editing level for the CLI to expert.
user@host> set cli level expert
2. From configuration mode, access the configuration statement that configures the
chassis alarms.
[edit]user@host# edit snmpmonitor chassis-alarm
3. (Optional) Disable all chassis alarms. You cannot delete the chassis alarms.
[edit snmpmonitor chassis-alarm]user@host# set disable
4. (Optional) Specify the number of seconds between which SNMP samples the value
of an object. For example:
[edit snmpmonitor chassis-alarm]user@host# set interval 60
RelatedDocumentation
Defining Alarm Thresholds for Battery Voltage Sensors on page 72•
• Defining Alarm Thresholds for CPU Sensors on page 73
• Defining Alarm Thresholds for Fan Speed Sensors on page 75
• Defining Alarm Thresholds for System Temperature Sensors on page 76
• SNMP Chassis Alarms on a C Series Controller on page 71
Defining Alarm Thresholds for Battery Voltage Sensors
To configure SNMP chassis alarm thresholds for battery voltage sensors:
1. Set the editing level for the CLI to expert.
user@host> set cli level expert
2. From configuration mode, access the configuration statement that defines the
thresholds for battery voltage sensors.
[edit]user@host# edit snmpmonitor chassis-alarm battery-voltage
3. (Optional) Specify the lower threshold for the minor alarm. For example:
[edit snmpmonitor chassis-alarm battery-voltage]user@host# set below-minor 3024
4. (Optional) Specify the lower threshold for the major alarm. For example:
[edit snmpmonitor chassis-alarm battery-voltage]user@host# set below-major 3008
Copyright © 2014, Juniper Networks, Inc.72
SRC 4.7.x Monitoring and Troubleshooting Guide
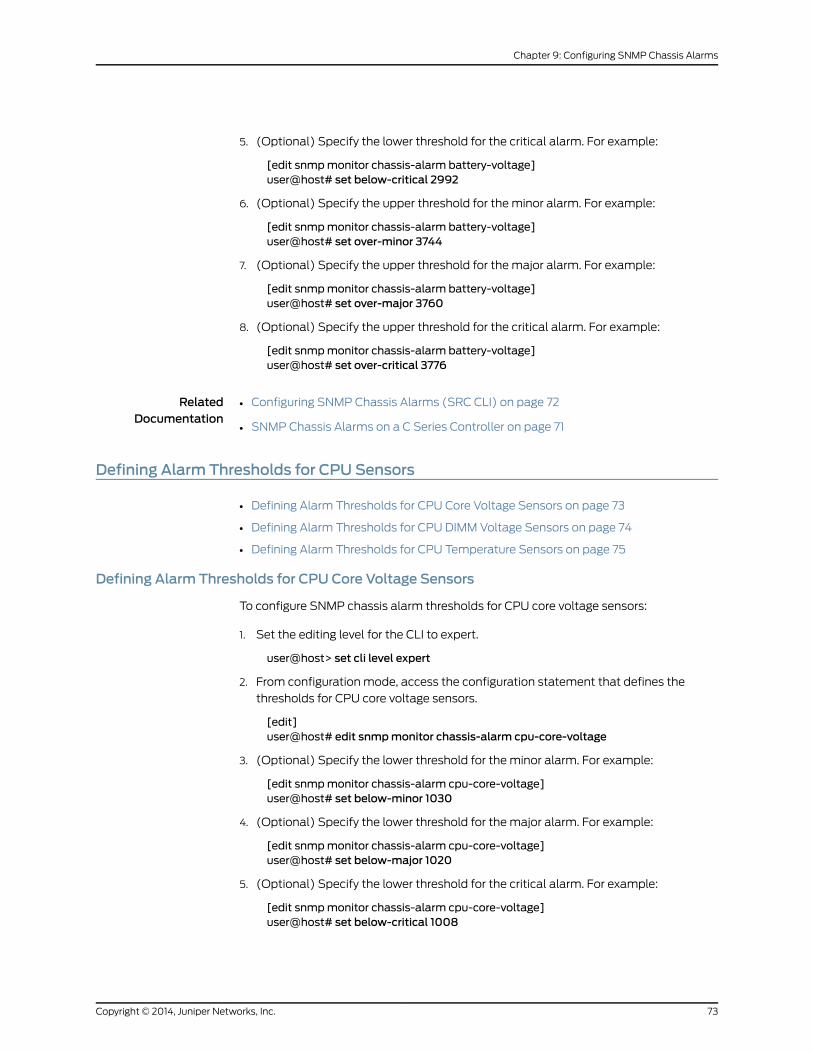
5. (Optional) Specify the lower threshold for the critical alarm. For example:
[edit snmpmonitor chassis-alarm battery-voltage]user@host# set below-critical 2992
6. (Optional) Specify the upper threshold for the minor alarm. For example:
[edit snmpmonitor chassis-alarm battery-voltage]user@host# set over-minor 3744
7. (Optional) Specify the upper threshold for the major alarm. For example:
[edit snmpmonitor chassis-alarm battery-voltage]user@host# set over-major 3760
8. (Optional) Specify the upper threshold for the critical alarm. For example:
[edit snmpmonitor chassis-alarm battery-voltage]user@host# set over-critical 3776
RelatedDocumentation
Configuring SNMP Chassis Alarms (SRC CLI) on page 72•
• SNMP Chassis Alarms on a C Series Controller on page 71
Defining Alarm Thresholds for CPU Sensors
• Defining Alarm Thresholds for CPU Core Voltage Sensors on page 73
• Defining Alarm Thresholds for CPU DIMM Voltage Sensors on page 74
• Defining Alarm Thresholds for CPU Temperature Sensors on page 75
Defining Alarm Thresholds for CPU Core Voltage Sensors
To configure SNMP chassis alarm thresholds for CPU core voltage sensors:
1. Set the editing level for the CLI to expert.
user@host> set cli level expert
2. From configuration mode, access the configuration statement that defines the
thresholds for CPU core voltage sensors.
[edit]user@host# edit snmpmonitor chassis-alarm cpu-core-voltage
3. (Optional) Specify the lower threshold for the minor alarm. For example:
[edit snmpmonitor chassis-alarm cpu-core-voltage]user@host# set below-minor 1030
4. (Optional) Specify the lower threshold for the major alarm. For example:
[edit snmpmonitor chassis-alarm cpu-core-voltage]user@host# set below-major 1020
5. (Optional) Specify the lower threshold for the critical alarm. For example:
[edit snmpmonitor chassis-alarm cpu-core-voltage]user@host# set below-critical 1008
73Copyright © 2014, Juniper Networks, Inc.
Chapter 9: Configuring SNMP Chassis Alarms

6. (Optional) Specify the upper threshold for the minor alarm. For example:
[edit snmpmonitor chassis-alarm cpu-core-voltage]user@host# set over-minor 1728
7. (Optional) Specify the upper threshold for the major alarm. For example:
[edit snmpmonitor chassis-alarm cpu-core-voltage]user@host# set over-major 1740
8. (Optional) Specify the upper threshold for the critical alarm. For example:
[edit snmpmonitor chassis-alarm cpu-core-voltage]user@host# set over-critical 1752
Defining Alarm Thresholds for CPUDIMMVoltage Sensors
To configure SNMP chassis alarm thresholds for CPU DIMM voltage sensors:
1. Set the editing level for the CLI to expert.
user@host> set cli level expert
2. From configuration mode, access the configuration statement that defines the
thresholds for CPU DIMM voltage sensors.
[edit]user@host# edit snmpmonitor chassis-alarm cpu-dimm-voltage
3. (Optional) Specify the lower threshold for the minor alarm. For example:
[edit snmpmonitor chassis-alarm cpu-dimm-voltage]user@host# set below-minor 2292
4. (Optional) Specify the lower threshold for the major alarm. For example:
[edit snmpmonitor chassis-alarm cpu-dimm-voltage]user@host# set below-major 2280
5. (Optional) Specify the lower threshold for the critical alarm. For example:
[edit snmpmonitor chassis-alarm cpu-dimm-voltage]user@host# set below-critical 2268
6. (Optional) Specify the upper threshold for the minor alarm. For example:
[edit snmpmonitor chassis-alarm cpu-dimm-voltage]user@host# set over-minor 2832
7. (Optional) Specify the upper threshold for the major alarm. For example:
[edit snmpmonitor chassis-alarm cpu-dimm-voltage]user@host# set over-major 2844
8. (Optional) Specify the upper threshold for the critical alarm. For example:
[edit snmpmonitor chassis-alarm cpu-dimm-voltage]user@host# set over-critical 2856
Copyright © 2014, Juniper Networks, Inc.74
SRC 4.7.x Monitoring and Troubleshooting Guide
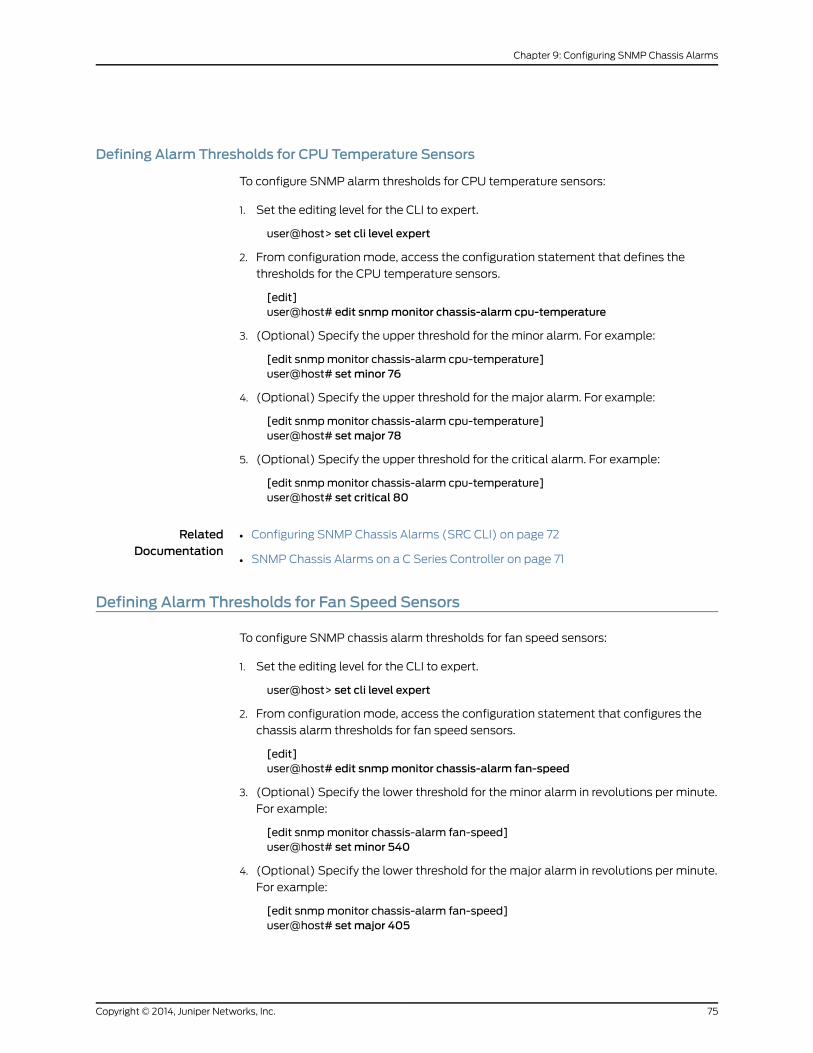
Defining Alarm Thresholds for CPU Temperature Sensors
To configure SNMP alarm thresholds for CPU temperature sensors:
1. Set the editing level for the CLI to expert.
user@host> set cli level expert
2. From configuration mode, access the configuration statement that defines the
thresholds for the CPU temperature sensors.
[edit]user@host# edit snmpmonitor chassis-alarm cpu-temperature
3. (Optional) Specify the upper threshold for the minor alarm. For example:
[edit snmpmonitor chassis-alarm cpu-temperature]user@host# setminor 76
4. (Optional) Specify the upper threshold for the major alarm. For example:
[edit snmpmonitor chassis-alarm cpu-temperature]user@host# setmajor 78
5. (Optional) Specify the upper threshold for the critical alarm. For example:
[edit snmpmonitor chassis-alarm cpu-temperature]user@host# set critical 80
RelatedDocumentation
Configuring SNMP Chassis Alarms (SRC CLI) on page 72•
• SNMP Chassis Alarms on a C Series Controller on page 71
Defining Alarm Thresholds for Fan Speed Sensors
To configure SNMP chassis alarm thresholds for fan speed sensors:
1. Set the editing level for the CLI to expert.
user@host> set cli level expert
2. From configuration mode, access the configuration statement that configures the
chassis alarm thresholds for fan speed sensors.
[edit]user@host# edit snmpmonitor chassis-alarm fan-speed
3. (Optional) Specify the lower threshold for the minor alarm in revolutions per minute.
For example:
[edit snmpmonitor chassis-alarm fan-speed]user@host# setminor 540
4. (Optional) Specify the lower threshold for the major alarm in revolutions per minute.
For example:
[edit snmpmonitor chassis-alarm fan-speed]user@host# setmajor 405
75Copyright © 2014, Juniper Networks, Inc.
Chapter 9: Configuring SNMP Chassis Alarms
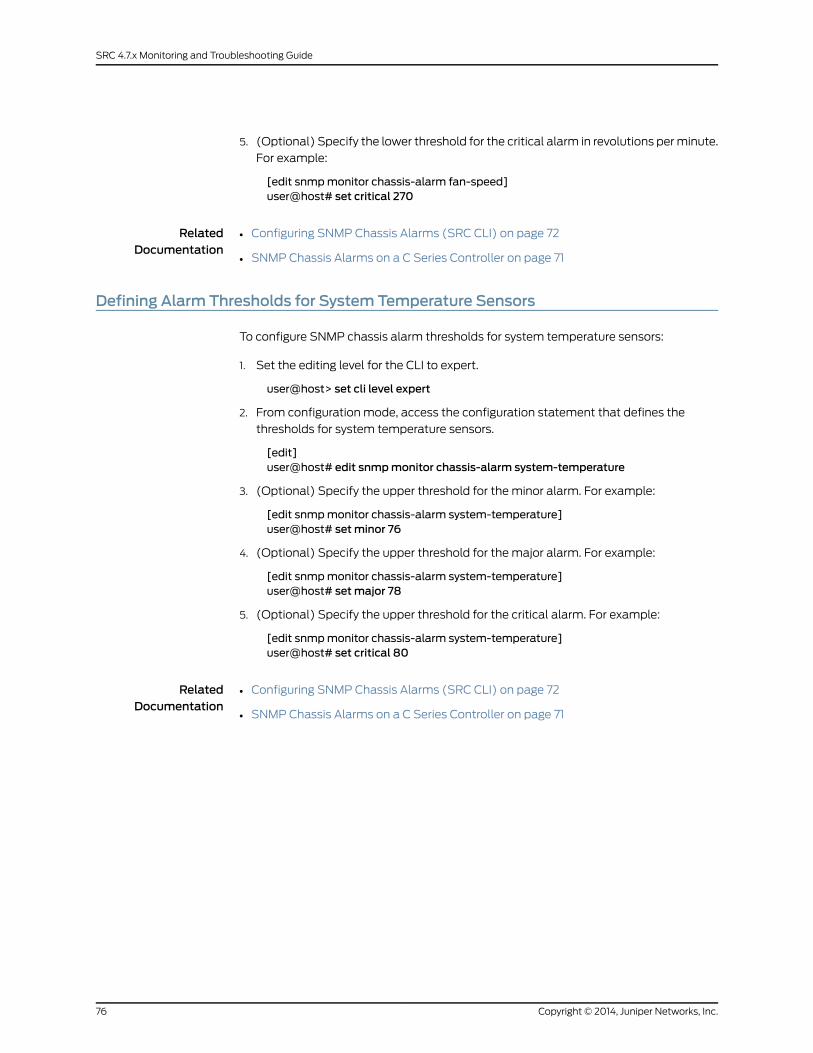
5. (Optional) Specify the lower threshold for the critical alarm in revolutions per minute.
For example:
[edit snmpmonitor chassis-alarm fan-speed]user@host# set critical 270
RelatedDocumentation
Configuring SNMP Chassis Alarms (SRC CLI) on page 72•
• SNMP Chassis Alarms on a C Series Controller on page 71
Defining Alarm Thresholds for System Temperature Sensors
To configure SNMP chassis alarm thresholds for system temperature sensors:
1. Set the editing level for the CLI to expert.
user@host> set cli level expert
2. From configuration mode, access the configuration statement that defines the
thresholds for system temperature sensors.
[edit]user@host# edit snmpmonitor chassis-alarm system-temperature
3. (Optional) Specify the upper threshold for the minor alarm. For example:
[edit snmpmonitor chassis-alarm system-temperature]user@host# setminor 76
4. (Optional) Specify the upper threshold for the major alarm. For example:
[edit snmpmonitor chassis-alarm system-temperature]user@host# setmajor 78
5. (Optional) Specify the upper threshold for the critical alarm. For example:
[edit snmpmonitor chassis-alarm system-temperature]user@host# set critical 80
RelatedDocumentation
Configuring SNMP Chassis Alarms (SRC CLI) on page 72•
• SNMP Chassis Alarms on a C Series Controller on page 71
Copyright © 2014, Juniper Networks, Inc.76
SRC 4.7.x Monitoring and Troubleshooting Guide
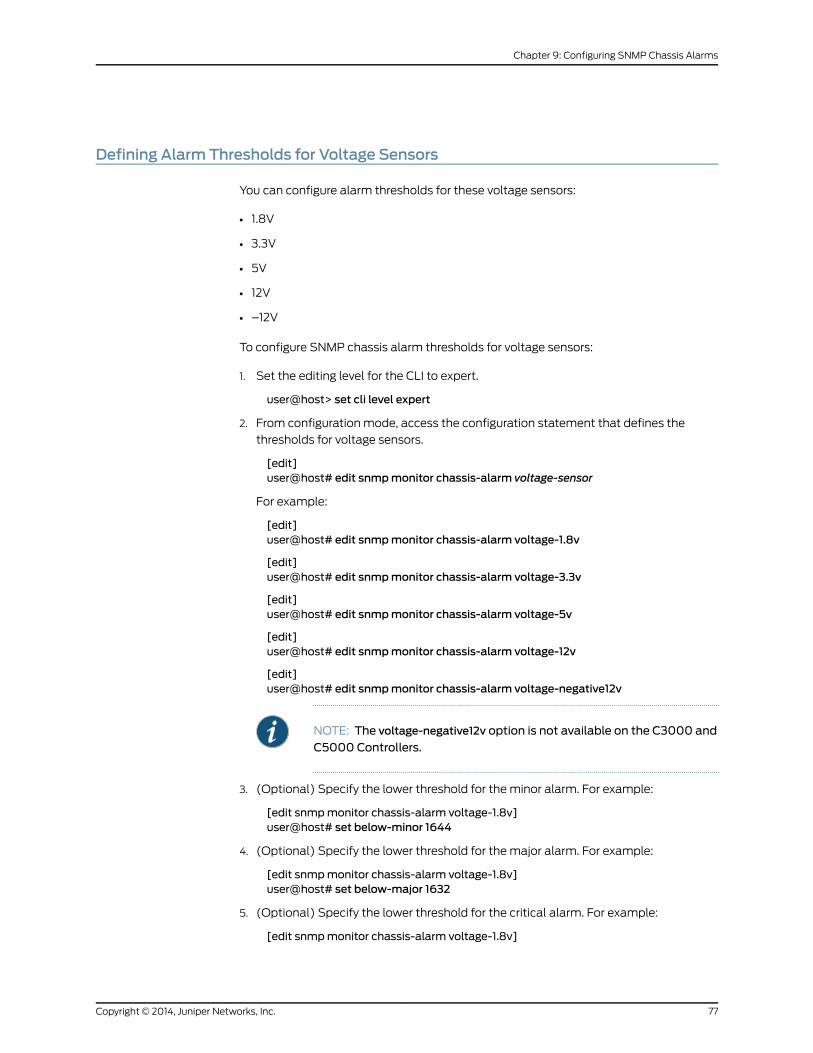
Defining Alarm Thresholds for Voltage Sensors
You can configure alarm thresholds for these voltage sensors:
• 1.8V
• 3.3V
• 5V
• 12V
• –12V
To configure SNMP chassis alarm thresholds for voltage sensors:
1. Set the editing level for the CLI to expert.
user@host> set cli level expert
2. From configuration mode, access the configuration statement that defines the
thresholds for voltage sensors.
[edit]user@host# edit snmpmonitor chassis-alarm voltage-sensor
For example:
[edit]user@host# edit snmpmonitor chassis-alarm voltage-1.8v
[edit]user@host# edit snmpmonitor chassis-alarm voltage-3.3v
[edit]user@host# edit snmpmonitor chassis-alarm voltage-5v
[edit]user@host# edit snmpmonitor chassis-alarm voltage-12v
[edit]user@host# edit snmpmonitor chassis-alarm voltage-negative12v
NOTE: The voltage-negative12v option is not available on the C3000 and
C5000 Controllers.
3. (Optional) Specify the lower threshold for the minor alarm. For example:
[edit snmpmonitor chassis-alarm voltage-1.8v]user@host# set below-minor 1644
4. (Optional) Specify the lower threshold for the major alarm. For example:
[edit snmpmonitor chassis-alarm voltage-1.8v]user@host# set below-major 1632
5. (Optional) Specify the lower threshold for the critical alarm. For example:
[edit snmpmonitor chassis-alarm voltage-1.8v]
77Copyright © 2014, Juniper Networks, Inc.
Chapter 9: Configuring SNMP Chassis Alarms
user@host# set below-critical 1620
6. (Optional) Specify the upper threshold for the minor alarm. For example:
[edit snmpmonitor chassis-alarm voltage-1.8v]user@host# set over-minor 2028
7. (Optional) Specify the upper threshold for the major alarm. For example:
[edit snmpmonitor chassis-alarm voltage-1.8v]user@host# set over-major 2040
8. (Optional) Specify the upper threshold for the critical alarm. For example:
[edit snmpmonitor chassis-alarm voltage-1.8v]user@host# set over-critical 2052
RelatedDocumentation
• Configuring SNMP Chassis Alarms (SRC CLI) on page 72
• SNMP Chassis Alarms on a C Series Controller on page 71
Copyright © 2014, Juniper Networks, Inc.78
SRC 4.7.x Monitoring and Troubleshooting Guide
CHAPTER 10
Configuring the SNMP Traps (SRC CLI)
• SNMP Traps Overview on page 79
• Configuration Statements for the SNMP Traps on page 81
• Configuring Performance Traps (SRC CLI) on page 82
• Configuring Event Traps (SRC CLI) on page 83
SNMP Traps Overview
The SNMP agent provides network management systems with SNMP trap notifications
in case of component failure or when critical resources are out of configurable limits.
This information is captured in a Management Information Base (MIB).
The SNMP agent can be run on each SRC host. It can monitor any SRC process running
on the host and is preconfigured to monitor SRC processes. Additionally, it provides
detailed monitoring and configuration of SRC server components.
MIBs
The SNMP agent monitors MIB variables. Most variables measure the performance of
the system. Some variables are counters, such as the saeLogins variable, which counts
the total number of subscriber logins since startup. Some variables are gauges, and their
numbers go up and down, such as the saeHeapUsed variable, which measures the Java
Virtual Machine heap that is currently in use.
A MIB defines a trap type that is associated with many MIB variables. For traps based on
counters, the SNMP agent periodically polls each specified variable. It takes the difference
between the previous and current values of the variable and compares that difference
with the threshold. If the difference has moved up across thresholds, the SNMP agent
sends a trap raising an alarm (minor, major, or critical) for the highest threshold crossed
to all configured receivers. If the difference has moved down across thresholds, the agent
sends a trap clearing the alarm of the lowest threshold crossed.
You can configure the polling interval between samples. If you change the polling interval,
also adjust the thresholds. For instance, if the critical threshold for SAE logins is 1,000
and the interval is 60 seconds, then a critical alarm is raised if there are more than 1,000
logins in 60 seconds. But if you change the interval to 600 seconds, then you would need
to change the threshold to 10,000 to have the same meaning.
79Copyright © 2014, Juniper Networks, Inc.
For traps based on gauges, the previous value is not needed; the current value is compared
with the thresholds.
In the trap tables, there is a field named R/AV, where R means rate, and AV means
absolute value. Rate is used for variables that are counters, and it measures the rate of
change of the counter. Absolute value is used for variables that are gauges.
ConfigurationMIBs
The SRC software has a limited number of MIB variables that can be set, such as variables
to shut down or start components.
MIB Structure
The SNMP agent MIB uses the following Juniper Networks MIBs:
• Juniper-SDX-ACP-MIB—SRC ACP MIB
• Juniper-SDX-CHASSIS-MIB—Chassis MIB (for C Series Controllers)
• Juniper-SDX-DES-MIB—Directory eventing system MIB
• Juniper-SDX-GW-MIB—Gateway applications MIB (includes the NIC MIB)
• Juniper-SDX-JPS-MIB—JPS MIB
• Juniper-SDX-LICENSE-MIB—Licensing MIB
• Juniper-SDX-MIB—Main Juniper Networks SDX MIB
• Juniper-SDX-MIBS—Collection of Juniper Networks SDX MIB modules
• Juniper-SDX-POM-MIB—Policy management MIB
• Juniper-SDX-REDIRECTOR-MIB—Redirector MIB
• Juniper-SDX-SAE-MIB—SAE MIB
• Juniper-SDX-TC-MIB—Textual conventions MIB
• Juniper-SDX-TRAP-MIB—SRC trap definition MIB
• Juniper-UNI-SMI—Base SMI MIB
MIB Location
The MIBs are located on the Juniper Networks Web site at
http://www.juniper.net/techpubs/software/management/src
Traps
Traps are individual events that the SNMP agent can monitor, such as the number of
timeouts or errors that have occurred or connections that have opened or closed. There
are two types of traps:
• Performance traps—Traps that poll MIB variables associated with the trap to determine
whether a variable has crossed configured thresholds. If the variable crosses a threshold,
an alarm is triggered and a trap is sent to the list of configured receivers.
Copyright © 2014, Juniper Networks, Inc.80
SRC 4.7.x Monitoring and Troubleshooting Guide
• Event traps—Traps that are sent when an event occurs; for example, when a connection
is established or closed.
SNMP Traps and Informs
SNMP notifications can be sent as traps or inform requests. SNMP traps are unconfirmed
notifications. SNMP informs are confirmed notifications.
SNMP traps are defined in either standard or enterprise-specific MIBs. The standard and
enterprise-specific traps are compiled into the network management software.
With traps, the receiver does not send any acknowledgment when it receives a trap and
the sender cannot determine if the trap was received. To increase reliability, SNMP informs
are supported in SNMPv3. With an inform, the receiver acknowledges the message with
a response.
For information on system logging severity levels for SNMP traps, see “Categories and
Severity Levels for Event Messages” on page 7.
RelatedDocumentation
Configuring the SRC SNMP Agent (SRC CLI)•
• SAE Performance Traps on page 88
• Accounting Performance Traps on page 90
• Authentication Performance Traps on page 92
• NIC Performance Traps on page 93
• Router Driver Performance Traps on page 94
• System Management Performance Traps on page 96
• Policy Engine Performance Traps on page 96
• SRC Redirector Performance Traps on page 97
• SRC ACP Performance Traps on page 97
• JPS Performance Traps on page 98
Configuration Statements for the SNMP Traps
Use the following configuration statements to configure the SNMP traps and the
notification target at the [edit] hierarchy level.
snmp notify alarm category category-name ...snmp notify alarm category category-name alarm alarm-name {interval interval;critical critical;majormajor;minorminor;
}snmp notify event category category-name ...snmp notify event category category-name event event-name ...snmp notify target target-name {
81Copyright © 2014, Juniper Networks, Inc.
Chapter 10: Configuring the SNMP Traps (SRC CLI)
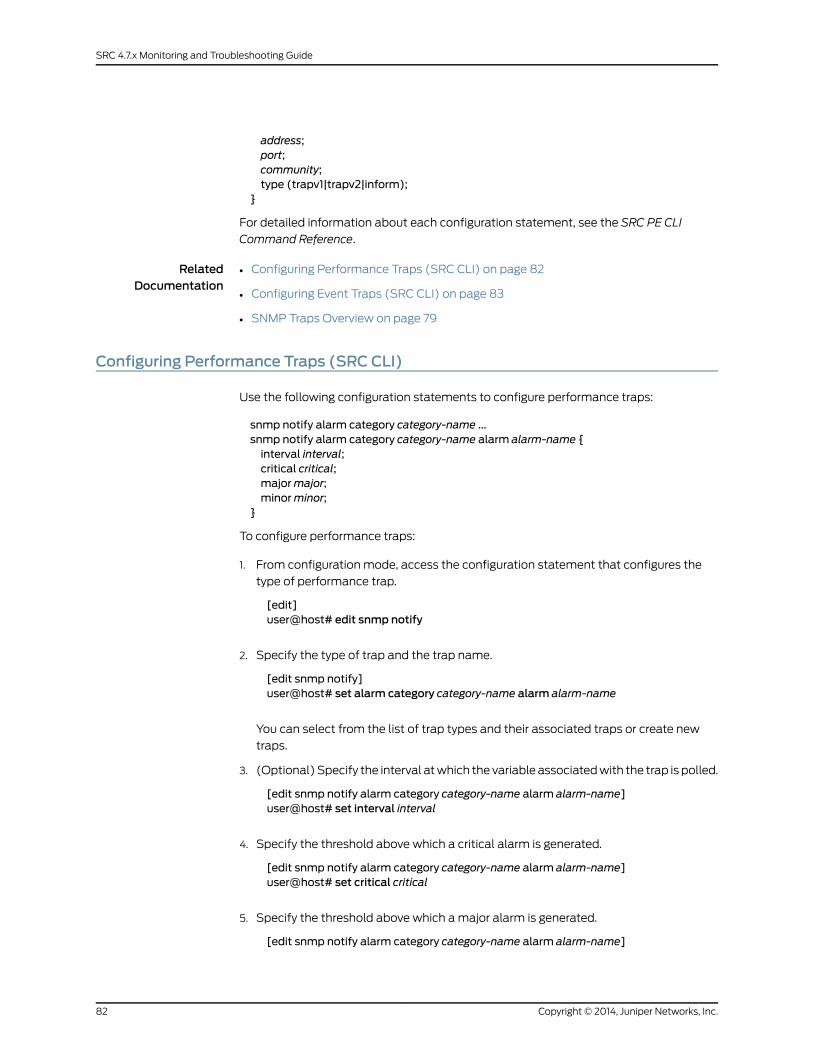
address;port;community;type (trapv1|trapv2|inform);
}
For detailed information about each configuration statement, see the SRC PE CLI
Command Reference.
RelatedDocumentation
Configuring Performance Traps (SRC CLI) on page 82•
• Configuring Event Traps (SRC CLI) on page 83
• SNMP Traps Overview on page 79
Configuring Performance Traps (SRC CLI)
Use the following configuration statements to configure performance traps:
snmp notify alarm category category-name ...snmp notify alarm category category-name alarm alarm-name {interval interval;critical critical;majormajor;minorminor;
}
To configure performance traps:
1. From configuration mode, access the configuration statement that configures the
type of performance trap.
[edit]user@host# edit snmp notify
2. Specify the type of trap and the trap name.
[edit snmp notify]user@host# set alarm category category-name alarm alarm-name
You can select from the list of trap types and their associated traps or create new
traps.
3. (Optional) Specify the interval at which the variable associated with the trap is polled.
[edit snmp notify alarm category category-name alarm alarm-name]user@host# set interval interval
4. Specify the threshold above which a critical alarm is generated.
[edit snmp notify alarm category category-name alarm alarm-name]user@host# set critical critical
5. Specify the threshold above which a major alarm is generated.
[edit snmp notify alarm category category-name alarm alarm-name]
Copyright © 2014, Juniper Networks, Inc.82
SRC 4.7.x Monitoring and Troubleshooting Guide
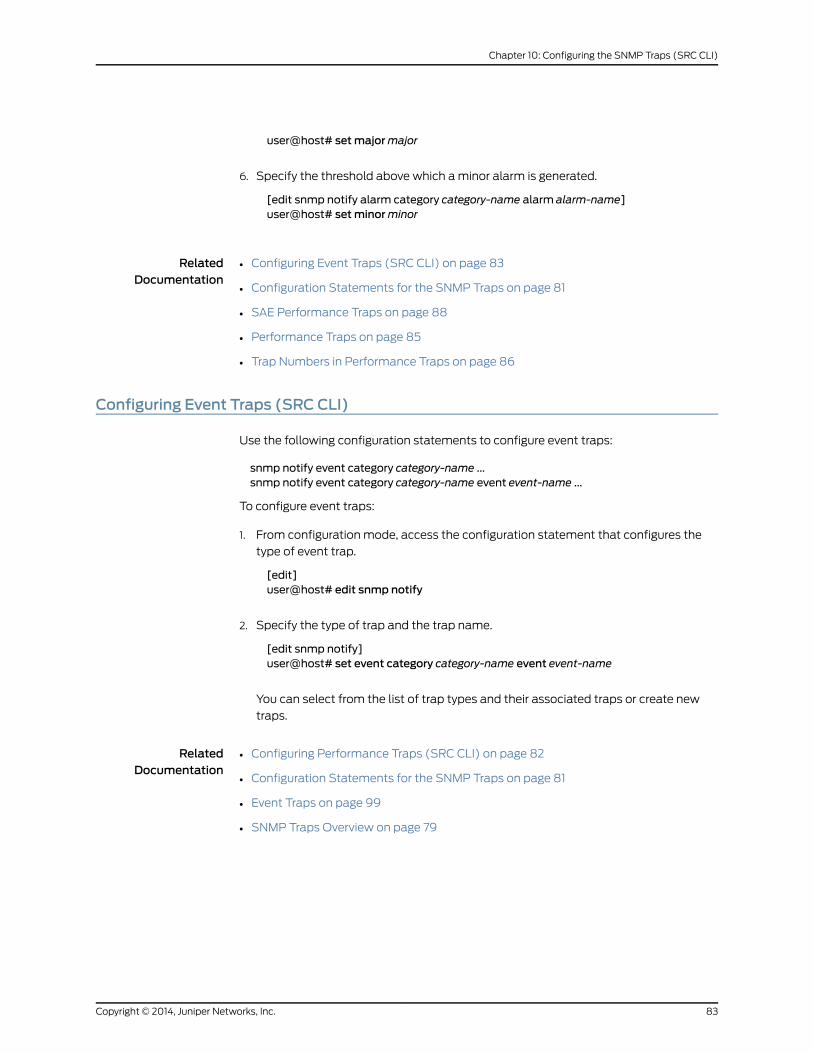
user@host# setmajormajor
6. Specify the threshold above which a minor alarm is generated.
[edit snmp notify alarm category category-name alarm alarm-name]user@host# setminorminor
RelatedDocumentation
Configuring Event Traps (SRC CLI) on page 83•
• Configuration Statements for the SNMP Traps on page 81
• SAE Performance Traps on page 88
• Performance Traps on page 85
• Trap Numbers in Performance Traps on page 86
Configuring Event Traps (SRC CLI)
Use the following configuration statements to configure event traps:
snmp notify event category category-name ...snmp notify event category category-name event event-name ...
To configure event traps:
1. From configuration mode, access the configuration statement that configures the
type of event trap.
[edit]user@host# edit snmp notify
2. Specify the type of trap and the trap name.
[edit snmp notify]user@host# set event category category-name event event-name
You can select from the list of trap types and their associated traps or create new
traps.
RelatedDocumentation
• Configuring Performance Traps (SRC CLI) on page 82
• Configuration Statements for the SNMP Traps on page 81
• Event Traps on page 99
• SNMP Traps Overview on page 79
83Copyright © 2014, Juniper Networks, Inc.
Chapter 10: Configuring the SNMP Traps (SRC CLI)

Copyright © 2014, Juniper Networks, Inc.84
SRC 4.7.x Monitoring and Troubleshooting Guide
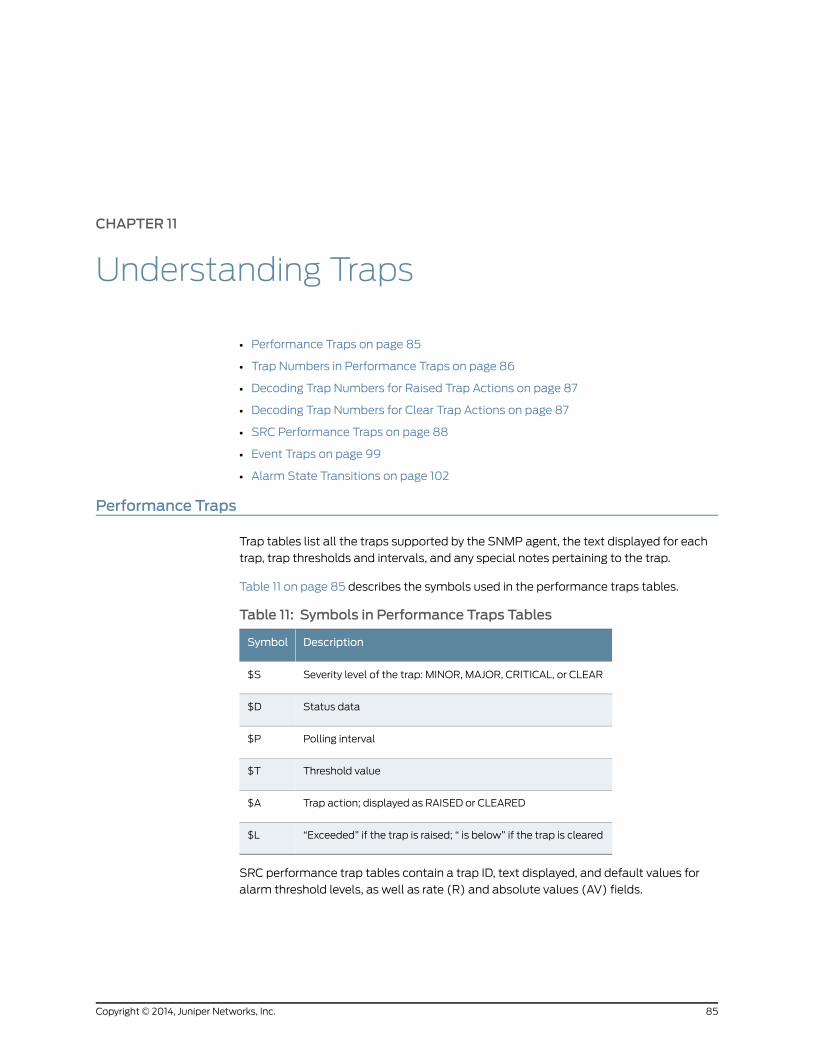
CHAPTER 11
Understanding Traps
• Performance Traps on page 85
• Trap Numbers in Performance Traps on page 86
• Decoding Trap Numbers for Raised Trap Actions on page 87
• Decoding Trap Numbers for Clear Trap Actions on page 87
• SRC Performance Traps on page 88
• Event Traps on page 99
• Alarm State Transitions on page 102
Performance Traps
Trap tables list all the traps supported by the SNMP agent, the text displayed for each
trap, trap thresholds and intervals, and any special notes pertaining to the trap.
Table 11 on page 85 describes the symbols used in the performance traps tables.
Table 11: Symbols in Performance Traps Tables
DescriptionSymbol
Severity level of the trap: MINOR, MAJOR, CRITICAL, or CLEAR$S
Status data$D
Polling interval$P
Threshold value$T
Trap action; displayed as RAISED or CLEARED$A
“Exceeded” if the trap is raised; “ is below” if the trap is cleared$L
SRC performance trap tables contain a trap ID, text displayed, and default values for
alarm threshold levels, as well as rate (R) and absolute values (AV) fields.
85Copyright © 2014, Juniper Networks, Inc.
R/AV
Each performance trap table has a field called R/AV. R means rate, and AV means
absolute value.
• Rate is used for variables that are counters. The rate is the difference between the
current value of the underlying MIB variable being monitored and its previous value,
which was read <interval> time ago. The interval length affects those values that are
appropriate for the thresholds; that is, the longer the interval, the larger the thresholds
must be. For instance, saeLogins is a counter of the total number of SAE logins. With
the default interval of 60 seconds, the critical threshold of 2,000 means that a critical
trap is sent if there are more than 2,000 logins within one minute. If you change the
interval to 300 seconds (5 minutes), to keep the critical threshold at 2,000 logins a
minute, you need to change the threshold to 10,000 (the number of logins in 5 minutes
for a rate of 2,000 per minute).
• Absolute value is used for variables that are gauges, and they transition from one alarm
threshold level to the next.
RelatedDocumentation
SNMP Traps Overview on page 79•
• Trap Numbers in Performance Traps on page 86
• Configuring Performance Traps (SRC CLI) on page 82
• Accounting Performance Traps on page 90
• Authentication Performance Traps on page 92
Trap Numbers in Performance Traps
Performance traps contain a trap ID, a severity, and an action. The trap ID, severity, and
action are encoded in the trap number to make it easy to configure trap receivers, such
as HP OpenView, to color and highlight traps.
Every performance trap has four trap definitions: one for critical, major, and minor severity
levels, and one for the clear action. For critical, major, and minor severity levels, the action
is raise. For the clear action, there is no severity level, because the severity level is implied
by the last raise action for the trap ID.
Severity levels are assigned the following numbers:
• Critical=1
• Major=2
• Minor=3
• Information=5
The JuniSdxTrapID ::= TEXTUAL-CONVENTION section in the Juniper-SDX-TC MIB lists
the trap IDs for all traps. The Juniper-SDX-TRAP MIB defines the SDX traps.
Copyright © 2014, Juniper Networks, Inc.86
SRC 4.7.x Monitoring and Troubleshooting Guide
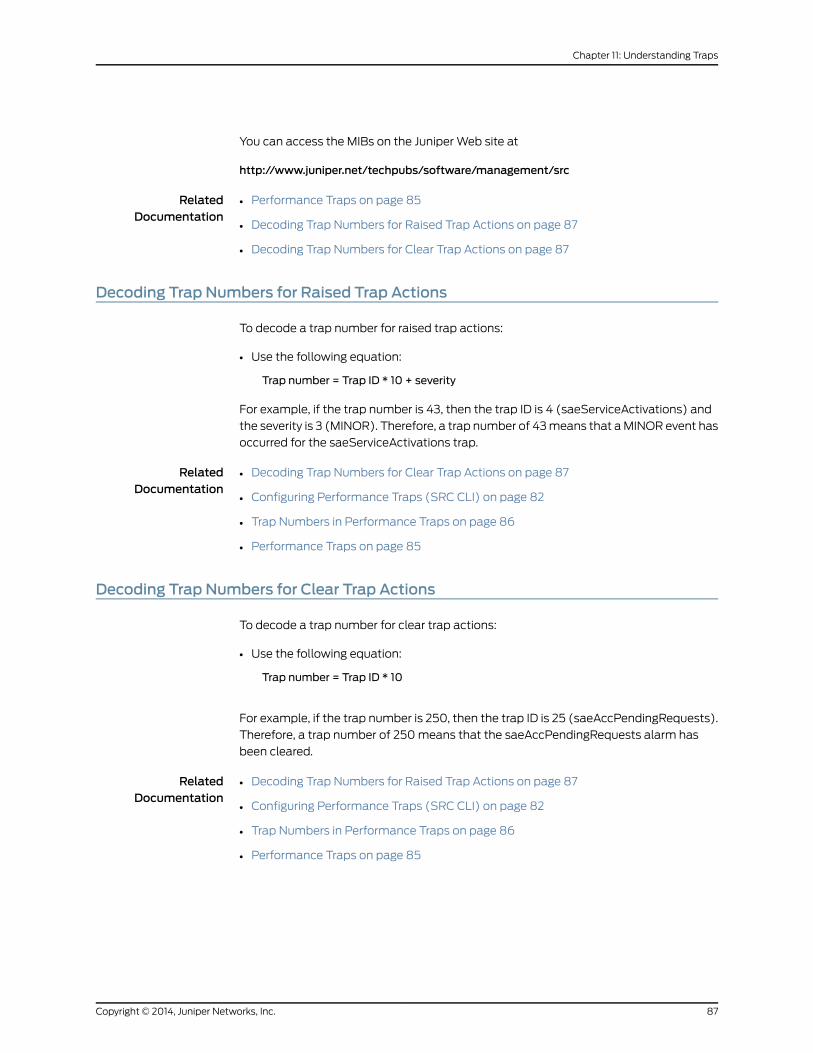
You can access the MIBs on the Juniper Web site at
http://www.juniper.net/techpubs/software/management/src
RelatedDocumentation
Performance Traps on page 85•
• Decoding Trap Numbers for Raised Trap Actions on page 87
• Decoding Trap Numbers for Clear Trap Actions on page 87
Decoding Trap Numbers for Raised Trap Actions
To decode a trap number for raised trap actions:
• Use the following equation:
Trap number = Trap ID * 10 + severity
For example, if the trap number is 43, then the trap ID is 4 (saeServiceActivations) and
the severity is 3 (MINOR). Therefore, a trap number of 43 means that a MINOR event has
occurred for the saeServiceActivations trap.
RelatedDocumentation
Decoding Trap Numbers for Clear Trap Actions on page 87•
• Configuring Performance Traps (SRC CLI) on page 82
• Trap Numbers in Performance Traps on page 86
• Performance Traps on page 85
Decoding Trap Numbers for Clear Trap Actions
To decode a trap number for clear trap actions:
• Use the following equation:
Trap number = Trap ID * 10
For example, if the trap number is 250, then the trap ID is 25 (saeAccPendingRequests).
Therefore, a trap number of 250 means that the saeAccPendingRequests alarm has
been cleared.
RelatedDocumentation
Decoding Trap Numbers for Raised Trap Actions on page 87•
• Configuring Performance Traps (SRC CLI) on page 82
• Trap Numbers in Performance Traps on page 86
• Performance Traps on page 85
87Copyright © 2014, Juniper Networks, Inc.
Chapter 11: Understanding Traps
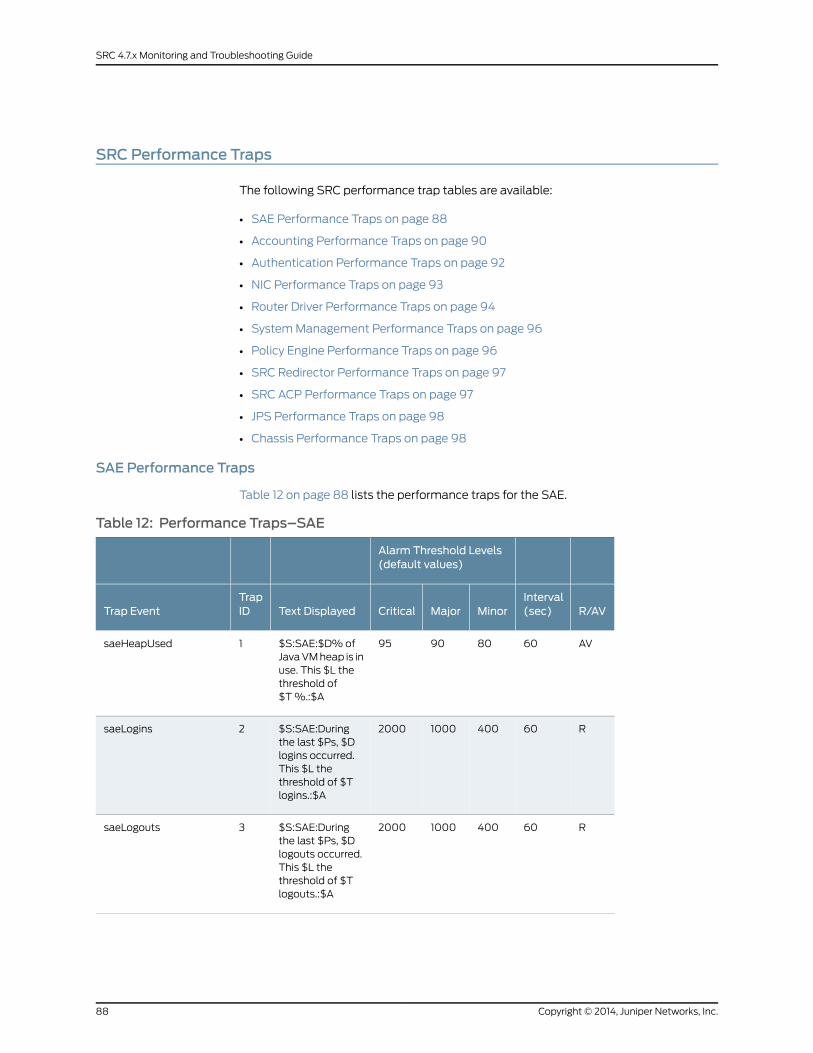
SRC Performance Traps
The following SRC performance trap tables are available:
• SAE Performance Traps on page 88
• Accounting Performance Traps on page 90
• Authentication Performance Traps on page 92
• NIC Performance Traps on page 93
• Router Driver Performance Traps on page 94
• System Management Performance Traps on page 96
• Policy Engine Performance Traps on page 96
• SRC Redirector Performance Traps on page 97
• SRC ACP Performance Traps on page 97
• JPS Performance Traps on page 98
• Chassis Performance Traps on page 98
SAE Performance Traps
Table 12 on page 88 lists the performance traps for the SAE.
Table 12: Performance Traps–SAE
Alarm Threshold Levels(default values)
R/AVInterval(sec)MinorMajorCriticalText Displayed
TrapIDTrap Event
AV60809095$S:SAE:$D% ofJava VM heap is inuse. This $L thethreshold of$T %.:$A
1saeHeapUsed
R6040010002000$S:SAE:Duringthe last $Ps, $Dlogins occurred.This $L thethreshold of $Tlogins.:$A
2saeLogins
R6040010002000$S:SAE:Duringthe last $Ps, $Dlogouts occurred.This $L thethreshold of $Tlogouts.:$A
3saeLogouts
Copyright © 2014, Juniper Networks, Inc.88
SRC 4.7.x Monitoring and Troubleshooting Guide
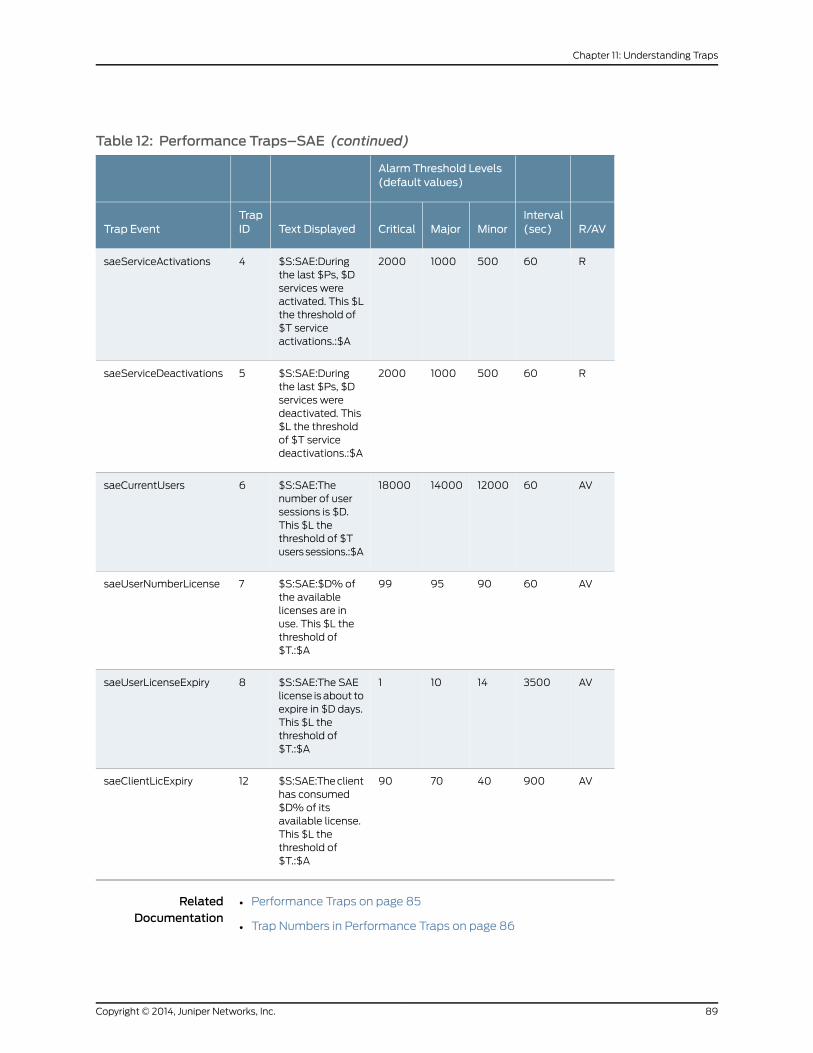
Table 12: Performance Traps–SAE (continued)
Alarm Threshold Levels(default values)
R/AVInterval(sec)MinorMajorCriticalText Displayed
TrapIDTrap Event
R6050010002000$S:SAE:Duringthe last $Ps, $Dservices wereactivated. This $Lthe threshold of$T serviceactivations.:$A
4saeServiceActivations
R6050010002000$S:SAE:Duringthe last $Ps, $Dservices weredeactivated. This$L the thresholdof $T servicedeactivations.:$A
5saeServiceDeactivations
AV60120001400018000$S:SAE:Thenumber of usersessions is $D.This $L thethreshold of $Tusers sessions.:$A
6saeCurrentUsers
AV60909599$S:SAE:$D% ofthe availablelicenses are inuse. This $L thethreshold of$T.:$A
7saeUserNumberLicense
AV350014101$S:SAE:The SAElicense is about toexpire in $D days.This $L thethreshold of$T.:$A
8saeUserLicenseExpiry
AV900407090$S:SAE:The clienthas consumed$D% of itsavailable license.This $L thethreshold of$T.:$A
12saeClientLicExpiry
RelatedDocumentation
Performance Traps on page 85•
• Trap Numbers in Performance Traps on page 86
89Copyright © 2014, Juniper Networks, Inc.
Chapter 11: Understanding Traps
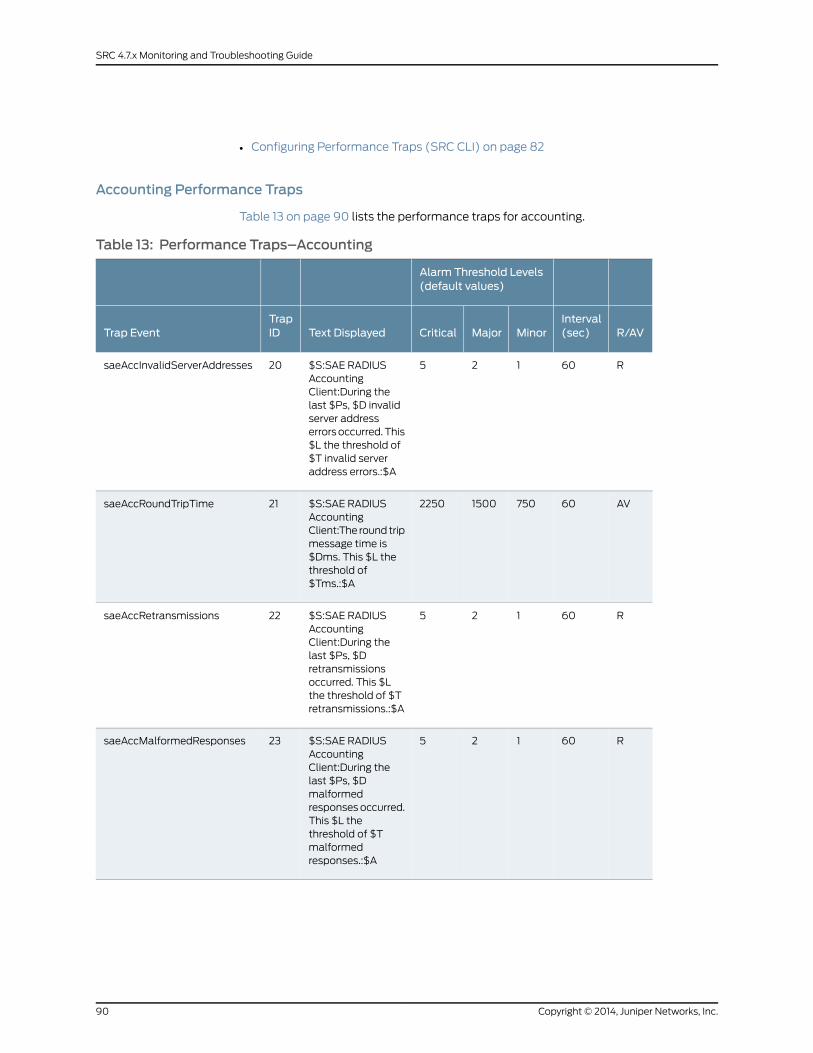
• Configuring Performance Traps (SRC CLI) on page 82
Accounting Performance Traps
Table 13 on page 90 lists the performance traps for accounting.
Table 13: Performance Traps–Accounting
Alarm Threshold Levels(default values)
R/AVInterval(sec)MinorMajorCriticalText Displayed
TrapIDTrap Event
R60125$S:SAE RADIUSAccountingClient:During thelast $Ps, $D invalidserver addresserrors occurred. This$L the threshold of$T invalid serveraddress errors.:$A
20saeAccInvalidServerAddresses
AV6075015002250$S:SAE RADIUSAccountingClient:The round tripmessage time is$Dms. This $L thethreshold of$Tms.:$A
21saeAccRoundTripTime
R60125$S:SAE RADIUSAccountingClient:During thelast $Ps, $Dretransmissionsoccurred. This $Lthe threshold of $Tretransmissions.:$A
22saeAccRetransmissions
R60125$S:SAE RADIUSAccountingClient:During thelast $Ps, $Dmalformedresponses occurred.This $L thethreshold of $Tmalformedresponses.:$A
23saeAccMalformedResponses
Copyright © 2014, Juniper Networks, Inc.90
SRC 4.7.x Monitoring and Troubleshooting Guide
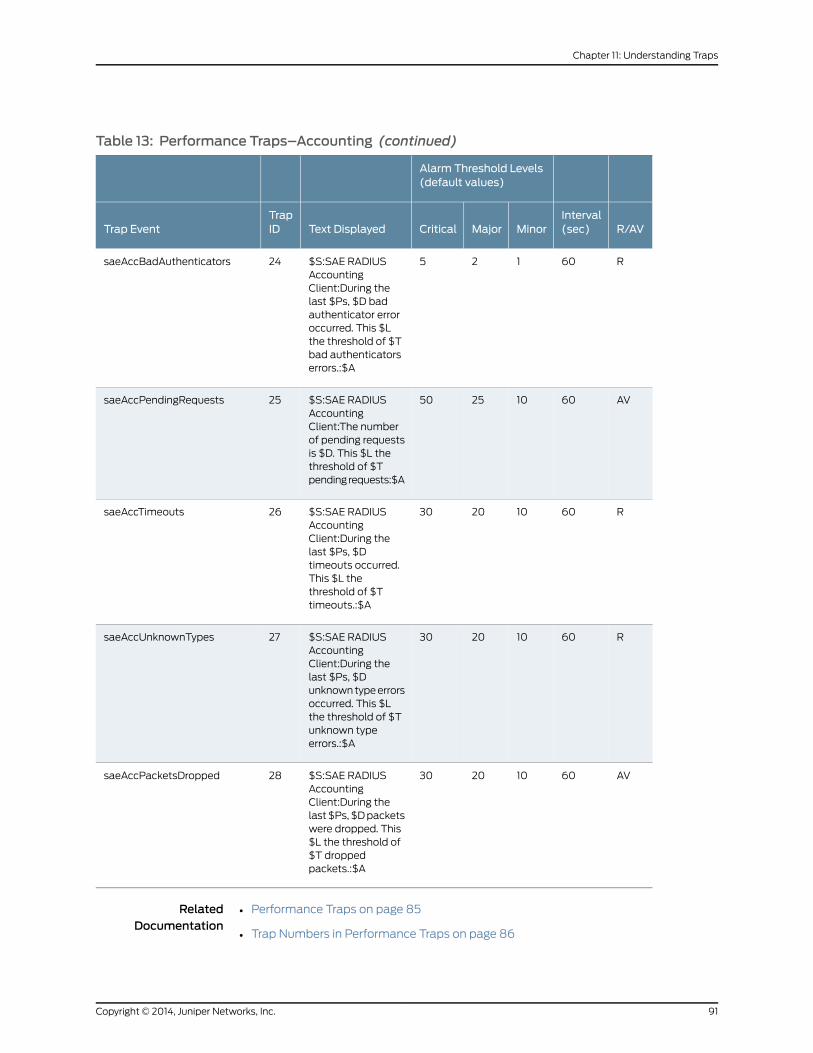
Table 13: Performance Traps–Accounting (continued)
Alarm Threshold Levels(default values)
R/AVInterval(sec)MinorMajorCriticalText Displayed
TrapIDTrap Event
R60125$S:SAE RADIUSAccountingClient:During thelast $Ps, $D badauthenticator erroroccurred. This $Lthe threshold of $Tbad authenticatorserrors.:$A
24saeAccBadAuthenticators
AV60102550$S:SAE RADIUSAccountingClient:The numberof pending requestsis $D. This $L thethreshold of $Tpending requests:$A
25saeAccPendingRequests
R60102030$S:SAE RADIUSAccountingClient:During thelast $Ps, $Dtimeouts occurred.This $L thethreshold of $Ttimeouts.:$A
26saeAccTimeouts
R60102030$S:SAE RADIUSAccountingClient:During thelast $Ps, $Dunknown type errorsoccurred. This $Lthe threshold of $Tunknown typeerrors.:$A
27saeAccUnknownTypes
AV60102030$S:SAE RADIUSAccountingClient:During thelast $Ps, $D packetswere dropped. This$L the threshold of$T droppedpackets.:$A
28saeAccPacketsDropped
RelatedDocumentation
Performance Traps on page 85•
• Trap Numbers in Performance Traps on page 86
91Copyright © 2014, Juniper Networks, Inc.
Chapter 11: Understanding Traps
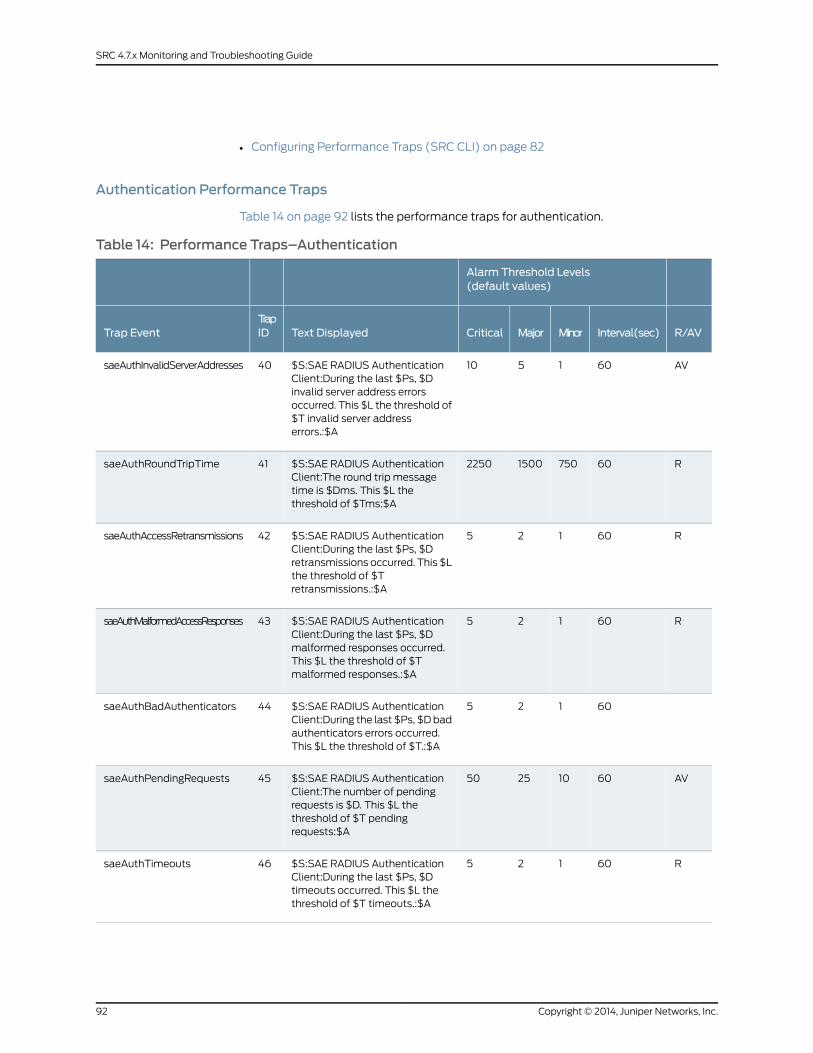
• Configuring Performance Traps (SRC CLI) on page 82
Authentication Performance Traps
Table 14 on page 92 lists the performance traps for authentication.
Table 14: Performance Traps–Authentication
Alarm Threshold Levels(default values)
R/AVInterval(sec)MinorMajorCriticalText DisplayedTrapIDTrap Event
AV601510$S:SAE RADIUS AuthenticationClient:During the last $Ps, $Dinvalid server address errorsoccurred. This $L the threshold of$T invalid server addresserrors.:$A
40saeAuthInvalidServerAddresses
R6075015002250$S:SAE RADIUS AuthenticationClient:The round trip messagetime is $Dms. This $L thethreshold of $Tms:$A
41saeAuthRoundTripTime
R60125$S:SAE RADIUS AuthenticationClient:During the last $Ps, $Dretransmissions occurred. This $Lthe threshold of $Tretransmissions.:$A
42saeAuthAccessRetransmissions
R60125$S:SAE RADIUS AuthenticationClient:During the last $Ps, $Dmalformed responses occurred.This $L the threshold of $Tmalformed responses.:$A
43saeAuthMalformedAccessResponses
60125$S:SAE RADIUS AuthenticationClient:During the last $Ps, $D badauthenticators errors occurred.This $L the threshold of $T.:$A
44saeAuthBadAuthenticators
AV60102550$S:SAE RADIUS AuthenticationClient:The number of pendingrequests is $D. This $L thethreshold of $T pendingrequests:$A
45saeAuthPendingRequests
R60125$S:SAE RADIUS AuthenticationClient:During the last $Ps, $Dtimeouts occurred. This $L thethreshold of $T timeouts.:$A
46saeAuthTimeouts
Copyright © 2014, Juniper Networks, Inc.92
SRC 4.7.x Monitoring and Troubleshooting Guide
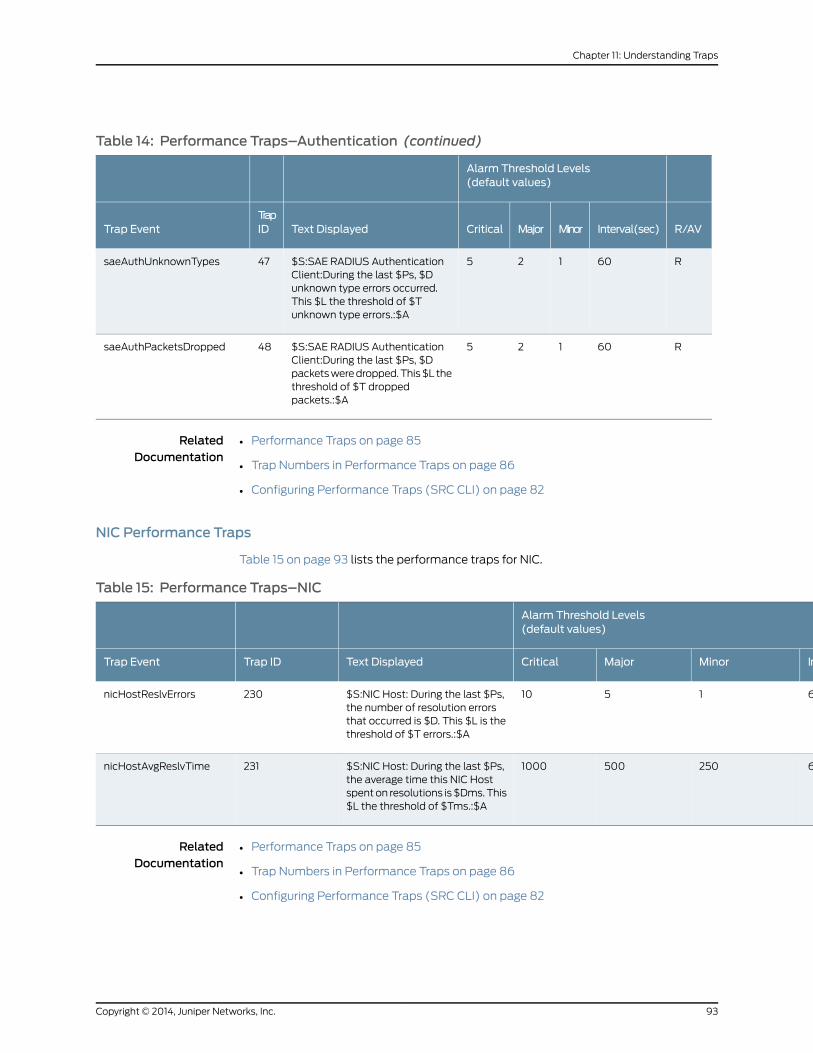
Table 14: Performance Traps–Authentication (continued)
Alarm Threshold Levels(default values)
R/AVInterval(sec)MinorMajorCriticalText DisplayedTrapIDTrap Event
R60125$S:SAE RADIUS AuthenticationClient:During the last $Ps, $Dunknown type errors occurred.This $L the threshold of $Tunknown type errors.:$A
47saeAuthUnknownTypes
R60125$S:SAE RADIUS AuthenticationClient:During the last $Ps, $Dpackets were dropped. This $L thethreshold of $T droppedpackets.:$A
48saeAuthPacketsDropped
RelatedDocumentation
• Performance Traps on page 85
• Trap Numbers in Performance Traps on page 86
• Configuring Performance Traps (SRC CLI) on page 82
NIC Performance Traps
Table 15 on page 93 lists the performance traps for NIC.
Table 15: Performance Traps–NIC
Alarm Threshold Levels(default values)
R/AVInterval(sec)MinorMajorCriticalText DisplayedTrap IDTrap Event
R601510$S:NIC Host: During the last $Ps,the number of resolution errorsthat occurred is $D. This $L is thethreshold of $T errors.:$A
230nicHostReslvErrors
R602505001000$S:NIC Host: During the last $Ps,the average time this NIC Hostspent on resolutions is $Dms. This$L the threshold of $Tms.:$A
231nicHostAvgReslvTime
RelatedDocumentation
Performance Traps on page 85•
• Trap Numbers in Performance Traps on page 86
• Configuring Performance Traps (SRC CLI) on page 82
93Copyright © 2014, Juniper Networks, Inc.
Chapter 11: Understanding Traps
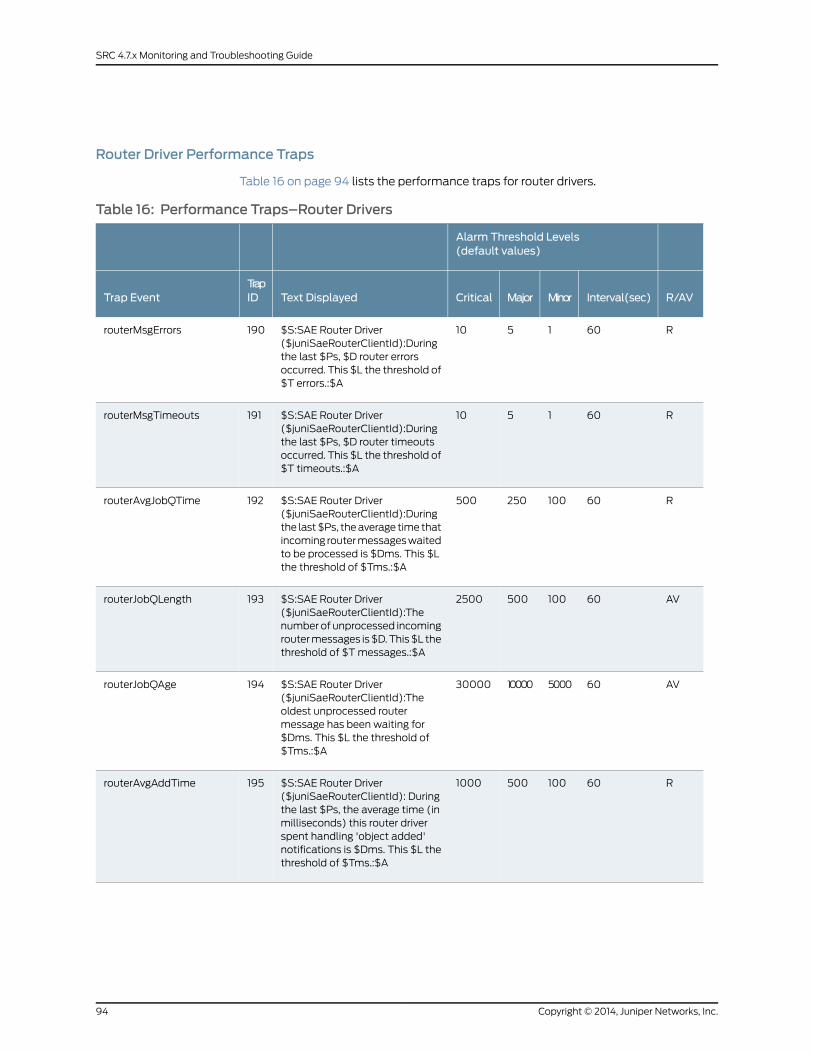
Router Driver Performance Traps
Table 16 on page 94 lists the performance traps for router drivers.
Table 16: Performance Traps–Router Drivers
Alarm Threshold Levels(default values)
R/AVInterval(sec)MinorMajorCriticalText DisplayedTrapIDTrap Event
R601510$S:SAE Router Driver($juniSaeRouterClientId):Duringthe last $Ps, $D router errorsoccurred. This $L the threshold of$T errors.:$A
190routerMsgErrors
R601510$S:SAE Router Driver($juniSaeRouterClientId):Duringthe last $Ps, $D router timeoutsoccurred. This $L the threshold of$T timeouts.:$A
191routerMsgTimeouts
R60100250500$S:SAE Router Driver($juniSaeRouterClientId):Duringthe last $Ps, the average time thatincoming router messages waitedto be processed is $Dms. This $Lthe threshold of $Tms.:$A
192routerAvgJobQTime
AV601005002500$S:SAE Router Driver($juniSaeRouterClientId):Thenumber of unprocessed incomingrouter messages is $D. This $L thethreshold of $T messages.:$A
193routerJobQLength
AV6050001000030000$S:SAE Router Driver($juniSaeRouterClientId):Theoldest unprocessed routermessage has been waiting for$Dms. This $L the threshold of$Tms.:$A
194routerJobQAge
R601005001000$S:SAE Router Driver($juniSaeRouterClientId): Duringthe last $Ps, the average time (inmilliseconds) this router driverspent handling 'object added'notifications is $Dms. This $L thethreshold of $Tms.:$A
195routerAvgAddTime
Copyright © 2014, Juniper Networks, Inc.94
SRC 4.7.x Monitoring and Troubleshooting Guide
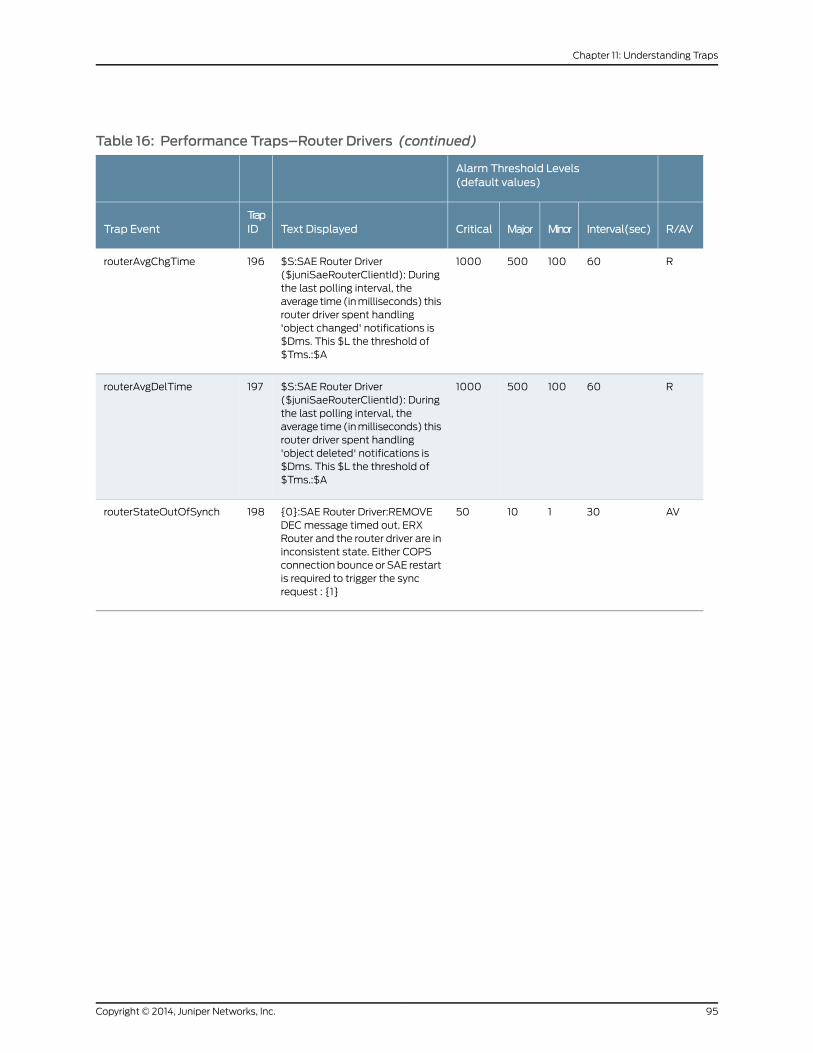
Table 16: Performance Traps–Router Drivers (continued)
Alarm Threshold Levels(default values)
R/AVInterval(sec)MinorMajorCriticalText DisplayedTrapIDTrap Event
R601005001000$S:SAE Router Driver($juniSaeRouterClientId): Duringthe last polling interval, theaverage time (in milliseconds) thisrouter driver spent handling'object changed' notifications is$Dms. This $L the threshold of$Tms.:$A
196routerAvgChgTime
R601005001000$S:SAE Router Driver($juniSaeRouterClientId): Duringthe last polling interval, theaverage time (in milliseconds) thisrouter driver spent handling'object deleted' notifications is$Dms. This $L the threshold of$Tms.:$A
197routerAvgDelTime
AV3011050{0}:SAE Router Driver:REMOVEDEC message timed out. ERXRouter and the router driver are ininconsistent state. Either COPSconnection bounce or SAE restartis required to trigger the syncrequest : {1}
198routerStateOutOfSynch
95Copyright © 2014, Juniper Networks, Inc.
Chapter 11: Understanding Traps
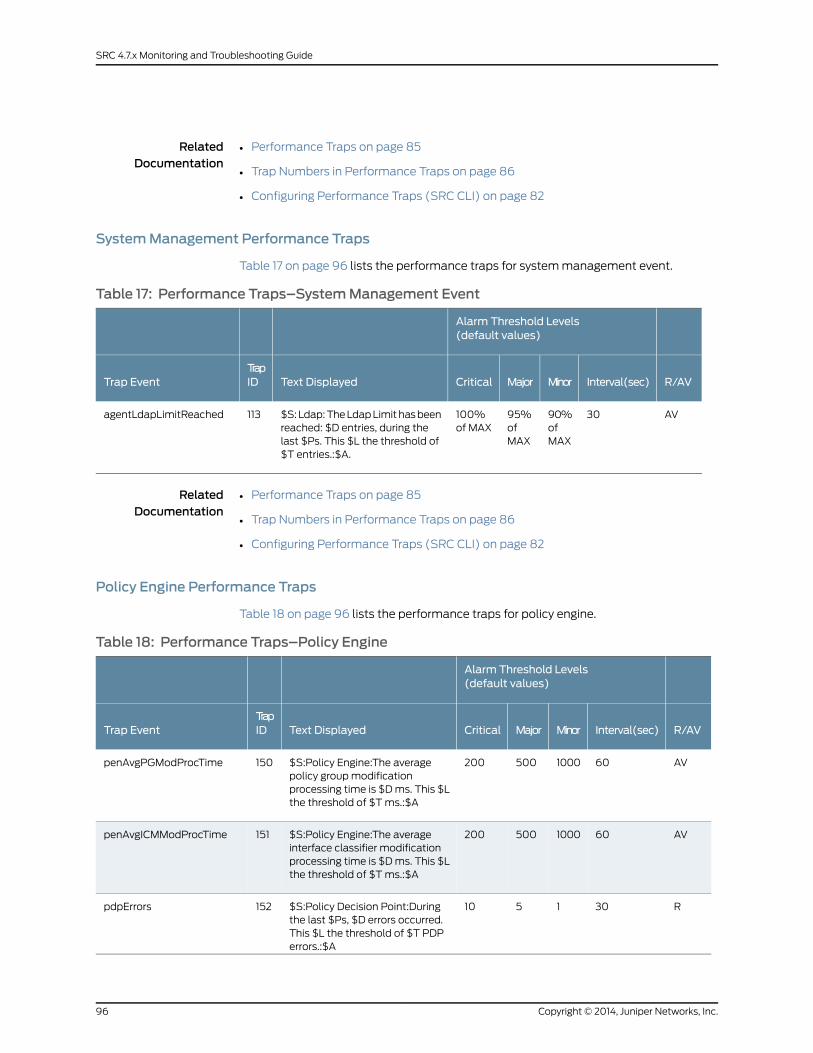
RelatedDocumentation
Performance Traps on page 85•
• Trap Numbers in Performance Traps on page 86
• Configuring Performance Traps (SRC CLI) on page 82
SystemManagement Performance Traps
Table 17 on page 96 lists the performance traps for system management event.
Table 17: Performance Traps–SystemManagement Event
Alarm Threshold Levels(default values)
R/AVInterval(sec)MinorMajorCriticalText DisplayedTrapIDTrap Event
AV3090%ofMAX
95%ofMAX
100%of MAX
$S: Ldap: The Ldap Limit has beenreached: $D entries, during thelast $Ps. This $L the threshold of$T entries.:$A.
113agentLdapLimitReached
RelatedDocumentation
Performance Traps on page 85•
• Trap Numbers in Performance Traps on page 86
• Configuring Performance Traps (SRC CLI) on page 82
Policy Engine Performance Traps
Table 18 on page 96 lists the performance traps for policy engine.
Table 18: Performance Traps–Policy Engine
Alarm Threshold Levels(default values)
R/AVInterval(sec)MinorMajorCriticalText DisplayedTrapIDTrap Event
AV601000500200$S:Policy Engine:The averagepolicy group modificationprocessing time is $D ms. This $Lthe threshold of $T ms.:$A
150penAvgPGModProcTime
AV601000500200$S:Policy Engine:The averageinterface classifier modificationprocessing time is $D ms. This $Lthe threshold of $T ms.:$A
151penAvgICMModProcTime
R301510$S:Policy Decision Point:Duringthe last $Ps, $D errors occurred.This $L the threshold of $T PDPerrors.:$A
152pdpErrors
Copyright © 2014, Juniper Networks, Inc.96
SRC 4.7.x Monitoring and Troubleshooting Guide
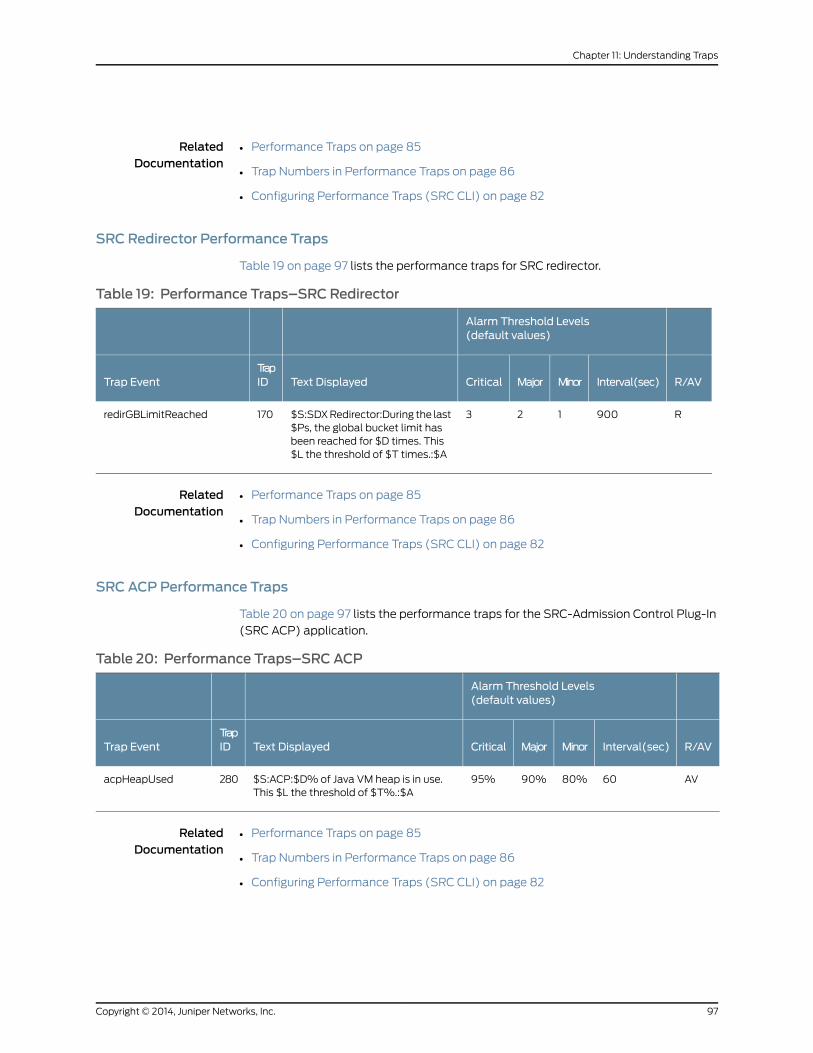
RelatedDocumentation
Performance Traps on page 85•
• Trap Numbers in Performance Traps on page 86
• Configuring Performance Traps (SRC CLI) on page 82
SRC Redirector Performance Traps
Table 19 on page 97 lists the performance traps for SRC redirector.
Table 19: Performance Traps–SRC Redirector
Alarm Threshold Levels(default values)
R/AVInterval(sec)MinorMajorCriticalText DisplayedTrapIDTrap Event
R900123$S:SDX Redirector:During the last$Ps, the global bucket limit hasbeen reached for $D times. This$L the threshold of $T times.:$A
170redirGBLimitReached
RelatedDocumentation
Performance Traps on page 85•
• Trap Numbers in Performance Traps on page 86
• Configuring Performance Traps (SRC CLI) on page 82
SRC ACP Performance Traps
Table 20 on page 97 lists the performance traps for the SRC-Admission Control Plug-In
(SRC ACP) application.
Table 20: Performance Traps–SRC ACP
Alarm Threshold Levels(default values)
R/AVInterval(sec)MinorMajorCriticalText DisplayedTrapIDTrap Event
AV6080%90%95%$S:ACP:$D% of Java VM heap is in use.This $L the threshold of $T%.:$A
280acpHeapUsed
RelatedDocumentation
Performance Traps on page 85•
• Trap Numbers in Performance Traps on page 86
• Configuring Performance Traps (SRC CLI) on page 82
97Copyright © 2014, Juniper Networks, Inc.
Chapter 11: Understanding Traps
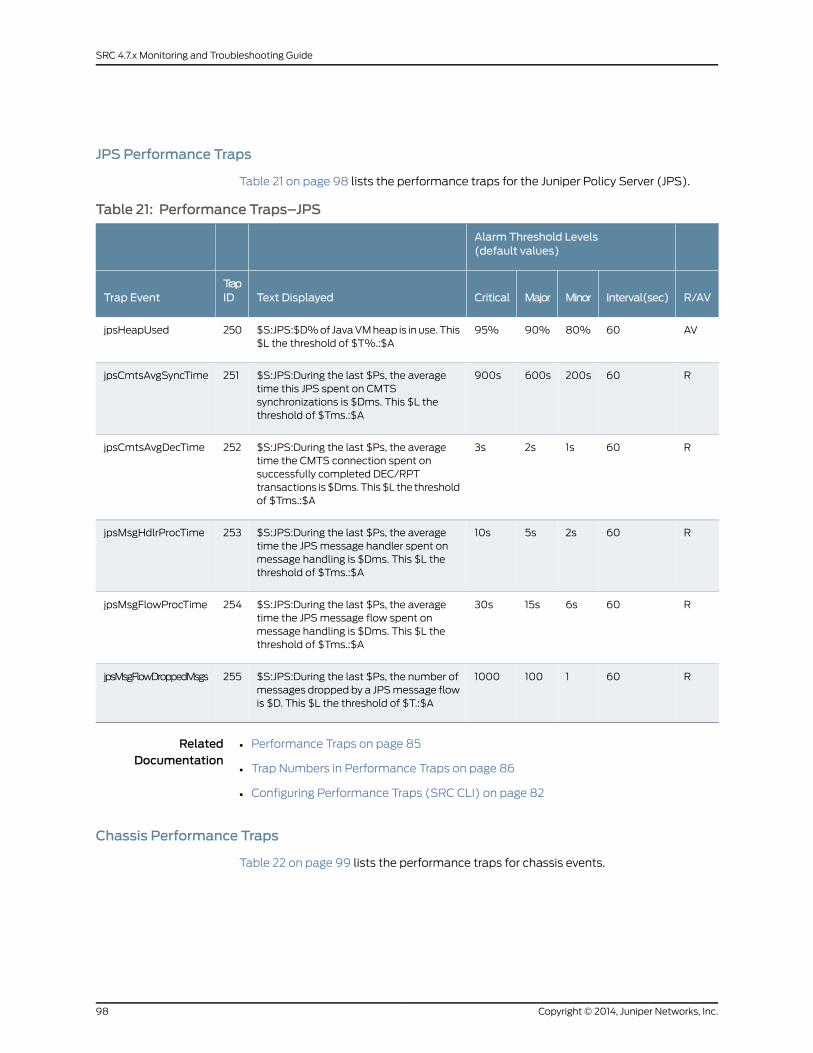
JPS Performance Traps
Table 21 on page 98 lists the performance traps for the Juniper Policy Server (JPS).
Table 21: Performance Traps–JPS
Alarm Threshold Levels(default values)
R/AVInterval(sec)MinorMajorCriticalText DisplayedTrapIDTrap Event
AV6080%90%95%$S:JPS:$D% of Java VM heap is in use. This$L the threshold of $T%.:$A
250jpsHeapUsed
R60200s600s900s$S:JPS:During the last $Ps, the averagetime this JPS spent on CMTSsynchronizations is $Dms. This $L thethreshold of $Tms.:$A
251jpsCmtsAvgSyncTime
R601s2s3s$S:JPS:During the last $Ps, the averagetime the CMTS connection spent onsuccessfully completed DEC/RPTtransactions is $Dms. This $L the thresholdof $Tms.:$A
252jpsCmtsAvgDecTime
R602s5s10s$S:JPS:During the last $Ps, the averagetime the JPS message handler spent onmessage handling is $Dms. This $L thethreshold of $Tms.:$A
253jpsMsgHdlrProcTime
R606s15s30s$S:JPS:During the last $Ps, the averagetime the JPS message flow spent onmessage handling is $Dms. This $L thethreshold of $Tms.:$A
254jpsMsgFlowProcTime
R6011001000$S:JPS:During the last $Ps, the number ofmessages dropped by a JPS message flowis $D. This $L the threshold of $T.:$A
255jpsMsgFlowDroppedMsgs
RelatedDocumentation
• Performance Traps on page 85
• Trap Numbers in Performance Traps on page 86
• Configuring Performance Traps (SRC CLI) on page 82
Chassis Performance Traps
Table 22 on page 99 lists the performance traps for chassis events.
Copyright © 2014, Juniper Networks, Inc.98
SRC 4.7.x Monitoring and Troubleshooting Guide
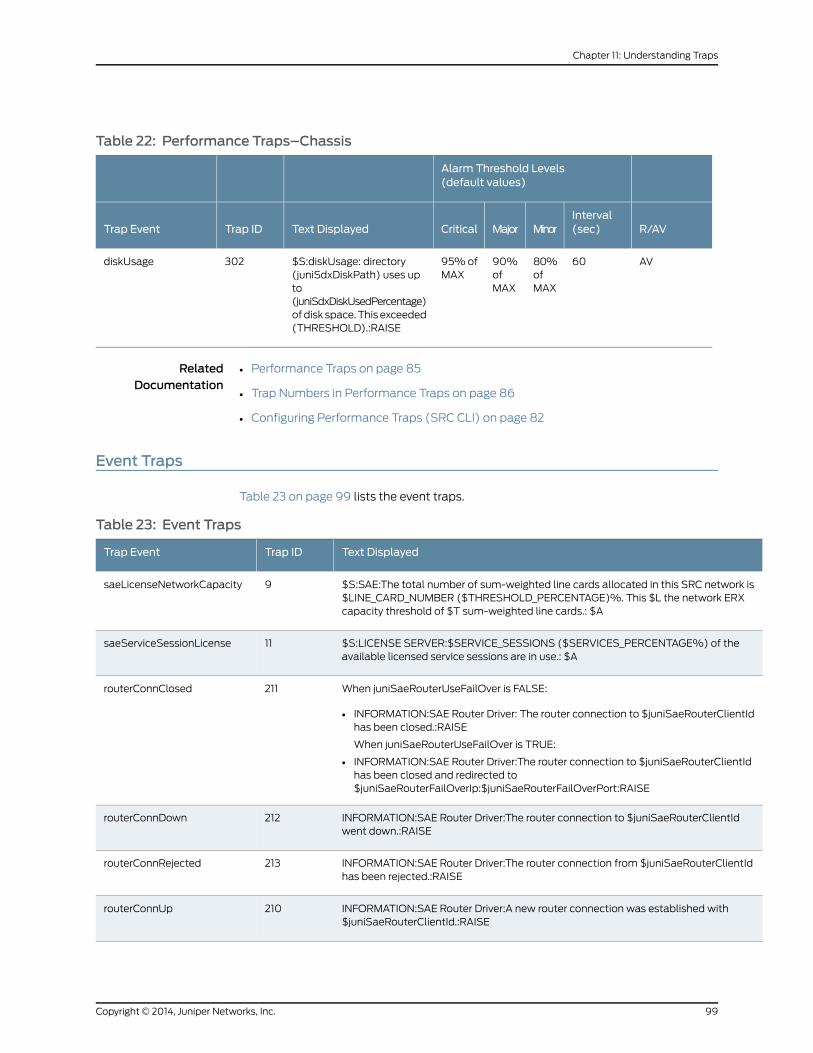
Table 22: Performance Traps–Chassis
Alarm Threshold Levels(default values)
R/AVInterval(sec)MinorMajorCriticalText DisplayedTrap IDTrap Event
AV6080%ofMAX
90%ofMAX
95% ofMAX
$S:diskUsage: directory(juniSdxDiskPath) uses upto(juniSdxDiskUsedPercentage)of disk space. This exceeded(THRESHOLD).:RAISE
302diskUsage
RelatedDocumentation
Performance Traps on page 85•
• Trap Numbers in Performance Traps on page 86
• Configuring Performance Traps (SRC CLI) on page 82
Event Traps
Table 23 on page 99 lists the event traps.
Table 23: Event Traps
Text DisplayedTrap IDTrap Event
$S:SAE:The total number of sum-weighted line cards allocated in this SRC network is$LINE_CARD_NUMBER ($THRESHOLD_PERCENTAGE)%. This $L the network ERXcapacity threshold of $T sum-weighted line cards.: $A
9saeLicenseNetworkCapacity
$S:LICENSE SERVER:$SERVICE_SESSIONS ($SERVICES_PERCENTAGE%) of theavailable licensed service sessions are in use.: $A
11saeServiceSessionLicense
When juniSaeRouterUseFailOver is FALSE:
• INFORMATION:SAE Router Driver: The router connection to $juniSaeRouterClientIdhas been closed.:RAISE
When juniSaeRouterUseFailOver is TRUE:
• INFORMATION:SAE Router Driver:The router connection to $juniSaeRouterClientIdhas been closed and redirected to$juniSaeRouterFailOverIp:$juniSaeRouterFailOverPort:RAISE
211routerConnClosed
INFORMATION:SAE Router Driver:The router connection to $juniSaeRouterClientIdwent down.:RAISE
212routerConnDown
INFORMATION:SAE Router Driver:The router connection from $juniSaeRouterClientIdhas been rejected.:RAISE
213routerConnRejected
INFORMATION:SAE Router Driver:A new router connection was established with$juniSaeRouterClientId.:RAISE
210routerConnUp
99Copyright © 2014, Juniper Networks, Inc.
Chapter 11: Understanding Traps
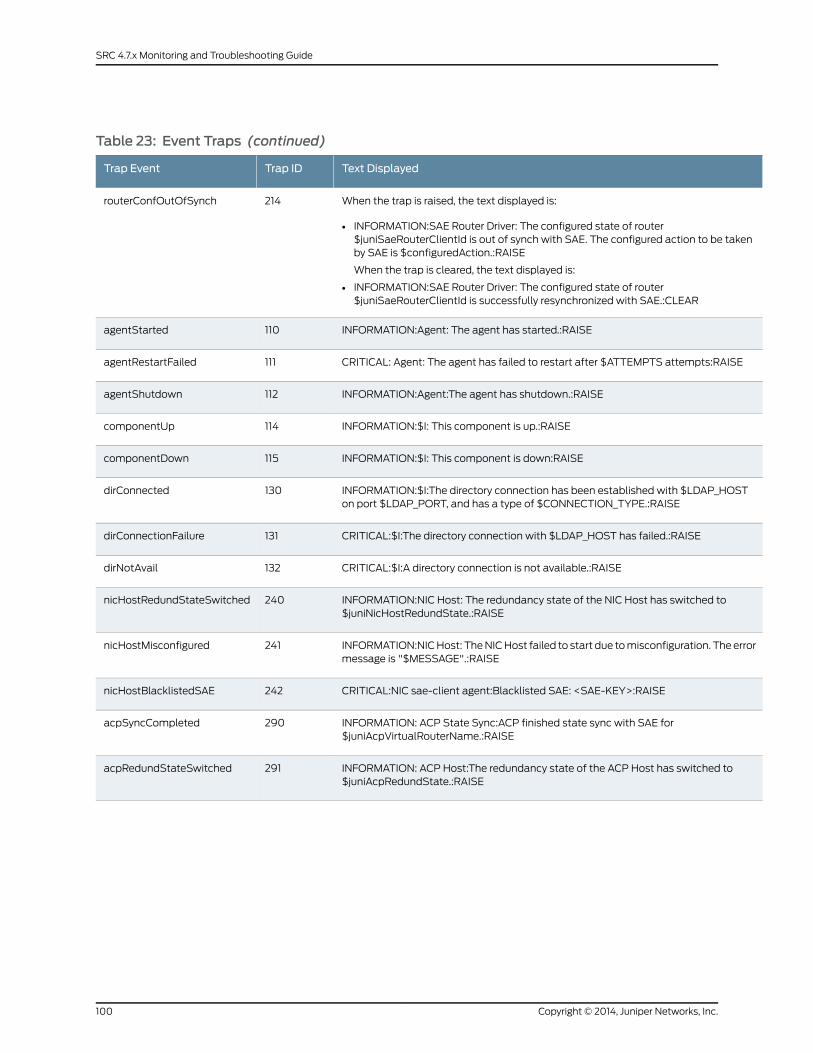
Table 23: Event Traps (continued)
Text DisplayedTrap IDTrap Event
When the trap is raised, the text displayed is:
• INFORMATION:SAE Router Driver: The configured state of router$juniSaeRouterClientId is out of synch with SAE. The configured action to be takenby SAE is $configuredAction.:RAISE
When the trap is cleared, the text displayed is:
• INFORMATION:SAE Router Driver: The configured state of router$juniSaeRouterClientId is successfully resynchronized with SAE.:CLEAR
214routerConfOutOfSynch
INFORMATION:Agent: The agent has started.:RAISE110agentStarted
CRITICAL: Agent: The agent has failed to restart after $ATTEMPTS attempts:RAISE111agentRestartFailed
INFORMATION:Agent:The agent has shutdown.:RAISE112agentShutdown
INFORMATION:$I: This component is up.:RAISE114componentUp
INFORMATION:$I: This component is down:RAISE115componentDown
INFORMATION:$I:The directory connection has been established with $LDAP_HOSTon port $LDAP_PORT, and has a type of $CONNECTION_TYPE.:RAISE
130dirConnected
CRITICAL:$I:The directory connection with $LDAP_HOST has failed.:RAISE131dirConnectionFailure
CRITICAL:$I:A directory connection is not available.:RAISE132dirNotAvail
INFORMATION:NIC Host: The redundancy state of the NIC Host has switched to$juniNicHostRedundState.:RAISE
240nicHostRedundStateSwitched
INFORMATION:NIC Host: The NIC Host failed to start due to misconfiguration. The errormessage is "$MESSAGE".:RAISE
241nicHostMisconfigured
CRITICAL:NIC sae-client agent:Blacklisted SAE: <SAE-KEY>:RAISE242nicHostBlacklistedSAE
INFORMATION: ACP State Sync:ACP finished state sync with SAE for$juniAcpVirtualRouterName.:RAISE
290acpSyncCompleted
INFORMATION: ACP Host:The redundancy state of the ACP Host has switched to$juniAcpRedundState.:RAISE
291acpRedundStateSwitched
Copyright © 2014, Juniper Networks, Inc.100
SRC 4.7.x Monitoring and Troubleshooting Guide
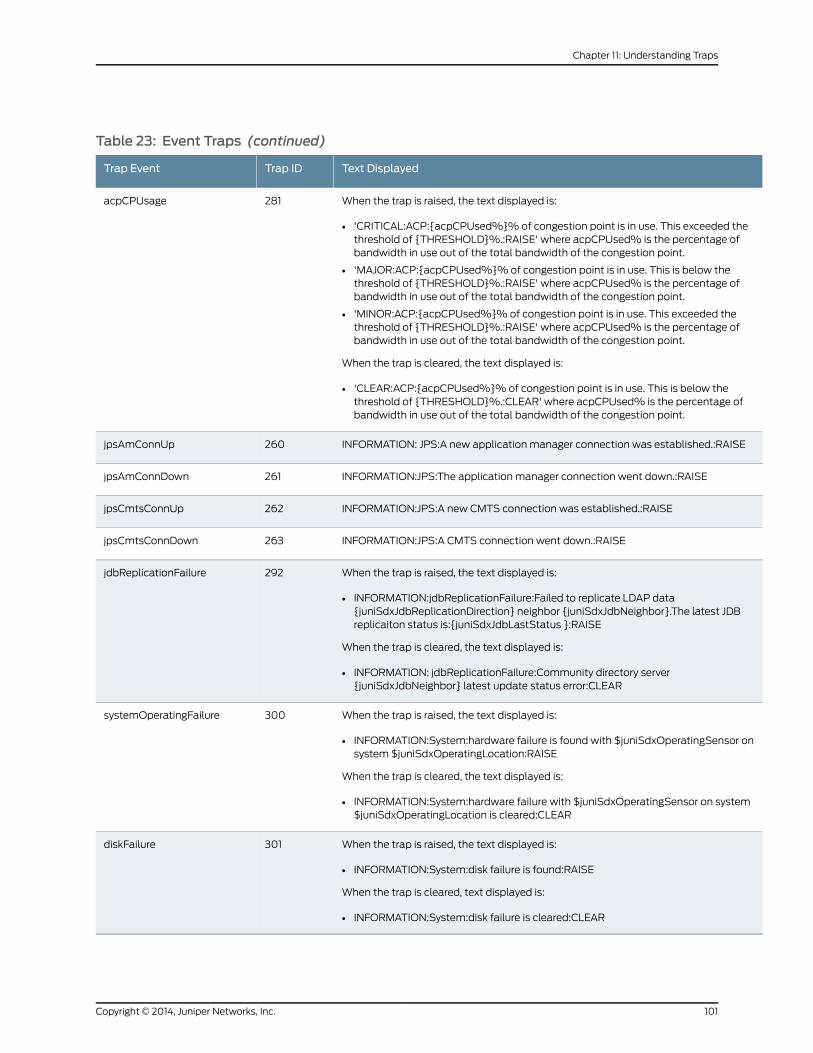
Table 23: Event Traps (continued)
Text DisplayedTrap IDTrap Event
When the trap is raised, the text displayed is:
• 'CRITICAL:ACP:{acpCPUsed%}% of congestion point is in use. This exceeded thethreshold of {THRESHOLD}%.:RAISE' where acpCPUsed% is the percentage ofbandwidth in use out of the total bandwidth of the congestion point.
• 'MAJOR:ACP:{acpCPUsed%}% of congestion point is in use. This is below thethreshold of {THRESHOLD}%.:RAISE' where acpCPUsed% is the percentage ofbandwidth in use out of the total bandwidth of the congestion point.
• 'MINOR:ACP:{acpCPUsed%}% of congestion point is in use. This exceeded thethreshold of {THRESHOLD}%.:RAISE' where acpCPUsed% is the percentage ofbandwidth in use out of the total bandwidth of the congestion point.
When the trap is cleared, the text displayed is:
• 'CLEAR:ACP:{acpCPUsed%}% of congestion point is in use. This is below thethreshold of {THRESHOLD}%.:CLEAR' where acpCPUsed% is the percentage ofbandwidth in use out of the total bandwidth of the congestion point.
281acpCPUsage
INFORMATION: JPS:A new application manager connection was established.:RAISE260jpsAmConnUp
INFORMATION:JPS:The application manager connection went down.:RAISE261jpsAmConnDown
INFORMATION:JPS:A new CMTS connection was established.:RAISE262jpsCmtsConnUp
INFORMATION:JPS:A CMTS connection went down.:RAISE263jpsCmtsConnDown
When the trap is raised, the text displayed is:
• INFORMATION:jdbReplicationFailure:Failed to replicate LDAP data{juniSdxJdbReplicationDirection} neighbor {juniSdxJdbNeighbor}.The latest JDBreplicaiton status is:{juniSdxJdbLastStatus }:RAISE
When the trap is cleared, the text displayed is:
• INFORMATION: jdbReplicationFailure:Community directory server{juniSdxJdbNeighbor} latest update status error:CLEAR
292jdbReplicationFailure
When the trap is raised, the text displayed is:
• INFORMATION:System:hardware failure is found with $juniSdxOperatingSensor onsystem $juniSdxOperatingLocation:RAISE
When the trap is cleared, the text displayed is:
• INFORMATION:System:hardware failure with $juniSdxOperatingSensor on system$juniSdxOperatingLocation is cleared:CLEAR
300systemOperatingFailure
When the trap is raised, the text displayed is:
• INFORMATION:System:disk failure is found:RAISE
When the trap is cleared, text displayed is:
• INFORMATION:System:disk failure is cleared:CLEAR
301diskFailure
101Copyright © 2014, Juniper Networks, Inc.
Chapter 11: Understanding Traps
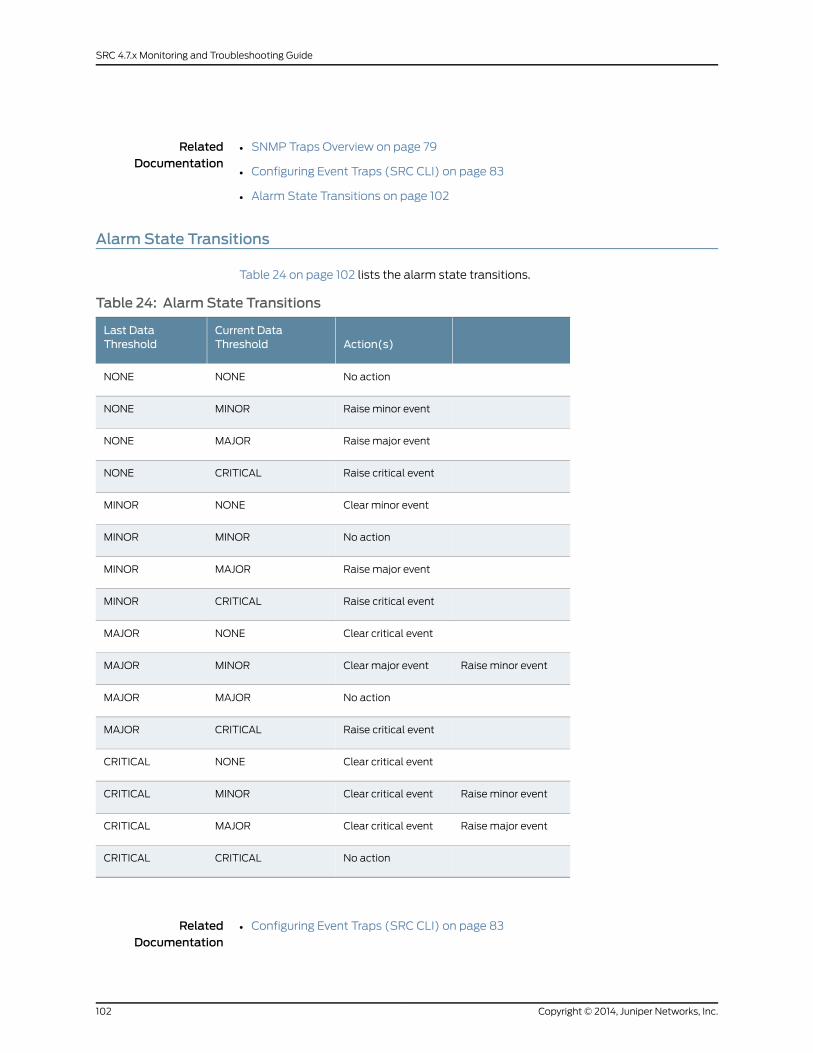
RelatedDocumentation
SNMP Traps Overview on page 79•
• Configuring Event Traps (SRC CLI) on page 83
• Alarm State Transitions on page 102
Alarm State Transitions
Table 24 on page 102 lists the alarm state transitions.
Table 24: Alarm State Transitions
Action(s)Current DataThreshold
Last DataThreshold
No actionNONENONE
Raise minor eventMINORNONE
Raise major eventMAJORNONE
Raise critical eventCRITICALNONE
Clear minor eventNONEMINOR
No actionMINORMINOR
Raise major eventMAJORMINOR
Raise critical eventCRITICALMINOR
Clear critical eventNONEMAJOR
Raise minor eventClear major eventMINORMAJOR
No actionMAJORMAJOR
Raise critical eventCRITICALMAJOR
Clear critical eventNONECRITICAL
Raise minor eventClear critical eventMINORCRITICAL
Raise major eventClear critical eventMAJORCRITICAL
No actionCRITICALCRITICAL
RelatedDocumentation
• Configuring Event Traps (SRC CLI) on page 83
Copyright © 2014, Juniper Networks, Inc.102
SRC 4.7.x Monitoring and Troubleshooting Guide

• Event Traps on page 99
103Copyright © 2014, Juniper Networks, Inc.
Chapter 11: Understanding Traps

Copyright © 2014, Juniper Networks, Inc.104
SRC 4.7.x Monitoring and Troubleshooting Guide
PART 5
Monitoring the SRC Software and the CSeriesControllerwith theC-Web Interfaceand the SRC CLI
• Monitoring with the SRC CLI and the C-Web Interface on page 107
• Monitoring the System (SRC CLI) on page 111
• Monitoring the System (C-Web Interface) on page 117
• Monitoring SAE Data (SRC CLI) on page 125
• Monitoring SAE Data (C-Web Interface) on page 153
• Monitoring and Troubleshooting the NIC (SRC CLI) on page 179
• Monitoring the NIC (C-Web Interface) on page 189
• Monitoring NTP (SRC CLI) on page 195
• Monitoring NTP (C-Web Interface) on page 199
• Monitoring Redirect Server (SRC CLI) on page 203
• Monitoring the Redirect Server and Filtered Traffic (C-Web Interface) on page 205
• Troubleshooting Network Connectivity (SRC CLI) on page 207
• Monitoring Network Connectivity (C-Web Interface) on page 211
• Monitoring Activity for SRC Components on page 213
105Copyright © 2014, Juniper Networks, Inc.

Copyright © 2014, Juniper Networks, Inc.106
SRC 4.7.x Monitoring and Troubleshooting Guide
CHAPTER 12
Monitoring with the SRC CLI and theC-Web Interface
• Monitoring with the SRC CLI and the C-Web Interface on page 107
• SRC Monitoring Options on page 107
Monitoring with the SRC CLI and the C-Web Interface
You can use the show commands available with the SRC CLI to monitor the operation
and configuration of your SRC environment.
The C-Web graphical user interface (GUI) allows you to monitor the operation and
configuration of your SRC environment by using a Web browser with Hypertext Transfer
Protocol (HTTP) or HTTP over Secure Sockets Layer (HTTPS) enabled.
RelatedDocumentation
Monitoring and Troubleshooting Tools Overview on page 3•
• SRC Monitoring Options on page 107
SRCMonitoring Options
Table 25 on page 108 lists and compares the monitoring options for the C-Web interface
and the SRC CLI.
107Copyright © 2014, Juniper Networks, Inc.
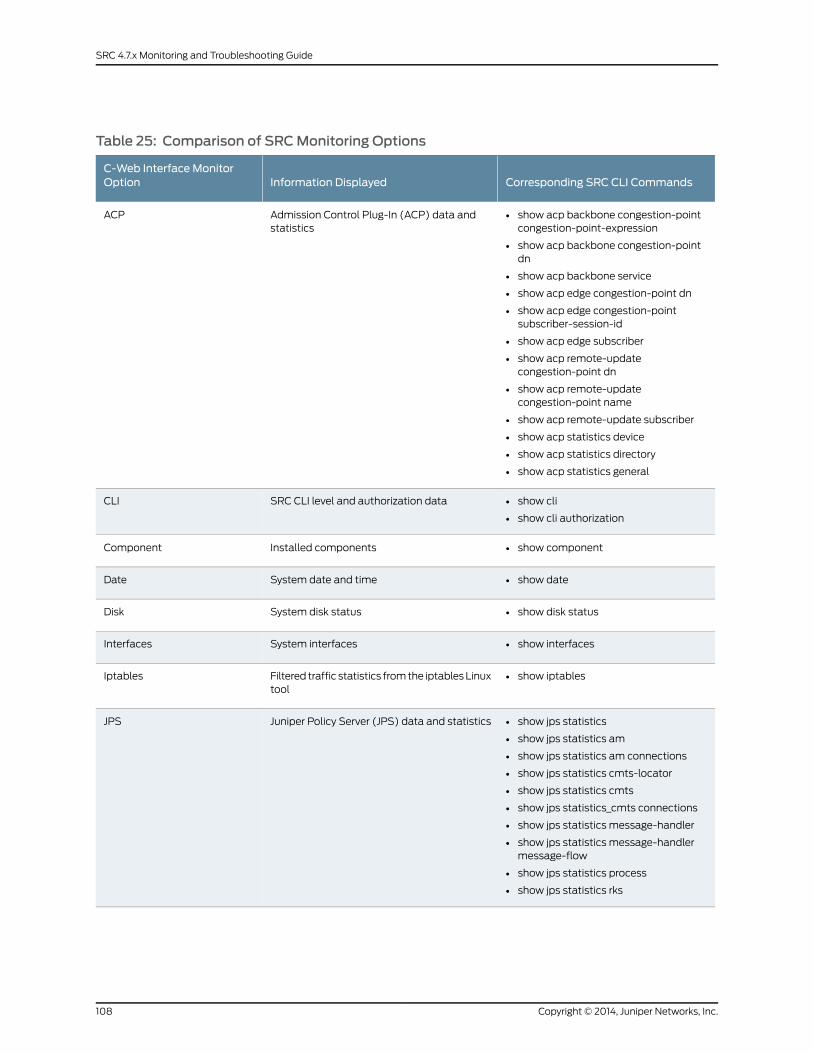
Table 25: Comparison of SRCMonitoring Options
Corresponding SRC CLI CommandsInformation DisplayedC-Web Interface MonitorOption
• show acp backbone congestion-pointcongestion-point-expression
• show acp backbone congestion-pointdn
• show acp backbone service
• show acp edge congestion-point dn
• show acp edge congestion-pointsubscriber-session-id
• show acp edge subscriber
• show acp remote-updatecongestion-point dn
• show acp remote-updatecongestion-point name
• show acp remote-update subscriber
• show acp statistics device
• show acp statistics directory
• show acp statistics general
Admission Control Plug-In (ACP) data andstatistics
ACP
• show cli
• show cli authorization
SRC CLI level and authorization dataCLI
• show componentInstalled componentsComponent
• show dateSystem date and timeDate
• show disk statusSystem disk statusDisk
• show interfacesSystem interfacesInterfaces
• show iptablesFiltered traffic statistics from the iptables Linuxtool
Iptables
• show jps statistics
• show jps statistics am
• show jps statistics am connections
• show jps statistics cmts-locator
• show jps statistics cmts
• show jps statistics_cmts connections
• show jps statistics message-handler
• show jps statistics message-handlermessage-flow
• show jps statistics process
• show jps statistics rks
Juniper Policy Server (JPS) data and statisticsJPS
Copyright © 2014, Juniper Networks, Inc.108
SRC 4.7.x Monitoring and Troubleshooting Guide
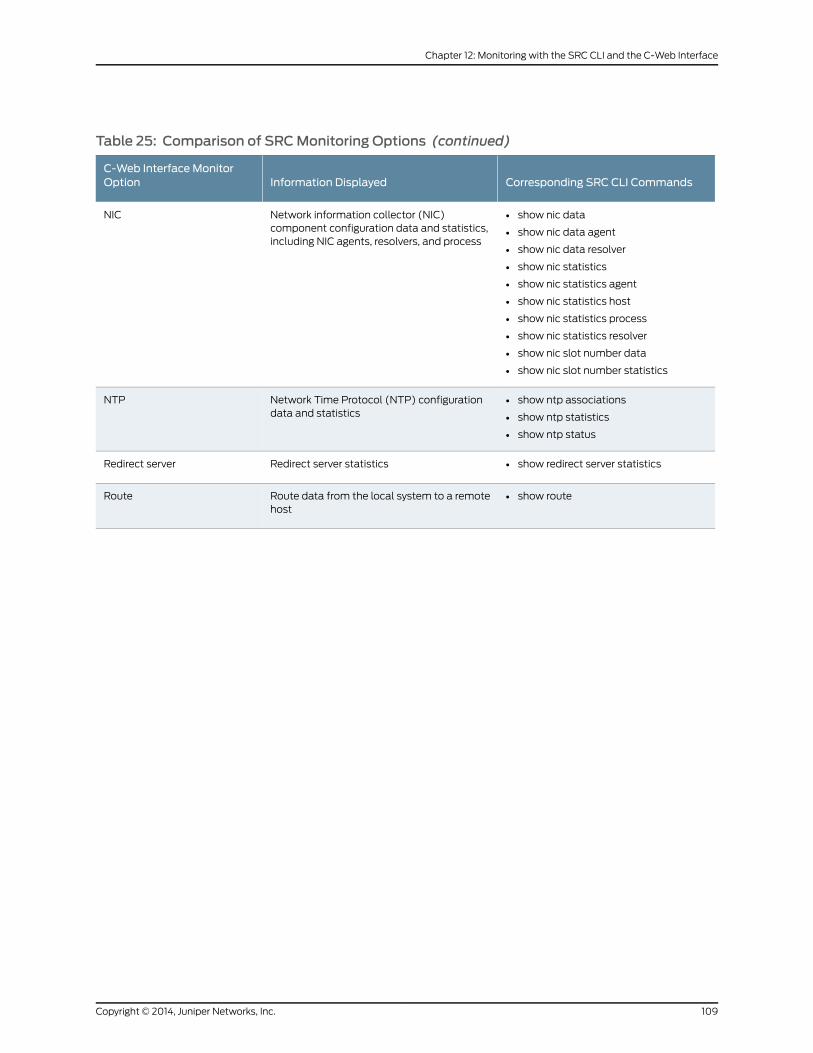
Table 25: Comparison of SRCMonitoring Options (continued)
Corresponding SRC CLI CommandsInformation DisplayedC-Web Interface MonitorOption
• show nic data
• show nic data agent
• show nic data resolver
• show nic statistics
• show nic statistics agent
• show nic statistics host
• show nic statistics process
• show nic statistics resolver
• show nic slot number data
• show nic slot number statistics
Network information collector (NIC)component configuration data and statistics,including NIC agents, resolvers, and process
NIC
• show ntp associations
• show ntp statistics
• show ntp status
Network Time Protocol (NTP) configurationdata and statistics
NTP
• show redirect server statisticsRedirect server statisticsRedirect server
• show routeRoute data from the local system to a remotehost
Route
109Copyright © 2014, Juniper Networks, Inc.
Chapter 12: Monitoring with the SRC CLI and the C-Web Interface
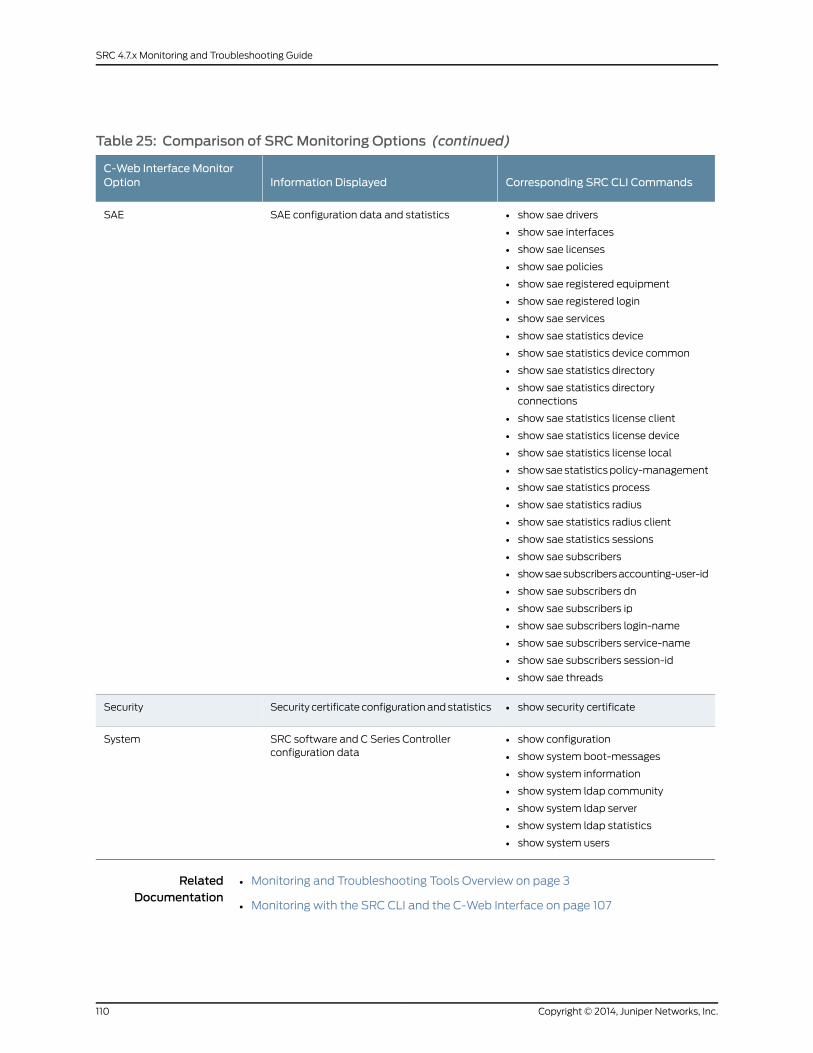
Table 25: Comparison of SRCMonitoring Options (continued)
Corresponding SRC CLI CommandsInformation DisplayedC-Web Interface MonitorOption
• show sae drivers
• show sae interfaces
• show sae licenses
• show sae policies
• show sae registered equipment
• show sae registered login
• show sae services
• show sae statistics device
• show sae statistics device common
• show sae statistics directory
• show sae statistics directoryconnections
• show sae statistics license client
• show sae statistics license device
• show sae statistics license local
• show sae statistics policy-management
• show sae statistics process
• show sae statistics radius
• show sae statistics radius client
• show sae statistics sessions
• show sae subscribers
• show sae subscribers accounting-user-id
• show sae subscribers dn
• show sae subscribers ip
• show sae subscribers login-name
• show sae subscribers service-name
• show sae subscribers session-id
• show sae threads
SAE configuration data and statisticsSAE
• show security certificateSecurity certificate configuration and statisticsSecurity
• show configuration
• show system boot-messages
• show system information
• show system ldap community
• show system ldap server
• show system ldap statistics
• show system users
SRC software and C Series Controllerconfiguration data
System
RelatedDocumentation
• Monitoring and Troubleshooting Tools Overview on page 3
• Monitoring with the SRC CLI and the C-Web Interface on page 107
Copyright © 2014, Juniper Networks, Inc.110
SRC 4.7.x Monitoring and Troubleshooting Guide
CHAPTER 13
Monitoring the System (SRC CLI)
• Viewing Information About a C Series Controller (SRC CLI) on page 111
• Viewing Information About Components Installed (SRC CLI) on page 113
• Viewing Information About Boot Messages (SRC CLI) on page 113
• Viewing Information About Security Certificates (SRC CLI) on page 115
Viewing Information About a C Series Controller (SRC CLI)
Purpose View information about a C Series Controller.
111Copyright © 2014, Juniper Networks, Inc.
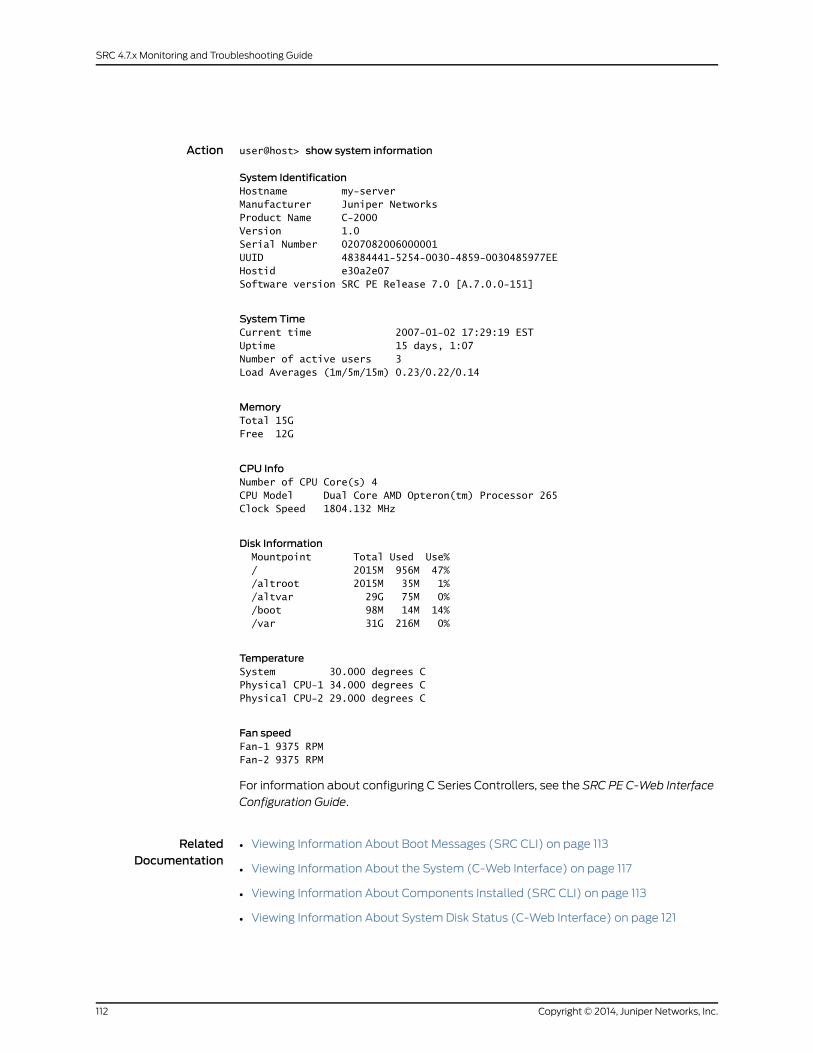
Action user@host> show system information
System IdentificationHostname my-serverManufacturer Juniper NetworksProduct Name C-2000Version 1.0Serial Number 0207082006000001UUID 48384441-5254-0030-4859-0030485977EEHostid e30a2e07Software version SRC PE Release 7.0 [A.7.0.0-151]
System TimeCurrent time 2007-01-02 17:29:19 ESTUptime 15 days, 1:07Number of active users 3Load Averages (1m/5m/15m) 0.23/0.22/0.14
MemoryTotal 15GFree 12G
CPU InfoNumber of CPU Core(s) 4CPU Model Dual Core AMD Opteron(tm) Processor 265Clock Speed 1804.132 MHz
Disk Information Mountpoint Total Used Use% / 2015M 956M 47% /altroot 2015M 35M 1% /altvar 29G 75M 0% /boot 98M 14M 14% /var 31G 216M 0%
TemperatureSystem 30.000 degrees CPhysical CPU-1 34.000 degrees CPhysical CPU-2 29.000 degrees C
Fan speedFan-1 9375 RPMFan-2 9375 RPM
For information about configuring C Series Controllers, see the SRC PE C-Web Interface
Configuration Guide.
RelatedDocumentation
Viewing Information About Boot Messages (SRC CLI) on page 113•
• Viewing Information About the System (C-Web Interface) on page 117
• Viewing Information About Components Installed (SRC CLI) on page 113
• Viewing Information About System Disk Status (C-Web Interface) on page 121
Copyright © 2014, Juniper Networks, Inc.112
SRC 4.7.x Monitoring and Troubleshooting Guide
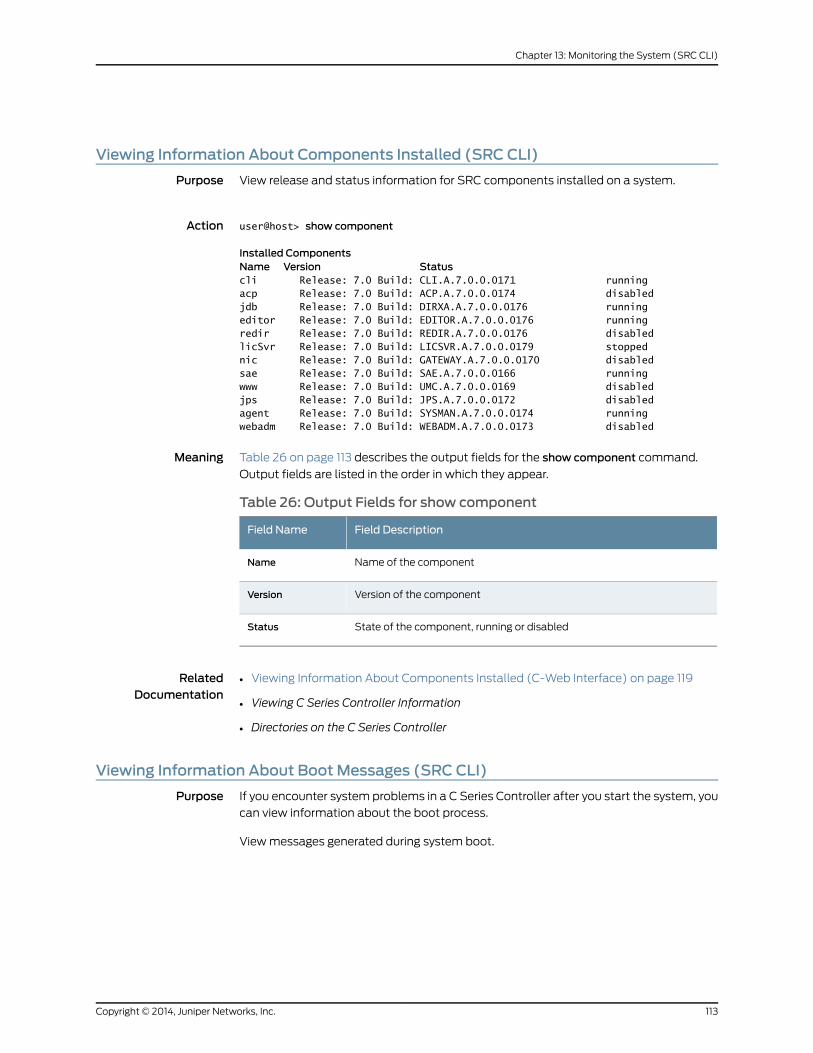
Viewing Information About Components Installed (SRC CLI)
Purpose View release and status information for SRC components installed on a system.
Action user@host> show component
Installed ComponentsName Version Statuscli Release: 7.0 Build: CLI.A.7.0.0.0171 running acp Release: 7.0 Build: ACP.A.7.0.0.0174 disabledjdb Release: 7.0 Build: DIRXA.A.7.0.0.0176 running editor Release: 7.0 Build: EDITOR.A.7.0.0.0176 running redir Release: 7.0 Build: REDIR.A.7.0.0.0176 disabledlicSvr Release: 7.0 Build: LICSVR.A.7.0.0.0179 stopped nic Release: 7.0 Build: GATEWAY.A.7.0.0.0170 disabledsae Release: 7.0 Build: SAE.A.7.0.0.0166 running www Release: 7.0 Build: UMC.A.7.0.0.0169 disabledjps Release: 7.0 Build: JPS.A.7.0.0.0172 disabledagent Release: 7.0 Build: SYSMAN.A.7.0.0.0174 running webadm Release: 7.0 Build: WEBADM.A.7.0.0.0173 disabled
Meaning Table 26 on page 113 describes the output fields for the show component command.
Output fields are listed in the order in which they appear.
Table 26: Output Fields for show component
Field DescriptionField Name
Name of the componentName
Version of the componentVersion
State of the component, running or disabledStatus
RelatedDocumentation
Viewing Information About Components Installed (C-Web Interface) on page 119•
• Viewing C Series Controller Information
• Directories on the C Series Controller
Viewing Information About Boot Messages (SRC CLI)
Purpose If you encounter system problems in a C Series Controller after you start the system, you
can view information about the boot process.
View messages generated during system boot.
113Copyright © 2014, Juniper Networks, Inc.
Chapter 13: Monitoring the System (SRC CLI)
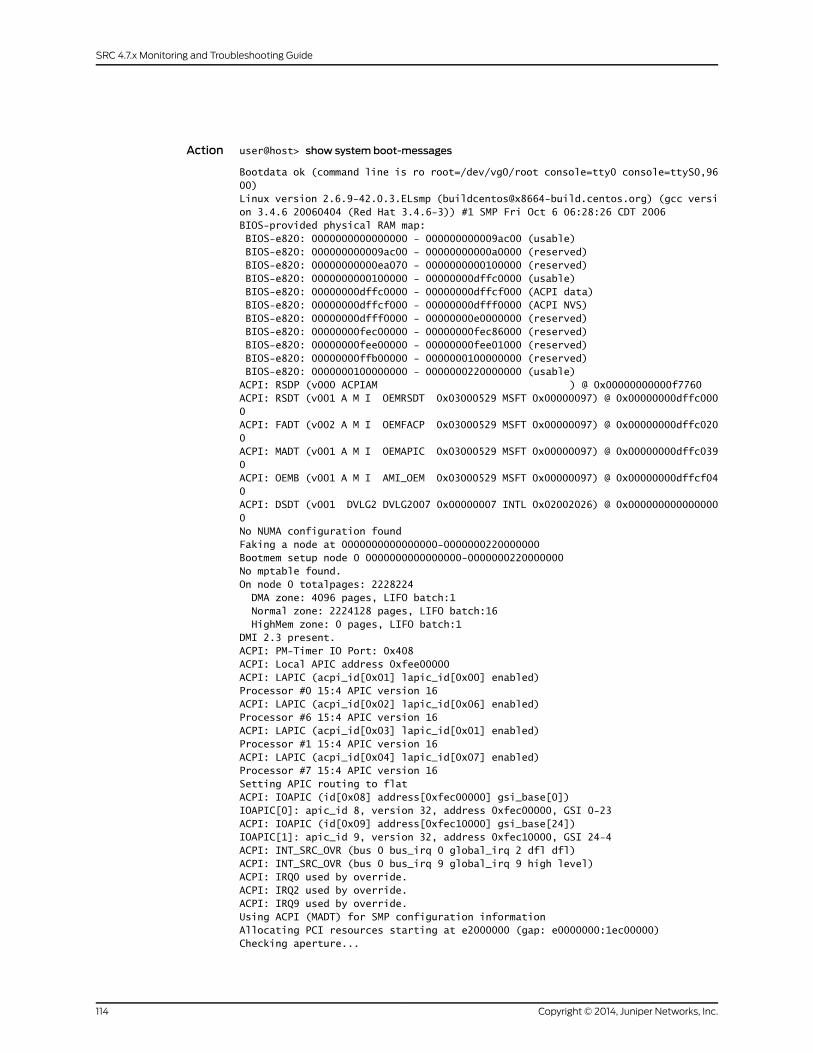
Action user@host> show system boot-messages
Bootdata ok (command line is ro root=/dev/vg0/root console=tty0 console=ttyS0,9600)Linux version 2.6.9-42.0.3.ELsmp ([email protected]) (gcc version 3.4.6 20060404 (Red Hat 3.4.6-3)) #1 SMP Fri Oct 6 06:28:26 CDT 2006BIOS-provided physical RAM map: BIOS-e820: 0000000000000000 - 000000000009ac00 (usable) BIOS-e820: 000000000009ac00 - 00000000000a0000 (reserved) BIOS-e820: 00000000000ea070 - 0000000000100000 (reserved) BIOS-e820: 0000000000100000 - 00000000dffc0000 (usable) BIOS-e820: 00000000dffc0000 - 00000000dffcf000 (ACPI data) BIOS-e820: 00000000dffcf000 - 00000000dfff0000 (ACPI NVS) BIOS-e820: 00000000dfff0000 - 00000000e0000000 (reserved) BIOS-e820: 00000000fec00000 - 00000000fec86000 (reserved) BIOS-e820: 00000000fee00000 - 00000000fee01000 (reserved) BIOS-e820: 00000000ffb00000 - 0000000100000000 (reserved) BIOS-e820: 0000000100000000 - 0000000220000000 (usable)ACPI: RSDP (v000 ACPIAM ) @ 0x00000000000f7760ACPI: RSDT (v001 A M I OEMRSDT 0x03000529 MSFT 0x00000097) @ 0x00000000dffc0000ACPI: FADT (v002 A M I OEMFACP 0x03000529 MSFT 0x00000097) @ 0x00000000dffc0200ACPI: MADT (v001 A M I OEMAPIC 0x03000529 MSFT 0x00000097) @ 0x00000000dffc0390ACPI: OEMB (v001 A M I AMI_OEM 0x03000529 MSFT 0x00000097) @ 0x00000000dffcf040ACPI: DSDT (v001 DVLG2 DVLG2007 0x00000007 INTL 0x02002026) @ 0x0000000000000000No NUMA configuration foundFaking a node at 0000000000000000-0000000220000000Bootmem setup node 0 0000000000000000-0000000220000000No mptable found.On node 0 totalpages: 2228224 DMA zone: 4096 pages, LIFO batch:1 Normal zone: 2224128 pages, LIFO batch:16 HighMem zone: 0 pages, LIFO batch:1DMI 2.3 present.ACPI: PM-Timer IO Port: 0x408ACPI: Local APIC address 0xfee00000ACPI: LAPIC (acpi_id[0x01] lapic_id[0x00] enabled)Processor #0 15:4 APIC version 16ACPI: LAPIC (acpi_id[0x02] lapic_id[0x06] enabled)Processor #6 15:4 APIC version 16ACPI: LAPIC (acpi_id[0x03] lapic_id[0x01] enabled)Processor #1 15:4 APIC version 16ACPI: LAPIC (acpi_id[0x04] lapic_id[0x07] enabled)Processor #7 15:4 APIC version 16Setting APIC routing to flatACPI: IOAPIC (id[0x08] address[0xfec00000] gsi_base[0])IOAPIC[0]: apic_id 8, version 32, address 0xfec00000, GSI 0-23ACPI: IOAPIC (id[0x09] address[0xfec10000] gsi_base[24])IOAPIC[1]: apic_id 9, version 32, address 0xfec10000, GSI 24-4ACPI: INT_SRC_OVR (bus 0 bus_irq 0 global_irq 2 dfl dfl)ACPI: INT_SRC_OVR (bus 0 bus_irq 9 global_irq 9 high level)ACPI: IRQ0 used by override.ACPI: IRQ2 used by override.ACPI: IRQ9 used by override.Using ACPI (MADT) for SMP configuration informationAllocating PCI resources starting at e2000000 (gap: e0000000:1ec00000)Checking aperture...
Copyright © 2014, Juniper Networks, Inc.114
SRC 4.7.x Monitoring and Troubleshooting Guide
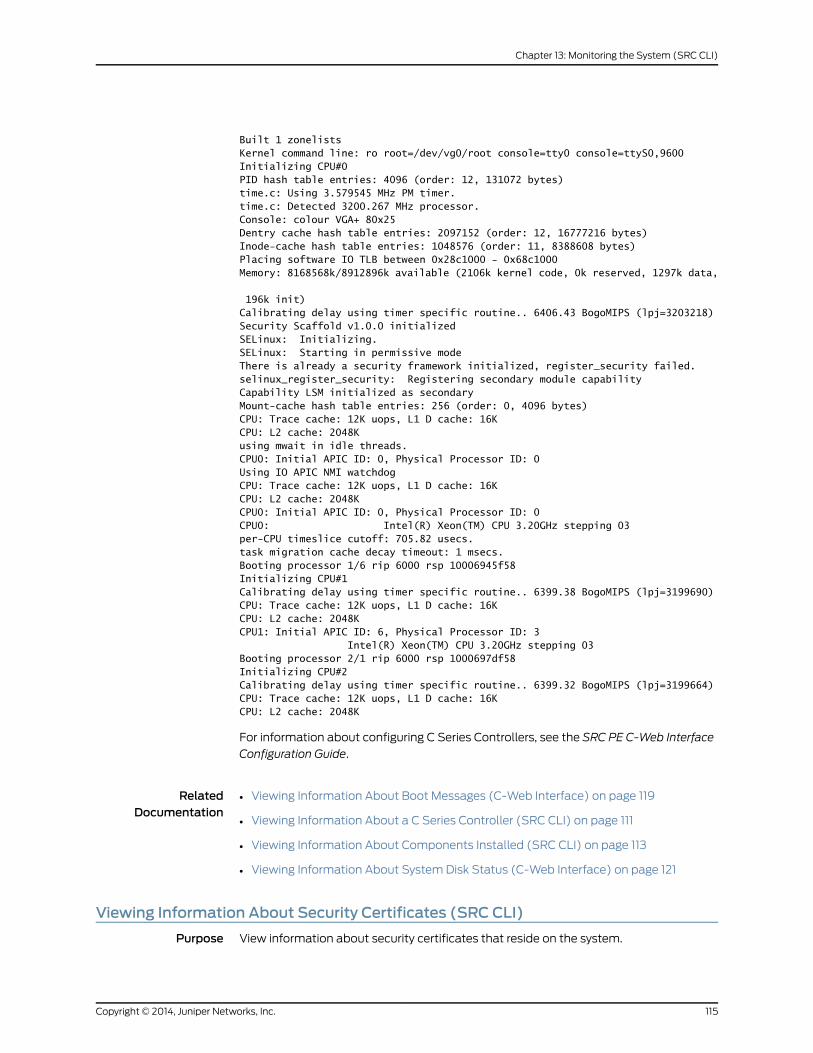
Built 1 zonelistsKernel command line: ro root=/dev/vg0/root console=tty0 console=ttyS0,9600Initializing CPU#0PID hash table entries: 4096 (order: 12, 131072 bytes)time.c: Using 3.579545 MHz PM timer.time.c: Detected 3200.267 MHz processor.Console: colour VGA+ 80x25Dentry cache hash table entries: 2097152 (order: 12, 16777216 bytes)Inode-cache hash table entries: 1048576 (order: 11, 8388608 bytes)Placing software IO TLB between 0x28c1000 - 0x68c1000Memory: 8168568k/8912896k available (2106k kernel code, 0k reserved, 1297k data,
196k init)Calibrating delay using timer specific routine.. 6406.43 BogoMIPS (lpj=3203218)Security Scaffold v1.0.0 initializedSELinux: Initializing.SELinux: Starting in permissive modeThere is already a security framework initialized, register_security failed.selinux_register_security: Registering secondary module capabilityCapability LSM initialized as secondaryMount-cache hash table entries: 256 (order: 0, 4096 bytes)CPU: Trace cache: 12K uops, L1 D cache: 16KCPU: L2 cache: 2048Kusing mwait in idle threads.CPU0: Initial APIC ID: 0, Physical Processor ID: 0Using IO APIC NMI watchdogCPU: Trace cache: 12K uops, L1 D cache: 16KCPU: L2 cache: 2048KCPU0: Initial APIC ID: 0, Physical Processor ID: 0CPU0: Intel(R) Xeon(TM) CPU 3.20GHz stepping 03per-CPU timeslice cutoff: 705.82 usecs.task migration cache decay timeout: 1 msecs.Booting processor 1/6 rip 6000 rsp 10006945f58Initializing CPU#1Calibrating delay using timer specific routine.. 6399.38 BogoMIPS (lpj=3199690)CPU: Trace cache: 12K uops, L1 D cache: 16KCPU: L2 cache: 2048KCPU1: Initial APIC ID: 6, Physical Processor ID: 3 Intel(R) Xeon(TM) CPU 3.20GHz stepping 03Booting processor 2/1 rip 6000 rsp 1000697df58Initializing CPU#2Calibrating delay using timer specific routine.. 6399.32 BogoMIPS (lpj=3199664)CPU: Trace cache: 12K uops, L1 D cache: 16KCPU: L2 cache: 2048K
For information about configuring C Series Controllers, see the SRC PE C-Web Interface
Configuration Guide.
RelatedDocumentation
Viewing Information About Boot Messages (C-Web Interface) on page 119•
• Viewing Information About a C Series Controller (SRC CLI) on page 111
• Viewing Information About Components Installed (SRC CLI) on page 113
• Viewing Information About System Disk Status (C-Web Interface) on page 121
Viewing Information About Security Certificates (SRC CLI)
Purpose View information about security certificates that reside on the system.
115Copyright © 2014, Juniper Networks, Inc.
Chapter 13: Monitoring the System (SRC CLI)
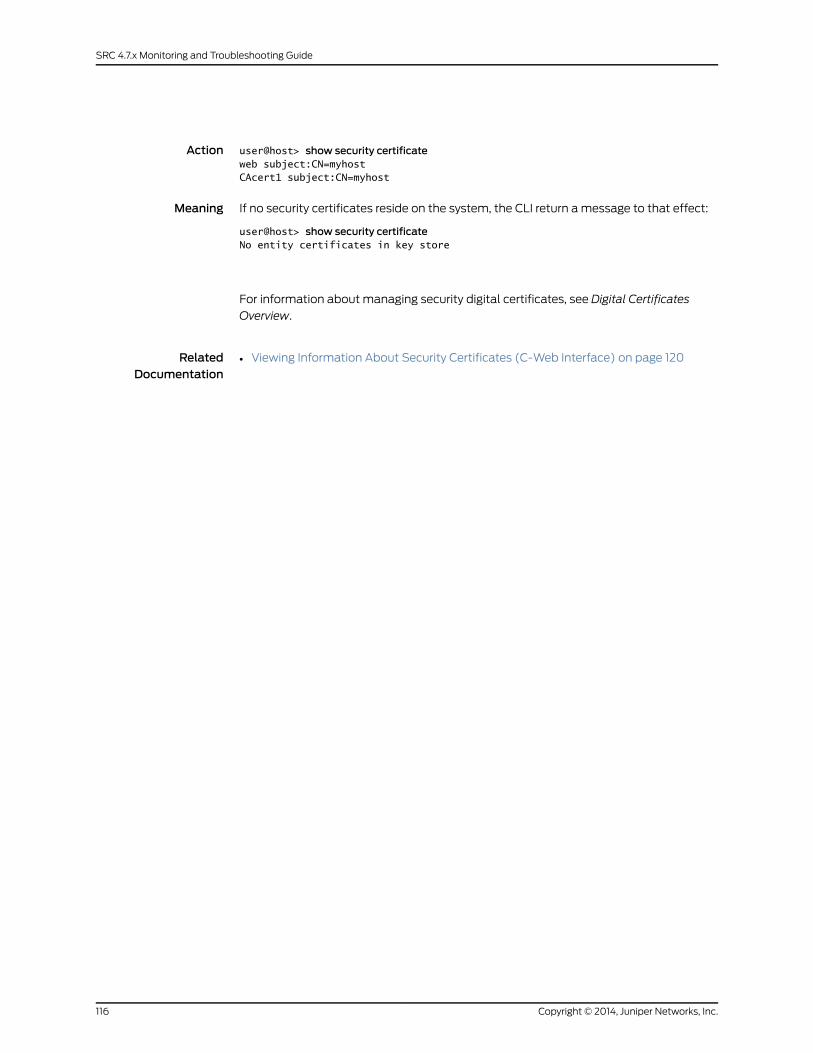
Action user@host> show security certificateweb subject:CN=myhostCAcert1 subject:CN=myhost
Meaning If no security certificates reside on the system, the CLI return a message to that effect:
user@host> show security certificateNo entity certificates in key store
For information about managing security digital certificates, see Digital Certificates
Overview.
RelatedDocumentation
• Viewing Information About Security Certificates (C-Web Interface) on page 120
Copyright © 2014, Juniper Networks, Inc.116
SRC 4.7.x Monitoring and Troubleshooting Guide
CHAPTER 14
Monitoring theSystem(C-Web Interface)
• Viewing Information About the System (C-Web Interface) on page 117
• Viewing the System Date and Time (C-Web Interface) on page 118
• Viewing Information About Components Installed (C-Web Interface) on page 119
• Viewing Information About Boot Messages (C-Web Interface) on page 119
• Viewing Information About Security Certificates (C-Web Interface) on page 120
• Viewing Information About System Disk Status (C-Web Interface) on page 121
• Viewing Information About the Users on the System (C-Web Interface) on page 121
• Viewing Information About the Juniper Networks Database in Community Mode (C-Web
Interface) on page 122
• Viewing Statistics for the Juniper Networks Database (C-Web Interface) on page 123
• Viewing Information About the SRC CLI (C-Web Interface) on page 123
Viewing Information About the System (C-Web Interface)
Purpose View system information.
You can view information about the SRC software, including system identification and
the system time. You can also view information about the environment of the C Series
Controller, including memory, temperature, and fan speeds.
117Copyright © 2014, Juniper Networks, Inc.
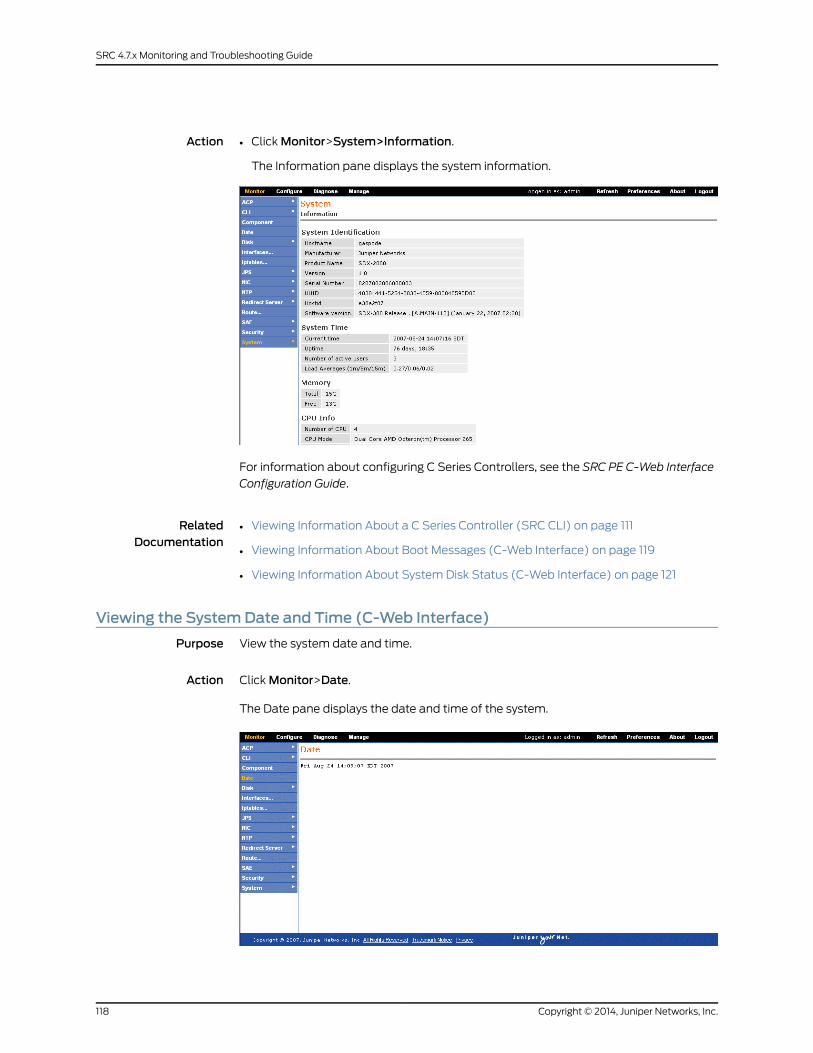
Action • Click Monitor>System>Information.
The Information pane displays the system information.
For information about configuring C Series Controllers, see the SRC PE C-Web Interface
Configuration Guide.
RelatedDocumentation
Viewing Information About a C Series Controller (SRC CLI) on page 111•
• Viewing Information About Boot Messages (C-Web Interface) on page 119
• Viewing Information About System Disk Status (C-Web Interface) on page 121
Viewing the SystemDate and Time (C-Web Interface)
Purpose View the system date and time.
Action Click Monitor>Date.
The Date pane displays the date and time of the system.
Copyright © 2014, Juniper Networks, Inc.118
SRC 4.7.x Monitoring and Troubleshooting Guide
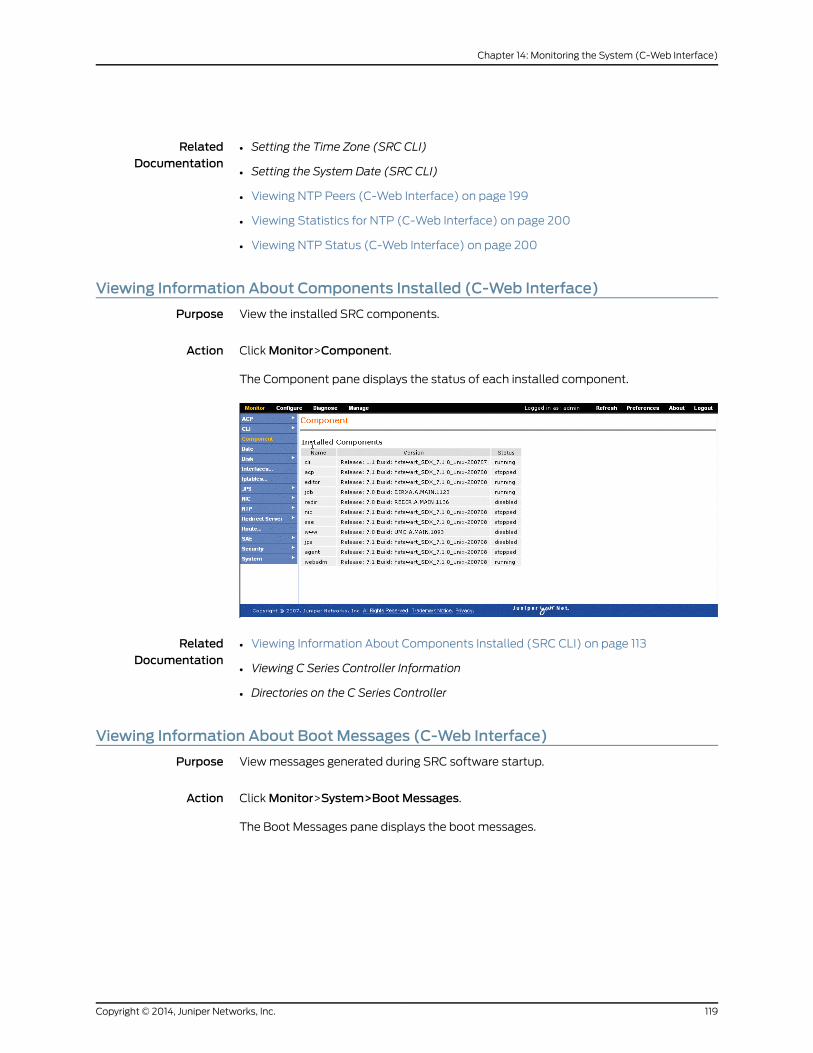
RelatedDocumentation
Setting the Time Zone (SRC CLI)•
• Setting the System Date (SRC CLI)
• Viewing NTP Peers (C-Web Interface) on page 199
• Viewing Statistics for NTP (C-Web Interface) on page 200
• Viewing NTP Status (C-Web Interface) on page 200
Viewing Information About Components Installed (C-Web Interface)
Purpose View the installed SRC components.
Action Click Monitor>Component.
The Component pane displays the status of each installed component.
RelatedDocumentation
Viewing Information About Components Installed (SRC CLI) on page 113•
• Viewing C Series Controller Information
• Directories on the C Series Controller
Viewing Information About Boot Messages (C-Web Interface)
Purpose View messages generated during SRC software startup.
Action Click Monitor>System>Boot Messages.
The Boot Messages pane displays the boot messages.
119Copyright © 2014, Juniper Networks, Inc.
Chapter 14: Monitoring the System (C-Web Interface)
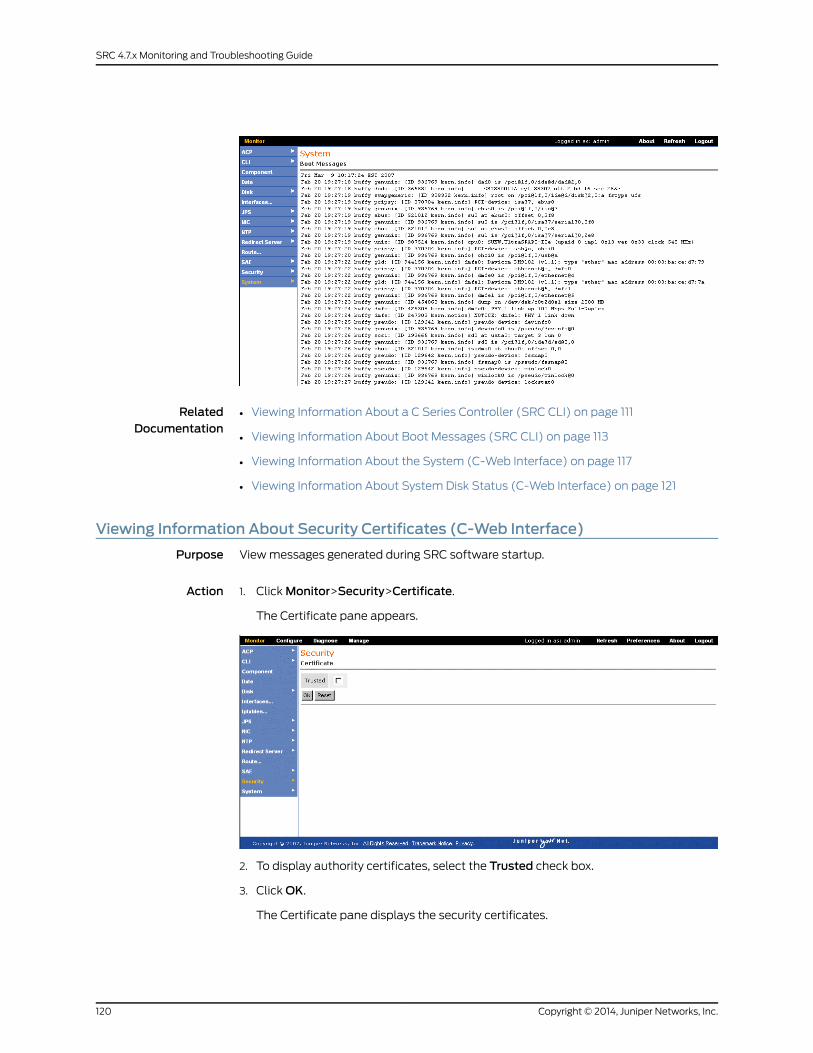
RelatedDocumentation
Viewing Information About a C Series Controller (SRC CLI) on page 111•
• Viewing Information About Boot Messages (SRC CLI) on page 113
• Viewing Information About the System (C-Web Interface) on page 117
• Viewing Information About System Disk Status (C-Web Interface) on page 121
Viewing Information About Security Certificates (C-Web Interface)
Purpose View messages generated during SRC software startup.
Action Click Monitor>Security>Certificate.1.
The Certificate pane appears.
2. To display authority certificates, select the Trusted check box.
3. Click OK.
The Certificate pane displays the security certificates.
Copyright © 2014, Juniper Networks, Inc.120
SRC 4.7.x Monitoring and Troubleshooting Guide
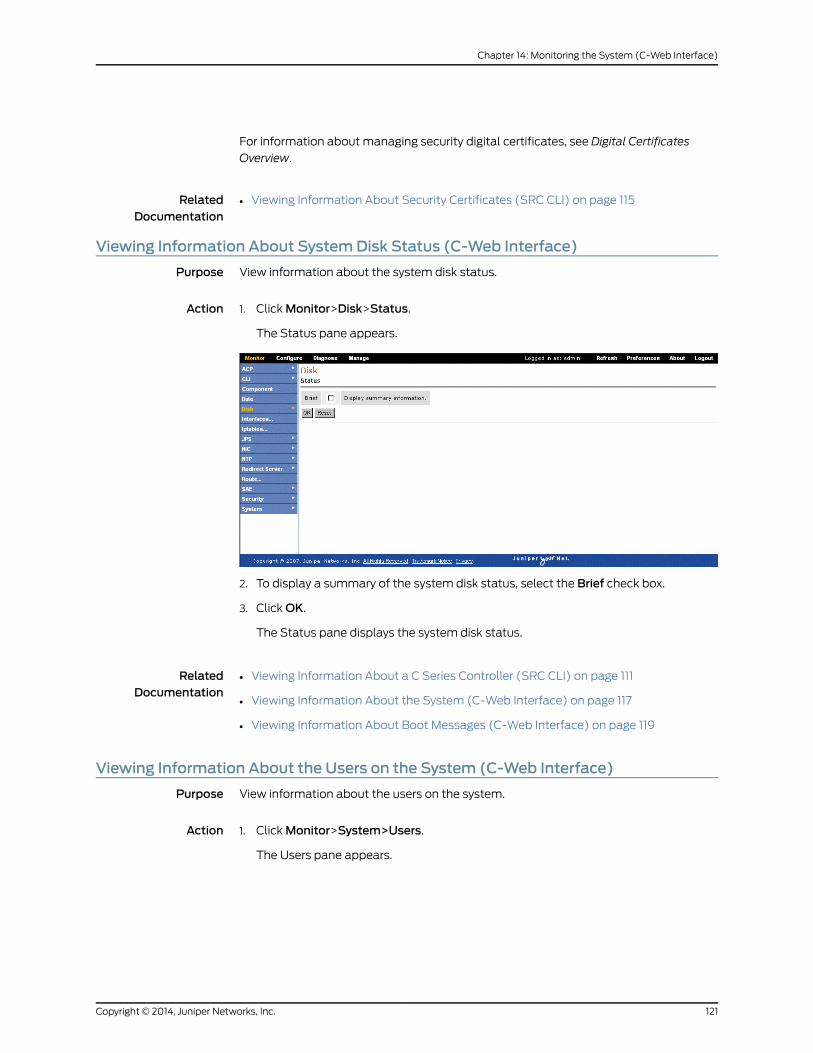
For information about managing security digital certificates, see Digital Certificates
Overview.
RelatedDocumentation
Viewing Information About Security Certificates (SRC CLI) on page 115•
Viewing Information About SystemDisk Status (C-Web Interface)
Purpose View information about the system disk status.
Action Click Monitor>Disk>Status.1.
The Status pane appears.
2. To display a summary of the system disk status, select the Brief check box.
3. Click OK.
The Status pane displays the system disk status.
RelatedDocumentation
Viewing Information About a C Series Controller (SRC CLI) on page 111•
• Viewing Information About the System (C-Web Interface) on page 117
• Viewing Information About Boot Messages (C-Web Interface) on page 119
Viewing Information About the Users on the System (C-Web Interface)
Purpose View information about the users on the system.
Action Click Monitor>System>Users.1.
The Users pane appears.
121Copyright © 2014, Juniper Networks, Inc.
Chapter 14: Monitoring the System (C-Web Interface)
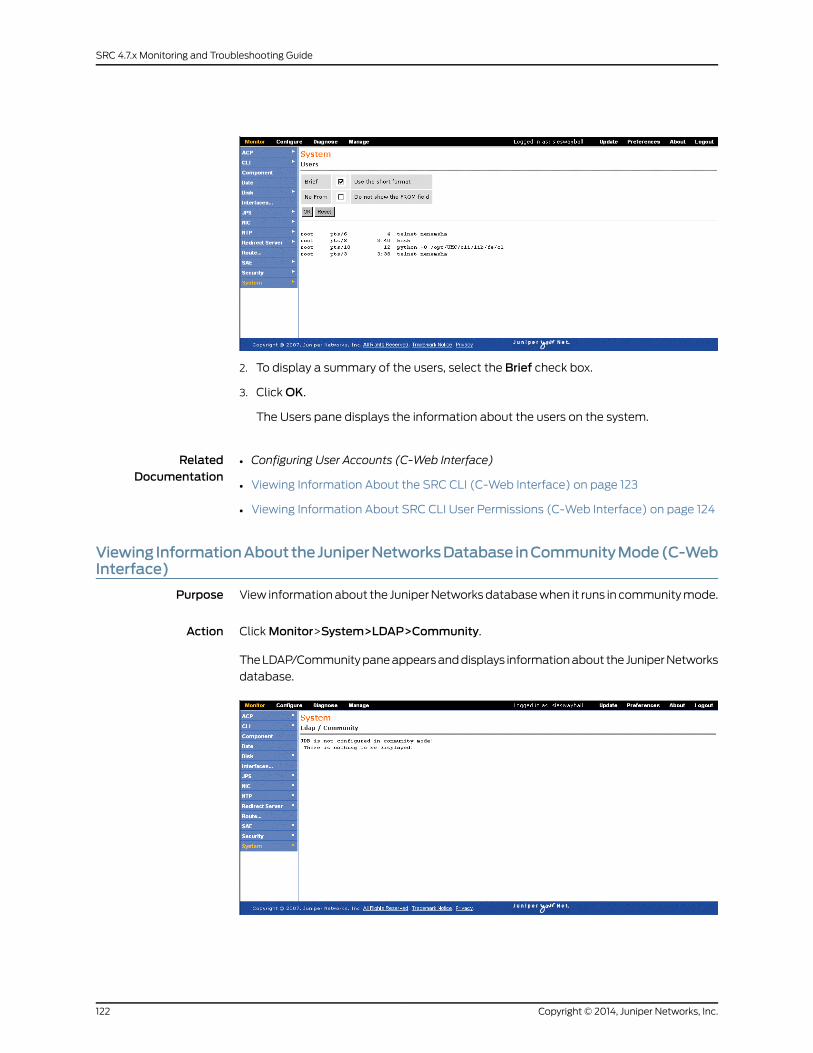
2. To display a summary of the users, select the Brief check box.
3. Click OK.
The Users pane displays the information about the users on the system.
RelatedDocumentation
Configuring User Accounts (C-Web Interface)•
• Viewing Information About the SRC CLI (C-Web Interface) on page 123
• Viewing Information About SRC CLI User Permissions (C-Web Interface) on page 124
Viewing InformationAbouttheJuniperNetworksDatabase inCommunityMode(C-WebInterface)
Purpose View information about the Juniper Networks database when it runs in community mode.
Action Click Monitor>System>LDAP>Community.
The LDAP/Community pane appears and displays information about the Juniper Networks
database.
Copyright © 2014, Juniper Networks, Inc.122
SRC 4.7.x Monitoring and Troubleshooting Guide
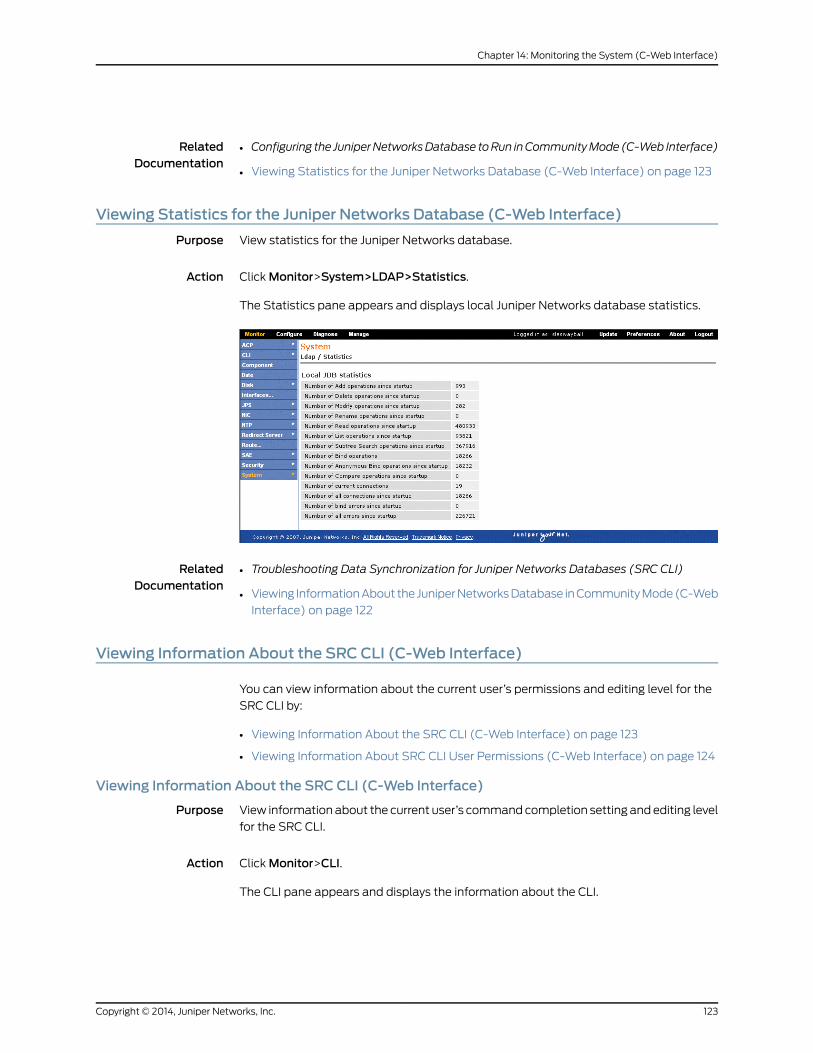
RelatedDocumentation
Configuring the JuniperNetworksDatabase toRun inCommunityMode (C-Web Interface)•
• Viewing Statistics for the Juniper Networks Database (C-Web Interface) on page 123
Viewing Statistics for the Juniper Networks Database (C-Web Interface)
Purpose View statistics for the Juniper Networks database.
Action Click Monitor>System>LDAP>Statistics.
The Statistics pane appears and displays local Juniper Networks database statistics.
RelatedDocumentation
Troubleshooting Data Synchronization for Juniper Networks Databases (SRC CLI)•
• Viewing Information About the Juniper Networks Database in Community Mode (C-Web
Interface) on page 122
Viewing Information About the SRC CLI (C-Web Interface)
You can view information about the current user’s permissions and editing level for the
SRC CLI by:
• Viewing Information About the SRC CLI (C-Web Interface) on page 123
• Viewing Information About SRC CLI User Permissions (C-Web Interface) on page 124
Viewing Information About the SRC CLI (C-Web Interface)
Purpose View information about the current user’s command completion setting and editing level
for the SRC CLI.
Action Click Monitor>CLI.
The CLI pane appears and displays the information about the CLI.
123Copyright © 2014, Juniper Networks, Inc.
Chapter 14: Monitoring the System (C-Web Interface)
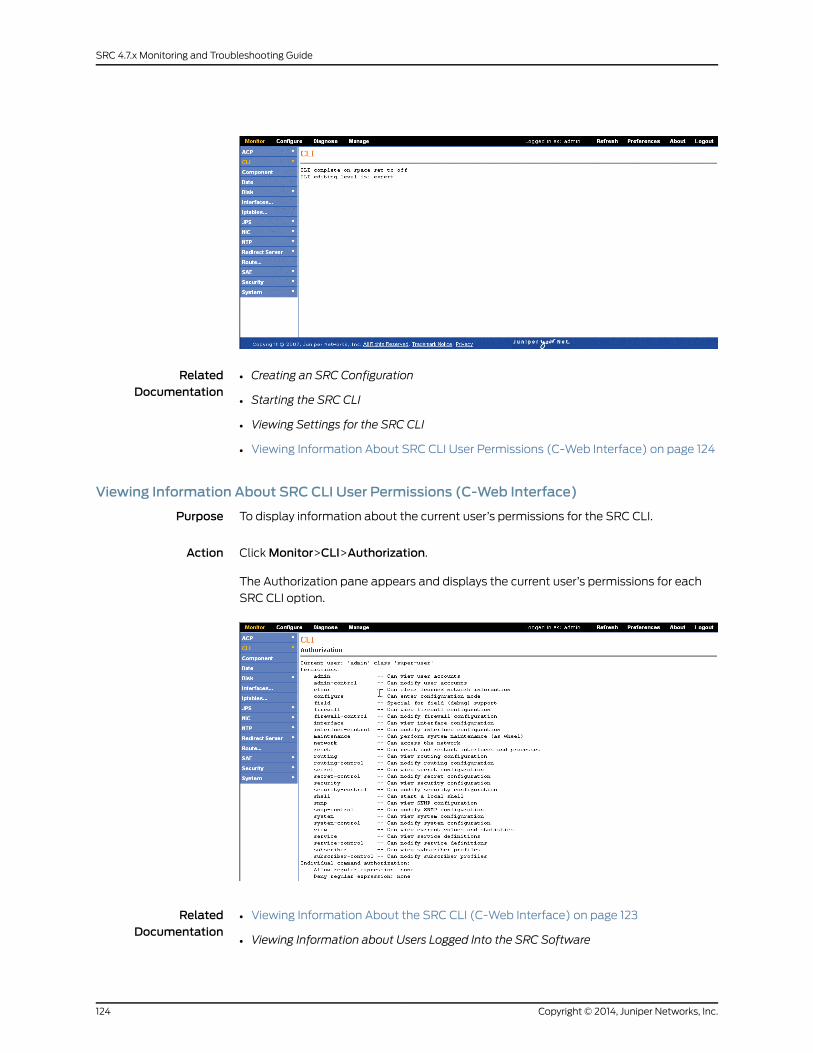
RelatedDocumentation
Creating an SRC Configuration•
• Starting the SRC CLI
• Viewing Settings for the SRC CLI
• Viewing Information About SRC CLI User Permissions (C-Web Interface) on page 124
Viewing Information About SRC CLI User Permissions (C-Web Interface)
Purpose To display information about the current user’s permissions for the SRC CLI.
Action Click Monitor>CLI>Authorization.
The Authorization pane appears and displays the current user’s permissions for each
SRC CLI option.
RelatedDocumentation
• Viewing Information About the SRC CLI (C-Web Interface) on page 123
• Viewing Information about Users Logged Into the SRC Software
Copyright © 2014, Juniper Networks, Inc.124
SRC 4.7.x Monitoring and Troubleshooting Guide
CHAPTER 15
Monitoring SAE Data (SRC CLI)
• Viewing SAE Data with the CLI on page 125
• Viewing Information About Subscriber Sessions (SRC CLI) on page 134
• Viewing SAE SNMP Information with the CLI on page 142
Viewing SAE Data with the CLI
You can view information about the SAE active configuration for data currently stored
in the SAE server’s memory.
You can view SAE data by:
• Viewing Information About the Directory Blacklist (SRC CLI) on page 125
• Viewing Information About SAE Device Drivers (SRC CLI) on page 126
• Viewing the Synchronization Status of SAE Session Stores (SRC CLI) on page 127
• Viewing Information About SAE Interfaces (SRC CLI) on page 128
• Viewing Information About SAE Licenses (SRC CLI) on page 128
• Viewing Information About Policies on the SAE (SRC CLI) on page 129
• Viewing Login Registrations (SRC CLI) on page 130
• Viewing Equipment Registrations (SRC CLI) on page 131
• Viewing Information About Services (SRC CLI) on page 131
• Viewing Information About Threads (SRC CLI) on page 134
Viewing Information About the Directory Blacklist (SRC CLI)
Purpose View information about the directory blacklist configured on the SAE.
Action user@host> show sae directory-black-list
RelatedDocumentation
Removing the Directory Blacklist (C-Web Interface)•
• Initially Configuring the SAE
• Viewing Information About the Directory Blacklist (C-Web Interface) on page 153
• Viewing Information About SAE Device Drivers (SRC CLI) on page 126
125Copyright © 2014, Juniper Networks, Inc.
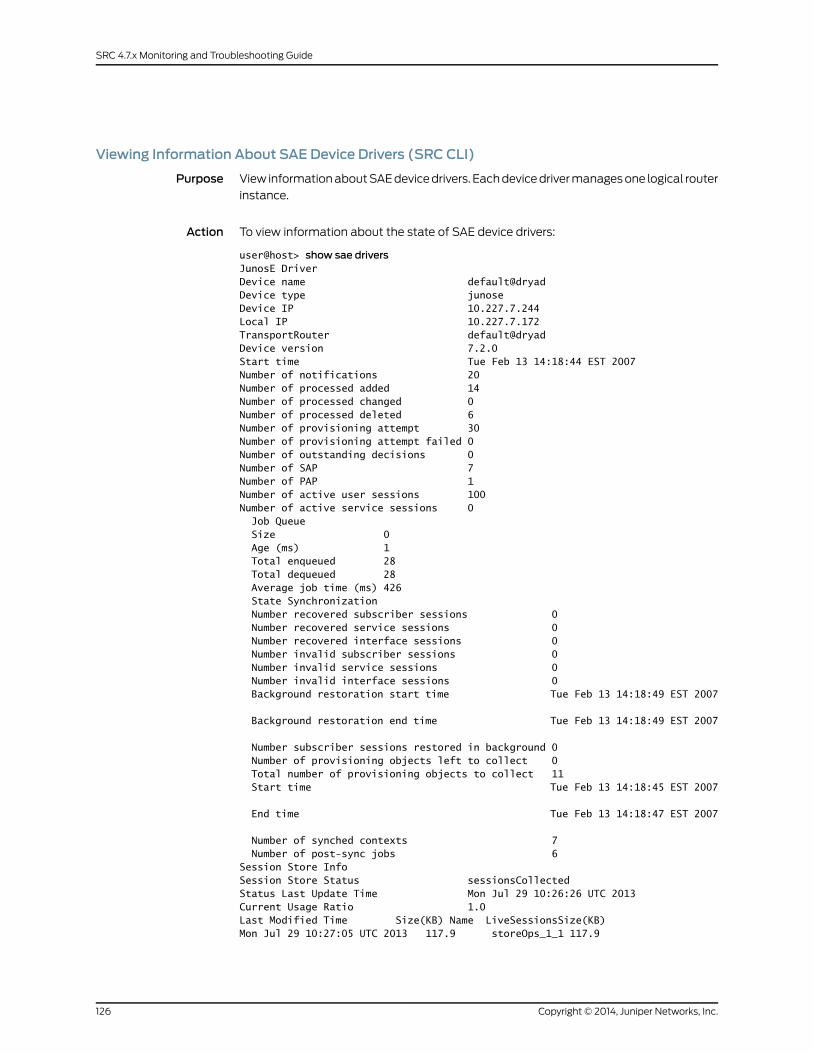
Viewing Information About SAE Device Drivers (SRC CLI)
Purpose View information about SAE device drivers. Each device driver manages one logical router
instance.
Action To view information about the state of SAE device drivers:
user@host> show sae driversJunosE DriverDevice name default@dryadDevice type junoseDevice IP 10.227.7.244Local IP 10.227.7.172TransportRouter default@dryadDevice version 7.2.0Start time Tue Feb 13 14:18:44 EST 2007Number of notifications 20Number of processed added 14Number of processed changed 0Number of processed deleted 6Number of provisioning attempt 30Number of provisioning attempt failed 0Number of outstanding decisions 0Number of SAP 7Number of PAP 1Number of active user sessions 100Number of active service sessions 0 Job Queue Size 0 Age (ms) 1 Total enqueued 28 Total dequeued 28 Average job time (ms) 426 State Synchronization Number recovered subscriber sessions 0 Number recovered service sessions 0 Number recovered interface sessions 0 Number invalid subscriber sessions 0 Number invalid service sessions 0 Number invalid interface sessions 0 Background restoration start time Tue Feb 13 14:18:49 EST 2007
Background restoration end time Tue Feb 13 14:18:49 EST 2007
Number subscriber sessions restored in background 0 Number of provisioning objects left to collect 0 Total number of provisioning objects to collect 11 Start time Tue Feb 13 14:18:45 EST 2007
End time Tue Feb 13 14:18:47 EST 2007
Number of synched contexts 7 Number of post-sync jobs 6Session Store InfoSession Store Status sessionsCollectedStatus Last Update Time Mon Jul 29 10:26:26 UTC 2013Current Usage Ratio 1.0Last Modified Time Size(KB) Name LiveSessionsSize(KB)Mon Jul 29 10:27:05 UTC 2013 117.9 storeOps_1_1 117.9
Copyright © 2014, Juniper Networks, Inc.126
SRC 4.7.x Monitoring and Troubleshooting Guide
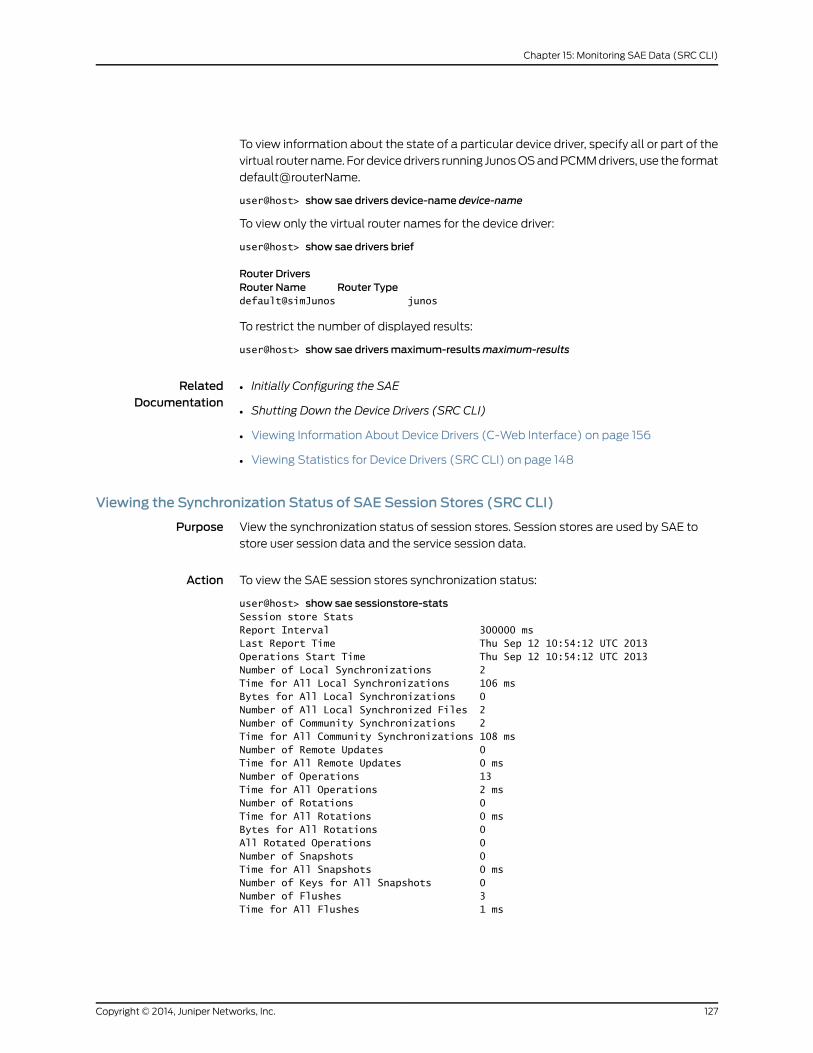
To view information about the state of a particular device driver, specify all or part of the
virtual router name. For device drivers running Junos OS and PCMM drivers, use the format
default@routerName.
user@host> show sae drivers device-name device-name
To view only the virtual router names for the device driver:
user@host> show sae drivers brief
Router DriversRouter Name Router Typedefault@simJunos junos
To restrict the number of displayed results:
user@host> show sae driversmaximum-resultsmaximum-results
RelatedDocumentation
Initially Configuring the SAE•
• Shutting Down the Device Drivers (SRC CLI)
• Viewing Information About Device Drivers (C-Web Interface) on page 156
• Viewing Statistics for Device Drivers (SRC CLI) on page 148
Viewing the Synchronization Status of SAE Session Stores (SRC CLI)
Purpose View the synchronization status of session stores. Session stores are used by SAE to
store user session data and the service session data.
Action To view the SAE session stores synchronization status:
user@host> show sae sessionstore-statsSession store StatsReport Interval 300000 msLast Report Time Thu Sep 12 10:54:12 UTC 2013Operations Start Time Thu Sep 12 10:54:12 UTC 2013Number of Local Synchronizations 2Time for All Local Synchronizations 106 msBytes for All Local Synchronizations 0Number of All Local Synchronized Files 2Number of Community Synchronizations 2Time for All Community Synchronizations 108 msNumber of Remote Updates 0Time for All Remote Updates 0 msNumber of Operations 13Time for All Operations 2 msNumber of Rotations 0Time for All Rotations 0 msBytes for All Rotations 0All Rotated Operations 0Number of Snapshots 0Time for All Snapshots 0 msNumber of Keys for All Snapshots 0Number of Flushes 3Time for All Flushes 1 ms
127Copyright © 2014, Juniper Networks, Inc.
Chapter 15: Monitoring SAE Data (SRC CLI)
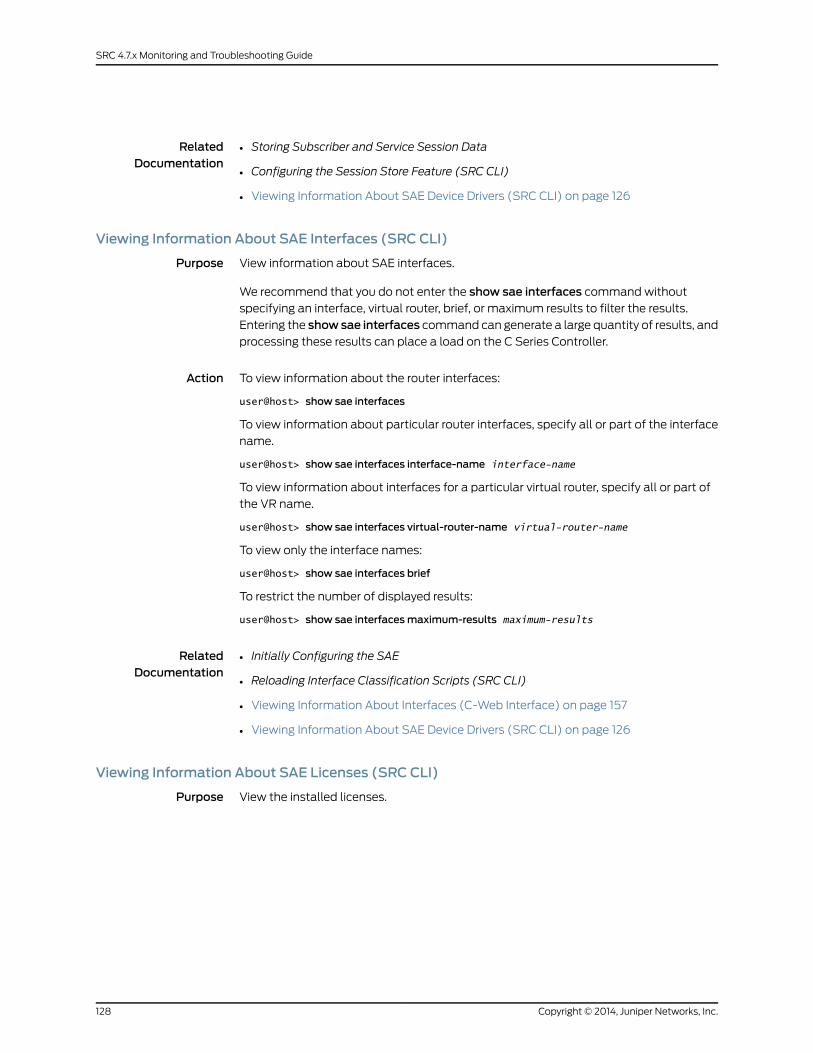
RelatedDocumentation
Storing Subscriber and Service Session Data•
• Configuring the Session Store Feature (SRC CLI)
• Viewing Information About SAE Device Drivers (SRC CLI) on page 126
Viewing Information About SAE Interfaces (SRC CLI)
Purpose View information about SAE interfaces.
We recommend that you do not enter the show sae interfaces command without
specifying an interface, virtual router, brief, or maximum results to filter the results.
Entering the showsae interfaces command can generate a large quantity of results, and
processing these results can place a load on the C Series Controller.
Action To view information about the router interfaces:
user@host> show sae interfaces
To view information about particular router interfaces, specify all or part of the interface
name.
user@host> show sae interfaces interface-name interface-name
To view information about interfaces for a particular virtual router, specify all or part of
the VR name.
user@host> show sae interfaces virtual-router-name virtual-router-name
To view only the interface names:
user@host> show sae interfaces brief
To restrict the number of displayed results:
user@host> show sae interfacesmaximum-results maximum-results
RelatedDocumentation
Initially Configuring the SAE•
• Reloading Interface Classification Scripts (SRC CLI)
• Viewing Information About Interfaces (C-Web Interface) on page 157
• Viewing Information About SAE Device Drivers (SRC CLI) on page 126
Viewing Information About SAE Licenses (SRC CLI)
Purpose View the installed licenses.
Copyright © 2014, Juniper Networks, Inc.128
SRC 4.7.x Monitoring and Troubleshooting Guide
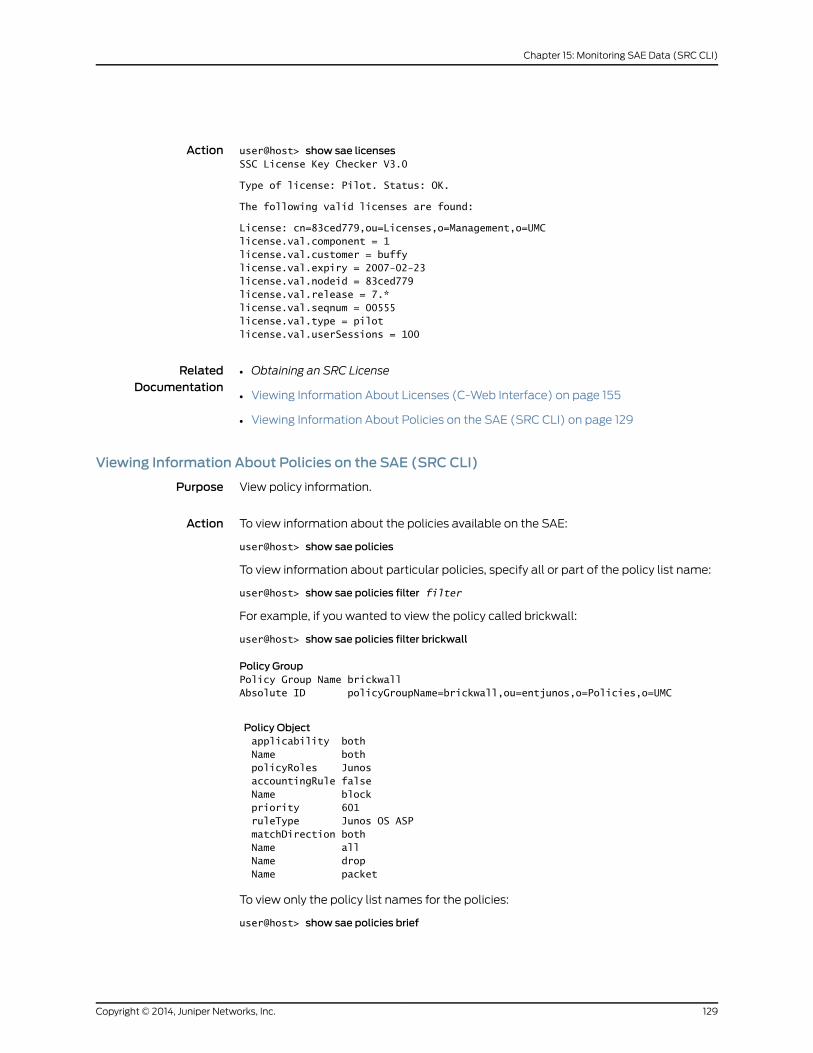
Action user@host> show sae licensesSSC License Key Checker V3.0
Type of license: Pilot. Status: OK.
The following valid licenses are found:
License: cn=83ced779,ou=Licenses,o=Management,o=UMClicense.val.component = 1license.val.customer = buffylicense.val.expiry = 2007-02-23license.val.nodeid = 83ced779license.val.release = 7.*license.val.seqnum = 00555license.val.type = pilotlicense.val.userSessions = 100
RelatedDocumentation
Obtaining an SRC License•
• Viewing Information About Licenses (C-Web Interface) on page 155
• Viewing Information About Policies on the SAE (SRC CLI) on page 129
Viewing Information About Policies on the SAE (SRC CLI)
Purpose View policy information.
Action To view information about the policies available on the SAE:
user@host> show sae policies
To view information about particular policies, specify all or part of the policy list name:
user@host> show sae policies filter filter
For example, if you wanted to view the policy called brickwall:
user@host> show sae policies filter brickwall
Policy GroupPolicy Group Name brickwallAbsolute ID policyGroupName=brickwall,ou=entjunos,o=Policies,o=UMC
Policy Object applicability both Name both policyRoles Junos accountingRule false Name block priority 601 ruleType Junos OS ASP matchDirection both Name all Name drop Name packet
To view only the policy list names for the policies:
user@host> show sae policies brief
129Copyright © 2014, Juniper Networks, Inc.
Chapter 15: Monitoring SAE Data (SRC CLI)
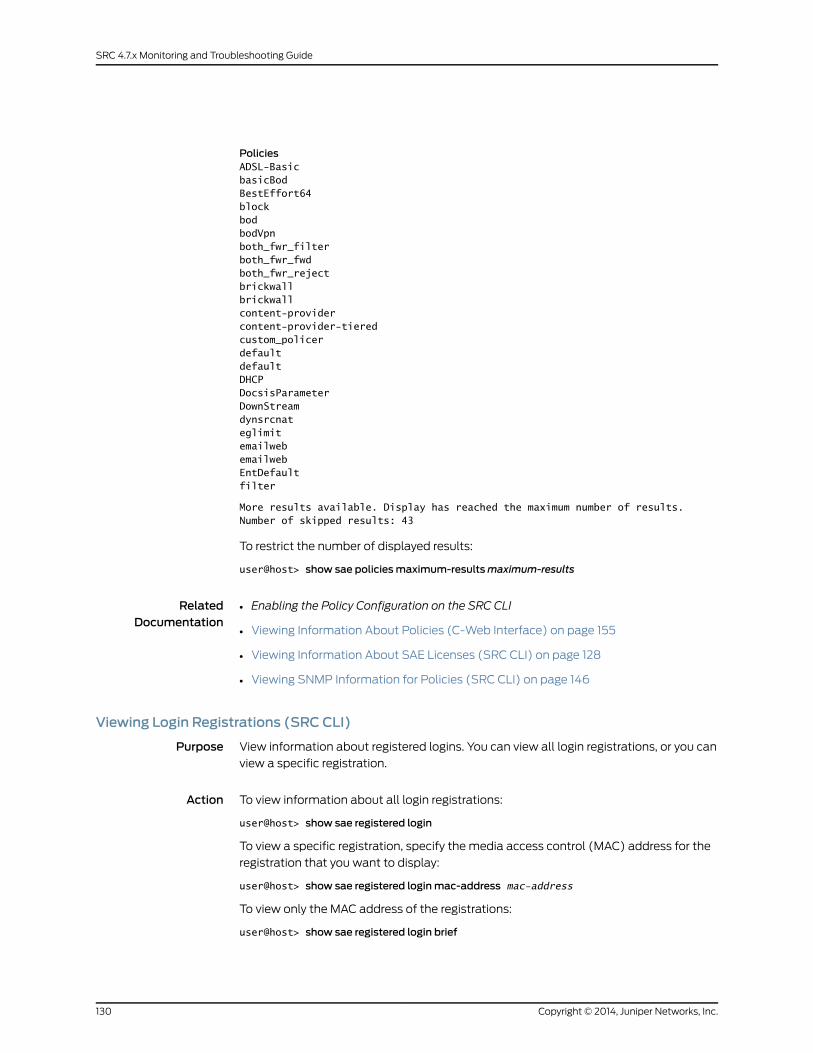
PoliciesADSL-BasicbasicBodBestEffort64blockbodbodVpnboth_fwr_filterboth_fwr_fwdboth_fwr_rejectbrickwallbrickwallcontent-providercontent-provider-tieredcustom_policerdefaultdefaultDHCPDocsisParameterDownStreamdynsrcnateglimitemailwebemailwebEntDefaultfilter
More results available. Display has reached the maximum number of results.Number of skipped results: 43
To restrict the number of displayed results:
user@host> show sae policiesmaximum-resultsmaximum-results
RelatedDocumentation
Enabling the Policy Configuration on the SRC CLI•
• Viewing Information About Policies (C-Web Interface) on page 155
• Viewing Information About SAE Licenses (SRC CLI) on page 128
• Viewing SNMP Information for Policies (SRC CLI) on page 146
Viewing Login Registrations (SRC CLI)
Purpose View information about registered logins. You can view all login registrations, or you can
view a specific registration.
Action To view information about all login registrations:
user@host> show sae registered login
To view a specific registration, specify the media access control (MAC) address for the
registration that you want to display:
user@host> show sae registered loginmac-address mac-address
To view only the MAC address of the registrations:
user@host> show sae registered login brief
Copyright © 2014, Juniper Networks, Inc.130
SRC 4.7.x Monitoring and Troubleshooting Guide
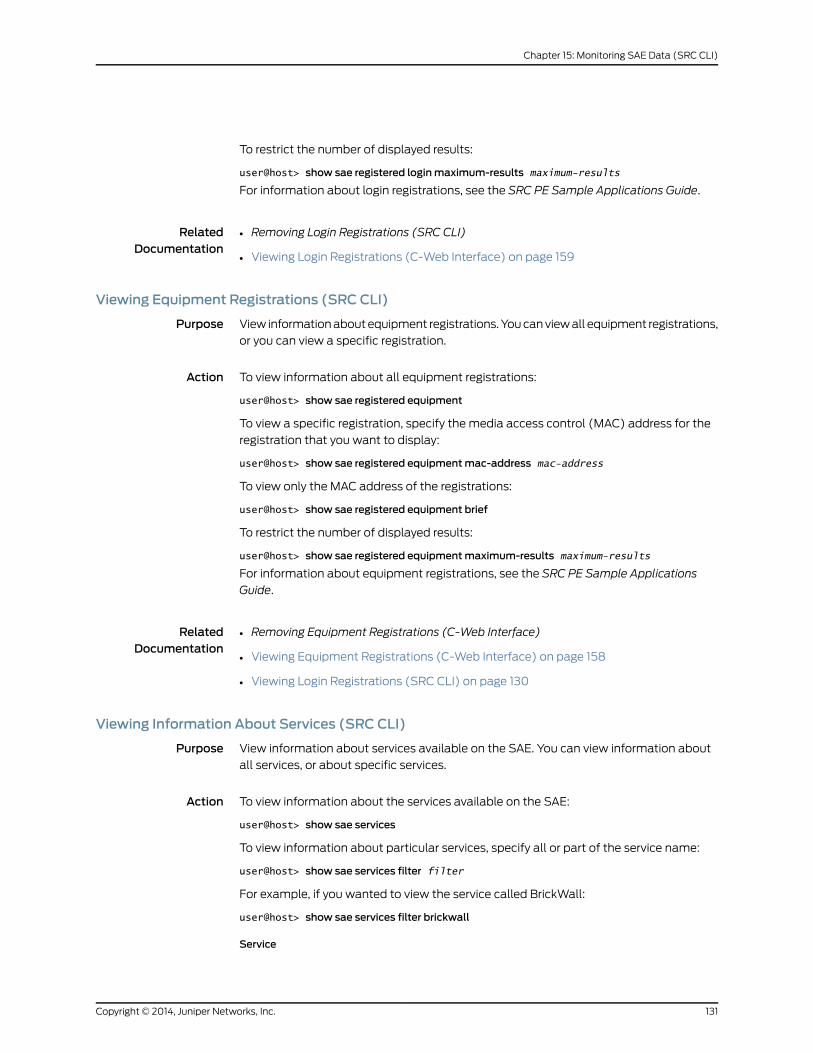
To restrict the number of displayed results:
user@host> show sae registered loginmaximum-results maximum-results
For information about login registrations, see the SRC PE Sample Applications Guide.
RelatedDocumentation
Removing Login Registrations (SRC CLI)•
• Viewing Login Registrations (C-Web Interface) on page 159
Viewing Equipment Registrations (SRC CLI)
Purpose View information about equipment registrations. You can view all equipment registrations,
or you can view a specific registration.
Action To view information about all equipment registrations:
user@host> show sae registered equipment
To view a specific registration, specify the media access control (MAC) address for the
registration that you want to display:
user@host> show sae registered equipmentmac-address mac-address
To view only the MAC address of the registrations:
user@host> show sae registered equipment brief
To restrict the number of displayed results:
user@host> show sae registered equipmentmaximum-results maximum-results
For information about equipment registrations, see the SRC PE Sample Applications
Guide.
RelatedDocumentation
Removing Equipment Registrations (C-Web Interface)•
• Viewing Equipment Registrations (C-Web Interface) on page 158
• Viewing Login Registrations (SRC CLI) on page 130
Viewing Information About Services (SRC CLI)
Purpose View information about services available on the SAE. You can view information about
all services, or about specific services.
Action To view information about the services available on the SAE:
user@host> show sae services
To view information about particular services, specify all or part of the service name:
user@host> show sae services filter filter
For example, if you wanted to view the service called BrickWall:
user@host> show sae services filter brickwall
Service
131Copyright © 2014, Juniper Networks, Inc.
Chapter 15: Monitoring SAE Data (SRC CLI)
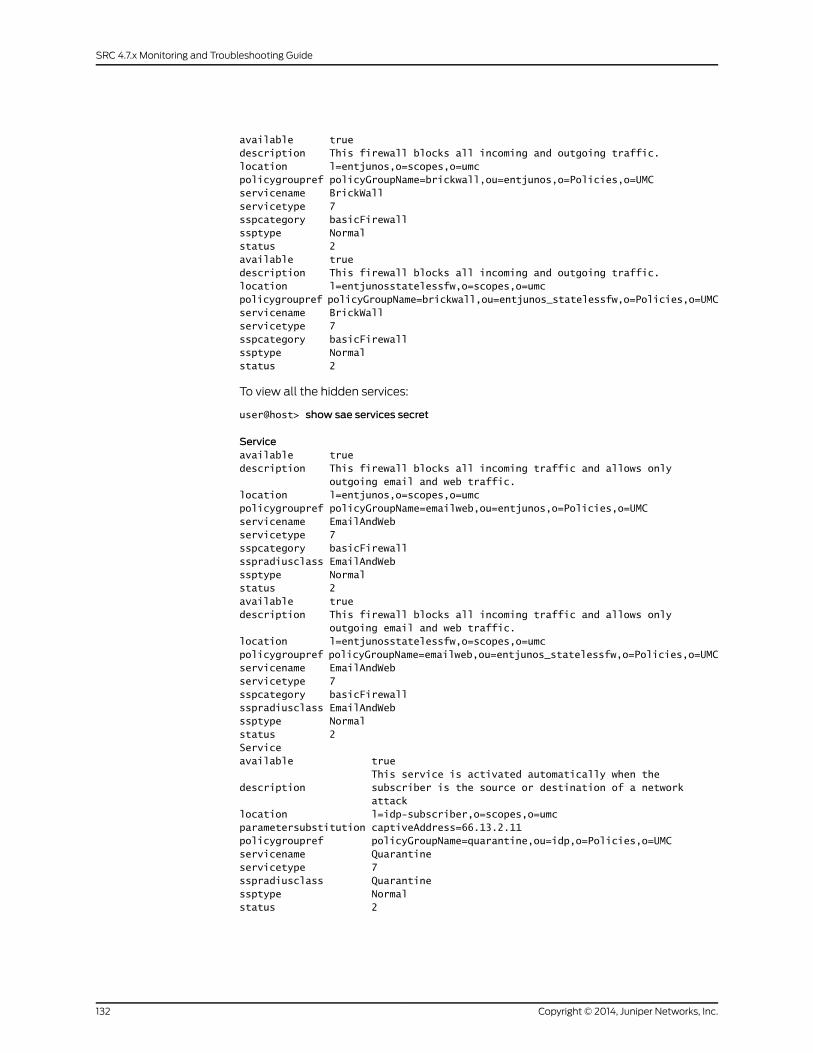
available truedescription This firewall blocks all incoming and outgoing traffic.location l=entjunos,o=scopes,o=umcpolicygroupref policyGroupName=brickwall,ou=entjunos,o=Policies,o=UMCservicename BrickWallservicetype 7sspcategory basicFirewallssptype Normalstatus 2available truedescription This firewall blocks all incoming and outgoing traffic.location l=entjunosstatelessfw,o=scopes,o=umcpolicygroupref policyGroupName=brickwall,ou=entjunos_statelessfw,o=Policies,o=UMCservicename BrickWallservicetype 7sspcategory basicFirewallssptype Normalstatus 2
To view all the hidden services:
user@host> show sae services secret
Serviceavailable truedescription This firewall blocks all incoming traffic and allows only outgoing email and web traffic.location l=entjunos,o=scopes,o=umcpolicygroupref policyGroupName=emailweb,ou=entjunos,o=Policies,o=UMCservicename EmailAndWebservicetype 7sspcategory basicFirewallsspradiusclass EmailAndWebssptype Normalstatus 2available truedescription This firewall blocks all incoming traffic and allows only outgoing email and web traffic.location l=entjunosstatelessfw,o=scopes,o=umcpolicygroupref policyGroupName=emailweb,ou=entjunos_statelessfw,o=Policies,o=UMCservicename EmailAndWebservicetype 7sspcategory basicFirewallsspradiusclass EmailAndWebssptype Normalstatus 2Service available true This service is activated automatically when thedescription subscriber is the source or destination of a network attacklocation l=idp-subscriber,o=scopes,o=umcparametersubstitution captiveAddress=66.13.2.11policygroupref policyGroupName=quarantine,ou=idp,o=Policies,o=UMCservicename Quarantineservicetype 7sspradiusclass Quarantinessptype Normalstatus 2
Copyright © 2014, Juniper Networks, Inc.132
SRC 4.7.x Monitoring and Troubleshooting Guide
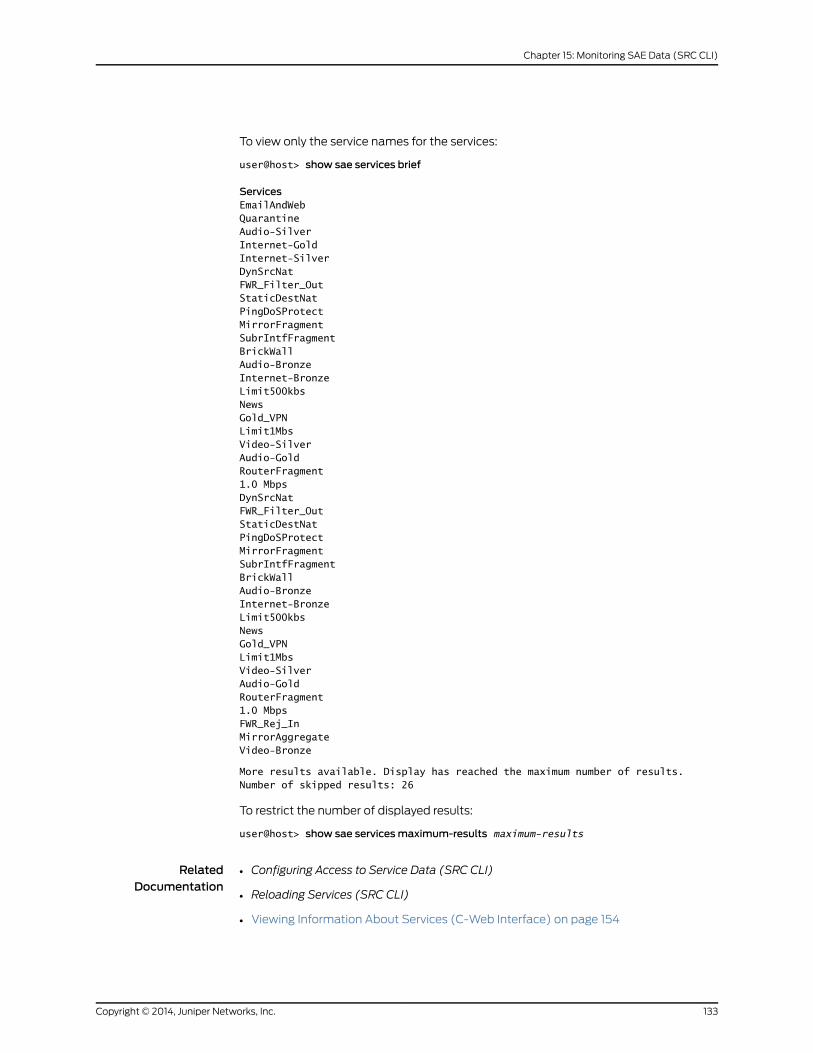
To view only the service names for the services:
user@host> show sae services brief
ServicesEmailAndWebQuarantineAudio-SilverInternet-GoldInternet-SilverDynSrcNatFWR_Filter_OutStaticDestNatPingDoSProtectMirrorFragmentSubrIntfFragmentBrickWallAudio-BronzeInternet-BronzeLimit500kbsNewsGold_VPNLimit1MbsVideo-SilverAudio-GoldRouterFragment1.0 MbpsDynSrcNatFWR_Filter_OutStaticDestNatPingDoSProtectMirrorFragmentSubrIntfFragmentBrickWallAudio-BronzeInternet-BronzeLimit500kbsNewsGold_VPNLimit1MbsVideo-SilverAudio-GoldRouterFragment1.0 MbpsFWR_Rej_InMirrorAggregateVideo-Bronze
More results available. Display has reached the maximum number of results.Number of skipped results: 26
To restrict the number of displayed results:
user@host> show sae servicesmaximum-results maximum-results
RelatedDocumentation
Configuring Access to Service Data (SRC CLI)•
• Reloading Services (SRC CLI)
• Viewing Information About Services (C-Web Interface) on page 154
133Copyright © 2014, Juniper Networks, Inc.
Chapter 15: Monitoring SAE Data (SRC CLI)
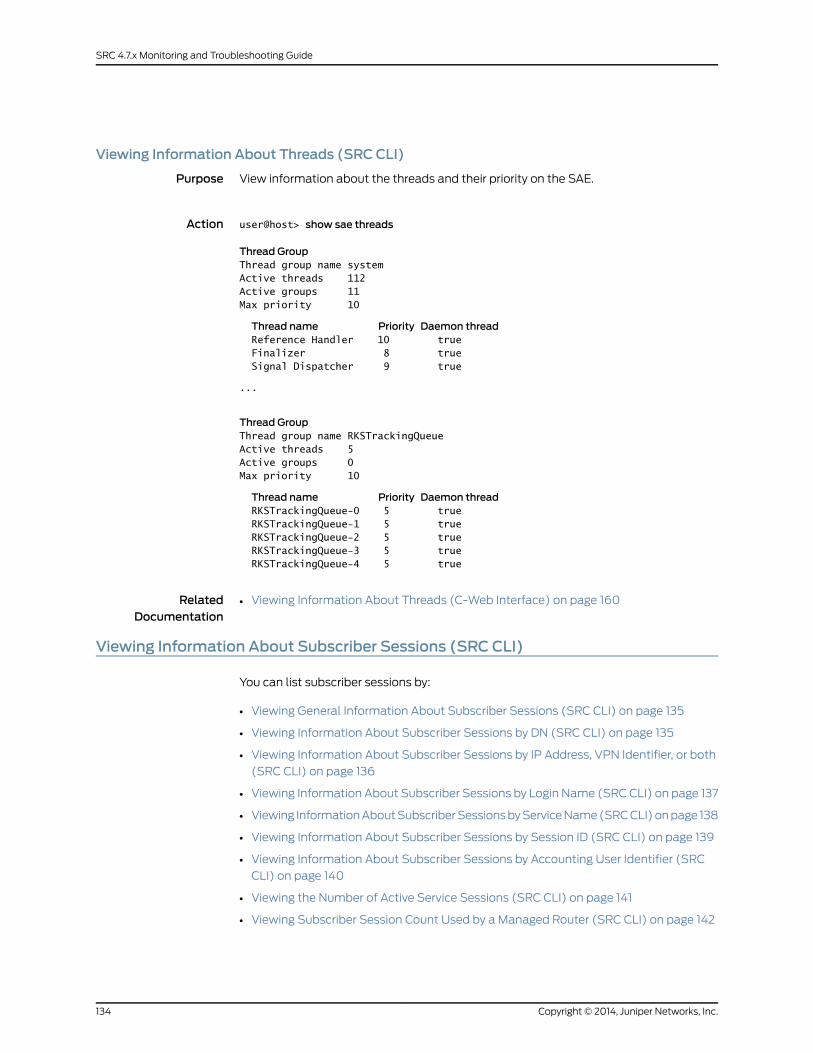
Viewing Information About Threads (SRC CLI)
Purpose View information about the threads and their priority on the SAE.
Action user@host> show sae threads
Thread GroupThread group name systemActive threads 112Active groups 11Max priority 10
Thread name Priority Daemon thread Reference Handler 10 true Finalizer 8 true Signal Dispatcher 9 true
...
Thread GroupThread group name RKSTrackingQueueActive threads 5Active groups 0Max priority 10
Thread name Priority Daemon thread RKSTrackingQueue-0 5 true RKSTrackingQueue-1 5 true RKSTrackingQueue-2 5 true RKSTrackingQueue-3 5 true RKSTrackingQueue-4 5 true
RelatedDocumentation
Viewing Information About Threads (C-Web Interface) on page 160•
Viewing Information About Subscriber Sessions (SRC CLI)
You can list subscriber sessions by:
• Viewing General Information About Subscriber Sessions (SRC CLI) on page 135
• Viewing Information About Subscriber Sessions by DN (SRC CLI) on page 135
• Viewing Information About Subscriber Sessions by IP Address, VPN Identifier, or both
(SRC CLI) on page 136
• Viewing Information About Subscriber Sessions by Login Name (SRC CLI) on page 137
• Viewing Information About Subscriber Sessions by Service Name (SRC CLI) on page 138
• Viewing Information About Subscriber Sessions by Session ID (SRC CLI) on page 139
• Viewing Information About Subscriber Sessions by Accounting User Identifier (SRC
CLI) on page 140
• Viewing the Number of Active Service Sessions (SRC CLI) on page 141
• Viewing Subscriber Session Count Used by a Managed Router (SRC CLI) on page 142
Copyright © 2014, Juniper Networks, Inc.134
SRC 4.7.x Monitoring and Troubleshooting Guide
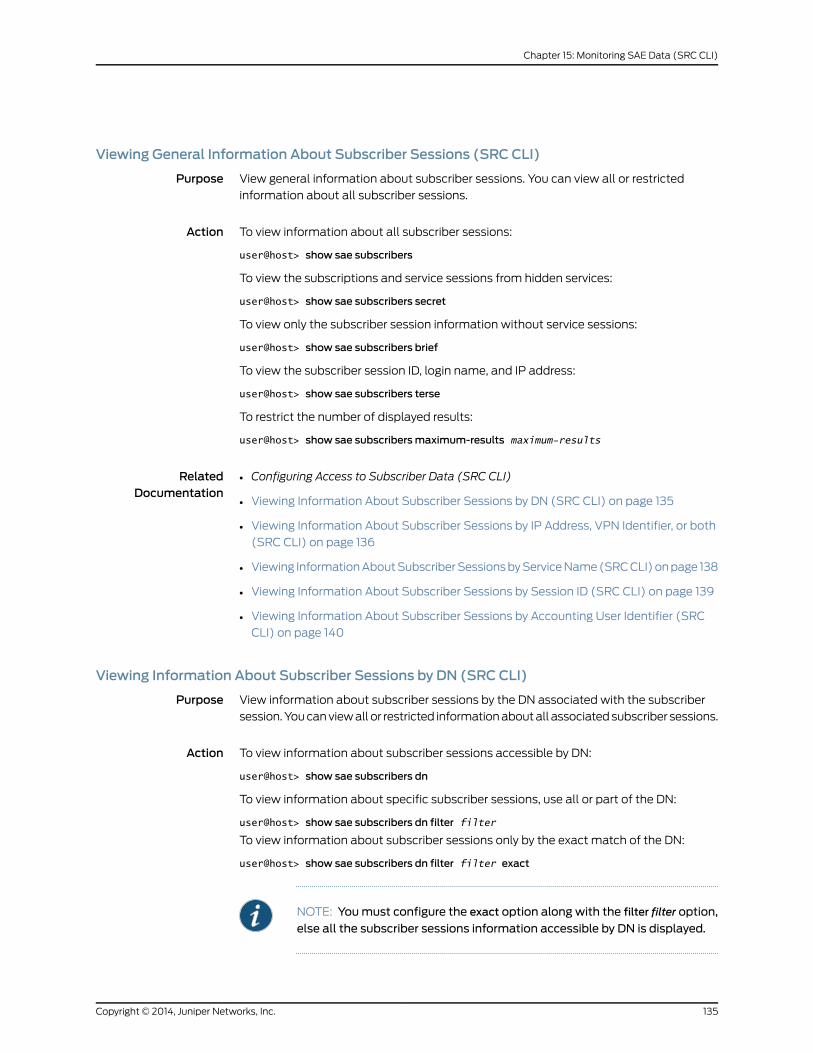
Viewing General Information About Subscriber Sessions (SRC CLI)
Purpose View general information about subscriber sessions. You can view all or restricted
information about all subscriber sessions.
Action To view information about all subscriber sessions:
user@host> show sae subscribers
To view the subscriptions and service sessions from hidden services:
user@host> show sae subscribers secret
To view only the subscriber session information without service sessions:
user@host> show sae subscribers brief
To view the subscriber session ID, login name, and IP address:
user@host> show sae subscribers terse
To restrict the number of displayed results:
user@host> show sae subscribersmaximum-results maximum-results
RelatedDocumentation
Configuring Access to Subscriber Data (SRC CLI)•
• Viewing Information About Subscriber Sessions by DN (SRC CLI) on page 135
• Viewing Information About Subscriber Sessions by IP Address, VPN Identifier, or both
(SRC CLI) on page 136
• Viewing Information About Subscriber Sessions by Service Name (SRC CLI) on page 138
• Viewing Information About Subscriber Sessions by Session ID (SRC CLI) on page 139
• Viewing Information About Subscriber Sessions by Accounting User Identifier (SRC
CLI) on page 140
Viewing Information About Subscriber Sessions by DN (SRC CLI)
Purpose View information about subscriber sessions by the DN associated with the subscriber
session. You can view all or restricted information about all associated subscriber sessions.
Action To view information about subscriber sessions accessible by DN:
user@host> show sae subscribers dn
To view information about specific subscriber sessions, use all or part of the DN:
user@host> show sae subscribers dn filter filter
To view information about subscriber sessions only by the exact match of the DN:
user@host> show sae subscribers dn filter filter exact
NOTE: Youmust configure the exact option along with the filter filter option,
else all the subscriber sessions information accessible by DN is displayed.
135Copyright © 2014, Juniper Networks, Inc.
Chapter 15: Monitoring SAE Data (SRC CLI)
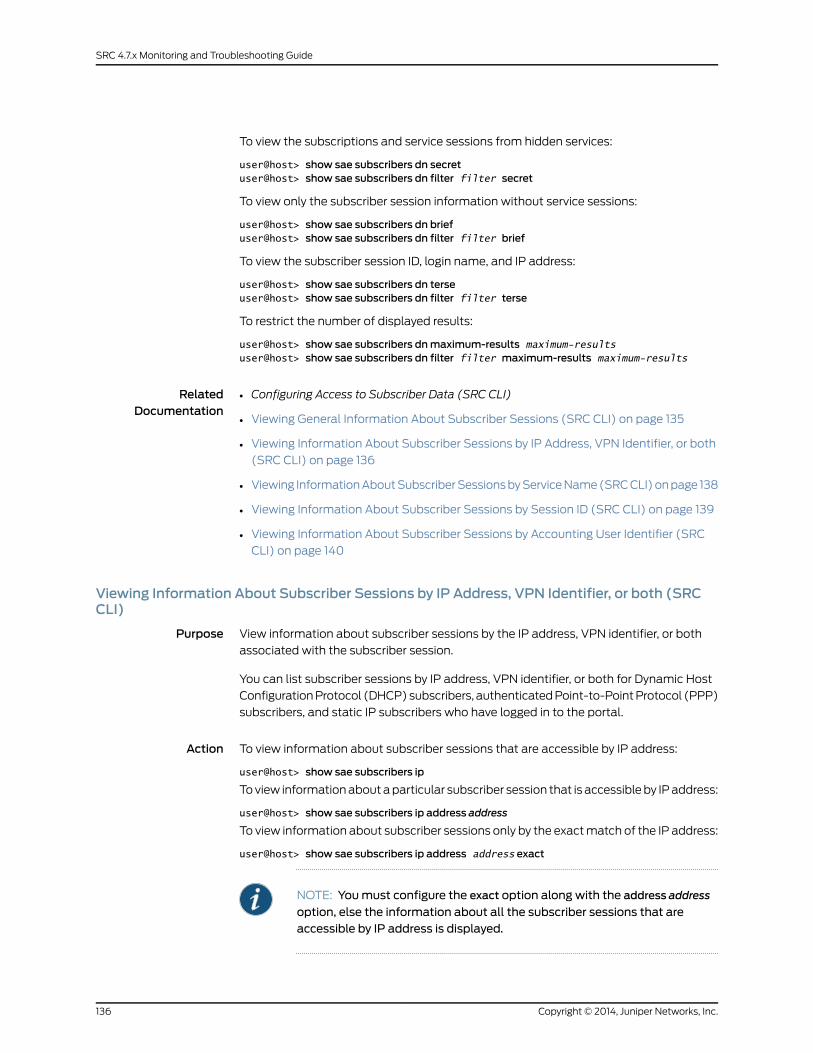
To view the subscriptions and service sessions from hidden services:
user@host> show sae subscribers dn secretuser@host> show sae subscribers dn filter filter secret
To view only the subscriber session information without service sessions:
user@host> show sae subscribers dn briefuser@host> show sae subscribers dn filter filter brief
To view the subscriber session ID, login name, and IP address:
user@host> show sae subscribers dn terseuser@host> show sae subscribers dn filter filter terse
To restrict the number of displayed results:
user@host> show sae subscribers dnmaximum-results maximum-resultsuser@host> show sae subscribers dn filter filter maximum-results maximum-results
RelatedDocumentation
Configuring Access to Subscriber Data (SRC CLI)•
• Viewing General Information About Subscriber Sessions (SRC CLI) on page 135
• Viewing Information About Subscriber Sessions by IP Address, VPN Identifier, or both
(SRC CLI) on page 136
• Viewing Information About Subscriber Sessions by Service Name (SRC CLI) on page 138
• Viewing Information About Subscriber Sessions by Session ID (SRC CLI) on page 139
• Viewing Information About Subscriber Sessions by Accounting User Identifier (SRC
CLI) on page 140
Viewing Information About Subscriber Sessions by IP Address, VPN Identifier, or both (SRCCLI)
Purpose View information about subscriber sessions by the IP address, VPN identifier, or both
associated with the subscriber session.
You can list subscriber sessions by IP address, VPN identifier, or both for Dynamic Host
Configuration Protocol (DHCP) subscribers, authenticated Point-to-Point Protocol (PPP)
subscribers, and static IP subscribers who have logged in to the portal.
Action To view information about subscriber sessions that are accessible by IP address:
user@host> show sae subscribers ip
To view information about a particular subscriber session that is accessible by IP address:
user@host> show sae subscribers ip address address
To view information about subscriber sessions only by the exact match of the IP address:
user@host> show sae subscribers ip address address exact
NOTE: Youmust configure the exact option along with the address address
option, else the information about all the subscriber sessions that areaccessible by IP address is displayed.
Copyright © 2014, Juniper Networks, Inc.136
SRC 4.7.x Monitoring and Troubleshooting Guide
To view information about subscriber sessions that are accessible by VPN identifier:
user@host> show sae subscribers ip vpnid vpnid
To view information about a particular subscriber session that is accessible by both IP
address and VPN identifier:
user@host> show sae subscribers ip address address vpnid vpnid
To view information about particular subscriber sessions, specify the IP address:
user@host> show sae subscribers ip filter filter
To view the subscriptions and service sessions from hidden services:
user@host> show sae subscribers ip secretuser@host> show sae subscribers ip filter filter secret
To view only the subscriber session information without service sessions:
user@host> show sae subscribers ip briefuser@host> show sae subscribers ip filter filter brief
To view the subscriber session ID, login name, and IP address:
user@host> show sae subscribers ip terseuser@host> show sae subscribers ip filter filter terse
To restrict the number of displayed results:
user@host> show sae subscribers ipmaximum-results maximum-resultsuser@host> show sae subscribers ip filter filter maximum-results maximum-results
RelatedDocumentation
Configuring Access to Subscriber Data (SRC CLI)•
• Viewing General Information About Subscriber Sessions (SRC CLI) on page 135
• Viewing Information About Subscriber Sessions by DN (SRC CLI) on page 135
• Viewing Information About Subscriber Sessions by Service Name (SRC CLI) on page 138
• Viewing Information About Subscriber Sessions by Session ID (SRC CLI) on page 139
• Viewing Information About Subscriber Sessions by Accounting User Identifier (SRC
CLI) on page 140
Viewing Information About Subscriber Sessions by Login Name (SRC CLI)
Purpose View information about subscriber sessions by the subscriber login name. You can view
all or restricted information about all associated subscriber sessions.
Action To view information about subscriber sessions accessible by login name:
user@host> show sae subscribers login-name
To view information about specific subscriber sessions, use all or part of the login name:
user@host> show sae subscribers login-name filter filter
To view information about subscriber sessions only by the exact match of the login name:
user@host> show sae subscribers login-name filter filter exact
137Copyright © 2014, Juniper Networks, Inc.
Chapter 15: Monitoring SAE Data (SRC CLI)
NOTE: Youmust configure the exact option along with the filter filter option,
elseall thesubscriber sessions informationaccessibleby thesubscriber loginname is displayed.
To view the subscriptions and service sessions from hidden services:
user@host> show sae subscribers login-name secretuser@host> show sae subscribers login-name filter filter secret
To view only the subscriber session information without service sessions:
user@host> show sae subscribers login-name briefuser@host> show sae subscribers login-name filter filter brief
To view the subscriber session ID, login name, and IP address:
user@host> show sae subscribers login-name terseuser@host> show sae subscribers login-name filter filter terse
To restrict the number of displayed results:
user@host> show sae subscribers login-namemaximum-results maximum-resultsuser@host> showsaesubscribers login-namefilter filter maximum-results maximum-results
RelatedDocumentation
Configuring Access to Subscriber Data (SRC CLI)•
• Viewing General Information About Subscriber Sessions (SRC CLI) on page 135
• Viewing Information About Subscriber Sessions by DN (SRC CLI) on page 135
• Viewing Information About Subscriber Sessions by IP Address, VPN Identifier, or both
(SRC CLI) on page 136
• Viewing Information About Subscriber Sessions by Session ID (SRC CLI) on page 139
• Viewing Information About Subscriber Sessions by Accounting User Identifier (SRC
CLI) on page 140
Viewing Information About Subscriber Sessions by Service Name (SRC CLI)
Purpose View information about subscriber sessions that are associated with a specified service.
You can view all or restricted information about all associated subscriber sessions.
Action To view information about subscriber sessions activated by a subscription to an active
service session:
user@host> show sae subscribers service-name
To view information about specific subscriber sessions, use all or part of the service name:
user@host> show sae subscribers service-name filter filter
To view information about subscriber sessions only by the exact match of the service
name:
user@host> show sae subscribers service-name filter filter exact
Copyright © 2014, Juniper Networks, Inc.138
SRC 4.7.x Monitoring and Troubleshooting Guide
NOTE: Youmust configure the exact option along with the filter filter option,
else informationaboutall thesubscriber sessionsactivatedbyasubscriptionto an active service session is displayed.
To view the subscriptions and service sessions from hidden services:
user@host> show sae subscribers service-name secretuser@host> show sae subscribers service-name filter filter secret
To view only the subscriber session information without service sessions:
user@host> show sae subscribers service-name briefuser@host> show sae subscribers service-name filter filter brief
To view the subscriber session ID, login name, and IP address:
user@host> show sae subscribers service-name terseuser@host> show sae subscribers service-name filter filter terse
To restrict the number of displayed results:
user@host> show sae subscribers service-namemaximum-results maximum-resultsuser@host> show sae subscribers service-name filter filter maximum-resultsmaximum-results
RelatedDocumentation
Configuring Access to Subscriber Data (SRC CLI)•
• Viewing General Information About Subscriber Sessions (SRC CLI) on page 135
• Viewing Information About Subscriber Sessions by DN (SRC CLI) on page 135
• Viewing Information About Subscriber Sessions by IP Address, VPN Identifier, or both
(SRC CLI) on page 136
• Viewing Information About Subscriber Sessions by Session ID (SRC CLI) on page 139
Viewing Information About Subscriber Sessions by Session ID (SRC CLI)
Purpose View information about subscriber sessions by the session ID associated with the
subscriber session. You can view all or restricted information about all associated
subscriber sessions.
Action To view information about subscriber sessions by session ID:
user@host> show sae subscribers session-id
To view information about specific subscriber sessions, use all or part of the subscriber
session ID:
user@host> show sae subscribers session-id filter filter
To view information about subscriber sessions only by the exact match of the subscriber
session ID:
user@host> show sae subscribers session-id filter filter exact
139Copyright © 2014, Juniper Networks, Inc.
Chapter 15: Monitoring SAE Data (SRC CLI)
NOTE: Youmust configure the exact option along with the filter filter option,
else all he subscriber sessions information by the session ID is displayed.
To view the subscriptions and service sessions from hidden services:
user@host> show sae subscribers session-id secretuser@host> show sae subscribers session-id filter filter secret
To view only the subscriber session information without service sessions:
user@host> show sae subscribers session-id briefuser@host> show sae subscribers session-id filter filter brief
To view the subscriber session ID, login name, and IP address:
user@host> show sae subscribers session-id terseuser@host> show sae subscribers session-id filter filter terse
To restrict the number of displayed results:
user@host> show sae subscribers session-idmaximum-results maximum-resultsuser@host> showsaesubscriberssession-id filter filter maximum-results maximum-results
RelatedDocumentation
Configuring Access to Subscriber Data (SRC CLI)•
• Viewing General Information About Subscriber Sessions (SRC CLI) on page 135
• Viewing Information About Subscriber Sessions by DN (SRC CLI) on page 135
• Viewing Information About Subscriber Sessions by IP Address, VPN Identifier, or both
(SRC CLI) on page 136
• Viewing Information About Subscriber Sessions by Service Name (SRC CLI) on page 138
• Viewing Information About Subscriber Sessions by Accounting User Identifier (SRC
CLI) on page 140
Viewing Information About Subscriber Sessions by Accounting User Identifier (SRC CLI)
Purpose View information about subscriber sessions by the accounting user identifier associated
with the subscriber session. You can view all or specific information about all associated
subscriber sessions.
Action To view information about subscriber sessions accessible by accounting user identifier:
user@host> show sae subscribers accounting-user-id
To view information about specific subscriber sessions, use all or part of the accounting
user identifier:
user@host> show sae subscribers accounting-user-id filter filter
To view information about subscriber sessions only by the exact match of accounting
user identifier:
user@host> show sae subscribers accounting-user-id filter filter exact
Copyright © 2014, Juniper Networks, Inc.140
SRC 4.7.x Monitoring and Troubleshooting Guide
NOTE: Youmust configure the exact option along with the filter filter option,
else the information about all the subscriber sessions accessible by theaccounting user identifier is displayed.
To view the subscriptions and service sessions from hidden services:
user@host> show sae subscribers accounting-user-id secretuser@host> show sae subscribers accounting-user-id filter filter secret
To view only the subscriber session information without service sessions:
user@host> show sae subscribers accounting-user-id briefuser@host> show sae subscribers accounting-user-id filter filter brief
To view the subscriber session ID, login name, and IP address:
user@host> show sae subscribers accounting-user-id terseuser@host> show sae subscribers accounting-user-id filter filter terse
To restrict the number of displayed results:
user@host>showsaesubscribersaccounting-user-idmaximum-resultsmaximum-resultsuser@host> show sae subscribers accounting-user-id filter filtermaximum-resultsmaximum-results
RelatedDocumentation
Viewing General Information About Subscriber Sessions (SRC CLI) on page 135•
• Viewing Information About Subscriber Sessions by Login Name (SRC CLI) on page 137
• Viewing Information About Subscriber Sessions by DN (SRC CLI) on page 135
• Viewing Information About Subscriber Sessions by IP Address, VPN Identifier, or both
(SRC CLI) on page 136
• Viewing Information About Subscriber Sessions by Session ID (SRC CLI) on page 139
Viewing the Number of Active Service Sessions (SRC CLI)
Purpose View the number of currently active service sessions that exist for a given service, service
attribute, scope, and virtual router.
Action To view the number of currently active service sessions for a given service, service attribute,
scope, and virtual router:
user@host> showsaenumber-service-sessionsservice-nameservice-nameservice-attribute-nameservice-attribute-name scope scope virtual-router virtual-router
RelatedDocumentation
Configuring Access to Subscriber Data (SRC CLI)•
• Viewing General Information About Subscriber Sessions (SRC CLI) on page 135
• Viewing Information About Subscriber Sessions by DN (SRC CLI) on page 135
141Copyright © 2014, Juniper Networks, Inc.
Chapter 15: Monitoring SAE Data (SRC CLI)
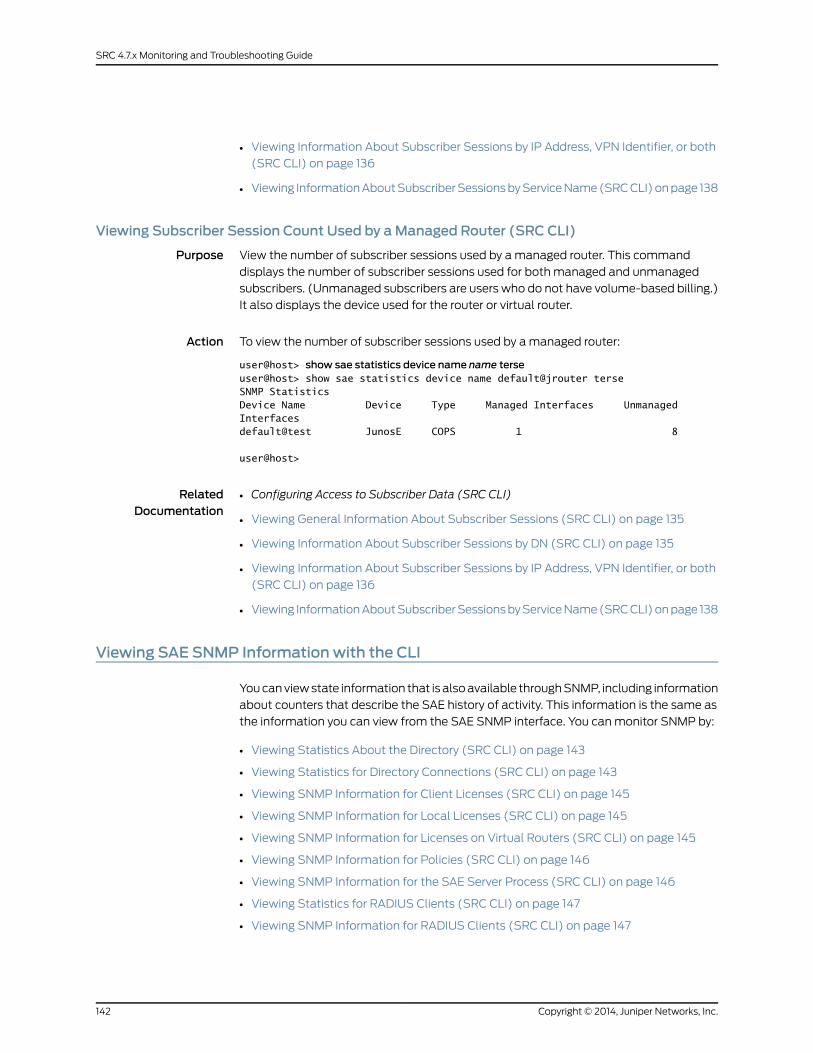
• Viewing Information About Subscriber Sessions by IP Address, VPN Identifier, or both
(SRC CLI) on page 136
• Viewing Information About Subscriber Sessions by Service Name (SRC CLI) on page 138
Viewing Subscriber Session Count Used by aManaged Router (SRC CLI)
Purpose View the number of subscriber sessions used by a managed router. This command
displays the number of subscriber sessions used for both managed and unmanaged
subscribers. (Unmanaged subscribers are users who do not have volume-based billing.)
It also displays the device used for the router or virtual router.
Action To view the number of subscriber sessions used by a managed router:
user@host> show sae statistics device name name terseuser@host> show sae statistics device name default@jrouter terseSNMP StatisticsDevice Name Device Type Managed Interfaces Unmanaged Interfacesdefault@test JunosE COPS 1 8
user@host>
RelatedDocumentation
Configuring Access to Subscriber Data (SRC CLI)•
• Viewing General Information About Subscriber Sessions (SRC CLI) on page 135
• Viewing Information About Subscriber Sessions by DN (SRC CLI) on page 135
• Viewing Information About Subscriber Sessions by IP Address, VPN Identifier, or both
(SRC CLI) on page 136
• Viewing Information About Subscriber Sessions by Service Name (SRC CLI) on page 138
Viewing SAE SNMP Information with the CLI
You can view state information that is also available through SNMP, including information
about counters that describe the SAE history of activity. This information is the same as
the information you can view from the SAE SNMP interface. You can monitor SNMP by:
• Viewing Statistics About the Directory (SRC CLI) on page 143
• Viewing Statistics for Directory Connections (SRC CLI) on page 143
• Viewing SNMP Information for Client Licenses (SRC CLI) on page 145
• Viewing SNMP Information for Local Licenses (SRC CLI) on page 145
• Viewing SNMP Information for Licenses on Virtual Routers (SRC CLI) on page 145
• Viewing SNMP Information for Policies (SRC CLI) on page 146
• Viewing SNMP Information for the SAE Server Process (SRC CLI) on page 146
• Viewing Statistics for RADIUS Clients (SRC CLI) on page 147
• Viewing SNMP Information for RADIUS Clients (SRC CLI) on page 147
Copyright © 2014, Juniper Networks, Inc.142
SRC 4.7.x Monitoring and Troubleshooting Guide
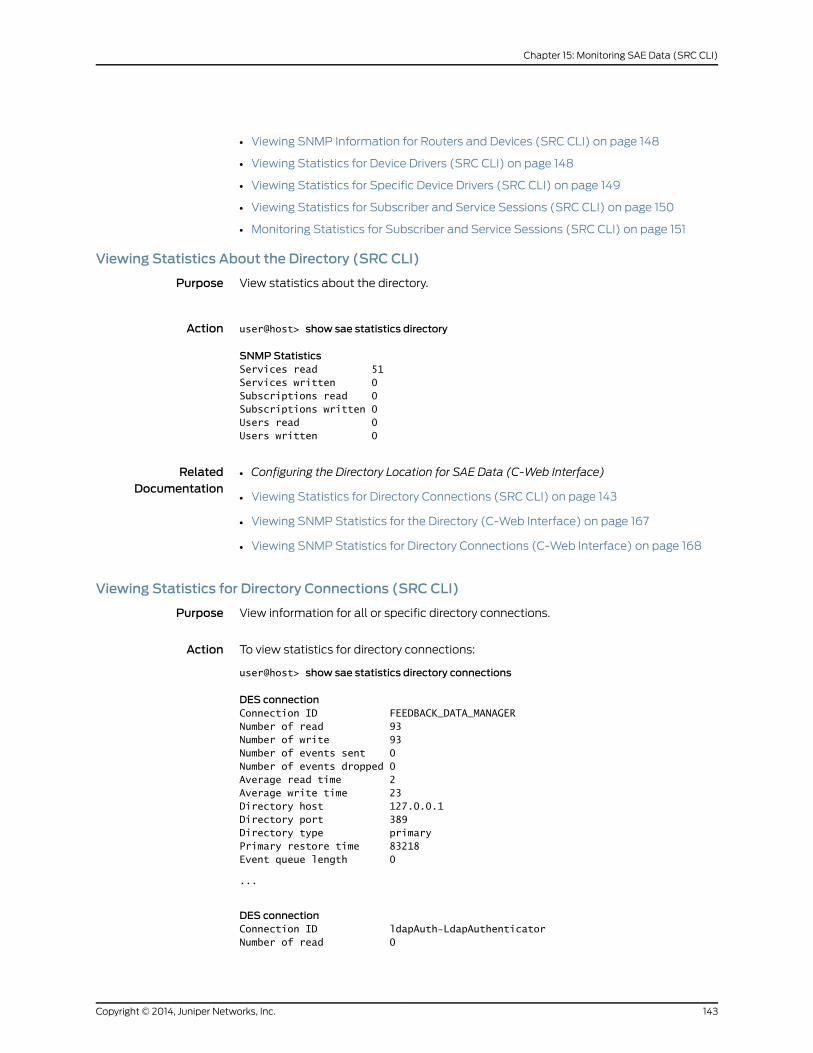
• Viewing SNMP Information for Routers and Devices (SRC CLI) on page 148
• Viewing Statistics for Device Drivers (SRC CLI) on page 148
• Viewing Statistics for Specific Device Drivers (SRC CLI) on page 149
• Viewing Statistics for Subscriber and Service Sessions (SRC CLI) on page 150
• Monitoring Statistics for Subscriber and Service Sessions (SRC CLI) on page 151
Viewing Statistics About the Directory (SRC CLI)
Purpose View statistics about the directory.
Action user@host> show sae statistics directory
SNMPStatisticsServices read 51Services written 0Subscriptions read 0Subscriptions written 0Users read 0Users written 0
RelatedDocumentation
Configuring the Directory Location for SAE Data (C-Web Interface)•
• Viewing Statistics for Directory Connections (SRC CLI) on page 143
• Viewing SNMP Statistics for the Directory (C-Web Interface) on page 167
• Viewing SNMP Statistics for Directory Connections (C-Web Interface) on page 168
Viewing Statistics for Directory Connections (SRC CLI)
Purpose View information for all or specific directory connections.
Action To view statistics for directory connections:
user@host> show sae statistics directory connections
DES connectionConnection ID FEEDBACK_DATA_MANAGERNumber of read 93Number of write 93Number of events sent 0Number of events dropped 0Average read time 2Average write time 23Directory host 127.0.0.1Directory port 389Directory type primaryPrimary restore time 83218Event queue length 0
...
DES connectionConnection ID ldapAuth-LdapAuthenticatorNumber of read 0
143Copyright © 2014, Juniper Networks, Inc.
Chapter 15: Monitoring SAE Data (SRC CLI)
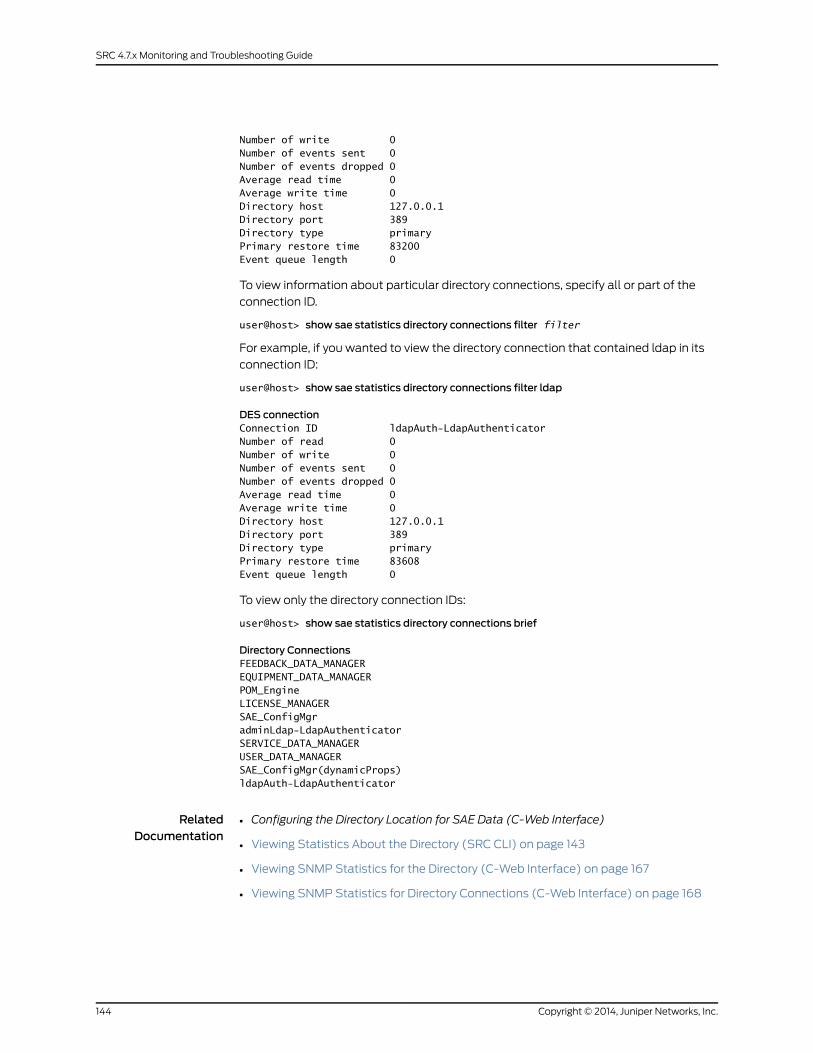
Number of write 0Number of events sent 0Number of events dropped 0Average read time 0Average write time 0Directory host 127.0.0.1Directory port 389Directory type primaryPrimary restore time 83200Event queue length 0
To view information about particular directory connections, specify all or part of the
connection ID.
user@host> show sae statistics directory connections filter filter
For example, if you wanted to view the directory connection that contained ldap in its
connection ID:
user@host> show sae statistics directory connections filter ldap
DES connectionConnection ID ldapAuth-LdapAuthenticatorNumber of read 0Number of write 0Number of events sent 0Number of events dropped 0Average read time 0Average write time 0Directory host 127.0.0.1Directory port 389Directory type primaryPrimary restore time 83608Event queue length 0
To view only the directory connection IDs:
user@host> show sae statistics directory connections brief
Directory ConnectionsFEEDBACK_DATA_MANAGEREQUIPMENT_DATA_MANAGERPOM_EngineLICENSE_MANAGERSAE_ConfigMgradminLdap-LdapAuthenticatorSERVICE_DATA_MANAGERUSER_DATA_MANAGERSAE_ConfigMgr(dynamicProps)ldapAuth-LdapAuthenticator
RelatedDocumentation
Configuring the Directory Location for SAE Data (C-Web Interface)•
• Viewing Statistics About the Directory (SRC CLI) on page 143
• Viewing SNMP Statistics for the Directory (C-Web Interface) on page 167
• Viewing SNMP Statistics for Directory Connections (C-Web Interface) on page 168
Copyright © 2014, Juniper Networks, Inc.144
SRC 4.7.x Monitoring and Troubleshooting Guide
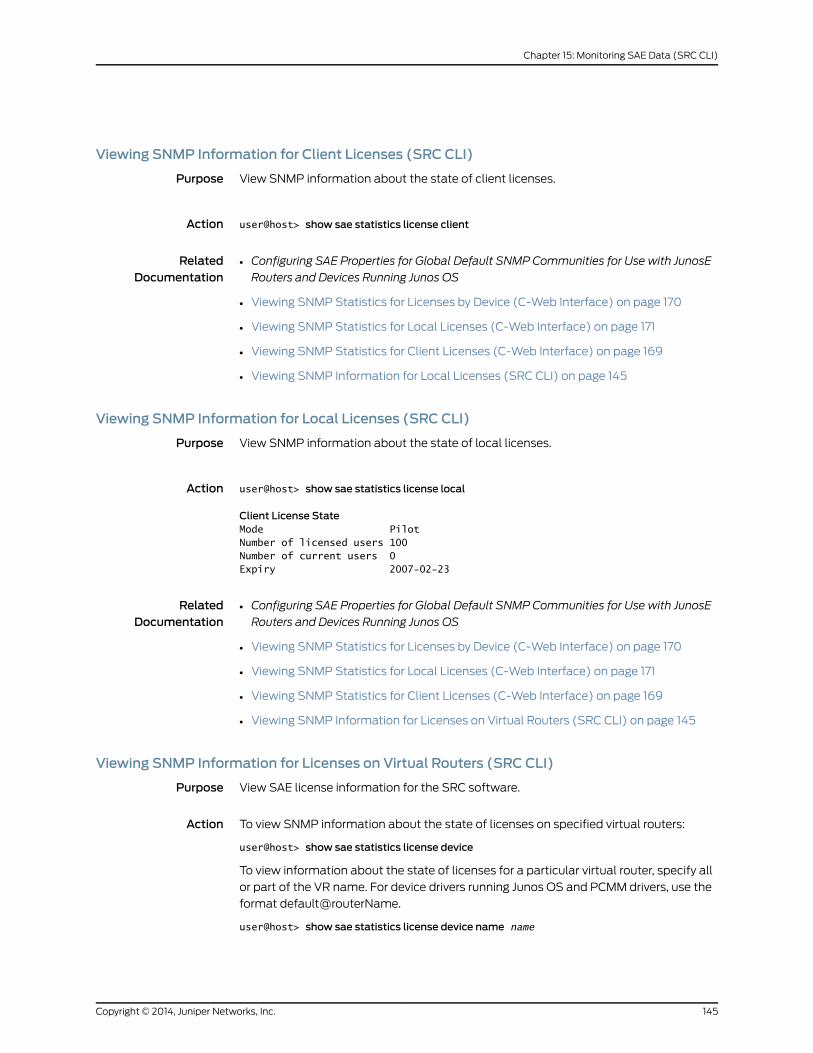
Viewing SNMP Information for Client Licenses (SRC CLI)
Purpose View SNMP information about the state of client licenses.
Action user@host> show sae statistics license client
RelatedDocumentation
Configuring SAE Properties for Global Default SNMP Communities for Use with JunosE
Routers and Devices Running Junos OS
•
• Viewing SNMP Statistics for Licenses by Device (C-Web Interface) on page 170
• Viewing SNMP Statistics for Local Licenses (C-Web Interface) on page 171
• Viewing SNMP Statistics for Client Licenses (C-Web Interface) on page 169
• Viewing SNMP Information for Local Licenses (SRC CLI) on page 145
Viewing SNMP Information for Local Licenses (SRC CLI)
Purpose View SNMP information about the state of local licenses.
Action user@host> show sae statistics license local
Client License StateMode PilotNumber of licensed users 100Number of current users 0Expiry 2007-02-23
RelatedDocumentation
Configuring SAE Properties for Global Default SNMP Communities for Use with JunosE
Routers and Devices Running Junos OS
•
• Viewing SNMP Statistics for Licenses by Device (C-Web Interface) on page 170
• Viewing SNMP Statistics for Local Licenses (C-Web Interface) on page 171
• Viewing SNMP Statistics for Client Licenses (C-Web Interface) on page 169
• Viewing SNMP Information for Licenses on Virtual Routers (SRC CLI) on page 145
Viewing SNMP Information for Licenses on Virtual Routers (SRC CLI)
Purpose View SAE license information for the SRC software.
Action To view SNMP information about the state of licenses on specified virtual routers:
user@host> show sae statistics license device
To view information about the state of licenses for a particular virtual router, specify all
or part of the VR name. For device drivers running Junos OS and PCMM drivers, use the
format default@routerName.
user@host> show sae statistics license device name name
145Copyright © 2014, Juniper Networks, Inc.
Chapter 15: Monitoring SAE Data (SRC CLI)
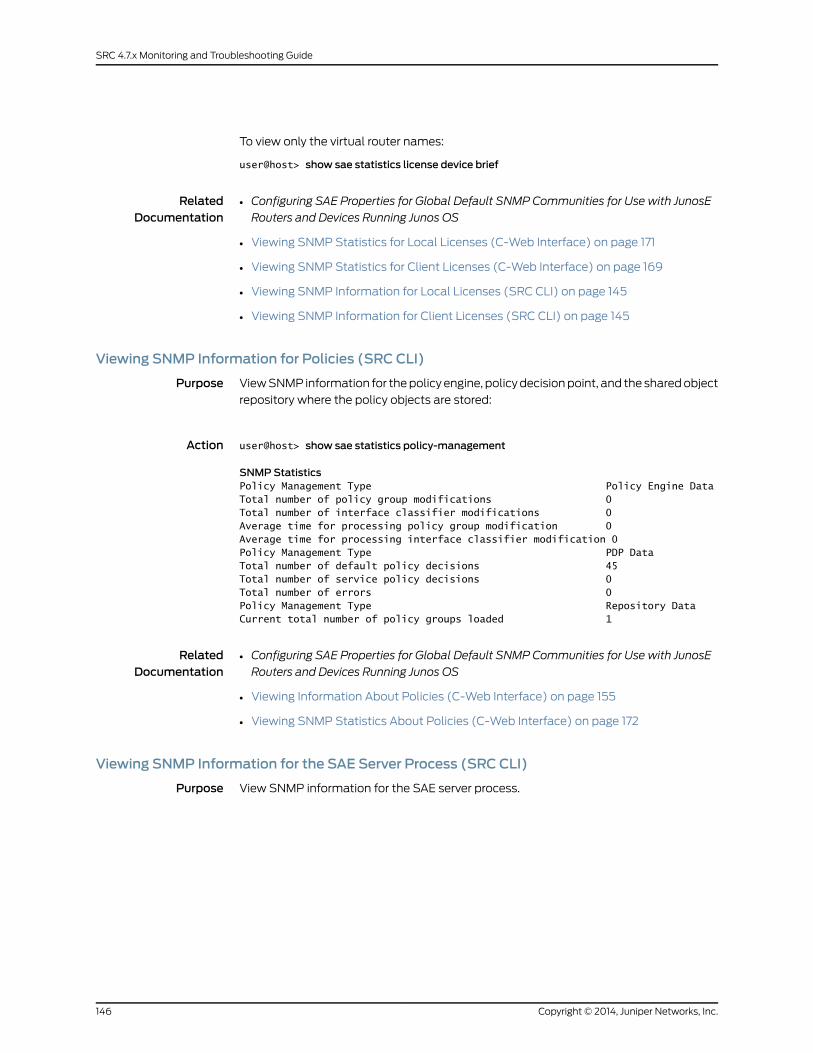
To view only the virtual router names:
user@host> show sae statistics license device brief
RelatedDocumentation
Configuring SAE Properties for Global Default SNMP Communities for Use with JunosE
Routers and Devices Running Junos OS
•
• Viewing SNMP Statistics for Local Licenses (C-Web Interface) on page 171
• Viewing SNMP Statistics for Client Licenses (C-Web Interface) on page 169
• Viewing SNMP Information for Local Licenses (SRC CLI) on page 145
• Viewing SNMP Information for Client Licenses (SRC CLI) on page 145
Viewing SNMP Information for Policies (SRC CLI)
Purpose View SNMP information for the policy engine, policy decision point, and the shared object
repository where the policy objects are stored:
Action user@host> show sae statistics policy-management
SNMPStatisticsPolicy Management Type Policy Engine DataTotal number of policy group modifications 0Total number of interface classifier modifications 0Average time for processing policy group modification 0Average time for processing interface classifier modification 0Policy Management Type PDP DataTotal number of default policy decisions 45Total number of service policy decisions 0Total number of errors 0Policy Management Type Repository DataCurrent total number of policy groups loaded 1
RelatedDocumentation
Configuring SAE Properties for Global Default SNMP Communities for Use with JunosE
Routers and Devices Running Junos OS
•
• Viewing Information About Policies (C-Web Interface) on page 155
• Viewing SNMP Statistics About Policies (C-Web Interface) on page 172
Viewing SNMP Information for the SAE Server Process (SRC CLI)
Purpose View SNMP information for the SAE server process.
Copyright © 2014, Juniper Networks, Inc.146
SRC 4.7.x Monitoring and Troubleshooting Guide
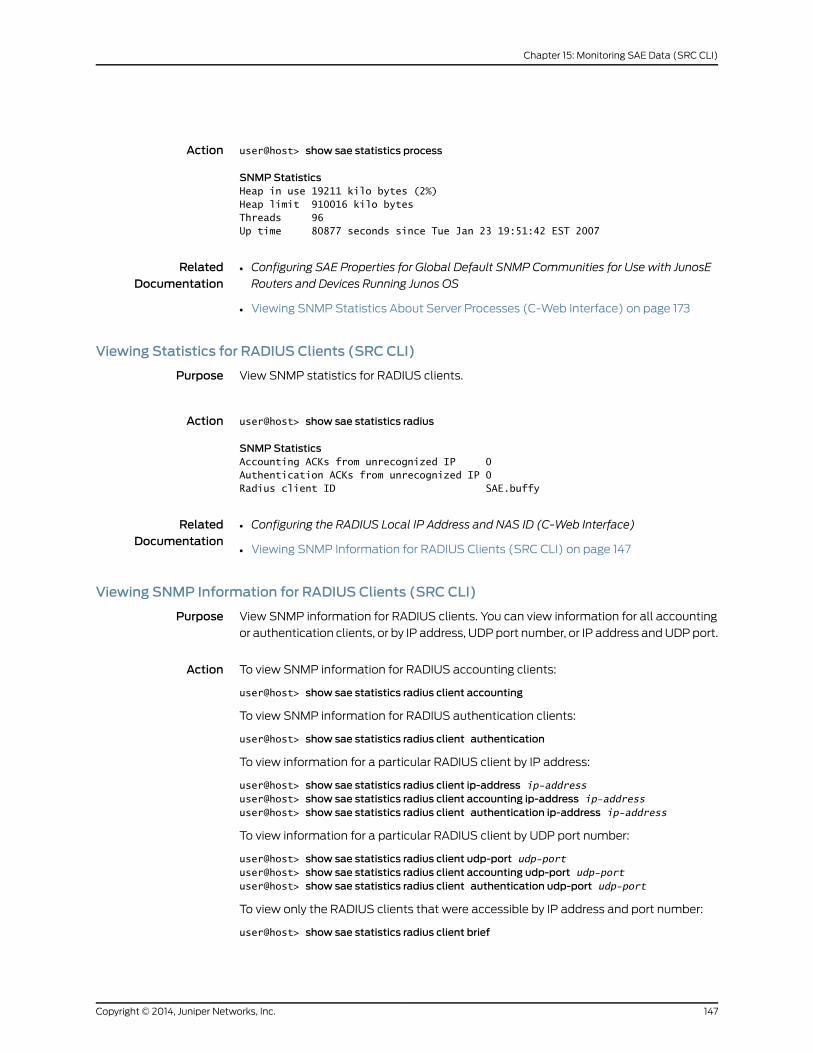
Action user@host> show sae statistics process
SNMPStatisticsHeap in use 19211 kilo bytes (2%)Heap limit 910016 kilo bytesThreads 96Up time 80877 seconds since Tue Jan 23 19:51:42 EST 2007
RelatedDocumentation
Configuring SAE Properties for Global Default SNMP Communities for Use with JunosE
Routers and Devices Running Junos OS
•
• Viewing SNMP Statistics About Server Processes (C-Web Interface) on page 173
Viewing Statistics for RADIUS Clients (SRC CLI)
Purpose View SNMP statistics for RADIUS clients.
Action user@host> show sae statistics radius
SNMPStatisticsAccounting ACKs from unrecognized IP 0Authentication ACKs from unrecognized IP 0Radius client ID SAE.buffy
RelatedDocumentation
Configuring the RADIUS Local IP Address and NAS ID (C-Web Interface)•
• Viewing SNMP Information for RADIUS Clients (SRC CLI) on page 147
Viewing SNMP Information for RADIUS Clients (SRC CLI)
Purpose View SNMP information for RADIUS clients. You can view information for all accounting
or authentication clients, or by IP address, UDP port number, or IP address and UDP port.
Action To view SNMP information for RADIUS accounting clients:
user@host> show sae statistics radius client accounting
To view SNMP information for RADIUS authentication clients:
user@host> show sae statistics radius client authentication
To view information for a particular RADIUS client by IP address:
user@host> show sae statistics radius client ip-address ip-addressuser@host> show sae statistics radius client accounting ip-address ip-addressuser@host> show sae statistics radius client authentication ip-address ip-address
To view information for a particular RADIUS client by UDP port number:
user@host> show sae statistics radius client udp-port udp-portuser@host> show sae statistics radius client accounting udp-port udp-portuser@host> show sae statistics radius client authentication udp-port udp-port
To view only the RADIUS clients that were accessible by IP address and port number:
user@host> show sae statistics radius client brief
147Copyright © 2014, Juniper Networks, Inc.
Chapter 15: Monitoring SAE Data (SRC CLI)
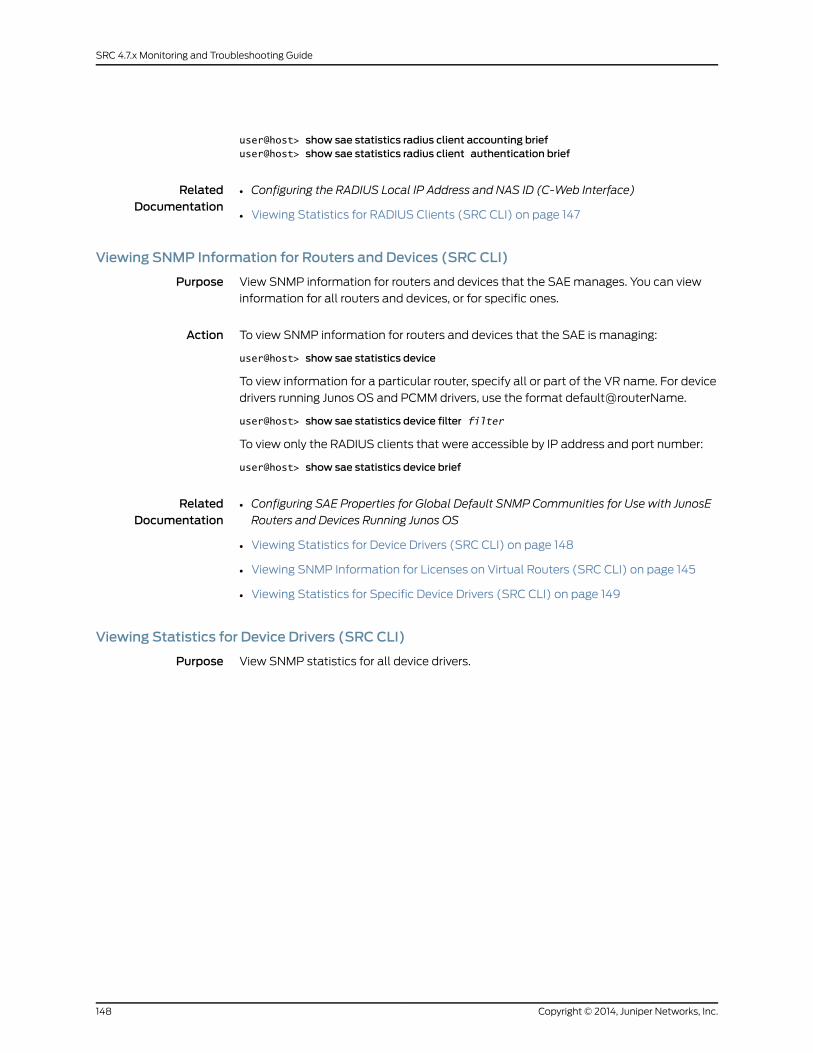
user@host> show sae statistics radius client accounting briefuser@host> show sae statistics radius client authentication brief
RelatedDocumentation
Configuring the RADIUS Local IP Address and NAS ID (C-Web Interface)•
• Viewing Statistics for RADIUS Clients (SRC CLI) on page 147
Viewing SNMP Information for Routers and Devices (SRC CLI)
Purpose View SNMP information for routers and devices that the SAE manages. You can view
information for all routers and devices, or for specific ones.
Action To view SNMP information for routers and devices that the SAE is managing:
user@host> show sae statistics device
To view information for a particular router, specify all or part of the VR name. For device
drivers running Junos OS and PCMM drivers, use the format default@routerName.
user@host> show sae statistics device filter filter
To view only the RADIUS clients that were accessible by IP address and port number:
user@host> show sae statistics device brief
RelatedDocumentation
Configuring SAE Properties for Global Default SNMP Communities for Use with JunosE
Routers and Devices Running Junos OS
•
• Viewing Statistics for Device Drivers (SRC CLI) on page 148
• Viewing SNMP Information for Licenses on Virtual Routers (SRC CLI) on page 145
• Viewing Statistics for Specific Device Drivers (SRC CLI) on page 149
Viewing Statistics for Device Drivers (SRC CLI)
Purpose View SNMP statistics for all device drivers.
Copyright © 2014, Juniper Networks, Inc.148
SRC 4.7.x Monitoring and Troubleshooting Guide
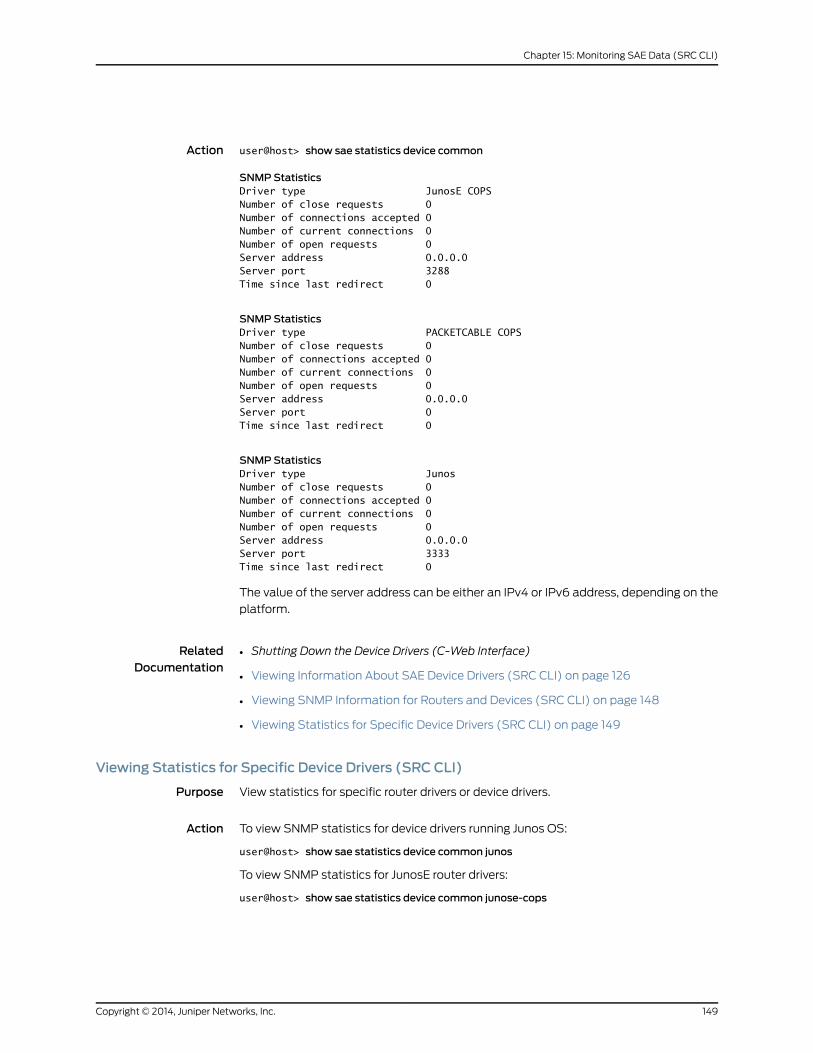
Action user@host> show sae statistics device common
SNMPStatisticsDriver type JunosE COPSNumber of close requests 0Number of connections accepted 0Number of current connections 0Number of open requests 0Server address 0.0.0.0Server port 3288Time since last redirect 0
SNMPStatisticsDriver type PACKETCABLE COPSNumber of close requests 0Number of connections accepted 0Number of current connections 0Number of open requests 0Server address 0.0.0.0Server port 0Time since last redirect 0
SNMPStatisticsDriver type JunosNumber of close requests 0Number of connections accepted 0Number of current connections 0Number of open requests 0Server address 0.0.0.0Server port 3333Time since last redirect 0
The value of the server address can be either an IPv4 or IPv6 address, depending on the
platform.
RelatedDocumentation
Shutting Down the Device Drivers (C-Web Interface)•
• Viewing Information About SAE Device Drivers (SRC CLI) on page 126
• Viewing SNMP Information for Routers and Devices (SRC CLI) on page 148
• Viewing Statistics for Specific Device Drivers (SRC CLI) on page 149
Viewing Statistics for Specific Device Drivers (SRC CLI)
Purpose View statistics for specific router drivers or device drivers.
Action To view SNMP statistics for device drivers running Junos OS:
user@host> show sae statistics device common junos
To view SNMP statistics for JunosE router drivers:
user@host> show sae statistics device common junose-cops
149Copyright © 2014, Juniper Networks, Inc.
Chapter 15: Monitoring SAE Data (SRC CLI)
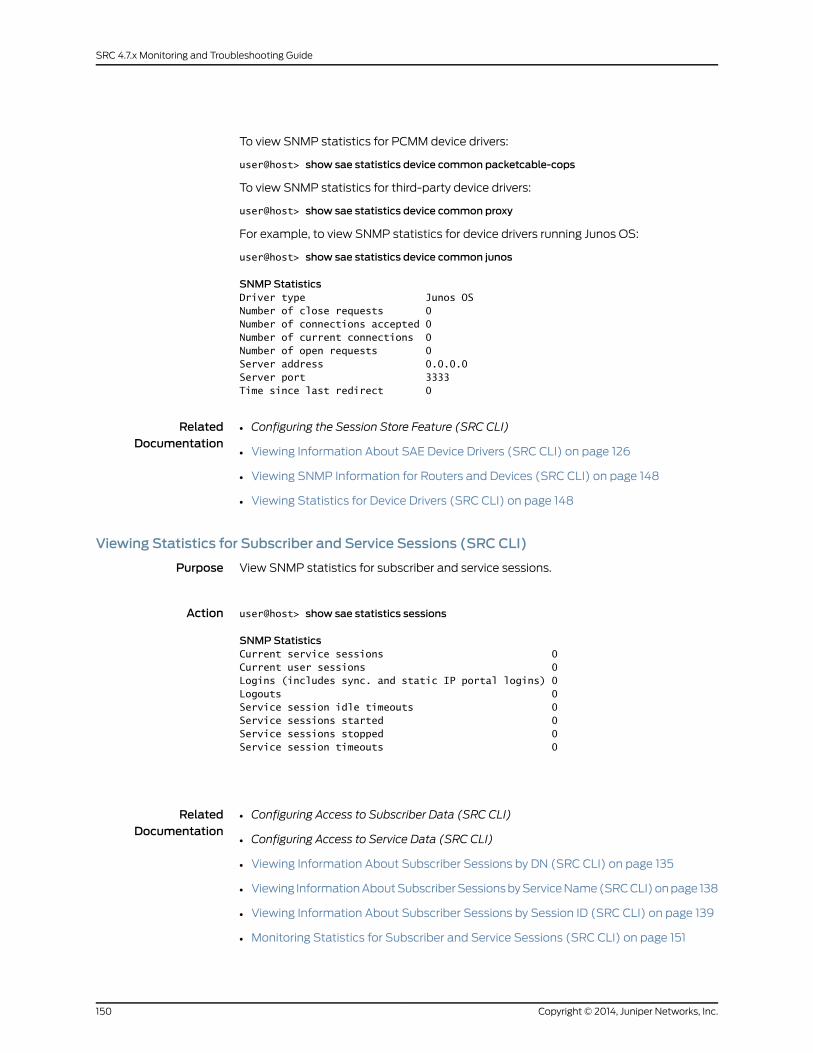
To view SNMP statistics for PCMM device drivers:
user@host> show sae statistics device common packetcable-cops
To view SNMP statistics for third-party device drivers:
user@host> show sae statistics device common proxy
For example, to view SNMP statistics for device drivers running Junos OS:
user@host> show sae statistics device common junos
SNMPStatisticsDriver type Junos OSNumber of close requests 0Number of connections accepted 0Number of current connections 0Number of open requests 0Server address 0.0.0.0Server port 3333Time since last redirect 0
RelatedDocumentation
Configuring the Session Store Feature (SRC CLI)•
• Viewing Information About SAE Device Drivers (SRC CLI) on page 126
• Viewing SNMP Information for Routers and Devices (SRC CLI) on page 148
• Viewing Statistics for Device Drivers (SRC CLI) on page 148
Viewing Statistics for Subscriber and Service Sessions (SRC CLI)
Purpose View SNMP statistics for subscriber and service sessions.
Action user@host> show sae statistics sessions
SNMPStatisticsCurrent service sessions 0Current user sessions 0Logins (includes sync. and static IP portal logins) 0Logouts 0Service session idle timeouts 0Service sessions started 0Service sessions stopped 0Service session timeouts 0
RelatedDocumentation
Configuring Access to Subscriber Data (SRC CLI)•
• Configuring Access to Service Data (SRC CLI)
• Viewing Information About Subscriber Sessions by DN (SRC CLI) on page 135
• Viewing Information About Subscriber Sessions by Service Name (SRC CLI) on page 138
• Viewing Information About Subscriber Sessions by Session ID (SRC CLI) on page 139
• Monitoring Statistics for Subscriber and Service Sessions (SRC CLI) on page 151
Copyright © 2014, Juniper Networks, Inc.150
SRC 4.7.x Monitoring and Troubleshooting Guide
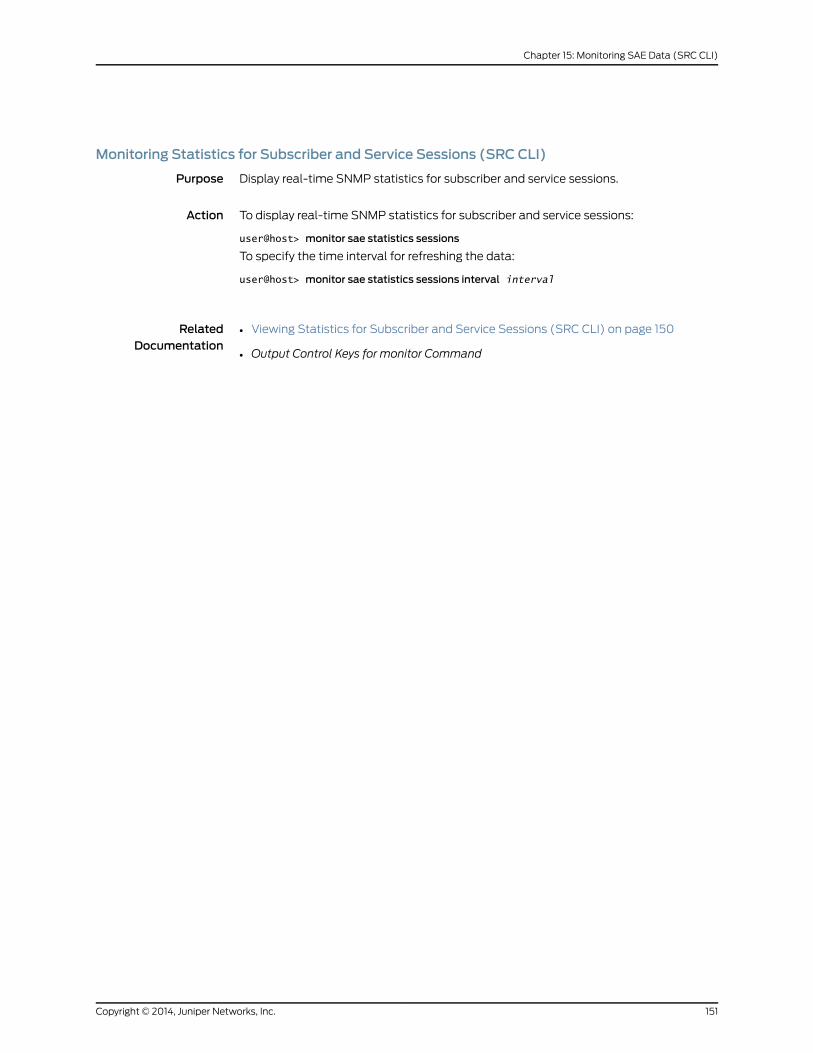
Monitoring Statistics for Subscriber and Service Sessions (SRC CLI)
Purpose Display real-time SNMP statistics for subscriber and service sessions.
Action To display real-time SNMP statistics for subscriber and service sessions:
user@host> monitor sae statistics sessions
To specify the time interval for refreshing the data:
user@host> monitor sae statistics sessions interval interval
RelatedDocumentation
• Viewing Statistics for Subscriber and Service Sessions (SRC CLI) on page 150
• Output Control Keys for monitor Command
151Copyright © 2014, Juniper Networks, Inc.
Chapter 15: Monitoring SAE Data (SRC CLI)

Copyright © 2014, Juniper Networks, Inc.152
SRC 4.7.x Monitoring and Troubleshooting Guide
CHAPTER 16
Monitoring SAE Data (C-Web Interface)
• Viewing SAE Data (C-Web Interface) on page 153
• Viewing Information About Subscriber Sessions (C-Web Interface) on page 161
• Viewing SNMP Information (C-Web Interface) on page 167
Viewing SAE Data (C-Web Interface)
You can view data currently stored in the SAE server’s memory by:
• Viewing Information About the Directory Blacklist (C-Web Interface) on page 153
• Viewing Information About Services (C-Web Interface) on page 154
• Viewing Information About Licenses (C-Web Interface) on page 155
• Viewing Information About Policies (C-Web Interface) on page 155
• Viewing Information About Device Drivers (C-Web Interface) on page 156
• Viewing Information About Interfaces (C-Web Interface) on page 157
• Viewing Equipment Registrations (C-Web Interface) on page 158
• Viewing Login Registrations (C-Web Interface) on page 159
• Viewing Information About Threads (C-Web Interface) on page 160
Viewing Information About the Directory Blacklist (C-Web Interface)
Purpose View information about the directory blacklist configured on the SAE.
Action Click Monitor>SAE >Directory Blacklist.1.
The Directory Blacklist pane appears.
153Copyright © 2014, Juniper Networks, Inc.
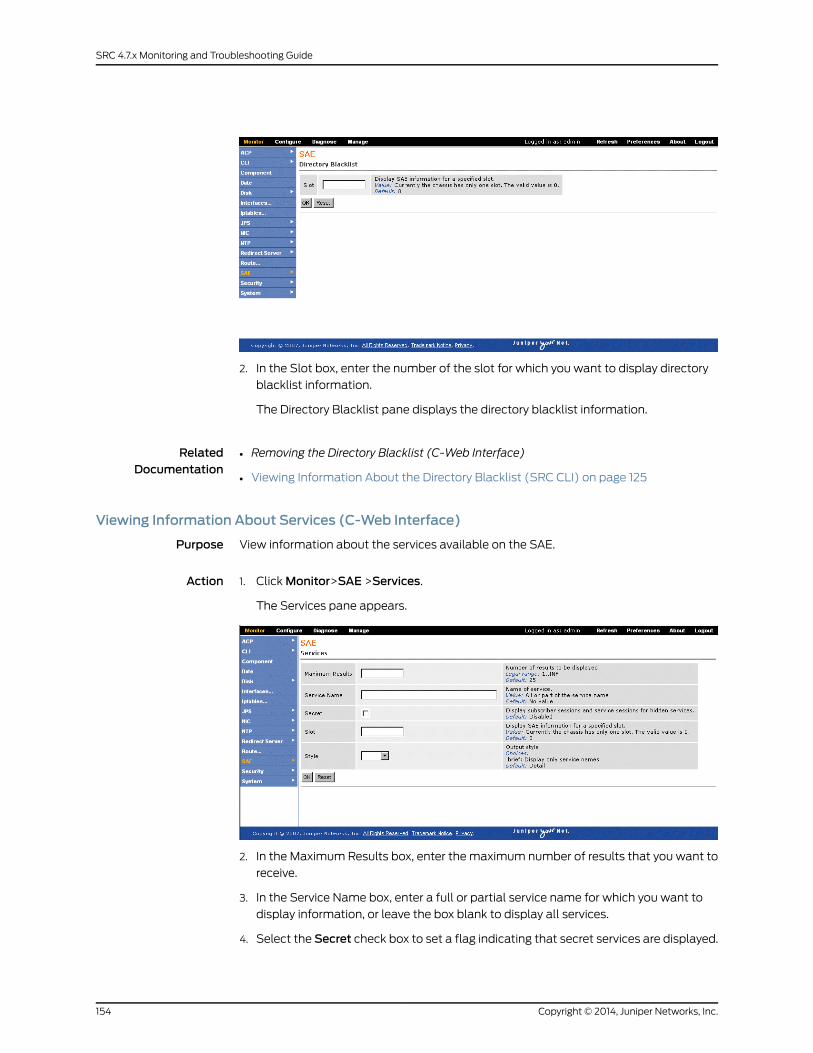
2. In the Slot box, enter the number of the slot for which you want to display directory
blacklist information.
The Directory Blacklist pane displays the directory blacklist information.
RelatedDocumentation
Removing the Directory Blacklist (C-Web Interface)•
• Viewing Information About the Directory Blacklist (SRC CLI) on page 125
Viewing Information About Services (C-Web Interface)
Purpose View information about the services available on the SAE.
Action 1. Click Monitor>SAE >Services.
The Services pane appears.
2. In the Maximum Results box, enter the maximum number of results that you want to
receive.
3. In the Service Name box, enter a full or partial service name for which you want to
display information, or leave the box blank to display all services.
4. Select the Secret check box to set a flag indicating that secret services are displayed.
Copyright © 2014, Juniper Networks, Inc.154
SRC 4.7.x Monitoring and Troubleshooting Guide
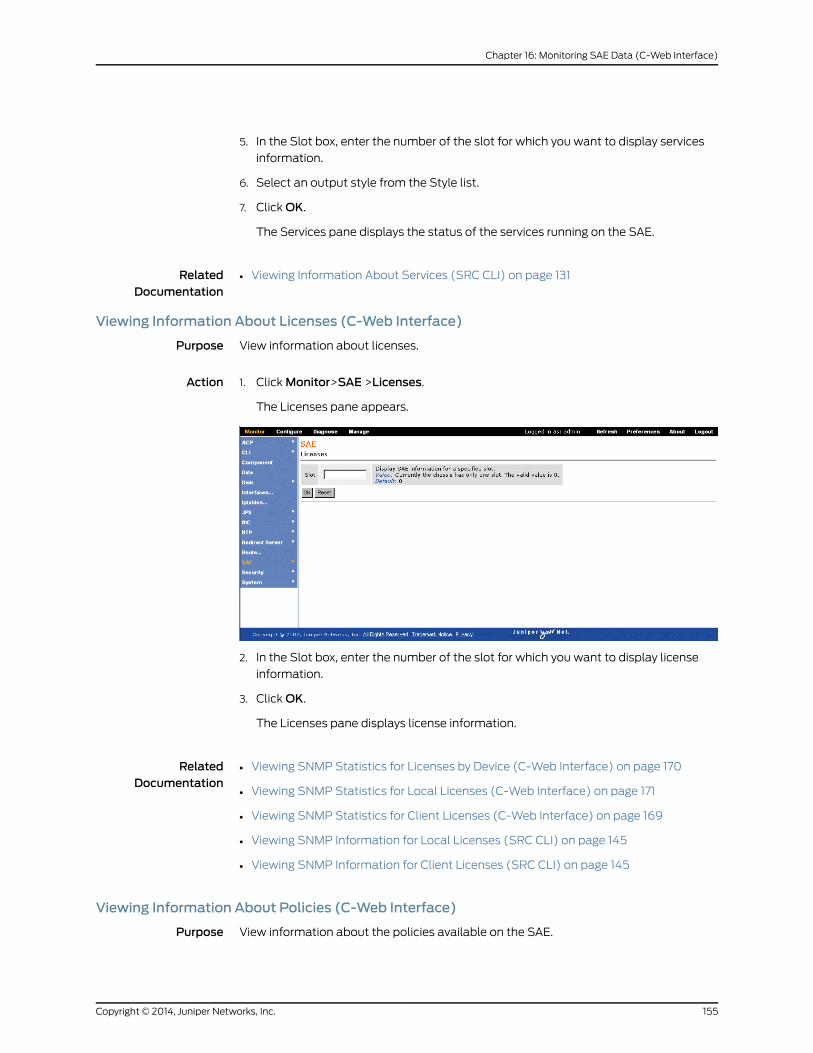
5. In the Slot box, enter the number of the slot for which you want to display services
information.
6. Select an output style from the Style list.
7. Click OK.
The Services pane displays the status of the services running on the SAE.
RelatedDocumentation
Viewing Information About Services (SRC CLI) on page 131•
Viewing Information About Licenses (C-Web Interface)
Purpose View information about licenses.
Action Click Monitor>SAE >Licenses.1.
The Licenses pane appears.
2. In the Slot box, enter the number of the slot for which you want to display license
information.
3. Click OK.
The Licenses pane displays license information.
RelatedDocumentation
Viewing SNMP Statistics for Licenses by Device (C-Web Interface) on page 170•
• Viewing SNMP Statistics for Local Licenses (C-Web Interface) on page 171
• Viewing SNMP Statistics for Client Licenses (C-Web Interface) on page 169
• Viewing SNMP Information for Local Licenses (SRC CLI) on page 145
• Viewing SNMP Information for Client Licenses (SRC CLI) on page 145
Viewing Information About Policies (C-Web Interface)
Purpose View information about the policies available on the SAE.
155Copyright © 2014, Juniper Networks, Inc.
Chapter 16: Monitoring SAE Data (C-Web Interface)
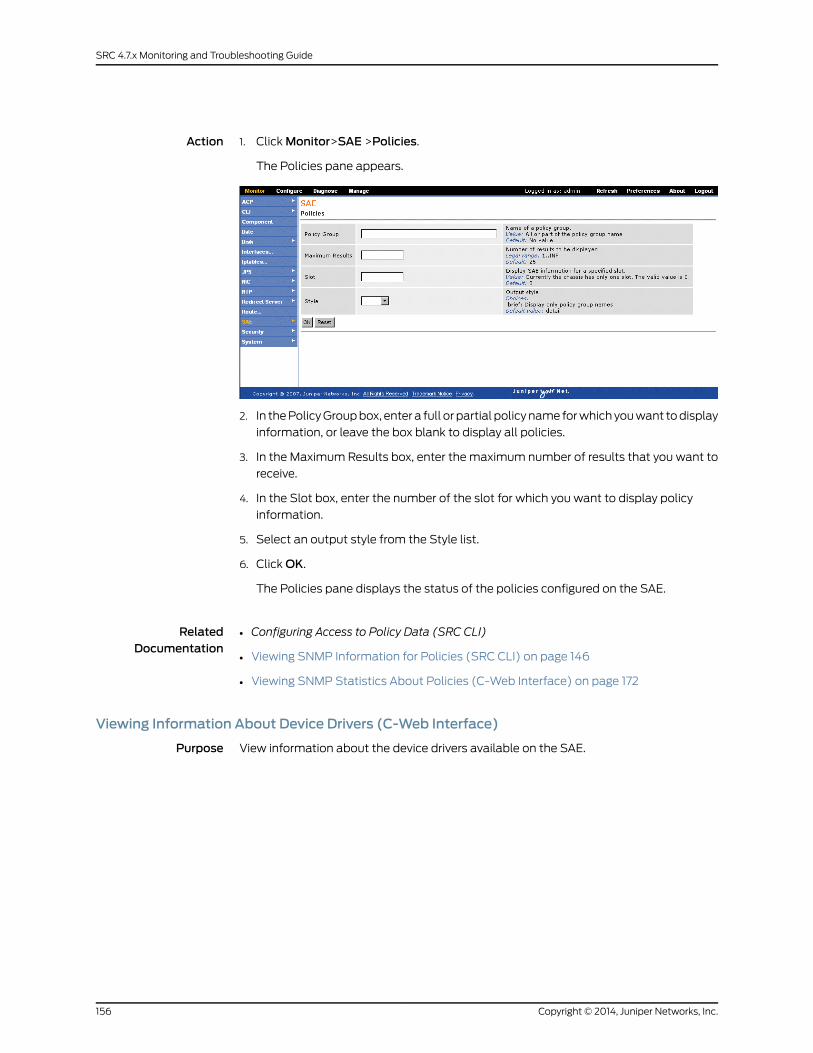
Action 1. Click Monitor>SAE >Policies.
The Policies pane appears.
2. In the Policy Group box, enter a full or partial policy name for which you want to display
information, or leave the box blank to display all policies.
3. In the Maximum Results box, enter the maximum number of results that you want to
receive.
4. In the Slot box, enter the number of the slot for which you want to display policy
information.
5. Select an output style from the Style list.
6. Click OK.
The Policies pane displays the status of the policies configured on the SAE.
RelatedDocumentation
Configuring Access to Policy Data (SRC CLI)•
• Viewing SNMP Information for Policies (SRC CLI) on page 146
• Viewing SNMP Statistics About Policies (C-Web Interface) on page 172
Viewing Information About Device Drivers (C-Web Interface)
Purpose View information about the device drivers available on the SAE.
Copyright © 2014, Juniper Networks, Inc.156
SRC 4.7.x Monitoring and Troubleshooting Guide
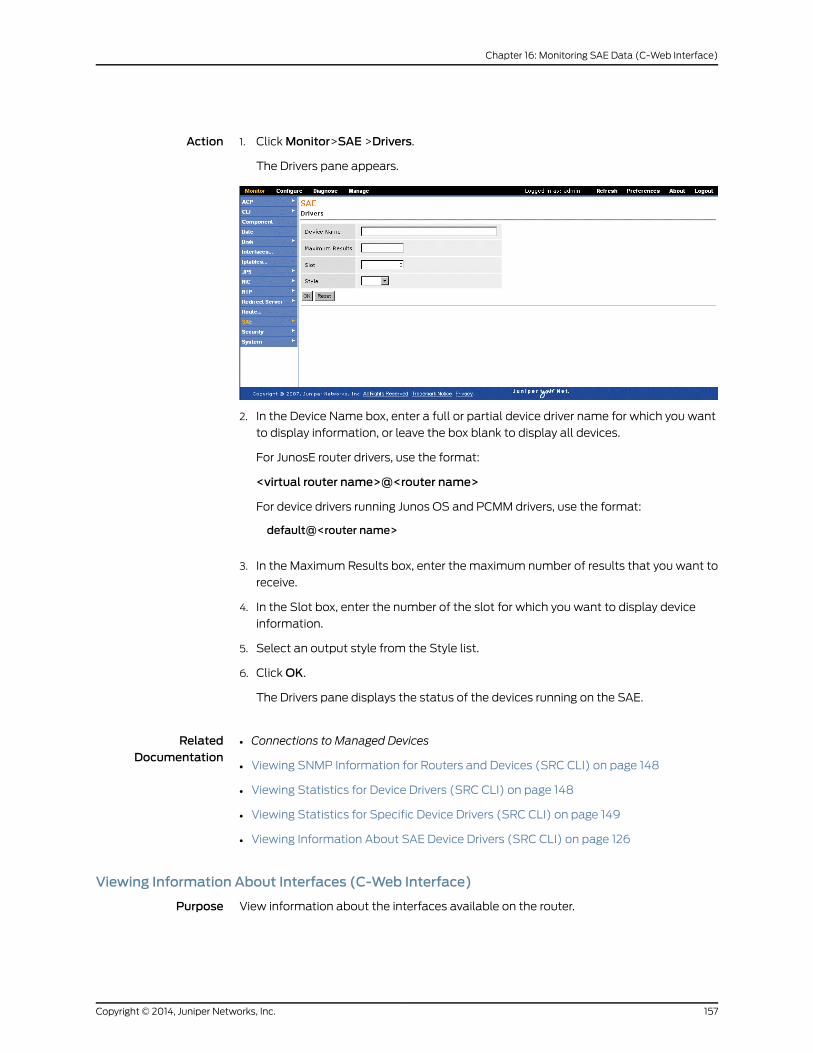
Action 1. Click Monitor>SAE >Drivers.
The Drivers pane appears.
2. In the Device Name box, enter a full or partial device driver name for which you want
to display information, or leave the box blank to display all devices.
For JunosE router drivers, use the format:
<virtual router name>@<router name>
For device drivers running Junos OS and PCMM drivers, use the format:
default@<router name>
3. In the Maximum Results box, enter the maximum number of results that you want to
receive.
4. In the Slot box, enter the number of the slot for which you want to display device
information.
5. Select an output style from the Style list.
6. Click OK.
The Drivers pane displays the status of the devices running on the SAE.
RelatedDocumentation
Connections to Managed Devices•
• Viewing SNMP Information for Routers and Devices (SRC CLI) on page 148
• Viewing Statistics for Device Drivers (SRC CLI) on page 148
• Viewing Statistics for Specific Device Drivers (SRC CLI) on page 149
• Viewing Information About SAE Device Drivers (SRC CLI) on page 126
Viewing Information About Interfaces (C-Web Interface)
Purpose View information about the interfaces available on the router.
157Copyright © 2014, Juniper Networks, Inc.
Chapter 16: Monitoring SAE Data (C-Web Interface)
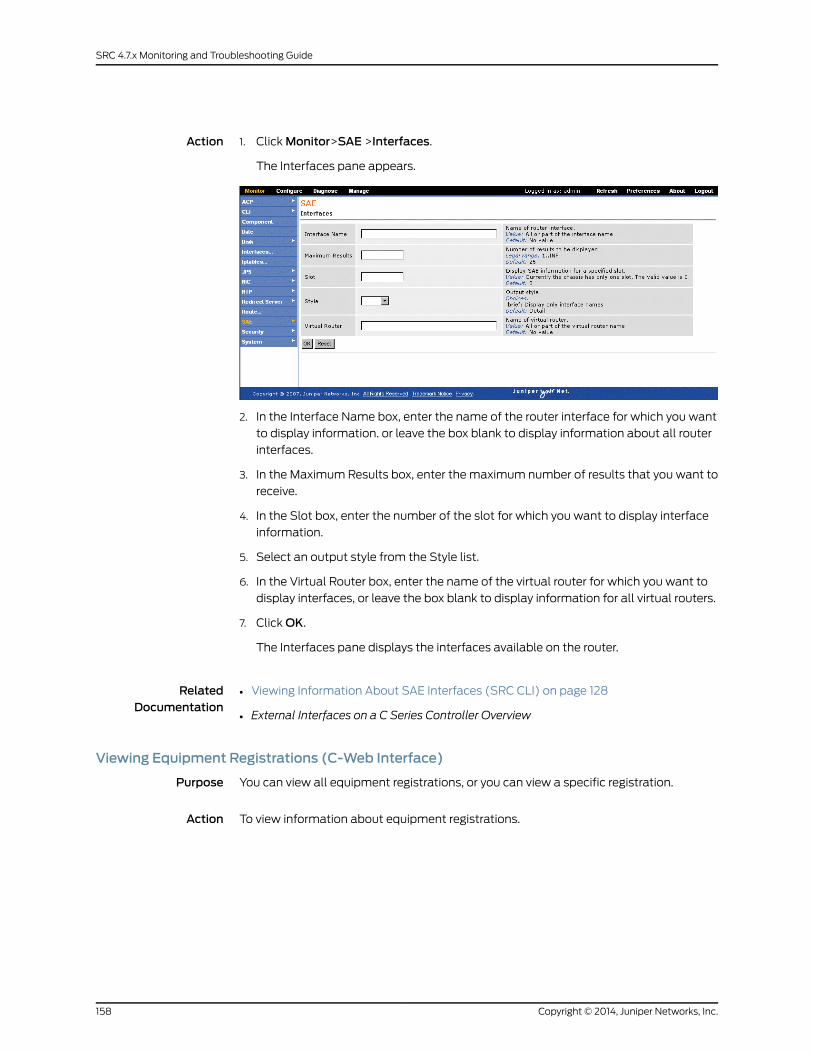
Action 1. Click Monitor>SAE >Interfaces.
The Interfaces pane appears.
2. In the Interface Name box, enter the name of the router interface for which you want
to display information. or leave the box blank to display information about all router
interfaces.
3. In the Maximum Results box, enter the maximum number of results that you want to
receive.
4. In the Slot box, enter the number of the slot for which you want to display interface
information.
5. Select an output style from the Style list.
6. In the Virtual Router box, enter the name of the virtual router for which you want to
display interfaces, or leave the box blank to display information for all virtual routers.
7. Click OK.
The Interfaces pane displays the interfaces available on the router.
RelatedDocumentation
Viewing Information About SAE Interfaces (SRC CLI) on page 128•
• External Interfaces on a C Series Controller Overview
Viewing Equipment Registrations (C-Web Interface)
Purpose You can view all equipment registrations, or you can view a specific registration.
Action To view information about equipment registrations.
Copyright © 2014, Juniper Networks, Inc.158
SRC 4.7.x Monitoring and Troubleshooting Guide
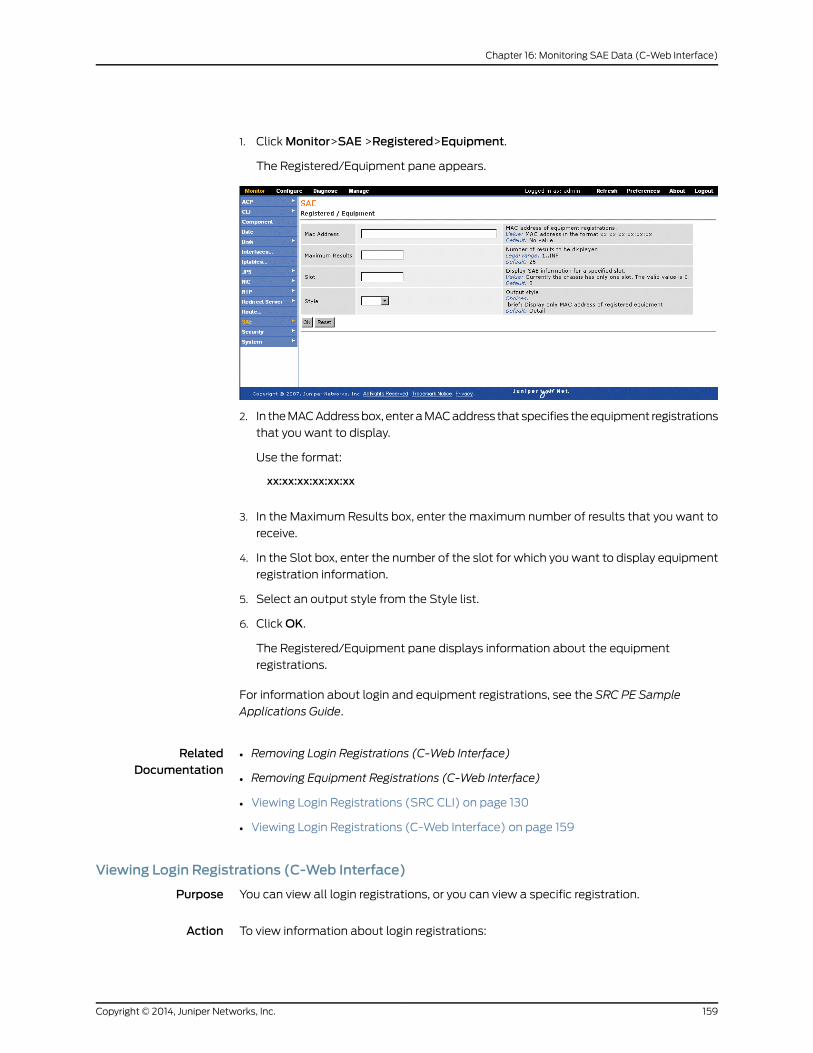
1. Click Monitor>SAE >Registered>Equipment.
The Registered/Equipment pane appears.
2. In the MAC Address box, enter a MAC address that specifies the equipment registrations
that you want to display.
Use the format:
xx:xx:xx:xx:xx:xx
3. In the Maximum Results box, enter the maximum number of results that you want to
receive.
4. In the Slot box, enter the number of the slot for which you want to display equipment
registration information.
5. Select an output style from the Style list.
6. Click OK.
The Registered/Equipment pane displays information about the equipment
registrations.
For information about login and equipment registrations, see the SRC PE Sample
Applications Guide.
RelatedDocumentation
Removing Login Registrations (C-Web Interface)•
• Removing Equipment Registrations (C-Web Interface)
• Viewing Login Registrations (SRC CLI) on page 130
• Viewing Login Registrations (C-Web Interface) on page 159
Viewing Login Registrations (C-Web Interface)
Purpose You can view all login registrations, or you can view a specific registration.
Action To view information about login registrations:
159Copyright © 2014, Juniper Networks, Inc.
Chapter 16: Monitoring SAE Data (C-Web Interface)
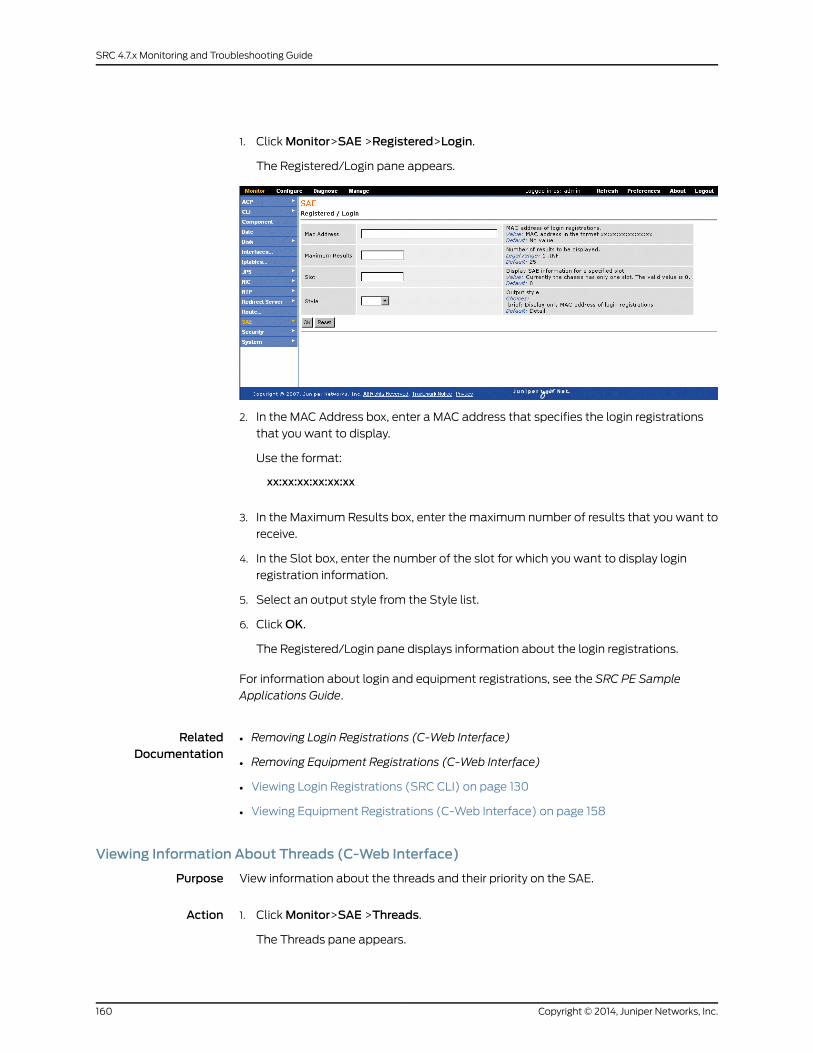
1. Click Monitor>SAE >Registered>Login.
The Registered/Login pane appears.
2. In the MAC Address box, enter a MAC address that specifies the login registrations
that you want to display.
Use the format:
xx:xx:xx:xx:xx:xx
3. In the Maximum Results box, enter the maximum number of results that you want to
receive.
4. In the Slot box, enter the number of the slot for which you want to display login
registration information.
5. Select an output style from the Style list.
6. Click OK.
The Registered/Login pane displays information about the login registrations.
For information about login and equipment registrations, see the SRC PE Sample
Applications Guide.
RelatedDocumentation
Removing Login Registrations (C-Web Interface)•
• Removing Equipment Registrations (C-Web Interface)
• Viewing Login Registrations (SRC CLI) on page 130
• Viewing Equipment Registrations (C-Web Interface) on page 158
Viewing Information About Threads (C-Web Interface)
Purpose View information about the threads and their priority on the SAE.
Action Click Monitor>SAE >Threads.1.
The Threads pane appears.
Copyright © 2014, Juniper Networks, Inc.160
SRC 4.7.x Monitoring and Troubleshooting Guide
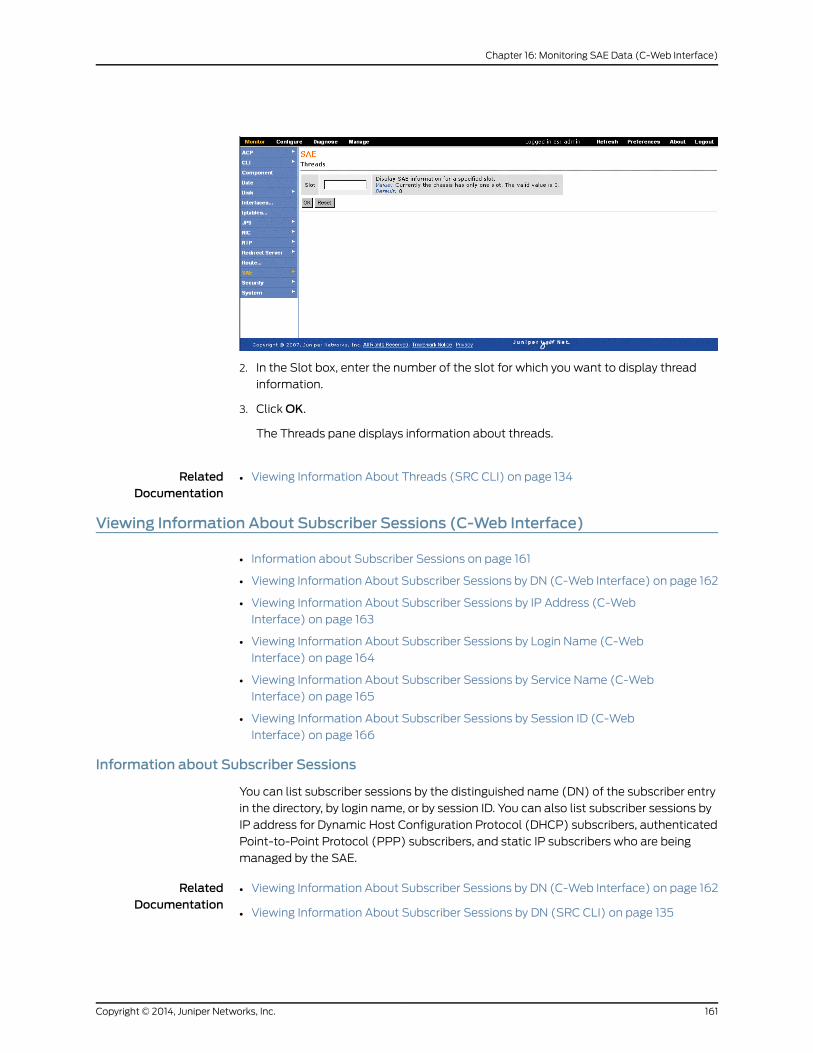
2. In the Slot box, enter the number of the slot for which you want to display thread
information.
3. Click OK.
The Threads pane displays information about threads.
RelatedDocumentation
Viewing Information About Threads (SRC CLI) on page 134•
Viewing Information About Subscriber Sessions (C-Web Interface)
• Information about Subscriber Sessions on page 161
• Viewing Information About Subscriber Sessions by DN (C-Web Interface) on page 162
• Viewing Information About Subscriber Sessions by IP Address (C-Web
Interface) on page 163
• Viewing Information About Subscriber Sessions by Login Name (C-Web
Interface) on page 164
• Viewing Information About Subscriber Sessions by Service Name (C-Web
Interface) on page 165
• Viewing Information About Subscriber Sessions by Session ID (C-Web
Interface) on page 166
Information about Subscriber Sessions
You can list subscriber sessions by the distinguished name (DN) of the subscriber entry
in the directory, by login name, or by session ID. You can also list subscriber sessions by
IP address for Dynamic Host Configuration Protocol (DHCP) subscribers, authenticated
Point-to-Point Protocol (PPP) subscribers, and static IP subscribers who are being
managed by the SAE.
RelatedDocumentation
Viewing Information About Subscriber Sessions by DN (C-Web Interface) on page 162•
• Viewing Information About Subscriber Sessions by DN (SRC CLI) on page 135
161Copyright © 2014, Juniper Networks, Inc.
Chapter 16: Monitoring SAE Data (C-Web Interface)
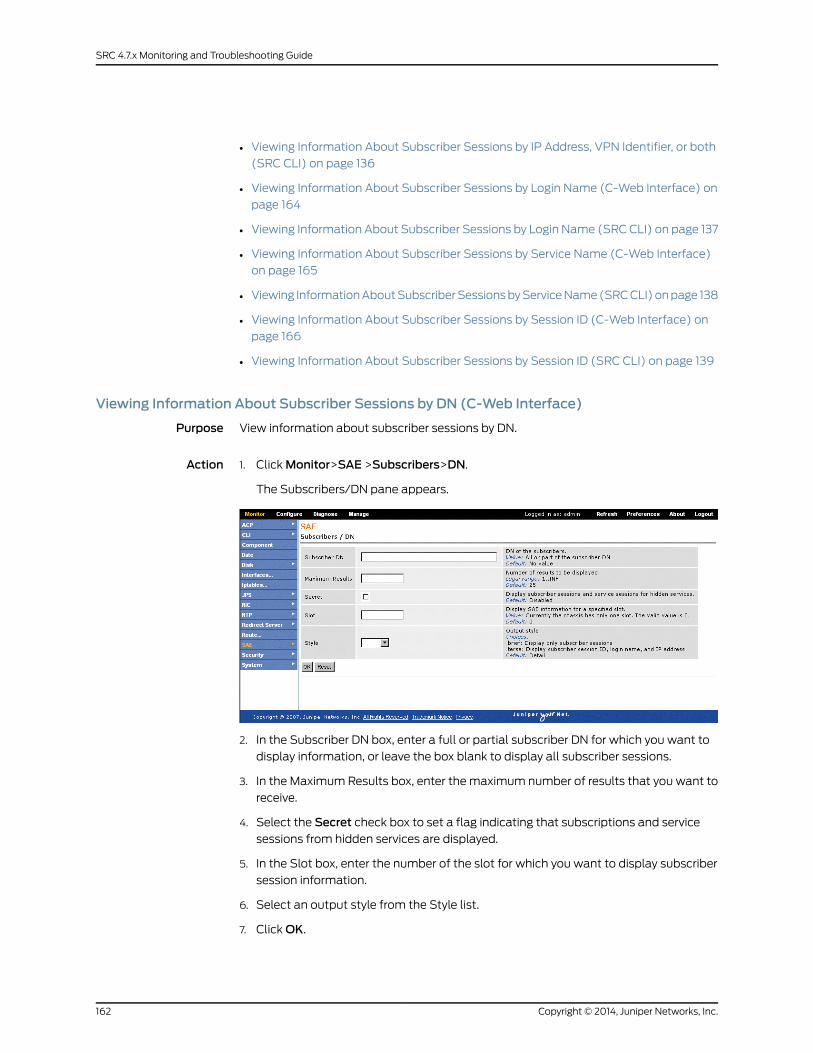
• Viewing Information About Subscriber Sessions by IP Address, VPN Identifier, or both
(SRC CLI) on page 136
• Viewing Information About Subscriber Sessions by Login Name (C-Web Interface) on
page 164
• Viewing Information About Subscriber Sessions by Login Name (SRC CLI) on page 137
• Viewing Information About Subscriber Sessions by Service Name (C-Web Interface)
on page 165
• Viewing Information About Subscriber Sessions by Service Name (SRC CLI) on page 138
• Viewing Information About Subscriber Sessions by Session ID (C-Web Interface) on
page 166
• Viewing Information About Subscriber Sessions by Session ID (SRC CLI) on page 139
Viewing Information About Subscriber Sessions by DN (C-Web Interface)
Purpose View information about subscriber sessions by DN.
Action 1. Click Monitor>SAE >Subscribers>DN.
The Subscribers/DN pane appears.
2. In the Subscriber DN box, enter a full or partial subscriber DN for which you want to
display information, or leave the box blank to display all subscriber sessions.
3. In the Maximum Results box, enter the maximum number of results that you want to
receive.
4. Select the Secret check box to set a flag indicating that subscriptions and service
sessions from hidden services are displayed.
5. In the Slot box, enter the number of the slot for which you want to display subscriber
session information.
6. Select an output style from the Style list.
7. Click OK.
Copyright © 2014, Juniper Networks, Inc.162
SRC 4.7.x Monitoring and Troubleshooting Guide
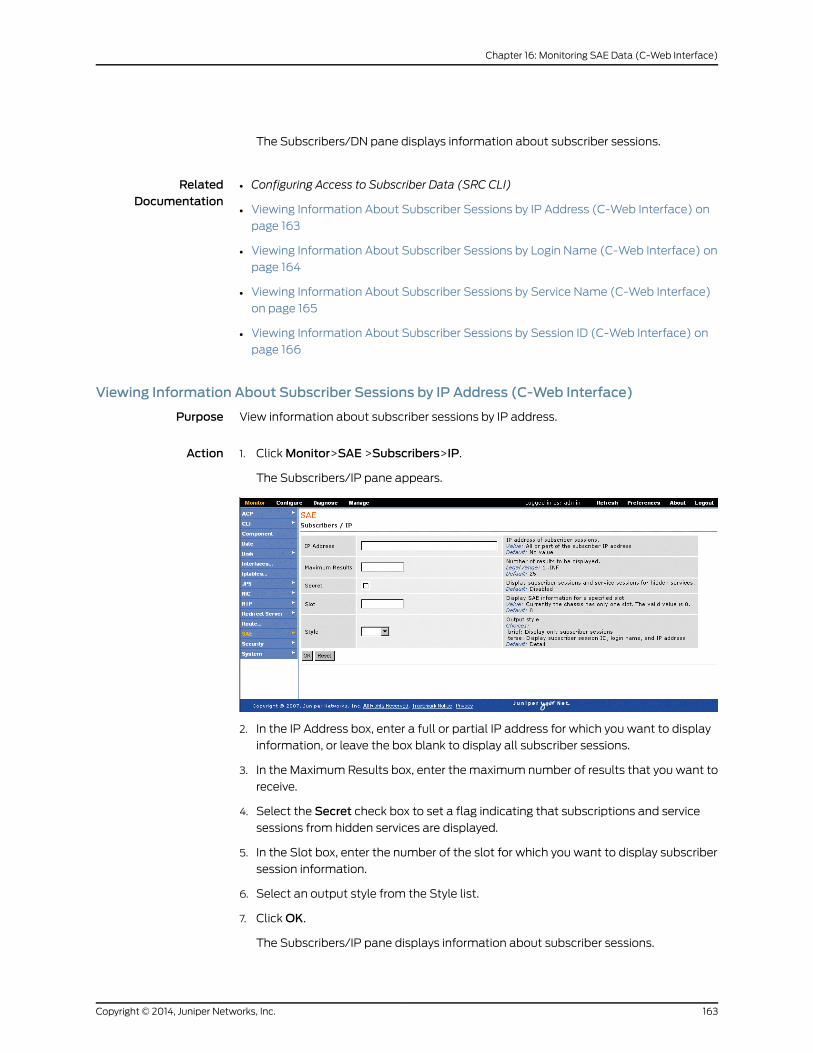
The Subscribers/DN pane displays information about subscriber sessions.
RelatedDocumentation
Configuring Access to Subscriber Data (SRC CLI)•
• Viewing Information About Subscriber Sessions by IP Address (C-Web Interface) on
page 163
• Viewing Information About Subscriber Sessions by Login Name (C-Web Interface) on
page 164
• Viewing Information About Subscriber Sessions by Service Name (C-Web Interface)
on page 165
• Viewing Information About Subscriber Sessions by Session ID (C-Web Interface) on
page 166
Viewing Information About Subscriber Sessions by IP Address (C-Web Interface)
Purpose View information about subscriber sessions by IP address.
Action 1. Click Monitor>SAE >Subscribers>IP.
The Subscribers/IP pane appears.
2. In the IP Address box, enter a full or partial IP address for which you want to display
information, or leave the box blank to display all subscriber sessions.
3. In the Maximum Results box, enter the maximum number of results that you want to
receive.
4. Select the Secret check box to set a flag indicating that subscriptions and service
sessions from hidden services are displayed.
5. In the Slot box, enter the number of the slot for which you want to display subscriber
session information.
6. Select an output style from the Style list.
7. Click OK.
The Subscribers/IP pane displays information about subscriber sessions.
163Copyright © 2014, Juniper Networks, Inc.
Chapter 16: Monitoring SAE Data (C-Web Interface)
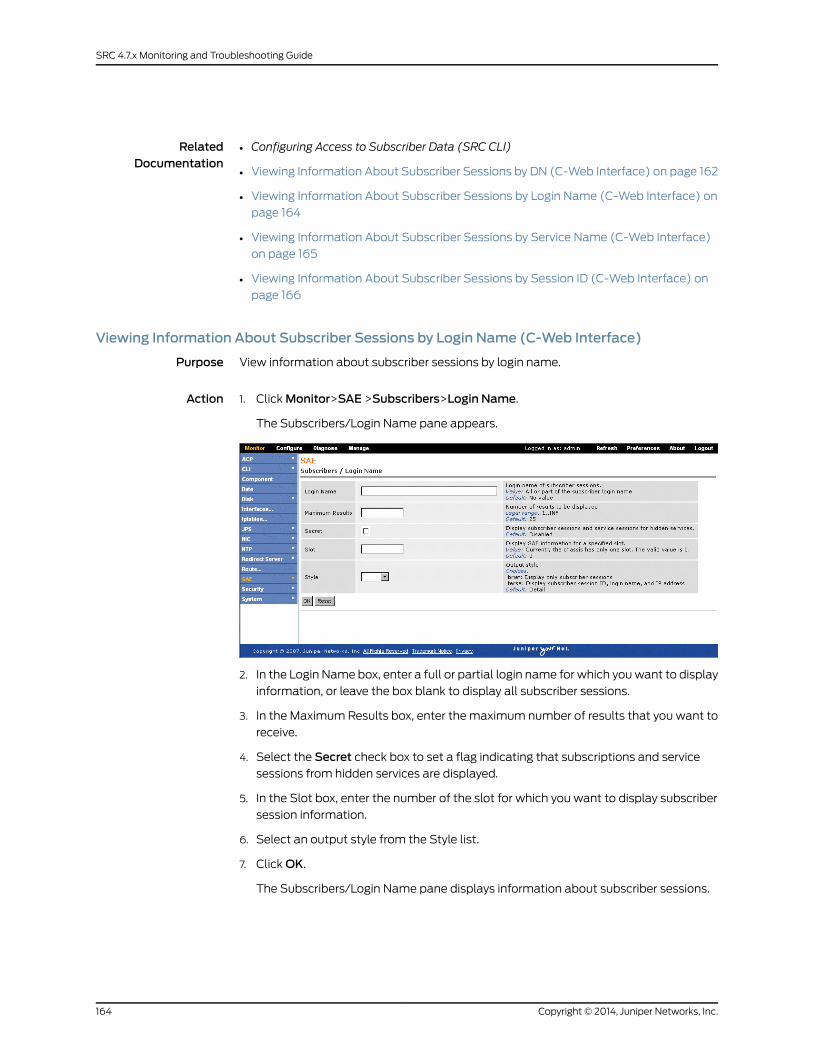
RelatedDocumentation
Configuring Access to Subscriber Data (SRC CLI)•
• Viewing Information About Subscriber Sessions by DN (C-Web Interface) on page 162
• Viewing Information About Subscriber Sessions by Login Name (C-Web Interface) on
page 164
• Viewing Information About Subscriber Sessions by Service Name (C-Web Interface)
on page 165
• Viewing Information About Subscriber Sessions by Session ID (C-Web Interface) on
page 166
Viewing Information About Subscriber Sessions by Login Name (C-Web Interface)
Purpose View information about subscriber sessions by login name.
Action 1. Click Monitor>SAE >Subscribers>Login Name.
The Subscribers/Login Name pane appears.
2. In the Login Name box, enter a full or partial login name for which you want to display
information, or leave the box blank to display all subscriber sessions.
3. In the Maximum Results box, enter the maximum number of results that you want to
receive.
4. Select the Secret check box to set a flag indicating that subscriptions and service
sessions from hidden services are displayed.
5. In the Slot box, enter the number of the slot for which you want to display subscriber
session information.
6. Select an output style from the Style list.
7. Click OK.
The Subscribers/Login Name pane displays information about subscriber sessions.
Copyright © 2014, Juniper Networks, Inc.164
SRC 4.7.x Monitoring and Troubleshooting Guide
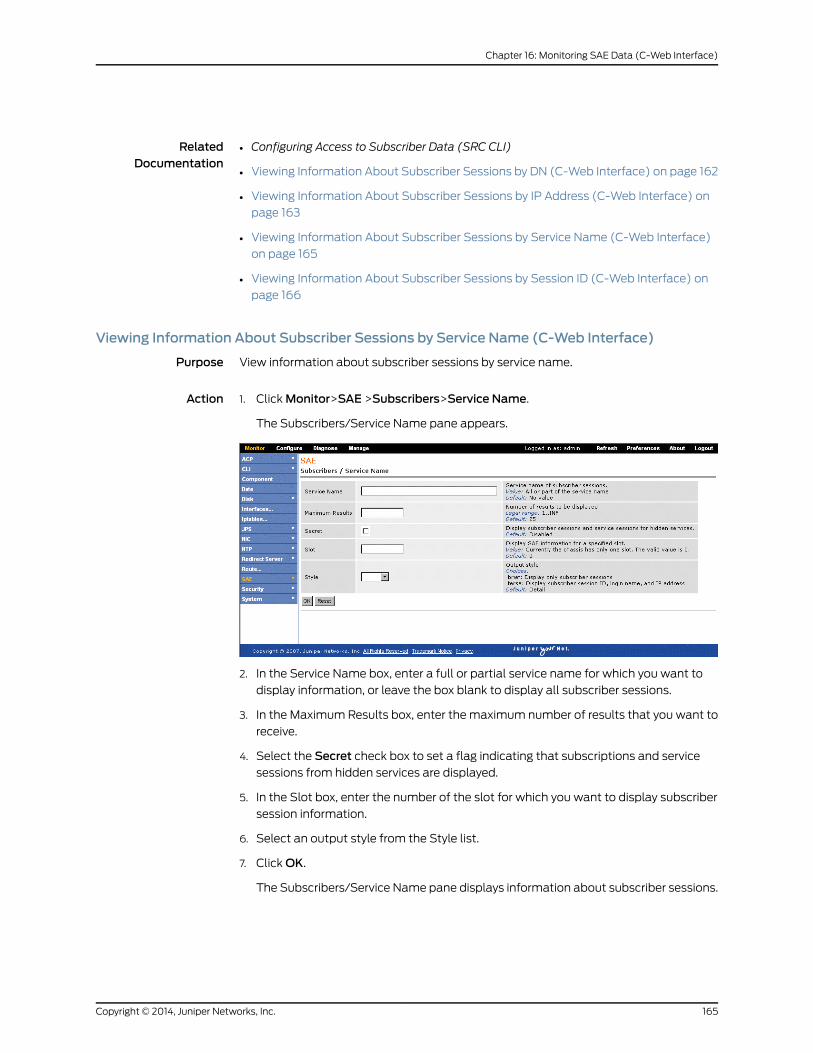
RelatedDocumentation
Configuring Access to Subscriber Data (SRC CLI)•
• Viewing Information About Subscriber Sessions by DN (C-Web Interface) on page 162
• Viewing Information About Subscriber Sessions by IP Address (C-Web Interface) on
page 163
• Viewing Information About Subscriber Sessions by Service Name (C-Web Interface)
on page 165
• Viewing Information About Subscriber Sessions by Session ID (C-Web Interface) on
page 166
Viewing Information About Subscriber Sessions by Service Name (C-Web Interface)
Purpose View information about subscriber sessions by service name.
Action 1. Click Monitor>SAE >Subscribers>Service Name.
The Subscribers/Service Name pane appears.
2. In the Service Name box, enter a full or partial service name for which you want to
display information, or leave the box blank to display all subscriber sessions.
3. In the Maximum Results box, enter the maximum number of results that you want to
receive.
4. Select the Secret check box to set a flag indicating that subscriptions and service
sessions from hidden services are displayed.
5. In the Slot box, enter the number of the slot for which you want to display subscriber
session information.
6. Select an output style from the Style list.
7. Click OK.
The Subscribers/Service Name pane displays information about subscriber sessions.
165Copyright © 2014, Juniper Networks, Inc.
Chapter 16: Monitoring SAE Data (C-Web Interface)
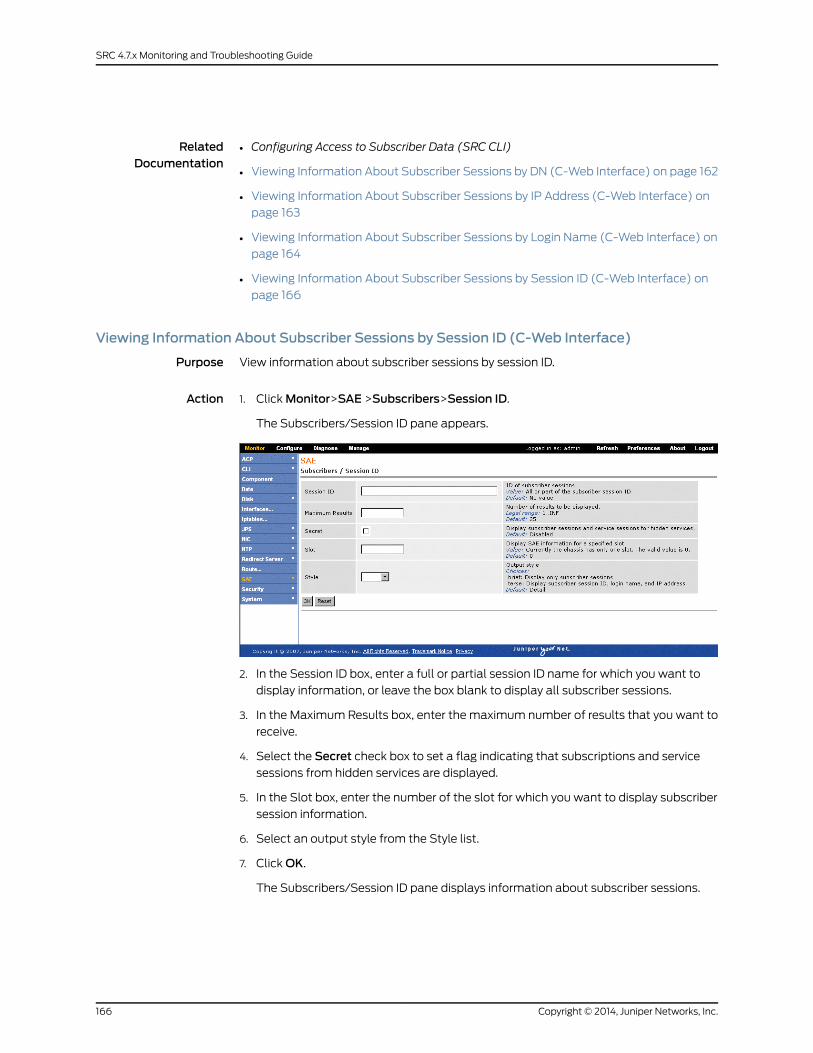
RelatedDocumentation
Configuring Access to Subscriber Data (SRC CLI)•
• Viewing Information About Subscriber Sessions by DN (C-Web Interface) on page 162
• Viewing Information About Subscriber Sessions by IP Address (C-Web Interface) on
page 163
• Viewing Information About Subscriber Sessions by Login Name (C-Web Interface) on
page 164
• Viewing Information About Subscriber Sessions by Session ID (C-Web Interface) on
page 166
Viewing Information About Subscriber Sessions by Session ID (C-Web Interface)
Purpose View information about subscriber sessions by session ID.
Action 1. Click Monitor>SAE >Subscribers>Session ID.
The Subscribers/Session ID pane appears.
2. In the Session ID box, enter a full or partial session ID name for which you want to
display information, or leave the box blank to display all subscriber sessions.
3. In the Maximum Results box, enter the maximum number of results that you want to
receive.
4. Select the Secret check box to set a flag indicating that subscriptions and service
sessions from hidden services are displayed.
5. In the Slot box, enter the number of the slot for which you want to display subscriber
session information.
6. Select an output style from the Style list.
7. Click OK.
The Subscribers/Session ID pane displays information about subscriber sessions.
Copyright © 2014, Juniper Networks, Inc.166
SRC 4.7.x Monitoring and Troubleshooting Guide
RelatedDocumentation
Configuring Access to Subscriber Data (SRC CLI)•
• Viewing Information About Subscriber Sessions by DN (C-Web Interface) on page 162
• Viewing Information About Subscriber Sessions by IP Address (C-Web Interface) on
page 163
• Viewing Information About Subscriber Sessions by Login Name (C-Web Interface) on
page 164
• Viewing Information About Subscriber Sessions by Service Name (C-Web Interface)
on page 165
Viewing SNMP Information (C-Web Interface)
You can use the C-Web interface to view SNMP statistics for the SAE configuration by:
• Viewing SNMP Statistics for the Directory (C-Web Interface) on page 167
• Viewing SNMP Statistics for Directory Connections (C-Web Interface) on page 168
• Viewing SNMP Statistics for Client Licenses (C-Web Interface) on page 169
• Viewing SNMP Statistics for Licenses by Device (C-Web Interface) on page 170
• Viewing SNMP Statistics for Local Licenses (C-Web Interface) on page 171
• Viewing SNMP Statistics About Policies (C-Web Interface) on page 172
• Viewing SNMP Statistics About Server Processes (C-Web Interface) on page 173
• Viewing SNMP Statistics About RADIUS (C-Web Interface) on page 174
• Viewing SNMP Statistics About RADIUS Clients (C-Web Interface) on page 174
• Viewing SNMP Statistics for Devices (C-Web Interface) on page 175
• Viewing SNMP Statistics for Specific Devices (C-Web Interface) on page 176
• Viewing SNMP Statistics for Subscriber Sessions and Service Sessions (C-Web
Interface) on page 177
Viewing SNMPStatistics for the Directory (C-Web Interface)
Purpose View SNMP statistics for the directory.
Action Click Monitor>SAE >Statistics>Directory.1.
The Statistics/Directory pane appears.
167Copyright © 2014, Juniper Networks, Inc.
Chapter 16: Monitoring SAE Data (C-Web Interface)
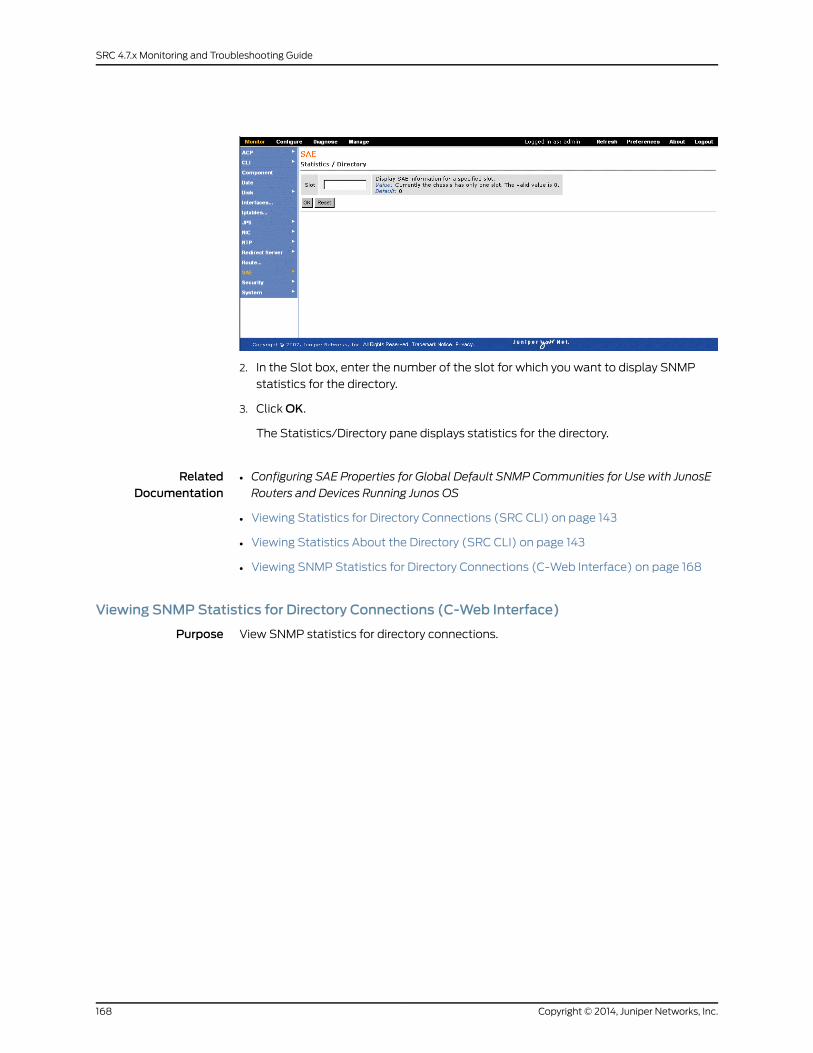
2. In the Slot box, enter the number of the slot for which you want to display SNMP
statistics for the directory.
3. Click OK.
The Statistics/Directory pane displays statistics for the directory.
RelatedDocumentation
Configuring SAE Properties for Global Default SNMP Communities for Use with JunosE
Routers and Devices Running Junos OS
•
• Viewing Statistics for Directory Connections (SRC CLI) on page 143
• Viewing Statistics About the Directory (SRC CLI) on page 143
• Viewing SNMP Statistics for Directory Connections (C-Web Interface) on page 168
Viewing SNMPStatistics for Directory Connections (C-Web Interface)
Purpose View SNMP statistics for directory connections.
Copyright © 2014, Juniper Networks, Inc.168
SRC 4.7.x Monitoring and Troubleshooting Guide
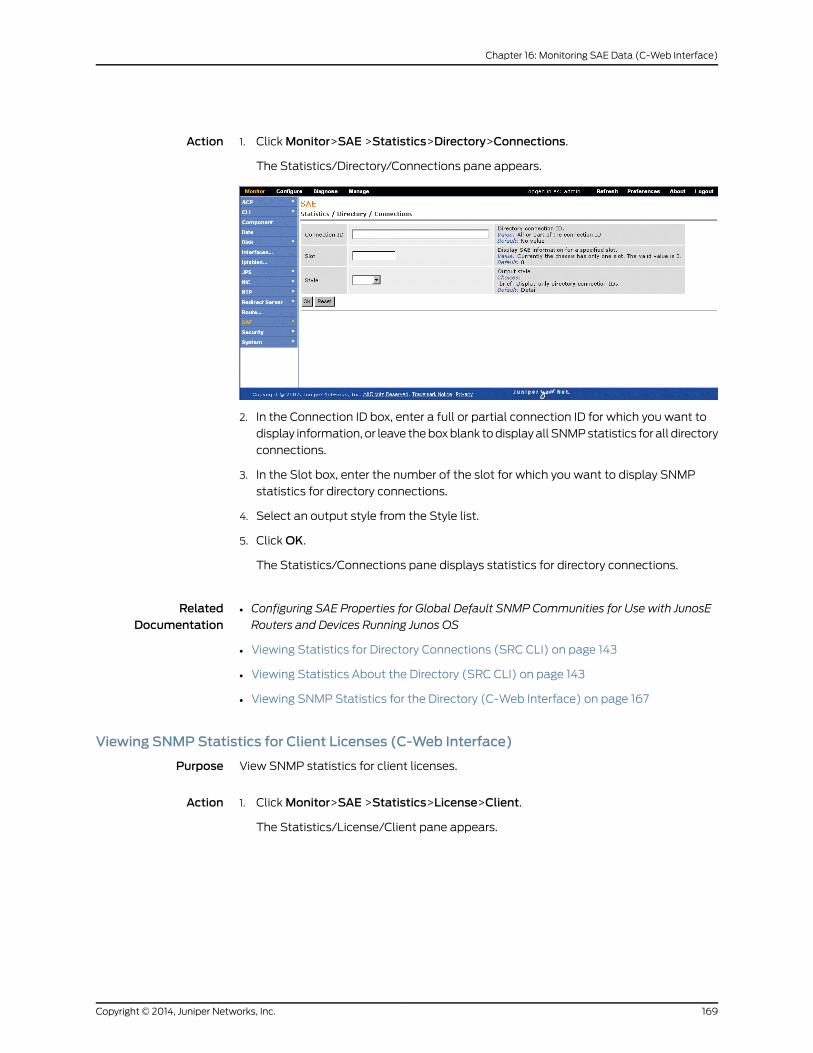
Action 1. Click Monitor>SAE >Statistics>Directory>Connections.
The Statistics/Directory/Connections pane appears.
2. In the Connection ID box, enter a full or partial connection ID for which you want to
display information, or leave the box blank to display all SNMP statistics for all directory
connections.
3. In the Slot box, enter the number of the slot for which you want to display SNMP
statistics for directory connections.
4. Select an output style from the Style list.
5. Click OK.
The Statistics/Connections pane displays statistics for directory connections.
RelatedDocumentation
Configuring SAE Properties for Global Default SNMP Communities for Use with JunosE
Routers and Devices Running Junos OS
•
• Viewing Statistics for Directory Connections (SRC CLI) on page 143
• Viewing Statistics About the Directory (SRC CLI) on page 143
• Viewing SNMP Statistics for the Directory (C-Web Interface) on page 167
Viewing SNMPStatistics for Client Licenses (C-Web Interface)
Purpose View SNMP statistics for client licenses.
Action Click Monitor>SAE >Statistics>License>Client.1.
The Statistics/License/Client pane appears.
169Copyright © 2014, Juniper Networks, Inc.
Chapter 16: Monitoring SAE Data (C-Web Interface)

2. In the Slot box, enter the number of the slot for which you want to display SNMP
statistics for client licenses.
3. Click OK.
The Statistics/License/Client pane displays statistics for client licenses.
RelatedDocumentation
Viewing SNMP Statistics for Licenses by Device (C-Web Interface) on page 170•
• Viewing SNMP Statistics for Local Licenses (C-Web Interface) on page 171
• Viewing SNMP Information for Local Licenses (SRC CLI) on page 145
• Viewing SNMP Information for Client Licenses (SRC CLI) on page 145
• Viewing SNMP Information for Licenses on Virtual Routers (SRC CLI) on page 145
Viewing SNMPStatistics for Licenses by Device (C-Web Interface)
Purpose View SNMP statistics for licenses by device.
Copyright © 2014, Juniper Networks, Inc.170
SRC 4.7.x Monitoring and Troubleshooting Guide
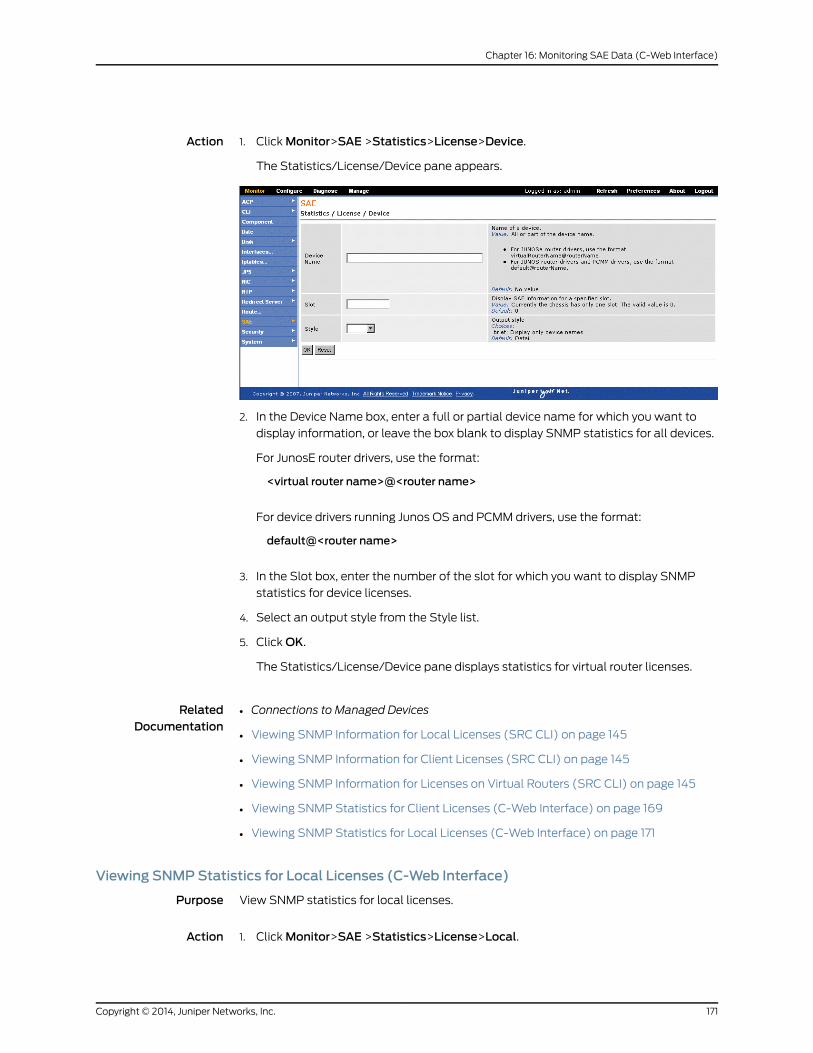
Action 1. Click Monitor>SAE >Statistics>License>Device.
The Statistics/License/Device pane appears.
2. In the Device Name box, enter a full or partial device name for which you want to
display information, or leave the box blank to display SNMP statistics for all devices.
For JunosE router drivers, use the format:
<virtual router name>@<router name>
For device drivers running Junos OS and PCMM drivers, use the format:
default@<router name>
3. In the Slot box, enter the number of the slot for which you want to display SNMP
statistics for device licenses.
4. Select an output style from the Style list.
5. Click OK.
The Statistics/License/Device pane displays statistics for virtual router licenses.
RelatedDocumentation
Connections to Managed Devices•
• Viewing SNMP Information for Local Licenses (SRC CLI) on page 145
• Viewing SNMP Information for Client Licenses (SRC CLI) on page 145
• Viewing SNMP Information for Licenses on Virtual Routers (SRC CLI) on page 145
• Viewing SNMP Statistics for Client Licenses (C-Web Interface) on page 169
• Viewing SNMP Statistics for Local Licenses (C-Web Interface) on page 171
Viewing SNMPStatistics for Local Licenses (C-Web Interface)
Purpose View SNMP statistics for local licenses.
Action Click Monitor>SAE >Statistics>License>Local.1.
171Copyright © 2014, Juniper Networks, Inc.
Chapter 16: Monitoring SAE Data (C-Web Interface)
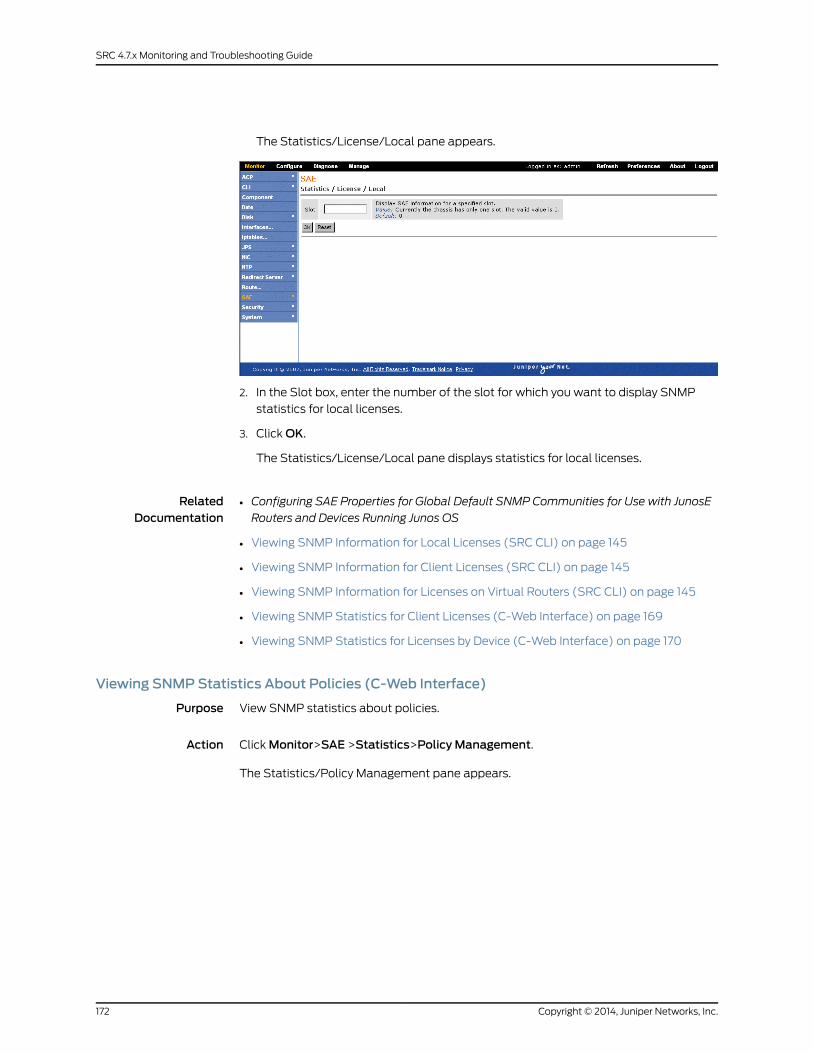
The Statistics/License/Local pane appears.
2. In the Slot box, enter the number of the slot for which you want to display SNMP
statistics for local licenses.
3. Click OK.
The Statistics/License/Local pane displays statistics for local licenses.
RelatedDocumentation
Configuring SAE Properties for Global Default SNMP Communities for Use with JunosE
Routers and Devices Running Junos OS
•
• Viewing SNMP Information for Local Licenses (SRC CLI) on page 145
• Viewing SNMP Information for Client Licenses (SRC CLI) on page 145
• Viewing SNMP Information for Licenses on Virtual Routers (SRC CLI) on page 145
• Viewing SNMP Statistics for Client Licenses (C-Web Interface) on page 169
• Viewing SNMP Statistics for Licenses by Device (C-Web Interface) on page 170
Viewing SNMPStatistics About Policies (C-Web Interface)
Purpose View SNMP statistics about policies.
Action Click Monitor>SAE >Statistics>Policy Management.
The Statistics/Policy Management pane appears.
Copyright © 2014, Juniper Networks, Inc.172
SRC 4.7.x Monitoring and Troubleshooting Guide
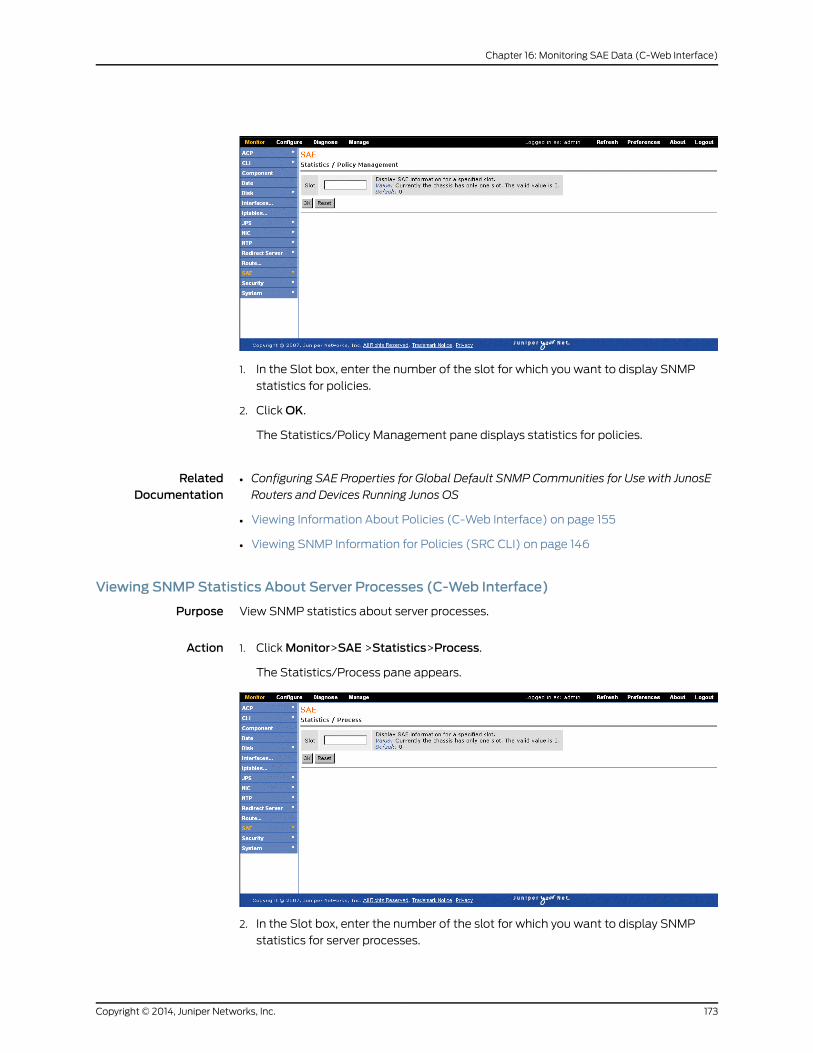
1. In the Slot box, enter the number of the slot for which you want to display SNMP
statistics for policies.
2. Click OK.
The Statistics/Policy Management pane displays statistics for policies.
RelatedDocumentation
Configuring SAE Properties for Global Default SNMP Communities for Use with JunosE
Routers and Devices Running Junos OS
•
• Viewing Information About Policies (C-Web Interface) on page 155
• Viewing SNMP Information for Policies (SRC CLI) on page 146
Viewing SNMPStatistics About Server Processes (C-Web Interface)
Purpose View SNMP statistics about server processes.
Action Click Monitor>SAE >Statistics>Process.1.
The Statistics/Process pane appears.
2. In the Slot box, enter the number of the slot for which you want to display SNMP
statistics for server processes.
173Copyright © 2014, Juniper Networks, Inc.
Chapter 16: Monitoring SAE Data (C-Web Interface)
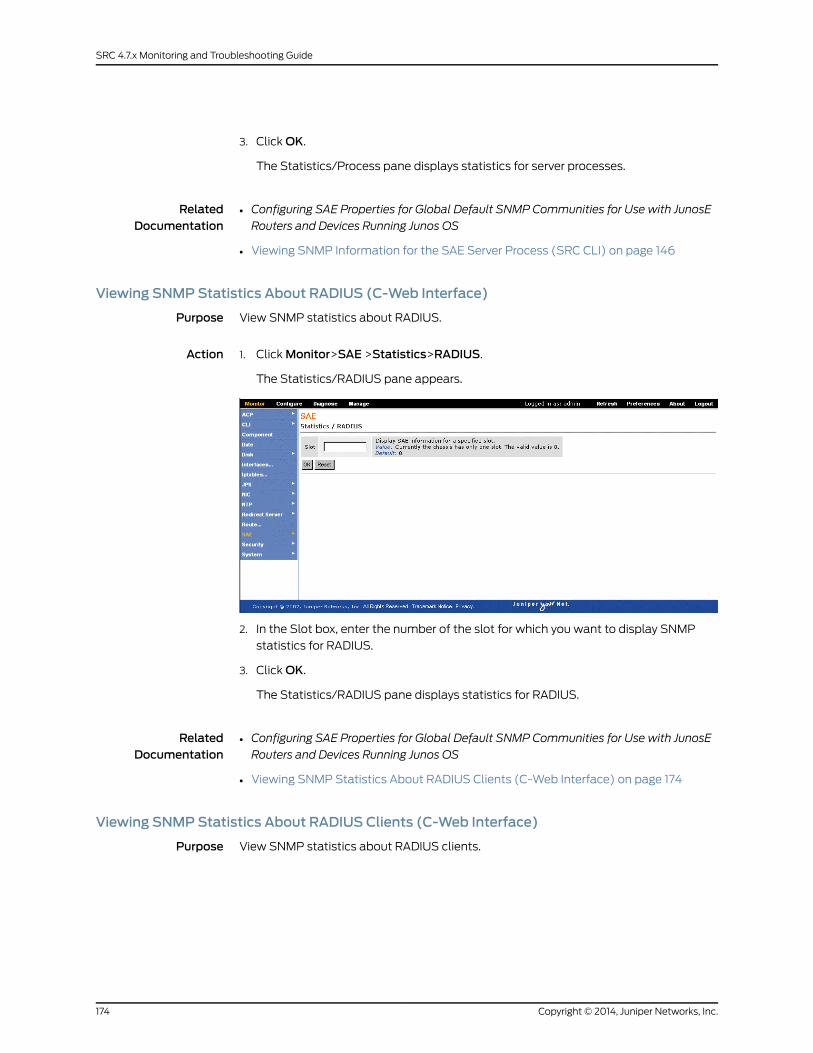
3. Click OK.
The Statistics/Process pane displays statistics for server processes.
RelatedDocumentation
Configuring SAE Properties for Global Default SNMP Communities for Use with JunosE
Routers and Devices Running Junos OS
•
• Viewing SNMP Information for the SAE Server Process (SRC CLI) on page 146
Viewing SNMPStatistics About RADIUS (C-Web Interface)
Purpose View SNMP statistics about RADIUS.
Action Click Monitor>SAE >Statistics>RADIUS.1.
The Statistics/RADIUS pane appears.
2. In the Slot box, enter the number of the slot for which you want to display SNMP
statistics for RADIUS.
3. Click OK.
The Statistics/RADIUS pane displays statistics for RADIUS.
RelatedDocumentation
Configuring SAE Properties for Global Default SNMP Communities for Use with JunosE
Routers and Devices Running Junos OS
•
• Viewing SNMP Statistics About RADIUS Clients (C-Web Interface) on page 174
Viewing SNMPStatistics About RADIUS Clients (C-Web Interface)
Purpose View SNMP statistics about RADIUS clients.
Copyright © 2014, Juniper Networks, Inc.174
SRC 4.7.x Monitoring and Troubleshooting Guide
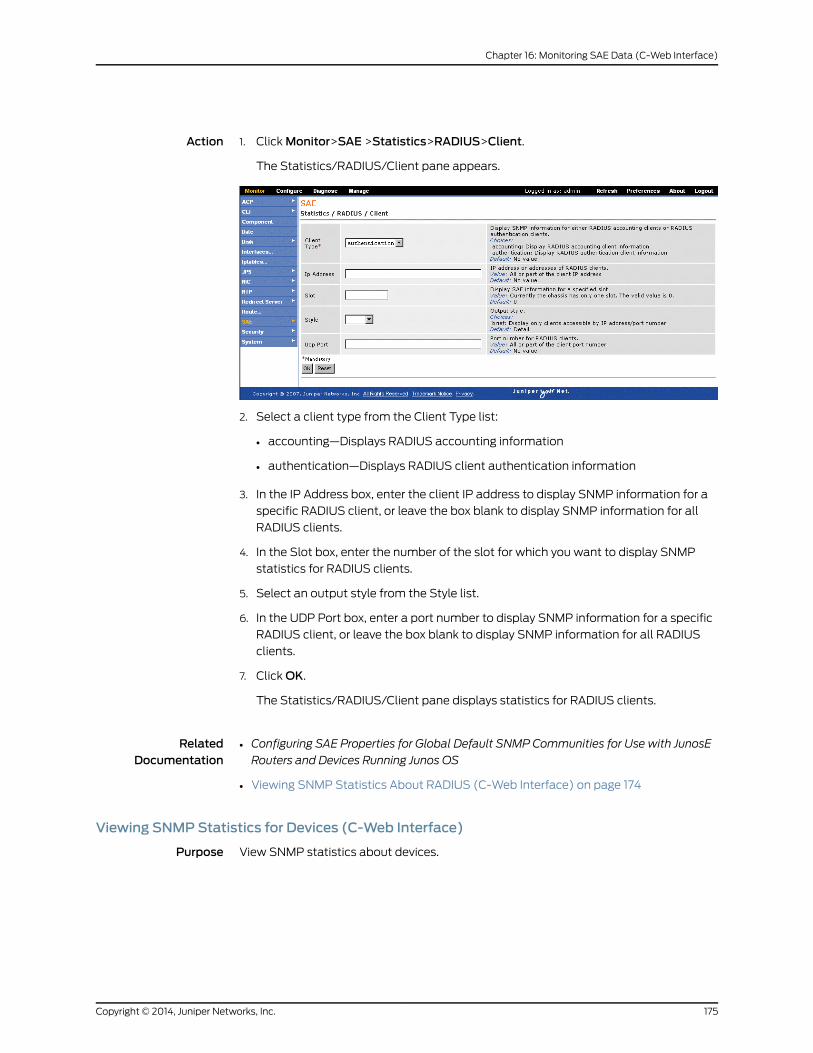
Action 1. Click Monitor>SAE >Statistics>RADIUS>Client.
The Statistics/RADIUS/Client pane appears.
2. Select a client type from the Client Type list:
• accounting—Displays RADIUS accounting information
• authentication—Displays RADIUS client authentication information
3. In the IP Address box, enter the client IP address to display SNMP information for a
specific RADIUS client, or leave the box blank to display SNMP information for all
RADIUS clients.
4. In the Slot box, enter the number of the slot for which you want to display SNMP
statistics for RADIUS clients.
5. Select an output style from the Style list.
6. In the UDP Port box, enter a port number to display SNMP information for a specific
RADIUS client, or leave the box blank to display SNMP information for all RADIUS
clients.
7. Click OK.
The Statistics/RADIUS/Client pane displays statistics for RADIUS clients.
RelatedDocumentation
Configuring SAE Properties for Global Default SNMP Communities for Use with JunosE
Routers and Devices Running Junos OS
•
• Viewing SNMP Statistics About RADIUS (C-Web Interface) on page 174
Viewing SNMPStatistics for Devices (C-Web Interface)
Purpose View SNMP statistics about devices.
175Copyright © 2014, Juniper Networks, Inc.
Chapter 16: Monitoring SAE Data (C-Web Interface)
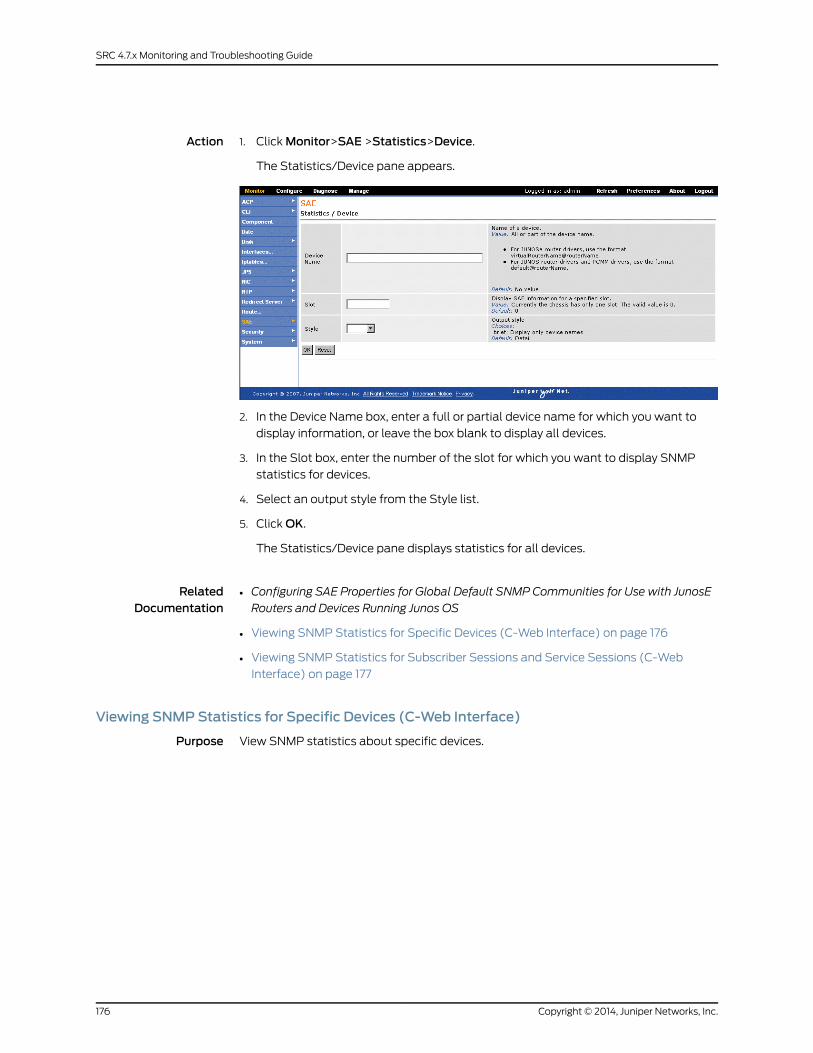
Action 1. Click Monitor>SAE >Statistics>Device.
The Statistics/Device pane appears.
2. In the Device Name box, enter a full or partial device name for which you want to
display information, or leave the box blank to display all devices.
3. In the Slot box, enter the number of the slot for which you want to display SNMP
statistics for devices.
4. Select an output style from the Style list.
5. Click OK.
The Statistics/Device pane displays statistics for all devices.
RelatedDocumentation
Configuring SAE Properties for Global Default SNMP Communities for Use with JunosE
Routers and Devices Running Junos OS
•
• Viewing SNMP Statistics for Specific Devices (C-Web Interface) on page 176
• Viewing SNMP Statistics for Subscriber Sessions and Service Sessions (C-Web
Interface) on page 177
Viewing SNMPStatistics for Specific Devices (C-Web Interface)
Purpose View SNMP statistics about specific devices.
Copyright © 2014, Juniper Networks, Inc.176
SRC 4.7.x Monitoring and Troubleshooting Guide
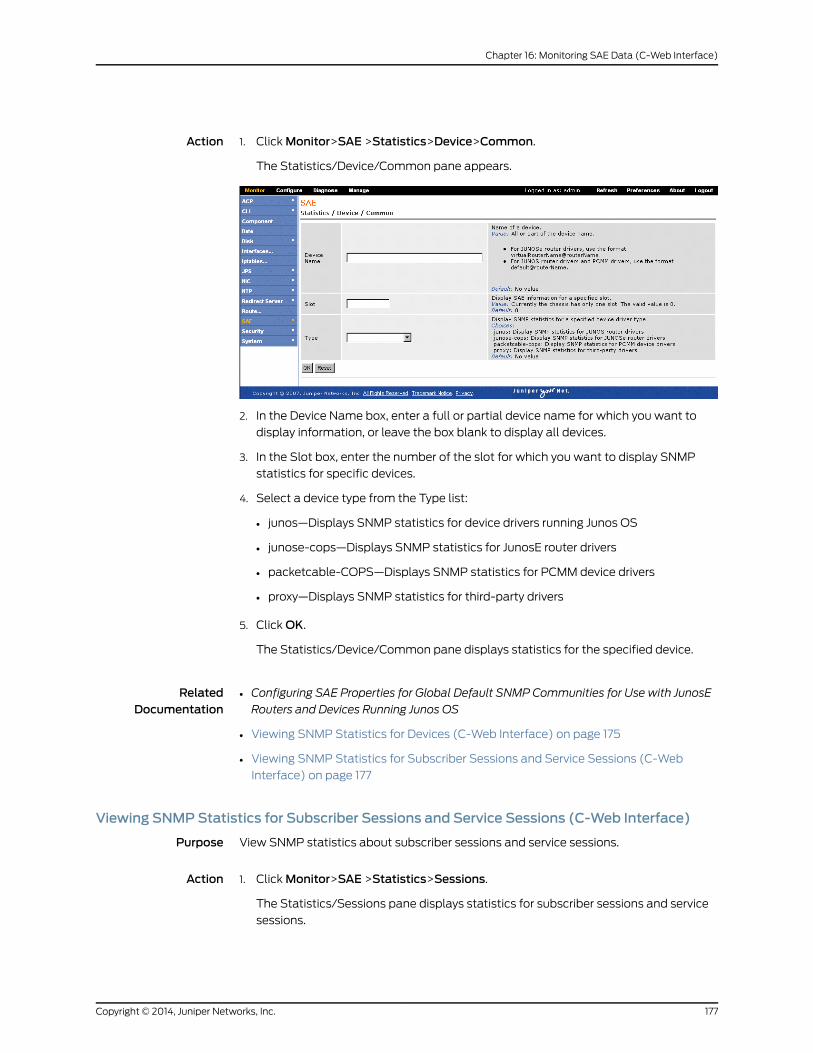
Action 1. Click Monitor>SAE >Statistics>Device>Common.
The Statistics/Device/Common pane appears.
2. In the Device Name box, enter a full or partial device name for which you want to
display information, or leave the box blank to display all devices.
3. In the Slot box, enter the number of the slot for which you want to display SNMP
statistics for specific devices.
4. Select a device type from the Type list:
• junos—Displays SNMP statistics for device drivers running Junos OS
• junose-cops—Displays SNMP statistics for JunosE router drivers
• packetcable-COPS—Displays SNMP statistics for PCMM device drivers
• proxy—Displays SNMP statistics for third-party drivers
5. Click OK.
The Statistics/Device/Common pane displays statistics for the specified device.
RelatedDocumentation
Configuring SAE Properties for Global Default SNMP Communities for Use with JunosE
Routers and Devices Running Junos OS
•
• Viewing SNMP Statistics for Devices (C-Web Interface) on page 175
• Viewing SNMP Statistics for Subscriber Sessions and Service Sessions (C-Web
Interface) on page 177
Viewing SNMPStatistics for Subscriber Sessions and Service Sessions (C-Web Interface)
Purpose View SNMP statistics about subscriber sessions and service sessions.
Action Click Monitor>SAE >Statistics>Sessions.1.
The Statistics/Sessions pane displays statistics for subscriber sessions and service
sessions.
177Copyright © 2014, Juniper Networks, Inc.
Chapter 16: Monitoring SAE Data (C-Web Interface)
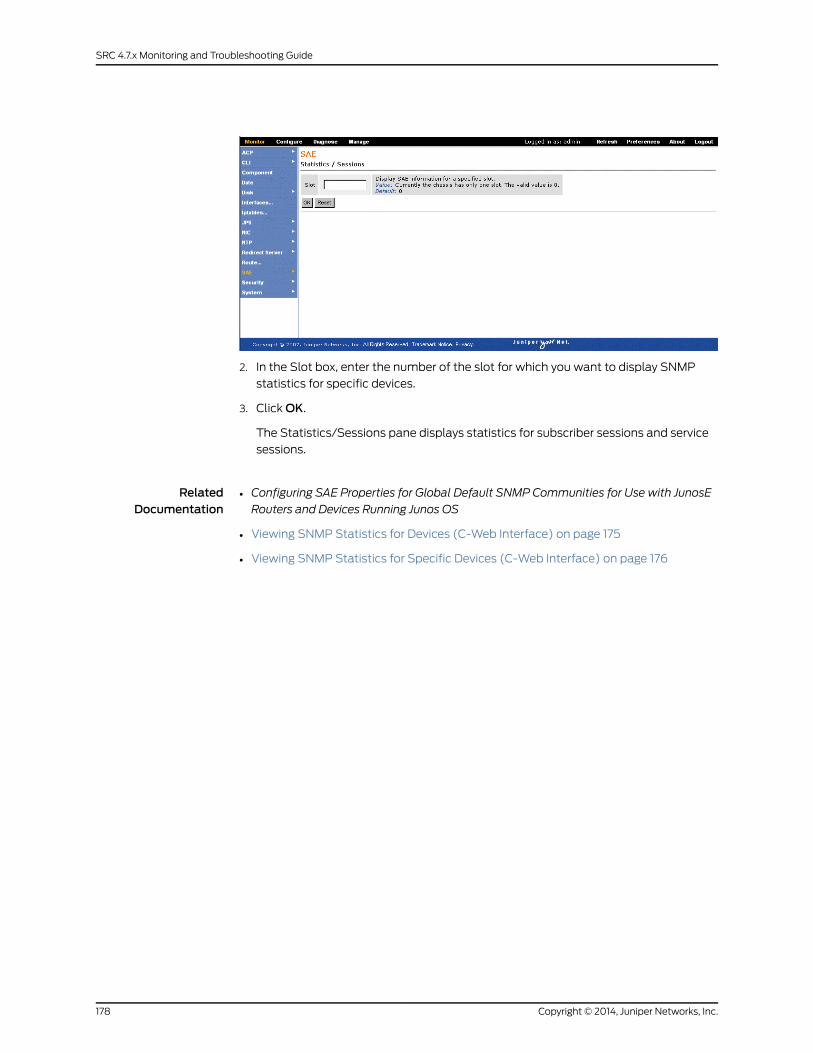
2. In the Slot box, enter the number of the slot for which you want to display SNMP
statistics for specific devices.
3. Click OK.
The Statistics/Sessions pane displays statistics for subscriber sessions and service
sessions.
RelatedDocumentation
• Configuring SAE Properties for Global Default SNMP Communities for Use with JunosE
Routers and Devices Running Junos OS
• Viewing SNMP Statistics for Devices (C-Web Interface) on page 175
• Viewing SNMP Statistics for Specific Devices (C-Web Interface) on page 176
Copyright © 2014, Juniper Networks, Inc.178
SRC 4.7.x Monitoring and Troubleshooting Guide
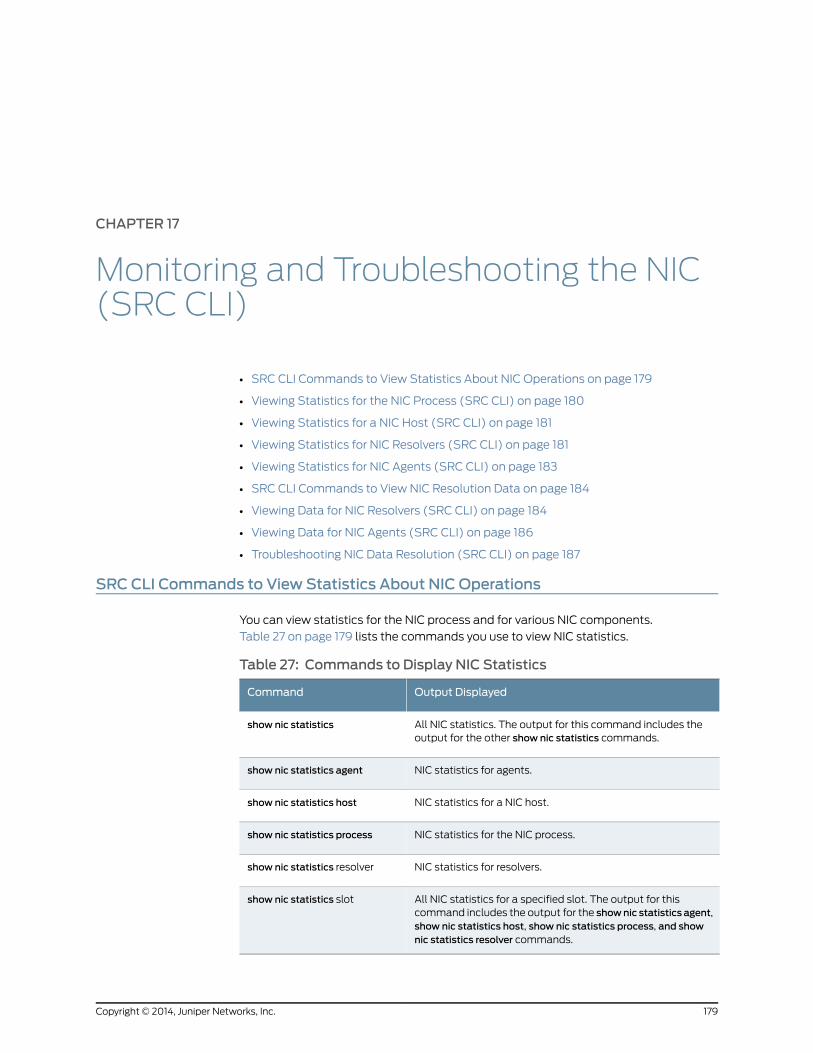
CHAPTER 17
Monitoring and Troubleshooting the NIC(SRC CLI)
• SRC CLI Commands to View Statistics About NIC Operations on page 179
• Viewing Statistics for the NIC Process (SRC CLI) on page 180
• Viewing Statistics for a NIC Host (SRC CLI) on page 181
• Viewing Statistics for NIC Resolvers (SRC CLI) on page 181
• Viewing Statistics for NIC Agents (SRC CLI) on page 183
• SRC CLI Commands to View NIC Resolution Data on page 184
• Viewing Data for NIC Resolvers (SRC CLI) on page 184
• Viewing Data for NIC Agents (SRC CLI) on page 186
• Troubleshooting NIC Data Resolution (SRC CLI) on page 187
SRC CLI Commands to View Statistics About NIC Operations
You can view statistics for the NIC process and for various NIC components.
Table 27 on page 179 lists the commands you use to view NIC statistics.
Table 27: Commands to Display NIC Statistics
Output DisplayedCommand
All NIC statistics. The output for this command includes theoutput for the other show nic statistics commands.
show nic statistics
NIC statistics for agents.show nic statistics agent
NIC statistics for a NIC host.show nic statistics host
NIC statistics for the NIC process.show nic statistics process
NIC statistics for resolvers.show nic statistics resolver
All NIC statistics for a specified slot. The output for thiscommand includes the output for the shownic statistics agent,show nic statistics host, show nic statistics process, and shownic statistics resolver commands.
show nic statistics slot
179Copyright © 2014, Juniper Networks, Inc.
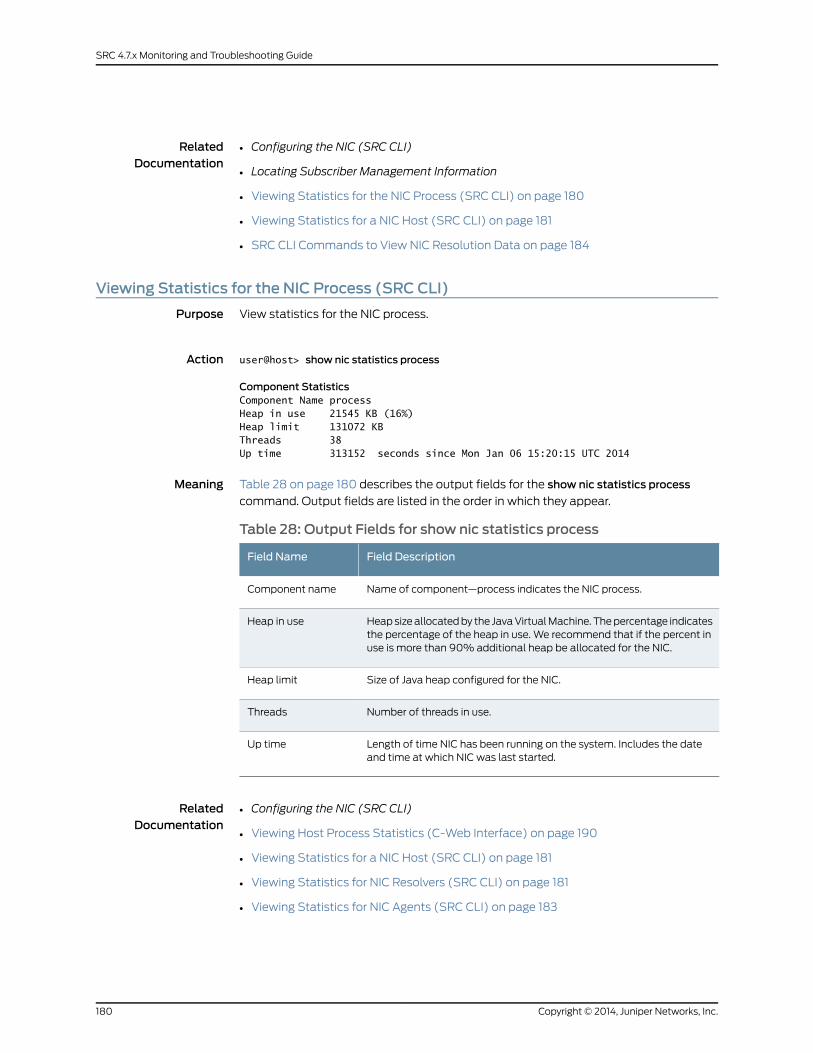
RelatedDocumentation
Configuring the NIC (SRC CLI)•
• Locating Subscriber Management Information
• Viewing Statistics for the NIC Process (SRC CLI) on page 180
• Viewing Statistics for a NIC Host (SRC CLI) on page 181
• SRC CLI Commands to View NIC Resolution Data on page 184
Viewing Statistics for the NIC Process (SRC CLI)
Purpose View statistics for the NIC process.
Action user@host> show nic statistics process
Component StatisticsComponent Name processHeap in use 21545 KB (16%)Heap limit 131072 KBThreads 38Up time 313152 seconds since Mon Jan 06 15:20:15 UTC 2014
Meaning Table 28 on page 180 describes the output fields for the show nic statistics process
command. Output fields are listed in the order in which they appear.
Table 28: Output Fields for show nic statistics process
Field DescriptionField Name
Name of component—process indicates the NIC process.Component name
Heap size allocated by the Java Virtual Machine. The percentage indicatesthe percentage of the heap in use. We recommend that if the percent inuse is more than 90% additional heap be allocated for the NIC.
Heap in use
Size of Java heap configured for the NIC.Heap limit
Number of threads in use.Threads
Length of time NIC has been running on the system. Includes the dateand time at which NIC was last started.
Up time
RelatedDocumentation
Configuring the NIC (SRC CLI)•
• Viewing Host Process Statistics (C-Web Interface) on page 190
• Viewing Statistics for a NIC Host (SRC CLI) on page 181
• Viewing Statistics for NIC Resolvers (SRC CLI) on page 181
• Viewing Statistics for NIC Agents (SRC CLI) on page 183
Copyright © 2014, Juniper Networks, Inc.180
SRC 4.7.x Monitoring and Troubleshooting Guide
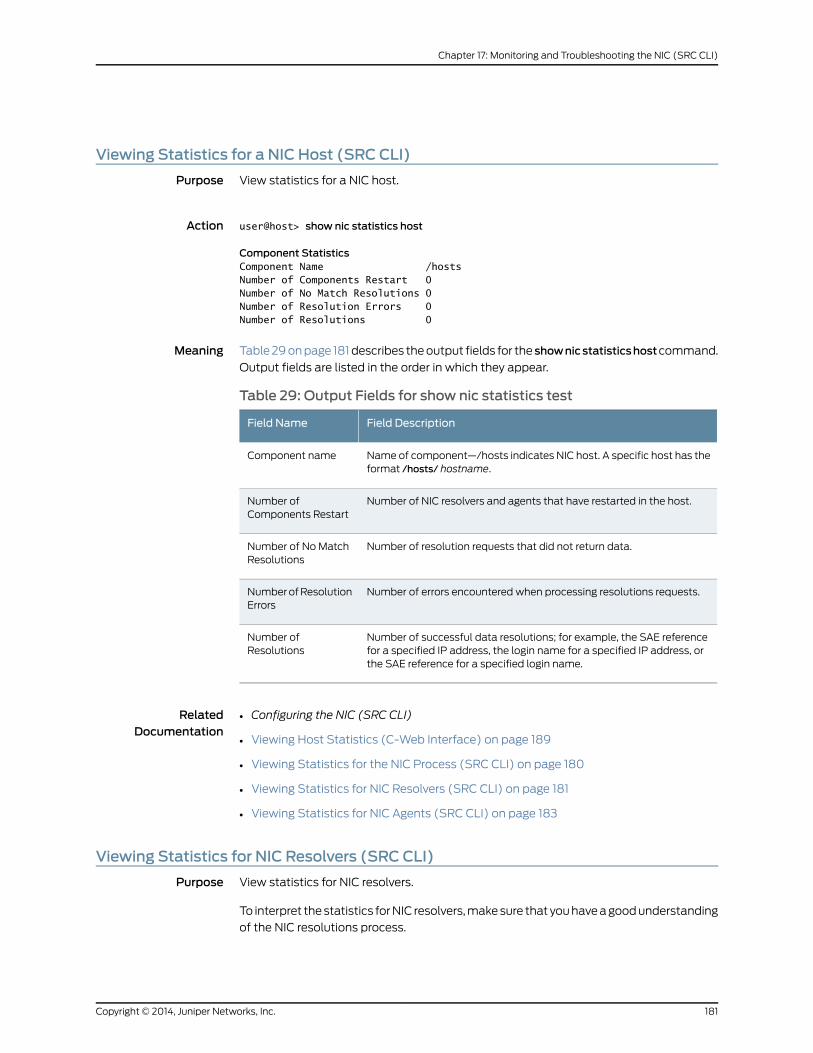
Viewing Statistics for a NIC Host (SRC CLI)
Purpose View statistics for a NIC host.
Action user@host> show nic statistics host
Component StatisticsComponent Name /hostsNumber of Components Restart 0Number of No Match Resolutions 0Number of Resolution Errors 0Number of Resolutions 0
Meaning Table 29 on page 181 describes the output fields for the shownicstatisticshostcommand.
Output fields are listed in the order in which they appear.
Table 29: Output Fields for show nic statistics test
Field DescriptionField Name
Name of component—/hosts indicates NIC host. A specific host has theformat /hosts/ hostname.
Component name
Number of NIC resolvers and agents that have restarted in the host.Number ofComponents Restart
Number of resolution requests that did not return data.Number of No MatchResolutions
Number of errors encountered when processing resolutions requests.Number of ResolutionErrors
Number of successful data resolutions; for example, the SAE referencefor a specified IP address, the login name for a specified IP address, orthe SAE reference for a specified login name.
Number ofResolutions
RelatedDocumentation
Configuring the NIC (SRC CLI)•
• Viewing Host Statistics (C-Web Interface) on page 189
• Viewing Statistics for the NIC Process (SRC CLI) on page 180
• Viewing Statistics for NIC Resolvers (SRC CLI) on page 181
• Viewing Statistics for NIC Agents (SRC CLI) on page 183
Viewing Statistics for NIC Resolvers (SRC CLI)
Purpose View statistics for NIC resolvers.
To interpret the statistics for NIC resolvers, make sure that you have a good understanding
of the NIC resolutions process.
181Copyright © 2014, Juniper Networks, Inc.
Chapter 17: Monitoring and Troubleshooting the NIC (SRC CLI)
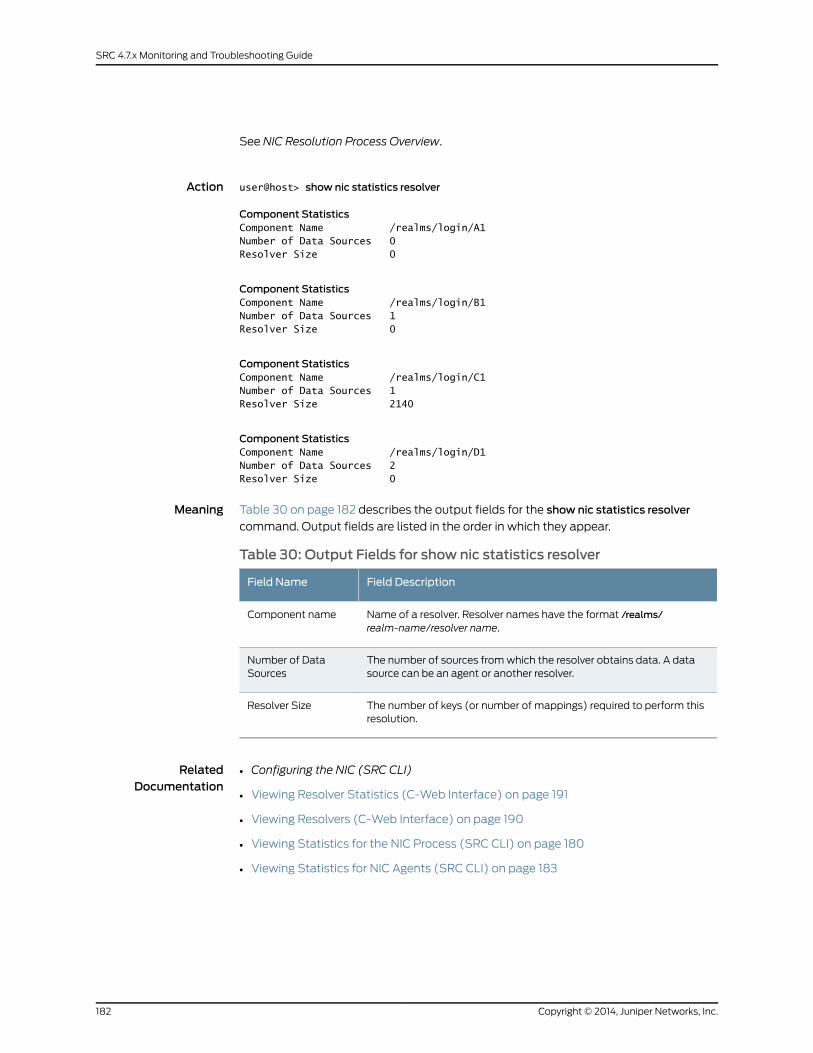
See NIC Resolution Process Overview.
Action user@host> show nic statistics resolver
Component StatisticsComponent Name /realms/login/A1Number of Data Sources 0Resolver Size 0
Component StatisticsComponent Name /realms/login/B1Number of Data Sources 1Resolver Size 0
Component StatisticsComponent Name /realms/login/C1Number of Data Sources 1Resolver Size 2140
Component StatisticsComponent Name /realms/login/D1Number of Data Sources 2Resolver Size 0
Meaning Table 30 on page 182 describes the output fields for the show nic statistics resolver
command. Output fields are listed in the order in which they appear.
Table 30: Output Fields for show nic statistics resolver
Field DescriptionField Name
Name of a resolver. Resolver names have the format /realms/realm-name/resolver name.
Component name
The number of sources from which the resolver obtains data. A datasource can be an agent or another resolver.
Number of DataSources
The number of keys (or number of mappings) required to perform thisresolution.
Resolver Size
RelatedDocumentation
Configuring the NIC (SRC CLI)•
• Viewing Resolver Statistics (C-Web Interface) on page 191
• Viewing Resolvers (C-Web Interface) on page 190
• Viewing Statistics for the NIC Process (SRC CLI) on page 180
• Viewing Statistics for NIC Agents (SRC CLI) on page 183
Copyright © 2014, Juniper Networks, Inc.182
SRC 4.7.x Monitoring and Troubleshooting Guide
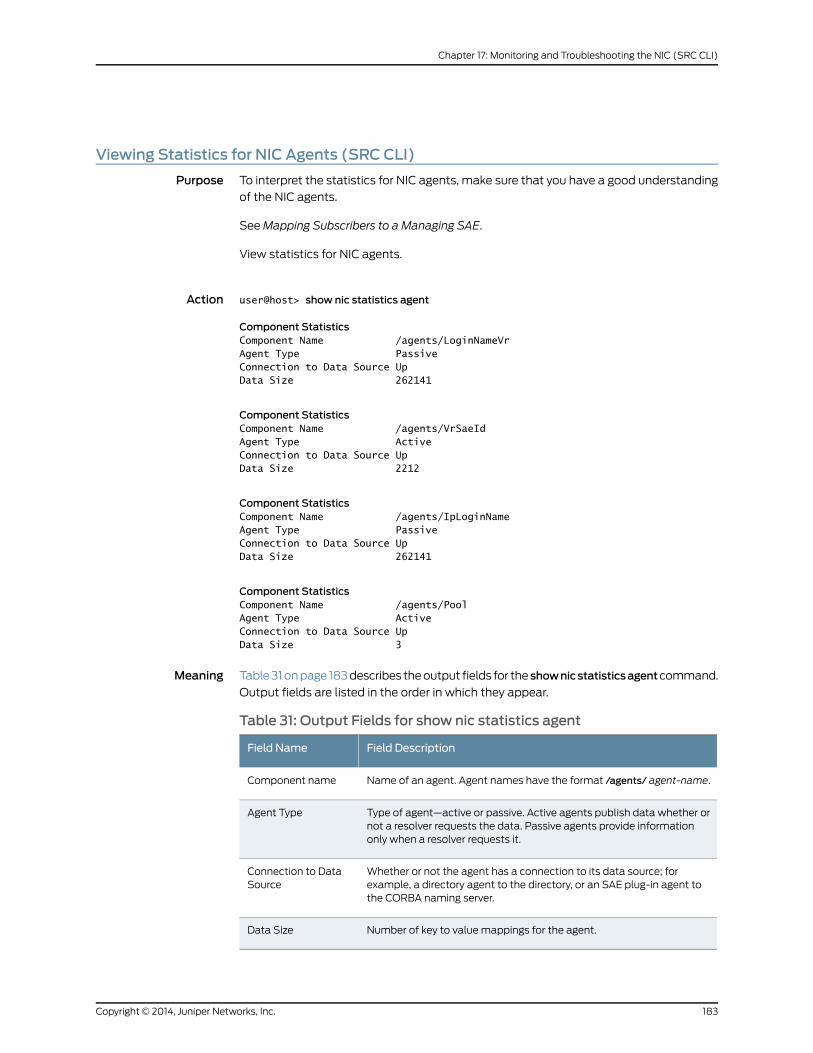
Viewing Statistics for NIC Agents (SRC CLI)
Purpose To interpret the statistics for NIC agents, make sure that you have a good understanding
of the NIC agents.
See Mapping Subscribers to a Managing SAE.
View statistics for NIC agents.
Action user@host> show nic statistics agent
Component StatisticsComponent Name /agents/LoginNameVrAgent Type PassiveConnection to Data Source UpData Size 262141
Component StatisticsComponent Name /agents/VrSaeIdAgent Type ActiveConnection to Data Source UpData Size 2212
Component StatisticsComponent Name /agents/IpLoginNameAgent Type PassiveConnection to Data Source UpData Size 262141
Component StatisticsComponent Name /agents/PoolAgent Type ActiveConnection to Data Source UpData Size 3
Meaning Table 31 on page 183 describes the output fields for the shownicstatisticsagentcommand.
Output fields are listed in the order in which they appear.
Table 31: Output Fields for show nic statistics agent
Field DescriptionField Name
Name of an agent. Agent names have the format /agents/ agent-name.Component name
Type of agent—active or passive. Active agents publish data whether ornot a resolver requests the data. Passive agents provide informationonly when a resolver requests it.
Agent Type
Whether or not the agent has a connection to its data source; forexample, a directory agent to the directory, or an SAE plug-in agent tothe CORBA naming server.
Connection to DataSource
Number of key to value mappings for the agent.Data Size
183Copyright © 2014, Juniper Networks, Inc.
Chapter 17: Monitoring and Troubleshooting the NIC (SRC CLI)
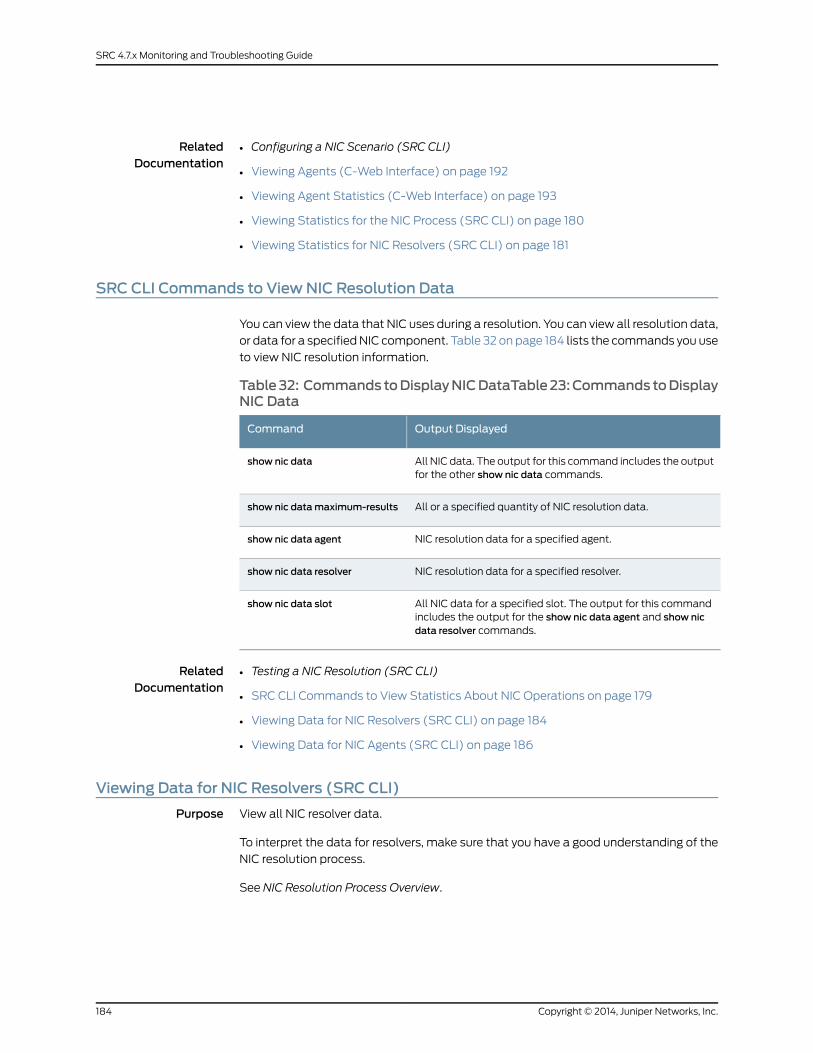
RelatedDocumentation
Configuring a NIC Scenario (SRC CLI)•
• Viewing Agents (C-Web Interface) on page 192
• Viewing Agent Statistics (C-Web Interface) on page 193
• Viewing Statistics for the NIC Process (SRC CLI) on page 180
• Viewing Statistics for NIC Resolvers (SRC CLI) on page 181
SRC CLI Commands to ViewNIC Resolution Data
You can view the data that NIC uses during a resolution. You can view all resolution data,
or data for a specified NIC component. Table 32 on page 184 lists the commands you use
to view NIC resolution information.
Table32: Commands toDisplayNICDataTable23:Commands toDisplayNIC Data
Output DisplayedCommand
All NIC data. The output for this command includes the outputfor the other show nic data commands.
show nic data
All or a specified quantity of NIC resolution data.show nic datamaximum-results
NIC resolution data for a specified agent.show nic data agent
NIC resolution data for a specified resolver.show nic data resolver
All NIC data for a specified slot. The output for this commandincludes the output for the show nic data agent and show nicdata resolver commands.
show nic data slot
RelatedDocumentation
Testing a NIC Resolution (SRC CLI)•
• SRC CLI Commands to View Statistics About NIC Operations on page 179
• Viewing Data for NIC Resolvers (SRC CLI) on page 184
• Viewing Data for NIC Agents (SRC CLI) on page 186
Viewing Data for NIC Resolvers (SRC CLI)
Purpose View all NIC resolver data.
To interpret the data for resolvers, make sure that you have a good understanding of the
NIC resolution process.
See NIC Resolution Process Overview.
Copyright © 2014, Juniper Networks, Inc.184
SRC 4.7.x Monitoring and Troubleshooting Guide
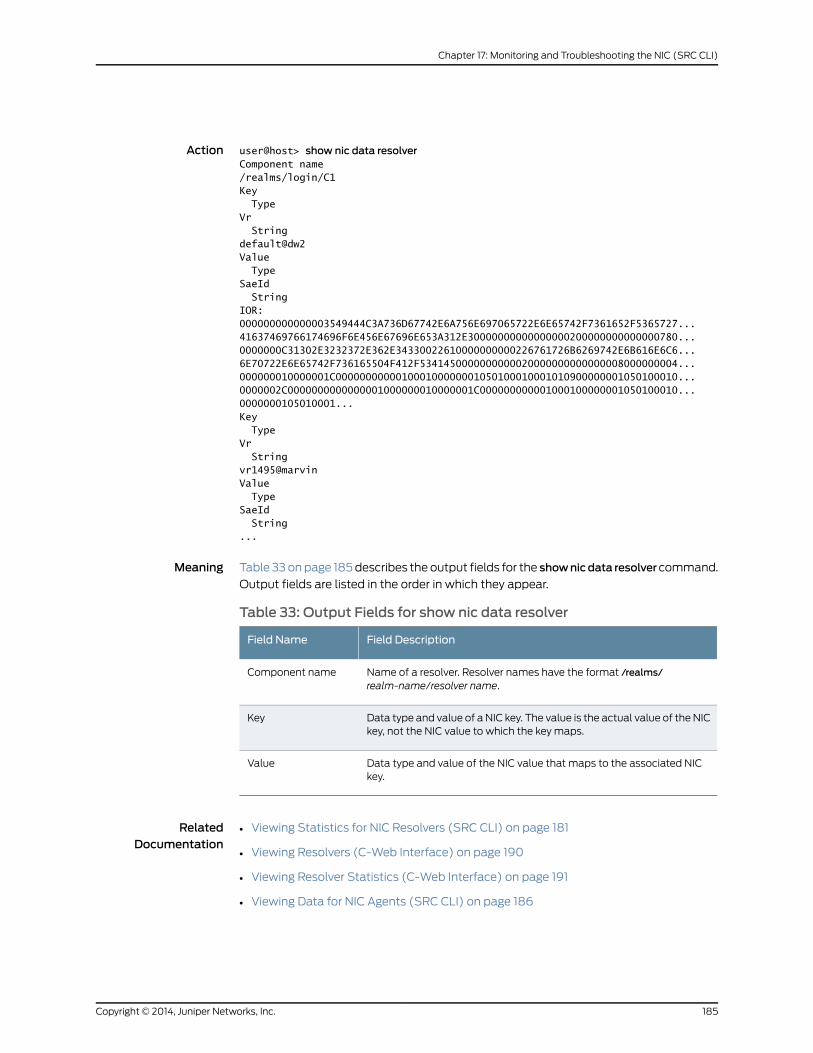
Action user@host> show nic data resolverComponent name/realms/login/C1Key TypeVr Stringdefault@dw2Value TypeSaeId StringIOR:000000000000003549444C3A736D67742E6A756E697065722E6E65742F7361652F5365727...41637469766174696F6E456E67696E653A312E30000000000000000200000000000000780...0000000C31302E3232372E362E34330022610000000000226761726B6269742E6B616E6C6...6E70722E6E65742F736165504F412F5341450000000000020000000000000008000000004...000000010000001C000000000001000100000001050100010001010900000001050100010...0000002C0000000000000001000000010000001C000000000001000100000001050100010...0000000105010001...Key TypeVr Stringvr1495@marvinValue TypeSaeId String...
Meaning Table 33 on page 185 describes the output fields for the shownicdata resolvercommand.
Output fields are listed in the order in which they appear.
Table 33: Output Fields for show nic data resolver
Field DescriptionField Name
Name of a resolver. Resolver names have the format /realms/realm-name/resolver name.
Component name
Data type and value of a NIC key. The value is the actual value of the NICkey, not the NIC value to which the key maps.
Key
Data type and value of the NIC value that maps to the associated NICkey.
Value
RelatedDocumentation
Viewing Statistics for NIC Resolvers (SRC CLI) on page 181•
• Viewing Resolvers (C-Web Interface) on page 190
• Viewing Resolver Statistics (C-Web Interface) on page 191
• Viewing Data for NIC Agents (SRC CLI) on page 186
185Copyright © 2014, Juniper Networks, Inc.
Chapter 17: Monitoring and Troubleshooting the NIC (SRC CLI)
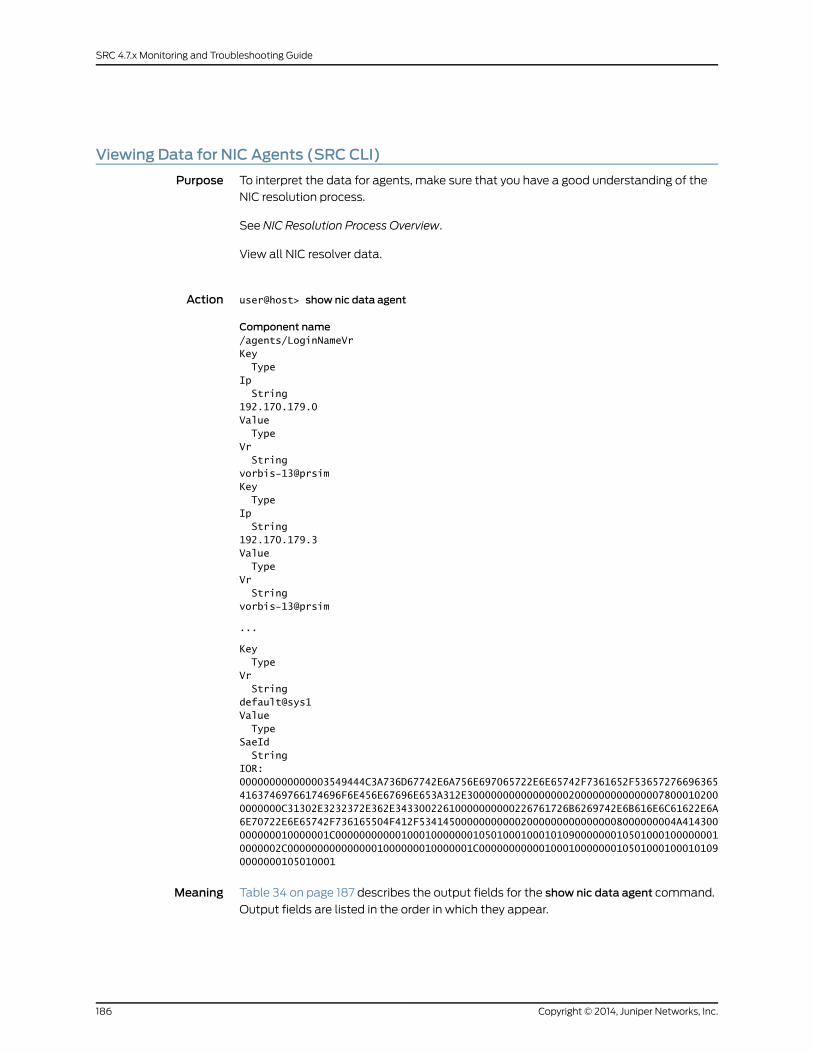
Viewing Data for NIC Agents (SRC CLI)
Purpose To interpret the data for agents, make sure that you have a good understanding of the
NIC resolution process.
See NIC Resolution Process Overview.
View all NIC resolver data.
Action user@host> show nic data agent
Component name/agents/LoginNameVrKey TypeIp String192.170.179.0Value TypeVr Stringvorbis-13@prsimKey TypeIp String192.170.179.3Value TypeVr Stringvorbis-13@prsim
...
Key TypeVr Stringdefault@sys1Value TypeSaeId StringIOR:000000000000003549444C3A736D67742E6A756E697065722E6E65742F7361652F5365727669636541637469766174696F6E456E67696E653A312E3000000000000000020000000000000078000102000000000C31302E3232372E362E34330022610000000000226761726B6269742E6B616E6C61622E6A6E70722E6E65742F736165504F412F5341450000000000020000000000000008000000004A414300000000010000001C00000000000100010000000105010001000101090000000105010001000000010000002C0000000000000001000000010000001C00000000000100010000000105010001000101090000000105010001
Meaning Table 34 on page 187 describes the output fields for the show nic data agent command.
Output fields are listed in the order in which they appear.
Copyright © 2014, Juniper Networks, Inc.186
SRC 4.7.x Monitoring and Troubleshooting Guide
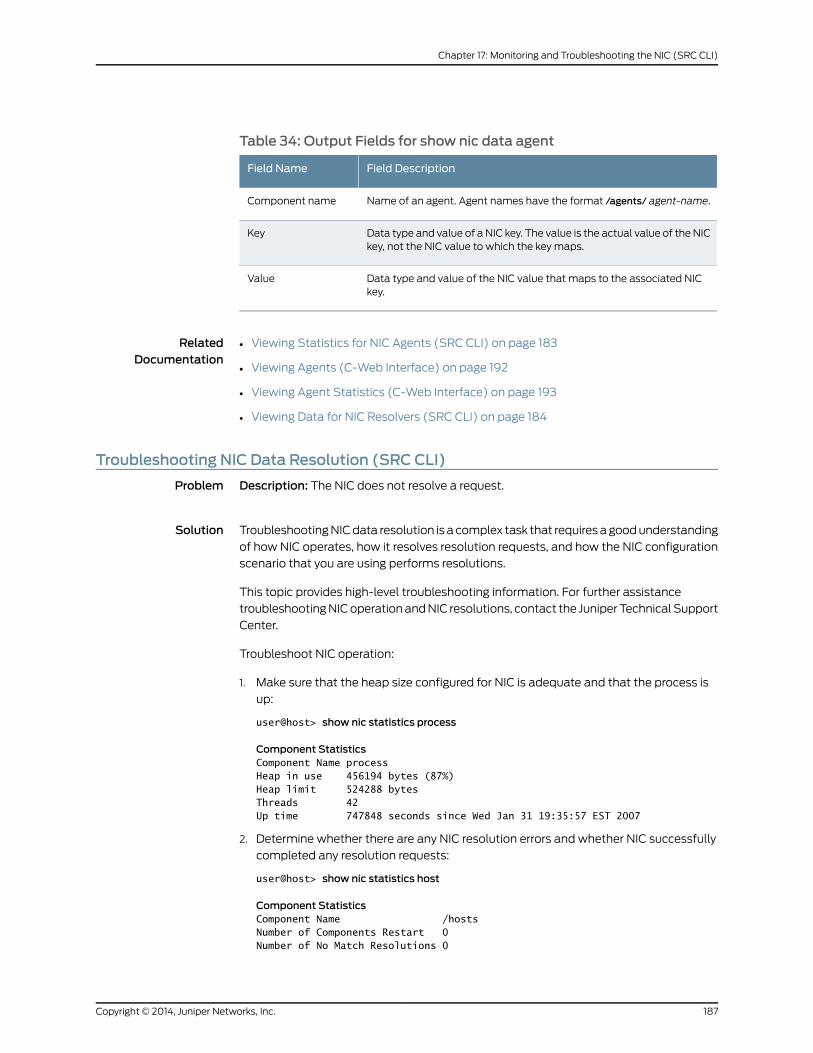
Table 34: Output Fields for show nic data agent
Field DescriptionField Name
Name of an agent. Agent names have the format /agents/ agent-name.Component name
Data type and value of a NIC key. The value is the actual value of the NICkey, not the NIC value to which the key maps.
Key
Data type and value of the NIC value that maps to the associated NICkey.
Value
RelatedDocumentation
Viewing Statistics for NIC Agents (SRC CLI) on page 183•
• Viewing Agents (C-Web Interface) on page 192
• Viewing Agent Statistics (C-Web Interface) on page 193
• Viewing Data for NIC Resolvers (SRC CLI) on page 184
Troubleshooting NIC Data Resolution (SRC CLI)
Problem Description: The NIC does not resolve a request.
Solution Troubleshooting NIC data resolution is a complex task that requires a good understanding
of how NIC operates, how it resolves resolution requests, and how the NIC configuration
scenario that you are using performs resolutions.
This topic provides high-level troubleshooting information. For further assistance
troubleshooting NIC operation and NIC resolutions, contact the Juniper Technical Support
Center.
Troubleshoot NIC operation:
1. Make sure that the heap size configured for NIC is adequate and that the process is
up:
user@host> show nic statistics process
Component StatisticsComponent Name processHeap in use 456194 bytes (87%)Heap limit 524288 bytesThreads 42Up time 747848 seconds since Wed Jan 31 19:35:57 EST 2007
2. Determine whether there are any NIC resolution errors and whether NIC successfully
completed any resolution requests:
user@host> show nic statistics host
Component StatisticsComponent Name /hostsNumber of Components Restart 0Number of No Match Resolutions 0
187Copyright © 2014, Juniper Networks, Inc.
Chapter 17: Monitoring and Troubleshooting the NIC (SRC CLI)
Number of Resolution Errors 0Number of Resolutions 0
3. Test the resolution process by using the test nic resolve command.
See Configuring the NIC (SRC CLI).
If you are unsure whether NIC is resolving resolution requests, view data about those
requests to see whether NIC is receiving data.
1. Verify that NIC is receiving data by running the show nic data resolver command.
See “Viewing Data for NIC Resolvers (SRC CLI)” on page 184.
For each resolver, which is identified by a component name such as /realms/login/C1,
the output should show a value, such as default@sys1 for the key Vr, and the NIC value
for that key such as the IOR that identifies an SAE.
2. If NIC is not receiving data, determine which agent or agents are not receiving data by
running the show nic data agent command.
See “Viewing Data for NIC Agents (SRC CLI)” on page 186.
3. Review your NIC configuration to make sure that NIC is configured correctly by running
the show command for the NIC configuration scenario. For example:
[edit shared nic scenario OnePop]user@host# show
RelatedDocumentation
• NIC Resolution Process Overview
• NIC Configuration Scenarios
Copyright © 2014, Juniper Networks, Inc.188
SRC 4.7.x Monitoring and Troubleshooting Guide
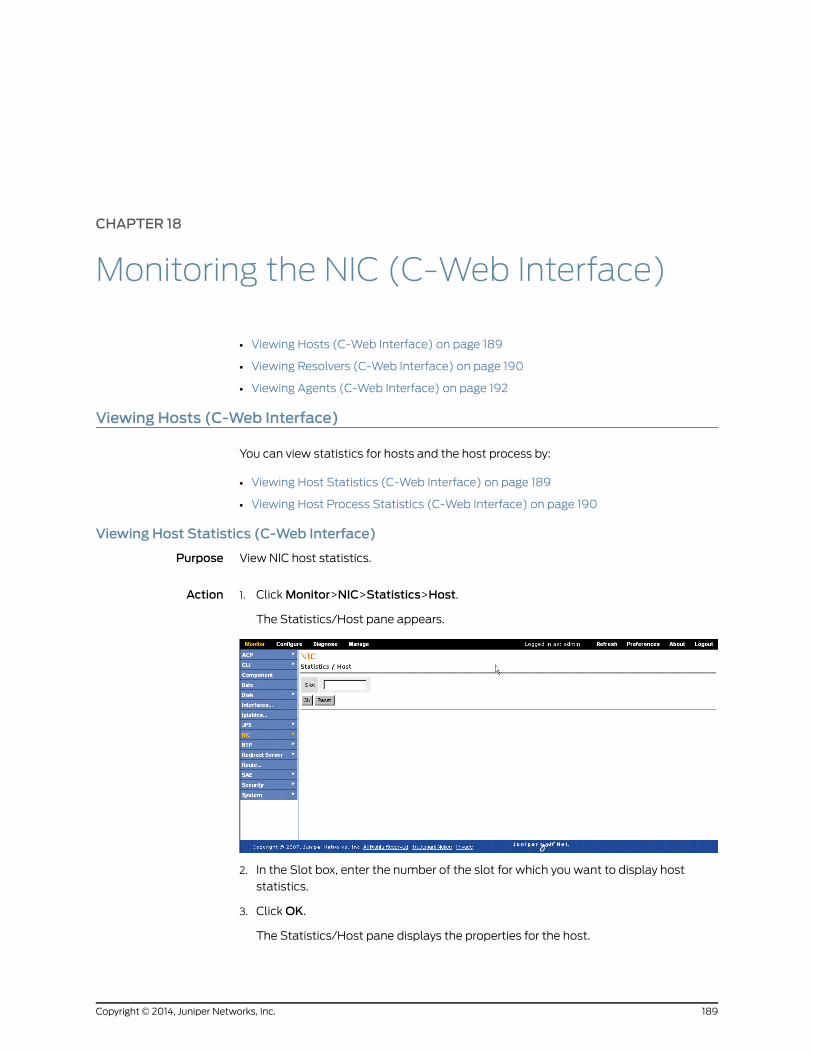
CHAPTER 18
Monitoring the NIC (C-Web Interface)
• Viewing Hosts (C-Web Interface) on page 189
• Viewing Resolvers (C-Web Interface) on page 190
• Viewing Agents (C-Web Interface) on page 192
Viewing Hosts (C-Web Interface)
You can view statistics for hosts and the host process by:
• Viewing Host Statistics (C-Web Interface) on page 189
• Viewing Host Process Statistics (C-Web Interface) on page 190
Viewing Host Statistics (C-Web Interface)
Purpose View NIC host statistics.
Action Click Monitor>NIC>Statistics>Host.1.
The Statistics/Host pane appears.
2. In the Slot box, enter the number of the slot for which you want to display host
statistics.
3. Click OK.
The Statistics/Host pane displays the properties for the host.
189Copyright © 2014, Juniper Networks, Inc.
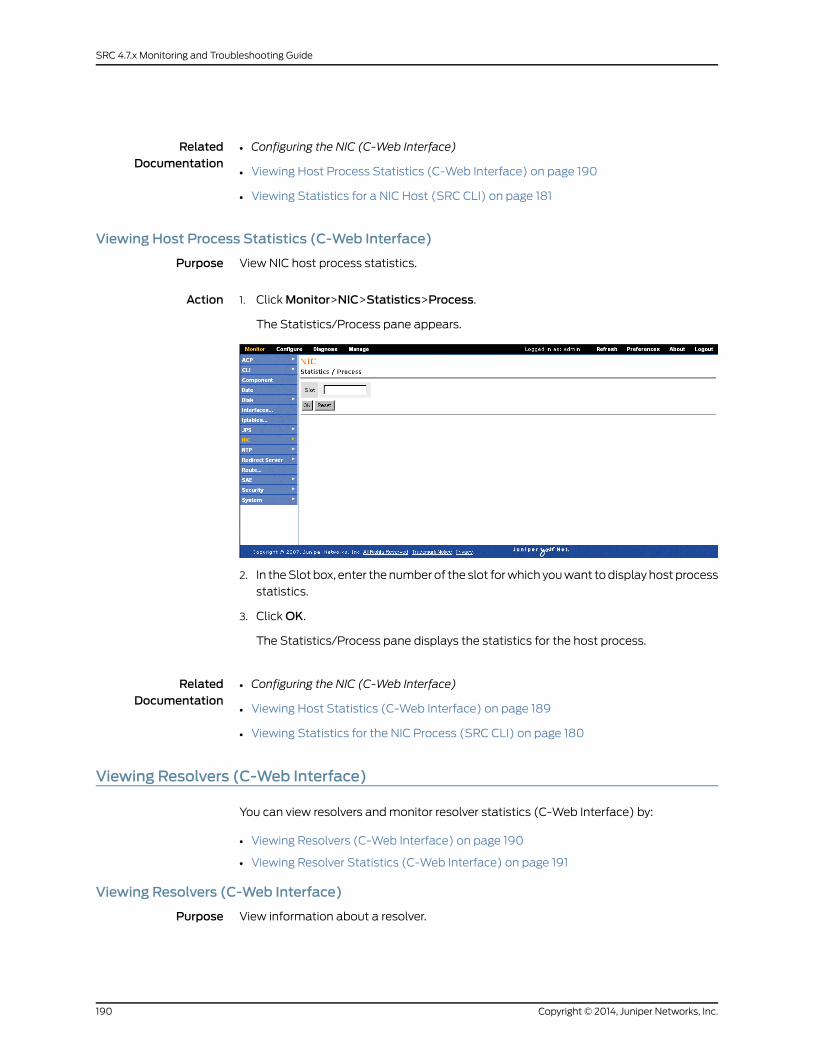
RelatedDocumentation
Configuring the NIC (C-Web Interface)•
• Viewing Host Process Statistics (C-Web Interface) on page 190
• Viewing Statistics for a NIC Host (SRC CLI) on page 181
Viewing Host Process Statistics (C-Web Interface)
Purpose View NIC host process statistics.
Action Click Monitor>NIC>Statistics>Process.1.
The Statistics/Process pane appears.
2. In the Slot box, enter the number of the slot for which you want to display host process
statistics.
3. Click OK.
The Statistics/Process pane displays the statistics for the host process.
RelatedDocumentation
Configuring the NIC (C-Web Interface)•
• Viewing Host Statistics (C-Web Interface) on page 189
• Viewing Statistics for the NIC Process (SRC CLI) on page 180
Viewing Resolvers (C-Web Interface)
You can view resolvers and monitor resolver statistics (C-Web Interface) by:
• Viewing Resolvers (C-Web Interface) on page 190
• Viewing Resolver Statistics (C-Web Interface) on page 191
Viewing Resolvers (C-Web Interface)
Purpose View information about a resolver.
Copyright © 2014, Juniper Networks, Inc.190
SRC 4.7.x Monitoring and Troubleshooting Guide
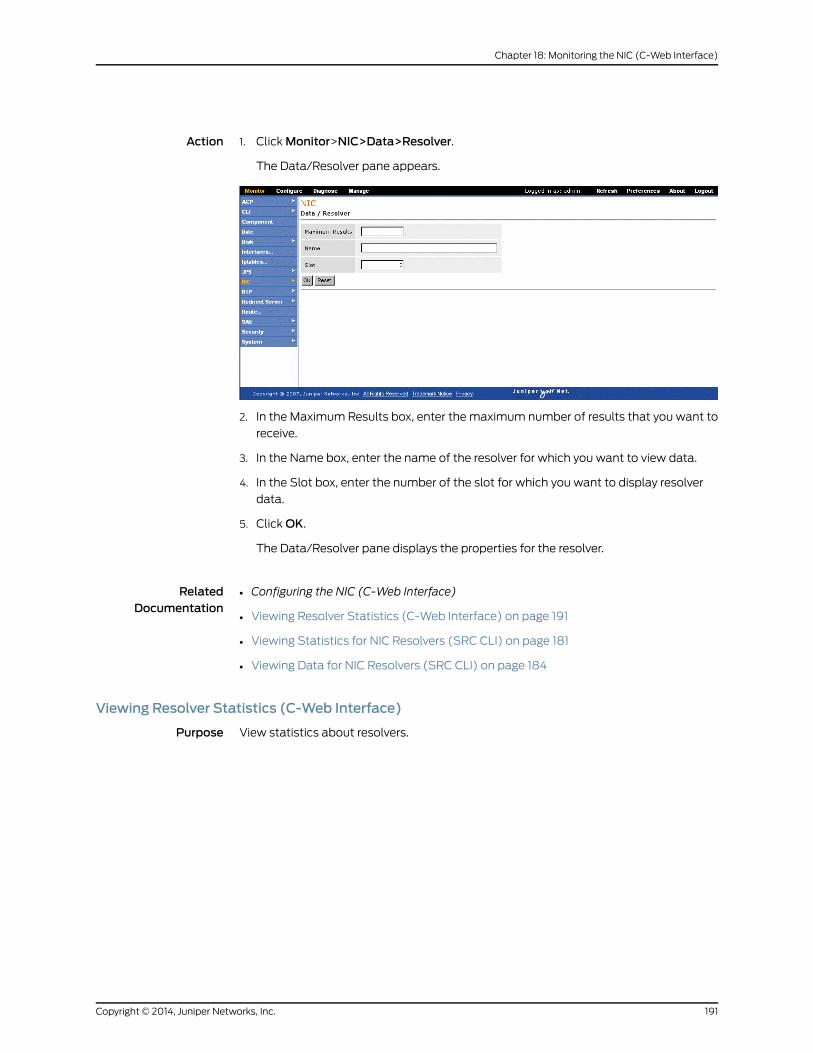
Action 1. Click Monitor>NIC>Data>Resolver.
The Data/Resolver pane appears.
2. In the Maximum Results box, enter the maximum number of results that you want to
receive.
3. In the Name box, enter the name of the resolver for which you want to view data.
4. In the Slot box, enter the number of the slot for which you want to display resolver
data.
5. Click OK.
The Data/Resolver pane displays the properties for the resolver.
RelatedDocumentation
Configuring the NIC (C-Web Interface)•
• Viewing Resolver Statistics (C-Web Interface) on page 191
• Viewing Statistics for NIC Resolvers (SRC CLI) on page 181
• Viewing Data for NIC Resolvers (SRC CLI) on page 184
Viewing Resolver Statistics (C-Web Interface)
Purpose View statistics about resolvers.
191Copyright © 2014, Juniper Networks, Inc.
Chapter 18: Monitoring the NIC (C-Web Interface)
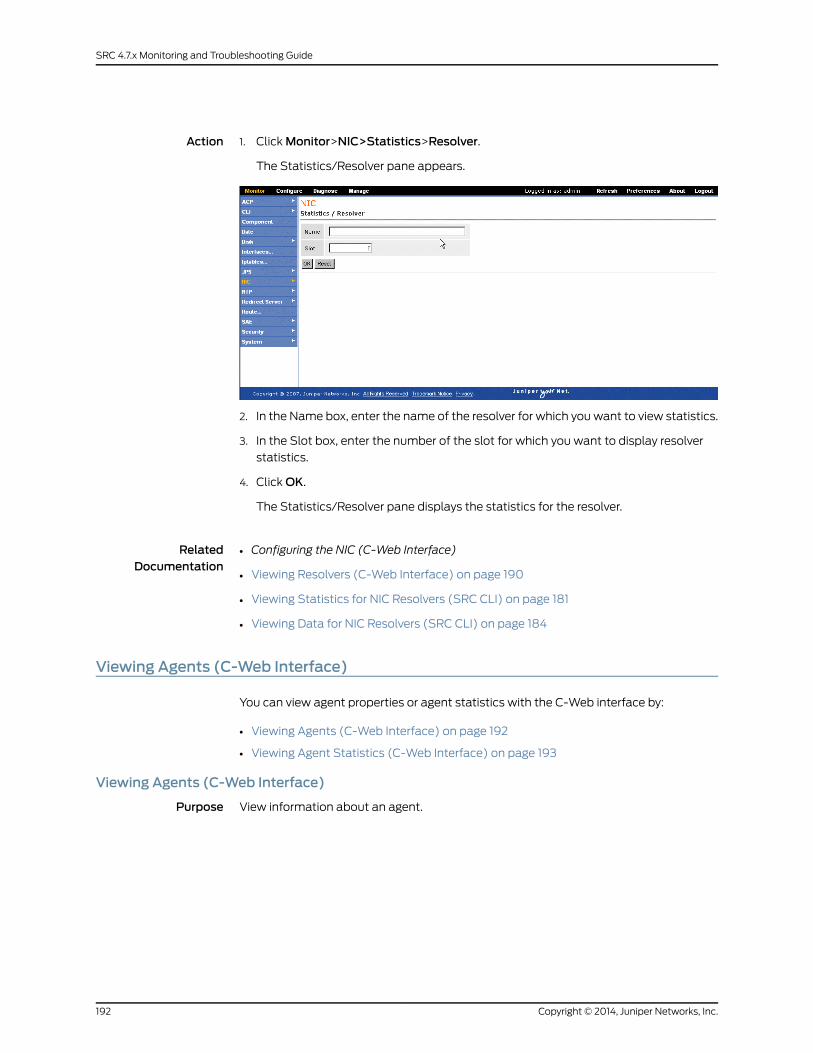
Action 1. Click Monitor>NIC>Statistics>Resolver.
The Statistics/Resolver pane appears.
2. In the Name box, enter the name of the resolver for which you want to view statistics.
3. In the Slot box, enter the number of the slot for which you want to display resolver
statistics.
4. Click OK.
The Statistics/Resolver pane displays the statistics for the resolver.
RelatedDocumentation
Configuring the NIC (C-Web Interface)•
• Viewing Resolvers (C-Web Interface) on page 190
• Viewing Statistics for NIC Resolvers (SRC CLI) on page 181
• Viewing Data for NIC Resolvers (SRC CLI) on page 184
Viewing Agents (C-Web Interface)
You can view agent properties or agent statistics with the C-Web interface by:
• Viewing Agents (C-Web Interface) on page 192
• Viewing Agent Statistics (C-Web Interface) on page 193
Viewing Agents (C-Web Interface)
Purpose View information about an agent.
Copyright © 2014, Juniper Networks, Inc.192
SRC 4.7.x Monitoring and Troubleshooting Guide

Action 1. Click Monitor>NIC>Data>Agent.
The Data/Agent pane appears.
2. In the Maximum Results box, enter the maximum number of results that you want to
receive.
3. In the Name box, enter the name of the agent for which you want to view data.
4. In the Slot box, enter the number of the slot for which you want to display agent data.
5. Click OK.
The Data/Agent pane displays the properties for the agent.
RelatedDocumentation
Configuring a NIC Scenario (C-Web Interface)•
• Viewing Data for NIC Agents (SRC CLI) on page 186
• Viewing Agent Statistics (C-Web Interface) on page 193
• Viewing Statistics for NIC Agents (SRC CLI) on page 183
Viewing Agent Statistics (C-Web Interface)
Purpose View statistics for an agent.
193Copyright © 2014, Juniper Networks, Inc.
Chapter 18: Monitoring the NIC (C-Web Interface)
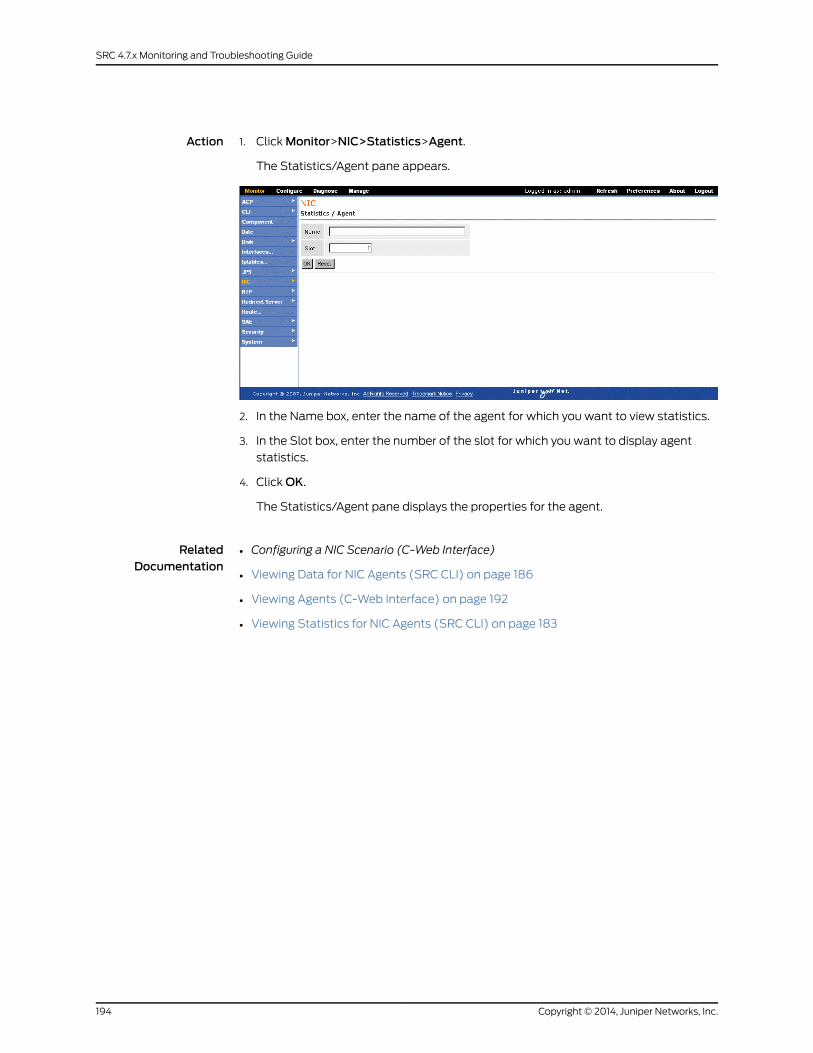
Action 1. Click Monitor>NIC>Statistics>Agent.
The Statistics/Agent pane appears.
2. In the Name box, enter the name of the agent for which you want to view statistics.
3. In the Slot box, enter the number of the slot for which you want to display agent
statistics.
4. Click OK.
The Statistics/Agent pane displays the properties for the agent.
RelatedDocumentation
• Configuring a NIC Scenario (C-Web Interface)
• Viewing Data for NIC Agents (SRC CLI) on page 186
• Viewing Agents (C-Web Interface) on page 192
• Viewing Statistics for NIC Agents (SRC CLI) on page 183
Copyright © 2014, Juniper Networks, Inc.194
SRC 4.7.x Monitoring and Troubleshooting Guide
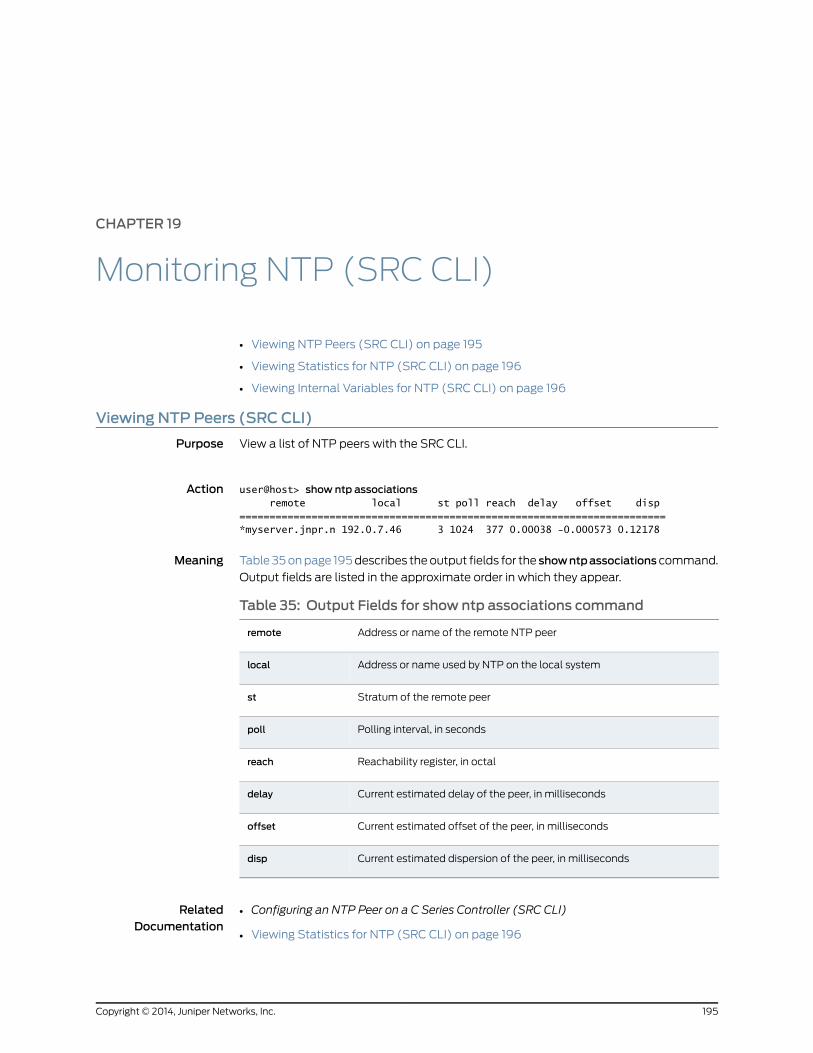
CHAPTER 19
Monitoring NTP (SRC CLI)
• Viewing NTP Peers (SRC CLI) on page 195
• Viewing Statistics for NTP (SRC CLI) on page 196
• Viewing Internal Variables for NTP (SRC CLI) on page 196
Viewing NTP Peers (SRC CLI)
Purpose View a list of NTP peers with the SRC CLI.
Action user@host> show ntp associations remote local st poll reach delay offset disp=======================================================================*myserver.jnpr.n 192.0.7.46 3 1024 377 0.00038 -0.000573 0.12178
Meaning Table 35 on page 195 describes the output fields for the showntpassociations command.
Output fields are listed in the approximate order in which they appear.
Table 35: Output Fields for show ntp associations command
Address or name of the remote NTP peerremote
Address or name used by NTP on the local systemlocal
Stratum of the remote peerst
Polling interval, in secondspoll
Reachability register, in octalreach
Current estimated delay of the peer, in millisecondsdelay
Current estimated offset of the peer, in millisecondsoffset
Current estimated dispersion of the peer, in millisecondsdisp
RelatedDocumentation
Configuring an NTP Peer on a C Series Controller (SRC CLI)•
• Viewing Statistics for NTP (SRC CLI) on page 196
195Copyright © 2014, Juniper Networks, Inc.
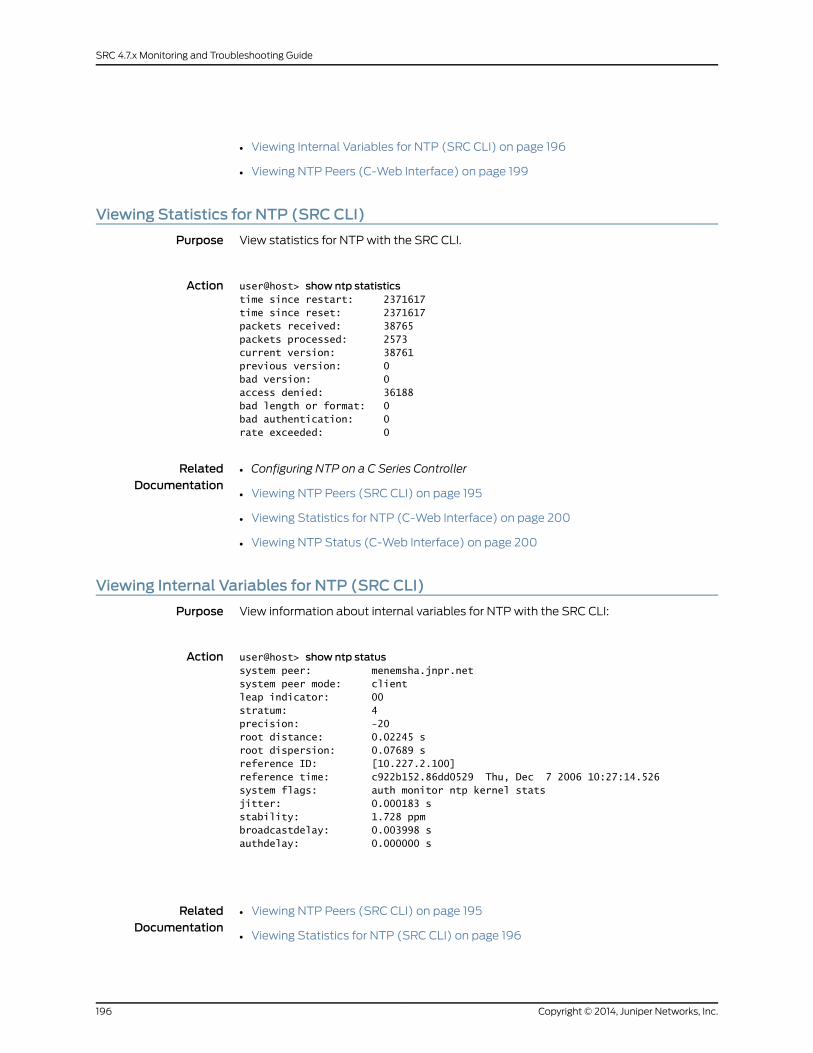
• Viewing Internal Variables for NTP (SRC CLI) on page 196
• Viewing NTP Peers (C-Web Interface) on page 199
Viewing Statistics for NTP (SRC CLI)
Purpose View statistics for NTP with the SRC CLI.
Action user@host> show ntp statisticstime since restart: 2371617time since reset: 2371617packets received: 38765packets processed: 2573current version: 38761previous version: 0bad version: 0access denied: 36188bad length or format: 0bad authentication: 0rate exceeded: 0
RelatedDocumentation
Configuring NTP on a C Series Controller•
• Viewing NTP Peers (SRC CLI) on page 195
• Viewing Statistics for NTP (C-Web Interface) on page 200
• Viewing NTP Status (C-Web Interface) on page 200
Viewing Internal Variables for NTP (SRC CLI)
Purpose View information about internal variables for NTP with the SRC CLI:
Action user@host> show ntp statussystem peer: menemsha.jnpr.netsystem peer mode: clientleap indicator: 00stratum: 4precision: -20root distance: 0.02245 sroot dispersion: 0.07689 sreference ID: [10.227.2.100]reference time: c922b152.86dd0529 Thu, Dec 7 2006 10:27:14.526system flags: auth monitor ntp kernel stats jitter: 0.000183 sstability: 1.728 ppmbroadcastdelay: 0.003998 sauthdelay: 0.000000 s
RelatedDocumentation
• Viewing NTP Peers (SRC CLI) on page 195
• Viewing Statistics for NTP (SRC CLI) on page 196
Copyright © 2014, Juniper Networks, Inc.196
SRC 4.7.x Monitoring and Troubleshooting Guide

• Viewing NTP Peers (C-Web Interface) on page 199
• Viewing Statistics for NTP (C-Web Interface) on page 200
• Viewing NTP Status (C-Web Interface) on page 200
197Copyright © 2014, Juniper Networks, Inc.
Chapter 19: Monitoring NTP (SRC CLI)

Copyright © 2014, Juniper Networks, Inc.198
SRC 4.7.x Monitoring and Troubleshooting Guide
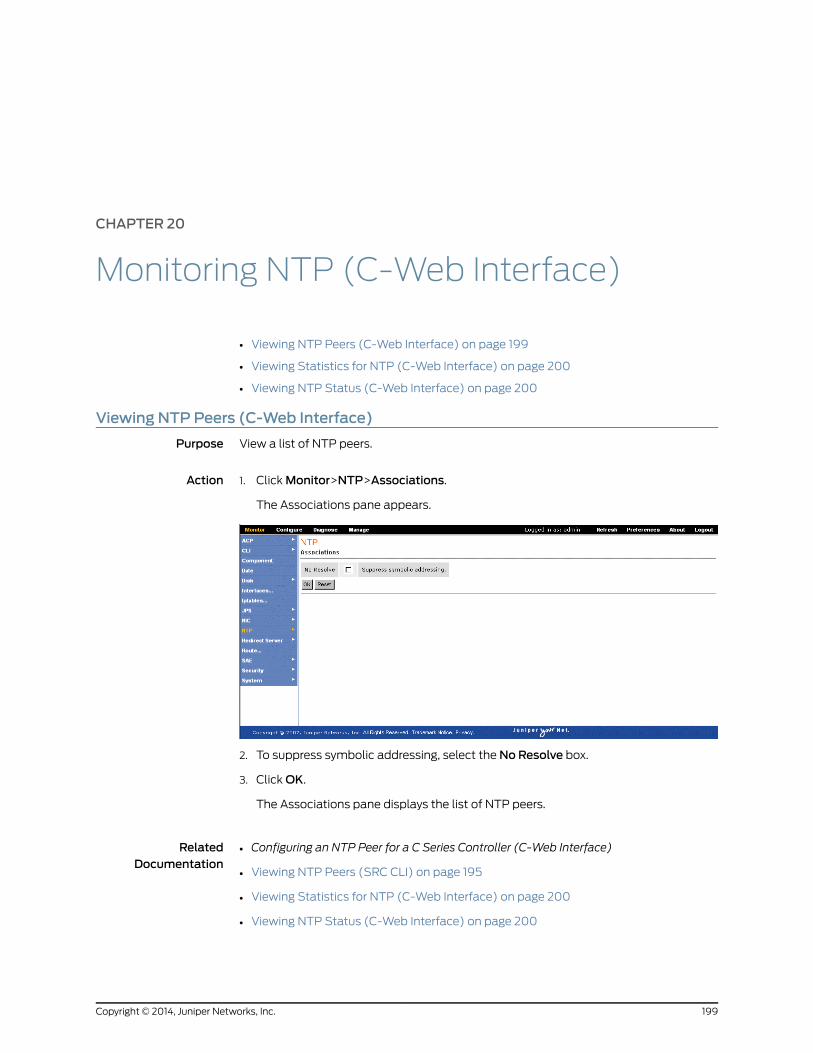
CHAPTER 20
Monitoring NTP (C-Web Interface)
• Viewing NTP Peers (C-Web Interface) on page 199
• Viewing Statistics for NTP (C-Web Interface) on page 200
• Viewing NTP Status (C-Web Interface) on page 200
Viewing NTP Peers (C-Web Interface)
Purpose View a list of NTP peers.
Action Click Monitor>NTP>Associations.1.
The Associations pane appears.
2. To suppress symbolic addressing, select the No Resolve box.
3. Click OK.
The Associations pane displays the list of NTP peers.
RelatedDocumentation
Configuring an NTP Peer for a C Series Controller (C-Web Interface)•
• Viewing NTP Peers (SRC CLI) on page 195
• Viewing Statistics for NTP (C-Web Interface) on page 200
• Viewing NTP Status (C-Web Interface) on page 200
199Copyright © 2014, Juniper Networks, Inc.
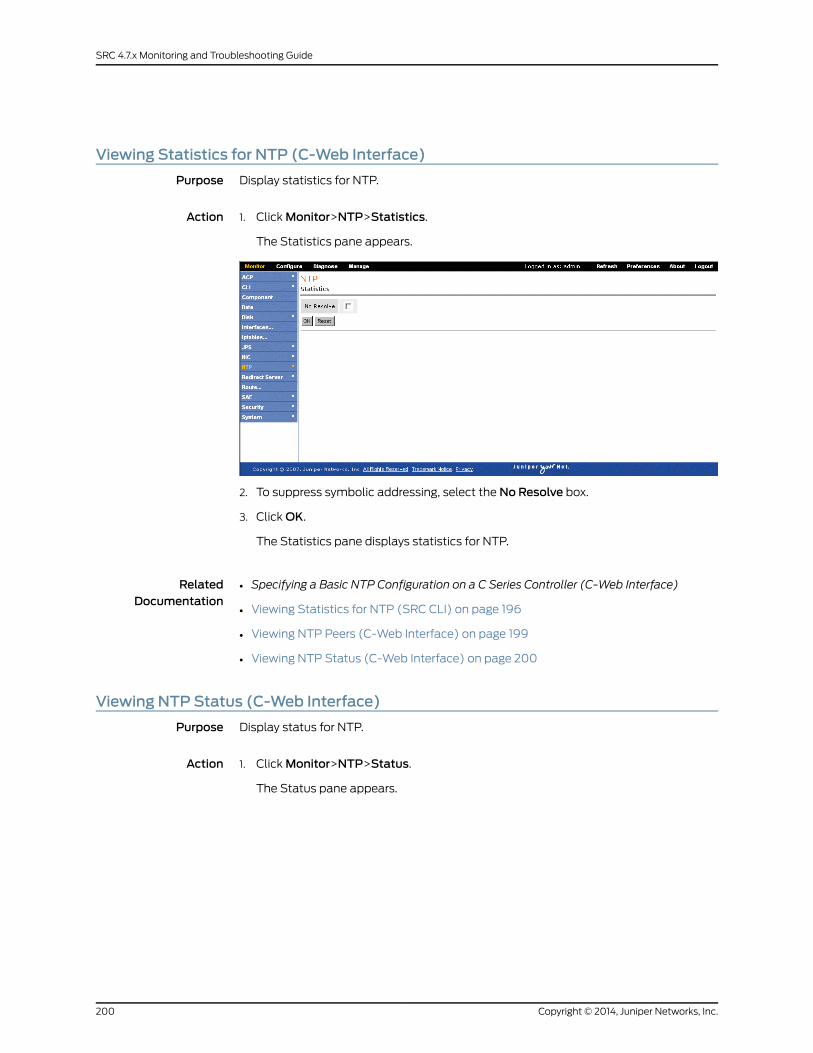
Viewing Statistics for NTP (C-Web Interface)
Purpose Display statistics for NTP.
Action Click Monitor>NTP>Statistics.1.
The Statistics pane appears.
2. To suppress symbolic addressing, select the No Resolve box.
3. Click OK.
The Statistics pane displays statistics for NTP.
RelatedDocumentation
Specifying a Basic NTP Configuration on a C Series Controller (C-Web Interface)•
• Viewing Statistics for NTP (SRC CLI) on page 196
• Viewing NTP Peers (C-Web Interface) on page 199
• Viewing NTP Status (C-Web Interface) on page 200
Viewing NTP Status (C-Web Interface)
Purpose Display status for NTP.
Action Click Monitor>NTP>Status.1.
The Status pane appears.
Copyright © 2014, Juniper Networks, Inc.200
SRC 4.7.x Monitoring and Troubleshooting Guide
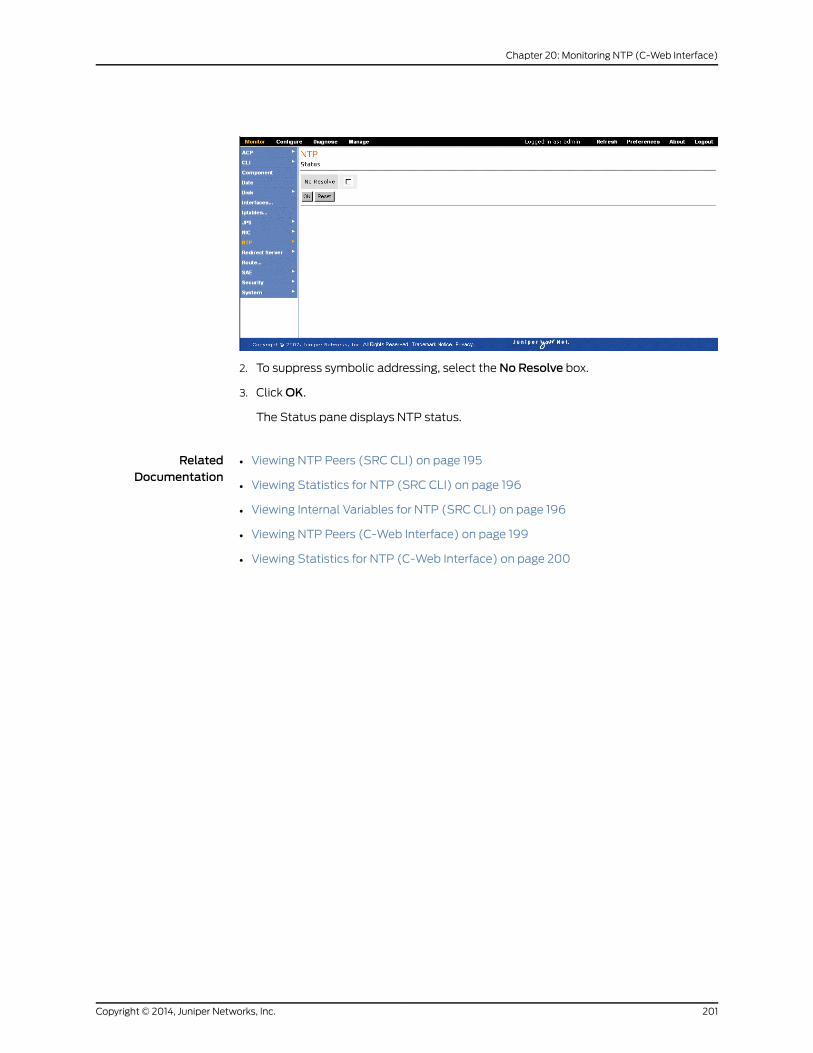
2. To suppress symbolic addressing, select the No Resolve box.
3. Click OK.
The Status pane displays NTP status.
RelatedDocumentation
• Viewing NTP Peers (SRC CLI) on page 195
• Viewing Statistics for NTP (SRC CLI) on page 196
• Viewing Internal Variables for NTP (SRC CLI) on page 196
• Viewing NTP Peers (C-Web Interface) on page 199
• Viewing Statistics for NTP (C-Web Interface) on page 200
201Copyright © 2014, Juniper Networks, Inc.
Chapter 20: Monitoring NTP (C-Web Interface)

Copyright © 2014, Juniper Networks, Inc.202
SRC 4.7.x Monitoring and Troubleshooting Guide
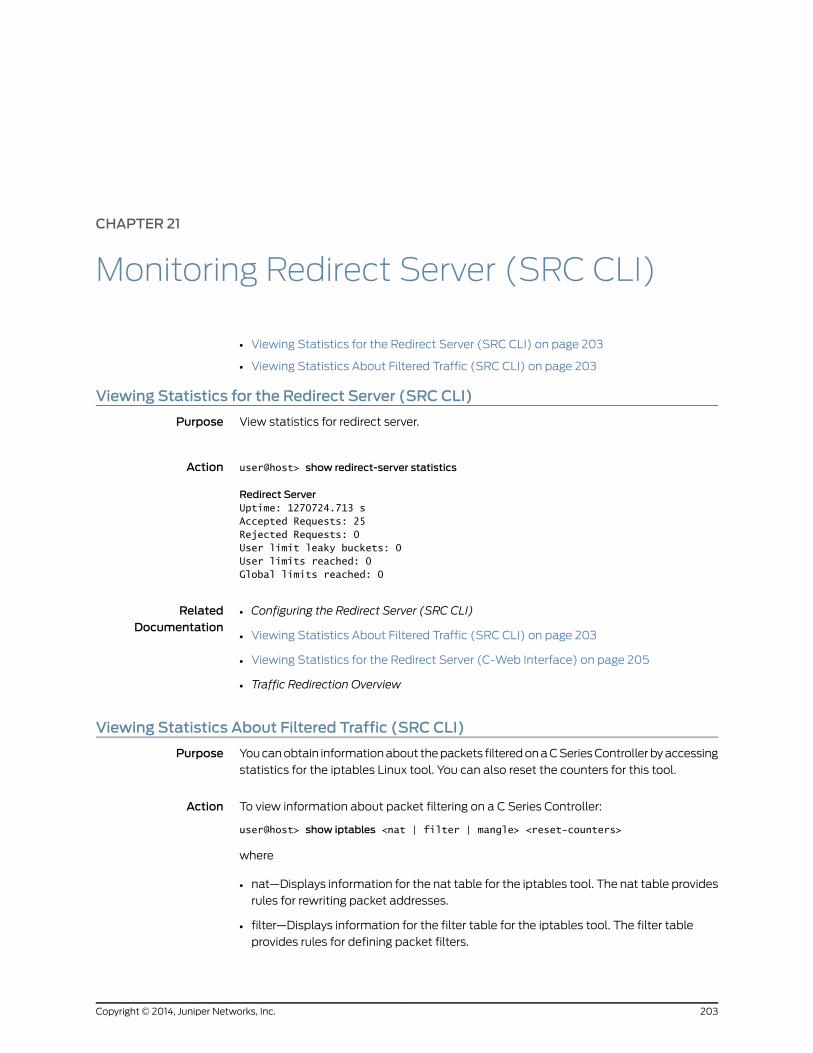
CHAPTER 21
Monitoring Redirect Server (SRC CLI)
• Viewing Statistics for the Redirect Server (SRC CLI) on page 203
• Viewing Statistics About Filtered Traffic (SRC CLI) on page 203
Viewing Statistics for the Redirect Server (SRC CLI)
Purpose View statistics for redirect server.
Action user@host> show redirect-server statistics
Redirect ServerUptime: 1270724.713 sAccepted Requests: 25Rejected Requests: 0User limit leaky buckets: 0User limits reached: 0Global limits reached: 0
RelatedDocumentation
Configuring the Redirect Server (SRC CLI)•
• Viewing Statistics About Filtered Traffic (SRC CLI) on page 203
• Viewing Statistics for the Redirect Server (C-Web Interface) on page 205
• Traffic Redirection Overview
Viewing Statistics About Filtered Traffic (SRC CLI)
Purpose You can obtain information about the packets filtered on a C Series Controller by accessing
statistics for the iptables Linux tool. You can also reset the counters for this tool.
Action To view information about packet filtering on a C Series Controller:
user@host> show iptables <nat | filter | mangle> <reset-counters>
where
• nat—Displays information for the nat table for the iptables tool. The nat table provides
rules for rewriting packet addresses.
• filter—Displays information for the filter table for the iptables tool. The filter table
provides rules for defining packet filters.
203Copyright © 2014, Juniper Networks, Inc.
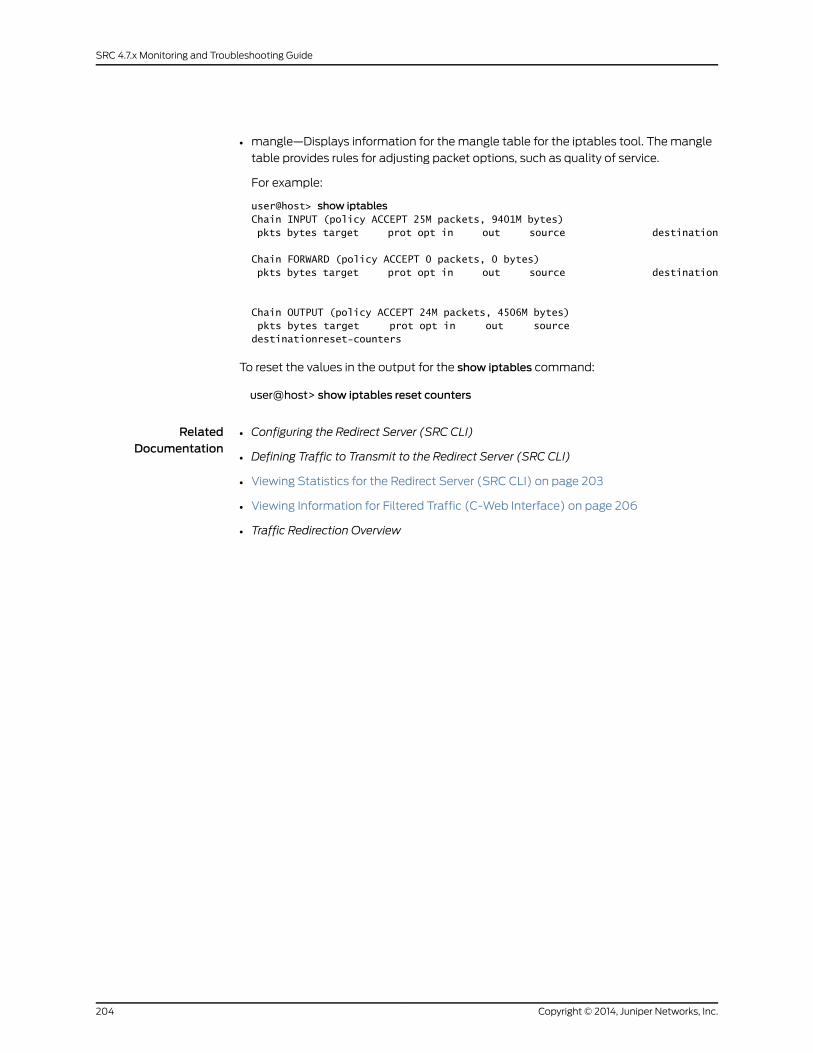
• mangle—Displays information for the mangle table for the iptables tool. The mangle
table provides rules for adjusting packet options, such as quality of service.
For example:
user@host> show iptablesChain INPUT (policy ACCEPT 25M packets, 9401M bytes) pkts bytes target prot opt in out source destination
Chain FORWARD (policy ACCEPT 0 packets, 0 bytes) pkts bytes target prot opt in out source destination
Chain OUTPUT (policy ACCEPT 24M packets, 4506M bytes) pkts bytes target prot opt in out source destinationreset-counters
To reset the values in the output for the show iptables command:
user@host> show iptables reset counters
RelatedDocumentation
• Configuring the Redirect Server (SRC CLI)
• Defining Traffic to Transmit to the Redirect Server (SRC CLI)
• Viewing Statistics for the Redirect Server (SRC CLI) on page 203
• Viewing Information for Filtered Traffic (C-Web Interface) on page 206
• Traffic Redirection Overview
Copyright © 2014, Juniper Networks, Inc.204
SRC 4.7.x Monitoring and Troubleshooting Guide
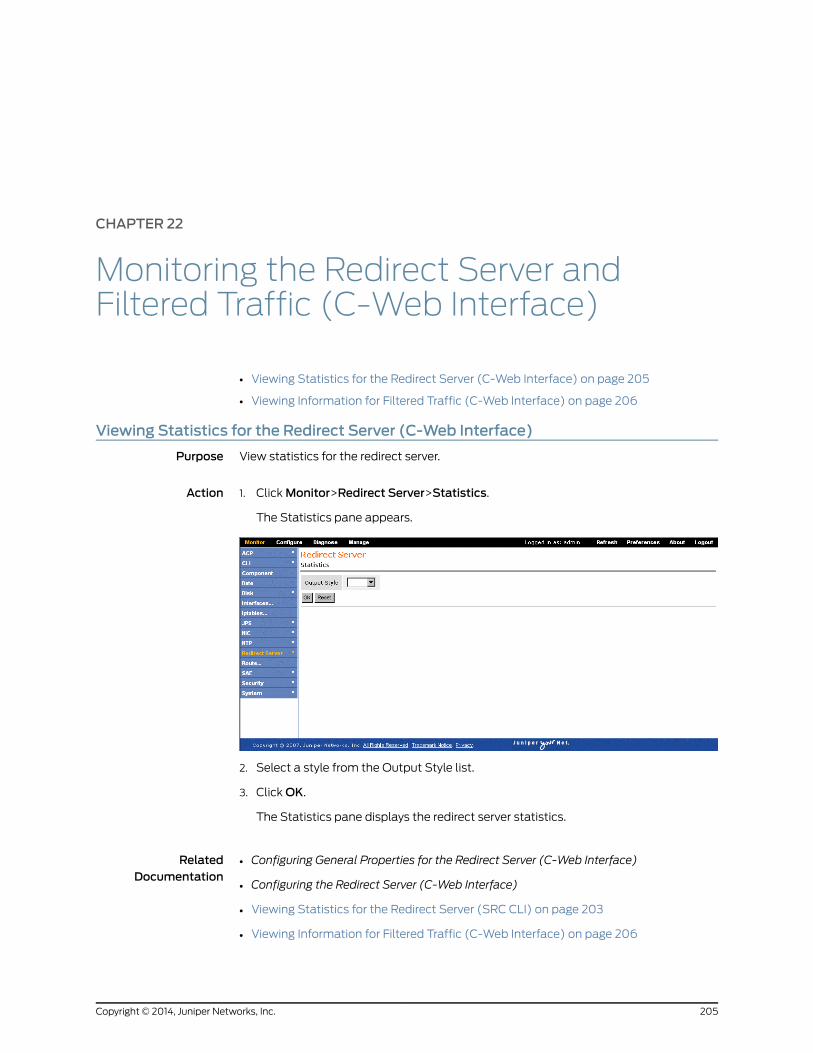
CHAPTER 22
Monitoring the Redirect Server andFiltered Traffic (C-Web Interface)
• Viewing Statistics for the Redirect Server (C-Web Interface) on page 205
• Viewing Information for Filtered Traffic (C-Web Interface) on page 206
Viewing Statistics for the Redirect Server (C-Web Interface)
Purpose View statistics for the redirect server.
Action Click Monitor>Redirect Server>Statistics.1.
The Statistics pane appears.
2. Select a style from the Output Style list.
3. Click OK.
The Statistics pane displays the redirect server statistics.
RelatedDocumentation
Configuring General Properties for the Redirect Server (C-Web Interface)•
• Configuring the Redirect Server (C-Web Interface)
• Viewing Statistics for the Redirect Server (SRC CLI) on page 203
• Viewing Information for Filtered Traffic (C-Web Interface) on page 206
205Copyright © 2014, Juniper Networks, Inc.
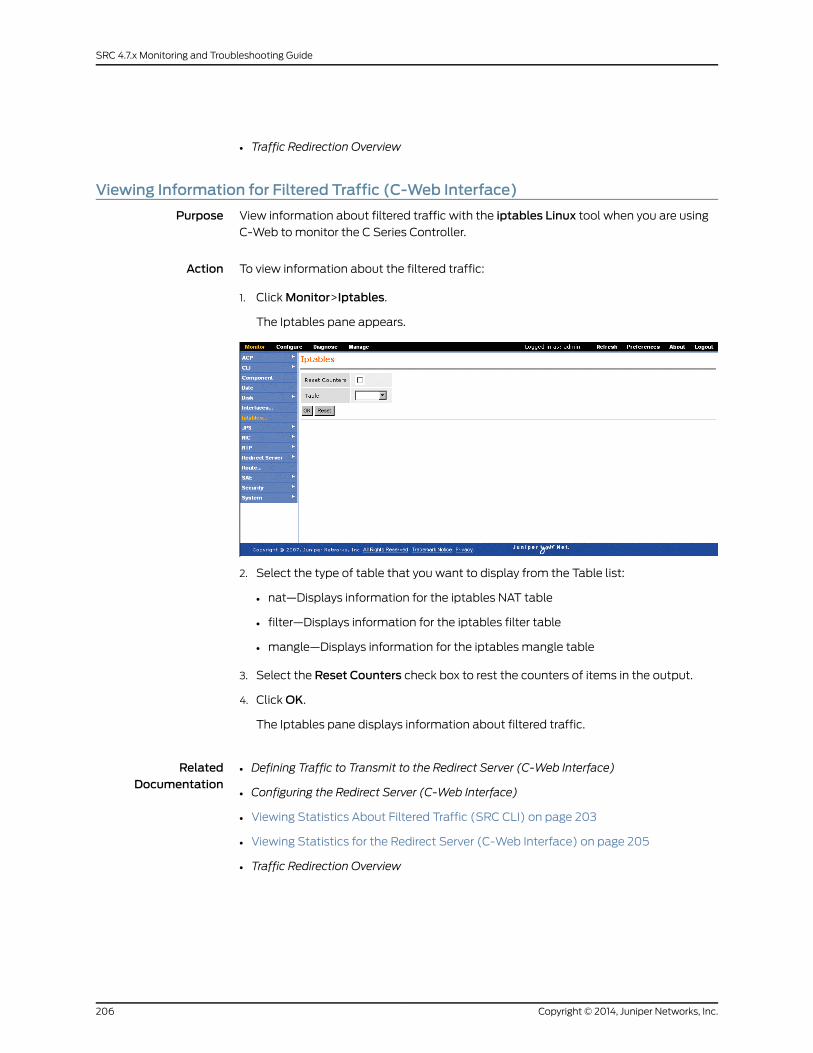
• Traffic Redirection Overview
Viewing Information for Filtered Traffic (C-Web Interface)
Purpose View information about filtered traffic with the iptables Linux tool when you are using
C-Web to monitor the C Series Controller.
Action To view information about the filtered traffic:
1. Click Monitor>Iptables.
The Iptables pane appears.
2. Select the type of table that you want to display from the Table list:
• nat—Displays information for the iptables NAT table
• filter—Displays information for the iptables filter table
• mangle—Displays information for the iptables mangle table
3. Select the Reset Counters check box to rest the counters of items in the output.
4. Click OK.
The Iptables pane displays information about filtered traffic.
RelatedDocumentation
• Defining Traffic to Transmit to the Redirect Server (C-Web Interface)
• Configuring the Redirect Server (C-Web Interface)
• Viewing Statistics About Filtered Traffic (SRC CLI) on page 203
• Viewing Statistics for the Redirect Server (C-Web Interface) on page 205
• Traffic Redirection Overview
Copyright © 2014, Juniper Networks, Inc.206
SRC 4.7.x Monitoring and Troubleshooting Guide
CHAPTER 23
Troubleshooting Network Connectivity(SRC CLI)
• Commands to Troubleshoot Connections to Remote Hosts Overview on page 207
• Testing Connectivity to Remote Hosts (SRC CLI) on page 207
• Viewing the Route Information (SRC CLI) on page 208
• Viewing Routing Table Information (SRC CLI) on page 209
• Viewing Interface Information (SRC CLI) on page 209
Commands to Troubleshoot Connections to Remote Hosts Overview
If you are troubleshooting problems with the SRC software that might be caused by
connectivity problems to remote hosts, you can use the following commands:
• ping—Test connectivity to a remote host.
• traceroute—Display the route from the local host to a remote host and back.
• show interfaces—Display information about system interfaces.
• show route—Display information from the system routing table.
RelatedDocumentation
Testing Connectivity to Remote Hosts (SRC CLI) on page 207•
• Viewing the Route Information (SRC CLI) on page 208
• Viewing Routing Table Information (SRC CLI) on page 209
• Viewing Interface Information (SRC CLI) on page 209
Testing Connectivity to Remote Hosts (SRC CLI)
Purpose Test connectivity to a remote host.
207Copyright © 2014, Juniper Networks, Inc.
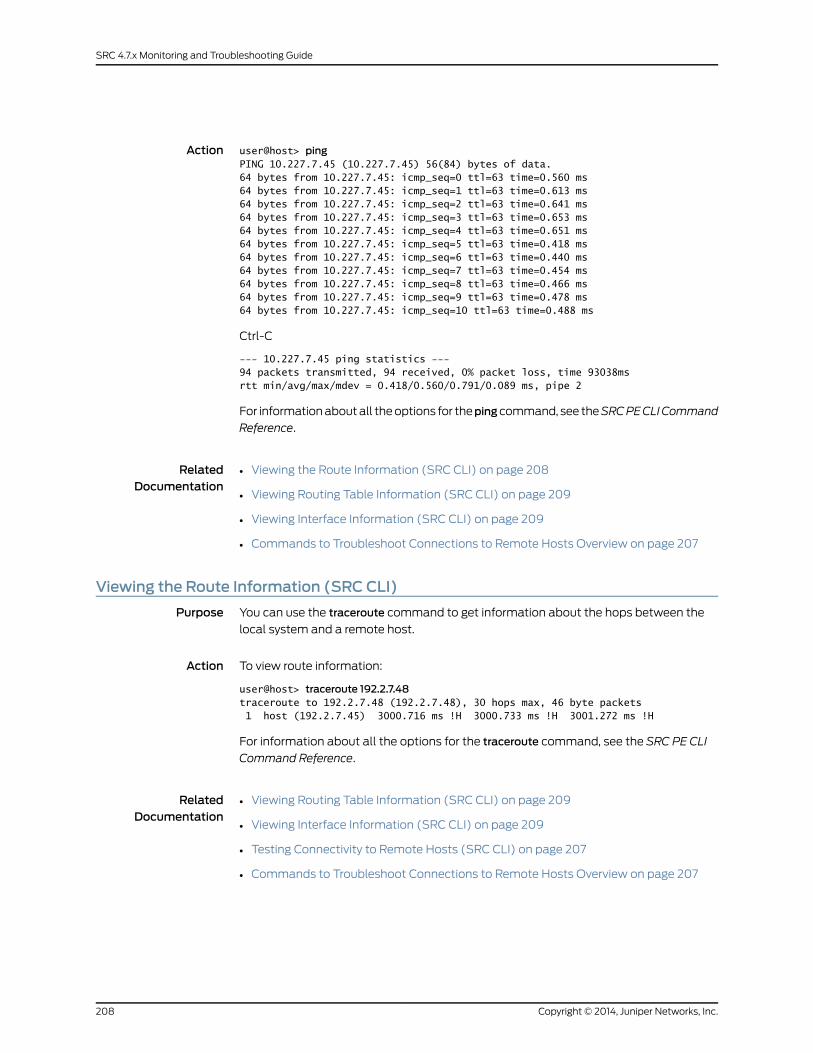
Action user@host> pingPING 10.227.7.45 (10.227.7.45) 56(84) bytes of data.64 bytes from 10.227.7.45: icmp_seq=0 ttl=63 time=0.560 ms64 bytes from 10.227.7.45: icmp_seq=1 ttl=63 time=0.613 ms64 bytes from 10.227.7.45: icmp_seq=2 ttl=63 time=0.641 ms64 bytes from 10.227.7.45: icmp_seq=3 ttl=63 time=0.653 ms64 bytes from 10.227.7.45: icmp_seq=4 ttl=63 time=0.651 ms64 bytes from 10.227.7.45: icmp_seq=5 ttl=63 time=0.418 ms64 bytes from 10.227.7.45: icmp_seq=6 ttl=63 time=0.440 ms64 bytes from 10.227.7.45: icmp_seq=7 ttl=63 time=0.454 ms64 bytes from 10.227.7.45: icmp_seq=8 ttl=63 time=0.466 ms64 bytes from 10.227.7.45: icmp_seq=9 ttl=63 time=0.478 ms64 bytes from 10.227.7.45: icmp_seq=10 ttl=63 time=0.488 ms
Ctrl-C
--- 10.227.7.45 ping statistics ---94 packets transmitted, 94 received, 0% packet loss, time 93038msrtt min/avg/max/mdev = 0.418/0.560/0.791/0.089 ms, pipe 2
For information about all the options for thepingcommand, see theSRCPECLICommand
Reference.
RelatedDocumentation
Viewing the Route Information (SRC CLI) on page 208•
• Viewing Routing Table Information (SRC CLI) on page 209
• Viewing Interface Information (SRC CLI) on page 209
• Commands to Troubleshoot Connections to Remote Hosts Overview on page 207
Viewing the Route Information (SRC CLI)
Purpose You can use the traceroute command to get information about the hops between the
local system and a remote host.
Action To view route information:
user@host> traceroute 192.2.7.48traceroute to 192.2.7.48 (192.2.7.48), 30 hops max, 46 byte packets 1 host (192.2.7.45) 3000.716 ms !H 3000.733 ms !H 3001.272 ms !H
For information about all the options for the traceroute command, see the SRC PE CLI
Command Reference.
RelatedDocumentation
Viewing Routing Table Information (SRC CLI) on page 209•
• Viewing Interface Information (SRC CLI) on page 209
• Testing Connectivity to Remote Hosts (SRC CLI) on page 207
• Commands to Troubleshoot Connections to Remote Hosts Overview on page 207
Copyright © 2014, Juniper Networks, Inc.208
SRC 4.7.x Monitoring and Troubleshooting Guide
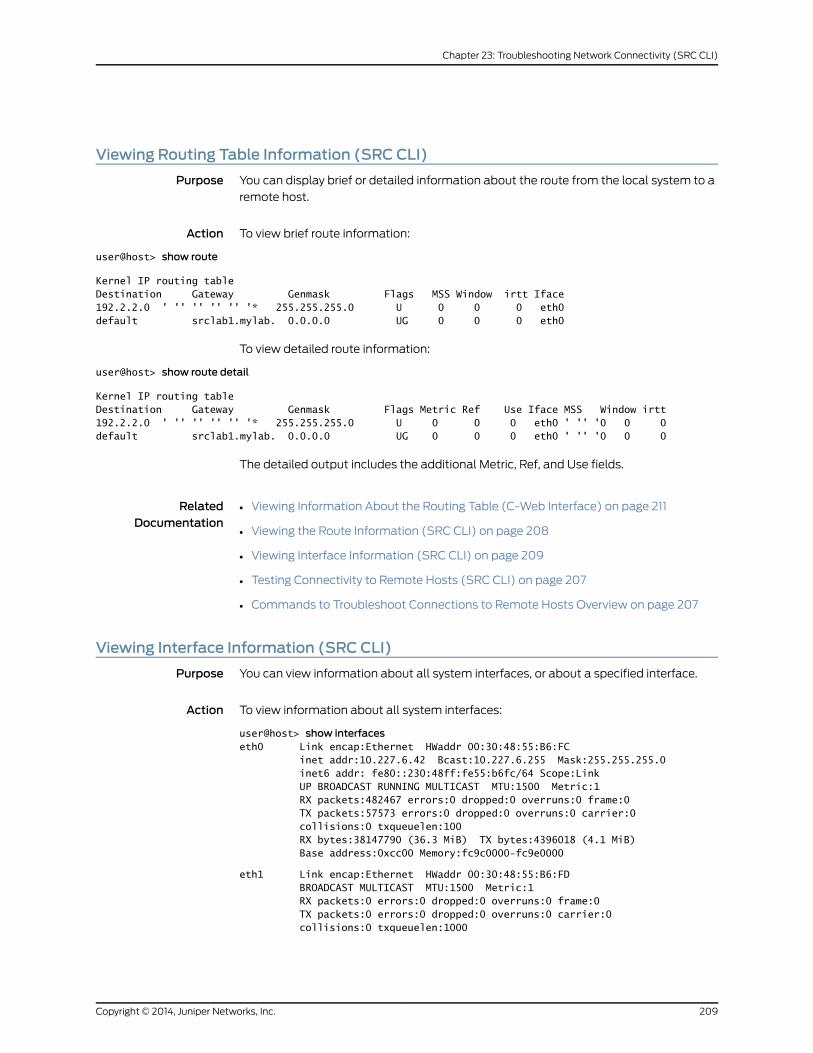
Viewing Routing Table Information (SRC CLI)
Purpose You can display brief or detailed information about the route from the local system to a
remote host.
Action To view brief route information:
user@host> show route
Kernel IP routing tableDestination Gateway Genmask Flags MSS Window irtt Iface192.2.2.0 ' '' '' '' '' '* 255.255.255.0 U 0 0 0 eth0default srclab1.mylab. 0.0.0.0 UG 0 0 0 eth0
To view detailed route information:
user@host> show route detail
Kernel IP routing tableDestination Gateway Genmask Flags Metric Ref Use Iface MSS Window irtt192.2.2.0 ' '' '' '' '' '* 255.255.255.0 U 0 0 0 eth0 ' '' '0 0 0default srclab1.mylab. 0.0.0.0 UG 0 0 0 eth0 ' '' '0 0 0
The detailed output includes the additional Metric, Ref, and Use fields.
RelatedDocumentation
Viewing Information About the Routing Table (C-Web Interface) on page 211•
• Viewing the Route Information (SRC CLI) on page 208
• Viewing Interface Information (SRC CLI) on page 209
• Testing Connectivity to Remote Hosts (SRC CLI) on page 207
• Commands to Troubleshoot Connections to Remote Hosts Overview on page 207
Viewing Interface Information (SRC CLI)
Purpose You can view information about all system interfaces, or about a specified interface.
Action To view information about all system interfaces:
user@host> show interfaceseth0 Link encap:Ethernet HWaddr 00:30:48:55:B6:FC inet addr:10.227.6.42 Bcast:10.227.6.255 Mask:255.255.255.0 inet6 addr: fe80::230:48ff:fe55:b6fc/64 Scope:Link UP BROADCAST RUNNING MULTICAST MTU:1500 Metric:1 RX packets:482467 errors:0 dropped:0 overruns:0 frame:0 TX packets:57573 errors:0 dropped:0 overruns:0 carrier:0 collisions:0 txqueuelen:100 RX bytes:38147790 (36.3 MiB) TX bytes:4396018 (4.1 MiB) Base address:0xcc00 Memory:fc9c0000-fc9e0000
eth1 Link encap:Ethernet HWaddr 00:30:48:55:B6:FD BROADCAST MULTICAST MTU:1500 Metric:1 RX packets:0 errors:0 dropped:0 overruns:0 frame:0 TX packets:0 errors:0 dropped:0 overruns:0 carrier:0 collisions:0 txqueuelen:1000
209Copyright © 2014, Juniper Networks, Inc.
Chapter 23: Troubleshooting Network Connectivity (SRC CLI)
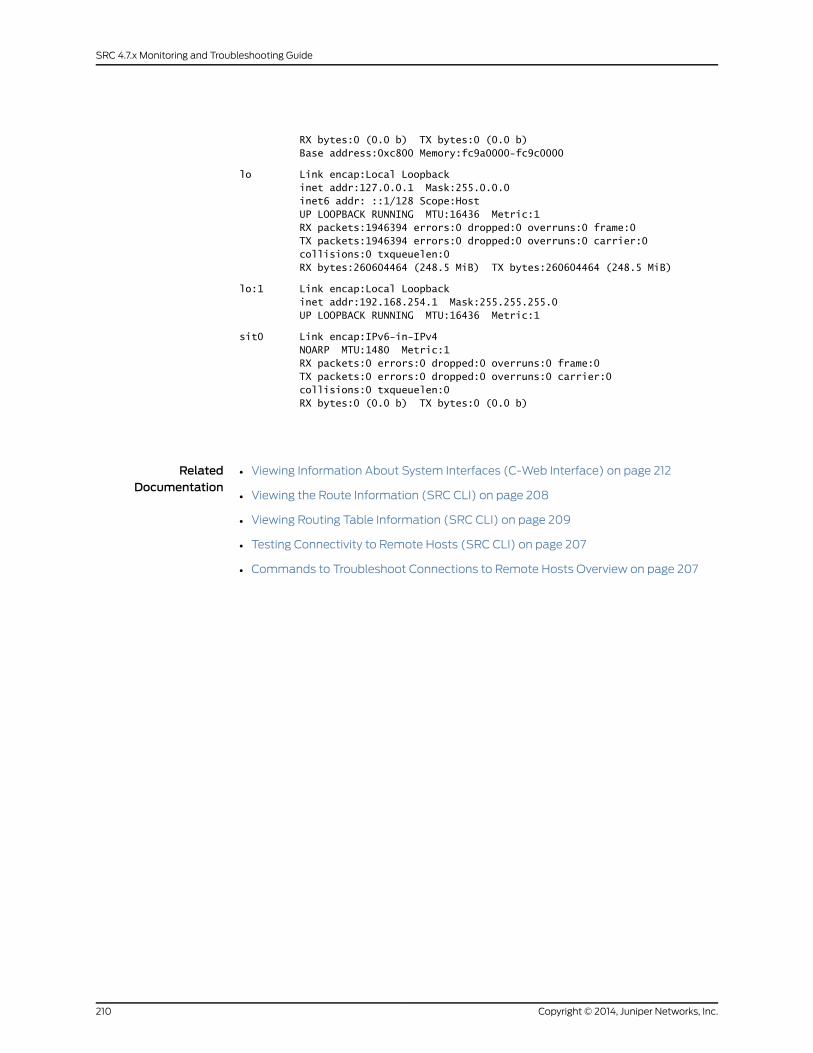
RX bytes:0 (0.0 b) TX bytes:0 (0.0 b) Base address:0xc800 Memory:fc9a0000-fc9c0000
lo Link encap:Local Loopback inet addr:127.0.0.1 Mask:255.0.0.0 inet6 addr: ::1/128 Scope:Host UP LOOPBACK RUNNING MTU:16436 Metric:1 RX packets:1946394 errors:0 dropped:0 overruns:0 frame:0 TX packets:1946394 errors:0 dropped:0 overruns:0 carrier:0 collisions:0 txqueuelen:0 RX bytes:260604464 (248.5 MiB) TX bytes:260604464 (248.5 MiB)
lo:1 Link encap:Local Loopback inet addr:192.168.254.1 Mask:255.255.255.0 UP LOOPBACK RUNNING MTU:16436 Metric:1
sit0 Link encap:IPv6-in-IPv4 NOARP MTU:1480 Metric:1 RX packets:0 errors:0 dropped:0 overruns:0 frame:0 TX packets:0 errors:0 dropped:0 overruns:0 carrier:0 collisions:0 txqueuelen:0 RX bytes:0 (0.0 b) TX bytes:0 (0.0 b)
RelatedDocumentation
• Viewing Information About System Interfaces (C-Web Interface) on page 212
• Viewing the Route Information (SRC CLI) on page 208
• Viewing Routing Table Information (SRC CLI) on page 209
• Testing Connectivity to Remote Hosts (SRC CLI) on page 207
• Commands to Troubleshoot Connections to Remote Hosts Overview on page 207
Copyright © 2014, Juniper Networks, Inc.210
SRC 4.7.x Monitoring and Troubleshooting Guide
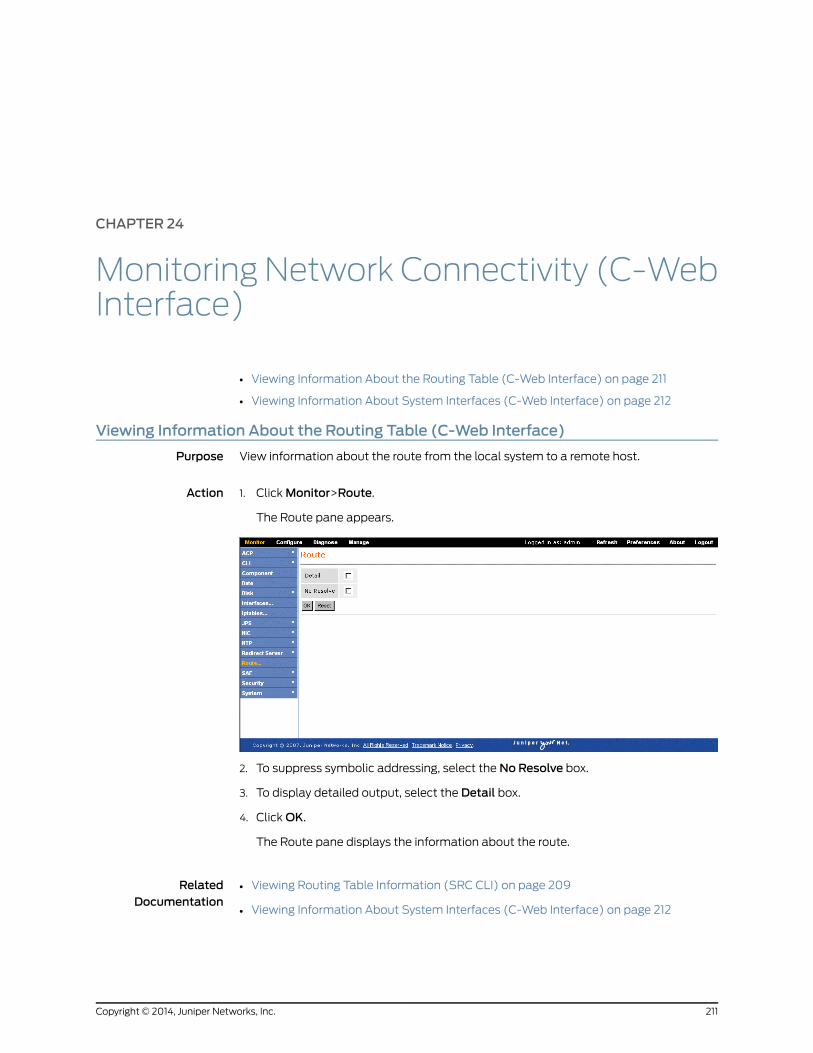
CHAPTER 24
Monitoring Network Connectivity (C-WebInterface)
• Viewing Information About the Routing Table (C-Web Interface) on page 211
• Viewing Information About System Interfaces (C-Web Interface) on page 212
Viewing Information About the Routing Table (C-Web Interface)
Purpose View information about the route from the local system to a remote host.
Action 1. Click Monitor>Route.
The Route pane appears.
2. To suppress symbolic addressing, select the No Resolve box.
3. To display detailed output, select the Detail box.
4. Click OK.
The Route pane displays the information about the route.
RelatedDocumentation
Viewing Routing Table Information (SRC CLI) on page 209•
• Viewing Information About System Interfaces (C-Web Interface) on page 212
211Copyright © 2014, Juniper Networks, Inc.
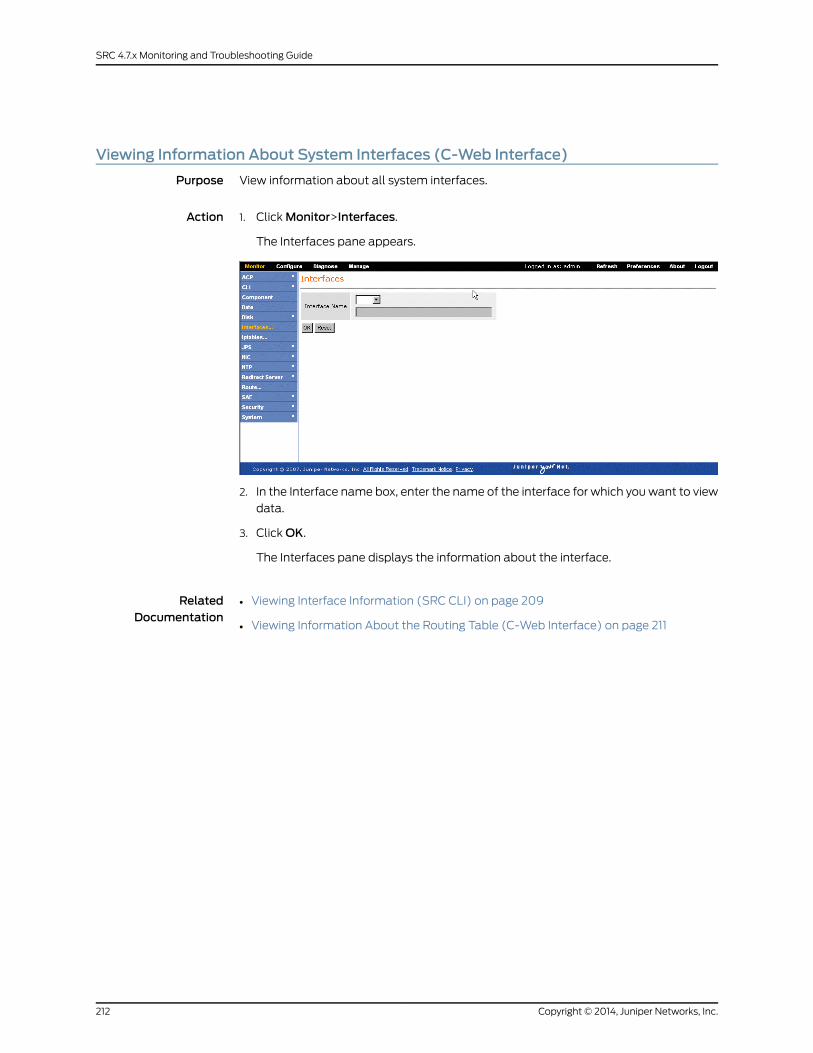
Viewing Information About System Interfaces (C-Web Interface)
Purpose View information about all system interfaces.
Action Click Monitor>Interfaces.1.
The Interfaces pane appears.
2. In the Interface name box, enter the name of the interface for which you want to view
data.
3. Click OK.
The Interfaces pane displays the information about the interface.
RelatedDocumentation
• Viewing Interface Information (SRC CLI) on page 209
• Viewing Information About the Routing Table (C-Web Interface) on page 211
Copyright © 2014, Juniper Networks, Inc.212
SRC 4.7.x Monitoring and Troubleshooting Guide
CHAPTER 25
Monitoring Activity for SRC Components
• Monitoring Activity on C Series Controllers on page 213
• Collecting Data with the Activity Monitor (SRC CLI) on page 214
• Collecting Data with the Activity Monitor (C-Web Interface) on page 216
• Viewing Graphs (C-Web Interface) on page 216
• Viewing Graphs from a Web Page on page 216
Monitoring Activity on C Series Controllers
The SRC software provides logging support and general statistics for SRC components.
The Activity Monitor collects diagnostic information about the state of a component at
a specific time and archives this information in one file.
You can collect the following information:
• Log files
• Configuration files
• stdout
• stderr
• Round-robin database (rrd) files generated by the Activity Monitor
• Output from system monitoring commands
• System log files, SAR data files, and other important log files in the system /var/log
directory
The collected information is in a zipped tarball file that is named in the format
diagnostic-hostname-productname-YYMMDD-HHMMSS.tar.gz—for example,
diagnostic-atlanta-C2000-20110926-184950.tar.gz—and is found in the
/opt/UMC/activity/var/diagnostic/directory. The tarball file contains thediagnostic-info.log
file, which contains all the operations performed by the command and their success
status. If an error occurred during an operation, the error message is logged.
The Activity Monitor can create graphs from the collected data to help determine the
state of the SRC component for troubleshooting. You can view the graphs for the
components during a specified time in the C-Web interface.
213Copyright © 2014, Juniper Networks, Inc.
The generated graphs include data about the C Series Controller:
• CPU usage
• Load average
• Memory usage
• Interface traffic
The generated graphs for the SAE include the following data:
• Heap usage
• Service activity
• User activity
• Users and services
The generated graphs for the components include data generated from the MIBs.
• ACP—juniAcpHeapLimit, juniAcpHeapUsed, juniAcpIntfTrackingEvents,
juniAcpIgnoredTrackingEvents, juniAcpCongestionPoints, juniAcpVirtualRouters,
juniAcpCPUpdateRcvd, juniAcpUserUpdateRcvd, juniAcpCPActiveUpdate,
juniAcpUserActiveUpdate
• License server—juniSdxLicApplEntry
• NIC—juniNicHostHeapLimit, juniNicHostHeapUsed, juniNicHostResolutions,
juniNicHostUnmatchedResolutions, juniNicHostResolutionErrors,
juniNicHostResolutionTime
• SAE—juniSaeRouterCommonCurConn, juniSdxSaeUserLicenses
RelatedDocumentation
Collecting Data with the Activity Monitor (SRC CLI) on page 214•
• Collecting Data with the Activity Monitor (C-Web Interface) on page 216
• Viewing Graphs (C-Web Interface) on page 216
• Viewing Graphs from a Web Page on page 216
Collecting Data with the Activity Monitor (SRC CLI)
You can collect data with the Activity Monitor for specific components over a specified
time and save them to a tar.gz file in the /opt/UMC/activity/var/diagnostic/* directory.
You can view the exact file name and path after you execute the request support
information command. Before you perform data collection with the Activity Monitor,
make sure the filter for the specific components is enabled.
To perform data collection with the Activity Monitor:
• user@host> request support information
Some of the information retrieved includes:
Copyright © 2014, Juniper Networks, Inc.214
SRC 4.7.x Monitoring and Troubleshooting Guide
• System log messages from the /var/log/messages/* directory.
• The configuration in text format, XML format, and set format.
• The host name in the name of the diagnostic file.
To perform data collection for specific components:
• user@host> request support information component
where component is one of the following:
• acp—SRC Admission Control Plug-In
• activity—Activity Monitor
• agent—SNMP agent
• appsvr—Application server
• cli—SRC CLI
• diameter—Diameter application
• dsa—Dynamic Service Activator
• extsubmon—External Subscriber Monitor
• ims—IP multimedia subsystem
• jdb—Juniper Networks database
• jps—Juniper Policy Server
• licSvr—License server
• nic—Network information collector
• redir—Redirect server
• sae—SAE
• webadm—C-Web interface
To perform data collection for a specified number of days:
• user@host> request support information days
where days is in the range of 1–36500.
RelatedDocumentation
Before You Load a Configuration•
• Viewing Graphs (C-Web Interface) on page 216
• Viewing Graphs from a Web Page on page 216
• Monitoring Activity on C Series Controllers on page 213
215Copyright © 2014, Juniper Networks, Inc.
Chapter 25: Monitoring Activity for SRC Components
Collecting Data with the Activity Monitor (C-Web Interface)
You can collect data with the Activity Monitor for specific components over a specified
time. Before you configure data collection for the Activity Monitor, make sure the Activity
Monitor (activity), CLI (cli), and C-Web interface (webadm) components are enabled.
To perform data collection with the Activity Monitor:
1. Click Manage>Request>Support>Information.
The Support Information pane appears.
2. From the Components list, select the components you want to monitor, and clickOK.
3. (Optional) Enter the number of days for which you want to collect data, and clickOK.
RelatedDocumentation
Viewing Graphs (C-Web Interface) on page 216•
• Viewing Graphs from a Web Page on page 216
• Monitoring Activity on C Series Controllers on page 213
Viewing Graphs (C-Web Interface)
You can display graphs for components for which the Activity Monitor has collected data.
To display graphs from the Activity Monitor with the C-Web interface:
1. Click Graphs.
2. In the side pane, select the component and the graph that you want to display.
The pane for selecting the time period displayed by the graph appears.
3. Select one of the preset values or enter the time range in the From and To boxes, and
click OK.
The graphs appear.
RelatedDocumentation
Collecting Data with the Activity Monitor (C-Web Interface) on page 216•
• Viewing Graphs from a Web Page on page 216
• Monitoring Activity on C Series Controllers on page 213
Viewing Graphs from aWeb Page
You can display graphs for components for which the Activity Monitor has collected data
from a Web page. Before you display these graphs, make sure the Activity Monitor
Copyright © 2014, Juniper Networks, Inc.216
SRC 4.7.x Monitoring and Troubleshooting Guide

(activity) and C-Web interface (webadm) components are enabled. For more secure
displays, configure the C-Web interface to use HTTPS and use POST requests.
• Viewing Graphs for a Preset Time Period from a Web Page on page 217
• Viewing Graphs for Specified Time Periods from a Web Page on page 218
Viewing Graphs for a Preset Time Period from aWeb Page
To display graphs with preset time periods from the Activity Monitor from a Web page:
http://ip-address/graph?&id=username&pw=password&name=graph-name&time=time-period
where
• ip-address—IP address of the C Series Controller
• username—Username used to log in to the C Series Controller
• password—Password used to log in to the C Series Controller
• graph-name—Name of graph to display in the format <component>-<graph>, where
<graph> is the name of the graph as specified in the C-Web interface in all lowercase
letters with hyphens separating words
• time-period—Period of time that data was collected for display in a graph in the format
<number><units>
The <number> is the number of <units>, which are specified as one of the following
values:
• m—minutes
• h—hours
• d—days
• w—weeks
• M—months
• y—years
For example, to view the CPU graph for the System component for the past 10 minutes
on the C Series Controller called c2000 for the user admin:
http://c2000/graph?&id=admin&pw=secret&name=system-cpu&time=10m
217Copyright © 2014, Juniper Networks, Inc.
Chapter 25: Monitoring Activity for SRC Components
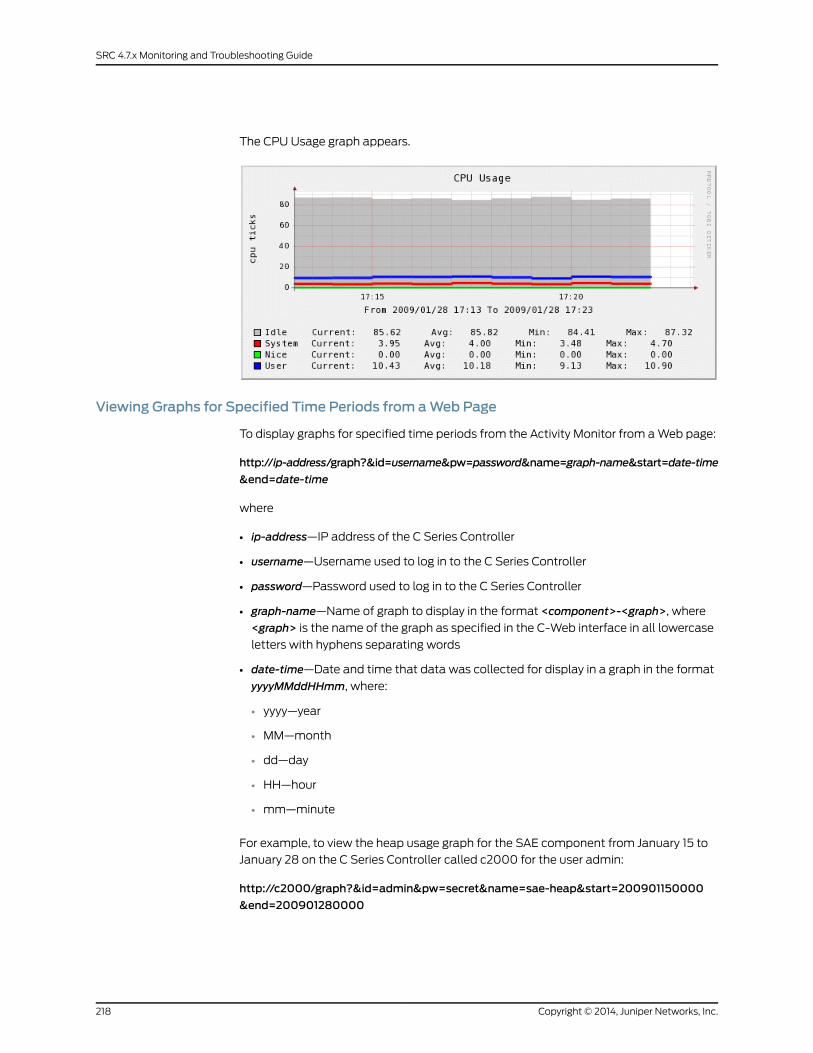
The CPU Usage graph appears.
Viewing Graphs for Specified Time Periods from aWeb Page
To display graphs for specified time periods from the Activity Monitor from a Web page:
http://ip-address/graph?&id=username&pw=password&name=graph-name&start=date-time
&end=date-time
where
• ip-address—IP address of the C Series Controller
• username—Username used to log in to the C Series Controller
• password—Password used to log in to the C Series Controller
• graph-name—Name of graph to display in the format <component>-<graph>, where
<graph> is the name of the graph as specified in the C-Web interface in all lowercase
letters with hyphens separating words
• date-time—Date and time that data was collected for display in a graph in the format
yyyyMMddHHmm, where:
• yyyy—year
• MM—month
• dd—day
• HH—hour
• mm—minute
For example, to view the heap usage graph for the SAE component from January 15 to
January 28 on the C Series Controller called c2000 for the user admin:
http://c2000/graph?&id=admin&pw=secret&name=sae-heap&start=200901150000
&end=200901280000
Copyright © 2014, Juniper Networks, Inc.218
SRC 4.7.x Monitoring and Troubleshooting Guide
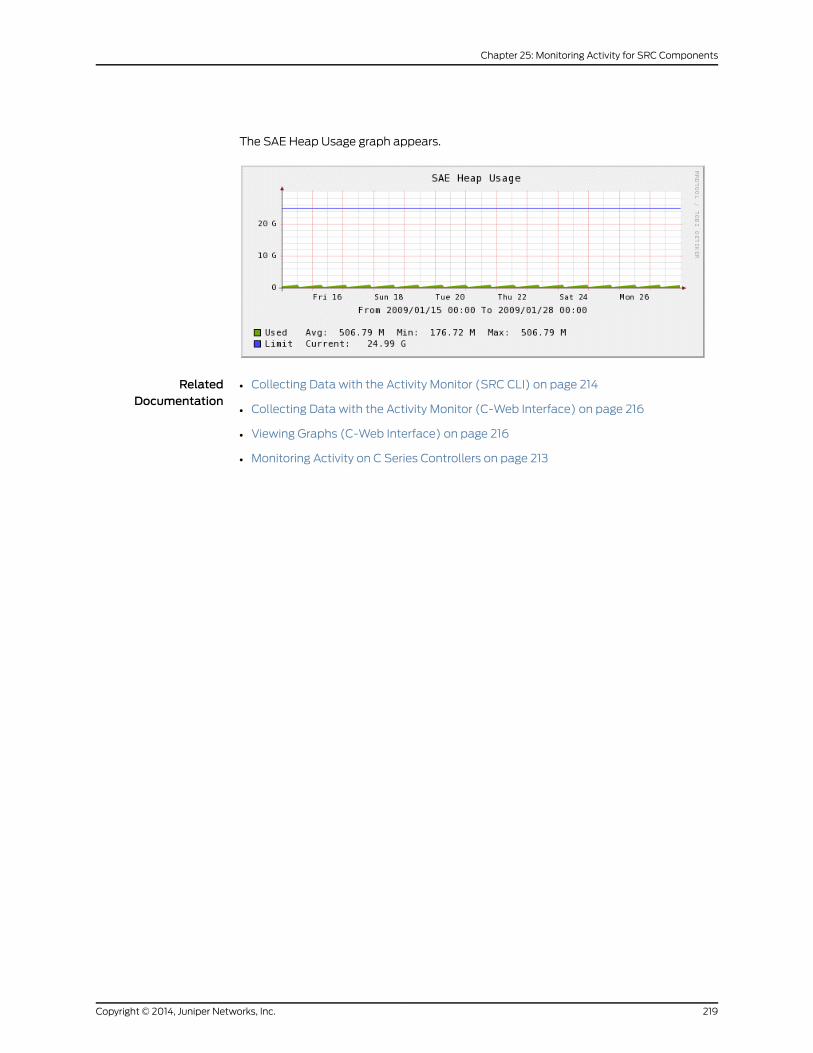
The SAE Heap Usage graph appears.
RelatedDocumentation
• Collecting Data with the Activity Monitor (SRC CLI) on page 214
• Collecting Data with the Activity Monitor (C-Web Interface) on page 216
• Viewing Graphs (C-Web Interface) on page 216
• Monitoring Activity on C Series Controllers on page 213
219Copyright © 2014, Juniper Networks, Inc.
Chapter 25: Monitoring Activity for SRC Components

Copyright © 2014, Juniper Networks, Inc.220
SRC 4.7.x Monitoring and Troubleshooting Guide

PART 6
Index
• Index on page 223
221Copyright © 2014, Juniper Networks, Inc.

Copyright © 2014, Juniper Networks, Inc.222
SRC 4.7.x Monitoring and Troubleshooting Guide
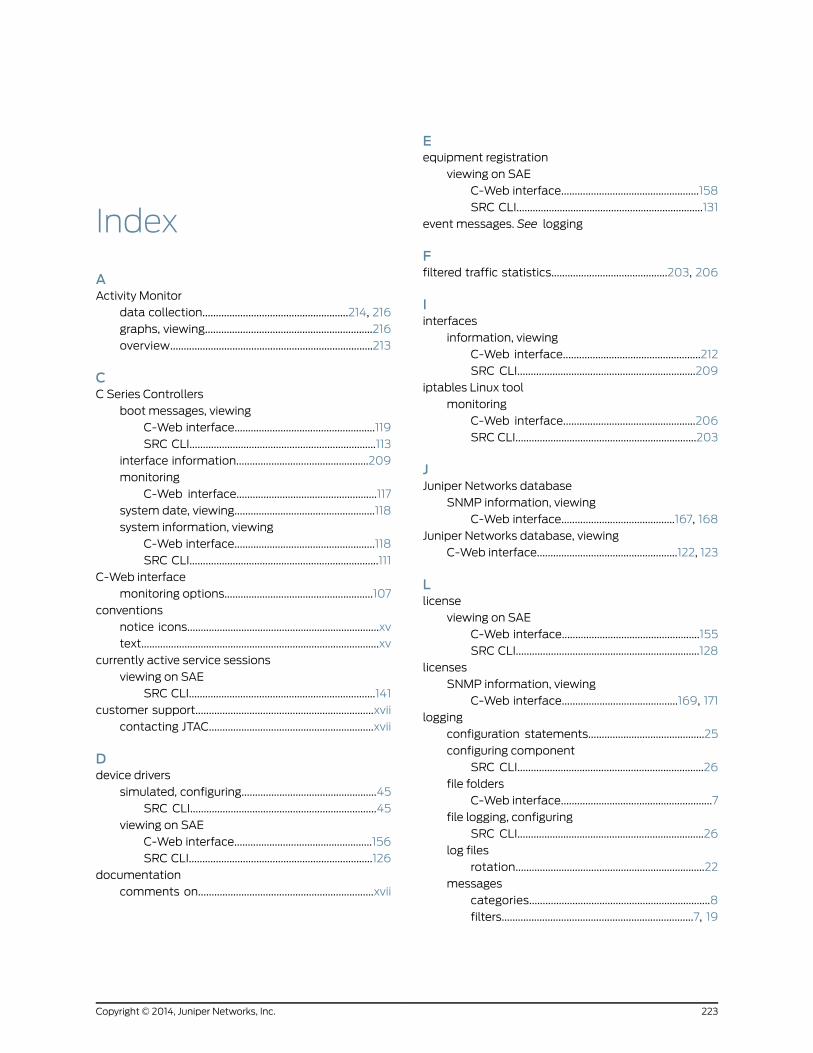
Index
AActivity Monitor
data collection......................................................214, 216
graphs, viewing..............................................................216
overview...........................................................................213
CC Series Controllers
boot messages, viewing
C-Web interface....................................................119
SRC CLI.....................................................................113
interface information.................................................209
monitoring
C-Web interface....................................................117
system date, viewing....................................................118
system information, viewing
C-Web interface....................................................118
SRC CLI......................................................................111
C-Web interface
monitoring options.......................................................107
conventions
notice icons.......................................................................xv
text........................................................................................xv
currently active service sessions
viewing on SAE
SRC CLI.....................................................................141
customer support..................................................................xvii
contacting JTAC.............................................................xvii
Ddevice drivers
simulated, configuring..................................................45
SRC CLI.....................................................................45
viewing on SAE
C-Web interface...................................................156
SRC CLI....................................................................126
documentation
comments on.................................................................xvii
Eequipment registration
viewing on SAE
C-Web interface...................................................158
SRC CLI.....................................................................131
event messages. See logging
Ffiltered traffic statistics...........................................203, 206
Iinterfaces
information, viewing
C-Web interface...................................................212
SRC CLI..................................................................209
iptables Linux tool
monitoring
C-Web interface.................................................206
SRC CLI...................................................................203
JJuniper Networks database
SNMP information, viewing
C-Web interface..........................................167, 168
Juniper Networks database, viewing
C-Web interface....................................................122, 123
Llicense
viewing on SAE
C-Web interface...................................................155
SRC CLI....................................................................128
licenses
SNMP information, viewing
C-Web interface...........................................169, 171
logging
configuration statements...........................................25
configuring component
SRC CLI.....................................................................26
file folders
C-Web interface........................................................7
file logging, configuring
SRC CLI.....................................................................26
log files
rotation......................................................................22
messages
categories...................................................................8
filters.......................................................................7, 19
223Copyright © 2014, Juniper Networks, Inc.
format........................................................................29
severity levels..........................................................18
overview................................................................................7
system log, configuring
SRC CLI.....................................................................28
login registration
viewing on SAE
C-Web interface...................................................159
SRC CLI...................................................................130
logrotate utility
configuration statements...........................................30
configuring
SRC CLI......................................................................32
overview
SRC CLI......................................................................22
Mmanuals
comments on.................................................................xvii
MIBs
Juniper Networks, list...................................................80
monitoring with SNMP agent....................................79
monitoring tools
C-Web interface............................................................107
overview...............................................................................3
SRC CLI.............................................................................107
Nnetwork devices
SNMP information, viewing
C-Web interface..................................170, 175, 176
Network Time Protocol. See NTP
NIC (network information collector)
agents, viewing
C-Web interface...................................................192
SRC CLI....................................................................183
hosts, viewing
C-Web interface..................................................189
SRC CLI.....................................................................181
monitoring
C-Web interface..................................................189
SRC CLI....................................................................179
resolution data, troubleshooting............................187
resolution data, viewing
C-Web interface..................................................190
SRC CLI..........................................................184, 186
statistics, viewing
C-Web interface..................................................189
SRC CLI...................................................................180
notice icons................................................................................xv
NTP (Network Time Protocol)
monitoring
C-Web interface..................................................199
SRC CLI..........................................................195, 196
statistics, viewing
C-Web interface.................................................200
SRC CLI...................................................................196
Ppolicies
SNMP information, viewing
C-Web interface....................................................172
viewing on SAE
C-Web interface...................................................155
SRC CLI....................................................................129
portals, testing.........................................................................49
RRADIUS statistics
SNMP information, viewing
C-Web interface...................................................174
redirect server
statistics, viewing
C-Web interface..................................................205
SRC CLI...................................................................203
router interfaces
viewing on SAE
C-Web interface...................................................157
SRC CLI....................................................................128
routing table, viewing
C-Web interface.............................................................211
SRC CLI...........................................................................209
SSAE (service activation engine)
configuration, viewing
SRC CLI....................................................................125
directory blacklist, viewing
C-Web interface...................................................153
SRC CLI....................................................................125
SNMP information, viewing
SRC CLI....................................................................142
SAE (service activation engine), configuring
simulated router driver
C-Web interface.....................................................47
SRC CLI.....................................................................45
Copyright © 2014, Juniper Networks, Inc.224
SRC 4.7.x Monitoring and Troubleshooting Guide
security certificates
information, viewing
C-Web interface...................................................120
SRC CLI.....................................................................115
server processes
SNMP information, viewing
C-Web interface...................................................173
service sessions
SNMP information, viewing
C-Web interface....................................................177
services
viewing on SAE
C-Web interface...................................................154
SRC CLI.....................................................................131
simulated router driver, configuring
C-Web interface..............................................................47
SRC CLI..............................................................................45
simulated subscribers
logging in on SAE...........................................................50
logging out........................................................................49
SNMP agent
MIBs....................................................................................80
See also SNMP traps ...................................................85
viewing information on SAE
C-Web
interface.167, 168, 169, 170, 171, 172, 173, 174, 175, 176, 177
SRC CLI....................................................................142
SNMP alarm
Boolean test.....................................................................63
discontinuity check.......................................................65
existence test..................................................................64
overview.............................................................................62
threshold test..................................................................65
SNMP chassis alarms
battery voltage sensors................................................72
configuring.........................................................................72
CPU core voltage sensors...........................................73
CPU DIMM voltage sensors........................................74
CPU sensors.....................................................................73
CPU temperature sensors...........................................75
fan speed sensors..........................................................75
overview..............................................................................71
system temperature sensors.....................................76
voltage sensors................................................................77
SNMP events.....................................................................66, 67
SNMP monitors
alarms................................................................................62
Boolean test............................................................63
existence test.........................................................64
threshold test.........................................................65
chassis alarms....................................................71, 75, 76
configuring................................................................72
events..........................................................................66, 67
overview............................................................................59
security name.................................................................66
statement hierarchy.......................................................61
SNMP traps
alarm state transitions...............................................102
configuring................................................................82, 83
event traps
configuring...............................................................83
defined.......................................................................81
list and description...............................................99
notifications
defined.......................................................................81
overview............................................................................80
performance traps
accounting..............................................................90
authentication........................................................92
chassis......................................................................98
configuring...............................................................82
defined......................................................................80
JPS..............................................................................98
NIC..............................................................................93
policy engine...........................................................96
redirect server.........................................................97
router driver.............................................................94
SAE.............................................................................88
SRC ACP...................................................................97
system management..........................................96
SRC CLI, viewing
C-Web interface............................................................123
SRC components
activity, monitoring.......................................................213
information, viewing
C-Web interface....................................................119
SRC CLI.....................................................................113
storing log messages
SRC CLI..............................................................................26
subscriber session count by managed router
viewing on SAE
SRC CLI....................................................................142
225Copyright © 2014, Juniper Networks, Inc.
Index
subscriber sessions
logging in...........................................................................50
logging out........................................................................53
SNMP information, viewing
C-Web interface....................................................177
viewing on SAE...............................................................161
SRC CLI........................134, 135, 136, 137, 138, 139
support, technical See technical support
system logging. See logging
Ttechnical support
contacting JTAC.............................................................xvii
testing
connection to remote host......................................209
text conventions defined......................................................xv
threads
viewing on SAE
C-Web interface..................................................160
SRC...........................................................................134
traps. See SNMP traps
troubleshooting
tools.......................................................................................3
with log files........................................................................7
Uuser permissions, viewing
C-Web interface............................................................124
users, viewing
C-Web interface.............................................................121
Copyright © 2014, Juniper Networks, Inc.226
SRC 4.7.x Monitoring and Troubleshooting Guide