Embed Size (px)
Citation preview
Report No. 10079-CE
Sri LankaStrengthened Adjustment for Growthand Poverty ReductionJanuary 8, 1992
Country Operations, Industry & Finance Division MICROFICHE COPY
South Asia Country Department IIIReport No. 10079-CE Type: (ECO)
FOR OFFICIAL USE ONLY SHISHIDO, / X80429 / D9091/ ASICO
6~
Document~ of the World Ban'k
This document has a restricted distribution and may be used by recipientsonly in the performance of their official duties. Its contents may nototherwise
be disclosed without World Bank Authorizati,n.
19>,9 ,, J . .. '~~~~~~~~~~~~~~~~~~~~~~~~~~~~~~~~~~~~~~~~~~~~~~~~~~~~~~~~~~~~~~~~~~~~~~~~~~~~~4
Pub
lic D
iscl
osur
e A
utho
rized
Pub
lic D
iscl
osur
e A
utho
rized
Pub
lic D
iscl
osur
e A
utho
rized
Pub
lic D
iscl
osur
e A
utho
rized
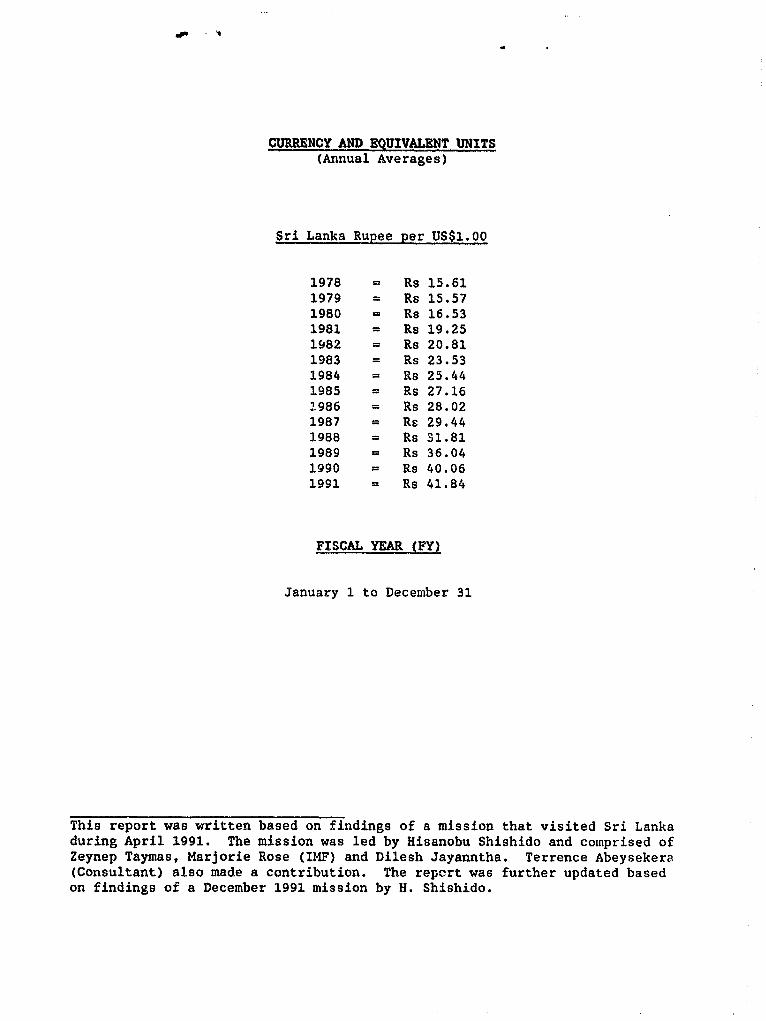
CURRENCY AND EQUIVALENT UNITS(Annual Averages)
Sri Lanka Rupee per US$1.00
1978 = Rs 15.611979 = Rs 15.571980 = Rs 16.531981 = Rs 19.251982 = Rs 20.811983 = Rs 23.531984 - Rs 25.441985 Rs 27.161986 = Rs 28.021987 - Rs 29.441988 = Rs 31.811989 = Rs 36.041990 Rs 40.061991 = Rs 41.84
FISCAL YEAR (FY)
January 1 to December 31
This report was written based on findings of a mission that visited Sri Lankaduring April 1991. The mission was led by Hisanobu Shishido and comprised ofZeynep Taymas, Marjorie Rose (IMF) and Dilesh Jayanntha. Terrence Abeysekera(Consultant) also made a contribution. The repert was further updated basedon findings of a December 1991 mission by H. Shishido.
FOR OFFICIAL USE ONLY
List of Abbreviations and Acronyms Used
ADB - Asian Development BankAGA - Assistant Government AgentARC - Administrative Reforms Commission
BOC - Bank of Ceylon
CBSL - Central Bank of Sri LankaCCPI - Colombo Consumer Price IndexCPC - Ceylon Petroleum CorporationCTB - Central Transport BoardCWE - Cooperative Wholesale Establishment
EEC - European Economic CommunityEPZ - Export Processing Zones
FCD - Food Commissioner's DepartmentFIAC - Foreign Investment Advisory C;mmitteeFIAS - Foreign Investment Advisor:, ServiceFSP - Food Stamp Program
GCEO - Greater Colombo Economic CommissionGDP - Gross Domestic ProductGNP - Gross National ProductGOBUs - Government Owned Business Undertakings
HYV - High Yielding Varieties
IDA - International Development AssociationILO - International Labor OrganisationIMF - International Monetary Fund
JEDB - Janatha Estates Development BoardJSP - Jana Saviya ProgramJVP - Janatha Vimukthi Peramuna (Peoples' Liberation Front)
MDMP - Mid-Day Meal ProgramMPA - Ministry of Public AdministrationMPCS - Multi-Purpose Cooperative Societies
NGOs - Non-Governmental OrganizationsNIC - Newly Industrialized CountriesNSB - National Savings BankNTC - National Transportation Commission
O&M - Operation & Maintenance
PAC - Poverty Alleviation CreditPB - Peoples' BankPEs - Public Enterprises
This document has a restricted distribution and may be used by recipients only in the performanceof their official duties. Its contents may not otherwise be disclosed without World Bank authorization.
- 2-
PMB - Paddy Marketing BoardPSC - Public Service Commission
RACA - Restructuring and Collection AgencyRTB - Regional Transport Board
SLBFE - Sri Lanka Bureau of Foreign EmploymentSLSPC - Sri Lanka State Plantations Corporation
/
TITLE: STRENGTHENED ADJUSTMENT FOR GROWTH AND POVERTY REDUCTION
COUNTRYs SRI LANKA
REGION: COUNTRY DEPARTMENT III, SOUTH ASIA
SECTOR: COUNTRY ECONOMIC
REPORT TYPE CLASSIF MM1YX LANGUAGE10079-CE CEM Restricted 01/92 English
PUBDATE: 9201
ABSTRACT: The Government of Sri Lanka embarked on serious economic restructuringefforts in 1989. These efforts included measures to: (i) stabilize theecoaomy; (ii) rationalize the public sector; (iii) encourage privateinvestment; and (iv) improve the country's poverty programs. As a resultof these efforts and together with good weather and improved securitysituation in most parts of the country, economic growth improved to 5-6percent a year in 1990 and 1991 from the 2 percent average of theprevious three years. Cautious optimism has, therefore, started toemerge as to the country's potential to sustain high growth and in thelonger term to join the rank of newly industrialized countries. But,while tight macroeconomic management stance largely was maintained in1990, it has become rather lax from the fourth quarter of 1991 and fiscaland credit targets have been exceeded. For the economy to enjoysustainable growth, it is essential that the macroeconomic stance betightened immediately, and, in addition, two worrisome signs in theeconomic adjustment patterns be removed. One of these signs is thatpublic investment (which complements private productive investment) isplummeting while an increasing portion of private investment may be goinginto housing and real estate. The other sign is eroding externalcompetitiveness; wages and domestic prices have been rising rapidly whileadjustment in exchange rate in the recent past has been rather limited.The root cause of these problems lies in the larger government recurrentspending relative to its revenues--its current deficit has been 1-2percent of GDP since 1989. This dissaving has increased consumption biasin the economy undermining the Government's efforts to encourage privateinvestments in export sectors. The Government needs to rectify this andachieve positive recurrent surplus (about 2 percent of GDP) byimplementing appropriate wage policies, restructuring the public sectorpension scheme and improving further cost effectiveness of povertyprograms. To improve the economy's overall efficiency, in addition, thegovernment needs to continue privatizing commercial public enterprises,and allow market forces to play a significant role in management ofpublic sector banks and tree crop plantations; privatization should beconsidered in the latter two subsectors as well. The government alsoneeds to resort increasingly, in consultation with the IMF, to fle.ibleforeign exchange rate management. These macroeconomic reforms need to becomplemented by a wide range of reforms at the microeconomic and sectorallevels. The report briefly discusses four such reform areas which areseen as high priority. They are, improvement of: (i) financialinstitutions; (ii) the environment for foreign direct investment;(iii) labor legislation; and (iv) physical infrastructure. In addition,the Government needs to make further progress in resolving the civilconflict so as to improve the investment climate, encourage increasedproduction in affected areas, and free up resources for development.
SRI LANKA
STRENGTHENED ADJUSTMENT FOR GROWTH AND POVERTY REDUCTION
TABLE OF CONTENTS
Page
Country Data
Executive Summary i
I. REVIEW OF RECENT ECONOMIC PERFORMANCE ............................. 1
Economic Performance in 1990 and 1991 .......................... 1
Background ....... ...................... 1National Accounts and Growth ................................ 2
Growth Performance in 1990 ..... ............. 4Savings and Investment ................................ 7
Balance of Payments ......................................... 11Fiscal Developments .................... ..................... 16Inflation ......................... .......................... 18Impact of the Gulf Crisis ................................... 22
The Agriculture Sector ..................... ....................... 26The Paddy Sector ..................... ....................... 26Alternative Food Crops: Crop Diversification ....... ......... 29Impact of the Civil Conflict on Agriculture ........ ......... 32
Civil Conflicts Defense Expenditures and Refugee Issues ........... 36The Evolution of Actual Defense Expenditure ........ ......... 36Refugees ......................... ........................... 37
II. TOWARDS A GROWTH-ORIENTED POLICY PACK&GE .......................... 39
Introduction ........... 39
Macroeconomic Management for Enhanced Export Orientation ........ .. 41Evolution of Investments and Savings ......... .. ............. 41Evolution of External Competitiveness ......... .. ............ 46Summary ..... 49
Reduction of the Government's Size and Influence .. ................ 50Establishing Administrative Capacity ........... ............. 50Promoting Privatization/Peoplization ...... .................. 53Public Tree Crop Sector Restructuring ...... ................. 55Summary ................................................. 61
Creation of a Competitive Business EnvironmentConducive to Private Ilvestment ................ ................. 61
Establishing an Efficient Financial Sector ........ .......... 63Promoting Foreign Direct Investment .. ....................... 65Improving Labor Relations ................. .................. 67Providing Adequate Infrastructure Services .................. 69Summary ............................... . 70
Restructuring Poverty Programs .. ............................ 71Jana Saviya Program ............... ............... 72The Food Stamp Program .............................. 74The Mid-Day Meal Program .............................. 74
- ii -
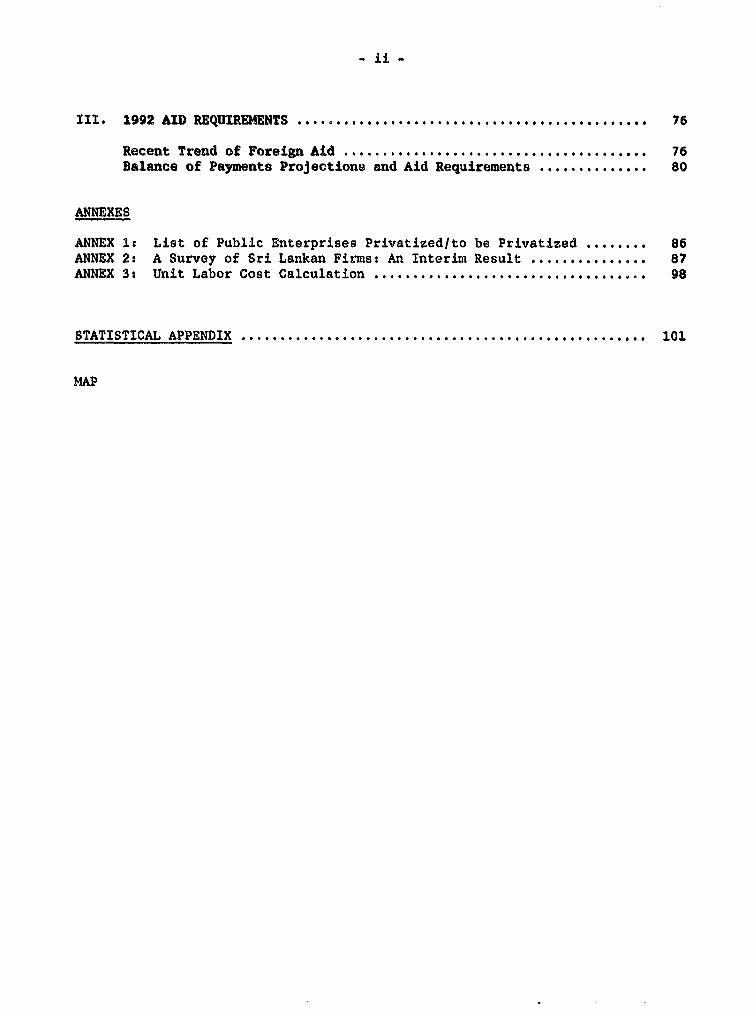
III. 1992 AID REQUIREMENTS . ..... ............................................ 76
Recent Trend of Foreign Aid ....... ................................ 76Balance of Payments Projections and Aid Requirements .............. 80
ANNEXES
ANNEX 1: List of Public Enterprises Privatized/to be Privatized ........ 86ANNEX 2: A Survey of Sri Lankan Firms: An Interim Result ............... 87ANNEX 3: Unit Labor Cost Calculation .................................. . 98
STATISTICAL APPENDIX ...................................... 101
MAP
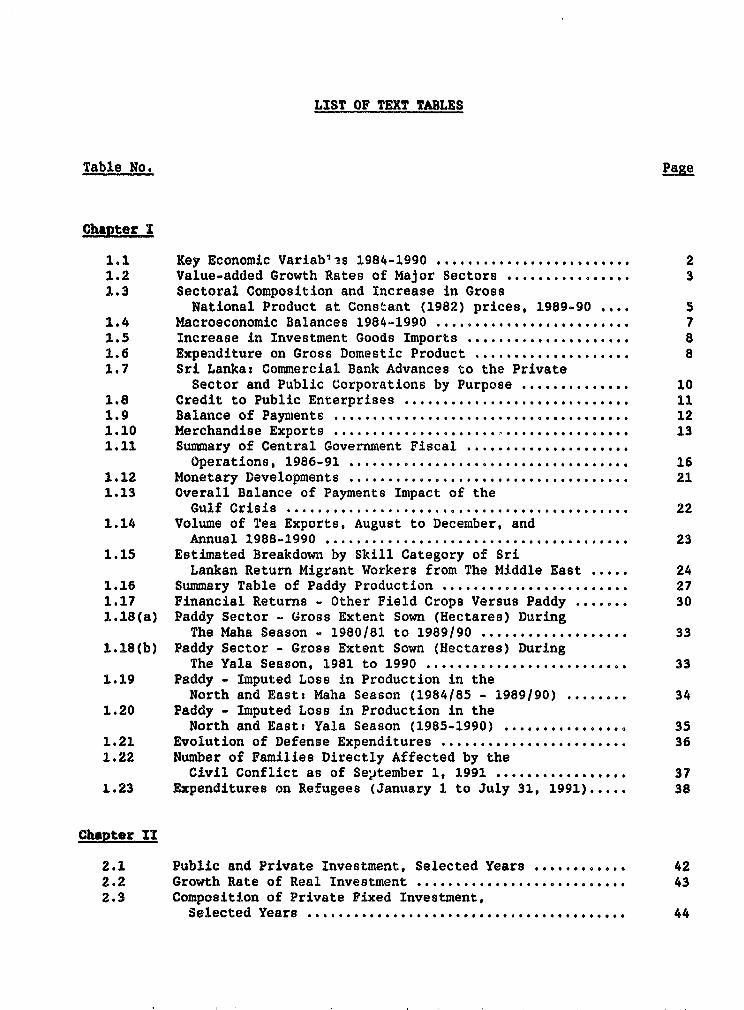
LIST OF TEXT TABLES
Table No. PaRe
Chater 1I
1.1 Key Economic Variab1 -s 1984-1990 ........... 21.2 Value-added Growth Rates of Major Sectors ............... 31.3 Sectoral Composition and Increase in Gross
National Product at Constant (1982) prices, 1989-90 .... 51.4 Macroeconomic Balances 1984-1990 .......... * .............. 71.5 Increase in Investment Goods Imports .................... . 81.6 Expenditure on Gross Domestic Product .. .................. 81.7 Sri Lanka: Commercial Bank Advances to the Private
Sector and Public Corporations by Purpose .............. 101.8 Credit to Public Enterprises ............................. 111.9 Balance of Payments ...................................... 121.10 Merchandise Exports ................. 131.11 Summary of Central Government Fiscal .
Operations, 1986-91 ........ ............................ 161.12 Monetary Developments ........ ............................ 211.13 Overall Balance of Payments Impact of the
Gulf Crisis .221.14 Volume of Tea Exports, August to December, and
Annual 1988-1990. 231.15 Estimated Breakdown by Skill Category of Sri
Lankan Return Migrant Workers from The Middle East ..... 241.16 Summary Table of Paddy Production ........ ................ 271.17 Financial Returns - Other Field Crops Versus Paddy ....... 301.18(a) Paddy Sector - Gross Extent Sown (Hectares) During
The Maha Season - 1980/81 to 1989/90 ................... 331.18(b) Paddy Sector - Gross Extent Sown (Hectares) During
The Yala Season, 1981 to 1990 ............ 331.19 Paddy - Imputed Loss in Production in the
North and East: Maha Season (1984/85 - 1989/90). 341.20 Paddy - Imputed Loss in Production in the
North and East: Yala Season (1985-1990) ............... . 351.21 Evolution of Defense Expenditures ........................ 361.22 Number of Families Directly Affected by the
Civil Conflict as of September 1, 1991 ................ . 371.23 Expenditures on Refugees (January 1 to July 31, 1991) ..... 38
Chapter It
2.1 Public and Private Investment, Selected Years ....... , 422.2 Growth Rate of Real Investment ........................... 432.3 Composition of Private Fixed Investment,
Selected Years......... . ...... 44
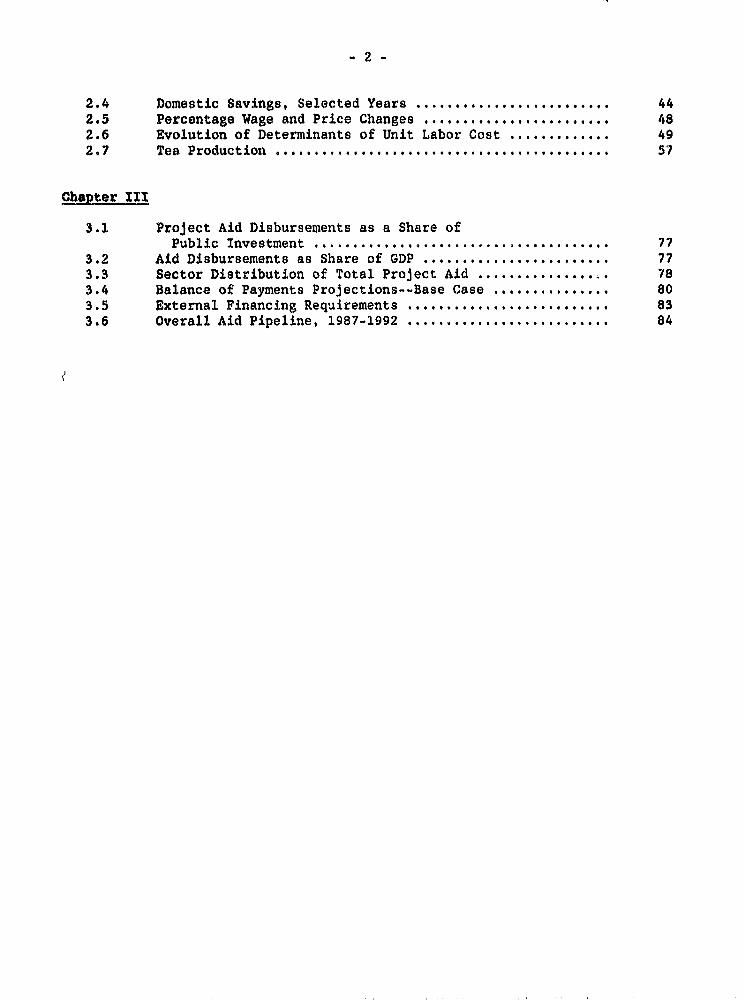
2-
2.4 Domestic Savings, Selected Years ................... .... 442.5 Percentage Wage and Price Changes ....... ......... 482.6 Evolution of Determinants of Unit Labor Cost ............. 492.7 Tea Production ................. .......................... 57
Chapter III
3.1 Project Aid Disbursements as a Share ofPublic Investment ...................................... 77
3.2 Aid Disbursements as Share of GDP ..... ................... 773.3 Sector Distribution of Total Project Aid ............... . . 783.4 Balance of Payments Projections--Base Case . .............. 803.5 External Financing Requirements .......................... 833.6 Overall Aid Pipeline, 1987-1992 ...... .................... 84
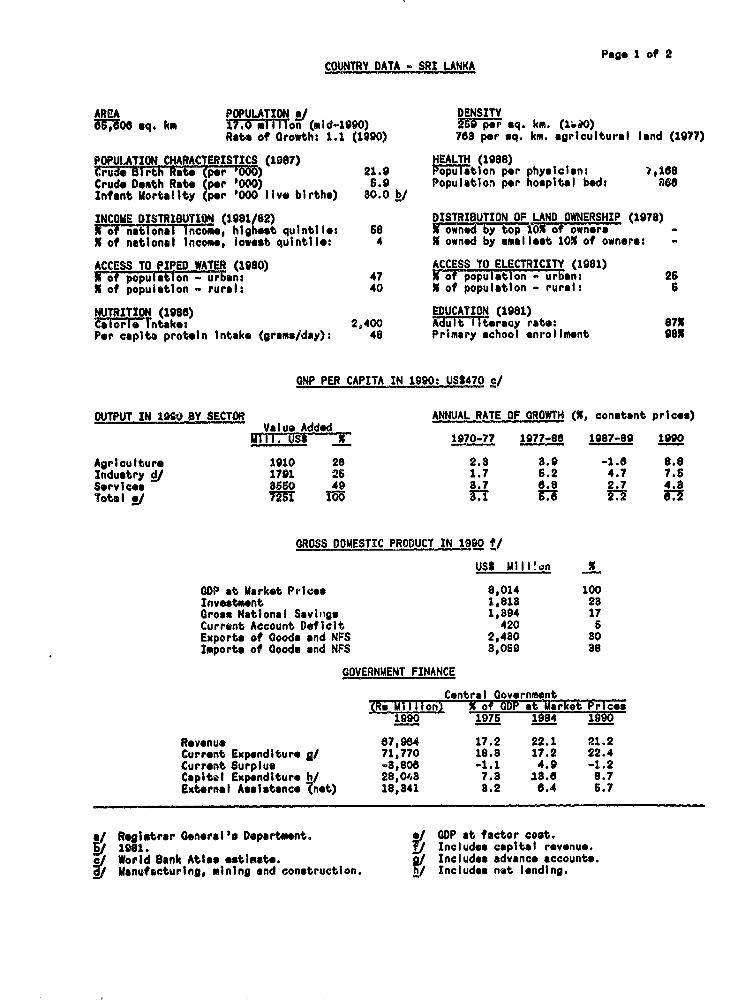
Pago 1 of 2CONTRY DATA SRI LANKA
AREA POPULATION ^/ DENSITYMU;OO sq. km X77rTTITon (mid-1990) 25W per sq. km. (l.i0)
Rate of Growth: 1.1 (1990) 703 per sq. km. agricultural land (1977)
POPULATION CHARACTERISTICS (1987) HEALTH (1988)Crude Birtn Rate (per '000) 21.9 Population per physician: ),168Crud. Death Rat. (per '000) 6.9 Population per ho.pit.l bed: 6seInfant Mortality (per '000 live births) 80.0 b/
INCOME DISTR18UTION (1081/82) DISTRIBUTION OF LAND OWNERSHIP (1978)X of natlonal i come, highest quintilI: 58 X owned by top lox of owners -X of national income, lowest quintile: 4 X owned by smalloot 10 of owners: -
ACCESS TO PIPED WATER (1980) ACCESS TO ELECTRICITY (1981)X-of population - urban: 47 X of population - urban: 26X of populatlon - rural: 40 X of population - rural: 6
NUTRITION (1988) EDUCATION (1981)Calo;-reTntako: 2,400 Adult lteracy rate: 87XPer capita protein Intake (grams/day): 48 Primary school enrollmont 98x
GNP PER CAPITA IN 1990: USU470 c/
OUTPUT IN 1990 BY SECTOR ANNUAL RATE OF GROWTH (X, constant prices)Value Added
Mill. Us$ U 1970-77 1977-86 1987-89 1990
Agriculturo 1910 26 2.8 8.9 -1.8 8.6Industry j/ 1791 26 1.7 6.2 4.7 7.6Services a850 49 3.7 6.8 2.7 4.3Total !/ m .T
GROSS DOMESTIC PRODUCT IN 1990 f/
US$ Mill!,on U
GDP at Market Prices 8,014 100Investment 1,818 23Gross National Savings 1,894 17Current Account Deficit 420 5Exports of Goods and NFS 2,48o 8oImports of Goods and NFS 8,069 38
GOVERNMENT FINANCE
Contral Government(Ru Million) X of GDP at MarketE Pricos
1990 1975 1984 1990
Revenue 67,984 17.2 22.1 21.2Current Expenditure g/ 71,770 18.8 17.2 22.4Current Surplus -3,806 -1.1 4.9 -1.2Capltl Expenditure hl 28,04S 7.3 13.6 8.7External Assist nco (not) 18,841 8.2 6.4 6.7
a Rogistrar General's Department. */ GDP at factor cost./, 1961. / Includes capital revenue.
cl World Bank Atlas estite. / Includes advance accounts.Manufacturlng, mlning and construction. f/ Includes not lending.
Page 2 of 2
COUNTRY DATA SRI LANKA
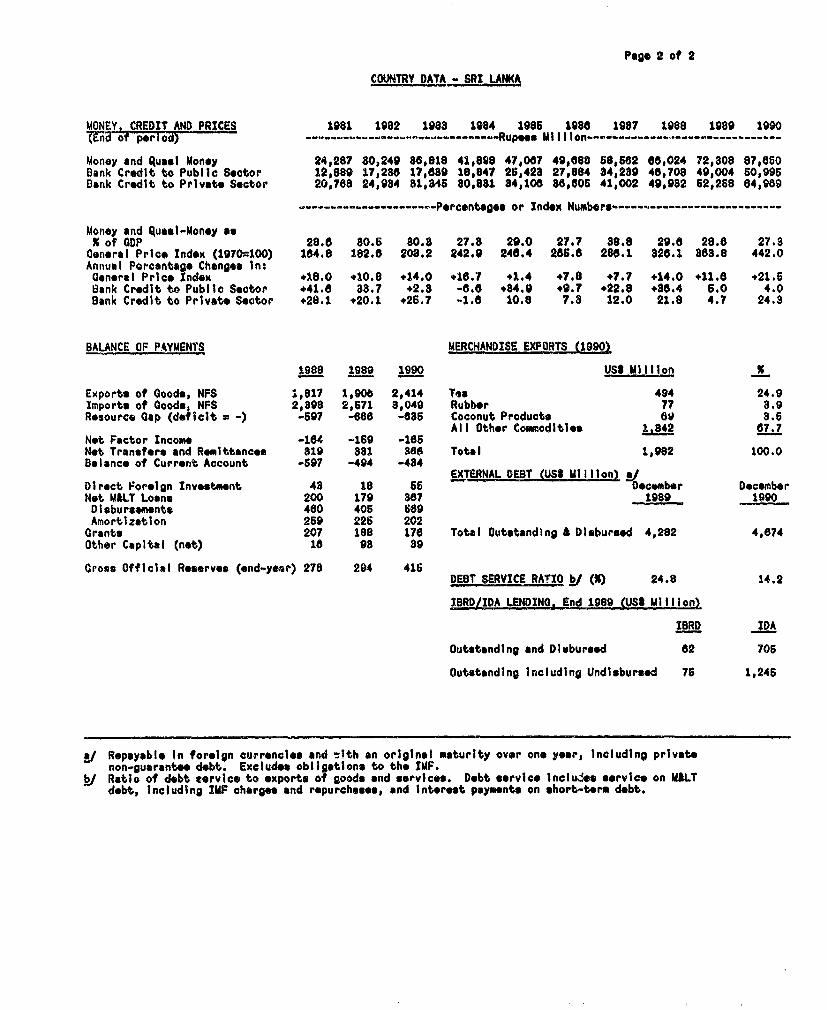
MONEY. CREDIT AND PRICES 1981 1982 1983 1984 1986 198a 1987 1988 1989 1990(End of perioa) - …-- Rupsee Million…------
Money and Qusl Money 24,287 80,249 88,818 41,898 47,087 49,680 68,662 66,024 72,808 87,850Bank Credit to Public Sector 12,889 17,288 17,889 18,847 25,423 27,684 a4,289 48,708 49,004 60,995Dank Credit to Private Sector 20,768 24,934 81,346 80,881 34,108 8a,605 41,002 49,982 62,268 84,989
-Percentage* or Index Numbers-----------------------
Money and Quasi-Money as% of GDP 28.6 80.5 80.3 27.3 29.0 27.7 88.8 29.8 28.6 27.8Oeneral Price Index (1970-100) 164.8 182.6 208.2 242.9 246.4 256.8 288.1 328.1 863.8 442.0Annual Pereantago Changes In:General Price Index .18.0 +10.8 +14.0 e18.7 +1.4 +7.8 +7.7 +14.0 +11.8 +21.5Bank Credit to Public Sector e41.0 38.7 +2.8 -6.8 .84.9 .9.7 +22.8 +86.4 6.0 4.0Bank Credit to Private Soctor +28.1 +20.1 +26.7 -1.8 10.8 7.8 12.0 21.8 4.7 24.3
BALANCE OF PAYMENTS MERCHANDISE EXPORTS (19901
1988 1989 1990 USt Million U
Exports of Goods, NFS 1,817 1,906 2,414 Toa 494 24.9Import. of Goods, NFS 2,898 2,671 3,049 Rubber 77 3.9Resource Gap (deficit m -) -597 -6e8 -685 Coconut Products 68 3.6
All Other Commodities 1.S42 67.7Net Factor Income -164 -169 -1B6Net Transfer* and Romittancos 819 881 386 Total 1,982 100.0Balance of Current. Account -697 -494 -434
EXTERNAL DEBT (US$ Million) /Direct Foreign Invostment 43 18 65 December DecomberNot MALT Loan. 200 179 387 1989 1990Disbursements 460 405 669Amortization 269 225 202Grants 207 188 176 Total Outstanding £ Disbursed 4,282 4,674Other Capital (net) 16 98 89
Gross Official Resorves (end-year) 278 294 416DEBT SERVICE RATIO ki (U) 24.8 14.2
IBRD/IDA LENDING. End 1989 QUS2 Million)
IBRD IDA
Outstanding and Diabursed 82 705
Outstanding Including Undisbursed 76 1,246
ki Repayable in foreign currencles and tith an original maturity over one year, Including privatenon-guarante debt. Excludes obligations to the IMF.
b Ratio of debt tervice to exports of goods and services. Debt service lncludos service on MALTdebt, Including IMF charges and repurchases, and Interest paymnts on short-term debt.
EXECUTIVtI' SMARY
The Setting
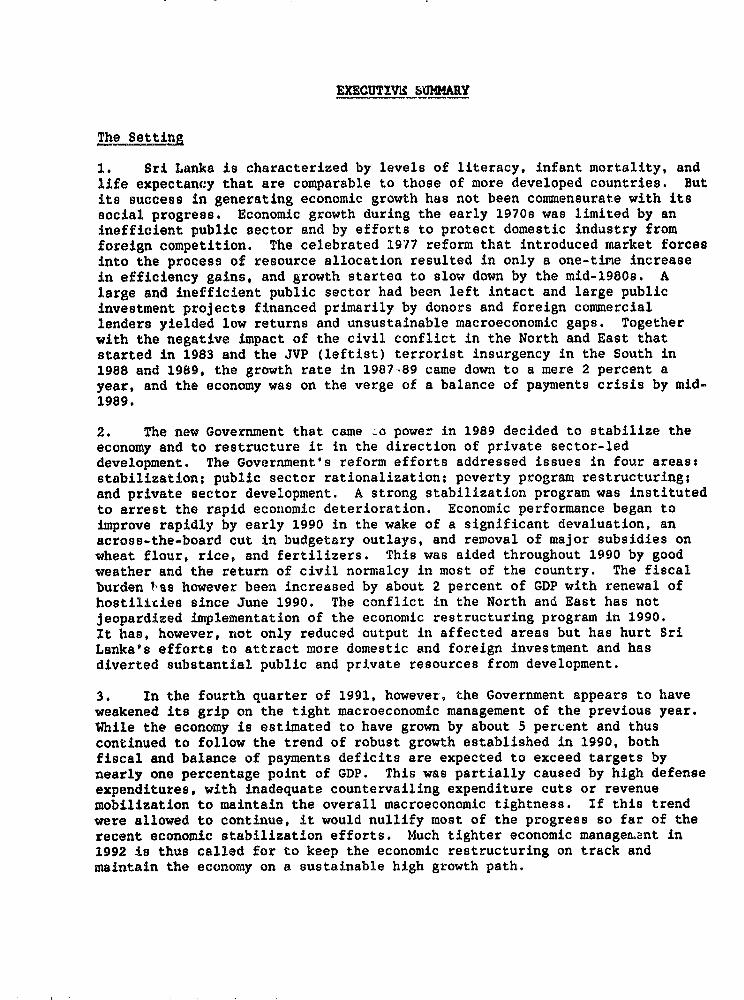
1. Sri Lanka is characterized by levels of literacy, infant mortality, andlife expectancy that are comparable to those of more developed countries. Butits success in generating economic growth has not been commensurate with itssocial progress. Economic growth during the early 1970s was limited by aninefficient public sector and by efforts to protect domestic industry fromforeign competition. The celebrated 1977 reform that introduced market forcesinto the process of resource allocation resulted in only a one-time increasein efficiency gains, and growth startea to slow down by the mid-1980s. Alarge and inefficient public sector had been left intact and large publicinvestment projects financed primarily by donors and foreign commerciallenders yielded low returns and unsustainable macroeconomic gaps. Togetherwith the negative impact of the civil conflict in the North and East thatstarted in 1983 and the JVP (leftist) terrorist insurgency in the South in1988 and 1989, the growth rate in 1987-89 came down to a mere 2 percent ayear, and the economy was on the verge of a balance of payments crisis by mid-1989.
2. The new Government that came .o power in 1989 decided to stabilize theeconomy and to restructure it in the direction of private sector-leddevelopment. The Government's reform efforts addressed issues in four areas:stabilization; public sector rationalization; poverty program restructuring;and private sector development. A strong stabilization program was institutedto arrest the rapid economic deterioration. Economic performance began toimprove rapidly by early 1990 in the wake of a significant devaluation, anacross-the-board cut in budgetary outlays, and removal of major subsidies onwheat flour, rice, and fertilizers. This was aided throughout 1990 by goodweather and the return of civil normalcy in most of the country. The fiscalburden !,as however been increased by about 2 percent of GDP with renewal ofhostilicies since June 1990. The conflict in the North and East has notjeopardized implementation of the economic restructuring program in 1990.It has, however, not only reduced output in affected areas but has hurt SriLanka's efforts to attract more domestic and foreign investment and hasdiverted substantial public and private resources from development.
3. In the fourth quarter of 1991, however, the Government appears to haveweakened its grip on the tight macroeconomic management of the previous year.While the economy is estimated to have grown by about 5 percent and thuscontinued to follow the trend of robust growth established in 1990, bothfiscal and balance of payments deficits are expected to exceed targets bynearly one percentage point of GDP. This was partially caused by high defenseexpenditures, with inadequate countervailing expenditure cuts or revenuemobilization to maintain the overall macroeconomic tightness. If this trendwere allowed to continue, it would nullify most of the progress so far of therecent economic stabilization efforts. Much tighter economic managen.ant in1992 is thus called for to keep the economic restructuring on track andmaintain the economy on a sustainable high growth path.
- ii -
Economic Performance in 1990 and 1991
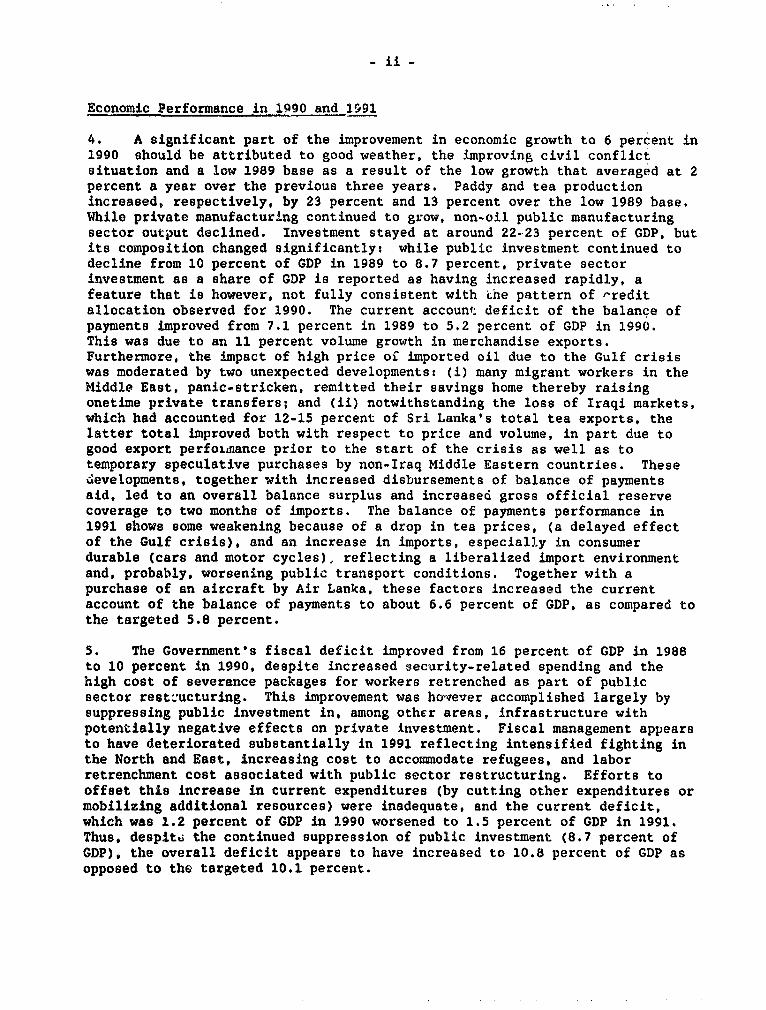
4. A significant part of the improvement in economic growth to 6 percent in1990 should be attributed to good weather, the improving civil conflictsituation and a low 1989 base as a result of the low growth that averaged at 2percent a year over the previous three years. Paddy and tea productionincreased, respectively, by 23 percent and 13 percent over the low 1989 base.While private manufacturing continued to grow, non-oil public manufacturingsector output declined. Investment stayed at around 22-23 percent of GDP, butits composition changed significantly: while public investment continued todecline from 10 percent of GDP in 1989 to 8.7 percent, private sectorinvestment as a share of GDP is reported as having increased rapidly, afeature that is however, not fully consistent with che pattern of -reditallocation observed for 1990. The current account deficit of the balance ofpayments improved from 7.1 percent in 1989 to 5.2 percent of GDP in 1990.This was due to an 11 percent volume growth in merchandise exports.Furthermore, the impact of high price oE imported oil due to the Gulf crisiswas moderated by two unexpected developments: (i) many migrant workers in theMiddle East, panic-stricken, remitted their savings home thereby raisingonetime private transfers; and (ii) notwithstanding the loss of Iraqi markets,which had accounted for 12-15 percent of Sri Lanka's total tea exports, thelatter total improved both with respect to price and volume, in part due togood export perfoLnance prior to the start of the crisis as well as totemporary speculative purchases by non-Iraq Middle Eastern countries. Thesedevelopments, together with increased disbursements of balance of paymentsaid, led to an overall balance surplus and increased gross official reservecoverage to two months of imports. The balance of payments performance in1991 shows some weakening because of a drop in tea prices, (a delayed effectof the Gulf crisis), and an increase in imports, especially in consumerdurable (cars and motor cycles), reflecting a liberalized import environmentand, probably, worsening public transport conditions. Together with apurchase of an aircraft by Air Lanka, these factors increased the currentaccount of the balance of payments to about 6.6 percent of GDP, as compared tothe targeted 5.8 percent.
5. The Government's fiscal deficit improved from 16 percent of GDP in 1988to 10 percent in 1990, despite increased security-related spending and thehigh cost of severance packages for workers retrenched as part of publicsector rest:'ucturing. This improvement was hor.ever accomplished largely bysuppressing public investment in, among other areas, infrastructure withpotentially negative effects on private investment. Fiscal management appearsto have deteriorated substantially in 1991 reflecting intensified fighting inthe North and East, increasing cost to accommodate refugees, and laborretrenchment cost associated with public sector restructuring. Efforts tooffset this increase in current expenditures (by cutting other expenditures ormobilizing additional resources) were inadequate, and the current deficit,which was 1.2 percent of GDP in 1990 worsened to 1.5 percent of GDP in 1991.Thus, despitd the continued suppression of public investment (8.7 percent ofGDP), the overall deficit appears to have increased to 10.8 percent of GDP asopposed to the targeted 10.1 percent.
iii -
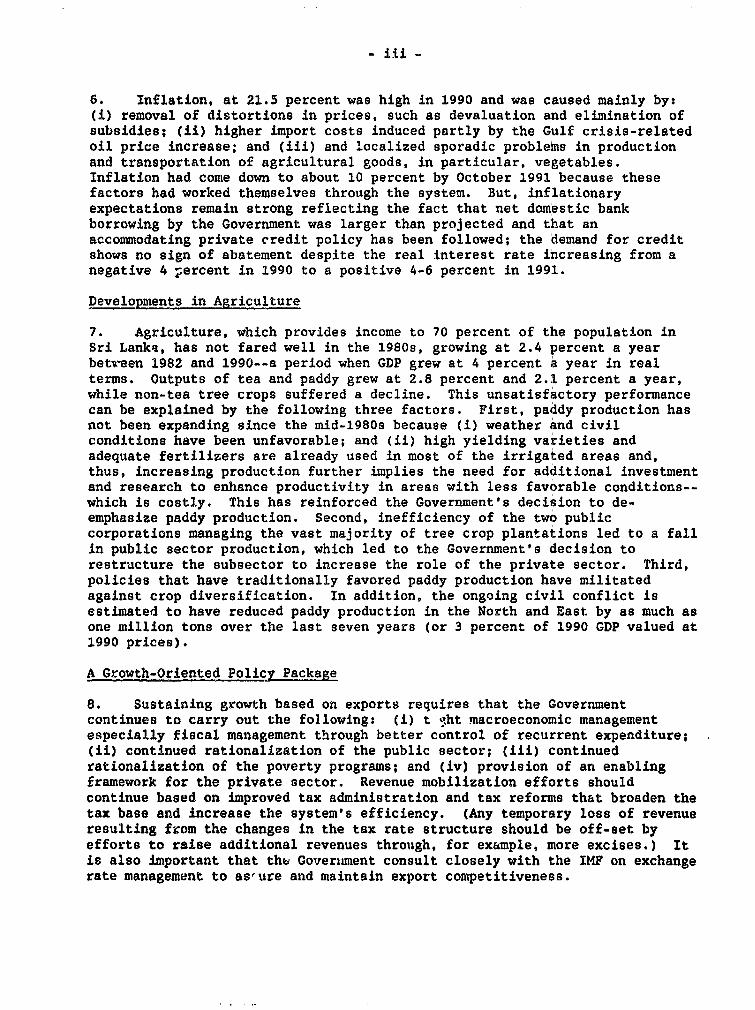
6. Inflation, at 21.5 percent was high in 1990 and was caused mainly by:(i) removal of distortions in prices, such as devaluation and elimination ofsubsidies; (ii) higher import costs induced partly by the Gulf crisis-relatedoil price increase; and (iii) and localized sporadic problems in productionand transportation of agricultural goods, in particular, vegetables.Inflation had come down to about 10 percent by October 1991 because thesefactors had worked themselves through the system. But, inflationaryexpectations remain strong reflecting the fact that net domestic bankborrowing by the Government was larger than projected and that anaccommodating private credit policy has been followed; the demand for creditshows no sign of abatement despite the real interest rate increasing from anegative 4 percent in 1990 to a positive 4-6 percent in 1991.
Developments in Agriculture
7. Agriculture, which provides income to 70 percent of the population inSri Lanka, has not fared well in the 1980s, growing at 2.4 percent a yearbet,reen 1982 and 1990--a period when GDP grew at 4 percent a year in realterms. Outputs of tea and paddy grew at 2.8 percent and 2.1 percent a year,while non-tea tree crops suffered a decline. This unsatisfactory performancecan be explained by the following three factors. First, paddy production hasnot been expanding since the mid-1980s because (i) weather and civilconditions have been unfavorable; and (ii) high yielding varieties andadequate fertilizers are already used in most of the irrigated areas and,thus, increasing production further implies the need for additional investmentand research to enhance productivity in areas with less favorable conditions--which is costly. This has reinforced the Government's decision to de-emphasize paddy production. Second, inefficiency of the two publiccorporations managing the vast majority of tree crop plantations led to a fallin public sector production, which led to the Government's decision torestructure the subsector to increase the role of the private sector. Third,policies that have traditionally favored paddy production have militatedagainst crop diversification. In addition, the ongoing civil conflict isestimated to have reduced paddy production in the North and East by as much asone million tons over the last seven years (or 3 percent of 1990 GDP valued at1990 prices).
A Growth-Oriented Policy Package
8. Sustaining growth based on exports requires that the Governmentcontinues to carry out the following: (i) t %vht macroeconomic managementespecially fiscal management through better control of recurrent expenditure;(ii) continued rationalization of the public sector; (iii) continuedrationalization of the poverty programs; and (iv) provision of an enablingframework for the private sector. Revenue mobilization efforts shouldcontinue based on improved tax administration and tax reforms that broaden thetax base and increase the system's efficiency. (Any temporary loss of revenueresulting from the changes in the tax rate structure should be off-set byefforts to raise additional revenues through, for example, more excises.) Itis also important that the Government consult closely with the IMF on exchangerate management to as,ure and maintain export competitiveness.
- iv -
Resumption of Tight Macroeconomic Management
9. The favorable economic outturn in 1990 and 1991 has allowed cautiousoptimism to emerge regarding the future of Sri Lanka's growth prospects.However, given, that most factors supporting this performance were external toeconomic management, viz., good weather, a relatively stable securitysituation and unexpected positive, albeit temporary, effects of the Gulfcrisis, it is important that optimism not give way to complacency. Indeed thestill good 1991 output performance has been accompanied by weakening effortstowards tight macroeconomic management as both fiscal deficit and balance-of-payments deficit are projected to be higher than targeted; a trend that needsto be reversed as soon as possible. Moreover, the pattern of growth ischaracterized by a number of undesirable features. First, real investment hasstagnated. Public investment has fallen sharply. While private investmenthas been on the rise, there is some evidence to suggest that an increasingshare of it is going towards residential buildings rather than into directlyproductive sectors of the economy. Second, the real effective exchange ratehas appreciated by 20 percent from the fourth quarter of 1989 till July 1991.The erosion of competitiveness during this period reflects a rapid increase inproductivity-adjusted unit labor costs and exchange rate depreciation thatfalls short of domestic inflation. This reinforces the need for coordinatedaction to contain these labor costs as well as, in close consultation with theIMF, on exchange rate management.
10. The low public investment and erosion of external competitiveness maybe traced at least in part, to a shortfall of revenues over currentexpenditures amounving to 1-2 percent of GDP, a situation caused in part byintroduction of additional welfare programs (which need better targeting) andof the substantial wage and salary component of security-related spending.These outlays increased demands for consumption goods, mostly food and somese-:ices. This set of circumstances has weakened incentives for investmentsin the production of exports goods and redirected resources towardsconsumption or investments in activities such as real estate. This phenomenonis borne out by the fact that private sector credits for residential buildingsand consumption increased rapidly in 1990 at 37 percent and 42 percent,respectively. The situation needs to be redressed through changes in policy.To prevent such a tendency from gaining momentum, the Government should aim atattaining a current budget surplus of about 2 percent of GDP within two tothree years through control of current expenditure items such as the publicsector wage bill, transfers to public corporations, the government pensionscheme and leakages from welfare programs to those not truly in need.Somewhat lax macroeconomic management in 2991 must be reversed in 1992 to puteconomic restructuring back on track. In addition, given the difficulty inachieving immediate and adequate fiscal retrenchment, an appropriate mix ofwage policy, aggregate demand policy, and exchange rate policy, should beemployed. At the same time, public resources should be shifted towardinvestment in efficient infrastructure (see para. 18 below).
Public Sector Rationallation
11. The Government has taken various measures to rationalize public sectoractivities to make more room for the private sector and improve overallefficiency. First, the public sector bus company was converted into about 80privatized companies through employee share ownership, (or "peoplization").While this is a step in the right direction, experiences in other countriesshow that this method of privatization often ended up inhibiting the infusioninto the ccmpanies of managerial, financial and technological resources theyneed to compete in the private market. More direct divestiture should beencouraged in the future. Second, an action plan has been prepared toincrease the role of the private sector in managing the important (andcurrently loss-making) state-owned tree-crop plantations through privatemanagement contracts based on fees-for-services and profit sharing. To ensurethe success of this measure, however, it is crucial that there be moreincentive to maximize longer-run profits. Privatization is the preferable wayto accomplish this. Third, the Government has also committed itself toprivatizing all commercially oriented public enterprises and corporations, andso far has divested eleven firms. Fourth, in an effort to achieve the targetof retrenching 25 percent or 80,000-90,000 staff over a four-to-five yearperiod based on the recommendations made by the Administrative ReformCommittee, the Government retrenched about 10 percent or about 40,000 ofcentral and provincial staff in 1990. Lastly, the Government has made theprocess of recruitment and promotion purely merit-based. There are recentindications, however, that the Government's commitment to furtherrationalization of the civil service is weakening; they have difficulties incommitting to further reduction in civil service size.
Poverty Program Restructuring
12. The Government has made considerable efforts to improve the nation'sthree major poverty p.:ograms. They are: the Jana Saviya (poverty alleviation)program (JSP), the fo'd stamp program (FSP), and the Mid-Day Meal Program(HDMP) for school children. All three suffered from inadequate targeting;many more people than the truly poor or those at risk were receiving benefits,causing a drain on the budget and diluting the effectiveness of the programs.While the truly poor in Sri Lanka are estimated at about 20-25 percent of thepopulation, the JSP was initially envisaged to provide substantial incometransfers (close to semi-skilled labor wages) and, in the aggregate, amountingto 20 percent of GDP, to half of the nation's population for two years duringwhich period recipients were supposed to learn skills for employment or self-employment. There was however no mechanism established to monitor whetherthose conditions were being met. The FSP provided food stamps to half thepopulation as well. The MDMP is designed to provide additional food stamps toall school children in the country to supplement children's nutritionalintake.
13. As part of rationalization, the JSP has been staggered over 11 rounds tolessen its fiscal cost, with the beneficiaries screened at the community levelto ensure that only the truly needy get the benefits. In addition, it hasbeen made mandatory that a person from each beneficiary household participate
- vi -
in rural civil works. There is, however, substantial difficulty in monitoringthe progress. For the FSP, restructuring mainly consisted of improvedtargeting: about one million families currently receive stamps as compared to1.9 million families until October 1991. The MDMP is being administered in away that reduces program cost by 20 percent. Nutritional interventions wouldhowever be much more effective if they were targeted towards needy pre-schoolers who are truly nutritionally at risk as well as lactating mothers.While these measures discussed above represent significant improvements of theimplementation design of the three programs, there continue to be strongpolitical pressures in Sri Lanka for welfare programs comprising primarilyconsumption-oriented income transfers.
An Enabling Framework for Privat Investment
14. The macroeconomic policy reforms and public sector restructuringdiscussed above provide a framework within which private investment may bepromoted. They however need to be complemented by a wide range of reforms atthe microeconomic and sectoral levels, four areas of high priority arementioned here although the list is not meant to be exhaustive.
15. An efficiently functioning financial sector is a prerequisite forprivate sector-led growth. Among various policy measures to improve thefinancial sector, highest priority should be attached to addressinginefficiencies in the finiancial institutions, especially the state-ownedentities. The two state-owned banks, Bank of Ceylon and People's Bank, whichown more than 60 percent of the commercial bank assets, but are insolvent wheninternationally accepted provisioning for bad debts is taken, need to berestructured after appropriate provisioning and recapitalization is completed.In particular, the two state-owned banks need to be commercialized to improvethe competitive environment of the sector. Furthermore, the Bank of Ceylonneeds to be privatized in the future. In addition, major functions of theNational Savings Bank, such as supply of funds to the Government, are lessrelevant with the expansion of treasury bill sales and investment by pensionfunds. It is thus recommended that its rural branch structure berationalized, and that if it cannot break even by investing in treasury bills,consideration should be given to its phasing out. In addition, improvedprocedures for classifying and provisioning for bad debts should beeffectively implemented. Debt recovery should be improved through amendingand enforcing the country's debt recovery laws, and establishing a debtrecovery agency.
16. Despite low wages and a strategic location, Sri Lanka remains a marginalrecipient of foreign direct investment: the figure was about US$32 million in1990. While part of this is clearly due to the unsettled civil situation inthe country, uncoordinated policies and the discretionary nature of approvalprocedures have also played their part. The Government has therefore recentlyannounced measures that will open up most of the economy to foreign investmentand allow free remittances to be made even during balance-of-payments crises.At the same time, the institution that approves and assists foreign investorsshould be improved to handle efficiently all kinds of applications whether ornot the investments take place in the Export Processing Zones. In addition,
- vii -
the list of activities that would not get "automatic approval" shouldeventually be limited to only those that relate to national security andhealth hazards. While this approach represents a significant step forward, itis important that the new policies be implemented expeditiously and thatremaining obstacles to foreign investment--such as limited access to domesticcredit--be removed.
17. The Termination of Workmen Act, which effectively takes away theemployer's right to decide on lay-offs and firings of workers, by making ithighly costly to do so is a controversial piece of labor legislation. ThisAct, originally established with the intention of protecting labor, is nowdamaging workers interests in general by giving incentives to employers toreplace labor with capital. Its repeal or, transitionally, announcement of aprocedure for receiving a waiver from its effects is recommended. TheIndustrial Dispute Act already offers an acceptable alternative to theTermination Act. The rest of the economy's complex labor legislation shouldbe reviewed and streamlined.
18. Appropriate infrastructural services lower the cost of private businessand induce private investment. To promote industrial development for exports,a further concentration of production activities in the Greater ColomboMetropolitan Area may be unavoidable, and an appropriate infrastructurestrategy should be built on this assumption. For diversified agriculture withexport orientation, the crucial factors, beyond incentives, will be access tomarkets and market information. Priority areas in this latter regard shouldbe: establishing a well-maintained intercity road network; developingcommercial refrigerated transportation and storage systems; and improvingquality and coverage of the domestic and international telecommunicationsnetwork.
1992 Aid Requirements
19. If the measures discussed above are substantially implemented in thenear future including reversing the deteriorating macroeconomic managementwitnessed in the second half of 1991, and if the civil conflict situationgradually improves, the country is expected to grow at around 5-6 percent ayear in the medium-term future, with a current account deficit of around 5.8-5.9 percent of GDP. This current account deficit, together with amortizationand other foreign exchange needs, would bring total foreign financingrequirements to about US$1 billion a year. Taking into consideration netprivate flows and net purchases from the IMF, annual foreign aid flows wouldneed to be about US$790 million in 1992. Project aid requirements in 1992 areexpected to be about US$530 million, of which US$500 million is expected to bedisbursed from the existing project pipeline. Furthermore, disbursements ofnon-project aid from the existing pipeline would be US$190 million. Theremaining gap of US$100 million needs therefore to be filled by commitments ofproject aid amounting to about US$630 million and quick-disbursing balance-of-payment assistance of approximately US$170 million in 1992. Again, it isimportant to emphasize that if the momentum for policy reforms is notmaintained, the rationale for this level of high donor assistance will besubstantially weakened. In particular, without the re-establishment of
- viii -
disciplined and tight fiscal management within 1992, balance-of-paymentssupport could allow maintenance of unsustainable external current account andfiscal deficits.
CHAPTER IR REVIEW OF RECENT ECONOMIC PERFORMANCE
1. Economic Performance in 1990 and 1991
a) Background
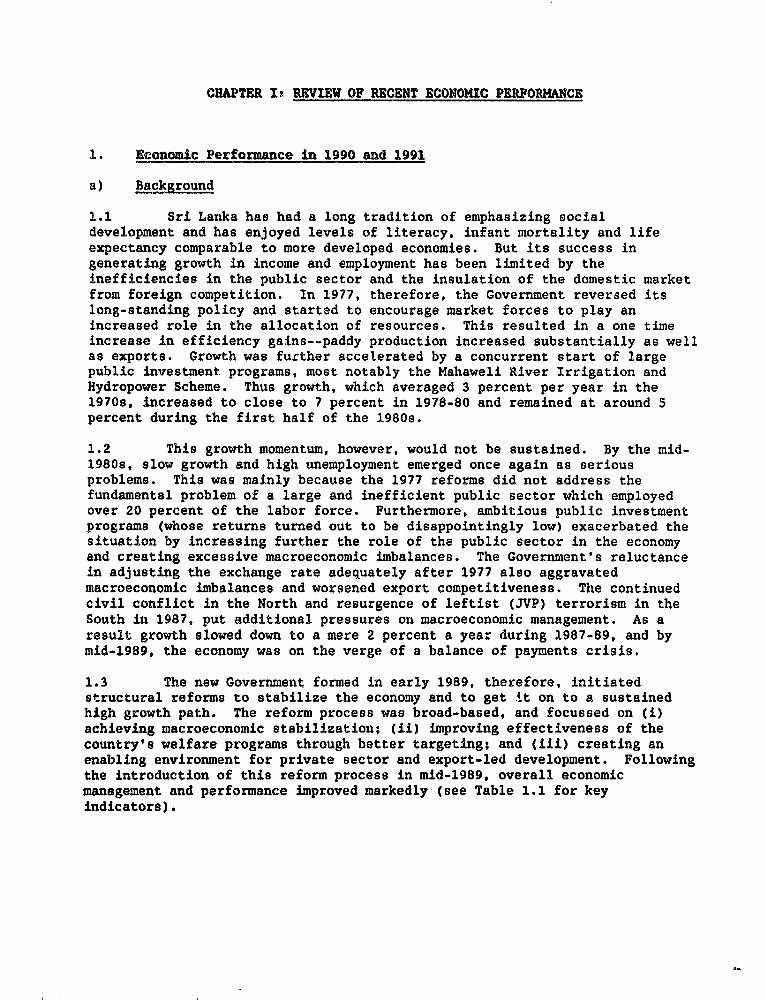
1.1 Sri Lanka has had a long tradition of emphasizing socialdevelopment and has enjoyed levels of literacy, infant mortality and lifeexpectancy comparable to more developed economies. But its success ingenerating growth in income and employment has been limited by theinefficiencies in the public sector and the insulation of the domestic marketfrom foreign competition. In 1977, therefore, the Government reversed itslong-standing policy and started to encourage market forces to play anincreased role in the allocation of resources. This resulted in a one timeincrease in efficiency gains--paddy production increased substantially as wellas exports. Growth was further accelerated by a concurrent start of largepublic investment programs, most notably the Mahaweli River Irrigation andHydropower Scheme. Thus growth, which averaged 3 percent per year in the19709, increased to close to 7 percent in 1978-80 and remained at around 5percent during the first half of the 19809.
1.2 This growth momentum, however, would not be sustained. By the mid-1980s, slow growth and high unemployment emerged once again as seriousproblems. This was mainly because the 1977 reforms did not address thefundamental problem of a large and inefficient public sector which employedover 20 percent of the labor force. Furthermore, ambitious public investmentprograms (whose returns turned out to be disappointingly low) exacerbated thesituation by increasing further the role of the public sector in the economyand creating excessive macroeconomic imbalances. The Government's reluctancein adjusting the exchange rate adequately after 1977 also aggravatedmacroeconomic imbalances and worsened export competitiveness. The continuedcivil conflict in the North and resurgence of leftist (JVP) terrorism in theSouth in 1987, put additional pressures on macroeconomic management. As aresult growth slowed down to a mere 2 percent a year during 1987-89, and bymid-1989, the economy was on the verge of a balance of payments crisis.
1.3 The new Government formed in early 1989, therefore, initiatedstructural reforms to stabilize the economy and to get it on to a sustainedhigh growth path. The reform process was broad-based, and focussed on (i)achieving macroeconomic stabilization; (ii) improving effectiveness of thecountry's welfare programs through better targeting; and (iii) creating anenabling environment for private sector and export-led development. Followingthe introduction of this reform process in mid-1989, overall economicmanagement and performance improved markedly (see Table 1.1 for keyindicators).
-2-
Table 1.1: KEY ECONOMIC VARIABES 1904-990
Incentive Indlcators 1984 1986 1988 1987 1988 1989 1990 1991
1 Exchance Rot;1.1 NominI-A crig h Exchnge Rate (R/US$) 26.4 27.2 28.0 29.4 81.8 88.0 40.1 42 0 2/1.2 Real Effecive Exchange Rote h (1980=100) 124.8 118.7 108.9 93.0 90.9 88.1 87.7 92.6 R/1.3 Annual Change In 1.2 11.2 -8.5 -11.0 -10.6 -2.3 -5.2 1.8 6.6 2/
2. Real Interest Rat.2.1 12 month deposlt -3.9 12.9 6.2 2.6 -2.3 1.6 -3.0 4.0 9/2.2 Commercial lending 0.2 19.4 12.3 10.5 4.2 6.9 -4.0 6.0 3/2.3 Treasury Bills (3 months) -2.8 10.7 3.1 3.8 6.1 5.9 -8.6 e.o I/
3. Index of Real Wage* (D*c. 1978=100)3.1 Minimum Wages 99.5 105.9 104.5 102.6 108.7 112.8 108.4 109.5 3/3.2 Government Wage. 108.8 121.2 117.6 109.1 125.4 121.9 113.2 114.4 3/
4. Incentive for Agricultural Production4.1 Rice (Produc*r price/international price) 104.8 112.7 126.7 104.3 71.1 70.8 111.2 -4.2 Tea Producers (Profit Rate [%]) 85.2 0.3 -18.9 -0.9 -6.8 4.7 17.5 -
External Trade Indicators
S. Volume Index of Major Exports (1980-100)5.1 Tea 110.6 107.2 112.6 108.9 119.0 110.6 112.6 115.55.2 Rubber 104.3 99.3 90.9 87.6 82.1 71.1 80.8 72.65.3 Coconut 138.8 390.5 481.6 224.7 93.6 238.6 307.7 227.65.4 Gorments 807.1 396.2 413.6 459.8 480.8 513.6 613.4 784.46.5 Goms 743.8 976.7 1456.1 1960.4 e882.0 6178.1 7298.8 6177.2
8 Export Shares In World Trade8.1 Tea 21.7 20.7 21.3 20.6 20.8 18.0 - -
7. Non-traditlonal ExDortt7.1 RlF roWth (Xy-- - 7.6 -10.0 11.0 3.1 13.6 17.0 12.17.2 Share In total exports 44.8 63.1 60.4 68.5 64.0 66.7 68.9 73.4
8 Commodity Terms of Trad.8.1 Index (I980=7100) 148.6 116.6 107.0 110.7 100.6 94.7 93.9 -8.2 Annual Changes - -22.2 -7.4 3.4 -9.1 -5.9 -0.8 -
1/ Increase meane real appreclaElon.2/ As of July 1991.3/ Three quarters only.
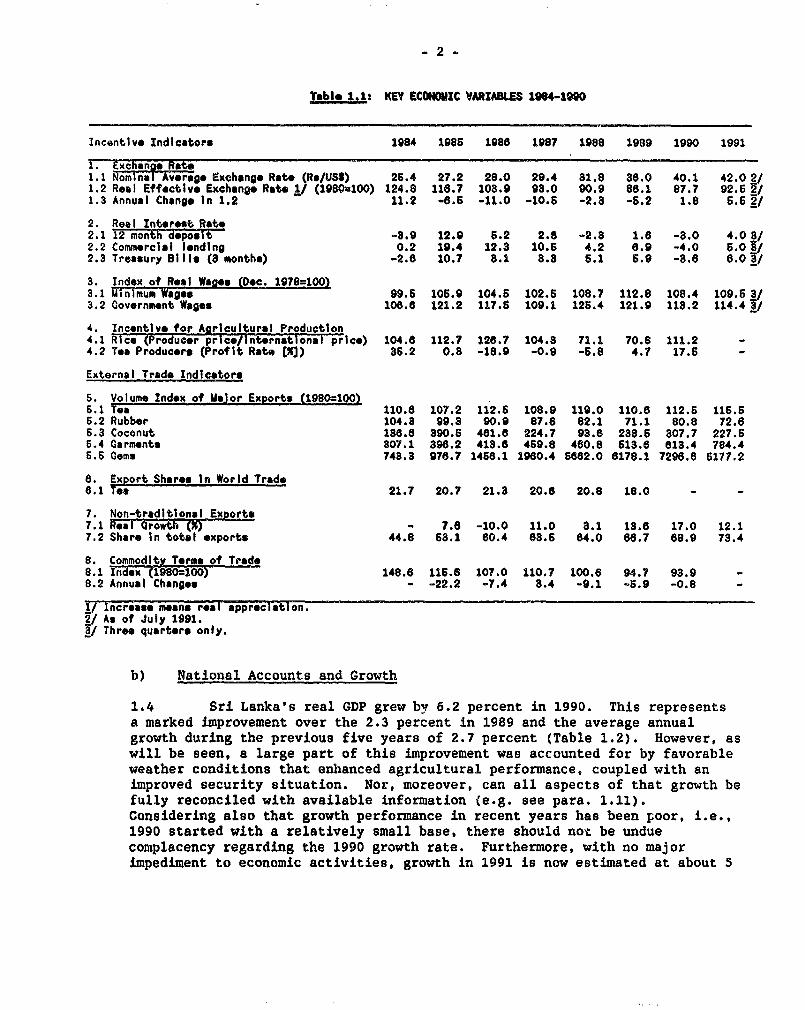
b) National Accounts and Growth
1.4 Sri Lanka's real GDP grew by 6.2 percent in 1990. This representsa marked improvement over the 2.3 percent in 1989 and the average annualgrowth during the previous five years of 2.7 percent (Table 1.2). However, aswill be seen, a large part of this improvement was accounted for by favorableweather conditions that enhanced agricultural performance, coupled with animproved security situation. Nor, moreover, can all aspects of that growth befully reconciled with available information (e.g. see para. 1.11).Considering also that growth performance in recent years has been poor, i.e.,1990 started with a relatively small base, there should not be unduecomplacency regarding the 1990 growth rate. Furthermore, with no majorimpediment to economic activities, growth in 1991 is now estimated at about 5
-3-
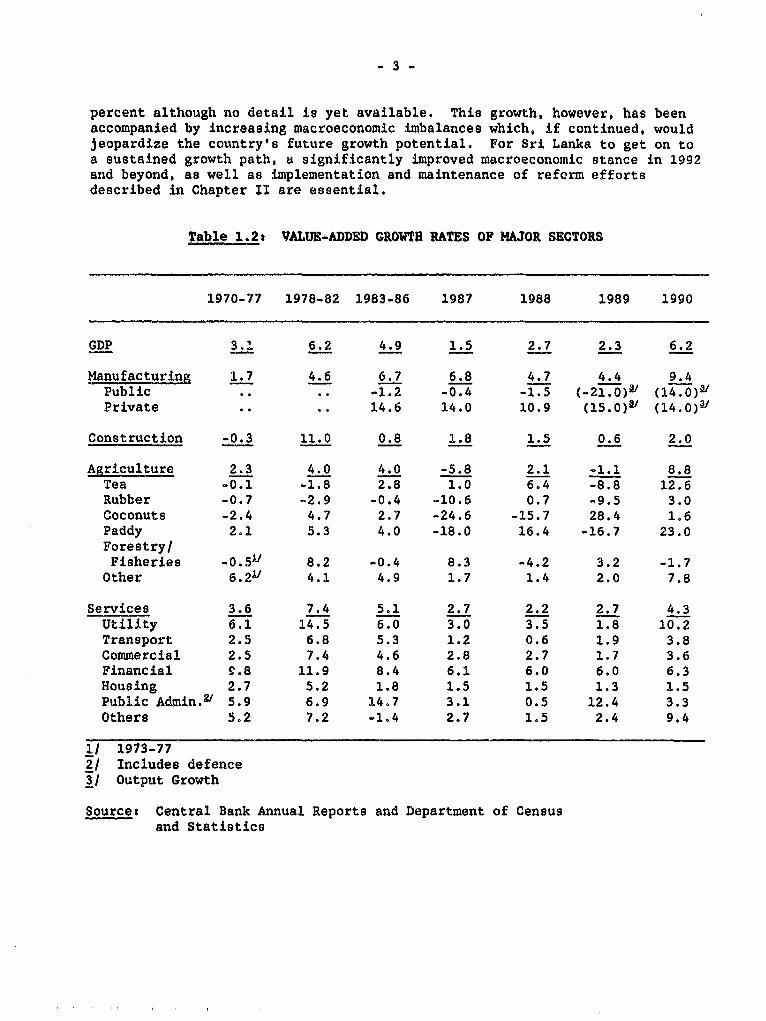
percent although no detail is yet available. This growth, however, has beenaccompanied by increasing macroeconomic imbalances which, if continued, wouldjeopardize the country's future growth potential. For Sri Lanka to get on toa sustained growth path, a significantly improved macroeconomic stance in 1992and beyond, as well as implementation and maintenance of referm effortsdescribed in Chapter II are essential.
Table 1.2: VALUE-ADDED GRO'WTH RATES OF MAJOR SECTORS
1970-77 1978-82 1983-86 1987 1988 1989 1990
GDP 3.1 6.2 4.9 1.5 2.7 2.3 6.2
Manufacturing 1.7 4.6 6.7 6.8 4.7 4.4 9.4Public .. .. -1.2 -0.4 -1.5 (-21.0)9/ (14.0)?JPrivate .. .. 14.6 14.0 10.9 (15 .0 )v (14.0)2
Construction -0.3 11.0 0.8 1.8 1.5 0.6 2.0
Agriculture 2.3 4.0 4.0 -5.8 2.1 -1.1 8.8Tea -0.1 -1.8 2.8 1.0 6.4 -8.8 12.6Rubber -0.7 -2.9 -0.4 -10.6 0.7 -9.5 3.0Coconuts -2.4 4.7 2.7 -24.6 -15.7 28.4 1.6Paddy 2.1 5.3 4.0 -18.0 16.4 -16.7 23.0Forestry/Fisheries -0.51 8.2 -0.4 8.3 -4.2 3.2 -1.7
Other 6.211 4.1 4.9 1.7 1.4 2.0 7.8
Services 3.6 7.4 5.1 2.7 2.2 2.7 4.3Utility 6.1 14.5 6.0 3.0 3.5 1.8 10.2Transport 2.5 6.8 5.3 1.2 0.6 1.9 3.8Commercial 2.5 7.4 4.6 2.8 2.7 1.7 3.6Financial S.8 11.9 8.4 6.1 6.0 6.0 6.3Housing 2.7 5.2 1.8 1.5 1.5 1.3 1.5Public Admin.V 5.9 6.9 14.7 3.1 0.5 12.4 3.3Others 5.2 7.2 -1.4 2.7 1.5 2.4 9.4
1/ 1973-772/ Includes defence3/ Output Growth
Source: Central Bank Annual Reports and Department of Censusand Statistics
-4-
1. Growth Performance in 1990
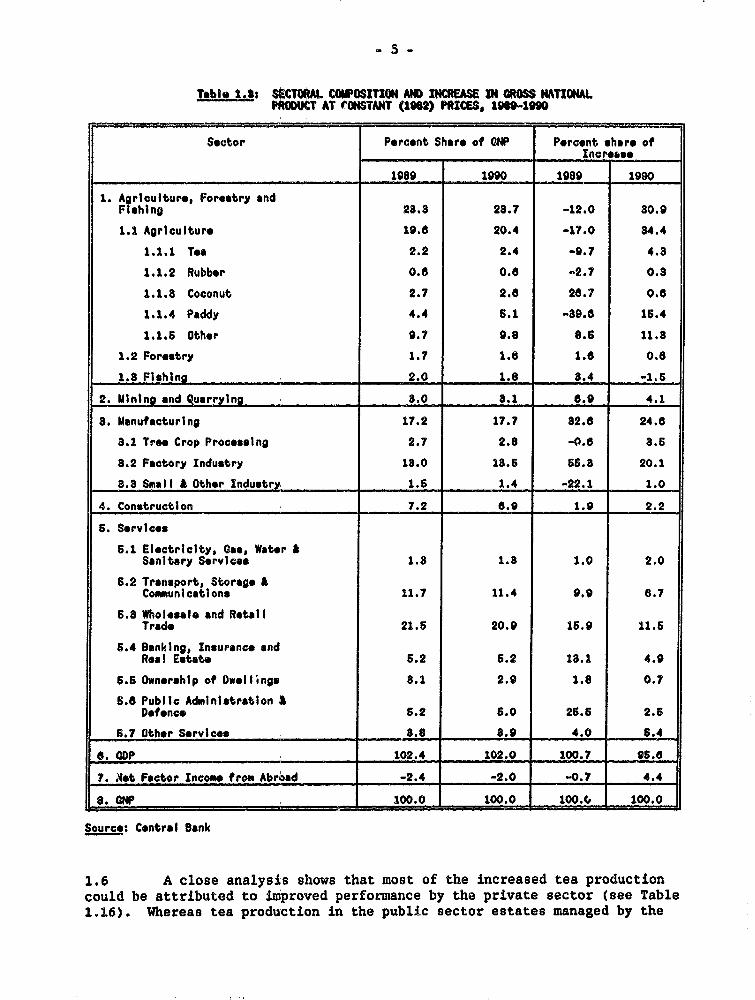
1.5 Agriculture. Agriculture accounts for a significant part of theaccelerated growth in 1990. As Table 1.3 illustrates, over a third of theincrease in GNP in 1990 could be accounted for by increased agriculturalproduction, and about half of this can be attributed to the 23 percent growthin paddy output over a poor 1989 base. This high paddy growth was due to asubstantial expansion in the area sown and harvested. The average yield,however, increased only marginally. Minor food crop production alsocontributed to the high sector growth by recording an increase of 8 percentover its 1989 level. In addition, tea production in 1990 reached its highestrecorded level and its value added in real terms increased by 12.6 percentover its 1989 level. The other two tree crops, namely, rubber and coconut,grew marginally in 1990 (3.0 percent and 1.6 percent, respectively).
able1-.3Ss SECTORAL COMPOSITION Am INCREASE IN GROSS NATIONALPRODUCT AT EONSTANT (1OU) PRICES, 1999-bO
Sector Percent Share of ONP Percent share of____________ _________ Increse,
1989 1990 1989 1990
1. A riculture, Forestry andFishing 23.8 28.7 -12.0 30.9
1.1 Agriculture 19.6 20.4 -17.0 84.4
1.1.1 Tea 2.2 2.4 -9.7 4.8
1.1.2 Rubber 0.6 0.6 -2.7 0.3
1.1.8 Coconut 2.7 2.8 28.7 0.6
1.1.4 Paddy 4.4 S 1 -39.8 16.4
1.1.6 Other 9.7 9.8 8.6 11.3
1.2 Forestry 1.7 1.6 1.6 0.6
1.8 Fishing 2.0 1.8 3.4 -1l5
2. Mining and Quarrying 8.0 8. 1 8.9 4.1
a. Manufacturing 17.2 17.7 82.6 24.6
3.1 Tre Crop Processlng 2.7 2.8 -0.6 3.6
8.2 Factory Industry 13.0 13.5 65.3 20.1
3.8 Small A Other Industry 1.5 1.4 -22.1 1.0
4. Construction 7.2 8.9 1.9 2.2
5 Services
5.1 Electricity, Gas, Water ASanitary Serviceo 1.3 1.3 1.0 2.0
6.2 Transport, Storage ACommunications 11.7 11.4 9.9 6.7
6.8 Wholesale and RetallTrade 21.5 20.9 16.9 11.5
6.4 Banking, Insurance andReal Estate 6.2 5.2 18.1 4.9
6.5 Ownership of Dwellings 3.1 2.9 1.8 0.7
5.8 Public Administrstlon ADefence 5.2 5.0 26.5 2.6
6.? Other Services 8.8 8.9 4.0 5.4
6. CDP 102.4 102.0 100.7 95.6
7. Ut Factor Income from Abroad -2.4 -2.0 -0.7 4.4
8. OMP 100.0 100.0 100.C 100.0
Soure: Central Bank
1.6 A close analysis shows that most of the increased tea productioncould be attributed to improved performance by the private sector (see Table1.16). Whereas tea production in the public sector estates managed by the
-6-
Janatha Estates Development Board (JEDB) and the Sri Lanka State PlantationsCorporation (SLSPC) grew by 4 percent and 5 percent respectively, teaproduction in the private sector rose by 27 percent. This was partly due tothe fact that 1989 was a particularly bad year for private sector teaproducers, many of whom are in the Southern Province and cultivate low grownvarieties; the South was especially affected by the JVP insurgency in 1989(paras. 1.52-1.53) and by adverse weather conditions that damaged mostly low-grown varieties in the same year.
1.7 The Manufacturing and Other Industrial Sectors. Another sectorthat contributed to enhanced 1990 growth was manufacturing which grew by 9.4percent. As Table 1.3 illustrates, a quarter of the increase in GNP in 1990could be accounted for by this sector. The industrial sub-categories whichrecorded the largest increases in value added during the year were chemicals,petroleum and plastic products (25 percent), fabricated metal products,machinery and transport equipment (12 percent), textiles, apparel and leatherproducts (10 percent) and food, beverages and tobacco (8 percent). Accordingto the Central Bank, both public and private sector industrial output grew by14 percent. However, a large part of this was due to increased output ofpetroleum products (especially that of the Ceylon Petroleum Corporation due tothe high output to build up oil reserves amidst the Gulf crisis and to a lowbase of 1989 when the refinery had to stop operation for five weeks formaintenance purposes). When the value of petroleum products output isexcluded, overall industrial production increased by only 7 percent, andproduction in the public manufacturing sector declined by 21 percent in 1990.Part of this decline is due to the transfer if ownership of two large publicsector textile mills to the private sector which resulted in a 45 percentreduction in the output of Textile Corporation.
1.8 The construction sector expanded by a modest 2 percent in 1990,(compared to a growth of 0.6 percent in the preceding year) reflectingsluggish construction-intensive public investment (which declined in realterms by close to 30 percent) although the sector received some boost fromincreasing residential housing investment. Value added in the mining andquarrying sector rose by 9.1 percent in 1990 largely due to an expansion ofgem mining. Some other mining activities, however, suffered a decline inoutput due to the renewed fighting in the North and East.
1.9 The Services Sector. Like the agriculture sector, the servicessector accounted for one third of the total increase in GDP during 1990.Increased production in the agricultural and manufacturing sectors stimulatedgrowth in the transport, trade, banking, insurance and real estate services.Underlying this was the improved security situation in the country, a majorfactor in the recovery in tourism (covered in the "other services"sub-category). Tourist arrivals in 1990 recorded an increase of 62 percentover those of 1989.
-7-
2. Savings and Investment
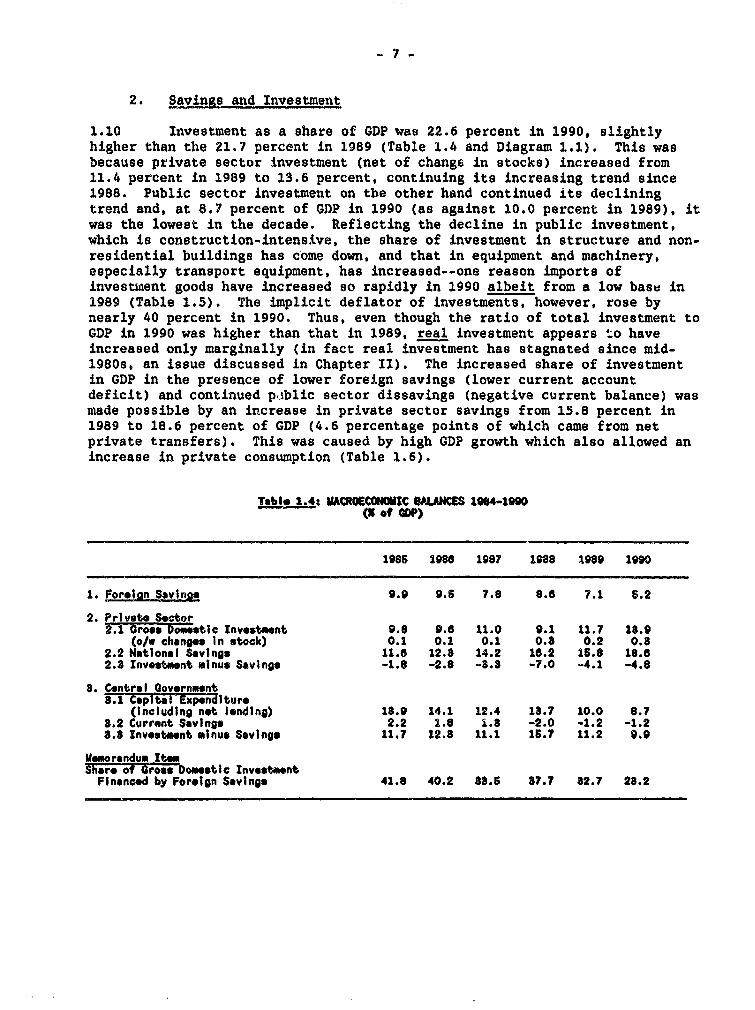
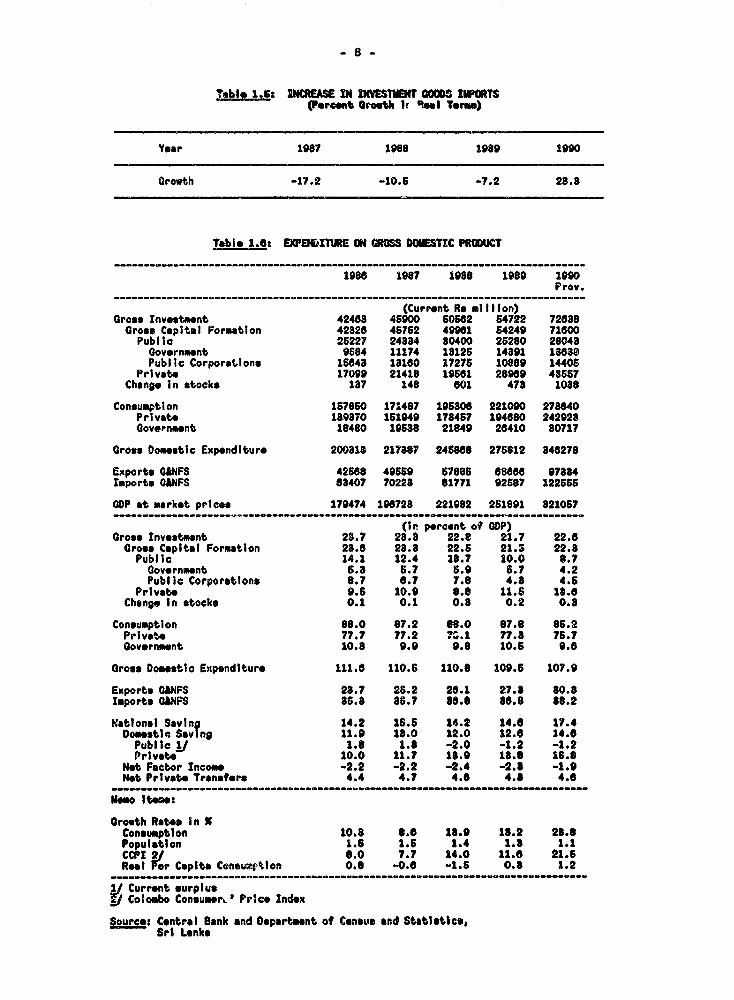
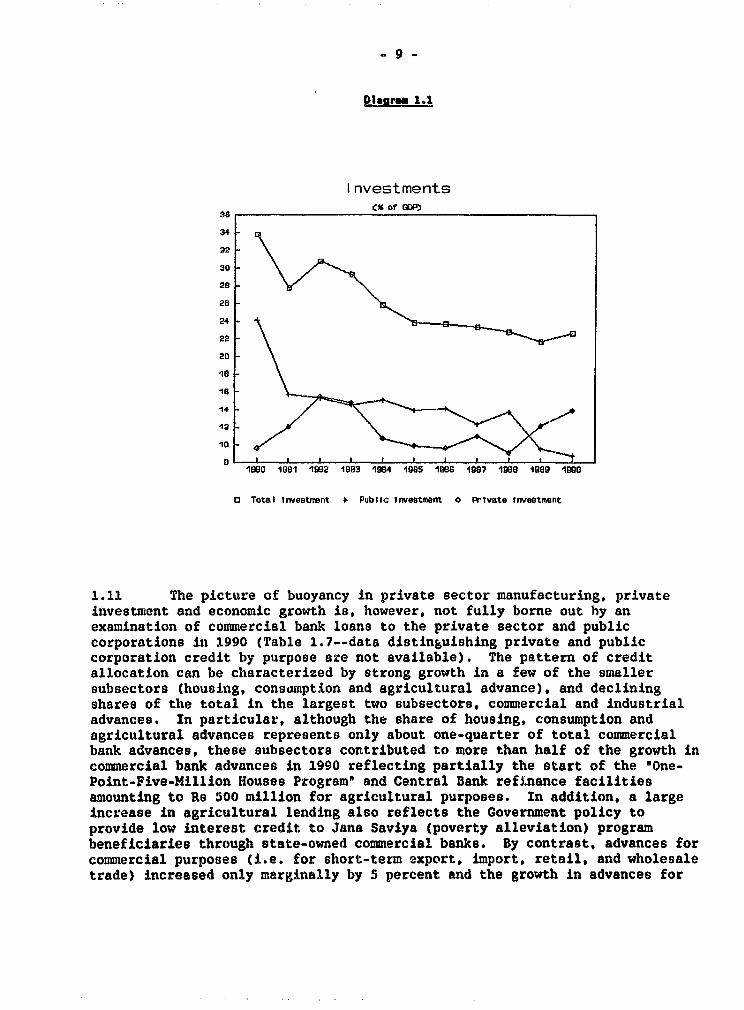
1.10 Investment as a share of GDP was 22.6 percent in 1990, slightlyhigher than the 21.7 percent in 1989 (Table 1.4 and Diagram 1.1). This wasbecause private sector investment (net of change in stocks) increased from11.4 percent in 1989 to 13.6 percent, continuing its increasing trend since1988. Public sector investment on the other hand continued its decliningtrend and, at 8.7 percent of GDP in 1990 (as against 10.0 percent in 1989), itwas the lowest in the decade. Reflecting the decline in public investment,which is construction-intensive, the share of investment in structure and non-residential buildings has come down, and that in equipment and machinery,especially transport equipment, has increased--one reason imports ofinvestinent goods have increased so rapidly in 1990 albeit from a low base in1989 (Table 1.5). The implicit deflator of investments, however, rose bynearly 40 percent in 1990. Thus, even though the ratio of total investment toGDP in 1990 was higher than that in 1989, real investment appears to haveincreased only marginally (in fact real investment has stagnated since mid-1980s, an issue discussed in Chapter II). The increased share of investmentin GDP in the presence of lower foreign savings (lower current accountdeficit) and continued p.Ablic sector dissavings (negative current balance) wasmade possible by an increase in private sector savings from 15.8 percent in1989 to 18.6 percent of GDP (4.6 percentage points of which came from netprivate transfers). This was caused by high GDP growth which also allowed anincrease in private consumption (Table 1.6).
Table 1.4s MACROENOMC 8ALANCOS 1864-1990-- ( of GDP)
19o5 1986 1987 1988 1989 1990
1. Forgian Savings 9.9 9.5 7.8 8.6 7.1 6.2
2. Private Sector2.1 Grove Doss tIc Investment 9.8 9.6 11.0 9.1 11.7 1.9
(o/w changes In stock) 0.1 0.1 0.1 0.8 0.2 0.82.2 National Savings 11.6 12.8 14.2 16.2 15. 8 18.62.8 Investment minus Saving. -1.8 -2.8 -3.8 -7.0 -4.1 -4.8
8. Central Government8.1 Capital Expenditure
(including not lending) 18.9 14.1 12.4 18.7 10.0 8.78.2 Current Savings 2.2 1.8 1.8 -2.0 -1.2 -1.28.8 Investment minus Savings 11.7 12.8 11.1 16.7 11.2 9.9
Memorandum ItemShare of arose Doometic investmentFinanced by Foreign Savings 41.8 40.2 38.6 87.7 82.7 28.2
-8-
Table 1.5S INCREASE IN DINESTMFI C00WS0 IPORTS(Percent Growth Ir R l Term)
Year 1987 1988 1989 1990
Growth -17.2 -10.6 -7.2 28.8
Table 1.6: EXPENDZTURE ON OSS DCIESTIC PRODUCT
------------------------------------------------------------ __---------------__-
1986 1987 1988 1989 1990Prov.
------------------------------------------------------------------ __---------__-
(Current Re mlillon)Gross Invostment 42463 45900 50582 64722 72638
Gross Capital Formation 42826 4S762 49961 54249 71600Public 25227 24384 80400 26280 28048
Government 9684 11174 18126 14391 13688Public Corporations 16848 1816o 17276 10889 14406
Private 17099 21418 19681 28989 48657Change In stocks 137 148 601 478 1038
Consumption 157860 171487 195306 221090 273840Private 189370 161949 178457 194680 242928Government 18480 19388 21849 26410 80717
Grosv Domestic Expenditure 200818 217387 245868 276812 346278
Exports CO4FS 42688 49569 67885 6886s 97884Imports G1NFS 63407 70228 81771 92587 122565
GDP at market prices 179474 190728 221982 261891 821057
(in percent ot GDP)Gross Investment 28.7 28.8 22.e 21.7 22.6Gross Capital Formation 28.6 28.8 22.5 21.S 22.8Public 14.1 12.4 18.7 10.0 8.7Governmnt 5.8 6.7 6.9 5.7 4.2Public Corporatlons 8.7 6.7 7.8 4.8 4.6
Private 9.6 10.9 8.8 11.6 18.6Change In stocks 0.1 0.1 0.8 0.2 0.8
Consumption 88.0 67.2 68.0 87.8 85.2PrIvate 77.7 77.2 7v.1 77.8 76.7Government 10.8 9.9 9.8 10.6 9.6
Gross Domstlc Expenditure 111.6 110.6 110.8 109.6 107.9
Exports QihFS 28.7 26.2 26.1 27.8 80.8Imports GMNFS 86.8 86.7 #8.6 88.8 88.2
Natlonal Saving 14.2 1656 14.2 14.6 17.4Domestl Saving 11.9 18.0 12.0 12.6 14.6Public 1/ 1.6 1.8 -2.0 -1.2 -1.2Privat 10.0 11.7 18.0 18.8 16.8
Net Factor Income -2.2 -2.2 -2.4 -2.8 -1.9Not Private Transter* 4.4 4.7 4.6 4.8 4.6
Memo Iteo:
Orowth Rates In XConsumption 10.8 8.6 18.9 18.2 28.8Population 1.6 1.5 1.4 1.8 1.1CCPI 2/ 6.0 7.7 14.0 11.6 21.6Real For Capita Con**ition 0.8 -0.6 -1.6 0.8 1.2
1 Current surplusV Colombo ConsumerO Price Index
Source: Central fank and Doparteent ot Census and Statistics,Sri Lanka
-9-
Diagram 1.1
I nvestmentsCM of GD3
S8_
34
32
30
28
28
24
22
20
la
14
12
10
1980 1981 1982 1983 1984 1G9S 1986 1987 1988 1989 1W90
a Toteai tnvesetrert 1 Pubitc Investment o PrTvate Investment
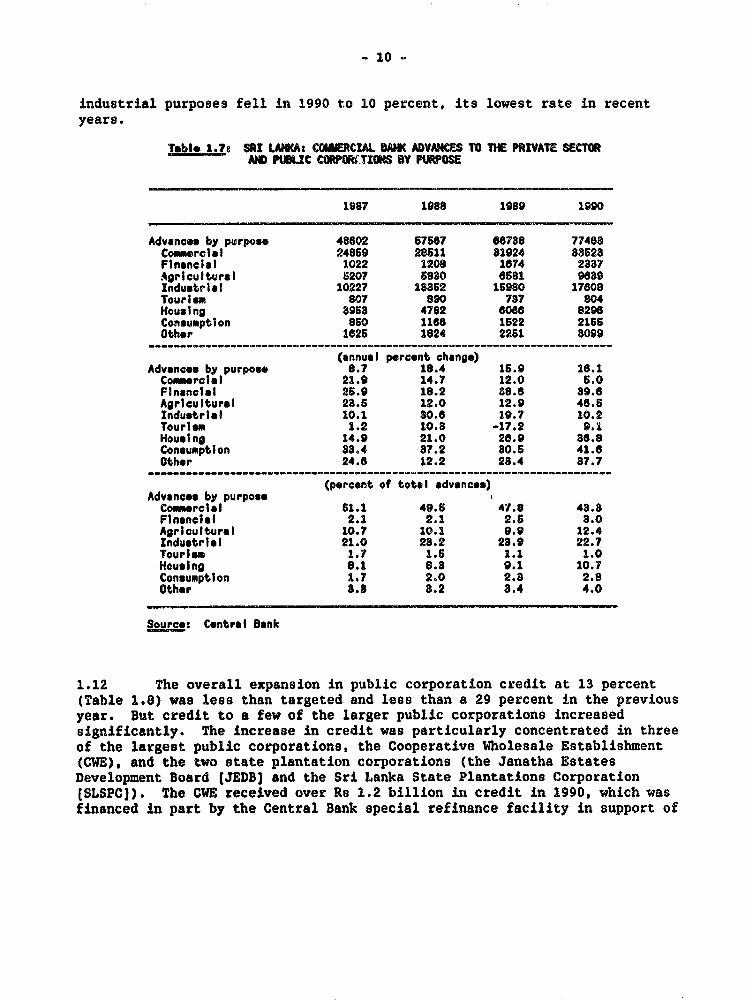
1.11 The picture of buoyancy in private sector manufacturing, privateinvestment and economic growth is, however, not fully borne out by anexamination of commercial bank loans to the private sector and publiccorporations in 1990 (Table 1.7--data distinguishing private and publiccorporation credit by purpose are not available). The pattern of creditallocation can be characterized by strong growth in a few of the smallersubsectors (housing, consamption and agricultural advance), and decliningshares of the total in the largest two subsectors, commercial and industrialadvances. In particular, although the share of housing, consumption andagricultural advances represents only about one-quarter of total commercialbank advances, these subsectors contributed to more than half of the growth incommercial bank advances in 1990 reflecting partially the start of the "One-Point-Five-Million Houses Program" and Central Bank refinance facilitiesamounting to Re 500 million for agricultural purposes. In addition, a largeincrease in agricultural lending also reflects the Government policy toprovide low interest credit to Jana Saviya (poverty alleviation) programbeneficiaries through state-owned commercial banks. By contrast, advances forcommercial purposes (i.e. for short-tenm export, import, retail, and wholesaletrade) increased only marginally by 5 percent and the growth in advances for
- 10
industrial purposes fell in 1990 to 10 percent, its lowest rate in recentyears.
Table 1.7s SRI LACA: COMMERCIAL BMI ADVANCES TOTHE PRIVATE SECTORAND PUBLC CORPTXONS BY PURPOSE
1987 1988 1989 1990
Advances by purpose 48602 67687 68788 77408Coomrcial 24859 28511 81924 33628Financial 1022 1208 1874 2337Agricultural 6207 5830 8s81 9839Industrial 10227 13562 16980 17808Tourism 807 890 737 804Housing 3968 4782 6068 8298Consumption 860 1186 1522 2166Other 1625 1824 2251 3099
(annual percent change)Advanco by purpose 8.7 18.4 15.9 16.1Commercial 21.9 14.7 12.0 6.0Financial 25.9 18.2 88.6 39.6Agricultural 23.6 12.0 12.9 46.5Industrial 10.1 80.8 19.7 10.2Tourism 1.2 10.8 -17.2 9.1Housing 14.9 21.0 28.9 86.8Consumption 83.4 37.2 30.6 41.6Other 24.6 12.2 23.4 37.7
(percent of total advances)Advances by purposeCowmrclal 61.1 49.6 47.8 43.8Financial 2.1 2.1 2.5 3.0Agricultural 10.7 10.1 9.9 12.4Industrlsl 21.0 23.2 23.9 22.7Tourism 1.7 1.5 1.1 1.0Housing 8.1 8.8 9.1 10.7Consumption 1.7 2.0 2.3 2.8Other 8.8 8.2 3.4 4.0
Source: Central Bank
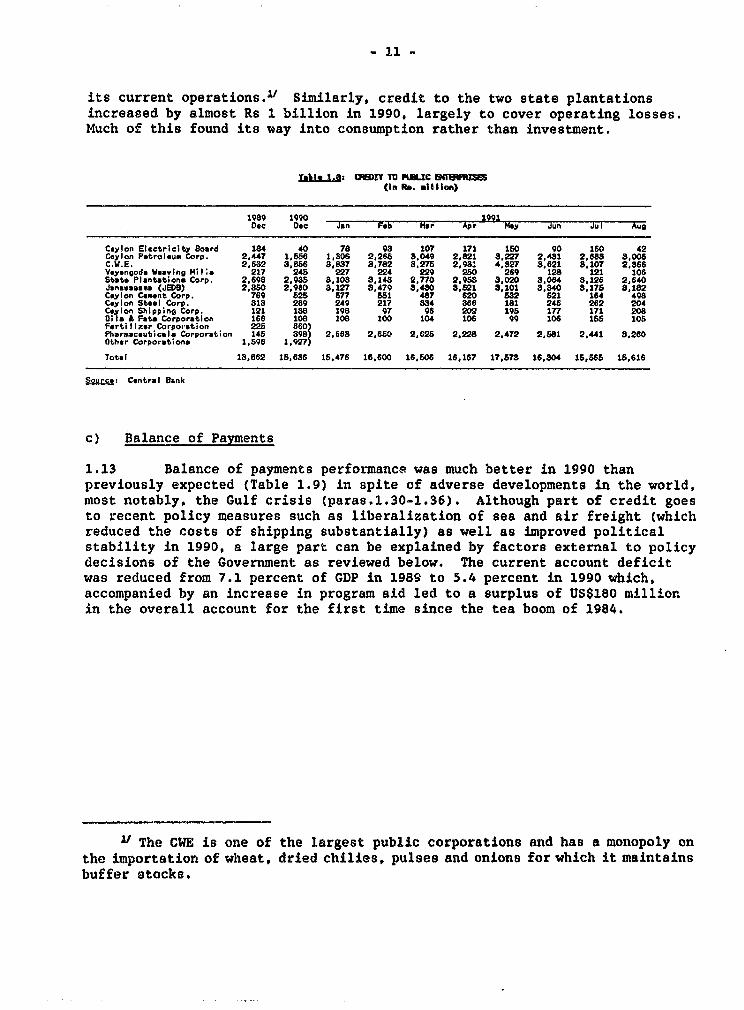
1.12 The overall expansion in public corporation credit at 13 percent(Table 1.8) was lees than targeted and less than a 29 percent in the previousyear. But credit to a few of the larger public corporations increasedsignificantly. The increase in credit was particularly concentrated in threeof the largest public corporations, the Cooperative Wholesale Establishment(CWE), and the two state plantation corporations (the Janatha EstatesDevelopment Board (JEDBJ and the Sri Lanka State Plantations Corporation(SLSPC]). The CWE received over Re 1.2 billion in credit in 1990, which wasfinanced in part by the Central Bank special refinance facility in support of
- 11 -
its current operations. Similarly, credit to the two state plantationsincreased by almost Rs 1 billion in 1990, largely to cover operating losses.Much of this found its way into consumption rather than investment.
ZIkLt-.I: aRr2T TO PWUC 8lWRl_(I n Rs. l I I ton)
1989 1090 1991Dtec Oc Jan F b Mar Apr May Jun Jul Aug
Ceylon Electricity Board 184 40 78 98 107 171 180 90 160 42Ceylon Petroleum Corp. 2,447 1,580 1,306 2,265 8.049 2,821 9.227 2,481 2,S88 8,008C.W.' 2,682 3,856 8,837 8,782 8.278 2,981 4,827 8,621 8,107 2,866Veyangod Weaing ;1; 217 24S 227 224 229 280 269 128 121 108st.et Plent,tion- Corp. 2,698 2,938 8,108 8,148 2,770 2,9S8 3,020 3S064 8,126 2,640Janaweamas (JED8) 2,80 2,O90 8,127 3,479 8,430 3.821 3.101 a.340 S,17S 8,182Ceylon Cemnt. Corp. 769 525 877 551 487 620 532 821 164 498Ceylon Steel Corp. S31 289 240 217 334 856 181 246 262 204Ceylon Shipping Corp. 121 188 198 97 98 202 19S 177 171 208Bil& & Fats Corporation 166 108 108 100 104 106 99 10 185 108Fertilizer Corporation 225 660)Pharamaceuticale Corporation 148 898) 2,668 2,6t0 2,628 2,228 2,472 2,581 2,441 8.260Other Corporationa 1,596 1,927)
Total 18,862 15,686 15,476 16,600 16,606 16,167 17,678 16,804 16,865 15,616
5ource: Central Bank
c) Balance of Payments
1.13 Balance of payments performance was much better in 1990 thanpreviously expected (Table 1.9) in spite of adverse developments in the world,most notably, the Gulf crisis (paras.1.30-1.36). Although part of credit goesto recent policy measures such as liberalization of sea and air freight (whichreduced the costs of shipping substantially) as well as improved politicalstability in 1990, a large part can be explained by factors external to policydecisions of the Government as reviewed below. The current account deficitwas reduced from 7.1 percent of GDP in 1989 to 5.4 percent in 1990 which,accompanied by an increase in program aid led to a surplus of US$180 millior.in the overall account for the first time since the tea boom of 1984.
l/ The CWE is one of the largest public corporations and has a monopoly onthe importation of wlheat, dried chilies, pulses and onions for which it maintainsbuffer stocks.
- 12 -
Tblei 1.9: WAKUCE OF PAYiS(US$ MllIIIon)
mn 1980 1984 1985 1988 1987 1988 1989 1990 1991Prol mn.
do Balance -986.8 -464.8 -722.0 -761.8 -679.8 -7683.6 -687.0 -702.7 -843.9Exports 1064.7 1462.6 1318.0 1208.6 1893.8 1478.0 1680.4 1976.9 2080.0Imports 2061.R 1926.9 2038.0 1970.4 2078.4 2239.5 2227.4 2678.6 2923.9(R*hab.) 0.0 0.0 0.0 0.0 0.0 18.7 21.4 30.0 (n.a.)
vico, not 61.9 -67.8 -136.0 -128.8 -165.9 -168.0 -167.7 -97.2 -121.8Recelpts 278.6 336.9 828.2 379.8 397.7 410.6 403.1 534.1 e60.4Payments 226.8 404.7 468.1 607.8 563.6 683.6 680.7 631.3 762.2(Rohab. Interest) 0.0 0.0 0.0 00 0.0 0.4 1.0 1.9 (n.e.)
de and Servicoo,n.t -934.7 -632.1 -856.9 -890.1 -835.6 -916.5 -824.7 -799.8 -985.7
vet, Transfere, net 186.7 276.4 285.8 284.2 312.6 319.4 830.6 866.3 370.7Receipts 152.3 800.8 292.0 316.0 849.8 367.0 367.9 402.4 414.7Payments 16.8 24.4 28.2 31.8 37.8 37.6 27.8 36.1 44.0
rent Account -798.0 -256.7 -691.1 -605.9 -523.0 -597.1 -494.1 -433.6 -696.0ercent of ODP) (.21.2) (4.2) (-9.9) (-9.5) (-7.8) (-8.6) (-7.1) (-5.4) (-8.6)
icial Transfers,not 138.0 202.7 174.6 179.9 180.1 207.1 188.1 176.1 163.2(Rehab.) 0°0 0.0 0.0 0.0 0.0 6.0 23.0 82.2 (n.o.)
on-monetary Capital, not 390.3 344.8 388.2 828.9 804.6 259.7 289.8 468.0 650.9(Reheb.) 0.0 0.0 0.0 0.0 0.0 14.1 25.9 36.8 (n.e.)Direct Investment 48.0 82.6 24.9 28.6 67.7 48.1 17.6 32.0 66.0Private Long-term,not 19.6 -4.8 31.3 19.1 8.9 -44.0 -44.2 -43.2 -6.6
Inflows 81.2 42.5 89.7 78.9 101.2 51.1 19.1 32.4 76.6Outflows 11.7 47.4 S8.4 t9.9 92.8 95.1 68.8 76.6 83.0
Short-term,not 178.3 -24.9 3.4 -13.1 89.6 16.1 92.9 64.6 29.1Governmnt, Long-teru,net 167.6 841.4 273.7 294.4 198.5 244.4 223.6 409.8 643.4
Inflows 261.6 408.1 347.0 410.? 842.8 408.6 386.6 658.6 876.7(Rehab.) 0.0 0.0 0.0 0.0 0.0 14.1 26.9 38.8 (n.a.)Outflows 104.1 o6.7 73.3 118.2 144.3 164.8 161.9 126.7 183.3
Government Short-term,not 0.0 0.0 0.0 0.0 0.0 0.0 0.0 0.0 29.9Allocations 16.6 0.0 0.0 0.0 0.0 0.0 0.0 0.0 0.0
or and Omissions 46.7 18.1 -28.1 27.0 -41.7 44.3 -70.0 -26.1 24.4
roil Balance -216.1 804.4 -111.6 -70.2 -80.1 -88.0 -88.2 180.5 243.6
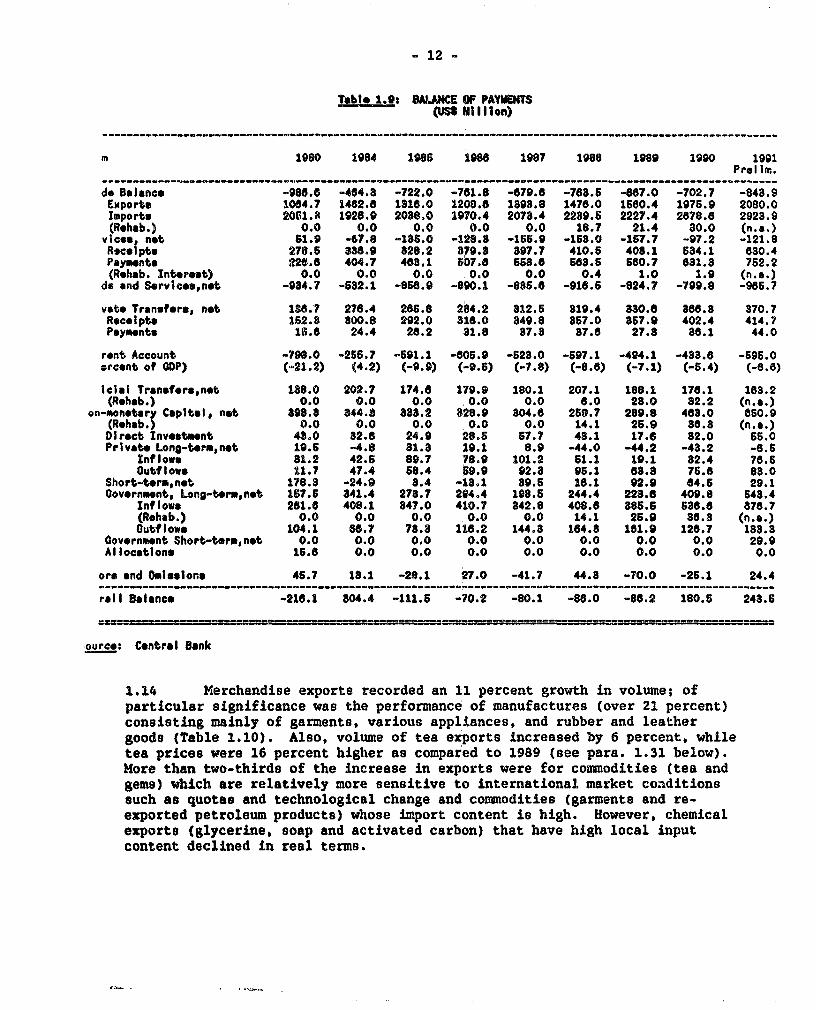
ource: Central Bank
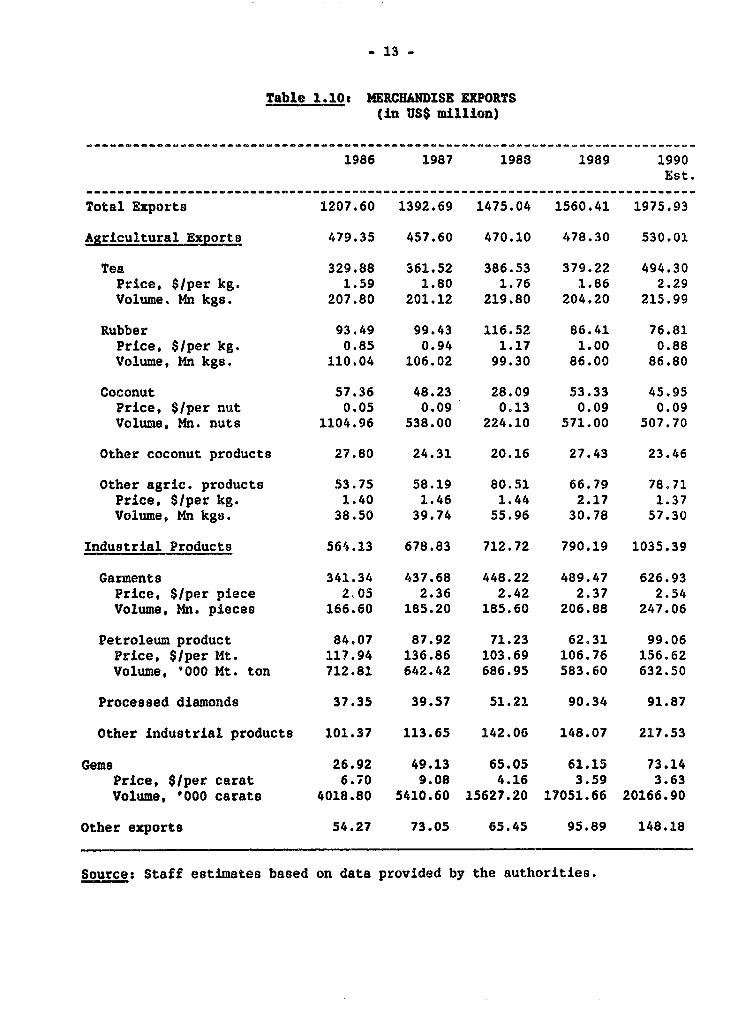
1.14 Merchandise exports recorded an 11 percent growth in volume; ofparticular significance was the performance of manufactures (over 21 percent)consisting mainly of garments, various appliances, and rubber and leathergoods (Table 1.10). Also, volume of tea exports increased by 6 percent, whiletea prices were 16 percent higher as compared to 1989 (see para. 1.31 below).More than two-thirds of the increase in exports were for comiodities (tea andgems) which are relatively more sensitive to international market conditionssuch as quotas and technological change and commodities (garments and re-exported petroleum products) whose import content is high. However, chemicalexports (glycerine, soap and activated carbon) that have high local inputcontent declined in real terms.
_ 13 -
Table 1.10: MERCHANDISE EXPORTS(in USS million)
1986 1987 1988 1989 1990Est.
Total Exports 1207.60 1392.69 1475.04 1560.41 1975.93
Agricultural Exports 479.35 457.60 470.10 478.30 530.01
Tea 329.88 361.52 386.53 379.22 494.30Price, $/per kg. 1.59 1.80 1.76 1.86 2.29Volume. Mn kgs. 207.80 201.12 219.80 204.20 215.99
Rubber 93.49 99.43 116.52 86.41 76.81Price, S/per kg. 0.85 0.94 1.17 1.00 0.88Volume, Mn kgs. 110.04 106.02 99.30 86.00 86.80
Coconut 57.36 48.23 28.09 53.33 45.95Price, $/per nut 0.05 0.09 0.13 0.09 0.09Volume, Mn. nuts 1104.96 538.00 224.10 571.00 507.70
Other coconut products 27.80 24.31 20.16 27.43 23.46
Other agric. products 53.75 58.19 80.51 66.79 78.71Price, $/per kg. 1.40 1.46 1.44 2.17 1.37Volume, Mn kgs. 38.50 39.74 55.96 30.78 57.30
Industrial Products 564.13 678.83 712.72 790.19 1035.39
Garments 341.34 437.68 448.22 489.47 626.93Price, $/per piece 2.05 2.36 2.42 2.37 2.54Volume, Mn. pieces 166.60 185.20 185.60 206.88 247.06
Petroleum product 84.07 87.92 71.23 62.31 99.06Price, $/per Mt. 117.94 136.86 103.69 106.76 156.62Volume, '000 Mt. ton 712.81 642.42 686.95 583.60 632.50
Processed diamonds 37.35 39.57 51.21 90.34 91.87
Other industrial products 101.37 113.65 142.06 148.07 217.53
Gems 26.92 49.13 65.05 61.15 73.14Price, S/per carat 6.70 9.08 4.16 3.59 3.63Volume, '000 carats 4018.80 5410.60 15627.20 17051.66 20166.90
Other exports 54.27 73.05 65.45 95.89 148.18
Source: Staff estimates based on data provided by the authorities.
- 14 -
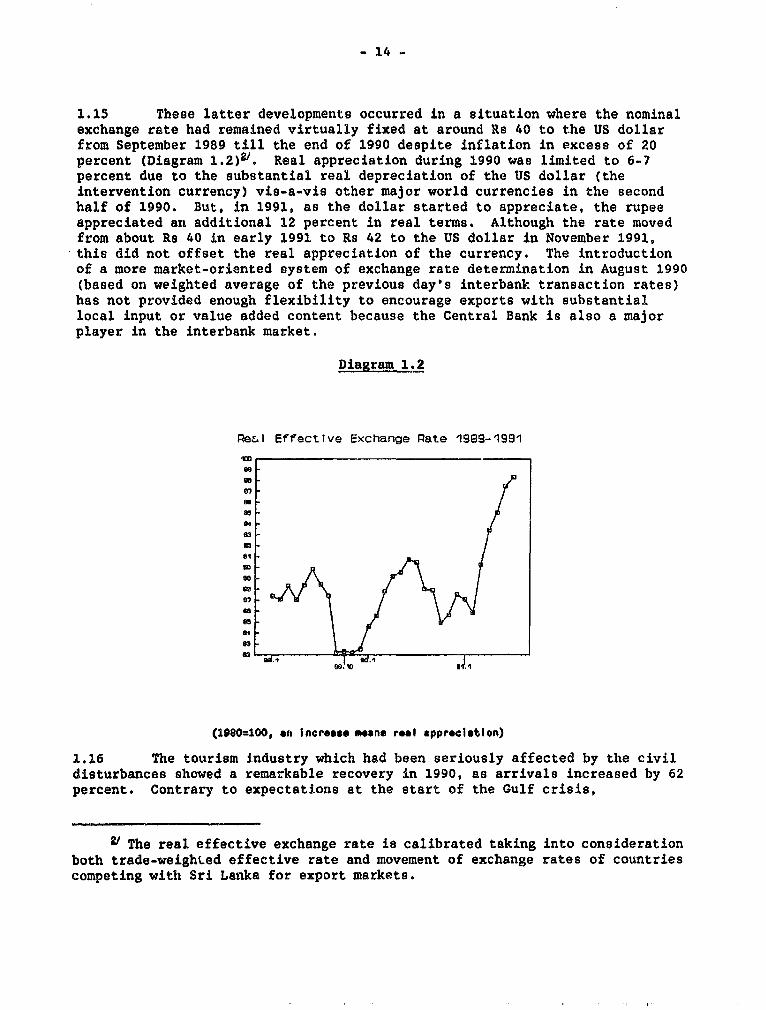
1.15 These latter developments occurred in a situation where the nominalexchange rate had remained virtually fixed at around Rs 40 to the US dollarfrom September 1989 till the end of 1990 despite inflation in excess of 20percent (Diagram 1.2)V. Real appreciation during 1990 was limited to 6-7percent due to the substantial real depreciation of the US dollar (theintervention currency) vis-a-vis other major world currencies in the secondhalf of 1990. But, in 1991, as the dollar started to appreciate, the rupeeappreciated an additional 12 percent in real terms. Although the rate movedfrom about Rs 40 in early 1991 to Rs 42 to the US dollar in November 1991,this did not offset the real appreciation of the currency. The introductionof a more market-oriented system of exchange rate determination in August 1990(based on weighted average of the previous day's interbank transaction rates)has not provided enough flexibility to encourage exports with substantiallocal input or value added content because the Central Bank is also a majorplayer in the interbank market.
Diagram 1.2
PRe&I Effective Exchange Pate 1989-1991
40
07
94
4340
40
.011
0,~~~~W,
(1980=100, an i ncrss means mal a pproci tlon)
1.16 The tourism industry which had been seriously affected by the civildisturbances showed a remarkable recovery in 1990, as arrivals increased by 62percent. Contrary to expectations at the start of the Gulf crisis,
,v The real effective exchange rate is calibrated taking into considerationboth trade-weightLed effective rate and movement of exchange rates of countriescompeting with Sri Lanka for export markets.
- 15 -
remittances of workers from Gulf countries showed a robust increase of 11percer. in US dollar terms, as many panic-stricken workers remitted to SriLanka their savings (see paras.l.32-1.33). On the import side, favorableweather conditions and the resulting good paddy production allowed riceimports to be almost halved as compared to 1989. Imports of petroleum,however, increased reflecting higher prices and the felt need to holdstrategic reserves. Terms of trade declined only marginally by about 1percent.
1.17 In 1990 a new pattern of external assistance seems to be emergingwhereby external resource transfers to Sri Lanka are achieved through arelatively high contribution of balance-of-payments support rather thanproject-related aid. Not only did official grants decline due to a large dropin commodity aid, but project-related disbursements in nominal US dollar termsstayed at the level of 1989. This was rather disappointing becausedisbursements in 1989 were already low on account of slow projectimplementation. These shortfalls, however, were more than offset bydisbursements of program loans by IDA and ADB which amounted to about US$90million in 1990 (as compared to US$29 million in 1989). The level of foreigndirect investment grew rapidly form the small base in 1989 but still remainedrelatively low at about US$32 million in 1990, underscoring the difficulty ofpromoting Sri Lanka's image abroad as a "foreign investment haven" in the faceof ongoing civil conflict. There was also a 20 percent reduction inamortization payments, as a result of the government paying off the bulk ofshort-term nonconcessional loans in 1989. The debt service ratio improvedfurther and remained relatively low at 14 percent of exports and non factorservices. Notwithstanding these favorable developments, gross officialforeign exchange reserves still cover only about 2 months of merchandiseimports.
1.18 Preliminary data for 1991 indicate an increase in current accountdeficit to 6.6 percent of GDP from the 5.4 percent achieved in 1990--primarilybecause of higher than projected imports of "non-grain food", "non-foodconsumer goods" and "textile as intermediate inputs". Most of the increase in"non-food consumer goods" imports was due to cars and motor cycles while hightextile imports reflect adjustment of input stocks. The increased imports ofconsumer goods in general were probably a result of an increased degree ofimport liberalization in an environment where bias toward consumption wasstrong as discussed in Chapter II. The amount of nominal exports at slightlyabove US$2 billion (real growth of 4.8 percent over 1990) was largely asexpected. There are, however, some worrisome signs. Real growth of exportsof "other" agricultural and industrial goods (which are presumably the engineof export-led growth) has been much less than anticipated, with the formersuffering negative growth implying that the Government could do much more toencourage non-traditional exports including in the areas of exchange ratemanagement. Private transfers on the other hand recorded modest but positivenominal growth despite the expectation that this would decline due to anexpected loss in remittances/transfers from migrant workers abroad as a resultof the Gulf crisis-induced return of a substantial number in 1990. In fact,the expected decline in workers' remittances in 1991 appears to have occurred.But, as the economy has been doing rather well in 1990 and 1991, there appears
- 16
to have been a reverse flow of earlier capital flight, probably amounting toat least about US$40 million. This latter helped realize the overall increasein private transfers. On the capital account, foreign investment increasedsubstantially to US$55 million reflecting the relative stability in theeconomic and political environment. Most of the increase in foreigninvestment, however, was due to investment in existing shares rather thanfixed capital formation. Finally aid disbursements increased by about US$80million over the level in 1990. But, because disbursements of balance-of-payments support increased by almost US$ 200 million, nominal project aiddisbursements appear to have been below the 1990 level.
d) Fiscal Developments
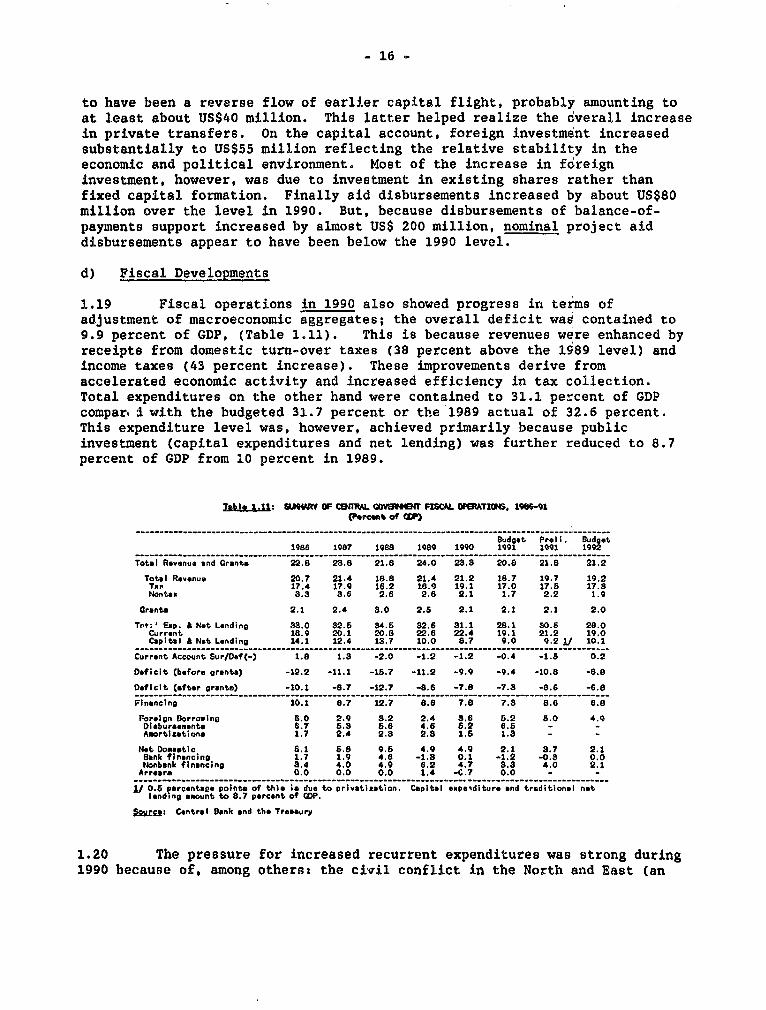
1.19 Fiscal operations in 1990 also showed progress irn terms ofadjustment of macroeconomic aggregates; the overall deficit was contained to9.9 percent of GDP, (Table 1.11). This is because revenues were enhanced byreceipts from domestic turn-over taxes (38 percent above the 1989 level) andincome taxes (43 percent increase). These improvements derive fromaccelerated economic activity and increased efficiency in tax collection.Total expenditures on the other hand were contained to 31.1 percent of GDPcompar,I with the budgeted 31.7 percent or the 1989 actual of 32.6 percent.This expenditure level was, however, achieved primarily because publicinvestment (capital expenditures and net lending) was further reduced to 8.7percent of GDP from 10 percent in 1989.
Imbls..L1: 5.SItf OF CETARL CO^V844E FISCA OPERATIONS, 19691(Percent of GP)
---------------------------------------------------------------------- ___-----__----------------------
Budget Preli. Budget1986 1987 1988 1989 1Q90 1991 1991 1992
Total Revenue und Grant- 22.8 28.8 21.8 24.0 23.3 20.0 21.8 21.2
Total Revenue 20.7 21.4 18.8 21.4 21.2 18.7 19.7 19.2Ta.r 17.4 17.9 16.2 18.9 19.1 17.0 17.8 17.3Nontex 3.3 3.6 2.6 2.6 2.1 1.7 2.2 1.9
Grants 2.1 2.4 3.0 2.5 2.1 2.1 2.1 2.0
Toat; &ip. Not Lend;ng 3.0 32.6 34.8 82.6 S3.1 28.1 so.8 28.0Current 18.9 20.1 20.8 22.6 22.4 19.1 21.2 19.0Capital A Net Lending 14.1 12.4 13.7 10.0 8.7 9.0 9.2 1/ 10.1
Current Account Sur/Dof(-) 1.8 1.3 -2.0 -1.2 -1.2 -0.4 -1.5 0.2
Deficit (before grants) -12.2 -11.1 -15.7 -11.2 -9.9 -9.4 -10.8 -8.0
Deficit (after grants) -10.1 -8.7 -12.7 -8.6 -7.8 -7.3 -8.6 -6.8
Financing 10.1 8.7 12.7 8.6 7.8 7.3 8.6 6.8
Foreign iorrouine 8.0 2.9 3.2 2.4 3.6 6.2 5.0 4.9Dlebureoment. 6.7 5.3 5.6 4.6 8.2 6.5 -Amortizatione 1.7 2.4 2.8 2.8 1.5 1.8 -
Net Domestic 8.1 5.8 9.6 4.9 4.9 2.1 3.7 2.1Bank financing 1.7 1.9 4.8 -1.8 0.1 -1.2 -0.8 0.0Nonbank financing 8.4 4.0 4.9 6.2 4.7 3.8 4.0 2.1
Arrear 0.0 0.0 0.0 1.4 --. 7 0.0 - -
I/ 0.5 percentage pointo of this is due to privatization. Capital epPeiditure and traditional netlending sount to 8.7 percent of DP.
Source: Central Bunk ond the Trenaury
1.20 The pressure for increased recurrent expenditures was strong during1990 because of, among others: the civil conflict in the North and East (an
- 17
additional Rs 4.5 billion was allocated for this purpose in a mid-yearsupplementary budget); severance payments for continued public sector laborretrenchment (Rs 2.3 billion); and the revived mid-day meal program (Rs 1.5billion although Rs 1.1 billion was actually disbursed for this program). Inaddition, probably because of the tight control on fund releases in 1989 aspart of the stabilization efforts started in mid-1989, many of the claimsaccrued to the Government during the second half of 1989 had not been paidwithin the same year; the authorities found that they had to pay in 1990accumulated arrears amounting to Rs 3.5 billion.
1.21 In 1991, the strong pressure for increased recurrent expendituresremained due to the civil conflict in the North and East while the refugeesfrom the affected areas needed to be taken care of. Supplementaryexpenditures for these two purposes have been at Rs 5 billion and Rs 1.9billion, respectively. Together with the public sector restructuring cost(additional pension of Rs 2.2 billion, and unpaid transport staff severancepayments of Rs 3.8 billion), expenditures for 1991 over and above theoriginally budgeted figures are currently expected to be Rs 13.5 billion (3.6percent of projected 1991 GDP). Although increased savings and revenuesattenuated the situation somewhat, more of these efforts could have been made,e.g., making the defense levy and additional excises effective as of November1991 rather than a later date in 1992 announced in the budget. As a result,it is estimated that the current deficit was 1.5 percent of GDP in 1991 andthe overall deficit 10.8 percent exceeding the Government's target of 10.1percent by a significant margin. In addition to the insufficient efforts madeto offset increased military and other expenditures, the Government morerecently appears to be making ad hoc decisions that are intended to tackledifferent problems piecemeal rather than in a consistent policy framework. (Acase in point is a government-sponsored training program for unemployedgraduates with provision of substantial stipend so that they become employableby the private sector.) It is also noteworthy that, as stated above, theproject disbursements in 1991 declined nominally in US dollar terms over 1990disbursements implying further slow down of implementation of major projects.The increased disbursements of balance-of-payments aid has more than offsetthis decline in financing the budget deficit.
1.22 Given this background, the 1992 budget looks optimistic. It callsfor current surplus amounting to 0.2 percent of GDP and the overall deficit of8.8 percent of GDP, both of which are improvements of about 2 percentagepoints of GDP over the preliminary estimates for 1991. This, however, may bedifficult to achieve for at least two reasons even if fiscal discipline isregained. First, the budget calls for no nominal increase in the total wagebill over the 1991 actual level, and an extremely tight allocation -as madefor non-deZense "other goods and services" procurements. The former isinconsistent with the strong pressure for wage increases, and the fact thatthe Government has already committed a Rs 300/month cost of living adjustmentfor the majority of civil servants. Second, the budget may also be optimisticbecause the 1992 estimate of defense expenditures are nominally the same asthe actual of 1991. Because of inflation, if the level of fighting remainsthe same, for additional resources may be required by the fourth quarter. Theallocation for non-civil administration of the Ministry of Defense also
- 18 -
appears rather small compared with the historical level. If the recurventexpenditure allocations turns out to be insufficient, the overall deficit willbe pushed to above 10 percent of GDP once again and also public investmentwill continue to be suppressed. In addition, tax revenues from tea exportsmay be over-estimated as the assumed export price is US$2.1/kg, as opposed tocurrently prevailing US$1.5-1.6/kg.
1.23 A bright side of the 1992 budget is the implementation of TaxReform. It was announced that the corporate income tax rate would be reducedfrom 50 percent to 45 percent in 1992 and to a unified 35 percent from 1993,the same rate as the reduced maximum marginal rate for personal income tax.Wealth tax will be abolished, and withholding tax on letters of credit will bereduced. As regards indirect taxation, the four-band import tariff system wasannounced and its implementation started in November 1991, and surcharge onimport duty (except on car imports) has been abolished. Ad valorem tax rateson tea and coconut oil exports have been reduced from 50 percent to 40percent. Turnover taxes will be restructured into a value-added tax (VAT)system as of April 1993, and in the interim the turnover tax rates have beensimplified into a four-rate structure. These are all welcome developmentsthat increase efficiency in the medium-term and Government efforts toimplement these expeditiously should be highly commended. In addition, theexpected loss in revenues in the immediate future as a result of this taxreform is expected to be counter-balanced by (i) a defence levy on all imports(except for exporters' imported inputs) and domestically manufactured goods(except for exports) of 1 percent as of January 1, 1992; (ii) improvement intax administration, an ongoing effort with IMF assistance; and (iii) effortsto reduce expenditures. The 1992 budget incorporates revenue implications ofthese measures.
e) Inflation
1.24 Adjustment efforts in Sri Lanka have been accompanied by priceincreases (as measured by the GDP deflator) that averaged 10 percent annuallyduring the 1982-89 period. These inflationary pressures became of particularconcern in 1990 when both the GDP deflator and the Colombo consumer priceindex (CCPI) rose by over 20 percent. This inflation eroded Sri Lanka'sexternal competitiveness and thus weakened the strategy of fostering privateinvestment and exports as well as distorted consumption and saving patterns.
1.25 Increases in wage levels, terms of trade deterioration, and Luoregenerally "imported inflation" have historically played an important role inthe inflationary processes of the 1980s. The average real wage (deflated byconsumers' price index) increase in manufacturing was consistently positiveand increased at 5.7 percent per annum in the 1983-88 period', whereas realoutput per worker rose by 4.1 percent. Second, the price index of allmerchandise imports, which had risen moderately before 1986, went up annuallyby an average of 17.6 percent in the 1987-89 period. Apart from their primaryimpact on the CCPI, through food prices, external price increases had also
S Official data (Industrial Surveys) are available for this period only.
- 19 -
indirect effects by: (i) increasing private sector's expenditure on currentinputs (which are mostly imported) and the demand for bank credit related toworking capital requirements, and (ii) increasing the cost of investmentgoods.
1.26 Similar cost push factors were at work in 1990 as well. Theongoing adjustment program aimed in part at correcting past distortionsthrough price alignments. It included two series of measures which causedonce and for all price increases in 1990: a devaluation of the rupee by 16percent during the third quarter of 1989; and the lifting of controls ofprices for fertilizers, wheat flour and rice. import prices in rupee termssoared by 33 percent in 1990, the highest price rise since the mid-1970s.However, the prices of imported consumer goods--which have the most directimpact on the CCPI--went up by about 24 percent. Since imported goodscomprised about one quarter of total private consumption in 1990, the directimpact on the price level in that particular year was limited at about 6percentage points. The impact of "imported" inflation was instead felt mainlythrough the domestic production process--imported inputs (intermediate inputsare 50 percent of merchandise imports, and investment goods imports are about18 percent) recorded the highest price increase in 1990 in the last ten yearsmainly owing to a 40 percent rise in petroleum prices induced by the Gulfcrisis.
1.27 The elimination of food subsidies also had a major impact. Foodproducts have a 70 percent weight in the CCPI, and were responsible for almostthree-quarters of the upward move of the index for at least four reasons.First and foremost, administered wheat flour and bread prices were revisedupward (in order to eliminate subsidies) from a level fixed in 1985. Thischange alone (about 56 percent increase in the price index for wheat flour andbread) explains more than one quarter of the rise in the CCPI. Second, theprice of rice also increased by 22 percent. As rice and wheat bread arenatural substitutes in consumer's demand, the higher wheat price increased thedemand for rice, causing price pressures in the latter market which wereexacerbated by the poor rice harvest in 1989 and some domestic transportbottlenecks. A dearth of private rice importers also prevented the systemfrom responding flexibly to the situation by importing more rice. The CWE,which had the monopoly of wheat and rice imports, was not responsive enougheither. Wheat imports in 1990 stood at their lowest level since 1985, andwhen the CWE finally managed to import inexpensive rice in 1990, it had to becareful not to release it all at once in the domestic market because theimports preceded the paddy sowing period, and a sudden fall in the rice pricemight have jeopardized producer incentives especially at a time when the costof rice production was sky rocketing reflecting higher oil import prices,elimination of fertilizer subsidies, and a substantial rise in wages. Third,sugar registered an import price increase of 26 percent. Fourth, there werelarge increases in vegetable prices owing mainly to security problems in theNorth and East, but also to import bottlenecks as in the case of rice. Forexample, the price of red onions, for which CWE had the import monopoly, alonerose by 141 percent during the year.
- 20 -
1.28 Thus, the main cause of inflation in Sri Lanka appears to have beenvarious "cost-push" factors which would amplify the demand for money, lead to"bankable" requests for credit which, in turn, would be met by increaseseither in the money stock (through accommodating credit policies) or, ifunsatisfied, in the velocity of circulation. An accommodating credit policywhich increased outstanding credit by 24 percent was pursued to sustain theincreased level of economic activity in the face of the cost-push inflation, apolicy that helped sustain that inflation. With the start of thestabilization efforts in 1989, the rate of growth in broad money was containedto 11 percent in 1989 (Table 1.12). While this restraint was continuedthrough the first half of 1990, a dramatic improvement in net foreign assetsand accommodating credit policy, augmented growth in monetary liabilities to20 percent in 1990. This growth, however, fell short of the rate ofinflation.
1.29 In 1991, because most of the effects of changes in administeredprices have worked themselves through the system, inflation came down to about10 percent by the third quarter. Provisional 1991 monetary figures, however,indicate a possible departure from the cost-push inflation pattern describedabove. The Government credit growth which had been minimal in 1989 and 1990increased to about 16 percent, almost the same as the growth of the privatesector credit, prGbably crowding out the latter's activities. Furthermore,while inflation has come down, monetary expansion accelerated to 22 percent(October 1990-October 1991, which is above the nominal income growth) pushedby the large fiscal deficit (with larger than envisaged bank financing) andthe continued and non-sterilized increase in foreign assets; renewed inflationmay be lurking ahead. Already, despite the high positive rate of realinterest, private sector credit demand shows no sign of abatement implyingthat the private sector expects substantial inflation in the near future.Immediate and decisive reversal of the lax fiscal policies with the associatedcredit policy, therefore, is crucial in maintaining sound macroeconomicmanagement.
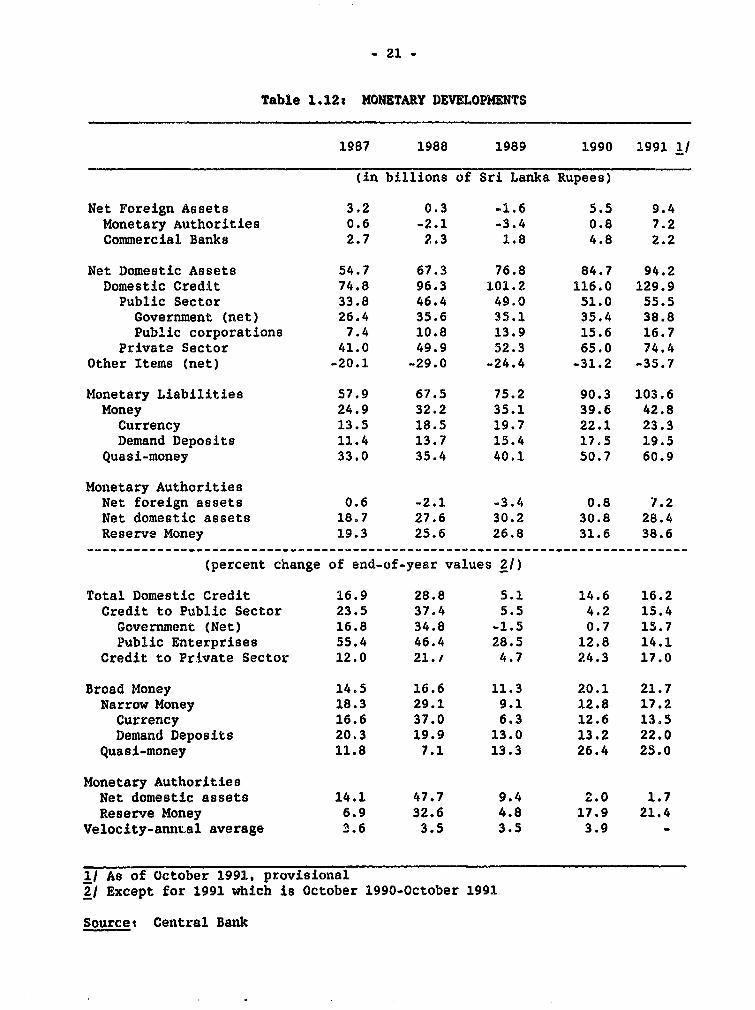
- 21 -
Table 1.12: MONETARY DEVELOPMENTS
1987 1988 1989 1990 1991 1/
(in billions of Sri Lanka Rupees)
Net Foreign Assets 3.2 0.3 -1.6 5.5 9.4Monetary Authorities 0.6 -2.1 -3.4 0.8 7.2Commercial Banks 2.7 2.3 1.8 4.8 2.2
Net Domestic Assets 54.7 67.3 76.8 84.7 94.2Domestic Credit 74.8 96.3 101.2 116.0 129.9Public Sector 33.8 46.4 49.0 51.0 55.5Government (net) 26.4 35.6 35.1 35.4 38.8Public corporations 7.4 10.8 13.9 15.6 16.7
Private Sector 41.0 49.9 52.3 65.0 74.4Other Items (net) -20.1 -29.0 -24.4 -31.2 -35.7
Monetary Liabilities 57.9 67.5 75.2 90.3 103.6Money 24.9 32.2 35.1 39.6 42.8Currency 13.5 18.5 19.7 22.1 23.3Demand Deposits 11.4 13.7 15.4 17.5 19.5
Quasi-money 33.0 35.4 40.1 50.7 60.9
Monetary AuthoritiesNet foreign assets 0.6 -2.1 -3.4 0.8 7.2Net domestic assets 18.7 27.6 30.2 30.8 28.4Reserve Money 19.3 25.6 26.8 31.6 38.6
------------------------------------------------------------------- ___________
(percent change of end-of-year values 2/)
Total Domestic Credit 16.9 28.8 5.1 14.6 16.2Credit to Public Sector 23.5 37.4 5.5 4.2 15.4Government (Net) 16.8 34.8 -1.5 0.7 15.7Public Enterprises 55.4 46.4 28.5 12.8 14.1
Credit to Private Sector 12.0 21.i 4.7 24.3 17.0
Broad Money 14.5 16.6 11.3 20.1 21.7Narrow Money 18.3 29.1 9.1 12.8 17.2Currency 16.6 37.0 6.3 12.6 13.5Demand Deposits 20.3 19.9 13.0 13.2 22.0
Quasi-money 11.8 7.1 13.3 26.4 25.0
Monetary AuthoritiesNet domestic assets 14.1 47.7 9.4 2.0 1.7Reserve Money 6.9 32.6 4.8 17.9 21.4
Velocity-annuLal average 3.6 3.5 3.5 3.9 -
1/ As of October 1991, provisional2/ Except for 1991 which is October 1990-October 1991
Sources Central Bank
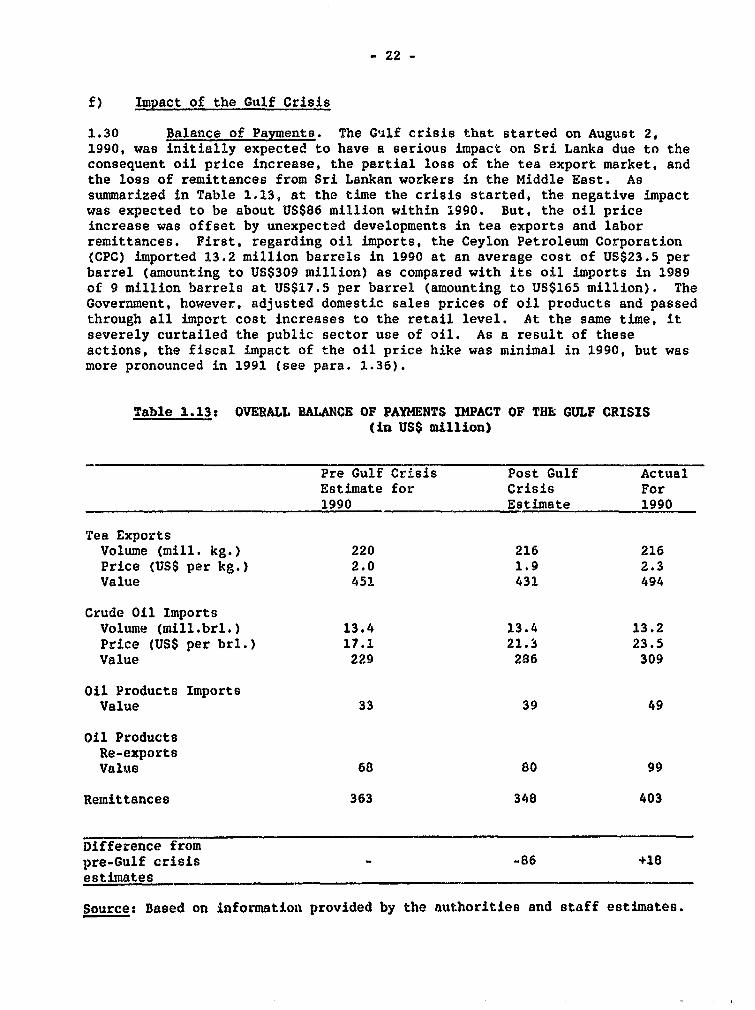
- 22 -
f) Impact of the Gulf Crisis
1.30 Balance of Payments. The Gulf crisis that started on August 2,1990, was initially expected to have a serious impact on Sri Lanka due to theconsequent oil price increase, the partial loss of the tea export market, andthe loss of remittances from Sri Lankan workers in the Middle East. Assummarized in Table 1.13, at the time the crisis started, the negative impactwas expected to be about US$86 million within 1990. But, the oil priceincrease was offset by unexpected developments in tea exports and laborremittances. First, regarding oil imports, the Ceylon Petroleum Corporation(CPC) imported 13.2 million barrels in 1990 at an average cost of US$23.5 perbarrel (amounting to US$309 million) as compared with its oil imports in 1989of 9 million barrels at US$17.5 per barrel (amounting to US$165 million). TheGovernment, however, adjusted domestic sales prices of oil products and passedthrough all import cost increases to the retail level. At the same time, itseverely curtailed the public sector use of oil. As a result of theseactions, the fiscal impact of the oil price hike was minimal in 1990, but wasmore pronounced in 1991 (see para. 1.36).
Table 1.13: OVERALL BALANCE OF PAYMENTS IMPACT OF THE GULF CRISIS(in US$ million)
Pre Gulf Crisis Post Gulf ActualEstimate for Crisis For1990 Estimate 1990
Tea ExportsVolume (mill. kg.) 220 216 216Price (US$ per kg.) 2.0 1.9 2.3Value 451 431 494
Crude Oil ImportsVolume (mill.brl.) 13.4 13.4 13.2Price (US$ per brl.) 17.1 21.3 23.5Value 229 286 309
Oil Products ImportsValue 33 39 49
Oil ProductsRe-exportsValue 68 80 99
Remittances 363 348 403
Difference frompre-Gulf crisis - -86 +18estimates
Source: Based on information provided by the authorities and staff estimates.
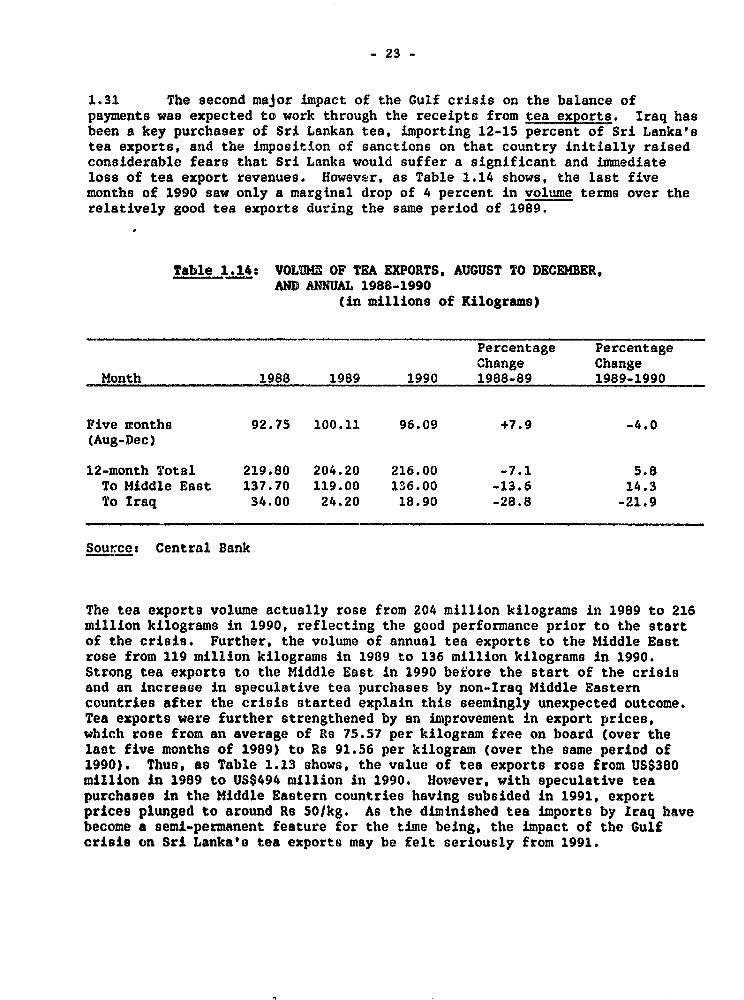
- 23 -
1.31 The second major impact of the Gulf crisis on the balance ofpayments was expected to work through the receipts from tea exports. Iraq hasbeen a key purchaser of Sri Lankan tea, importing 12-15 percent of Sri Lanka'stea exports, and the imposition of sanctions on that country initially raisedconsiderable fears that Sri Lanka would suffer a significant and immediateloss of tea export revenues. However, as Table 1.14 shows, the last fivemonths of 1990 saw only a marginal drop of 4 percent in volume terms over therelatively good tea exports during the same period of 1989.
Table 1.14: VOLUME OF TEA EXPORTS, AUGUST TO DECEMBER,AND ANNUAL 1988-1990
(in millions of Kilograms)
Percentage PercentageChange Change
Month 1988 1989 1990 1988-89 1989-1990
Five months 92.75 100.11 96.09 +7.9 -4.0(Aug-Dec)
12-month Total 219.80 204.20 216.00 -7.1 5.8To Middle East 137.70 119.00 136.00 -13.6 14.3To Iraq 34.00 24.20 18.90 -28.8 -21.9
Source: Central Bank
The tea exports volume actually rose from 204 million kilograms in 1989 to 216million kilograms in 1990, reflecting the good performance prior to the startof the crisis. Further, the volume of annual tea exports to the Middle Eastrose from 119 million kilograms in 1989 to 136 million kilograms in 1990.Strong tea exports to the Middle East in 1990 before the start of the crisisand an increase in speculative tea purchases by non-Iraq Middle Easterncountries after the crisis started explain this seemingly unexpected outcome.Tea exports were further strengthened by an improvement in export prices,which rose from an average of Rs 75.57 per kilogram free on board (over thelast five months of 1989) to Rs 91.56 per kilogram (over the same period of1990). Thus, as Table 1.13 shows, the value of tea exports rose from US$380million in 1989 to US$494 million in 1990. However, with speculative teapurchases in the Middle Eastern countries having subsided in 1991, exportprices plunged to around Rs 50lkg. As the diminished tea imports by [raq havebecome a semi-permanent feature for the time being, the impact of the Gulfcrisis on Sri Lanka's tea exports may be felt seriously from 1991.
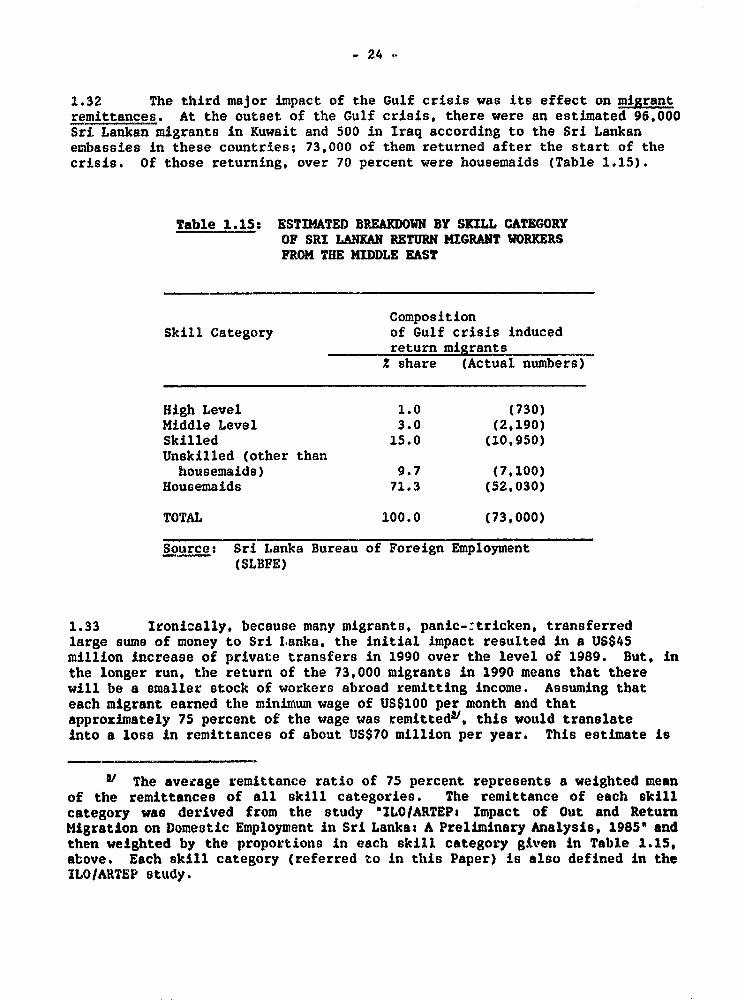
- 24 -
1.32 The third major impact of the Gulf crisis was its effect on migrantremittances. At the outset of the Gulf crisis, there were an estimated 96,000Sri Lankan migrants in Kuwait and 500 in Iraq according to the Sri Lankanembassies in these countries; 73,000 of them returned after the start of thecrisis. Of those returning, over 70 percent were housemaids (Table 1.15).
Table 1.15: ESTIMATED BREAKDOWN BY SKILL CATEGORYOF SRI LANRKAN RETURN MIGRANT WORKERSPROM THE MIDDLE EAST
CompositionSkill Category of Gulf crisis induced
return migrantsZ share (Actual numbers)
High Level 1.0 (730)Middle Level 3.0 (2,190)Skilled 15.0 (10,950)Unskilled (other thanhousemaids) 9.7 (7,100)
Housemaids 71.3 (52,030)
TOTAL 100.0 (73,000)
Source: Sri Lanka Bureau of Foreign Employment(SLBFE)
1.33 Ironically, because many migrants, panic-:tricken, transferredlarge sums of money to Sri Lanka, the initial impact resulted in a US$45million increase of private transfers in 1990 over the level of 1989. But, inthe longer run, the return of the 73,000 migrants in 1990 means that therewill be a smaller stock of workers abroad remitting income. Assuming thateach migrant earned the minimum wage of US$100 per month and thatapproximately 75 percent of the wage was remittedV, this would translateinto a loss in remittances of about US$70 million per year. This estimate is
V The average remittance ratio of 75 percent represents a weighted meanof the remittances of all skill categories. The remittance of each skillcategory was derived from the study 'ILO/ARTEPt Impact of Out and ReturnMigration on Domestic Employment in Sri Lankat A Preliminary Analysis, 1985' andthen weighted by the proportions in each skill category given in Table 1.15,above. Each skill category (referred to in this Paper) is also defined in theILO/ARTEP study.
- 25 _
on the low side, for the average wage or salary of a Sri Lankan in the MiddleEast is estimated to be well above US$100 per month.
1.34 At present, it does not appear that the 73,000 returnee migrantswill be able to return early to the Middle East in the near future. Inparticular. Kuwaiti immigration controls regarding the re-employment ofexpatriate labor have been tightened after the war. Thus, the Sri LankanMinistry of Labor (in collaboration with the ILO) is helping to re-integratethe returnees into Sri Lanka through counselling, or providing training. Apromotion campaign is also being mounted to assist returnees to secureoverseas employment in other regions including Europe and Eastern Asia. Theimpact of this addition of approximately 73,000 workers (1.2 percent of thelabor force) on the labor market is not well understood. However, given thatthe majority of the returnees are young housemaids and that many have tendedto be re-absorbed in their family structure, the immediate impact appears tobe not as severe as in other countries (e.g. Egypt) whose migrant workers inthe affected areas went back home to join the visibly unemployed labor force.
1.35 The Impact on the Budget. The direct fiscal burden incurred due tothe return of the Gulf migrants was small in 1990. The Government paid AirLanka a sum of Rs 250 million to cover the costs of flying the migrants back,a service which was provided free of charge to the returnees. In addition,the International Organization of Migration (IOM) assisted the Government witha grant of US$15 million to repatriate Sri Lankans working abroad. The SriLanka Bureau of Foreign Employment (SLBFE) estimates that it incurred a costof about Rs 7 million between August 1990 and January 1091 in assisting in thereturnees. The total budgetary cost in FY90 to the Government was, therefore,no more than Rs 260 million. In addition, in FY91, a sum of Rs 1.0 billion(about US$24 million) has been requested in the form of supplementaries, tocover the costs of rehabilitating these returnee migrants. A large part, ifnot all, of this sum could probably be met from ADB assistance amounting toUS$19 million which is specifically designed to compensate for the impact ofthe Gulf crisis.
1.36 In 1991, however, the loss that the Ceylon Petroleum Corporation(CPC) incurred became a major cost to the economy. CPC bought crude oil atthe height of the crisis when the oil price was at its peak (especially early1991) and sold it later, at much lower prices both in export and domesticmarkets. The total loss to t.he budget thus incurred, during approximately thefirst four months of 1991, s around Rs 500-600 million (and projected to beRs 900 million for the full year), although the total loss to the CPC so farin 1991 appears to be of the order of Rs 2 billion with the difference borneby increased bank credit to CPC (see Table 1.8). It is worthwhile pointingout that more than a half of the loss was due to the sale of oil products inthe domestic market--if further price increases had been made to absorb thecost of the high oil prices in early 1991, the loss to the CPC would have beenmuch smaller.
- 26 -
2. The Agriculture Sector
1.37 Agriculture contributes about 24 percent of the GDP of Sri Lanka,and some 36 percent of the merchandise exports (1990), of which latter figure89 percent is accounted for by three main export crops: tea, rubber andcoconut. The growth record of the agriculture sector in the 1980s is mixed;although the sector achieved 4 percent annual growth rate between 1978-1986,it recently suffered two years (1987 and 1989) of negative growth. Importantfactors contributing to the recent marked variations in the performance of thesector are the civil disturbances in most parts of the country and fluctuatingweather conditions. Taxes from export crops have plummeted from about 25percent of total revenues in 1981 to 2.4 percent in 1990. Agriculture! employs2.2 million persons (43 percent of the labor force) and is an important sourceof income for nearly 70 percent of the country's population who live in ruralareas. Yet, recently, the amount of attention agriculture, in particular thenon-tree crop sector, has received from policy makers has been limitedl tofragmented and piecemeal discussions at the project level. This sectionreviews the recent performance of the non-tree crop agriculture sector andpolicies taken, focussing primarily on paddy, and export crops as a backgroundfor future sector-wide strategy discussions for increasing export orientationof the sector.
a) The Paddy Sector
1.38 Throughout the past, all successive governments in Sri Lanka haveemphasized the expansion of domestic paddy production in order to achieve anumber of objectivea. These objectives broadly involve ensuring national foodsecurity (self-sufficiency), creation of more eLiployment opportunities,enhancing farm household incomes and social welfare, and import substitution.With these goals in view, a wide range of interventions have been made! by alllevels of governments covering many activities such as the supply of inputsand services, procurement and distribution, research and extension,institutional development, trade and imports. As reviewed below, near self-sufficiency in paddy production has been achieved since the mid-1980s. Growthin labor absorption, however, has been rather limited. Employment creationdirectly in agriculture or directly and indirectly in settlement (about 60,000families under Mahaweli), still represents a fairly modest contribution toresolving the overall unemployment problem.
1.39 Production and Self-Sufficiency. Paddy production has increasedmarkedly between 1960-90 rising from 0.62 million metric tons between 1960-62to the average annual paddy output of 2.2 million metric tons between 1980-82,and to 2.4 million metric tons in 1988-90 (see Table 1.16 for summary since1970). In contrast with a rapid increase in the early 1980s, productionduring the latter part of 1980s showed slower and highly variable annualgrowth. The highest level of paddy production was achieved in 1985 with 2.7million metric tons. As a result, rice imports kept declining till 1984 whenthey reached the lowest level of 38 thousand metric tons (2 percent ofdomestic consumption). However, in subsequent years, output declined to a lowpoint of 2.1 million metric tons in 1989 due mostly to the reduction incultivated area because of the civil conflict and adverse weather conditions.
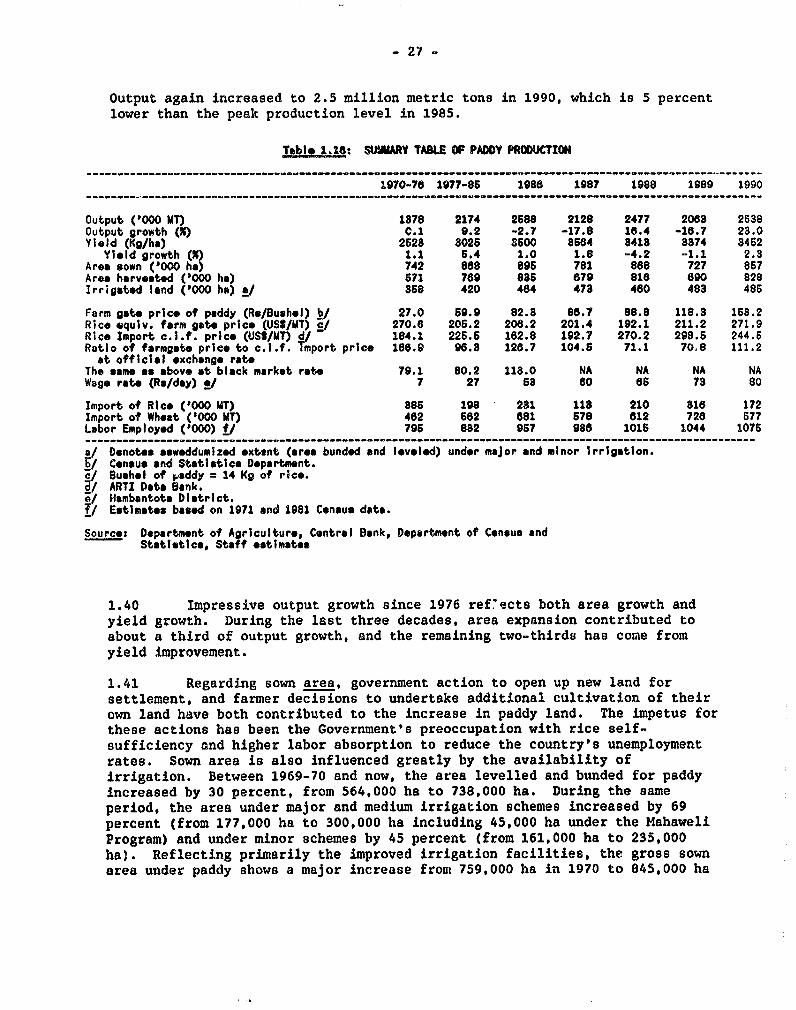
_ 27 -
Output again increased to 2.5 million metric tons in 1990, which is 5 percentlower than the peak production level in 1985.
Table 1.16: SUYWAY TABLE OF PADDY PRODUCTION
1970-76 1977-86 1986 1987 1988 1989 1990
Output ('000 MT) 1378 2174 2688 2128 2477 2063 2638Output growth (X) C.1 9.2 -2.7 -17.8 16.4 -16.7 28.0Yield (Kg/he) 2628 8026 S60S 8564 8418 8374 3452
Yield growth (X) 1.1 6.4 1.0 1.8 -4.2 -1.1 2.3Area gown ('000 h) 742 8s8 895 781 8s8 727 867Area harvested ('000 he) 571 769 83S 679 816 690 828Irrigated land ('000 ha) !/ 858 420 484 478 460 483 486
Farm gate price of paddy (Re/Bushel) k/ 27.0 69.9 82.3 86.7 88.8 118.3 168.2Rice equiv. farm gate price (US$/MT) E/ 270.6 206.2 208.2 201.4 192.1 211.2 271.9Rice Import c.i.f. pr7ce (USS/MT) d/ 184.1 22656 162.8 192.7 270.2 298.6 244.6Ratio of formgato price to c.l.f. Import price 166.9 96.8 128.7 104.6 71.1 70.8 111.2at official exchange rate
The same as above at black market rate 79.1 80.2 113.0 NA NA NA NAWage rate (Ru/day) !/ 7 27 S 60 es 73 80
Import of Rice ('000 MT) 886 198 281 118 210 818 172Import of Wheat ('000 UT) 462 562 881 678 812 728 677Labor Employed ('000) fl 795 882 957 988 1015 1044 1076
a/ Denotes asweddumized extsnt (rea bunded and leveled) under major and minor lrrigation.b/ Census and Statistics Department.c/ Bushel of paddy = 14 Kg of rice.a/ ARTI Data Bank.e/ Hmbantota District.f/ Estimates based on 1971 and 1981 Census data.
Source: Department of Agriculture, Central Bank, Department of Census andStatistics, Staff estimates
1.40 Impressive output growth since 1976 refVects both area growth andyield growth. During the last three decades, area expansion contributed toabout a third of output growth, and the remaining two-thirds has come fromyield improvement.
1.41 Regarding sown area, government action to open up new land forsettlement, and farmer decisions to undertake additional cultivation of theirown land have both contributed to the increase in paddy land. The impetus forthese actions has been the Government's preoccupation with rice self-sufficiency and higher labor absorption to reduce the country's unemploymentrates. Sown area is also influenced greatly by the availability ofirrigation. Between 1969-70 and now, the area levelled and bunded for paddyincreased by 30 percent, from 564,000 ha to 738,000 ha. During the sameperiod, the area under major and medium irrigation schemes increased by 69percent (from 177,000 ha to 300,000 ha including 45,000 ha under the MahaweliProgram) and under minor schemes by 45 percent (from 161,000 ha to 235,000ha). Reflecting primarily the improved irrigation facilities, the gross sownarea under paddy shows a major increase from 759,000 ha in 1970 to 845,000 ha
- 28 -
in 1980. It reached a peak in 1984 with 990,000 ha and since then increasedat a slower pace with wide annual fluctuations between years, due in part tothe civil conflict situation. Cropping intensity remains low at 110-120(gross sown area as a percent of bunded area--with two crops per year, themaximum potential intensity is 200) due primarily to insufficient irrigationwater availability during the Yala season.
1.42 Growth in paddy ylields has been impressive. The first majorincrease occurred towards the end of the 1960s with the introduction of thegreen revolution technologies. From the mid-1970s, of about 2.3 tons/ha,there was a further substantial increase to 3.0 tons/ha in 1981 and a furtherincrease to 3.4 tons/ha in 1988-90, with increased productivity being thedominant contributor to overall production growth. This reflects bothtechnical progress and improved producer incentives. Technically, success inrice research and extension, and improved irrigation facilities and managementhave contributed to the increased yield. Adoption by farmers of high-yieldingvarieties (HYV) has not been a serious problem, consistent with the high levelof education. By the mid-1980s, over 90 percent of the total sown area usedHYVs. As discussed below, the liberalization of input and output marketssince 1977, and the improved incentive and trading environment, includingsharply increased availability of fertilizer to farmers, contributed even moresignificantly to the rapid expansion in the use of yield-increasingtechnologies. Since 1983, however, yields have been broadly stagnant. Thisis partly due to unfavorable weather and security conditions, but also in partbecause readily achievable increases associated with the accessibletechnological potential had been exploited. Further increase, therefore,would require heavy commitments of research and extension--a highly expensiveproposition.
1.43 Another set of factors that contributed to the high paddyproduction is improved producer incentives. The 1977 liberalization of thedomestic rice trade has had significantly positive effects on paddyproduction. Prior to 1977, rice marketing had technically been the monopolyof public sector agencies (though, in practice, they never controlled morethan about a quarter of the trade). The Paddy Marketing Board (PMB) had soleresponsibility for domestic procurement, and the Food Commissioner'sDepartment (FCD) and Multi-Purpose Cooperative Societies (MPCS) wereresponsible for distribution at officially fixed prices which were determinedin a highly politicized context. Furthermore, the farmgate prices weresubstantially below the import price evaluated at the blackmarket rates (Table1.17). The market was then characterized by acute shortages, parallel pricingsystems, and a general lack of responsiveness to market conditions.Liberalization led to a dramatic expansion of competitive private sectoragents and institutions, some quite small; the efficiency and flexibility ofmarket operations markedly increased, responding to shortages or surpluses asthey occurred. Furthermore, marketing agents are now far moreentrepreneurial, searching out opportunities for profitable innovation,production and intermediation. The liberalized and integrated markets havealso allowed prices to reflect locational, seasonal and quality differencesgiving farmers added incentives to produce quality products. In addition,during the most of the mid-1980s, farmgate prices were above import prices,
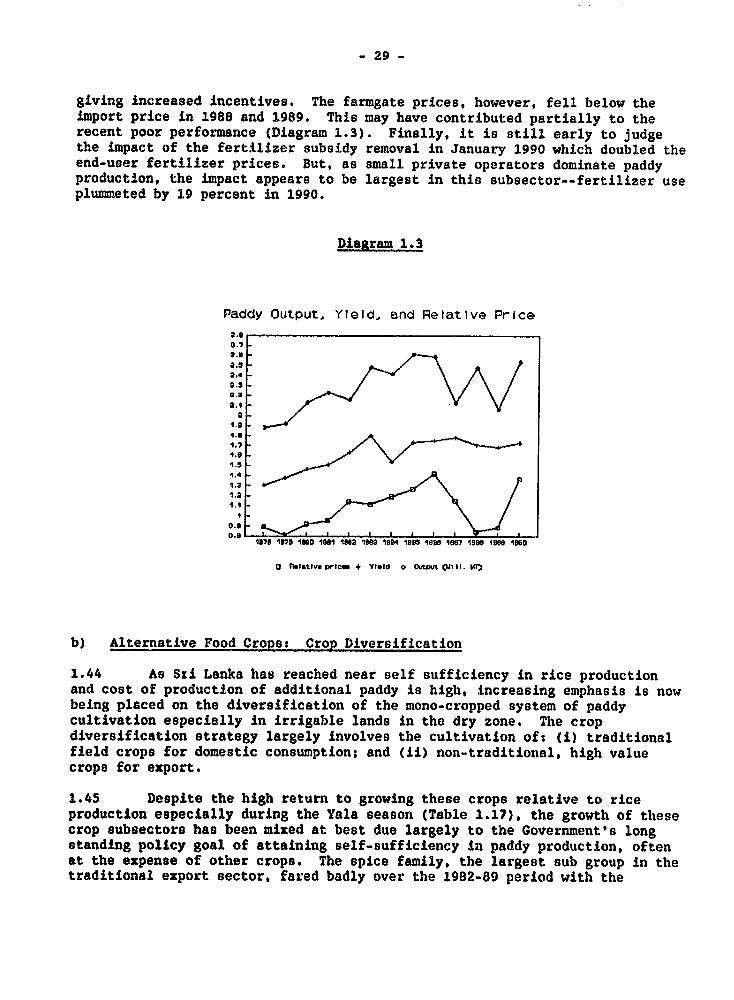
- 29 -
giving increased incentives. The farmgate prices, however, fell below theimport price in 1988 and 1989. This may have contributed partially to therecent poor performance (Diagram 1.3). Finally, it is still early to judgethe impact of the fertilizer subsidy removal in January 1990 which doubled theend-user fertilizer prices. But, as small private operators dominate paddyproduction, the impact appears to be largest in this subsector--fertilizer useplummeted by 19 percent in 1990.
Diagram 1.3
Paddy Output, YTeId, and RelatIve Price2.62.72.8:2.5-2.4-2.3-2.232.1-
I.9I.E-1.7_Ile-1.94.41.34.2I.'
1373 73160 191D INI 1912 1983 1OM *186 096 *I67 1836 693 IND
0 R.lative priem + Yelld 0 Ou9&St j 11. KO)
b) Alternative Food Crops: Crop Diversification
1.44 As Sri Lanka has reached near self sufficiency in rice productionand cost of production of additional paddy is high, increasing emphasis is nowbeing placed on the diversification of the mono-cropped system of paddycultivation especially in irrigable lands in the dry zone. The cropdiversification strategy largely involves the cultivation of: Ci) traditionalfield crops for domestic consumption; and (ii) non-traditional, high valuecrops for export.
1.45 Despite the high return to growing these crops relative to riceproduction especially during the Yala season (Table 1.17), the growth of thesecrop subsectors has been mixed at best due largely to the Government's longstanding policy goal of attaining self-sufficiency in paddy production, oftenat the expense of other crops. The spice family, the largest sub group in thetraditional export sector, fared badly over the 1982-89 period with the
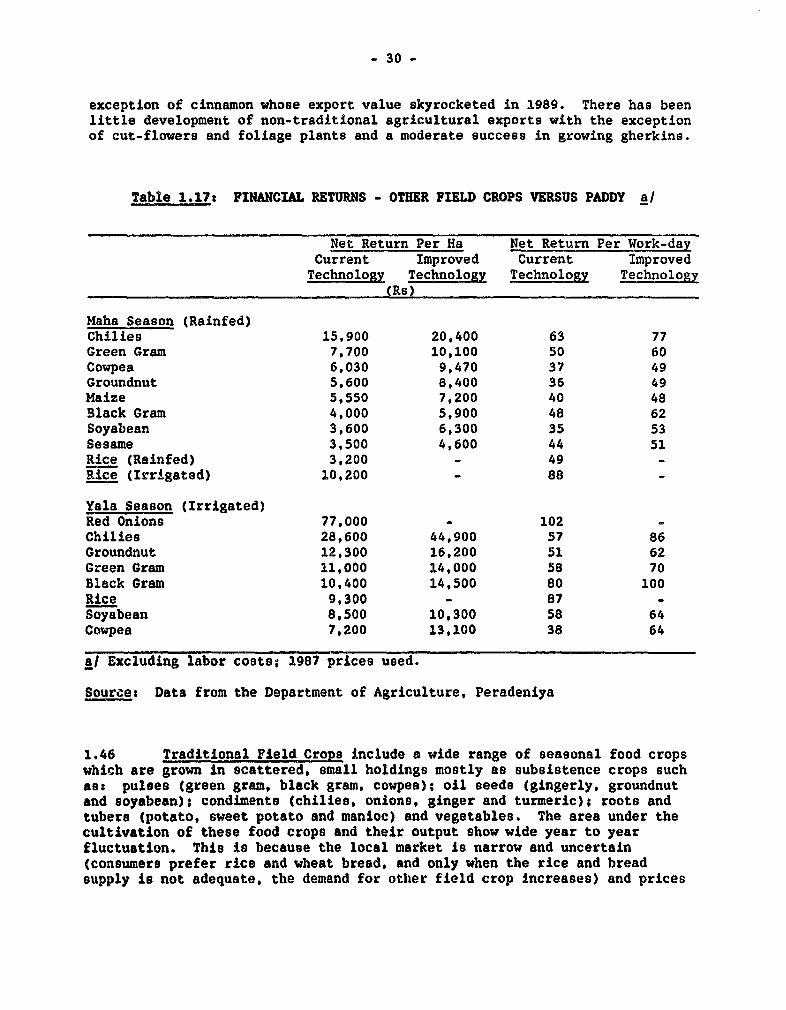
- 30 -
exception of cinnamon whose export value skyrocketed in 1989. There has beenlittle development of non-traditional agricultural exports with the exceptionof cut-flowers and foliage plants and a moderate success in growing gherkins.
Table 1.17: FINANCIAL RETURNS - OTHER FIELD CROPS VERSUS PADDY a/
Net Return Per Ha Net Return Per Work-dayCurrent Improved Current ImprovedTechnology Technology Technology Technology
(Rs)
Maha Season (Rainfed)Chilies 15,900 20,400 63 77Green Gram 7,700 10,100 SO 60Cowpea 6,030 9,470 37 49Groundnut 5,600 8,400 36 49Haize 5,550 7,200 40 48Black Gram 4,000 5,900 48 62Soyabean 3,600 6,300 35 53Sesame 3,500 4,600 44 51Rice (Rainfed) 3,200 - 49 -Rice (Irrigated) 10,200 - 88
Yala Season (Irrigated)Red Onions 77,000 - 102 -Chilies 28,600 44,900 57 86Groundnut 12,300 16,200 51 62Green Gram 11,000 14,000 58 70Black Gram 10,400 14,500 80 100Rice 9,300 - 87 _Soyabean 8,500 10,300 58 64Cowpea 7,200 13,100 38 64
a/ Excluding labor costS, 1987 prices used.
Source: Data from the Department of Agriculture, Peradeniya
1.46 Traditional Field Crops include a wide range of seasonal food cropswhich are grown in scattered, small holdings mostly as subsistence crops suchas: pulses (green gram, black gram, cowpea); oil seeds (gingerly, groundnutand soyabean); condiments (chilies, onions, ginger and turmeric); roots andtubers (potato, sweet potato and manioc) and vegetables. The area under thecultivation of these food crops and their output show wide year to yearfluctuation. This is because the local market is narrow and uncertain(consumers prefer rice and wheat bread, and only when the rice and breadsupply is not adequate, the demand for other field crop increases) and prices
- 31 -
can, therefore, be highly variable--farmers thus tend to minimize theirproduction. The more important causes for this poor situation is the highpriority accorded to rice production--research, extension and marketingservices for non-rice crops have been largely neglected. The effort tocultivate traditional field crops in irrigable paddy lands in the dry zoneduring Yala season has also failed as irrigation management prefers to favorpaddy-growers and tend to ignore the need of other crop growers. Furthermore,policies to protect consumers, such as occasional export bans on coconut meals(which have hurt the oil seed growers) and CWE's monopoly importer position ofchilies and onions discourage farmer's investment in these crops while thesubsidized sugar industry in the past tended to give incentives to farmers togrow sugar cane even if, without subsidies, ither crops might provide higherreturns. As a consequence, their yields have remained virtually static overthe past 15-20 years.
1.47 Non-Traditional Export Crops. Expansion of high value perishablecrops for exporting to high income markets is a relatively recent activityreceiving growing attention in Sri Lanka. The commodities concerned are freshfruits, vegetables, foliage plants and flowers, which are in high demand inthe more affluent economies. The comparative advantage for producing thesecrops in Sri Lanka is mainly due to its geographic location, favorableclimatic conditions and availability of good quality low cost labor. Exportvalue of cut-flowers and foliage plants climbed to Rs 117 million (about US$4million) in 1987, the latest year when separate data for these items isavailable, with an average annual growth rate of 13 percent over the 1982-87period. The growth rate for fresh fruits and vegatables was a mere 1.3percent a.id major effort has been centered around the marketing of freshfruits to traditional markets, e.g., the Maldives and Middle East countriesand the production and marketing of semi-processed gherkins for the Australianand EEC markets. The total value of fresh and processed fruit and vegetableexports in 1990 came to approximately Rs 418 million (about US$10 million),FOB, including Rs 224 million reported for gherkin exports.
1.48 Production of these non-traditional crops is associated with highmanagerial competence and production skills. It also requires highly specificprocessing and storage facilities including refrigerated storage and transportequipment and up-to-date information on and close integration with markets inthe affluent economies. Although the potential for expanding this category ofcrops appear to be promising, many problems have acted as constraints fordeveloping this activity in the recent past. These problems include: lack ofresearch and development efforts; unavailability of unsecured finance forthese new investments with some gestation periods; insufficient transfer oftechnology on post-harvest technology, which is critical but may come withonly direct foreign equity participation. In addition, the restriction thatno private Individual can own a piece of land larger than 50 acres has been amajor impediment to the development of export crops which often requires largescale operations. Finally, as also discussed above on traditional crops, adominating problem has been bias towards rice production--such as difficultyin converting paddy land into other crop cultivation. More even regulatoryand incentive framework will be needed so that farmers will be free to choosecrops aco.ording to their returns.
- 32 -
1.49 Diversification in Perspective. Diversification in agricultureshould essentially depend on private sector investment. The Government'spolicy in encouraging private investments in manufacturing should be appliedin agriculture as well. Namely, the Government should be eliminatingbureaucratic impediments (including official floor prices and paddy-biasedpolicies) and creating a liberalized environment for investors. In thisregard, as discussed above, the ban to convert paddy land to other use shouldbe lifted. The ban on private land ownership exceeding 50 acres should alsobe lifted. Furthermore, insecurity and confusion in legal land tenure (manypeople claiming ownership of the same plot of land) for about 20 percent ofthe country's cultivated area has been a serious impediment in farmdevelopment and require urgent attention by the Government. In addition,irrigation management practices should be established to respond to therequirements of the diversified crops (rather than only for paddy farmers),preferably managed by farmer organizations. At the same time, consideringthat many of the non-paddy crops are exportable, the economy-wide biasesagainst tradeable goods should continue to be removed primarily throughflexible adjustment of exchange rate and encouraging open competition by allprivate agents including foreigners. Finally, as development of the exportcrops sector requires a large amount of foreign investment, discussion inChapter II of the institutional framework for foreign investment promotion ishighly relevant.
c) Impact of the Civil Conflict on Agriculture
1.50 In this section some very broad estimates of the impact of thecivil conflict on agricultural production are made. A brief look at defenseexpenditures and the refugee situation appears in paras. 1.57-1.61.
1.51 Paddy. Since 1983, the conflict with the Liberation Tigers ofTamil Eelam (LTTE) has hampered some paddy production, chiefly in the Northand East. In making an estimate of its impact on production, however, we haveto try to separate the role of the civil conflict and that of other factors,notably weather, for this purpose. As a first step, we have focussed on thegross extent sown in each district in the North and East, as this would be agood proxy for the investment decisions of farmers and most likely to beinfluenced by considerations of civil unrest. Table 1.18 shows the grossextent sown during the Maha and Yala seasonS1 from 1980/81 to 1989/90 in eachof the (currently) five northernY and three eastern districts. Due to thesimplifying assumptions employed, however, this estimate must be regarded asapproximate.
V The Maha season runs from September/October (when sowing occurs) toMarch/April (when the crop is harvested). The Yala season runs from April/May(when sowing occurs) to August/September (when the crop is harvested).
V The Killinochchi District was carved out of the Jaffna District in themid-1980s.
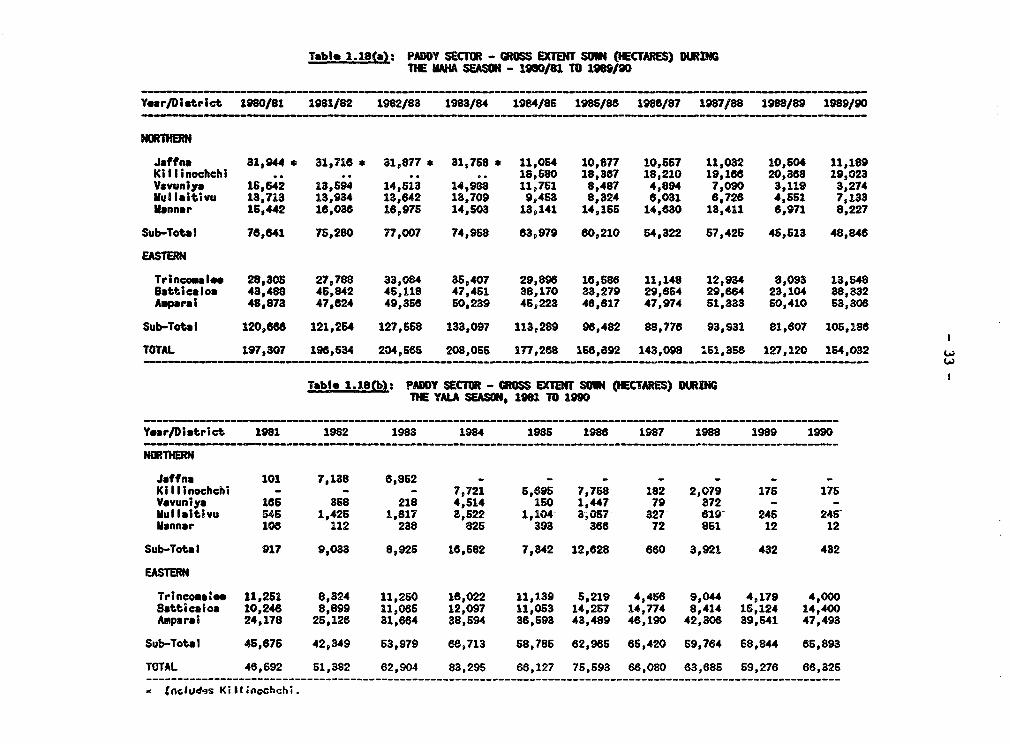
Table 1.18(a): PADY SECTOR - GROSS EXTENT SOW (HECTARES) DURIN¢TlE MMVI SEASON - 196/81 TO 16990
Year/District 1980J81 1981/82 1982/83 1983/84 1984/86 1985/88 1988/87 1987/88 1988/89 1989/90
NORTHERN
Jaffna 31,944 s 31,716 * 81,877 * 31,768 * 11,054 10,877 10,567 11,032 10,504 11,189Killinochchi .. .. 18,580 18,367 18,210 19,188 20,3e8 19,023Vavuniya 16,642 13,594 14,513 14,988 11,761 8,487 4,894 7,090 3,119 3,274Mullaitivu 13,713 13,934 13,642 13,709 9,453 8,324 8,031 6,728 4,551 7,133Mannar 16,442 16,038 16,976 14,503 13,141 14,166 14,630 13,411 6,971 8,227
Sub-Total 76,841 75,280 77,007 74,958 63,979 60,210 54,322 67,425 45,513 48,848
EASTERN
TrincoIalm 28,305 27,788 33,084 35,407 29,898 16,588 11,148 12,934 8,093 13,548Batticalom 43,488 45,842 45,118 47,461 38,170 33,279 29,854 29,864 23,104 38,332Asparai 48,873 47,624 49,358 50,239 45,223 46,617 47,974 61,333 60,410 53,308
Sub-Total 120,668 121,254 127,558 133,097 113,289 98,482 88,778 93,931 81,807 105,188
TOTAL 197,307 198,634 204,565 208,065 177,268 158,892 143,098 161,358 127,120 164,032
Table 1.18(b): PADDY SECTOR - GROSS EXTENT SON (HECTARES) DURINGTIE YALA SEASMN, 1961 TO 1990
Year/District 1981 1982 1983 194 1985 1986 1987 1988 1989 1990
NORTHERN
Jatfna 101 7,138 6,852 - - - - - - -Killinochchi - - - 7,721 6,895 7,768 182 2,079 176 176Vavuniya 165 358 218 4,514 150 1,447 79 372 - -Mullaitivu 545 1,425 1,817 3,622 1,104- 3,O07 327- 819- 245- 246Mannar 106 112 238 825 393 38e 72 861 12 12
Sub-Total 917 9,033 8,926 16,582 7,342 12,628 860 3,921 432 432
EASTERN
Trincomalee 11,251 8,324 11,250 16,022 11,139 6,219 4,458 9,044 4,179 4,000Batticaloa 10,246 8,899 11,066 12,097 11,053 14,267 14,774 8,414 15,124 14,400Amparai 24,178 26,126 31,884 38,594 36,693 43,489 46,190 42,308 39,641 47,493
Sub-Total 45,676 42,349 63,979 88,713 68,786 82,985 86,420 69,784 68,844 65,893
TOTAL 48,692 51,382 62,904 83,295 68,127 75,693 68,080 83,688 69,276 66,326-------------------------------------------------------------------- __-------__---------------------------------- tncitJdis Ki 11 *occhchi .
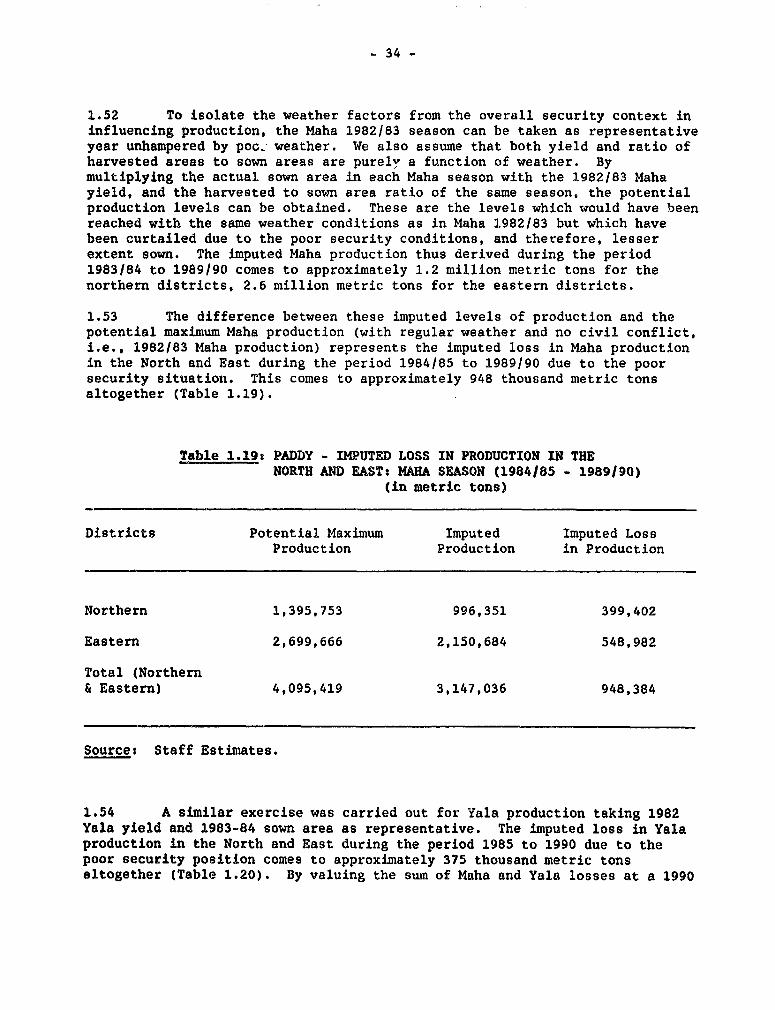
- 34 -
1.52 To isolate the weather factors from the overall security context ininfluencing production, the Maha 1982/83 season can be taken as representativeyear unhampered by poc. weather. We also assume that both yield and ratio ofharvested areas to sown areas are purely a function of weather. Bymultiplying the actual sown area in each Maha season with the 1982/83 Mahayield, and the harvested to sown area ratio of the same season, the potentialproduction levels can be obtained. These are the levels which would have beenreached with the same weather conditions as in Maha 1982/83 but which havebeen curtailed due to the poor security conditions, and therefore, lesserextent sown. The imputed Maha production thus derived during the period1983/84 to 1989/90 comes to approximately 1.2 million metric tons for thenorthern districts, 2.6 million metric tons for the eastern districts.
1.53 The difference between these imputed levels of production and thepotential maximum Maha production (with regular weather and no civil conflict,i.e., 1982/83 Maha production) represents the imputed loss in Maha productionin the North and East during the period 1984/85 to 1989/90 due to the poorsecurity situation. This comes to approximately 948 thousand metric tonsaltogether (Table 1.19).
Table 1.19: PADDY - IMPUTED LOSS IN PRODUCTION IN THENORTH AND EAST: MAHA SEASON (1984/85 - 1989/90)
(in metric tons)
Districts Potential Maximum Imputed Imputed LossProduction Production in Production
Northern 1,395,753 996,351 399,402
Eastern 2,699,666 2,150,684 548,982
Total (Northern& Eastern) 4,095,419 3,147,036 948,384
Source: Staff Estimates.
1.54 A similar exercise was carried out for Yala production taking 1982Yala yield and 1983-84 sown area as representative. The imputed loss in Yalaproduction in the North and East during the period 1985 to 1990 due to thepoor security position comes to approximately 375 thousand metric tonsaltogether (Table 1.20). By valuing the sum of Maha and Yala losses at a 1990
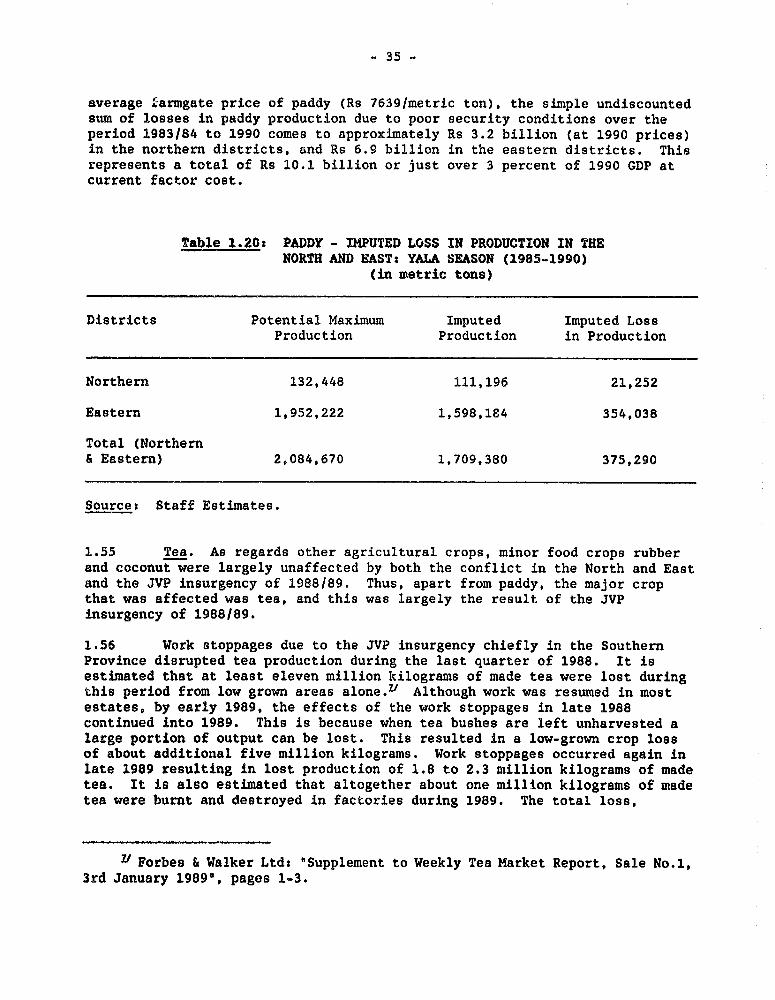
- 35 -
average sarmgate price of paddy (Rs 7639/metric ton), the simple undiscountedsum of losses in paddy production due to poor security conditions over theperiod 1983/84 to 1990 comes to approximately Rs 3.2 billion (at 1990 prices)in the northern districts, and Rs 6.9 billion in the eastern districts. Thisrepresents a total of Rs 10.1 billion or just over 3 percent of 1990 GDP atcurrent factor cost.
Table 1.20: PADDY - IMPUTED LOSS IN PRODUCTION IN THENORTH AND EAST: YALA SEASON (1985-1990)
(in metric tons)
Districts Potential Maximum Imputed Imputed LossProduction Production in Production
Northern 132,448 111,196 21,252
Eastern 1,952,222 1,598,184 354,038
Total (Northern& Eastern) 2,084,670 1,709,380 375,290
Source: Staff Estimates.
1.55 Tea. As regards other agricultural crops, minor food crops rubberand coconut were largely unaffected by both the conflict in the North and Eastand the JVP insurgency of 1988/89. Thus, apart from paddy, the major cropthat was affected was tea, and this was largely the result of the JVPinsurgency of 1988/89.
1.56 Work stoppages due to the JVP insurgency chiefly in the SouthernProvince disrupted tea production during the last quarter of 1988. It isestimated that at least eleven million kilograms of made tea were lost duringthis period from low grown areas alone./ Although work was resumed in mostestates, by early 1989, the effects of the work stoppages in late 1988continued into 1989. This is because when tea bushes are left unharvested alarge portion of output can be lost. This resulted in a low-grown crop lossof about additional five million kilograms. Work stoppages occurred again inlate 1989 resulting in lost production of 1.8 to 2.3 million kilograms of madetea. It is also estimated that altogether about one million kilograms of madetea were burnt and destroyed in factories during 1989. The total loss,
v Forbes & Walker Ltds 'Supplement to Weekly Tea Market Report, Sale No.1,3rd January 1989", pages 1-3.
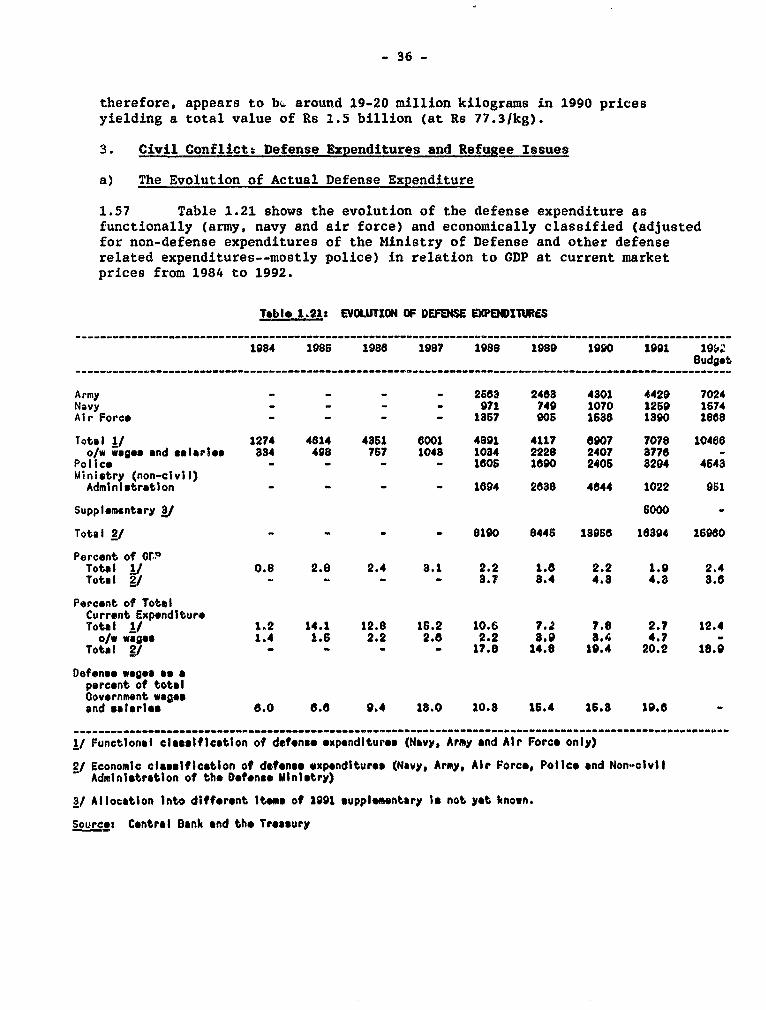
- 36 -
therefore, appears to bL around 19-20 million kilograms in 1990 pricesyielding a total value of Re 1.5 billion (at Rs 77.3/kg).
3. Civil Conflict. Defense Expenditures and RefuRee Issues
a) The Evolution of Actual Defense Expenditure
1.57 Table 1.21 shows the evolution of the defense expenditure asfunctionally (army, navy and air force) and economically classified (adjustedfor non-defense expenditures of the Ministry of Defense and other defenserelated expenditures--mostly police) in relation to GDP at current marketprices from 1984 to 1992.
Table 1.21: EVOLUTION OF DEFENSE EXPENDITURES
-------------------------------------------------------- __-------------------__-------------------------.
1984 1985 1986 1987 1988 1989 1990 1991 19W.Budgot
Army - - - - 2683 2463 4801 4429 7024Navy - - - - 971 749 1070 1259 1674Air Force - - - - 1367 905 1586 1390 1868
Total VJ 1274 4814 4351 6001 4891 4117 6907 7078 10466o/w wages and salaries 334 498 767 1048 1034 2228 2407 3776 -
Police - - - - 1805 1690 2406 3294 4643ministry (non-civil)Administration - - - - 1694 2688 4644 1022 961
Supplomentary t/ 6000
Total O - - - - 8190 8446 18958 18394 16980
Percont of GVrTotal V/ 0.8 2.8 2.4 8.1 2.2 1.8 2.2 1.9 2.4Total V - . - - 8.7 8.4 4.8 4.8 8.6
Percent of TotalCurrent ExpenditureTotal 1/ 1.2 14.1 12.8 16.2 10.6 7.2 7.8 2.7 12.4o/W wages 1.4 1.6 2.2 2.6 2.2 8.9 3.4 4.7 -
Total J -- - - 17.8 14.8 19.4 20.2 18.9
Defens woge as eporcent of totalGovernment wagooand salaries 8.0 6.8 9.4 18.0 10.8 16.4 16.8 19.6 -
1/ Functional classification of defense expenditures (Navy, Army and Air Forceo only)
2/ Economic classlfletion of defense oxpendituros (Navy, Army, Air Force, Polleo and Non-clvllAdministration of the Deftneo MInltry)
3/ Allocation Into difforent Items of 1991 suppleontary ti not yet known.
Soureo: Central Bank and the Treasury
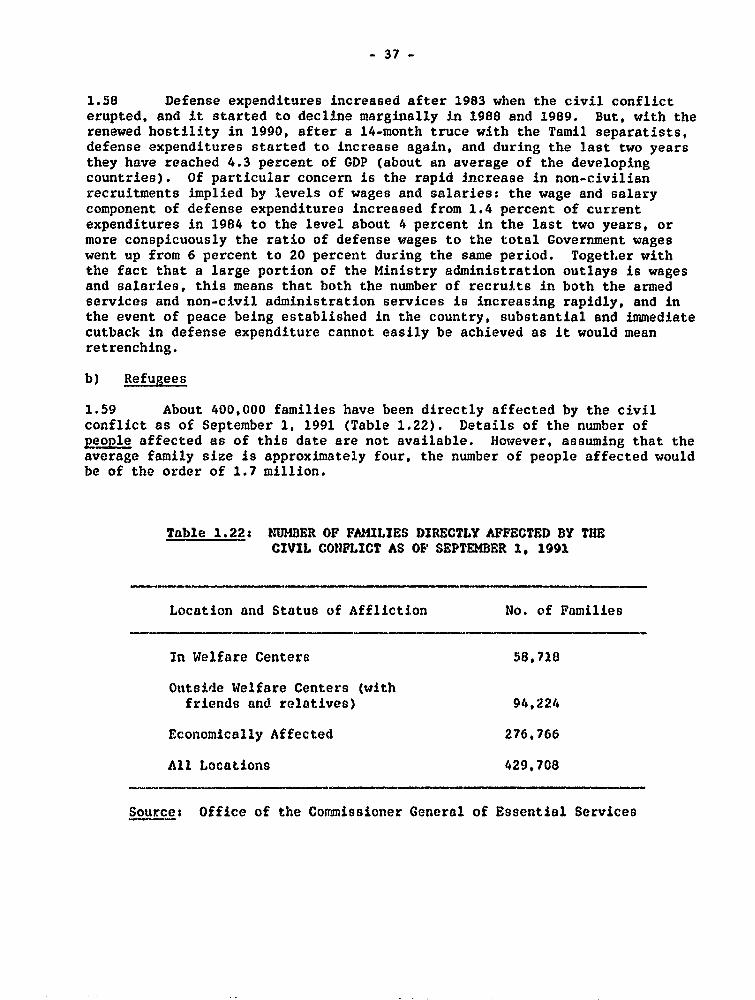
- 37 -
1.58 Defense expenditures increased after 1983 when the civil conflicterupted, and it started to decline marginally in 1988 and 1989. But, with therenewed hostility in 1990, after a 14-month truce with the Tamil separatists,defense expenditures started to increase again, and during the last two yearsthey have reached 4.3 percent of GDP (about an average of the developingcountries). Of particular concern is the rapid Increase in non-civilianrecruitments implied by levels of wages and salaries: the wage and salarycomponent of defense expenditures increased from 1.4 percent of currentexpenditures in 1984 to the level about 4 percent in the last two years, ormore conspicuously the ratio of defense wages to the total Government wageswent up from 6 percent to 20 percent during the same period. TogetLer withthe fact that a large portion of the Ministry administration outlays is wagesand salaries, this means that both the number of recruits in both the armedservices and non-civil administration services is increasing rapidly, and inthe event of peace being established in the country, substantial and immediatecutback in defense expenditure cannot easily be achieved as it would meanretrenching.
b) Refugees
1.59 About 400,000 families have been directly affected by the civilconflict as of September 1, 1991 (Table 1.22). Details of the number ofpeople affected as of this date are not available. However, assuming that theaverage family size is approximately four, the number of people affected wouldbe of the order of 1.7 million.
Table 1.22: tIMDER OF FAMILIES DIRECTLY AFFECTED BY THECIVIL CONFLICT AS OF SEPTEMBER 1, 1991
Location and Status of Affliction No. of Families
In Welfare Centers 58,718
Outside Welfare Centers (withfriends and relatives) 94,224
Economically Affected 276,766
All Locations 429,708
Sourcet Office of the Commissioner General of Essential Services
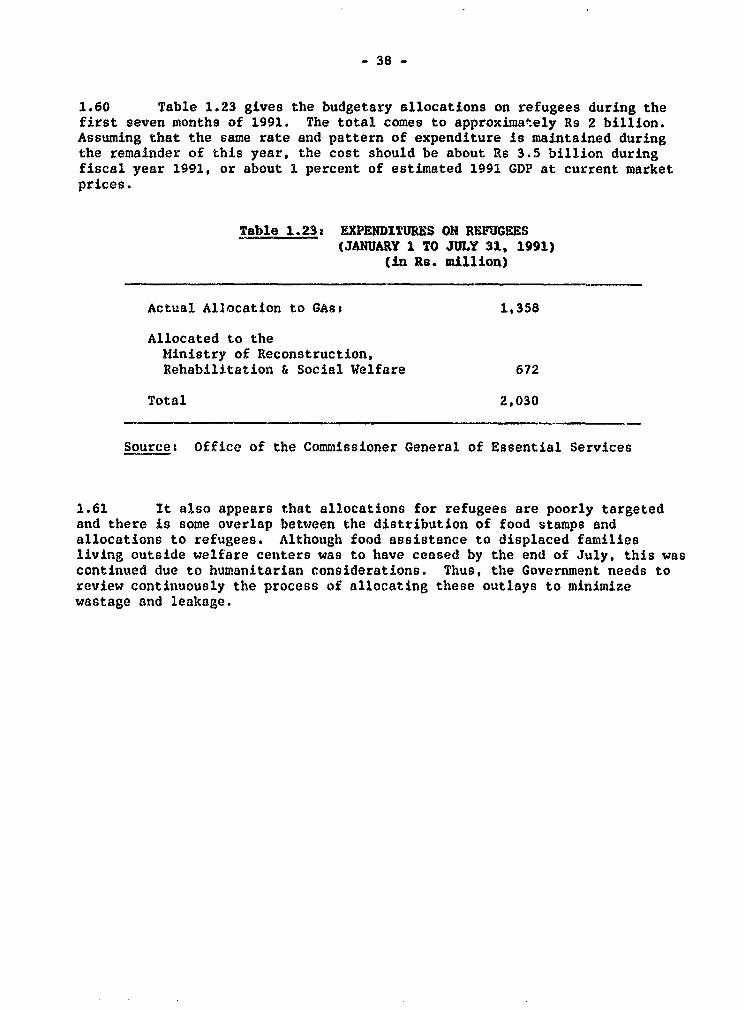
- 38 -
1.60 Table 1.23 gives the budgetary allocations on refugees during thefirst seven months of 1991. The total comes to approximately Rs 2 billion.Assuming that the same rate and pattern of expenditure is maintained duringthe remainder of this year, the cost should be about Rs 3.5 billion duringfiscal year 1991, or about 1 percent of estimated 1991 GDP at current marketprices.
Table 1.23: EXPENDITURES ON REFUGEES(JANUARY 1 TO JULY 31, 1991)
(in Rs. milliont)
Actual Allocation to GAs: 1.358
Allocated to theMinistry of Reconstruction,Rehabilitation & Social Welfare 672
Total 2,030
Source: Office of the Commissioner General of Essential Services
1.61 It also appears that allocations for refugees are poorly targetedand there is some overlap between the distribution of food stamps andallocations to refugees. Although food assistance to displaced familiesliving outside welfare centers was to have ceased by the end of July, this wascontinued due to humanitarian considerations. Thus, the Government needs toreview continuously the process of allocating these outlays to minimizewastage and leakage.
- 39 -
CHAPTER II. TOWARDS A GROWTH-ORIENTED POLICY PACKAGE
1e Introduction
2.1 As discussed in Chapter I. the Government embarked on a majorstabilization-cum-adjustment program in mid-1989, in the face of mountingeconomic and financial difficulties: slow economic growth, an unsustainablefiscal deficit, costly and inefficient welfare programs, an overextendedpublic sector, eroded external competitiveness accompanying a depletion offoreign exchange reserves, and a private sector unwilling to invest. The taskof putting the economy back on track was not easy. Well aware of thechallenge, the Government outlined in the annual Policy Framework Papersreforms required in four areas: (i) macroeconomic stabilization, Cii) publicsector rationalization, (iii) private sector development, and (iv) welfareprogram restructuring.
2.2 The Government is now in the midst of its medium term adjustmenteffort, with encouraging initial results. On the macroeconomic stabilizationfront, measures taken have led to an improvement in the financial situation in1990/1991; foreign exchange reserves rebounded to over two months' worth ofimports notwithstanding the Gulf crisis. In 1990, the Government met thefiscal targets of the program supported by the IMF, despite the difficultiesassociated with restructuring the economy and the military and refugee-relatedexpenditures. In this process, major food and energy subsidies have beenremoved. Although the Government has been successful in addressing the mostcrucial stabilization issues, this has had a cost. The improvement in theoverall budgetary deficit has been achieved at the expense of the investmentprogram which bore the brunt of fiscal adjustment. At the same time, keepinga fixed nominal exchange rate throughout 1990 and most of 1991 has causederosion in the country's external competitiveness. Although the Governmentshould continue making every effort to reduce recurrent expenditures, theremzay not be much latitude for restraining public consumption in the short-term.This, therefore, underscores the importance of wage restraint and, in closeconsultation with IMP, using the exchange rate policy as a complementary meansof macroeconomic adjustment as well as enhancing competitiveness.
2.3 Without a comprehensive public sector rationalization policy,stabilization efforts cannot be sustained in the medium-term. About 8 percentof the country's total population are employed by the public sector. Thepublic sector controls a wide range of activities from manufacturing to trade,banking and Insurance. The Government has already started the process ofpublic sector rationalization. First, it reduced the size of the civilservice by about 10 percent (or 40,000) and the number of ministries.Nonetheless, Sri l.anksn public administration still remains large andinefficient. The Governmenit will need to continue addressing the issues ofpublic sector employment and wage policy, with a view to reducing the civilservice uize, while enhancing its quality. Second, the Government has so far
- 40 -
divested eleven public enterprises out of about 48 PEs--designated forimmediate privatization--some of which, like Ceylon Fertilizer Corporation andCooperative Wholesale Establishment, play a dominant role in their respectivesubsectors. Although the large public sector bus company was converted to 80commercially-oriented "peoplized" companies, the Government has yet to severeits financial ties with the newly privatized bus companies. The Governmentalso needs to accord greater autonomy to corporations remaining under itspurview. Thus, private sector management and ownership have, still, to beintroduced in the bulk of the pervasive public enterprise sector. Third, theGovernment has initiated a process to prepare and adopt an Action Plan torestructure and privatize the management of state-owned treecrops plantationswhich employ about half a million people. It has, however, yet to address theissues of ownership privatization, wage policy, and labor mobility.
2.4 In a country long dominated by socialist tradition, private sectordevelopment will not be easy. Yet, this would be the only way for Sri Lankato achieve its goal in the longer run to join the rank of 'newlyindustrialized countries". Sri Lanka has undertaken trade policy reforms wellahead of many other developing countries. As a result, there are relativelyfew trade related distortions hurting the overall incentive framework. TheGovernment has now to address more entrenched issues of bureaucraticprocedures, a cumbersome legislation, and deterrent labor laws andregulations. Irn addition, the foreign investment regime needs to be reviewedin order to make it more transparent and non-discretionary.
2.5 When the new Government came to power in 1989, it proposedambitious and financially unsustainable welfare programs to deal withperceived social needs. The Government has made considerable progress inrestructuring welfare programs since then. It started to improve theireffectiveness--both in terms of fiscal cost and coverage of the truly needy--through improved targeting and/or design. In this process, the country'sdistricts have been regrouped into 11 units, and the Jana Saviya (povertyalleviation) Program (JSP) has been implemented in one or two units at a timethereby spreading the cost over a longer time horizon. The number of secondround beneficiaries has also been reduced by about 40 percent and itsproduction orientation has been increased. Similarly, the number of foodstamp recipient families has been nearly halved. While these measuresrepresent significant improvements, there exists strong political pressures toincrease the coverage and the consumption orientation of these welfareprograms. Also, although the cost of the Mid-Day Meal Program (MDMP) has beenreduced, it has not at all been an effective means of addressing thenutritional needs of those at risk.
2.6 This Chapter reviews the actions taken and their results in thesefour policy areas. In the light of the issues still outstanding, it outlinesthe measures that would be needed for Sri Lanka to sustain its reform programand maintain the economy on a high growth path.
- 41 -
2. Macroecon mic Management for Enhanced Export Orientation
2.3 The Government achieved most of the PFP targets in 1990 through apronounced tightening of both fiscal and monetary policies. The Government,however, relaxed its grip on tight macroeconomic management in 1991 because ofhigh security-related expenditures and significant cost of public sectorworkers' severance packages. As a result, fiscal deficit appears to haveexceeded the target by nearly one percentage point of GDP, a situation theGovernment is trying to reverse in 1992. In addition, there are at least twoemerging worrisome signs in the pattern of macroeconomic development. one isthe pattern of investment: overall investment in real terms has stagnetedsince the mid-1980s with public investment falling sharply; and within privateinvestment an increasing proportion appears to have gone into housing in 1990.These are partially due to the bias in the economy towards consumption becauseof the Government's high recurrent expenditures. The other aspect is that,measured either by the trends in real effective exchange rate or by unit laborcosts, the economy's external competitiveness has been eroding.
a) Evolution of Investments and Savings
2.4 If Sri Lanka is to eventually join the ranks of newlyindustrialized countries (NIC), efficient capital accumulation needs to takeplace primarily driven by private investments. The key role of publicinvestments is to provide infrastructure that complements private activities,and as such, a careful and continuous review is necessary as to the selectionof public investments lest they crowd out private investors. Successful Asiancountries, such as Malaysia, Thailand and Korea, invested 25-30 percent oftheir GDP during periods of sustained growth with the private sector investinga little less than 20 percent and the public sector somewhere close to 10percent. Investment in Sri Lanka as a share of GDP compares unfavorably withthem. First of all the share of investment in GDP has been on the declinethroughout the decade (Table 2.1)L. The share of total investment in GDPstood at about 21 percent of GDP in 1988-90. Although Sri Lanka went througha period (1980-83) when it invested 30 percent of GDP, a significant portionof this was large public investment in the Mahaweli River Scheme, whichunfortunately turned out to have very low returns. In addition, realinvestments have more or less stagnated since the mid-1980s and have in factdeclined over the last two years (Table 2.2). This stagnating investment hasbeen caused primarily by falling public investment, due in the mid-1980s, tocompletion of various large projects under the Mahaweli River Scheme. Morepronounced decline in public investment occurred in 1989 and 1990 when thestabilization and restructuring program got under way; public investments weresuppressed to achieve the goal of stabilization and infrastructuralinvestments, which complements private investments, were also suppressed.Because the quality of infrastructural services affects the cost of doingbusiness and therefore is an important consideration for private productive
O Table 2.1 is in constant prices to emphasize the higher increase inthe investment deflator than that of the GDP deflator.
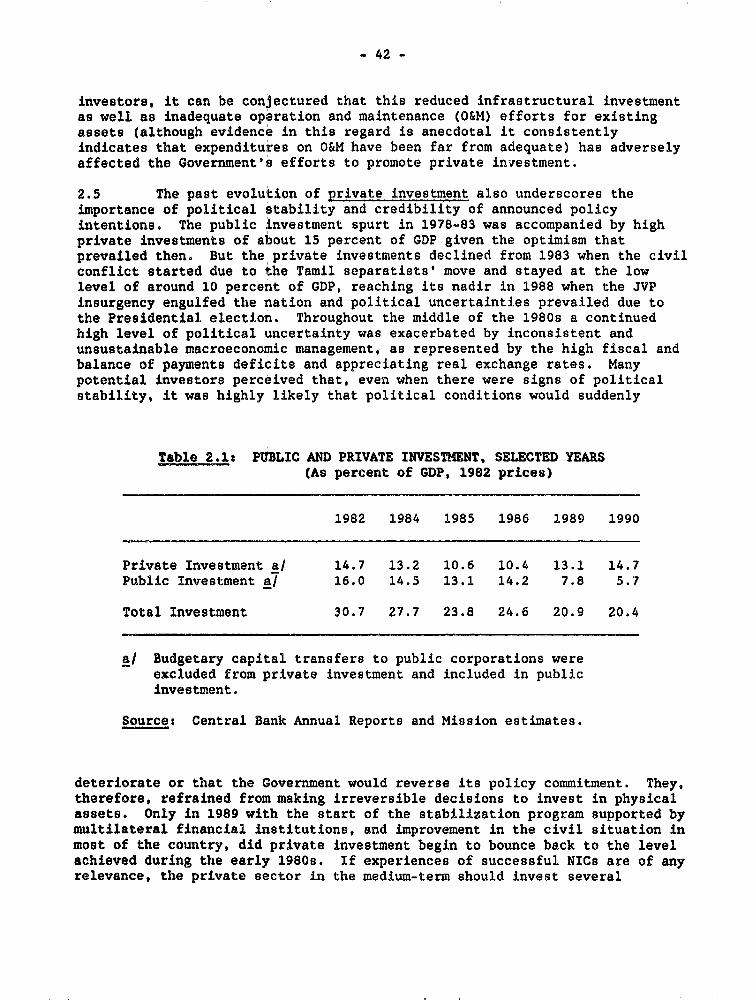
- 42 -
investors, it can be conjectured that this reduced infrastructural investmentas well as inadequate operation and maintenance (O&M) efforts for existingassets (although evidence in this regard is anecdotal it consistentlyindicates that expenditures on O&M have been far from adequate) has adverselyaffected the Government's efforts to promote private investment.
2.5 The past evolution of private investment also underscores theimportance of political stability and credibility of announced policyintentions. The public investment spurt in 1978-83 was accompanied by highprivate investments of about 15 percent of GDP given the optimism thatprevailed then. But the private investments declined from 1983 when the civilconflict started due to the Tamil separatists' move and stayed at the lowlevel of around 10 percent of GDP, reaching its nadir in 1988 when the JVPinsurgency engulfed the nation and political uncertainties prevailed due tothe Presidential election. Throughout the middle of the 1980s a continuedhigh level of political uncertainty was exacerbated by inconsistent andunsustainable macroeconomic management, as represented by the high fiscal andbalance of payments deficits and appreciating real exchange rates. Manypotential investors perceived that, even when there were signs of politicalstability, it was highly likely that political conditions would suddenly
Table 2.1s PUBLIC AND PRIVATE INVESTMENT, SELECTED YEARS(As percent of GDP, 1982 prices)
1982 1984 1985 1986 1989 1990
Private Investment a/ 14.7 13.2 10.6 10.4 13.1 14.7Public Investment a/ 16.0 14.5 13.1 14.2 7.8 5.7
Total Investment 30.7 27.7 23.8 24.6 20.9 20.4
a/ Budgetary capital transfers to public corporations wereexcluded from private investment and included in publicinvestment.
Source: Central Bank Annual Reports and Mission estimates.
deteriorate or that the Government would reverse its policy commitment. They,therefore, refrained from making irreversible decisions to invest in physicalassets. Only in 1989 with the start of the stabilization program supported bymultilateral financial institutions, and improvement in the civil situation inmost of the country, did private investment begin to bounce back to the levelachieved during the early 1980s. If experiences of successful NICs are of anyrelevance, the private sector in the medium-term should invest several
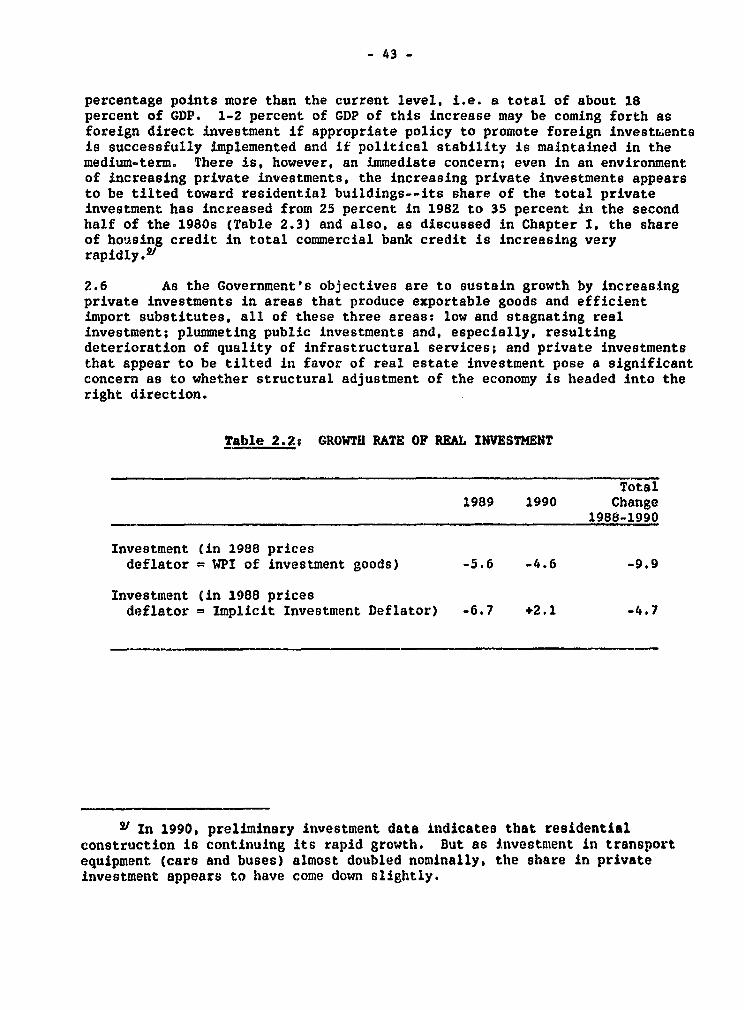
- 43 -
percentage points more than the current level, i.e. a total of about 18percent of GDP. 1-2 percent of GDP of this increase may be coming forth asforeign direct investment if appropriate policy to promote foreign investr,entsis successfully implemented and if political stability is maintained in themedium-term. There is, however, an immediate concern; even in an environmentof increasing private investments, the increasing private investments appearsto be tilted toward residential buildings--its share of the total privateinvestment has increased from 25 percent in 1982 to 35 percent in the secondhalf of the 1980s (Table 2.3) and also, as discussed in Chapter I, the shareof housing credit in total commercial bank credit is increasing veryrapidly .9'
2.6 As the Government's objectives are to sustain growth by increasingprivate investments in areas that produce exportable goods and efficientimport substitutes, all of these three areas: low and stagnating realinvestment; plummeting public investments and, especially, resultingdeterioration of quality of infrastructural services; and private investmentsthat appear to be tilted in favor of real estate investment pose a significantconcern as to whether structural adjustment of the economy is headed into theright direction.
Table 2.2: GROWTH RATE OF REAL INVESTMENT
Total1989 1990 Change
1988-1990
Investment (in 1988 pricesdeflator = WPI of investment goods) -5.6 -4.6 -9.9
Investment (in 1988 pricesdeflator = Implicit Investment Deflator) -6.7 +2.1 -4.7
S In 1990, preliminary investment data indicates that residentialconstruction is continuing its rapid growth. But as investmeent in transportequipment (cars and buses) almost doubled nominally, the share in privateinvestment appears to have come down slightly.
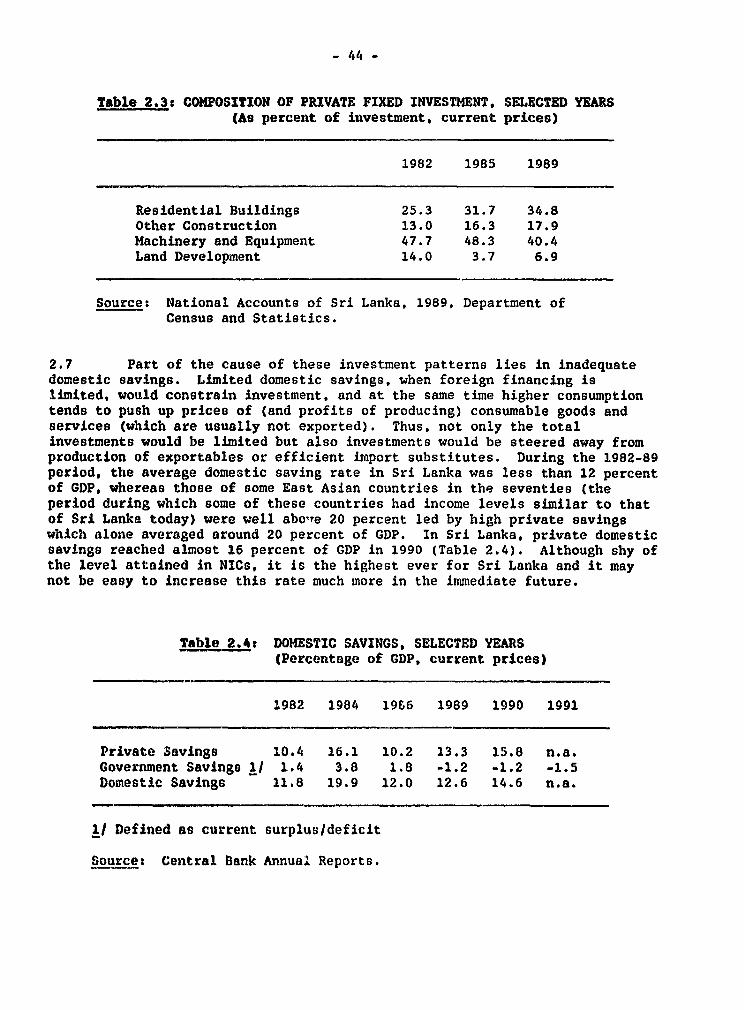
- 44 -
Table 2.3: COMPOSITION OF PRIVATE FIXED INVESTMENT, SELECTED YEARS(As percent of investment, current prices)
1982 1985 1989
Residential Buildings 25.3 31.7 34.8Other Construction 13.0 16.3 17.9Machinery and Equipment 47.7 48.3 40.4Land Development 14.0 3.7 6.9
Source: National Accounts of Sri Lanka, 1989, Department ofCensus and Statistics.
2.7 Part of the cause of these investment patterns lies in inadequatedomestic savings. Limited domestic savings, when foreign financing islimited, would constrain investment, and at the same time higher consumptiontends to push up prices of (and profits of producing) consumable goods andservices (which are usually not exported). Thus, not only the totalinvestments would be limited but also investments would be steered away fromproduction of exportables or efficient import substitutes. During the 1982-89period, the average domestic saving rate in Sri Lanka was less than 12 percentof GDP, whereas those of some East Asian countries in the seventies (theperiod during which some of these countries had income levels similar to thatof Sri Lanka today) were well abo're 20 percent led by high private savingswhich alone averaged around 20 percent of GDP. In Sri Lanka, private domesticsavings reached almost 16 percent of GDP in 1990 (Table 2.4). Although shy ofthe level attained in NICs, it is the highest ever for Sri Lanka and it maynot be easy to increase this rate much more in the immediate future.
Table 2.4, DOMESTIC SAVINGS, SELECTED YEARS(Percentage of GDP, current prices)
1982 1984 19&6 1989 1990 1991
Private Savings 10.4 16.1 10.2 13.3 15.8 n.a.Government Savings 11 1.4 3.8 1.8 -1.2 -1.2 -1.5Domestic Savings 11.8 19.9 12.0 12.6 14.6 n.a.
1/ Defined as current surplus/deficit
Source: Central Bank Annual Reports.
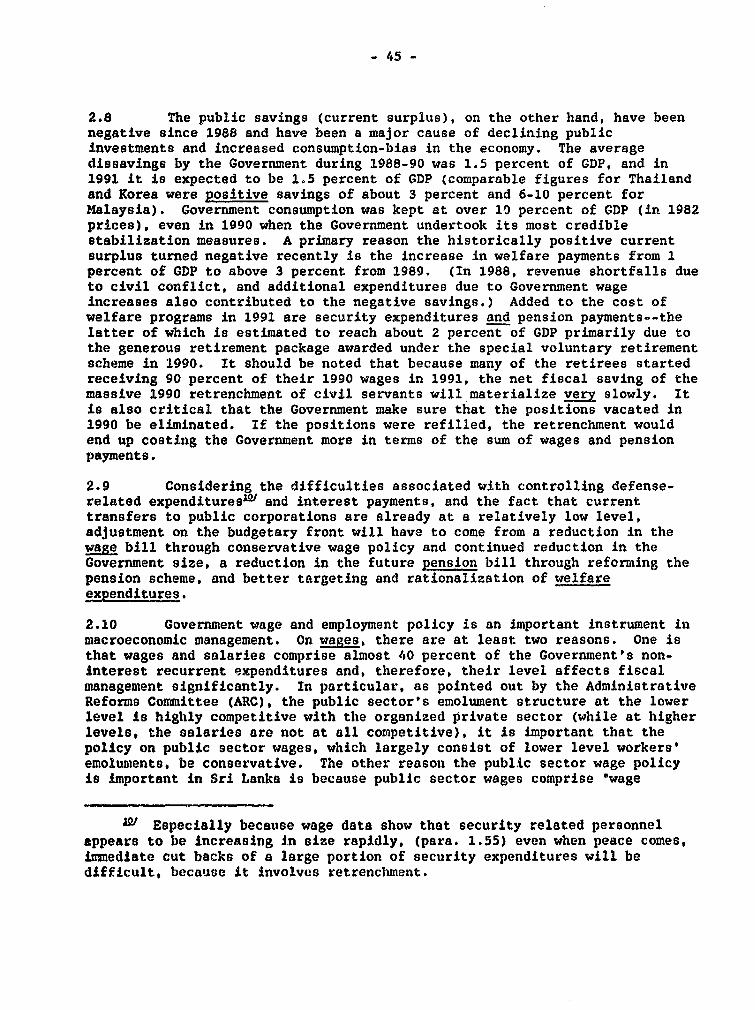
- 45 -
2.8 The public savings (current surplus), on the other hand, have beennegative since 1988 and have been a major cause of declining publicinvestments and increased consumption-bias in the economy. The averagedissavings by the Government during 1988-90 was 1.5 percent of GDP, and in1991 it is expected to be 1.5 percent of GDP (comparable figures for Thailandand Korea were positive savings of about 3 percent and 6-10 percent forMalaysia). Government consumption was kept at over 10 percent of GDP (in 1982prices), even in 1990 when the Government undertook its most crediblestabilization measures. A primary reason the historically positive currentsurplus turned negative recently is the increase in welfare payments from 1percent of GDP to above 3 percent from 1989. (In 1988, revenue shortfalls dueto civil conflict, and additional expenditures due to Government wageincreases also contributed to the negative savings.) Added to the cost ofwelfare programs in 1991 are security expenditures and pension payments--thelatter of which is estimated to reach about 2 percent of GDP primarily due tothe generous retirement package awarded under the special voluntary retirementscheme in 1990. It should be noted that because many of the retirees startedreceiving 90 percent of their 1990 wages in 1991, the net fiscal saving of themassive 1990 retrenchment of civil servants will materialize very slowly. Itis also critical that the Government make sure that the positions vacated in1990 be eliminated. If the positions were refilled, the retrenchment wouldend up costing the Government more in terms of the sum of wages and pensionpayments.
2.9 Considering the difficulties associated with controlling defense-related expendituresn1 and interest payments, and the fact that currenttransfers to public corporations are already at a relatively low level,adjustment on the budgetary front will have to come from a reduction in thewage bill through conservative wage policy and continued reduction in theGovernment size, a reduction in the future pension bill through reforming thepension scheme, and better targeting and rationalization of welfareexpenditures.
2.10 Government wage and employment policy is an important instrument inmacroeconomic management. On wages, there are at least two reasons. One isthat wages and salaries comprise almost 40 percent of the Government's non-interest recurrent expenditures and, therefore, their level affects fiscalmanagement significantly. In particular, as pointed out by the AdministrativeReforms Committee (ARC), the public sector's emolument structure at the lowerlevel is highly competitive with the organized private sector (while at higherlevels, the salaries are not at all competitive), it is important that thepolicy on public sector wages, which largely consist of lower level workers'emolunments, be conservative. The other reason the public sector wage policyis important in Sri Lanka is because public sector wages comprise "wage
ly Especially because wage data show that security related personnelappears to be increasing in size rapidly, (para. 1.55) even when peace comes,imnediate cut backs of a large portion of security expenditures will bedifficult, because it involves retrenchment.
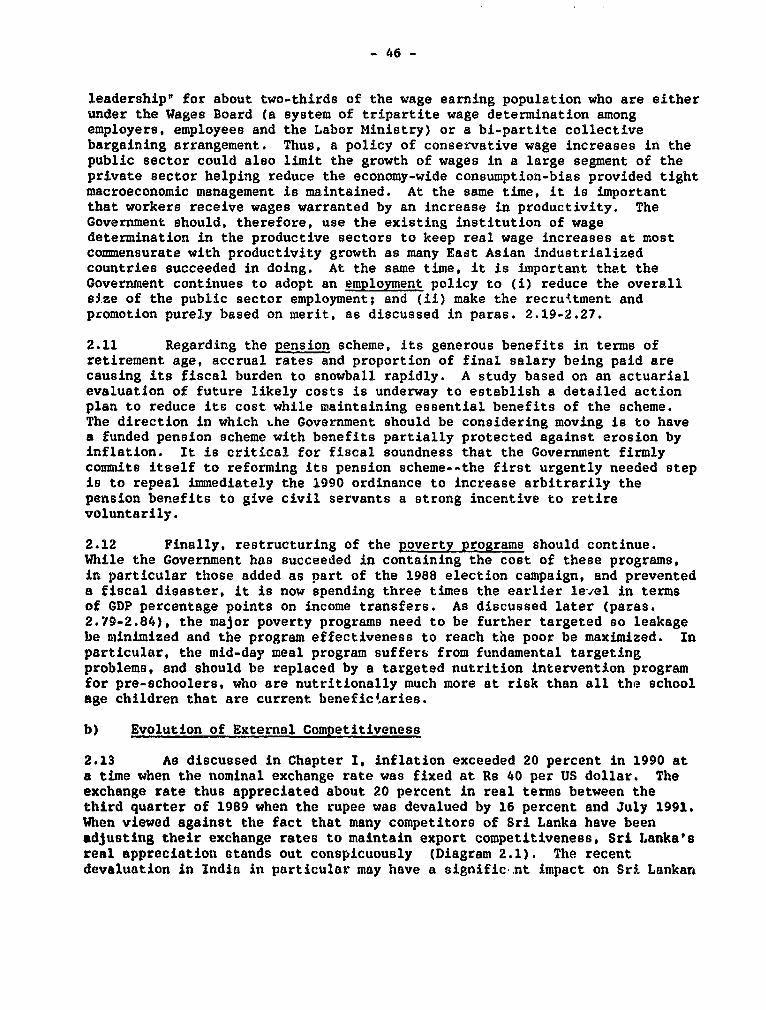
- 46 -
leadership" for about two-thirds of the wage earning population who are eitherunder the Wages Board (a system of tripartite wage determination amongemployers, employees and the Labor Ministry) or a bi-partite collectivebargaining arrangement. Thus, a policy of conservative wage increases in thepublic sector could also limit the growth of wages in a large segment of theprivate sector helping reduce the economy-wide consumption-bias provided tightmacroeconomic management is maintained. At the same time, it is importantthat workers receive wages warranted by an increase in productivity. TheGovernment should, therefore, use the existing institution of wagedetermination in the productive sectors to keep real wage increases at mostcommensurate with productivity growth as many East Asian industrializedcountries succeeded in doing. At the same time, it is important thet theGovernment continues to adopt an employment policy to (i) reduce the overallsize of the public sector employment; and (ii) make the recruttment andpromotion purely based on merit, as discussed in paras. 2.19-2.27.
2.11 Regarding the pension scheme, its generous benefits in terms ofretirement age, accrual rates and proportion of final salary being paid arecausing its fiscal burden to snowball rapidly. A study based on an actuarialevaluation of future likely costs is underway to establish a detailed actionplan to reduce its cost while maintaining essential benefits of the scheme.The direction in which ihe Government should be considering moving is to havea funded pension scheme with benefits partially protected against erosion byinflation. It is critical for fiscal soundness that the Government firmlycomiits itself to reforming its pension scheme--the first urgently needed stepis to repeal immediately the 1990 ordinance to increase arbitrarily thepension benefits to give civil servants a strong incentive to retirevoluntarily.
2.12 Finally, restructuring of the poverty programs should continue.While the Government has succeeded in containing the cost of these programs,in particular those added as part of the 1988 election campaign, and preventeda fiscal disaster, it is now spending three times the earlier level in termsof GDP percentage points on income transfers. As discussed later (paras.2.79-2.84), the major poverty programs need to be further targeted so leakagebe minimized and the program effectiveness to reach the poor be maximized. Inparticular, the mid-day meal program suffers from fundamental targetingproblems, and should be replaced by a targeted nutrition intervention programfor pre-schoolers, who are nutritionally much more at risk than all the schoolage children that are current benefictaries.
b) Evolution of External Competitiveness
2.13 As discussed in Chapter I, inflation exceeded 20 percent in 1990 ata time when the nominal exchange rate was fixed at Rs 40 per US dollar. Theexchange rate thus appreciated about 20 percent in real terms between thethird quarter of 1989 when the rupee was devalued by 16 percent and July 1991.When viewed against the fact that many competitors of Sri Lanka have beenadjusting their exchange rates to maintain export competitiveness, Sri Lanka'sreal appreciation stands out conspicuously (Diagram 2.1). The recentdevaluation in India in particular may have a signific.nt impact on Sri Lankan
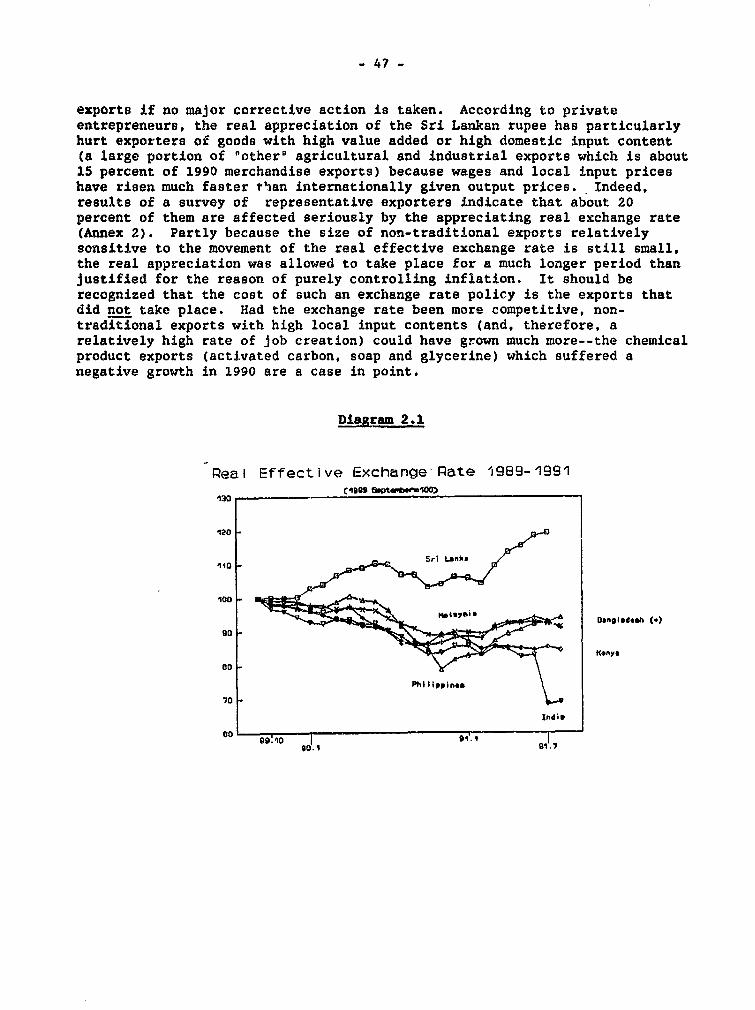
- 47 -
exports if no major corrective action is taken. According to privateentrepreneurs, the real appreciation of the Sri Lankan rupee has particularlyhurt exporters of goods with high value added or high domestic input content(a large portion of Pother" agricultural and industrial exports which is about15 percent of 1990 merchandise exports) because wages and local input priceshave risen much faster than internationally given output prices. Indeed,results of a survey of representative exporters indicate that about 20percent of them are affected seriously by the appreciating real exchange rate(Annex 2). Partly because the size of non-traditional exports relativelysonsitive to the movement of the real effective exchange rate is still small,the real appreciation was allowed to take place for a much longer period thanjustified for the reason of purely controlling inflation. It should berecognized that the cost of such an exchange rate policy is the exports thatdid not take place. Had the exchange rate been more competitive, non-traditional exports with high local input contents (and, therefore, arelatively high rate of job creation) could have grown much more--the chemicalproduct exports (activated carbon, soap and glycerine) which suffered anegative growth in 1990 are a case in point.
Diagram 2.1
Real Effective Exchange Pate 1989-1991
'130
120-
*100t~~~~~~~~~~~~~~~~~~~~O0 , sD.elh (.)
PhilIippints
70
Indio
Go I9' tO gjs. *
90.1 931.7
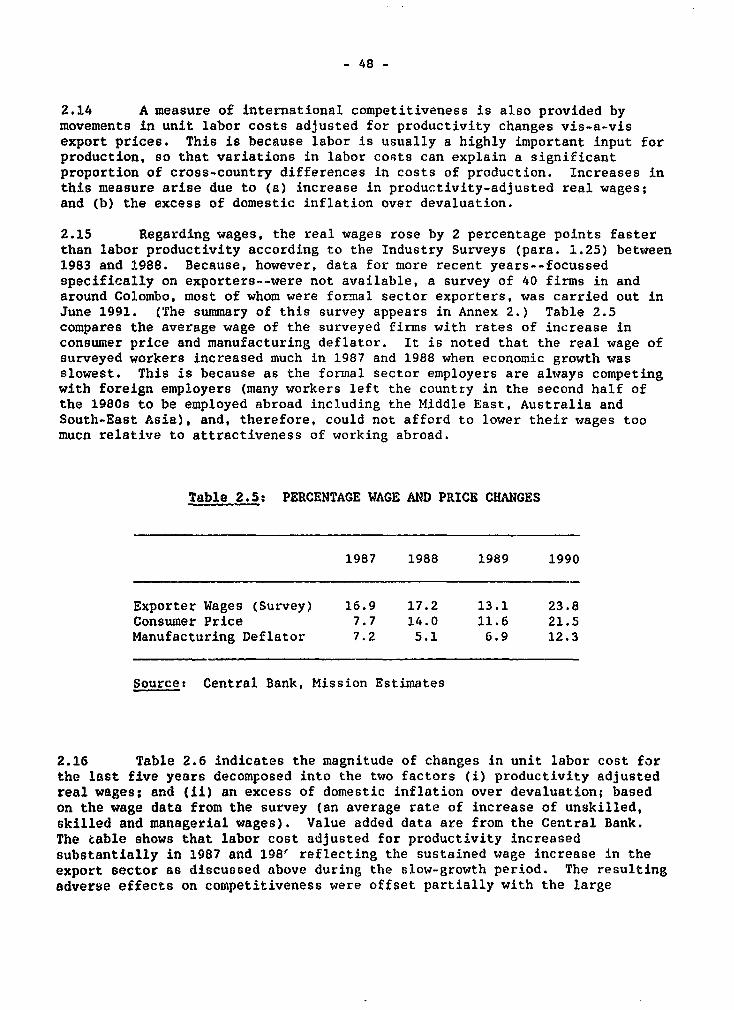
- 48 -
2.14 A measure of international competitiveness is also provided bymovements in unit labor costs adjusted for productivity changes vis-a-visexport prices. This is because labor is usually a highly important input forproduction, so that variations in labor costs can explain a significantproportion of cross-country differences in costs of production. Increases inthis measure arise due to (a) increase in productivity-adjusted real wages;and (b) the excess of domestic inflation over devaluation.
2.15 Regarding wages, the real wages rose by 2 percentage points fasterthan labor productivity according to the Industry Surveys (para. 1.25) between1983 and 1988. Because, however, data for more recent years--focussedspecifically on exporters--were not available, a survey of 40 firms in andaround Colombo, most of whom were formal sector exporters, was carried out inJune 1991. (The summary of this survey appears in Annex 2.) Table 2.5compares the average wage of the surveyed firms with rates of increase inconsumer price and manufacturing deflator. It is noted that the real wage ofsurveyed workers increased much in 1987 and 1988 when economic growth wasslowest. This is because as the formal sector employers are always competingwith foreign employers (many workers left the country in the second half ofthe 1980s to be employed abroad including the Middle East, Australia andSouth-East Asia), and, therefore, could not afford to lower their wages toomucn relative to attractiveness of working abroad.
Table 2.5: PERCENTAGE WAGE AND PRICE CHANGES
1987 1988 1989 1990
Exporter Wages (Survey) 16.9 17.2 13.1 23.8Consumer Price 7.7 14.0 11.6 21.5Manufacturing Deflator 7.2 5.1 6.9 12.3
Sourcet Central Bank, Mission Estimates
2.16 Table 2.6 indicates the magnitude of changes in unit labor cost forthe last five years decomposed into the two factors (i) productivity adjustedreal wages; and (ii) an excess of domestic inflation over devaluation; basedon the wage data from the survey (an average rate of increase of unskilled,skilled and managerial wages). Value added data are from the Central Bank.The table shows that labor cost adjusted for productivity increasedsubstantially in 1987 and 198' reflecting the sustained wage increase in theexport sector as discussed above during the slow-growth period. The resultingadverse effects on competitiveness were offset partially with the large
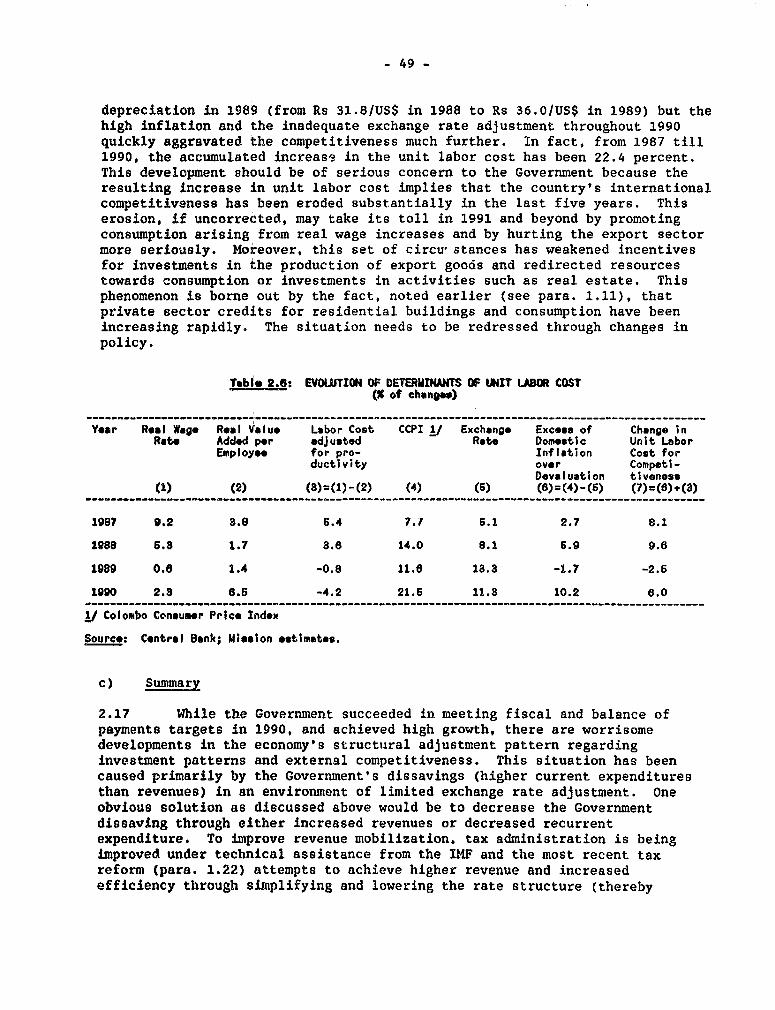
- 49 -
depreciation in 1989 (from Rs 31.8/US$ in 1988 to Rs 36.01US$ in 1989) but thehigh inflation and the inadequate exchange rate adjustment throughout 1990quickly aggravated the competitiveness much further. In fact, from 1987 till1990, the accumulated increase in the unit labor cost has been 22.4 percent.This development should be of serious concern to the Government because theresulting increase in unit labor cost implies that the country's internationalcompetitiveness has been eroded substantially in the last five years. Thiserosion, if uncorrected, may take its toll in 1991 and beyond by promotingconsumption arising from real wage increases and by hurting the export sectormore seriously. Moreover, this set of circu stances has weakened incentivesfor investments in the production of export goods and redirected resourcestowards consumption or investments in activities such as real estate. Thisphenomenon is borne out by the fact, noted earlier (see para. 1.11), thatprivate sector credits for residential buildings and consumption have beenincreasing rapidly. The situation needs to be redressed through changes inpolicy.
Table 2.6: EVOLUTION OF DETERMINANTS OF UNIT LABOR COST(X of changes)
Year Roal Wago Real Value Labor Cost CCPI 1/ Exchange Excess of Change inRate Added per adjusted Rate Domestic Unit Labor
Employ" for pro- Inflation Cost forductivity over Competi-
Devaluation ti veness(1) (2) (8)=(1)-(2) (4) (6) (6)=(4)-(S) (7)=(8) .(3)
1987 9.2 8.8 6.4 7.7 6.1 2.7 8.1
1988 5.3 1.7 3.6 14.0 8.1 6.9 9.6
s989 0.8 1.4 -0.8 11.6 13.3 -1.7 -2.6
1990 2.3 6.5 -4.2 21.6 11.3 10.2 6.0
1/ Colombo Consumer Price Index
Source: Central Bank; Mission estimates.
c) Summary
2.17 While the Government succeeded in meeting fiscal and balance ofpayments targets in 1990, and achieved high growth, there are worrisomedevelopments in the economy's structuiral adjustment pattern regardinginvestment patterns and external competitiveness. This situation has beencaused primarily by the Government's dissavings (higher current expendituresthan revenues) in an environment of limited exchange rate adjustment. Oneobvious solution as discussed above would be to decrease the Governmentdissaving through either increased revenues or decreased recurrentexpenditure. To improve revenue mobilization, tax administration is beingimproved under technical assistance from the IMF and the most recent taxreform (para. 1.22) attempts to achieve higher revenue and increasedefficiency through simplifying and lowering the rate structure (thereby
- 50 -
enlarging the tax base). In the immediate future, however, these efforts areexpected to have a limited additional revenue mobilization effect over andabove the already relatively high tax revenue of close to 20 percent of GDP,although the defense levy and additional excises will attenuate the problem.On expenditures, as discussed above, conservative wage policies would producesavings only in the medium-term. So does retrenchment because the terms ofseverance payments and pension are so generous. In addition, the securityexpenditures continue to put fiscal pressure on economic management. The onlyobvious candidate for immediate savings is further improving the costeffectiveness of the welfare programs. In particular, the mid-day mealprogram should be replaced by a more effectivle nutrition intervention program--but this will save less than 0.5 percent of GDP. The Government needs tomake serious efforts toward achieving positive public sector savings, even ifa substantial reduction in recurrent expenditures in the short-run isdifficult. This relative rigidity on the fiscal front implies that a flexiblemanagement of nominal exchange rate must play a more prominent and active rolein economic management of Sri Lanka than it has done in the last two years.Exchange rate policy needs to be worked out in close collaboration with theIMF to assure closer control of demand management and wage (including pension)policy. Without these complementary policies, the exchange rate policy wouldnot be effective.
3. Reduction of the Government's Size and Influence
2.18 The Government is also committed to establishing a lean andefficient public sector. Such a public sector is required to promot. thecountry's economic development--one which is too large will be tempted tointerfere in areas better left to the market and the private sector while oTnewhich is not efficient will not play its appropriate part in policyformulations, in setting the "ground rules" for development, and in providingthose services which it is sensible for the public sector to provide.Discussed below are three efforts the Government has made in this regard:'i) an effort toward administrative reform to make the Government small andimprove its servicee; (ii) an effort to privatize public commercialenterprises including the public bus industry; and (Mi) an effort to startrestructuring public tree crop sector.
a) Establishi¶-g Administrative Capacity
2.19 An efficiently functioning civil service is essential forimplementation of the economic reform process. (Looking back at the historyof success stories in Eastern Asia, economic development strategies are notsimply packages of discrete policies but also involve establishment, as aprerequisite, of effective administrative capacity.) Sri Lanka's civilservice was once highly respected for its independence and professionalstandards. These were eroded by increasing political influence inappointments, by excessive growth particularly at lower levels, and by adecline in morale (which was arguably due to a reduction in the real level ofsalaries and some loss in parts of the service of a disciplined work ethic).
- 51 -
2.20 The Government is now committed to reversing the decline in thepublic service by implementing recommendations made in 1988 by thePresidential Administrative Reforms Committee (ARC). It recognizes the needfor a smaller, more efficient, fairJy paid and highly motivated publicservice. The Governmient's strategy has four parts: (i) to reduce over-staffing and the fiscal cost; (ii) to ensure that recruitment and promotionare based on merit and transparent criteria; (iii) to develop the publicaervice's management capability for contiruing self-sustaining reform, forexample in career development, training, cadre review and management audit;and (iv; to improve reward and motivation policies including both financialrewards (salaries and benefits levels and pension provisions) as well asleadership and morale building measures.
2.21 Staffing Levels. One major recommendation of the ARC was to reducethe number of ministries and departments, and to reduce the number of publicservants by about 25 percent, which translated into a Government target of20,000 in each of the four years 1990 to 1993.
2.22 In March 1989 the number of ministries was reduced from 45 to 24.A recruitment freeze with only limited exceptions continues in operation. Acomprehensive public service census is being carried out each quarter fromSeptember 1990. During 1990 nearly 31,000 staff retired early under theGovernment's retrenchment scheme, which operated with particularly favorableterms up to the end of the year. About 13,000 further staff retired duringthe year under normal retirement terms, The retrenchment package was agenerous one to meet the political priority of an all-volur.teer program. Notonly has this caused a large fiscal burden, but also a number of valuablestaff left when management considerations would have favored retaining them.
2.23 During 1991 and part of 1992, the highest priority is toconsolidate the civil service strength by completing the first round of cadrereviews to determine where the volu..tary retirement program in 1990 leftshortage of staff and where overstaffing still exists, and appropriatetransfers and redeployments that should take place based on efficientresponsibility/function mapping across institutions so that duplication offunctions should be avoided. It will also be important for the Government totighten progressively thte budgeting, monitoring and control procedures for thestaff of provinclal councils so as to maintain budget discipline whileclarifying the functions and powers to be devolved. Given the high prioritythat should be accorded to this work, Governmnent is considering that theyshould be carried out by the Restructuring Management Uniit, recentlyestablished under UNDP assistance.
2.24 Appaintments. In early 1991 Cabinet delegated to the PublicService Commission (PSC) the powers given to it unlder the Constittion ofappointment, dismissal and discipliniary control in the public service. ThePSC needs to have this authority, but in the recenit past, has bieen asked tosurrender powers of recruitment and promotion to Cabinet tMinisters. Th.ss waspartly responsible for "politictzation of the bureaucracy' wherebyappointments were ntade largely on political grounds rather than on omerit.ProvincLal ptlliic service commillssions hlve been established to staff the
- 52 -
provincial public service. To enhance this process of improving the civilservice, competitive examinations are now again standard practice forrecruitment at all levels but, in the particular circumstances of Sri Lanka,are being supplemented by ethnic ratios for the time being. Furthermore, inthe future, as confidence in the objectivity of the PSC grows, it will bedesirable to move toward selection decisions based on the full range ofqualities required for development administration (such as management skills,leadership and practical performance on the job).
2.25 Management Capability. While the reduction of overstaffing is animportant exercise, the quality of the remaining civil servants is moreimportant. The Government is, therefore, concerned with: (i) strengtheninghuman zesource development policies; and (ii) developing the service'smanagement audit and efficiency improvement capability for cadre review,organization and methods studies, management reviews, and use of informationtechnology. This is a welcome decision. To achieve these goals, a new PolicyDivision has been established within the Ministry of Public Administration,which is being staffed up to deal with: personnel policy; organization auditand cadre review; administrative systems and training and career development.The Salaries and Cadres Committee (successor to the ARC) is also reviewingprogress on the ARC recommendations as a whole.
2.26 Motivation. The Government recognizes the importance for thepublic service of energy and commitment at all levels. It had been planned tocarry out in the first half of 1991 a comprehensive study of public serviceremuneration (including basic salary, allowances, holidays, pensions, housing,transport, and other benefits) as compared with a range of comparable private-sector employers and corp"rations. This has been delayed but it is stillimportant given that in general lower level public servants are well paidrelative to the private sector while more senior staff are relatively under-paid. The Government has increased the pay level of civil servants but thelargest itncreases hiave beern given for lower level staff while, in contrast, athigher levels where better rewards are really needed, the increase in salarieshas been minimal.
2.27 While some progress has been made as noted above, in administrativereform, 'a are recent signs that the Government's commitment to the processis weakening. These include: (i) the Government's refusal to comniit tofurther retrenchment from 1992 onwards; and (ii) its emphasis on politicaldifficulties in reforming, the Government's pension scheme. In addition, thepressure for new recruitment is strong. The Government needs to firmly adhereto the announced administrative reform measures and to maintaitn the process oncourse.
- 53 -
b) Promoting Privatization/Peoplizatioinw
2.28 To largely eliminate the public sector's participation inactivities better performed by the private sector, the Government launched aprivatization program which aimed at privatizing all commercially-orientedstate-owned ventures by end-1991. Although, this objective was highlyambitious and its time frame unrealistic, it demonstrated the Government'scommitment to the privatization process. The Government specified 48 publicenterprises (PE) that should be privatized immediately (a complete list ofthese enterprises and their status in privatization is provided in Annex 1).This list covers a wide range of activities and is likely to expand asconditions warrant. The Goverrment has adopted a pragmatic and ad hocapproach as regards both the selection of the PEs to be privatized, and themodus _oerandi of their privatization--floating shares in the domestic capitalmarket, negotiated sales to foreign investors, and management contracts.Although a comprehensive and well-programmed restructuring and divestitureplan under a clearly-defined institutional framework would have lifted someuncertainties invariably associated with such an ad hoc approach, theGovernment has adopted this case-by-case appreach given politicalsensitivities surrounding privatization issues, limited absorptive capacity ofthe domestic capital market,W' and difficulties it, attracting foreigners'portfolio investment in Sri Lankan equities becaus6e of the civil conflict inthe country.
2.29 Out of the 48 PEs selected privatization of 11 has already beencompleted (including United Motors, three textile mi1ls:"/ Thulhiriya,Pugoda and Veyangoda, Hlotel de Buhari, Ceylon Oxygen Ltd. and DankotuwaPorcelain), Most of the privatization episodes started with conversion ofGovernment-Owled Business Undertakings (GOBUs) and Corporations into equity-share ptublic companies, (a step that has already been taken for mostenterprises). Further actions will be determined on a case-by-case basis.United Motor's slhares were floatecd in the domestic carpital market whileThulhiriys was sold outriglht to a foreign firm, and Pugoda and mnany otherswere sold after a period of negotiations with foreig,n firms and/or employees.
;" rPeoplization' is the term used by the Government to describe theprocess of creating broad-based share ownership of former public sectorentities. It usually implies privatization with su'bstantial employee shareownership.
;22 There ore 176 listed comp1anies with market capitalizationi less than 8percent. f GDP in 1989. The last country economic memorandum quoted marketobservers saying that tlhe maximumn absorption by the capital market would be RG150 million per year--whereas the value of enterpriscs in the pipeline forprivatization easily exceeds R6, 3 billion.
' Onice the sale of thie remaininigl textile mi'l (Mattegama) is completed,the 1Notional Textile Corporation will be formally liqutidated. Thlis wouldrequire substantial restructuring, including closinig down of the Ministry CfTextiler.
- 54 -
2.30 As far as the regulatory framework is concerned several actionshave been taken. These include: (i) legislation enacted in 1987 whichprovides for the establishment of legally-independent public companies to takeover the operations of Government Owned Buisiness Undertakings (GOBU) or publiccorporations; (ii) the Mining and Minerals Development Act--with expectedParliamentary approval before end-1991--which will ensure the appropriatelegal and regulatory framework for promoting private mining and mineralactivities; (iii) the removal of import bans and some monopolies accorded topublic enterprises, and the reduction of tariffs on textiles, paper, leather,plywood and tires; and (iv) the amendment of the Gratuities Act in such a waythat gratuities to be paid to employees upon their departure from anestablishment could be in the form of bonds, in order to prevent serious cashoutlays at the time of the conversion of PEs into companiesa'.
2.31 The Government's most ambitious privatization/peoplization programhas so far been that of the Central and Regional Transport Boards (CTB/RTB)which used to employ 50,500 people and operate a fleet of buses (6,500 in theearly eighties, but only 3,500-4,000 buses currently). The Government hasconverted CTB/RTB into about 80 depot-based peoplized companies (except forthe North and East where public bus services ceased to operate due to thecivil conflict). At the start of CTB restructuring, the Government retrenched13,500 workers to make the newly peoplized companies financially viable.Since the retrenchment was based on voluntary retirement, this resulted inover staffing in the category of clerical workers assuming that the size ofthe operative bus fleet is 3,500 and shortages in drivers and conductors.Considering that further voluntary retrenchment would aggravate the skill-mixof the remaining workers and that compulsory retrenchment of clerical workerswas not only politically difficult but also technically unnecessary if morebuses were functional, the Government embarked on a bus rehabilitation/acquisition program. This bus repair program has been slower than anticipatedfor several reasons: (i) due to the past neglect of preventive maintenance,ntonthly breakdowns have been nearly as many as the Central Workshops canrepair every month; (il) the repair program has been undertaken in acentralized marner in which orders for spare parts are placed by a centralcommittee based on requests from ex-CTB depots. This is a cumbersome and slowprocess without the capacity to flexibly respond to changing spare partrequirements of eachi depot in the course of day-to-day operations. It hasbeeni recomnended that this centralized system be replaced by the localsousrcing and stocking of spare parts and emphasis shifted to a systematicpreventive maintenance. The Government also enacted the NationalTransportation Commisoion Act which: ensures fare deregulation; sets up a newregulatory authority (National Transportation Conunission (NTC)) which enforcessafety standards; and provides the mechanism to ensture the servicing ofuneconomic routes in the rural areas by auctioning for minimum subsidies tooperate such routes.
I"J Althouigh the lltiv has been amended, its implementation appears slowgiven the negative reactionis that this hals engendered from employees whoprefer c*a0h paynwintu to botidu.
- 55 -
2.32 Three valuable lessons regarding privatization have been learnt bythe Government from this effort. The first lesson was that the deregulationof the sector should not lag behind the peoplization process. As manycompanies had already been peoplized before the passage of the NTC Act inAugust 1991, these companies were functioning without the capacity to adjustfares or changp bus routes and without subsidies even if their routes wereuneconomical. This was a strain to many and could have engendered businessfailures among the companies peoplized earlier, seriously jeopardizing therest of the peoplization program. Second, it has proven difficult to changethe attitudes and skills of the managers of the newly peoplized companiesrapidly so that they could compete with purely private operators in a non-regulated environment. The provision of technical assistance can teachspecific skills but the change in attitudes can be speeded up by the injectionof domestic or foreign private management skills early in the r'!structuringprocess. Finally, privatization should be far reaching, i.e., old ties shouldbe severed with government-owned institutions as early as possible in theprivatization process (see next para.). In the same vein, the shares ofpeoplized companies which the public sector currently de facto owns chrough"Asset Disposition Trust" (a group of bankers), need to be divested as quicklyas possible. This process is about to start in early 1992.
2.33 These three lessons can be expanded to draw some preliminaryconclusions regarding peoplization in general in Sri Lanka; the Governmentshould be cautioned against an excessive dependence on peoplization throughlarge transfers of shares to existing public enterprise employees. Infusionof competitive managerial skills, additional financial resources to improvephysical assets, and new technologies is critical in makingprivatized/peoplized enterprises succeed. The significant share offering toemployees in the case of the bus industry has so far worked to delay thisinfusion, and often maintained lackadaisical managers unable to compete withthe real private sector bus companies. While it is understandable that thismethod was employed for bus peoplization to: (i) preempt labor concernsregarding the consequences of privatization; and (ii) quickly convert publicassets into private hands when the enterprise was not attractive to generalpublic, it is important that in the future a more direct privatization methodshould be employed for commercial public entities. In fact, experiences ofother countries (e.g., worker self management in Yugoslavia, privatization ofone commerciel bank in Jamaica) show that when employees were transferredadequate shares to enable decision making, they tended to refuse infusion ofnew managers and/or efficiency in management and ended up in failures. Moregenerally, if required for political reasons, 5-20 percent employee shareownership tended to be successful in providing an added incentive for workersand promoting broad based capital ownership. (The Government's intention isto limit the share offering to employees to 10 percent of the total equity forall future privatization.)
c) Public Tree Crop Sector Restructuring
2.34 The three major tree crops (tea, rubber and coconuts) have for manyyears played a predominant role in Sri Lankas' economy, and particularly inthe case of tea, have traditionally been virtually synonymious wlth the
- 56
country's exports (still accounting for about one third of the total).Although the estates that produced the tree crops were earlier generallyefficient production units, operating with tight and increasingly skilledmanagement in an intensely competitive arena, they were mostly foreign-ownedand considered by many governments as a politically costless source oftaxation and expropriation. This heavy taxation and disinvestment and neglectthat followed the Government's decision to nationalize the estates (made inthe 1950s but actually implemented in early 1970s) contributed to the recentprecipitous decline. What began as an effort to transfer ownership andmanagement to Sri Lankan nationals, instead led to the replacement of foreignownership and management of commercially profitable estates by inefficientstate ownership and centralized management. Recently the tree crops sub-sector, which accounted for 5.4 percent of GDP and employed over a millionpeople in 1990 and contributed 34 percent of total export earnings, has notbeen a major contributor to growth. From 1983-90, while agriculture grew by2.4 percent a year, GDP in the tree crops subsector increased by only 1.8percent a year even with the record breaking tea production in 1990.
2.35 The two public corporations (JEDB and SLSPC) manage more than250,000 ha of land (contributing 67 percent, 33 percent and 10 percent of allland under tea, rubber and coconut, respectively), account for 50-60 percentof tea production and employ 425,000 people. Available data indicate thatvirtually all the increase in tea production during 1983-1989 came fromprivate estates and smallholders (Table 2.7). Overall export volume from thetree crops subsector has increased by 1 percent a year during the same period.While tea exports have remained flat, rubber exports have steadily declinedsince 1984 and coconut exports have fluctuated depending on weatherconditions. In sharp contrast to the weak performance in Sri Lanka, itsprincipal competitors have generally experienced more robust, sustained growthin tree crops resulting in an erosion of Sri Lanka's world market share.
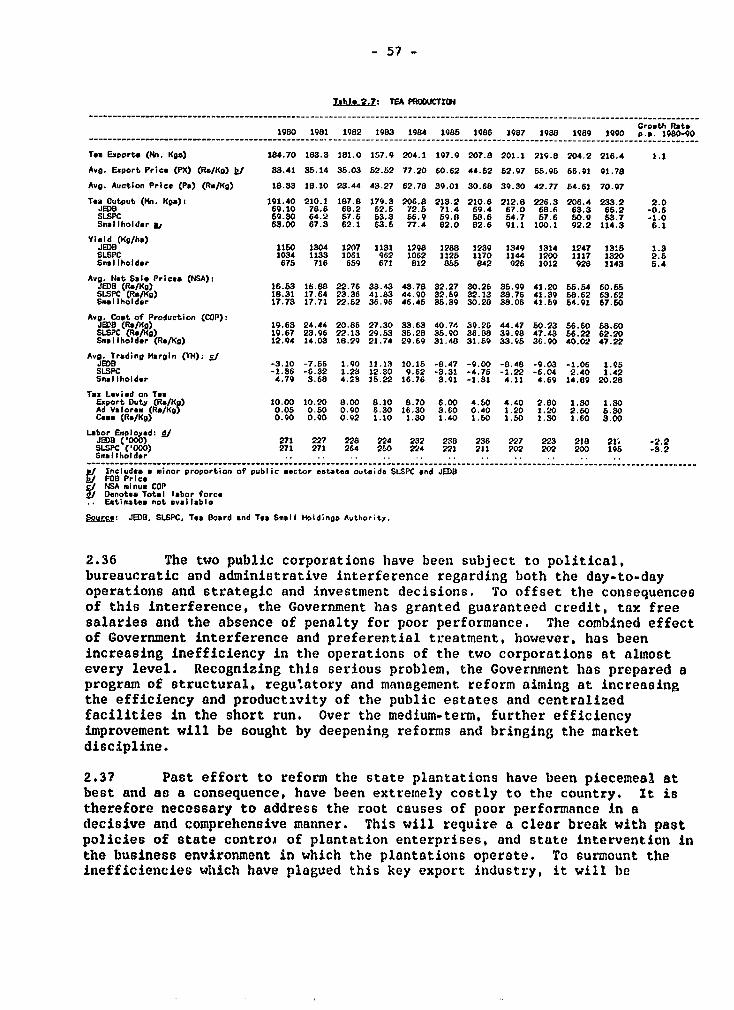
- 57 -
Tblip 2.7: TEA PROUCTION
Growth. Rate1980 1981 1982 1983 1984 1986 1986 1987 1988 1989 1990 p.m. 1980-90
Too Exports (Mn. Kos) 184.70 183.3 181.0 157.9 204.1 197.9 207.8 201.1 219.8 204.2 216.4 1.1
Avg. Export Price (PX) (Re/Kg) I 83.41 35.14 35.03 52.62 77.20 60.62 44.62 82.97 65.95 66.91 91.78
Avg. Auction Price (Pa) (Rs/Kg) 18.83 18.10 23.44 43.27 62.78 89.01 30.68 39.30 42.77 54.61 70.97
Tea Output (Mn. Kg*): 191.40 210.1 187.8 179.3 206.8 213.2 210.6 212.8 226.3 206.4 233.2 2.0JED8 69.10 78.6 68.2 62.6 72.6 71.4 69.4 67.0 68.6 63.3 65.2 -0.6SLSPC 69.30 64.2 57.6 63.3 56.9 59.8 58.6 54.7 57.6 50.9 63.7 -1.0Smaliholder pi 63.00 67.3 62.1 63.5 77.4 82.0 82.6 91.1 100.1 92.2 114.3 6.1
Yield (Kg/h.)JED8 1160 1304 1207 1131 1298 1288 1239 1349 1314 1247 1318 1.3SLSPC 1034 1133 1061 962 1062 1125 1170 1144 1200 1117 1820 2.6Smailholder 675 716 659 671 812 855 842 926 1012 928 1143 S.4
Avg. Net Sale Pric.a (NSA):JEDB (Ru/Kg) 16.63 16.88 22.76 38.43 43.78 82.27 30.26 36.99 41.20 65.64 60.S5SLSPC (Re/Kg) 18.31 17.64 23.36 41.83 44.90 32.69 32.13 38.76 41.39 58.62 63.62Smuliholder 17.73 17.71 22.32 36.96 46.45 35.39 30.28 38.06 41.69 54.91 67.60
Avg. Cost of Production (COP):JEDB (Re/Kg) 19.63 24.44 20.86 27.30 33.63 40.74 39.26 44.47 50.23 56.60 58.60SLSPC (Re/Kg) 19.67 23.96 22.13 29.63 35.28 35.90 36.83 39.98 47.43 56.22 62.20SmalIholder (Rs/Kg) 12.94 14.03 18.29 21.74 29.69 31.48 31.59 33.95 36.90 40.02 47.22
Avg. Trading Margin (TM): s/JEDB -3.10 -7.56 1.90 11.13 10.15 -8.47 -9.00 -8.48 -9.03 -1.06 1.95SLSPC -1.86 -6.32 1.23 12.30 9.62 -3.31 -4.75 -1.22 -6.04 2.40 1.42Smaliholder 4.79 3.68 4.23 16.22 16.76 3.91 -1.31 4.11 4.69 14.89 20.28
Tax Levied on TeaExport Duty (Re/Kg) 10.00 10.20 8.00 8.10 8.70 6.00 4.50 4.40 2.80 1.30 1.30Ad Valorem (Re/Kg) 0.05 0.50 0.90 6.30 16.30 3.60 0.40 1.20 1.20 2.50 5.30Coxe (Re/Kg) 0.90 0.90 0.92 1.10 1.30 1.40 1.50 1.50 1.30 1.60 3.00
Labor Employed: jJJEDB ('000) 271 227 228 224 232 238 236 227 223 218 21; -2.2SLSPC ('000) 271 271 264 250 224 221 211 202 202 200 195 -3.2SnAllholder .. .. .. .. .. .. .. ..
f Includes a minor proportion of public *ector estates outside SLSPC end JEDBFOB PriceNSA minus COPDenotes Total labor force.Estiates not ovi Ilablo
Sorc: JED8. SWSPC, Tea Board and Tea Small Holdings Authority.
2.36 The two public corporations have been subject to political,bureaucratic and administrative interference regarding both the day-to-dayoperations and strategic and investment decisions. To offset the consequencesof this interference, the Government has granted guaranteed credit, tax freesalaries and the absence of penalty for poor performance. The combined effectof Government interference and preferential treatment, however, has beenincreasing inefficiency in the operations of the two corporations at almostevery level. Recognizing this serious problem, the Government has prepared aprogram of structural, regu'atory and management reform aiming at increasingthe efficiency and productivity of the public estates and centralizedfacilities in the short run. Over the medium-term, further efficiencyimprovement will be sought by deepening reforms and bringing the marketdiscipline.
2.37 Past effort to reform the state plantations have been piecemeal atbest and as a consequence, have been extremely costly to the country. It istherefore necessary to address the root causes of poor performance in adecisive and comprehensive manner. This will require a clear break with pastpolicies of state controi of plantation enterprises, and state intervention inthe business environument in which the plantations operate. To surmount theinefficiencies whlich have plagued this key export industry, it will be
- 58 _
necessary to allow plantation enterprises to operate along strictly commerciallines free of government interference; these enterprises must be afforded theautonomy to manage the resources under their control to best advantage andmust have the capacity to assume the risks inherent in profitably operating inan increasingly competitive international arena. As such capacity largelyexists only in the private sector and as autonomy is best assured throughprivate ownership and control, privatization of the industry should be a majorelement of the reform program. Moreover, privatization of ownership providesthe strongest ircentives for such parties to devote substantial resourcesrequired and to assume the risks inherent in operating and investing in theplantation industries.
2.38 Corporate Restructuring. Given political sensitivities attached tothe issues of private ownership in the tree crop subsector, the Government isprepared now to privatize only management. In the short run, the main actionto be taken is changing the statutory framework under which the stateplantations operate by converting the two state plantation corporations into22 smaller public limited liability companies and leasing the land to thesecompanies on a 99 year basis. This is to both create more manageable sizedunits and to provide those smaller units with the autonomy and accountabilityrequired to operate as efficient commercial enterprises. The Government willemploy experienced, qualified, well-capitalized private firms throughmanagement contracts to run these 22 companies. These firms are expected tobring in the necessary company level skills, access to markets, technology andcommercial finance to what will be large plantation companies. The Governmentintends to reward them based on the degree of risk they assume and thefinancial performance of the company. It is, however, unlikely to be feasibleto devise realistic contracts that will provide the incentives for adequateinvestment and longer-run profit maximization that would come from privateownership.
2.39 There are two difficult problems associated with the restructuring.One is that of the approximately 500 estates managed by the JEDB and SLSPC,about 50-60 estates which have regularly generated losses, and are consideredunviable in that the costs of improving productivity far outweigh anyfinancial benefit that could be realized by the Government. It has,therefore, been decided that these estates will be excluded from the processof forming the 22 new companies, because to include them would seriouslyundermine the companies' financial viability. They will be retainedtemporarily by JEDBISLSPC, pending a study of the disposition options.
2.40 The other issue that needs to be addressed relates to labor. Keyto the success of the restructuring is the removal of the inefficient use ofthe staff of the two corporations and of estate labor and bringing staffingand labor rewards into line with productivity, while ensuring fair treatmentof the staff and labor of the two corporations. Past studies identified threekey aspects of labor policy that have put undue pressure on labor costs: (i)wages are paid on a rigid six-day work week basis regardless of actual workload; (Li) wage rates are centrally negotiated and politically determinedbearing little relation to changes either in productivity or the cost ofliving; and (iii) estate labor is imimobile. The GoveLuaient lios noted these
- 59 -
policies as constraints to improved efficiency and cost control, but concludedthat autonomous public companies with private management would be able toproductively utilize existing labor through improvements in operating andinvestment efficiency which the proposed structure i4 expected to foster.More specifically, it is expected that with better management, less politicalinterference and greater flexibility in the use of non-labor resources, laborproductivity would be significantly increased. Particularly important is thatmanagement contractors are indeed afforded the autonomy to effectively managelabor resources. While the above lines of reasoning are plausible, it wouldbe unwise to proceed with the restructuring program in the absence ofprocedures and programs for dealing with estate or company specific laborredundancy problems. Such problems are bound to arise on at least some of theestates. If strategies are not developed for dealing with such problems, theGovernment may find itself in the midst of contract disputes and litigationwhich in turn may halt the entire program. Equally important is the need toformulate strategies for maintaining and enhancing worker welfare. Over thepast decade, the Government has devoted substantial resources to improvinghousing, health and education of the public estate work force, particularlythe resident work force. The recurrent costs of such programs have riien toapproximately 10 percent of the total costs of production. With autonomouscompanies under private management, the levels, modalities, andresponsibilities for providing such services will doubtless requiremodification. To enhance both living conditions and mobility of the presentlabor force, both in the private and public estates, provision of suchservices will have to be shared jointly among plantation companies, lineagencies, aud NGOs rather than being placed solely on the backs of what are tobe autonomous plantation companies. A careful study on how best to deal withthis human resource aspect of restructuring is, therefore, urgently needed.Such a study would lead to a preparation of an action plan to minimizepolitical and financial costs of the restructuring.
2.41 De-monopolization of Marketing Arrangements. All public estatesare currently required to sell tea and rubber products through the JEDB andSLSPC marketing and warehousing facilities. These monopsonistic practiceshave resulted in delays in payments, lower prices and lack of access to timelyand relevant market information, and have generally discouraged shifts inproduct and process diversification consistent with c'.anging internationalmarkets. The Government is therefore eliminating obligatory monopsony powerof the marketing/warehousing functions of JEDB and SLSPC and the fertilizermarketing function of JEDB by converting them into independent privatecompanies whX'n will have to compete with others. Their ownership will bedivested in the near term.
2.42 Sectorwide Policy and Institutional Reform. Since the overridingobjective of the restructuring program is to increase the efficiency of thetree crop sub-sector as a whole, it is important that deficiencies in thesectorwide policy and institutional framework be dealt with from the outset.For the sub-sector including the 22 new companies to realize the anticipatedgains in efficiency distortions emanating from the tax/subsidy/pricing regime,and regulatory restrictions on operational nnd invootment e?nd marketingpractices must be rectified. The issues of weak technology development should
- 60 -
also be dealt with. Failure to address these sectorwide constraints toproductive and allocative efficiency will substantially limit the productivitygains which can be realized from corporate restructuring by itself. Moreover,such reforms will significantly improve the prospects and performance of theprivate producers and marketing agents who have demonstrated a remarkableresponsiveness to recent policy reforms in the sector.
2.43 On the fiscal area, marginal rates of export and ad valorem taxeson tea and rubber in Sri Lanka are the highest in the world, and significantlyreduce producer incentives to invest or to improve product quality (althoughthese taxes account for less than 3 per..ent of total tax revenues). Moreover,since part of the revenue mobilized through the tax system is for the purposeof the state realizing returns on the substantial assets managed by the stateplantations corporations, there is an implicit tax on private producers in thelevying of uniform rates of taxation of public and private producers. TheGovernment's strategy therefore is to phase out export taxes to bringfinancial costs and returns ins line with their economic values, and toprovide a simple, transparent means for the state to realize a return on itsassets in the plantation sector. In order to raise fiscal resources for usein publicly administered tree crops development programs, Government haslevied cesses on tree crops producers. Other than the high administrativecost, cesses combined with Government subsidies have altered pricerelationships and distorted investment decision making. The Governmentintends to reduce both taxes and subsidies/cess in favor oC reliance on marketbased price incentives to encourage efficient investment in the production oftree crops products.
2.44 On the regulatory side, investments, trading, marketing andshipping of tree ,;rop products are subject to a number of regulations whichlimit market entry and inhibits competition. A number of these regulationshave been geared to the present state-dominated structure of production orhave imply been held over from the pre-independence days others are,themselves a direct outgrowth of the cess funded subsidy schemes. Therelevance and appropriateness of many of these regulations are open to seriousquestion since the structure of world tea and rubber markets has changed andthe domestic industry has been evolving and will change quite dramaticallywith the break up of the two corporations. A commercial environment whichwill encouvage competition needs to be established by eliminating restrictiveregulations. The out-dated regulations governing private sector investment,operations and marketing practices, and the ineffective, unresponsive researchsystem needs to be addressed. Equally inmportant, is the lack of mechanism forensuring public estates face the same resource costs (particularly land/assetcosts) as private producers. Regarding the latter, the inclusion of a paymentmechanism in the financial structure of the newly formed companies which wouldreflect their use of the State's assets as a cost of doing business should becarefully considered. As land is to be leased to the plantation companies,the most transparent and administratively simple mechanism for this purposewould be an annual land lease paymenit. Such a mechanism would enable theGovernment to reduce expeditiously distortionary export taxes while moderatingthe decline in fiscal reveniue mobilizaition.
- 61 -
2.45 Technology development and adaptation, key elements in increasingproductivity and maintaining international competitiveness, have progressedmore slowly in Sri Lanka than in other countries. The three producer financedresearch institutes for tea, rubber and coconut have not been sufficientlyinstrumental in enhancing productivity and improving output quality to thedegree realized in competing countries. The responsiveness of these researchinstitutes need to be increased by augmenting the role of industryparticipants in defining objectives and approving and evaluating researchprograms.
d) SummarX
2.46 A large and inefficient public sector has been one of the majorproblems facing Sri Lanka. This problem should be addressed through: (i)continued administrative reform that reduces the civil service size, andefforts to make recruitment and promotion based purely on merit; (ii)continued privatization/peoplization of commercial public enterprisesincluding divesting the shares of "peoplized' bus companies that are currentlyheld by the public sector: and (iii) tree crop sector restructuring thatincreases the role of the market in the subsector. On the last issue, whilethe Government is willing to privatize only management of publicly ownedestates through management contracts, it is preferable that the reformincludes privatization so that managers should have incentives to invest theirown resources in the assets and to maximize profits in the long run.
4. Creation of a Competitive Business Environment Conducive to PrivateInvestment
2.47 For more than two decades prior to 1977, Sri Lanka followed animport substitution policy emphasizing the public sector as the major forcetoward industrialization. With the ethos of socialism that prevailed duringmost of the two decades, private entrepreneurs were not only mistrusted andmarginalized but also their activities were limited by strict controls onprices they could charge and foreign exchange they could utilize. Inaddition, after the enactment of the Business Undertaking (Acquisition) Act of1970, private firms, whenever they became large or otherwise conspicuous(through, for example, labor problems), became targets of nationalization.All this discouraged new investments by the private sector, either domestic orforeign, and prevented existing private firms from expanding.
2.48 In 1977, having realized the limit of what inward-looking policycould achieve, the Government otarted to dismantle administrative controlsover allocation of resources and to promote market- and export-orientedeconomic policies. This policy change encouraged significant private sectorgrowth. But, it is hard to eliminate the legacy of the interventionist systemengraved in the economy over decades, and mutual mistrusts between theGovernment and the private entrepreneurs are still lingering on. Suchmistrust was aggravated by the Government's recent decision to nationalize asoft drink company under the Emergency Act after the Government had committedto no more nationalization and the Business Acquisition act of 1970 had beenrepealed.
- 62 -
2.49 Current Business Environment for the Private Sector. Today, evenafter a decade of double-digit growth of the private manufacturing sector, theprivate sector in Sri Lanka remains diffuse and anonymous. Part of the reasonis the higlh corporate income tax rate (50 percent until April i992) withlimited tax enforcement capability of the Government. Because unregisteredsmall companies can effectively evade the entirety of tax burden, it is highlycostly to grow into a larger firm that receives scrutiny from the taxauthorities. The current tax reform efforts to lower the corporate taxuniformly to 35 percent by 1993 (the same rate as the highest individualincome tax bracket), and to improve tax administration should change thispicture substantially. Another reason many firms decide to remain small andanonymous is to avoid the effects of labor legislation; if a firm employs 15workmen or more, it becomes subject to the Termination Act (paras. 2.68-2.71)which practically takes away the right of employers to lay off workers fornon-disciplinary reasons increasing the cost of business operationssubstantially.
2.50 The private sector's access to financial resources for investmenthas also been inadequate due to the Government deficit that pre-empts 60-70percent of the national savings. Reflecting this, the cost of capital hasbeen high in terms of real rate of borrowing which often exceeded 10 percent(Table 1.1--except for 1990 when high inflation and managed interest ratescreated a situation of largely negative real rates), and in terms ofrationing. Recently, this crowding out of the private sector has beenoccurring more through quantity rationing because the level of interest rateshas been managed by the Central Bank through its treasury bill auctions. In1990, for example, the central government issued Rs 16.3 billion in newdomestic debt (5 percent of GDP excluding repayments). Commercial banksincreased treasury bill holdings by Rs 4.2 billion in 1990. Becausecommercial banks are the principal source of financial resources to theproductive sectors in the economy, the increase in the net government creditas a proportion of total assets tends to dampen credit in other areas. Agreater amount, i.e., the remainder of the additional gross debt issued in1990 was held in the form of treasury bills (and low interest national defensebonds) by nonbank captive sources in the public sector (such as providentfunds) at rates and amounts determined by the Central Bank. Because theseinstitutions are the principal domestic sources of medium- and long-termloanable funds in Sri Lanka, the dominance of Government securities in theirportfolios leaves little scope for investing in alternative opportunitiesincluding private capital.
2.51 Additionally, a major weakness of the financial sector in Sri Lankais that, for relatively lar:ger borrowers (including public enterprises), debtcollection has been poorly enforced resulting in insolvent commercial banks ifinternationally acceptuble loan classification and provisioning requirementsare applied. A corollary of this weakness has been that, since debt repaymenthas not been enforced, cost of bank debts has become artificially lower thanthe true financial intermediation cost, or cost of equity financing throughthe capital market. As discussed below, the development of capital market hasthus been significantly deterred.
_ 63 -
2.52 Regarding the regulatory framework, Sri Lanka has relatively fewformal and conspicuous obstacles. In particular, the Government has recentlytaken important steps to improve private sector environment by implementing aseries of policy measures which include: eliminating all quotas and bans onimport of non-agricultural comn,odities; removing some import licensingrequirements; rationalizing tariffs through a gradual reduction of maximumnominal rates to 50 percent within a four band tariff structure; reducingforeign exchange controls; and liberalizing shipping and air freight. As partof this process, the Government disbanded the Local Investment AdvisoryCommittee which approved all new domestic investments, and eliminated the 100percent tax on transfer of equity shares between Sri Lankan nationals andforeigners first up to 40 percent foreign ownership and more recently,announced dismantling this tax altogether. To publicize and implement theGovernment's policy toward increased market-orientation, the IndustrializationStrategy was issued in December 1989 and the Industrial Promotion Act enactedin 1990. Based on the Act, most price controls through the Fair TradingCommission were removed and the Industrialization Commission was established.The Commission's tasks are to review policies critical to foreign investmentincluding investment incentives, industrial relstions, and infrastructuraldevelopment.
2.53 In spite of these measures, operations of the private .-ector arestill constrained by cumbersome and time-consuming bureaucratic procedures asrequired by the Customs Act, the Exchange Control Act, and the Export andImport Control Act. Discretionary and often informal application ofregulations/incentives to various private entities is also a serious problem.In addition, as pointed out in Chapter I, the limit on private land holding to50 acres and the ban on converting paddy land to other uses are impeding, inparticular, development of non-traditional export-oriented agriculture. Toaddress these concerns, the Government has appointed a "Commission onBureaucratic Control" chaired by a private sector representative, which aimsat facilitating the dialogue between the Government and the private sector andat examining and proposing remedies for private sector grievances. The finalreport is expected at the end of 1991. The issues that will be addressedinclude simplifying customs procedures, removing all export controls exceptfor those that should be protected from exploitation (e.g. ivory),streamlining foreign exchange controls and removing most of the remainingimport licensing requirements (for more than 270 items). Finally, inadequacyof infrastructural services has emerged as a major concern of the privatesector due to the low public investments and low provisions from O&M outlays.
2.54 Given the current situation described above, four major issuessurrounding the private sector are reviewed in this section. They are: (i)creation of an efficient financial sector; (ii) promotion of foreign directinvestment; (iii) improvement of labor legislation; and (iv) provision ofadequate physical infrastructure.
a) Establishing an Efficient Financial Sector
2.55 Sustained economic grow.th requires a financial sector thatmobilizes and allocates financial resources to areas where returns are
- 64 -
highest. Sri Lanka's financial institutions are relatively diverse andsophisticated and are capable of reaching private borrowers with at leastshort-term working capital lending. Yet, there are a number of problems; thefollowing four measures have been identified in the Bank's sector work ascritical for establishing a broadly competitive and sound financial sector.
2.56 First, the two large state-owned banks, Bank of Ceylon (BOC) andPeople's Bank (PB) wbich dominate the commercial banking sector (with 66percent of assets) are inefficient. They would have substantial negative networth and incur large losses if proper accounting policies for bad debtprovisions were applied. In addition to a number of weaknesses in themanagement culture and operations of the banks (e.g., very high employee-related costs) Government pressures to lend to public enterprises and forrural development have contributed substantially to the banks' financialproblems. Private banks, while growing, have taken advantage of the statebanks' need for unusually high margins to increase their own margins. Suchpolicies impose high costs on Sri Lanka's productive sectors.
2.57 It is recommended that integrated restructuring programs for BOCand PB be implemented. Based on an international audit, the two banks shouldtake large provisions for bad debt and receive a large inflow in new capitalfrom government in the form of bonds. It is also proposed that governmentpurchase selected large bad loans from the banks at written down values andtransfer them to restructuring and collection agency (RACA) being established.The two state-owned banks should be commercialized so that they compete withother banks in the market on a strictly commercial basis. Moreover, BOCshould be privatized in the near future and P3 should continue for the timebeing as a commercialized government-controlled bank with minority privateownership. In addition, the National Savings Bank (NSB) is an inefficient,loss-making institution whose role as a critical supplier of funds togovernment is rapidly diminishing with the expansion of treasury bill salesand investment by pension funds. It is recommended that NSB rationalize itsrural branch structure and that, if it cannot break even by investing intreasury bills, consideration be given to phasing it out.
2.58 Second, Sri Lanka's financial institutions are also hurt by seriousdebt recovery problems, insufficiently rigorous central bank supervision, andinadequate accounting and auditing. Although 13 debt recovery laws haverecently been enacted or amended, additional amendments are required toaddress significant flaws. The Central Bank of Sri Lanka (CBSL) shouldeffectively enforce newly established loan classification requirements,accounting policy requirements relating to provisioning and suspension ofinterest, and capital adequacy requirements. The accounting profession shouldalso enforce use of internationally accepted accounting standards and expandeddisclosure requirements.
2.59 Third, Sri Lanka's pension funds and insurance companies havesuccessfully raised large pools of long-term capital. However, governmentdirectives require that almost all of this money be invested short termn ingovernment securities. The two development banks, while relatively sound andwell managed, are unable to mobilize long-term local currency funds for
- 65 -
onlending. The State Mortgage and Investment Bank's new commitments aredropping sharply for the same reason. It is recommended that Governmentregulations be amended so that the pension funds and insurance companiespursue optimal portfolio management policies which provide maturity andsubsector diversification.
2.60 Finally, Sri Lanka's capital market is relatively undeveloped andactivity on the Colombo Stock Exchange is low. While some policy-relatedconstraints impede the market's development, the most significant constraintis imposed by the relatively low cost of bank debt and benks' tolerantpolicies toward high debt to equity ratios and treatment of defaulters, whichreduce borrowers' incentives to raise resourccs through issuing equity. Whilesome proposed new investment vehicles, e.g., a well designed investment trust,may assist in expanding the capital market, priurity should be given totackling the underlying problem of artificially inexpensive debt. (This issuewas discussed extensively in the last Country Economic Memorandum.)
b) Promoting Foreign Direct Investment
2.61 The small size of the domestic private sector, together withlimited domestic savings implies that Sri Lanka will have to depend on foreigninvestment to provide a boost to private investment. During the last 12years, Sri Lanka has received an annual average of US$40 million directforeign investment. This amount, however, has been declining over the lastfour years reflecting the uncertainties perceived by potential investors duepartially to the ongoing civil conflict; in 1990, the net investment was US$32million (less than 2 percent of investment), among the lowest since the EPZsystem. was establislhed in 3.978. This should be compared with the investmentreceipts of Indonesia, Thailand and Malaysia in 1989 of US$0.8 billion, US$1.7billion and US$1.8 billion, respectively (World Development Report) showingthe order of magnitude of what is potentially available for Sri Lanka. Inparticular, nmany potential investors from Japan, Korea, Taiwan and others arenow searching for appropriate new investment sites because of the insufficientsupply of infrastructure in Bangkok, political uncertainties in thePhilippines and increased wage cost in Malaysia. Many investors are thusprompted to go into Indones .a. There is, therefore, a wir.dow of opportunityfor Sri Lanka to attract a large number of foreign investors if it can moveexpeditiously (before Vietnam or a liberalized India become establishedforeign investment competitors) in improving the investment climate andinfrastructure, and making progress in resolving the civil conflict.
2.62 The immediate goals of the Government, therefore, are: (i) toestablish a unified regime for firms regardless of whether or not they locatein the established export processing zones (EPZ) thus in effect making theentire island an EPZ; (Mi) to make approval for entry to Sri Lanka automaticexcept for activities related to national security (e.g., weapons) or healthhazards; (iii) to ensure the firms have foreign exchange available for importsand repatriation, even when Sri Lanka is suffering from balance of paymentscrisis; and (iv) to make sure the firms have access to 'ocal credit.
- 66 -
2.63 Until 1989, foreign investment requests were approved andadministered under two different institutional set-ups. On the one hand, theGreater Colombo Economic Commission (GCE'), established in 1978 as alegislative authority, has the power to approve foreign investment entry,grant special incentives, and exempt companies from national laws, includingthe Foreign Exchange Control Act and the Inland Revenue Act.Th Until 1989,GCEC's role and functions had been largely limited to the export processingzones (EPZ). It has been relatively successful in attracting foreigninvestment to Sri Lanka. On the other hand, the Foreign Investment AdvisoryCommittee (FIAC) handled all foreign investments outside the GCEC's authority,which had to be joint ventures. As GCEC, FIAC approved foreign investors'entry to Sri Lanka, and granted incentives regarding foreign exchange andtaxation. But FIAC incentives were less attractive than those of the GCEC interms of both tax incentives and compliance with foreign exchange regulations.The FIAC process also involved approval by other government agencies andproved to be cumbersome and time consuming. Due to the high tax rates in thecountry, both GCEC and FIAC resorted to an intensive use of tax holidays andother fiscal incentives to be negotiated on a case by case basis. Also, rulesand regulations were put in place to restrict the access by wholly foreign-owned ventures to domestic borrowing and by joint ventures to foreignexchange.
2.64 In order to encourage foreign investment nationwide under a unifiedregime, the Government merged the two institutions in 19d9 into the GCEC as aone-stop shop for foreign investors that provides unified package ofincentives. This action, however, was not accompanied by necessary changes inpolicies and legal procesoes, and the 'new GCEC' was never adjusted to handleFIAC type of investments. As a result, two different regimes (in theory)continued to exist, but FIAC-type investment requests could no longer beprocessed. Rather than encouraging foreign investment, this action has thusformed a new obstacle to the majority of investors.
2.65 In response to these concerns the Government, with the assistanceof the Foreign Investment Advisory Service (FIAS) of IFC/MIGA, issued anInvestment Policy Statement in November 1990. The Statement recognizes theneed for unifying the two investment regimes (GCEC and non-GCEC or ex-FIAC)while admitting that special incentives need to continue until a comprehensivetax reform is implemented in 1992-1993. The Statement, however, stressed thatthe rules and procedures for approving investments and granting theseincentives should be made simple, transparent and automatic. To conform tothese pritnciples, the Statement emphasized that in many policy areas,including entry, foreign exchange, local financing, and special incentives,changes were needed in current policies, laws and institutions. The Statementmade a commitment to prompt development of detailed investment guidelines fora unified regime.
w1' To qualify for GCEC incentives, an enterprise must be a newestablishment in Sri Lanka that: exports a minimum 95 percent of production;has foreign sources of financing fixed and working capital; and has a minimumproject financing of US$250,000.
- 67 -
2.66 The draft Guidelineu were thus prepared in August 1991. Accordingto the draft Guidelines, improvements have been made especially on entry;"preferred areasn have been eliminated and "automatic approval' will begranted for most foreign investment with clearly spelled out criteria andprocedures. The "non-automatic list", a list of sectors for which foreigninvestments exceeding 40 percent share ownership need to be approved case bycase, is to be relatively short and will be reViewed from time to time to makeit shorter. When the draft Guidelines become official, therefore, most of theSri Lankan economy will have been opened up for foreign investment. As forforeign exchange policy, major improvements were also proposed in theGuidelines: GCEC will replace the Central Bank as the approval authority forremittances and capital repatriations. In addition, by promulgating a newl'CEC regulation that allows all foreign investors free remittance abroadthrough commercial banks, the new system provides foreign investors anindirect guarantee of foreign exchange, even in times of balance of paymentscrisis.
2.67 The approach to direct foreign investment embodied in the newGuidelines represents an important step forward. There are certain areas,however, where timely action is necessary. First, regarding creditfacilities, foreign-majority joint ventures are not allowed automatic accessto local credit markets. They require Central Bank approval on a case-by-casebasis--a restriction that is not necessary. Second, tho Government wiishes tobring in far-reaching ref.cm in foreign investors' tax incentives all at oncew*hen the comprehensive tax reform is implemented. Given that major tax reformmeasures were already announced in the 1992 budget, the Government must be atan advanced stage of preparing for post-tax reform in-entive schemes at thepresent time. If not, preparation should be accelerated substantially.
c) Iml roving Labor Relations
2.68 Sri Lanka has a relatively well-educated labor force but due tolabor legislation, the objective of which is to protect labor, their mobilityamong firms and among sectors is limited. Of particular concern is theTermination of Employment of Workmen Act No.45 of 1971, which was introducedin the wake of the economic recession that followed the 1971 JVP insurgency.At that time, there were many allegations that employers were using scarcityof foreign exchange or raw material imports as an excuse to remove unionleaders, and it was felt that the State should exercise control over theretrenchment and lay-off of employees in the private sector. Hence, the Actessentially took away the rights of most employers to terminate a contract ofemployment for non-disciplinary reasons stipulating that 'any employeremploying 15 or more workmen shall not terminate the tservice of a workmian whohas served for one year or more without the workman's prior written consent orthe prior written approval of the Labor Commissioner." The Act gave theCommission power to intervene in any retrenchment or lay-off process (and tohave consultations with the other departments and sector ministries in theevent shortages of raw materials was given as a reason for labor redundancy).The Act wes amended in 1976 to include terminating employment of workmenarising from closures and was made effective retroactively from May 1971--as
- 68 -
there were allegations that many employers got around the Act by closing downtheir business entirely.
2.69 The net effect of this law, however, has been to raise the cost toemployers of laying-off their employees--and as a result increase the overallcost of employing workers. This has served as an incentive to employers tominimize employment of labor and thus has worked against those that the Actwas originally designed to protect. In fact, existing employers' job securityis protected at the expense of potential employees that may be able to do thework better. The Act has also promoted inefficient resource allocation in atleast three way. First, because labor has become expensive, capital has beensubstituted for labor in a country where labor should be relatively cheaper.Second. many employers felt incapable of investing in new and potentiallypromising activities if it involved retrenching part of the existing workers,and workers on the other hand felt it unnecessary to look for moreremunerative jobs or obtain training for more promising positions therebylimiting labor mobility and smooth adjustment. Third, to avoid being coveredby this Act, many employers have chosen to be below the threshold of 15emplovees. Business growth, if any, has often taken place through adding newsmall establishments rather than expanding existing establishments--repeatingadministration functions in each establishment, and, most probably, losingscale economies. Indeed, empirical analysisL1 of Sri Lanka shows that laborregulation is cited as one of the two most serious obstacles to "growth" forlimited liability companies hiring 16 or more employees (the other perceivedobstacle being potential changes in tax status). Interviews with potentialforeign investors also cite the Act as a serious deterrents to consideringinvestment in Sri Lanka.
2.70 It is recomm-nded that the Terminations Act be repealed, and thatonly the Industrial Disputes Act--a piece of legislation which is morecommonly found in the nest of the world for settling issues of laborrelations--be utilized as a much ; tter alternative. If it is not politicallyfeasible to take this action, the Government can establish a transparentmechanism which a firm can use to obtain a waiver from the force of theTerminations Act as in the "free enterprise" system in Mauritius. Currently,similar waivers are given by GCEC for establishments within the free tradezones; this waiver system should be expanded to the entire nation and itsgranting should be made more automatic.
2.71 While the above issue has been identified as important throughinterviews with foreign and domestic investors, there are other labor issuesthat need the attention of the Goveznment. It is recommended that theGovernment review the labor legislation comprehensively (involving 48 Acts)with a view to streamlining the entire system. Overprotection not onlyreduces the country's international competitiveness by raising effective laborcost but at the same time ends up undermining the very purpose by reducing theoverall level of employment.
Lv Brian Levy: Obstacles to Developing Small and Medium-SizedEnterprises, An Empirical Assessment, World Bank PRE Working Paper No.588,Feuruary 1991.
- 69 -
d) Providing Adequate Infrastructure Services
2.72 Public investment, especially in appropriate infrastructurefacilities, enhances private investment by lowering the cost of--among others--transport. communication and power and water supply. Indeed, a survey ofprimarily export-oriented firms indicate that inadequacy of infrastructureservices is the most serious constraint to their business activities (Annex2), a sign indicative of inadequate public capital and O&M expenditure oninfrastructure. As a result, most export-oriented entrepreneurs have theirown supply of infrastructure services (e.g. private power generation, well-water, cellular phones, and firm-specific supply of transportation for theiremployees) increasing production cost and weakening Sri Lankan exportcompetitiveness.
2.73 Thus, the need to improve infrastructural services is strong. Withthe pressing need to contain fiscal deficit to a manageable level, however,the Government must be careful in choosing and phasing infrastructureinvestments; the medium-term infrastructure investment pattern needs to beconsistent with the Government's strategy to promote industry and diversifiedagriculture both oriented toward exports as an engine of growth. In pursuingthis strategy, from both experiences of other countries and observations ofthe current situation in Sri Lanka, it should be conjectured that continuedconcentration of industrial activities in the Greater Metropolitan area maynot be avoidable. Agglomeration economies are important in increasingefficiency of firm operation, and therefore, the economy's internationalcompetitiveness. It should be borne in mind that, in discussing export-oriented strategies, Colombo is competing with Hong Kong, Bangkok, Jakarta,Singapore, Bombay, Madras, etc. Attempts to force export-oriented industriesaway from Colon.vo toward smaller cities such as Trincomalee, Jaffna or Gallenow would jeopardize the economy's competitiveness and slow down growth ofboth income and employment in the medium-term future. Government's immediatepolicy priority should be to review the availability and quality ofinfrastructure services in Greater Colombo Metropolitan area and establish astrategy to build up required infrastructure. Colombo and surrounding areas(currently housing about 3.5 million population) should not repeat the historyof Bangkok which, due to the Central Government's desire to cut back publicinvestment starting in 1985, has such inadequate infrastructure services(roads, water, power, etc.) and related environmental pollution that the costof doing business there has skyrocketed to the point that many potentialinvestors are now choosing to invest in other cities in Asia.
2.74 The development of areas outside the Metropolitan Colombo areashould be through: (i) improved rural-urban interdeE ndence based on betterinfrastructure (transport and communications which respectively lower shippingand information cost, between urban and rural areas) which would boost farmand non-farm rural income if rapid urbanization takes place; and (ii)efficient systems that make foreign markets accessible from rural areasthrough Colombo in terms of both physical transport and market information,What is critical for road transport at this stage is to increase efforts tomaintain the existing road network and establish responsible and viable truck,bus, rail and sea transport subsectors based on commercial principles. At the
- 70 -
same time, telecommunication needs to be improved between all parts of thecountry, through Colombo and to foreign cities. Given the limited capacity ofthe Telecommunication Corporation it is recommended that foreign investment bebrought in to establish selected electric data lines or fax-quality telephoneconnections. Foreign investment in other infrastructure facilities includingthe road transport system should also be encouraged to alleviate currentlyexisting bottlenecks. Refrigerated storage and transport facilities are alsogood candidates for foreign participation which would encourage non-traditional and export-oriented agricultural activities outside theMetropolitan Colombo area.
e) Summary
2.75 There are various areas whereby reforms are needed to promoteprivate productive investment. This sectior. identifies four areas ofimportance, partially based on our sector work, interviews with businessmenand other observations. The first is the need to improve the efficiency ofthe financial institutions by, among others: (i) restructuring andrecapitalizing the two state-owned commercial banks--restructuring includescommercialization of both banks (and privatization of one of them) to improvethe competitive environment of the sector; (ii) rationalizing the NationalSavings Bank; (iii) improving the practice of classifying and provisioning forbad debts; (iv) improving debt recovery through amending legislation andestablishing a debt recovery agency; and (v) allowing public sector financialinstitutions to freely adjust their portfolios. Second, foreign investmentshould play a crucial role in enhancing the economy's productive assets whiledomestic savings are limited. To achieve this goal, the institution thatapproves and supports foreign investments (GCEC) should be improved, and bothapproval procedures and fiscal incentives should be unified for all investorsregardless of their investment sites. These incentives should also besimplified in view of the ongoing tax reforms (which reduce the need forspecial incentives as rates are being lowered) and the consideration that bothdomestic and foreign investors should be equally treated. Finally, automaticapproval of foreign investment should be the norm for all activities exceptthose related to national security and health hazards. Third, anecdotalevidences indicate consistently that the over-protection of Sri Lanka's laborthrough labor legislation is undermining the objective of increasingemployment by raising the cost of labor. A good example is the TerminationAct that practically takes away the employers' right to terminate employees onnon-disciplinary grounds. A repeal of the Act or, waiving the effect of thelaw using, as an alternative, the Industrial Dispute Act should berecommended. The rest of the economy's complex labor legislation should alsobe reviewed and streamlined. Fourth, the economy's inadequate infrastructureforms a constraint to business activities according to existing entrepreneurs.A strategy of infrastructure development should be established with theobjective of promoting industrial and diversified agriculture oriented towardsexports. This would most probably include improvement of industrialinfrastructure in and around Colombo and improvement of the road andcommunication network in the rest of the country.
- 71 -
5. Restructuring Poverty Programs
2.76 In Sri Lanka, poverty and unemployment have traditionally been keyfactors in shaping economic policies. The Government has recognizedimportance of investments in health and education for improving the well-beingof the disadvantaged. As a result, health and education services are muchbetter than other countries at a comparable level of income. In addition, theGovernment has given priority to the provision of food subsidies to thepopulation--initially subsidized ration-rice was given to nearly every SriLankan, and after 1979 food stamps were provided to about one half of thepopulation. The food subsidy programs, however, have suffered fromsubstantial leakages of resources to the non-poor because data based onvarious household surveys show that less than a half of food stamp recipientsor about 20-25 percent of the population actually have inadequate calorieintake. As a result of this inadequate targeting, the really poor receivedonly 40 percent of the total income transfers through the past food subsidyprograms. Many governments in Sri Lanka have also been concerned with theissue of chronically high unemployment, especially the unemployed poor.However, the majority of the unemployed in Sri Lanka are young first-time jobseekers, a significant proportion of whom are queuing up for potential publicsector jobs while supported by their family members. Thus, less than 6percent of poor household heads are unemployed--and incrtasing employment perse would have only limited effects on the poor. Lower productivity and lowwages of the employed poor are more critical issues--issues that can mosteffectively be addressed by higher growth.OJ
2.77 With slow growth experienced in the second half of the 1980s andthe civil unrese situation in both the North and East and the South, theGovernment perceived an increasingly urgent need to address the issues ofpoverty and unemployment with a higher emphasis on income transfers than inthe past. This was partially because the Government saw an increased need tohelp the poor and unemployed due to slow growth or those dislocated due to thecivil conflicts. But, more importantly, the Government realized that theperception of the poor and the unemployed that they had been inadequately andunfairly treated contributed to the aggravation of the civil conflictsituation. Therefore, in its election campaign in 1988, the Governmentpromised to launch two large programs, the Jana Sav.ya (poverty alleviation)Program (JSP) and the Mid-Day Meal Program (MDMP). The JSP was originallydesigned as significant income transfers to 50 percent of population for twoyears during which time beneficiaries are supposed to obtain necessary skillsfor employment or self-employment. This program would have cost above 20percent of GDP a year if implemented in its original design. Concerned alsowith child malnutrition, the Government promised a program to provide a mid-day meal (or food stamps equivalent to it) to every school child in thecountry. Recognizing, however, the programs' fiscal implications andapparently limited effectiveness, the Government has recently started their
W The issues of poverty and unemployment were discussed extensively inthe last country economic memorandum.
- 72 -
restructuring to reduce leakages to non-intended beneficiaries and to increasetheir effectiveness.
2.78 It is important to note that a rational strategy to address theissue of social development must consist of three elements. The first, andthe most important element is that the overall macroeconomic policy and thebusiness environment be conducive to private productive investment, and thus,support efficient growth of income. These policy issues are discussed in therest of this report. The second element is that investment programs ineducation and health, which the Sri Lankan Government traditionallyemphasized, must be well-chosen and designed to increase their effectiveness.Giveh the importance of the quality of human capital that supports futuregrowth, the Government should vigorously pursue implementation of highpriority social projects. This issue of prioritizing investments will bediscussed in the public expenditure review in the context of the ne:ct CountryEconomic Memorandum. Third, income transfer programs, as a safety net, mustbe managed effectively for those who remain in extreme poverty. It isunderstandable that the Government particularly stresses the need for safety-net programs during a period of major economic restructuring because someprice hikes hurt the poor directly and because shifting resources from non-productive/non-competitive sectors to more promising areas inevitably involvestemporary displacement of labor. This notwithstanding, the Government's focusso far on the income transfer programs has been excessive relative to the twoother types of efforts that need to be made; even with the ongoingrestructuring efforts, income transfers amount to above 3 percent of GDP ascompared with 1 percent prior to 1989. Discussed below are ongoing efforts bythe Government to rectify targeting and cost effectiveness problems of thethree major poverty programs (the Food Stamp, Jana Saviya, and the Mid-DayMeal) which account for 70 percent of current transfers to households.
a) Jana Saviya Program
2.79 The Jana Saviya Program (JSP) is the Government's main povertyalleviation program. The original proposal was to give substantialconsumption assistance to one half of the population for two years. Realizingits high fiscal cost, the Government has reduced the program and staggered itover 11 rounds. The first round was initiated in October 1989. In thisRound, 164,000 families had access to a monthly entitlement, consisting ofRs 1042 in JSP stamps to buy specified consumer goods from the cooperatives,and Rs 458 to be deposited in an individual's saving account. There were,however, two major shortcomings with Round I: First, it was not well targetedto the poor. Almost tnree quarters of the food stamp holders were included inthe program. Second, the supposed production-orientation of the program wasmissing--JSP recipients were expected to engage in some sort of communityrelated work (called Saragam), but this was never enforced, creating strongdisincentives to work, ns JSP benefits are about equivalent to the wage levelof a semi-skilled laborer.
2.80 Based on the experience of this first round, the second round hasbeen restructured substantially in the following three respects. First, usingthe above-mentioned community-based screening process, the Government has
- 73 -
reduced the number of second round JSP beneficiaries from the initiallyintanded 164,000 to 100,000 households. The screening process was carried outin three phases. In the first phase. 20 poorest families were selected ineach hamlet of the 22 Assistant Government Agent (AGA) divisions following acommunity based screeiiing process among food stamp recipients. This phaseidentified only one third of the food stamp recipients. Subsequently,following the same proceduire, another 10 families from each hamlet wereselected, making a total of 70,000 JSP beneficiaries. In some hamlets wherethere is a large concentration of thP poor, more families were identified in athird phase. The number of beneficiaries so selected was 100,000 families, or50 percent of food stamp recipients in these divisione.
2.81 Second, Round II is being made more production-oriented. Toreceive the entitlement, Round II beneficiaries have to enroll in production-oriented work which includes civil works, land development, skills andentrepreneurship training for self-employment and micro-enterprisedevelopment. This nexus between JSP payment and participation in a productiveactivity will be achieved with assistance from the newly created Jana Saviyarrust established in the context of IDA's Poverty Alleviation Credit (PAC) andin close cooperation with partner organizations which are mainly NGOs andrelevant government agencies. The identification and management of ruralcivil works and the provision of training for the JSP participants are carriedout by partner organizations under the supervision of the Trust/PAC. The PAC,in addition, has a credit component that assists the enterprising among thepoor to start their own businesses. Third, in the JSP, the Government willput into place an exit mechanism so that: (i) those refusing to participate ina productive activity would be dropped from the program immediately and becomeeligible for food stamps only; and (ii) beneficiaries would graduate from theprogram within the two-year JSP entitlement period as soon as the family'sincome level reaches Rs 1,500 per month on a sustained basis. This exitmechanism is expected to furt.er reduce the number of beneficiaries below100,000.
2.82 These principles have been translated into clear guidelines withrespect to the modus operandi of the Jana Saviya Trust. More importantly, thepublic in general and JSP recipients in particular have been informed of thenew rules governing Round II. It is hoped that Round II would be atransitional and somewhat experimental phase which will try to establish aclear link between JSP entitlement, productive activities and the Trust. Itis, therefore, recommended that the next round of the JSP be started after theimplementation of Round II is fully underway and that the Jana Saviya Trust'scapacity to undertake actions on a larger scale be enhanced. Additionally,partly because the budgetary resources are limited, state-owned commercialbanks have been asked to extend low-interest credit to JSP beneficiaries.This has not yet been done on an extensive scale, but the Government should bediscouraged from taking such action lest the financial sector development beundermined by further weakened state-owned banks. Additional subsidies to JSPbeneficiaries, if needed at all, should come through the transparent budgetarysystem.
- 74 -
b) The Food Stamp Program
2.83 No matter how much emphasis the Government puts on productionorientation and on training and entrepreneurship in its Jana Saviya Programand other policy areas, it will not be possible to eradicate povertyaltogether. The food stamp program (FSP), if managed properly, can pro-de asafety net"J particularly for the ultra poor (defined as those spending morethan 80 percent of their income and obtaining less than 80 percent ofnutrition requirement in terms of calories--about 3 percent of thepopulation). The FSP, however, also suffered from inadequate targeting withlimited benefits per capita. The Government has, therefore, undertaken to re-target the population of FSP beneficiaries to the truly needy and reduce theirnumber to one million households, an estimated size of the truly needy.However, these one million households have been screened from outside theareas where JSP rounds I and II are being implemented, as no food stampbenefits are given in those regions. Therefore, the selection is being donebased on 1.5 million families, rather than the originally planned populationof 1.9 million covering the entire island (excluding the North and East wherethe program administration is impossible). Next, from the remaining 1.5million households, about 600,000 families have been declared ineligible andso notified while 100,000 families, who had not been receiving food stamps,have been identified as eligible in the process and added to the beneficiarylist. (The latter number may include families dislocated from the North andEast, and affected by the return migration from the Gulf.) Food stamps whichare good from October 1, 1991 have been issued to these eligible one millionhouseholds. In this process, there are two considerations that the Governmenthas to take into account. First, JSP is unlikely to eliminate poverty, as atthe end of the program even the Government's optimistic projection states 60percent to 80 percent of the beneficiaries will have a sustainable income, inthe wet zone and in the dry zone about 20 to 40 percent. These figures arelikely to be much lower. Therefore, some JSP areas will continue to needincome transfers in the future. Second, food stamp entitlement per familyshould be increased for the ultra-poor. Budgetary saving should be achievedby further targeting of the beneficiaries to the poorest of the populat'on.
c) The Mid-Day Meal Program
2.84 The mid-day meal program clearly suffers from highly limitedeffectiveness in reducing child malnutrition, and is a good candidate forresource savings through its elimination or fundamental redesigning. In thisprogram, every school child in primary and secondary education receives adaily coupon for three rupees (on condition that he/she brings a homemadelunch to school) which can be used at the end of the month to buy candy, soft
My It is, hoever, wrong to assume that every poor person Just be coveredby this safety net. For some temporarily unemployed, for example,unemployment insurance should be much more efficient. Furthermore, in view ofthe potential work disincentives such income transfer could entail, thecurrent eligibility criteria consisting mostly of income levels should bereviewed thoroughly.
- 75 -
drink, exercise book, or food for adult members of the family at designatedstores. It is clear that in ad3ition to being costly (actual expenditures ofaround Rs 1.6 billion in 1990). this program is far from achieving itsintended objectives, i.e. to satisfy the nutritional requirements of theschool-age population. Rather, it merely causes leakages of enormousresources to non-poor children and their parents. There are certainly moreeffective ways to improve the nutritional status in the country by targetingchildren under three years of age who are nutritionally at risk, and lactatingmothers. An innovative nutrition intervention approach being tested by theGovernment in one AGA divisioii will be extended to others under the IDA-assisted Poverty Alleviation Project. It is estimated that the cost of thenation-wide application of this targeted nutrition intervention is at most Rs400 million. This should replace the mid-day meal program entirely.
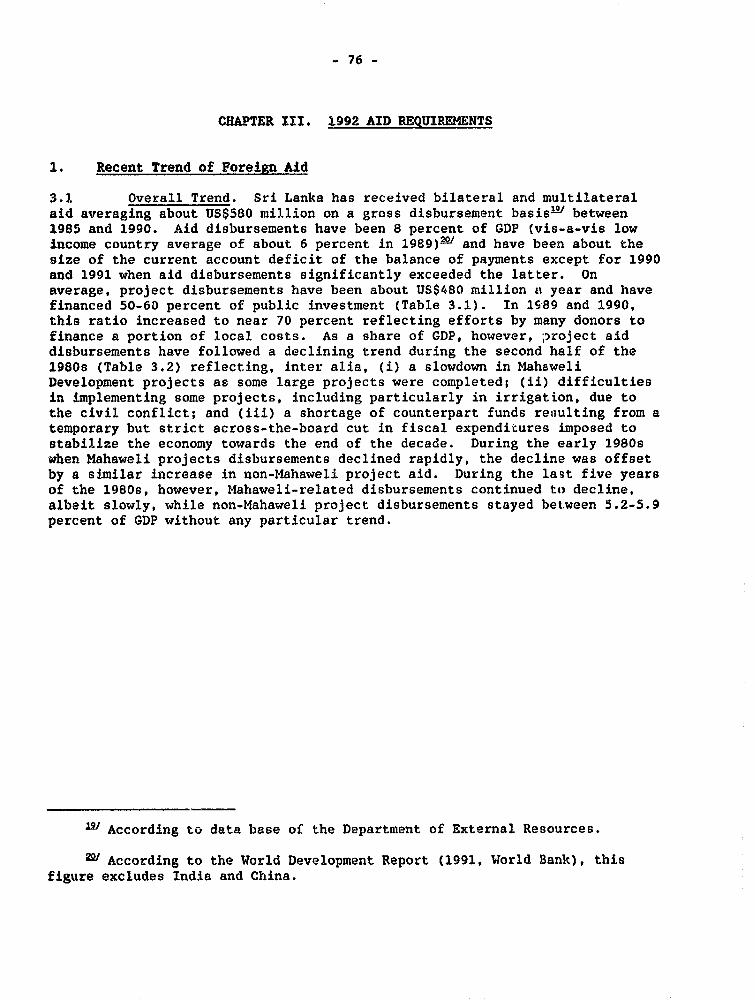
- 76 -
CHAPTER III. 1992 AID REQUIREMENTS
1. Recent Trend of Foreign Aid
3.1 Overall Trend. Sri Lanka has received bilateral and multilateralaid averaging about US$580 million on a gross disbursement basisL' between1985 and 1990. Aid disbursements have been 8 percent of GDP (vis-a-vis lowincome country average of about 6 percent in 1989)29 and have been about thesize of the current account deficit of the balance of payments except for 1990and 1991 when aid disbursements significantly exceeded the latter. Onaverage, project disbursements have been about US$480 million a1 year and havefinanced 50-60 percent of public investment (Table 3.1). In 1$89 and 1990,this ratio increased to near 70 percent reflecting efforts by many donors tofinance a portion of local costs. As a share of GDP, however, project aiddisbursements have followed a declining trend during the second half of the1980s (Table 3.2) reflecting, inter alia, (i) a slowdown in 1MahaweliDevelopment projects as some large projects were completed; (ii) difficultiesin implementing some projects, including particularly in irrigation, due tothe civil conflict; and (iii) a shortage of counterpart funds rei;ulting from atemporary but strict across-the-board cut in fiscal expenditures imposed tostabilize the economy towards the end of the decade. During the early 1980swhen Mahaweli projects disbursements declined rapidly, the decline was offsetby a similar increase in non-Mahaweli project aid. During the last five yearsof the 1980s, however, Mahaweli-related disbursements continued to decline,albeit slowly, while non-Mahaweli project disbursements stayed between 5.2-5.9percent of GDP without any particular trend.
18 According to data base of the Department of External Resources.
2u According to the World Development Report (1991, World Bank), thisfigure excludes India and China.
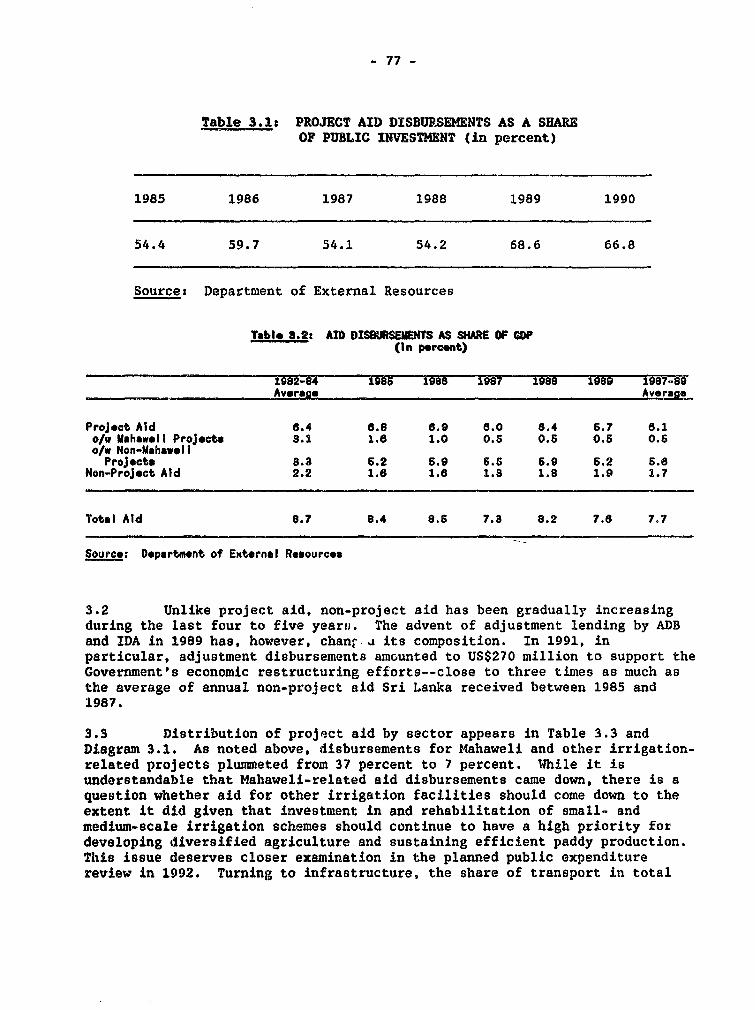
- 77 -
Table 3.1a PROJECT AID DISBURSEMENTS AS A SHAREOF PUBLIC INVESTMENT (in percent)
1985 1986 1987 1988 1989 1990
54.4 59.7 54.1 54.2 68.6 66.8
Sources Department of External Resources
Table 0.2: AID DISBURSEMENTS AS SHARE OF CDP(In percent)
1982-84 1985 _1986S 1987 198 1989 1987-89Average Average
Project Aid 6.4 6.8 6.9 6.0 6.4 5.7 6.1o0w Mahawell Projects 1 1.6 1.0 0.5 0.5 0.6 0.6o/w Non-Mahawll
Projects 8.3 6.2 5.9 5.6 6.9 5.2 .68Non-Project Aid 2.2 1.6 1.6 1.3 1.8 1.9 1.7
Total Aid 8.7 8.4 8.6 7.8 8.2 7.8 7.7
Source: Department of External Resources
3.2 Unlike project aid, non-project aid has been gradually increasingduring the last four to five yearti. The advent of adjustment lending by ADBand IDA in 1989 has, however, chan .i its composition. In 1991, inparticular, adjustment disbursements amounted to US$270 million to support theGovernment's economic restructuring efforts--close to three times as much asthe average of annual non-project aid Sri Lanka received between 1985 and1987.
3.3 Distribution of project aid by sector appears in Table 3.3 andDiagram 3.1. As noted above, disbursements for Mahaweli and other irrigation-related projects plummeted from 37 percent to 7 percent. While it isunderstandable that Mahaweli-related aid disbursements came down, there is aquestion whether aid for other irrigation facilities should come down to theextent it did given that investment in and rehabilitation of small- andmedium-scale irrigation schemes should continue to have a high priority fordeveloping diversified agriculture and sustaining efficient paddy production.This issue deserves closer examination in the planned public expenditurereview in 1992. Turning to infrastructure, the share of transport in total
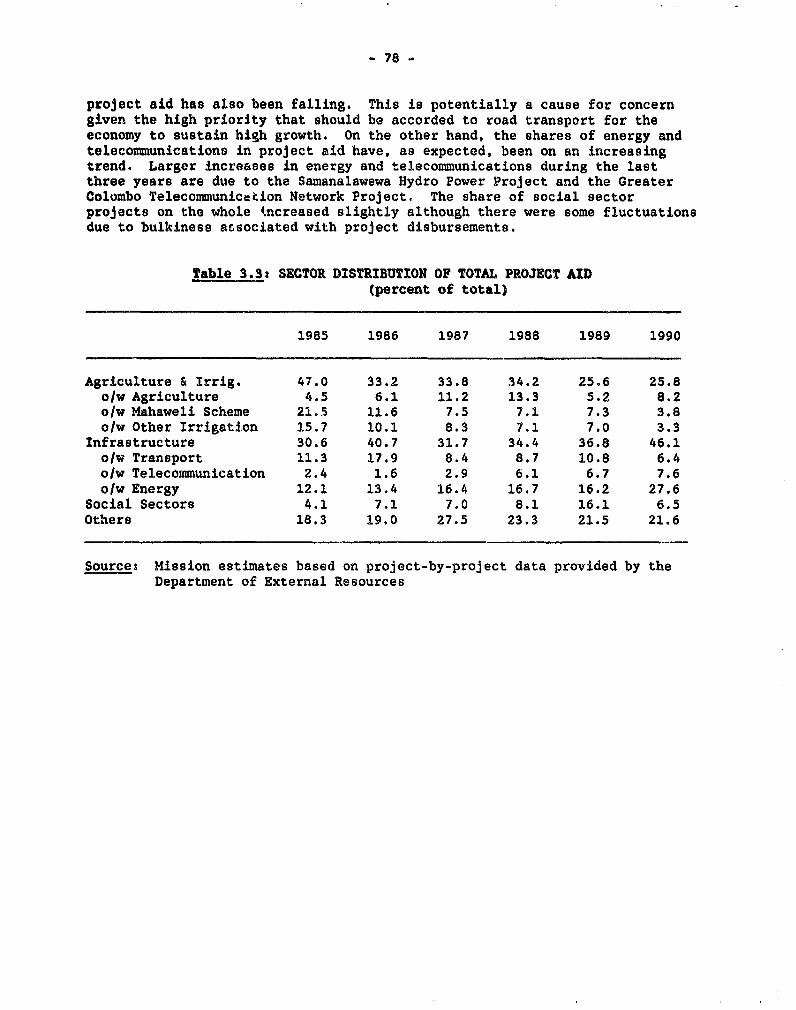
- 78 -
project aid has also been falling. This is potentially a cause for concerngiven the high priority that should be accorded to road transport for theeconomy to sustain high growth. On the other hand, the shares of energy andtelecommunications in project aid have, as expected, been on an increasingtrend. Larger increases in energy and telecommunications during the lastthree years are due to the Samanalawewa Hydro Power Project and the GreaterColombo Telecommunicetion Network Project. The share of social sectorprojects on the whole tncreased slightly although there were some fluctuationsdue to bulkiness associated with project disbursements.
Table 3.3: SECTOR DISTRIBUTION OF TOTAL PROJECT AID(percent of total)
1985 1986 1987 1988 1989 1990
Agriculture & Irrig. 47.0 33.2 33.8 34.2 25.6 25.8osw Agriculture 4.5 6.1 11.2 13.3 5.2 8.2o/w Mahaweli Scheme 21,5 11.6 7.5 7.1 7.3 3.8o/w Other Irrigation 15.7 10.1 8.3 7.1 7.0 3.3
Infrastructure 30.6 40.7 31.7 34.4 36.8 46.1o/w Transport 11.3 17.9 8.4 8.7 10.8 6.4olw Telecommunication 2.4 1.6 2.9 6.1 6.7 7.6ojw Energy 12.1 13.4 16.4 16.7 16.2 27.6
Social Sectors 4.1 7.1 7.0 8.1 16.1 6.5Others 18.3 19.0 27.5 23.3 21.5 21.6
Source: Mission estimates based on project-by-project data provided by theDepartment of External Resources
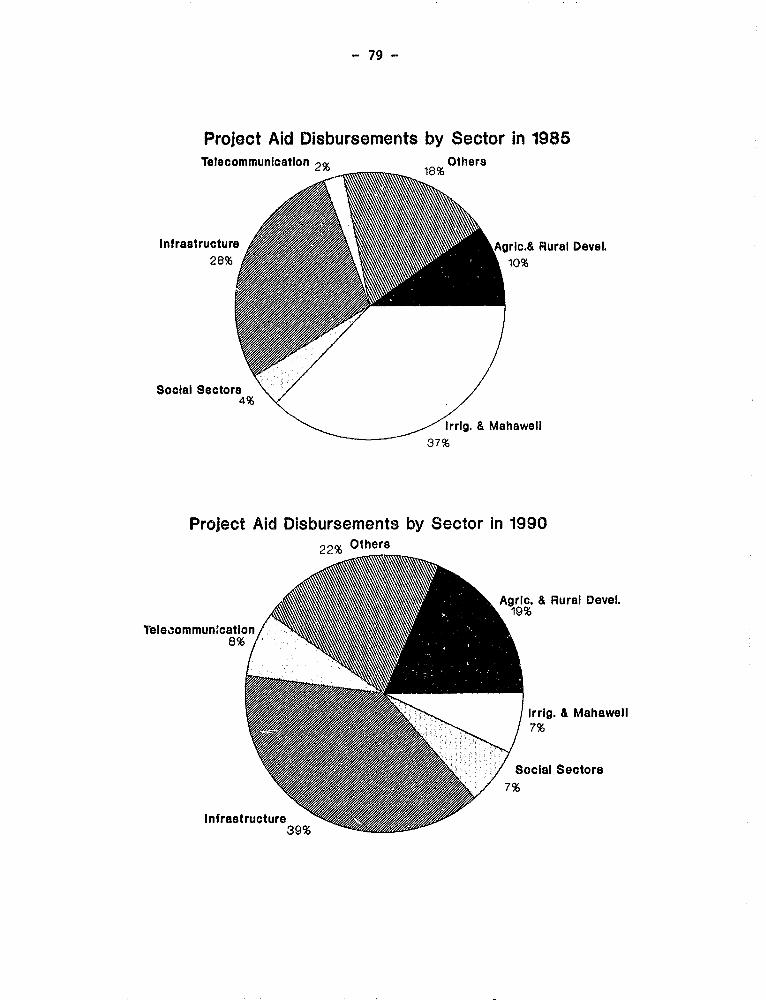
- 79 -
Project Aid Disbursements by Sector in 1985Telecommunication 2 8% Others
Infrastructure Arc.& Rural Devel.
Soclal Sectors4%
Irrig. & Mahawell37%
Project Aid Disbursements by Sector in 199022% Others
Agric. & Rural Devel.
Toleeommun:catSon
Irrig. & Mahawell7%
Social Sectors
Infrastructure
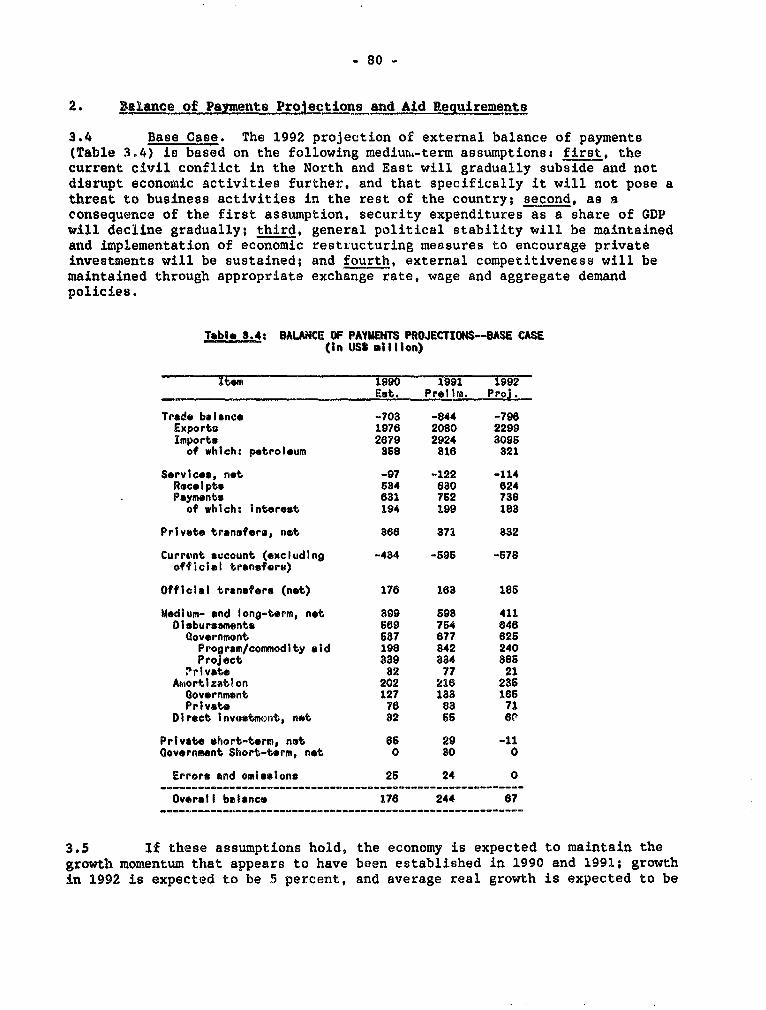
- 80 -
2. B0alance of Payments Proiections and Aid Requirements
3.4 Base Case. The 1992 projection of external balance of payments(Table 3.4) is based on the following medium.-term assumptions: first, thecurrent civil conflict in the North and East will gradually subside and notdisrupt economic activities further, and that specifically it will not pose athreat to business activities in the rest of the country; second, as aconsequence of the first assumption, security expenditures as a share of GDPwill decline gradually; third, general political stability will be maintainedand implementation of economic restl.ucturing measures to encourage privateinvestments will be sustained; and fourth, external competitiveness will bemaintained through appropriate exchange rate, wage and aggregate demandpolicies.
Table 8.4: BALAN4CE OF PAYMENTS PROJECTIONS--BASE CASE(in US$t ilion)
_ItWm_ 1990 1992. 1992Est. Pre ltm. Proi.
Trads balance -703 -844 -798Exports 1976 2080 2299Imports 2679 2924 3096
of which: petroleum 368 816 321
Services, not -97 -122 -114Receipts 634 630 624Payments 631 762 738
of which: interest 194 199 183
Private transfers, net 388 371 332
Currant account (excluding -434 -595 -578official transfers)
Official transfers (not) 176 168 18S
Medium- and long-term, not 399 593 411Disbursements 569 764 648
Government 587 877 626Program/commodity aid 198 842 240Project 339 334 88S
Irivat. 82 77 21Ahmortization 202 k18 235
Government 127 133 165Privato 76 8a 71
Direct lnvotmofnt, not 82 55 eo
Private short-term, net 8S 29 -11Government Short-term, not 0 3o 0
Errors and omissions 26 24 0----------------------------- __----------------------------
Overall balance 178 244 67
3.5 If these assumptions hold, the economy is expected to maintain thegrowth momentum that appears to have been established in 1990 and 1991; growthin 1992 is expected to be 5 percent, and average real growth is expected to be
- 81 -
5-6 percent a year during the next three years. It should be emphasized thatthis positive outlook is sensitive to progress--or lack of progress--inresolving the civil conflict.
3.6 To sustain this rate of growth within a tightly managedmacroeconomic framework but reflecting the negative real import growth between1987-1989, the overall 1991 and 1992 inport elasticity is assumed to be above1.2 (1990 was 1.06). Particularly high in these years are elasticities ofimports of investment goods and intermediate goods (including oil) reflectingthe assumed high economic growth and limited initial stock availability.Consumer goods, on the other hand, are expected to have an increasing but lowelasticity reflecting both the assumption that regular weather conditionsprevail, which reduces the need for substantial rice imports, and thatGovernment's measures to remove consumption bias in the economy will beimplemented as discussed in Chapter II. It is, however, expected that therewill be an initial increase in imports of non-food consumer goods because somepent-up demand for these goods exists. As this pent-up demand and demand forstock adjustment for investment and intermediate goods are eased in themedium-term future (by 1994/95), import elasticities for these goods areprojected to fall to around unity. With these assumptions, the overallimports in real terms will be growing at 5-6 percent a year. This wouldtranslate to about 10 percent growth in nominal US dollar term imports from1992 onwards.
3.7 From 1992, export volume is expected to grow at slightly above 7percent a year. Export-oriented and liberalizing policy measures discussed inChapter II are expected to create an environment conducive to non-traditionalexport growth. Non-tree crop agriculture and "other" industrial exports(excluding garments, processed diamonds and petroleum re-exports), as aresult, are expected to continue to grow rapidly, at 9 percent and 19 percentin volume terms, respectively. These rates reflect actual performance asthese exports have been growing at 10 percent and 18 percent, respectively,over the last four to five years. Garment exports are expected to grow at 8percent in volume terms--this projected growth is a little slower than 11percent average in the past five years reflecting expected changes in marketconditions after 1992 and a gradual shift of Sri Lankan production to highervalue-added products. Traditional treecrop exports on the other hand, areexpected to have steady but rather low growth rates. In volume terns, tea andrubber exports are expected to be growing at 1-2.5 percent a year. Coconutexports are expected to be maintained at the 1990 level (when weatherconditions for coconut were average). Gem exports, which have had largefluctuations, are projected to maintain the 1990 export level on average.These volume projections discussed above would translate into 9 percent growthin nominal US dollar terms in 1992 and 11-12 percent thereafter.
3.8 These exports and imports projections would give the currentaccount deficit of around 5.7-5.9 percent of GDP during the next several
^1 r.
- 82 °
years6.2 This includes a conservative projection on tourism (nominallygrowing at 10-11 perceat a year after doubling between 1989 and 1991), andgradual recovery of private transfers from the delayed negative impact of theGulf crisis. Furthermore, debt service obligations declined from 25 percentof exports of goods and non-factor services in 1989 to 18-19 percent in 1990and 1991 primarily because of amortization of the Government's short-termcommercial debts. They are projected to further decline to 12.4 percent by1994 because of buoyant export growth, and continued restraint from commercialborrowing. In this respect, the Government needs to proceed carefullyregarding the purchase of a number cf airplanes planned by Air Lanka over thenext few years. Already, the first purchase of an airbus raised thecommercial borrowing by US$36 million in 1991. Future commercial borrowingfor this purpose shnuld be minimized and, initially, leasing should be doneuntil the market proves that purchases will have high returns.
3.9 Finally, foreign investment, which increased significantly in 1991albeit from a low 1990 base, would be boosted further and projected to reachUS$100 million in two or three years. To achieve these levels, the Governmentwould have to create a liberalized investment climate with unified, simple andautomatic procedures for fure.'gn investment approval (paras. 2.61-2.67) asquickly as possible as well as to make progress in resolving the civilconflict.
3.10 Aid Requirements for 1992. As argued in Chapter II, the Governmenthas committed itself to reforms that, if sustained, will lead to export-oriented and sustained growth, although macroeconomic management in 1991 wasnot tight enough. If the Government can get the economy back on to therestructuring path by reversing the expansionary macroeconomic trend itstarted to establish in 1991, and maintain the earlier commitment toimplementing export-oriented policy reforms, Sri Lanka should succeed inachieving such growth. In addition, growth would not only increase the incomelevel but also reduce unemployment and most probably reduce the level ofsocial tension u-derlying the civil conflict situation in the country.
3.11 To achieve this sustained growth, the reform efforts must continue.The current account deficit in 1992 that supports the reform efforts isexpected to be around 5.8-5.9 percent of GDP. In addition, taking intoconsideration the need for debt amortization, restoration of gross reserves toa level equivalent to three months of merchandise imports (which was theaverage coverage during the early 1980s) and netting out private sector flowsand the IMF's ESAF, the external aid financing requirement is projected to beabout US$790 million a year for 1992 (Table 3.5). Project aid disbursementsare expected to be about US$530 million which is consistent with theGovernment's public investment program. About US$ 500 million of this can be
W The current account deficit of 5.4 percent ol GDP achieved in 1990 wasdue to some exceptional circumstances and was based on external factors thatare unlikely to be repeated. A current account deficit of 5.8-5.9 percent ofGDP, therefore, is assumed to be a more realistic starting deficit level forthe near future.
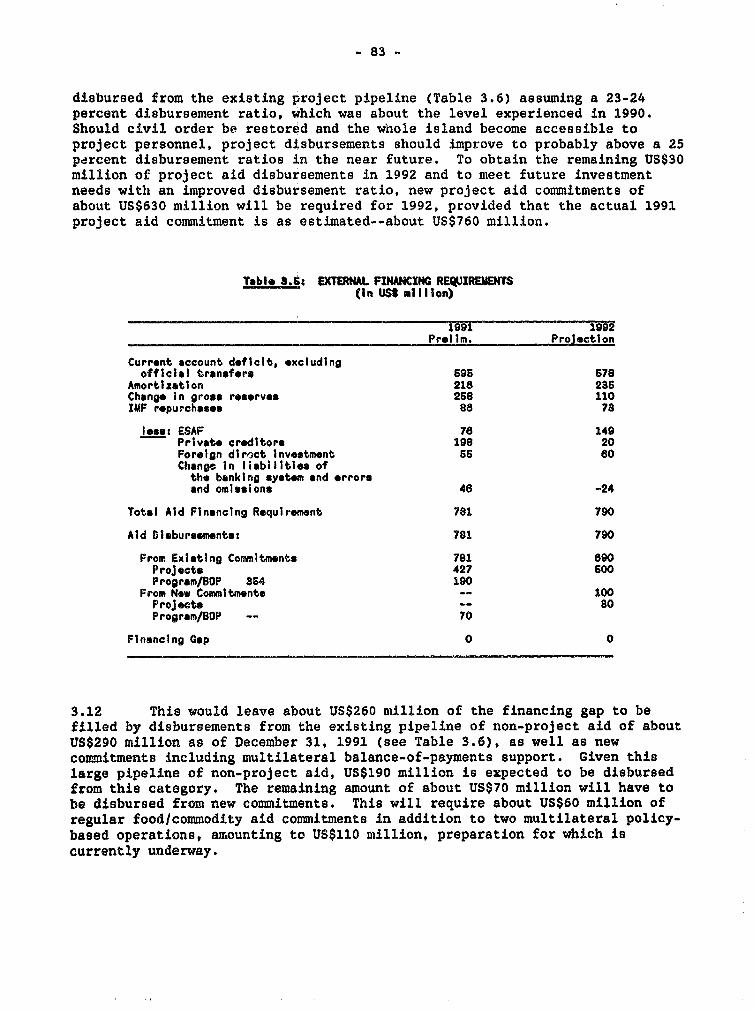
- 83 -
disbursed from the existing project pipeline (Table 3.6) assuming a 23-24percent disbursement ratio, which was about the level experienced in 1990.Should civil order be restored and the whole island become accessible toproject personnel, project disbursements should improve to probably above a 25porcent disbursement ratios in the near future. To obtain the remaining US$30million of project aid disbursements in 1992 and to meet future investmentneeds with an improved disbursement ratio, new project aid commitments ofabout US$630 million will be required for 1992, provided that the actual 1991project aid commitment is as estimated--about US$760 million.
Table S.6: EXTERNAL FINAfCING REQUIREMENTS(in USS m1lI0on)
Prelim. Projection
Current account d.ficit, *xcludingofficial transfers 595 678
Amortization 218 285Change In gross reserves 258 110IMF repurchas*e 86 78
loes: ESAF 78 149Privat, creditors 198 20Foreign diroct investment 56 80Change In liabilities ofthe banking system and errorsand omissions 46 -24
Total Aid Financing Requirement 781 790
Aid Disbursements: 781 790
From Existing Commitments 781 690Projects 427 go0Program/SOP 854 190
From New Commitments - 100Projects -- 80Program/BOP -- 70
Financing Gap 0 0
3.12 This would leave about US$260 million of the financing gap to befilled by disbursements from the existing pipeline of non-project aid of aboutUS$290 million as of December 31, 1991 (see Table 3.6), as well as newcoumitments including multilateral balance-of-payments support. Given thislarge pipeline of non-project aid, US$190 million is expected to be disbursedfrom this category. The remaining amount of about US$70 million will have tobe disbursed from new commitments. This will require about US$60 million ofregular food/commodity aid commitments in addition to two multilateral policy-based operations, amounting to US$110 million, preparation for which iscurrently underway.
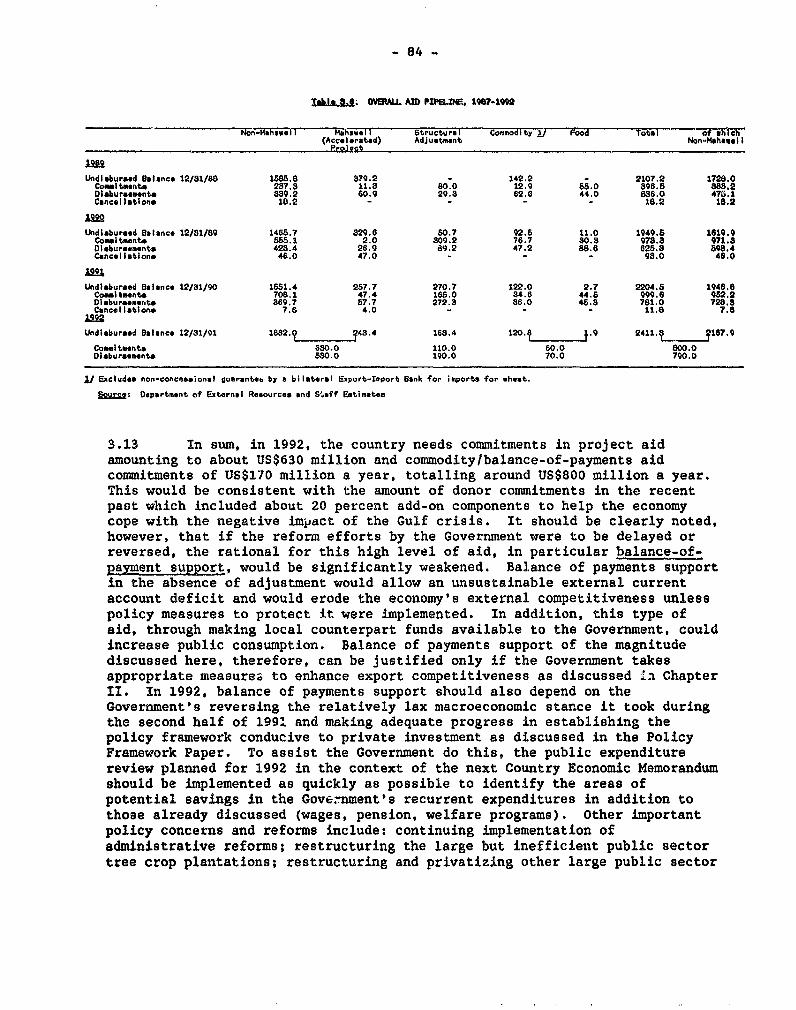
- 84 -
TkIsA.6; OV9tALL AID PI*'6M, 19?-1992
Non-Mahawell NahRavel Structural Commodity Al Foi Total of *h)ch(Accelerated) Adjuetwent Non-H.hwll
Undl.buraed Balance 12/31/88 1180.8 879.2 - 142 2 - 2107.2 1728.0Comitment. 237.3 11.3 80.0 12.9 55.0 898.6 88 82Disburveemnto 889.2 60.9 29.3 62.6 44.0 88680 47.1iCancellations 18.2 - - - - 18.2 18.2
2iQ
Undlebured Balance 12/81/69 1465.7 829.6 S0.7 92.8 11.0 1949.5 1619.9Coimtaitent 555.1 2.0 309.2 76.7 80.3 978.8 971.8Dlbursements 428.4 26.9 89.2 47.2 88.6 625.6 898.4CanceilatIon. 46.0 47.0 - - . 93.0 48.0
Undlabur ed Balance 12/81/90 1551.4 257.7 270.7 122.0 2.7 2204.S 1946.8Commitment. 708.1 47.4 165.0 84.6 445 6 999.6 982.2Disburseen.rts 869.7 57.7 272.8 88.0 45.8 781.0 7283.Cancellation, 7.6 4.0 - - - 11.8 7.8
Undiebura.d ealance 12/S1/91 1882. 34S.4 168.4 1 20.1 8 9 0 2411 j 3 18 7.9
Commitments 680.0 110.0 60.0 800.0Disbursements 880.0 190.0 70.0 700.0
Ii Excludes non-conceoaional guaranteb by a bilateral Export-Import Bank for imports for oheat.
Sourcs: Department of External Rescurce* and S.aff Estimates
3.13 In sum, in 1992, the country needs commitments in project aidamounting to about US$630 million and commodity/balance-of-payments aidcommitments of US$170 million a year, totalling around US$800 million a year.This would be consistent with the amount of donor commitments in the recentpast which included about 20 percent add-on components to help the economycope with the negative impact of the Gulf crisis. It should be clearly noted,however, that if the reform efforts by the Government were to be delayed orreversed, the rational for this high level of aid, in particular balance-of-payment support, would be significantly weakened. Balance of payments supportin the absence of adjustment would allow an unsustainable external currentaccount deficit and would erode the economy's external competitiveness unlesspolicy measures to protect it were implemented. In addition, this type ofaid, through making local counterpart funds available to the Government, couldincrease public consumption. Balance of payments support of the magnitudediscussed here, therefore, can be justified only if the Government takesappropriate measurea to enhance export competitiveness as discussed 1A ChapterII. In 1992, balance of payments support should also depend on theGovernment's reversing the relatively lax macroeconomic stance it took duringthe second half of 1991 and making adequate progress in establishing thepolicy framework conducive to private investment as discussed in the PolicyFramework Paper. To assist the Government do this, the public expenditurereview planned for 1992 in the context of the next Country Economic Memorandumshould be implemented as quickly as possible to identify the areas ofpotential savings in the Government's recurrent expenditures in addition tothose already discussed (wages, pension, welfare programs). Other importantpolicy concerns and reforms include: continuing implementation ofadministrative reforms; restructuring the large but inefficient public sectortree crop plantations; restructuring and privatizing other large public sector
- 85 -
entities including CWE, and CPC; improving the efficiency of the financialsector and capital market; and other measures to promote private sectordevelopment by removing institutional, regulatory and legislative obstacles toprivate investment.
3.14 The Government has established a clear goal to achieve high andsustained growth through deveiopmant if industry and diversified agricultureoriented towards export, and this goal should be supported through investmentaid. To lay the foundation for such growth, Sri Lanka needs to invest inadditional infrastructural assets and to improve on operations and maintenanceof existing assets. In the Greater Metropolitan Areas, improved industrialinfrastructure facilities (power, industrial water, port, telecommunicationsand intra-urban and inter-city transport) are required while for diversifiedagriculture (which induces more broad-based growth) an efficient system ofrural-urban transport, high-quality telecommunications, and irrigationfacilities managed by farmers are essential. In addition, the economy needsto keep up social sector investments that facilitate future growth. Furtherwork is needed on priorities among sectors. For example, an irrigationstrategy after the Mahaweli has not been established. Neither has a clearinvestment priority within the transport sector been established despiterecent efforts. Again, the public expenditure review planned for 1992 isexpected to help fill these gaps and establish investment priorities for themedium-term future. Furthermore, in view of the recent economic disruptionsin the North and East, public investment (and donor assistance) needs shouldbe reviewed in detail once the civil situation improves substantially. TheGovernment would then need to assess to what extent physical assets have beendamaged by sector and by region, and prepare an investment plan within aframework of private sector-led growth.
3.15 There is, however, a risk that the civil conflict in the North andEast might worsen, in which event macroeconomic management would be made moredifficult. Donor support would then have to depend on how the Governmentdeals with the situation. Donors would need to review, for example, theextent of physical damage and insecurity, and the Government's efforts toprotect sound economic management and a positive investment climate.
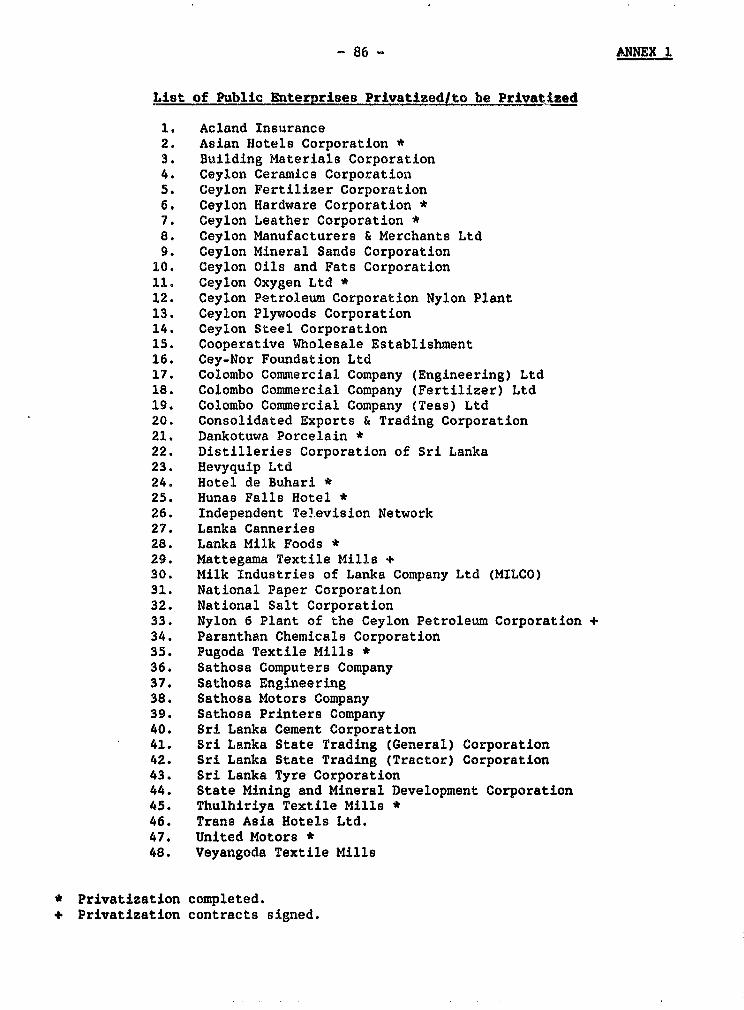
-86- ANNEX 1
List of Public Enterprises Privatized/to be Privatized
1. Acland Insurance2. Asian Hotels Corporation *3. Building Materials Corporation4. Ceylon Ceramics Corporation5. Ceylon Fertilizer Corporation6. Ceylon Hardware Corporation *7. Ceylon Leather Corporation *8. Ceylon Manufacturers & Merchants Ltd9. Ceylon Mineral Sands Corporation10. Ceylon Oils and Fats Corporation11. Ceylon Oxygen Ltd *12. Ceylon Petroleum Corporation Nylon Plant13. Ceylon Plywoods Corporation14. Ceylon Steel Corporation15. Cooperative Wholesale Establishment16. Cey-Nor Foundation Ltd17. Colombo Commercial Company (Engineering) Ltd18. Colombo Commercial Company (Fertilizer) Ltd19. Colombo Commercial Company (Teas) Ltd20. Consolidated Exports & Trading Corporation21. Dankotuwa Porcelain *22. Distilleries Corporation of Sri Lanka23. Hevyquip Ltd24. Hotel de Buhari *25. Hunas Falls Hotel *26. Independent Television Network27. Lanka Canneries28. Lanka Milk Foods *29. Mattegama Textile Mills +30. Milk Industries of Lanka Company Ltd (MILCO)31. National Paper Corporation32. National Salt Corporation33. Nylon 6 Plant of the Ceylon Petroleum Corporation +34. Paranthan Chemicals Corporation35. Pugoda Textile Mills *36. Sathosa Computers Company37. Sathosa Engineering38. Sathosa Motors Company39. Sathosa Printers Company40. Sri Lanka Cement Corporation41. Sri Lanka State Trading (General) Corporation42. Sri Lanka State Trading (Tractor) Corporation43. Sri Lanka Tyre Corporation44. State Mining and Mineral Development Corporation45. Thulhiriya Textile Mills *46. Trans Asia Hotels Ltd.47. United Motors *48. Veyangoda Textile Mills
* Privatization completed.* Privatization contracts signed.
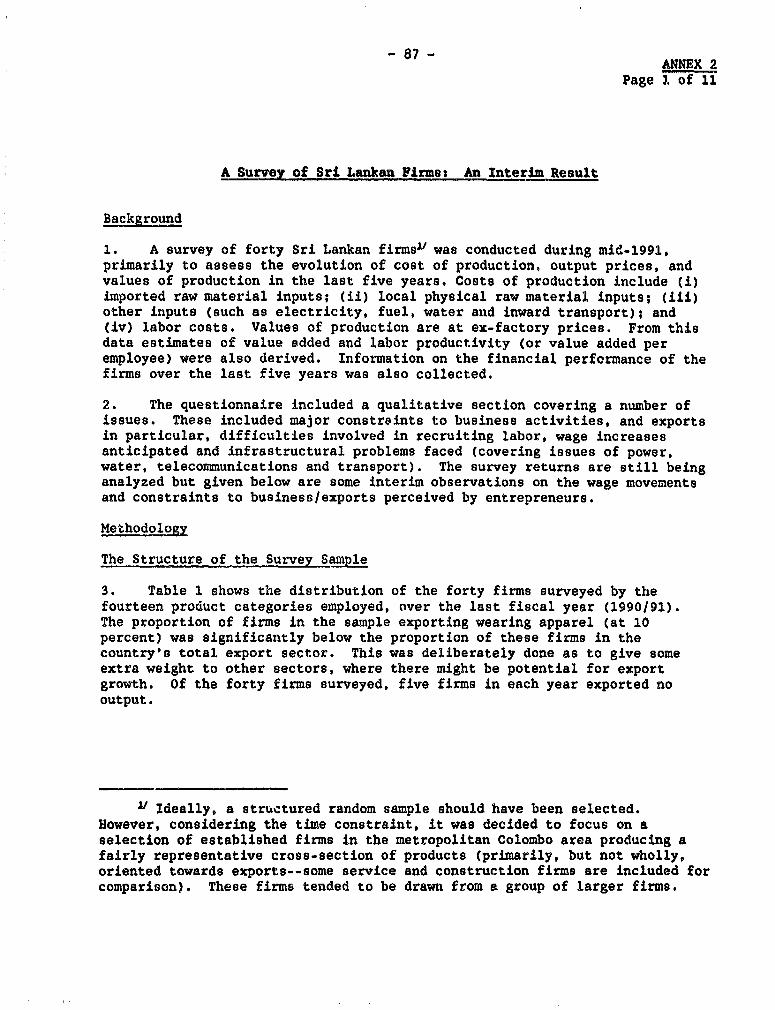
-87- ANNEX 2
Page 1 of 11
A Survey of Sri Lankan Firms: An Interim Result
Background
1. A survey of forty Sri Lankan firmsU was conducted during mid-1991,primarily to assess the evolution of cost of production, output prices, andvalues of production in the last five years. Costs of production include (i)imported raw material inputs: (ii) local physical raw material inputs; (iii)other inputs (such as electricity, fuel, water and inward transport); and(iv) labor costs. Values of production are at ex-factory prices. From thisdata estimates of value added and labor productivity (or value added peremployee) were also derived. Information on the financial perfcrmance of thefirms over the last five years was also collected.
2. The questionnaire included a qualitative section covering a number ofissues. These included major constreints to business activities, and exportsin particular, difficulties involved in recruiting labor, wage increasesanticipated and infrastructural problems faced (covering issues of power,water, telecommunications and transport). The survey returns are still beinganalyzed but given below are some interim observations on the wage movementsand constraints to business/exports perceived by entrepreneurs.
Methodology
The Structure of the Survey Sample
3. Table 1 shows the distribution of the forty firms surveyed by thefourteen product categories employed, over the last fiscal year (1990/91).The proportion of firms in the sample exporting wearing apparel (at 10percent) was significantly below the proportion of these firms in thecountry's total export sector. This was deliberately done as to give someextra weight to other sectors, where there might be potential for exportgrowth. Of the forty firms surveyed, five firms in each year exported nooutput.
" Ideally, a structured random sample should have been selected.However, considering the time constraint, it was decided to focus on aselection of established firms in the metropolitan Colombo area producing afairly representative cross-section of products (primarily, but not wholly,oriented towards exports--some service and construction firms are included forcomparison). These firms tended to be drawn from a group of larger firms.
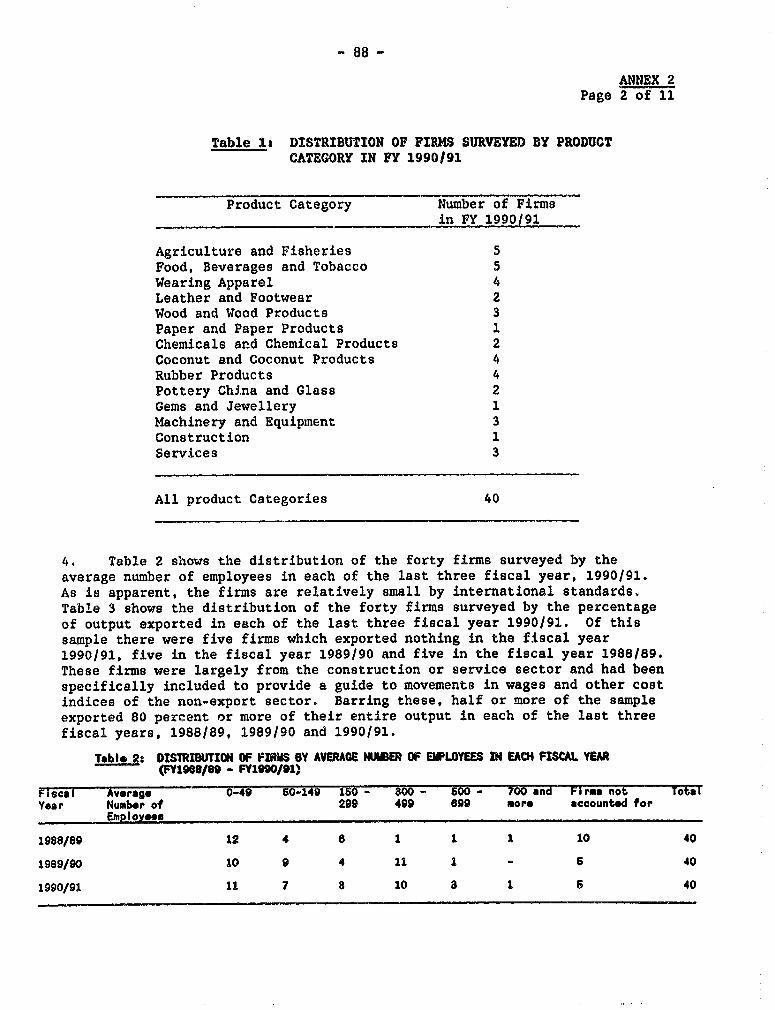
- 88 -
ANNEX 2Page 2 of 11
Table 1: DISTRIBUTION O FI1 MS SURVEYED BY PRODUCTCATEGORY IN FY 1990/91
Product Category Number of Firmsin FY 1990/91
Agriculture and Fisheries 5Food, Beverages and Tobacco 5Wearing Apparel 4Leather and Footwear 2Wood and Wood Products 3Paper and Paper Products 1Chemicals and Chemical Products 2Coconut and Coconut Products 4Rubber Products 4Pottery China and Glass 2Gems and Jewellery 1Machinery and Equipment 3Construction 1Services 3
All product Categories 40
4. Table 2 shows the distribution of the forty firms surveyed by theaverage number of employees in each of the last three fiscal year, 1990/91.As is apparent, the firms are relatively small by international standards.Table 3 shows the distribution of the forty firms surveyed by the percentageof output exported in each of the last three fiscal year 1990/91. Of thissample there were five firms which exported nothing in the fiscal year1990/91, five in the fiscal year 1989/90 and five in the fiscal year 1988/89.These firms were largely from the construction or service sector and had beenspecifically included to provide a guide to movements in wages and other costindices of the non-export sector. Barring these, half or more of the sampleexported 80 percent or more of their entire output in each of the last threefiscal years, 1988/89, 1989/90 and 1990/91.
Table 2: DISThIRIJON OF FIRMS BY AVERAGE N?UMR OF EMPLOYEES IN EACH FISCAL YEAR(FY19089 - FY1090/91)
Fiscal Average 0-49 S0149 160 - S00 - 500 - 700 *nd Fliis not TotalYear Number of 299 499 699 more accountod for
Employeeu
1988/89 12 4 6 1 1 1 10 40
1989/90 10 9 4 11 1 - 5 40
1990/91 11 7 a 10 a 1 6 40
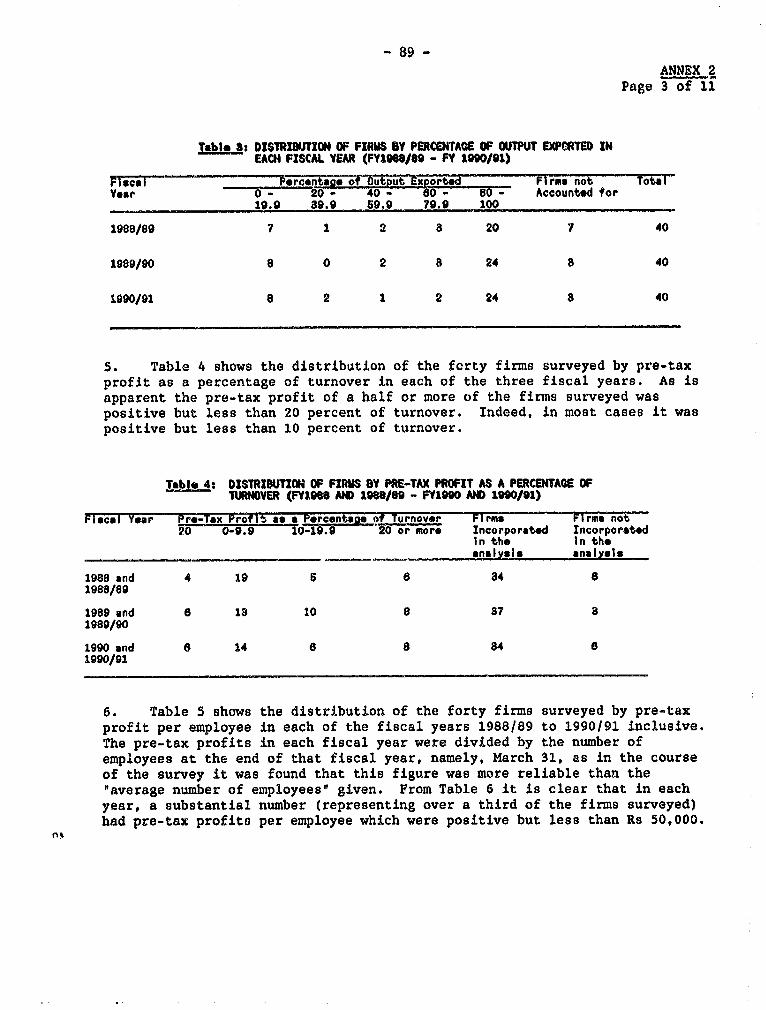
89 -
ANNEX 2Page 3 of 11
Lable l: DISIRITION OF FIM BY PERCENTAGE OF OTPIUT EXPORlTED INEACH FISCAL YEAR (FY190/49 - FY 1990/91)
Fiscal rcentage of OutDut Exported Firms not TotalYear 0- 2- 40- 60_- 8 - Accountd tor
19.9 39.9 69.9 79.9 100
1988/89 7 1 2 a 20 7 40
1989/90 8 0 2 a 24 8 40
1990/91 8 2 1 2 24 a 40
5. Table 4 shows the distribution of the fcrty firms surveyed by pre-taxprofit as a percentage of turnover in each of the three fiscal years. As isapparent the pre-tax profit of a half or more of the firms surveyed waspositive but less than 20 percent of turnover. Indeed, in most cases it waspositive but less than 10 percent of turnover.
Table 4: DISTRIBTON OF FIRMS BY PRE-TAX PROFIT AS A PERCENTAGE OF- RER (FY1968 A) 1988/89 - FY19M ND 1990/91)
Fiscal Year Pro-Tax Prof IS as a Porcentaed of Tu-rnover FPIrms Firma not0 0-9.9 10-19.9 20 or more Incorporat*d Incorporated
In the in the_______ analysis analysis
1988 and 4 19 6 6 34 a1988/89
1989 and 6 1i 10 8 37 a1989/90
1990 and 6 14 6 8 34 61990/91
6. Table 5 shows the distribution of the forty firms surveyed by pre-taxprofit per employee in each of the fiscal years 1988/89 to 1990/91 inclusive.The pre-tax profits in each fiscal year were divided by the number ofemployees at the end of that fiscal year, namely, March 31, as in the courseof the survey it was found that this figure was more reliable than the"average number of employees" given. From Table 6 it is clear that in eachyear, a substantial number (representing over a third of the firms surveyed)had pre-tax profits per employee which were positive but less than Rs 50,000.
A8
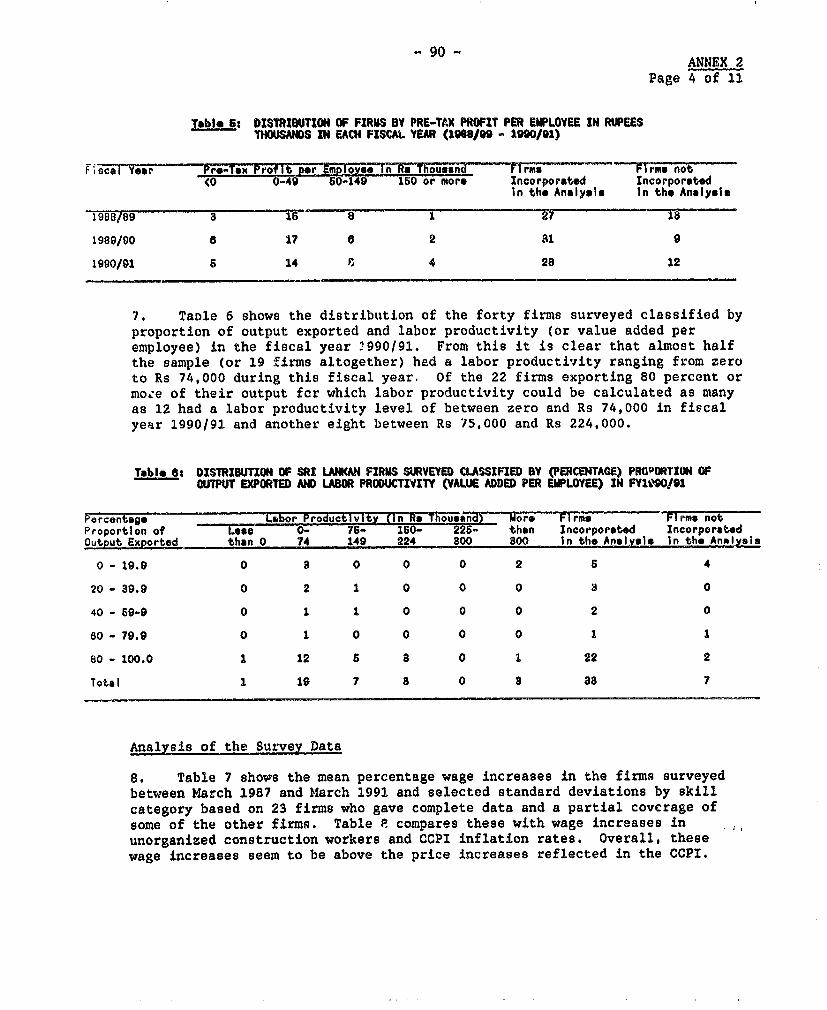
90 -ANNEX 2
Page 4 of 11
Table 6: DISTRIBUTION OF FIRMS BY PRE-Tt.X PROFIT PER EMPLOYEE IN RUPEES-THSANDS IN EACH FISCAL YEAR (198/9 - 1990/91)
F 66i Te-x r e ysen n g ourm Flrma not.(0 0-49 60 160 or more Incorporated Incorporatod
In the Analysis In the Analysis
1989/90 8 17 e 2 9
1990/91 6 14 C 4 28 12
7. TaDle 6 shows the distribution of the forty firms surveyed classified byproportion of output exported and labor productivity (or value added peremployee) in the fiscal year t990/91. From this it is clear that almost halfthe sample (or 19 firms altogether) had a labor productivity ranging from zeroto Rs 74,000 during this fiscal year. Of the 22 firms exporting 80 percent ormoze of their output fcr which labor productivity could be calculated as manyas 12 had a labor productivity level of between zero and Rs 74,000 in fiscalyear 1990/91 and another eight between Rs 75,000 and Rs 224,000.
Table St DISTRIBUTION OF SRI LANtAN FIRMS SURVEYED CLASSIFIED BY (PERCENTAGE) PROPORTION OFWTPUT EXPORTED AND LASR PROUCTIVITY (VALUE ADED PER EIFLOYEE) IN FY190/91
=~~~~~~~~~ao Prdctvt = nRe ME rms ) b f ir-mo Sli-oPercentage T rrou v neouan More rinProportion of L0- 75- 150- 225- than Incorporated IncorporstedOutput Exported than 0 74 149 224 Bo0 B00 In the Analysis In tho Analysis
0- 19.9 0 8 0 0 0 2 5 4
20- 9.9 0 2 1 0 0 0 a 0
40- 69-9 0 1 1 0 0 0 2 0
0- 79.9 0 1 0 0 0 0 1 1
80- 100.0 1 12 5 a 0 1 22 2
Total 1 19 7 8 0 a as 7
Analysis of the Survey Data
8. Table 7 shows the mean percentage wage increases in the firms surveyedbetween March 1987 and March 1991 and selected standard deviations by skillcategory based on 23 firms who gave complete data and a partial coverage ofsome of the other firms. Table P compares these with wage increases inunorganized construction workers and CCPI inflation rates. Overall, thesewage increases seem to be above the price increases reflected in the CCPI.
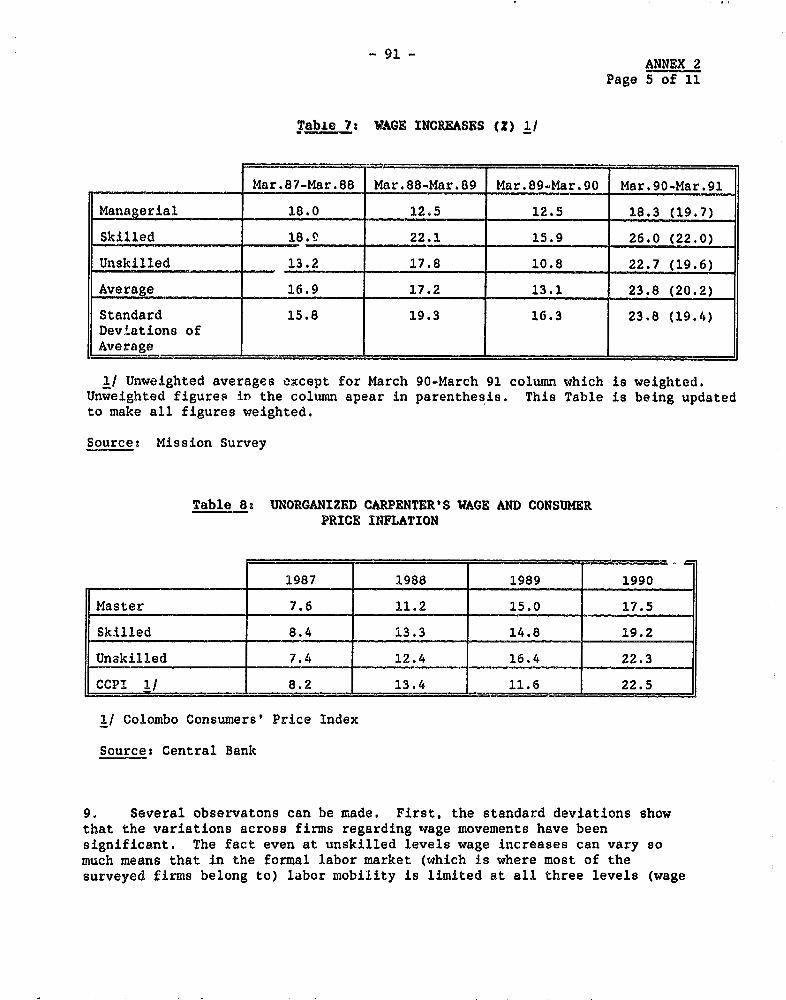
- 91 - ANNEX 2
Page 5 of 11
Table 7: WAGE INCREASES (Z) 1,
Mar.87-Mar.88 Mar.88-Mar.89 Mar.89-Mar.90 Mar.90-Mar.91
Managerial 18.0 12.5 12.5 18.3 (19.7)
Skilled 18.e 22.1 15.9 26.0 (22.0)
Unskilled __, 13.2 17.8 10.8 22.7 (19.6)
Average 16.9 17.2 13.1 23.8 (20.2)
Standard 15.8 19.3 16.3 23.8 (19.4)Deviations ofAverage I_I_I_I_I
1/ Unweighted averages except for March 90-March 91 column which is weighted.Unweighted figures 1i the column apear in parenthesis. This Table is being updatedto make all figures weighted.
Source: Mission Survey
Table 8: UNORGANIZED CARPENTER'S WAGE AND CONSUMERPRICE INFLATION
1987 1988 1989 1990
LMaster 7.6 11.2 15.0 17.5
Skilled 8.4 13.3 14.8 19.2
Unakilled 7.4 12.4 16.4 22.3
CCPI 1/ 8.2 13.4 11.6 22.5
1/ Colombo Consumers' Price Index
Sources Central Bank
9. Several observatons can be made. First, the standard deviations showthat the variations across firms regarding wage movements have beensignificant. The fact even at unskilled levels wage increases can vary somuch means that in the formal labor market (which is where most of thesurveyed firms belong to) labor mobility is limited at all three levels (wage
- 92 -
ANNEX 2Page 6 of 11
differentials across firms are not reduced by labor moving betwwen firms).The second observation is that in each year skilled workers tend to havehighest wage increase implying that problems of labor shortage or mobility maybe more serious at this level than the other two.
10. Third, the formal market wage moved up much faster than the informalmarket wages (Table 8) in 1987 and 1988, but in 1989 and 1990 the wages in twomarkets are comparable. The first impression is that in the years when theeconomy was growing slowly, informal sector wages barely kept up with theinflation. But formal sector employers are always competing with foreignemployers (many workers left the country in the sicond half of the 1980s to beemployed abroad including the Middle East, Australia and South-East Asia),and, therefore, could not afford to lower their wages too much relative toattractiveness of working abroad. These wage raises are for preventing themfrom leaving as there was probably costs (company-specific skill) associatedwith losing even unskilled workers. Informal sector workers also left thecountry; but their wages are dependent on pure market forcesV__with veryslow growth the wage increases were slow in 1987 and 1988 but as the economystarted to pick up from the second half of 1989 (and as many constructionworkers had already left the country causing labor supply to be on theshortage side) their wages started to increase rapidly.
11. Table 9 shows the mean percentage wage increases between March 31, 1990and March 31, 1991 in the Sri Lankan firms surveyed by skill category andproduct category. The most notable features of this table are, first, therelatively high wage increases across all skill categories in the agricultureand fisheries sector. These increases were fairly evenly spread out acrossthe firms. Second, there were very marked increases, especially in themanageriel and skilled categories, of the pottery, china and glass subsector.In this case, however, the increase was due to one firm which introduced aspecial incentive scheme in 1990.
2) There is an interesting point here that all unorganized sector workerwages move very closely with the Colombo Consumer Price Index. An inquiryinto the mechanism of wage determination may be worthwhile.
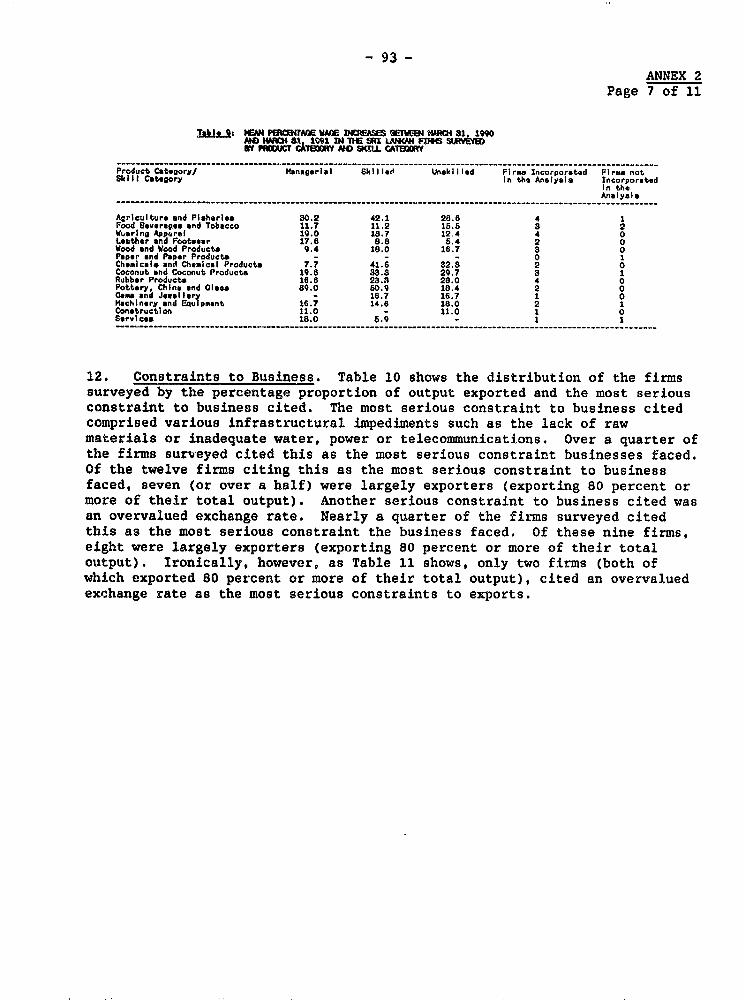
- 93 -
ANNEX 2Page 7 of 11
IbJks-i: lAN PIC9IA WWE IKrGASM BETWE eNsK% 81 1990AND MAR0l &l 1099 IN TME SUt LNW FIR4 WWbEIby PFUCT CtSW NO OULL CA1I1WR
Product Cat -gory- - - anag-rial Skilla- Unstkilled Firm- s Inorporated Firma noSkill Category In the Analyais Incorporated
In theAn.lysis
Agriculture and Fisheries 80.2 42.1 28.6 4 1Food Bvervages and Tobacco 11.7 11.2 16.8 a 2Wvaring Appc rel 19.0 18.7 12.4 4 0Leather and Footwear 17.6 8.8 5.4 2 0Wood and Wood Products 9.4 18.0 16.7 8 0Paper and Pnper Products - - - 0 1Ch acale, and Chsaical Products 7.7 41.6 32.3 2 0Coconut and Coconut Products 19.6 33.8 29.7 3 1Rubber Products 16.6 23.8 28.0 4 0Pottery, China and Closs 80.0 60.9 18.4 2 0ae s *nd Jwellery - 16.7 16.7 1 0Machinnry and Egupepent 16.7 14.6 18.0 2 1Construction 11.0 - 11.0 1 0Services 18.0 6.9 - 1 I
12. Constraints to Business. Table 10 shows the distribution of the firmssurveyed by the percentage proportion of output exported and the most seriousconstraint to business cited. The most serious constraint to business citedcomprised various infrastructural impediments such as the lack of rawmaterials or inadequate water, power or telecommunications. Over a quarter ofthe firms surveyed cited this as the most serious constraint businesses faced.Of the twelve firms citing this as the most serious constraint to businessfaced, seven (or over a half) were largely exporters (exporting 80 percent ormore of their total output). Another serious constraint to business cited wasan overvalued exchange rate. Nearly a quarter of the firms surveyed citedthis as the most serious constraint the business faced. Of these nine firms,eight were largely exporters (exporting 80 percent or more of their totaloutput). Ironically, however, as Table 11 shows, only two firms (both ofwhich exported 80 percent or more of their total output), cited an overvaluedexchange rate as the most serious constraints to exports.
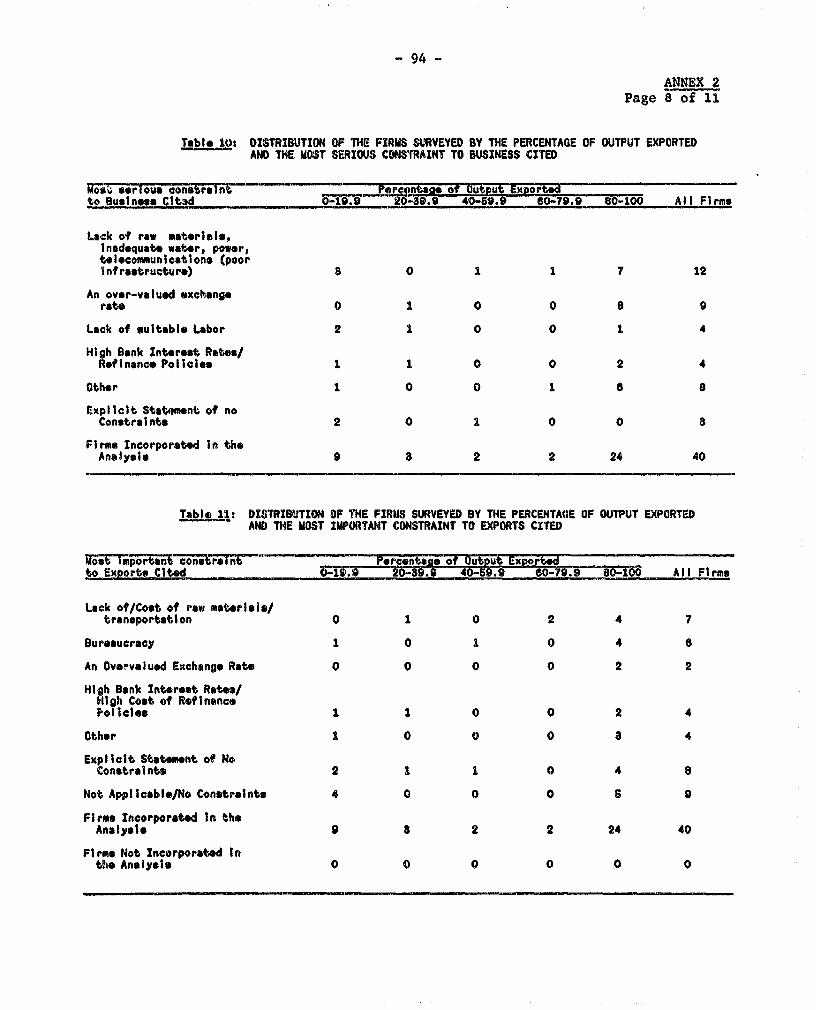
94 -
ANNEX 2Page 8 of 11
Table 10: DISTRIBUTION OF THE FIRMS SURVEYED BY THE PERCENTAGE OF OUTPUT EXPORTEDAND THE MOST SERIOUS CONSTRAINT TO BUSINESS CITED
s~ F sorovau~stritPretg fOt Exportelo Business CIt.3d -1. iS.9 40-59.9 50-79.9 80W-100 All Firms
Lack of raw materiels,lnadoquate water, power,telocommunicati one tpoorInfrastructure) 8 0 1 1 7 12
An ovor-valuod exchangerate 0 1 0 0 8 9
Lack of suitable Labor 2 1 0 0 1 4
High Bank Intorest Rates/Refinance Policies 1 1 0 0 2 4
Other 1 0 0 1 6 8
Explicit Statemnt of noConstraints 2 0 1 0 0 8
Firms Incorporated In theAnalysis 9 3 2 2 24 40
Table 11: DISTRIBUTION OF THE FIRMS SURVEYED BY THE PERCENTAGE OF OUTPUT EXPORTEDAND THE MOST IMPORTANT CONSTRAINT TO EXPORTS CITED
goat important conPercentaog of OutRut Ex2ortoExports Cited 0-019. 20-39.9 40-59.9 60-79.9 8-0--100 All Firms
Lack of/Cost of raw materla ./transportation 0 1 0 2 4 7
Bureaucracy 1 0 1 0 4 a
An Oveovalued Exchange Rate 0 0 0 0 2 2
High Bank Interest Rates/High Cost of Refinancelol1cles I 1 0 0 2 4
Othor 1 0 0 0 a 4
Explicit Statment of NoConstraints 2 1 1 0 4 8
Not Applicable/No Constraints 4 0 0 0 6 9
Firms Incorporated In theAnalysis 9 8 2 2 24 40
Firms Not Incorporated Inthe Analysis 0 0 0 0 0 0
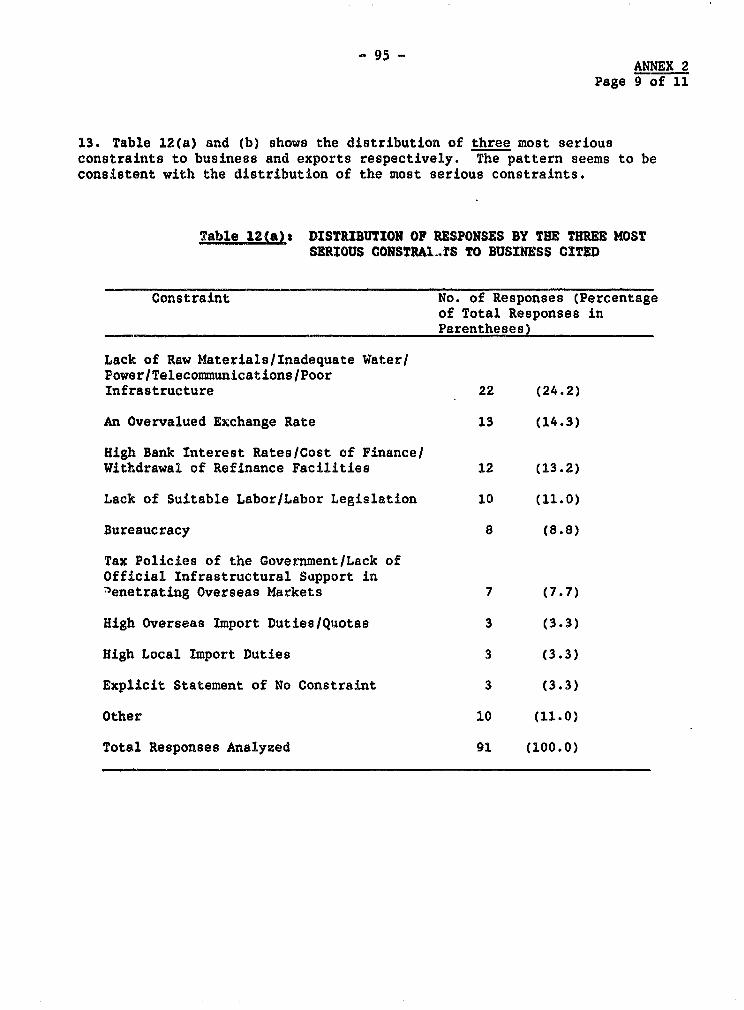
- 95-ANNEX 2
Page 9 of 11
13. Table 12(a) and (b) shows the distribution of three most seriousconstraints to business and exports respectively. The pattern seems to beconsistent with the distribution of the most serious constraints.
!Table12(at DISTRIBUTION OF RESPONSES BY THE THREE MOSTSERIOUS CONSTRAI.TS TO BUSINESS CITED
Constraint No. of Responses (Percentageof Total Responses inParentheses)
Lack of Raw Materials/Inadequate Water/Power/Telecommunications/PoorInfrastructure 22 (24.2)
An Overvalued Exchange Rate 13 (14.3)
High Bank Interest Rates/Cost of Finance/Withdrawal of Refinance Facilities 12 (13.2)
Lack of Suitable Labor/Labor Legislation 10 (11.0)
Bureaucracy 8 (8.8)
Tax Policies of the Government/Lack ofOfficial Infrastructural Support in'enetrating Overseas Markets 7 (7.7)
High Overseas Import Duties/Quotas 3 (3.3)
High Local Import Duties 3 (3.3)
Explicit Statement of No Constraint 3 (3.3)
Other 10 (11-0)
Total Responses Analyzed 91 (100.0)
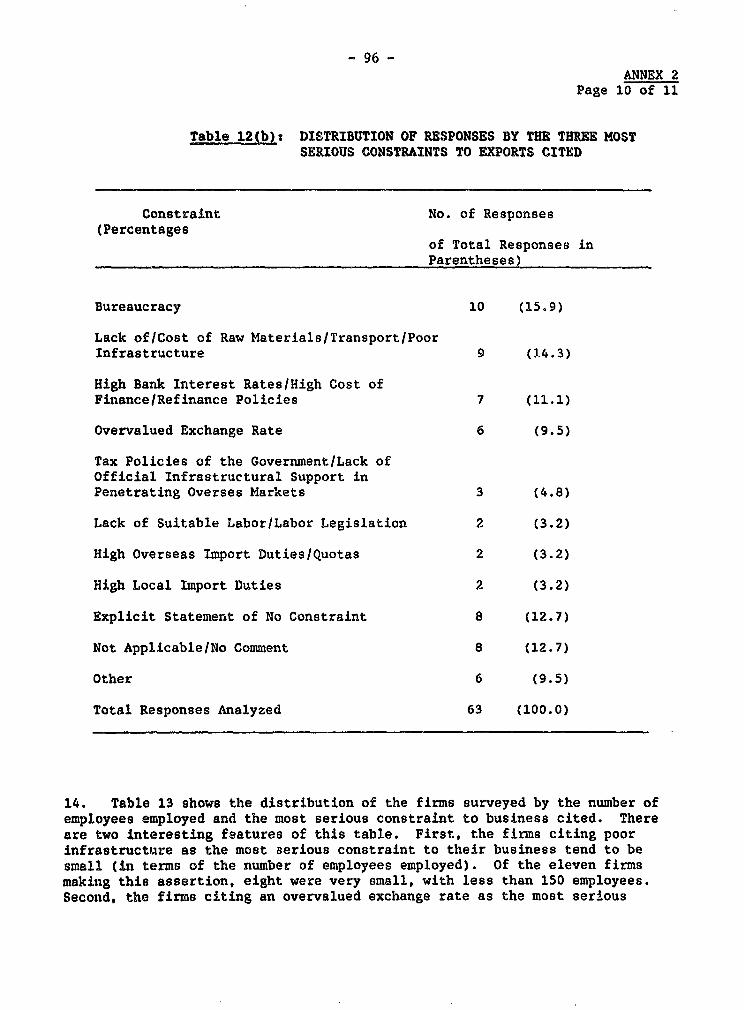
- 96 -ANNEX 2
Page 10 of 11
Table ILb_t) DISTRIBUTION OF RESPONSES BY THE THREE MOSTSERIOUS CONSTRAINTS TO EXPORTS CITED
Constraint No. of Responses(Percentages
of Total Responses inParentheses)
Bureaucracy 10 (15.9)
Lack of/Cost of Raw Materials/Transport/PoorInfrastructure 9 (3.4.3)
High Bank Interest Rates/High Cost ofFinance/Refinance Policies 7 (11.1)
Overvalued Exchange Rate 6 (9.5)
Tax Policies of the Government/Lack ofOfficial Infrastructural Support inPenetrating Overses Markets 3 (4.8)
Lack of Suitable Labor/Labor Legislation 2 (3.2)
High Overseas Import Duties/Quotas 2 (3.2)
High Local Import Duties 2 (3.2)
Explicit Statement of No Constraint 8 (12.7)
Not Applicable/No Comment 8 (12.7)
Other 6 (9.5)
Total Responses Analyzed 63 (100.0)
14. Table 13 shows the distribution of the firms surveyed by the number ofemployees employed and the most serious constraint to business cited. Thereare two interesting features of this table. First, the firms citing poorinfrastructure as the most serious constraint to their business tend to besmall (in terms of the number of employees employed). Of the eleven firmsmakinig this assertion, eight were very small, with less than 150 employees.Second, the firms citing an overvalued exchange rate as the most serious
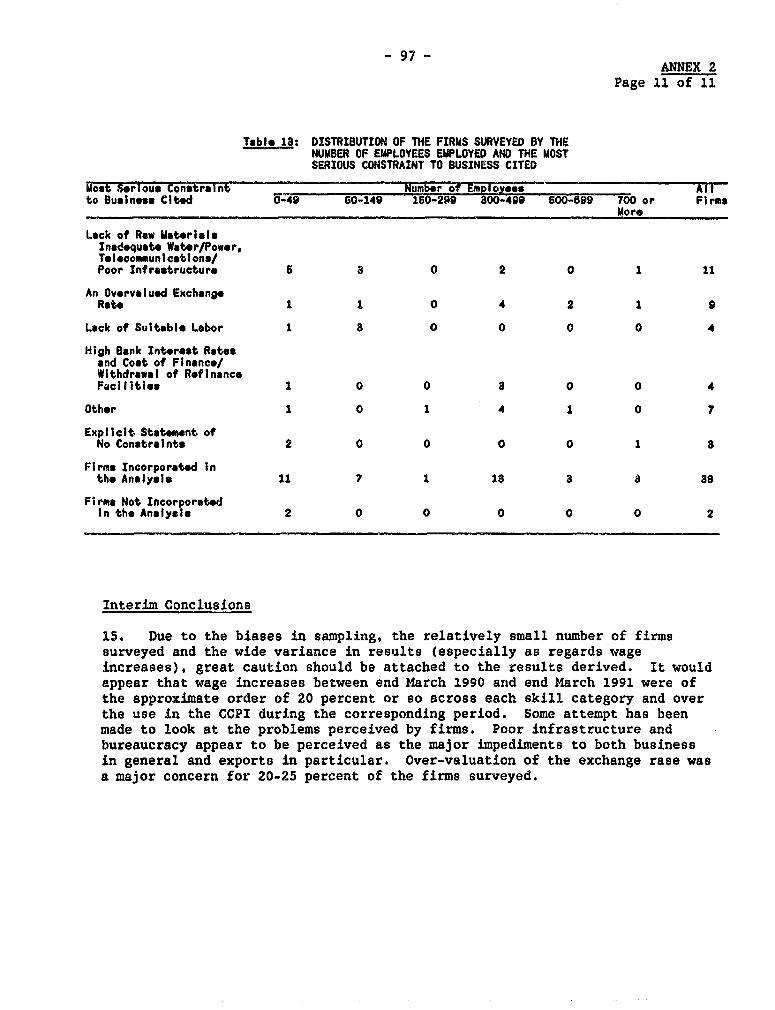
- 97 -ANNEX 2
Page 11 of 11
Table 13: DISTRIBUTION OF THE FIRMS SURVEYED BY THENUMBER OF EMPLOYEES EMPLOYED AND THE MOSTSERIOUS CONSTRAINT TO BUSINESS CITED
Most S rious Constraint Numbe- -- E-ployes. _ Allto Business Cited 0-49 60-149 150-2P9 800-499 600-689 700 or Firms
More
Lack of Raw MaterialsInndequate Water/Power,Telecommunications/Poor Infrastructure 6 a 0 2 0 1 11
An Overvalued ExchangeRate 1 1 0 4 2 1 9
Lack of Suitable Labor 1 a 0 0 0 0 4
High Bank Interest Rntesand Cost of Flnance/Withdrawal of RefinanceFacilities 1 0 0 a 0 0 4
Other 1 0 1 4 1 0 7
Explielt Statement ofNo Constraints 2 0 0 0 0 1 8
Firms Incorporated inthe Analysis 11 7 1 18 3 a 88
Firms Not Incorporatedin tho Analysis 2 0 0 0 0 0 2
Interim Conclusions
15. Due to the biases in sampling, the relatively small number of firmssurveyed and the wide variance in results (especially as regards wageincreases), great caution should be attached to the results derived. It wouldappear that wage increases between end March 1990 and end March 1991 were ofthe approximate order of 20 percent or so across each skill category and overthe use in the CCPI during the corresponding period. Some attempt has beenmade to look at the problems perceived by firms. Poor infrastructure andbureaucracy appear to be perceived as the major impediments to both businessin general and exports in particular. Over-valuation of the exchange rase wasa major concern for 20-25 percent of the firms surveyed.
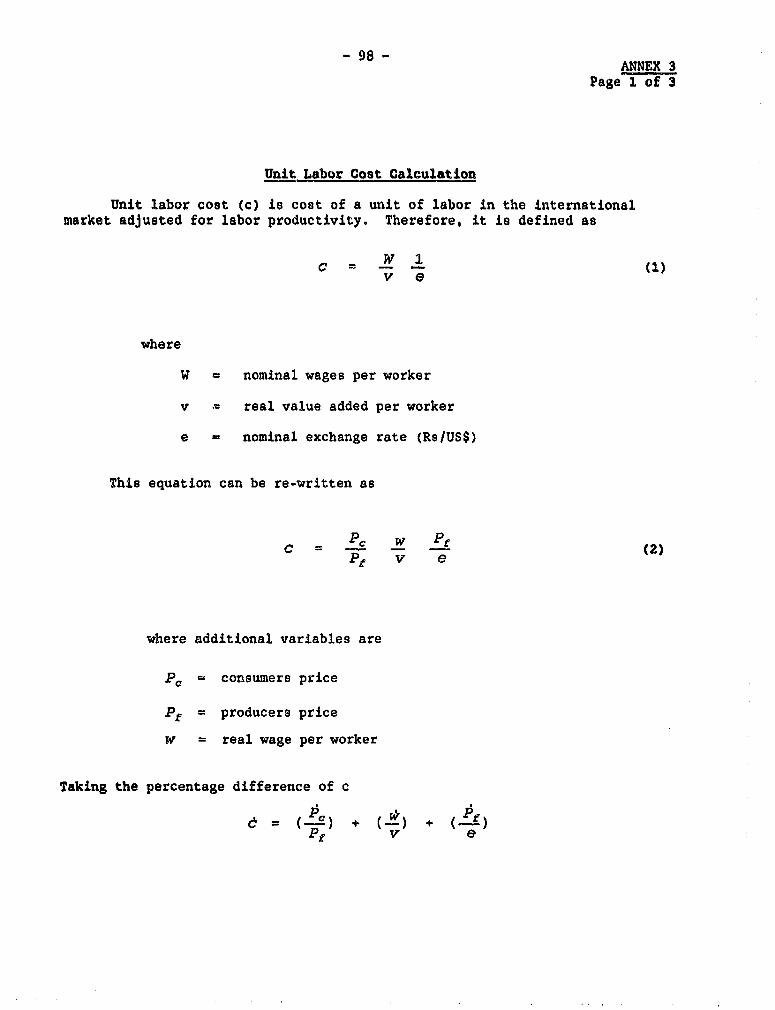
- 98 -ANNEX 3
Page 1 of 3
Unit Labor Cost Calculation
Unit labor cost (c) is cost of a unit of labor in the internationalmarket adjusted for labor productivity. Therefore, it is defined as
C = w I (1)v e
where
W = nominal wages per worker
v * real value added per worker
e = nominal exchange rate (Rs/US$)
This equation can be re-written as
C PC W Pt (2)pf v e
where additional variables are
Pc = consumers price
Pt = producers price
w = real wage per worker
Taking the percentage difference of c
=+ (-) + (.f)Pf v e
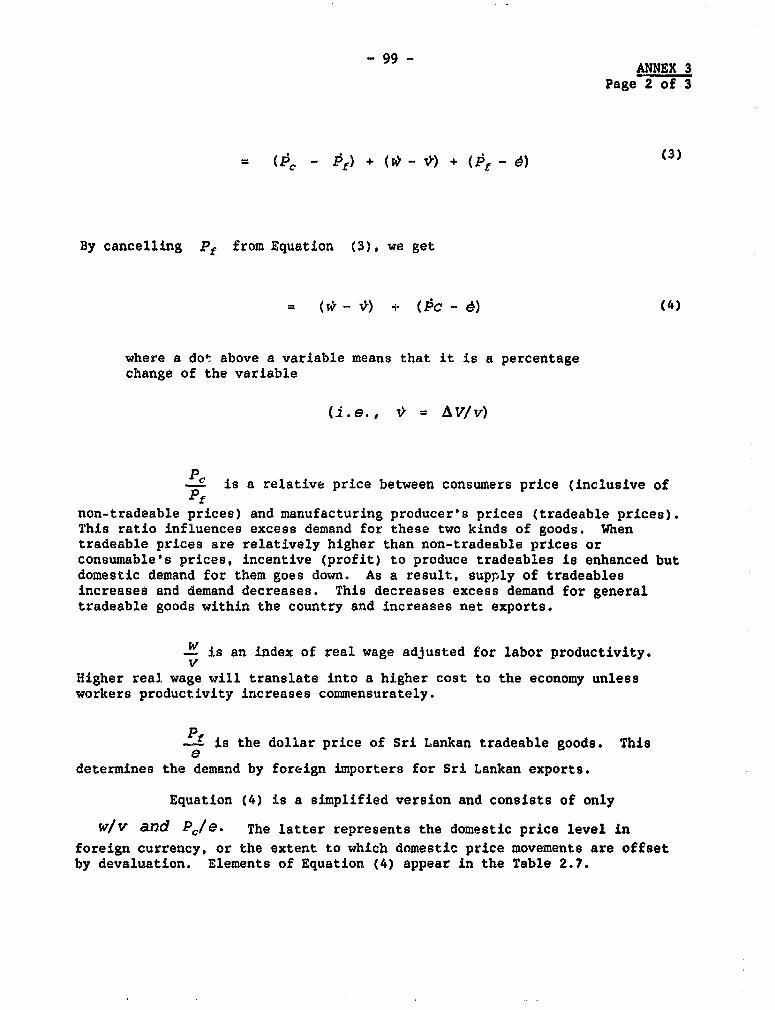
- 99 ANNEX 3Page 2 of 3
=- (c - Pf) + ( - 0) + ( 3.- e) (3)
By cancelling Pf from Equation (3), we get
= (k -P) + (13c- ) (4)
where a dot above a variable means that it is a percentagechange of the variable
(i.e., P = AV/v)
-; is a relative price between consumers price (inclusive ofPf
non-tradeable prices) and manufacturing producer's prices (tradeable prices).This ratio influences excess demand for these two kinds of goods. Whentradeable prices are relatively higher than non-tradeable prices orconsumable's prices, incentive (profit) to produce tradeables is enhanced butdomestic demand for them goes down. As a result, supply of tradeablesincreases and demand decreases. This decreases excess demand for generaltradeable goods within the country and increases net exports.
-w is an index of real wage adjusted for labor productivity.v
Higher real wage will translate into a higher cost to the economy unlessworkers productivity increases commensurately.
-f is the dollar price of Sri Lankan tradeable goods. Thise
determines the demand by foreign importers for Sri Lankan exports.
Equation (4) is a simplified version and consists of only
w/v and PI/e. The latter represents the domestic price level in
foreign currency, or the extent to which domestic price movements are offsetby devaluation. Elements of Equation (4) appear in the Table 2.7.
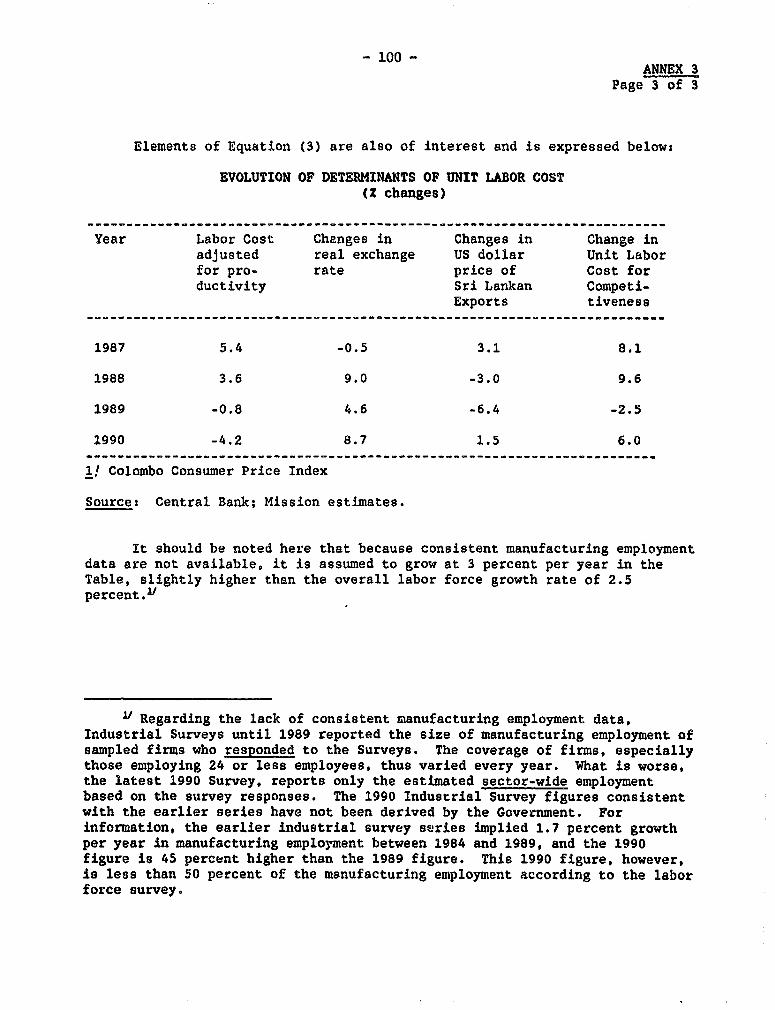
- 100 -
ANNEX 3Page 3 of 3
Elements of Equation (3) are also of interest and is expressed below:
EVOLUTION OF DETERMINANTS OF UNIT LABOR COST(Z changes)
Year Labor Cost Changes in Changes in Change inadjusted real exchange US dollar Unit Laborfor pro- rate price of Cost forductivity Sri Lankan Competi-
Exports tiveness
1987 5.4 -0.5 3.1 8.1
1988 3.6 9.0 -3.0 9.6
1989 -0.8 4.6 -6.4 -2.5
1990 -4.2 8.7 1.5 6.0--------------------------------------------------------------------- __--
1! Colombo Consumer Price Index
Source: Central Bank; Mission estimates.
It should be noted here that because consistent manufacturing employmentdata are not available, it is assumed to grow at 3 percent per year in theTable, slightly higher than the overall labor force growth rate of 2.5percent.v
U Regarding the lack of consistent manufacturing employment data,Industrial Surveys until 1989 reported the size of manufacturing employment ofsampled firms who responded to the Surveys. The coverage of firms, especiallythose employing 24 or less employees, thus varied every year. What is worse,the latest 1990 Survey, reports only the estimated sector-wide employmentbased on the survey responses. The 1990 Industrial Survey figures consistentwith the earlier series have not been derived by the Government. Forinformation, the earlier industrial survey series implied 1.7 percent growthper year in manufacturing employment between 1984 and 1989, and the 1990figure is 45 percent higher than the 1989 figure. This 1990 figure, however,is less than 50 percent of the manufacturing employment according to the laborforce survey.
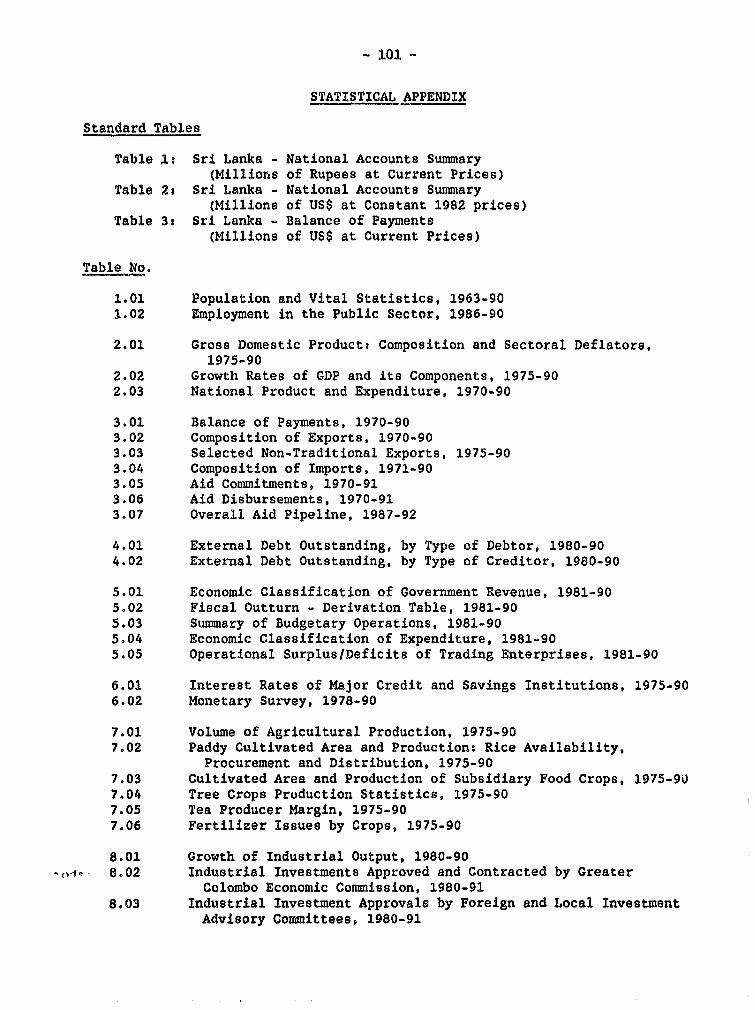
- 101 -
STATISTICAL APPENDIX
Standard Tables
Table 1: Sri Lanka - National Accounts Summary(Millions of Rupees at Current Prices)
Table 2: Sri Lanka - National Accounts Summary(Millions of US$ at Constant 1982 prices)
Table 3: Sri Lanka - Balance of Payments(Millions of US$ at Current Prices)
Table No.
1.01 Population and Vital Statistics, 1963-901.02 Employment in the Public Sector, 1986-90
2.01 Gross Domestic Product: Composition and Sectoral Deflators,1975-90
2.02 Growth Rates of GDP and its Components, 1975-902.03 National Product and Expenditure, 1970-90
3.01 Balance of Payments, 1970-903.02 Composition of Exports, 1970-903.03 Selected Non-Traditional Exports, 1975-903.04 Composition of Imports, 1971-903.05 Aid Commitments, 1970-913.06 Aid Disbursements, 1970-913.07 Overall Aid Pipeline, 1987-92
4.01 External Debt Outstanding, by Type of Debtor, 1980-904.02 External Debt Outstanding, by Type of Creditor, 1980-90
5.01 Economic Classification of Government Revenue, 1981-905.02 Fiscal Outturn - Derivation Table, 1981-905.03 Summary of Budgetary Operations, 1981-905.04 Economic Classification of Expenditure, 1981-905.05 Operational Surplus/Deficits of Trading Enterprises, 1981-90
6.01 Interest Rates of Major Credit and Savings Institutions, 1975-906.02 Monetary Survey, 1978-90
7.01 Volume of Agricultural Production, 1975-907.02 Paddy Cultivated Area and Production: Rice Availability,
Procurement and Distribution, 1975-907.03 Cultivated Area and Production of Subsidiary Food Crops, 1975-907.04 Tree Crops Production Statistics, 1975-907.05 Tea Producer Margin, 1975-907.06 Fertilizer Issues by Crops, 1975-90
8.01 Growth of Industrial Output, 1980-90-o-le. 8.02 Industrial Investments Approved and Contracted by Greater
Colombo Economic Commission, 1980-918.03 Industrial Investment Approvals by Foreign and Local Investment
Advisory Committees, 1980-91
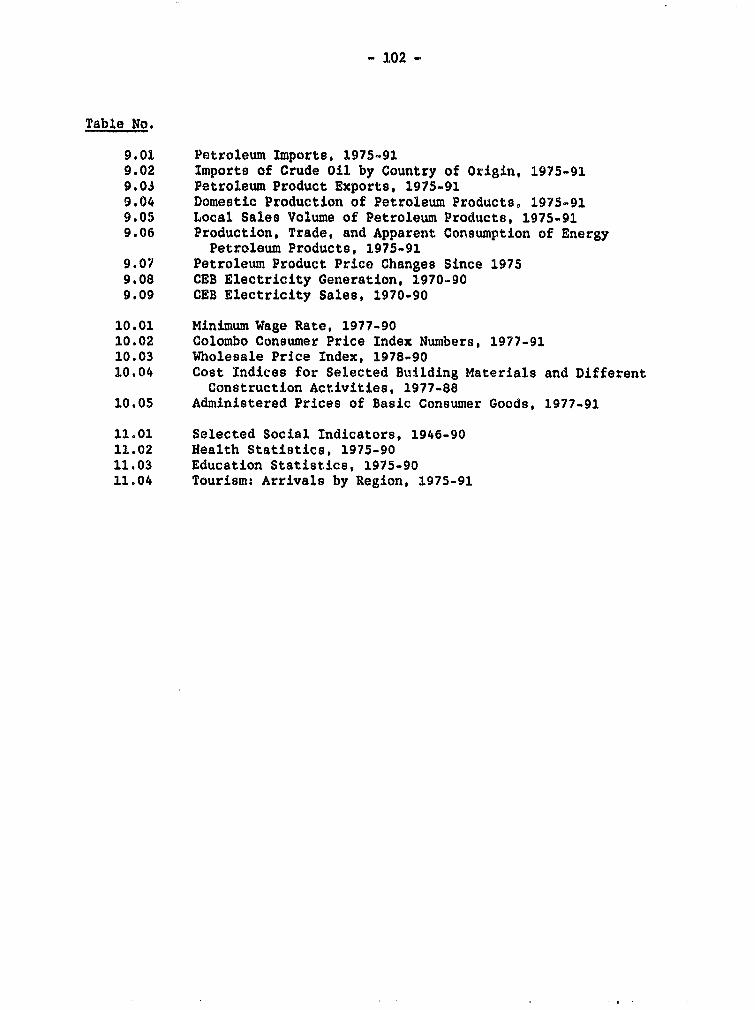
- 102 -
Table No.
9.01 Petroleum Imports, 1975-919.02 Imports of Crude Oil by Country of Origin, 1975-919.03 Petroleum Product Exports, 1975-919.04 Domestic Production of Petroleum Products, 1975-919.05 Local Sales Volume of Petroleum Products, 1975-919.06 Production, Trade, and Apparent Consumption of Energy
Petroleum Products, 1975-919.07 Petroleum Product Price Changes Since 19759.08 CEB Electricity Generation, 1970-909.09 CEB Electricity Sales, 1970-90
10.01 Minimum Wage Rate, 1977-9010.02 Colombo Consumer Price Index Numbers, 1977-9110.03 Wholesale Price Index, 1978-9010.04 Cost Indices for Selected Building Materials and Different
Construction Activities, 1977-8810.05 Administered Prices of Basic Consumer Goods, 1977-91
11.01 Selected Social Indicators, 1946-9011.02 Health Statistics, 1975-9011.03 Education Statistics, 1975-9011.04 Tourism: Arrivals by Region, 1975-91
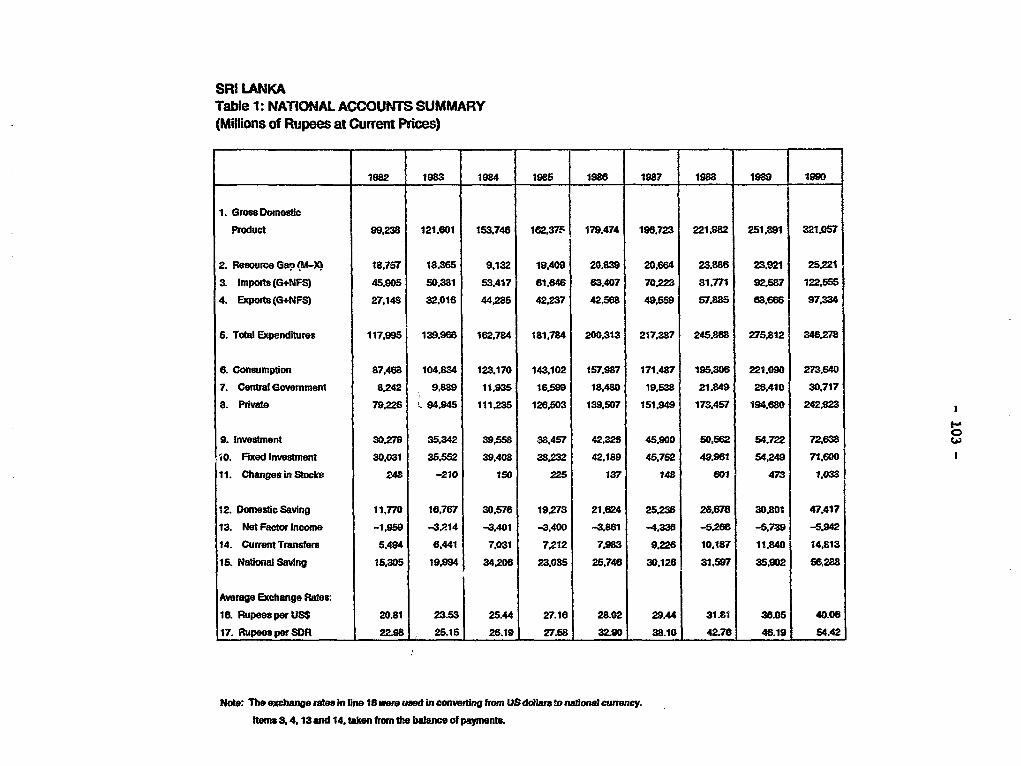
SRI LANKATable 1: NATIONAL ACCOUNTS SUMMARY(Millions of Rupees at Current Prices)
1982 1983 1984 1985 1986 1987 1988 1989 1990
1. Grow Domestc
Product 99.238 121.601 153.746 102,375r 179.474 196,723 221.982 251,891 321.057
2. Resource Gao (M-7Q 18,757 18.365 9.132 19.409 20.839 20.664 23,886 23.921 25.2213. lmponts(G+NFS) 45,905 50.381 53.417 61.645 83.407 70223 81.771 92587 122.5554. Export (G+NFS) 27.148 32.016 44.285 42.237 42,568 49,559 57,885 68.686 97,334
S. Toda Expenditures 117,995 139.96B 162.784 181.7s4 200,313 217.S87 245.,ss 275.812 346,278
6. Consumption 87.468 104.834 123.170 143.102 157987 171.487 195s306 221.090 273.6407. Central Govemment 8,242 9,889 11,935 16.599 18,480 19.538 21.849 26.410 30.7178. Private 79,226 I 9495 11123 126,503 139.507 151.94 173.457 194.680 242,923
9. Investment 30.279 35.342 39,558 38.457 42,326 45.900 50.562 54,722 72.638 o10. Fixed Investment 30.031 35,552 39,408 38232 42.189 45.762 49.961 54.249 71.60011. Changes in Stocke 248 -210 150 225 137 14S 601 473 1.033
12. DomesUc Saving 11.770 16.767 30,76 19273 21.624 25,236 26.676 30.801 47.41713. Net Factor Income -1.959 -3.214 -3.401 -3.400 3.861 -4.336 -5.2e6 -5.739 -5.4214. Current Translers 5.494 6.441 7.031 7.212 7,983 9226 10.17 11,840 14.81315. National Saving 15.305 19.994 34,206 23.085 25.746 30.128 31.597 35.902 56,288
Average Exchange Rates:16. Rupees per USS 20.81 23.53 25.44 27.16 28.02 29.44 31.81 36.05 40.0617. Rupees per SDR 228 2 26.19 27.58 32.90 38.10 42.76 46.19 54.42
Note: The exchange rates in line 1Bwere sed in convertinr fom US dolars to national cunency.ftems 3.4.13 and 14. tiken from fte balance of payments.
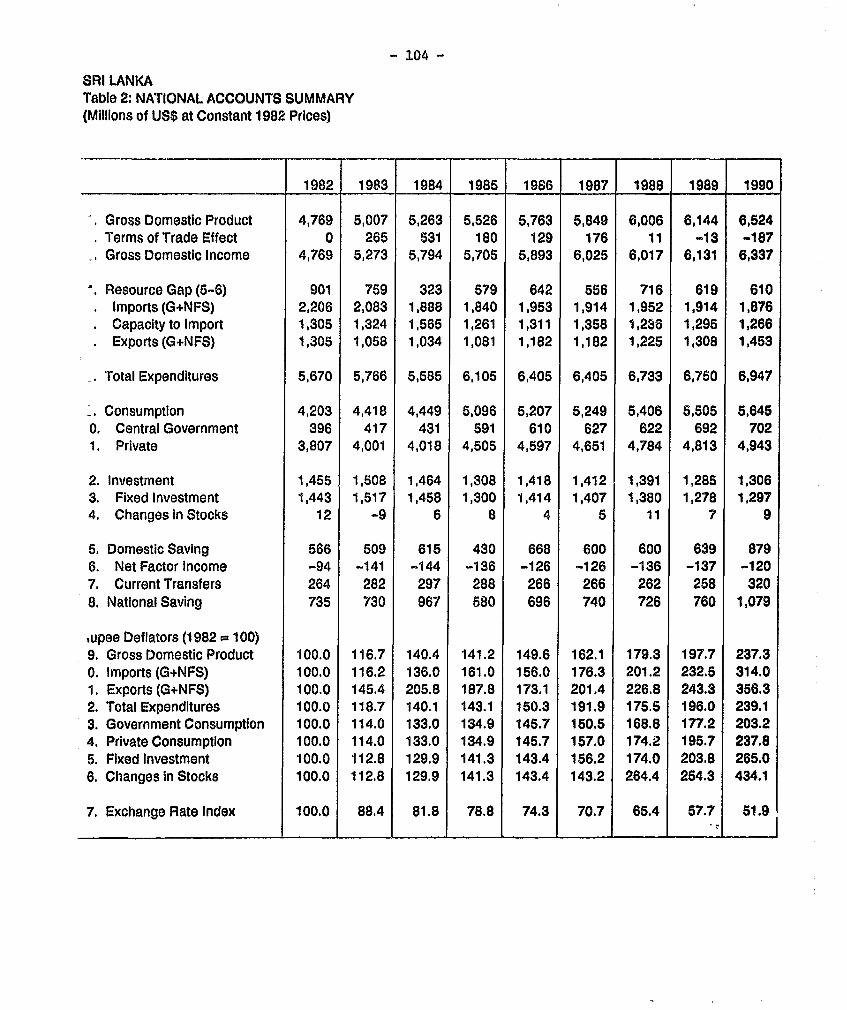
- 104 -
SRI LANKATable 2: NATIONAL ACCOUNTS SUMMARY(Millions of US$ at Constant 1982 Prices)
1982 1983 1984 1985 1986 1987 1988 1989 1990
Gross Domestic Product 4,769 5,007 5,263 5,526 5,763 5,849 6,006 6,144 6,524. Terms of Trade Effect 0 265 531 180 129 176 11 -13 -187, Gross Domestic Income 4,769 5,273 5,794 5,705 5,893 6,025 6,017 6,131 6,337
. Resource Gap (5-6) 901 759 323 579 642 556 716 619 610Imports (G+NFS) 2,206 2,083 1,888 1,840 1,953 1,914 1,952 1,914 1,876Capacity to Import 1,305 1,324 1,565 1,261 1,311 1,358 1,236 1,295 1,266Exports (G+NFS) 1,305 1,058 1,034 1,081 1,182 1,182 1,225 1,308 1,453
X, Total Expenditures 5,670 5,766 5,585 6,105 6,405 6,405 6,733 6,750 6,947
. Consumption 4,203 4,418 4,449 5,096 5,207 5,249 5,406 5,505 5,6450. Central Government 396 417 431 591 610 627 622 692 7021. Private 3,807 4,001 4,018 4,505 4,597 4,651 4,784 4,813 4,943
2. Investment 1,455 1,508 1,464 1,308 1,418 1,412 1,391 1,285 1,3063. Fixed Investment 1,443 1,517 1,458 1,300 1,414 1,407 1,380 1,278 1,2974. Changes in Stocks 12 -9 6 8 4 5 11 7 9
5. Domestic Saving 566 509 615 430 668 600 600 639 8796. Net Factor Income -94 -141 -144 -136 -126 -126 -136 -137 -1207. Current Transfers 264 282 297 288 266 266 262 258 3208. National Saving 735 730 967 580 696 740 726 760 1,079
.upee Deflators (1982 = 100)9. Gross Domestic Product 100.0 116.7 140.4 141.2 149.6 162.1 179.3 197.7 237.30. Imports (G+NFS) 100.0 116.2 136.0 161.0 156.0 176.3 201.2 232.5 314.01. Exports (G+NFS) 100.0 145.4 205.8 187.8 173.1 201.4 226.8 243.3 356.32. Total Expenditures 100.0 118.7 140.1 143.1 150.3 191.9 175.5 196.0 239.13. Government Consumption 100.0 114.0 133.0 134.9 145.7 150.5 168.8 177.2 203.24. Private Consumption 100.0 114.0 133.0 134.9 145.7 157.0 174.2 195.7 237.85. Fixed Investment 100.0 112.8 129.9 141.3 143.4 156.2 174.0 203.8 265.06. Changes in Stocks 100.0 112.8 129.9 141.3 143.4 143.2 264.4 254.3 434.1
7. Exchange Rate Index 100.0 88.4 81.8 78.8 74.3 70.7 65.4 57.7 51.9
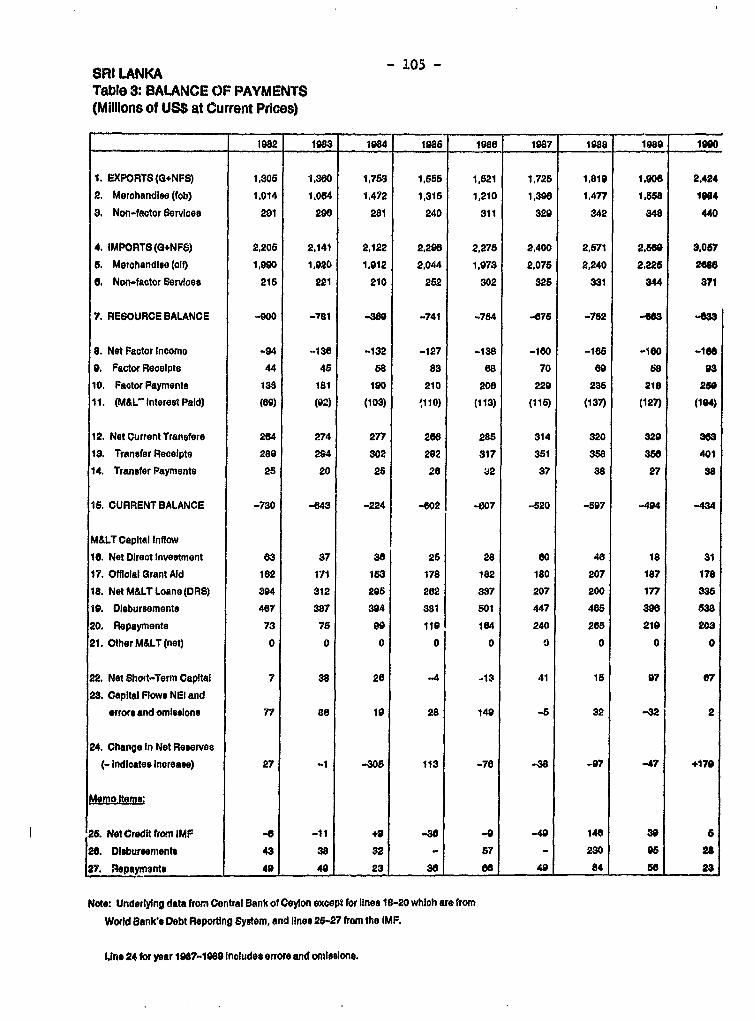
SRI LANKA - 105 -Table 3: BALANCE OF PAYMENTS(Millions of US$ at Current Prices)
1982 193 1984 1986 198e 1987 1988 1980 190
1. EXPORTS(G+NFS) 1.306 130M 1,763 1.565 1,621 1,726 1,819 1.9006 2,424
2. Merohandise (fob) 1,014 1,064 1,472 1,316 1,210 1,390 1,477 1,U68 1964
3, Non-factor Services 201 290 281 240 311 329 342 348 440
4. IMPORTS(G+NFS) 2,206 2,141 2,122 2,290 2,275 2,400 2,671 2,566 3,067
5. Merohandieo(aOf) 1,990 1,920 1,912 2,044 1,973 2,076 2,240 2,226 2660
S. Non-faotor Services 216 221 210 262 302 326 331 344 371
7. RESOURCE BALANCE -900 -781 -369 -741 -764 -076 -762 -66 -033
8. Not Faotor Income -94 -130 -132 -127 -138 -100 -105 -100 -100
9. Factor Receipts 44 46 58 83 6a 70 e6 68 93
10. Faetor Payments 138 181 190 210 200 229 236 218 260
11. (M&L- Interest Paid) (69) (92) (103) '110) (113) (115) (137) (127) (194)
12. Net Current Transfers 264 274 277 206 286 314 320 329 363
13. Transfer Recelpts 289 294 302 292 317 361 368 366 401
14. Transfer Payments 25 20 26 2e ;2 37 38 27 3s
15. CURRENT BALANCE -730 -043 -224 -02 -607 -620 -597 -494 -434
M< Capital Inflow
10. Net Direot Investment 03 37 36 26 28 o0 48 18 3117. Official Grant Ald 162 171 163 178 182 180 207 187 178
18. Net M< Loans (DRS) 394 312 295 262 337 207 200 177 335
19. Olibursements 467 887 394 301 601 447 4065 39 638
20. Repayments 73 75 99 119 104 240 206 219 203
21. Other M< (net) 0 0 0 0 0 0 0 0 0
22. Net Short-Term Capital 7 38 26 -4 -13 41 16 97 07
23. Capital Flows NEI and
errors and omisorons 77 se 19 28 149 -5 32 -32 2
24. Change In Net Reserves
(- Indlcates Increase) 27 -1 -30S 113 -76 -38 -97 -47 +179
Msmo Items:
25. Net Credit from IMF -0 -11 9 -3-9 -49 140 89 6
26 Disbursements 43 38 32 _ 67 - 230 96 28
27. Repaymants 49 49 23 36 _ e 49 84 66 23
Note: Underlying data from Centroi Bank of Ceylon except for lines 18-20 which are from
Worid Bank's Debt Reporting System, and lines 25-27 frorn the IMF.
Un. 24 for year 1987-1989 Includes errors and omissions.
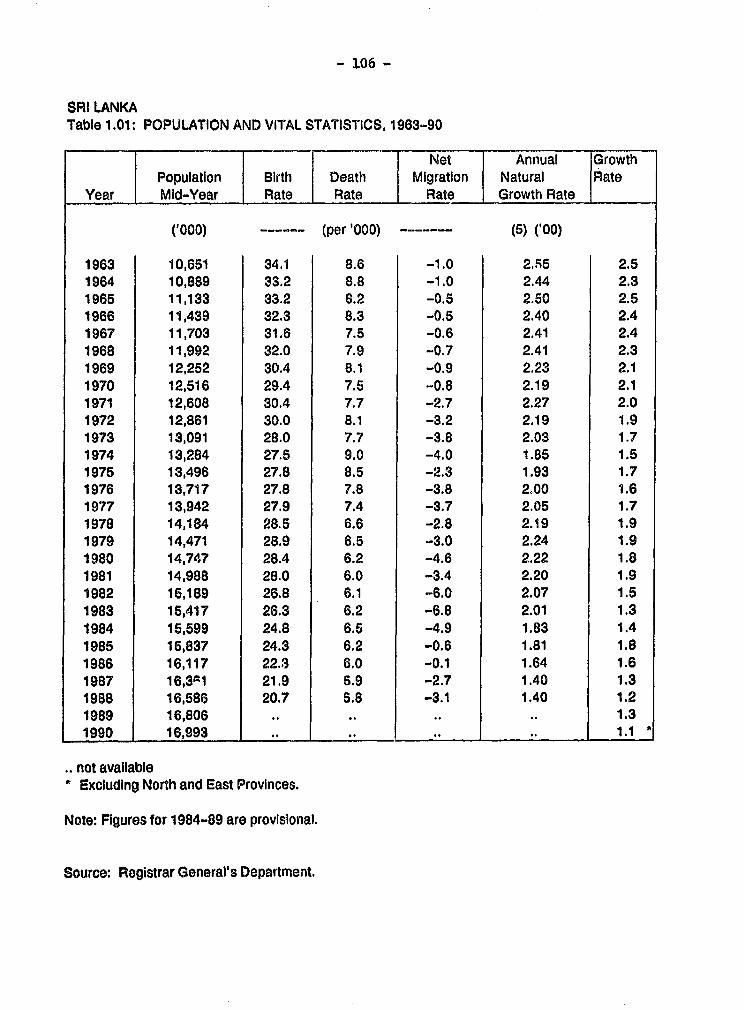
- 106 -
SRI LANKATable 1.01: POPULATION AND VITAL STATISTICS, 1963-90
. _ . ._ Net Annual GrowthPopulation Birth Death Migration Natural Rate
Year Mid-Year Rate Rate _ Rate Growth Rate
('000) (per'000) (5) ('00)
1963 10,651 34.1 8.6 -1.0 2.55 2.51964 10,889 33.2 8.8 -1.0 2.44 2.31965 11,133 33.2 8.2 -0.5 2.50 2.51966 11,439 32.3 8.3 -0.5 2.40 2.41967 11,703 31.6 7.5 -0.6 2.41 2.41968 11,992 32.0 7.9 -0.7 2.41 2.31969 12,252 30.4 8.1 -0.9 2.23 2.11970 12,516 29.4 7.5 -0.8 2.19 2.11971 12,608 30.4 7.7 -2.7 2.27 2.01972 12,861 30.0 8.1 -3.2 2.19 1.91973 13,091 28.0 7.7 -3.8 2.03 1.71974 13,284 27.5 9.0 -4.0 1.85 1.51975 13,496 27.8 8.5 -2.3 1.93 1.71976 13,717 27.8 7.8 -3.8 2.00 1.61977 13,942 27.9 7.4 -3.7 2.05 1.71978 14,184 28.5 6.6 -2.8 2.19 1.91979 14,471 28.9 6.5 -3.0 2.24 1.91980 14,747 28.4 6.2 -4.6 2.22 1.81981 14,988 28.0 6.0 -3.4 2.20 1.91982 15,189 26.8 6.1 -6.0 2.07 1.51983 15,417 26.3 6.2 -6.8 2.01 1.31984 15,599 24.8 6.5 -4.9 1.83 1.41985 15,837 24.3 6.2 -0.6 1.81 1.81986 16,117 22.3 6.0 -0.1 1.64 1.61987 16,3r1 21.9 5.9 -2.7 1.40 1.31988 16,586 20.7 5.8 -3.1 1.40 1.21989 16,806 .. .. .. .. 1.31990 16,993 .. .. .. .. 1.1
not available* Excluding North and East Provinces.
Note: Figures for 1984-89 are provisional.
Source: Registrar General's Department.
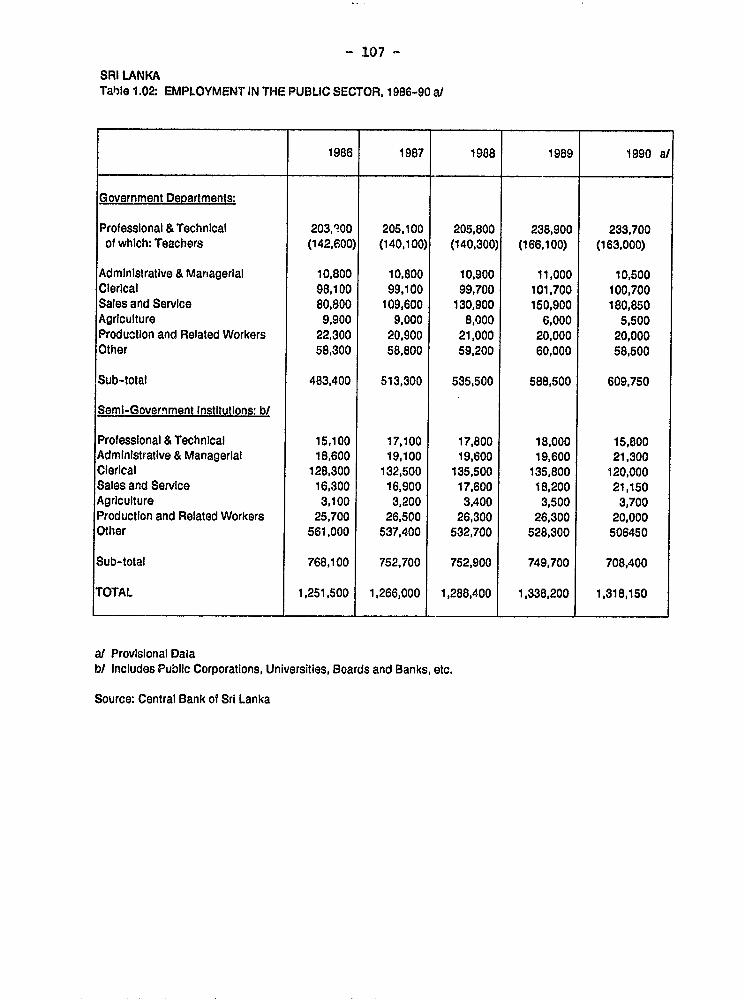
- 107 -
SRI LANKATa'Ie 1.02: EMPLOYMENT IN THE PUBLIC SECTOR, 1986-90 a/
1986 1987 1988 1989 1990 a/
Government Departments:
Professional & Technical 203,"00 205,100 205,800 238,900 233,700of which: Teachers (142,600) (140,100) (140,300) (166,100) (163,000)
Administrative & Managerlal 10,800 10,800 10,900 11,000 10,500Clerical 98,100 99,100 99,700 101,700 100,700Sales and Service 80,800 109,600 130,900 150,900 180,850Agriculture 9,900 9,000 8,000 6,000 5,500ProduCtion and Related Workers 22,300 20,900 21,000 20,000 20,000Other 58,300 58,800 59,200 60,000 58,500
Sub-total 483,400 513,300 535,500 588,500 609,750
Semi-Government Institutions: b/
Professlonal & Technical 15,100 17,100 17,800 18,000 15,800Administrative & Managerial 18,600 19,100 19,600 19,600 21,300Clerical 128,300 132,500 135,500 135,800 120,000Sales and Service 16,300 16,900 17,600 18,200 21,150Agriculture 3,100 3,200 3,400 3,500 3,700Production and Related Workers 25,700 26,500 26,300 26,300 20,000Other 561,000 537,400 532,700 528,300 506450
Sub-total 768,100 752,700 752,900 749,700 708,400
TOTAL 1,251,500 1,266,000 1,288,400 1,338,200 1,318,150
at Provisional Datab/ Includes Public Corporations, Universities, Boards and Banks, etc.
Source: Central Bank of Sri Lanka
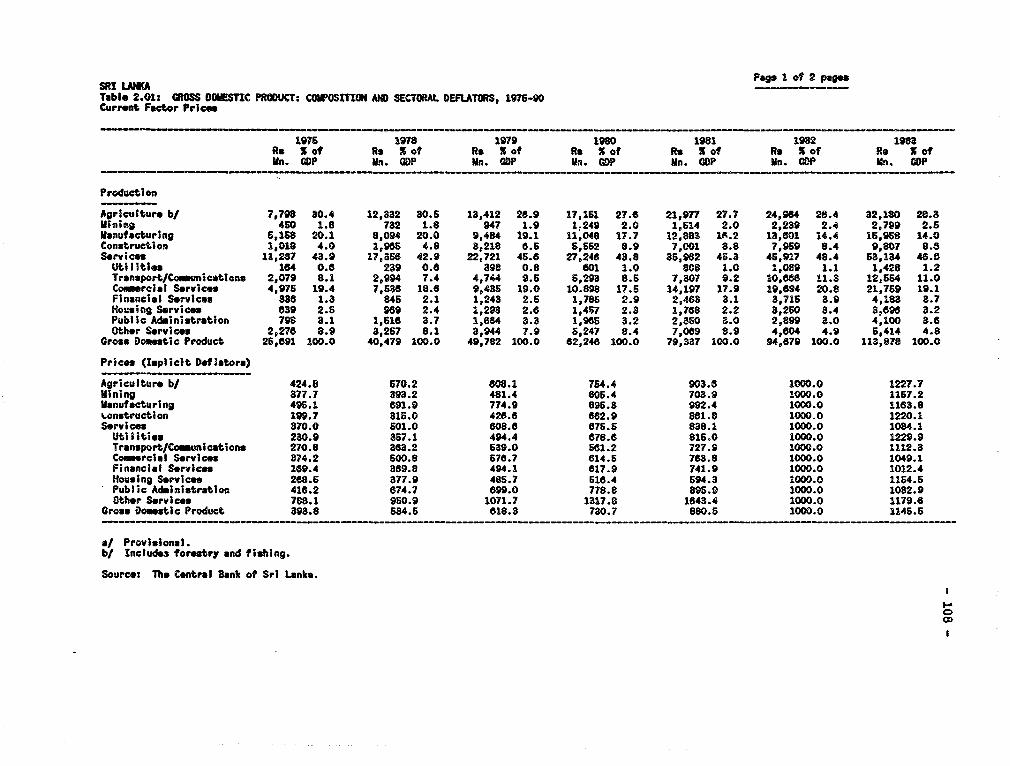
Pog I of 2 pegeSRI LAWCTable 2.01: GaOSS DOIESTIC PRODUCT: COWOSMON AM SECTORAL DEFLATORS, 1976-90Current Factor Price
1976 1978 1979 1980 1981 1982 1983Rs X of Rs S of Rs % of Rs % of Rs S of Rs S ot Rs S ofMn. GDP Un. GDP Mn. CDP Mn. CDP Un. CDP ln. GDP Mn. GDP
Production
Agriculture b/ 7,798 30.4 12,832 30.5 13,412 28.9 17,151 27.6 21,977 27.7 24,964 26.4 32,180 28.3mining 450 1.8 732 1.8 947 1.9 1,249 2.0 1,614 2.0 2,239 2.4 2,799 2.5Manufacturing 5,158 20.1 8,094 20.0 9,484 19.1 11,048 17.7 12,893 1A.2 18,801 14.4 16,968 14.0Construction 1,018 4.0 1,966 4.8 3,218 6.5 5,552 8.9 7,001 8.8 7,959 8.4 9,807 8.6Services 12,207 43.9 17,868 42.9 22,721 45.6 27,248 43.8 86,962 45.3 46,917 48.4 53,134 46.8
Utilities 184 0.6 289 0.6 398 0.8 601 1.0 808 1.0 1,089 1.1 1,428 1.2Trsnsport/Communicstion, 2,079 8.1 2,994 7.4 4,744 9.5 6,293 8.6 7,307 9.2 10,686 11.3 12,S54 11.0Commercial Services 4,976 19.4 7,6588 18.8 9,435 19.0 10.898 17.5 14,197 17.9 19,694 20.8 21,769 19.1Financial Services 338 1.3 e45 2.1 1,243 2.6 1,785 2.9 2,463 8.1 3,716 3.9 4,183 8.7Housing Services 639 2.5 969 2.4 1,293 2.6 1,457 2.3 1,768 2.2 3,260 8.4 3,696 3.2Public Administration 798 3.1 1,616 3.7 1,664 3.3 1,965 3.2 2,350 3.0 2,899 3.0 4,100 3.6Other Services 2,276 8.9 3,257 8.1 3,944 7.9 5,247 8.4 7,069 8.9 4,604 4.9 5,414 4.8
Cross Domestic Product 26,691 100.0 40,479 100.0 49,782 100.0 62,248 100.0 79,337 100.0 94,879 100.0 113,878 100.0
Prices (Implicit Deflators)
Agriculture b/ 424.8 670.2 608.1 764.4 903.8 1000.0 1227.7Mining 377.7 393.2 481.4 605.4 703.9 1000.0 1167.2Manuftcturlng 495.1 691.9 774.9 896.3 m.4 1000.0 1163.8
wonstructlon 199.7 316.0 426.6 682.9 861.8 1000.0 1220.1Services 370.0 601.0 608.8 875.5 838.1 1000.0 1084.1Utilities 230.9 367.1 494.4 678.6 816.0 1000.0 1229.9Transport/Co uBnications 270.8 368.2 639.0 561.2 727.9 1000.0 1112.3Conercisl Services 374.2 500.8 678.7 614.5 763.8 1000.0 1049.1Financial Services 169.4 389.8 494.1 617.9 741.9 1000.0 1012.4Housing Services 2e68.6 77.9 485.7 616.4 694.3 1000.0 1154.6Public Administration 416.2 674.7 699.0 778.8 895.9 1000.0 1082.9
Other Services 788.1 950.9 1071.7 1317.8 1643.4 1000.0 1179.6Cross Domestic Product 393.8 654.6 818.3 730.7 880.5 1000.0 114b.5
a/ Provisional.b/ Include3 forestry and fishing.
Source: The Central Bank of Sri Lanka.
0
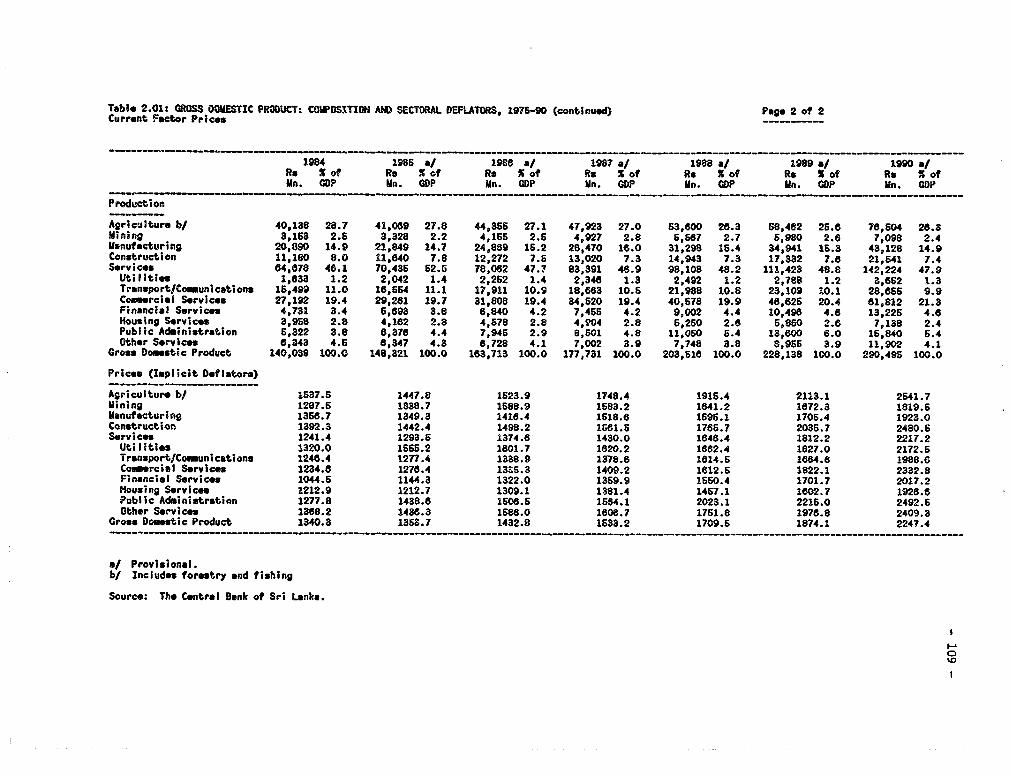
Table 2.01: QRosS OMIESTIC PRODUCT: COMPOSITION AND SECTORAL DEFLATORS, 197S-90 (continued) Page 2 of 2Current Factor Prices
198 1985 a/ 1988 a/ 1987 a/ 1988 a/ 1989 a/ 1990 a/Re X of Re X Of Rs X of R X of Rs X of Ru X of Rs N ofMn. GDP Mn. CDP Mn. GDP Mn. GDP Mn. GDP ln. GDP Mn. GDP
Production
Agriculture b/ 40,138 28.7 41,069 27.8 44,355 27.1 47,923 27.0 53,600 28.3 58,462 25.8 78,504 28.3Mining 3,163 2.6 3,328 2.2 4,156 2.6 4,927 2.8 6,587 2.7 6,980 2.6 7,098 2.4UMnufacturing 20,890 14.9 21,849 14.7 24,889 16.2 28,470 16.0 31,298 15.4 34,941 15.3 43,128 14.9Construction 11,180 8.0 11,640 7.8 12,272 7.5 13,020 7.3 14,943 7.3 17,332 7.8 21,541 7.4Service. 64,878 48.1 70,435 52.6 78,062 47.7 83,391 48.9 98,108 48.2 111,423 48.8 142,224 47.9Utiliti;s 1,633 1.2 2,042 1.4 2,252 1.4 2,348 1.3 2,492 1.2 2,788 1.2 3,652 1.3Transport/Comunications 16,499 11.0 18,564 11.1 17,911 10.9 18,663 10.5 21,988 10.8 23,109 10.1 28,655 9.9Comercial Services 27,192 19.4 29,281 19.7 31,808 19.4 34,620 19.4 40,678 19.9 48,626 20.4 81,812 21.3Financial Services 4,731 3.4 5,393 3.8 6,840 4.2 7,465 4.2 9,002 4.4 10,498 4.6 13,225 4.6Housing Services 3,958 2.8 4,182 2.8 4,578 2.8 4,904 2.8 5,250 2.8 5,860 2.6 7,138 2.4Public Adininstration 6,322 3.8 8,376 4.4 7,945 2.9 8,601 4.8 11,050 5.4 13,800 6.0 15,840 6.4Other Services 6,343 4.6 6,347 4.3 8,728 4.1 7,002 3.9 7,748 3.8 8,955 3.9 11,902 4.1Gross Domestic Product 140,039 100.0 148,321 100.0 183,713 100.0 177,731 100.0 203,518 100.0 228,138 100.0 290,495 100.0Prices (Implicit Deflators)
Agriculture b/ 1537.5 1447.8 1623.9 1748.4 1915.4 2113.1 2641.7Mining 1287.5 1338.7 1588.9 1583.2 1841.2 1872.3 1819.6Manufacturing 1368.7 1349.3 1416.4 1618.8 1596.1 1705.4 1923.0Construction 1392.3 1442.4 1498.2 1581.5 1765.7 2036.7 2480.5Services 1241.4 1293.6 1374.6 1430.0 1e48.4 1812.2 2217.2Utilities 1320.0 1555.2 1801.7 1820.2 1882.4 1827.0 2172.5Transport/Communications 1246.4 1277.4 1338.9 1378.8 1814.6 1884.8 1988.8Commercial Services 1234.6 1276.4 13S5.3 1409.2 1812.6 1822.1 2332.8Financial Services 1044.6 1144.3 1322.0 1359.9 1650.4 1701.7 2017.2Housing Services 1212.9 1212.7 1309.1 1381.4 1467.1 1602.7 1928.6Public Administration 1277.8 1438.8 1508.5 1664.1 2023.1 2216.0 2492.6Other Services 1368.2 1436.3 1588.0 1608.7 1751.8 1978.8 2409.3Gross Domestic Product 1340.3 1363.7 1432.8 1633.2 1709.5 1874.1 2247.4---------------------- --------------------------------- ------------
at Provisional.b/ Includos forostry and fishing
Source: Tho Central Sank of Sri Lanka.
I-0
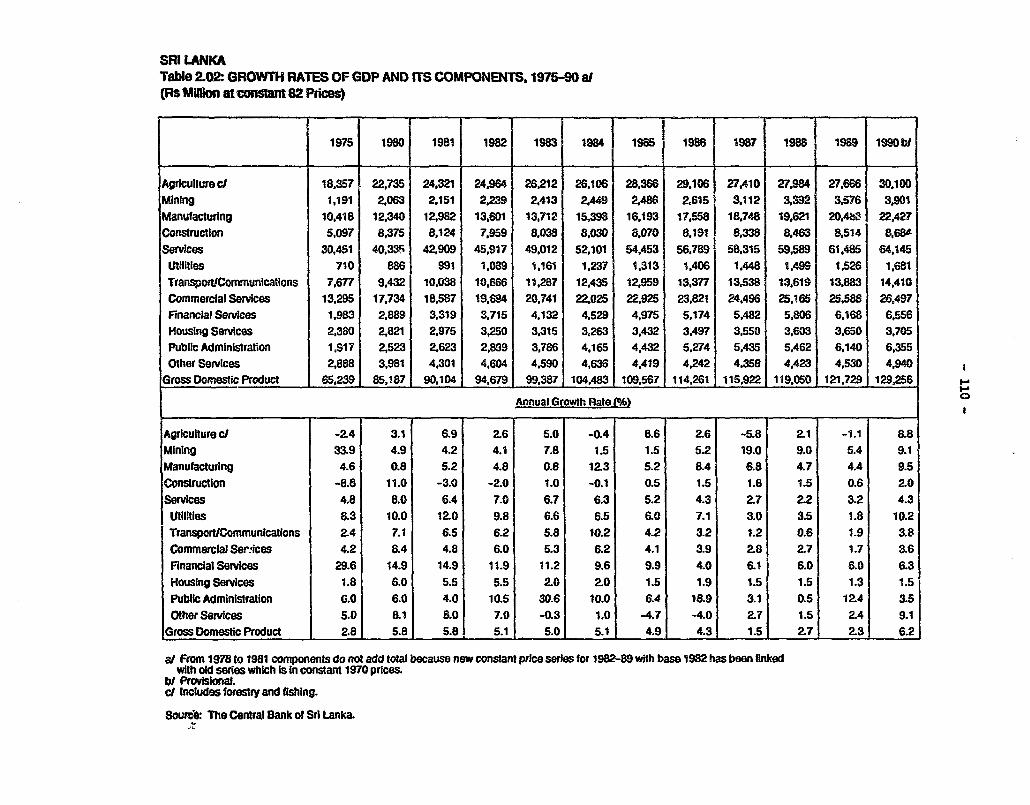
SRI LANKATable 2.02: GROWTH RATES OF GDP AND rrS COMPONENTS. 1975-90 af(Rs Million at onstam 82 Prces
1975 1980 1981 1982 1983 1984 | 1985 1986 1987 1988 1989 1990bI
Agriculture c 18,357 22,735 24.321 24,984 26,212 26,106 28.368 29,106 27,410 27,984 27.666 30,100Mining 1,191 2.063 2,t15 2.239 2,413 2.449 2,486 2,615 3.112 3,392 3.576 3,901Manufacturing 10.418 12,340 12,982 13,601 13.712 15,398 16,193 17.558 18,748 19.621 20.4b8 22,427Construction 5,097 8,375 8,124 7,959 8.038 8,030 8.070 8.191 8,338 8,463 8,514 8.68BServices 30,451 40,335 42,909 45,917 49,012 52,101 54,453 56,789 58.315 59,589 61,485 64,145Utilites 710 886 991 1,089 1,161 1,237 1,313 1.406 1.448 1,499 1,526 1,681TranspotlCommunications 7,677 9,432 10.038 10,666 11,287 12,435 12.959 13.377 13,538 13.619 13.883 14.410Commercial Serices 13.295 17.734 18,587 19,694 20.741 22.025 22,925 23,821 24.496 25,165 25,588 26,497Financial Services 1,983 2,889 3,319 3.715 4,132 4,529 4,975 5,174 5,482 5,806 6,168 6.556Housing Services 2,380 2,821 2.975 3,250 3.315 3.263 3,432 3.497 3.550 3,603 3,650 3,705Public Administration 1,917 2,523 2,623 2,899 3,786 4,165 4,432 5,274 5,435 5,462 6,140 6.355Other Services 2,888 3,981 4,301 4,604 4,590 4.636 4,419 4.242 4.358 4.423 4,530 4,940
Gross Domestic Product 65.239 85,187 90,104 94,679 99,387 1,04483 109,567 114,261 115.922 119,050 121,729 129,256
Annual Growth Rate f)
Agriculture cd -2.4 3.1 6.9 2.6 5.0 -0.4 8.6 2.6 -5.8 2.1 -1.1 8.8Mining 33.9 4.9 4.2 4.1 7.8 1.5 1.5 5.2 19.0 9.0 5.4 9.1Manufacturing 4.6 0.8 5.2 4.8 0.8 12.3 5.2 8.4 6.8 4.7 4.4 9.5Construction -8.8 11.0 -3.0 -2.0 1.0 -0.1 0.5 1.5 1.8 1.5 0.6 2.0Services 4.8 8.0 6.4 7.0 6.7 6.3 5.2 4.3 2.7 22 3.2 4.3Utilities 8.3 10.0 12.0 9.8 6.6 6.5 6.0 7.1 S o 3.5 1.8 10.2TransportlCommunications 2.4 7.1 6.5 6.2 5.8 10.2 4.2 3.2 1.2 0.6 1.9 | 38Commercial Ser!ices 4.2 &4 4.8 6.0 5.3 6.2 4.1 3.9 28 2.7 1.7 3.6Financial Services 29.6 14.9 14.9 11.9 11.2 9.6 9.9 4.0 6.1 6.0 6.0 6.3Housing Services 1.8 6.0 5.5 5.5 2.0 2.0 1.5 1.9 1.5 1.5 1.3 1.5Public Administration G.0 6.0 4.0 10.5 30.6 10.0 6.4 189 3. 0.5 124 3.5Other Services 5.0 &1 8o 7.0 -0.3 1.0 -4.7 -4.0 2.7 1.5 2.4 9.1
Gross Domestic Procduct 2.8 5.8 5.8 5.1 5.0 5.1 4.9 4.3 1.5 2.7 2.3 6.2
a/ From 1978 to 1981 components do not add total because new constant price series for 1982-89 with base 1982 has been linkedwith old series which is In constant 1970 prices.b/ Provisional.cl Incluies forestry and ftishing.
Source: The Central Bank of Sri Lanka.
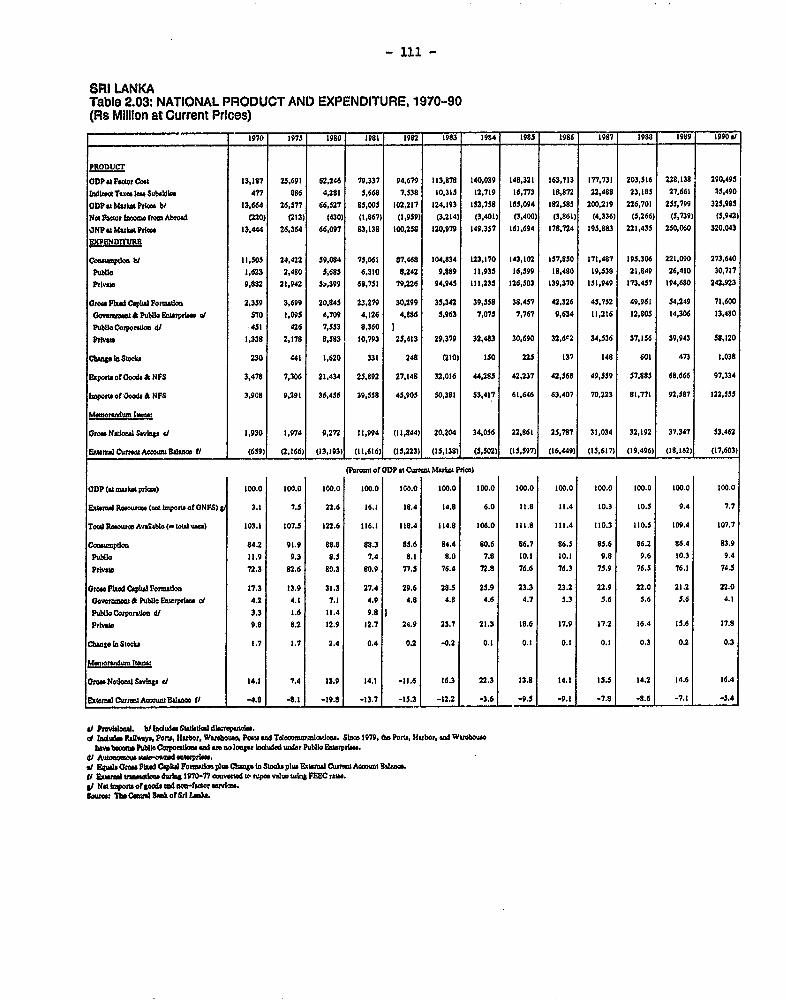
- 111 -
SRI LANKATable 2.03: NATIONAL PRODUCT AND EXPENDITURE, 1970-90(Rs Million at Current Prices)
.1_ X970 1971 1980 1981 1982 1983 1904 1985 1986 1987 1988 1989 19901
PRODUcr
ODP1 Factor Com 13,187 25,691 62.246 79,337 94,679 113,878 140,039 148,321 163,713 177,731 203,516 228,138 290,495
itD#g Tuu I- SubWidi 477 886 4,281 5,668 7,538 10,315 12,719 16,773 18,872 22,488 23,185 27,661 35,490
ODP at Marko Picu bi 13,664 26,577 66,527 85,00S 102,217 124,193 1S2,758 165,094 182,585 200.219 226,701 255,799 32S,985
No F8 . t awomo fto. iAbromd (220) (213) (4301 (1,8671 (1,959) (3.214) (3,401) (3.400) (3,861) (4,336) (5,266) (5,739) (5,942)
3NP a MUaI P,cm 13,466 26,364 66,097 93,138 100,258 120,979 149,357 161,694 178,724 195,883 221.435 250,060 320.043
axpoND1truR
C: emoptlom bi 11,505 24.422 59,084 73,061 87,468 104,834 123,170 143,102 157,850 171,487 195,306 221,090 273,640
Pvule 1,623 2,480 5,685 6.310 8,242 9,889 11,935 16,599 18,480 19,538 21,849 26,410 30,717
Pivais 9,882 21,942 3j,399 68,751 79,226 94,945 111,235 126,503 139,370 11,949 173,457 194,680 242,923
Oem F)Ad Cpula Fooa±la 2,359 3,699 20.845 23,279 30,299 M3.342 39,558 38.457 42,326 45.732 49,961 54,249 71,600
UovWAP & publio E'aprlm of 570 1,09S 4,709 4,126 4,886 5,963 7,075 7,767 9,834 11,216 12,803 14,306 13,480
PubliaCQorporLoe a 4531 426 7,553 8,360
Pulm 1,338 2,178 8,583 10,793 25,413 29,379 32,483 30.690 32.602 34,536 37,156 39,943 38,120
Changin DSoob 230 441 1,620 331 248 (210) 150 225 137 148 601 473 1,038
Export. of Good. & NFS 3,478 7,306 21.434 25,892 27,148 32,016 44,295 42.237 42,S68 49,539 57.885 68,666 97,334
lmptof U oods & NFS 3,908 9,291 36,456 39,538 45,905 S0,381 53,417 61,646 63,407 70,223 81,771 92,387 122,5S3
Mamrodwum IVA":
0o.N4adooSavilo e 1,930 1,974 9,272 11,994 (11,844) 20,204 34.0S6 22,861 23,787 31,034 32,192 37.347 53,462
E.umnl .uiAo¢m A 9h)cU s t (639) (2,1661 (13,193)1 (11.6161 (15,2231 (15,1381 (5,302) (1I,397) (16,449)1 (1,617) ()9.496) (l8,162) (17,603)
(Poroni of ODP at Cu Out Muiut Pios)
CDP ( awh4t prim) 100.0 100.0 100.0 100.0 100.0 100.0 100.0 100.0 100.0 100.0 100.0 100.0 100.0
ExI.mal Rawousra mgImpotu of ON FS) 3.1 7.3 22.6 16.1 18.4 14.8 6.0 11.8 11.4 10.3 10.5 9.4 7.7
Total Rorm Ava0ble('tomum) 103.1 107.5 122.6 116.1 118.4 114.8 106.0 111.8 111.4 110.3 110.5 109.4 107.7
Coopdom 84.2 91.9 89.8 88.3 85.6 84.4 80.6 86.7 86.5 85.6 96.2 86.4 83.9
Pubic 11.9 9.3 8.3 7.4 8.1 8.0 7.8 10.1 10.1 9.8 9.6 10.3 9.4
P*nt 72.3 82.6 80.3 80.9 77.5 76.4 72.8 76.6 76.3 75.9 76.5 76.1 74.5
Oro FlbAd C*pluIl Fonratlo 17.3 13.9 31.3 27.4 29.6 28.3 23.9 23.3 23.2 22.9 22.0 21.2 22.0
Gov clmm ¢ Public Eocurprl.o o 4.2 4.1 7.1 4.9 4.8 4.? 4.6 4.7 5.3 5.6 5.6 3.6 4.1
Publi Co.woral dl 3.3 1.6 11.4 9.8 I
Privai. 9.8 8.2 12.9 12.7 24.9 23.7 21.3 18.6 17.9 17.2 16.4 15.6 17.8
cum*s InSloo) 1.7 1.7 2.4 0.4 0.2 -0.2 0.1 0.1 0.1 0.1 0.3 0.2 0.3
Hmml an6o ram:
7roa Nudoos SavlNts at 14.1 7.4 13.9 14.1 -11.6 16.3 22.3 13.8 14.1 15.5 14.2 14.6 16.4
Ext Mutarnt AmiJnBhImo ft -4.8 -8.1 -19.8 -13.7 -13.3 -12.2 -3.6 -9.5 -9. -7.8 -8.6 -7.1 _-.4
at Provlalud. S ind S u dicc.of 1udto Rds, Por IHutor, Wa/omo, Poats aod Telamounalowiou. Sl1 1979, Uth Port, Hubor, ad Wszubowu
ba bem Publi Corpotosa mad u no lo lbdouda undor Pubib Eoawpdr.41 Auwacuct PAWV9JU MipT,3.ot Eqa arm Fixed Cepial FonIo. plus Qag to Stoch pluc Extd Ouew Acotmt 81m.Ui & rul tnucoAo durang 1970-7 uvrerd to rup valu usIng FEEC ram.8t No bportA of goods end no-factor tvlm..S4ta The Cantral Smb of Sit Laka,
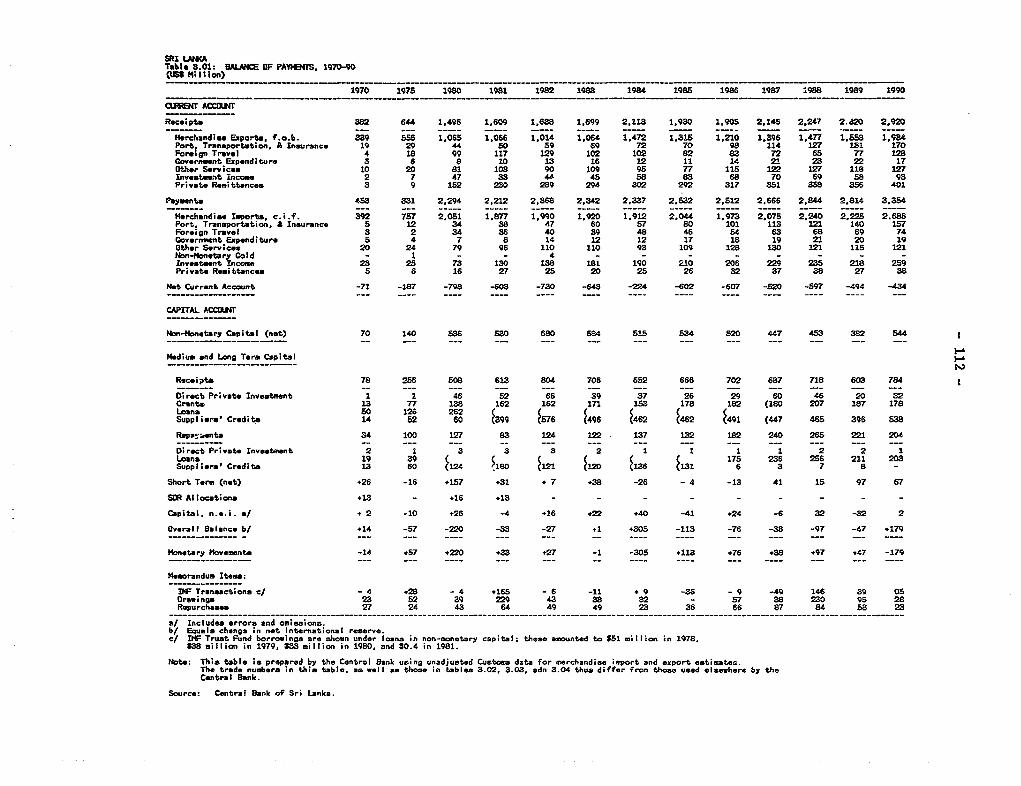
SRI LSANKTable 3.01: BAWLACE OF PAYM1eS, 1970-90
Hi M I ion)
1970 1975 1980 1981 1982 1983 1984 1985 1988 1987 1988 1989 1990
COURRE ACCOtL
Receipts 382 644 1,496 1,609 1,638 1,699 2,113 1,930 1,905 2,14S 2.247 2.320 2,920Merchandise Exports, f.o.b. 339 5S 1.065 1,066 1,014 1,064 1,472 1,315 1,210 1,896 1,477 1,558 1,984Port, Transportation, A Insurance 19 29 44 50 59 69 72 70 98 114 127 131 170Foreign Travel 4 18 99 117 129 102 102 82 83 72 65 77 128Covernment Expenditure 5 6 8 10 13 16 12 11 14 21 23 22 17othe Services 10 20 81 103 90 109 95 77 lS 122 127 118 127Investsent Incose 2 7 47 33 44 45 58 83 68 70 69 58 93Private Remittances 3 9 152 230 289 294 302 292 317 351 358 356 401
Payments 453 831 2,294 2,212 2,568 2,342 2,337 2,532 2,512 2,666 2,844 2,814 3,354
Merchandise Imports, c.i.f. 392 757 2.051 1,877 1,990 1,920 1,912 2.044 1,973 2,075 2,240 2,225 2.686Port, Transportation, A Insurance 5 12 34 35 47 60 57 80 101 113 121 140 157Foreign Travel 3 2 34 36 40 59 48 46 54 63 68 69 74Oovernasnt Expenditure 5 4 7 8 14 12 12 17 18 19 21 20 19other Services 20 24 79 96 110 110 93 109 128 130 121 115 121Non-Moetary Cold - 1 - - 4 - - - - - - - -Investent Incom 23 25 73 150 138 161 190 210 206 229 235 218 259Private Remittances 5 6 16 27 25 20 25 26 32 37 38 27 38
Net Current Account -71 -187 -798 -603 -730 -643 -274 -602 -607 -520 -597 -494 434
CAPITAL ACCOWT
Non-Monetary Capital (net) 70 140 536 530 680 584 515 534 520 447 453 382 S44
Medium and Long Term Capital
Receipts 78 256 508 613 804 706 652 666 702 687 718 603 784
Direct Private Investment 1 1 46 52 66 39 37 26 29 60 46 20 32Grants 13 77 138 162 162 171 153 178 182 (180 207 187 178Loans 50 126 262Suppl iera' Credits 14 52 60 J399 &76 (496 f462 J462 t491 (447 465 396 538
Repao,-;nta 34 100 127 8S 124 122 137 132 182 240 265 221 204
Direct Privato Investment 2 1 3 3 3 2 1 1 1 1 2 2 1Loans 19 39 175 236 256 211 203Suppliers' Credits 13 60 (124 0160 121 120 (136 131 6 3 7 8 -Short Term (not) +26 -16 +157 +31 + 7 .38 -26 - 4 -13 41 15 97 67SOR Al locations .13 - .16 .13 - - - - - - - - -
Capital, n.e.i. o/ * 2 -10 +26 -4 .16 +22 .40 -41 .24 -6 32 -32 2
Overall Balance bJ t14 -57 -220 -33 -27 t1 .305 -113 -76 -38 -97 -47 .179
Monetary Movements -14 .57 .220 .33 .27 -1 -305 .113 .76 .38 +97 .47 -179
Meorandus Items:
IW Transactions c/ - 4 +28 - 4 .165 - 6 -11 + 9 -36 - 9 -49 146 39 05Dramiwnga 23 52 39 229 43 38 32 - 57 38 230 95 28Repurchases 27 24 43 64 49 49 23 36 66 87 84 58 23
a/ Includes errors and omissions.bJ Equals change in net international reserve.c/ IMF Trust Fund borroings are shown under toans in non-monetary capital; these amounted to $51 mill ion in 1978,
S38 million in 1979, 833 million in 1960, and 30.4 in 1981.
Note: This table is prepared by the Central Bank using unadjusted Customs data for merchandise irport and export estisate=.The trade numbers in this table, as wmll an those in tables 3.02, 3.03, adn 3.04 thus differ from those used elsewhere by theCentral Bank.
Source: Central Bank of Sri Lanka.
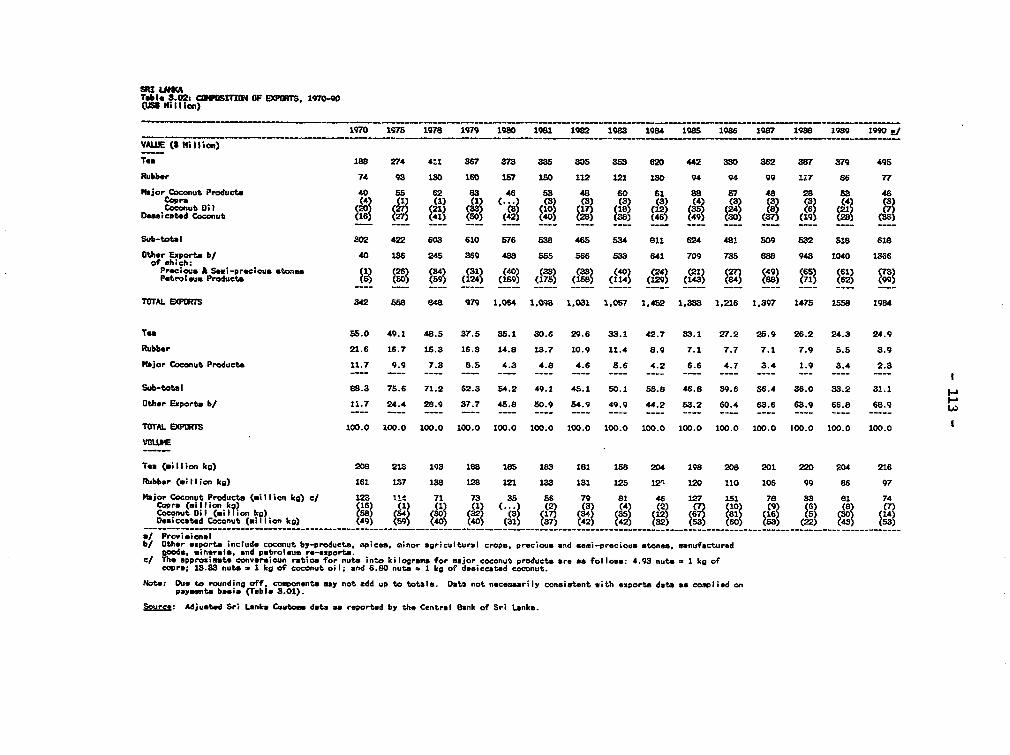
SIU LMITab IJ a.O2: CWuPOSrr£T OF EXPIJIS 1970-90(US Mt I I ion)
1970 19M7 1978 1979 1984 1981 1982 1988 1984 198S 198 1987 1988 1989 1990 g/
VA (S Ws II oion)
Tes 188 274 4'1 367 373 335 305 35S 620 442 330 362 387 379 495
Rubber 74 93 180 160 157 iS0 112 121 230 94 94 99 117 86 77
Mejor Coconut Products 40 8S 62 S3 46 SS 48 60 61 88 57 48 28 Ss 46Capral (4 ) (1) (43) (3) $ (3a
Demicuted Cconut 016) 2 41 (425 ° 28 B540 49 37 (19 2 (35Coconut Oi 133 200~I8 (2) ( (4)(7
Sub-total 302 422 603 610 576 538 465 534 8ll 624 481 509 832 518 618
Other Exports b/ 40 186 245 369 48 555 566 S33 641 709 735 888 943 1040 1366of which:
Pr precious *(5 1 ) (50> (59) (124) () (733 158) 114) (249 (213) (84) C (62)(99)Patrol s Proda stones (1) (28) (34) (124) (409) (33) (33) (140) (124) (21)a (27) 9 151 (67 (714
TOTAL EDa87PS 342 55W 848 979 1,064 1,093 1,031 1,067 1,452 1,333 1.216 1,397 1475 1388 1984
Ter 55.0 49.1 48.5 37.5 35.1 30.6 29.6 33.1 42.7 33.1 27.2 25.9 26.2 24.3 24.9
Rubber 21.6 16.7 15.3 16.3 14.8 13.7 10.9 11.4 8.9 7.1 7.7 7.1 7.9 5.5 3.9
Major Coconut Products 11.7 9.9 7.3 8.5 4.3 4.8 4.6 5.6 4.2 6.6 4.7 3.4 1.9 3.4 2.3__… -…_ ____ ___ ___ ____ ____ --- ---- --- ____ ---- -_ ---- --- I
Sub-total 88.3 75.6 71.2 62.3 54.2 49.1 45.1 50.1 55.8 46.8 39.6 56.4 36.0 33.2 31.1Other Exports b/ 11.7 24.4 28.9 37.7 45.8 50.9 54.9 49.9 44.2 53.2 60.4 63.6 63.9 66.8 68.9
TOTAL EXPOTS 100.0 100.0 100.0 100.0 100.0 100.0 100.0 100.0 100.0 100.0 100.0 100.0 I00.0 100.0 100.0
VOIE
Tea (mi ll ion kg) 208 213 193 188 185 183 181 158 204 198 208 201 220 204 216
Rubber (mi ll ion kg) 161 137 38 12 1221 133 131 125 12. 120 110 106 99 86 97
Major Coconut Products (million kg) c/ 123 1it 71 73 35 56 79 81 46 127 151 78 33 81 74Coconut OilI (nw l I non kg) (88) (54) (13) (323 (3) (17) (34)3 (35) (1 8t 8213 (16) (5) (304Cop re (m;Illion kgj (S16) (1) (01) 1 . (2 ) 3 (4) (22 ,(, lO59 6) (8 (7)Desiccated Coconut (Sill ien kg) (49) (59) (40) 40) (31) (37) (42) (42) M)5S ,60, (33) (22) (43)
*1 Provisionalb/ Other *xports include coconut by-product.. apices. minor agricultural crops, precious and semi-precious *tones, msnufactured
goods, ainerals, and petroleum re-exports.c/ The approximte conversioun ratios for nuts into kilograms for major coconut products are as follows: 4.93 nuts = 1 kg of
Copra; 13.33 nuts - 1 kg of coconut oil; and 6.80 nuts * 1 kg of desiccated coconut.
Note: Due to rounding off, component. may not add up to totals. Data not necessarily consistent with exports data as complied onpayments basis (Table 3.01).
Soure: Adjusted Sri Lanka Custom data as reported by the Central Bank of Sri Lanka.
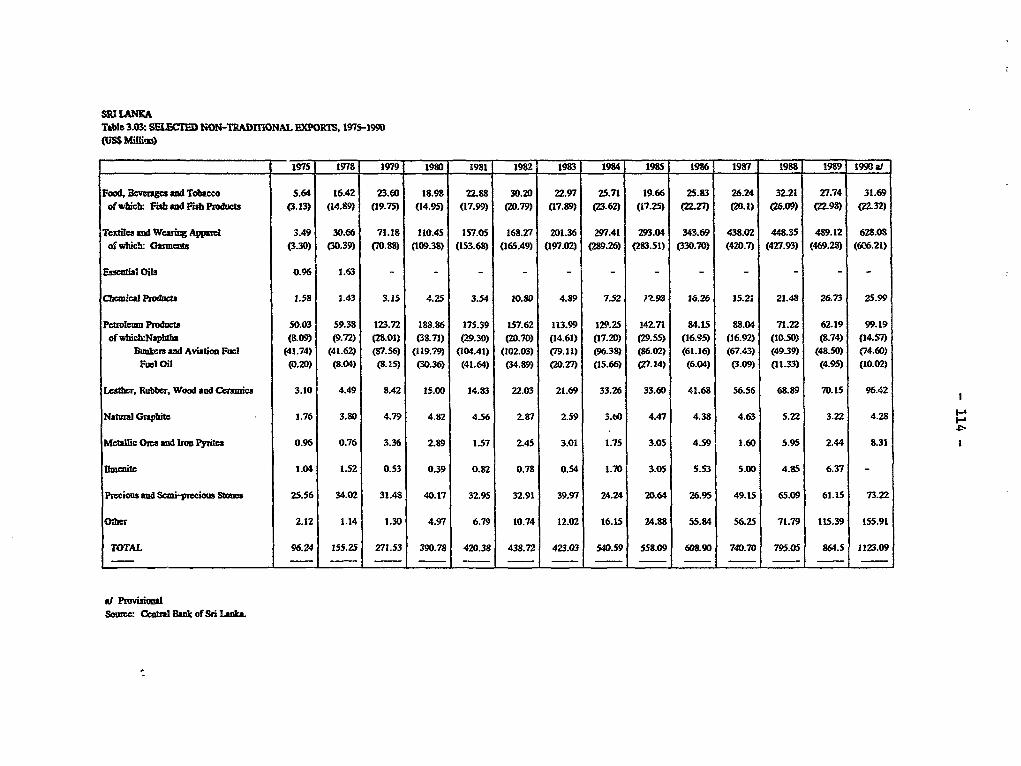
SRI LANKA
Table 3.03: SELECTED NON-TRADITIONAL EXPORTS, 1975-1990(USS bSilic
1975 1978 1979 1980 1981 1982 1983 1984 1985 1936 1 1987 1988| 1989 1990 at
Fod, Bvages and Tobacco 5.64 16.42 23.60 18.98 22.88 30.20 22.97 25.71 19.66 25.83 26.24 32.21 27.74 31.69of which: Fab md Fish Poducts (3.13) (14.89) (19.75) (14.95) (17.99) (20.79) (17.89) (23.62) (17.25) (22.27 (2D.1) (26.09) (22.98) (2232)
Tcdiea and Wcarg AW=paIt 3.49 30.66 71.18 11OA5 157.05 168.27 201.36 297AI 293.04 343.69 438.02 448.35 489.12 628.08of whicb: Oimcnls (3.30) (30.39) (70.88) (109.38) (153.68) (165.49) (197.02) (289.26) (285.51) (330.70) (420.7) (427.93) (469.28) (606.21)
EssitW Oia s 0.96 1.63 - - - - - - - - - -
;cMiCad PadWtS 1.5 1.43 3.1 4.25 3.54 10.80 4.89 7.52 ??.98 16.26 15.21 21.48 26.73 25.99
Petroeum Prod 50.03 59.38 123.72 188.86 175.39 157.62 113.99 129.25 142.71 84.15 88.04 71.22 62.19 99.19of whidLNIphtbh (8.09) (9.72) (2801) (38.71) (29.30) (20.70) (14.61) (17.20) (29.55) (16.95) (16.92) (10.50) (8.74) (14.57)
Bunkers and Aviation Fuel (41.74) (41.62) (37.56) (119.79) (104.41) (102.03) (79.11) (96.38) (86.02) (61.16) (67.43) (49.39) (48.50) (74.60)Fuel Oil (0.20) (8.04) (8.15) (30.36) (41.64) (34.89) (20.27) (15.66) (27.14) (6.04) (3.09) (11.33) (4.95) (10.02)
Lesther, Rubbcr, Wood and Carmics 3.10 4.49 8A2 15.00 14.83 22.03 21.69 33.26 33.60 41.68 56.56 68.89 70.15 96.42
I-ANatal Graphit 1.76 3.8D 4.79 4.82 4.56 2.87 2.59 3.60 4.47 4.38 4.63 5.22 3.22 4.28 >
Metallic Oms end Ir Pyites 0.96 0.76 3.36 2.89 1.57 2.45 3.01 1.75 3.05 4.59 1.60 5.95 2.44 8.31
Imcuite 1.04 1.52 0.53 0.39 0.82 0.78 0.54 1.70 3.05 5.53 5.00 4.85 6.37 -
Psecious and Scmi-Pecious StouC4 25.56 34.02 31.48 40.17 32.95 32.91 39.97 24.24 20.64 26.95 49.15 65.09 61.15 73.22
Other 2.12 1.14 1.30 4.97 6.79 10.74 12.02 16.15 24.88 55.84 56.25 71.79 115.39 155.91
TOTAL 96.24 155.25 271.53 390.78 420.38 438.72 423.03 540.59 558.09 608.90 740.70 795.05 864.5 1123.09
af PrvisioaSoaw=: Central Bank of Sri -nk.
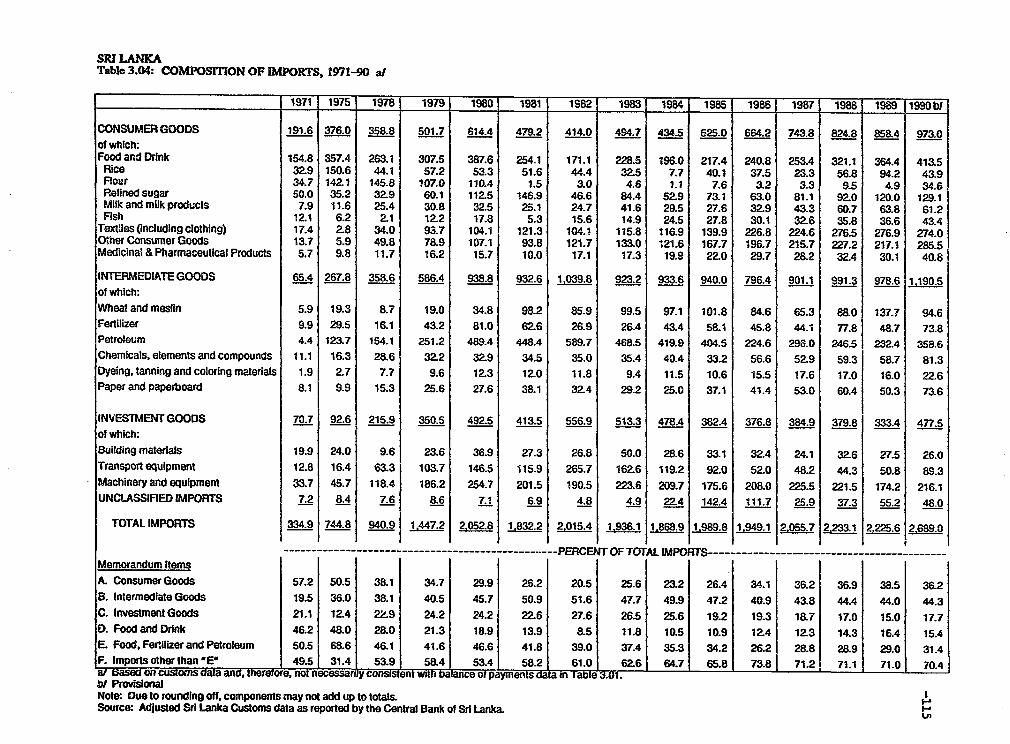
SRI LANATable 3.04: COMPOSMTION OF IMPORTS, 1971-90 al
1971 1975 1978 1979 1980 1981 1982 1983 1984 1985 1986 1987 1988 1989 1990bl
CONSUMER GOODS 191.6 376.0 3sas 501.7 614.4 479.2 414.0 494.7 434.5 525.0 664.2 743.8 824.8 858.4 973.0of which:Food and Drink 154.8 357.4 263.1 307.5 387.6 254.1 171.1 228.5 196.0 217.4 240.8 253A 321.1 364.4 413.5Rice 32.9 150.6 44.1 57.2 53.3 51.6 44.4 32.5 7.7 40.1 37.5 23.3 56.8 94.2 43.9Flour 34.7 142 1 145.8 107.0 110.4 1.5 3.0 4.6 1.1 7.6 3.2 3.3 9.5 4.9 34.6Refined sugar 50.0 35.2 32.9 60.1 112.5 148.9 46.6 84.4 52.9 73.1 63.0 81.1 92.0 120.0 129.1Milk and milk products 7.9 11.6 25.4 30.8 32.5 25.1 24.7 41.6 29.5 27.6 32.9 43.3 6D.7 63.8 61.2Fish 12.1 6.2 2.1 12.2 17.8 5.3 15.6 14.9 24.5 27.8 30.1 32.6 35.8 36.6 43.4
TexCiles (including clothing) 17.4 2.8 34.0 93.7 104.1 121.3 104.1 115.8 116.9 139.9 226.8 224.6 276.5 276.9 274.0Other Consumer Goods 13.7 5.9 49.8 78.9 107.1 93.8 121.7 133.0 121.6 167.7 196.7 215.7 227.2 217.1 285.5Medicinal & Pharmaceutical Products 5.7 9.8 11.7 16.2 15.7 10.0 17.1 17.3 19.9 22.0 29.7 28.2 32.4 30.1 40.8
INTERMEDIATE GOODS 65.4 267.8 358.6 586.4 938.8 932.6 1039.8 923.2 933.6 940.0 796.4 901.1 991.3 978.6 1,190.5of which:Wheat and meslin 5.9 19.3 8.7 19.0 34.8 98.2 85.9 99.5 97.1 101.8 84.6 65.3 880 137.7 94.6Fertilizer 9.9 29.5 16.1 43.2 81.0 62.6 26.9 26A 43.4 58.1 45.8 44.1 77.8 48.7 73.8Petroleum 4.4 123.7 154.1 251.2 489.4 448.4 589.7 468.5 419.9 404.5 224.6 296.0 246.5 232.4 358.6Chemicals, elements and compounds 11.1 16.3 28.6 32.2 32.9 34.5 35.0 35.4 40.4 33.2 56.6 52.9 59.3 58.7 81.3Dyeing, tanning and coloring materials 1.9 2.7 7.7 9.6 12.3 12.0 11.8 9.4 11.5 10.6 15.5 17.6 17.0 16.0 22.6Paper and paperboard 8.1 9.9 15.3 25.6 27.6 38.1 32.4 29.2 25.0 37.1 41.4 53.0 60.4 50.3 73.6
INVESTMENTGOODS 70.7 92.6 215.9 350.5 492.5 413.5 556.9 513.3 478A 382.4 376.8 384.9 379.8 333.4 477.5of which:Building materials 19.9 24.0 9.6 23.6 36.9 27.3 26.8 50.0 28.6 33.1 32.4 24.1 32.6 27.5 26.0Transport equipment 12.8 16.4 63.3 103.7 146.5 115.9 265.7 162.6 119.2 92.0 52.0 48.2 44.3 50.8 89.3Machinery and equipment 33.7 45.7 118.4 186.2 254.7 201.5 190.5 223.6 209.7 175.6 208.0 225.5 221.5 174.2 216.1UNCLASSIFIED IMPORTS 7.2 8.4 7.6 8.6 7.1 6.9 4.8 4.9 22.4 142.4 111.7 25.9 37.3 55.2 48.0
TOTAL IMPORTS 334.9 744.8 940.9 1447. 2 ,0s2. 1,.32. 2.015. 1s961 1,868. 1,89. 1.949.1 2055.7 2.233. 1 2.225.6 2.689.
-------------------------------- -PERCENT OF TOTAL IMPORTS- - - - --.-._______ -_._ -__ -___Memorandum Items |A. Consumer Goods 57.2 50.5 38.1 34.7 29.9 26.2 20.5 25.6 23.2 26.4 34.1 36.2 36.9 38.5 36.2B. Intermediate Goods 19.5 36.0 38.1 40.5 45.7 50.9 51.6 47.7 49.9 47.2 40.9 43.8 44.4 44.0 44.3C. Investment Goods 21.1 12.4 22.9 24.2 24.2 22.6 27.6 26.5 25.6 19.2 19.3 18.7 17.0 15.0 17.7D. Food and Drink 46.2 48.0 28.0 21.3 18.9 13.9 8.5 11.8 10.5 10.9 12.4 12.3 14.3 16.4 15.4E. Food. Fertilizer and Petroleum 50.5 68.6 46.1 41.6 46.6 41.8 39.0 37.4 35.3 34.2 26.2 28.8 28.9 29.0 31.4F. Imports other than E 49.5 31.4 53.9 584 53.4 58.2 61.0 62.6 64.7 65.8 73.8 71.2- 71.1 71.0 70.4at Basea on cusioms data and, therore, not incessar iy consis snt nin ba ance of payments data In I ave 3.01.bI ProvionalNote: Due to rounding off, components may not add up to totals.Source: Adjusted Sri Lanka Customs data as reported by the Central Bank of Sri Lanka.
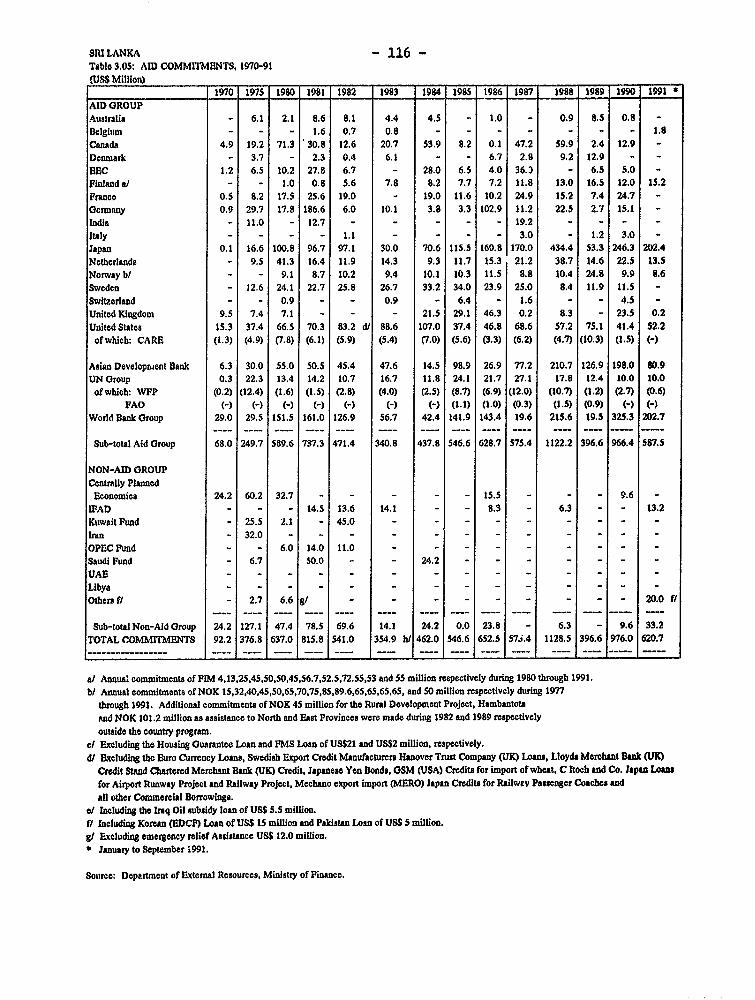
SRI LANKA - 116 -
Table 3.05: AID COMMITMENTS, 1970-91(USS Million)
_______________________ _1970 1975 1980 1981 1982 1983 1984 1985 1986 1987 1988 1989 1990 1991AID GROUPAustralia - 6.1 2.1 8.6 8.1 4.4 4.5 - 1.0 - 0.9 8.5 0.8
Belgium - - - 1.6 0.7 0.8 - - - - - - - 1.8Canada 4.9 19.2 71.3 30.8 12.6 20.7 53.9 8.2 0.1 47.2 59.9 2.4 12.9Denmark - 3.7 - 2.3 0.4 6.1 - - 6.7 2.8 9.2 12.9 _EEC 1.2 6.5 10.2 27.8 6.7 - 28.0 6.5 4.0 36.3 - 6.5 5.0 _Finland a/ - - 1.0 0.8 5.6 7.8 8.2 7.7 7.2 11.8 13.0 16.5 12.0 15.2Franco 0.5 8.2 17.5 25.6 19.0 - 19.0 11.6 10.2 24.9 15.2 7.4 24.7 -
Germany 0.9 29.7 17.8 186.6 6.0 10.1 3.8 3.3 102.9 11.2 22.5 2.7 15.1 -
India - 11.0 - 12.7 - - - - - 19.2 - - - -
Italy - - - - 1.1 - - - 3.0 - 1.2 3.0 -
Japan 0.1 16.6 100.8 96.7 97.1 30.0 70.6 115.5 160.8 170.0 434.4 53.3 246.3 202.4Netherlands - 9.5 41.3 16.4 11.9 14.3 9.3 11.7 15.3 21.2 38.7 14.6 22.5 13.5Norway bl - - 9.1 8.7 10.2 9.4 10.1 10.3 11.5 8.8 10.4 24.8 9.9 8.6Sweden - 12.6 24.1 22.7 25.8 26.7 33.2 34.0 23.9 25.0 8.4 11.9 11.5 -
Switzerland - - 0.9 - - 0.9 - 6.4 - 1.6 - - 4.5 -
United Kingdom 9.5 7.4 7.1 - - - 21.5 29.1 46.3 0.2 8.3 - 23.5 0.2United States 15.3 37.4 66.5 70.3 83.2 d/ 88.6 107.0 37.4 46.8 68.6 57.2 75.1 41.4 52.2of which: CARE (1.3) (4.9) (7.8) (6.1) (5.9) (5.4) (7.0) (5.6) (3.3) (6.2) (4.7) (10.3) (1.5) (-)
Asian Developnment Bank 6.3 30.0 55.0 50.5 45.4 47.6 14.5 98.9 26.9 77.2 210.7 126.9 198.0 80.9UN Group 0.3 22.3 13.4 14.2 10.7 16.7 11.8 24.1 21.7 27.1 17.8 12.4 10.0 10.0of wbich: WFP (0.2) (12.4) (1.6) (1.5) (2.8) (4.0) (2.5) (8.7) (6.9) (12.0) (10.7) (1.2) (2.7) (0.6)
PAO (-) (-) (-) ) (-) (-) (-) (I. 1) (1.0) (0.3) (I 5' (0 9) (-) (-)World Bank Oroup 29.0 29.5 151.5 161.0 126.9 56.7 42.4 141.9 143.4 19.6 215.6 19.5 325.3 202.7
Sub-total Aid Group 68.0 249.7 589.6 737.3 471.4 340.8 437.8 546.6 628.7 575.4 1122.2 396.6 966.4 587.5
NON-AID GROUPCentrally PlanoedEconomics 24.2 60.2 32.7 - - - - - 15.5 - - - 9.6 -
IFAD - - - 14.5 13.6 14.1 - - 8.3 - 6.3 - - 13.2Kuwait Fund - 25.5 2.1 - 45.0 - - - - - - - - -Iran - 32.0 - - - - - - - - - _ -
OPEC Fund - - 6.0 14.0 11.0 - - - - - - - - -
Saudi Fund - 6.7 50.0 - - 24.2 - - - - - - -
UAE - - - - - - - - - - - -_ - -Libya - - - - - - - - - - - - - -Othera f/ - 2.7 6.6 g/ - - - - - - - - - 20.0 f/
Sub-total Non-Aid Group 24.2 127.1 47.4 78.5 69.6 14.1 24.2 0.0 23.8 - 6.3 - 9.6 33.2TOTAL COMMITMENTS 92.2 376.8 637.0 815.8 541.0 354.9 hl 462.0 546.6 652.5 57j.4 1128.5 396.6 976.0 620.7
a/ Anual commitments of VIM 4,13,25,45,50,50,45,56.7,52.5,72.55,53 and 55 million respectively during 1980 through 1991.b/ Annual commitments of NOK 15,32,40,45,50,65,70,75,85,89.6,65,65,65,65, and 50 million respectively during 1977
through 1991. Additional commitments of NOK 45 million for the Rural Development Project, Hambantotaand NOK 101.2 million as assistance to North and East Provinces were made during 1982 and 1989 respectivelyoutside the country program.
cl Excluding the Housing Guarantee Loan and FMS Loan of US$21 and US$2 million, respectively.dl Excluding the Euro CurrDeCy Loans, Swedisb Export Credit Manufacturers Hanover Trst Company (UK) Los, Lloyda Merchant Bank (UK)
Credit Stand Chartered Merchant Bank (UK) Credit, Japanese Yen Bonds, OSM (USA) Credits for import of wheat, C Itoeb and Co. Japan Loanfor Airport Runway Project and Railway Project, Mchano export import (MERO) Japan Credits for Railwtv Passenger Coaches andall other Commercial Borrowings.
el Including the Iraq Oil subsidy loan of US$ 5.5 million.f/ Including Korean (EDCF) Loan of US$ 15 million and Palistan Loan of US$ 5 million.gS Excluding emegiency relief Assistance US$ 12.0 million.* January to September 1991.
Source: Dopartment of Extemal Resources, Ministry of Finance.
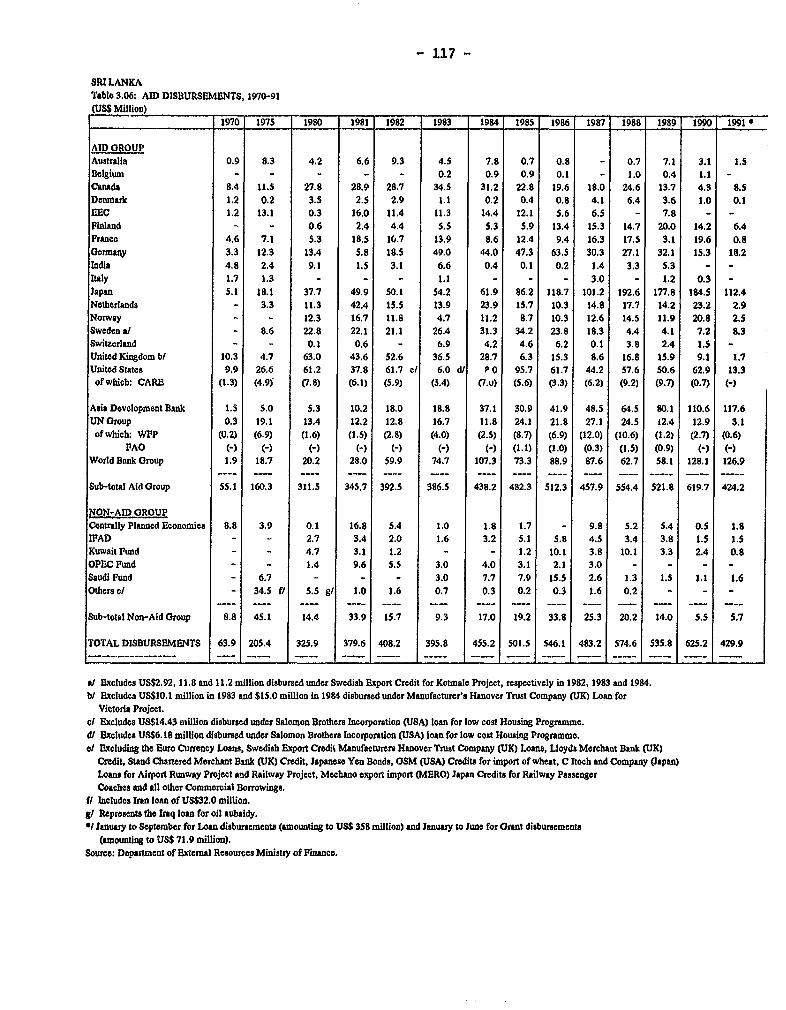
- 117 -
SRI LANKATablo 3.06: AID DISBURSEMENTS, 1970-91(USS Million)
1970 1975 1980 198I 1982 1983 1984 1985 1986 1987 1988 1989 1990 1991 *
AID GROUPAustralia 0.9 8.3 4.2 6.6 9.3 4.5 7.8 0.7 0.8 - 0.7 7.1 3.1 1.5Bolgium _- - - - 0.2 0.9 0.9 0.1 - 1.0 0.4 1.1 -Canada 8.4 11.5 27.8 28.9 28.7 34.5 31.2 22.8 19.6 18.0 24.6 13.7 4.3 8.5Denmark 1.2 0.2 3.5 2.5 2.9 1.1 0.2 0.4 0.8 4.1 6.4 3.6 1.0 0.1EEC 1.2 13.1 0.3 16.0 11.4 11.3 14.4 12.1 5.6 6.5 - 7.8 - -
Pinland _ - 0.6 2.4 4.4 5.5 5.3 5.9 13.4 15.3 14.7 20.0 14.2 6.4France 4.6 7.1 5.3 18.5 10.7 13.9 8.6 12.4 9.4 16.3 17.5 3.1 19.6 0.8Germany 3.3 12.3 13.4 5.8 18.5 49.0 44.0 47.3 63.5 30.3 27.1 32.1 15.3 18.2India 4.8 2.4 9.1 1.5 3.1 6.6 0.4 0.1 0.2 1.4 3.3 5.3 - -
Italy 1.7 1.3 - - - 1.1 - - - 3.0 - 1.2 0.3 -
Japan 5.1 18.1 37.7 49.9 50.1 54.2 61.9 86.2 118.7 101.2 192.6 177.8 184.5 112.4Netherlands - 3.3 11.3 42.4 15.5 13.9 23.9 15.7 10.3 14.8 17.7 14.2 23.2 2.9Norway - - 12.3 16.7 11.8 4.7 11.2 8.7 10.3 12.6 14.5 11.9 20.8 2.5Sweden / - 8.6 22.8 22.1 21.1 26.4 31.3 34.2 23.8 18.3 4.4 4.1 7.2 8.3Switzorland _ - 0.1 0.6 - 6.9 4.2 4.6 6.2 0.1 3.8 2.4 1.5 -
United Kingdom bl 10.3 4.7 63.0 43.6 52.6 36.5 28.7 6.3 15.3 8.6 16.8 15.9 9.1 1.7United States 9.9 26.6 61.2 37.8 61.7 c/ 6.0 dl P O 95.7 61.7 44.2 57.6 50.6 62.9 13.3of which: CARE (1.3) (4.9) (7.8) (6.1) (5.9) (3.4) (7.u) (5.6) (3.3) (6.2) (9.2) (9.7) (07) (-)
Asia Dovelopment Bank 1.5 5.0 5.3 10.2 18.0 18.8 37.1 30.9 41.9 48.5 64.5 80.1 110.6 117.6UN Group 0.3 19.1 13.4 12.2 12.8 16.7 11.8 24.1 21.8 27.1 24.5 i2.4 12.9 3.1of which: WPP (0.2) (6.9) (1.6) (1.5) (2.8) (4.0) (2.5) (8.7) (6.9) (12.0) (10.6) (1.2) (2.7) (0.6)
PAO (_) (- H_ (-) H_ (- (-) (I. .1) (l .0) (0.3) (I .5) (0.9) (-) (-)World Bank Group 1.9 18.7 20.2 28.0 59.9 74.7 107.3 73.3 88.9 87.6 62.7 58.1 128.1 126.9
Sub-total Aid Group 55.1 160.3 311.5 345.7 392.5 386.5 438.2 482.3 512.3 457.9 554.4 521.8 619.7 424.2
NON-AID GROUPCentrally Planned Economies 8.8 3.9 0.1 16.8 5.4 1.0 1.8 1.7 - 9.8 5.2 5.4 0.5 1.8IPAD _ - 2.7 3.4 2.0 1.6 3.2 5.1 5.8 4.5 3.4 3.8 1.5 1.5Kuwait Fund - - 4.7 3.1 1.2 - - 1.2 10.1 3.8 10.1 3.3 2.4 0.8OPEC Fund - - 1.4 9.6 5.5 3.0 4.0 3.1 2.1 3.0 - - - -Saudi Fund - 6.7 - - - 3.0 7.7 7.9 15.5 2.6 1.3 1.5 1.1 1.6Othore cl - 34.5 f/ 5.5 g/ 1.0 1.6 0.7 0.3 0.2 0.3 1.6 0.2 - - -
Sub-total Non-Aid Group 8.8 45.1 14.4 33.9 15.7 9.3 17.0 19.2 33.8 25.3 20.2 14.0 5.5 5.7
TOTAL DISBURSEMENTS 63.9 205.4 325.9 379.6 408.2 395.8 455.2 501.5 546.1 483.2 574.6 535.8 625.2 429.9
a/ Excludes US$2.92, 11.8 and 11.2 million disbursed under Swedish Export Credit for Kotmale Project, respectively in 1982, 1983 and 1984.b/ Excludes US$10.1 million in 1983 and $15.0 million in 1984 disbursed under Manufacturer's Hanover Trust Company (UK) Loan for
Victoria Project.c/ Excludes US$14.43 million disbursed under Salomon Brothers Incorporation (USA) loan for low cost Housing Programme.d/ Excludes US$6.18 million disbursed under Salomon Brothers Incorporation (USA) loan for low cost Housing Programme.e/ Excluding the Euro Currency Loans, Swedish Export Credii Manufacturers Hanover Trust Company (UK) Loans, Lloyds Merchant BJmk (UK)
Credit, Stand Chartered Merchant Bank (UK) Credit, Japanese Yen Bonds, OSM (USA) Credits for import of wheat, C Itoch and Company (Japan)Loan for Airpost Runway Project sad Railway Project, Mechano export import (MERO) Japan Credits for Railway PassengerCoaches and all other Commercial Borrowings.
f/ Includos Iran loan of US$32.0 million.g/ Reprosents the Iraq loan for oil *ubsidy.4/ January to September for Loan disbursements (amounting to US$ 358 million) and Januasy to June for Crant disburements
(amounting to US$ 71.9 million).Source: Depaent of External Resources Ministry of Finance.
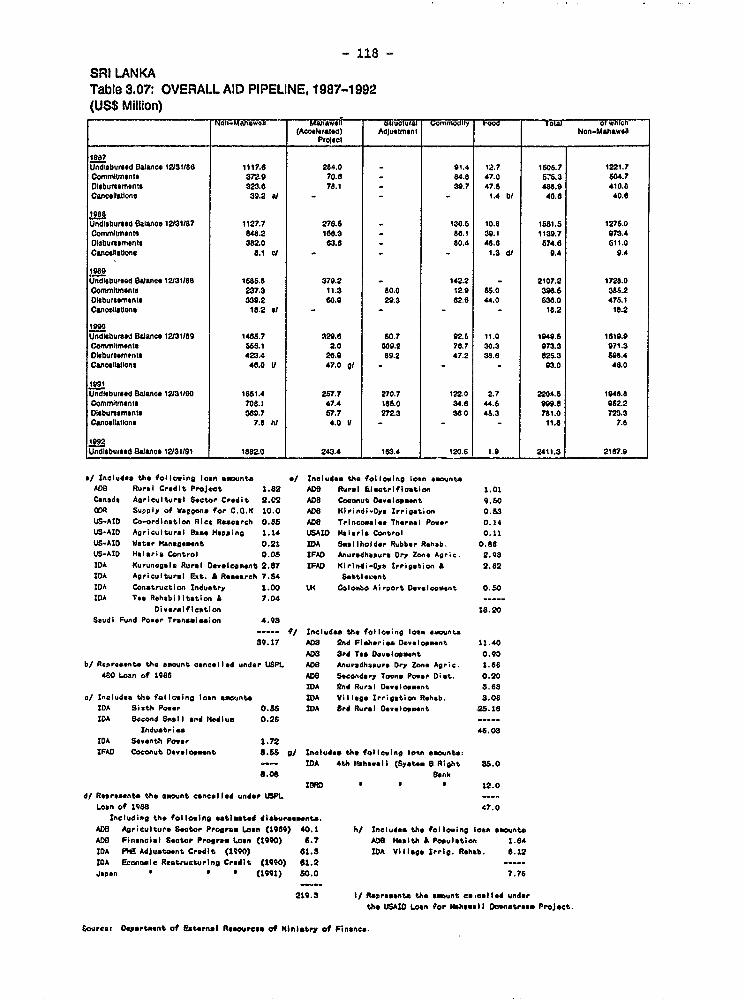
- 118 -
SRI LANKATable 3.07: OVERALL AID PIPELINE, 1987-1992(US$ Million)
-Wonn-mahawoli Mallawell ufuclura. 5 Foo Iou ot v n cn(Acoeheralad) Adjutrnent Non-Milhawell
Project
198? Undl,bureed alancs* l231186 1117.6 284.0 - 91.4 12.7 1606.7 1221.7Commitments 3729 70.6 - 84.6 47.0 676.3 604.7Disburtements =23.o 78.1 - 39.7 47.5 4.88.9 410.6Cancellations 39.2 l _ _ _ 1.4 bi 40.6 40.6
1988Undsblijted Balance 12131187 1127.7 276.6 . 130.5 10.8 1651.5 1276.0Commiliments 848.2 188.3 - 88.1 39.1 1139.7 973.4Disbulrgmnient 3azo .0.8 - 80.4 48.0 6 74.8 611.0Cancilallone t.1 cl i _ 1.3 dl 9.4 9.4
1989Undlebu oCd Balance 12V31188 1686.8 379.2 142.2 - 2107.2 1728.0Committctnle 237.3 11.3 80.0 12.9 66.0 396.6 385.2Dlaburarontl 339.2 60.9 29.3 62.6 44.0 838.0 476.1Canoellstone 18.2 51 _ _ _ _ 16.2 18.2
Undiebursed Balanc 12131189 1485.7 329.6 50.7 92.6 11.0 1949.5 1619.9Comitmentse 568.1 ZO 3809.2 76.7 30.3 973.3 971.3Dlebureements 423.4 26.9 89.2 47.2 38.8 826.3 5S9.4Gtnollelatons 4.0 0U 47.0 gii - - 93.0 48.0
199-1Undlebu,aed Balanes 12/31/90 1651.4 257.7 270.7 122.0 2.7 2204.6 1948.8Commitments 708.1 47.4 165.0 34.8 44.6 96.6 952.2Disbursement 389.7 67.7 272.3 3e 0 46.3 781.0 723.3Cancellatlons 7.8 hi 4.0 VI - - 11.8 7.8
Undlsbursed B3aancs 12131/91 _ 18dZO 243.4 163.4 120.8 5 9 2411.3 2187.9
n/ Includes the following loan *munt- .1 Include. the following loan *mo.ntoADS Rural Credit. ProJect 1.82 ADO Rural Electrification 1.01Ceneds Agricultural Sector Credit 2.02 ADO Coconut Dve,loee.nt 9.60
CDR SupPly of WV gon. for C.O K 10.0 ADO KWrindi-Oya Irrigation 0.53
1S5-AID Co-ordination Rice Research 0.55 ADS Trincomalee Thermal Power 0.14US-AID Agricultural Bane Mapping 1.14 VSAID HMlaria Control 0.11US-AID Water Management 0.21 MDA Seallholder Rubber Rehab. 0.86US-AID Malaria Control 0. 05 IFAD Anuradhapura Dry Zone Aor;c. 2.93
IDA Kurunegala Rural Develoseant 2.87 IFAD Kirlndi-Oya Irrigation A 2.62IDA Agricultural Ext. A Research 7.54 S6ttleuentIDA Conatruction Industry 1.00 UK Colovbo Airport Denelooment 0. SOIDA Tog Rehabilitetion A 7.04 -----
Diversificatlon 18.20Ssudi Fund Power Trantaielon 4.93
---- 4/ Includes tsh following loan emunt.39.17 ADS 2nd Fiheries Developmnt 11.40
ADS 3rd Tea Develoestnt 0.90b/ Rapreeents .he snount concel led under UEPL ADO Anuradhapura Dry Zone Agr;c. 1.66
480 Loan of 1986 ADO Secondry Towne Power Dist. 0.20IDA 2nd Rural Development 38.3
c/ Includes the following loan amounts IDA Village Irrigation Rehab. 3.08IDA Sixth Power 0.55 IDA Zrd Rural Development 2!.i18IDA Second Small and Medius 0.26 -----
Industries 46.03IDA Seventh Power 1.72IFAD Coconut Development 8.66 g/ Includes the following lokn 11ountse
.--- IDA 4th Mahewall (System 8 Right 36.08.08 Bank
Iow a a a 12.0
d/ Represents the amount cancelled under USPL ----Loan of 1938 47.0
Including the following estimated dlibursements.ADS Agriculture Sector Program Loan (1969) 40.1 h/ Includes the following loon amountsADD Financial Sector Progrem Loan (1090) 6.7 AD8 sealth £ Population 1.64IDA PHE Adjustment Credit (1990) 61.3 IDA Village Irrlg. Rehab. 6.12
IoA Econosie Restructuring Credit (1990) 61.2 -----Japan a e (1991) 80.0 7.76
219.3 1/ Represents the amunt ca celled underthe USAID Loon for Mahewal Ionstream Project.
Source: Department oa Evternal Rcaources of Ministry ot Finance.
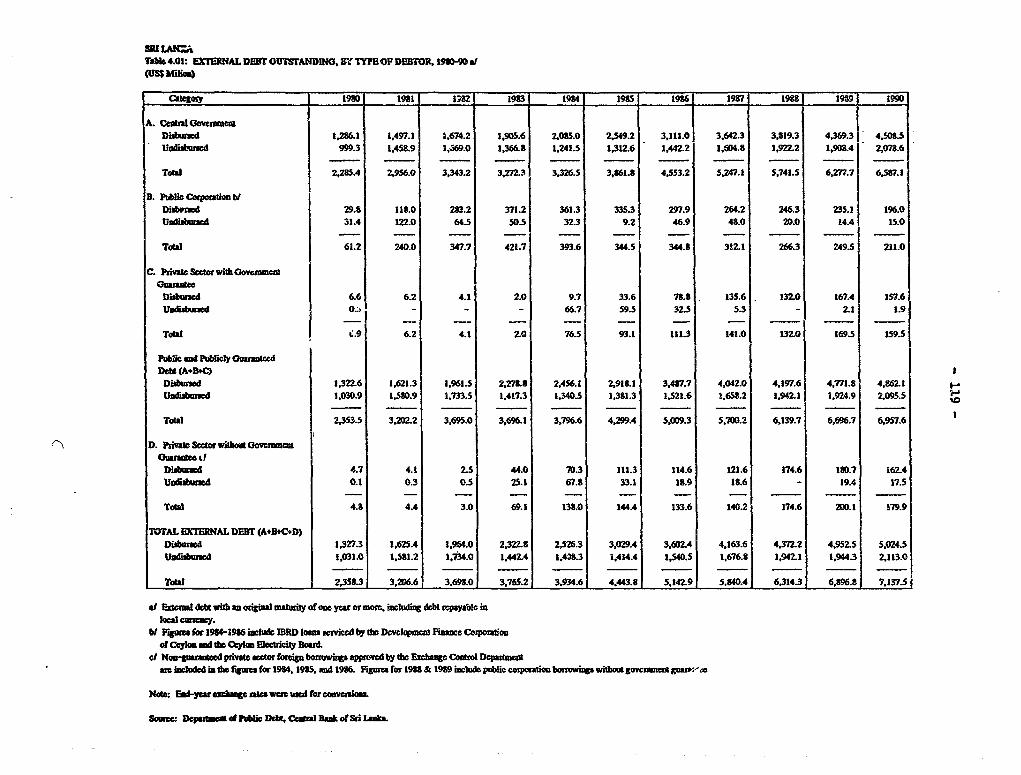
Tak 4.01: EXTERNAL DEIrU SiM4DINo, BY TYPEOF DEBFOR, 190-90 a(Ussbftim
--ate-Y 190 1921 W 2 1923 1984 19S5 196 19S7 19S8 1929 1990
A. Ccalkowiena Diabuzed 1,286.1 1,497.1 1,674.2 1,905.6 2,025.0 2,549.2 3,111.0 3,642.3 3,S19.3 4,369.3 -4,S SUni1irad 999.3 1,45&9 ,6569.0 1_366.8 1,241.5 1,312.6 1,442.2 1,04.8 1,922.2 1,90.4 2,072.6
Totl 2,285.4 2,956.0 3,343.2 3,2.3 3,326.5 3,261.S 4,553.2 5247.1 5,741.5 6,27.7 6,57.1
B. PtMbc Coption btDi*vred 29.8 118.0 223.2 371.2 361.3 335.3 297.9 264.2 246.3 235.1 196.0UaDlMred 31.4 122.0 64.5 50.5 32.3 9.2 46.9 48.0 20.0 14.4 15.0
TOtW 61.2 240.0 347.7 421.7 393.6 344.5 344.8 312.1 266.3 249.5 211.0
C. Pivalt Scor with GovesueniGumoec
Disbumd 6.6 6.2 4.1 2.0 9.7 33.6 78.8 135.6 132.0 167.4 157.6U.disbuad 0.:, - - - 66.7 59.5 32.5 5.3 - 2.1 1.9
TOd C.9 6.2 4.1 2.0 76.5 93.1 111.3 141.0 132.0 169.5 159.5
Publi and Publicly GuaranteedDcli (&+B.C
Disbumwd 1,322.6 1,621.3 1,961.5 227.8 2.456.1 2,918.1 3,487.7 4,042.0 4,197.6 4,771.8 4,86.Uudiabu d 1,030.9 1,520.9 1,733.5 1,417.3 1,340.5 1,321.3 1,521.6 1,658.2 1,942.1 1,924.9 2,095.5
Tdal 2,353.5 3,202.2 3,695.0 3,6961 3,796.6 4,299.4 5,OD9.3 5,70.2 6,139.7 6,696.7 6,957.6
D. Ptivate Scctor wilbwo oCammiatGuanxS lr
Dibuaed 4.7 4.1 2.5 44.0 70.3 111.3 114.6 121.6 174.6 1I0.7 162.4Undiahuld 0.1 0.3 0.5 25.1 67.8 33.1 18.9 18.6 - 19.4 17.5
TOal 4.8 4.4 3.0 69.1 13S.0 144.4 133.6 140.2 174.6 200.1 179.9
T3TAL EXTERNAL DEBT (A+B*CeD)Diabued 1,327.3 1,625.4 1,964.0 2,322.S 2,S6.3 3,029.4 3,602.4 4,163.6 4,372.2 4,952.5 5,024.5Undiabwacd 1,031.0 1,5S1.2 1,734.0 1,442.4 1,403.3 1,414.4 1,40.5 1,676.8 1,942.1 1,944.3 2,113.0
Toal 2,35J3 3,206.6 3,692.0 3,765.2 3,934.6 4,443.8 5.142.9 5,840.4 6,314.3 6,896.81 7.137.5
d Ezxml debt wit u oiinal mturty of am yer or more, including dbt vpayable inhel cuqcty.
bt Figu for 1984-986 iclude IBRD loam saeiced by tdo Dcvelomcnl Fnac Ceorpoinof Ceylo and the Cyl Eblticit Bard.
cd NowTuanratod pitvat setor foig borigs appWr by th Exdrne Cotrol Dqatenta ied isl tbc fi for 19S4, 39t5, and 19S6. Fr. forI 9 & 199 ilud publie corpoati owingswinlmugownrct dguazr,-e
Note E s- ar )c rccaweuadforceveraoas
Som:ee Dqaze of M&c Debt, Co"al B of Sri 1Ib.
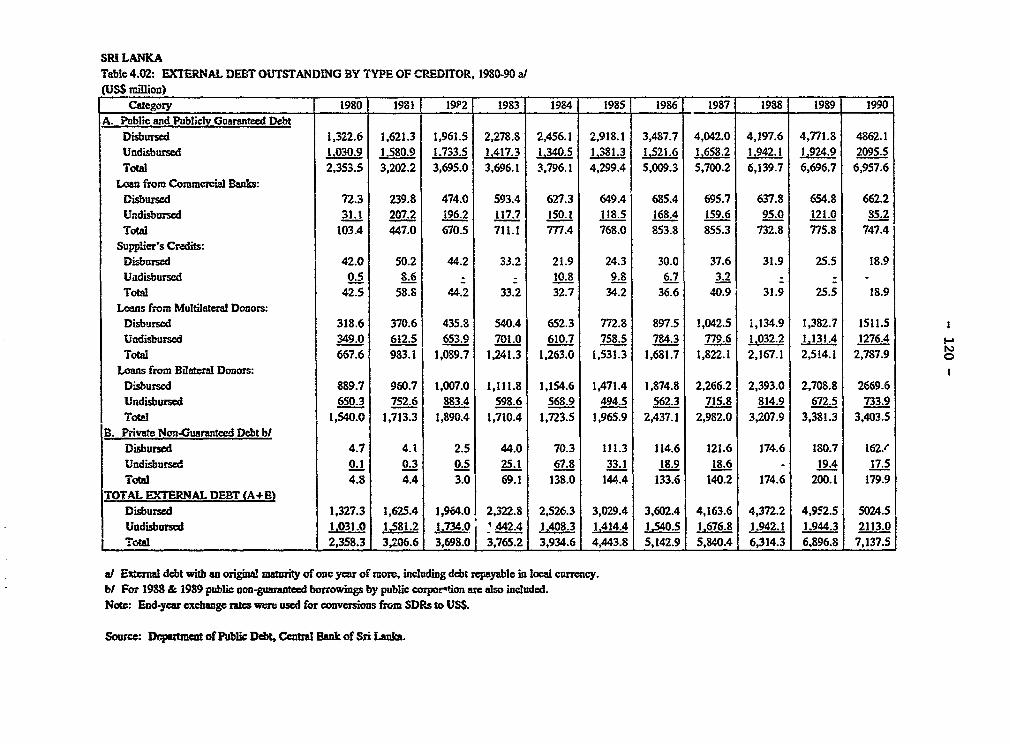
SRI LANKATable 4.02: EXTERNAL DEBT OUTSTANDING BY TYPE OF CREDITOR, 1980-90 al(USS mlion)
Category 1980 1981 19P2| 1983 [ 1984 1985 1986 1987 1988 1989 1990A. Public and Publicly Guaranteed Debt I
Disbursed 1,322.6 1,621.3 1,961.5 2,278.8 2,456.1 2,918.1 3,487.7 4,042.0 4,197.6 4,771.8 4862.1Undisbursed 1,030.9 1.580.9 1.733.5 A17.3 1 .340.5 1.381.3 1,521.6 1,658.2 942.1 1,924.9 2095.5Total 2,353.5 3,202.2 3,695.0 3,696.1 3,796.1 4,299.4 5,009.3 5,700.2 6,139.7 6,696.7 6,957.6Loan from Commercial Banks:
Disbursed 72.3 239.8 474.0 593.4 627.3 649.4 685.4 695.7 637.8 654.8 662.2Undisbursed 31.1 207.2 196.2 117.7 150.1 118.5 168.4 159.6 95.0 121.0 85.2Total 1034 447.0 670.5 711.1 777.4 768.0 853.8 855.3 732.8 775.8 747.4
Supplier's Credits:Disbursed 42.0 50.2 44.2 33.2 21.9 24.3 30.0 37.6 31.9 25.5 18.9Undisbursed 0.5 8.6 - - 10.8 9.8 6.7 3.2 -Total 42.5 58.S 44.2 33.2 32.7 34.2 36.6 40.9 31.9 25.5 18.9
Loans from Multilaterd Donors:Disbursed 318.6 370.6 435.8 540.4 652.3 772.8 897.5 1,042.5 1,134.9 1,382.7 1511.5Undisbursed 349.0 612.5 653.9 701.0 610.7 758.5 784.3 779.6 1,032.2 .131.4 1276.4 Total 667.6 983.1 1,039.7 1,241.3 1,263.0 1,531.3 1,681.7 1,822.1 2,167.1 2,514.1 2,787.9
Loans from Bilecral Donors:Disbursed 889.7 960.7 1,007.0 1,111.8 1,154.6 1,471.4 1,874.8 2,266.2 2,393.0 2,708.8 2669.6Undisburscd 650.3 752.6 883.4 598.6 568.9 494.5 562.3 715.8 814.9 672.5 733.9Tbotal 1,540.0 1,713.3 1,890.4 1,710.4 1,723.5 1,965.9 2,437.1 2,982.0 3,207.9 3,381.3 3,403.5
B. Private Non-Guaranteed Debt blDisbursed 4.7 4.1 2.5 44.0 70.3 111.3 114.6 121.6 174.6 180.7 162./Undisbursed 0.1 0.3 0.5 25.1 67.8 33.1 18.9 18.6 - 19.4 17.5Total 4.8 4.4 3.0 69.1 138.0 144.4 133.6 140.2 174.6 200.1 179.9
TOTAL EXTERNAL DEBT (A+E)Disbursed 1,327.3 1,625.4 1,964.0 2,322.8 2,526.3 3,029.4 3,602.4 4,163.6 4,372.2 4,952.5 5024.5Undisbursed 1,031.0 1,581.2 1730j 1.442.4 1403 1.4144 1.540.5 1,676.8 1,942.1 944.3 2113.0Totl 2,358.3 3,206.6 3,698.0 3,765.2 3,934.6 4,443.8 5,142.9 5,840.4 6,314.3 6,896.8 7,137.5
at External debt with an origina! maurity of one year of more, including debt repayable in local currency.bW For 1988 & 1989 public non-guanteed borrowings by public corpor-tion are also included.Note: End-year exchangc ratcs were used for conversions from SDRs to USS.
Source: Depbrmnt of Public Debt, Ccntr Bank of Sri iLana.
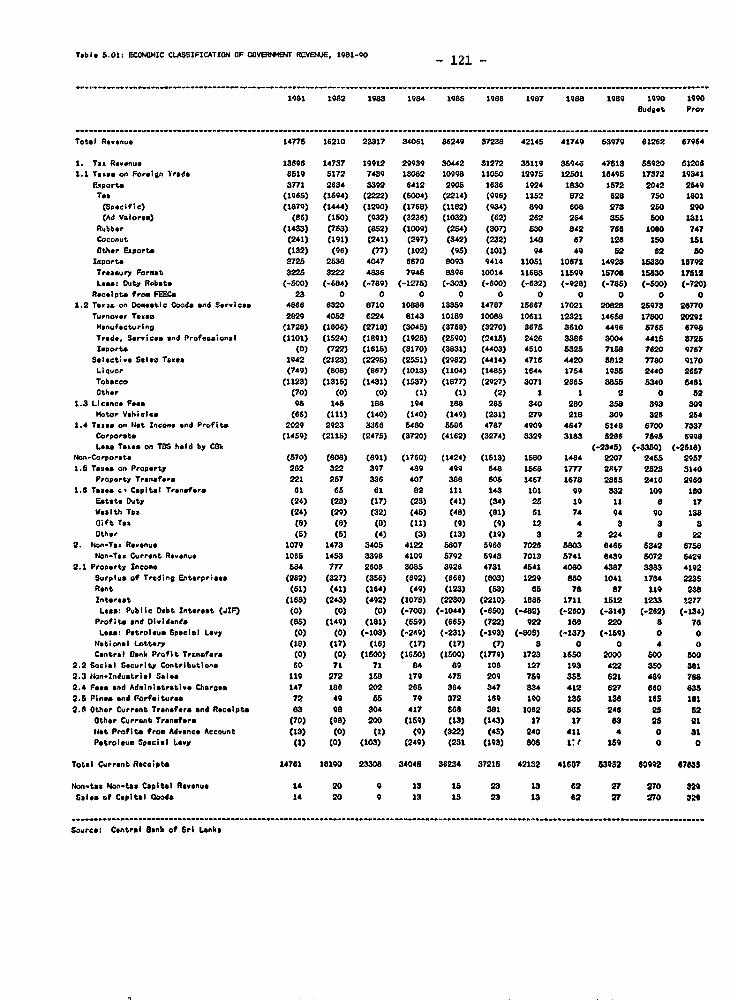
Table 5.01: ECONONIC CLASSIFICATION OF GOViERNMET RCVNUJE, 1981-90 - 121 -
... .... ....... ... ---- -------- -------- -------- -------- -------- -------- -------- -------- -------- -------- -------- -------- -------
1981 1982 1983 1984 1986 1986 1987 1988 1989 1990 1990
8udgat Prov
Total Aetenue 14775 16210 23317 34061 36249 87238 42146 41749 83979 81262 67964
1. Tat Revenue 13806 14737 19912 29939 30442 31272 35119 35948 47513 55920 612061.1 Taxe. en loraion Trade 6519 5172 7439 13062 10998 11050 12975 12501 16495 17372 19341
Sxport. 3771 2634 3392 6412 2905 1636 1024 l630 1572 2042 2549Too (1965) (1594) (2222) (5004) (2214) (096) 1152 872 628 750 1601
(Specific) (1879) (1444) (1290) (1768) (1182) (934) 890 608 273 250 290(Ad Valorgm) (86) (150) (932) (3236) (1032) (62) 262 264 355 00 1311
Rubber (1433) (753) (652) (1009) (254) (307) 830 842 766 lO0O 747Coconut (241) (191) (241) (297) (342) (232) 148 67 126 1SO 151Other Euporte (132) (96) (77) (102) (95) (lO1) 94 49 52 62 60
Imports 2725 2538 4047 6670 8093 9414 11051 10871 14923 15330 t6792Treasury Foermt 3225 3222 4836 7945 8396 10014 11683 11599 15706 15830 17512Less: Duty Robot* (-600) (-684) (-789) (-1278) (-303) (-600) (-632) (-928) (-785) (-600) (-720)
R.ceipto from FEECe 23 0 0 0 0 0 0 0 0 0 01.2 TatuL on o etic Coods and Service. 4866 8320 8710 108I8 13359 14787 15667 17021 20828 26973 2t770
Turnover TsBaO 2829 4052 6224 8143 10189 10083 10611 12321 14658 17800 20291Manufacturing (1728) (1506) (2718) (3045) (3768) (3270) 3875 3610 4496 5765 6798Trade. Services and Profess6;onal (1101) (1524) (1891) (1928) (2590) (2415) 2426 3386 3004 4415 3725Imports (0) (722) (1615) (3170) (3831) (4403) 4510 S325 7158 7620 9767
Selective Selso Taxte 1942 (2323) (2296) (2551) (2982) (4414) 4716 4420 5812 7760 9170Liquor (749) (808) (867) (1013) (1104) (1485) 1644 1754 1955 2440 2657Tobacco (1123) (1316) (1431) (1837) (1877) (2927) 3071 2665 3855 5340 481
Other (70) (0) (0) (1) (1) (2) 1 1 2 0 52
1.3 Licence Fe.c 95 146 18 194 188 285 340 280 358 393 309Motor Vehicle. (66) (111) (140) (140) (149) (231) 279 218 309 326 254
1.4 Taxes on Not Income and Profit. 2029 2923 3366 8480 5806 4787 4909 4647 5148 6700 7337Corporate (1459) (2115) (2475) (3720) (4162) (3274) 3329 3183 5286 7595 6998Le" Taxea on TBS held by COk (-2345) (-3350) (-2518)
Non-Corporate (570) (808) (891) (1760) (1424) (1513) 1580 1464 2207 2455 29571.5 Toate on Property 282 322 307 489 499 643 1568 1777 2Rv7 2526 3140
Property Transfer. 221 257 336 407 338 505 1467 1678 2365 2410 29601.6 Toee. c Capital Tranefore a1 65 61 82 111 143 101 99 332 109 16O
Eetate Duty (24) (23) (17) (23) (41) (34) 25 19 11 8 17Wealth Tat (24) (29) (32) (45) (48) (81) 61 74 94 90 188Gift Tr (8) (8) (a) (11) (9) (9) 12 4 J 3 3Other (5) (5) (4) (3) (13) (19) 3 2 224 8 22
2. Non-Tax Revenue 1079 1473 3405 4122 5807 5968 7026 5803 6466 5342 8758Non-Tex Current Revenue 1065 1453 3396 4100 5792 5943 7013 8741 6439 5072 6429
2.1 Property Income 84 7m 2606 3085 3926 4731 4541 4080 4387 3383 4192
Surplus of Trading Enterprieas (262) (327) (356) (692) (666) (803) 1229 805 1041 1784 2235Rent (51) (41) (164) (49) (123) (53) 65 78 67 119 238Intereat (l83) (243) (492) (1076) (2230) (2210) 1888 1711 1512 1233 1277Le": Public Oebt Interest (JIF) (0) (0) (0) (-708) (-1044) (-680) (-432) (-260) (-314) (.262) (-134)
Profits and Dividends (85) (149) (181) (859) (665) (722) 922 168 220 a 76Les Petroleum Special Levy (0) (0) (-103) (-249) (-231) (-193) (-SO5) (o137) (-159) 0 0
National Lottery (18) (17) (16) (17) (17) (7) 3 0 0 4 0Central Bank Profit Trensfera (0) (0) (1500) (1650) (1500) (1779) 1723 1650 2000 800 SOO
2.2 Social Security Contribution. 60 71 71 84 89 108 127 193 422 350 3812.3 Non-Induatrlel Sales 119 272 158 179 475 209 759 35s 621 480 7682.4 Fees and Adainistrativ. Chargse 147 188 202 265 364 347 334 412 627 660 83S
2.5 Fines and Forfeitures 72 49 55 79 372 169 1oo 138 138 165 1612.6 Other Current Transfers and Receipts 63 O8 304 417 586 3S1 1062 5W5 246 25 62
Other Current Transfer. (70) (98) 200 (159) (13) (143) 17 17 83 26 21Net Profitsf *r Advance Account (13) (0) (1) (t) (322) (45) 240 411 4 0 31
Petroloum Special LAvy (1) (0) (103) (249) (231 (193) 8065 * 159 0 0
Total Cuprent Rce;ipts 14761 16190 23308 34048 36234 37215 42132 41607 83982 60992 87835
Non-tat Non-tae Capital Rovenue 14 20 0 13 15 23 13 62 27 270 320Sales of Capitol Cooed 14 20 9 13 i5 23 13 82 27 270 329
Soarce: Central eank of Sri Lanka
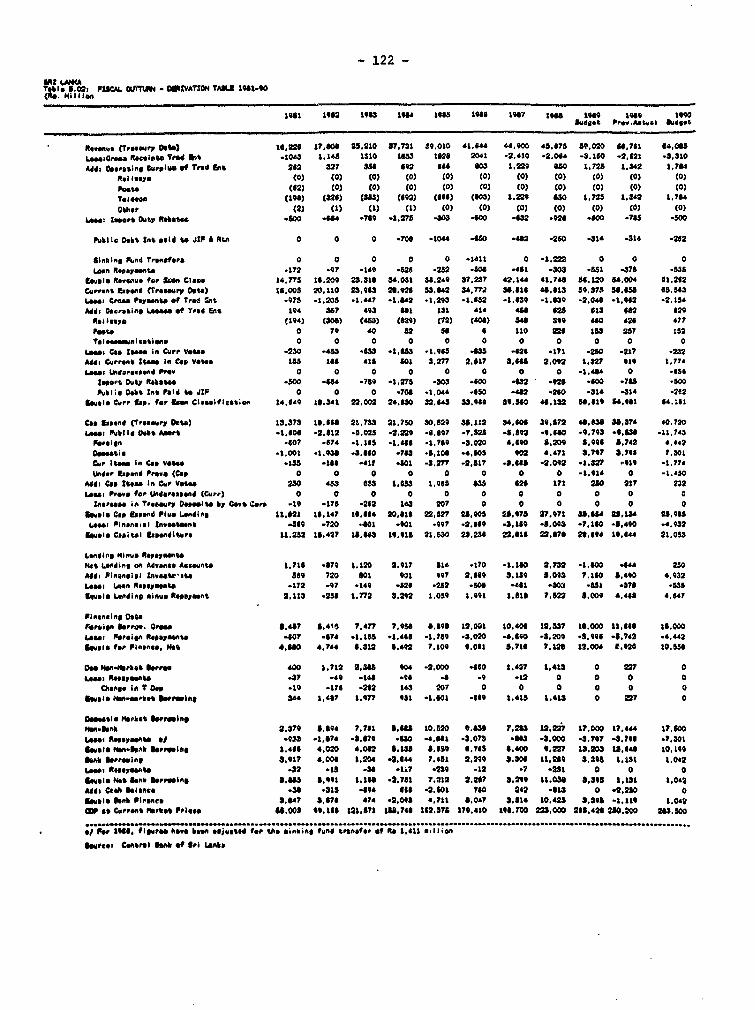
- 122 -
o 8.02: PISC. 0U - D0IVATION TAL 1911-90(Re. Million
198 1962 1083 196A 108 198 1047 19t 1969 1969 1990budget P.ew..Ast.91 budol.
A.n..s, (TCenen"r Cole) 16.226 17,8011 2 .210 87,731 39.010 1.644 "6,O0 434.75 59,020 66,761 6,0o5L Aeca9 Recit Tr" W% .1065 1.14 1510 55 16o" 2061 .2.410 .2.0U6 -3.160 -2,S21 3.3.10
Adds oeo^s; n6 wSuplus of Trod 14b. 262 327 3ss 692 *66 603 1.229 65 .72 1.3,2 1.764Rsm l.uy (0) (0) (0) (0) (0) (0) (0) (0) (0) (0) (0)pasto (62) (0) (0) (0) (0) (a) (0) (0) (0) (0) (0)Telecoe (196) (326 (3S3) (602) (668) (603) 1.229 6o 1.725 1.342 1,784other (2) (1) (1) (1) (0) (0) (0) (0) (0) (0) (0)
Le.: Lep,e* Duty Rebates .500 x 6 o79 -1.V * 40-27 0 00 2 92 .80 .75 -500
PubiIa Otis 2In% toId w JIs Rtn 0 0 0 -708 -1064 -65o 2 -250 .314 .316 -282
SInki.s F nnd ?,oteft'a 0 0 0 0 0 -1611 0 -1.= 0 o OLash R.oaymonto 172 .97 -169 .526 -252 so6 .461 -303 .551 -578 -535
Biuemi A8.,go top 0ten Cl... 16.7"7 16.209 23.316 34.051 38.269 37,237 42. 44 41. 748 ".120 54.004 $1.262Current expend (Tr.r.n. Os") 16.005 20.110 23.963 26.926 35.842 34,772 3s816 46,613 59.575 5.6 S65,584 314.. Ore" PI'gonso 4. Trod Ent -.75 -1.203 -1."?7 .1,62 .1.293 *1.852 .1.639 -1.639 .2,046 .1,.92 .2.156Adds Operating L.... et ?re. d 11 194 3S7 493 "I 131 614 66 625 613 142 629
R84 fly* (194) (302) (45) (29) (72) (40) 36 399 60 626 677
fote 0 79 d0 52 56 I 110 22 153 257 152Telecmmuications 0 0 0 0 0 0 0 0 0 0 0
Le1. Ca# 1Z. in CUPP V ot .230 -4.3 .a -3.. .1.965 -85 -626 .171 -250 -217 -232A"d Cunr,nt tt4 In Cap V444. 153 16U *15 501 3,277 2.517 3.6" 2.0M2 1,327 1 1.776Lae.6idU,.rownd PPrY 0 0 0 0 0 0 0 0 -.. 486 0 .656
teant Duty Re41W .5-0 664 .769 -1.275 -J30 .00 -62 *n26 .600 .7681 *5Pwbl;. 06b. Zre PaId to JdI 0 0 0 -708 .1.044 6O5 42 -260 -364 .316 -262
ftiwal Cute 6s.. for gee. CIa";ificw%ben 6.9 14.361 22,0D2 24.60 32.6J3 33,988 3S.560 44 132 6,619 66,961 646.61
CS. lasend (Treasry Dowe) 13,373 16.618 2. 733 21,750 30.529 35.112 34,606 39,572 6.636 56.374 *0.7201a44t Putllg hCob A_r s1.r08 -2,612 -3.023 -2,229 -. 097 -7,52 -5.692 9.640 U 9.,793 .9.358 .11,745
FPart i -607 .676 -1.15 -1 ,646 -1.769 -3.020 4,690 8.209 8.996 8.742 6.442Oee.441 -1.001 -1.938 2. 160 -763 -5,106 .64.05 002 6.471 5,747 8,796 7.30184, I". in Cap V.08. .135 -168 -41F -601 -3.27r 2,517 .5865J -2.092 1.,327 .019 .1.776WdUe, Rag.4 Pe.n (Cap 0 0 0 0 0 0 0 0 -1,916 0 -1.450
Add: Ca# too" In Cup Vot" 230 453 655 1,63 1.963 GU 620 171 250 217 232Loal rv *for Undepsaend (Cur,) 0 0 0 0 0 0 0 0 0 0 C
emaPlse in T.aa*s17 Ooeeeit, by 00,4 Carn .19 -176 .262 143 207 0 0 0 0 0 0
r1 *Ia C.p lsann Pima L6nding 11.21 16,147 16,664 20,.18 22,527 26,905 2S,675 27.i97 SI88 28,h1l4 28,98546ea: Pinmneoil t£nv,enb .3e9 .720 401 .901 .497 .2,669 .3,190 J.,093 -7.160 -86940 -4,J32
Reamim C*Pit*l 911t1d11Art 11,232 1,427 16,U64 19,916 21.530 23.238 22,616 22,678 26.694 19,64 21,055
Lending linve R8.ye.n9Net Uding oh Adveco Aigeunte L.716 .679 1,120 2.917 316 -170 -1,10 2,732 -1.600 -64 250Adds P1,4are;el LAn6,11t S89 720 601 *01 997 26690 3.159 5,093 7.160 ,490 4.932Lame o n449 Ropoymwnte .172 -97 -149 -526 .252 -506 -461 -303 -531 .376 5351vals LendIng *1s*. Repayment 2.113 -256 1,772 S.292 1.0539 1,9l 1.51O 7.522 8.009 64,66 4.667
FlasnalrOecr.,4169 eanta. are 6 ,67 S.415 7.477 7.s se 6.696 12,00 10,406 12,557 16,000 11,666 1S.000Loans Petai6n R.Payment .607 ? -67 . 1.16 .1.646 -1.769 -3,020 .6.690 -5.209 -5,.99 -8,762 .4,662&mole ftop P1i,49, Hls 4.60 6.764 8,312 6.492 7.109 9.061 5,716 7.126 12,006 t,924 10, 58
OG "oA-Mwbh6 bs, 400 1.712 2.365 o0 -2,000 -660 1.427 1.413 0 227 0I.e. renmy"met .37 -69 -168 -98 .6 -9 -12 0 0 0 0
Cat In? T oa -19 *176 -242 163 207 0 0 0 0 0 0hucis holl-.lore4 B1.440n. 54 1.67 1.977 *6l 1.901 .669 1.415 1.413 0 227 0
castoale marke4t b.pa.ingHall.bn 2.370 S. 7,761 .S68U 10,520 e,846 7,213 12.2? 17,000 17.44 17,800
1440 a0807090 6, .933 -1.876 -S,679 -630 7.SSU -3,073 -463 -6.000 3,.707 -8.796 .7.301swats NM.6mAb Uo.eolorg 1.666 4,020 60 6.138 6,689 6. u75 $.Oo 0.227 13.205 1,48 10,o19gnb Saer"mIn 3,917 4.006 1.206 .264a 7. 51 2.209 5.306 11,269 , 339 1. 31 1,042Lee. R.oyemnte .32 15 3 43 -.17 .233 *U2 .7 -231 0 0 0
&ss1a N4.4l Sent SenigoIns 8"8 3,911 1, 168 -2.781 7.212 2.207 S,299 11.038 5,595 1,131 1.062Adds Cook b n c -S6 .315 -694 668 -2.801 780 262 .613 0 -2,2,0 0O0,.:. gnk MpInce 5.647 8,676 676 .-2,09 4*711 8,07 35,16 10.25 8.68 -1.119 1,062CDr St 0.4094 ltftko PI*^* * 4,.005 99,1s6 121.671 1887 4 162,375 179.410 1,96,700 223,000 266,62 280.200 263.500
.. .
m/ Pen £964 flg,n. he bee m6j,ma 90, 0 *int.,, fun Inanfe of rW 1.411 * lien
Spn, Ce1entImi 11. @9, lin k.
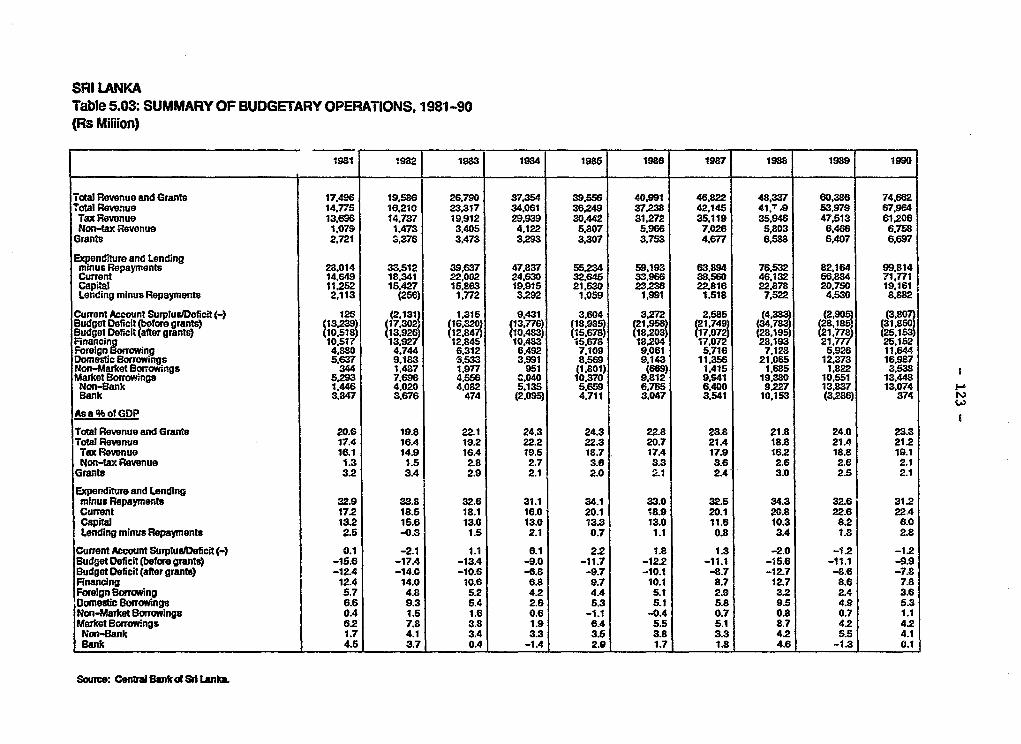
SRI LANKATable 5.03: SUMMARY OF BUDGETARY OPERATIONS, 1981 -90(Rs Miflion)
1981 1982 18 1984 1 985 1986 1987 1988 1989 1990
Total Revenue and Grants 17,496 19.586 26,790 37.354 39,556 40,991 46,822 48.337 60,386 74.662Total Rovenue 14.775 16.210 23.317 34.061 36.249 37.238 42.145 41.' .9 53,979 67.914Tax Revenue 13.696 14.737 19.912 29.939 30.442 31,272 35,119 35,946 47,513 81,206Non-tax Rwevnue 1.079 1,473 3.405 4,122 5.807 5,966 7,026 5.803 6,466 6,758Grants 2,721 3,376 3.473 3,293 3.307 3.753 4.677 6.588 6,407 6,697
Expenditure and Lendingminus Repayments 28.014 33.512 39,637 47.837 55234 59.193 63,894 76,532 82.164 99,814Current 14.649 18.341 22,002 24.630 32,645 33,966 398560 46,132 56.884 71.771Capital 11.252 15.427 16.863 19,915 21,530 23236 22.816 22.878 20.750 19,161Lending minus Ropayments 2.113 (256) 1.772 3,292 1.059 1,991 1.518 7.522 4.530 8,882
Current Account Surplus/Deficit(-7 128 (2.1311 1.315 9,431 3,604 3.272 2,585 (4,383 (2,905 (3.807)Budget Deficit before grants) 13,239 17,302) (16320) 13 776) 18. 98 2195 (21,749) (34 78 (8.185 31850JBudget Deficit (aftTer grants) 10.518) 13 926) 12 847) 10,483) 15 678 18,20 17,07 128 19 t277E 25,153)Financing 10.517 13 .927 12.845 10 15.678 18,204 17.072 28.193 21.7 25152Foreign Sorrowing 4.880 4,744 6,312 6,492 7.109 9,061 5,716 7.128 5.926 11,644Domestic Borrowings 5.637 9.183 S.533 3,991 8.569 9.143 11,356 21.065 12373 16,987Non-Market Borrowings 344 1.487 1.977 951 (1.801) (669) 1415 1.685 1.822 3,538Market Borrowings 5.93 7,696 4,556 C,040 10,370 9.812 9.941 19,380 10.551 13.448Non rrwnk 1,446 4,020 4.082 5.135 5,659 6.765 6.400 9,227 13.837 13,074 IBank 3R847 3.676 474 (2.095) 4,711 3,047 3.541 10,153 (3,286) 374Asa ofGDP
Total Revenue and Grants 20.6 19.8 22.1 24.3 24.3 22.8 23.8 21.8 24.0 23.3Total Revenue 17.4 16.4 19.2 22.2 22.3 20.7 21.4 18.8 21.4 21.2Tax Revenue 16.1 14.9 16.4 19.5 18.7 17.4 17.9 16.2 18.8 19.1Non-tax Revenue 1.3 1.5 2.8 2.7 3.6 3.3 3.6 2.6 2.6 2.1Grants 3.2 3.4 2.9 2.1 2.0 2.1 2.4 3.0 2.5 2.1Expenditure and Lendingminus Repayments 32.9 33.8 32.6 31.1 34.1 33.0 32.5 34.3 32.6 31.2Current 17.2 18.5 18.1 16.0 20.1 18.9 20.1 20.8 22.6 22.4Capital 13.2 15.6 13.0 13.0 13.3 13.0 11.6 10.3 8.2 6.0Lending minus Repayments 2.5 -0.3 1.5 2.1 0.7 1.1 0.8 3.4 1.8 2.8
Current Account SurpluslDeficit(-) 0.1 -2.1 1.1 6.1 2.2 1.8 1.3 -2.0 -1.2 -1.2Budget Deficit (befbre grants) -15.6 -17.4 -13.4 -9.0 -11.7 -12.2 -11.1 -15.6 -11.1 -9.9Budget Deficit (after grants) -12.4 -14.0 -10.6 -6.8 -9.7 -10.1 -8.7 -12.7 -8.6 -7.8Financing 12.4 14.0 10.6 6.8 9.7 10.1 8.7 12.7 8.6 7.8Foreign Borrowing 5.7 4.8 5.2 42 4A 5.1 2.9 3.2 2.4 3.6Domestic orwings 6.6 9.3 5.4 2.6 5.3 5.1 5.8 9.5 4.9 5.3Non-Market Borrowings 0.4 1.5 1.6 0.6 -1.1 -0.4 0.7 0.8 0.7 1.1Market Borrowings 6.2 7.8 3.8 1.9 6.4 5.5 5.1 8.7 4.2 4.2Non-Bank 1.7 4.1 3.4 3.3 3.5 3.8 3.3 4.2 5.5 4.1Bank 4.5 3.7 0.4 -1.4 2.9 1.7t 1.8 4.6 -1.3 0.1
Sorce: Cntr Bank of St LankL
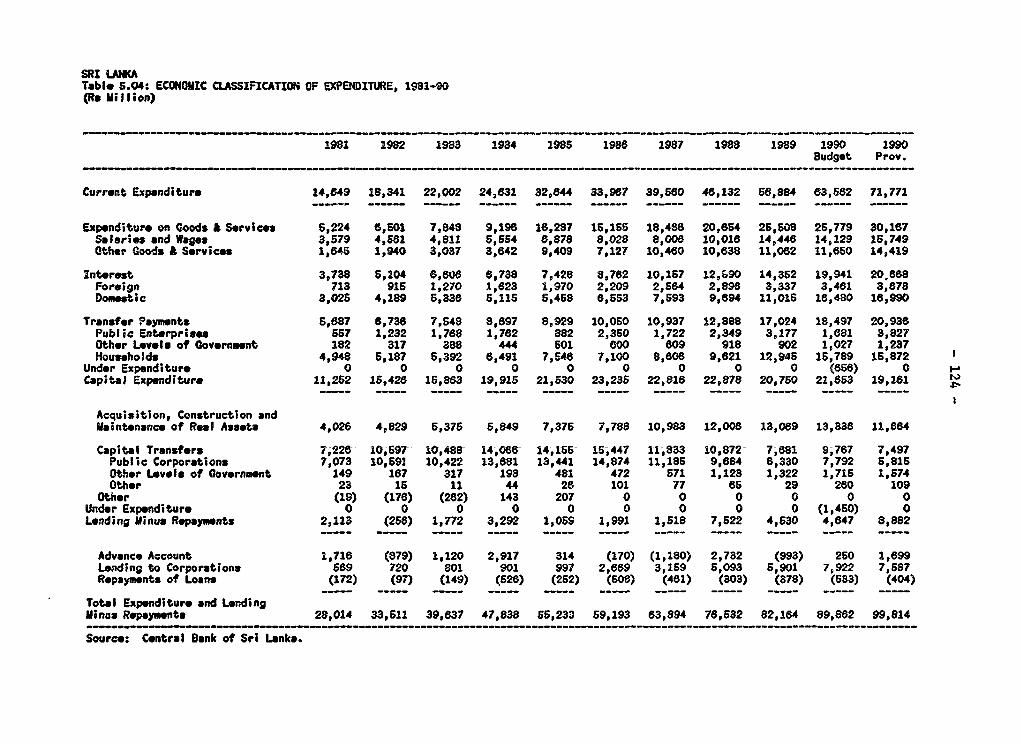
SRI UNKATable 5.04: ECONOIIC CLASSIFICATIOti OF EXPENDITURE, 1981-90(Re Million)
1981 1982 1983 1984 1985 1988 1987 1988 1989 1990 1990Budget Prov.
Current Expenditure 14,649 18,341 22,002 24,831 32,844 33,967 39,580 46,132 56,8B4 63,582 71,771
Expenditure on Goods A Services 5,224 8,601 7,849 9,198 18,287 16,1S5 18,486 20,654 26,608 26,779 30,187Salaries and Wages 3,679 4,561 4,811 5,554 8,878 8,028 8,008 10,018 14,446 14,129 15,749Other Goods A Services 1,845 1,940 3,037 3,642 9,409 7,127 10,480 10,638 11,062 11,650 14,419
Interest 3,738 5,104 6,8e0 8,738 7,428 8,782 10,157 12,690 14,352 19,941 20,668Fore;gn 713 916 1,270 1,823 1,970 2,209 2,584 2,898 3,337 3,481 3,878Domstic 3,025 4,189 5,338 6,115 5,468 8,553 7,593 9,894 11,016 18,480 16,990
Transfer Payments S,887 8,73s 7,648 8,897 8,929 10,050 10,937 12,888 17,024 18,497 20,936Public Enterprises 657 1,232 1,788 1,782 882 2,350 1,722 2,349 3,177 1,681 3,827Other Levels of Covernmnt 182 317 388 444 501 0oo 809 918 902 1,027 1,237Households 4,948 5,187 5,392 6,491 7,548 7,100 8,608 9,621 12,945 15,789 15,872Under Expenditure 0 0 0 0 0 0 0 0 0 (856) 0 iCapital Expenditure 11,252 16,428 16,883 19,915 21,530 23,235 22,818 22,878 20,750 21,683 19,181
Acquisition, Construction andMaintenance of Real Assets 4,026 4,829 6,375 5,849 7,376 7,788 10,983 12,006 13,069 13,338 11,884
Capital Transfers 7,228 10,697 10,488 14,086 14,155 15,447 11,833- 10,872- 7,861 9,787 7,497Public Corporations 7,073 10,692 10,422 13,881 13,441 14,874 11,185 9,884 8,330 7,792 5,815Other Levols of Government 149 187 317 198 481 472 571 1,123 1,322 1,715 1,574Other 23 15 11 44 26 101 77 es 29 280 109Other (19) (178) (282) 143 207 0 0 0 0 0 0Under Expenditure 0 0 0 0 0 0 0 0 0 (1,450) 0Lending Minus Repayments 2,113 (258) 1,772 3,292 1,059 1,991 1,618 7,522 4,530 4,847 8,882
Advance Account 1,716 (879) 1,120 2,917 314 (170) (1,180) 2,732 (993) 250 1,699Lending to Corporations 589 720 801 901 997 2,e89 3,159 5,093 5,901 7,922 7,687Repayments of Loans (172) (97) (149) (528) (262) (608) (461) (303) (378) (633) (404)
Total Expenditure and LendingMinus Repaymnts 28,014 33,511 39,837 47,838 55,233 59,193 83,894 78,532 82,184 89,882 99,814
Source: Central Bank of Sri Lanka.
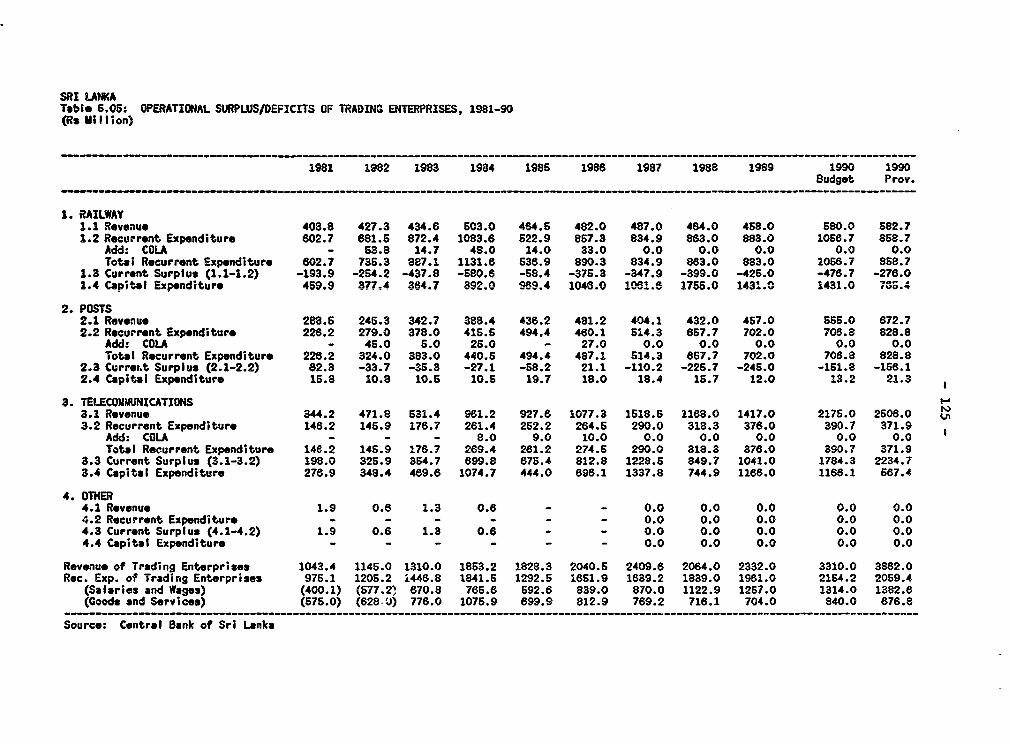
SRI LAHATable 6.05: OPERATIONAL SURPLUS/DEFICITS OF TRADING ENTERPRISES, 1981-90(Rs Million)
1981 1982 1983 1984 1986 1986 1987 1988 1989 1990 1990Budget Prov.
1. RAILWAY1.1 Revenue 408.8 427.3 434.6 603.0 464.5 482.0 487.0 464.0 458.0 580.0 582.71.2 Recurrent Expenditure 802.7 681.5 872.4 1083.6 522.9 857.3 834.9 883.0 883.0 10SB.7 858.7Add: COLA - 53.8 14.7 48.0 14.0 33.0 0.0 0.0 0.0 0.0 0.0Totai Recurrent Expenditure 602.7 736.3 887.1 1131.6 536.9 890.3 834.9 883.0 883.0 1056.7 858.71.3 Current Surplus (1.1-1.2) -193.9 -254.2 -437.8 -680.6 -58.4 -376.3 -347.9 -399.0 -426.0 -478.7 -276.01.4 Capital Expenditure 459.9 377.4 384.7 392.0 989.4 104f.0 10RI.6 1755.0 1431.0 1431.0 785S.4
2. POSTS2.1 Revenue 288.5 245.3 342.7 388.4 436.2 481.2 404.1 432.0 457.0 555.0 672.72.2 Recurrent Expenditure 226.2 279.0 378.0 415.5 494.4 460.1 614.3 657.7 702.0 708.8 828.8Add: COLA - 45.0 5.0 25.0 - 27.0 0.0 0.0 0.0 0.0 0.0Total Recurrent Expenditure 226.2 324.0 383.0 440.5 494.4 487.1 514.3 867.7 702.0 708.8 828.82.3 Currert Surplus (2.1-2.2) 82.3 -33.7 -35.3 -27.1 -68.2 21.1 -110.2 -226.7 -246.0 -151.8 -156.12.4 Capital Expenditure 16.8 10.8 10.5 10.5 19.7 18.0 18.4 15.7 12.0 13.2 21.3
3. TELECOMMUNICATIONS3.1 Revenue 344.2 471.8 631.4 961.2 927.6 1077.3 1518.6 1168.0 1417.0 2175.0 2506.03.2 Recurrent Expenditure 146.2 145.9 176.7 261.4 252.2 264.5 290.0 318.3 376.0 390.7 371.9Add: COLA - - - 8.0 9.0 10.0 0.0 0.0 0.0 0.0 0.0Total Recurrent Expenditure 14e.2 145.9 176.7 269.4 281.2 274.6 290.0 318.3 376.0 390.7 371.93.3 Current Surplus (3.1-3.2) 198.0 325.9 354.7 699.8 67S.4 812.8 1228.6 849.7 1041.0 1784.3 2234.73.4 Capital Expenditure 276.9 348.4 469.6 1074.7 444.0 896.1 1337.8 744.9 1166.0 1168.1 687.4
4. OTHER4.1 Revenue 1.9 0.8 1.3 0.6 - - 0.0 0.0 0.0 0.0 0.04.2 Recurrent Expenditure - - - - - - 0.0 0.0 0.0 0.0 0.04.3 Current Surplus (4.1-4.2) 1.9 0.6 1.3 0.6 - - 0.0 0.0 0.0 0.0 0.04.4 Capital Expenditure - - - - - - 0.0 0.0 0.0 0.0 0.0
Revenue of Trading Enterprises 1043.4 1145.0 1310.0 1863.2 1828.3 2040.6 2409.6 2054.0 2332.0 3310.0 3862.0Rec. Exp. of Trading Enterprises 976.1 1205.2 i446.8 1841.6 1292.5 1651.9 1639.2 1839.0 1981.0 2154.2 2059.4(Salaries and Wages) (400.1) (577.2' 670.8 765.6 692.6 839.0 870.0 1122.9 1267.0 1314.0 1382.8(Goods and Services) (575.0) (628'J) 776.0 1075.9 899.9 812.9 769.2 718.1 704.0 840.0 676.8
Source: Central Bank of Sri Lanka
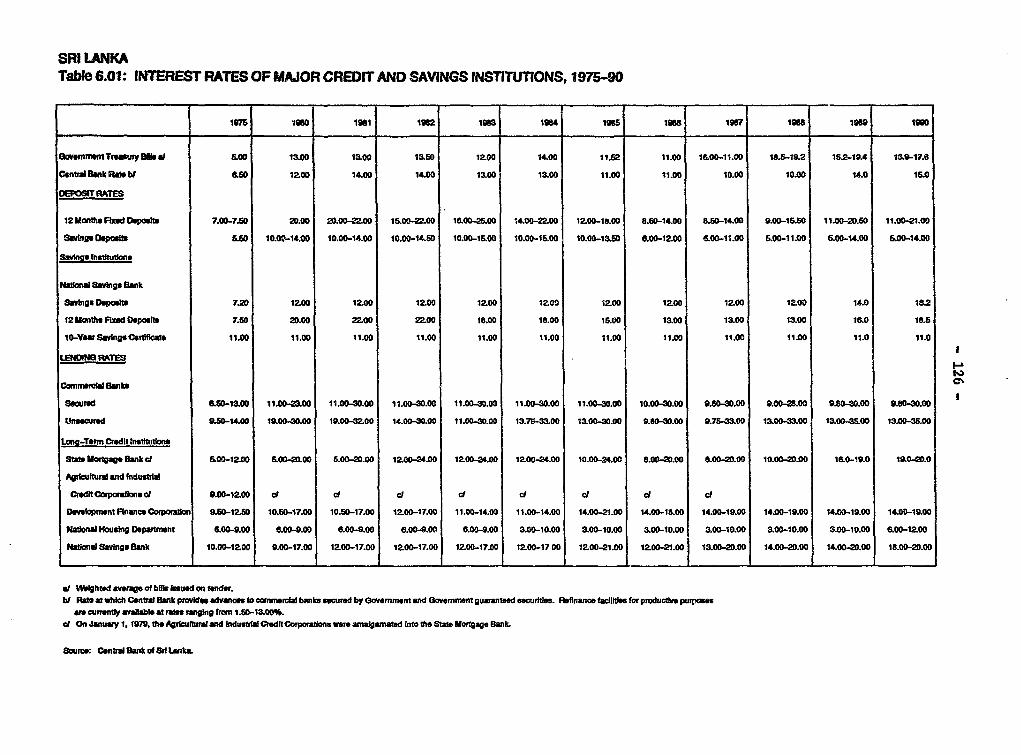
SRI LANKATable 6.01: INTEREST RATES OF MAJOR CREDIT AND SAVINGS INSTTTONS, 1975-90
1975 10 1981 1t 1983 198 18 18 7 1 18
Cvmt3v m. TetTburry l 6.00 13.00 1300 13.O 12.00 14.00 11X2 11.00 1&0-11.00 15.5-19.2 16.2-19 119-17.6Cent,al8lflankftatebl 80 1t0 14.00 14.00 18.00 1aoo 11.00 11.00 10.00 10.0 14.0 15.0DEPO9 RATES
12 MorthD FRad Depost 7.00-7.60 2D.00 20.002Z00 16.00-2ZOO 1600-200 14.02200 12.00-1O.00 80-14.00 80-14.00) 9.00-16. 11.00-20.60 11.00-21.eoSavIngs Deposit. 5.60 10.00-14.00 10.00-14.00 10.00-14.50 10.00-15.00 10.00-1I.o 10.00-130 8.00-12.00 6.0,-11.00 5O00-11.00 .00-14.00 6.00-14.00
SuvnosnstIttIn
Natia Savings Bank
savbign Depo0It 720 12.00 12.00 12.00 12.00 lZO lZOO 12.00 12Z.O 12ZOO 14.0 1S212 Monts Fbksd Depsts 7.60 20.00 mo0 22.00 18.0 18.00 1100 13.o 1100 18.00 110 18.5o-Yvw SavingsCsr rca 11.00 11.00 11.00 11.00 11.00 11.00 11.00 11.00 11.00 11.00 11.0 11.0
LEBNG RATES.
ComereiW Banks
S8crd 8.60-1.00 11.0000 11.00-l0.00 11.00-30.00 11.00-0.00 11.00-30.00 11.00-30.00 10.00-0.00 9.80 .00 9.00-28.00 9830.00 9A.0-.00Unsecured 9.60-14.00 19-40.00 19.00-32G00 14.00-3.00 11.00-30.0 13.76-33.00 13OO-30.00 9.80-30.00 9.75-3300 100-33.00 1o0-35.00 1S 00-3600
Long-Term Credit Instutons
Stat MYa Bank d c500-12.00 S00-20.00 6.00-20.00 1z00-24.00 1ZO-24.00 12.00-24.00 10.00-24.e 8.00-20.00 8.00-20.00 10.00-20.00 160-19.0 190-20.0Agfcutura nd Industrl
Cr.dftCorporatlons d 9.00-1200 d d d d d d d dDornbpment Rnance Corporaon 9.60-16 10.0-17.00 10.50-17.00 12.00-17.00 11.00-14.00 11.00-14.00 14.00-21.00 100-100 14.00-19.00 14.00-19.00 14.00-19.00 14.00-19.00Natonal Houing Depamnt &00-9.00 6.00.00 .00-9.00 1 00-9.00 e0o-9.00 3.00-10.00 3.00-10.00 3.00-10.00 3.00-10.00 3.00-10.00 .00-1000 6.00-12.00Nionl Savings Bank 10.00-1Z.0 9.OD-17.00 12.O0-17.00 12.00-17.00 11ZOO-17.00 IzOo-17 00 1Z00-21.00 1Z00-21.00 13.00-20.00 14.00-20.00 14.00-2.00 18.00-2.00
af Mightedvrgerof bilklsuedon tnder.b t t which Cebat ?3nnt nk ponvidw dnc to mmral banks secured by ovnmment and Govrnmwnt guaanteed sud Refinance adlefor poducti purpoe
ae currently avatble t ra rging B n llS 60-MO%,d On Januwy 1. t97, dthe Agrkuftuns and industrial Cted(tCorporaton were amalgamated Into th Stat Uortgage BanL
S0urc Centrd Bank of d Lanka.
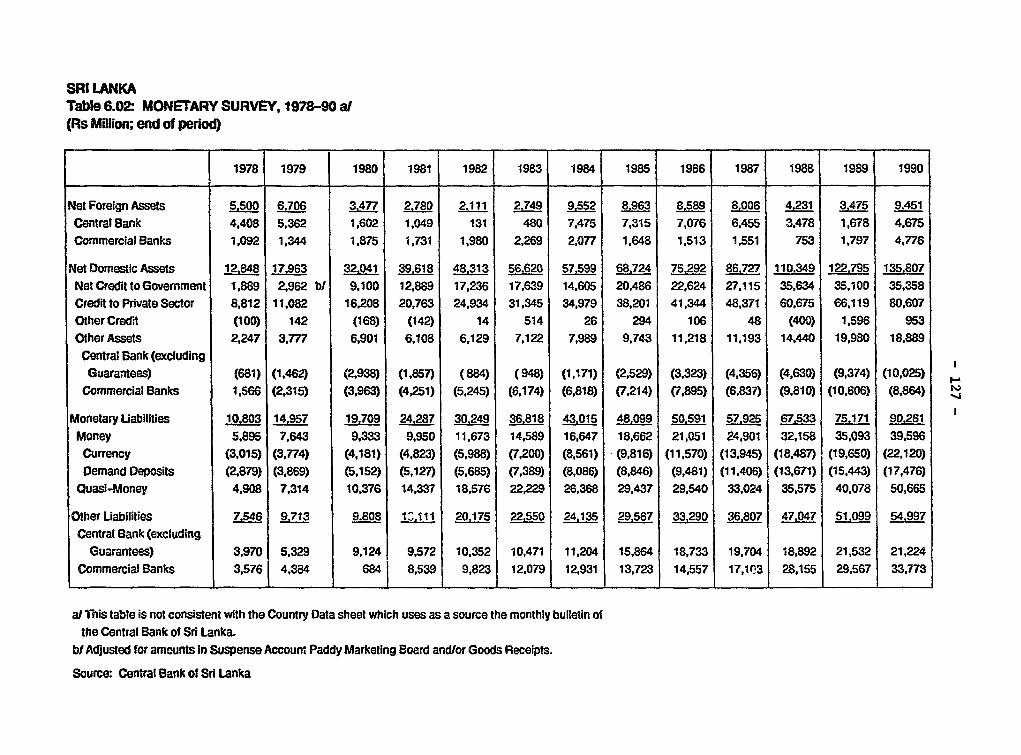
SRI LANKATable 6.02: MONETARY SURVEY, 1978-90 al(Rs Millon; end of period)
I 1978 1979 1980 1981 1982 1983 1984 1985 1986 1987 1988 1989 1990
Net Foreign Assets 5,500 6,706 3 477 2,780 2.111 2,749 9 ss2 8,963 8.589 8,006 4,231 3,475 9,451Central Bank 4.408 5,362 1,602 1,049 131 480 7,475 7,315 7,076 6,455 3,478 1.678 4,675Commercial Banks 1,092 1,344 1,875 1,731 1,980 2,269 2,077 1,648 1,513 1,551 753 1,797 4.776
Net Domestic Assets 12,848 17,963 32,041 g9 1 48,33 §5660 57,59 68.7 752 86.727 110.349 1.2279 135.807Net Credit to Government 1,889 2,962 bt 9.100 12,889 17,236 17,639 14,605 20,486 22,624 27,115 35,634 35,100 35,358Credit to Private Sector 8,812 11,082 16.208 20,763 24,934 31,345 34,979 38,201 41.344 48,371 60,675 66,119 80,607Other Credit (100) 142 (168) (142) 14 514 26 294 106 48 (400) 1,596 953Other Assets 2,247 3,777 6,901 6,108 6,129 7,122 7,989 9,743 11,218 11,193 14,440 19,980 18,889Central Bank (excludingGuarantees) (681) (1,462) (2,938) (1,857) (884) (948) (1,171) (2,529) (3,323) (4,356) (4,630) (9,374) (10,025)
Commercial Banks 1,566 (2,315) (3,963) (4,251) (5.245) (6,174) (6,818) (7,214) (7,895) (6,837) (9,810) (10,606) (8,864) s
Monetary Liabilities 10.803 14.957 19.70 42 30.249 36818 43,015 48.09 50591 57925 67.533 75.171 90,261Money 5,895 7,643 9,333 9,950 11,673 14,589 16,647 18,662 21,051 24,901 32,158 35,093 39,596Currency (3,015) (3,774) (4,181) (4,823) (5,988) (7,200) (8,561) (9,816) (11,570) (13,945) (18,487) (19,650) (22,120)Demand Deposits (2.879) (3,869) (5,152) (5,127) (5,685) (7,389) (8,086) (8,846) (9,481) (11,406) (13,671) (15.443) (17,476)
Quasi-Money 4,908 7,314 10.376 14,337 18,576 22,229 26,368 29,437 29,540 33,024 35.575 40,078 50,665
Olher Liabilities 7.46 97t3 9.808 I1r1 20,17S 22,550 24,135 2987 3329 36,807 47,047 51,099 5499Central Bank (excluding
Guarantees) 3,970 5,329 9,124 9,572 10,352 10,471 11,204 15,864 18,733 19,704 18,892 21,532 21,224Commercial Banks 3.576 | 4,384 684 | 8,539 9,823 12,079 12,931 13,723 14,557 17,1(Q3 28,155 29,567 33,773
al This table is not consistent with the Country Data sheet which uses as a source the monthly bulletin ofthe Central Bank of Sri Lanka.
bl Adjusted for amounts in Suspense Account Paddy Marketing Board and/or Goods Receipts.
Source: Central Bank of Sri Lanka
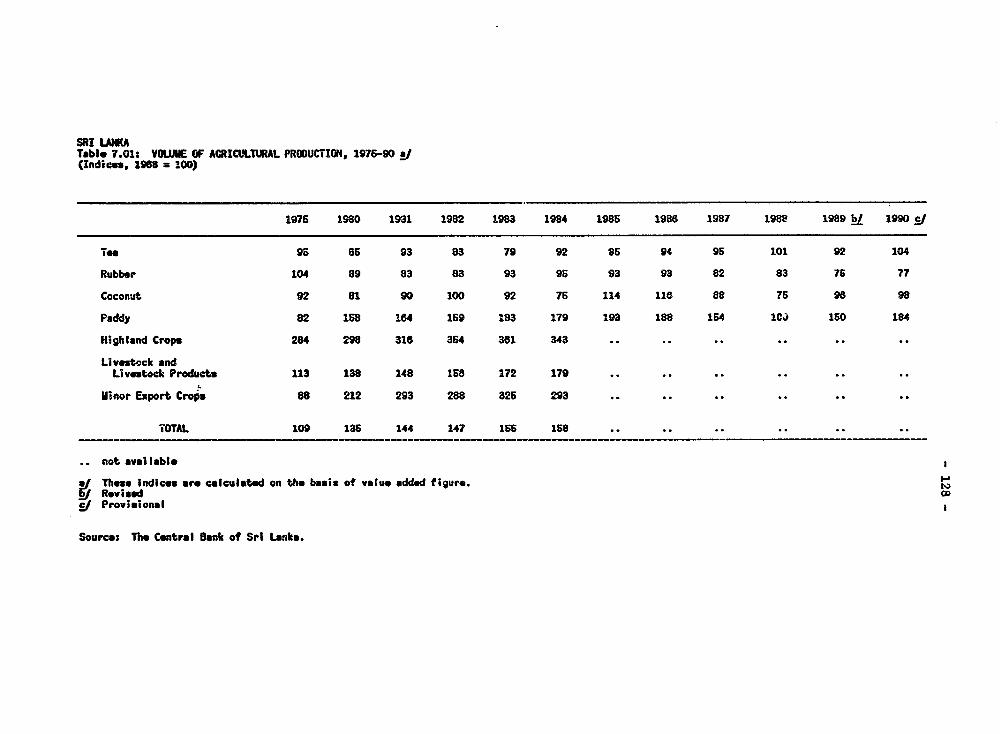
SRI LNATable 7.01: VOUME OF ACRICULTtRAL PRODUCTION, 1976-90(Indices, 1968 = 100)
1975 1980 1931 1982 1983 1984 1985 1988 1987 198e 1989 b/ 1990
Too 95 8S 93 83 79 92 95 94 95 101 92 104
Rubber 104 89 a3 83 93 95 93 93 82 83 76 77
Coconut 92 81 90 100 92 75 114 116 88 76 96 98
Paddy 82 158 164 159 183 179 193 188 164 1GC) 1S0 184
Highland Crops 284 298 316 354 361 343 .. .. ..
Livestock andLivestock Products 113 138 148 158 172 179 .. .. ..
Minor Export Crops 88 212 293 288 326 293 .. .. ..
TOTAL 109 135 144 147 165 158
not available
Thovo Indics aro calculated on the basis of value added figure.R vised OD
LI Provisional a
Source: The Central Bank of Sri Lanka.
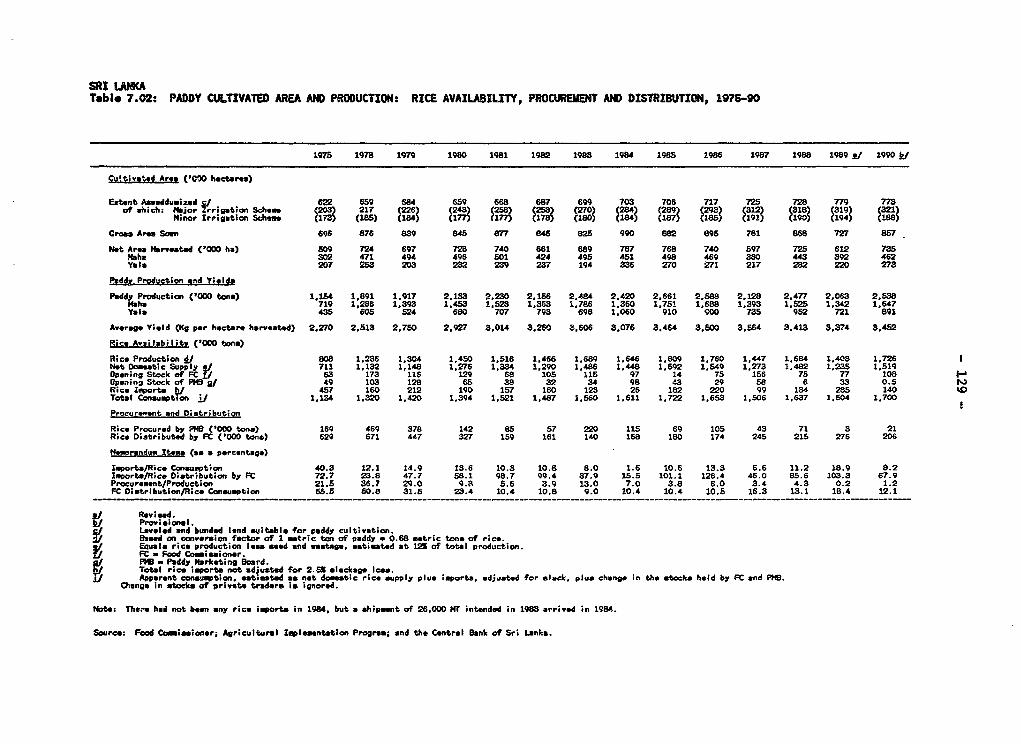
SRI LAtATabl- 7.02: PADDY CULTIVATED AREA AND PRODUCTION: RICE AVAILABILI, PROCtIEMENT AND DISTRIBUTION, 1975-90
1975 1978 1979 1980 1981 1982 1983 1984 195S 1986 1987 1988 1989 / 1990
C41tiva"d Area ('0° hectares)
EmUtnt Aeweddumi zd c 622 859 684 659 668 687 699 703 706 717 725 728 779 773of which: Major Irrigation Schem (203) 217 (226) (243) (258 (258) (270) (284 (289) (298) (312) (318 (319) 321)Minor Irrigation Schem (173) (185) (184) (177) (177) (178) (180) (184) (187) (l85) (191) (190) (194) (18)Cross Area Sown 695 876 839 845 877 84S 825 990 s82 895 781 868 727 857Net Area Hbrvested ('OOD ha) 09 724 697 728 740 661 689 787 768 740 597 725 612 735a.Mh 302 471 494 496 501 424 49s 451 498 469 380 443 392 462Yale 207 253 203 282 239 237 194 336 270 271 217 282 220 273PNddy Production and Yields
Paddy Production ('000 tone) 1,154 1,891 1,917 2.133 2,230 2.156 2.484 2,420 2,661 2.Ss 2. 12 2.477 2,063 2,s33Mbah 719 1,288 1,393 1.453 1.523 1,3S 1,786 1,360 1.751 1,688 1,393 1,825 1,342 1.647Yetl 435 605 524 680 707 793 698 1.060 910 900 735 952 721 891Averag Yield (Kg per hcotre herveated) 2.270 2,518 2,780 2,927 3,014 3.260 3,606 3,076 3,464 3,500 3,564 3,413 3,374 3.452Rice Availability ('000 tonn)
Rice Production A/ 808 1.286 1.804 1,430 1.516 1,466 1.689 1.646 1.809 1.760 1,447 1.684 1,403 1,726Net Domestic Supply _/ 711 1.132 1,148 21,276 1334 1,290 1486 1.4"8 1,592 1,549 1,273 1,482 1,23S 1,519GOpening Stock of PC f/ 63 173 116 129 68 105 115 97 14 75 156 75 77 103osOpening Stock of PMO g/ 49 103 128 6S 38 32 34 98 43 29 58 6 33 0.5 6Rice Importe V 457 160 212 190 157 160 123 26 182 220 99 184 285 140 '0Total Consumption ij 1,134 1.320 1.420 1.394 1.521 1.487 1.560 1,611 1,722 1,653 1,506 1,637 1,504 1,700Procure-ont and Oistribution
Rice Procured by PM6 ('000 tons) 169 469 378 142 8s 57 220 115 69 105 43 71 3 21Rico Distributed by FC (o000 tone) 629 671 447 327 159 161 140 168 1S0 174 245 215 276 206nemorandum Ie (as a percentage)
Imports/Ric. Consumption 40.3 12.1 14.9 13.6 10.3 10.8 8.0 1.6 10.6 13.3 6.6 11.2 18.9 8.2Imports/Rice Distribution by FC 72.7 23.8 47.7 5s.1 98.7 99.4 87.9 1S.5 101.1 126.4 46.0 85.6 103.3 67.9Procurement/Production 21.5 36.7 29.0 9.8 5.6 3.9 13.0 7.0 3.8 6.0 3.4 4.3 0.2 1.2FC Distribution/Rice Consumption 55.5 50.8 31.5 23.4 10.4 10.8 9.0 10.4 10.4 10.5 16.3 13.1 18.4 12.1
Jl/ Revied./ Proviiocnal.
S/ Leveled and bunded lend suitable for paddy cultivation.Based on conversion factor of 1 mtric ton of paddy * 0.68 metric tons of rice.Equol- rice production les seed and wastage. eatimated at 12 of total production.FC * Food Comissioner.FPM - Paddy Marketing Board.Total rice imports not adjusted for 2.6 Slalckage I0es.Apparent consumption. est,usted as not domestic rice supply plus isports, adjusted for slack, plu- change in tho stocks held by FC and PM.Change in stocks of private traders is ignored.
Note: There had not been any rice imports in 1964, but a shipment of 26.000 Kr intended in 1983 arrived in 1984.
Source: Food comiseioner; Agricultural lcplesntation Program; and the Central Bank of Sri Lenka.
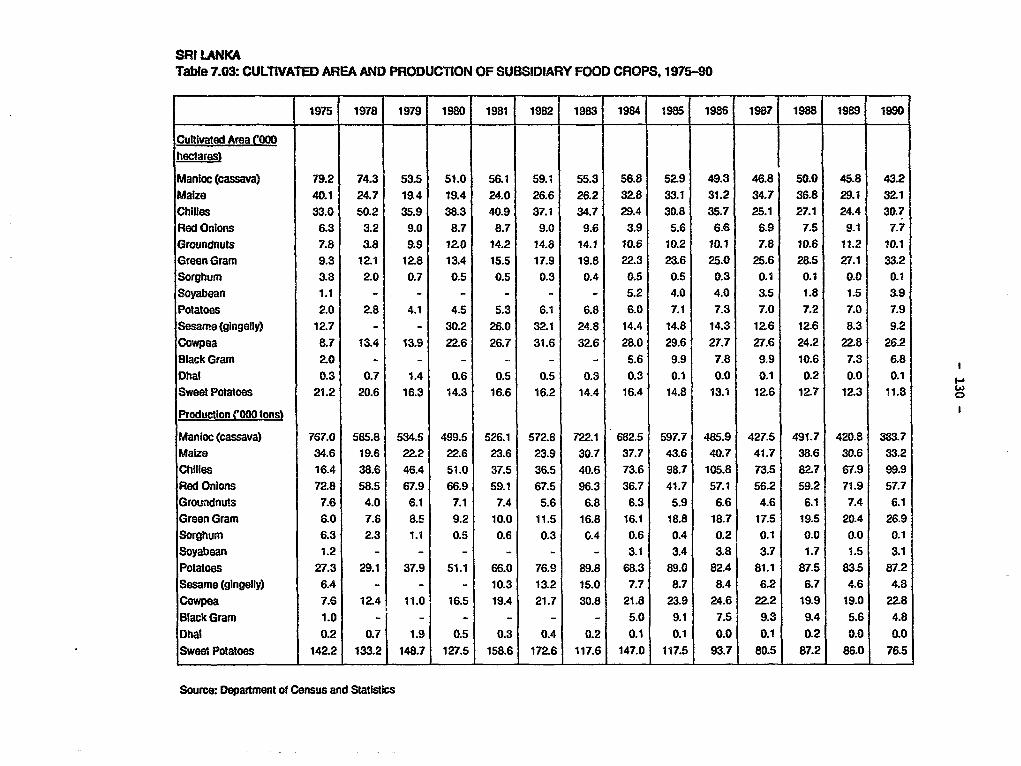
SRI LANKATable 7.03: CULTIVATED AREA AND PRODUCTION OF SUBSIDIARY FOOD CROPS, 1975-90
1975 1978 1979 1980 1981 1982 1983 1984 1985 1986 1987 1988 1989 1990
Cultivated Area C°°0hectares)
Manioc (cassava) 79.2 74.3 53.5 51.0 56.1 59.1 55.3 56.8 52.9 49.3 46.8 50.0 45.8 43.2Maize 40.1 24.7 19.4 19.4 24.0 26.6 26.2 32.8 33.1 31.2 34.7 36.8 29.1 32.1Chilles 33.0 50.2 35.9 38.3 40.9 37.1 34.7 29.4 30.8 35.7 25.1 27.1 24.4 30.7Red Onions 6.3 3.2 9.0 8.7 8.7 9.0 9.6 3.9 5.6 6.6 6.9 7.5 9.1 7.7Groundnuts 7.8 3.8 9.9 120 14.2 14.8 14.1 10.6 10.2 10.1 7.8 10.6 11.2 10.1Green Gram 9.3 12.1 12.8 13.4 15.5 17.9 19.8 22.3 23.6 25.0 25.6 28.5 27.1 33.2Sorghum 3.8 2.0 0.7 0.5 0.5 0.3 0.4 0.5 0.5 0.3 0.1 0.1 0.0 0.1Soyabean 1.1 - - - - - - 5.2 4.0 4.0 3.5 1.8 1.5 3.9Potatoes 2.0 2.8 4.1 4.5 5.3 6.1 6.8 6.0 7.1 7.3 7.0 7.2 7.0 7.9Sesame (gingelly) 12.7 - - 30.2 26.0 32.1 24.8 14.4 14.8 14.3 12.6 1Z6 8.3 9.2Cowpea 8.7 13.4 13.9 22.6 26.7 31.6 32.6 28.0 29.6 27.7 27.6 24.2 22.8 26.2Black Gram 2.0 - - - . - - 5.6 9.9 7.8 9.9 10.6 7.3 6.8Dhal 0.3 0.7 1.4 0.6 0.5 0.5 0.3 0.3 0.1 0.0 0.1 0.2 0.0 0.1Sweet Potatoes 21.2 20.6 16.3 14.3 16.6 16.2 14.4 16.4 14.8 13.1 12.6 12.7 12.3 11.8Production (000 tons)
Manioc (cassava) 767.0 585.8 534.5 499.5 526.1 572.8 722.1 682.5 597.7 485.9 427.5 491.7 420.8 383.7Maize 34.6 19.6 22.2 22.6 23.6 23.9 30.7 37.7 43.6 40.7 41.7 38.6 30.6 33.2Chilies 16.4 38.6 46.4 51.0 37.5 36.5 40.6 73.6 98.7 105.8 73.5 82.7 67.9 99.9Red Onions 72.8 58.5 67.9 66.9 59.1 67.5 96.3 36.7 41.7 57.1 56.2 59.2 71.9 57.7Groundnuts 7.6 4.0 6.1 7.1 7.4 5.6 6.8 6.3 5.9 6.6 4.6 6.1 7.4 6.1Green Gram 6.0 7.6 8.5 9.2 10.0 11.5 16.8 16.1 18.8 18.7 17.5 19.5 20.4 26.9Sorghum 6.3 2.3 1.1 0.5 0.6 0.3 G.4 0.6 0.4 0.2 0.1 0.0 0.0 0.1Soyabean 1.2 - - - - - - 3.1 3.4 3.8 3.7 1.7 1.5 3.1Potatoes 27.3 29.1 37.9 51.1 66.0 76.9 89.8 68.3 89.0 82.4 81.1 87.5 83.5 87.2Sesame (gingelly) 6.4 - - - 10.3 13.2 15.0 7.7 8.7 8.4 6.2 6.7 4.6 4.8Cowpea 7.6 12.4 11.0 16.5 19.4 21.7 30.8 21.8 23.9 24.6 22.2 19.9 19.0 22.8Black Gram 1.0 - - - - - - 5.0 9.1 7.5 9.3 9.4 5.6 4.8Dhal 0.2 0.7 1.9 0.5 0.3 0.4 0.2 0.1 0.1 0.0 0.1 0.2 0.0 0.0Sweet Potatoes 142.2 133.2 148.7 127.5 15&6 172.6 117.6 147.0 117.5 93.7 80.5 87.2 86.0 76.5
Source: Department of Census and Statistics
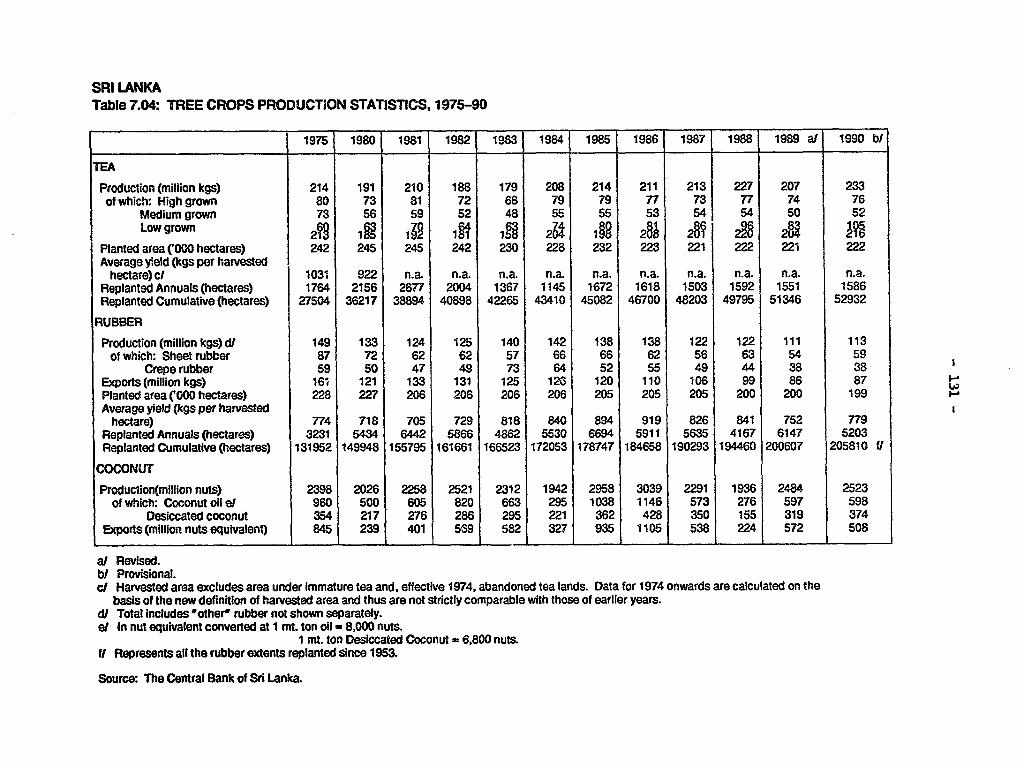
SRI LANKATable 7.04: TREE CROPS PRODUCTION STATISTICS, 1975-90
1975 1980 1981 1982 1983 1984 1985 1986 1987 1988 1989 at 1990 bI
TEA
Production (million kgs) 214 191 210 188 179 208 214 211 213 227 207 233of which: High grown 80 73 81 72 68 79 79 77 73 77 74 76Medium grown 73 56 59 52 48 55 55 53 54 54 50 52
Low grown 2163 199 13 191 199 26 189 2u Au 228 2H YPlanted area ('000 hectares) 242 245 245 242 230 228 232 223 221 222 221 222Average yield (kgs per harvested
hectare) cr 1031 922 n.a. n.a. n.a. n.a. n.a. n.a. n.a. n.a. n.a. n.a.Replanted Annuals (hectares) 1764 2156 2677 2004 1367 1145 1672 1618 1503 1592 1551 1586Replanted Cumulative (hectares) 27504 36217 38894 40898 42265 43410 45082 46700 48203 49795 51346 52932RUBBER
Production (million kgs) di 149 133 124 125 140 142 138 138 122 122 11i 113of which: Sheet rubber 87 72 62 62 57 66 66 62 56 63 54 59Crepe rubber 59 50 47 49 73 64 52 55 49 44 38 38Exports (million kgs) 16* 121 133 131 125 126 120 110 106 99 86 87Planted area (000 hectares) 228 227 206 206 206 206 205 205 205 200 200 199Average yield (kgs per harvestedhectare) 774 718 705 729 818 840 894 919 826 841 752 779
Replanted Annuals (hectares) 3231 5434 6442 5866 4862 5530 6694 5911 5635 4167 6147 5203Replanted Cumulative (hectares) 131952 149948 155795 161661 166523 172053 178747 184658 190293 194460 200607 205810 flCOCONUT
Production(million nuts) 2398 2026 2258 2521 2312 1942 2958 3039 2291 1936 2484 2523of which: Coconut oil ef 960 500 605 820 663 295 1038 1146 573 276 597 598Desiccated coconut 354 217 276 286 295 221 362 428 350 155 319 374Exports (million nuts equivalent) 845 239 401 569 582 327 935 1105 538 224 572 508
a/ Revised.bl Provisional.cd Harvested area excludes area under immature tea and, effective 1974, abandoned tea lands. Data for 1974 onwards are calculated on thebasis of the new definition of harvested area and thus are not strictly comparable with those of earlier years.di Total includes "other' rubber not shown separately.el In nut equivalent converted at 1 mt. ton oil = 8,000 nuts.
1 mt. ton Desiccated Coconut = 6,800 nuts.ft Represents all the rubber extents replanted since 1953.
Source The Central Bank of Sri Lanka.
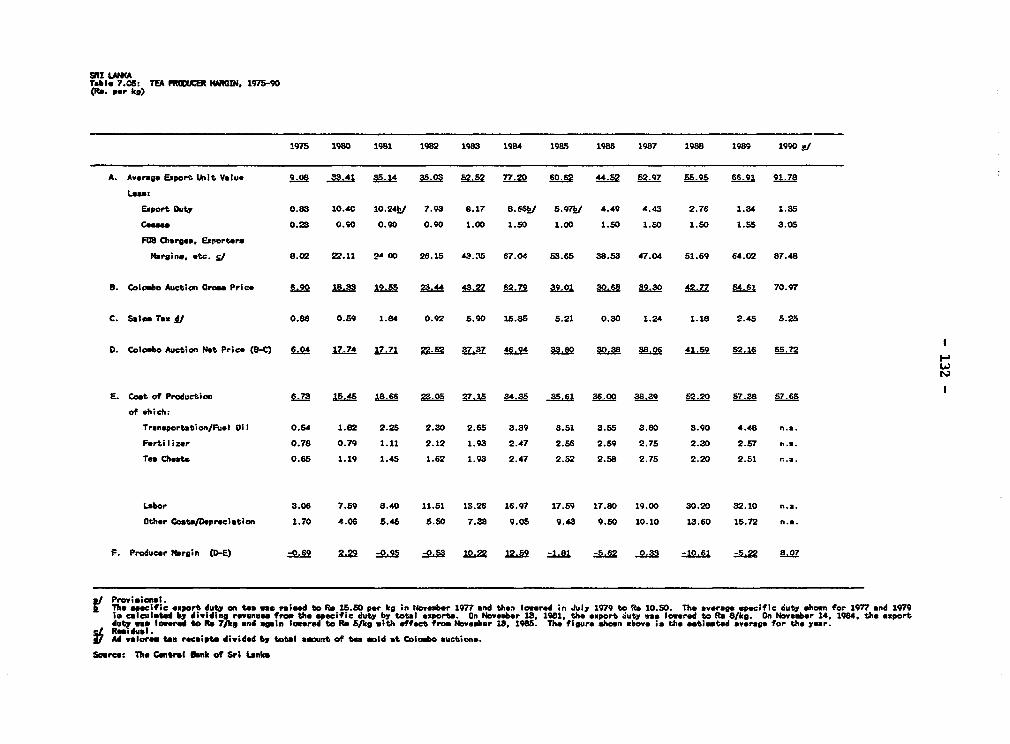
SU LANCATablo 7.05: TEA PROOICEP MARAIN. 1975-90(Re. er kg)
1975 1980 1981 1982 1983 1984 1985 1986 1987 1988 1989 1990 a/
A. Averag ExpCrt, Unit Value 9_0& 83.41 S5. 4 36.0 S 52 72Q 60.62 44.5 52.97 65.95 66,91 91.76Lena:
Export Duty 0.83 10.40 10.24k/ 7.98 8.17 8.66k/ 5.97b/ 4.49 4.43 2.76 1.34 1.35Cease 0.23 0.90 0.90 0.90 1.00 1.50 1.00 1.50 1.50 1.50 1.55 3.05FOB Chargeo, Exporters
margins, *ec. S/ 8.02 22.11 2A 00 26.15 4a is 67.04 53.66 38.53 47.04 51.69 64.02 87.48
B. Coloabo Auction Crrm Price .9 3S 19. 23.44 42 679 39 01 30.68 39.30 42.77 6.61 70.97
C. Sales To m/ 0.86 0.59 1.84 0.92 5.90 15.85 6.21 0.30 1.24 1.18 2.45 5.25
D. Colombo Auction Net Price (B-C) 6LU 17.74 17.71 2 46.94 3 303 3 52.16 46572
I-
E. Cost of Production 6.7S 13.46 18.66 23.05 27.15 34.3 SS61 36.00 38.39 52.2 7.38 57.65of oh ich:
Transportation/Fusl Oi l 0.54 1.82 2.25 2.30 2.65 3.39 3.51 3.55 3.80 3.90 4.48 n.a.Fortilizer 0.78 0.79 1.11 2.12 1.93 2.47 2.56 2.59 2.75 2.30 2.57 e.a.Teo Chant 0.65 1.19 1.45 1.62 1.93 2.47 2.52 2.58 2.75 2.20 2.51 n.a.
Labor 3.06 7.59 8.40 11.51 15.26 16.97 17.59 17.80 19.00 30.20 32.10 n.a.Other Costs/Depreciation 1.70 4.06 5.45 5.50 7.38 9.05 9.43 9.50 10.10 13.60 15.72 n.a.
F. Producer Margin (D-E) -0 2.9 2 -0.95 -0.53 12.6 -1.81 -5.6 -10.61 -5.22 8.07
a/ Provisionat.The specific export duty on tea was raised to Rs 15.50 per kg in November 1977 and then lowered in July 1979 to Re 10.50. Th- average specific duty shown for 1977 and 1979is calculated by diving revenus from the specific duty by total exports. On November 13, 1981, the export ciuty was lowered to Re 8/kg. On November 14, 1984. the exportduty wa Ier t. P. 7Jkg and again lowered to RF $/kg with effect from November 13, 1985. The figure shown above is the estimated averoge for the year.
I5 Ad vlorem tan receipts divided by total *nunt of te sold at CoItAbo auctiens.Sourc: The Cntral Sank of Sri Lanka
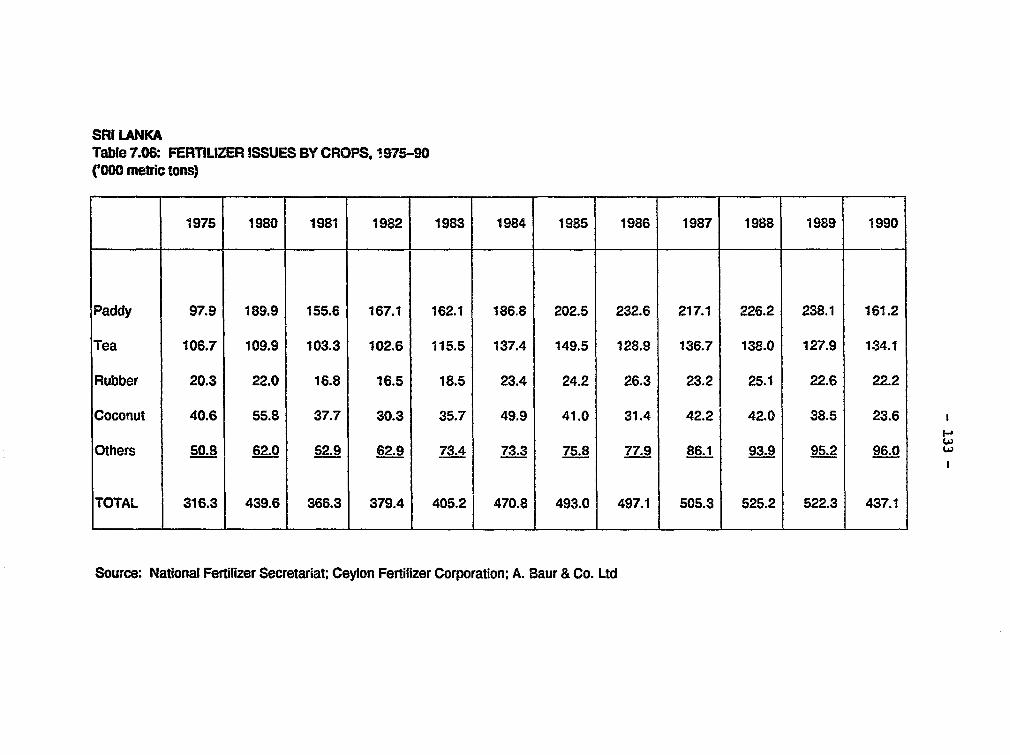
SRI LANKATable 7.06: FERTILIZER ISSUES BY CROPS. 1975-90(G000 metric tons)
1975 1980 1981 1982 1983 1984 1985 1986 1987 1988 1989 1990
Paddy 97.9 189.9 155.6 167.1 162.1 186.8 202.5 232.6 217.1 226.2 238.1 161.2
Tea 106.7 109.9 103.3 102.6 115.5 137.4 149.5 128.9 136.7 138.0 127.9 134.1
Rubber 20.3 22.0 16.8 16.5 18.5 23.4 24.2 26.3 23.2 25.1 22.6 22.2
Coconut 40.6 55.8 37.7 30.3 35.7 49.9 41.0 31.4 42.2 42.0 38.5 23.6
Others 50.8 62.0 52.9 62.9 73.4 73.3 75.8 77.9 86.1 93.9 95.2 96.0
TOTAL 316.3 439.6 366.3 379.4 405.2 470.8 493.0 497.1 505.3 525.2 522.3 437.1
Source: National Fertilizer Secretariat; Ceylon Fertilizer Corporation; A. Baur & Co. Ltd
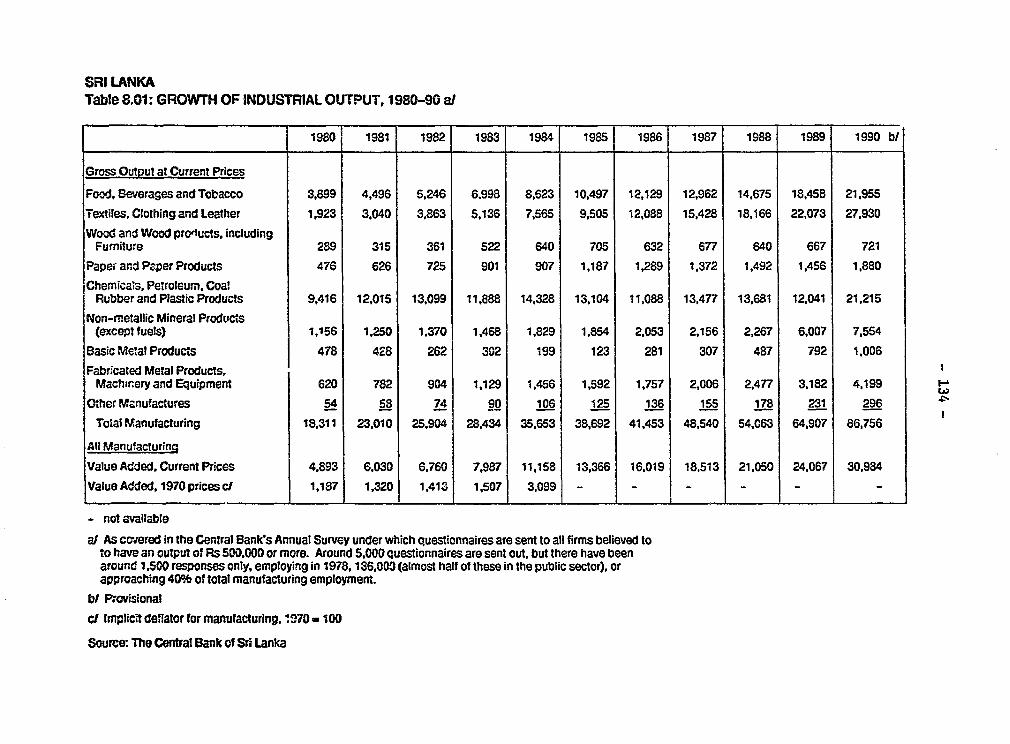
SRI LANKATable 8.01: GROWTH OF INDUSTRIAL OUTPUT, 1980-90 al
1980 1981 1982 1983 1984 1985 1986 1987 1988 1989 1990 b/
Gross Output at Current Prices
Food, Beverages and Tobacco 3,899 4,496 5,246 6.998 8,623 10,497 12,129 12,962 14,675 18,458 21,955Textiles, Clothing and Leather 1,923 3.040 3,863 5,136 7,565 9,505 12,088 15,428 18,166 22,073 27,930Wood and Wood protucts, including
Fumiture 289 315 361 522 640 705 632 677 640 667 721Paper and Paper Products 476 626 725 901 907 1,187 1,289 1,372 1,492 1,456 1,880Chemica's, Petroleum, Coal
Rubber and Plastic Products 9,416 12,015 13,099 11,888 14,328 13,104 11,088 13,477 13,681 12,041 21,215Non-metallic Mineral Products(except fuels) 1,156 1,250 1,370 1,468 1,829 1,854 2,053 2,156 2,267 6,007 7,554
Basic Metal Products 478 428 262 302 199 123 281 307 487 792 1,006Fabricated Metal Products,
Machinary and Equipment 620 782 904 1,129 1,456 1,592 1,757 2,006 2,477 3,182 4.199 wOther Manufactures 54 58 74 90 106 125 136 155 178 231 296
Total Manufacturing 18,311 23,010 25,904 28.434 35,653 38,692 41,453 48,540 54,063 64,907 86,756All Manu.tacturincValue Added. Current Prices 4.893 6,030 6,760 7,987 11,158 13,366 16,019 18,513 21,050 24,067 30,984Value Added, 1970 prices cl 1,187 1,320 1,413 1,507 3,099 - - - - - -
- not available
aJ As covered in the Central Bank's Annual Survey under which questionnaires are sent to all firms believed toto have an output of Rs 500,000 or more. Around 5,000 questionnaires are sent out, but there have beenaround 1,500 responses only, employing in 1978,136,009 (almost half of these in the public sector), orapproaching 40b of total manufacturing employment.
bt Provisionalcl fmplicit deflator for manufacturing, 94v70 - 100
Source. The Central Bank of Sri Lanka
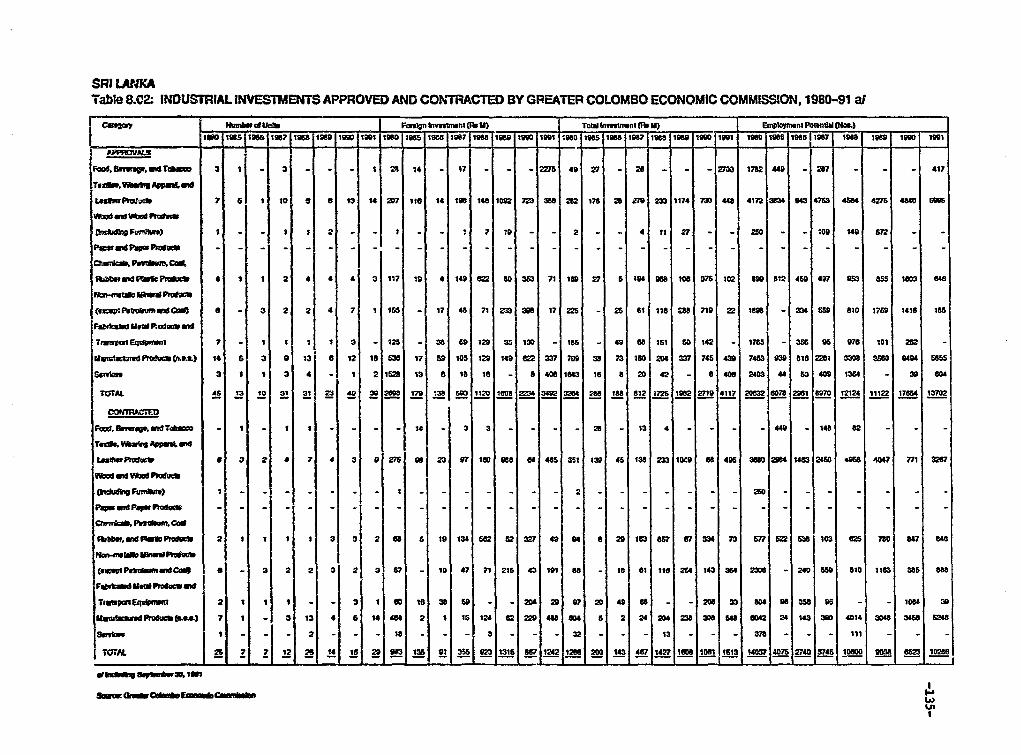
SRI LA?NKATable 8.02: INDUSTRIAL INVESTMENTS APPROVED AND CON-TRACTED BY GREATER COLOMBO ECONOMIC COMMISSION, 1980-91 at
GgARn aun co IJ%f I Fa,mw klnmwrnt (lh I) Tota l kv,lmsnl (1 U) EMplVWnI" Pot*nlia (NMcs)1110 a 105 w38 Ij 0010 0118 0516 07 081819 0110 9516 0 1 1988 109V"6 1991i 190 98 198118I108 06 109 1091
API60VALS - - 1Fmo.ftmg,vuwITom 3 1 ~ 3 - - - 128 14 - 17 - - - 2275 49 27 - 20 - - - 270172244 -07 -2- 417
L.atpmS.,c 7 s I iO a 6 13 14 207 110 14 108 148 1002 723 388 252 178 25 239 233 1174 730 448 4172 38U 943 4723 4584 4275 4840 506
am,dbo ,FumIftn) I - - 0 7 2 - - IS - - 1 7 to - - 2 - - 4 11 27 - - 260 too10 140 672 -PMwatmd psp9t* -- --- - - --- - --- ----- - ---- -- - - -- - - -chmt, Pslrim Go
Fkj0twordPSS9OPtMcS 4 1 I 2 4 4 4 3 117 i9 4 149 e= 80 363 71 160 27 5 494 98 106 375 102 83 812 460 407 053 855 1603 64a
(mW6g1Fl~vbgMWIdC a - 3 2 2 4 7 1 158 - 1 7 48 71 233 3M8 17 2256 25 61 116 288 719 22 1898 - 334 650 810 1760 1416 186FaStcuIU8 Mal It-dueM id
TramupcwEqgwnuwi 7 - I I I 1 3 -125 - 38 69 129 3513D -1Its - 49 68151 50 142 - 1785 - 35605 076 101 252 -
auv.itii,dPMtQ16*A.) 14 5 3 9 13 a 12 18 SW6 17 52 105 129 149 628 337 709 38 73 160 204 337 745 439 7463 03 816 2281 330 386 9404 585S.wvtm 3 1 1 3 4 - 1 215WO 13 a 18 18 - 8 406 1643 18 8 20 42 - 8 406 2403 44 63 409 1364 - 30 604
TOTAL 45 1 1O 1 1 2 40 30 269 79 la8 53 1120 1e08 E2!3 3492 208 268 188 612 1725 1962 2719 4117 20=3 6078 296 897 12124 11122 17654 13702
Fbc. 8vu g. id Tabom - I - - - - 14 - 3 3 - - - - 28 - 13 4 - - - - 449 - 148 82 - - -1edsv vaw1~ .Ipemkwi l
Leamwpadom* 3 2 4 7 4 3 9 07 06 23 07 10008664 485 351139 46136 2331IO1 6 406 3880 2041483 24509OM84047 771 328
(IkidiOiFtili*fI) I… … … … … ……- - I…-- - - - - - 2 - - - -0--0 20 - - - -- -pmw aid PmwftwlucS - ---- ------ - - - --- ------ -- - - - -
9i88 W VWSO pm9mva 2 1 1 I 1 3 3 2 W 6 10134 5 2 32W 4094 6 29 183657607334 70 5778382103 625 M2 847 848
C.xwa,p,8idmwidc= 0 - 3 2 2 3 2 3 67 - 10 47 71 215 43 191 86 - 1a861 118 264 143 384 2306 - 240 550 810 1418 85 6"8Fab,idMeUW Iwoducacl
T,uuP-Eq*,Y.hI 2 1 1 1 - - 3 16016a386so - - 2D42 907 204088 - - 20633 804 063SW6 9 - - 1004 30Iimuurgsd Pto&duc 614.0 7 1 - 3 1 3 4 6 14 d84 2 1 IS 124 82 223 488 604 6 2 24 204 238 30 6 54 6042 24 143 39 4014 M04 3456 524
swvbm I - - I 2 - - - 1S - - - 3 - - - 32 - - - 1 3 - - - 372 - - - III - - -
TOTAL 25 7 j12 25 14 L6 29 943 136 91 356 02 358714 2620 134712 6818 53107475 j2740 3746 100 05 50 00Eb~~~~~~~~~~' bpUn*wU ~ ~ ~ ~ ~ ~ ~ ~ ~ ~ ~ 36 P 14216 2 4 If 147 837 51 WM D9
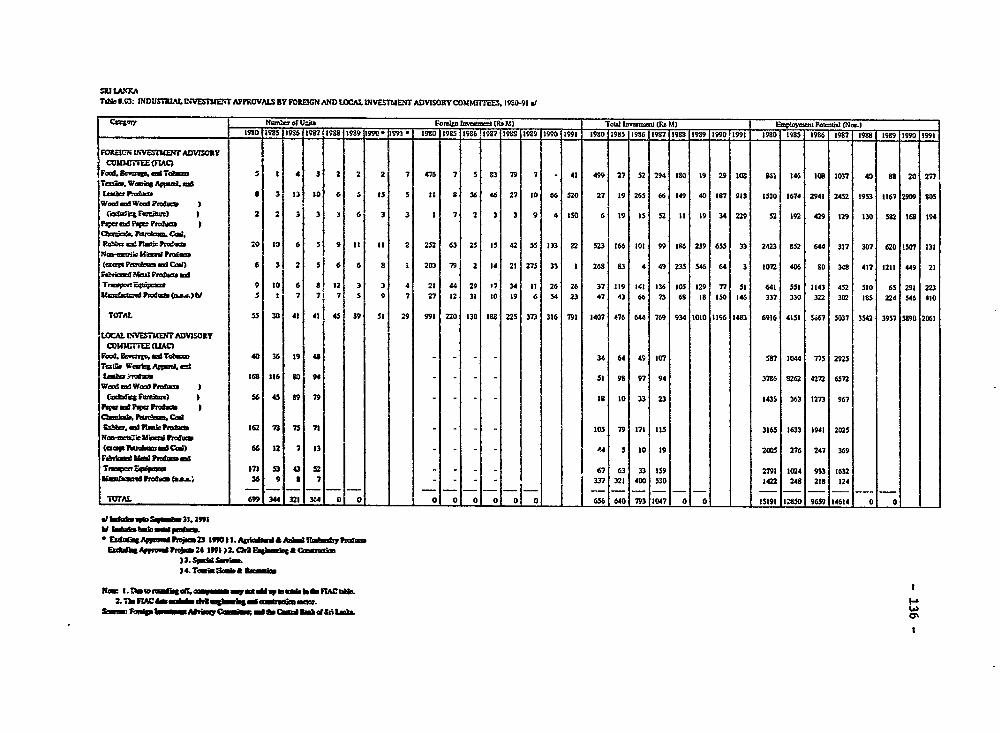
SRI LAINKATabis802 1INDUSThIL8NViVESSUE3TAPFROVALS BY FOR3504 ANDlLOCAL SNVESrUE?TADVSORYcommrFreES. 990-95
C-9-Y ~~~~~~~N-bc or unk. 8ortifn 5flavc5no (Rs M) Totul Eor.mu=u (Rs MS _ E.oloyuuk Pouotiil (No.5 )_____________________ 980 V.983 . m1936 .TTii i9ss .990'Jm 6695' 5880 5985119865198798 19331989199011991 1980 1985 1986f 1988 . "98 .9890*1T 9 1980 5985 59961 1987 5986 989 599 5m991
FOR88CN VEIriV TnL ADVISORY IFoc &=m #nsTSE(HAC) '1 ' 3 2 476 7 93179 7 - 41 499 27 52129451805192980IS8 66 146 508 1037 40 88 202717
TaIS.. W--&p gc1-7- re.4mm I~~~ 3 33 so 6 5 I5 5 I1I 8 36 46 27 50 66 520 27 19 265 66 149 40 187 913 1530 1674 2945 2452 1953 556712909 50
Wom1 .cd wad Frol" )caduft FuZRu26u I 2 2 3 3 3 6 3 3 1 7 2 3 3 9 45150 6519 I5552 51 19 34229 52 192 429 1295130582 162594
cu5o.2s ?romia. CoaW.Robb" d pluw Pnd- .05t 6 5 95 551 1 2 252 63 25 15 42 55 133 22 5235Z66501 995186 239 655 33 2423 852 644 317 307 620515075131
C=.c6pt 6sle d Cod5) 6 3 2 5 6 6 S 5 203 79 251421 273 33 1 269 83 4 49 235 546 64 3 5072 406 90 348417512115449 21Msnc d?Aa Pmru=. Ms
T.uupoEqp- ~ 9 t016 8 12 3 3 4 21 44 29 P7 34 55 26 26 37 11914155265055129 77 5 645 555 8143 452 550, 65 295223U=mctedpaSP b Co .9t.t 5 5 7 7 7 S 9 7 27 5 2 31 10 I59 6 54 23 47 43 66 7368 5 85505146 337 330 322 302 585 224546 410
=OAL. 55 30 48 41 45 39 55 29 991 220 130 568 225 373 356 791 5407 476 644 769 934 1050 5196 5483 6956 41551 567 5037 3542 3937 3890 2865
LOCAL INVES-ET62. ADVISORY1C0M3CTT83 (UAC)
'Foo. fkrcuqad ~TvU 40 36 19 48 - - - - 34 64 49 107 587 1044 775 2925ToaSRR Wcw5tApegA cs. 19j
19190 kradwo 1685516890 4 - - 55 9897 94 3796 8262 4272 6572word adl Wadl PrlL
(~OlgdcFwnka3 9 56 4589919 - - 8 10 33 23 543554353273 967Faf me FM= Froolw
RCMa.Ed RNIC ?M=b 16 73 7- 71- 1050 79 171 155 3165 1633 1941 2025
(cm" lwdm od cm"66512 7 13 - PA -' 55I0519 2005 276 247 369
uIllftma tato cma:,36 9 9 7 - - 33 325 400 530 1422 248 218 124
- - -- -.- I- -.-..---..-..-----.--0 0- I I ;.1757A3. 699344321364 0 0 0 0 2L2 J 656 640 793 3047 0 0 55595 58850 9659 54654 0 0~~~~~~~~~~~~~~~~~~~~~~~~~~~~~~~~~~~~~~~~~~~~~~~~~~~~~~~~~~~~~~~~~~~~~~~~~~~~~~~~~~~~~~~~~~~~~~~~~~~~~~~~~~~~~~~~~~~~~~~~~~~~~~~~~~~~~~~~~~~~~~~~~~~~~~~~~~~~~~~~~~~~~~~6664 U" 9 41
*Ezdsin.Appo- V~23 598)5. AkdwdIS*Aozi8md r Fm S,bytE Affya"o.d 1 24 59532.ICi Aw Iqmg - & d
)3Sp, wwi.
94. T~~a=wud& mew.
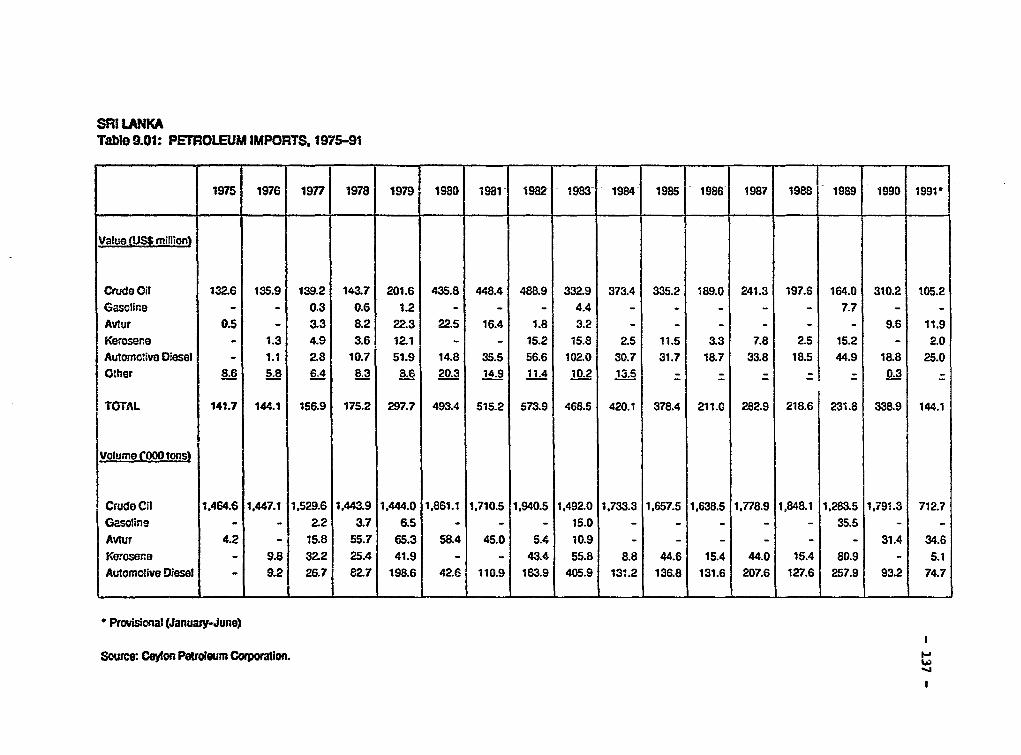
SRI LANKATable 9.01: PETROLEUM IMPORTS, 1975-91
1975 1976 1977 1978 19791 1930 1981 198t - 19835 1984 1985 1986 1987 1988 1989 1990 1991
Value CUSS million)
Crude Oil 132.6 135.9 139.2 143.7 201.6 435.8 448.4 488.9 332.9 373.4 335.2 189.0 241.3 197.6 164.0 310.2 105.2Gasoline - - 0.3 0.6 1.2 - - - 4.4 - - - - - 7.7 - -Avtur 0.5 - 3.3 8.2 22.3 22.5 16.4 1.8 3.2 - - - - - - 9.6 11.9Kerosene - 1.3 4.9 3.6 12.1 - - 15.2 15.8 2.5 11.5 3.3 7.8 2.5 15.2 - 2.0Automotive D:esel - 1.1 28 10.7 51.9 14.8 35.5 56.6 102.0 30.7 31.7 18.7 33.8 18.5 44.9 18.8 25.0Other 8.6 58. 6.4 8.3 8.6 20.3 14.9 11.4 10.2 13.5 _- - 0.3 _
TOTAL 141.7 144.1 156.9 175.2 297.7 493.4 515.2 573.9 468.5 420.1 378.4 211.0 282.9 218.6 231.8 338.9 144.1
Volume (000 tons)
Crudo Cil 1,464.6 1,447.1 1,529.6 1.443.9 1,444.0 1,861.1 1,710.5 1,940.5 1,492.0 1,733.3 1,657.5 1,638.5 1,778.9 1,848.1 1,283.5 1,791.3 712.7Gasoline - - 2.2 3.7 6.5 - - - 15.0 - - - - - 35.5 - -Avtur 4.2 - 15.8 55.7 65.3 58.4 45.0 5.4 10.9 - - - - - - 31.4 34.6Kerosene - 9.8 32.2 25.4 41.9 - - 43.4 55.8 8.8 44.6 15.4 44.0 15.4 80.9 - 5.1Automotive Diesel - 9.2 26.7 82.7 198.6 4Z6 110.9 183.9 405.9 131.2 136.8 131.6 207.6 127.6 257.9 93.2 74.7
* Provisional (January-June)
Source: Ceylon Petroluum Cotporation.
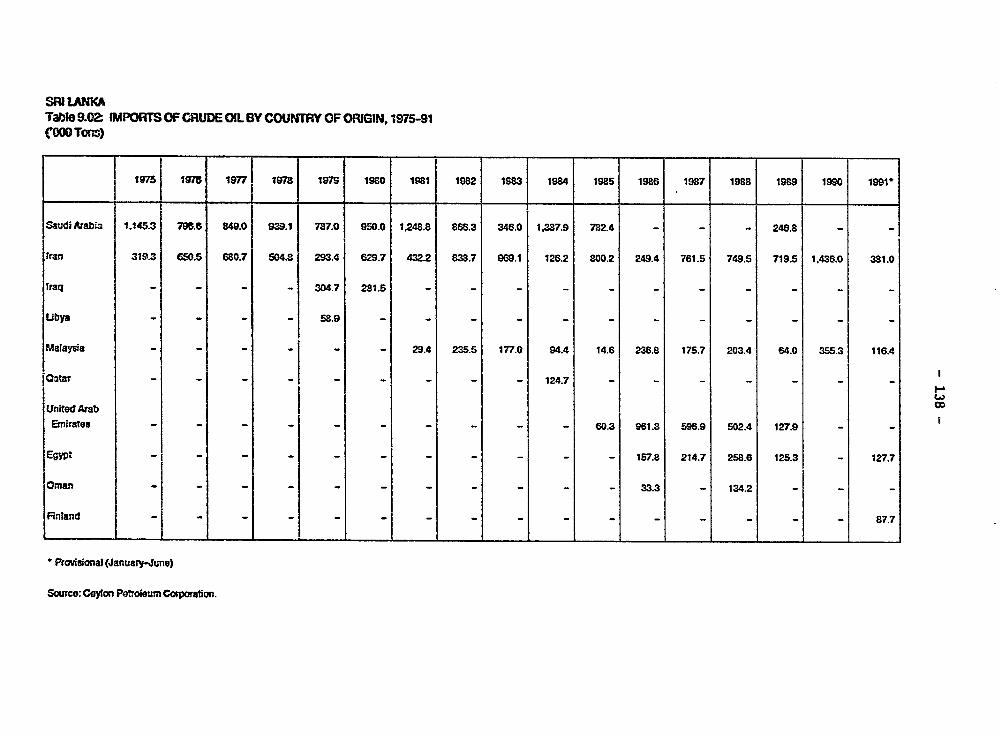
SFU LAMKATak&o 9.02 fPAPORlS OF CRUDE OIL BY COUNTRFY OF ORIGIN, 1975-91('000 TOns)
1975 t5751 1977I 1978 1975 1980 1S81 1982 1s83 1984 1985 1986 1987 1988 1989 199s 1991-
Sadi Arabt 1.145.3 796.6 849.0 939.1 787.0 950.0 1,248.8 866.3 346.0 1 .387.9 782.4 - - - 24E.8 _ _
Iran 3193 650.5 680.7 504.8 293.4 629.7 432.2 838.7 969.1 126.2 800.2 249.4 761.5 749.5 719.5 1.436.0 381.0
Iraq - - - - 304.7 281.5 - - - - - - - - -
Libya - - - - 58.9 _ - - - - - - - - - - -
Malaysia - - - - - _ 29.4 235.5 177.0 94.4 14.6 236.8 175.7 203.4 64.0 355.3 116.4
Oatar- - - - - - - - 124.7 - - - - - - -
United Arab coEmiirates - - - - - - _ _ _ - 60.3 961.3 596.9 502.4 127.9 _ -
EzypS - _ _- - - - - 157.8 214.7 258.6 125.3 _ 127.7
Oman _ - - - _ _ _ _ 33.3 - 134.2 _ - -
Finland _ _ _ _- - - - -_ _ 87.7
* Prosional (January-June)
Source: Ceylon PetieumrCOrpmafion.
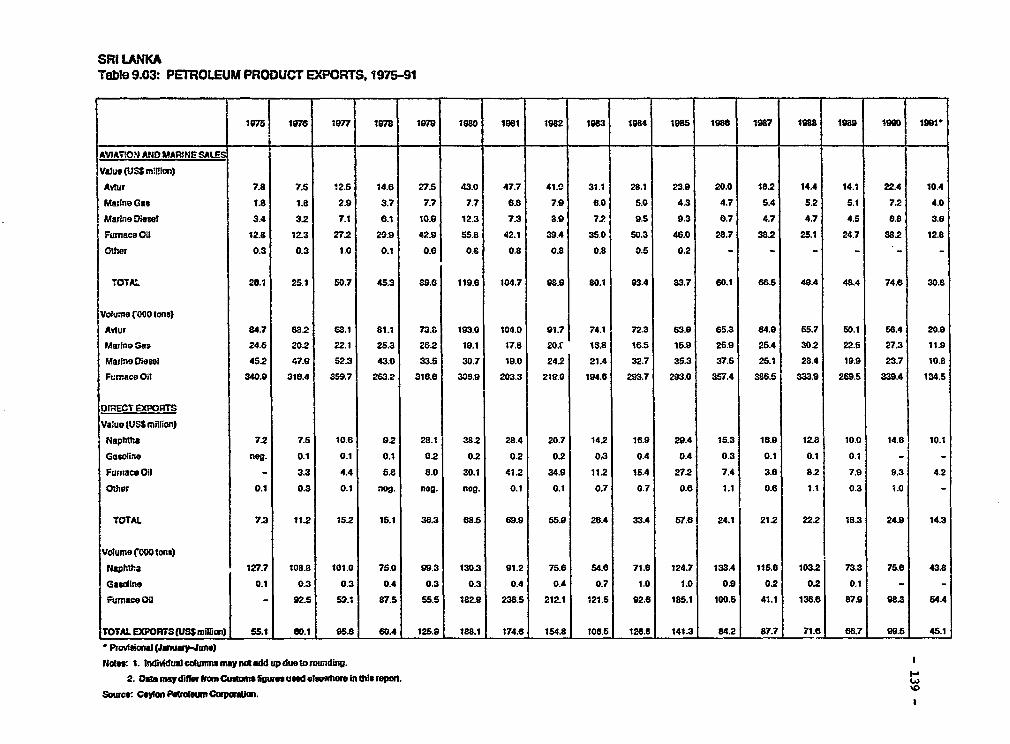
SRI LANKATable 9.03: PETROLEUM PRODUCT EXPORTS. 1975-91
1975 ter7 197 17 1979 1980 1981 1982 193 198 1985 18 1987 1988 198 199 1991w
AVTATI' AiqD MARINE SALES
Value (USSiniliDon)
Avtur 7.8 'J5 12.5 14.e 27.5 43.0 47.7 41.0 31.1 28.1 23.9 20.0 182 14.4 14.1 22.4 10.4MarineGas 1.8 1.8 2.9 3.7 7.7 7.7 6.8 7.9 8.0 5.0 4.3 4.7 5.4 52 5.1 72 4.0Majino Diesel 3.4 32 7.1 6.1 10.9 12.3 7.3 8.9 72 9.S 9.3 8.7 4.7 4.7 4.5 8.8 3.6Fumnace Ci 12.6 12.3 27.2 20.9 42.9 55.8 42.1 39.4 35.0 50.3 48.0 28.7 38.2 25.1 24.7 38.2 12.8Other 0.3 0.3 1.0 0.1 0.6 0.8 0.8 0.8 0.8 0.5 0.2 - - - - - -
TOTAL 28.1 25.1 50.7 45.3 89.8 119. 104.7 98.9 80.1 93A 83.7 60.1 8BS. 49.4 48.4 74.8 30.8
Volume f080 tons)
Avtur 84.7 83.2 68.1 81.1 73.8 193.0 104.0 91.7 74.1 72.3 83.9 65.3 64.9 55.7 50.1 58.4 20.9Marini Gas 24.5 20.2 22.1 25.3 26.2 19.1 17.8 20.r 13.8 1.5 15.9 25.9 25.4 30.2 22.5 27.3 11.9Marins Diesel 45.2 47.9 52.3 43.0 33.5 30.7 19.0 24.2 21.4 32.7 35.3 37.5 25.1 28.4 19.9 23.7 10.8Furnace Oil 340.9 318.4 359.7 283.2 318.0 308.9 203.3 21e.0 194.8 2B3.7 293.0 357.4 386.5 333.9 269.5 339.4 134.5
DIRECT EXPORTS
Value (USS million)
NaphUa 7.2 7.s 10.6 92 28.1 38.2 28.4 20.7 14.2 18.9 29.4 15.3 18.9 12.8 10.0 14.8 10.1Gasoline neg. 0.1 0.1 0.1 0.2 0.2 0.2 0.2 0,3 0.4 0.4 0.3 0.1 0.1 0.1 - -Fumace Oil - 3.3 4.4 5.8 8.0 30.1 41.2 34.9 11.2 15.4 27.2 7.4 3. 8.2 7.9 9.3 42Other 0.1 0.3 0.1 neg. neg. neg. 0.1 0.1 0.7 0.7 0.8 1.1 0.6 1.1 0.3 1.0 -
TOTAL 7.3 11.2 15.2 15.1 38.3 88.5 69.9 55.9 26.4 33.4 57.e 24.1 212 22.2 18.3 24.9 14.3
Volume COO tons)
Naphtha 127.7 103.8 101.0 75.0 99.3 130.3 91.2 75.6 54.8 71.8 124.7 133.4 115.8 103.2 73.3 75.0 43.8Gaoline 0.1 0.3 0.3 0.4 0.3 0.3 0.4 0.& 0.7 1.0 1.0 0.9 0.2 0.2 0.1 - -FurnaceODl - 92.5 59.1 87.5 55.5 182.9 238.6 212.1 121.6 92.0 185.1 100.5 41.1 138.6 87.9 98.3 544A
TOTAL EXPORTS (USS millon) 65.1 0.1 95.8 80.4 125.9 188.1 174.6 154.8 100.5 128.8 141.3 84.2 87.7 71.6 66.7 99.5 45.1* Provisional (Janu,Jwwuno)
N4ts 1. lndMdual clkmenmaynotadd up due to munding. I2. Date may difer *m Cusom Eguew usd elewhere in this reatx
Souvce: Ceylo P.tra(mmC .ma m.
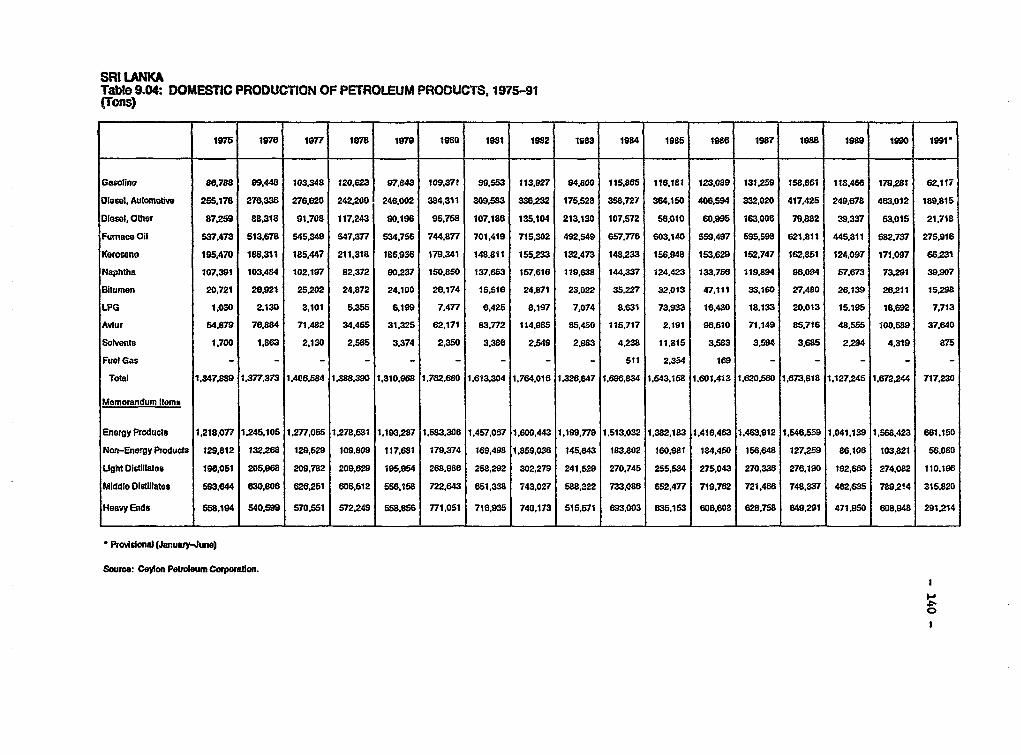
SRI LANKATable 9.04: DOMESTIC PRODUCTION OF PErROLEUM PRODUCTS, 1975-91(Tons)
1975 1978 1977 17 1979 1980 1981 1982 1983 1984 1985 1986 1967 198s 1989 190 1991-
Gasorine 86788 99.448 103.348 120.623 97,843 109.371 99.553 113,627 94.800 115.865 118,181 123,089 131.29 158,861 118.466 179281 82.117Diesel. Automotive 255.178 278.336 276,620 242,200 248.002 384,311 309,583 338.232 175,628 358,727 384.150 406,594 332.020 417,425 249.678 463,012 189.815Diesel. Othler 87.2s 88,318 91.708 117,243 90.196 95,758 107,186 135.104 213,130 107,572 56.010 60.995 163,006 79.832 39.337 53,015 21.713Fumaceo Oil 637.473 513,678 545.349 647,377 534,756 744,877 701,419 715,302 492,649 657,776 603.140 559.497 595,593 621,811 445.811 582.737 275,916Keroseno 195,470 188,311 185.447 211.318 186.93 179.341 148.811 155,233 132.473 143,233 156.948 153.629 152.747 162,851 124.097 171.097 66231Naphtha 107,391 103.484 102.197 82,372 90.237 150.850 137.653 157.616 119s838 144,337 124.423 133,756 119,894 98.094 57.673 73291 39.907Bitumen 20,721 26.921 26,202 24.872 24,100 28.174 15.516 24,871 23,022 35.227 32.013 47,111 33.180 27.480 28,139 28.211 1528LPG 1,030 2,130 3,101 5.355 6.199 7,477 6.425 8.197 7,074 8,631 73.933 18.430 18.133 20,013 15.195 18.692 7,713Avtur 54.879 76584 71,482 34.485 31.325 62,171 83.772 114.985 65,450 116,717 2.191 98,510 71,149 85,716 48,555 100,589 37.640Solvents 1.700 1,863 2.130 2.565 3,374 2,350 3,386 2,549 2,983 4,238 11.815 3.583 3,594 3,635 2294 4,319 875Fuel Gas - - - - - - - - - 511 2.354 169 - - - -
TotW 1.347.889 1.377.373 1,406,584 1.388,390 1,310,983 1.762.680 1,613,304 1,764.018 1,328,647 1,696,834 1,643.158 1,601.413 1,820.560 1,673,818 1,127,245 1.672,244 717.230
Memorandum Items
Energy Products 1.218,077 1.245.105 1277,055 1,278,581 1,193287 1.583.306 1.457,067 1.600,443 1.199,779 1.513,032 1,382,183 1.416.483 1.463.912 1,546,559 1,041.139 1.563.423 661.150Non-Energy Products 129,812 132268 129,529 109,809 117.681 179,374 169,498 1.859,036 145,643 183.802 160.981 184.450 156,648 127,259 86.106 103,821 56,080Ught Distillates 198,051 205,968 209,782 209.629 195,954 268,9s6 258292 302,279 241,529 270,745 255,534 275,043 270.338 276.190 192,560 274.082 110.196Middle Distitlates 593.644 630,806 626,251 606,512 556,158 722,643 651.338 743.027 588,322 733,0s6 652,477 719,762 721,468 748.337 462.635 789,214 315,820
Heavy Ends 558,194 540,599 570.51 572,249 55.856 771051 716,935 740,173 515,571 693,003 635.153 W60,608 828,758 W9,291 471.90 6D8948 291,214
* Provisional (January-June)
Source: Ceylon Petroleum Corporation.
I-
0
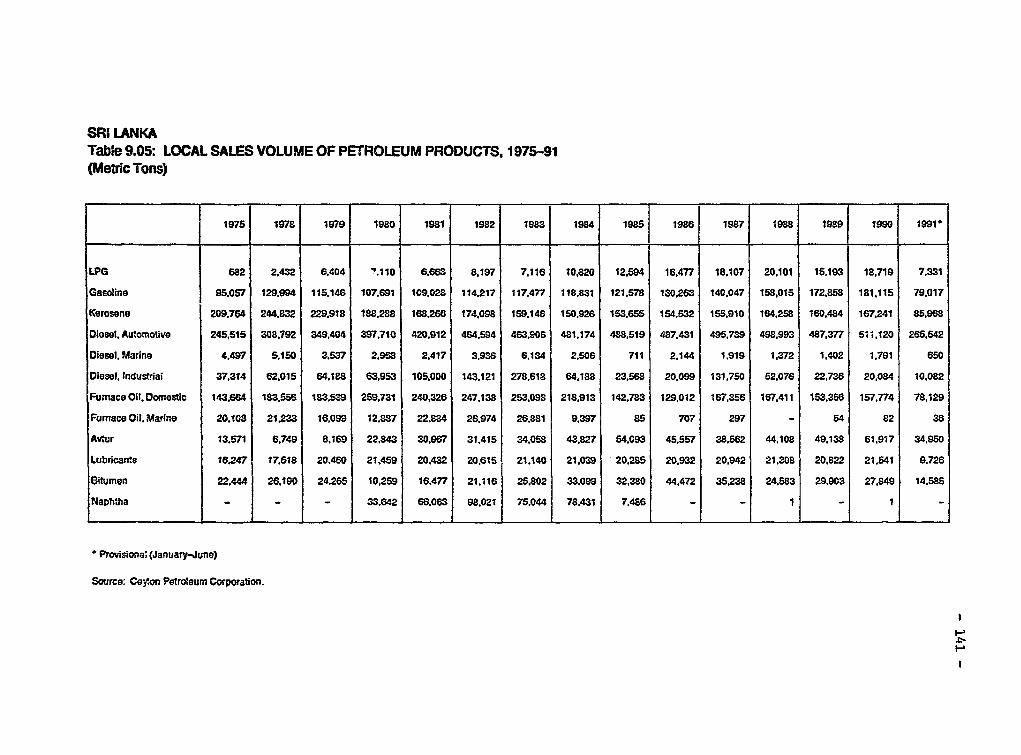
SRI LANKATable 9.05: LOCAL SALES VOLUME OF PETROLEUM PRODUCTS, 1975-91(Metric Tons)
1975 1978 1979 1980 1981 1982 1e 3 1984 1985 1986 1987 1988 1989 1990 1991'
LPG 682 2.432 6,404 '.110 6,966 8,197 7.116 10.820 12,594 16,477 18.107 20.101 15.193 18,719 7.331Gasdine 95,057 129.994 115.146 107.691 109.028 114.217 117,477 118.831 121,578 130.263 140.047 158,015 172,858 181.115 79.017Kerosene 209.764 244.832 229.918 188.238 168.268 174.098 159.14S 150.926 153.655 154.532 155.910 164.258 160,484 167.241 85.968Diesel. Automotive 245,515 308.792 349.404 397.710 420.912 464.594 463.906 481,174 488,519 487,431 495,739 498,993 487.377 511,120 265.542Diesel. Marine 4,497 5,150 3.537 2.968 2.417 3.936 6,134 2.506 711 2.144 1,919 1,372 1.402 1.791 650Diesel, Indusmai 37,314 62,015 64.188 63.953 105.000 143.121 278,618 64,188 23.568 20.099 131.750 52,076 22.736 20,084 10,082FumaceOil.Domestic 143.664 183.556 183.539 259.731 240.326 247,138 253.098 218.913 142,783 129.012 167.356 167.411 153.356 157,774 78,129Fumnace Oil. Marine 20.108 21,233 16,099 12.887 22.884 26.974 26.881 9.397 85 707 297 - 54 82 36Avtur 13.571 6,749 8.169 22.843 30.967 31.415 34.058 43.827 54.093 45,557 38.562 44.108 49,138 61.917 34.950Lubrican-s 16,247 17.518 20.460 21,459 20.432 20.615 21.140 21.039 20.285 20.932 20.942 21.308 20.822 21.541 9.726Bitumen 22.444 26.190 24.265 10,259 16,477 21.116 25.802 33,099 32,380 44.472 35.238 24,583 29.903 27.849 14.585Naphthia - - - 33,642 66,063 98.021 75.044 78.431 7.486 - - I - 1 -
* Provisionat (January-June)
Source: Coyon Petroleum Corporation.
1-AI
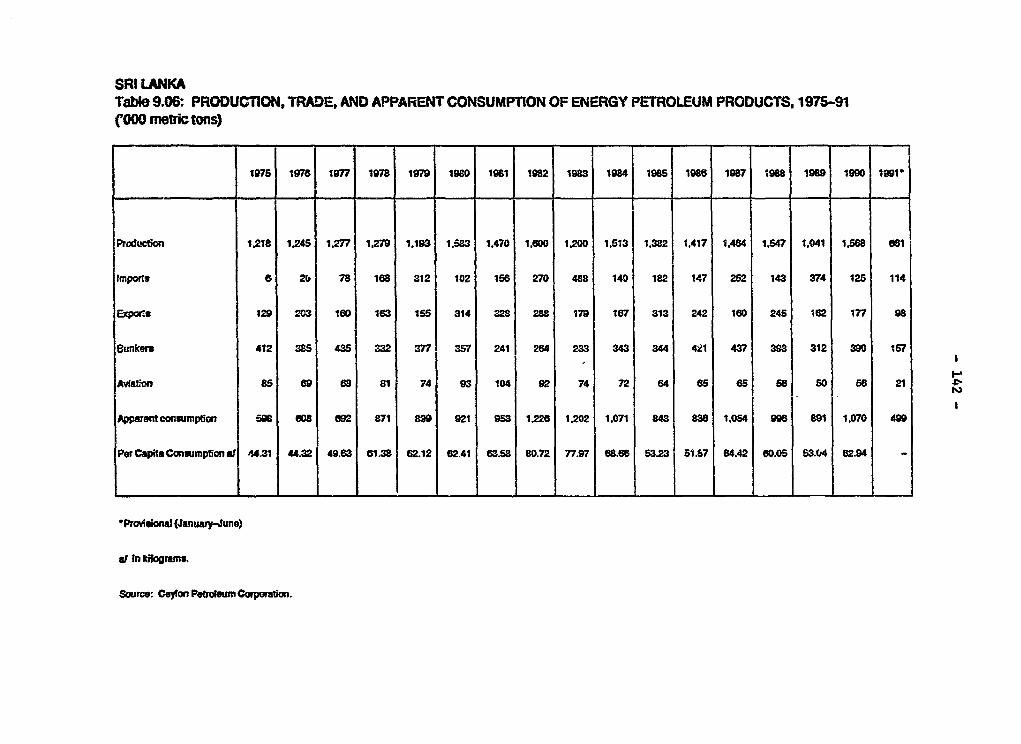
SRI LANKATabbe 9.06: PRODUCTION, TRADE, AND APPARENT CONSUMPTON OF ENERGY PETROLEUM PRODUCTS. 1975-91('000 metric tons)
1975 1978 1977 1978 1979 1980 1961 1982 1963 1984 1965 1986 1987 1988 1969 1990 1991-
Produdion 1.218 1245 1.277 1t279 1.193 1.t83 1,470 1.f00 1.200 1.513 1.382 1,417 1,464 1.,47 1,041 1 ,S8 051
Imnpor G 20i 78 168 312 102 1se 270 488 140 182 147 252 143 374 125 114
Expore 129 203 160 163 155 314 328 288 179 167 313 242 160 245 162 177 98
Bunker 412 385 435 332 377 357 241 264 233 343 344 421 437 393 312 390 157
Aviation 85 69 68 81 74 93 104 92 74 72 64 6S 65 56 50 56 21
Appaet conumption 5Q6 eos 692 871 899 921 953 1.226 1.202 1.071 843 836 1.054 996 891 1.070 499
Per Capita Conumption at 44.31 44.32 49.63 61.38 62.12 62.41 63.58 80.72 77.97 68.f6 53.23 51.67 64.42 60.05 53.t4 62.94 -
'Pomilora (January-June)
at In ldogramn.
Source: CeIon Poerleum Corporatkn.
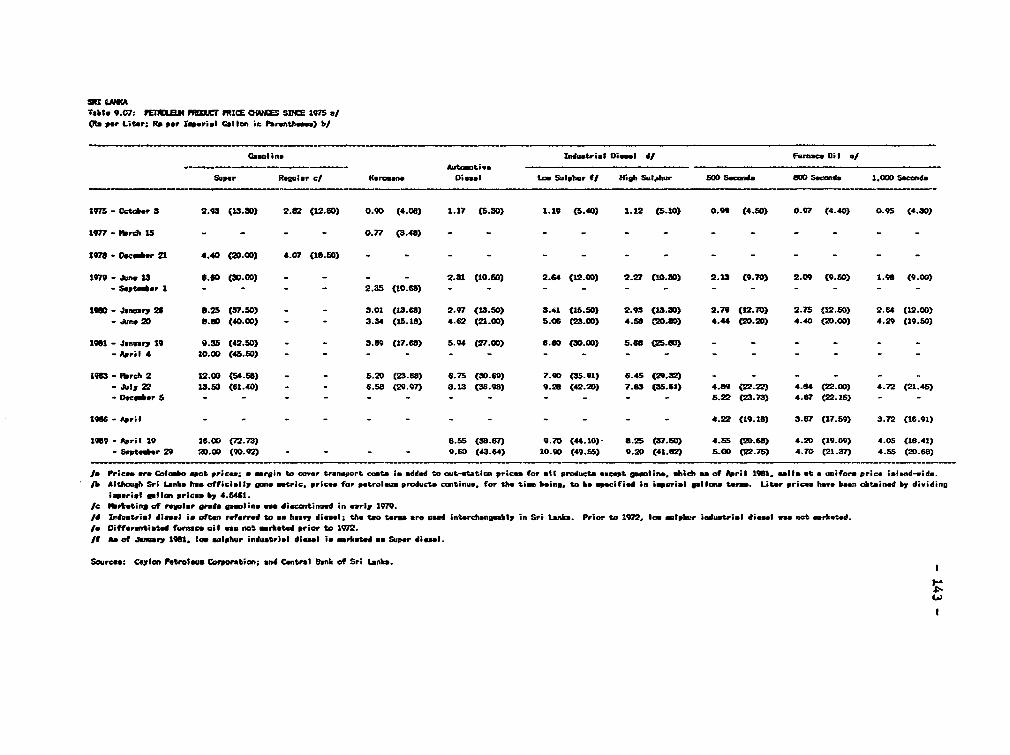
Tabte 9.07: 7EL.& FJCT MICE OWAME SD4lf 1975 a/per Liter; Rr per t_erial Cation ir Parenthe"e) b/
Camoline Industrl Doeml d Furnace Oil /Autt tive
Super Reglar c/ Kerosne oi.el Lt Sulphur f* High Sul Iur 50 Secd 8a0 s5owd 2.000 Second.
1I75 - Cctdoer 3 2.13 (13-30) 2.02 (12.80) 0.90 (4.08) 1.17 (5.3D) 1.19 (5.40) 1.12 (5.10) 0.99 (4.5D) 0.97 (4.40) 0.95 (4.30)
1977- rchS- - - - - 0.77 (3.48) - - - - - - - - - - - -
tt78 - VIcaber 21 4.40 (20.00) 4.07 (18.50) - - -
1979 - .%ne 13 6.80 (30.00) - - - - 2.31 (10.50) 2.64 (12.00) 2.27 (10.30) 2.13 (9.70) 2.09 (9.50) 1.98 (9.00)- Septmsbr I - - - - 2.35 (10.68) - - - - - - - - - - - -I190 - Jnamry 26 6.2: (37.50) - - 3.01 (13.68) 2.97 (13.50) 3.41 (t5.50) 2.93 (13.3) 2.79 (12.70) 2.75 (12.50) 2.64 (12.0D)- Juno 20 8.80 (40.00) - - 3.54 (15.t8) 4.62 (21.00) 5.06 (23.0D) 4.58 (20.80) 4.44 (20.20) 4.40 (00.0O) 4.29 (19.50)
1961 - Janury 19 9.35 (42.50) - - 3.89 (17.68) 5.94 (27.OD) 6.60 (30.00) 5.68 (25.0) - - - -- April 10.00 (45.50) - - - _ _ _ _ _ _ _ _ _ _ _ _ _
IMl3 - lhrrh 2 12.00 (54.58) - - 5.20 (23.68) 6.75 (30.69) 7.90 (35.91) 6.45 29.32) - - - - - -- July 22 13.50 (61.40) - - 6.58 (29.97) 8.13 (356.98) 9.20 (42.20) 7.83 (35.61) 4.89 (21.22) 4.84 (22.00) 4.72 (21.45)- Oca_er t - - - - - - - - - 5.22 (23.73) 4.87 (21.35) - -
19t- -- -Aprl 4 .22 (19.18) 3.87 (17.59) 3.72 (16.91)
19Ot - April 19 16.00 (72.73) 8.55 (38.87) 9.70 (44.10) 80.2! (37.5) 4.55 (00.68) 4.20 (19.09) 4.05 (10.41)- Sapt*er 29 20.00 (90.92) - - - - 9.60 (43.64) 10.90 (49.55) 9.00 (41."2) 5.00 (22.75) 4.70 (21.37) 4.55 (20.68)
la Prices pro Col-o spot prices, a mrgin to cover traneport coats is added to out-tatson prices for all product ascept gasoline, shicb as of April 1961. sel11 at a unifor price island-aid.Altough Sri lankis has officially one metric. prices for petrolaus product. continu-, for the tim eing, to be apeified in iporial gailon term. Liter prices have been obtained by dividingiaperiel when prices by 4.*U1.Ic Plrkoting of reular grade gd gl in. uee discentinued in oerly 979./d Iniuat-rial diesel ie often referred to ma heavy diesl; the two term are ueed interchangebly in Sri Lank. Prior to 1972, law ,lplar induatrial diese w-I not mrk.eted.lo Oifferentiated furnace oil use moS mrbetad prior to 972.It Ae of JSaury 1961, for Iaiphur induetrial diesel s marlketad *a Super diesl.
Smrces: Ceylon Pteolea Corporation; and Centrl Benk oa Sri Lanka.
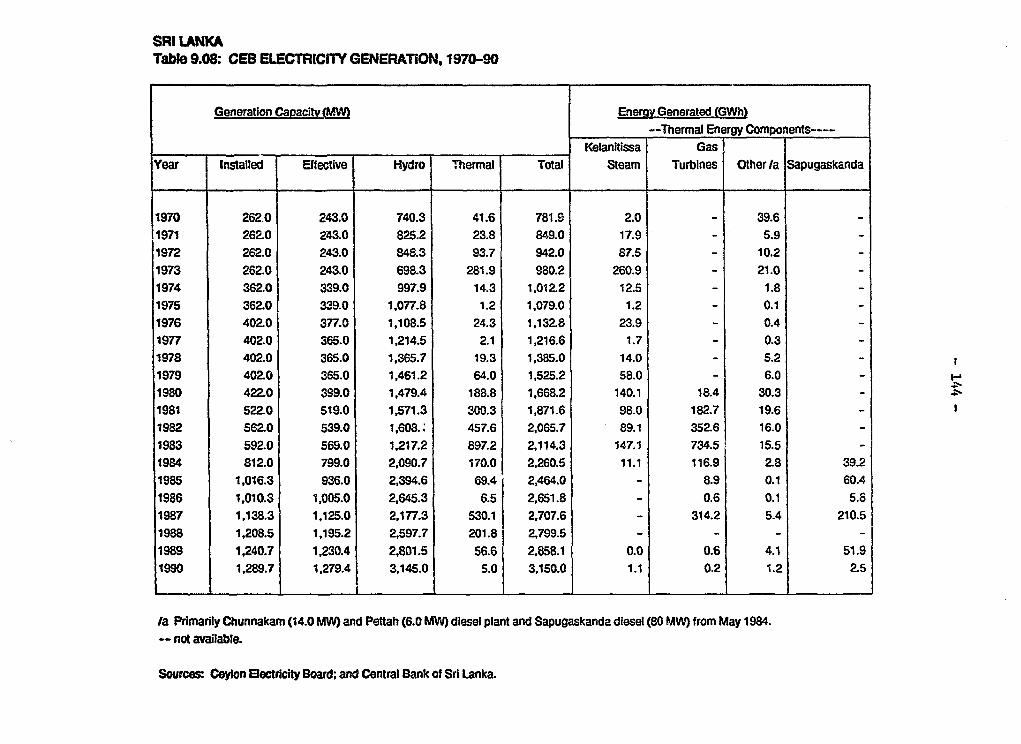
SRI LANKATable 9.08: CEB ELECTRICITY GENERATiON, 1970-90
Generation Capacity Energy Generated (GWh)--Thermal Energy Components----
Kelanitissa GasYear Installed Effective Hydro Thermal Total Steam Turbines Other la Sapugaskanda
1970 262.0 243.0 740.3 41.6 781.9 2.0 - 39.6 _1971 262.0 243.0 825.2 23.8 849.0 1T9 - 5.9 -1972 262.0 243.0 848.3 93.7 942.0 87.5 - 10.21973 262.0 243.0 69&3 281.9 980.2 260.9 - 21.0 -1974 362.0 339.0 997.9 14.3 1,012.2 12.5 - 1.8 -1975 362.0 339.0 1,077.8 1.2 1,079.0 1.2 - 0.1 -1976 402.0 377.0 1,108.5 24.3 1,132.8 23.9 - 0.4 -1977 402.0 365.0 1,214.5 2.1 1,216.6 1.7 - 0.3 -1978 402.0 365.0 1,365.7 19.3 1,385.0 14.0 - 5.2 -1979 402.0 365.0 1,461.2 64.0 1,525.2 58.0 - 6.0 -1980 422.0 399.0 1,479.4 188.8 1,668.2 140.1 18.4 30.3 -1981 522.0 519.0 1,571.3 300.3 1,871.6 98.0 182.7 19.6 -1982 562.0 539.0 1,608.; 457.6 2,065.7 89.1 352.6 16.01983 592.0 569.0 1,217.2 897.2 2,114.3 147.1 734.5 15.51984 812.0 799.0 2,090.7 170.0 2,260.5 11.1 116.9 2.8 39.21985 1,016.3 936.0 2,394.6 69.4 2,464.0 - 8.9 0.1 60.41986 1,010.3 1,005.0 2,645.3 6.5 2,651.8 - 0.6 0.1 5.81987 1,138.3 1,125.0 2,177.3 530.1 2,707.6 - 314.2 5.4 210.51988 1,208.5 1,195.2 2,597.7 201.8 2,799.5 - - -
1989 1,240.7 1,230.4 2,801.5 56.6 2,858.1 0.0 0.6 4.1 51.91990 1,289.7 1,279.4 3,145.0 5.0 3,150.0 1.1 0.2 1.2 2.5
la Primarily Chunnakam (14.0 MW) and Pettah (6.0 MW) diesel plant and Sapugaskanda diesel (80 MW) from May 1984.-- not available.
Sources: Ceylon Electricity Board; and Central Bank of Sri Lanka.
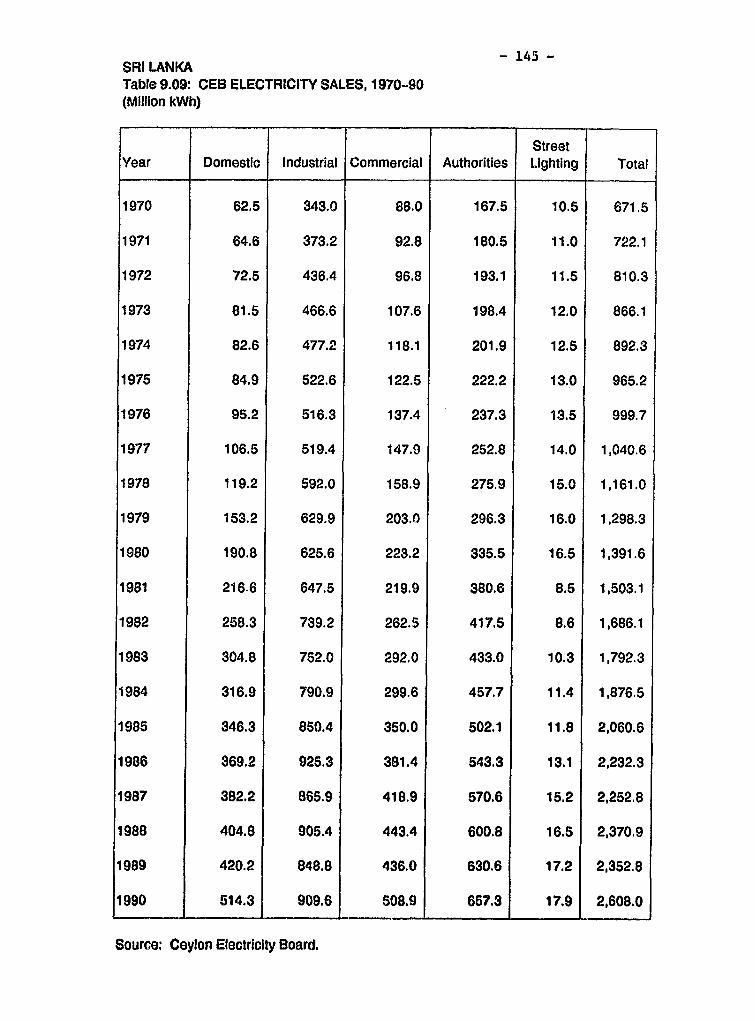
- 145 -SRI LANKATable 9.09: CEB ELECTRICITY SALES, 1970-90(Million kWh)
StreetYear Domestic Industrial Commercial Authorities Lighting Total
1970 62.5 343.0 88.0 167.5 10.5 671.5
1971 64.6 373.2 92.8 180.5 11.0 722.1
1972 72.5 436.4 96.8 193.1 11.5 810.3
1973 81.5 466.6 107.6 198.4 12.0 866.1
1974 82.6 477.2 118.1 201.9 12.5 892.3
1975 84.9 522.6 122.5 222.2 13.0 965.2
1976 95.2 516.3 137.4 237.3 13.5 999.7
1977 106.5 519.4 147.9 252.8 14.0 1,040.6
1978 119.2 592.0 158.9 275.9 15.0 1,161.0
1979 153.2 629.9 203.0 296.3 16.0 1,298.3
1980 190.8 625.6 223.2 335.5 16.5 1,391.6
1981 216.6 647.5 219.9 380.6 8.5 1,503.1
1982 258.3 739.2 262.5 417.5 8.6 1,686.1
1983 304.8 752.0 292.0 433.0 10.3 1,792.3
1984 316.9 790.9 299.6 457.7 11.4 1,876.5
1985 346.3 850.4 350.0 502.1 11.8 2,060.6
1986 369.2 925.3 381.4 543.3 13.1 2,232.3
1987 382.2 865.9 418.9 570.6 15.2 2,252.8
1988 404.8 905.4 443.4 600.8 16.5 2,370.9
1989 420.2 848.8 436.0 630.6 17.2 2,352.8
1990 514.3 909.6 508.9 657.3 17.9 2,608.0
Source: Coylon Electricity Board.
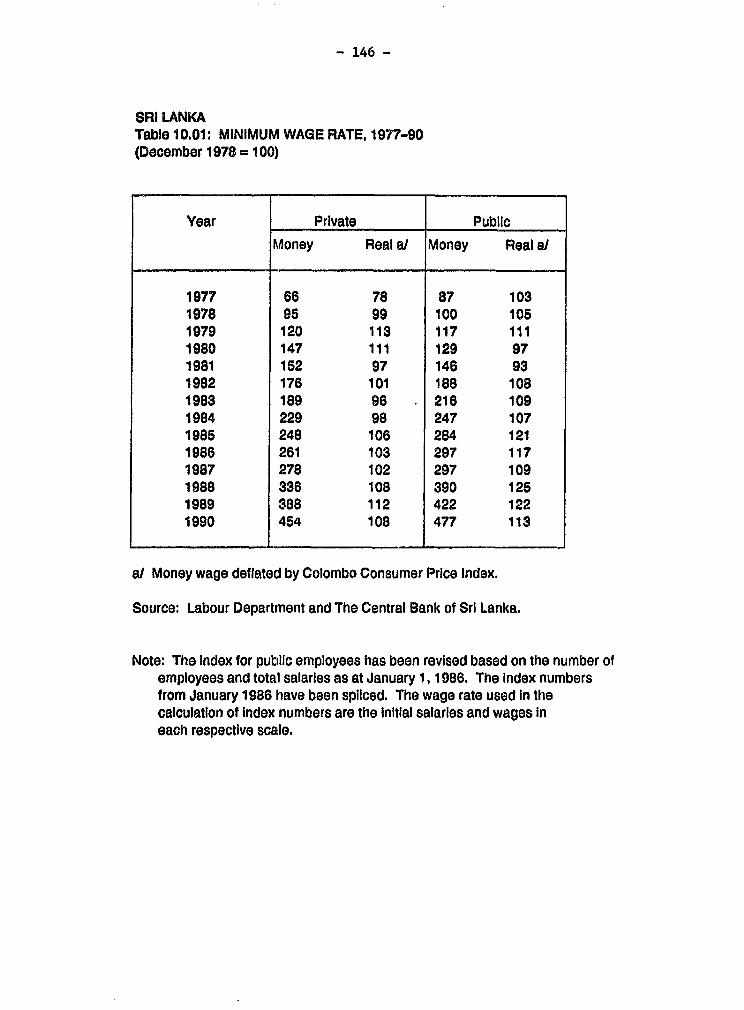
- 146 -
SRI LANKATable 10.01: MINIMUM WAGE RATE, 1977-90(December 1978 100)
Year Private Public
iMoney Real al Money Real a/
1977 66 78 87 1031978 95 99 100 1051979 120 113 117 1111980 147 111 129 971981 152 97 146 931982 176 101 188 1081983 189 96 216 1091984 229 98 247 1071985 248 106 284 1211986 261 103 297 1171987 278 102 297 1091988 336 108 390 1251989 388 112 422 1221990 454 108 477 113
a/ Money wage deflated by Colombo Consumer Price Index.
Source: Labour Department and The Central Bank of Sri Lanka.
Note: The indox for pubilic employees has been revised based on the number ofemployees and total salaries as at January 1, 1986. The Index numbersfrom January 1986 have been spliced. The wage rate used In thecalculation of index numbers are the Initial salaries and wages ineach respective scatle.
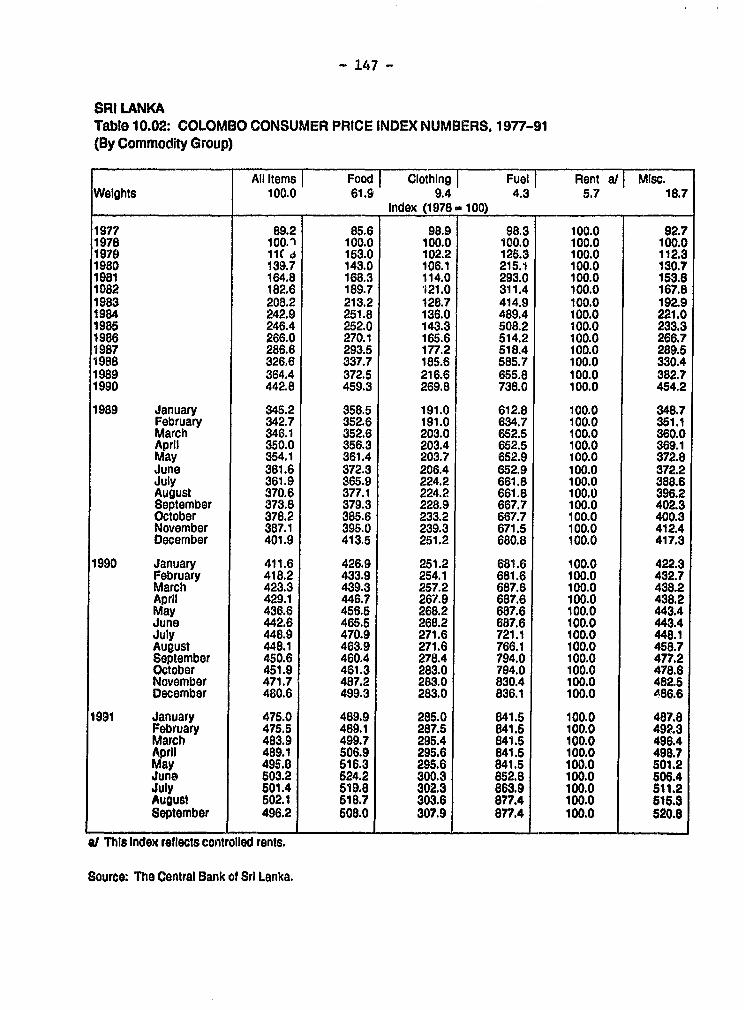
- 147 -
SRI LANKATable 10.02: COLOMBO CONSUMER PRICE INDEX NUMBERS, 1977-91(By Commodity Group)
All Items Food Clothing Fuel Rent a/I Misc.Weights 100.0 61.9 9.4 4.3 5.7 18.7
Index (1978- 100)
1977 89.2 85.6 98.9 98.3 100.0 92.71978 100.1 100.0 100.0 100.0 100.0 100.01979 1ff d 153.0 102.2 125.3 100.0 112.31980 139.7 143.0 106.1 215.1 100.0 130.71981 164.8 168.3 114.0 293.0 100.0 153.81082 182.6 189.7 121.0 311.4 100.0 167.81983 208.2 213.2 128.7 414.9 100.0 192.91984 242.9 251.8 136.0 489.4 100.0 221.01985 246.4 252.0 143.3 508.2 100.0 233.31986 266.0 270.1 165.6 514.2 100.0 266.71987 286.6 293.5 177.2 518.4 100.0 289.51988 326.6 337.7 185.6 585.7 100.0 330.41989 364.4 372.5 216.6 655.8 100.0 382.71990 442.8 459.3 269.8 738.0 100.0 454.2
1989 January 345.2 358.5 191.0 612.8 100.0 348.7February 342.7 352.6 191.0 634.7 100.0 351.1March 346.1 352.6 203.0 652.5 100.0 360.0April 350.0 356.3 203.4 652.5 100.0 369.1May 354.1 361.4 203.7 652.9 100.0 372.8June 361.6 372.3 206.4 652.9 100.0 372.2July 361.9 365.9 224.2 661.8 100.0 388.6August 370.6 377.1 224.2 661.8 100.0 396.2September 373.8 379.3 228.9 667.7 100.0 402.3October 378.2 385.6 233.2 667.7 100.0 400.3November 387.1 395.0 239.3 671.5 100.0 412.4December 401.9 413.5 251.2 680.8 100.0 417.3
1990 January 411.6 426.9 251.2 681.6 100.0 422.3February 418.2 433.9 254.1 681.6 100.0 432.7March 423.3 439.3 257.2 687.6 100.0 438.2April 429.1 446.7 267.9 687.6 100.0 438.2May 436.6 456.5 268.2 687.6 100.0 443.4June 442.6 465.5 268.2 687.6 100.0 443.4July 448.9 470.9 271.6 721.1 100.0 448.1August 448.1 463.9 271.6 766.1 100.0 458.7September 450.6 460.4 278.4 794.0 100.0 477.2October 451.9 461.3 283.0 794.0 100.0 478.6November 471.7 487.2 283.0 830.4 100.0 482.5December 480.6 499.3 283.0 836.1 100.0 486.6
1991 January 475.0 489.9 285.0 841.5 100.0 487.8February 475.5 489.1 287.5 841.5 100.0 492.3March 483.9 499.7 295.4 841.5 100.0 496.4April 489.1 506.9 295.6 841.5 100.0 498.7May 495.8 516.3 295.6 841.5 100.0 501.2June 503.2 524.2 300.3 852.8 100.0 506.4July 501.4 519.8 302.3 863.9 100.0 611.2August 502.1 518.7 303.6 877.4 100.0 616.3September 496.2 508.0 307.9 877.4 100.0 520.8
a/ ThIs Index reflects controlled rents.
Source: The Central Bank of Sri Lanka.
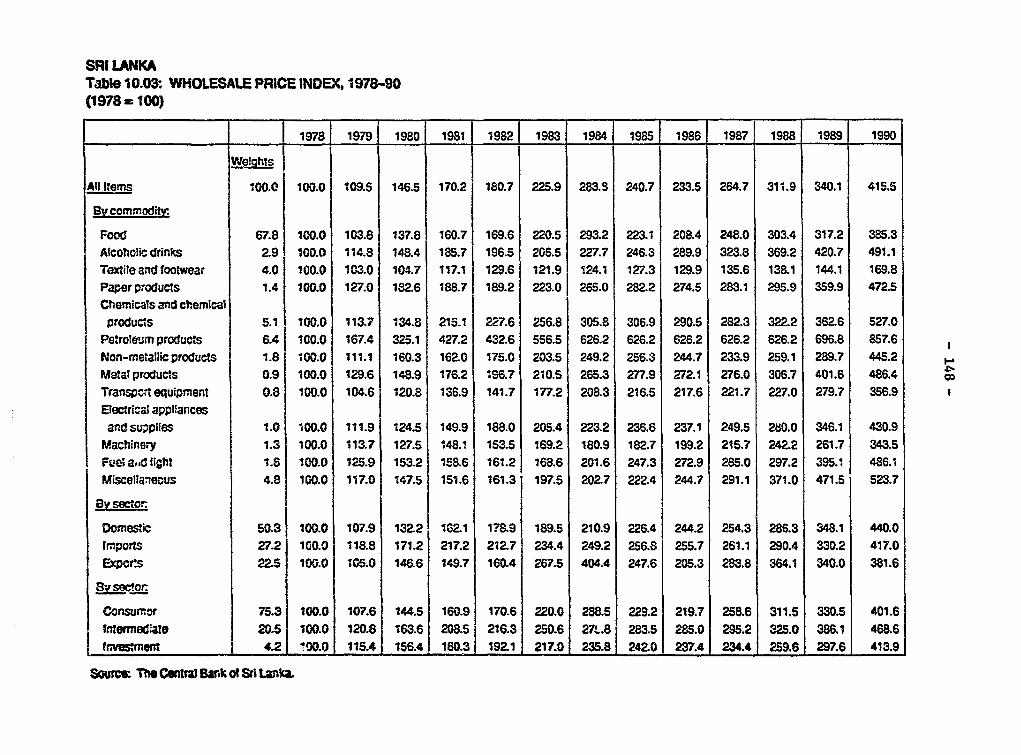
SRI LANKATable 10.03: WHOLESALE PRICE INDEX, 1978-90(1978 = 100)
1978 1979 1980 1981 1982 1983 1984 1985 1986 1987 1988 1989 1990
Weights
All Items 100.0 100.0 109.5 146.5 170.2 180.7 225.9 283.S 240.7 233.5 264.7 311.9 340.1 415.5
Bycommodity
Food 67.8 100.0 103.8 137.8 160.7 169.6 220.5 293.2 223.1 208.4 248.0 303.4 317.2 385.3Arcoholic drinks 2.9 100.0 114.8 148.4 185.7 196.5 206.5 227.7 246.3 289.9 323.8 369.2 420.7 491.1Textile and footwear 4.0 100.0 10&0 104.7 117.1 129.6 121.9 124.1 127.3 129.9 135.6 13&1 144.1 169.8Paper products 1.4 100.0 127.0 182.6 188.7 189.2 223.0 265.0 282.2 274.5 283.1 295.9 359.9 472.5Chemicals and chemicalproducts 5.1 100.0 113.7 134.8 215.1 227.6 256.8 305.8 306.9 290.5 282.3 322.2 362.6 527.0
Petroteum products 6.4 100.0 167.4 325.1 427.2 432.6 556.5 626.2 626.2 626.2 626.2 626.2 696.8 857.6Non-metallic products 1.8 100.0 111.1 160.3 162.0 175.0 203.5 249.2 256.3 244.7 233.9 259.1 289.7 445.2Metal products 0.9 100.0 129.6 148.9 176.2 1.96.7 210.5 265.3 277.9 272.1 276.0 306.7 401.6 486.4Transpcrt equipment 0.8 100.0 104.6 120.8 136.9 141.7 177.2 208.3 216.5 217.6 221.7 227.0 279.7 356.9Electrical appliancesand suppiies 1.0 100.0 111.9 124.5 149.9 188.0 205.4 223.2 236.6 237.1 249.5 280.0 346.1 430.9
Machinery 1.3 100.0 113.7 127.5 148.1 153.5 169.2 180.9 182.7 199.2 215.7 242.2 261.7 343.5Fuel a,id fight 1.8 100.0 125.9 153.2 158.6 161.2 168.6 201.6 247.3 272.9 285.0 297.2 395.1 486.1Miscellaneous 4.8 100.0 117.0 147.5 151.6 161.3 197.5 202.7 222.4 244.7 291.1 371.0 471.5 523.7By Xsctor I
Domegic 50.3 | 100.0 107.9 132.2 12.1 178.9 189.5 210.9 226.4 244.2 254.3 286.3 348.1 440.0Imports 27.2 100.0 11&8 171.2 217.2 212.7 234.4 249.2 256.8 255.7 261.1 290.4 330.2 417.0Expcrs 22.5 100.0 105.0 146.6 149.7 160.4 267.5 404.4 247.6 205.3 283.8 364.1 340.0 381.6
Consuwror 75.3 100.0 107.6 144.5 160.9 170.6 220.0 288.5 229.2 219.7 258.6 311.5 330.5 401.6Intermediate 20.5 100.0 120.8 163.6 2085 216.3 250.6 27L,8 283.5 285.0 295.2 325.0 386.1 468.6ftiovXmemt 4.2 '0.0 1l15.4 156.4 160.31 192.1 217.0 235.8 242.0 237.4 234.4 259.6 297.6 413.9
Sours The Cmtra Balrk of Sri LanX;&
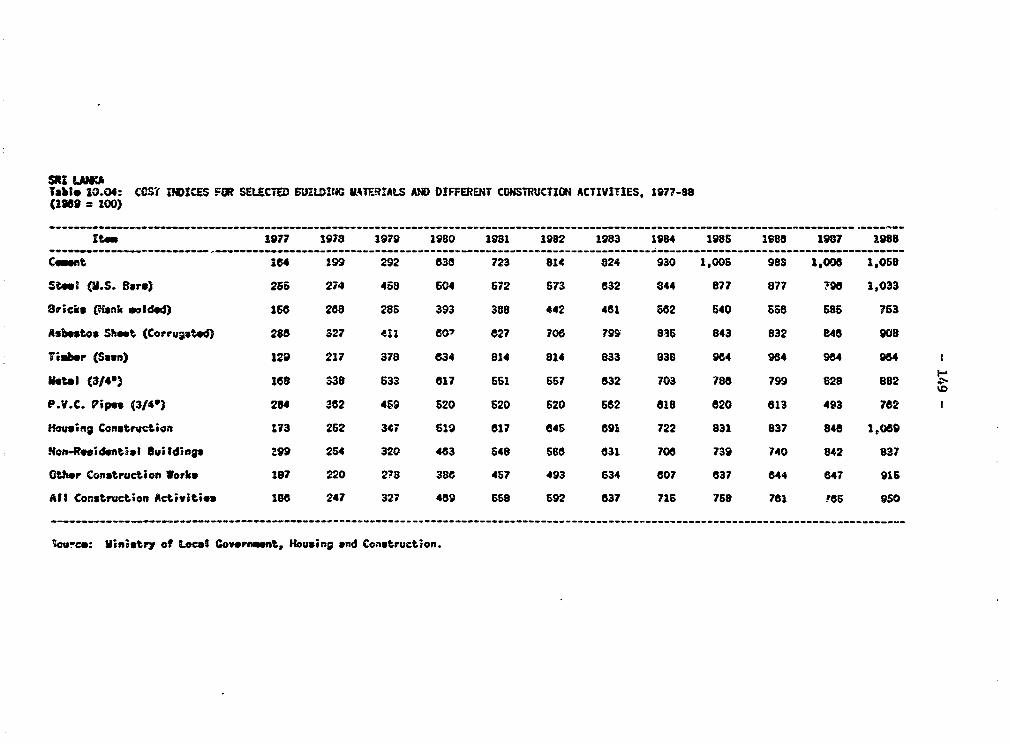
Table 10.04: CCSuf VICES FOR SELECTED BUILDING IATERIALS AND DIFFERENT CONSTRUCTION ACTIVITIES, 1977-88(1969 = 100)
It.. 1977 1978 1979 1980 1931 1982 1983 1984 1986 1980 1987 1988
Cent 104 199 292 638 723 814 824 930 I,O1 S 983 1,000 1,068
stee (U.S. Bare) 266 274 458 604 672 573 032 S44 877 877 790 1,033
Bricks (Hank solded) 156 208 286 393 388 442 481 662 640 555 585 763
Asbestos Shet (Corrupted) 288 327 411 807 027 708 799 835 843 832 840 908
Timber (Sawn) 129 217 378 634 814 814 833 838 984 984 964 964 1
Metal (314') lZS 338 633 817 661 6?7 832 703 788 799 828 882 4
P.V.C. Pipes (3140) 214 382 459 520 520 520 562 618 820 813 493 762
Houing Construction 173 262 347 619 817 045 691 722 831 837 840 1,089
lion-Residenti.l Buildings 199 254 320 483 548 588 031 706 739 740 82 837
otser Construction Works 187 220 278 388 457 493 634 807 837 644 647 915
All Construction Activities 188 247 327 489 558 692 837 716 768 781 ?85 950
'ouwc: Ministry of Locl Govrnmwnt, Housing and Construction.
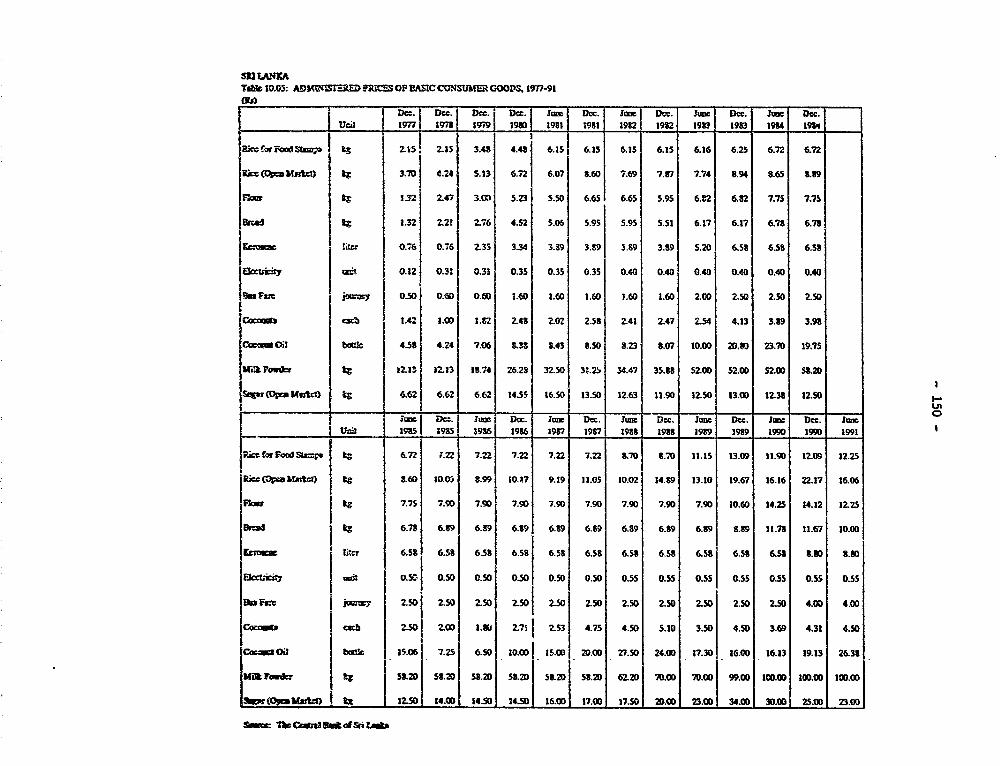
SE1 IAI4TATdSc 10.05: AJD NL;ERE IPRCSOF BASIC CONSUME GOODS. I977-91
T~ DG. D Ote. 5 Dcc. 3 Drc. 3ux Dcc. June Dcc. Ju Dec.Ucii 14:72 1:7 1999 1930 1981 1981 1982 1982 1983 1983 1984 1984
Uc: orfForzdmS 8 2.15. 2S15 3.48 4.41 6.15 6.15 6.15 6.15 6.16 6.25 6.72 6.72
R;= (O8S lNk) Is 3.70 4.24 5.13 6.72 6.07 8.60 7.69 7.87 7.74 8.94 &65 389
FAm 8 1.32 z47 3.00 5.23 5.50 6.65 6.65 5.95 6.82 6.82 7.75 7.75
Brad kg 1.32 2.21 2.76 4.52 5.06 5.95 5.95 5.S 6.17 6.17 6.78 6.78
gc:s litcw 0.76 0.76 2.35 3.4 3.89 3.99 3.89 3.89 5.20 6.53 6.58 6.S3
ccuiry omit 0.12 0.31 0.31 0.35 0.35 0.35 0.40 0.40 0.40 0.40 0.40 0.40
19 a Ft iwcY 050 0.6 0.60 L.60 1.60 1.6 1.60 1.60 2.00 2.50 2.50 2.5D
Cbcau cac 1.42 1.05 3..2 2.48 2.02 2.58 2.41 Z47 2.54 4.13 3.39 3.93
ct= Oil beak 4.58 4.24 7.06 U3S 8.43 8.50 8.23 8.07 10.00 20.W 23.70 19.75
U,i1k 8 t I2.33 1Z23 18.74 26.28 32.50 31.2. 34.47 35.88 52.00 52.00 52.OD 53.2D
Supr(OpcuMatti) U j.62 6.62 6.62 14.55 16.50 13.50 12.63 11.9D 12.50 13.00 12.38 12.50
*wz Dc:. ;WC Dcc. lzne Dec. Junc Dec. June Dcc. Jun Dcc. June O___________ us3l 1935 19S5 E986 1986 1987 1987 1988 1988 1989 1989 1990 1990 1991
tRict f=or , 83 t 6.72 1.22 7.22 7.22 7.22 7.22 .70 S.79 11.15 13.09 11.90 12.09 12.25
Ri;CcOpMxItC? tg 8.60; 20.05 899 10.17 9.19 11.05 10.02 14.S9 13.10 19.67 16.16 22.17 16.06
Flm ts3 7.75 7.90 7.99 7.90 7.90 7.9D 7.90 7.90 7.9D 10.60 14.25 14.12 IZ25
[B=d tg 6.73 6.91 6.-9 6.19 6.89 6.89 6.89 6.89 6.89 8.39 11.73 11.67 10.00
|cmumc litc. 6.58 6.53 6.58 6.58 6.58 6.58 6.58 6.58 6.53 6.53 6.5S 8.8D 3.80
JBccieiZy Y.50 0.50 0.50 0.50 0.50 0.50 0.55 0.55 0.5S 0.55 0.55 0.5S 0.55
|>n Fwc |ji=n 250| 2.50 2.50 2.50 2.50 2.50 2.50 2.50 2.50 2.50 2.50 4.00 4.00
Cc1, I 2.50 ZOD 1.* 2.71 j253 4.75 4.50 5.10 3.50 4.50 3.69 4.31 4.50
CAewo0 bi Xc 15106 7.25 6.50 i0.o31 - 5.03 2000 27.50 24.00 17.30 16.00 16.13 19.13 2631
MUilk raicr itw 5S2D1 58.2D 582D 5.2D01 1 820 58.2D 62.20 70.00 70.0 99.00 100.00D IO.00 100.0
.pi(SUam 3) __t_ 12.501 14.00 14.5D 14.501 16.010 17.00 17.50, 2D.D0 23.001 34.00 30.00 25.00 23.00
3 1oc5zu a of C2 L t
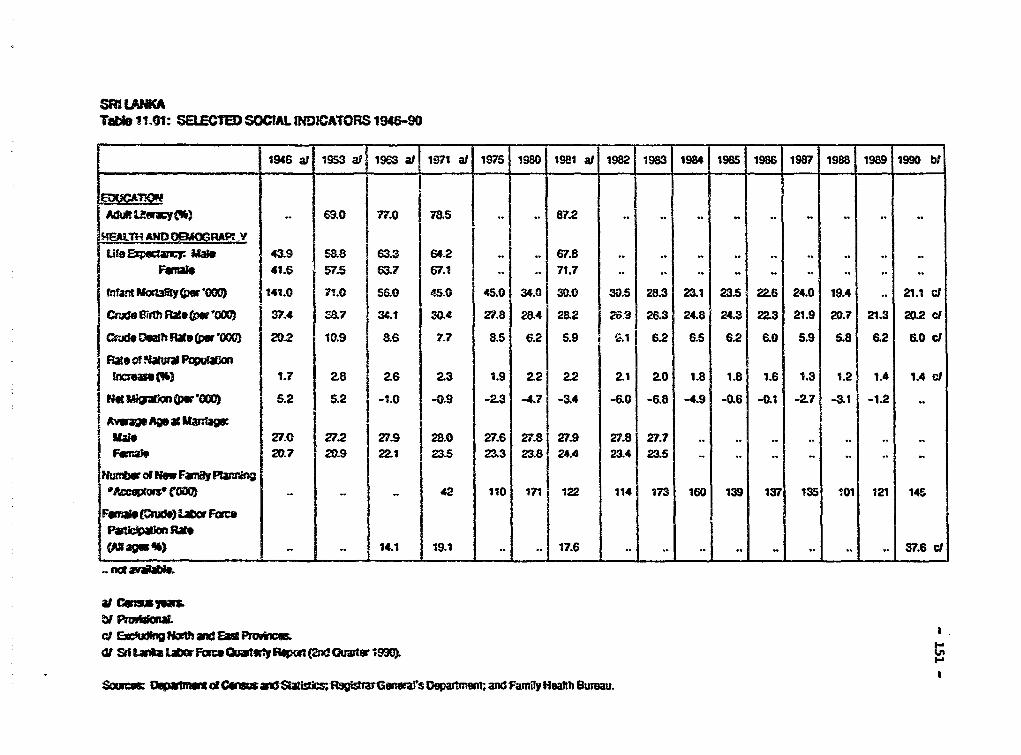
SR LANKATabe 11.1: SELECTED SCIAL moiCATORS 196-90
1946 ar 19S3 a? 3 at 1 1971 a 97 1980 1981 a| 192 1983 94 1985 196 198 1988 1989 1990 bl
A" SL8UUc7 69.0 77.0 7s. .. 87.2 .. .. .. .. .. ..
!M!h AND OgERAI, LifeEamy_ Ma__ 43-9 588 63.3 64.2 .. .. 67.8 .. .. .. .. .. ..
F*g 41.6 57ZS 637 67.1 ... 71.7 .. .. .. .. ..
rfrira!m3tF"(WuG) 1147.0 71.0 56.0 45.0 45.0 34.0 30.0 30.5 28.3 23.1 23.5 22.6 24.0 19.4 .. 21.1 clCuf ( tpmwM 37.4 87 3C.1 30.4 271.8 28.4 2&2 26.9 26.3 24.8 24.3 22.3 21.9 20.7 21.3 20.2 dCh Qt nthR Pp ur'0M 292 10.9 86 7.7 8.5 6.2 5.9 S.1 6.2 6 62 60 5.9 5.8 6.2 6.0 dRateIof Nga" ppuWJu Want%) 1.7 1 8 26 Z3 1.9 2.2 2.2 21 2.0 1.8 1.8 1.6 1.3 1.2 1.4 1.4 d
N*t mWarm am 1000 5.2 5.2 -1.0 -0.9 -2.3 -4.7 -3.4 -6. -6.8 -49 -0.6 -0 -2.7 -3.1 -1.2
USs 27.0 27.2 27.9 28.0 27.6 27.8 27.9 27.8 27.7 .. .. .. ..Fifna* 2D.7 20.9 22.1 23.5 23.3 238 24.4 23.4 23.5 .. .. .. ..
?Nt3 N of MmP Famty InnA£outsliXlt -_ .. .. _ 142 110 171 122 114 173 160 139 137 135 101 121 145
tFma C) La Famel
(Pi *am %) .. | 14.1 19.1 .. 17.6 . .. .. _ 37.6 c- not wafN
a, COrOsuinICl Pmxfdng
af SdLtaCW FomQ=twP? pqow(2ndQuart 199( ESourc; V1m_utoll Con1us1MaUsRwgisZiarGum?s Depattlrn and family Hsalthaureu.
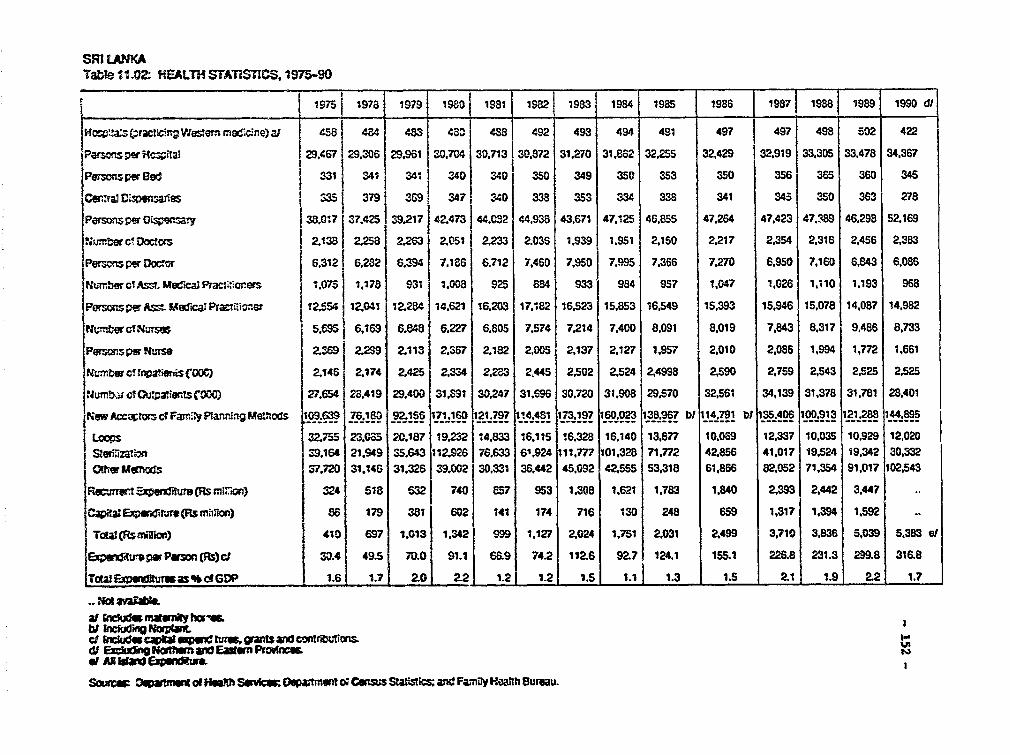
SRI LANKATabe 11.02 HEALh rSTATISTiCS. 1975-90
1975 1978 19739 19a0 | 1981 1552 1983 1984 1985 1986 1987 |198 1989 190d
HKOSV (ra cing vJes:em mqd4ne) aI 458 484 483 48^ 488 492 493 494 491 497 497 498 502 422
Persopser H=m tal 29.467 29.306 29.961 30.704 30.713 30,972 31,270 31,862 32,255 32,429 32fl19 33.30S 33.478 34.367
Perscns r eed 3S31 341 341 340 340 350 349 350 353 350 356 365 360 345
&csrva dC.risares 335 379 359 347 34 338 353 334 338 341 34S 350 363 278Pers=ns per Dcisensary 38,0:7 37.425 39.217 42.473 | 44.032 44.938 43,671 47,125 46,855 47,264 47.423 47A189 46,298 52,169
?.'jm rr ck Doccs 2!138 2.258 2.263 2051 2233 2.036 1,939 1.951 2,150 2,217 2.354 2,316 2,456 2,383
Persos per DOtor 6.3121 6.282 6.394 7.186 6.712 7,460 7,950 7,995 7.366 7.270 6.950 7,160 6,843 6.086
Number cl Ass?. MeC=M Practi:1rers 1.075 1.178 931 1,008 925 884 933 984 957 1,047 1,026 1,110 1.193 968
Perscs per ARssL MedcrayPrac ?..Uner 2554 12041 12284 14.621 16.203 17 .182 16,523 15,653 16,549 15,393 15.946 15,078 14,087 14,982
Nurn eC c1Nursm 5.695 6,169 6.848 6.227 6,805 7.574 7,214 7.400 8.091 8.019 7.843 8.317 9.4B6 8.733
Pervnsps Nperse 2.Mm9Z 22S9 2113 2.367 2.182 2,005 2,137 2.127 1,957 2,010 2,086 1,994 1,772 1,661
NuYrr inga?iamisCCCG 2,145 2174 2.425 2.334 2283 2.445 2.502 2.524 2,4998 2,590 2,759 2,543 2,525 2,525
WNn4P-cM, OUTPOnti S C) 27.654 28.419 29.400 31.891 30,247 31.696 30.720 31.908 29.570 I32,561 34,139 31,378 31,781 28.401
rew Aca;t=s ct Famy Plarning Me>oMds 109.639 76.183 92.156 71.160 121.797 14.481 173.197 160.023 138.967 bW 114,791 b/ 15.406 100,913 121,288 144,895
LOWVs 32.755 23.085 20.187 19.232 14.833 16.115 16.328 16,140 13.877 10.069 12,337 10.035 10.929 12,020Szevization 39.164 21,949 35.643 112.926 76.633 6'.924 11,777 101,328 71.772 42.856 41,017 19,524 19,342 30,332O CXirMum' ds 37.720 31.146 31,325 39.002 30.331 36.442 45.092 42,555 53,318 61,856 82,052 71.354 91,017 102,543
rs=nw.1 EenwidureMRs mil,on) 324 518 6321 740 857 953 1.308 1.621 1.783 1.840 2.393 2,442 3,447
{CtsaolEw!urxre(t#Rmiiliorn) 86 179 381 602 141 174 716 130 248 659 1,317 1,394 1,592To (RRsniiM l) 410 697 1.013 1.S42 999 1.127 2024 1.751 2.031 2.499 3,710 3,836 5,039 5,383 of
EvwOnutg,swPw=sn(Rs)c 30.4 49.5 70.0 91.1 |669 74.2 112.6 92.7 124.1 155.1 226.8 231.3 299.8 316.8
|ToCJE=wMurmas d GOPGD 3.6 1.71 2.01 2.2 1.2 1.2 1 .5 I 1.1 J 1.3 1.S t | 1.9 2.21 1.7
.. Nw avait
ai Exc hNesan d Eah'wn Pencof l M'"'' E Av Poviums
Soax=u 3zp1t1 of HWapjft SN'; Dopj6-tm N C4 Stastj and Farrh? HWeafth Bureau.
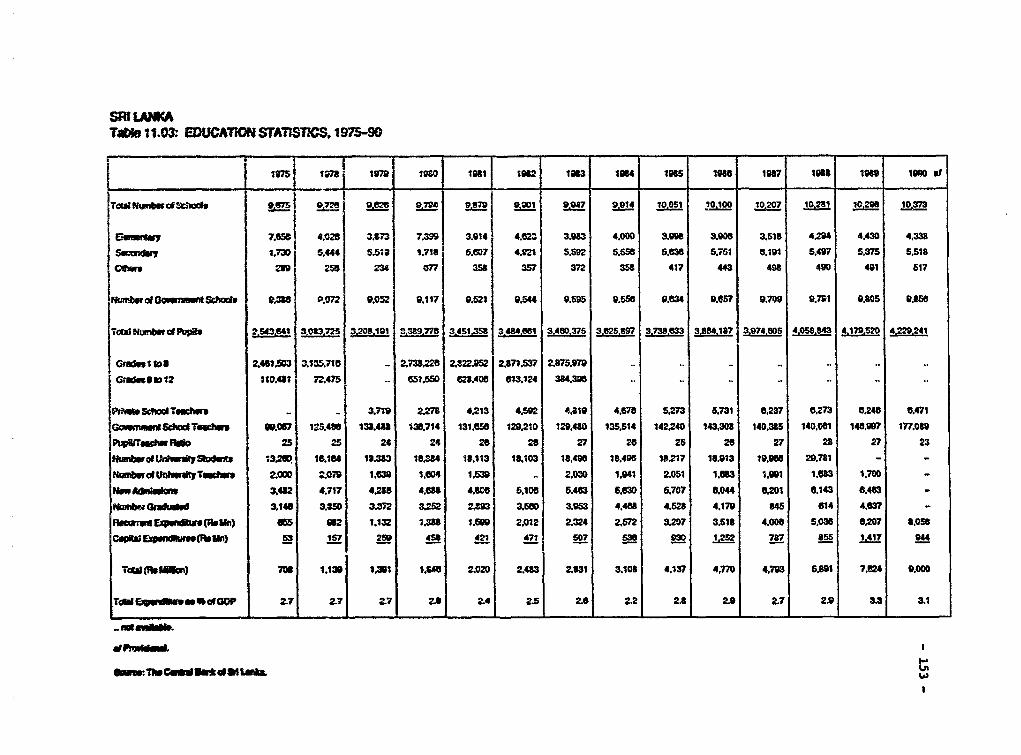
SMILAWCATiae 11.03: EDUCATiO STATisTcs. 1975-90
I7 lt-a 17 lto 10671 1062 13 1064 1M5 18 1987 106 710 100 at
TCld N 4f t 9,1S75 9.728 9J7 . 9^7 90 1 9.W7 9pl 10.05100 10,207 10.21 10.26 10.373
7.C56 c.02a 3.73 7.9 3.914 4.62 3.93 4.000 3.908 3.9s 3.518 4.24 4,430 4.1.730 5.444 5.519 1.718 S.607 4.921 5.52 5.55 5.63 6.751 0.191 5.407 5.375 5.S18
c0w1 219 256 234 077 358 57 372 358 417 443 498 490 401 517
mbsrg douw n a Sdeoce 9.35 P.72 9.052 9.117 9.21 9 9.544 9.5 0.556 9.0634 9.6 9.709 9.791 9.805 9.656
TCW WIP upit n dPi 2.3,5C1 3.0".32 .2 " . 3 . 7 3.48.t= 3,"40.e 374 3 5 3,7.8C 3S4,19a37 3.974.eos 4.058.83 4.179.52 4.29241
G sn so I 2toa.4613 3,125.715 - 272 2 ,5 2,s71.537 2875.979 .. .. .. ..9..GQas01oZ 110.481 2475 - 651.50 6.406 613.124 384.3,5 .. .. .. ..
Pfu $;hod TuoIm . _ 3.719 2.7 4213 4.592 4,S19 4.6 5.273 5.731 8.237 60273 6246 0.471G _miS&IdTmchwv 0.067 125.4W 133.4AU $3714 131.65 129210 129.43 135.514 142.240 143.308 140.3B5 140.061 146,997 177.089Pu8Ii'mF , o 25 25 24 24 26 26 27 26 25 26 27 28 27 23NIUIdOuI*twyJUw8 13.200 16.164 18.3 16.384 1S.113 1S.;03 18.496 1B.496 18.217 18.913 19.066 29.781 - -HAbp oldUwft,Tvwl 2,0Q0 2 t79 1.63 .eo4 1t,39 .. 2.030 1.941 2.051 1.683 1.991 1.683 1.700 -N i _Atm,Ion 3.412 4.717 4.2 4.688 4.306 6.106 5.463 50630 6.707 6.044 6.201 0.143 8.463 -Num6w GratAdid 3.148 3.35 3.72 3.22 2893 3.560 3.63 4.468 4.528 4.179 645 614 4.67 -PdcwwRExp.df(Rut) so5 02 1.132 1.388 1.509 2,012 2324 2.572 3207 3.518 4.006 6.036 0.207 6.056Cspf OWwwnJr(FbUn) 53 157 259 458 421 471 507 536 93 1t252 787 855 1.417 44
TOtd Ro w) 7a n1. 1,3;t 1.4 2.020 2.483 2.U31 3.108 4.137 4,770 4.73 65.91 7.624 90000
pTa E__w 8 *s g Gd P 2.7 2.7 2.7 2.8 Z4 2.5 2.6 2.2 2.6 2.9 Z7 2.9 3 3.1
I-_:m1bCdU *d1Laa
U'
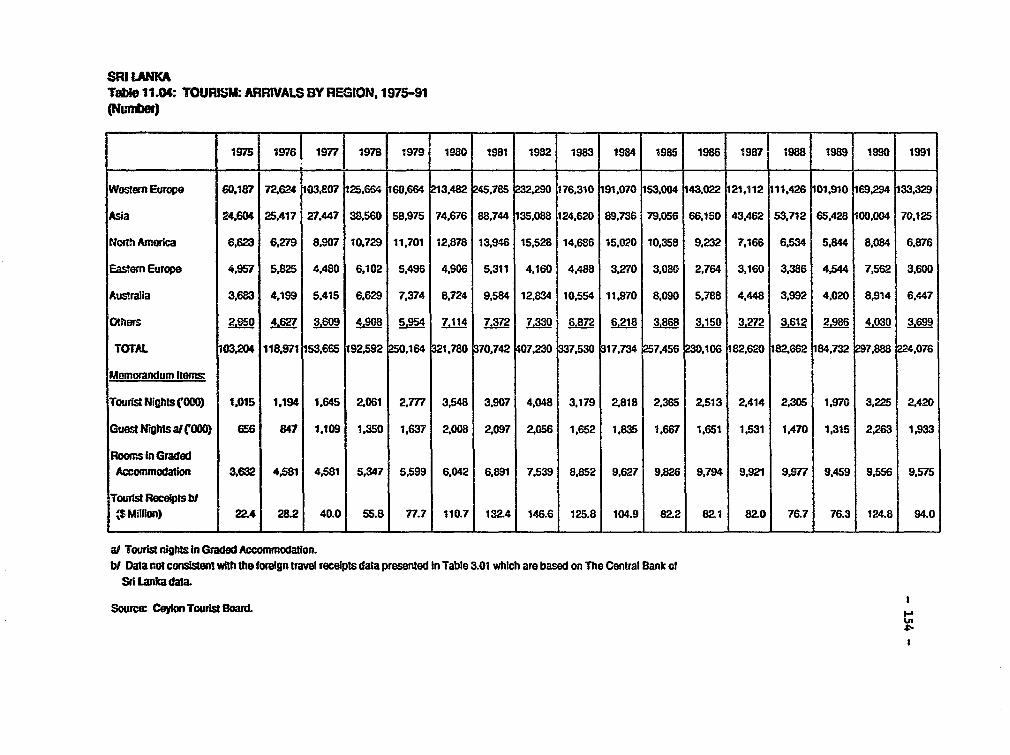
SM LANK1TaU 11.04: TOURISM: ARRWALS BY REGION, 1975-91(Nuiter)
1975 1976 1977 | 1978 1979 1980 1981 1982 1983 1984 1985 1986 1987 1988 1989 1990 1991
Western Eurcpe 60,187 72,624 103,807 125.664 160,664 213,482 245,785 176,310 91.070 153.004 143.022 21,112 111,426 101,910 69,294 133,329
Asia 24.604 25.417 27.447 38,560 58.975 74.676 88.744 135,088 24,620 89.736 79,056 66,150 43,462 53.712 65,428 00.004 70,125
North America 6,823 6.279 8.907 10,729 11,701 12.878 13,9486 15,528 14.686 15,020 10,358 9.232 7.166 6,534 5,844 8,084 6.876
Easeren Europe 4,957 5,825 4.480 6,102 5,496 4,906 5,311 4.160 4.488 3,270 3.080 2,764 3.160 3,386 4,544 7,562 3,600
Australia 3,683 4,199 5.415 6.629 7.374 8,724 9,584 12,834 10.554 11,970 8.090 5.788 4.448 3,992 4,020 8,914 6,447
Others 2,SSO 4.627 3.09 4.9Q 5,954 7,114 7,372 7330 6872 6.218 3.868 3.150 3 272 3.612 2,986 4,030 3.699
TOTAL 03,204 118,971 153,665 192.592 250,164 321,780 370,742 47,230 337,530 317,734 257,456 230.106 82.620 82,662 84,732 7,888 4,076
Memorandum ltems
Tous NighIs (COC) 1,015 1,194 1,645 2,061 2,777 3,548 3.907 4,048 3.179 2,818 2,365 2,513 2,414 2,305 1,970 3.225 2,420
Guest Nights alfOO) 656 847 1,109 1,350 1,637 2,008 2,097 2,056 1.652 1,835 1,667 1,651 1,531 1,470 1,315 2.263 1,933
Rooms In GradedAccommodation 3,632 4,581 4,581 5.347 5,599 6,042 6.891 7539 8.852 9,627 9,826 9,794 9.921 9.977 9.459 9.556 9.575
Tourist Receips bIsS Million) 22.4 28.2 40.0 55.8 77.7 110.7 132.4 146.6 126.8 104.9 82.2 821 820 76.7 76.3 124.8 94.0
af TourLst nights in Graded Accommodation.bl Data not consistent with the foreign travel receipts data presented In Table 3.01 which are based on The Central Bank of
Sr Lanka data.
Source: Ceylon Tourist Board.
4'-

MAP SECTION
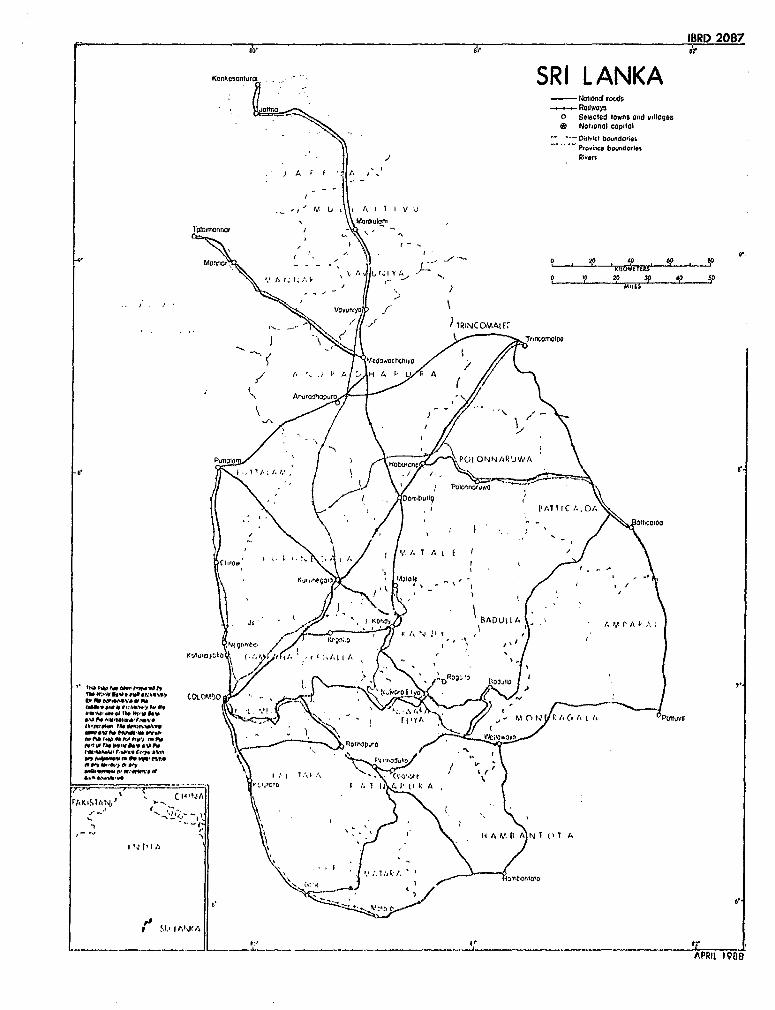
IBRD 2087
Kankesornturcl SRI LANKA- National rocido
all no ~ ~ ~ ~ ~ ~ ~ ~ ~ - Railwayso Selected iowns and vi110ges* National capital
WO; bt,k , tonnda'.sP'O'ime bo,,dodlts
j A F F |A ,
, , A,I U i Ti-i I U
ManuililonmTolatimoa,n -I
I Y
4' ~~~Mocirro. - - -,- i, rP 60 Y tO°* a a , ,.IY'.' -j p. t. t. W ' v '- ,o Ip ao p
I ~ ~ ~~~~~~~~~~~~~'4 , VOvaniy Jr
-> J - ) TRINCOMAtF,f
| edowochcniya /
* Anuasd',pura
Pullk I . i P ONN V W A
~~'~ *h \'0 AM Off t'WPD
?AOWA/ 55,50'\ 'LOiO ; \
iS ~ ~ ~ ~ \ I<~'i i' it,hull tTTI . /
0.' 4'.5I '5. '/vOk'. I '..1-
\iii' *,t.'d.s -F / Ci lJ ci, (, As / K PoltiAl
Iui iui . .'wl i biiS\iS0.Wp ft-40Oft. I
010 ~ ~ Po ,06044 r'1 . I -"- I A A / , A
i,S,Chi rr t,thii t.'I S 3AS3S *._ )J7
r4rXw _- . Po "W got k
0" 11O .1"IMOP lre*i v_)Roinopvo -Of'0 I.9A.A.A isi k siSO m " f ori , i i"i%
elEvW.v C' aviv-k'.,. iv ~ ~ ~ ~ ~ ~ ~ ~ ~ F' Ik PA *'b7b@ Cr a g /. I 1., ."4 4ikA
, ~ ,. \\ | ' \ li A iM t1 A)N T 1i t A I
5 5.l1 i I A?.I A
i~ C:-' ARI
APRIL^ )D88