Embed Size (px)
Citation preview
ed: JS / sa: PY, CS
FULLY VALUED Last Traded Price ( 4 May 2018): S$2.29 (STI : 3,545.38)
Price Target 12-mth: S$2.05 (-10% downside) (Prev S$2.20)
Analyst Sachin MITTAL +65 66823699 [email protected]
What’s New 1Q18 earnings of S$62.8m (-13% y-o-y) marked 7
th
consecutive quarter of y-o-y earnings decline; excluding
one-offs, earnings were 8% below our estimate
Trading at 9x FY18F EV/EBITDA versus regional 7x
average despite prospects of EBITDA decline
Maintain FULLY VALUED with a revised TP of S$ 2.05
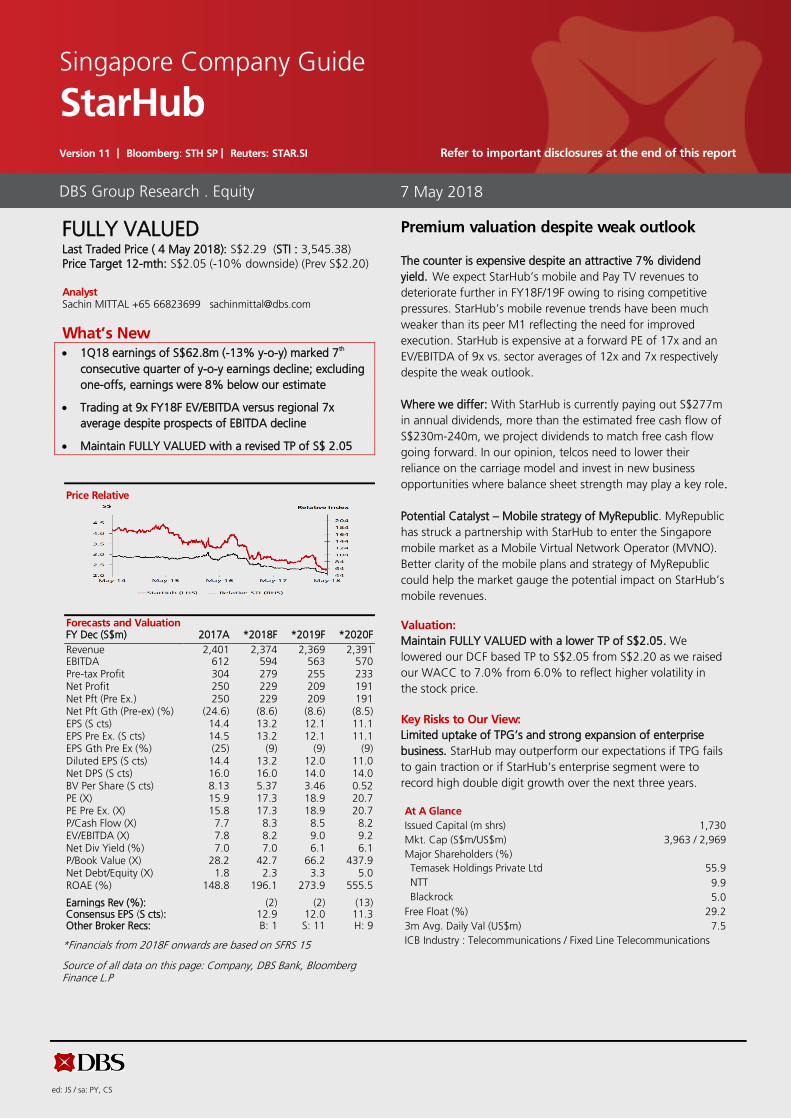
Price Relative
Forecasts and Valuation FY Dec (S$m) 2017A *2018F *2019F *2020F
Revenue 2,401 2,374 2,369 2,391 EBITDA 612 594 563 570 Pre-tax Profit 304 279 255 233 Net Profit 250 229 209 191 Net Pft (Pre Ex.) 250 229 209 191 Net Pft Gth (Pre-ex) (%) (24.6) (8.6) (8.6) (8.5) EPS (S cts) 14.4 13.2 12.1 11.1 EPS Pre Ex. (S cts) 14.5 13.2 12.1 11.1 EPS Gth Pre Ex (%) (25) (9) (9) (9) Diluted EPS (S cts) 14.4 13.2 12.0 11.0 Net DPS (S cts) 16.0 16.0 14.0 14.0 BV Per Share (S cts) 8.13 5.37 3.46 0.52 PE (X) 15.9 17.3 18.9 20.7 PE Pre Ex. (X) 15.8 17.3 18.9 20.7 P/Cash Flow (X) 7.7 8.3 8.5 8.2 EV/EBITDA (X) 7.8 8.2 9.0 9.2 Net Div Yield (%) 7.0 7.0 6.1 6.1 P/Book Value (X) 28.2 42.7 66.2 437.9 Net Debt/Equity (X) 1.8 2.3 3.3 5.0 ROAE (%) 148.8 196.1 273.9 555.5 Earnings Rev (%): (2) (2) (13) Consensus EPS (S cts): 12.9 12.0 11.3 Other Broker Recs: B: 1 S: 11 H: 9
*Financials from 2018F onwards are based on SFRS 15
Source of all data on this page: Company, DBS Bank, Bloomberg Finance L.P
Premium valuation despite weak outlook
The counter is expensive despite an attractive 7% dividend
yield. We expect StarHub’s mobile and Pay TV revenues to
deteriorate further in FY18F/19F owing to rising competitive
pressures. StarHub’s mobile revenue trends have been much
weaker than its peer M1 reflecting the need for improved
execution. StarHub is expensive at a forward PE of 17x and an
EV/EBITDA of 9x vs. sector averages of 12x and 7x respectively
despite the weak outlook.
Where we differ: With StarHub is currently paying out S$277m
in annual dividends, more than the estimated free cash flow of
S$230m-240m, we project dividends to match free cash flow
going forward. In our opinion, telcos need to lower their
reliance on the carriage model and invest in new business
opportunities where balance sheet strength may play a key role.
Potential Catalyst – Mobile strategy of MyRepublic. MyRepublic
has struck a partnership with StarHub to enter the Singapore
mobile market as a Mobile Virtual Network Operator (MVNO).
Better clarity of the mobile plans and strategy of MyRepublic
could help the market gauge the potential impact on StarHub’s
mobile revenues.
Valuation:
Maintain FULLY VALUED with a lower TP of S$2.05. We
lowered our DCF based TP to S$2.05 from S$2.20 as we raised
our WACC to 7.0% from 6.0% to reflect higher volatility in
the stock price.
Key Risks to Our View:
Limited uptake of TPG’s and strong expansion of enterprise
business. StarHub may outperform our expectations if TPG fails
to gain traction or if StarHub’s enterprise segment were to
record high double digit growth over the next three years.
At A Glance Issued Capital (m shrs) 1,730
Mkt. Cap (S$m/US$m) 3,963 / 2,969
Major Shareholders (%)
Temasek Holdings Private Ltd 55.9
NTT 9.9
Blackrock 5.0
Free Float (%) 29.2
3m Avg. Daily Val (US$m) 7.5
ICB Industry : Telecommunications / Fixed Line Telecommunications
DBS Group Research . Equity
7 May 2018
Singapore Company Guide
StarHub Version 11 | Bloomberg: STH SP | Reuters: STAR.SI Refer to important disclosures at the end of this report
Page 2
Company Guide
StarHub
WHAT’S NEW
Bottomline on a downward spiral
Earnings contraction continued despite lower opex. Earnings
of S$62.8m (-13% y-o-y, +345% q-o-q) were in line with our
expectations of S$61m. However, excluding ~S$5m one offs
for reversals of accruals, underlying net profit of S$57.2m
was below our expectations of S$61m. Key disappointment
came from higher than expected rise in costs despite lower
service revenue. Cost of services (mainly for content costs)
rose to S$118m, up 11% y-o-y despite pay TV revenue
declining 10% y-o-y.
Mobile service revenue contraction of 7% y-o-y is a concern.
Revenue of S$ 561m (-4.7% y-o-y, -13.6% q-o-q) was in line
with our expectations of S$ 564m. Mobile revenue after
restatements contracted 7% y-o-y driven by subscriber losses
and contraction of ARPUs. StarHub’s subscriber base
contracted 1% q-o-q which could be due to an aggressive
M1 poaching high-end subscribers with its MySim plans.
Postpaid ARPU also declined 4% y-o-y driven by declining
data yields and higher contract amortisation costs. Pay TV
revenues entered the ninth consecutive quarter of annual
declines, contracting 10% in 1Q18. Pay TV subscriber losses
continued in 1Q18 and nearly 79,000 subscribers,
representing 17% of StarHub’s current subscriber base, have
now left StarHub’s Pay TV services since 1Q16. Enterprise
services expanded 18% y-o-y driven by the consolidation of
Accel Systems and D’Crypt partially offsetting lower mobile
and Pay TV revenues.
Partnership with MyRepublic could offer some respite to
declining mobile revenues but waiting for better clarity.
MyRepublic has struck a partnership with StarHub to enter
the Singapore mobile market as a Mobile Virtual Network
Operator (MVNO). MyRepublic, known for its aggressive
pricing strategies and generous data allowances, is in a strong
footing after securing S$70m in funding from Singapore-
based Makara Capital and is likely to cause further woes in
the already heated data market. We understand that M1 and
Circles.Life spent 2-3 years on developmental efforts before
the actual launch in 2016. In that sense the MVNO partner
has fill-in-the gaps left by the telco operator. While
MyRepublic has yet to disclose its service plans, we believe
that it would place heavy emphasis on data given its target
market of “Tech-Savvy youth”, further pressuring already
depressed data yields. We believe contributions from
MyRepublic would offer some stability to StarHub’s declining
mobile revenues but we wait for better clarity on
MyRepublic’s strategy for the mobile market and effective
execution of its partnership with StarHub
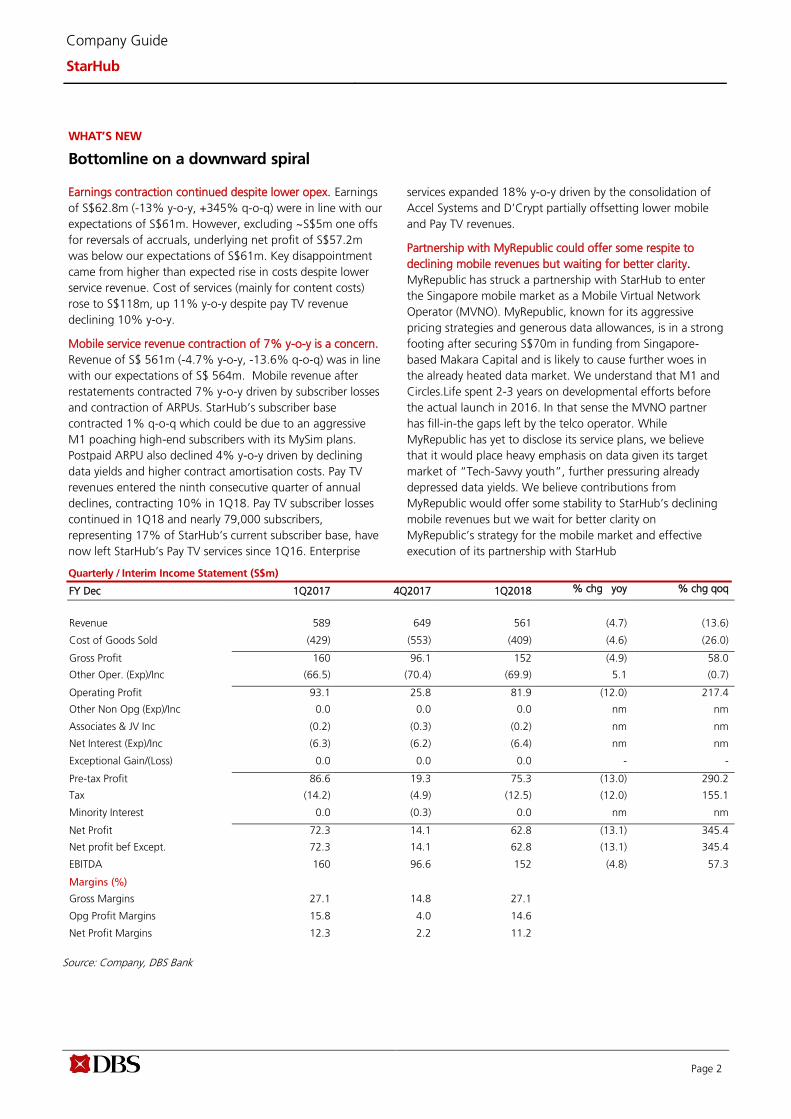
Quarterly / Interim Income Statement (S$m)
FY Dec 1Q2017 4Q2017 1Q2018 % chg yoy % chg qoq
Revenue 589 649 561 (4.7) (13.6)
Cost of Goods Sold (429) (553) (409) (4.6) (26.0)
Gross Profit 160 96.1 152 (4.9) 58.0
Other Oper. (Exp)/Inc (66.5) (70.4) (69.9) 5.1 (0.7)
Operating Profit 93.1 25.8 81.9 (12.0) 217.4
Other Non Opg (Exp)/Inc 0.0 0.0 0.0 nm nm
Associates & JV Inc (0.2) (0.3) (0.2) nm nm
Net Interest (Exp)/Inc (6.3) (6.2) (6.4) nm nm
Exceptional Gain/(Loss) 0.0 0.0 0.0 - -
Pre-tax Profit 86.6 19.3 75.3 (13.0) 290.2
Tax (14.2) (4.9) (12.5) (12.0) 155.1
Minority Interest 0.0 (0.3) 0.0 nm nm
Net Profit 72.3 14.1 62.8 (13.1) 345.4
Net profit bef Except. 72.3 14.1 62.8 (13.1) 345.4
EBITDA 160 96.6 152 (4.8) 57.3
Margins (%)
Gross Margins 27.1 14.8 27.1
Opg Profit Margins 15.8 4.0 14.6
Net Profit Margins 12.3 2.2 11.2
Source: Company, DBS Bank
Page 3
Company Guide
StarHub
CRITICAL DATA POINTS TO WATCH
Critical Factors
Hubbing strategy under pressure. StarHub’s go-to market
strategy of bundling mobile, broadband and Pay-TV services is
under pressure from the proliferation of over-the top (OTT) TV
services. As at the end of FY17, nearly 24,000 customers with
subscriptions to three or more services have downgraded since
1Q16, representing ~7% of subscriptions with three or more
services. Majority of these customers are moving away from
Pay-TV to cheaper alternatives such as Netflix, despite losing
the discount available on bundled services in the process. We
believe downgrades of hubbing subscriptions would accelerate
amid the increasing appeal of OTT TV services among high-
end Pay TV customers and rising pressure on the broadband
segment from M1 and MyRepublic. As this is a critical success
factor for StarHub, there could be near term impact on the
company's share price as the structural decline is unlikely to
reverse.
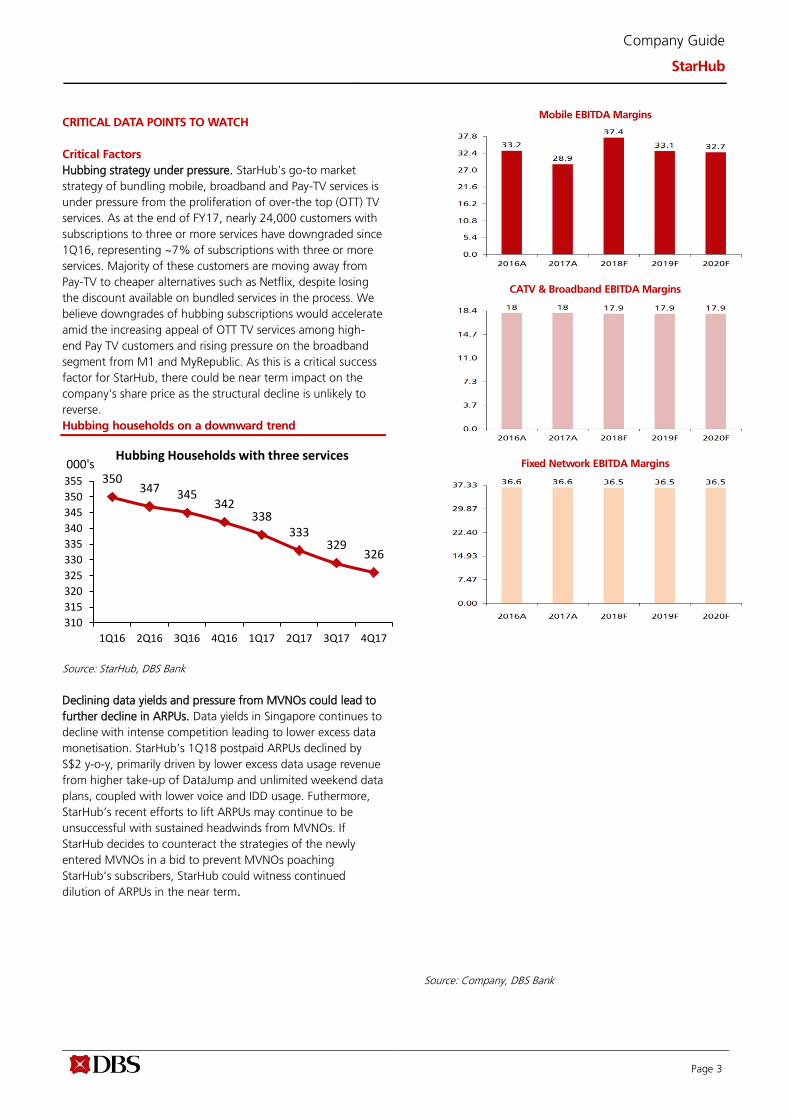
Hubbing households on a downward trend
Source: StarHub, DBS Bank
Declining data yields and pressure from MVNOs could lead to
further decline in ARPUs. Data yields in Singapore continues to
decline with intense competition leading to lower excess data
monetisation. StarHub’s 1Q18 postpaid ARPUs declined by
S$2 y-o-y, primarily driven by lower excess data usage revenue
from higher take-up of DataJump and unlimited weekend data
plans, coupled with lower voice and IDD usage. Futhermore,
StarHub’s recent efforts to lift ARPUs may continue to be
unsuccessful with sustained headwinds from MVNOs. If
StarHub decides to counteract the strategies of the newly
entered MVNOs in a bid to prevent MVNOs poaching
StarHub’s subscribers, StarHub could witness continued
dilution of ARPUs in the near term.
Mobile EBITDA Margins
CATV & Broadband EBITDA Margins
Fixed Network EBITDA Margins
Source: Company, DBS Bank
350347 345
342338
333329
326
310
315
320
325
330
335
340
345
350
355
1Q16 2Q16 3Q16 4Q16 1Q17 2Q17 3Q17 4Q17
000'sHubbing Households with three services
Page 4
Company Guide
StarHub
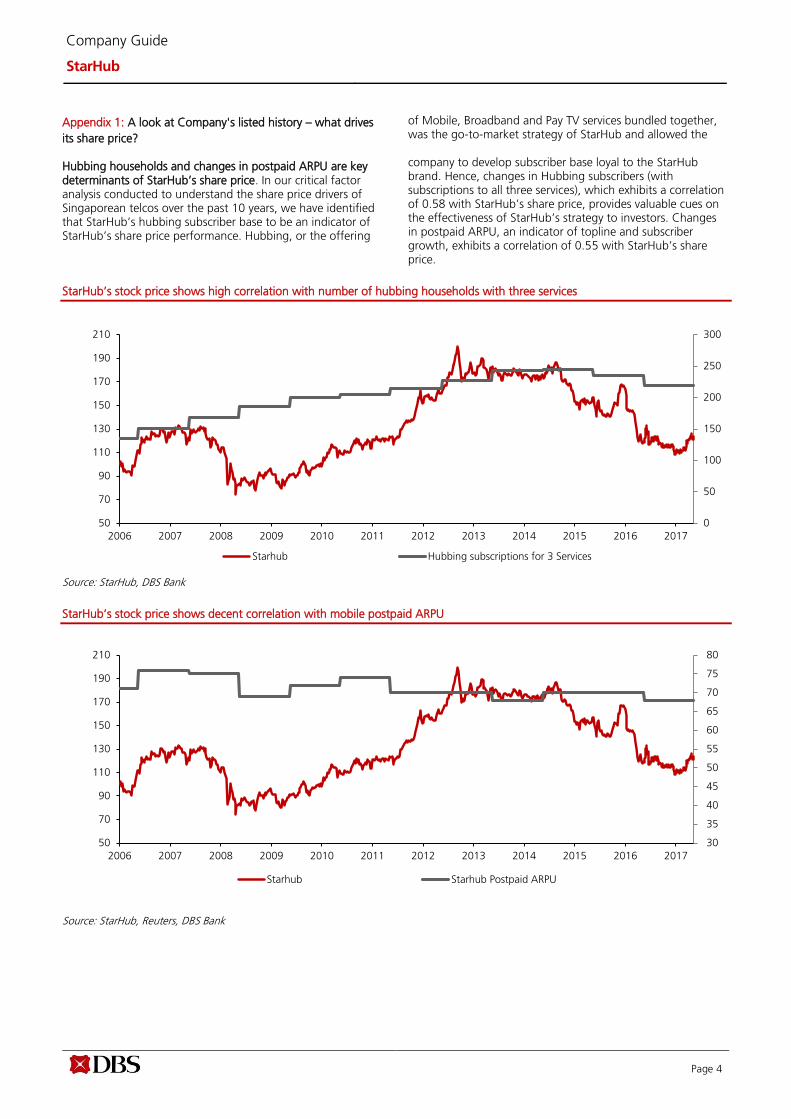
Appendix 1: A look at Company's listed history – what drives
its share price? Hubbing households and changes in postpaid ARPU are key determinants of StarHub’s share price. In our critical factor analysis conducted to understand the share price drivers of Singaporean telcos over the past 10 years, we have identified that StarHub’s hubbing subscriber base to be an indicator of StarHub’s share price performance. Hubbing, or the offering
of Mobile, Broadband and Pay TV services bundled together, was the go-to-market strategy of StarHub and allowed the company to develop subscriber base loyal to the StarHub brand. Hence, changes in Hubbing subscribers (with subscriptions to all three services), which exhibits a correlation of 0.58 with StarHub’s share price, provides valuable cues on the effectiveness of StarHub’s strategy to investors. Changes in postpaid ARPU, an indicator of topline and subscriber growth, exhibits a correlation of 0.55 with StarHub’s share price.
StarHub’s stock price shows high correlation with number of hubbing households with three services
Source: StarHub, DBS Bank
StarHub’s stock price shows decent correlation with mobile postpaid ARPU
Source: StarHub, Reuters, DBS Bank
0
50
100
150
200
250
300
50
70
90
110
130
150
170
190
210
2006 2007 2008 2009 2010 2011 2012 2013 2014 2015 2016 2017
Starhub Hubbing subscriptions for 3 Services
30
35
40
45
50
55
60
65
70
75
80
50
70
90
110
130
150
170
190
210
2006 2007 2008 2009 2010 2011 2012 2013 2014 2015 2016 2017
Starhub Starhub Postpaid ARPU
Page 5
Company Guide
StarHub
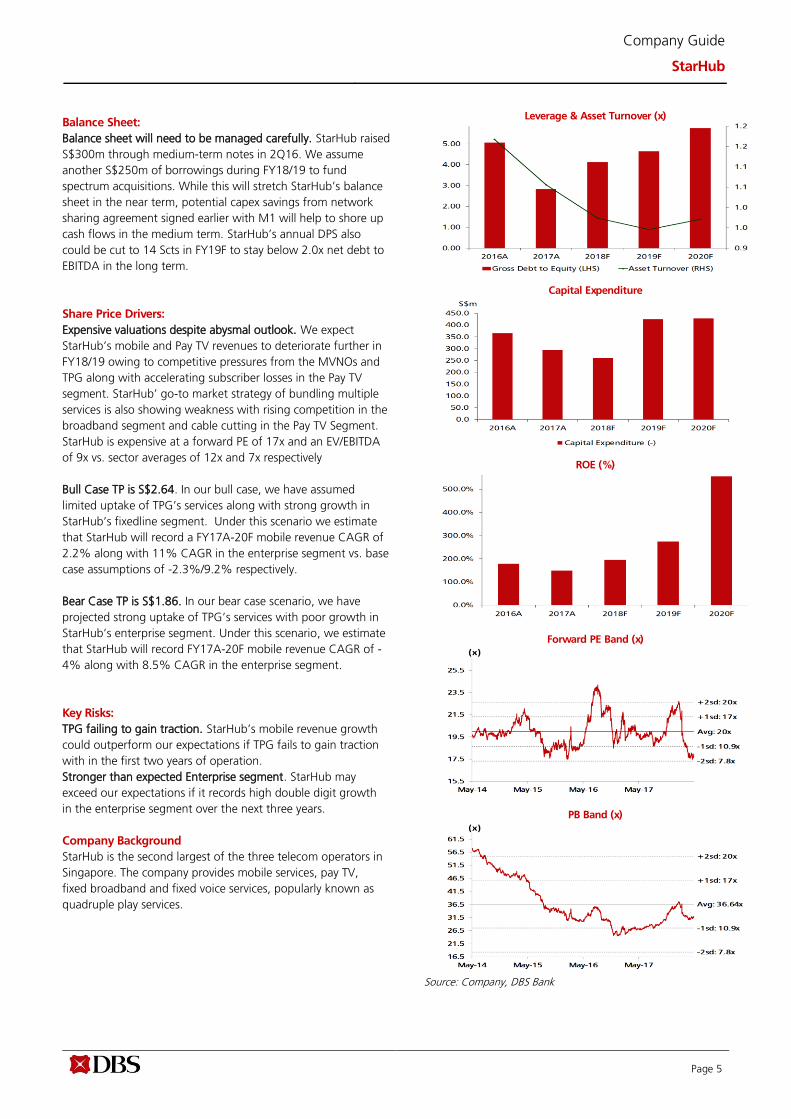
Balance Sheet:
Balance sheet will need to be managed carefully. StarHub raised
S$300m through medium-term notes in 2Q16. We assume
another S$250m of borrowings during FY18/19 to fund
spectrum acquisitions. While this will stretch StarHub’s balance
sheet in the near term, potential capex savings from network
sharing agreement signed earlier with M1 will help to shore up
cash flows in the medium term. StarHub’s annual DPS also
could be cut to 14 Scts in FY19F to stay below 2.0x net debt to
EBITDA in the long term.
Share Price Drivers:
Expensive valuations despite abysmal outlook. We expect
StarHub’s mobile and Pay TV revenues to deteriorate further in
FY18/19 owing to competitive pressures from the MVNOs and
TPG along with accelerating subscriber losses in the Pay TV
segment. StarHub’ go-to market strategy of bundling multiple
services is also showing weakness with rising competition in the
broadband segment and cable cutting in the Pay TV Segment.
StarHub is expensive at a forward PE of 17x and an EV/EBITDA
of 9x vs. sector averages of 12x and 7x respectively
Bull Case TP is S$2.64. In our bull case, we have assumed
limited uptake of TPG’s services along with strong growth in
StarHub’s fixedline segment. Under this scenario we estimate
that StarHub will record a FY17A-20F mobile revenue CAGR of
2.2% along with 11% CAGR in the enterprise segment vs. base
case assumptions of -2.3%/9.2% respectively.
Bear Case TP is S$1.86. In our bear case scenario, we have
projected strong uptake of TPG’s services with poor growth in
StarHub’s enterprise segment. Under this scenario, we estimate
that StarHub will record FY17A-20F mobile revenue CAGR of -
4% along with 8.5% CAGR in the enterprise segment.
Key Risks:
TPG failing to gain traction. StarHub’s mobile revenue growth
could outperform our expectations if TPG fails to gain traction
with in the first two years of operation.
Stronger than expected Enterprise segment. StarHub may
exceed our expectations if it records high double digit growth
in the enterprise segment over the next three years.
Company Background
StarHub is the second largest of the three telecom operators in
Singapore. The company provides mobile services, pay TV,
fixed broadband and fixed voice services, popularly known as
quadruple play services.
Leverage & Asset Turnover (x)
Capital Expenditure
ROE (%)
Forward PE Band (x)
PB Band (x)
Source: Company, DBS Bank
Page 6
Company Guide
StarHub
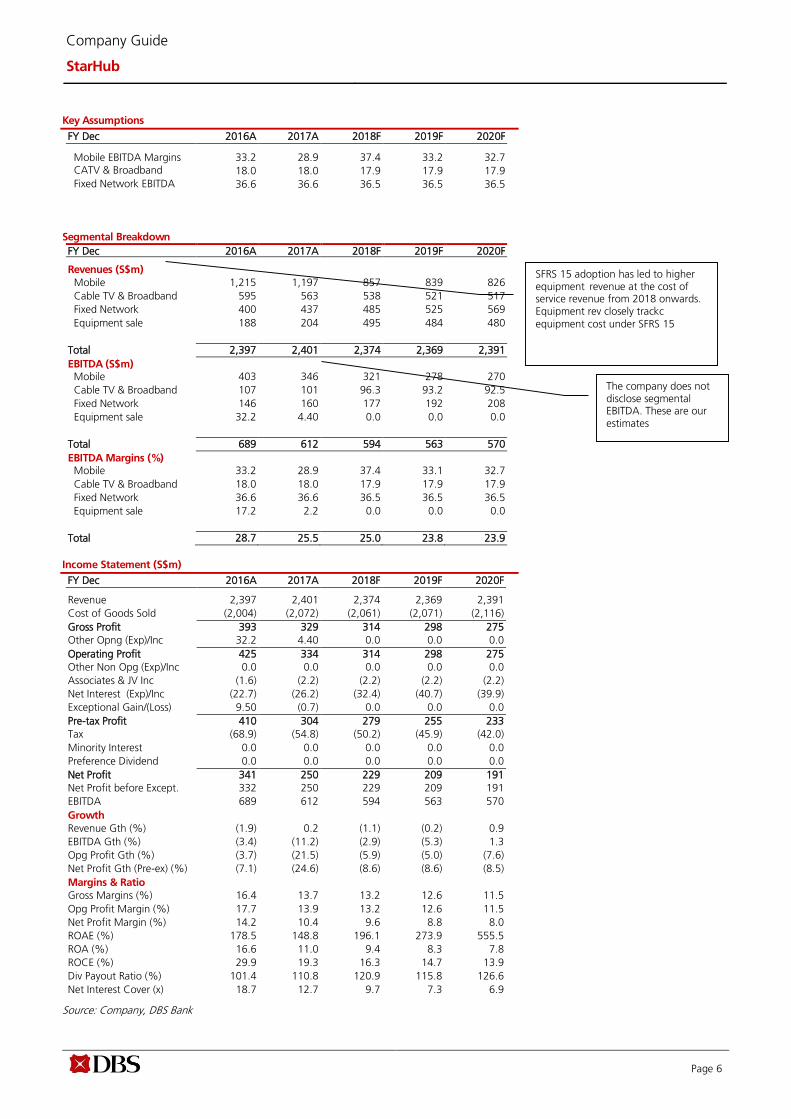
Key Assumptions
FY Dec 2016A 2017A 2018F 2019F 2020F
Mobile EBITDA Margins 33.2 28.9 37.4 33.2 32.7 CATV & Broadband EBITDA Margins
18.0 18.0 17.9 17.9 17.9
Fixed Network EBITDA Margins
36.6 36.6 36.5 36.5 36.5
Segmental Breakdown
FY Dec 2016A 2017A 2018F 2019F 2020F Revenues (S$m)
Mobile 1,215 1,197 857 839 826
Cable TV & Broadband 595 563 538 521 517
Fixed Network 400 437 485 525 569
Equipment sale 188 204 495 484 480
Total 2,397 2,401 2,374 2,369 2,391
EBITDA (S$m) Mobile 403 346 321 278 270
Cable TV & Broadband 107 101 96.3 93.2 92.5
Fixed Network 146 160 177 192 208
Equipment sale 32.2 4.40 0.0 0.0 0.0
Total 689 612 594 563 570
EBITDA Margins (%) Mobile 33.2 28.9 37.4 33.1 32.7
Cable TV & Broadband 18.0 18.0 17.9 17.9 17.9
Fixed Network 36.6 36.6 36.5 36.5 36.5
Equipment sale 17.2 2.2 0.0 0.0 0.0
Total 28.7 25.5 25.0 23.8 23.9
Income Statement (S$m)
FY Dec 2016A 2017A 2018F 2019F 2020F
Revenue 2,397 2,401 2,374 2,369 2,391
Cost of Goods Sold (2,004) (2,072) (2,061) (2,071) (2,116)
Gross Profit 393 329 314 298 275
Other Opng (Exp)/Inc 32.2 4.40 0.0 0.0 0.0
Operating Profit 425 334 314 298 275
Other Non Opg (Exp)/Inc 0.0 0.0 0.0 0.0 0.0
Associates & JV Inc (1.6) (2.2) (2.2) (2.2) (2.2)
Net Interest (Exp)/Inc (22.7) (26.2) (32.4) (40.7) (39.9)
Exceptional Gain/(Loss) 9.50 (0.7) 0.0 0.0 0.0
Pre-tax Profit 410 304 279 255 233
Tax (68.9) (54.8) (50.2) (45.9) (42.0)
Minority Interest 0.0 0.0 0.0 0.0 0.0
Preference Dividend 0.0 0.0 0.0 0.0 0.0
Net Profit 341 250 229 209 191
Net Profit before Except. 332 250 229 209 191
EBITDA 689 612 594 563 570
Growth
Revenue Gth (%) (1.9) 0.2 (1.1) (0.2) 0.9
EBITDA Gth (%) (3.4) (11.2) (2.9) (5.3) 1.3
Opg Profit Gth (%) (3.7) (21.5) (5.9) (5.0) (7.6)
Net Profit Gth (Pre-ex) (%) (7.1) (24.6) (8.6) (8.6) (8.5)
Margins & Ratio
Gross Margins (%) 16.4 13.7 13.2 12.6 11.5
Opg Profit Margin (%) 17.7 13.9 13.2 12.6 11.5
Net Profit Margin (%) 14.2 10.4 9.6 8.8 8.0
ROAE (%) 178.5 148.8 196.1 273.9 555.5
ROA (%) 16.6 11.0 9.4 8.3 7.8
ROCE (%) 29.9 19.3 16.3 14.7 13.9
Div Payout Ratio (%) 101.4 110.8 120.9 115.8 126.6
Net Interest Cover (x) 18.7 12.7 9.7 7.3 6.9
Source: Company, DBS Bank
The company does not disclose segmental EBITDA. These are our estimates
SFRS 15 adoption has led to higher equipment revenue at the cost of service revenue from 2018 onwards. Equipment rev closely trackc equipment cost under SFRS 15
Page 7
Company Guide
StarHub
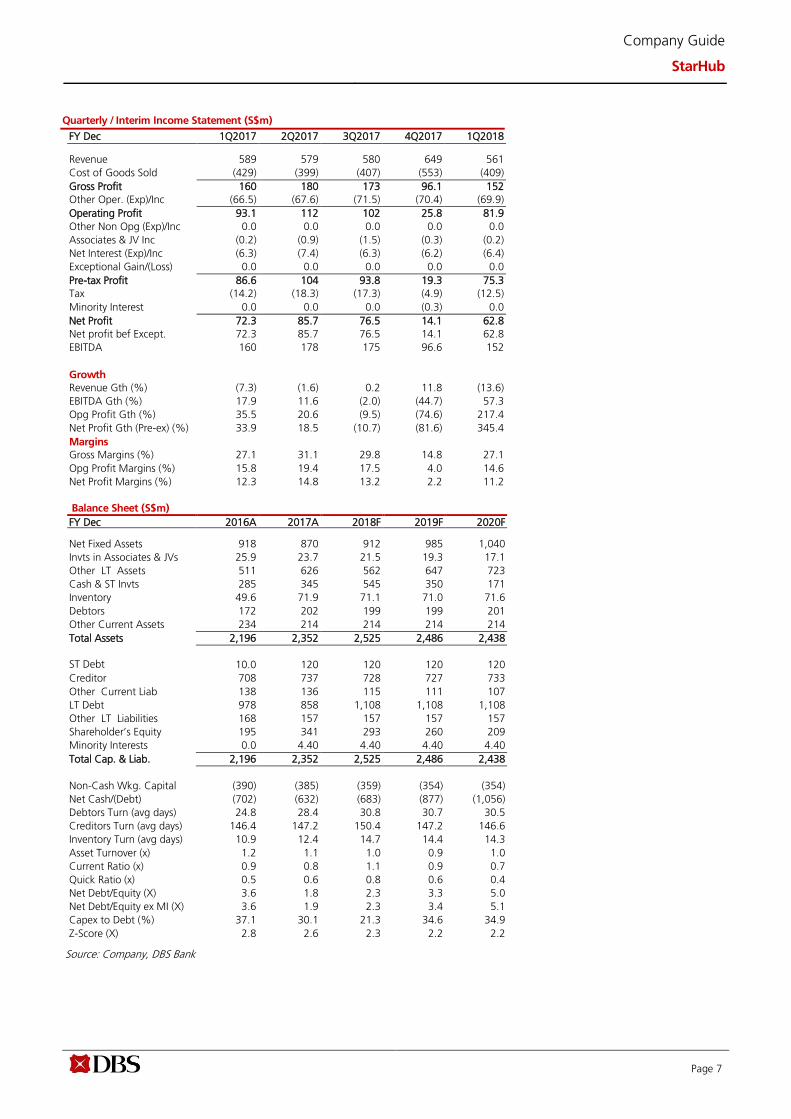
Quarterly / Interim Income Statement (S$m)
FY Dec 1Q2017 2Q2017 3Q2017 4Q2017 1Q2018 Revenue 589 579 580 649 561
Cost of Goods Sold (429) (399) (407) (553) (409)
Gross Profit 160 180 173 96.1 152
Other Oper. (Exp)/Inc (66.5) (67.6) (71.5) (70.4) (69.9)
Operating Profit 93.1 112 102 25.8 81.9
Other Non Opg (Exp)/Inc 0.0 0.0 0.0 0.0 0.0
Associates & JV Inc (0.2) (0.9) (1.5) (0.3) (0.2)
Net Interest (Exp)/Inc (6.3) (7.4) (6.3) (6.2) (6.4)
Exceptional Gain/(Loss) 0.0 0.0 0.0 0.0 0.0
Pre-tax Profit 86.6 104 93.8 19.3 75.3
Tax (14.2) (18.3) (17.3) (4.9) (12.5)
Minority Interest 0.0 0.0 0.0 (0.3) 0.0
Net Profit 72.3 85.7 76.5 14.1 62.8
Net profit bef Except. 72.3 85.7 76.5 14.1 62.8
EBITDA 160 178 175 96.6 152
Growth
Revenue Gth (%) (7.3) (1.6) 0.2 11.8 (13.6)
EBITDA Gth (%) 17.9 11.6 (2.0) (44.7) 57.3
Opg Profit Gth (%) 35.5 20.6 (9.5) (74.6) 217.4
Net Profit Gth (Pre-ex) (%) 33.9 18.5 (10.7) (81.6) 345.4
Margins Gross Margins (%) 27.1 31.1 29.8 14.8 27.1
Opg Profit Margins (%) 15.8 19.4 17.5 4.0 14.6
Net Profit Margins (%) 12.3 14.8 13.2 2.2 11.2
Balance Sheet (S$m)
FY Dec 2016A 2017A 2018F 2019F 2020F Net Fixed Assets 918 870 912 985 1,040
Invts in Associates & JVs 25.9 23.7 21.5 19.3 17.1
Other LT Assets 511 626 562 647 723
Cash & ST Invts 285 345 545 350 171
Inventory 49.6 71.9 71.1 71.0 71.6
Debtors 172 202 199 199 201
Other Current Assets 234 214 214 214 214
Total Assets 2,196 2,352 2,525 2,486 2,438
ST Debt
10.0 120 120 120 120
Creditor 708 737 728 727 733
Other Current Liab 138 136 115 111 107
LT Debt 978 858 1,108 1,108 1,108
Other LT Liabilities 168 157 157 157 157
Shareholder’s Equity 195 341 293 260 209
Minority Interests 0.0 4.40 4.40 4.40 4.40
Total Cap. & Liab. 2,196 2,352 2,525 2,486 2,438
Non-Cash Wkg. Capital (390) (385) (359) (354) (354)
Net Cash/(Debt) (702) (632) (683) (877) (1,056)
Debtors Turn (avg days) 24.8 28.4 30.8 30.7 30.5
Creditors Turn (avg days) 146.4 147.2 150.4 147.2 146.6
Inventory Turn (avg days) 10.9 12.4 14.7 14.4 14.3
Asset Turnover (x) 1.2 1.1 1.0 0.9 1.0
Current Ratio (x) 0.9 0.8 1.1 0.9 0.7
Quick Ratio (x) 0.5 0.6 0.8 0.6 0.4
Net Debt/Equity (X) 3.6 1.8 2.3 3.3 5.0
Net Debt/Equity ex MI (X) 3.6 1.9 2.3 3.4 5.1
Capex to Debt (%) 37.1 30.1 21.3 34.6 34.9
Z-Score (X) 2.8 2.6 2.3 2.2 2.2
Source: Company, DBS Bank
Page 8
Company Guide
StarHub
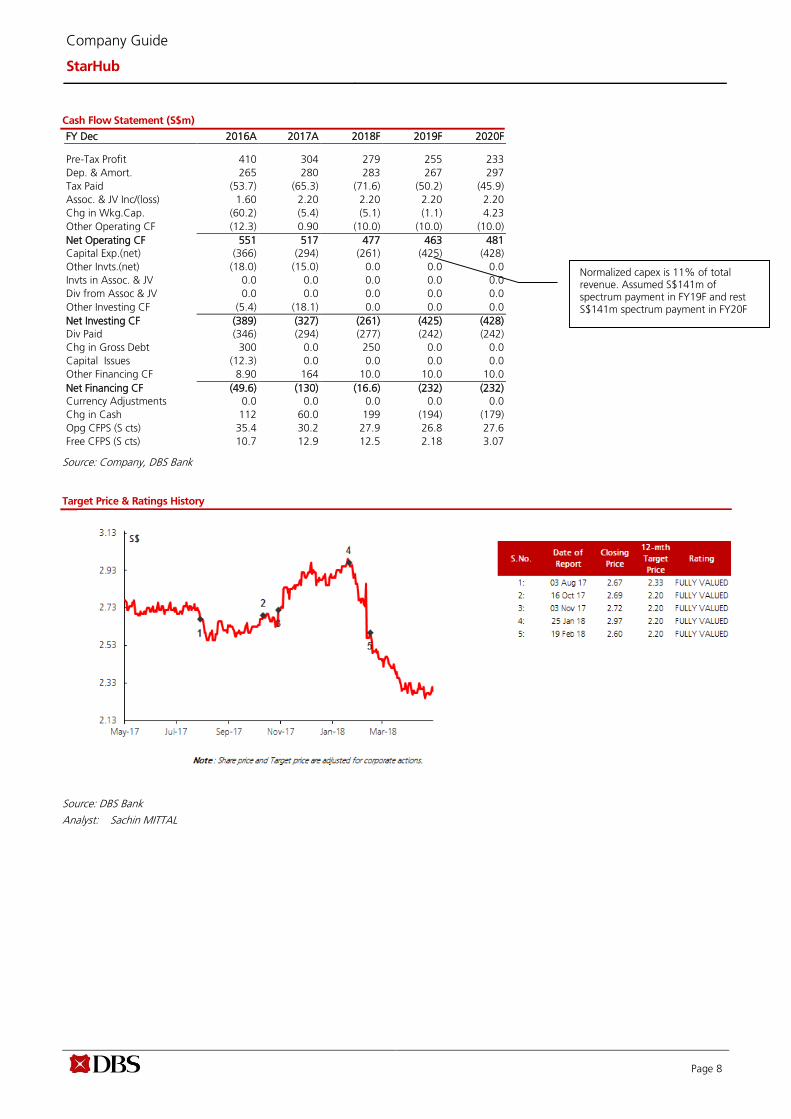
Cash Flow Statement (S$m)
FY Dec 2016A 2017A 2018F 2019F 2020F Pre-Tax Profit 410 304 279 255 233
Dep. & Amort. 265 280 283 267 297
Tax Paid (53.7) (65.3) (71.6) (50.2) (45.9)
Assoc. & JV Inc/(loss) 1.60 2.20 2.20 2.20 2.20
Chg in Wkg.Cap. (60.2) (5.4) (5.1) (1.1) 4.23
Other Operating CF (12.3) 0.90 (10.0) (10.0) (10.0)
Net Operating CF 551 517 477 463 481
Capital Exp.(net) (366) (294) (261) (425) (428)
Other Invts.(net) (18.0) (15.0) 0.0 0.0 0.0
Invts in Assoc. & JV 0.0 0.0 0.0 0.0 0.0
Div from Assoc & JV 0.0 0.0 0.0 0.0 0.0
Other Investing CF (5.4) (18.1) 0.0 0.0 0.0
Net Investing CF (389) (327) (261) (425) (428)
Div Paid (346) (294) (277) (242) (242)
Chg in Gross Debt 300 0.0 250 0.0 0.0
Capital Issues (12.3) 0.0 0.0 0.0 0.0
Other Financing CF 8.90 164 10.0 10.0 10.0
Net Financing CF (49.6) (130) (16.6) (232) (232)
Currency Adjustments 0.0 0.0 0.0 0.0 0.0
Chg in Cash 112 60.0 199 (194) (179)
Opg CFPS (S cts) 35.4 30.2 27.9 26.8 27.6
Free CFPS (S cts) 10.7 12.9 12.5 2.18 3.07
Source: Company, DBS Bank
Target Price & Ratings History
Source: DBS Bank
Analyst: Sachin MITTAL
Normalized capex is 11% of total revenue. Assumed S$141m of spectrum payment in FY19F and rest S$141m spectrum payment in FY20F
Page 9
Company Guide
StarHub
DBS Bank recommendations are based an Absolute Total Return* Rating system, defined as follows:
STRONG BUY (>20% total return over the next 3 months, with identifiable share price catalysts within this time frame)
BUY (>15% total return over the next 12 months for small caps, >10% for large caps)
HOLD (-10% to +15% total return over the next 12 months for small caps, -10% to +10% for large caps)
FULLY VALUED (negative total return i.e. > -10% over the next 12 months)
SELL (negative total return of > -20% over the next 3 months, with identifiable catalysts within this time frame)
Share price appreciation + dividends
Completed Date: 7 May 2018 08:23:51 (SGT) Dissemination Date: 7 May 2018 10:32:42 (SGT)
Sources for all charts and tables are DBS Bank unless otherwise specified.
GENERAL DISCLOSURE/DISCLAIMER
This report is prepared by DBS Bank Ltd. This report is solely intended for the clients of DBS Bank Ltd, its respective connected and associated
corporations and affiliates only and no part of this document may be (i) copied, photocopied or duplicated in any form or by any means or (ii)
redistributed without the prior written consent of DBS Bank Ltd.
The research set out in this report is based on information obtained from sources believed to be reliable, but we (which collectively refers to DBS
Bank Ltd, its respective connected and associated corporations, affiliates and their respective directors, officers, employees and agents (collectively,
the “DBS Group”) have not conducted due diligence on any of the companies, verified any information or sources or taken into account any other
factors which we may consider to be relevant or appropriate in preparing the research. Accordingly, we do not make any representation or
warranty as to the accuracy, completeness or correctness of the research set out in this report. Opinions expressed are subject to change without
notice. This research is prepared for general circulation. Any recommendation contained in this document does not have regard to the specific
investment objectives, financial situation and the particular needs of any specific addressee. This document is for the information of addressees
only and is not to be taken in substitution for the exercise of judgement by addressees, who should obtain separate independent legal or financial
advice. The DBS Group accepts no liability whatsoever for any direct, indirect and/or consequential loss (including any claims for loss of profit)
arising from any use of and/or reliance upon this document and/or further communication given in relation to this document. This document is not
to be construed as an offer or a solicitation of an offer to buy or sell any securities. The DBS Group, along with its affiliates and/or persons
associated with any of them may from time to time have interests in the securities mentioned in this document. The DBS Group, may have
positions in, and may effect transactions in securities mentioned herein and may also perform or seek to perform broking, investment banking and
other banking services for these companies.
Any valuations, opinions, estimates, forecasts, ratings or risk assessments herein constitutes a judgment as of the date of this report, and there can
be no assurance that future results or events will be consistent with any such valuations, opinions, estimates, forecasts, ratings or risk assessments.
The information in this document is subject to change without notice, its accuracy is not guaranteed, it may be incomplete or condensed, it may
not contain all material information concerning the company (or companies) referred to in this report and the DBS Group is under no obligation to
update the information in this report.
This publication has not been reviewed or authorized by any regulatory authority in Singapore, Hong Kong or elsewhere. There is no planned
schedule or frequency for updating research publication relating to any issuer.
The valuations, opinions, estimates, forecasts, ratings or risk assessments described in this report were based upon a number of estimates and
assumptions and are inherently subject to significant uncertainties and contingencies. It can be expected that one or more of the estimates on
which the valuations, opinions, estimates, forecasts, ratings or risk assessments were based will not materialize or will vary significantly from actual
results. Therefore, the inclusion of the valuations, opinions, estimates, forecasts, ratings or risk assessments described herein IS NOT TO BE RELIED
UPON as a representation and/or warranty by the DBS Group (and/or any persons associated with the aforesaid entities), that:
(a) such valuations, opinions, estimates, forecasts, ratings or risk assessments or their underlying assumptions will be achieved, and
(b) there is any assurance that future results or events will be consistent with any such valuations, opinions, estimates, forecasts, ratings or risk
assessments stated therein.
Please contact the primary analyst for valuation methodologies and assumptions associated with the covered companies or price targets.
Any assumptions made in this report that refers to commodities, are for the purposes of making forecasts for the company (or companies)
mentioned herein. They are not to be construed as recommendations to trade in the physical commodity or in the futures contract relating to the
commodity referred to in this report.
Page 10
Company Guide
StarHub
DBSVUSA, a US-registered broker-dealer, does not have its own investment banking or research department, has not participated in any public
offering of securities as a manager or co-manager or in any other investment banking transaction in the past twelve months and does not engage
in market-making.
ANALYST CERTIFICATION
The research analyst(s) primarily responsible for the content of this research report, in part or in whole, certifies that the views about the
companies and their securities expressed in this report accurately reflect his/her personal views. The analyst(s) also certifies that no part of his/her
compensation was, is, or will be, directly or indirectly, related to specific recommendations or views expressed in the report. The research analyst (s)
primarily responsible for the content of this research report, in part or in whole, certifies that he or his associate1 does not serve as an officer of the
issuer or the new listing applicant (which includes in the case of a real estate investment trust, an officer of the management company of the real
estate investment trust; and in the case of any other entity, an officer or its equivalent counterparty of the entity who is responsible for the
management of the issuer or the new listing applicant) and the research analyst(s) primarily responsible for the content of this research report or
his associate does not have financial interests2 in relation to an issuer or a new listing applicant that the analyst reviews. DBS Group has
procedures in place to eliminate, avoid and manage any potential conflicts of interests that may arise in connection with the production of
research reports. The research analyst(s) responsible for this report operates as part of a separate and independent team to the investment
banking function of the DBS Group and procedures are in place to ensure that confidential information held by either the research or investment
banking function is handled appropriately. There is no direct link of DBS Group's compensation to any specific investment banking function of the
DBS Group.
COMPANY-SPECIFIC / REGULATORY DISCLOSURES
1. DBS Bank Ltd, DBS HK, DBS Vickers Securities (Singapore) Pte Ltd (''DBSVS''), DBSV HK or their subsidiaries and/or other affiliates have a
proprietary position in Singtel, M1, StarHub, recommended in this report as of 30 Mar 2018.
2. Neither DBS Bank Ltd, DBS HK nor DBSV HK market makes in equity securities of the issuer(s) or company(ies) mentioned in this Research
Report.
3. DBS Bank Ltd, DBS HK, DBSVS, DBSV HK, their subsidiaries and/or other affiliates have a net long position exceeding 0.5% of the total issued share capital in DBS Bank Ltd, DBS HK, DBSVS, DBSV HK, their subsidiaries and/or other affiliates have a net long position exceeding 0.5% of the total issued share capital in M1, StarHub, recommended in this report as of 30 Mar 2018
Compensation for investment banking services: 4. DBS Bank Ltd, DBS HK, DBSVS, DBSV HK, their subsidiaries and/or other affiliates of DBSVUSA have received compensation, within the past
12 months for investment banking services from StarHub, as of 30 Mar 2018
5. 6. DBS Bank Ltd, DBS HK, DBSVS, their subsidiaries and/or other affiliates of DBSVUSA have managed or co-managed a public offering of securities for StarHub in the past 12 months, as of 30 Mar 2018
6. DBSVUSA does not have its own investment banking or research department, nor has it participated in any public offering of securities as a
manager or co-manager or in any other investment banking transaction in the past twelve months. Any US persons wishing to obtain further
information, including any clarification on disclosures in this disclaimer, or to effect a transaction in any security discussed in this document
should contact DBSVUSA exclusively.
Directorship/trustee interests:
7. Danny Teoh Leong Kay, a member of DBS Group Holdings Board of Directors, is a Director / Chairman of M1 as of 31 Mar 2018
8. Nihal Vijaya Devadas Kaviratne CBE, a member of DBS Group Holdings Board of Directors, is a Director of Starhub as of 31 Mar 2018
1 An associate is defined as (i) the spouse, or any minor child (natural or adopted) or minor step-child, of the analyst; (ii) the trustee of a trust of
which the analyst, his spouse, minor child (natural or adopted) or minor step-child, is a beneficiary or discretionary object; or (iii) another person accustomed or obliged to act in accordance with the directions or instructions of the analyst.
2 Financial interest is defined as interests that are commonly known financial interest, such as investment in the securities in respect of an issuer or a new listing applicant, or financial accommodation arrangement between the issuer or the new listing applicant and the firm or analysis. This term does not include commercial lending conducted at arm's length, or investments in any collective investment scheme other than an issuer or new listing applicant notwithstanding the fact that the scheme has investments in securities in respect of an issuer or a new listing applicant.
Page 11
Company Guide
StarHub
Disclosure of previous investment recommendation produced:
9. DBS Bank Ltd, DBS Vickers Securities (Singapore) Pte Ltd (''DBSVS''), their subsidiaries and/or other affiliates may have published other
investment recommendations in respect of the same securities / instruments recommended in this research report during the preceding 12
months. Please contact the primary analyst listed in the first page of this report to view previous investment recommendations published by
DBS Bank Ltd, DBS Vickers Securities (Singapore) Pte Ltd (''DBSVS''), their subsidiaries and/or other affiliates in the preceding 12 months.
RESTRICTIONS ON DISTRIBUTION
General This report is not directed to, or intended for distribution to or use by, any person or entity who is a citizen or resident of or
located in any locality, state, country or other jurisdiction where such distribution, publication, availability or use would be
contrary to law or regulation.
Australia This report is being distributed in Australia by DBS Bank Ltd. (“DBS”) or DBS Vickers Securities (Singapore) Pte Ltd
(“DBSVS”). DBS holds Australian Financial Services Licence no. 475946.
DBSVS is exempted from the requirement to hold an Australian Financial Services Licence under the Corporation Act 2001
(“CA”) in respect of financial services provided to the recipients. DBSVS is regulated by the Monetary Authority of Singapore
under the laws of Singapore, which differ from Australian laws.
Distribution of this report is intended only for “wholesale investors” within the meaning of the CA.
Hong Kong This report has been prepared by a person(s) who is not licensed by the Hong Kong Securities and Futures Commission to
carry on the regulated activity of advising on securities in Hong Kong pursuant to the Securities and Futures Ordinance
(Chapter 571 of the Laws of Hong Kong). This report is being distributed in Hong Kong and is attributable to DBS Vickers
Hong Kong Limited, a licensed corporation licensed by the Hong Kong Securities and Futures Commission to carry on the
regulated activity of advising on securities pursuant to the Securities and Futures Ordinance (Chapter 571 of the Laws of
Hong Kong).
For any query regarding the materials herein, please contact Paul Yong (CE. No. ASE988) at [email protected].
Indonesia This report is being distributed in Indonesia by PT DBS Vickers Sekuritas Indonesia.
Malaysia This report is distributed in Malaysia by AllianceDBS Research Sdn Bhd ("ADBSR"). Recipients of this report, received from
ADBSR are to contact the undersigned at 603-2604 3333 in respect of any matters arising from or in connection with this
report. In addition to the General Disclosure/Disclaimer found at the preceding page, recipients of this report are advised
that ADBSR (the preparer of this report), its holding company Alliance Investment Bank Berhad, their respective connected
and associated corporations, affiliates, their directors, officers, employees, agents and parties related or associated with any
of them may have positions in, and may effect transactions in the securities mentioned herein and may also perform or seek
to perform broking, investment banking/corporate advisory and other services for the subject companies. They may also
have received compensation and/or seek to obtain compensation for broking, investment banking/corporate advisory and
other services from the subject companies.
Wong Ming Tek, Executive Director, ADBSR
Singapore This report is distributed in Singapore by DBS Bank Ltd (Company Regn. No. 196800306E) or DBSVS (Company Regn No.
198600294G), both of which are Exempt Financial Advisers as defined in the Financial Advisers Act and regulated by the
Monetary Authority of Singapore. DBS Bank Ltd and/or DBSVS, may distribute reports produced by its respective foreign
entities, affiliates or other foreign research houses pursuant to an arrangement under Regulation 32C of the Financial
Advisers Regulations. Where the report is distributed in Singapore to a person who is not an Accredited Investor, Expert
Investor or an Institutional Investor, DBS Bank Ltd accepts legal responsibility for the contents of the report to such persons
only to the extent required by law. Singapore recipients should contact DBS Bank Ltd at 6327 2288 for matters arising from,
or in connection with the report.
Thailand This report is being distributed in Thailand by DBS Vickers Securities (Thailand) Co Ltd.
Page 12
Company Guide
StarHub
United
Kingdom
This report is produced by DBS Bank Ltd which is regulated by the Monetary Authority of Singapore.
This report is disseminated in the United Kingdom by DBS Vickers Securities (UK) Ltd, ("DBSVUK"). DBSVUK is authorised
and regulated by the Financial Conduct Authority in the United Kingdom.
In respect of the United Kingdom, this report is solely intended for the clients of DBSVUK, its respective connected and
associated corporations and affiliates only and no part of this document may be (i) copied, photocopied or duplicated in any
form or by any means or (ii) redistributed without the prior written consent of DBSVUK. This communication is directed at
persons having professional experience in matters relating to investments. Any investment activity following from this
communication will only be engaged in with such persons. Persons who do not have professional experience in matters
relating to investments should not rely on this communication.
Dubai
International
Financial
Centre
This research report is being distributed by DBS Bank Ltd., (DIFC Branch) having its office at PO Box 506538, 3rd Floor,
Building 3, East Wing, Gate Precinct, Dubai International Financial Centre (DIFC), Dubai, United Arab Emirates. DBS Bank
Ltd., (DIFC Branch) is regulated by The Dubai Financial Services Authority. This research report is intended only for
professional clients (as defined in the DFSA rulebook) and no other person may act upon it.
United Arab
Emirates
This report is provided by DBS Bank Ltd (Company Regn. No. 196800306E) which is an Exempt Financial Adviser as defined
in the Financial Advisers Act and regulated by the Monetary Authority of Singapore. This report is for information purposes
only and should not be relied upon or acted on by the recipient or considered as a solicitation or inducement to buy or sell
any financial product. It does not constitute a personal recommendation or take into account the particular investment
objectives, financial situation, or needs of individual clients. You should contact your relationship manager or investment
adviser if you need advice on the merits of buying, selling or holding a particular investment. You should note that the
information in this report may be out of date and it is not represented or warranted to be accurate, timely or complete. This
report or any portion thereof may not be reprinted, sold or redistributed without our written consent.
United States This report was prepared by DBS Bank Ltd. DBSVUSA did not participate in its preparation. The research analyst(s) named
on this report are not registered as research analysts with FINRA and are not associated persons of DBSVUSA. The research
analyst(s) are not subject to FINRA Rule 2241 restrictions on analyst compensation, communications with a subject company,
public appearances and trading securities held by a research analyst. This report is being distributed in the United States by
DBSVUSA, which accepts responsibility for its contents. This report may only be distributed to Major U.S. Institutional
Investors (as defined in SEC Rule 15a-6) and to such other institutional investors and qualified persons as DBSVUSA may
authorize. Any U.S. person receiving this report who wishes to effect transactions in any securities referred to herein should
contact DBSVUSA directly and not its affiliate.
Other
jurisdictions
In any other jurisdictions, except if otherwise restricted by laws or regulations, this report is intended only for qualified,
professional, institutional or sophisticated investors as defined in the laws and regulations of such jurisdictions.
Page 13
Company Guide
StarHub
DBS Regional Research Offices
HONG KONG DBS Vickers (Hong Kong) Ltd Contact: Paul Yong 18th Floor Man Yee Building 68 Des Voeux Road Central Central, Hong Kong Tel: 65 6878 8888 Fax: 65 65353 418 e-mail: [email protected] Participant of the Stock Exchange of Hong Kong
MALAYSIA AllianceDBS Research Sdn Bhd Contact: Wong Ming Tek (128540 U) 19th Floor, Menara Multi-Purpose, Capital Square, 8 Jalan Munshi Abdullah 50100 Kuala Lumpur, Malaysia. Tel.: 603 2604 3333 Fax: 603 2604 3921 e-mail: [email protected]
SINGAPORE DBS Bank Ltd Contact: Janice Chua 12 Marina Boulevard, Marina Bay Financial Centre Tower 3 Singapore 018982 Tel: 65 6878 8888 Fax: 65 65353 418 e-mail: [email protected] Company Regn. No. 196800306E
INDONESIA PT DBS Vickers Sekuritas (Indonesia) Contact: Maynard Priajaya Arif DBS Bank Tower Ciputra World 1, 32/F Jl. Prof. Dr. Satrio Kav. 3-5 Jakarta 12940, Indonesia Tel: 62 21 3003 4900 Fax: 6221 3003 4943 e-mail: [email protected]
THAILAND DBS Vickers Securities (Thailand) Co Ltd Contact: Chanpen Sirithanarattanakul 989 Siam Piwat Tower Building, 9th, 14th-15th Floor Rama 1 Road, Pathumwan, Bangkok Thailand 10330 Tel. 66 2 857 7831 Fax: 66 2 658 1269 e-mail: [email protected] Company Regn. No 0105539127012 Securities and Exchange Commission, Thailand


