Embed Size (px)
Citation preview
1 23
International Journal of Public HealthInternational Journal of Public Health ISSN 1661-8556 Int J Public HealthDOI 10.1007/s00038-014-0612-4
Status of the diabetes epidemic in theKingdom of Saudi Arabia, 2013
Charbel El Bcheraoui, MohammedBasulaiman, Marwa Tuffaha, FarahDaoud, Margaret Robinson, Sara Jaber,Sarah Mikhitarian, et al.

1 23
Your article is protected by copyright and
all rights are held exclusively by Swiss
School of Public Health. This e-offprint is
for personal use only and shall not be self-
archived in electronic repositories. If you wish
to self-archive your article, please use the
accepted manuscript version for posting on
your own website. You may further deposit
the accepted manuscript version in any
repository, provided it is only made publicly
available 12 months after official publication
or later and provided acknowledgement is
given to the original source of publication
and a link is inserted to the published article
on Springer's website. The link must be
accompanied by the following text: "The final
publication is available at link.springer.com”.

ORIGINAL ARTICLE
Status of the diabetes epidemic in the Kingdom of Saudi Arabia,2013
Charbel El Bcheraoui • Mohammed Basulaiman • Marwa Tuffaha •
Farah Daoud • Margaret Robinson • Sara Jaber • Sarah Mikhitarian •
Ziad A. Memish • Mohammad Al Saeedi • Mohammad A. AlMazroa •
Ali H. Mokdad
Received: 10 July 2014 / Revised: 2 September 2014 / Accepted: 23 September 2014
� Swiss School of Public Health 2014
Abstract
Objectives In the Kingdom of Saudi Arabia (KSA), cur-
rent data on diabetes are lacking, and a rise of the epidemic
is feared, given the epidemiologic transition in the country.
To inform public health authorities on the current status of
the diabetes epidemic, we analyzed data from the Saudi
Health Interview Survey (SHIS).
Methods Saudi Health Interview Survey is a cross-sec-
tional national multistage survey of individuals aged
15 years or older. A total of 10,735 participants completed
a health questionnaire and were invited to the local health
clinics for biomedical exams.
Results 1,745,532 (13.4 %) Saudis aged 15 years or older
have diabetes. Among those, 57.8, 20.2, 16.6, and 5.4 %
are undiagnosed, treated uncontrolled, treated controlled,
and untreated, respectively. Males, older individuals, and
those who were previously diagnosed with hypertension or
hypercholesterolemia were more likely to be diabetic.
Conclusions Our findings call for increased awareness of
pre-diabetes, diabetes, and undiagnosed diabetes in KSA.
Combatting diabetes and other non-communicable diseases
should be the task of the Ministry of Health and other
ministries as well, to offer a comprehensive socio-cultural
approach to fighting this epidemic.
Keywords Saudi Arabia � Diabetes � Survey �Undiagnosed � Screening
Introduction
From 1990 to 2010, the number of deaths attributable to
type 2 diabetes doubled from 650,000 to 1.3 million
worldwide (Lozano et al. 2012). Various epidemiological
studies have found that the increase in diabetes prevalence
is correlated with the global urbanization: a trend toward
C. El Bcheraoui � M. Tuffaha � F. Daoud � M. Robinson �S. Jaber � S. Mikhitarian � A. H. Mokdad (&)
Institute for Health Metrics and Evaluation, University of
Washington, 2301 Fifth Ave., Suite 600, Seattle, WA 98121,
USA
e-mail: [email protected]
C. El Bcheraoui
e-mail: [email protected]
M. Tuffaha
e-mail: [email protected]
F. Daoud
e-mail: [email protected]
S. Jaber
e-mail: [email protected]
S. Mikhitarian
e-mail: [email protected]
M. Basulaiman � Z. A. Memish � M. Al Saeedi �M. A. AlMazroa
Ministry of Health of the Kingdom of Saudi Arabia,
Assadah, Al Murabba Riyadh 12613, Saudi Arabia
M. Basulaiman
e-mail: [email protected]
Z. A. Memish
e-mail: [email protected]
M. Al Saeedi
e-mail: [email protected]
M. A. AlMazroa
e-mail: [email protected]
Int J Public Health
DOI 10.1007/s00038-014-0612-4
123
Author's personal copy

sedentary lifestyles and poor diet is becoming the norm
(Stampfer et al. 2000; Key et al. 2002; WHO/FAO Expert
Consultation 2003; Amuna and Zotor 2008). The Kingdom
of Saudi Arabia (KSA) has witnessed a demographic shift
over the last 20 years, accompanied by behavioral changes
such as an increase in caloric, fat, and carbohydrate intake
with a reduction in physical activity (Al-Hazzaa et al.
2011; Ng et al. 2011). In 2010, the country had a high
proportion of years lost to disability (YLDs) due to dia-
betes, about 8 %, compared to ischemic heart disease, with
YLDs of 0.81 %.
At the population level, the Saudi Ministry of Health
(SMOH) is in charge of health promotion, early detection,
and disease treatment of Saudis, a free health care system.
To best utilize its human and financial resources, SMOH
needs accurate and timely data to allocate the appropriate
resources for treatment by disease or disability. Current
national data on diabetes in KSA are non-existent, and the
most recent estimates date from 2005(Ministry of Health,
Kingdom of Saudi Arabia, in collaboration with WHO
2005).
We conducted a large household survey to collect data
on health, assess the prevalence of several non-communi-
cable diseases (NCDs), and identify their risk factors. We
analyzed data from this survey to inform the SMOH on the
current status of diabetes.
Methods
The Saudi Health Interview Survey (SHIS) is a national
multistage survey of individuals aged 15 years or older.
Households were randomly selected from a national sam-
pling frame maintained and updated by the Census Bureau.
KSA was divided into 13 regions. Each region was divided
into subregions and blocks. All regions were included, and
a probability proportional to size was used to randomly
select subregions and blocks. Households were randomly
selected from each block. A roster of household members
was conducted and an adult aged 15 or older was randomly
selected to be surveyed. Weight, height, and blood pressure
were measured at the household by a trained professional.
Omron HN286 (SN:201207-03163F) and Omron M6
Comfort (HEM-7223-E) instruments were used to measure
weight and blood pressure.
The survey included questions on socio-demographic
characteristics, tobacco consumption, diet, physical activ-
ity, health care utilization, different health-related
behaviors, and self-reported NCDs.
We used measured weight and height to calculate body
mass index (BMI) as weight (kg)/height (m2). Participants
were classified into four groups: (1) underweight, BMI less
than 18.5; (2) normal weight, BMI between 18.5 and 24.9;
(3) overweight, BMI between 25.0 and 29.9; or (4) obese,
BMI greater than or equal to 30.0. Respondents were
classified as current, past, and never smoker based on self-
reported data. We computed the servings of fruits and
vegetables and red meats and chicken consumed per day
from the detailed dietary questionnaire as the sum of the
average daily consumption of fruits, fruit juices, and veg-
etables and red meats and chicken. We used the
International Physical Activity questionnaire (Craig et al.
2003) to classify respondents into four groups of physical
activity: (1) met vigorous physical activity, (2) met mod-
erate physical activity, (3) insufficient physical activity to
meet vigorous or moderate levels, and (4) no physical
activity.
To assess diagnosed hypertension, diabetes, and hyper-
cholesterolemia status, respondents were asked three
separate questions: ‘‘Have you ever been told by a doctor,
nurse, or other health professional that you had: (1) high
blood pressure, otherwise known as hypertension; (2) dia-
betes mellitus, otherwise known as diabetes, sugar
diabetes, high blood glucose, or high blood sugar; (3)
hypercholesterolemia, otherwise known as high or abnor-
mal blood cholesterol?’’ Women diagnosed with diabetes
or hypertension during pregnancy were counted as not
having these conditions. Those who were diagnosed with
either of these conditions were further asked if they are
currently receiving any treatment for their condition.
Similarly, the same type of questions was used to deter-
mine previous diagnosis of stroke, myocardial infarction,
atrial fibrillation, cardiac arrest, congestive heart failure,
chronic obstructive pulmonary disease, asthma, renal fail-
ure, and cancer. We considered a person to be diagnosed
with a chronic condition if they reported being diagnosed
with any of these conditions.
In addition, respondents who reported being diagnosed
with diabetes, were asked: ‘‘What type of diabetes do you
have?’’ and whether they are being treated via the following
question: ‘‘During the past 30 days, or since your diagnosis,
have you ever taken medication for this condition?’’.
Respondents who completed the questionnaire were
invited to local primary health care clinics to provide a
blood sample for laboratory analysis. All blood samples
were analyzed in a central lab at the King Fahd Medical
City in Riyadh. COBAS INTEGRA400 plus was used to
measure blood levels of HbA1C, or glycated hemoglobin.
We followed the National Health and Nutrition Examina-
tion Survey (NHANES) for determining diabetes status
(NHANES 2009). Respondents were considered to be
diabetic if they met any of the following criteria: (1)
measured HbA1c equals or exceeds 6.5 % (48.5 mmol/
mol), or (2) measured HbA1c not equaling or exceeding
6.5 % (48.5 mmol/mol), but the respondent reported taking
medications for diabetes. Hence, the subgroup diabetic
C. El Bcheraoui et al.
123
Author's personal copy

includes those with measured HbA1c equal or above 6.5 %
or taking medication for diabetes. Respondents were con-
sidered to have borderline diabetes if: (1) they did not
report taking drugs for diabetes, and (2) their measured
HbA1c blood level was between 5.7 % (35.3 mmol/mol)
and less than 6.5 % (48.5 mmol/mol). Respondents were
considered undiagnosed if they reported not being previ-
ously diagnosed with diabetes but their measured HbA1c
was equal or above 6.5 % (48.5 mmol/mol). The classifi-
cation criteria for the different categories of diabetes are
detailed in Table 1. Moreover, we examined diabetes status
among those who reported that they were previously
diagnosed as pre-diabetic.
Statistical analysis
We used a multivariate logistic regression model to measure
association between outcome variables and socio-demo-
graphic factors first. Diabetics were compared to borderline
diabetics and non-diabetics; borderline diabetics were
compared to non-diabetics, and undiagnosed diabetics were
compared to non-diabetics. Then, we used a backward
elimination multivariate logistic regression model to mea-
sure association between outcome variables and all
associated factors. All factors were first included in the
models. Then variables were eliminated based on a Wald
Chi-square test for analysis of effect. Variables were
removed one by one based on the significance level of their
effect on the model, starting with the variable with the
highest p [ 0.5, till all variables kept had a p B 0.5 in the
analysis of effect. Our results are based on a national sample
for adults aged 15 or older who completed the survey and
went to a clinic to undergo a physical exam.
Weighting methodology
Two sets of sampling weights were generated and incor-
porated into the dataset for analysis. First, we created an
individual sampling weight for all respondents to account
for (1) the probability of selection of an eligible respondent
within a household, (2) the probability of selection of the
household within a stratum, and (3) the post-stratification
differences in age and sex distribution between the sample
and the Saudi population.
For individuals who completed the lab-based blood
analysis, we computed an additional sampling weight used
in analyzing data from clinic visits to account for (1) the
individual sampling weight described above, (2) the
probability of visiting a clinic, (3) socio-demographic,
behavioral, and health differences between respondents
who visited the clinic and those who did not, and (4) the
post-stratification differences in age and sex distribution
between the respondents who visited the clinic and the
Saudi population.
We used SAS 9.2 (SAS Institute Inc., Cary, NC, USA)
for analyses and to account for the complex sampling
design.
Results
Survey response and sample characteristics
Between April and June 2013, a total of 10,735 participants
completed the SHIS—a response rate of 89.4 %—and were
invited to the local health clinics. The remaining 1,265
completed part of the household enumeration, or all of it,
but the selected adult did not complete the survey. A total of
5,590 individuals went to the local clinics and provided
blood samples for analyses—a response rate of 52.1 %. The
characteristics of respondents who completed the ques-
tionnaire and the laboratory exam are presented in Table 2.
Prevalence of diagnosed, measured, borderline,
and undiagnosed diabetes
Overall, 1,095,776 (8.5 %) Saudis reported being diag-
nosed with diabetes. However, a total of 1,745,532
Table 1 Classification criteria for the different categories of non-diabetics, diabetics, and borderline diabetics, Saudi Health Interview Survey,
Kingdom of Saudi Arabia, 2013
History of diagnosis
with diabetes
Currently taking
treatment for diabetes
Measured HbA1c
\5.7 % 5.7–6.49 % C6.5 %
Non-diabetic No No Yes No No
Diabetic
Diagnosed not treated Yes No No No Yes
Diagnosed treated uncontrolled Yes Yes No No Yes
Diagnosed treated controlled Yes yes Yes yes No
Undiagnosed No No No No Yes
Borderline diabetic No No No Yes No
Status of the diabetes epidemic
123
Author's personal copy

(13.4 %) Saudis aged 15 years or older had diabetes. This
total group is the sum of measured diabetes (1,193,075,
68.4 %) and those who were currently on diabetes medi-
cation with controlled levels of HbA1c (552,457, 31.6 %).
Among those that our survey identified as diabetic from
blood exams, 43.6 % were undiagnosed. Moreover, 15.2 %
of Saudis, or 979,953, had borderline diabetes. Character-
istics of respondents with undiagnosed diabetes, diabetes,
and borderline diabetes are presented in Table 3.
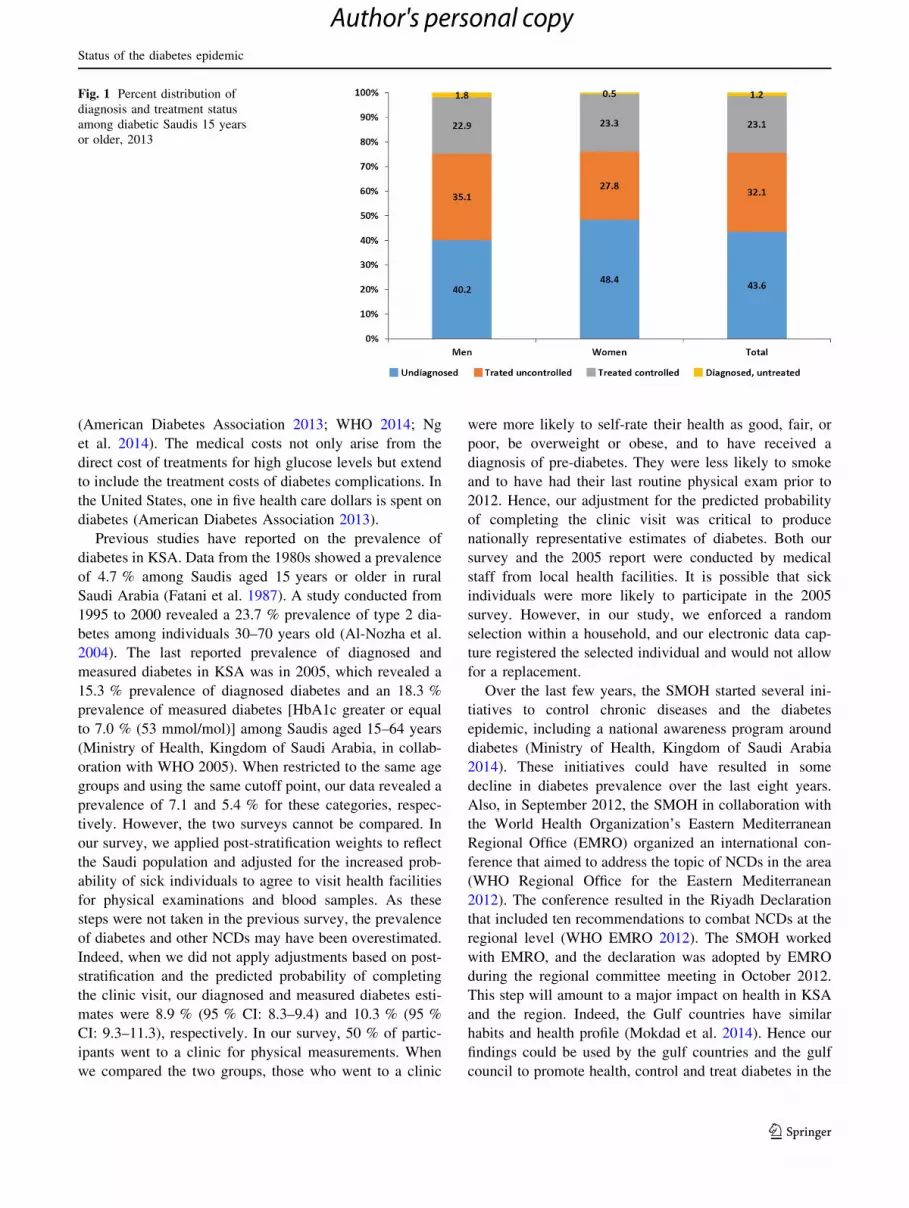
Type, treatment, and control of diagnosed diabetes
Among participants diagnosed with diabetes, 13.4 %
reported being diagnosed with type 1 diabetes, 66.7 %
reported being diagnosed with type 2 diabetes, and 19.9 %
did not know their type. Also, 91.0 % reported taking
medication for their condition. About 70.9 % of partici-
pants on medication for diabetes had their diabetes
controlled. Hence, about 397,541 adults had uncontrolled
diabetes. Among all those who are diabetic, 57.8, 20.2,
16.6, and 5.4 % were undiagnosed, treated uncontrolled,
treated controlled, and untreated, respectively (Fig. 1).
Predictors of diabetes, borderline diabetes,
and undiagnosed diabetes
Age, sex, and diagnosis history of hypertension and
hypercholesterolemia were associated with diabetes
(Table 4). The risk of being diabetic was lower among
females [adjusted odds ratio (AOR) = 0.68; 95 % confi-
dence interval (CI): 0.53–0.89] but increased with age
(AOR = 1.04; 95 % CI: 1.04–1.06) and previous diagnosis
of hypertension (AOR = 1.82; 95 % CI: 1.31–2.53) and
hypercholesterolemia (AOR = 2.18; 95 % CI: 1.51–3.15).
Marital status, education, smoking status, diet, daily hours
spent watching television, levels of physical activity, and
history of NCDs were not associated with the risk of dia-
betes (Table 4). When we excluded respondents who
reported being diagnosed with type 1 diabetes, our results
remained unchanged (data not presented). The risk of
borderline diabetes was not associated with any of the
socio-demographic characteristics or other risk factors
studied (Table 5).
The risk of being diabetic but undiagnosed with diabetes
was only associated with age (Table 6). Indeed, older
individuals were less likely to be diagnosed with diabetes
(AOR = 1.03; 95 % CI: 1.03–1.04).
Among Saudis aged 15 years or older, 191,957 (1.5 %)
were previously diagnosed with pre-diabetes. Of those,
55.1 % were currently diabetic by our definition [measured
HbA1c C6.5 % (48.5 mmol/mol)] or undergoing treatment
for diabetes), but only 22.8 % had blood HbA1c levels
C6.5 % (48.5 mmol/mol).
Discussion
In a nationally representative sample of Saudis aged
15 years or older, we found a high prevalence of diabetes
(13.4 %). A large proportion (43.6 %) of diabetic indi-
viduals were undiagnosed, and 29.1 % of those receiving
treatment had uncontrolled diabetes. An additional 15.2 %
Table 2 Socio-demographic characteristics, Saudis 15 years or older who completed the questionnaire and laboratory exam, Saudi Health
Interview Survey, Kingdom of Saudi Arabia, 2013
Socio-demographic and risk factors Categories Complete sample Clinical exam sample
N Weighted (%) SE N Weighted (%) SE
Sex Male 5,253 50.64 0.69 2,576 52.86 1.08
Female 5,482 49.36 0.69 3,014 47.14 1.08
Age 15–24 2,382 40.31 0.73 1,163 42.32 1.14
25–34 2,757 21.50 0.52 1,299 22.05 0.84
35–44 2,339 15.18 0.41 1,241 14.35 0.58
45–54 1,520 12.38 0.40 860 11.51 0.55
55–64 862 6.47 0.29 485 6.03 0.40
65? 875 4.17 0.20 542 3.74 0.24
Marital status Currently married 3,286 26.32 0.58 2,024 28.39 0.91
Never married 4,872 52.83 0.68 2,325 51.92 1.07
Separated, divorced, or widowed 2,557 20.85 0.53 1,236 19.69 0.82
Education Primary school or less 6,976 49.35 0.69 3,657 46.52 1.05
Elementary or high school completed 2,829 45.87 0.71 1,423 49.74 1.08
College degree or higher education 897 4.78 0.23 492 3.75 0.27
SE standard error
C. El Bcheraoui et al.
123
Author's personal copy

Table 3 Socio-demographic characteristics of undiagnosed diabetic, diabetic, and borderline diabetic Saudis 15 years or older, Saudi Health
Interview Survey, Kingdom of Saudi Arabia, 2013
Socio-demographic and risk factors Undiagnosed diabetic Diabetic Borderline diabetic
N Weighted (%) SE N Weighted (%) SE N Weighted (%) SE
Sex
Male 194 5.96 0.64 593 14.84 0.88 430 15.51 1.08
Female 195 5.70 0.65 506 11.70 0.79 453 14.76 1.08
Age
15–24 54 4.13 0.75 67 4.70 0.76 152 13.46 1.43
25–34 69 5.74 0.95 98 7.82 1.06 184 13.82 1.32
35–44 88 5.96 0.86 165 12.42 1.23 236 19.37 1.59
45–54 82 7.35 1.11 259 26.94 2.09 155 17.88 1.86
55–64 56 13.51 2.60 239 47.78 3.36 73 16.86 2.83
65? 40 8.06 1.84 271 50.40 3.11 83 14.95 2.08
Marital status
Currently married 279 7.36 0.63 821 20.63 0.03 616 16.32 0.85
Never married 70 4.11 0.66 99 5.08 0.70 193 14.12 1.30
Separated, divorced, or widowed 38 9.33 2.58 176 33.31 3.28 72 14.83 2.36
Education
Primary school or less 153 6.89 0.84 619 22.46 1.30 311 15.51 1.35
Elementary or high school completed 144 4.94 0.60 320 9.33 0.74 365 14.02 1.07
College degree or higher education 92 6.70 1.16 160 11.02 1.31 207 17.80 1.80
Smoking status
Never smoked 340 5.62 0.47 917 13.39 0.61 746 14.89 0.83
Ex-smoker 16 7.03 2.97 78 26.71 4.15 44 17.86 3.35
Current smoker 33 7.12 1.66 100 16.04 2.10 91 16.32 2.39
Type of fat consumed
Vegetable oils 330 5.61 0.49 941 13.13 0.64 758 15.47 0.84
Margarine 16 12.68 3.50 32 18.43 3.93 21 7.86 22.20
Animal fat 12 4.38 1.51 36 14.16 3.21 20 11.94 3.40
None in particular 26 7.19 1.68 72 15.88 2.25 71 17.66 2.50
Daily servings of fruits and vegetables
0 9 4.04 1.46 32 10.78 2.54 27 12.59 3.05
0.1–2.9 280 5.37 0.52 802 12.91 0.68 682 15.82 0.91
3–4.9 56 6.25 1.05 142 13.08 1.51 92 13.57 2.08
5? 38 10.44 2.40 88 17.66 2.73 66 11.89 1.96
Daily servings of meat and chicken
0–0.9 94 4.95 0.78 338 14.42 1.13 272 16.20 1.35
1–1.9 127 5.08 0.69 362 12.15 0.95 316 15.8 1.37
2–2.9 82 6.72 1.11 189 14.61 1.56 127 11.79 1.86
3? 84 8.02 1.32 191 13.12 1.47 157 14.54 1.73
Daily hours spent watching TV
0–0.9 34 8.22 2.51 120 22.06 3.15 69 14.57 3.04
1–2.9 131 6.27 0.83 370 14.37 1.07 322 16.66 1.39
3–4.9 70 5.15 0.92 181 10.96 1.24 165 13.06 1.51
5? 62 5.20 0.98 175 13.04 1.42 134 15.10 1.96
Levels of physical activity
None 164 6.67 0.80 495 18.25 1.17 342 15.72 1.26
Low 85 5.17 0.88 268 12.82 1.16 237 15.06 1.46
Status of the diabetes epidemic
123
Author's personal copy

were borderline diabetic. These numbers are alarming as
they indicate a total of 1,745,532 diabetic and 979,953
borderline diabetic Saudis. The KSA population is a very
young population, with 80 % of the population under the
age of 40 in 2013 (Ministry of Health, Kingdom of Saudi
Arabia 2013), and the burden of type 2 diabetes is likely to
overwhelm the health system of the country in the near
future. Our results call for a national program to prevent
and control diabetes. Moreover, screening campaigns are
needed to detect borderline and undiagnosed diabetes at
early stages for proper preventive measures and treatment.
Diabetes has a major impact on health and quality of life
and is a worsening problem in both the developed and the
developing world due to the complications it generates,
such as heart disease, kidney disease, eye damage, neu-
ropathy, and many others (Alberti and Zimmet 1998;
Ceriello 2006). These cause an increased number of years
lived with disability, during which patients suffer greatly,
and increasingly, from these associated complications
(Stewart and Liolitsa 1999; Egede 2004; Kalyani et al.
2010). In our study, diabetes was associated with self-
reported hypertension and hypercholesterolemia. It was
also associated with these diseases as measured in our
survey (results not shown). These results demonstrate the
joint occurrence of these three diseases, and hence a higher
burden carried by Saudi patients. Moreover, Saudis treated
for hypercholesterolemia were more likely to be diabetic
but undiagnosed (results not shown). As hypercholester-
olemia is a risk factor for diabetes, this suggests many
missed opportunities within the health care system where
patients with diagnosed hypercholesterolemia are not
evaluated for diabetes as well.
Indeed, diabetes is preventable through a healthy life-
style and early detection (Harris and Eastman 2000;
Goldberg 2006; Lindstrom et al. 2006). However, Saudis
do not seem to use medical preventive services, despite the
fact that they are covered by a free national health system
(Clark 2011). Our findings showed that only 14.8 %
reported visiting a health clinic for a regular checkup
within the last year (results not shown). This finding is of
concern, as we found that most pre-diabetic individuals
who progressed to become diabetic were able to control
their diabetes once they started treatment. In a country such
as KSA where medical care is free, the lack of health
services utilization should be addressed through awareness
campaigns. Moreover, Saudis are engaged in behavioral
activities that are contributing to the high rates of diabetes
and borderline diabetes. For example, our survey shows
low levels of fruit and vegetable intake and physical
activity.
Diabetes has major economic impact, including loss in
human capital, decrease in productivity, and medical costs
Table 3 continued
Socio-demographic and risk factors Undiagnosed diabetic Diabetic Borderline diabetic
N Weighted (%) SE N Weighted (%) SE N Weighted (%) SE
Moderate 44 5.76 1.41 131 11.89 1.63 104 13.95 1.92
High 96 5.71 0.80 205 10.01 0.98 200 15.29 1.56
Obesity
Not obese 217 5.19 0.55 556 10.75 0.69 504 13.51 0.90
Obese 166 7.79 0.88 516 19.87 1.22 350 18.63 1.46
History of diagnosis with hypertension
No 337 5.65 0.46 774 10.79 0.57 784 15.09 0.80
Yes 50 6.95 1.49 317 49.59 3.02 90 16.23 2.36
History of diagnosis with hypercholesterolemia
No 345 5.77 0.48 798 11.21 0.59 806 15.21 0.80
Yes 33 6.00 1.36 239 47.84 3.39 56 14.43 2.45
History of diagnosis of chronic condition
No 364 5.73 0.46 972 12.56 0.60 829 15.07 0.78
Yes 25 7.33 2.25 122 24.53 3.21 52 16.24 3.51
Undiagnosed diabetic: Respondents reported not being previously diagnosed with diabetes but their measured HbA1c equals or exceeds 6.5 %
(48.5 mmol/mol)
Diabetic: measured HbA1c equals or exceeds 6.5 % (48.5 mmol/mol), or measured HbA1c does not equal or exceed 6.5 % (48.5 mmol/mol) but
the respondent reported taking medications for diabetes
Borderline diabetic: Respondents did not report taking drugs for diabetes, and their measured HbA1c blood level was between 5.7 %
(35.3 mmol/mol) and less than 6.5 % (48.5 mmol/mol)
SE standard error
C. El Bcheraoui et al.
123
Author's personal copy
(American Diabetes Association 2013; WHO 2014; Ng
et al. 2014). The medical costs not only arise from the
direct cost of treatments for high glucose levels but extend
to include the treatment costs of diabetes complications. In
the United States, one in five health care dollars is spent on
diabetes (American Diabetes Association 2013).
Previous studies have reported on the prevalence of
diabetes in KSA. Data from the 1980s showed a prevalence
of 4.7 % among Saudis aged 15 years or older in rural
Saudi Arabia (Fatani et al. 1987). A study conducted from
1995 to 2000 revealed a 23.7 % prevalence of type 2 dia-
betes among individuals 30–70 years old (Al-Nozha et al.
2004). The last reported prevalence of diagnosed and
measured diabetes in KSA was in 2005, which revealed a
15.3 % prevalence of diagnosed diabetes and an 18.3 %
prevalence of measured diabetes [HbA1c greater or equal
to 7.0 % (53 mmol/mol)] among Saudis aged 15–64 years
(Ministry of Health, Kingdom of Saudi Arabia, in collab-
oration with WHO 2005). When restricted to the same age
groups and using the same cutoff point, our data revealed a
prevalence of 7.1 and 5.4 % for these categories, respec-
tively. However, the two surveys cannot be compared. In
our survey, we applied post-stratification weights to reflect
the Saudi population and adjusted for the increased prob-
ability of sick individuals to agree to visit health facilities
for physical examinations and blood samples. As these
steps were not taken in the previous survey, the prevalence
of diabetes and other NCDs may have been overestimated.
Indeed, when we did not apply adjustments based on post-
stratification and the predicted probability of completing
the clinic visit, our diagnosed and measured diabetes esti-
mates were 8.9 % (95 % CI: 8.3–9.4) and 10.3 % (95 %
CI: 9.3–11.3), respectively. In our survey, 50 % of partic-
ipants went to a clinic for physical measurements. When
we compared the two groups, those who went to a clinic
were more likely to self-rate their health as good, fair, or
poor, be overweight or obese, and to have received a
diagnosis of pre-diabetes. They were less likely to smoke
and to have had their last routine physical exam prior to
2012. Hence, our adjustment for the predicted probability
of completing the clinic visit was critical to produce
nationally representative estimates of diabetes. Both our
survey and the 2005 report were conducted by medical
staff from local health facilities. It is possible that sick
individuals were more likely to participate in the 2005
survey. However, in our study, we enforced a random
selection within a household, and our electronic data cap-
ture registered the selected individual and would not allow
for a replacement.
Over the last few years, the SMOH started several ini-
tiatives to control chronic diseases and the diabetes
epidemic, including a national awareness program around
diabetes (Ministry of Health, Kingdom of Saudi Arabia
2014). These initiatives could have resulted in some
decline in diabetes prevalence over the last eight years.
Also, in September 2012, the SMOH in collaboration with
the World Health Organization’s Eastern Mediterranean
Regional Office (EMRO) organized an international con-
ference that aimed to address the topic of NCDs in the area
(WHO Regional Office for the Eastern Mediterranean
2012). The conference resulted in the Riyadh Declaration
that included ten recommendations to combat NCDs at the
regional level (WHO EMRO 2012). The SMOH worked
with EMRO, and the declaration was adopted by EMRO
during the regional committee meeting in October 2012.
This step will amount to a major impact on health in KSA
and the region. Indeed, the Gulf countries have similar
habits and health profile (Mokdad et al. 2014). Hence our
findings could be used by the gulf countries and the gulf
council to promote health, control and treat diabetes in the
Fig. 1 Percent distribution of
diagnosis and treatment status
among diabetic Saudis 15 years
or older, 2013
Status of the diabetes epidemic
123
Author's personal copy

region (Secretariat General 2012). More so, inter-countries
collaboration, especially through the developed–develop-
ing countries model, can be beneficial to KSA and the
region in their fight against NCDs (Maziak et al. 2013).
Our study has some limitations. First, our data are from
a cross-sectional study, and therefore, we cannot assess
causality. Second, many of our behavioral data, such as
diet and physical activity, are self-reported and subject to
recall and social desirability biases. However, our study is
based on a large sample and used a standardized method-
ology for all its measures. Third, only 52 % of respondents
completed the visit to a health clinic and had their blood
drawn for analysis. However, our weighting methodology
accounted for this bias by applying a post-stratification
adjustment using socio-demographic characteristics, health
behaviors, previously diagnosed NCDs, and anthropomet-
ric measurements of respondents from the household
survey.
Table 4 Association between socio-demographic characteristics, risk factors, and diabetes among Saudis 15 years or older, Saudi Health
Interview Survey, Kingdom of Saudi Arabia, 2013
Socio-demographic and risk factors Categories Socio-demographic model Full adjusted model
AOR 95 % CI AOR 95 % CI
Sex Male REF REF
Female 0.74 0.58–0.95 0.68 0.53–0.89
Age 1.06 1.05–1.07 1.04 1.04–1.06
Marital status Currently married REF REF
Never married 0.80 0.55–1.16 0.88 0.59–1.27
Separated, divorced, or widowed 1.23 0.85–1.80 1.28 0.82–1.89
Education Primary school or less REF
Elementary or high school completed 0.99 0.75–1.31
College degree or higher education 0.92 0.66–1.30
Type of fat consumed Vegetable oils REF
Margarine 1.75 0.91–3.38
Animal fat 0.80 0.44–1.46
None in particular 1.08 0.68–1.73
Daily servings of fruits and vegetables 0 REF
0.1–2.9 1.32 0.69–2.51
3–4.9 1.10 0.55–2.20
5? 1.64 0.77–3.47
Daily servings of meat and chicken 0–0.9 REF
1–1.9 0.92 0.68–1.25
2–2.9 1.30 0.90–1.87
3? 1.07 0.72–1.58
Levels of physical activity None REF
Low 0.78 0.57-1.06
Moderate 0.59 0.39-0.88
High 0.67 0.48–0.94
Obesity Not obese REF
Obese 1.21 0.94–1.55
History of diagnosis with hypertension No REF
Yes 1.82 1.31–2.53
History of diagnosis with hypercholesterolemia No REF
Yes 2.18 1.51–3.15
History of diagnosis of chronic condition No REF
Yes 1.25 0.87–1.79
Diabetic: Measured HbA1c equals or exceeds 6.5 % (48.5 mmol/mol), or measured HbA1c does not equal or exceed 6.5 % (48.5 mmol/mol) but
the respondent reported taking medications for diabetes
Bold values represent 95 % CI that are larger or smaller than, but do not contain 1.0
CI confidence interval, AOR adjusted odds ratio
C. El Bcheraoui et al.
123
Author's personal copy

Our study revealed a high rate of diabetes in a young
population in KSA. The country, however, is not alone in
this epidemic. In 2010, diabetes ranked the fifth cause of
death in the Arab World, an increase from the 11th cause as
reported for 1990(Mokdad et al. 2014). Moreover, our
findings of the low utilization of free health services for
preventive care call for a major effort to inform the public
of the value of prevention. In addition to regular physical
checkups and screenings, programs to improve diet and
increase physical activity are urgently needed. These pro-
grams should take into account the culture and
environment in KSA. Creative methods will need to be
adopted to increase physical activity in a very hot envi-
ronment. In many places in the world, outdoor activities
are encouraged, but in KSA indoor activities have to
be established and made available to the public and
communities, perhaps using the KSA’s large indoor infra-
structure including malls and public spaces.
Our findings call for increased awareness of diabetes
and undiagnosed diabetes in the Kingdom. Moreover, our
study calls for an improvement in the early detection of
pre-diabetes, as it is the first step in prevention, especially
among adults 35 years and older. The detection cam-
paigns should be coupled with intensive and aggressive
programs for prevention and control of diabetes. A
national chronic disease program should be established
and involve several partners. Indeed, to combat NCDs, a
large segment of the government and society has to be
involved. This is not a task for the Ministry of Health
alone, but requires involvement of other ministries to
offer a comprehensive socio-cultural approach to fighting
this epidemic.
Table 5 Association between socio-demographic characteristics, risk factors, and borderline diabetes among Saudis 15 years or older, Saudi
Health Interview Survey, Kingdom of Saudi Arabia, 2013
Socio-demographic and risk factors Categories Socio-demographic model Full adjusted model
AOR 95 % CI AOR 95 % CI
Sex Male REF REF
Female 0.90 0.71–1.14 0.82 0.61–1.10
Age 1.03 1.02–1.04 1.03 1.02–1.04
Marital status Currently married REF REF
Never married 1.19 0.88–1.61 1.42 0.98–2.06
Separated, divorced, or widowed 0.90 0.58–1.41 1.14 0.65–1.98
Education Primary school or less REF REF
Elementary or high school completed 1.00 0.73–1.38 0.99 0.68–1.43
College degree or higher education 1.21 0.84–1.74 1.26 0.81–1.94
Type of fat consumed Vegetable oils REF
Margarine 0.51 0.25–1.02
Animal fat 0.55 0.24–1.30
None in particular 1.24 0.73–2.13
Daily servings of fruits and vegetables 0 REF
0.1–2.9 1.37 0.67–2.80
3–4.9 1.02 0.45–2.32
5? 0.89 0.40–1.97
Daily hours spent watching TV 0–0.9 REF
1–2.9 1.20 0.66–2.16
3–4.9 0.85 0.45–1.59
5? 1.02 0.53–1.94
Obesity Not obese REF
Obese 1.20 0.87–1.67
History of diagnosis with hypercholesterolemia No REF
Yes 1.39 0.80–2.43
Borderline diabetic: Respondents did not report taking drugs for diabetes, and their measured HbA1c blood level was between 5.7 %
(35.3 mmol/mol) and less than 6.5 % (48.5 mmol/mol)
Bold values represent 95 % CI that are larger or smaller than, but do not contain 1.0
CI confidence interval, AOR adjusted odds ratio
Status of the diabetes epidemic
123
Author's personal copy

References
Alberti Kgmm, Zimmet Pz (1998) Definition, diagnosis and classi-
fication of diabetes mellitus and its complications. Part 1:
diagnosis and classification of diabetes mellitus. Provisional
report of a WHO Consultation. Diabet Med 15:539–553. doi:10.
1002/(SICI)1096-9136(199807)15:7\539:AID-DIA668[3.0.
CO;2-S
Al-Hazzaa HM, Abahussain NA, Al-Sobayel HI et al (2011) Physical
activity, sedentary behaviors and dietary habits among Saudi
adolescents relative to age, gender and region. Int J Behav Nutr
Phys Act 8:140. doi:10.1186/1479-5868-8-140
Al-Nozha MM, Al-Maatouq MA, Al-Mazrou YY et al (2004)
Diabetes mellitus in Saudi Arabia. Saudi Med J 25:1603–1610
American Diabetes Association (2013) Economic costs of diabetes in
the U.S. in 2012. Diabetes Care 36:1033–1046. doi:10.2337/
dc12-2625
Amuna P, Zotor FB (2008) Epidemiological and nutrition transition in
developing countries: impact on human health and development.
Proc Nutr Soc 67:82–90. doi:10.1017/S0029665108006058
Ceriello PA (2006) Oxidative stress and diabetes associated compli-
cations. Endocr Pract 12:60–62. doi:10.4158/EP.12.S1.60
Clark M (2011) Health care system in Saudi Arabia: an overview.
East Mediterr Health J 17:784–793
Craig CL, Marshall AL, Sjostrom M et al (2003) International
physical activity questionnaire: 12-country reliability and valid-
ity. Med Sci Sports Exerc 35:1381–1395. doi:10.1249/01.MSS.
0000078924.61453.FB
Egede LE (2004) Diabetes, major depression, and functional disabil-
ity among U.S adults. Diabetes Care 27:421–428. doi:10.2337/
diacare.27.2.421
Fatani HH, Mira SA, El-Zubier AG (1987) prevalence of diabetes
mellitus in rural Saudi Arabia. Diabetes Care 10:180–183.
doi:10.2337/diacare.10.2.180
Goldberg RB (2006) Lifestyle interventions to prevent type 2
diabetes. Lancet 368:1634–1636. doi:10.1016/S0140-6736(06)
69676-1
Harris MI, Eastman RC (2000) Early detection of undiagnosed
diabetes mellitus: a US perspective. Diabetes Metab Res
Rev 16:230–236. doi:10.1002/1520-7560(2000)9999:9999\:AID-
DMRR122[3.0.CO;2-W
Kalyani RR, Saudek CD, Brancati FL, Selvin E (2010) Association of
diabetes, comorbidities, and A1C with functional disability in
older adults results from the National Health and Nutrition
Examination Survey (NHANES), 1999–2006. Diabetes Care
33:1055–1060. doi:10.2337/dc09-1597
Key TJ, Allen NE, Spencer EA, Travis RC (2002) The effect of diet
on risk of cancer. Lancet 360:861–868. doi:10.1016/S0140-
6736(02)09958-0
Lindstrom J, Ilanne-Parikka P, Peltonen M et al (2006) Sustained
reduction in the incidence of type 2 diabetes by lifestyle
intervention: follow-up of the Finnish Diabetes Prevention Study.
Lancet 368:1673–1679. doi:10.1016/S0140-6736(06)69701-8
Lozano R, Naghavi M, Foreman K et al (2012) Global and regional
mortality from 235 causes of death for 20 age groups in 1990 and
2010: a systematic analysis for the Global Burden of Disease
Study 2010. Lancet 380:2095–2128. doi:10.1016/S0140-6736
(12)61728-0
Maziak W, Critchley J, Zaman S et al (2013) Mediterranean studies of
cardiovascular disease and hyperglycemia: analytical modeling
of population socio-economic transitions (MedCHAMPS)—
rationale and methods. Int J Public Health 58:547–553. doi:10.
1007/s00038-012-0423-4
Ministry of Health (2005) Kingdom of Saudi Arabia, in collaboration
with WHO (2005) Ministry of Health, Kingdom of Saudi Arabia,
in collaboration with, World Health Organization. EMRO,
Country-Specific standard report Saudi Arabia
Ministry of Health, Kingdom of Saudi Arabia (2013) Kingdom of
Saudi Arabia Projected Population 2013
Ministry of Health, Kingdom of Saudi Arabia (2014) National
Program for Diabetes Awareness. http://sahsehlo.moh.gov.sa/
Pages/Home.aspx
Mokdad AH, Jaber S, Aziz MIA et al (2014) The state of health in the
Arab world, 1990–2010: an analysis of the burden of diseases,
Table 6 Association between socio-demographic characteristics, risk factors, and undiagnosed diabetes among diabetic Saudis 15 years or
older, Saudi Health Interview Survey, Kingdom of Saudi Arabia, 2013
Socio-demographic and risk factors Categories Socio-demographic model Full adjusted model
AOR 95 % CI AOR 95 % CI
Sex Male REF REF
Female 0.90 0.64–1.28 0.93 0.66–1.29
Age Age 1.03 1.02–1.05 1.03 1.03–1.04
Marital status Currently married REF
Never married 0.88 0.55–1.43
Separated, divorced, or widowed 1.21 0.61–2.40
Education Primary school or less REF
Elementary or high school completed 1.02 0.67–1.56
College degree or higher education 1.21 0.76–1.93
History of diagnosis of chronic condition No REF
Yes 1.31 0.65–2.65
Undiagnosed diabetic: Respondents reported not being previously diagnosed with diabetes but their measured HbA1c equals or exceeds 6.5 %
(48.5 mmol/mol)
Bold values represent 95 % CI that are larger or smaller than, but do not contain 1.0
CI confidence interval, AOR adjusted odds ratio
C. El Bcheraoui et al.
123
Author's personal copy
injuries, and risk factors. Lancet 383:309–320. doi:10.1016/
S0140-6736(13)62189-3
Ng SW, Zaghloul S, Ali HI et al (2011) The prevalence and trends of
overweight, obesity and nutrition-related non-communicable
diseases in the Arabian Gulf States. Obes Rev Off J Int Assoc
Study Obes 12:1–13. doi:10.1111/j.1467-789X.2010.00750.x
Ng CS, Lee JYC, Toh MP, Ko Y (2014) Cost-of-illness studies of
diabetes mellitus: a systematic review. Diabetes Res Clin Pract.
doi:10.1016/j.diabres.2014.03.020
NHANES (2009) National Heatlth and Nutrition Examination Survey
(NHANES). Health Tech/Blodd Pressure Procedures Manual.
Centers for Disease Control and Prevention
Secretariat General (2012) The Cooperation Council for the Arab
States of the Gulf. http://www.gcc-sg.org/eng/
Stampfer MJ, Hu FB, Manson JE et al (2000) Primary prevention of
coronary heart disease in women through diet and lifestyle.
N Engl J Med 343:16–22. doi:10.1056/NEJM200007063430103
Stewart R, Liolitsa D (1999) Type 2 diabetes mellitus, cognitive
impairment and dementia. Diabet Med J Br Diabet Assoc
16:93–112
WHO EMRO (2012) International Conference on healthy Lifestyles
and noncomunicable diseases in the arab world and the middle
east. The Riyadh Declaration
WHO (2014) WHO Diabetes: the cost of diabetes. In: WHO. http://
www.who.int/mediacentre/factsheets/fs236/en/. Accessed 22 May
2014
WHO Regional Office for the Eastern Mediterranean (2012) Inter-
national conference on healthy lifestyles and noncommunicable
diseases in the Arab world and the Middle East, Riyadh, 10–12
September 2012. Riyadh, Saudi Arabia
WHO/FAO Expert Consultation (2003) Diet, nutrition and the
prevention of chronic diseases. World Health Organ Tech Rep
Ser 916:i–viii, 1–149, backcover
Status of the diabetes epidemic
123
Author's personal copy


