Embed Size (px)
Citation preview

1
Status of the Phase I
of the SARAF Linac
L. Weissman, D. Berkovits, I. Eliyahu, I. Gertz, A. Grin,
S. Halfon, G. Lempert, I. Mardor, A. Nagler, A. Perry,
J. Rodnizki,
Soreq NRC, Yavne, Israel
K. Dunkel, M. Pekeler, C. Piel, P. vom Stein
RI Research Instruments, Bergisch Gladbach, Germany
A. Bechtold,
NTG, Gelnhausen 63571, Germany
LINAC 2010, Tsukuba, Japan
September 15, 2010

2
Presentation Outline
Overview
SARAF Linac Phase I components
ECR ion source + LEBT
RFQ
Prototype Superconducting Module (PSM)
Beam operation experience
Outlook

3
RFQ 1.5 MeV/u
PSM
p: 4 MeV, d: 5 MeV
EIS20 keV/u
Phase I
2009
Phase II
2015
5 × SC Modules 40 MeV
Radio
Pharmaceuticals
Radioactive
beams
Nuclear
Astrophysics
Thermal neutron
diffractionThermal neutron
radiography
ValueParameter
p / dIons
5 – 40 MeVEnergy
0.04 – 2 mACurrent
Hands-OnMaintenance
•Current upgradeable to 4 mA
Accelerator Parameters
SARAF LINAC Layout
44
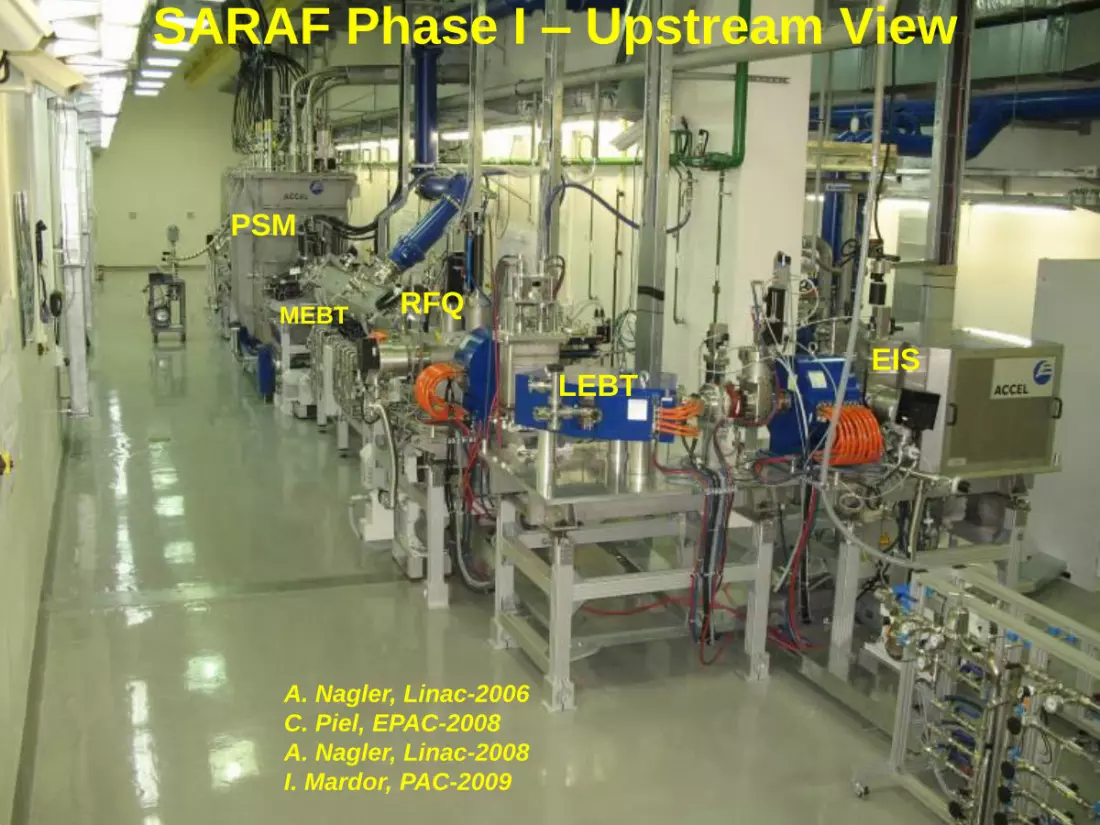
SARAF Phase I – Upstream View
EISLEBT
RFQMEBT
PSM
A. Nagler, Linac-2006
C. Piel, EPAC-2008
A. Nagler, Linac-2008
I. Mardor, PAC-2009

5
ECR/LEBT
wire/FCslits
aperture
K. Dunkel PAC 2007
ECRIS
8 mA p/d
DC/pulsed
analyzer
magnet
Build by RI (ACCEL)
sol1
sol2 sol3
beam
blocker
5 mA proton
beam optics
RFQECR
Large beam
minimize
space charge
(TRACK)
See poster TUP74
L. Weissman et al.

6
LEBT aperture
-19 -4 11
-30
-5
21
x [mm]
x' [m
rad
]
50 mm
-19 -4 11
-30
-5
21
x [mm]
x' [m
rad
]
5 mm
-19 -4 11
-30
-5
21
x [mm]
x' [m
rad
]
25 mm
-19 -4 11
-30
-5
21
x [mm]
x' [m
rad
]
15 mm
-19 -4 11
-30
-5
21
x [mm]
x' [m
rad
]
10 mm
Manipulating beam size, current and emittance using the LEBT aperture
0
0.05
0.1
0.15
0.2
0.25
0 0.5 1 1.5 2 2.5 3 3.5 4 4.5
LEBT current (mA)
rm
s n
orm
em
i ( p
mm
mra
d)
50
55
60
65
70
75
80
85
Aperture diam. (mm)
Tra
ns
mis
sio
n (
%)
RMS norm emi
Transmission
5 10 15 20 25 50

7
RFQ Beam Properties
Beam Parameter Protons Deuterons
Energy (MeV) 1.5 (1.5) 3.0 (3.0)
Maximal current [mA] 4.0 (CW) (4.0) 2.5 (10-2) (4.0)
Transverse emittance, r.m.s.,
normalized, 100% [π·mm·mrad]
( 0.5 mA, closed LEBT aperture) 0.17 (0.30) 0.16 (0.30)
(4.0 mA, open LEBT aperture) 0.25 / 0.29 (0.30) NM
Longitudinal emittance, r.m.s.,
[π·keV·deg/u] (3.0 mA/0.4 mA)90 (120) 200 (120)
Transmission [%] ( 0.5 mA)
(2.0 mA)
( 4.0 mA)
80 (90)
70 (90)
65 (90)
NM
NM
70 (90)
RF Conditioning Status
Input Power
[kW]
Duration [hrs]
190 (CW) 12
210 (CW) 2
240 (CW) 0.5
260 (DC = 80%) 0.5
Deuteron CW operation
requires conditioning up
to 260 kW (65 kV)
Power density:
average ~ 25 W/cm2
I. Mardor, SRF 2009
176 MHz 4-Rod CW RFQ
Built by NTG/
Univ. Frankfurt
2006
2005

8
0
50
100
150
200
250
300
0 10 20 30 40 50 60 70 80 90 100
Duty Cycle (%)
Fo
rwa
rd R
F P
ow
er
(kW
)
18.11 20.11 23.11 26.11
8.12 9.12 20.12 22.12
23.12 24.12 31.12 Goal
0
1
2
3
4
5
6
7
8
0 20 40 60 80 100 120 140 160 180 200 220 240 260 280 300
Average power (kW)
Pre
ss
ure
(1
0^
-7 m
ba
r)
20.11 23.11 26.11 8.12
9.12 20.12 22.12 23.12
24.12 31.12 Goal
The objective of the RFQ
conditioning (260 kW CW)
has not been achieved yet
Example: campaign end 2009
RFQ conditioning
campaigns
Deuterons CW
Deuterons CW
RFQ issues which prevented
reaching deuteron CW power:Arching from back side of rods
Melted tuning plates
Melted plungers
Broken RF fingers
Warming of end flanges
Burning O-rings
…
See poster TUP095 J. Rodnizki et al.

9
0
50
100
150
200
250
300
0 50 100 150 200 250 300
FPower in pulse (kW)
Scale
d V
pic
ku
p^
2(k
W)
4-Jul
9July
10July
Linear
Non-linearity of voltage response,
High x-ray background
Discharge between back of the rods and stems
Discharge between the rods and stems
In spring 2009 the rods were modified
locally to reduce the parasitic fields.
This solved the problem of discharge.
However, field realignment was required
(later in the talk).

10
Burning of tuning plates
Contact springs of tuning plates were burned twice
New design :
massive silver plate for better current and
thermal conductivity,
mechanical contact with stems by a splint system

11
Melting of plunger electrode
The low-energy plunger electrode has been melted.
It was verified that this was not due to a resonance phenomenon.
New design:
plunger was reduced by size (twice less thermal load),
cooling capacity was improved (the plunger and cooling shaft made from one block)

12
Plungers RF sliding contacts
Broken and deformed RF fingers of the plunger sliding contacts.
The sign analysis of the finger surface showed melting signs.
New design :
new type of RF contact with more rigid fingers
shafts plated by rhodium to avoid cold welding
rigid alignment of the plunger providing uniform contact pressure
Cu/Be silver plated
13
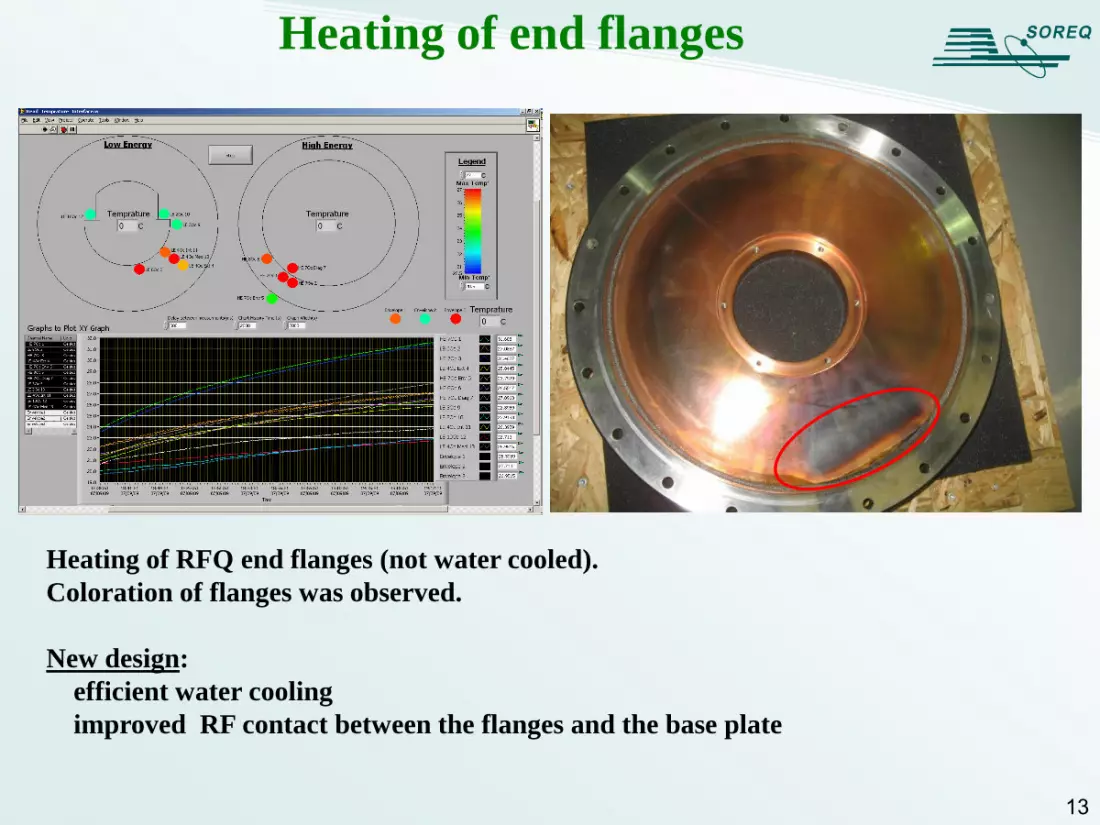
Heating of end flanges
Heating of RFQ end flanges (not water cooled).
Coloration of flanges was observed.
New design:
efficient water cooling
improved RF contact between the flanges and the base plate

14
Failure of vacuum seals
Several times vacuum failure
occurs during conditioning
Damaged vacuum or water
o-rings
This probably happens due to
discharges of RF field leaked
along cooling tubes
vacuum
air
beam direction
wa
ter

15
40 39bt 39 38b 38 37b 37 36b 36 35b 35 34b 34 33 32b 32 31 30 29b 29 28 27tb 27 26tb 26 25 24 23 22 21b 21 20b 20 19b 19 18 17 16 15 14t 14 13t 13 12 11 10 9 8 7 6 5 4 3 2 1t
150 -300 mV
<150 mV
300-450 mV
450-600 mV
600-750 mV
750-1000 mV
>1000 mV
RF mapping of cooling channels
RF hot spots were observed by mapping RF fields (200 W)
on the cooling channels .
In many cases these positions corresponded to the failed o-
rings.
Solutions for better RF contact, not implemented yet.

16
RFQ stability/availability
Tri
ps/
hou
r
Avail
ab
ilit
y (
%)
Duty cycle (%)
Stability as a function of the duty cycle6 hours
DC 25% DC 30% DC 35% DC 40% DC 45% DC 50% DC 55%
RF power 200 kW
25 oC
30oC

17
RFQ Conditioning Summary
The objective to condition RFQ to CW deuteron
operation powers is NOT achieved yet
Next steps to improve RF performance
Redesign and replace water flanges to solve the vacuum
seals problem
Improve vacuum systems: additional pumps, centralized oil
free backing
Further improvement of the RFQ cooling
Additional diagnostics for RF conditioning (more vacuum
gauges, RGA, x-ray mapping, etc.)

18
RFQ beam steering effects
Observed strong dependence of the overall transmission and beam
profiles on the RFQ forward power.
Such strong effects were not observed before the modifications made in
the RFQ in the first half of 2009
0
10
20
30
40
50
60
70
80
90
100
50 52.5 55 57.5 60 62.5 65 67.5 70 72.5
RF power (kW)
Tra
ns
mis
sio
n (
%)
Nov-2009
Profile X
-2
-1
0
1
2
3
4
5
6
7
-12.5 -10 -7.5 -5 -2.5 0 2.5 5 7.5 10 12.5
Position (mm)
Cu
rre
nt
(au
. U
n.)
61 kW
56 kW
53 kW
Profile XMEBT

March 2010:
replaced the shims in the high-energy section to shift the rod electrodes in the vertical plain
additional tuning block was introduced to keep the resonance frequency in range
as result the field homogeneity was improved to a large extent (+/- 2.7 %)
80
85
90
95
100
105
110
115
0 5 10 15 20 25 30 35 40
Stem no
Fie
ld U
0 [
%]
Nov-2009 Apr-2010
beam
19
RFQ field homogeneity
Tuning block
Shim

20
After improving field homogeneity observe
much smaller RFQ power effects
We plan further improvements of rods alignment(with help of our colleagues from the optics department)
RFQ steering effects
0
10
20
30
40
50
60
70
80
90
100
50 52.5 55 57.5 60 62.5 65 67.5 70 72.5
RF power (kW)
Tra
ns
mis
sio
n (
%)
Apr-2010 Nov-2009
Profile X
-2
-1
0
1
2
3
4
5
6
7
-12.5 -10 -7.5 -5 -2.5 0 2.5 5 7.5 10 12.5
Position (mm)
Cu
rre
nt
(au
. U
n.)
61 kW
56 kW
53 kW
Profile X
-1
0
1
2
3
4
5
-12.5 -10 -7.5 -5 -2.5 0 2.5 5 7.5 10 12.5
Position (mm)C
urr
en
t (a
u. u
n.)
62 kW
56 kW
54 kW
Nov 2009
Apr 2010
21
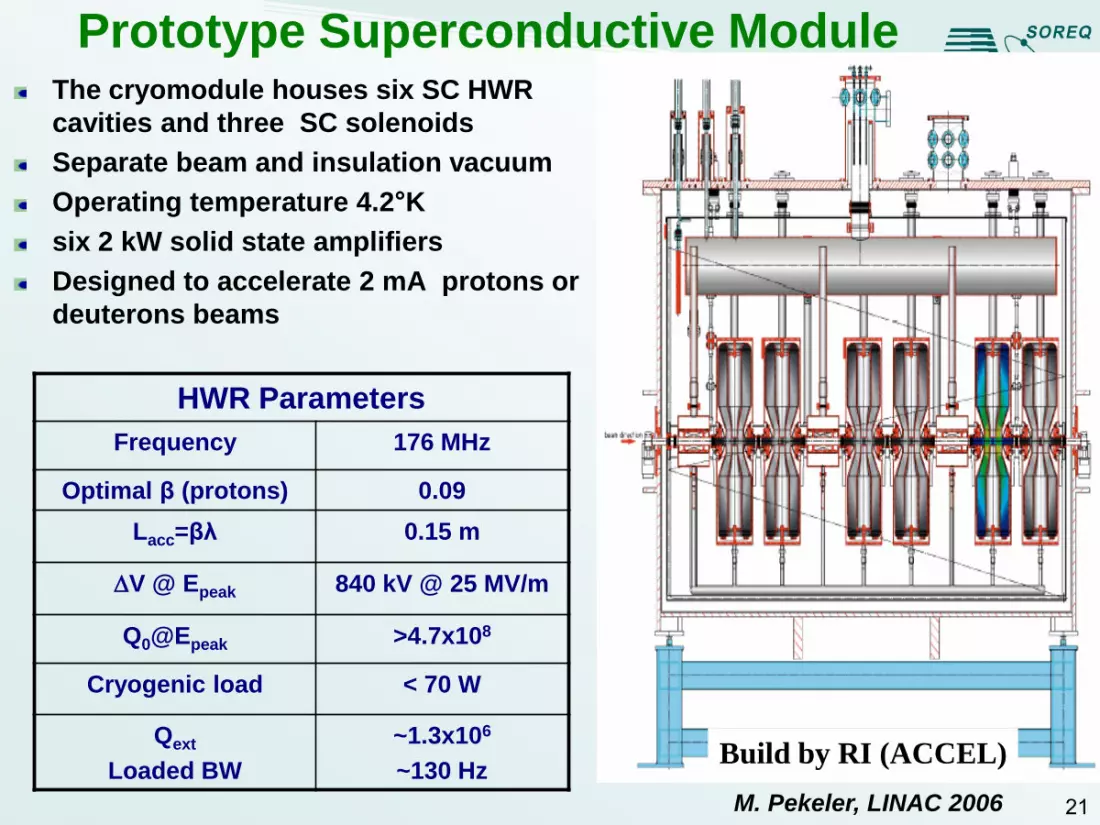
Prototype Superconductive ModuleThe cryomodule houses six SC HWR
cavities and three SC solenoids
Separate beam and insulation vacuum
Operating temperature 4.2°K
six 2 kW solid state amplifiers
Designed to accelerate 2 mA protons or
deuterons beams
HWR Parameters
176 MHzFrequency
0.09Optimal β (protons)
0.15 mLacc=βλ
840 kV @ 25 MV/mDV @ Epeak
>4.7x10⁸Q0@Epeak
< 70 WCryogenic load
~1.3x10⁶
~130 Hz
Qext
Loaded BW
M. Pekeler, LINAC 2006
Build by RI (ACCEL)

22
Helium processing :
99.9999% purity,
4 10-5 mbar
up to 43 MV/m 10% DC
Reduced field emission from the
cavities and allowed stable
operation at the nominal fields.
However, simultaneous operation
of all cavities at the nominal field
was not achieved for long period.
0.01
0.1
1
10
100
1000
15 20 25 30 35
Epeak (MV/m)
Rad
iati
on
(m
R/h
)
HWR1
HWR2
HWR3
HWR4
HWR5
HWR6
0.01
0.1
1
10
100
1000
15 20 25 30 35
Epeak (MV/m)
Rad
iati
on
(m
R/h
)HWR1
HWR2
HWR3
HWR4
HWR5
HWR6
Before
After
PSM commissioning
A. Perry, SRF2009
nominal peak field

23
HWR Microphonics measurements*
HWRs are extremely sensitive to LHe pressure fluctuations (60 Hz/mbar)
Detuning signal is dominated by the Helium pressure drift
Detuning sometimes exceeds +/-200 Hz (~ +/-2 BW).
100 110 120 130 140 150 160 170 180 190 200-100
-80
-60
-40
-20
0
20
40
60
80
100
Time[Sec]
Fre
quency D
etu
nin
g [
Hz]
Frequency Detuning
* Performed in collaboration with
J.Delayen and K. Davis (JLab)
45 sec45 sec

24
HWR Tune*
Piezoelectric actuator provides fine tuning of the
resonance frequency
Range reduction of the piezoelectric elements
Were subsequently replaced
is used for coarse tuning.Stepper motor
Stepper motor movement induces instabilities
and is therefore disabled during RF operation
* Performed in collaboration with
J.Delayen and K. Davis (JLab)600 700 800 900 1000 1100 1200 1300 1400
700
750
800
850
900
950
1000
1050
1100
Piezo Amplifier applied voltage[scaled]
Fre
quency d
etu
nin
g[H
z]
Tuner Response Curve
1st cycle
2nd cycle
Response of the fine tuner is
highly non-linear.

25
HWR Couplers temperature
During operation significant
heating of coupler #4 was
observed
Operation of cavity 4 is
therefore limited to ~500 kV
to avoid overheating
0.E+00
1.E+05
2.E+05
3.E+05
4.E+05
5.E+05
6.E+05
7.E+05
0 1 2 3 4 5 6 7 8 9 10 11 12 13
Time (h)
Vo
ltag
e (
V)
Voltage Cavity 4
60
65
70
75
80
85
90
95
100
0 1 2 3 4 5 6 7 8 9 10 11 12 13
Time (h)
T(
K)
coupler 4

26
PSM Status
Reached stable long-term only at 60-70% of nominal gradients :
high-sensitivity to helium pressure fluctuations
problems with tuner response
warming up of some couplers
Work on implementing a new tuner control algorithm on a NI – CRIO FPGA core – improve the response time and account for the hard nonlinearities.
Upgrade of 2 kW amplifiers to 4.0 kW to provide additional RF power required for high current field stabilization.

HWR1
1.2
1.3
1.4
1.5
1.6
1.7
1.8
-120 -95 -70 -45 -20 5 30 55 80 105 130 155
phase (deg)
En
erg
y (
Me
V)
27
Example of phasing cavities for
proton beam
Use low beam DC (10-2 %)
RFQ - 100 % (protons),
a few % (deuterons)
Measure energy of the protons scattered
on a 0.3 mg/cm2 gold foil as a function of
the cavities voltages/phases
Phasing cavities for pulsed beams
HWR 3
1.2
1.3
1.4
1.5
1.6
1.7
1.8
1.9
2
-200 -170 -140 -110 -80 -50 -20 10 40 70 100 130
phase (deg)
En
erg
y (
Me
V) 200 kV
430 kV
HWR4
1.7
1.8
1.9
2
2.1
2.2
2.3
2.4
-260 -220 -180 -140 -100 -60 -20 20 60 100 140 180
phase (deg)
En
erg
y (
MeV
)
200 kV
450 kV
HWR5
2
2.1
2.2
2.3
2.4
2.5
2.6
2.7
2.8
2.9
-160 -120 -80 -40 0 40 80 120 160 200
phase (deg)
En
erg
y (
Me
V)
200 kV
460 kV
HWR6
2
2.2
2.4
2.6
2.8
3
3.2
-180 -140 -100 -60 -20 20 60 100 140 180
phase (deg)
En
erg
y (
Me
V)
200 kV
660
Final settings for 3.1 MeV
Cavity Set Voltage Real Voltage Set Phase Sync Phase
HWR1 120 kV 150 kV 80 -95
HWR2 off off off off
HWR3 430 kV 600 Kv 40 0
HWR4 490 kV 500 kV -170 -35
HWR5 400 kV 500 kV -50 -30
HWR6 660 kV 500 kV 20 0
Beam Dynamics calculations J. Rodnizki
L. Weissman,
DIPAC2009
The highest beam energies for low DC beam:
Protons – 3.7 MeV
Deuterons – 4.3 MeV

28See poster TUP091, J. Rodnizki et al
0 0.5 1 1.5 2 2.5 3 3.5 4 4.5 5500
1000
1500
2000
2500
3000
3500
Energy Gain [keV/degree]
Energ
y V
ariance[k
eV
*keV
]
test
polynomial fitRFQ 237 kW
Long. Emittance
210 π deg keV/u
Example : Deuteron beam
RFQ + 1st cavity
The cavity was set to -90° (bunching mode) and its voltage is varied
Evaluation of longitudinal emittance via measuring energy width of the peak
as a function of the cavity voltage
0 0.5 1 1.5 2 2.5 3 3.5500
1000
1500
2000
2500
3000
3500
4000
4500
5000
5500
Energy Gain [keV/degree]
Energ
y V
ariance[k
eV
*keV
]
RBS
polynomial fitRFQ 249 kW
Long. Emittance
365 π deg keV/u
0 0.5 1 1.5 2 2.5 3 3.5 41000
1500
2000
2500
3000
3500
4000
4500
Energy Gain [keV/degree]
Energ
y V
ariance[k
eV
*keV
]
RBS
polynomial fit
Long. Emittance
260 π deg keV/u
RFQ 227 kW
RFQ Longitudinal emittance measurement

29
CW beam: vacuum/cryogenics effects
LHe inlet valve
Dewar heater
Scaled is
blown up
First attempts to conduct ~ mA CW
strong effects in the PSM vacuum and in the cryogenics
In this example 1 mA beam is conducted through the cryomodule without acceleration and
some optics parameters were varied (RFQ power, MEBT steers).
RFQ power
PSM pressure
~10-8 mbar
~10-10
mbar

30
CW beam (continued)Otimizing RFQ power and MEBT steering to minimize beam-induced effects
Managed to achieve stable operation for CW beam
RFQ power
RFQ vacuum
PSM vacuum
(different scale)
MEBT vacuum
There are still effects
on cryogenics
but operation Is stable
In this example, 1-1.3 mA 1.5 MeV drifted through the cryomodule.
Operation was stable for longer than 6.5 hours and
Operation was repeated during the two consequent days
LHe inlet valve
Dewar heater
PSM LHe pressure
1.5-2%
Plant return pressure
31
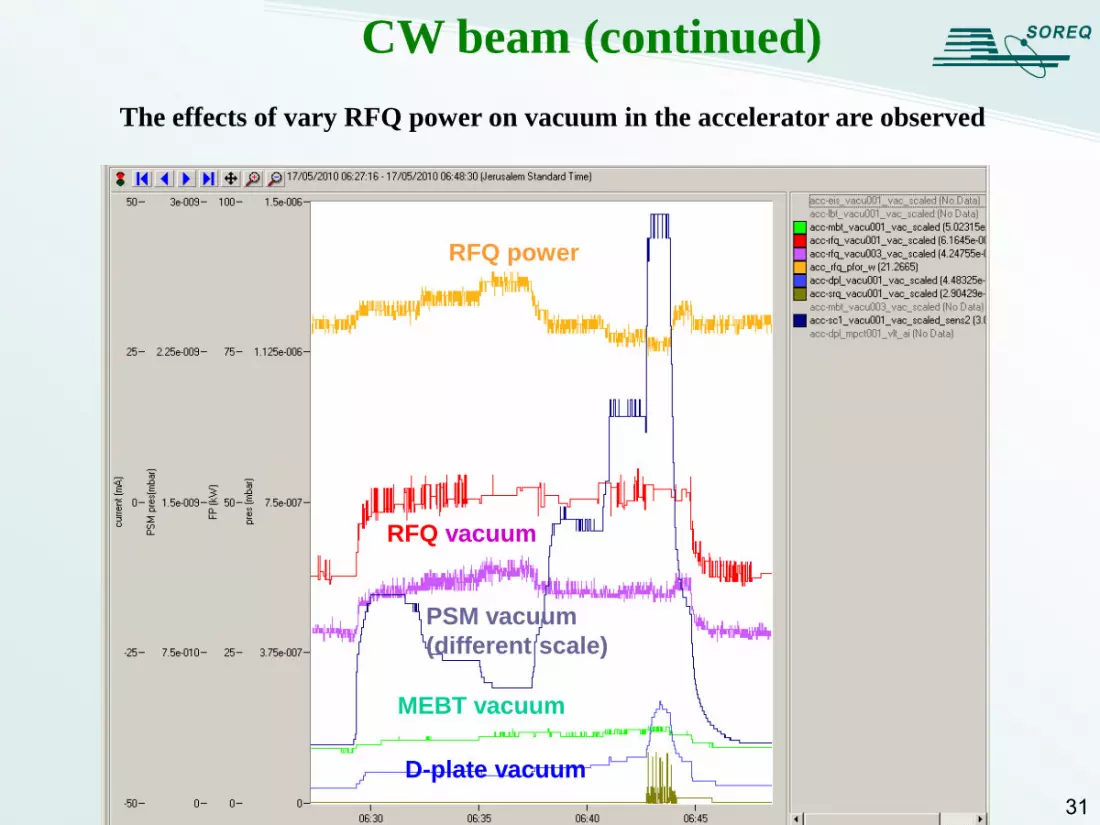
CW beam (continued)
RFQ power
RFQ vacuum
PSM vacuum
(different scale)
MEBT vacuum
D-plate vacuum
The effects of vary RFQ power on vacuum in the accelerator are observed

32
CW beam (continued)
RFQ power
RFQ vacuum
PSM vacuum
(different scale)
MEBT vacuum
1 mA 3 MeV
beam 9.3 h
heaters
ON heaters
OFF
RFQ trip
In this example:
Operation of ~1 mA, ~3 MeV accelerated proton beam.
Operation was stable for more than 9 hours.
Only one RFQ trip. Return to operation within minutes.
Effect on cryogenics is similar to 1.5 MeV beam.
So, probably, the loss of 2-3 mA happens at the entrance of the cryomodule.
Plan to introduce a beam scrapper in MEBT
24 h
LHe inlet valve
Dewar heater
PSM LHe pressure
Plant return pressure
PSM LHe level
Dewar LHe pressure
1.5-2%

33
Phase I Beam Operation Summary
Cavities 1 is used for bunching; cavity 2 is used as a drift
Operation at higher gradients is still limited by instabilities
Beam induced effects
CW (1 mA)
Proton
3.1 MeV
Low DC
Deuteron
4.3 MeV
Low DC
Proton
3.7 MeV
HWR #
Eacc
MV/m
Voltage
[kV]
Eacc
MV/m
Voltage
[kV]
Eacc
MV/m
Voltage
[kV]
11501.929011501
3.75603.959046303
2.74003.35003.75504
3.75503.35003.75505
3.55203.35005.99006
Lacc=βλ
Nominal voltage:
840 kV

Summary and Outlook
First proton and deuteron beams were accelerated by
a HWR based SC Linac
Proton and Deuteron low duty cycle beams were accelerated up to 3.7 MeV and 4.3 MeV
Protons CW ~1 mA beams accelerated up to 3.1 MeV
Phase I is still in its commissioning stage.
1. Actions to improve beam operation :RFQ alignment
MEBT scrapper
Upgrade of tuners control and cavities amplifiers
2. CW Deuteron operation has not been achieved yet
Design of Phase II is underway

35
Temporary beam line
Future
target
stations
Beam dump
Temporary beam line is being
commissioned in the accelerator
tunnel
Pilot project. Several beam lines
will be built for the Phase II
The first experiments in material
science and astrophysics
The first experiments should take
place until the end of the year
PSM
D-plate
VAT beam dump
Test station

36
People involved
SARAF team (including students, advisers and partially affiliated personal ) :
A. Nagler , I. Mardor, D. Berkovits,A. Abramson , A. Arenshtam, Y. Askenazi,
B. Bazak (until 2009), Y. Ben-Aliz, Y. Buzaglo, O. Dudovich, Y.Eisen,
I. Eliyahu, G. Finberg, I. Fishman, I. Gertz, A. Grin, S. Halfon, D. Har-Even,
D. Hirshman, T. Hirsh, A. Kreisel, D. Kijel, G. Lempert, A. Perry,
R. Raizman (until 2010), E. Reinfeld, J. Rodnizki, A. Shor, I. Silverman,
B. Vainas, L. Weissman,Y. Yanay (until 2009).
RI&Varian /(former ACCEL):H. Vogel, Ch. Piel, K, Dunkel, P. Von Stain, M. Pekeler, F. Kremer,
D. Trompetter, many mechanical and electrical engineers and technicians
NTG/ Frankfurt Univ:A. Bechtold, Ph. Fischer, A. Schempp, J. Hauser
Cryoelectra :B. Aminov, N. Pupeter, …
Red font : persons who joined recently


