Embed Size (px)
Citation preview

Strength training improves cycling performance, fractional utilization of 1
VO2max and cycling economy in female cyclists 2
Olav Vikmoen1,a, Stian Ellefsen1,a, Øyvind Trøen1, Ivana Hollan2,a, Marita Hanestadhaugen 3,a, 3
Truls Raastad4, Bent R. Rønnestad1,a 4
1Section of Sports Sciences, Lillehammer University College, Lillehammer, Norway; 5
2Hospital for Rheumatic Diseases, Lillehammer, Norway; 3 Department of Pathology, 6
Innlandet Hospital Trust, Lillehammer, Norway; 4Deparment of Physical Performance, 7
Norwegian School of Sports Sciences, Oslo, Norway; a Member of The Lillehammer 8
Research Center for Medicine and Exercise Physiology 9
Running head: Strength training and cycling performance 10
11
REF: Scand J Med Sci Sports 2015 April 18. Doi: 10.1111/sms.12468 [Epub ahead of print] 12
Corresponding author: Olav Vikmoen; Lillehammer University College, PO Box 952 13
N-2604 Lillehammer, Norway. Email: [email protected] Tel: +47 61288315, Fax: +47 14
61288200 15
16

Abstract 17
The purpose of this study was to investigate the effect of adding heavy strength training to 18
well-trained female cyclists’ normal endurance training on cycling performance. Nineteen 19
female cyclists were randomly assigned to 11 weeks of either normal endurance training 20
combined with heavy strength training (E+S, n=11) or to normal endurance training only (E, 21
n=8). E+S increased one repetition maximum in one-legged leg press and quadriceps muscle 22
CSA more than E (p < 0.05), and improved mean power output in a 40-min all-out trial, 23
fractional utilization of VO2max and cycling economy (p < 0.05). The proportion of type IIAX-24
IIX muscle fibers in m. vastus lateralis was reduced in E+S with a concomitant increase in 25
type IIA fibers (p < 0.05). No changes occurred in E. The individual changes in performance 26
during the 40-min all-out trial was correlated with both change in IIAX-IIX fiber proportion (r 27
= -0.63) and change in muscle CSA (r = 0.73). In conclusion, adding heavy strength training 28
improved cycling performance, increased fractional utilization of VO2max and improved 29
cycling economy. The main mechanisms behind these improvements seemed to be increased 30
quadriceps muscle CSA and fiber type shifts from type IIAX-IIX towards type IIA. 31
Key words 32
Concurrent training, cycling performance, work economy, muscle fiber type composition, 33
aerobic power 34
Introduction 35
During the last decades, improved cycling performance after adding strength training to 36
endurance training has been observed in several studies (Hickson et al., 1988; Ronnestad et 37
al., 2010; Sunde et al., 2010; Aagaard et al., 2011; Ronnestad et al., 2011; Ronnestad et al., 38
2014). However, other studies do not report beneficial effects (Bishop et al., 1999; Bastiaans 39

et al., 2001; Levin et al., 2009). Differences in methodology and specific training paradigms 40
probably explain these conflicting results. To improve cycling performance it seems vital that 41
the strength training is performed with sufficiently high loads, typically between 10 to 4 42
repetition maximum (RM), and that the training volume is sufficiently high and performed for 43
8 weeks or longer. (Aagaard & Andersen, 2010; Ronnestad & Mujika, 2014). The 44
mechanisms behind the observed improvements in cycling performance are still somewhat 45
unclear. Since endurance performance is mainly determined by the amount of oxygen that can 46
be consumed during a given event (the performance VO2) and the movement economy 47
(Bassett & Howley, 2000), it seems reasonable to assume that strength training improves one 48
or both of these factors. 49
Improved cycling economy has been observed after the addition of heavy strength training in 50
trained male cyclists and master athletes (Sunde et al., 2010; Barrett-O'Keefe et al., 2012; 51
Louis et al., 2012). The precise mechanism behind this improvement remains uncertain. An 52
increase in the proportion of type IIA at the expense of type IIX muscle fibers has been 53
reported in elite cyclists after 16 weeks of heavy strength training (Aagaard et al., 2011), and 54
in untrained subjects after periods of heavy strength training (Staron et al., 1994; Kraemer et 55
al., 1995; Andersen & Aagaard 2000). Because type IIA fibers are more economical and less 56
fatigable than type IIX fibers (Westerblad et al., 2010), this change in muscle fiber 57
distribution may contribute to improved cycling economy and performance after heavy 58
strength training (Aagaard & Andersen, 2010; Ronnestad & Mujika, 2014). However, 59
improved cycling economy cannot be the sole mechanism behind the ergogenic effects as 60
numerous studies report improved performance without changes in cycling economy 61
(Ronnestad et al., 2010; Aagaard et al., 2011; Ronnestad et al., 2014). 62
The performance VO2 is determined by the maximal oxygen consumption (VO2max) and the 63
percent of VO2max an athlete can sustain for the duration of the race (the fractional utilization 64

of VO2max). Addition of strength training has neither a positive nor a negative effect on 65
VO2max (e.g. Hickson et al., 1988; Bishop et al., 1999; Aagaard et al., 2011). To our 66
knowledge, no study has directly examined the effects of adding heavy strength training to 67
normal endurance training on performance VO2 or fractional utilization of VO2max. 68
Fractional utilization of VO2max is mainly determined by the amount of aerobic enzymes or 69
mitochondria in the active muscles that contribute to a certain power output (Holloszy & 70
Coyle, 1984; Coyle 1995). Theoretically, the fractional utilization of VO2max can therefore be 71
improved by increasing the content and activity of the aerobic enzymes in the active muscles 72
or increasing the amount of engaged/activated muscles at a certain power output (with no 73
change in the content and activity of the aerobic enzymes). Since strength training can 74
increase muscle mass and muscle cross sectional area (CSA), this can theoretically increase 75
the amount of mitochondria sharing the power output and therefore improve fractional 76
utilization of VO2max. 77
Most previous research on the effects of strength training on cycling performance has focused 78
on male cyclists. In fact, to our knowledge, only one study has investigated the effects of 79
adding heavy strength training to normal endurance training on cycling performance in female 80
cyclists, and this study reported no effect on mean power output during a 60-min all-out 81
cycling trial (Bishop et al., 1999). However, the strength training in that study included only 82
one exercise that resulted in a low training volume, which might explain its lack of effect on 83
performance. Therefore, it remains unknown whether or not addition of a larger volume of 84
strength training to usual endurance training has an effect on cycling performance in female 85
cyclists. 86
The main purpose of this study was to investigate the effects of 11 weeks of heavy strength 87
training on 40-min all-out performance in trained female cyclists. We also wanted to 88

investigate the effects on important determinants of cycling performance with a special focus 89
on fractional utilization of VO2max and cycling economy. To elucidate mechanisms behind any 90
changes in performance and performance determinants we measured changes in muscle 91
strength, muscle CSA, fiber type composition and content and expression of aerobic enzymes. 92
Materials and methods 93
Ethical approval 94
The study was approved by the Local Ethics Committee at Lillehammer University College. 95
Written informed consent was obtained from all participants prior to inclusion, and the study 96
was carried out in accordance with the Declaration of Helsinki. 97
Participants 98
Twenty-eight female cyclists that fulfilled at least two of Jeunkedrup et al.’s (2000) training 99
and race status descriptions of a well-trained cyclist were recruited to this study. Inclusion 100
criteria were that the cyclist had trained on average 4 sessions or more per week with 101
endurance training, and had not performed any systematic strength training for the last 12 102
months leading up to the study. The cyclists were matched for VO2max, then randomly 103
assigned to either adding heavy strength training to the ongoing endurance training (E+S, 104
n=14) or endurance training only (E, n=14). During the study, three cyclists in E+S left the 105
project, all for reasons unrelated to the project protocol: one because of medial tibial stress 106
syndrome, one because of a prolonged period off illness during the last part of the 107
intervention and one because of other medical reasons. In E, six cyclists left the study for 108
reasons unrelated to the project protocol (injuries from bicycle crash, pregnancy and lack of 109
time). Therefore, the final numbers of cyclists in E+S and E were 11 and 8 respectively (table 110
1). A questionnaire regarding the menstrual cycle and use of oral contraceptives was filled out 111

by 9 cyclist in E+S and 7 in E. Six of these 9 cyclist in E+S used oral contraceptives and the 112
corresponding numbers in E were 4 out of 7. 113
Insert table 1 around here 114
Experimental overview 115
The strength training program for the E+S group lasted for 11 weeks (during the competition 116
period from April to July) and consisted of two strength training sessions per week. Testing 117
before and after the intervention period was performed over four test-days. During pre-tests, 118
muscle biopsies were sampled from m. vastus lateralis at day 1, while at day 2 CSA of the 119
thigh muscles was measured by magnetic resonance imaging (MRI). Day 3 consisted of an 120
incremental cycle tests for determination of blood lactate profile followed by a VO2max test 121
and a test of 1RM in one-legged leg-press. Day 4 consisted of a Wingate test and a 40-min all-122
out test. There were 3-7 days between test days. At post the only difference in test order was 123
that muscle biopsies were taken on the last test day. 124
Training 125
Duration and intensity of endurance training was calculated based on heart rate (HR) 126
recordings. Endurance training was divided into three HR zones: 1) 60%-82%, 2) 83%-87%, 127
and 3) 88%-100% of maximal HR. There were no significant differences between groups in 128
the average weekly duration of the endurance training and the distribution of this training 129
within the three intensity zones (table 2). Also, no significant difference was found between 130
E+S and E in total weekly training duration including endurance training, competitions, 131
strength training, core stability training and other alternative training forms (E+S: 7.0 ± 1.4h, 132
E: 6.8 ± 2.5h, p = 0.87). 133

The heavy strength training performed by E+S targeted leg muscles and was performed twice 134
per week during the 11-week intervention period. Adherence to strength training was high, 135
with E+S cyclists completing 21.4 ± 1.0 (range 19-22) of the planned 22 strength-training 136
sessions. The strength training regimen was designed to improve cycling performance by 137
using cycling-specific exercises. Thus, strength-training exercises were performed using a 138
range of motion from 90° knee flexion to almost full extension. In addition, since cyclists 139
work each leg alternately during cycling, one-legged exercises were chosen in two of the four 140
exercises. The performed exercises were as follows: half squat in a smith machine, one-legged 141
leg press, standing one-legged hip flexion, and ankle plantar flexion. The cyclist were 142
instructed to perform the strength training with maximal acceleration and speed during the 143
concentric phase (duration around 1-s), while the eccentric and non-cycling specific phase 144
was performed more slowly (duration 2-3-s). At the start of each strength training session, 145
cyclists performed a 5-10-min warm-up at self-selected intensity on a cycle ergometer, 146
followed by 2-3 warm-up sets of half squats with gradually increasing load. For the first two 147
weeks of the intervention, investigators supervised all training sessions. Thereafter, the 148
follow-up frequency was kept at minimum once per week for the remainder of the 149
intervention. During weeks one to three, cyclists trained with 10RM sets during the first 150
session and 6RM sets during the second session. These alternating loads were adjusted to 151
8RM and 5RM during weeks four to six, and were further adjusted to 6RM and 4RM during 152
weeks seven to eleven. The numbers of repetitions was always the same as the prescribed RM 153
load meaning that the sets were performed until failure. The cyclists were allowed assistance 154
on the last repetition if necessary. The cyclists adjusted the absolute load as they got stronger 155
to correspond to the prescribed RM load. The number of sets in each exercise was always 156
three. 157
Insert table 2 around here 158

Strength and cycling performance tests 159
The cyclists were instructed to refrain from intense exercise the day preceding testing, to 160
prepare for the test as they would have done for a competition, and to consume the same type 161
of meal before each test. All cycling tests were performed on the same electromagnetically 162
braked cycle ergometer (Lode Excalibur Sport, Lode B. V., Groningen, The Netherlands), 163
which was adjusted according to each cyclist preference for seat height, horizontal distance 164
between tip of seat and bottom bracket, and handlebar position. Cyclists were allowed to 165
choose their preferred cadence during all cycling tests and they used their own shoes and 166
pedals. All cycling tests were performed in similar environmental conditions (18-20˚C), and 167
the cyclists were cooled with a fan during all cycling tests. 168
Blood lactate profile 169
The test was not preceded by a warm-up, and started with 5-min cycling at 50 W, which was 170
subsequently increased every 5-min. The first increase was 50 W, thereafter power output was 171
increased by 25W every 5 min. Blood was sampled from a finger-tip at the end of each 5-min 172
bout and analyzed for whole blood [la-] using a Lactate Pro LT-1710 analyzer (Arcray Inc., 173
Kyoto, Japan). At the same time, rate of perceived exertion (RPE) was recorded. The test was 174
terminated when a [la-] of 4 mmol∙L-1 or higher was measured. VO2 was measured during the 175
last 3-min of each bout, and mean values were used for statistical analysis. VO2 was measured 176
(30-s sampling time) using a computerized metabolic system with mixing chamber (Oxycon 177
Pro, Erich Jaeger, Hoechberg, Germany). The gas analyzer were calibrated with certified 178
calibration gases of known concentrations before every test. The flow turbine (Triple V, Erich 179
Jaeger, Hoechberg, Germany) was calibrated before every test with a 3 l, 5530 series, 180
calibration syringe (Hans Rudolph, Kansas City, USA). From this continuous incremental 181
cycling test, the power output at 3.5 mmol∙L-1 [la-] was calculated for each cyclist from the 182

relationship between [la-] and power output using linear regression between data points. Work 183
economy was determined by the average VO2 at a power output of 150 W. 184
VO2max and Wmax 185
After termination of the blood lactate profile test, the cyclists cycled for 10-min at a 186
submaximal power output (between 75 and 100 W) before completing another incremental 187
cycling test for determination of VO2max. This test has been described elsewhere (Ronnestad 188
et al., 2010). Briefly, the test was initiated with 1-min of cycling at a power output of 100 W, 189
which was subsequently increased by 25 W every minute until exhaustion. VO2max was 190
calculated as the average of the two highest 30-s VO2 measurements. Wmax was calculated as 191
the mean power output during the last 2-min of the incremental test. After the test blood [la-] 192
and HRpeak was noted. HR was measured using a Polar S610i heart rate monitor (Polar, 193
Kempele, Finland). 194
1RM tests 195
Approximately 20-min after termination of the VO2max test, maximal strength in the legs was 196
tested as 1RM in one-legged leg press. Prior to the testing day, each cyclist was given a 197
supervised familiarization session to learn proper lifting technique and find individual 198
equipment settings. During this session, the load was gradually increased to allow estimation 199
of a proper starting point for the 1RM testing. 200
The 1RM test started with a specific warm-up, consisting of 3 sets with gradually increasing 201
load (40, 75 and 85% of expected 1RM) and decreasing number of repetitions (10→6→3). 202
The first attempt was performed with a load approximately 5% below the expected 1RM. If a 203
lift was successful, the load was increased by approximately 5%. The test was terminated 204
when the cyclists failed to lift the load in 2-3 attempts and the highest successful load lifted 205
was noted as 1RM. Cyclists were given three minutes of rest between lifts. 206

Wingate test 207
The Wingate test was performed after a 10-min warm-up at a submaximal load on the Lode 208
cycle ergometer (75-100 W), including three submaximal sprints during the last 2-min. The 209
30-s all-out test started while pedaling at 60 rpm without braking resistance. Then, following 210
a 3-s countdown, the braking resistance was applied to the flywheel and remained constant 211
throughout the 30-s all-out test. Braking resistance was set to 0.67 Nm·kg-1 body mass. Peak 212
and average power output during the 30-s was recorded. Cyclists remained seated throughout 213
the test, and strong verbal encouragement was provided throughout. Cyclists were instructed 214
to pedal as fast as possible from the start and not to conserve energy for the last part of the 215
test. 216
40-min all-out trial 217
After the Wingate test the cyclists cycled at a submaximal power output (between 75-100 W) 218
for 10-min before the start of the 40-min all-out trial. During the first 5-min of the test, the 219
power output was set by the investigators. This individual selected power output was based on 220
the lactate profile test and corresponded to the power output at 2.5 mmol∙L-1 [la-]. Thereafter 221
the control unit controlling the power output was given to the cyclists, which were allowed to 222
adjust the power output themselves, with instructions to cycle at as high average power output 223
as possible. During this test, the ergometer was in a cadence-independent mode (constant-224
Watt production), so that the power output was not affected by the cadence. 225
To estimate performance VO2 and the fractional utilization of VO2max, measurements of VO2 226
were made during the last minute of every 5-min section of the test. During this minute the 227
cyclists were not allowed to adjust the power output. The average VO2 during this minute was 228
estimated to reflect VO2 during the corresponding 5-min section. VO2 was measured 229
continuously during the last 5-min of the test, as pilot testing showed that cyclists performed 230

numerous power output adjustments during this part of the test. The mouthpiece used to 231
measure VO2 was inserted into the mouth 30-s before the start of every measurement by the 232
cyclist themselves. This process took 1-3-s and was practiced by the cyclist during the warm 233
up and at previous tests. Performance VO2 was calculated as the average VO2 of all 5-min 234
sections, and fractional utilization of VO2max was calculated as performance VO2 in 235
percentage of VO2max. The cyclists were allowed to occasionally stand in the pedals during 236
the trial and to drink water ad libitum. 237
CSA of m. quadriceps femoris 238
MRI was used to measure quadriceps muscle CSA. The cyclists lied on their back inside the 239
MRI-machine (S-Scan, Esaote, Genova, Italy) and a coil was placed around the distal part of 240
the upper thigh. Care was taken to assure similar positioning of the coil at pre and post. Twenty-241
three cross-sectional images were sampled starting at the proximal edge of the patella and 242
moving up the thigh with 10 mm between the images. Images were analyzed using the software 243
OsiriX version 5.6 (Pixmeo, Geneva, Switzerland). Since the strength-training program mainly 244
targeted the extensor muscles, m. quadriceps femoris were chosen for analyses. The 3-5 most 245
proximal images (at the edge of the coil) had a low resolution and could not be used for analyses. 246
Therefore, the CSA of the quadriceps muscles was measured using the four most proximal 247
images with good resolution and the average CSA of all four images was used for statistical 248
analysis. For each cyclist, pre and post CSA was always calculated from the same images. The 249
technician performing the MRI scan and the investigator performing image analyses were 250
blinded for which group the cyclists belonged to. The cyclists were instructed to refrain from 251
physical activity for the 48h leading up to the MRI scan and were instructed to refrain from 252
ingesting any food or drinks for the last 2h. 253
Muscle biopsy sampling 254
Muscle biopsies were sampled from m. vastus lateralis using the Bergström procedure 255
(Ellefsen et al., 2014b). Cyclists were instructed to refrain from physical activity during the 256
last 24h before biopsy sampling. During each biopsy sampling-event, two separate muscle 257
biopsies were retrieved and pooled in a petri dish filled with sterile physiological saline. An 258
appropriately sized muscle sample was immediately excised and selected for quantitative real-259
time PCR (qRT-PCR) analyses (average wet weight ± SD: 38 ± 7 mg), whereupon a similarly 260
sized sample was selected for immunohistochemical analyses (average wet weight ± SD: 34 ± 261
13 mg). A sample of about 50 mg (average wet weight ± SD: 51 ± 5 mg) was selected for 262
homogenization/fractionation and later Western Blotting. Pre- and post-biopsies were 263
sampled at the same time of day for each particular cyclist. Biopsies for 264
immunohistochemical analyses were immediately immersed in 10% buffered formaldehyde 265
solution (Chemi-teknik AS), wherein they were left to fixate for 3-4 days before further 266
preparation. Biopsies for Western Blotting analyses were snap-frozen in isopentane, cooled 267
with dry ice, before storage at -80° C until extraction. Biopsies for qRT-PCR analyses were 268
immediately immersed in RNAlater® (Ambion) and were treated according to 269
manufacturer’s protocol before storage at -80° C until RNA extraction. 270
Muscle biopsy analyses 271
Immunohistochemistry 272
273
Formalin-fixed muscle biopsies were processed using an Shandon Excelsior ES (Thermo 274
Scientific, Hanover Park, IL USA), before it was paraffin-embedded and sectioned, 275
whereupon transverse, serial sections were immuno-labelled for myosin heavy chain I 276
(MyHC1) (A4.840), MyHCIIA (EPR5280) and MyHCIIX (6H1), as previously described 277
(Ellefsen et al., 2014b). The detections system used for determination of muscle fiber types 278
was EnVisionTM Flex+ (Dako, Glostrup, Denmark) by using the immunostainer, Autostainer 279

Link 48 (Dako, Glostrup, Denmark). Determination of muscle fiber composition was based on 280
analysis of a minimum of 200 fibers, performed using Photoshop CS6 Extended (Adobe, San 281
Jose, CA, USA). The investigator performing image analyses were blinded for which group 282
the cyclists belonged. Because of technical problems with some analyses the number of 283
cyclists in the immunohistochemistry data is 8 in E+S and 8 in E. 284
For fibers that labeled for the IIX antibody, a particular issue became evident during analyses. 285
All these fibers were found to co-label for the IIA-antibody, but not vice versa. This means 286
one of two things: i) either all IIX-positive fibers are IIAX hybrids or ii) the IIA-antibody 287
recognizes the IIX antigen in addition to recognizing the IIA antigen. In this study we have 288
chosen to refer to all these fibers type as IIAX-IIX fibers. 289
Gene expression 290
Changes in gene expression was measured for proteins involved in aerobic energy 291
metabolism. All genes included in the array with associated primers are listed in supporting 292
information. All results from gene expression are available as supporting information 293
Primers design, RNA extraction, evaluation of expression stability of reference genes and 294
qPCR was performed as previously described (Ellefsen et al., 2014a; Ellefsen et al., 2014b). 295
2-microglobulin and ribosomal protein L32 was evaluated to be the two most stable 296
references genes and used for calculation of normalisation factors by GeNorm, which were 297
then utilized for calculation of target gene expression. 298
Protein immunoblot 299
For Western Blotting analyses, ~50 mg of muscle tissue was homogenised and fractionated 300
into cytosol, membrane, nuclear and cytoskeletal fractions using ProteoExtract Subcellular 301
Proteo Extraction Kit (Cat. no. 539790, Calbiochem; EMD Biosciences GmbH, Schwalbach, 302
Germany), performed according to the manufacturer’s protocol. Protein concentrations were 303
assessed with a commercial kit (BioRad DC protein micro plate assay, nos 0113, 0114, 0115; 304
Bio-Rad Laboratories, Inc., Hercules, CA, USA), a filter photometer (Expert 96; ASYS 305
Hitech Cambridge, UK), and the provided software (Kim Version 5.45.0.1; Daniel Kittrich). 306
Membrane fractions (including the mitochondrial components) were analyzed by the Western 307
Blotting technique. Equal amounts of protein from pre and post biopsies (7–12 μg) were 308
loaded into wells and separated on 4–12% SDS-PAGE gels for 35–45 min at 200 volts in cold 309
MES running buffer (NuPAGE MES SDS running buffer; Invitrogen, Inc., Carlsbad, CA, 310
USA) under denaturing conditions. Thereafter, proteins were blotted onto a PDVF-membrane 311
(Immuno-blot, cat. no. 162-0177; Bio-Rad Laboratories, Inc.), at 30 volts for 90 min in cold 312
transfer buffer (NuPAGE transfer buffer, cat. no. NP0006-1; Life Technologies, Inc.). 313
Membranes were blocked at room temperature for 2 h in a 5% fat-free skimmed milk and 314
0.05% TBS-T solution [TBS, cat. no. 170–6435 (Bio-Rad Laboratories, Inc.); Tween 20, cat. 315
no. 437082Q (VWR International, Radnor, PA, USA); skimmed milk, cat. no. 1.15363 316
(Merck KGaA,Darmstadt, Germany)]. Blocked membranes were incubated with antibodies 317
against Citrate Synthase (CS, rabbit anti-Citrate Synthase, cat. no. Ab96699, diluted 1:1000; 318
Abcam Plc, Cambridge, UK), Hydroxyacyl-CoA dehydrogenase (HADH, rabbit anti-HADH 319
cat. no. Ab15088, diluted 1:8000 Abcam Plc, Cambridge, UK) and Cytochrome c oxidase 320
subunit IV (COX 4, mouse anti-COX4, cat. no. Ab14744, diluted 1:1000; Abcam Plc, 321
Cambridge, UK) overnight at 4°C, followed by incubation with secondary antibody (COX4: 322
goat anti-mouse, cat. no. 31430, diluted 1:30000; Thermo Fisher Scientific, Inc., Hanover 323
Park, IL, USA, CS and HADH: Anti rabbit cat. No. 70745 diluted 1:3000 Cell signaling 324
Technology, Inc Danvers, MA. USA) at room temperature for 1 h. All antibodies were diluted 325
in a 1% fat-free skimmed milk and 0.05% TBS-T solution. Between stages, membranes were 326
washed in 0.05% TBS-T solution. Bands were visualised using an HRP-detection system 327

(Super SignalWest Dura Extended Duration Substrate, cat. no. 34076; Thermo Fisher 328
Scientific, Inc.,Waltham, MA, USA). Chemiluminescence was measured using a CCD image 329
sensor (Image Station 2000R or Image Station 4000R; Eastman Kodak, Inc., Rochester, NY, 330
USA), and band intensities were calculated with Carestream molecular imaging software 331
(Carestream Health, Inc., Rochester, NY, USA). All samples were run as duplicates and mean 332
values were used for statistical analyses 333
Statistical analyses 334
All data in text, figures and tables are presented as mean ± standard deviation, unless 335
otherwise stated. Prior to statistical testing, gene expression of aerobic enzymes data and 336
protein data were log2-transformed. This was done to maximize the likelihood of normal 337
distribution. For data on muscle fiber composition, square-root arcsine-transformation was 338
performed, representing the recommended transformation for proportional (Sokal & Rohlf 339
2012). 340
To test for differences between groups at pre, post as well as differences in changes from pre 341
to post, unpaired students t-test were used. Within-group analyses were performed using 342
paired t-tests. Effect sizes (ES) were calculated for key performance and physiological 343
adaptations to elucidate on the practical significance of strength training. ES were calculated 344
as Cohen’s d and the criteria interpret the magnitude were the following: 0-0.2 = trivial, 0.2-345
0.6 = small, 0.6-1.2 = moderate, 1.2-2.0 = large and ˃ 2 = very large (Hopkins et al., 2009). 346
Correlation analyses were done using the Pearson product-moment method. 347
Analyses was performed in Excel 2013 (Microsoft Corporation, Redmon, WA, USA) and in 348
GraphPad Prism 6 (GraphPad Software Inc., California, USA). All analyses resulting in p ≤ 349
0.05 were considered statistically significant. P-values ≤ 0.10 were considered as tendencies. 350

Results 351
There were no significant differences between E+S and E in any of the measured variables at 352
baseline. 353
Body mass, maximal strength and muscle CSA 354
Body mass remained unchanged in E+S (from 62.4 ± 5.2 kg to 63.1 ± 5.6 kg) but was slightly 355
reduced in E (from 65.6 ± 8.4 kg to 64.8 ± 8.0 kg, p = 0.03). The change in body mass was 356
different between the groups (p = 0.01). 357
E+S increased 1RM in one-legged leg press with 38.6 ± 19.0% (p = 0.0005) while no 358
statistically significant changes occurred in E (5.6 ± 9.0%, p = 0.15, figure 1). The change in 359
1RM was larger in E+S than in E (p = 0.004), with a large practical effect of E+S compared 360
to E (ES = 2.20). 361
The CSA of m. quadriceps femoris increased in E+S with 7.4 ± 5.3% (p = 0.0004, figure 1) 362
while no change occurred in E (0.6 ± 3.5 %, p = 0. 98). The change in CSA was larger in E+S 363
than in E (p = 0.006) with a large practical effect of E+S compared to E (ES = 1.57). 364
Because of the change in body mass in E, VO2 and power output measurements are presented 365
as body mass adjusted values. 366
Insert figure 1 around here 367
Muscle fiber type composition 368
Fiber type composition determined by immunohistochemistry is displayed in figure 2. 369
Proportions of fibers positive for both IIA and IIX MyHC were reduced from 9 ± 7% to 0% in 370
E+S (p = 0.005) with a concomitant increase in fibers positive for type IIA only (39 ± 13% to 371
51 ± 10%, p = 0.002). No changes in fiber type composition was observed in E. 372

Insert figure 2 around here 373
Aerobic enzymes 374
The protein content of CS, COX and HADH per 50 mg of muscle did not change significantly 375
in any of the groups during the intervention period (figure 3). 376
Insert figure 3 around here 377
VO2max, Wmax and Wingate test 378
VO2max and Wmax were unchanged in both groups during the intervention period (VO2max: 379
E+S -1.1 ± 2.6% and E -1.0 ± 2.4%, Wmax: E+S 3.9 ± 6.7% and E 5.7 ± 10.3%, table 3). Peak 380
power in the 30-s Wingate test increased in E+S by 12.7 ± 12.6% (p = 0.004) with no 381
statistically significant change in E (6.2 ± 14.2%, p = 0.27, table 3). There was however no 382
significant difference in the change between groups, but the effect size analysis revealed a 383
small practical effect of E+S compared to E (ES = 0.49). E+S also increased mean power 384
output during the Wingate test by 3.4 ± 4.3% (p = 0.02) while there were no change in E (-0.2 385
± 3.4%, p = 0.85, table 3). There was a tendency to a larger increase in E+S (p = 0.07), with a 386
moderate practical effect of E+S compared to E (ES = 0.83). The rate of fatigue (percent 387
power decline) during the 30-s all-out test did not change in E+S (Pre: 82.7 ± 11.8%, Post: 388
82.6 ± 8.4%) or in E (Pre: 81.6 ± 8.1%, Post: 78.6 ± 8.3%). 389
Insert table 3 around here 390
Power output at 3.5 mmol∙L-1 [la-1] and cycling economy 391
Power output at 3.5 mmol∙L-1 [la-] tended to increase by 7.6 ± 12.0% (p = 0.06) in E+S with 392
no significant change in E (4.1 ± 8.4%, p = 0.23, figure 4). There were no difference in 393
change between the groups and the practical effect was small (ES = 0.34). 394

During the blood lactate profile test, E+S decreased the VO2 at a power output of 150 W 395
(corresponding to 93 ± 13 % of the power at 3.5 mmol∙L-1 [la-] at pre) by 3.5 ± 3.1% (p = 396
0.004) while there were no change in E (0.7 ± 4.8%, p= 0.85, figure 4). The change in VO2 397
was larger in E+S than in E (p = 0.022) and the ES analysis revealed a moderate practical 398
effect (ES = 1.0). The VO2 at 150 W for E+S corresponded to 71 ± 5% of and 70 ± 5 % 399
VO2max at pre and post respectively, and the corresponding numbers for E was 66 ± 7 and 68 400
± 8%. There were no changes from pre to post, and no difference between groups. The 401
change in VO2 at 150 W showed a significant negative correlation with the change in CSA of 402
the quadriceps muscles (r = -0.54, p = 0.02, figure 5) meaning an increased CSA of the 403
quadriceps muscles was associated with improved cycling economy. 404
Insert figure 4 around here 405
40-min all-out test 406
The mean power output during the 40-min all-out trial increased by 6.4 ± 7.9% in E+S (p = 407
0.002), with no change in E (2.0 ± 6.1%, p = 0.44, figure 4). There was no difference between 408
groups, but there was a moderate practical effect of E+S compared to E (ES = 0.63). There 409
were significant correlations between the change in mean power output during the 40-min all-410
out test and change in the proportion of IIAX-IIX fibers (r = -0.63, p = 0.009) and change in 411
CSA (r = 0.73 p < 0.0004, figure 5), respectively. The change in 40-min all-out performance 412
also correlated with change in power output at 3.5 mmol∙L-1 [la-] (r = 0.63, p = 0.004) and 413
change in cycling economy (r = -0.47, p = 0.04), but not with change in VO2max (r = 0.234, p 414
= 0.33). 415
The performance VO2 during the 40-min all-out trial tended to increase by 2.3 ± 4.2% in E+S 416
(p = 0.08), with no change in E (-0.6 ± 4.2%, figure 6). The change in Performance VO2 417
showed a significant correlation with the change in mean power output during the 40-min all-418
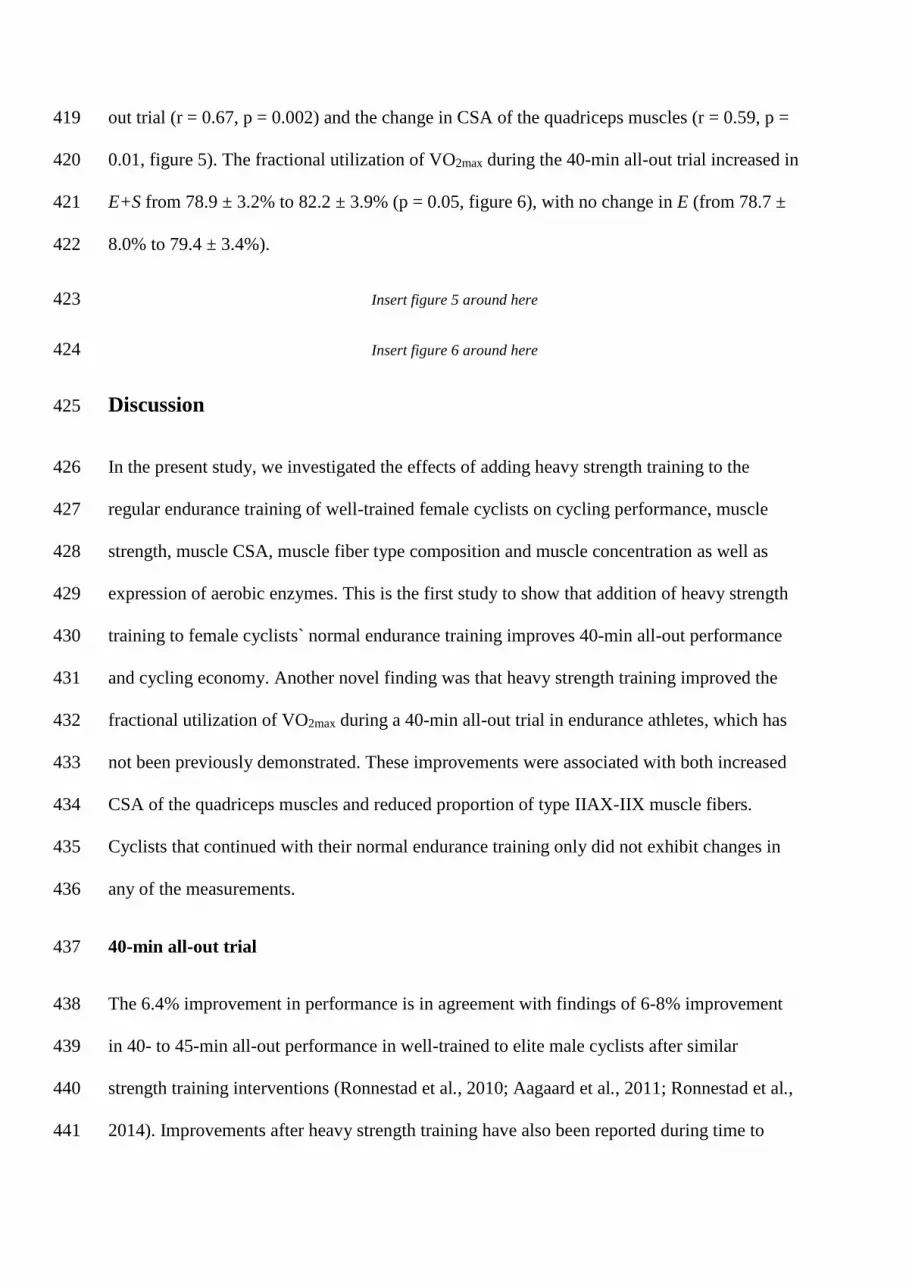
out trial (r = 0.67, p = 0.002) and the change in CSA of the quadriceps muscles (r = 0.59, p = 419
0.01, figure 5). The fractional utilization of VO2max during the 40-min all-out trial increased in 420
E+S from 78.9 ± 3.2% to 82.2 ± 3.9% (p = 0.05, figure 6), with no change in E (from 78.7 ± 421
8.0% to 79.4 ± 3.4%). 422
Insert figure 5 around here 423
Insert figure 6 around here 424
Discussion 425
In the present study, we investigated the effects of adding heavy strength training to the 426
regular endurance training of well-trained female cyclists on cycling performance, muscle 427
strength, muscle CSA, muscle fiber type composition and muscle concentration as well as 428
expression of aerobic enzymes. This is the first study to show that addition of heavy strength 429
training to female cyclists` normal endurance training improves 40-min all-out performance 430
and cycling economy. Another novel finding was that heavy strength training improved the 431
fractional utilization of VO2max during a 40-min all-out trial in endurance athletes, which has 432
not been previously demonstrated. These improvements were associated with both increased 433
CSA of the quadriceps muscles and reduced proportion of type IIAX-IIX muscle fibers. 434
Cyclists that continued with their normal endurance training only did not exhibit changes in 435
any of the measurements. 436
40-min all-out trial 437
The 6.4% improvement in performance is in agreement with findings of 6-8% improvement 438
in 40- to 45-min all-out performance in well-trained to elite male cyclists after similar 439
strength training interventions (Ronnestad et al., 2010; Aagaard et al., 2011; Ronnestad et al., 440
2014). Improvements after heavy strength training have also been reported during time to 441

exhaustion tests at 80 to 100% of VO2max in trained male cyclists (Hickson et al., 1988; Sunde 442
et al., 2010). However, there are also studies reporting no effect on cycling performance after 443
the addition of heavy strength training (Bishop et al., 1999; Bastiaans et al., 2001; Levin et al., 444
2009). In fact, in the only previous study involving female cyclists, 12 weeks of heavy 445
strength training had no effect on power output during a 60-min cycling test (Bishop et al., 446
1999). However, the low strength training volume used in that study (only one exercise was 447
performed) may explain the lack of improved cycling performance. 448
Long-term cycling performance is mainly determined by the performance VO2 and the 449
cycling economy (Coyle 1995; Bassett & Howley, 2000). Therefore, the improved 450
performance observed in the current study should be accompanied by an improvement in one 451
or both of these factors. 452
Performance VO2 453
The tendency to increased performance VO2 in E+S probably contributed to the improved 454
performance in the 40-min all-out trial as indicated by the relationship between change in 455
performance VO2 and change in 40-min all-out performance (r = 0.67). Because performance 456
VO2 depends on VO2max and fractional utilization of VO2max (Coyle 1995; Bassett & Howley, 457
2000), and because VO2max did not increase in E+S, the tendency to improved performance 458
VO2 and the concomitantly improved 40-min all-out performance was likely due to the 459
improved fractional utilization of VO2max. 460
To our best knowledge, this is the first study to investigate effects of concurrent training on 461
fractional utilization of VO2max and performance VO2 in endurance athletes. However, a few 462
studies have measured effects of concurrent training on VO2 at the lactate threshold in percent 463
of VO2max, an indirect measure of fractional utilization of VO2max, none of which has reported 464
an ergogenic effect in cycling (Sunde et al., 2010; Ronnestad et al., 2014). The reason for the 465

different results in the current study compared to previous studies are unclear but one obvious 466
reason is the different methods used to estimate fractional utilization of VO2max. In fact, when 467
estimating changes in VO2 at the power output corresponding to 3.5 mmol∙L-1 [la-] in percent 468
of VO2max in the current data set, both groups showed a similar increase of about 3 percentage 469
points (results not shown). 470
Even though not measured directly, data from a study by Aagaard et al. (2011) indicates that 471
improvements in fractional utilization of VO2max occurred after heavy strength training. They 472
found concurrent training to increase mean power output during a 45-min all-out trial without 473
changes in cycling economy and VO2max, suggesting improvement of fractional utilization of 474
VO2max and thus performance VO2. In fact, the authors estimated that the power output during 475
the test had increased from 76% to 83% of the power output at VO2max. 476
The mechanisms behind the increased fractional utilization of VO2max and hence the tendency 477
for improved performance VO2 is unclear but, may relate to the increased CSA in the 478
quadriceps muscles. This is supported by the observed relationship between changes in CSA 479
and performance VO2 (r = 0.59). It has been reported that cyclists that uses a larger amount of 480
their muscle mass have larger fractional utilization of VO2max (Coyle 1995). The reason for 481
this is probably that a larger amount of mitochondria is activated and the fractional utilization 482
of VO2max is mainly determined by the amount of aerobic enzymes and mitochondria sharing 483
a certain amount of VO2 (Holloszy & Coyle, 1984; Coyle 1995). The increased muscle CSA 484
in the current study probably allowed for more muscle mass to be activated, and since the 485
concentration of aerobic enzymes in m. vastus lateralis was unchanged, the total amount 486
aerobic enzymes available for sharing a certain power output should be increased. This may 487
allow the increased power output to be sustained with unchanged relative load experienced by 488
the mitochondria, thereby improving fractional utilization of VO2max. 489

Although the method for measuring fractional utilization of VO2max and performance VO2 in 490
the current study is not validated, we are confident that our measurement of performance VO2 491
is accurate and valid. To minimize the subjects discomfort and increase the external validity, 492
the VO2 was only measured during the last minute of every 5-min section during the 40-min 493
all-out test. The mean VO2 during this minute was assumed to reflect the VO2 for the entire 5-494
min period. Large changes in power output will of course threaten this assumption. However, 495
based on pilot work, we noticed that the athletes did not change their power output often with 496
the exception of the last 5-min of the 40-min all-out trial. Therefore, VO2 was measured 497
during the last 5-min and the average consumption was taken as VO2 during this period. 498
Cycling economy 499
The improved cycling economy observed in E+S probably explains some of the improved 500
power output during the 40-min all-out trial. This is supported by the relationship between 501
change in VO2 at 150 W and change in mean power output during the 40-min all-out trial (r = 502
-0.47). The finding of improved cycling economy is in agreement with results from other 503
studies in master athletes (Louis et al., 2012) and trained cyclists (Sunde et al., 2010; Barrett-504
O'Keefe et al., 2012). However, the addition of heavy strength training does not seem to 505
improve cycling economy in highly trained to elite cyclists (Ronnestad et al., 2010; Aagaard 506
et al., 2011; Ronnestad et al., 2014). 507
The precise mechanism for improved cycling economy after heavy strength training is not 508
completely understood. Barrett-O´Keffe et al. (2012) found a reduced pulmonary VO2 and a 509
corresponding reduced leg VO2 after 8 weeks heavy strength training. This indicates that the 510
mechanism may lie inside the trained muscles. One suggestion is that an increase in the 511
proportion of type IIA muscle fibers at the expense of type IIX muscle fibers might be a 512
contributor to improved cycling economy (Aagaard & Andersen, 2010; Ronnestad & Mujika, 513

2014). Since the type IIA fibers have been suggested to be more economical than the type IIX 514
fibers (Westerblad et al., 2010), this would in theory improve work economy. Our data 515
supports a role for such fiber type conversions behind the improved cycling economy, as the 516
E+S group displayed an increase in proportions of type IIA fibers with a concomitant 517
reduction in proportions of type IIAX-IIX fibers. However, no correlation between fiber type 518
conversion and changes in cycling economy was observed. 519
In line with the discussion on more efficient muscle fibers, an increase in the quadriceps 520
muscle CSA and increased muscle strength may also contribute to improved cycling 521
economy. This is supported by the relationship between change in CSA of the quadriceps 522
muscle and improved cycling economy (r = -0.54). When the maximal muscle strength 523
increases, the force levels required to ride at a certain power output is reduced relatively to 524
maximal force. This implies that the economical type I and type IIA muscle fibers can 525
account for a larger proportion of a certain absolute power output (Hickson et al., 1988; 526
Ronnestad & Mujika, 2014), as follows from the size principle of motor unit recruitment. 527
Indeed, cycling economy has been related to proportions of type I fibers in the active muscles 528
(Coyle et al., 1992; Mogensen et al., 2006), although this is not a universal finding (Hopker et 529
al., 2013). The combined effect of the aforementioned mechanisms of increased proportions 530
of type IIA fibers at the expense of type IIAX-IIX and increased quadriceps CSA should also 531
have an extra effects on both 40-min all-out performance and cycling economy since the total 532
muscle CSA covered by the fatigue resistant and more economical IIA fibers will be 533
substantially increased. 534
Wmax and power output in the Wingate test 535
Cycling races are often decided in a sprint or in a few minutes of all-out performance at the 536
end of the race. Furthermore, the ability to close gaps or break away from the pack can also be 537

important for success. Therefore, the ability to generate high power output for a short period 538
of time is an important factor for cycling performance (Atkinson et al., 2003). In the present 539
study, none of the groups had a significant increase in Wmax. The lack of an effect of heavy 540
strength training on Wmax is in conflict with previous studies from our group in well-trained to 541
elite male cyclists performing the same strength training program as in the current study 542
(Ronnestad et al., 2010; Ronnestad et al., 2014). The reasons for this discrepancy is unclear. 543
One explanation may be that this study included female athletes while the aforementioned 544
studies examined male cyclists. However, a lack of effect of strength training on Wmax has 545
also been reported in male cyclists after explosive type strength training (Bastiaans et al., 546
2001) and after a short period (6 weeks) of heavy strength training (Levin et al., 2009). In 547
addition, increased Wmax in double poling have been reported in female cross country skiers 548
after concurrent training (Hoff et al., 1999), making this explanation unlikely. VO2max is an 549
important factor determining Wmax, but Wmax also has a large anaerobic component (Jones & 550
Carter, 2000). The lack of change in Wmax can therefore indicate a lack of change in anaerobic 551
power and/or capacity. However, our other indicator of anaerobic abilities, the Wingate test, 552
showed improved anaerobic performance. 553
The finding of improved Wingate peak power output after combining heavy strength training 554
and endurance training was expected since similar findings have been reported in both 555
untrained subjects (Chromiak et al., 2004) and cyclists of various performance levels 556
(Ronnestad et al., 2010; Ronnestad et al., 2014). Because peak power often occur during the 557
first 5 s of an all-out sprint, the size of the involved muscle mass and maximal leg strength is 558
one of the main determinates of peak power output (Izquierdo et al., 2004; Van Praagh, 2007). 559
The increase in peak power during the Wingate test in the E+S group might therefore be 560
explained by the increase in quadriceps CSA and leg strength. 561

The strength training intervention also increased the mean power output during the Wingate 562
test, which was not seen in the control cyclists. This is in accordance with a study showing 563
that 9 weeks of explosive strength training prevented a decrease in mean power output during 564
a modified Wingate test in male cyclists (Bastiaans et al., 2001), and in studies with untrained 565
individuals after periods of heavy strength training (Chromiak et al., 2004). The dominant 566
energy source during the Wingate test is anaerobic lactic acid metabolism (Beneke et al., 567
2002). Since strength training have the potential to increase glycolyctic enzyme activity and 568
augment intracellular fuel stores of ATP and phosphocreatine (Gravelle, 2000), this is a likely 569
mechanism for the increased mean power during the Wingate test. 570
Strength, muscle CSA and muscle fiber type composition 571
The observed 39% increase in leg strength (1 RM in leg press) is in accordance with the 572
previously observed 28% to 40% increase in 1RM in endurance athletes adding 8-12 weeks of 573
heavy strength training to their normal endurance training (e.g. Bishop et al., 1999; Levin et 574
al., 2009 Barrett-O'Keefe et al., 2012). Likewise, the 7.4% increase in quadriceps CSA seen in 575
the present study is in accordance with previous reports of increases in lean mass of the legs 576
or increases in CSA of thigh muscles after similar strength training programs in well-trained 577
and elite male cyclists (Ronnestad et al., 2010; Ronnestad et al., 2014). Some of the improved 578
leg strength seen in E+S in the present study is likely due to the increased quadriceps CSA. 579
The eleven weeks of strength training reduced the proportion of type IIAX-IIX fibers and 580
increased the proportion of type IIA fibers to such a degree that no fibers was positive for the 581
type IIX antibody after the intervention. This finding is in accordance with a previous study in 582
elite male cyclists (Aagaard et al., 2011) and previous studies in untrained subjects (Staron et 583
al., 1994; Kraemer et al., 1995; Andersen & Aagaard 2000). 584
Aerobic enzymes 585

There were no changes in the concentration of aerobic enzymes in m. vastus lateralis during 586
the course of the study in neither E+S nor E. To investigate possible effects on the three major 587
pathways of aerobic metabolism, we measured changes in CS, COX4 and HADH as markers 588
for the Krebs cycle, oxidative phosphorylation and beta-oxidation, respectively. The findings 589
of no effect of concurrent training compared to endurance training alone is not surprising 590
considering data from the majority of previous studies. For example, in untrained subjects 591
concurrent training has led to similar gains in CS activity when compared to endurance 592
training alone (Sale et al., 1990; Bell et al., 2000). Similarly, studies in endurance athletes 593
adding a period of strength training to their normal training have reported change in the 594
content or activity of the aerobic enzymes (Hickson et al., 1988; Bishop et al., 1999). 595
Conclusion 596
The results from the present study demonstrated that adding heavy strength training to 597
endurance training in well-trained female cyclists leads to improvements in cycling 598
performance and cycling economy. This is the first study to show that concurrent training 599
improve fractional utilization of VO2max. The main mechanisms behind these improvements 600
seem to be increased muscle CSA and fiber type shifts from type IIX towards type IIA in the 601
main propulsive muscles. 602
Perspectives 603
Based on the results from the current study, female cyclists can be recommended to include 604
heavy strength training in their training programs for maximal gains in cycling performance. 605
The present finding is in accordance with previous findings in moderately-trained to elite 606
male cyclists (Ronnestad et al., 2010; Sunde et al., 2010 Aagaard et al., 2011; Ronnestad et 607
al., 2014). This is however not in accordance with the only previous study in female cyclists 608
(Bishop et al., 1999). However, the strength training volume in that study may have been too 609
low to enhance cycling performance. These results also confirm that heavy strength training 610
have the potential to improve cycling economy as previovsly reported in master cyclists 611
(Louis et al., 2012) and trained cyclists (Sunde et al., 2010; Barrett-O'Keefe et al., 2012). In 612
addition, the present study shows that strength training may improve fractional utilization of 613
VO2max and that this can be an important mechanism behind improved cycling performance. 614
Finally, this study indicates that muscle fiber type transition from type IIAX-IIX to type IIA 615
and increased muscle CSA are possible mechanisms behind the present observations of 616
improved cycling economy and fractional utilization of VO2max, hence representing the two 617
main factors for the improvement in cycling performance induced by concurrent strength 618
training. 619
Acknowledgements 620
The authors would like to thank the participants for their time and effort. Students Kristoffer 621
Bergstrøm, Roger Kristoffersen, Allan Sørgaard Nielsen and Sondre Prestkvern for assistant 622
during the intervention follow-up and data sampling. A special thanks to Jostein Flata at the 623
Hospital for Rheumatic Diseases for his time and effort performing the MRI scans. 624
625
References 626
Aagaard P, Andersen JL. Effects of strength training on endurance capacity in top-level 627
endurance athletes. Scand J Med Sci Sports 2010: 20 Suppl 2: 39-47. 628
629
Aagaard P, Andersen JL, Bennekou M, Larsson B, Olesen JL, Crameri R, Magnusson SP, 630
Kjaer M. Effects of resistance training on endurance capacity and muscle fiber 631
composition in young top-level cyclists. Scand J Med Sci Sports 2011: 21: e298-307. 632
633
Andersen JL, Aagaard P. Myosin heavy chain IIX overshoot in human skeletal muscle. 634
Muscle Nerve 2000: 23: 1095-1104 635
636

Atkinson G, Davison R, Jeukendrup A, Passfield L. Science and cycling: current knowledge 637
and future directions for research. Journal of sports sciences 2003: 21: 767-787. 638
639
Barrett-O'Keefe Z, Helgerud J, Wagner PD, Richardson RS. Maximal strength training and 640
increased work efficiency: contribution from the trained muscle bed. Journal of 641
applied physiology 2012: 113: 1846-1851. 642
643
Bassett DR, Howley ET. Limiting factors for maximum oxygen uptake and determinants of 644
endurance performance. MedSciSports Exerc 2000: 32: 70-84. 645
646
Bastiaans JJ, van Diemen AB, Veneberg T, Jeukendrup AE. The effects of replacing a portion 647
of endurance training by explosive strength training on performance in trained 648
cyclists. Eur J Appl Physiol 2001: 86: 79-84. 649
650
Bell GJ, Syrotuik D, Martin TP, Burnham R, Quinney HA. Effect of concurrent strength and 651
endurance training on skeletal muscle properties and hormone concentrations in 652
humans. Eur J Appl Physiol 2000: 81: 418-427. 653
654
Beneke R, Pollmann C, Bleif I, Leithauser RM, Hutler M. How anaerobic is the Wingate 655
Anaerobic Test for humans? Eur J Appl Physiol 2002: 87: 388-392. 656
657
Bishop D, Jenkins DG, Mackinnon LT, McEniery M, Carey MF. The effects of strength 658
training on endurance performance and muscle characteristics. Med Sci Sports Exerc 659
1999: 31: 886-891. 660
661
Chromiak JA, Smedley B, Carpenter W, Brown R, Koh YS, Lamberth JG, Joe LA, Abadie 662
BR, Altorfer G. Effect of a 10-week strength training program and recovery drink on 663
body composition, muscular strength and endurance, and anaerobic power and 664
capacity. Nutrition 2004: 20: 420-427. 665
666
667
Coyle EF. Integration of the Physiological Factors Determining Endurance Performance 668
Ability. Exercise and Sport Sciences Reviews 1995:23: 25-63. 669
670
Coyle EF, Sidossis LS, Horowitz JF, Beltz JD. Cycling efficiency is related to the percentage 671
of type I muscle fibers. Med Sci Sports Exerc 1992: 24: 782-788. 672
673
Ellefsen S, Vikmoen O, Slettalokken G, Whist JE, Nygaard H, Hollan I, Rauk I, Vegge G, 674
Strand TA, Raastad T, Ronnestad BR. Irisin and FNDC5: effects of 12-week strength 675
training, and relations to muscle phenotype and body mass composition in untrained 676
women. Eur J Appl Physiol 2014a: 114: 1875-1888. 677
678

Ellefsen S, Vikmoen O, Zacharoff E, Rauk I, Slettalokken G, Hammarstrom D, Strand TA, 679
Whist JE, Hanestadhaugen M, Vegge G, Fagernes CE, Nygaard H, Hollan I, 680
Ronnestad BR. Reliable determination of training-induced alterations in muscle fiber 681
composition in human skeletal muscle using quantitative polymerase chain reaction. 682
Scand J Med Sci Sports 2014b: 24(5): e334-e343 683
684
Gravelle BJ, Blessing, D. I. Physiological Adaptations in Women Concurrently Training for 685
Strength and Endrurance. Journal of Strength and Conditioning Research 2000 14: 5-686
13. 687
688
Hickson RC, Dvorak BA, Gorostiaga EM, Kurowski TT, Foster C. Potential for strength and 689
endurance training to amplify endurance performance. J Appl Physiol 1988: 65: 2285-690
2290. 691
Hoff J, Helgerud J, Wisløff U. Maximal strength training improves work economy in trained 692
female cross-country skiers. Med Sci Sports Exerc 1999: 870-877. 693
694
Holloszy JO, Coyle EF. Adaptations of skeletal muscle to endurance exercise and their 695
metabolic consequences. J Appl Physiol 1984: 56: 831-838. 696
697
Hopker JG, Coleman DA, Gregson HC, Jobson SA, Von der Haar T, Wiles J, Passfield L. The 698
influence of training status, age, and muscle fiber type on cycling efficiency and 699
endurance performance. Journal of applied physiology 2013: 115: 723-729. 700
701
Hopkins WG, Marshall SW, Batterham AM, Hanin J. Progressive statistics for studies in 702
sports medicine and exercise science. Med Sci Sports Exerc 2009: 41: 3-13. 703
704
Izquierdo M, Ibanez J, Hakkinen K, Kraemer WJ, Ruesta M, Gorostiaga EM. Maximal 705
strength and power, muscle mass, endurance and serum hormones in weightlifters and 706
road cyclists. Journal of sports sciences 2004: 22: 465-478. 707
708
Jeukendrup AE, Craig NP, Hawley JA. The bioenergetics of World Class Cycling. Journal of 709
science and medicine in sport / Sports Medicine Australia 2000: 3: 414-433. 710
711
712
Jones AM, Carter H. The effect of endurance training on parameters of aerobic fitness. Sports 713
Med 2000: 29: 373-386. 714
715
Kraemer WJ, Patton JF, Gordon SE, Harman EA, Deschenes MR, Reynolds K, Newton RU, 716
Triplett NT, Dziados JE. Compatibility of high-intensity strength and endurance 717
training on hormonal and skeletal muscle adaptations. J Appl Physiol 1995: 78: 976-718
989 719
720

Levin GT, McGuigan MR, Laursen PB. Effect of concurrent resistance and endurance 721
training on physiologic and performance parameters of well-trained endurance 722
cyclists. J Strength Cond Res 2009: 23: 2280-2286. 723
724
Louis J, Hausswirth C, Easthope C, Brisswalter J. Strength training improves cycling 725
efficiency in master endurance athletes. Eur J Appl Physiol 2012: 112: 631-640. 726
727
Mogensen M, Bagger M, Pedersen PK, Fernstrom M, Sahlin K. Cycling efficiency in humans 728
is related to low UCP3 content and to type I fibres but not to mitochondrial efficiency. 729
J Physiol 2006: 571: 669-681. 730
731
Ronnestad BR, Hansen EA, Raastad T. Effect of heavy strength training on thigh muscle 732
cross-sectional area, performance determinants, and performance in well-trained 733
cyclists. EurJApplPhysiol 2010: 108: 965-975. 734
735
Ronnestad BR, Hansen EA, Raastad T. Strength training improves 5-min all-out performance 736
following 185 min of cycling. Scand J Med Sci Sports 2011: 21: 250-259. 737
738
Ronnestad BR, Hansen J, Hollan I, Ellefsen S. Strength training improves performance and 739
pedaling characteristics in elite cyclists. Scand J Med Sci Sports 2014: 25(1) e89-e98 740
DOI: 10.1111/sms.12257 741
742
Ronnestad BR, Mujika I. Optimizing strength training for running and cycling endurance 743
performance: A review. Scand J Med Sci Sports 2014: 24: 603-612 DOI: 744
10.1111/sms.12104 745
746
Sale DG, MacDougall JD, Jacobs I, Garner S. Interaction between concurrent strength and 747
endurance training. J Appl Physiol 1990: 68: 260-270. 748
749
Sokal RR, Rohlf FJ. Biometry: 4th edn. New York: W.H Freeman and Company 2012 750
751
Staron RS, Karapondo DL, Kraemer WJ, Fry AC, Gordon SE, Falkel JE, Hagerman FC, 752
Hikida RS. Skeletal muscle adaptations during early phase of heavy-resistance training 753
in men and women. J Appl Physiol 1994: 76: 1247-1255. 754
755
Sunde A, Storen O, Bjerkaas M, Larsen MH, Hoff J, Helgerud J. Maximal strength training 756
improves cycling economy in competitive cyclists. J Strength Cond Res 2010: 24: 757
2157-2165. 758
759
760

Van Praagh E. Anaerobic fitness tests: what are we measuring? Medicine and sport science 761
2007: 50: 26-45. 762
763
Westerblad H, Bruton JD, Katz A. Skeletal muscle: energy metabolism, fiber types, fatigue 764
and adaptability. Experimental cell research 2010: 316: 3093-3099. 765
766
Figure legends 767
768
Figure 1: Individual values (dotted lines) and mean values (solid lines) before (Pre) and after 769
(Post) the intervention period for cyclists adding strength training to their normal endurance 770
training (E+S) and cyclists performing normal endurance training only (E). A: 1 repetition 771
maximum (RM) in one-legged legpress. B: Cross sectional area (CSA) of m. quadriceps 772
femoris. * Different than pre (p ˂ 0.05), # the percent change from pre is different in E+S than 773
in E (p ˂ 0.05). 774
Figure 2: Individual values (dotted lines) and mean values (solid lines) before (Pre) and after 775
(Post) the intervention period for cyclists adding strength training to their normal endurance 776
training (E+S) and cyclists performing normal endurance training only (E). 777
Immunohistochemistry determined muscle fiber proportions, presented as percentage of 778
overall fiber abundance. * Different from pre (p ˂ 0.05). 779
Figure 3: Log2-fold change in protein levels of Citrate Synthase (CS), Cytochrome c oxidase 780
subunit IV (Cox4) and Hydroxyacyl-CoA dehydrogenase (HADH) during the intervention 781
period for cyclists adding strength training to their normal endurance training (E+S) and 782
cyclists performing normal endurance training only (E). Values are mean ± CI 783
Figure 4: Individual values (dotted lines) and mean values (solid lines) before (Pre) and after 784
(Post) the intervention period for cyclists adding strength training to their normal endurance 785
training (E+S) and cyclists performing normal endurance training only (E). A: Body mass 786
adjusted mean power output during the 40-min all-out trial. B: Body mass adjusted power 787
output at 3.5 mmol∙L-1 [la-] calculated during the blood lactate profile test. C: Body mass 788
adjusted oxygen consumption (VO2) at 150 W. * Different from pre (p ˂ 0.05), # the percent 789
change from pre is different in E+S than in E (p ˂ 0.05), £ tendency to different from pre (p ˂ 790
0.1) 791

Figure 5: A: Correlation between change in m. quadriceps femoris cross sectional area (CSA) 792
and change in oxygen consumption (VO2) at 150 W. B: Correlation between changes in type 793
IIAX-IIX proportions and changes in mean power output during the 40-min all-out trial. C: 794
Correlation between change in m. quadriceps femoris CSA and change in mean power output 795
during the 40-min all-out trial. D: Correlation between change in m. quadriceps femoris CSA 796
and change in performance VO2 during the 40-min all-out trial. Open circles represents 797
cyclists in E+S while solid circles represents cyclists in E. 798
Figure 6: Individual values (dotted lines) and mean values (solid lines) before (Pre) and after 799
(Post) the intervention period for cyclists adding strength training to their normal endurance 800
training (E+S) and cyclists performing normal endurance training only (E). A: The fractional 801
utilization of VO2max during the 40-min all-out trial. B: The performance VO2 during the 40-802
min all-out trial. * Different from pre (p ˂ 0.05), £ tendency to different from pre (p ˂ 0.1) 803
804
Table 1. Characteristics of the cyclists adding strength training to their normal endurance training 805
(E+S) and cyclists performing normal endurance training only (E). 806
Group N Age (years) Height (m) Body mass (kg)
BMI (kg/m2)
E+S 11 31.5 ± 8.0 1.69 ± 0.05 62.2 ± 5.2 21.7 ± 1.3 E 8 34.9 ± 7.5 1.70 ± 0.03 65.8 ± 8.2 22.8 ± 2.8
Values are mean ± SD 807
808
Table 2. Duration (in hours per week) of the training performed during the 11 week intervention 809
period for cyclists adding strength training to their normal endurance training (E+S) and cyclists 810
performing normal endurance training only (E). Endurance training was divided into three heart rate 811
(HR) zones: HR zone 1) 60%-82%, HR zone 2) 83%-87%, and HR zone 3 3) 88%-100% of maximal HR. 812
HR zone 1 (h)
HR zone 2 (h)
HR zone 3 (h)
HR zone 1+2+3 (h)
Leg strength (h)
Other (h)
Total
E+S 3.2 ± 1.4
1.1 ± 0.6 0.8 ± 0.6 5.1 ± 1.1 1.5 ± 0.0 0.3 ± 1.0 7.0 ± 1.4
E 4.5 ± 1.8 1.1 ± 0.3 0.8 ± 0.5 6.3 ± 2.2 0.0 ± 0.0 0.5 ± 0.8 6.8 ± 2.5 Values are mean ± SD 813
814

Table 3. Data from the maximal oxygen consumption (VO2max) and Wingate tests before (Pre) and 815
after (Post) the intervention period for cyclists adding strength training to their normal endurance 816
training (E+S) and cyclists performing normal endurance training only (E). 817
E+S E Cohen’s D
Pre Post Pre Post Wmax (W∙kg-1)
4.0 ± 0.3 4.2 ± 0.3 4.0 ± 0.4 4.2 ± 0.2 0.21
VO2max (ml∙kg-1∙min-1)
53.5 ± 3.6 52.5 ± 4.2 54.6 ± 3.4 53.5 ± 1.8 0.05
HRpeak (beats∙min-1)
188 ± 9 186 ± 8 182 ± 8 182 ± 6 -
RPE
19.5 ± 0.5 19.8 ± 0.4 19.4 ± 0.7 19.3 ± 0.6 -
[La-]peak (mmol∙l-1)
10.8 ± 3.2 10.4 ± 2.9 9.8 ± 2.4 9.7 ± 2.3 -
Peak power Wingate (W∙kg-1)
17.0 ± 2.0 19.1 ± 2.5* 17.7 ± 1.4 18.7 ± 1.7 0.49
Mean power Wingate (W∙kg-1) 8.1 ± 0.7 8.4 ± 0.6* 8.1 ± 0.5 8.1 ± 0.6 0.83
Values are mean ± SD. *Larger than pre (p ˂ 0.05) 818
HRpeak, peak heart rate; [La-]peak, peak blood lactate concentration; RPE, rate of perceived exertion 819
820

Figure 1 821
822
823

Figure 2 824
825
Figure 3 826
827
828

Figure 4 829
830

Figure 5831
832
833

Figure 6 834
835