Embed Size (px)
Citation preview
884
de Geus and Meeusen are with the Dept of Human Physiology, Vrije Universiteit Brussel, Brussels, Belgium. Degraeuwe, Int Panis, Aertsens, De Weerdt, and Torfs are with the Dept of Transport & Mobility, Flemish Institute for Technological Research (VITO), Mol, Belgium. Vandenbulcke and Thomas are with C.O.R.E. and the Dept of Geography, Université Catholique de Louvain (UCL), Louvain-La-Neuve, Belgium.
Journal of Physical Activity and Health, 2014, 11, 884-894 http://dx.doi.org/10.1123/jpah.2012-0200 © 2014 Human Kinetics, Inc.
Utilitarian Cycling in Belgium: A Cross-Sectional Study in a Sample of Regular Cyclists
Bas de Geus, Bart Degraeuwe, Grégory Vandenbulcke, Luc Int Panis, Isabelle Thomas, Joris Aertsens, Yves De Weerdt, Rudi Torfs, and Romain Meeusen
Background: For an accurate estimation of health benefits and hazards of utilitarian cycling, a prospective collection of bicycle usage data (exposure) is fundamental. Individual and environmental correlates are necessary to guide health promotion and traffic safety issues. Firstly, this study aims to report on utilitarian bicycle usage in Belgium, using a prospective data collection in regular adult commuter cyclists. Secondly, the association is explored between the individual variation in bicycle usage and individual and environmental correlates. Methods: 1187 regular adult cyclists filled out travel diaries prospectively. Multivariate linear regression with Stepwise selection (SMLR) models studied the association between exposure and individual and envi-ronmental correlates. Results: Higher age and availability of cycle paths have a positive association with bicycle usage to work. Women cycle significant less compared with men, and so do cyclists with ‘poor’ or ‘average’ health. Living in an urban crown (opposed to city center) and living in Flanders (opposed to Brussels or Wallonia) is associated with significantly more cycling. Conclusions: Utilitarian cycling is related to regional differences, level of urbanization of the place of residence, availability of bicycle paths, and gender. These findings are useful in estimating health benefits and hazards of utilitarian cycling among regular Belgian cyclists.
Keywords: bicycle usage, correlates, prospective, SHAPES
Research on physical activity and health provides continu-ing, consistent and increasingly specific evidence to support the importance of physical activity for public health.1,2 To promote and maintain health, all healthy adults aged 18–65 years need moderate-intensity aerobic (endurance) physical activity (PA) for a minimum of 30 min on 5 days each week or vigorous-intensity aerobic PA for a minimum of 20 min on 3 days each week.3,4 Other authors have suggested that even half the recommended amount of physical activity (ie, 15 min per day or 90 min a week of moderate-intensity exercise) can provide significant health benefits.5
Utilitarian cycling (ie, cycling for transportation) has been iden-tified as an important strategy for reducing inactivity and improving cardiorespiratory fitness and mental health,6–10 because it holds the potential of being physically active on a regular basis at a moderate to vigorous intensity.11 Hendriksen et al8 and de Geus et al9 showed a positive dose-response relationship between the amount of cycling and health outcomes, in previously sedentary subjects. The lower the physical performance at the start of the study and the higher the total amount of kilometers cycled, the higher the gain in maxi-mal external power (Wmax).8 The maximal oxygen consumption increased significantly at approximately 1000 kcal/week and 1500 kcal/week of energy expended while cycling for women and men, respectively.9 Additionally, cycling is increasingly being promoted as a mean to reduce traffic congestion, air and noise pollution and the consumption of fossil fuels.12
To estimate the health impact of utilitarian cycling (as a resul-tant of being physically active, inhalation of air pollution and risk of bicycle accidents) an in-depth and thorough collection of bicycle usage (exposure) data are essential.12 As was shown by Int Panis et al,12 the dose of inhaled pollutants is dependent on the physical effort and so indirectly from cycling speed. Exposure-based injury and fatality rates will help us to understand whether policies reduce exposure or whether they increase risk, given a similar level of exposure.13 Without exposure data, the incidence rate cannot be calculated, making com-parisons between countries or regions within 1 country difficult.14
In most countries, statistics on bicycle usage (cycling time, speed and distance) are not collected in a systematic way and are often restricted to modal share or trip share and thus represent a weak indicator of exposure.15 Exceptions are the UK (UK Dept. of Transport) and the Netherlands (Centraal Bureau voor de Statistiek). In Belgium, the most recent nationwide dataset on bicycle usage was collected within the framework of the national socioeconomic census carried out in 2001 by the National Institute for Statistics.16 Vandenbulcke et al17 showed large differences in bicycle usage between the 3 institutional regions, caused by differences in topogra-phy (flat vs. hilly terrain), urban structure (Brussels-Capital Region vs. Flanders and Wallonia) and bicycle culture. Although exhaus-tive, these data have become outdated due to the rapid evolution in traffic density and changes in modal share. In addition, bicycle exposure data are mostly collected in a retrospective way, which could be subject to recall bias.
Developing policies that increase cycling rates and result in a safer cycling environment requires knowledge of correlates that influence bicycle usage.18 Previous studies have shown the importance of individual and environmental correlates to explain bicycle usage.18–22
Firstly, this study aims to report on utilitarian bicycle usage in Belgium, using a prospective data collection in regular adult com-
Official Journal of ISPAHwww.JPAH-Journal.com
ORIGINAL RESEARCH
Utilitarian Cycling in Belgium 885
muter cyclists. Secondly, the association is explored between the individual variation in bicycle usage and individual and environmen-tal correlates. Attention was particularly put on the role played by the institutional region of the place of residence as regional differences in Belgium form microcosms that also reflect variation observed at other geographical levels, between European countries (eg, northern and southern) or between different states within the USA.13
Methods
Study Design
This study is part of the SHAPES project (Systematic analysis of Health risks and physical Activity associated with cycling PoliciES) which is at the crossroads of health, transport and air pollution research. The aim of the SHAPES project is to analyze the benefits and risks (voluntary and involuntary) of cycling and to advise policy makers to facilitate the implementation of intersectoral policies related to cycling for transport. Within the SHAPES project expo-sure to traffic exhaust and accidents during cycling were considered as risks (see12,17,22–24).
For this part of the SHAPES project, bicycle usage data (expo-sure) were collected prospectively during 1 year, and were then correlated cross-sectionally with environmental and self-reported individual factors. A web and e-mail-based registration system to establish a cohort of commuter cyclists was incorporated in the website of the SHAPES project: www.shapes-ssd.be. The SHAPES online registration system was open-access, so that anyone could access the website and participate if they passed the inclusion and exclusion criteria. The system was designed to register bicycle usage and its (potential) individual and environmental correlates. Utilitarian cycling was here defined as ‘commuting to or from work’ or ‘cycling to other destinations.’ Leisure and ‘sports-related’ cycling (eg, cycling for competition or cycling that is not done for an utilitarian purpose such as work) was excluded. After entering their e-mail address, an automatically generated e-mail was sent to the tentative participant. In this first e-mail, information related to the purpose of the online registration system was given. The inclusion criteria were checked: (1) age between 18–65 years, (2) having a paid job outside home, (3) cycling to work at least twice a week for the preceding year, and (4) living in Belgium (Western Europe).
Those who fulfilled the inclusion criteria, further referred to as ‘participants,’ got access to the General Questionnaire (section 2.4.). At the same moment, a second e-mail was sent including the first travel diary (TD), which was resent to the participants every week (see section 2.3.). The General Questionnaire was filled out at one occasion, together with the first travel diary. The main dataset for this study was collected between March 10, 2008 and March 16, 2009.
The Vrije Universiteit Brussel Ethical Committee approved the study protocol.
Studied Area
Belgium is subdivided into 3 institutional regions: the Brussels-Capital region (BCR, central), the Flemish region (north), and the Walloon region (south). Although the traffic legislation is the same in the 3 institutional regions, procycling measures are more frequently implemented in Flanders: traffic calming measures are more frequent, traffic speed on secondary roads is more limited, bicycle infrastructure is more readily available, and road- and city-planning pay more attention to cyclists.17 The BCR is a particular region as it consists of a single condensed urbanized built-up area.
Data from the Belgian ‘National household survey’16, showed a clear-cut north-south division in bicycle usage, infrastructure, the presence of probicycle policies, flat vs. hilly terrain, and attitude toward cycling (for details, see Vandenbulcke et al.17,22).
Bicycle UsageTravel diaries (TD) were filled out prospectively on a weekly basis to collect self-reported data on bicycle usage. The same TD was used in other studies.9,10 All participants that fulfilled the inclusion criteria received an automatically generated e-mail every week at the same moment (Monday at 2 AM) with the question to fill out 1 unique TD. Data on travel frequency, time spent cycling and dis-tance traveled over the past 7 days was collected. Average cycling speed was calculated per week using the total travel time and total distance cycled during that specific week. In the TDs a distinction was made between ‘cycling to and from work’ and ‘cycling to other destinations’ (eg, cycling to the grocery shop, but excluding cycling for leisure and sport purposes).
Oja et al25 have emphasized the importance of the total energy expenditure of PA rather than its specific characteristics such as intensity, frequency, and bout duration for health benefits. Estimated total energy expenditure (MET-min/week) for each participant was used as the dependent variable and calculated by multiplying the bout duration (time spent cycling per week) with the intensity (cycling speed) to obtain an useful measure of bicycle usage. The cycling speed from the TD’s of every individual cyclist was then converted to Metabolic Equivalents (MET) according to Ainsworth et al.26 MET is an index of energy expenditure. [A MET is] the ratio of the rate of energy expended during an activity to the rate of energy expended at rest. [One] MET is the rate of energy expenditure while sitting at rest by convention.
MET-minutes is an index of energy expenditure that quantifies the total amount of physical activity performed in a standardized manner across individuals and types of activities. Calculated as the product of the number of METs associated with 1 or more physical activities and the number of minutes the activities were performed (ie, METs × minutes). Usually standardized per week or per day. Example: cycling at 18 km/h (=6 METs) for 30 min on 3 d/wk: 6 METs × 30 min × 3 times per week = 540 MET-min/wk.
Individual and Environmental CorrelatesThe individual and environmental correlates were collected through the General Questionnaire, that is based on the Belgian National Household Survey on Mobility16 and recent literature (eg, Winters et al18 and Moudon et al.20). Individual (gender, age, body mass index (BMI), perceived health, education, work situation and children) and environmental (availability of bicycle paths, level of urbaniza-tion of the place of residence (denoted as ‘Urbanization Home’) and level of urbanization of the work place (denoted as ‘Urbaniza-tion Work’), region of the place of residence (denoted as ‘Region Home’) and region of the work place (denoted as ‘Region Home’) correlates were studied. Supplementary File 1 lists and describes the explanatory variables.
To determine the correlates of bicycle usage, a Multivariate Linear Regression with Stepwise selection (SMLR), using Ordinary Least Square (OLS) estimation, was performed with MET-min/week as the continuous dependent variable. MET-min/week was ln transformed to fulfill the assumptions of OLS multivariate linear regression. The following assumptions were met: strictly exogenous independent variables, absence of multicollinearity, normally dis-tributed, homoscedastic and nonautocorrelated errors and finite error
886 de Geus et al
variances. Multicollinearity between ‘Region Home’ and ‘Region Work’ (Spearman correlation coefficient: 0.64; P < .0001) and ‘Urbanization Home’ and ‘Urbanization Work’ (Spearman correla-tion coefficient: 0.31; P < .0001) was present and therefore ‘Region Work’ and ‘Urbanization Work’ were not included in the SMLR. ‘Education’ and ‘work situation’ were also discarded because only 10.2% of the participants did not finish university studies and only 2.5% were “blue collar” workers.
A separate SMLR analysis was performed for (1) ‘cycling to work’ and for (2) ‘cycling to other destinations.’ This distinction was made because previous research indicated the importance of differentiating between context-specific behaviors.27
Results
Study Population
After 1 year of open-access, 1849 participants had left their e-mail address on the SHAPES server. Three hundred and seventy-seven of these participants did not respond to the first mail that asked them about the inclusion criteria and the General Questionnaire (GQ); 29 participants did not live in Belgium; 23 did not fit the age group (and were < 18 years old or > 65 years old); 116 did not have a paid job; and 101 did not cycle to work 2 or more times a week. That left us with 1203 (65.1%) participants that filled out the GQ. One thousand one hundred and eighty-seven participants filled out more than 1 travel diaries (TD) and were included in the data analysis.
Characteristics of our study population can be found in de Geus et al24 where they were compared with those of the ‘National household survey on mobility’.16 Participants in this study form a particular cohort composed of regular mostly male (68.2%) commuter cyclists (74.5% use the bicycle throughout the whole year) who are in good health (92.8% indicate to be in good to very good health), had a higher level of education (89.2%), and have a higher job status (only 2.5% blue collar workers). In comparison with the data of the National Institute for Statistics (NIS, 2001),16 significantly (P < .05) more participants in this study are men, have a higher education and significantly (P < .05) less participants are blue collar workers.
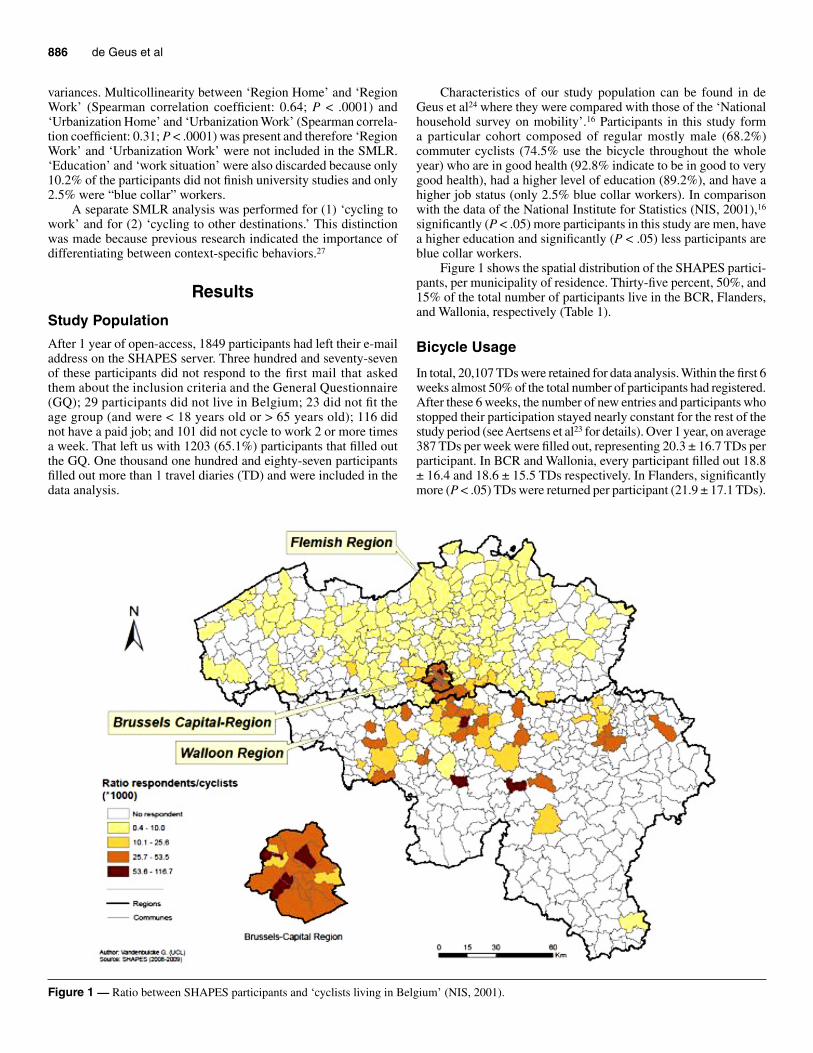
Figure 1 shows the spatial distribution of the SHAPES partici-pants, per municipality of residence. Thirty-five percent, 50%, and 15% of the total number of participants live in the BCR, Flanders, and Wallonia, respectively (Table 1).
Bicycle Usage
In total, 20,107 TDs were retained for data analysis. Within the first 6 weeks almost 50% of the total number of participants had registered. After these 6 weeks, the number of new entries and participants who stopped their participation stayed nearly constant for the rest of the study period (see Aertsens et al23 for details). Over 1 year, on average 387 TDs per week were filled out, representing 20.3 ± 16.7 TDs per participant. In BCR and Wallonia, every participant filled out 18.8 ± 16.4 and 18.6 ± 15.5 TDs respectively. In Flanders, significantly more (P < .05) TDs were returned per participant (21.9 ± 17.1 TDs).
Figure 1 — Ratio between SHAPES participants and ‘cyclists living in Belgium’ (NIS, 2001).
Utilitarian Cycling in Belgium 887
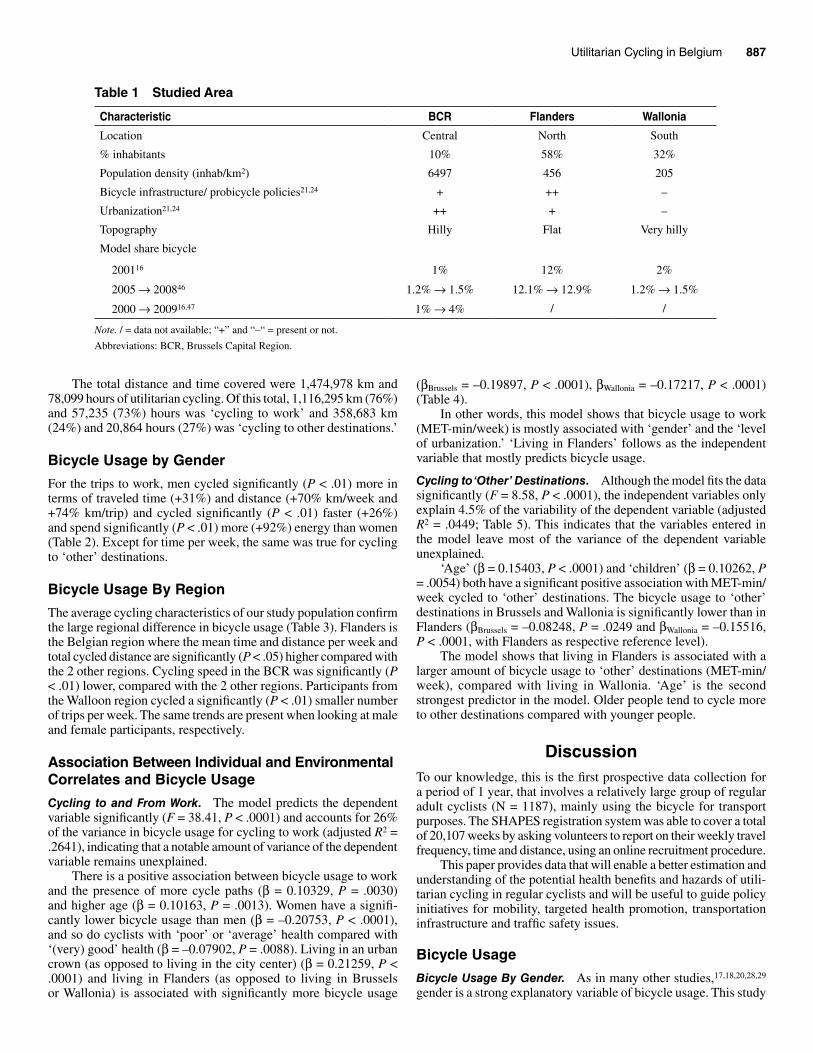
The total distance and time covered were 1,474,978 km and 78,099 hours of utilitarian cycling. Of this total, 1,116,295 km (76%) and 57,235 (73%) hours was ‘cycling to work’ and 358,683 km (24%) and 20,864 hours (27%) was ‘cycling to other destinations.’
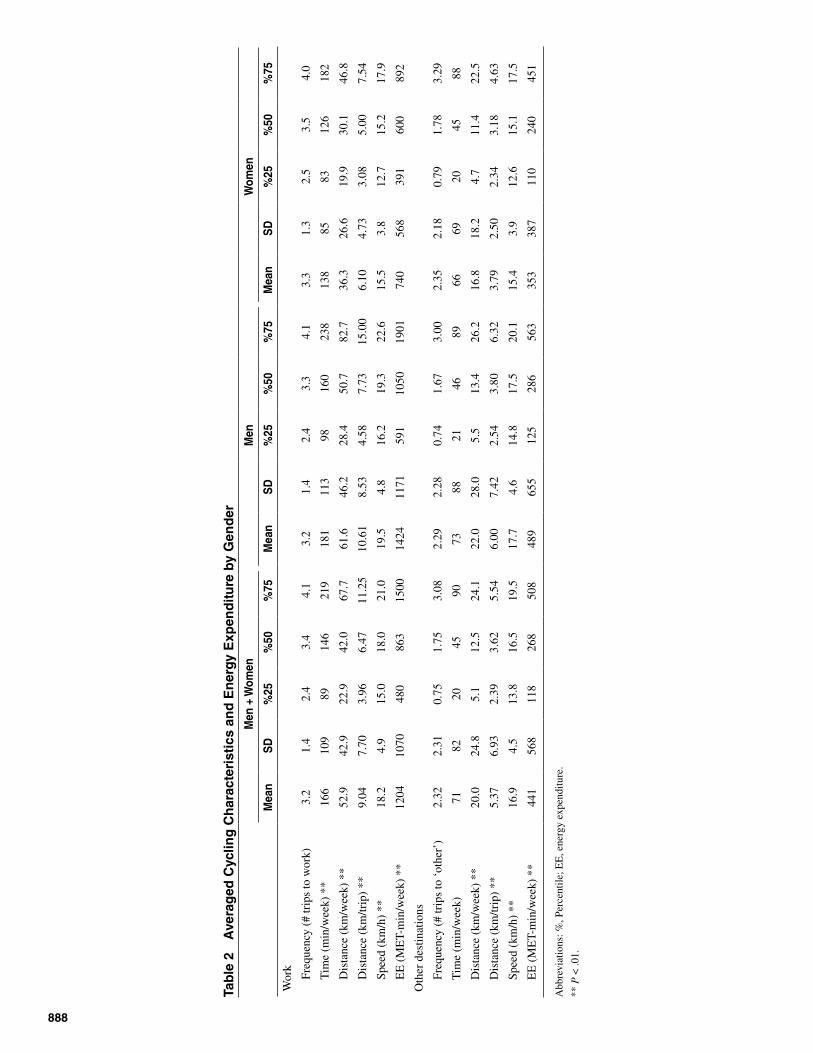
Bicycle Usage by Gender
For the trips to work, men cycled significantly (P < .01) more in terms of traveled time (+31%) and distance (+70% km/week and +74% km/trip) and cycled significantly (P < .01) faster (+26%) and spend significantly (P < .01) more (+92%) energy than women (Table 2). Except for time per week, the same was true for cycling to ‘other’ destinations.
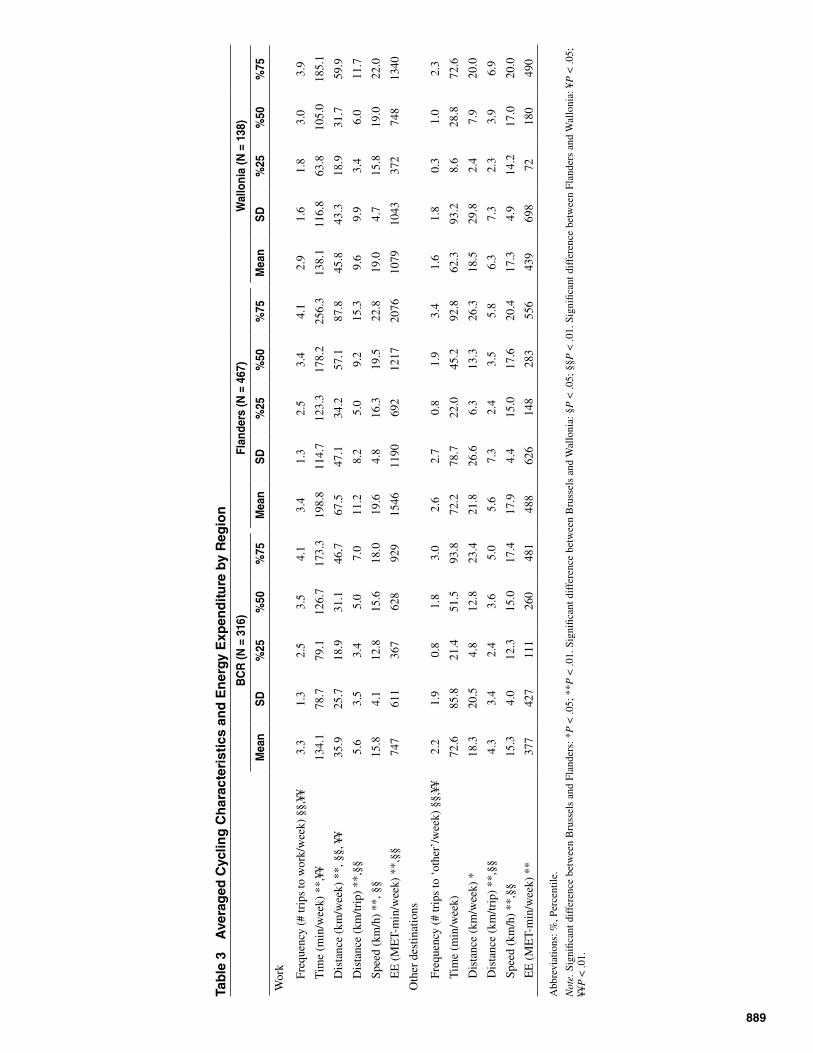
Bicycle Usage By Region
The average cycling characteristics of our study population confirm the large regional difference in bicycle usage (Table 3). Flanders is the Belgian region where the mean time and distance per week and total cycled distance are significantly (P < .05) higher compared with the 2 other regions. Cycling speed in the BCR was significantly (P < .01) lower, compared with the 2 other regions. Participants from the Walloon region cycled a significantly (P < .01) smaller number of trips per week. The same trends are present when looking at male and female participants, respectively.
Association Between Individual and Environmental Correlates and Bicycle Usage
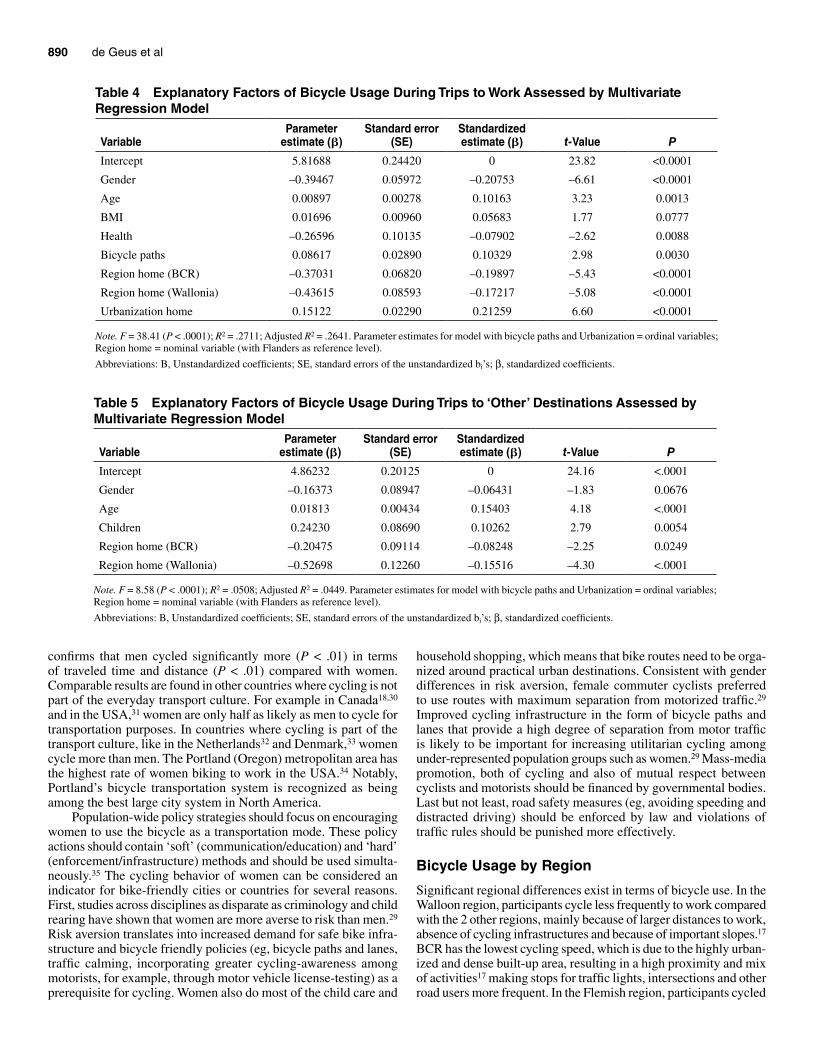
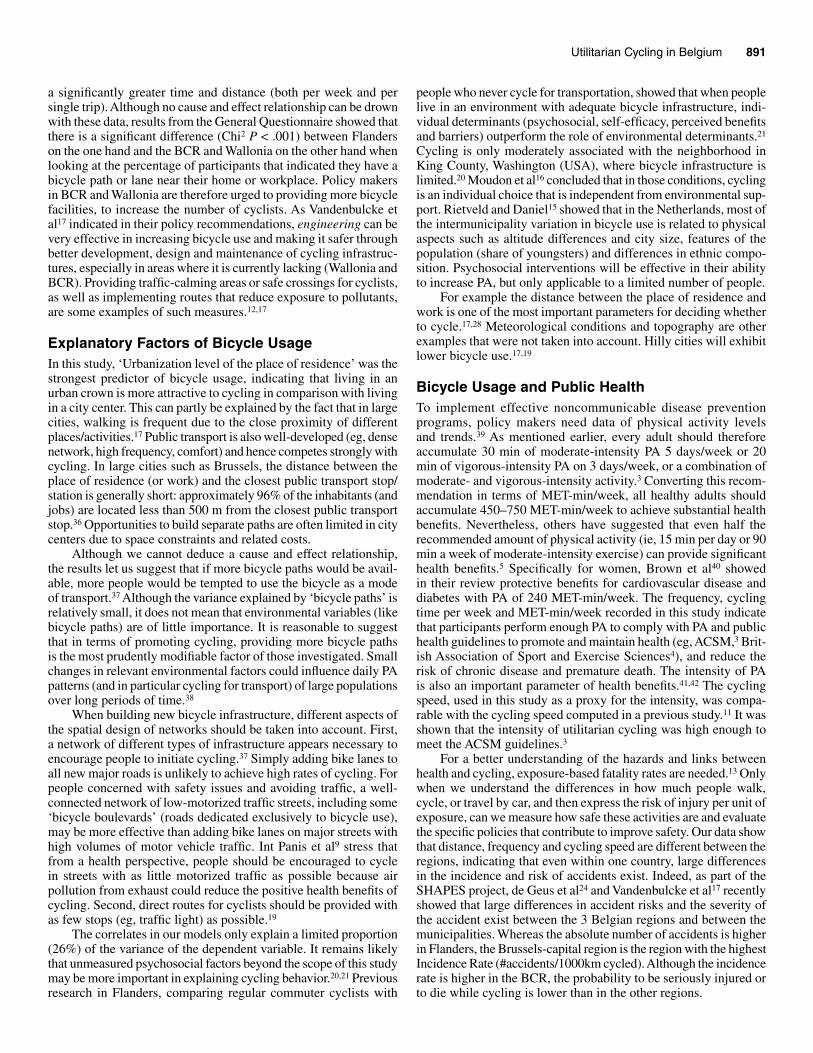
Cycling to and From Work. The model predicts the dependent variable significantly (F = 38.41, P < .0001) and accounts for 26% of the variance in bicycle usage for cycling to work (adjusted R2 = .2641), indicating that a notable amount of variance of the dependent variable remains unexplained.
There is a positive association between bicycle usage to work and the presence of more cycle paths (β = 0.10329, P = .0030) and higher age (β = 0.10163, P = .0013). Women have a signifi-cantly lower bicycle usage than men (β = –0.20753, P < .0001), and so do cyclists with ‘poor’ or ‘average’ health compared with ‘(very) good’ health (β = –0.07902, P = .0088). Living in an urban crown (as opposed to living in the city center) (β = 0.21259, P < .0001) and living in Flanders (as opposed to living in Brussels or Wallonia) is associated with significantly more bicycle usage
(βBrussels = –0.19897, P < .0001), βWallonia = –0.17217, P < .0001) (Table 4).
In other words, this model shows that bicycle usage to work (MET-min/week) is mostly associated with ‘gender’ and the ‘level of urbanization.’ ‘Living in Flanders’ follows as the independent variable that mostly predicts bicycle usage.
Cycling to ‘Other’ Destinations. Although the model fits the data significantly (F = 8.58, P < .0001), the independent variables only explain 4.5% of the variability of the dependent variable (adjusted R2 = .0449; Table 5). This indicates that the variables entered in the model leave most of the variance of the dependent variable unexplained.
‘Age’ (β = 0.15403, P < .0001) and ‘children’ (β = 0.10262, P = .0054) both have a significant positive association with MET-min/week cycled to ‘other’ destinations. The bicycle usage to ‘other’ destinations in Brussels and Wallonia is significantly lower than in Flanders (βBrussels = –0.08248, P = .0249 and βWallonia = –0.15516, P < .0001, with Flanders as respective reference level).
The model shows that living in Flanders is associated with a larger amount of bicycle usage to ‘other’ destinations (MET-min/week), compared with living in Wallonia. ‘Age’ is the second strongest predictor in the model. Older people tend to cycle more to other destinations compared with younger people.
DiscussionTo our knowledge, this is the first prospective data collection for a period of 1 year, that involves a relatively large group of regular adult cyclists (N = 1187), mainly using the bicycle for transport purposes. The SHAPES registration system was able to cover a total of 20,107 weeks by asking volunteers to report on their weekly travel frequency, time and distance, using an online recruitment procedure.
This paper provides data that will enable a better estimation and understanding of the potential health benefits and hazards of utili-tarian cycling in regular cyclists and will be useful to guide policy initiatives for mobility, targeted health promotion, transportation infrastructure and traffic safety issues.
Bicycle Usage
Bicycle Usage By Gender. As in many other studies,17,18,20,28,29 gender is a strong explanatory variable of bicycle usage. This study
Table 1 Studied Area
Characteristic BCR Flanders Wallonia
Location Central North South
% inhabitants 10% 58% 32%
Population density (inhab/km2) 6497 456 205
Bicycle infrastructure/ probicycle policies21,24 + ++ –
Urbanization21,24 ++ + –
Topography Hilly Flat Very hilly
Model share bicycle
200116 1% 12% 2%
2005 → 200846 1.2% → 1.5% 12.1% → 12.9% 1.2% → 1.5%
2000 → 200916,47 1% → 4% / /
Note. / = data not available; “+” and “–“ = present or not.
Abbreviations: BCR, Brussels Capital Region.
888
Tab
le 2
A
vera
ged
Cyc
ling
Ch
arac
teri
stic
s an
d E
ner
gy E
xpen
ditu
re b
y G
end
erM
en +
Wom
enM
enW
omen
Mea
nS
D%
25%
50%
75M
ean
SD
%25
%50
%75
Mea
nS
D%
25%
50%
75
Wor
k
Fr
eque
ncy
(# tr
ips
to w
ork)
3.2
1.4
2.4
3.4
4.1
3.2
1.4
2.4
3.3
4.1
3.3
1.3
2.5
3.5
4.0
T
ime
(min
/wee
k) *
*16
610
989
146
219
181
113
9816
023
813
885
8312
618
2
D
ista
nce
(km
/wee
k) *
*52
.942
.922
.942
.067
.761
.646
.228
.450
.782
.736
.326
.619
.930
.146
.8
D
ista
nce
(km
/trip
) **
9.04
7.70
3.96
6.47
11.2
510
.61
8.53
4.58
7.73
15.0
06.
104.
733.
085.
007.
54
Sp
eed
(km
/h)
**18
.24.
915
.018
.021
.019
.54.
816
.219
.322
.615
.53.
812
.715
.217
.9
E
E (
ME
T-m
in/w
eek)
**
1204
1070
480
863
1500
1424
1171
591
1050
1901
740
568
391
600
892
Oth
er d
estin
atio
ns
Fr
eque
ncy
(# tr
ips
to ‘
othe
r’)
2.32
2.31
0.75
1.75
3.08
2.29
2.28
0.74
1.67
3.00
2.35
2.18
0.79
1.78
3.29
T
ime
(min
/wee
k)71
8220
4590
7388
2146
8966
6920
4588
D
ista
nce
(km
/wee
k) *
*20
.024
.85.
112
.524
.122
.028
.05.
513
.426
.216
.818
.24.
711
.422
.5
D
ista
nce
(km
/trip
) **
5.37
6.93
2.39
3.62
5.54
6.00
7.42
2.54
3.80
6.32
3.79
2.50
2.34
3.18
4.63
Sp
eed
(km
/h)
**16
.94.
513
.816
.519
.517
.74.
614
.817
.520
.115
.43.
912
.615
.117
.5
E
E (
ME
T-m
in/w
eek)
**
441
568
118
268
508
489
655
125
286
563
353
387
110
240
451
Abb
revi
atio
ns: %
, Per
cent
ile; E
E, e
nerg
y ex
pend
iture
.
** P
< .0
1.
889
Tab
le 3
A
vera
ged
Cyc
ling
Ch
arac
teri
stic
s an
d E
ner
gy E
xpen
ditu
re b
y R
egio
nB
CR
(N =
316
)Fl
ande
rs (N
= 4
67)
Wal
loni
a (N
= 1
38)
Mea
nS
D%
25%
50%
75M
ean
SD
%25
%50
%75
Mea
nS
D%
25%
50%
75
Wor
k
Fr
eque
ncy
(# tr
ips
to w
ork/
wee
k) §
§,¥¥
3.3
1.3
2.5
3.5
4.1
3.4
1.3
2.5
3.4
4.1
2.9
1.6
1.8
3.0
3.9
T
ime
(min
/wee
k) *
*,¥¥
134.
178
.779
.112
6.7
173.
319
8.8
114.
712
3.3
178.
225
6.3
138.
111
6.8
63.8
105.
018
5.1
D
ista
nce
(km
/wee
k) *
*, §
§, ¥
¥35
.925
.718
.931
.146
.767
.547
.134
.257
.187
.845
.843
.318
.931
.759
.9
D
ista
nce
(km
/trip
) **
,§§
5.6
3.5
3.4
5.0
7.0
11.2
8.2
5.0
9.2
15.3
9.6
9.9
3.4
6.0
11.7
Sp
eed
(km
/h)
**, §
§15
.84.
112
.815
.618
.019
.64.
816
.319
.522
.819
.04.
715
.819
.022
.0
E
E (
ME
T-m
in/w
eek)
**,
§§74
761
136
762
892
915
4611
9069
212
1720
7610
7910
4337
274
813
40
Oth
er d
estin
atio
ns
Fr
eque
ncy
(# tr
ips
to ‘
othe
r’/w
eek)
§§,
¥¥2.
21.
90.
81.
83.
02.
62.
70.
81.
93.
41.
61.
80.
31.
02.
3
T
ime
(min
/wee
k)72
.685
.821
.451
.593
.872
.278
.722
.045
.292
.862
.393
.28.
628
.872
.6
D
ista
nce
(km
/wee
k) *
18.3
20.5
4.8
12.8
23.4
21.8
26.6
6.3
13.3
26.3
18.5
29.8
2.4
7.9
20.0
D
ista
nce
(km
/trip
) **
,§§
4.3
3.4
2.4
3.6
5.0
5.6
7.3
2.4
3.5
5.8
6.3
7.3
2.3
3.9
6.9
Sp
eed
(km
/h)
**,§
§15
.34.
012
.315
.017
.417
.94.
415
.017
.620
.417
.34.
914
.217
.020
.0
E
E (
ME
T-m
in/w
eek)
**
377
427
111
260
481
488
626
148
283
556
439
698
7218
049
0
Abb
revi
atio
ns: %
, Per
cent
ile.
Not
e. S
igni
fican
t dif
fere
nce
betw
een
Bru
ssel
s an
d Fl
ande
rs: *
P <
.05;
**P
< .0
1. S
igni
fican
t dif
fere
nce
betw
een
Bru
ssel
s an
d W
allo
nia:
§P
< .0
5; §
§P <
.01.
Sig
nific
ant d
iffe
renc
e be
twee
n Fl
ande
rs a
nd W
allo
nia:
¥P
< .0
5;
¥¥P
< .0
1.
890 de Geus et al
confirms that men cycled significantly more (P < .01) in terms of traveled time and distance (P < .01) compared with women. Comparable results are found in other countries where cycling is not part of the everyday transport culture. For example in Canada18,30 and in the USA,31 women are only half as likely as men to cycle for transportation purposes. In countries where cycling is part of the transport culture, like in the Netherlands32 and Denmark,33 women cycle more than men. The Portland (Oregon) metropolitan area has the highest rate of women biking to work in the USA.34 Notably, Portland’s bicycle transportation system is recognized as being among the best large city system in North America.
Population-wide policy strategies should focus on encouraging women to use the bicycle as a transportation mode. These policy actions should contain ‘soft’ (communication/education) and ‘hard’ (enforcement/infrastructure) methods and should be used simulta-neously.35 The cycling behavior of women can be considered an indicator for bike-friendly cities or countries for several reasons. First, studies across disciplines as disparate as criminology and child rearing have shown that women are more averse to risk than men.29 Risk aversion translates into increased demand for safe bike infra-structure and bicycle friendly policies (eg, bicycle paths and lanes, traffic calming, incorporating greater cycling-awareness among motorists, for example, through motor vehicle license-testing) as a prerequisite for cycling. Women also do most of the child care and
household shopping, which means that bike routes need to be orga-nized around practical urban destinations. Consistent with gender differences in risk aversion, female commuter cyclists preferred to use routes with maximum separation from motorized traffic.29 Improved cycling infrastructure in the form of bicycle paths and lanes that provide a high degree of separation from motor traffic is likely to be important for increasing utilitarian cycling among under-represented population groups such as women.29 Mass-media promotion, both of cycling and also of mutual respect between cyclists and motorists should be financed by governmental bodies. Last but not least, road safety measures (eg, avoiding speeding and distracted driving) should be enforced by law and violations of traffic rules should be punished more effectively.
Bicycle Usage by Region
Significant regional differences exist in terms of bicycle use. In the Walloon region, participants cycle less frequently to work compared with the 2 other regions, mainly because of larger distances to work, absence of cycling infrastructures and because of important slopes.17 BCR has the lowest cycling speed, which is due to the highly urban-ized and dense built-up area, resulting in a high proximity and mix of activities17 making stops for traffic lights, intersections and other road users more frequent. In the Flemish region, participants cycled
Table 4 Explanatory Factors of Bicycle Usage During Trips to Work Assessed by Multivariate Regression Model
VariableParameter
estimate (𝛃)Standard error
(SE)Standardized estimate (𝛃) t-Value P
Intercept 5.81688 0.24420 0 23.82 <0.0001
Gender –0.39467 0.05972 –0.20753 –6.61 <0.0001
Age 0.00897 0.00278 0.10163 3.23 0.0013
BMI 0.01696 0.00960 0.05683 1.77 0.0777
Health –0.26596 0.10135 –0.07902 –2.62 0.0088
Bicycle paths 0.08617 0.02890 0.10329 2.98 0.0030
Region home (BCR) –0.37031 0.06820 –0.19897 –5.43 <0.0001
Region home (Wallonia) –0.43615 0.08593 –0.17217 –5.08 <0.0001
Urbanization home 0.15122 0.02290 0.21259 6.60 <0.0001
Note. F = 38.41 (P < .0001); R2 = .2711; Adjusted R2 = .2641. Parameter estimates for model with bicycle paths and Urbanization = ordinal variables; Region home = nominal variable (with Flanders as reference level).
Abbreviations: B, Unstandardized coefficients; SE, standard errors of the unstandardized bi’s; β, standardized coefficients.
Table 5 Explanatory Factors of Bicycle Usage During Trips to ‘Other’ Destinations Assessed by Multivariate Regression Model
VariableParameter
estimate (𝛃)Standard error
(SE)Standardized estimate (𝛃) t-Value P
Intercept 4.86232 0.20125 0 24.16 <.0001
Gender –0.16373 0.08947 –0.06431 –1.83 0.0676
Age 0.01813 0.00434 0.15403 4.18 <.0001
Children 0.24230 0.08690 0.10262 2.79 0.0054
Region home (BCR) –0.20475 0.09114 –0.08248 –2.25 0.0249
Region home (Wallonia) –0.52698 0.12260 –0.15516 –4.30 <.0001
Note. F = 8.58 (P < .0001); R2 = .0508; Adjusted R2 = .0449. Parameter estimates for model with bicycle paths and Urbanization = ordinal variables; Region home = nominal variable (with Flanders as reference level).
Abbreviations: B, Unstandardized coefficients; SE, standard errors of the unstandardized bi’s; β, standardized coefficients.
Utilitarian Cycling in Belgium 891
a significantly greater time and distance (both per week and per single trip). Although no cause and effect relationship can be drown with these data, results from the General Questionnaire showed that there is a significant difference (Chi2 P < .001) between Flanders on the one hand and the BCR and Wallonia on the other hand when looking at the percentage of participants that indicated they have a bicycle path or lane near their home or workplace. Policy makers in BCR and Wallonia are therefore urged to providing more bicycle facilities, to increase the number of cyclists. As Vandenbulcke et al17 indicated in their policy recommendations, engineering can be very effective in increasing bicycle use and making it safer through better development, design and maintenance of cycling infrastruc-tures, especially in areas where it is currently lacking (Wallonia and BCR). Providing traffic-calming areas or safe crossings for cyclists, as well as implementing routes that reduce exposure to pollutants, are some examples of such measures.12,17
Explanatory Factors of Bicycle UsageIn this study, ‘Urbanization level of the place of residence’ was the strongest predictor of bicycle usage, indicating that living in an urban crown is more attractive to cycling in comparison with living in a city center. This can partly be explained by the fact that in large cities, walking is frequent due to the close proximity of different places/activities.17 Public transport is also well-developed (eg, dense network, high frequency, comfort) and hence competes strongly with cycling. In large cities such as Brussels, the distance between the place of residence (or work) and the closest public transport stop/station is generally short: approximately 96% of the inhabitants (and jobs) are located less than 500 m from the closest public transport stop.36 Opportunities to build separate paths are often limited in city centers due to space constraints and related costs.
Although we cannot deduce a cause and effect relationship, the results let us suggest that if more bicycle paths would be avail-able, more people would be tempted to use the bicycle as a mode of transport.37 Although the variance explained by ‘bicycle paths’ is relatively small, it does not mean that environmental variables (like bicycle paths) are of little importance. It is reasonable to suggest that in terms of promoting cycling, providing more bicycle paths is the most prudently modifiable factor of those investigated. Small changes in relevant environmental factors could influence daily PA patterns (and in particular cycling for transport) of large populations over long periods of time.38
When building new bicycle infrastructure, different aspects of the spatial design of networks should be taken into account. First, a network of different types of infrastructure appears necessary to encourage people to initiate cycling.37 Simply adding bike lanes to all new major roads is unlikely to achieve high rates of cycling. For people concerned with safety issues and avoiding traffic, a well-connected network of low-motorized traffic streets, including some ‘bicycle boulevards’ (roads dedicated exclusively to bicycle use), may be more effective than adding bike lanes on major streets with high volumes of motor vehicle traffic. Int Panis et al9 stress that from a health perspective, people should be encouraged to cycle in streets with as little motorized traffic as possible because air pollution from exhaust could reduce the positive health benefits of cycling. Second, direct routes for cyclists should be provided with as few stops (eg, traffic light) as possible.19
The correlates in our models only explain a limited proportion (26%) of the variance of the dependent variable. It remains likely that unmeasured psychosocial factors beyond the scope of this study may be more important in explaining cycling behavior.20,21 Previous research in Flanders, comparing regular commuter cyclists with
people who never cycle for transportation, showed that when people live in an environment with adequate bicycle infrastructure, indi-vidual determinants (psychosocial, self-efficacy, perceived benefits and barriers) outperform the role of environmental determinants.21 Cycling is only moderately associated with the neighborhood in King County, Washington (USA), where bicycle infrastructure is limited.20 Moudon et al16 concluded that in those conditions, cycling is an individual choice that is independent from environmental sup-port. Rietveld and Daniel15 showed that in the Netherlands, most of the intermunicipality variation in bicycle use is related to physical aspects such as altitude differences and city size, features of the population (share of youngsters) and differences in ethnic compo-sition. Psychosocial interventions will be effective in their ability to increase PA, but only applicable to a limited number of people.
For example the distance between the place of residence and work is one of the most important parameters for deciding whether to cycle.17,28 Meteorological conditions and topography are other examples that were not taken into account. Hilly cities will exhibit lower bicycle use.17,19
Bicycle Usage and Public HealthTo implement effective noncommunicable disease prevention programs, policy makers need data of physical activity levels and trends.39 As mentioned earlier, every adult should therefore accumulate 30 min of moderate-intensity PA 5 days/week or 20 min of vigorous-intensity PA on 3 days/week, or a combination of moderate- and vigorous-intensity activity.3 Converting this recom-mendation in terms of MET-min/week, all healthy adults should accumulate 450–750 MET-min/week to achieve substantial health benefits. Nevertheless, others have suggested that even half the recommended amount of physical activity (ie, 15 min per day or 90 min a week of moderate-intensity exercise) can provide significant health benefits.5 Specifically for women, Brown et al40 showed in their review protective benefits for cardiovascular disease and diabetes with PA of 240 MET-min/week. The frequency, cycling time per week and MET-min/week recorded in this study indicate that participants perform enough PA to comply with PA and public health guidelines to promote and maintain health (eg, ACSM,3 Brit-ish Association of Sport and Exercise Sciences4), and reduce the risk of chronic disease and premature death. The intensity of PA is also an important parameter of health benefits.41,42 The cycling speed, used in this study as a proxy for the intensity, was compa-rable with the cycling speed computed in a previous study.11 It was shown that the intensity of utilitarian cycling was high enough to meet the ACSM guidelines.3
For a better understanding of the hazards and links between health and cycling, exposure-based fatality rates are needed.13 Only when we understand the differences in how much people walk, cycle, or travel by car, and then express the risk of injury per unit of exposure, can we measure how safe these activities are and evaluate the specific policies that contribute to improve safety. Our data show that distance, frequency and cycling speed are different between the regions, indicating that even within one country, large differences in the incidence and risk of accidents exist. Indeed, as part of the SHAPES project, de Geus et al24 and Vandenbulcke et al17 recently showed that large differences in accident risks and the severity of the accident exist between the 3 Belgian regions and between the municipalities. Whereas the absolute number of accidents is higher in Flanders, the Brussels-capital region is the region with the highest Incidence Rate (#accidents/1000km cycled). Although the incidence rate is higher in the BCR, the probability to be seriously injured or to die while cycling is lower than in the other regions.
892 de Geus et al
In the study of Zuurbier et al,41 the mean cycling speed in the center of a medium-sized Dutch city (145,000 inhabitants) was 12 km/hr, compared with 15.8 km/hr in BCR in this study. As Zuurbier et al41 indicate, this mean cycling speed underestimates minute ventilation (inhaled volume of air) levels and consequently the inhaled dose of air pollutants during cycling. Substituting our more accurate estimates in their calculations may reveal that health impacts of exposure to air pollution are much higher than previ-ously estimated.
External Validity of Bicycle UsageThe SHAPES online registration system is a rich and detailed travel database and provides a lot of useful information. At the same time, it is likely to be prone to a number of errors and inconsistencies. To test the external validity of our data collection, studies investigating the validity of self-reported cycling characteristics were consulted and a comparison was made between our results and other data collections in Belgium and other commuter cycling studies.8,9 As the participants were free to start and stop their participation, not all participants filled out the TDs for 1 whole year. Seventy percent of the included participants filled out more than 3 TDs.
Witlox and Tindemans43 and Witlox44 indicate that commut-ers are capable of estimating their travel distance with reliable accuracy. The accuracy of self-reported distances is influenced by the sociodemographic profile of the participants, the characteris-tics of the trip, and the type of transport mode used.44 Witlox and Tindemans43 showed that the accuracy of estimating the distance traveled increases with the person’s income. In the same study, it was shown that executives and employees report better than retired or unemployed people but that gender does not have any influence on the accuracy of the estimate. It was found that self-reported distances for recurring, regular trips (such as trips to work) were more reliable than other trips, suggesting that repetitiveness of the trip positively influences distance knowledge.
When comparing the mean cycling characteristics from our study with other commuter cycling studies,8,9 the mean frequency, time and distance (km/trip and km/week) is slightly higher in this study. This could be explained by the fact that the study of de Geus et al8 and Hendriksen et al9 are intervention studies with untrained subjects who did not cycle to work before the start of the study.
Study LimitationsSome limitations of this study should be noted. Due to the nature of this study, the study population is self-selective and is composed of regular adult cyclists, which limits the generalizability of the find-ings. Therefore, the results of this study should be interpreted within the boundaries of its limits [eg, the results may not be (entirely) applicable to younger (< 18 years) and older adults (> 65 years) and people who cycle only occasionally or start cycling].
Passionate cyclists, who cycle a longer distance and time than occasional cyclists, seem to be more likely to participate. The requirement for e-mail and Internet access limits the applicability to some segments of the population. However, the Federal Public Service (FPS) Economy revealed that 73% of the households in Belgium had an access to internet in 2010.45 As discussed in the Study Population section, our sample includes a higher proportion of people with above-average income and education compared with the general Belgian population of commuter cyclists.16 Compared to the NIS16 and FPS46 data, the BCR is overrepresented and the participants in Flanders and Wallonia constitute an underrepresenta-tion (Supplementary file 2).
The calculated energy expenditure (EE) in this study should not be seen as absolute values but rather as an activity classification. The values do not take into account differences in body mass, adiposity, age, gender, efficiency of movement, geographic and environmental conditions in which the cycling was performed. Individual differ-ences in energy expenditure can be large and the true energy cost for a person may be under- or overestimated compared with the values used in this manuscript.
ConclusionsProspective collection of bicycle usage data is essential to improve estimations of the health impact of utilitarian cycling. The SHAPES online registration system was successful in registering bicycle usage data from regular commuter cyclists in Belgium. One thou-sand one hundred eighty-seven regular commuter cyclists filled out travel diaries covering an average of 387 data collection points per week over 1 year. Regular commuter cyclists commute on average 3.2 times per week to work. This means that they cycle on average 166 minutes per week, covering a distance of 9.04 km per trip. Men cycle for a longer duration (181 min/week and 138 min/week, respectively), over longer distances (61.6 km/week and 36.3 km/week, respectively) and at a higher speed (19.5 km/h and 15.5 km/h, respectively) compared with women. Higher ‘age’ and ‘good health’ were associated with more cycling. Large regional differ-ences are present, implying that policy toward cycling should be region specific. Stimulating measures should be specifically aimed at women as this group of commuter’s cycle significantly less than men. The results of the SMLR model indicate that bicycle usage is related to the ‘level of urbanization of the place of residence,’ ‘gender,’ and the ‘presence of bicycle paths.’
The results of this study provide an accurate estimate of some aspects of bicycle usage that are essential to estimate the health ben-efits and risks of utilitarian cycling among regular Belgian cyclists.
Acknowledgments
The work reported in this paper was partly financed by the Belgian science policy under the Science for Sustainable Development program (project n°: SD/HE/03) and the Flemish Institute for Technological Research (VITO, Belgium) coordinated research project. The authors wish to thank Dr. Ir Nico Smets for creating the online registration system as well as Eva von Rauch for her guidance in the statistics.
References 1. Haskell WL, Nelson ME. Physical Activity Guidelines Advisory
Committee. Physical Activity Guidelines Advisory Committee Report. Washington, DC: Department of Health and Human Services; 2008. Available at: www.health.gov/paguidelines. 2008.
2. Lee IM, Shiroma EJ, Lobelo F, Puska P, Blair SN, Katzmarzyk PT. Effect of physical inactivity on major non-communicable diseases worldwide: an analysis of burden of disease and life expectancy. Lancet. 2012;380(9838):219–229. PubMed doi:10.1016/S0140-6736(12)61031-9
3. Haskell WL, Lee IM, Pate RR, et al. Physical activity and public health. Med Sci Sports Exerc. 2007;39(8):1423–1434. PubMed doi:10.1249/mss.0b013e3180616b27
4. O’Donovan G, Blazevich AJ, Boreham C, et al. The ABC of physical activity for health: a consensus statement from the British Association of Sport and Exercise Sciences. J Sports Sci. 2010;28(6):573–591. PubMed doi:10.1080/02640411003671212
Utilitarian Cycling in Belgium 893
5. Wen CP, Wai JP, Tsai MK, et al. Minimum amount of physical activity for reduced mortality and extended life expectancy: a pro-spective cohort study. Lancet. 2011;378(9798):1244–1253. PubMed doi:10.1016/S0140-6736(11)60749-6
6. Oja P, Titze S, Bauman A, et al. Health benefits of cycling: a system-atic review. Scand J Med Sci Sports. 2011;21(4):496–509. PubMed doi:10.1111/j.1600-0838.2011.01299.x
7. Oja P, Vuori I, Paronen O. Daily walking and cycling to work: their utility as health-enhancing physical activity. Patient Educ Couns. 1998;33(1, Suppl):S87–S94. PubMed doi:10.1016/S0738-3991(98)00013-5
8. Hendriksen IJ, Zuiderveld B, Kemper HC, Bezemer PD. Effect of commuter cycling on physical performance of male and female employees. Med Sci Sports Exerc. 2000;32(2):504–510. PubMed doi:10.1097/00005768-200002000-00037
9. de Geus B, Joncheere J, Meeusen R. Commuter cycling: effect on physical performance in untrained men and women in Flanders: minimum dose to improve indexes of fitness. Scand J Med Sci Sports. 2009;19(2):179–187. PubMed doi:10.1111/j.1600-0838.2008.00776.x
10. de Geus B, Van Hoof E, Aerts I, Meeusen R. Cycling to work: influ-ence on indexes of health in untrained men and women in Flanders. Coronary heart disease and quality of life. Scand J Med Sci Sports. 2008;18(4):498–510. PubMed doi:10.1111/j.1600-0838.2007.00729.x
11. de Geus B, De Smet S, Nijs J, Meeusen R. Determining the intensity and energy expenditure during commuter cycling. Br J Sports Med. 2007;41(1):8–12. PubMed doi:10.1136/bjsm.2006.027615
12. Int Panis L, de Geus B, Vandenbulcke G, et al. Exposure to par-ticulate matter in traffic: a comparison of cyclists and car pas-sengers. Atmos Environ. 2010;44(19):2263–2270. doi:10.1016/j.atmosenv.2010.04.028
13. Christie N, Cairns S, Towner E, Ward H. How exposure information can enhance our understanding of child traffic “death leagues”. Inj Prev. 2007;13(2):125–129. PubMed doi:10.1136/ip.2006.011692
14. Jacobsen PL. Safety in numbers: more walkers and bicyclists, safer walking and bicycling. Inj Prev. 2003;9(3):205–209. PubMed doi:10.1136/ip.9.3.205
15. Stone M, Broughton J. Getting off your bike: cycling accidents in Great Britain in 1990–1999. Accid Anal Prev. 2003;35(4):549–556. PubMed doi:10.1016/S0001-4575(02)00032-5
16. National Institute for Statistics (NIS), Belgian Federal Science Policy Office. National house hold survey on mobility. Realization and results. Research contract MD/13/036. Brussels: FUNDP-GRT- LV-UIA-IW-INS; 2001.
17. Vandenbulcke G, Thomas I, de Geus B, et al. Mapping bicycle use and the risk of accidents for commuters who cycle to work in Belgium. Transp Policy. 2009;16(2):77–87. doi:10.1016/j.tranpol.2009.03.004
18. Winters M, Friesen MC, Koehoorn M, Teschke K. Utilitarian bicycling. a miltilevel analysis of climate and personal influences. Am J Prev Med. 2007;32(1):52–58. PubMed doi:10.1016/j.amepre.2006.08.027
19. Rietveld P, Daniel V. Determinants of bicycle use: do municipal poli-cies matter? Transp Res Part A Policy Pract. 2004;38(7):531–550. doi:10.1016/j.tra.2004.05.003
20. Moudon AV, Lee C, Cheadle AD, et al. Cycling and the built environ-ment, a US perspective. Transport Res D-Tr E. 2005;10(3):245–261. doi:10.1016/j.trd.2005.04.001
21. de Geus B, De Bourdeaudhuij I, Jannes C, Meeusen R. Psychosocial and environmental factors associated with cycling for transport among a working population. Health Educ Res. 2008;23(4):697–708. PubMed doi:10.1093/her/cym055
22. Vandenbulcke G, Dujardin C, Thomas I, de Geus B, Degraeuwe B, Meeusen R, et al. Cycle commuting in Belgium: Spatial determinants and ‘re-cycling’ strategies. Transport Res a-Pol. 2011;45(2):118-37.
23. Aertsens J, de Geus B, Vandenbulcke G, et al. Commuting by bike in Belgium, the costs of minor accidents. Accid Anal Prev. 2010;42(6):2149–2157. PubMed doi:10.1016/j.aap.2010.07.008
24. de Geus B, Vandenbulcke G, Int Panis L, et al. A prospective cohort study on minor accidents involving commuter cyclists in Bel-gium. Accid Anal Prev. 2012;45:683–693. PubMed doi:10.1016/j.aap.2011.09.045
25. Oja P. Dose response between total volume of physical activity and health and fitness. Med Sci Sports Exerc. 2001;33(6):S428–S37. PubMed doi:10.1097/00005768-200106001-00011
26. Ainsworth BE, Haskell WL, Whitt MC, et al. Compendium of physical activities: an update of activity codes and MET intensi-ties. Med Sci Sports Exerc. 2000;32(9, Suppl):S498–S504. PubMed doi:10.1097/00005768-200009001-00009
27. Giles-Corti B, Timperio A, Bull F, Pikora T. Understanding physi-cal activity environmental correlates: increased specificity for eco-logical models. Exerc Sport Sci Rev. 2005;33(4):175–181. PubMed doi:10.1097/00003677-200510000-00005
28. Dickinson J, Kingham S, Copsey S, Pearlman Hougie D. Employer travel plans, cycling and gender: will travel plan measures improve the outlook for cycling to work in the UK? Transp Res Part D Transp Environ. 2003;8(1):53–67. doi:10.1016/S1361-9209(02)00018-4
29. Garrard J, Rose G, Lo SK. Promoting transportation cycling for women: the role of bicycle infrastructure. Prev Med. 2008;46(1):55–59. PubMed doi:10.1016/j.ypmed.2007.07.010
30. Doherty ST, Aultman-Hall L, Swaynos J. Commuter cyclist accident patterns in Toronto and Ottawa. J Transp Eng. 2000;126(1):21–26. doi:10.1061/(ASCE)0733-947X(2000)126:1(21)
31. Pucher J, Renne JL. Socioeconomics of urban travel: evidence from the 2001 NHTS. Transp Q. 2003;57(3):49–77.
32. MON. Mobiliteitsonderzoek Nederland. Ministerie van Verkeer en Waterstaat; Rijkswaterstaat; Dienst Verkeer en Scheepvaart (2008-01-01; 2008-12-31). 2008.
33. DNTS. Danish National Travel Survey (TU200610v2) and DTU Transport.; 2010.
34. Hoffman MR, Lambert WE, Peck EG, Mayberry JC. Bicycle commuter injury prevention: it is time to focus on the environment. J Trauma Inj Infect Crit Care. 2010;69(5):1112–1119. PubMed doi:10.1097/TA.0b013e3181f990a1
35. Berg HY. Reducing crashes and injuries among young drivers: what kind of prevention should we be focusing on? Inj Prev. 2006;12(Suppl 1):i15–i18. PubMed doi:10.1136/ip.2006.012062
36. Vandenbulcke G, Steenberghen T, Thomas I. Accessibility indicators to places and transports: final report. Research Contract AP/10/02A. Belgian Science Policy and FPS Mobility and Transports, Brussels Available online at: http://www.mobilit.fgov.be/fr/index.htm. 2007.
37. Dill J. Bicycling for Transportation and Health: The Role of Infrastruc-ture. J Public Health Policy. 2009;30:S95–S110. PubMed doi:10.1057/jphp.2008.56
38. De Bourdeaudhuij I, Sallis JF, Saelens BE. Environmental correlates of physical activity in a sample of Belgian adults. Am J Health Promot. 2003;18(1):83–92. PubMed doi:10.4278/0890-1171-18.1.83
39. Hallal PC, Andersen LB, Bull FC, Guthold R, Haskell W, Ekelund U. Global physical activity levels: surveillance progress, pitfalls, and prospects. Lancet. 2012;380(9838):247–257. PubMed doi:10.1016/S0140-6736(12)60646-1
40. Brown WJ, Burton NW, Rowan PJ. Updating the evidence on physical activity and health in women. Am J Prev Med. 2007;33(5):404-11.e25.
41. Zuurbier M, Hoek G, Hazel P, Brunekreef B. Minute ventilation of cyclists, car and bus passengers: an experimental study. Environ Health. 2009;8(1):48. PubMed doi:10.1186/1476-069X-8-48

894 de Geus et al
42. de Hartog JJ, Boogaard H, Nijland H, Hoek G. Do the health benefits of cycling outweigh the risks? Environ Health Perspect. 2010;118(8):1109–1116. PubMed doi:10.1289/ehp.0901747
43. Witlox F, Tindemans H. Evaluating bicycle-car transport mode com-petitiveness in an urban environment. An activity-based approach. World Transp Policy Pract. 2004;10(4):32–42.
44. Witlox F. Evaluating the reliability of reported distance data in urban travel behaviour analysis. J Transp Geogr. 2007;15(3):172–183. doi:10.1016/j.jtrangeo.2006.02.012
45. Digital FPS. (r)evolution in Belgium—2010. Available online at: http://statbel.fgov.be/en/binaries/ict2010-en_tcm327-117754.pdf 2010.
46. FPS. Mobility and Transport Diagnistiek woon-ververkeer van 30 juni 2008. Available online at: http://www.mobilit.fgov.be/nl/mobil/mobaccn/diagnosn.htm.; 2010.
47. IRIS2. Mobiel Brussel-BUV van het Brussels Hoofdstedelijk Gewest, Camille Thiry, nov 2011.; 2011.


