Embed Size (px)
Citation preview

*Correspondence to: M. Cecconi, Dipartimento di Ingegneria Civile e Ambientale, Universita di Perugia, via G. Duranti,93, 06125 Perugia, Italy
�E-mail: [email protected]�Post-Doc Research FellowALecturer
Received 30 January 2001Copyright � 2001 John Wiley & Sons, Ltd. Revised 11 June 2001
INTERNATIONAL JOURNAL FOR NUMERICAL AND ANALYTICAL METHODS IN GEOMECHANICSInt. J. Numer. Anal. Meth. Geomech., 2001; 25:1525}1557 (DOI: 10.1002/nag.185)
Structural features and mechanical behaviour of apyroclastic weak rock
Manuela Cecconi��*���� and Giulia MB Viggiani��A
�Dipartimento di Ingegneria Civile e Ambientale, Universita% di Perugia, via G. Duranti, 93, 06125 Perugia, Italy�Universita di Roma Tor Vergata, Italy
SUMMARY
The results of an extensive programme of laboratory testing on intact and reconstituted samples ofa pyroclastic weak rock from the volcanic complex of the Colli Albani (Central Italy) are presented. Thedeposit is known asPozzolanaNera andmay be assimilated to a bonded coarse grainedmaterial. The natureof bonds and the micro-structural features were examined by means of di!ractometry, optical and electronmicroscopy. As bonds are made of the same constituents of grains and aggregates of grains, bonddeterioration and particles breakage upon loading are indistinguishable features of the mechanical behav-iour. The testing programme consisted mainly of one-dimensional and drained and undrained triaxialcompression tests in a wide range of con"ning pressures up to 58 MPa. As con"ning stress increases, themechanical behaviour of the material changes from brittle and dilatant to ductile and contractant; for bothbrittle and ductile behaviour failure is associated with the formation of shear surfaces separating the samplein several parts at the end of test. The experimental stress}dilatancy relationships are compared with theclassical stress}dilatancy theories for a purely frictional material and for a material with friction andcohesion between particles. The analysis of the data indicates that peak strength results from the interplaybetween degradation of inter-particle bonds, increasing friction between particles and increasing rate ofdilation. Copyright � 2001 John Wiley & Son, Ltd.
KEY WORDS: compressibility; fabric/structure of soils; laboratory tests; microscopy; shear strength; softrocks
INTRODUCTION
&Structured' hard soils and weak rocks are a broad class of natural materials resulting fromdi!erent geological processes, such as cementation, ageing, and overconsolidation, which increasethe sti!ness and the strength of the corresponding &de-structured' material [1], or from the

progressive physical and/or chemical degradation of a parent rock weakened by weathering ortemperature e!ects. For coarse-grained soils and weak rocks, structure is associated mainly tointer-particle bonding, which may be residual or connected to the precipitation of cementingagents.A common feature of all these materials is that their behaviour is sti! and brittle at low
con"ning pressures (rock-like) while it becomes softer and more ductile at higher con"ning stress(soil-like). The extent of the region of the stress space where the behaviour is rock-like is alwaysstress path dependent; however, for bonded granular soils, the size of the rock-like region ismainly controlled by the bond strength rather than by the initial voids ratio, stress state andhistory, as for sedimentary clays.The mechanical behaviour of structured hard soils and weak rocks has been extensively
investigated in the laboratory over the last decade [2}8]. In isotropic compression the response ofstructured soils is very sti! up to a well de"ned yield state at which large volume strains start tooccur [9]. Yield results from the degradation of inter-particle bonds and corresponds to the onsetof particle crushing, as suggested in Reference [10]. After yield, the state of the materialapproaches a unique normal compression line which results from gradual deterioration of bondsand increasing particle crushing [9,11]. In some cases, for relatively porous weak rocks,the breakage of bonds implies a sudden collapse of the soil skeleton at nearly constant e!ectivestress [5].The mechanical behaviour in triaxial compression depends strongly on the con"ning stress. At
low con"ning pressures the mechanical behaviour is brittle and dilatant; with increasing con"n-ing stress the behaviour becomes more ductile and contractant, although experimental resultsindicate that for many natural weak rocks there is a range of con"ning stress where a brittlestress}strain curve with a well de"ned peak of deviator stress is associated with contractantbehaviour [5,7]. Generally, when the behaviour is dilatant, results from natural and arti"ciallycemented soils show that the peak stress ratio does not correspond to the maximum rate ofdilation [12,13]. The hypothesis that inter-particle bonding contributes to the peak strengthof structured soils in addition to inter-particle friction and dilation is supported by classicexperimental results showing that the peak strength of arti"cially cemented sandsincreases with increasing percentage of cement [14]. Upon loading, bond degradationand particle breakage gradually occur; eventually the mechanical behaviour of the materialwill be controlled only by friction between particles and dilatancy due to fabric and particleinterlocking.Mathematical models of the behaviour of structured hard soils and weak rocks have been
proposed by many Authors, mainly in the class of elasto-plastic strain hardening models withisotropic or kinematic hardening [5,15}17], but also of damage mechanics [18}22]. In thiscontext, it is important that consistent sets of experimental observations should be madeavailable, making it possible to carry out quantitative comparisons of observed behaviour andmodel predictions.This paper presents the results of an extended experimental investigation of the structural
features and mechanical behaviour of a pyroclastic weak rock from the volcanic complex of theColli Albani, typical of the area south-east of Roma. The deposit is known locally as PozzolanaNera and can be assimilated to a bonded coarse grained material; based on its characteristic valueof uncon"ned compressive strength (�2 MPa) the material is at the transition between soils androcks. Despite its signi"cant occurrence in the subsoil of Rome, a systematic study of the physicaland mechanical properties of the Pozzolana Nera had not been undertaken until recently [23];
1526 MANUELA CECCONI AND GIULIA MB VIGGIANI
Copyright � 2001 John Wiley & Sons, Ltd. Int. J. Numer. Anal. Meth. Geomech., 2001; 25:1525}1557

the engineering interest in the behaviour of the Roman pozzolanas derives by the need to assessthe stability of sub-vertical cuts and underground cavities opened for exploitation.The geological origin and the main physical and micro-structural properties of the material are
described in detail in the paper. Some preliminary results of this research were presented inReference [24]; a much wider set of experimental results are examined here in terms of observedbehaviour in one-dimensional and isotropic compression and triaxial compression tests carriedout at con"ning stress up to 58 MPa on intact and reconstituted samples. The shear strength ofthe material is then discussed taking into account the state of the material and its structuralfeatures. The experimental results highlighted the in#uence of inter-particle bonds and theirprogressive degradation on the shear strength of the material; breakage of inter-particle bondsmainly reduces the cohesion intercept of the failure envelope, while dilation increases themobilised angle of friction, to a di!erent extent, depending on the strain level and the e!ectivecon"ning pressure.
GEOLOGY OF THE DEPOSIT
Pyroclastic deposits cover large areas of Central and Southern Italy for a total extent of8000}9000 km�. The main volcanic complexes in the area of Roma are the Monti Sabatini, 30 kmnorth-west, and the Colli Albani, about 25 km south-east of the city. The most intense explosiveactivity of the Colli Albani dates to the Upper-Middle Pleistocene.The majority of pyroclastic deposits south-east of Roma originate from pyroclastic #ows, i.e.
hot masses of rock fragments and gases moving rapidly along the ground surface in response togravity, deposited at high temperature [25]. Pyroclastic deposits contain crystals, glass shardsand pumices, and lithic fragments in highly variable proportions, depending on the type oferuption and the chemical composition of the magma.Pyroclastic deposits belonging to the Colli Albani consist mainly of di!erent layers of products
known as pozzolanas, each layer resulting from a single pyroclastic #ow. Individual layersgenerally lack internal strati"cation, although the superposition of a number of #ow units maygive the appearance of organised bedding. The typical subsoil pro"le from the south-east of Romais shown schematically in Figure 1; the thickness of each unit can vary from a few tens ofmillimetres to some tens of meters.Pozzolanas have been continuously exploited since Roman times to produce hydraulic mortars
and cement. The prolonged mining activities have resulted in a complex network of undergroundcavities; in some cases sudden collapses have occurred with the formation of sinkholes at thesurface [26]. Open quarries of pozzolanas are also frequent in the south east of Roma, withsub-vertical excavation fronts which can be as high as 20}25 m. The Pozzolana Nera, which wasselected for this experimental investigation, was extracted from the toe of a 23 m high vertical cutshown in the photograph in Figure 2, in a quarry located 10 km south of Roma.The Pozzolana Nera is a coarse grained pyroclastic deposit; the unit was formed during the
third cycle of the Tuscolano-Artemisio phase (from 600 000 to 360 000 years ago) when almost allvolcanic activity occurred. At the site the thickness of the Pozzolana Nera is about 10 m; thedegree of "ssuring of the rock mass is generally quite low, without any detectable families ofdiscontinuities. The deposit is above water table and therefore partially saturated in its naturalstate, with an average water content w
�of about 13$1.7 per cent, which corresponds to
a saturation degree S�of about 43.5$3.5 per cent.
THE MECHANICAL BEHAVIOUR OF A PYROCLASTIC WEAK ROCK 1527
Copyright � 2001 John Wiley & Sons, Ltd. Int. J. Numer. Anal. Meth. Geomech., 2001; 25:1525}1557

Figure 1. Typical subsoil pro"le of the Colli Albani.
The laboratory uncon"ned compression strength ranged from 1.3 to 2 MPa, depending onsample dimensions and saturation degree. According to the classi"cation proposed by theGeological Society of London [27] the material can be classi"ed as a weak rock.
MICROSTRUCTURAL FEATURES AND PHYSICAL PROPERTIES
Structural features, mineralogical composition and texture of the Pozzolana Nera were examinedby means of optical and electronic microscopy; X-ray di!raction was also used to identify soilminerals at the crystalline state.The Pozzolana Nera has a clastic texture, di!used in a black scoriaceous matrix containing
frequent crystals of leucite, piroxen, biotite as well as lithic fragments of lava. Figue 3 shows thematrix of the material in plane-polarized light. Crystals of leucite, recognizable from their straightedges, can reach dimensions of up to 1.5 mm side; voids appear as white areas with no de"nededges. It is generally very di$cult to discern grains from aggregates of grains; in some cases it ishard to identify individual particles at all; in thin section the material may look like a foam,probably due to the process of deposition. Pore space features such as size, shape, and orientationare very variable; the closed porosity is very small as con"rmed by measurements of speci"cgravity carried out using a helium picnometer on increasingly "ner powdered material [28].
1528 MANUELA CECCONI AND GIULIA MB VIGGIANI
Copyright � 2001 John Wiley & Sons, Ltd. Int. J. Numer. Anal. Meth. Geomech., 2001; 25:1525}1557

Figure 2. Sub-vertical cut in a quarry of Pozzolana; from the bottom up wards it is possible to recognise thelayers of Pozzolana Nera (:10 m), ¹ufo ¸ionato (:5 m), and Pozzolanella (:8 m).
Figure 4 shows the clastic texture of the Pozzolana Nera as observed by scanning electronmicroscopy on titanium-coated dried samples. The microstructure consists of sub-angular grainsof very variable size with a rough and pitted surface. Figures 5(a) and 5(b) show two examples ofcontacts between particles at a magni"cation factor of 1800�; in both cases, a physical bridge isobserved bonding the grains, which are evenly coated by microspherules with a minimumdiameter of about 0.5 �m.
THE MECHANICAL BEHAVIOUR OF A PYROCLASTIC WEAK ROCK 1529
Copyright � 2001 John Wiley & Sons, Ltd. Int. J. Numer. Anal. Meth. Geomech., 2001; 25:1525}1557

Figure 3. Thin section of Pozzolana Nera in plane-polarized light.
Figure 4. Scanning electron micrograph of Pozzolana Nera (200�).
1530 MANUELA CECCONI AND GIULIA MB VIGGIANI
Copyright � 2001 John Wiley & Sons, Ltd. Int. J. Numer. Anal. Meth. Geomech., 2001; 25:1525}1557

Figure 5. Scanning electron micrographs of Pozzolana Nera: (a) 72� and detail at 1800�;(b) 180� and detail at 1800�.
In order to identify the nature of bonding, chemical micro-analyses of selected areas of thesamples were performed in the electron microscope pointing at particles and bonds betweenparticles. No signi"cant di!erence in the mineralogical composition was revealed by the analyses,
THE MECHANICAL BEHAVIOUR OF A PYROCLASTIC WEAK ROCK 1531
Copyright � 2001 John Wiley & Sons, Ltd. Int. J. Numer. Anal. Meth. Geomech., 2001; 25:1525}1557

Figure 5. Continued
which indicates that deposition of cementing agents, such as calcite or silicates, did not occur; further-more, no secondary minerals such as zeolites, very common for pyroclastic soft rocks, were detected.Themainminerals at the crystalline state were identi"ed as Leucite,Magnetite, Augite andHalloysite.
1532 MANUELA CECCONI AND GIULIA MB VIGGIANI
Copyright � 2001 John Wiley & Sons, Ltd. Int. J. Numer. Anal. Meth. Geomech., 2001; 25:1525}1557

Table I. Average physical properties of the Pozzolana Nera.
w�
G�
� ��
n S�(%) (kN/m�) (kN/m�) (%)
13$1.7 2.69 16.46$0.06 14.64$0.03 0.45$0.01 43.5$3.5
Intrinsic inter-particle bonds are probably due to the original material continuity partially stillvisible in the foam microstructure revealed by thin sections. Hence bonding is connected to themechanism of deposition, but is not associated to diagenetic factors.At the scale of the laboratory sample the material is quite heterogeneous. Values of average
physical properties are summarized in Table I. Values of voids ratio and inter-particle porositywere determined by conventional methods and mercury porosimetry; they are rather low, ifcompared with other pyroclastic soils and weak rocks [7, 29].The grain size distribution depends strongly on the techniques adopted to separate larger
aggregates before sieving and on the methods and time employed for sieving e.g. Reference [30].In this case the grain size distribution was determined by dry sieve analysis; the sieving time didnot a!ect the results. Before sieving, the material was broken by hand while immersed in waterwith a detergent additive to allow separation of small aggregates, and then oven-dried at 1053C.The Pozzolana Nera is well graded and can be classi"ed as a gravel with sand with a coe$cient ofuniformity ;"33.6, D
��"0.12 mm, and D
��"2.5 mm.
APPARATUS AND EXPERIMENTAL PROGRAMME
The experimental work consisted mainly of one-dimensional compression tests and triaxialcompression tests on intact and reconstituted samples. One-dimensional compression tests werecarried out in an oedometer cell with reduced cross-section (35.7 mm dia.) which made it possibleto achieve a maximum vertical stress of 12.8 MPa.The majority of triaxial tests were performed in conventional triaxial cells modi"ed to allow
computer control of axial and radial stress reaching a maximum cell pressure of 3.2 MPa;a smaller number of tests were carried out in hydraulic stress-path computer controlled cells [31].Three special tests were carried out in high pressure triaxial systems reaching con"ning pressuresof 10, 14 and 70 MPa respectively [32, 6, 33]. Table II lists the triaxial tests which are discussed inthe present paper.Axial and volume strains were measured using external displacement transducers and a volume
gauge; in a limited number of tests a pair of miniature LVDTS were mounted directly on the centrelength of the sample to measure axial strains locally [34]. A radial strain belt was used in testscarried out on large samples (100 mm dia.) to measure radial strains.Intact samples of Pozzolana Nera for laboratory testing were obtained by rotary coring
partially saturated natural blocks [35]. Before coring, the blocks were immersed in water, whichincreased the saturation degree up to S
��0.7, and then frozen at !203C; the ends were then
squared on a band-saw up to a tolerance of 0.2 mm which, considering the grain size distributionof the material, is the smallest achievable.Prior to testing, the samples were thawed at room temperature and mounted on the base
pedestal of the cell; the samples were saturated in the triaxial cell under a back pressure of
THE MECHANICAL BEHAVIOUR OF A PYROCLASTIC WEAK ROCK 1533
Copyright � 2001 John Wiley & Sons, Ltd. Int. J. Numer. Anal. Meth. Geomech., 2001; 25:1525}1557
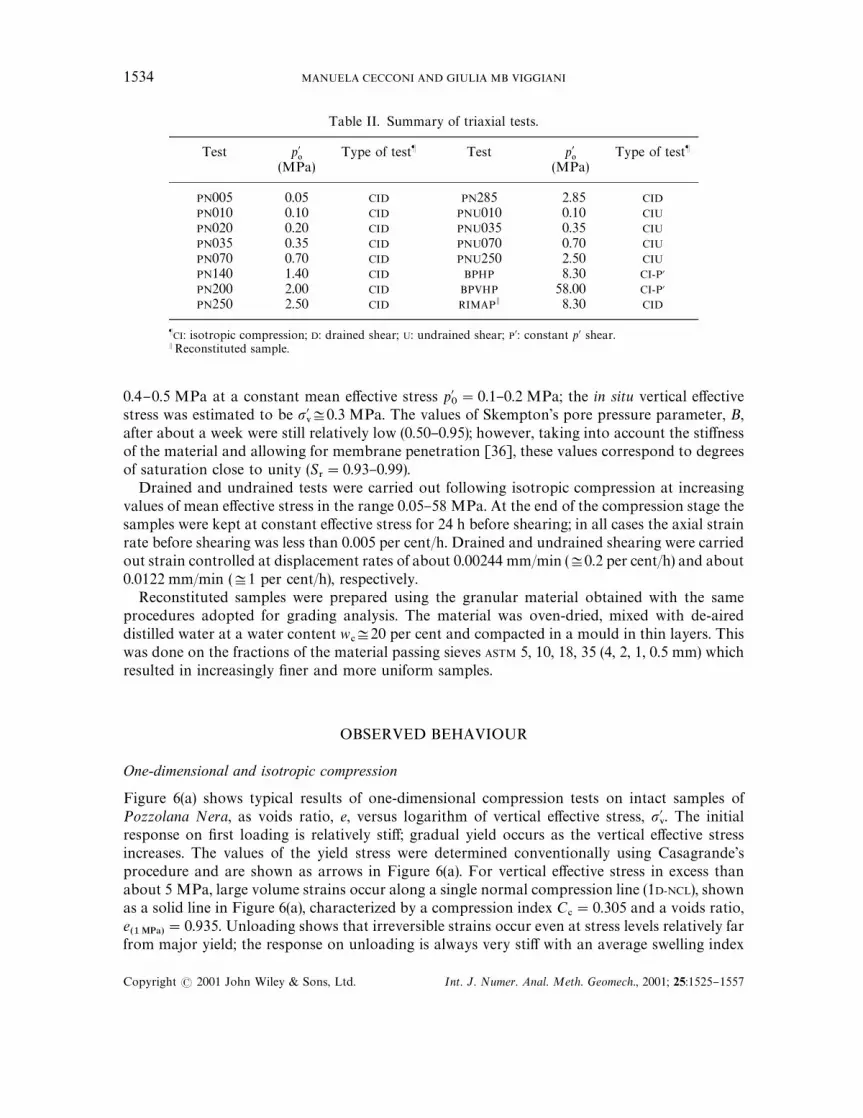
Table II. Summary of triaxial tests.
Test p��
Type of testB Test p��
Type of testB
(MPa) (MPa)
PN005 0.05 CID PN285 2.85 CID
PN010 0.10 CID PNU010 0.10 CIU
PN020 0.20 CID PNU035 0.35 CIU
PN035 0.35 CID PNU070 0.70 CIU
PN070 0.70 CID PNU250 2.50 CIU
PN140 1.40 CID BPHP 8.30 CI-P�PN200 2.00 CID BPVHP 58.00 CI-P�PN250 2.50 CID RIMAP� 8.30 CID
BCI: isotropic compression; D: drained shear; U: undrained shear; P�: constant p� shear.�Reconstituted sample.
0.4}0.5 MPa at a constant mean e!ective stress p��"0.1}0.2 MPa; the in situ vertical e!ective
stress was estimated to be ����0.3 MPa. The values of Skempton's pore pressure parameter, B,
after about a week were still relatively low (0.50}0.95); however, taking into account the sti!nessof the material and allowing for membrane penetration [36], these values correspond to degreesof saturation close to unity (S
�"0.93}0.99).
Drained and undrained tests were carried out following isotropic compression at increasingvalues of mean e!ective stress in the range 0.05}58 MPa. At the end of the compression stage thesamples were kept at constant e!ective stress for 24 h before shearing; in all cases the axial strainrate before shearing was less than 0.005 per cent/h. Drained and undrained shearing were carriedout strain controlled at displacement rates of about 0.00244 mm/min (�0.2 per cent/h) and about0.0122 mm/min (�1 per cent/h), respectively.Reconstituted samples were prepared using the granular material obtained with the same
procedures adopted for grading analysis. The material was oven-dried, mixed with de-aireddistilled water at a water content w
��20 per cent and compacted in a mould in thin layers. This
was done on the fractions of the material passing sieves ASTM 5, 10, 18, 35 (4, 2, 1, 0.5 mm) whichresulted in increasingly "ner and more uniform samples.
OBSERVED BEHAVIOUR
One-dimensional and isotropic compression
Figure 6(a) shows typical results of one-dimensional compression tests on intact samples ofPozzolana Nera, as voids ratio, e, versus logarithm of vertical e!ective stress, ��
�. The initial
response on "rst loading is relatively sti!; gradual yield occurs as the vertical e!ective stressincreases. The values of the yield stress were determined conventionally using Casagrande'sprocedure and are shown as arrows in Figure 6(a). For vertical e!ective stress in excess thanabout 5 MPa, large volume strains occur along a single normal compression line (1D-NCL), shownas a solid line in Figure 6(a), characterized by a compression index C
�"0.305 and a voids ratio,
e���
"0.935. Unloading shows that irreversible strains occur even at stress levels relatively farfrom major yield; the response on unloading is always very sti! with an average swelling index
1534 MANUELA CECCONI AND GIULIA MB VIGGIANI
Copyright � 2001 John Wiley & Sons, Ltd. Int. J. Numer. Anal. Meth. Geomech., 2001; 25:1525}1557

Figure 6. Results from one-dimensional compression tests on (a) intact, (b) intact with higher initialvoids ratio, and (c) intact atypical samples.
C�"0.0075. Yield on reloading occurs gradually as the state of the material approaches again the
1D-NCL.A smaller number of intact samples have an initial voids ratio which is above the range de"ned
by most samples (Figure 6(b)). Their behaviour on "rst loading is less sti! than that of most intactsamples, while the state of the material goes beyond the 1D-NCL de"ned in Figure 6(a) and seems toconverge towards it at ��
�:27 MPa. For all intact samples the average yield stress is
���
"3.95$0.67 MPa. The chain-dotted straight line in Figure 6(b) is an envelope to thecompressibility curves, characterized by a slope C*
�"0.425. Figure 6(c) shows two atypical test
results. The response of the material on "rst loading is very sti! in a wider range of stresses���"0.05}4 MPa. As in the previous case, the "rst loading compressibility curves go beyond the
1D-NCL de"ned by the majority of intact samples.
THE MECHANICAL BEHAVIOUR OF A PYROCLASTIC WEAK ROCK 1535
Copyright � 2001 John Wiley & Sons, Ltd. Int. J. Numer. Anal. Meth. Geomech., 2001; 25:1525}1557

Figure 7. Results from one-dimensional compression tests on reconstituted samples at di!erentinitial voids ratios.
The results of "ve tests on reconstituted samples are given in Figure 7. Four of the samples wereprepared following the procedures described in the previous section (full squares); these sampleswere partially saturated at the beginning of the test (S
�"0.5}0.6) and reached saturation during
one-dimensional compression. The open squares refer to the results of one test on a reconstitutedsample obtained after consolidation of the "nest fraction (0.25 mm) in a consolidometer, undera nominal maximum vertical stress of 0.1 MPa; due to the reconstitution procedure this samplewas saturated from the beginning of the test. The smallest initial voids ratio achievable bycompaction in the mould was always larger than the range of values measured for intact samples.The behaviour of reconstituted samples on "rst loading is less sti! than that of intact samples.After yield, due to the initially high voids ratio, large volume strains are observed. Due to theinitial full saturation of the material, the behaviour on loading of the sample prepared in theconsolidometer (e
�"0.849) is signi"cantly less sti! than any other intact or reconstituted
samples. For vertical e!ective stress in excess of about 5 MPa, this sample de"nes a normalcompression line which is parallel to the 1D-NCL de"ned by intact samples, although at lowervoids ratios (e
���"0.857).
1536 MANUELA CECCONI AND GIULIA MB VIGGIANI
Copyright � 2001 John Wiley & Sons, Ltd. Int. J. Numer. Anal. Meth. Geomech., 2001; 25:1525}1557

Figure 8. Results from high pressure isotropic compression tests on one intact and onereconstituted sample.
Data from isotropic compression tests performed on a reconstituted and an intact sample (seeTable II) are shown in Figure 8 as speci"c volume, v, versus logarithm of mean e!ective stress, p�.The pattern of results is consistent with that obtained from one-dimensional compression tests.At large stress the compressibility of both samples is described by a unique straight linecharacterized, as for one-dimensional compression, by a slope C*
�"0.425.
The data presented above show that the initial porosity is the main factor controlling thecompressibility of the Pozzolana Nera. As shown in Figure 9, C
�increases approximately linearly
with the initial voids ratio, e�, as for other natural soils and weak rocks [37]. The data from
samples reconstituted by compaction in the mould indicate a reduction of yield stress with initialvoids ratio (Figure 10), as observed in isotropic compression on arti"cially cemented soils [13],volcanic weak rocks [7], and cemented carbonate sands [9, 4]. On the other hand, the verticale!ective stress at yield for intact samples and for sample RIMED 1 does not show a clear trend withthe initial voids ratio (Figure 10).Gradual yield and normal compression of the intact material result from progressive breakage
of inter-particle bonds and/or grains and aggregates of grains, as bonds and grains are made ofthe same material. The main e!ect of the technique used to reconstitute the samples is that ofgiving an open structure to the material with a higher initial porosity than the intact samples.A consistent increase in compressibility with initial voids ratio has been observed for intact andreconstituted samples, although before yield intact samples are always sti!er than reconstitutedones.
THE MECHANICAL BEHAVIOUR OF A PYROCLASTIC WEAK ROCK 1537
Copyright � 2001 John Wiley & Sons, Ltd. Int. J. Numer. Anal. Meth. Geomech., 2001; 25:1525}1557

Figure 9. E!ect of initial voids ratio on compressibility.
Figure 10. E!ect of initial voids ratio on vertical yield stress.
1538 MANUELA CECCONI AND GIULIA MB VIGGIANI
Copyright � 2001 John Wiley & Sons, Ltd. Int. J. Numer. Anal. Meth. Geomech., 2001; 25:1525}1557

Figure 11. Drained triaxial compression tests on intact samples at low and intermediate con"ning pressures:(a) q vs �
�; (b) �
�vs. �
�.
Stress-strain behaviour in triaxial compression
Typical stress}strain curves from conventional drained triaxial compression tests on intactsamples at con"ning pressures in the range 0.05(p�
�(2.85 MPa are shown in Figure 11(a) in
terms of deviator stress, q, versus shear strain, ��; the corresponding curves of volume strain, �
�,
versus shear strain, ��, are shown in Figure 11(b). The initial speci"c volume of all triaxial samples
THE MECHANICAL BEHAVIOUR OF A PYROCLASTIC WEAK ROCK 1539
Copyright � 2001 John Wiley & Sons, Ltd. Int. J. Numer. Anal. Meth. Geomech., 2001; 25:1525}1557

Figure 12. Drained triaxial compression tests on intact samples: � vs ��.
was in the range v�"1.75}1.89. The maximum mean e!ective stress attained in the compression
stage was not su$cient to cause major yield; before yield the behaviour of the material inisotropic compression is very sti!, so that at the start of shearing the speci"c volume was close tothe initial value.At low con"ning pressures (0.05(p�
�(0.70 MPa) the behaviour is brittle with the deviator
stress increasing roughly linearly up to a sharp, well de"ned peak which is attained at shearstrains in the range 0.4}1.2 per cent; the average initial sti!ness, �q/��
�, over a range of shear
strains 0.1(��(0.25 per cent does not signi"cantly depend on the applied con"ning pressure.
After a small initial compression, the behaviour is dilatant throughout the test. The maximumrate of dilation decreases with increasing con"ning pressure; the peak deviator stress occursbefore the maximum rate of dilation, as observed for other soft rocks such as tu!s [2,7],calcarenites [4], porous limestones [12], and arti"cially cemented soils [13]. Peaks are followedby a rapid decrease of the deviator stress towards an ultimate state where the rate of dilation iszero. At the end of the test, well de"ned shear surfaces were observed which separated the samplein two or more nearly rigid bodies.At larger con"ning pressures (1.40(p�
�(2.85 MPa) the stress}strain behaviour is ductile and
the samples compress throughout the test. The stress}strain curves are initially roughly linear upto a relatively well de"ned yield point, with an abrupt change of slope which occurs at shearstrains similar to those corresponding to the peaks at lower pressures. The extent of the nearlylinear portion of the curves decreases with increasing con"ning pressure, making it more di$cultto de"ne the yield point. After yield, the deviator stress increases to reach a gentle peak at shear
1540 MANUELA CECCONI AND GIULIA MB VIGGIANI
Copyright � 2001 John Wiley & Sons, Ltd. Int. J. Numer. Anal. Meth. Geomech., 2001; 25:1525}1557

Figure 13. Thin section of intact sample after shearing at constant p�"8.3 MPa.
strains of about 7}13 per cent; the strain-softening behaviour is accompanied by positive volumestrains. On removal of the membrane, the samples separated in several parts.In Figure 12 the data are plotted in terms of stress ratio, �"q/p�, versus shear strain, �
�. From
the tests at low con"ning pressures (0.05(p��(0.70 MPa) it is not possible to identify a well
de"ned value of mobilized stress ratio at the end of the test, �"M; in some cases, towards the endof the test, the stress ratio increased as shearing progressed. For these samples, however, thebehaviour was associated with the formation of well de"ned slip surfaces; therefore, at largerstrains, stress}strain data cannot be directly computed from applied forces and displacementsmeasured at the boundary of the sample. Also, once the slip surface has formed, signi"cantexperimental errors in the measurement of the axial force may be introduced by increasedmembrane restraint and shaft friction on the axial ram. To a lesser extent, the same e!ects mayin#uence the interpretation of the tests carried out at higher con"ning pressures(p�
�"1.40}2.85 MPa) for which the strain-softening portion of the stress}strain curves must be
regarded with caution. At these pressures, however, the samples mobilize a relatively well de"nedvalue of the stress ratio M�1.6, corresponding to a value ��
��"393.
Figure 12 also shows the curves obtained from two tests carried out at constant mean e!ectivestress p�
�"8.30 and 58 MPa. The observed behaviour is consistent with that resulting from tests
performed at relatively large con"ning pressures. Sample BPHP failed in a ductile manner althoughat the end of the test an intense state of fracturing was observed. Figure 13 shows a thin section of
THE MECHANICAL BEHAVIOUR OF A PYROCLASTIC WEAK ROCK 1541
Copyright � 2001 John Wiley & Sons, Ltd. Int. J. Numer. Anal. Meth. Geomech., 2001; 25:1525}1557

Figure 14. Triaxial compression tests on intact samples at low and intermediate con"ning pressures:peak and end-of-test stress states.
the sample after shearing with a fracture following the edges of one of the crystals scattered in therock matrix; the presence of crystals in the intact material which are out of the axis of symmetry ofthe sample localizes strains [38]. For test BPVHP the behaviour is non-linear from the very start ofthe shearing stage, due to major yield having occurred in the previous isotropic compressionstage (see Figure 8). For this test the stress}strain curve still shows a gentle peak at shear strains ofabout 16 per cent, which is likely to correspond to the activation of a failure surface, clearly visibleon removal of the membrane at the end of the test. A slight tendency of M to decrease withincreasing con"ning pressure may be observed.The stress ratio mobilized at the end of the four undrained triaxial compression tests on
isotropically consolidated samples tends towards the same value, �"M"1.6, which was alsode"ned by drained tests at relatively large con"ning pressures. For all undrained tests thebehaviour of the soil skeleton is initially contractant with positive excess pore water pressures; themaximum value of �u corresponds to yield at maximum stress ratio. After yield a decrease in porewater pressures is observed corresponding to a tendency of the soil skeleton to dilate.
STRUCTURE AND DILATANCY
Strength and state
The shear strength of the Pozzolana Nera was examined in terms of stress parameters q, p�.Figure 14 shows the stress states at peak deviator stress and at the end of the test for intact
1542 MANUELA CECCONI AND GIULIA MB VIGGIANI
Copyright � 2001 John Wiley & Sons, Ltd. Int. J. Numer. Anal. Meth. Geomech., 2001; 25:1525}1557

Figure 15. Paths followed during shear and end-of-test states for all intact samples.
samples tested at low and intermediate con"ning pressures; the e!ective stress paths of theundrained tests are also shown in the same "gure. Open and full symbols identify peak andultimate states, respectively; circles refer to drained tests while squares refer to undrained tests.The dilatant behaviour observed in the undrained tests results in the e!ective stress pathstravelling to the right before the peak strength is attained.The peak strength points are "tted using a second order polynomial function, shown as
a dashed line. The tangent to the curve at p�"0 yields a cohesion intercept c��"0.3 MPa and
a peak friction angle ���"453. The end-of-test stress states fall closely around a straight line
through the origin characterized by a slope M"1.6.Figure 15 shows the state paths followed during shear and the end-of-test states in a v-ln p� plot
for all intact samples and for one reconstituted sample (RIMAP) tested at high con"ning pressure.The end-of-test points fall along a line which curves abruptly at a mean e!ective stress of about3 MPa; beyond this value of stress the state points describe a straight line, with a slope "0.132.A bi-linear or curved critical state line has been observed for a variety of sands [39}42], andjusti"ed with grain crushing occurring during shear at high e!ective stress, the change of slope inthe critical state line re#ecting changes in gradation and grain shape which occur during shear.Some evidence of grain crushing was found examining the grain size distribution curves ofsamples before and after shearing at increasing con"ning pressures, as shown in Figure 16.For the Pozzolana Nera the end-of-test conditions for dilatant samples may not be representa-
tive of a true critical state. At low con"ning pressures, strain localization inhibits dilation in thesample, so that critical state is only attained in a relatively narrow shear band where most
THE MECHANICAL BEHAVIOUR OF A PYROCLASTIC WEAK ROCK 1543
Copyright � 2001 John Wiley & Sons, Ltd. Int. J. Numer. Anal. Meth. Geomech., 2001; 25:1525}1557

Figure 16. Grain size distribution curves before and after shear.
Figure 17. Normalized stress paths for some drained and undrained triaxial tests on intact samples.
rearranging and crushing of grains, aggregates of grains and inter-particle bonds occur. Voidsratios are calculated from volume changes measured at the boundary and referred to the wholesample and the volume strains occurring within the shear band are grossly underestimated [38].The arrows in Figure 15 indicate the likely direction of state change for dilatant samples,although with the available information it is not possible to quantify the amount by which the
1544 MANUELA CECCONI AND GIULIA MB VIGGIANI
Copyright � 2001 John Wiley & Sons, Ltd. Int. J. Numer. Anal. Meth. Geomech., 2001; 25:1525}1557

Figure 18. E!ect of initial state on mobilized peak strength.
end-of-test state points should move upwards. In fact, according to Reference [43] the reportedcurvature of the critical state line of sands results from either incomplete testing, as for soil statesthat are dry of critical the dilation required to reach a true critical state may be incompatible withthe apparatus, or from localization of strains at low con"ning pressures.In the following, data are normalized with respect to the critical state line de"ned by the
end-of-test points of contractant samples, characterized by "1.88 and "0.132, and shown asa solid line in Figure 15. With this choice of critical state line the ratio p�
�/p�
��is constant and equal
to 2.18 which is close to that predicted by classic elasto-plastic models for soils [44,45]; Coop [46]reported much larger spacing of the NCL and CSL for sands with values of p�
�/p�
��typically being
around 4. Figure 17 shows the normalized stress paths for some drained and undrained triaxialtests on intact samples; the critical state is identi"ed by the crossed circle (M"1.6, p�/p�
��"1).
The end-of-test points for dilatant samples fall along a line atM"1.6, although they fail to reachp�/p�
��"1 for the reasons outlined above, while the normalized stress paths of the two tests
sheared at constant p� at high pressures do not reach the same value of M at critical state.Consistently with data for carbonate sands [11, 10] the critical state or end-of-test points do notcorrespond to the apex of the normalized stress paths.Peak strength data were also normalized using the state parameter � [47] which accounts for
the voids ratio and stress level at the start of shearing relative to the critical state line, as de"ned inFigure 15. Samples characterized by negative values of � dilate during shear, while samples withpositive values of � compress. Figure 18 shows the peak friction angle measured in each test, ��
�,
versus the state parameter,�, together with a set of data for di!erent sands [47];���in this context
refers to the angle of shearing obtained from the mobilized stress ratio at peak assin��
�"3�
�/(6#�
�). Although the peak friction angles obtained for intact Pozzolana Nera are
systematically higher than those reported in Reference [47] a similar decreasing trend of ���with
� can be observed in Figure 18.
THE MECHANICAL BEHAVIOUR OF A PYROCLASTIC WEAK ROCK 1545
Copyright � 2001 John Wiley & Sons, Ltd. Int. J. Numer. Anal. Meth. Geomech., 2001; 25:1525}1557

Stress}dilatancy
Following Rowe [48], for all drained and undrained triaxial tests the relationship betweenmobilized stress ratio, R"��
/��
�, and dilatancy, D"1#d, was examined, where
d"!
����
���
(1)
is the plastic strain increment ratio. Negative increments of plastic volume strain (plastic dilation)correspond to D'1 and positive increments of plastic volume strain (plastic contraction)correspond to D(1; at critical state (���
�/���
"0) D"1.
In Rowe's original formulation all strains are essentially plastic, or irrecoverable, as they resultfrom slip at the contacts of rigid particles. In the following, increments of plastic volume and axialstrain were calculated as
����"��
�!���
�"��
�!
��p�vp�
(2)
���"��
!���
"��
(3)
The elastic axial strains, neglected in the analysis, are likely to be most signi"cant at thebeginning of the shearing stage, which may a!ect the initial portion of the stress}dilatancyrelationship. Equation (2) simpli"es for the case of undrained tests, in which ��
�"0 and the voids
ratio remains constant during the test.Based on the study of the energy ratio at point contacts of regular packings, Rowe [48]
suggested that for a purely frictional granular material, the stress ratio, R, which represents themobilized strength, is proportional to the dilatancy,D, through a coe$cient which depends solelyon the angle of friction between particles, �
:
R
D"K"tan� �
4#
� 2 � (4)
The smallest value for � is the angle of inter-particle friction on sliding, ��, which depends on the
mineralogy, shape and roughness of the surface of the particles; the largest possible value of � is
the angle of shear strength at large strains, ����, when the assembly of particles is being continually
remoulded and rearranged at constant volume. During shear the inter-particle angle of frictionincreases monotonically from its minimum to its maximum value [49]. Therefore Rowe'sstress}dilatancy theory predicts that the ratioR/D during the test is always less than its "nal valuewhich is attained at large shear strains when the particles are continuously rearranging atconstant volume and constant stress (critical state).Many Authors have used Rowe's stress}dilatancy theory to interpret the mechanical behaviour
of natural sti! clays [51,52], coarse grained weak rocks [2] and very dense gravel [53] in anattempt to identify the contributions to strength due to friction and dilatancy and those due tomicrostructure and interparticle bonding.
1546 MANUELA CECCONI AND GIULIA MB VIGGIANI
Copyright � 2001 John Wiley & Sons, Ltd. Int. J. Numer. Anal. Meth. Geomech., 2001; 25:1525}1557

Figure 19. Typical stress}dilatancy relationships for drained triaxial compression tests on intactsamples at low con"ning pressures.
Figure 19 shows two typical stress}dilatancy relationships for drained triaxial tests carried outat low con"ning pressures (p�
�"0.05}0.70 MPa). The small contractant volume strains at the
beginning of shear are re#ected by values of D(1; at a very early stage of the test, however, thevolume strain increments become negative, as the soil dilates towards its ultimate state. Asshearing progresses, the stress}dilatancy paths are followed clockwise. Three characteristic pointshave been marked on each stress}dilatancy curve in Figure 19. The "rst corresponds to the pointin the test where the ratio R/D attains its maximum value; as shearing progresses, the stress ratio,or mobilized strength, increases and reaches its maximum value, R
��. The third characteristic
point corresponds to the maximum dilatancy, D��
. Figure 20 shows two typical stress}dilatancyrelationships obtained at larger con"ning pressures (p�
�"1.4}2.85 MPa); the same characteristic
points as in Figure 19 are marked on the stress-dilatancy curves in Figure 20; at these con"ningpressures the behaviour is contractant and the maximum dilatancy is reached at the end of test(D
���1). The values of shear strain corresponding to (R/D)
��, R
��and D
��for all drained
compression tests are given in Table III.For both dilatant and contractant behaviour, the ratio R/D"K increases and then decreases
as shearing progresses, attaining values in excess than K(����) and the peak state (q
��"R
��) is
always reached at shear strains smaller than those corresponding to the maximum dilatancy (seeTable III).Figure 21 shows the stress}dilatancy relationships proposed by Rowe [48] for dilatant and
contractant behaviour together with the experimental data; in the same "gure thestress}dilatancy relationships predicted by two classic isotropic hardening elasto-plastic modelsfor soils, namely Cam Clay [44] and Modi"ed Cam Clay [45], are also reported for comparison.The theoretical relationships have been drawn assuming ��"103, ��
��"393 andM"1.6. None
THE MECHANICAL BEHAVIOUR OF A PYROCLASTIC WEAK ROCK 1547
Copyright � 2001 John Wiley & Sons, Ltd. Int. J. Numer. Anal. Meth. Geomech., 2001; 25:1525}1557

Figure 20. Typical stress}dilatancy relationships for drained triaxial compression tests on intactsamples at intermediate con"ning pressures.
Table III. Shear strains at characteristic states.
Test p��(MPa) �
� ����(%) �
� ����(%) �
� ����(%) �
� ������(%)
PN005 0.05 0.393 0.793 0.393 0.266PN010 0.10 0.386 0.689 0.386 0.126PN020 0.20 0.632 2.608 0.632 0.278PN035 0.35 1.261 5.423 1.261 0.494PN070 0.70 0.736 1.689 0.736 0.504PN140 1.40 8.040 11.16 8.040 0.703PN200 2.00 7.007 9.825 7.007 1.413PN250 2.50 9.390 13.170 9.390 3.086PN285 2.85 13.132 15.830 13.132 1.530BPIII1 0.20 3.600 5.711 3.600 0.520BPIII2 0.20 0.574 4.818 0.574 0.742BPIII3 0.20 0.934 2.478 0.934 0.348BPX1 0.10 0.971 3.115 0.971 0.338BPHP 8.30 14.717 35.270 14.717 1.024BPVHP 58.00 16.302 26.287 16.302 6.762PNU010 0.10 3.786 0.197 0.454 0.477PNU035 0.35 8.446 1.167 0.485 0.562PNU070 0.70 4.060 0.854 0.568 0.607PNU250 2.50 7.710 2.162 1.717 1.050
of these models are able to reproduce the experimental data; although the Cam Clay andmodi"ed Cam Clay #ow rules can predict values ofK during the test greater than the "nal value,the maximum value of R is always attained at the maximum dilatancy, and no peak stress ratiocan be predicted for contractant behaviour (D(1).
1548 MANUELA CECCONI AND GIULIA MB VIGGIANI
Copyright � 2001 John Wiley & Sons, Ltd. Int. J. Numer. Anal. Meth. Geomech., 2001; 25:1525}1557

Figure 21. Comparison of experimental data and theoretical stress}dilatancy relationships fordilatant and contractant behaviour.
Experimental data have been interpreted with a version of the stress}dilatancy theory [50]which accounts for the cohesion between particles, c
R
D"K#
2c
���
�K (5)
In Reference [50] it is assumed thatK depends on � in the same manner as in Equation (4), while
the cohesion between particles is a material property. According to Equation (5), the ratio R/Dcan take values in excess of K(��
��) depending on the cohesion between grains and the e!ective
stress, ���.
The points where R/D is maximum may be thought of as states corresponding to the onset ofa process of &de-structuration' of the material involving the progressive reduction of inter-particlecohesion while the angle of friction between particles, �
, increases from �� to ��
��. The progress of
these phenomena is probably linked to both volume and shear plastic strains experienced by thematerial during the test; the values of shear strain reported in Table III, however, may be used asa "rst indication. The condition �
"��
��can be attained not only for shear strains smaller than
those corresponding to the critical states but even than those corresponding to the maximumdilatancy, which is attained at relatively large shear strains (see Table III). On the other hand, theshear strains at the maximum values of the ratio R/D are relatively small, so that it is reasonableto assume that �
��� and that the mobilized shear strength is mostly due to inter-particle
cohesion. The peak deviator stress results from the interplay between degradation of inter-particle bonds (corresponding to a reduction of c
), increasing friction between particles (increase
of � ) and increasing rate of dilation (increase of D). At shear strains corresponding to the point of
maximum dilation (see Figures 19, 21), the interparticle friction has reached its maximum value,
THE MECHANICAL BEHAVIOUR OF A PYROCLASTIC WEAK ROCK 1549
Copyright � 2001 John Wiley & Sons, Ltd. Int. J. Numer. Anal. Meth. Geomech., 2001; 25:1525}1557

Figure 22. E!ect of con"ning stress on maximum ratio R/D.
� ���
��, while cohesion between grains seems to be completely lost (c
�0); the data can be
interpolated with a straight line through the origin at a constant slope K(����), making it possible
to evaluate the value of ����from the whole of the data on the last portion of the stress}dilatancy
curve.To explore further this interpretation of the experimental data, in Figure 22 the values of
(R/D)��
obtained from drained and undrained triaxial compression tests on intact samples areplotted versus the radial e!ective stress; for undrained tests this is calculated from the radial stressand the excess pore pressure measured at (R/D)
��. In the same "gure Equation (5) has been
plotted for comparison using two di!erent constant values of c "0.5 and 0.7 MPa and constant
values � "��"103 and �
"��
��"393. The trend of the data is in very good agreement with
Equation (5), with (R/D)��
reducing with increasing ���, although the data are not "tted exactly by
any of the four curves in Figure 22. The maximum values of (R/D), however, were reached atdi!erent values of shear strain (see Table III), so that it is likely that the values of �
were not the
same for all tests; quite signi"cantly, the points relative to tests in which (R/D)��
was reached atlower shear strains tend to fall closer to the curves at �
"��, while the points from tests in which
(R/D)��
was reached at larger shear strains tend to fall closer to the curves at � "��
��. However,
the scatter in the data may also result from the natural variability of the material which mayproduce di!erent values of inter-particle cohesion c
from one sample to another. The values of
inter-particle cohesion used to calculate the analytical curves are higher than the cohesionintercept obtained from the failure peak envelope in q}p�; this is hardly surprising as the peakdeviator stress is always reached after the point in the test where R/D is maximum, whichcorresponds to the onset of the de-structuration process.Figure 23 shows the values of mobilized friction angle at peak, ��
�, versus the observed rate of
dilation at peak,D�, which, for the PozzolanaNera, is not the maximum rate of dilation,D
��. The
experimental data plot above the solid line which represents the expected relationship accordingto Reference [48], indicating that there are extra components of strength, in addition to frictionand dilatancy. The observed rate of dilation at peak, however, seems to be a reasonably wellde"ned decreasing function of the state parameter, �, as shown by the data in Figure 24; asexpected, for D
�"1, the state parameter � is null, which con"rms the choice of reference state
line in v : ln p� plane.
1550 MANUELA CECCONI AND GIULIA MB VIGGIANI
Copyright � 2001 John Wiley & Sons, Ltd. Int. J. Numer. Anal. Meth. Geomech., 2001; 25:1525}1557

Figure 23. Mobilized friction vs rate of dilation at peak from drained triaxial compression testson intact samples.
Figure 24. E!ect of initial state on observed dilation at peak.
Figure 25(a), 25(b), and 25(c) show the stress}dilatancy relationships obtained for three series ofdrained shearing cycles which were carried out at increasing values of con"ning pressures(p�
�"0.35, 1.40 and 2.00 MPa) before the main shearing stage of test BPHP; in each series of three
cycles the maximum deviator stress was kept about 1/10 of the expected peak strength of the
THE MECHANICAL BEHAVIOUR OF A PYROCLASTIC WEAK ROCK 1551
Copyright � 2001 John Wiley & Sons, Ltd. Int. J. Numer. Anal. Meth. Geomech., 2001; 25:1525}1557

Figure 25. Stress}dilatancy relationships observed in cycles of shear at constant radial e!ective stress;(a) p�
�"0.35; (b) p�
�"1.40, and (c) p�
�"2.00 MPa.
material at the corresponding mean e!ective stress. The stress}dilatancy paths followed in eachcycle are shown as continuous lines, although the data are quite scattered. In the loading stage ofeach series, for any given value of R, D increases with increasing number of cycles, which suggeststhat the structure of the material modi"es progressively for each subsequent cycle. The e!ect ofthe number of cycles reduces with increasing con"ning pressure.Figure 26 shows a selection of the experimental stress}dilatancy relationships for a wide range
of con"ning pressures in terms of stress ratio, �, versus plastic strain increment ratio d*"����/���
�.
The data corresponding to the points in the test whereR/D is maximum are shown in the "gure ascrossed squares and "tted using a straight line (line a) of equation
�"M*!�d* (6)
1552 MANUELA CECCONI AND GIULIA MB VIGGIANI
Copyright � 2001 John Wiley & Sons, Ltd. Int. J. Numer. Anal. Meth. Geomech., 2001; 25:1525}1557

Figure 26. Stress}dilatancy relationships for drained triaxial compression tests on intact samples in terms of� vs d*.
where �"1.49 andM* ('M)"2.31 is the mobilized stress ratio where the plastic volume strainincrement is null. A similar linear relationship "tting experimental data during de-structurationwas observed, among others, in Reference [16] for a porous calcarenite. The continuous straightline (line b), at a slope �"1 and intercept M"1.6, envelopes the last portion of the observedstress}dilatancy relationships for dilatant samples. From Equation (6), the mobilized stress ratioat the onset of de-structuration results from the sum of a component due to friction and cohesion(M*) and a component proportional to the dilatancy (�d*). Lines a and b enclose the region of� : d* plane where the process of de-structuration takes place; line b has the same equation as theCam Clay [44] #ow rule in which M*"M and �"1. Cotecchia and Chandler [54] observedthat the non-frictional character of the mechanical behaviour results in values of � larger thanunity for drained shearing.
CONCLUSIONS
The structural features and the mechanical properties of a pyroclastic weak rock from CentralItaly have been presented. The Pozzolana Nera, which belongs to a pyroclastic #ow deposit, isa weakly bonded coarse-grained material, with a peculiar micro-structure making conventionalprocedures of sampling and laboratory characterization testing rather problematic. The materialcan be classi"ed as a weak rock with respect to its uncon"ned compressive strength.Optical microscopy of thin sections and scanning electron microscopy revealed a very complex
arrangement of grains and aggregates of grains of very di!erent size and porosity, with frequentcrystals scattered in a scoriaceousmatrix. Bonding between individual grains was detected, even ifinter-particle bonds were found not to be associated to mineralogical changes resulting in the
THE MECHANICAL BEHAVIOUR OF A PYROCLASTIC WEAK ROCK 1553
Copyright � 2001 John Wiley & Sons, Ltd. Int. J. Numer. Anal. Meth. Geomech., 2001; 25:1525}1557

formation of secondary cementing agents. Bonds are discernible frommicrographs as thin bridgesof material connecting grains and aggregates, even if, with respect to composition, particlescannot be distinguished from bonds.One-dimensional compression tests carried out on intact and reconstituted samples provided
a clear understanding of the interaction between state, yield and structure. One-dimensionalcompressibility is mainly controlled by the breakage of bonds and/or grains.Intact samples tested in drained triaxial compression tests at low con"ning pressures
(0.05(p��(0.70 MPa) exhibited a strongly dilatant behaviour with well de"ned peak strengths
at low shear strain. In all tests, the shear strain at which the rate of dilation was maximum waslarger than the shear strain corresponding to the peak in the stress strain curve; the maximumrate of dilation decreased with increasing stress level. At high con"ning pressures(0.70(p�
�(8.3 MPa) the stress}strain curves are ductile and the material contracts throughout
the test; however, a gentle peak is always observed at relatively large shear strains. The extent ofthe nearly linear portion of the stress}strain curves decreases with increasing con"ning pressure;for a sample tested at very high con"ning pressures (p�
�"58 MPa) the behaviour was found to be
non-linear from the very start of shearing, as the sample yielded during the previous isotropiccompression stage. For both brittle and ductile behaviour failure was associated with theformation of shear surfaces separating the sample in several parts at the end of the test.Values of peak strength are relatively high (��
�"453, c�
�"0.3 MPa). At the end of the test, the
samples tested at higher con"ning pressures and reaching failure in a ductile manner, tended tomobilize a relatively well de"ned value of the stress ratio,M�1.6, corresponding to a value of thefriction angle at critical state, ��
��"393; this value applies also for the samples tested at lower
con"ning pressures, although in this case the "nal value of the stress ratio � at the end of test isless reliably de"ned, due to strain localisation. Peak strength data were normalized taking intoaccount the initial state of the material relative to the critical state line de"ned by end-of-testcondition of contractant samples in v : ln p� space; the mobilized peak strength was found todecrease with the state parameter �.The analyses of the experimental stress}dilatancy relationships proved to be a useful tool in
assessing the role played by degradation of inter-particle bonds and rate of dilation in thestrength of the material. The experimental results were found to be consistent with Rowe'sstress}dilatancy theory for a particulate material in which the contacts between particles arecharacterized by the inter-particle angle of friction, �
, increasing during shear from the value
� "�� to the maximum value �
"��
��, and by a true cohesion c
; however, the cohesion
between particles seems to deteriorate during shear. Peak strength, which follows the onset of thede-structuring process, results from the interplay between degradation of inter-particle bonds(decrease of true cohesion), increasing friction and increasing rate of dilation.
ACKNOWLEDGEMENTS
The authors gratefully acknowledge the invaluable help received during the progress of this research by Dr.M.R. Coop at the GERC of the City University of London, Prof. S. Rampello at the DISG of the Universityof Roma ¸a Sapienza, and by Prof. M. Sciotti at the DI¹S of the University of Roma ¸a Sapienza. Theauthors would also like to thank Dr. A. Amorosi for the help with high-pressures triaxial testing carriedout at the DISG (University of Roma ¸a Sapienza), Dr. P. Tommasi for his assistance with the inter-pretation of electron micrographs and Dr. G. Viggiani who read the manuscript and gave us many valuablesuggestions.
1554 MANUELA CECCONI AND GIULIA MB VIGGIANI
Copyright � 2001 John Wiley & Sons, Ltd. Int. J. Numer. Anal. Meth. Geomech., 2001; 25:1525}1557

APPENDIX A
c
inter-particle cohesionc��
peak cohesion in e!ective stressd"!���
�/���
plastic strain increment, or rate of dilation
d*"����/���
�plastic strain increment, or rate of dilation
e voids ratioe�
initial voids ration porosityp� mean e!ective stressp��
mean e!ective stress at the intersection of normal compression line and currentswelling line
p��
e!ective con"ning pressurep���
mean e!ective stress on critical state lineq deviator stressq�
peak deviator stress�u excess pore water pressurev speci"c volumew�
water contentB Skempton pore pressure coe$cientC
�compression index
C*�
compression index for reconstituted samples and for intact samples with high e�
C�
swelling indexD"1#d dilatancyD
��grain diameter at 10% "ner
G�"�
�/�
�speci"c gravity
R"��/��
�, stress ratio
S�
degree of saturation; uniformity coe$cient� slope of stress}dilatancy relationship� unit weight��
dry unit weight��
speci"c unit weight�
axial strain��
shear strain��
volume strain�� elastic strain�� plastic strain�"q/p� stress ratio��
stress ratio at peak slope of normal compression line���, ��
, ��
�, vertical, axial, radial e!ective stress
���
vertical e!ective stress at yield����
angle of friction at critical state�
inter-particle angle of friction���
peak friction angle
THE MECHANICAL BEHAVIOUR OF A PYROCLASTIC WEAK ROCK 1555
Copyright � 2001 John Wiley & Sons, Ltd. Int. J. Numer. Anal. Meth. Geomech., 2001; 25:1525}1557

���
mobilized peak friction angle�� inter-particle angle of friction on sliding� state parameter speci"c volume at critical state with p�"1 MPaM stress ratio at critical stateM* stress ratio corresponding to zero volume strain increment at the onset of destruc-
turation
REFERENCES
1. Kavvadas M. Modelling the soil behaviour*selection of soil parameters. General Report. Proceedings of theInternational Symposium on ¹he Geotechnics of Hard Soils-Soft Rocks, vol. 3. Napoli, 1998; 1441}1481.
2. Aversa S. Mechanical behaviour of soft rocks: some remarks. Proceeding of the=orkshop on Experimental Character-isation and Modelling of Soils and Soft Rocks. Napoli, 1991; 191}223.
3. Cuccovillo T, Coop MR. The in#uence of bond strength on the mechanics of carbonate soft rocks. Proceedings of theInternational Symposium On Geotechnical Engineering of Hard Soils and Soft Rocks. vol. 1. Athens, 1993; 447}455.
4. Cuccovillo T. Shear behaviour and sti!ness of naturally cemented sands. Ph D. ¹hesis. City University, 1995.5. Lagioia R, Nova R. An experimental and theoretical study of the behaviour of a calacrenite in triaxial compression.Geotechnique 1995; 45(4):633}648.
6. Amorosi A, Rampello, S. The in#uence of natural soil structure on the mechanical behaviour of a sti! clay.Proceedings of the International Symposium on ¹he Geotechnics of Hard Soils}Soft Rocks. vol. 1. Napoli, 1998;395}402.
7. Aversa S, Evangelista A. The mechanical behaviour of a pyroclastic rock: yield strength and destructuration e!ects.Rock Mechanics and Rock Engineering 1998; 31(1):25}42.
8. KavvadasM, Anagnostopoulos AG. A framework for the mechanical behaviour of structured soils. Proceedings of theInternational Symposium on ¹he Geotechnics of Hard Soils}Soft Rocks. vol. 2. Napoli, 1998; 2:591}601.
9. Airey DW. Triaxial testing on naturally cemented carbonate soil. Journal of Geotechnical Engineering of the AmericanSociety of Civil Engineers 1993; 119(9):1379}1398.
10. CoopMR. The in#uence of in situ state on the behaviour of carbonate sands. Proceedings of the Second InternationalConference on Calcareous Soils. vol. 2. Bahrain, 1999; 379}400.
11. Coop MR, Atkinson, JH. The mechanics of cemented carbonate sands. Ge&otechnique 1993; 43(1):53}67.12. Elliott GM, Brown ET. Yield of a soft, high porosity rock. Ge&otechnique 1985; 35(4):413}423.13. Maccarini M. Laboratory studies of a weakly bonded arti"cial soil. Ph. D ¹hesis. 1987, Imperial College of Science
Technology and Medicine, University of London.14. Clough GW, Sitar N, Bachus RC, Rad NS. Cemented sands under static loading. Journal of Geotechnical Engineering
of the American Society of Civil Engineers 1981; 107(GT6):799}817.15. Gens A, Nova R. Conceptual bases for a constitutive model for bonded soils and weak rocks. Proceedings of
the International Symposium On Geotechnical Engineering of Hard Soils and Soft Rocks. vol. 1. Athens, 1993;447}455.
16. Wood DM. Kinematic hardening model for structured soil. Proc. Numerical Models in Geomechanics 1995; 83}88.17. Kavvadas M, Amorosi A. Constitutive models for structured soils. Ge&otechnique 2000; 50(3):263}273.18. Shao JF, Rudnicki JW. A microcrack based continuous damage model for brittle geomaterials. Proceedings of the
AEPA, 2000; 103}108.19. Homand-Etienne F, Hoxha D, Shao JF. A continuum damage constitutive law of brittle rocks. Computers and
Geotechniques 1998; 22:135}151.20. Shao JF. Poroelastic behaviour of brittle rock materials with anisotropic damage, Mechanics of Materials 1998;
30:41}53.21. Chazallon C, Hicher PY. An elastoplastic model with damage for bonded geomaterials. Proceedings of the Interna-
tional Conference of the Numerical Methods for Geomechanics, Davos, vol. 5. 1995; 22}30.22. Chazallon C, Hicher PY. A constitutive model coupling elastoplasticity and damage for cohesive frictional materials.
Mechanics of Cohesive Frictional Materials 1998; 3:41}63.23. CecconiM. Caratteristiche strutturali e proprieta meccaniche di una piroclastite: la PozzolanaNera dell'area romana.
Ph D ¹hesis. 1999, Universita di Roma Tor Vergata.24. Cecconi M, Viggiani GMB, Rampello S. An experimental investigation of the mechanical behaviour of a pyroclastic
soft rock. Proceedings of the second International Symposium on Hard Soils/Soft Rocks. vol. 1. Napoli, 1998; 473}482.25. Fisher RV, Schmincke HU. Pyroclastic Rocks. Springer: Berlin, 1984.
1556 MANUELA CECCONI AND GIULIA MB VIGGIANI
Copyright � 2001 John Wiley & Sons, Ltd. Int. J. Numer. Anal. Meth. Geomech., 2001; 25:1525}1557

26. Bernabini M, Esu F, Martinetti S, Ribacchi R. On the stability of the pillars in an underground quarry workedthrough soft pyroclastic rocks. Proceedings of the I Congress International Society of Rock Mechanics. vol. 2. Lisboa,1966; 285}291.
27. Geological Society of London. The logging of rock cores for engineering purposes. Quartely Journal of EngineeringGeology 1970; 3(1):1}24.
28. Cecconi M, Viggiani GMB. Physical and structural properties of a pyroclastic soft rock. Proceedings of the secondInternational Symposium on Hard Soils/Soft Rocks. vol. 1. Napoli, 1998; 85}91.
29. Esposito L, Guadagno FM. Some special geotechnical properties of pumice deposits. Bulletin of Engineering Geologyand Environment 1998; 57:41}50.
30. Lee IK. Mechanical behaviour of compacted decomposed granite soil. Ph. D. ¹hesis. 1991, City University.31. Bishop AW, Wesley LD. A hydraulic triaxial apparatus for controlled stress path testing. Ge&otechnique 1974;
24(4):657}670.32. Taylor RN, Coop MR. Stress path testing of Boom clay from Mol, Belgium. Proceedings of the Conference on the
Engineering Geology of=eak Rock, Leeds, 1993; 77}82.33. Cuccovillo T, Coop MR. An automated triaxial apparatus for elevated pressures. Proceedings of the Nondestructive
and Automated ¹esting for Soil and Rock properties; AS¹M S¹P, vol. 1350. 1998.34. Cuccovillo T, Coop MR. The measurement of local axial strains in triaxial tests using LVDT's. Ge&otechnique 1997;
47(1):167}172.35. Cecconi M. Sample preparation of a problematic pyroclastic rock. Proceedings of the IS on Problematic Soils. vol. 1.
Sendai, 1998; 165}168.36. Baldi G, Nova R. Membrane penetration e!ects in triaxial testing. Journal of Geotechnical and Engineering of
American Society of Civil Engineers 1984; 110(3):403}420.37. Vaughan PR. Characterising the mechanical properties of in situ-residual soils.Proceedings of the second International
Conference on Geomechanics in ¹ropical Soils. Singapore, 1988; 469}487.38. Desrues J, Chambon R, Mokni M, Mazerolle F. Void ratio evolution inside shear bands in triaxial sand specimens
studied by computed tomography. Ge&otechnique 1996; 46(3):529}546.39. Been K, Je!eries MG, Hachey J. The critical state of sands. Ge&otechnique 1991; 41(3):365}381.40. Konrad JM. In situ sand state from CPT: evaluation of a uni"ed approach at two Canlex sites. Canadian Geotechnical
Journal 1997; 34:120}130.41. Colliat-Dangus JL, Desrues J, Foray P. Triaxial testing of granular soils under elevated cell pressures. Proceedings of
the Advanced ¹riaxial ¹esting of Soil and Rock, AS¹M S¹P, vol. 977. 1988; 290}310.42. Ishihara K. Liquefaction and #ow failure during earthquakes. Thirty-third Rankine Lecture. Ge&otechnique 1993;
43(3):349}416.43. Lee IK, Coop MR. The intrinsic behaviour of a decomposed granite soil. Ge&otechnique 1995; 45(1):117}130.44. Scho"eld AN, Wroth CP. Critical State Soil Mechanics. McGraw-Hill: London, 1968.45. Roscoe KH, Burland JB. On the generalised stress-strain behaviour of 'wet' clay. Engineering Plasticity. Cambridge
University Press: Cambridge, 1968; 535}609.46. Coop MR. The in#uence of particle breakage and state on the behaviour of sands. Proceedings of the second
International=orkshop on Crushable Soils, Yamaguchi, 1999.47. Been K, Je!eries MG. A state parameter for sands. Ge&otechnique 1985; 35(2):99}112.48. Rowe PW. The stress-dilatancy relation for static equilibrium of an assembly of particles in contact.Proceedings of the
Royal Society of ¸ondon, 1962; 269:500}527.49. Rowe PW. Theoretical meaning and observed values of deformation parameters for soil. Stress}strain behaviour of
soils. Proc. Roscoe Memorial Symp. Cambridge University, 1971.50. Rowe PW, Oates DB, Skermer NA. The stress}dilatancy performance of two clays, 1963. AS¹M S¹P; 361: 134}143.51. Canestrari F, Scarpelli G. Stress dilatancy and strength of Ancona clay. Resistenza e dilatanza dei terreni naturali,
Proceedings of the First International Conference Hard Soils soft Rocks, vol. 1. Athens, 1993; 417}424.52. Rampello S, Georgiannou VN, Viggiani G. Strength and dilatancy of natural and reconstituted Vallericca clay.
Proceedings of the First International Conference Hard Soils soft Rocks, vol. 1. Athens, 1993; 761}768.53. Flora A, Modoni G. Complex testing and simple analysis of coarse grained materials. Proceedings of the=orkshop on
Prediction and Performance in Geotechnical Engineering. Napoli, 1998; 151}216.54. Cotecchia F, Chandler RJ. The in#uence of structure on the pre-failure behaviour of a natural clay. Ge&otechnique
1997; 47(3):523}544.
THE MECHANICAL BEHAVIOUR OF A PYROCLASTIC WEAK ROCK 1557
Copyright � 2001 John Wiley & Sons, Ltd. Int. J. Numer. Anal. Meth. Geomech., 2001; 25:1525}1557