Embed Size (px)
Citation preview

Australasian Plant Pathology (2000) 29: 36-45
Structure ofAscochyta lentis in Australia revealed with random amplifiedpolymorphic DNA (RAPD) markers
R. FordA, P.H. Garnier-Gere-, M. Nasir" and P.W.J. TaylorA
ADepartment of Crop Production, Institute of Land and Food Resources, The University of Melboume, Parkville,Victoria 3052 AustraliaBDepartment of Agriculture, Fisheries and Forestry, GPO Box 858, Canberra, Australian Capital Territory 2601Australia
Corresponding author: R. Ford (Email [email protected])
Abstract
The genetic variation ofAscochyta lentis in Australia was investigated using random amplified polymorphic DNA(RAPO) analysis of23 isolates. Of the 87 loci assessed, 86 were polymorphic. The most closely related isolates werefrom Victoria and South Australia, and they shared identical banding profiles. The most genetically distant isolateswere from South Australia and Western Australia (83% dissimilar). Analysis ofmolecular variance showed low geneticvariation between groups of isolates originating from either within or outside Australia (4%). Large variation withineach group (96%) indicated similar pathogen variability within and outside Australia. Partitioning ofvariation withinAustralian states was shown. Isolates collected within South Australia were least variable (1%) and isolates collectedwithin Western Australia were most variable (61%). Increased variation in Western Australia is thought to haveoccurred through multiple introductions and/or the frequent presence of both mating types. Furthermore, two RAPDmarkers used in unison were able to explain over 50% of the variation in isolate pathogenicity. No RAPD markerswere found that discriminated mating type.
Introduction
Ascochyta blight of lentil is caused by Ascochytalentis (Kaiser et al. 1997; syn. Afabae Speg. f. sp.lentis Gossen et al. 1986) and is a major factorlimiting lentil production in Australia (Nasir andBretag 1997a). Surveys oflentil seed between 1995and 1998 showed that the pathogen occurred in alllentil growing areas ofthe country, with the potential to cause large income loss through yielddecrease and seed discoloration (Nasir 1998).Approaches to controlling A. lentis include resistant cultivars, fungicide application and crop rotation. However, these practices may cause strongdirectional selection pressures on pathogen populations with the subsequent risk of selecting new,more virulent pathotypes.
Fungal populations which possess high levels ofgenetic variation are likely to adapt to a new environment more rapidly than those that do not, suchas a population comprised largely ofclonal lineages
36
(McDonald and McDermott 1993). Therefore, it isimportant to assess the amount and distribution ofgenetic variation that is maintained within a pathogen species (within and between populations) inorder to predict the likelihood that a control measurewill remain effective. Together with an understanding of the host/pathogen interaction, this information is essential for designing strategies to reducedisease risk. Such information is currently lackingin studies ofA. lentis from Australia.
Sexual recombination is known to occur withinthe reproductive cycle ofA. lentis. Furthermore,A. lentis is heterothallic and compatible matingtypesare requiredfor the production of fertilepseudothecia. Two mating types ofA. lentis were initiallyidentified in the United States of America (Kaiserand Hallier 1993), and subsequently in Canada andother major lentil growing regions of the world(Ahmed et al. 1996; Kaiser 1997b), including Australia (Nasir 1998). The introduction of isolates ofcompatible mating types into lentil growing areas is
Australasian Plant Pathology Vol. 29 (1) 2000
likely to increase the potential for the developmentof the teleomorph (Didymella) and thus increasedpathogenic variability (Porta-Puglia et al. 1996).
The genetic variation within and between populations of plant pathogens has traditionally beenassessed using phenotypic traits. Variability in virulence was studied within populations of relatedspecies causing ascochyta blight such asMycosphaerella pinodes of field pea (Nasir andHoppe 1991), A. fabae of faba bean (Rashid et al.1991) andA. rabiei ofchickpea (Porta-Puglia et al.1996; Udupa et al. 1998). Studies ofpathogenicityin A. lentis revealed six pathotypes in Australia(Nasir and Bretag 1997b) and fourteen pathotypeswithin a collection of isolates from a broader geographical distribution (Nasir 1998).
A rapid method for identifying a pathotypewould be particularly useful when a defined set ofhost differentials is not available or when screeningunder differing environmental conditions. Thiscould potentially be achieved using DNA markersfor investigating the genetic identity, variability andrelatedness of fungal populations. DNA markersreveal polymorphism at the genomic level. In thecase ofPCR-based marker systems, a small amountof fungal biomass is required making the processrelatively cost efficient. Also, unlike the phenotype,DNA markers are insensitive to environmentalinfluences, are considered to be selectively neutraland have the potential to produce informationregarding a large number of alleles. Furthermore,DNA markers may offer an alternative to pathogenicity tests when disease reaction is poorlycharacterised.
Many studies have utilised DNA markers to gaininsight into the population structure ofplant pathogenic fungi (Arnau et at. 1994; Peltonen et at.1996). In some cases they have been correlated withvirulence and pathogenic variation (Kolmer et al.1995; Sicard et al. 1997), and also to differentiateaggressive from non-aggressive isolates (Schaferand Wostemeyer 1992; Plummer et al. 1994).Assessment ofgenetic variation between isolates ofA. rabiei has utilised oligonucleotide fingerprinting(Morjane et al. 1994), and random amplified polymorphic DNA (RAPD) analysis (Fischer et al.1995). To date, this method has not been employedto study genetic relationships between isolates ofA. lentis.
The aims of this study were: (1) to use RAPDmarkers to analyse and compare the genetic diversity among isolates ofA. lentis collected in Australia
Australasian Plant Pathology Vol. 29 (1) 2000
with the diversity among isolates originating froma much broader geographical distribution (2) tocompare the hierarchical classification obtainedfrom genetic distances using RAPD data and groupsbased on other characters such as pathotype andmating type and (3) to test for relationships betweenthe molecular markers and gene(s) involved in theexpression of these characters.
Methods
Fungal isolates A. lentis was isolated from naturally infected seeds. Seeds were plated onto Coon'sagar (Ali et al. 1978) and placed under UV light(Philips black light, model number TLD 18W/840)at 20±2°C. Two isolates were chosen from eachmajor lentil-growing district. Each isolate wassingle-spored (Table 1) and maintained throughsub-culturing every 10 to 12 weeks.
Determination of pathotype class and matingtype Both the mating type (lor 2) and the pathotype (1-14) of each isolate (except USAI andH2(2» were previously determined by Nasir(1998). Mating experiments were conducted underartificial conditions on pre-sterilised stem tissue(Nasir 1998). Each isolate was assigned a matingtype depending on its ability to mate with either oftwo tester isolates that were predetermined asmating type 1 or 2.
For this study, pathotypes were re-coded intothree pathotype classes. The classes were defined asweakly aggressive (W) for isolates causing a susceptible reaction on up to two of the differentialhosts, moderately aggressive (M) for isolates causing a susceptible reaction on either three or fourdifferential hosts, and highly aggressive (H) for isolates causing a susceptible reaction on five to sevenof the differential hosts.
DNA extraction Total genomic DNA was isolated either directly from pycnidiospores or frommycelium growing in liquid culture.
From pycnidiospores Cultures were grown onCoon's agar plates until pycnidia were produced (10to 14 days). They were then flooded with 2 mL ofsterile distilled water and the surface was scrapedwith a sterilised spatula to release pycnidiospores.The spore suspensions were stored at 20±2°C for48 h in the dark in sterile 1.5 mL tubes and spores
37

From mycelium Spores were isolated from cultures grown on Coon's agar as described. Suspended spores were counted using a haemocytometer (Neubauer counter) and transferred into200 mL glass flasks containing 30 mL of Coon'sliquid medium to a final concentration of 1 x 10⁶
spores per mL. Flasks were agitated at 150 rpm ona rotary platform shaker in the dark at 18±2°C for7 days. Mycelial mats were transferred to sterile1.5 mL tubes and washed three times with 500 J.lLsterile distilled water. Mycelium was transferred tosterile mortars and ground with liquid nitrogen.Total genomic DNA was extracted, assessed, quantified and the concentration adjusted as described.
DNA amplification The decamer oligonucleotide primers (Operon Technologies Inc., UnitedStates of America) used for RAPD amplification ofDNA from A. lentis are shown in Table 2. PCRreaction and thermal cycler conditions were thesame as those detailed in Ford et al. (1997) exceptfor the following changes: the 25 J.lL PCR reaction
Table 1 Characteristics of isolates of Ascochyta lentis
were pelleted by centrifuging at 13 000 rpm for5 min. The pellet was transferred to a sterile mortarand ground to a powder using a small volume ofliquid nitrogen (1-2 mL). One mL of cetyltrimethyl ammonium bromide (CTAB) bufferpH 5.4, comprising 2% CTAB (Sigma, UnitedStates of America), 1.4 M NaCI (AJAX Chemicals,Australia), 100 mM Tris-HCl pH 8.0 (Sigma,United States of America) and 20 mM EDTA(AJAX Chemicals, Australia), was added. The suspension was transferred to a fresh 1.5 mL tube,vortexed for 2 min and incubatedat 55°Cfor 15min.Total genomic DNA was extracted using theadapted CTAB method ofTaylor et al. (1995). Theintegrity of DNA was visually assessed on a1.2% agarose gel after incubation at 37°C for20 min with five units of RNAse (BoehringerMannheim, Germany), and quantification of DNAwas determined by spectrophotometric analysis atA
260nm and adjusted to 10 ng/ul. for PCR.
Isolate Origin Pathotype class- Mating type"
111222
TF6 Turrettfield, South Australia, Australia MTF15 Turrettfield, South Australia, Australia MYLlO Yeelana, South Australia, Australia HYLl3 Yeelana, South Australia, Australia HRB6 Rosebery, Victoria, Australia HRB 12 Rosebery, Victoria, Australia HH2(2) Horsham, Victoria, Australia -13
H3 Horsham, Victoria, Australia H 1L2 Laen, Victoria, Australia H 2NH9 Northam, Western Australia, Australia W 1NH14 Northam, Western Australia, Australia W 1MD3 Merredin, Western Australia, Australia H 2MD5 Merredin, Western Australia, Australia H 2JUS Junee, New South Wales, Australia M 1JU6 Junee, New South Wales, Australia M 1MT3 Manitoba, Canada H 1MT12 Manitoba, Canada H 1SK6 Saskatchewan, Canada H 1USAl United States of America 2PK 13 Pakistan H 1PK14 Pakistan H 1S10 Syria H 1C13 China W 1
AFor each isolate, pathotype classwas either H (highly aggressive),M (moderately aggressive) or W (weaklyaggressive) and mating type was either 1 or 2.B_ denotes missing data.
38 Australasian Plant Pathology Vol. 29 (1) 2000

Ordination using principal coordinates analysisPrincipal coordinates analysis (PCA) was carriedout on the dissimilarity matrix using the 'PROCFACTOR' procedure ofSAS. Isolates were plottedin a 3-D representation against the first three components. The graphical representation of a groupstructure among isolates using PCA may offer aclearer understanding of the genetic proximitybetween groups ofisolates than using the dendrogramalone. PCA reduces the dimensions of a dataset byseeking major axes of variation in the data.
Hierarchical classification A dendrogram wasproduced from the dissimilarity matrix using theunweighted pair-group method with arithmeticmean (UPGMA), with 'PROC CLUSTER' and'PROC TREE' procedures of SAS.
Data analysis
mixture contained 40 ng ofgenomic DNA template,1.0 unit of Taq DNA polymerase (Gibco/BRL-LifeTechnologies Inc., Australia); PCR buffer comprised 10 mM Tris-HCl/50 mM KCl/O.l mg/mLgelatin, pH 8.3 (Gibco/BRL-Life Technologies Inc.,Australia); MgC1
2(Gibco/BRL-Life Technologies
Inc., Australia) was added separately to the reactionto a fmal concentration of3 mM. The PCR reactionwas performed with a thermal-cycler model PTC200 (MJ Research, Inc., United States ofAmerica).Amplification products were separated by electrophoresis in a 1.4 % agarose gel in TAE buffer,stained with ethidum bromide and visualised underUV light. Initially, 30 primers were screened withthree isolates from different locations (YLl3, JU6and TF6) to detect polymorphisms and verifyamplification profiles (data not shown). Primers thatyielded reproducible polymorphisms were used toscreen the remaining isolates in this study. Polymorphic bands were referred to by primer name andband size.
Scoring and estimation of dissimilarity indicesAmplification products were scored as eitherpresent (1) or absent (0) for each isolate. A conservative scoring approach was taken whereby faintbands were not scored. A dissimilarity matrix wasconstructed based on the RAPD data collected fromthe 23 isolates using the simple matching coefficient(Apostol et al. 1993), using the SAS statistical package (ver. 6.12, 1997, SAS Institute Inc., Cary, NorthCarolina).
Analysis ofmolecular variance - pathotype diversity An analysis of molecular variance (AMOVA),developed by Excoffier et al. (1992), was conductedusing the RAPD data. The AMOVA testing procedure is based on a permutational analysis ofthe nulldistribution ofvariance components and is considered significant ifthe statistics exceed the observedvalue under the null hypothesis. The AMOVA wasperformed on a matrix of squared molecular distances between pairs of isolates using the softwareWINAMOVA (Excoffier 1993).
Three group structures were tested. Firstly, theisolates were partitioned into two separate groups.One group included eight isolates originating fromoutside Australia and another included 14 isolatescollected from within Australia. Secondly, the Australian isolates were subsequently hierarchicallypartitioned into four separate geographical groups
Table 2 Decamer primers used for RAPD analysis of isolates of Ascochyta lentis
Primer Sequence (5'-3') No. amplification products No. polymorphic products
OPE-07 AGATGCAGCC 10 10OPF-IO GGAAGCTTGG 4 4OPF-12 ACGGTACCAG 6 6OPF-13 GGCTGCAGAA 10 10OPF-14 TGCTGCAGGT 6 6OPG-05 CTGAGACGGA 9 8OPG-I0 AGGGCCGTCT 8 8OPG-16 AGCGTCCTCC 4 4OPG-17 ACGACCGACA 7 7OPV-08 GGACGGCGTT 8 8OPV-lO GGACCTGCTG 15 15
Total 87 86
Australasian Plant Pathology Vol. 29 (1) 2000 39

Victoria (VIC), New South Wales (NSW), SouthAustralia (SA) and Western Australia (WA).Thirdly, the Australian isolates were also partitionedinto two other groups. One group included ten isolates collected from VIC, NSW and SA. The othergroup comprised four isolates collected from WA.
Prior to the AMOVA, reactions that produced thesame marker profile for each isolate with a singleprimer were excluded from the data set, leaving atotal of 71 polymorphic RAPD markers.
Prediction ofpathotype and mating type In orderto test for genetic associations between individualRAPD markers and pathotypes, two methods ofstatistical analysis were employed. First, one-wayanalysis ofvariance (ANOVA) was conducted usingthe 'general linear model' procedure (PROC GLM)within SAS. Initially, each RAPD band was treatedas a factor with two classes (the presence (1) orabsence (0) of the band) and the ability to distinguish between pathotype classes was tested. Second, after screening for bands that produced significant results, pairs ofbands were tested in a two-wayANOYA (for an additive effect) or by recoding thedata into four classes (0,0; 0,1; 1,0 and 1,1), fromdouble absence to double presence.
Furthermore, to test for genetic associationsbetween individual RAPD markers and matingtypes, the 'PROC FREQ' procedure within SASwas used to perform X2tests and Fisher's exact tests.The null hypothesis for these tests was the absenceof any such association.
Results
DNA amplification Between four and fifteenbands ranging in size from approximately 200 bp to> 2000 bp were scored from PCR ofgenomic DNAof 23 isolates for each selected primer. Of the 87reproducible RAPD bands generated with 11 random primers, only one was present in all isolates(monomorphic). This marker was named OPG5>2000and further testing is needed to determine whetherthis marker is specific to A. lentis. Therefore, allprimers used and 99% ofall markers amplified werepolymorphic between the isolates in this study.
Several isolates produced identical banding patterns with all ofthe primers assessed (YLlO, YLl3,RB6 and TFI5). Of these, isolates YLl3 and RB6were also identical in pathotype class and matingtype, indicating that they may belong to the same
40
clonal lineage. Conversely, all other pairs ofthese isolates differed in either pathotype class or mating type.
Data analysis
Simple matching coefficients From the dissimilarity matrix, the most closely related Australian isolates were TF6, YLlO, YLl3, TF15 and RB6, thelast four being identical. The two most distant Australian isolates were TF6 and NH9 (distance value(D) of 0.83).
The maximum distance between the SA isolateswas 0.01 and between the VIC isolates was 0.07(excluding H2(2» or 0.34 (including H2(2». However, the distances among the WA isolates were ashigh as 0.56. The isolate NH9 was quite distinctfrom all other Australian isolates, the closest beingMD3 (D =0.22), also from WA. The closest relatedisolate to NH9, originating from outside Australia,was PKI4 (Pakistan; D = 0.33). The most similarisolates originating from outside Australia were C13(China) and MT3 (Manitoba, Canada; D = 0.06).The Australian isolate JU6 was found to be veryclose to both of these (D = 0.07 and 0.01, respectively). Of the isolates originating from outsideAustralia, the two most distant were S10 (Syria) andUSAI (North America; D = 0.59).
Hierarchical clustering The dendrogram, constructed from the distance matrix, illustrated thegenetic relationships between isolates (Figure 1).When the dendrogram was cross-sectioned at agenetic distance of approximately 0.25, one largecluster (A) comprised most isolates from VIC (RB6,RBI2, H3 and L2), SA (TF6, TFI5, YLlO andYLI3), NSW (JU5 and JU6), Canada (MT3, MT12and SK6), China (C13) and North America (USAI).Within cluster A, Australian isolates from VIC, SAand NSW were closest.
There were a further five clusters which contained a relatively small number of isolates. Thesewere: B, comprising two isolates from WA (NHI4and MD5); C, comprising H2(2) from Horsham,VIC; D, comprising PKI3 from Pakistan; E, comprising another two isolates from WA (NH9 andMD3); and F, comprising PKI4 from Pakistan.Isolate H2(2) was the most distantly related VICisolate, clustering quite separately from other isolates collected within the same region and at distances approximately similar to those in cluster B(WA isolates = 0.40) and cluster D (Pakistan isolate= 0.47). However, a smaller distance was observed
Australasian Plant Pathology Vol. 29 (1) 2000

between H2(2) and the remaining VIC isolates(0.34), showing the limits ofthe clustering representation for the more distant isolates. Also, isolatesthat were collected from the same location withinWA (NH9 and NH 14) were not as close as thosecollected from different locations (NH14 andMD5). The distance matrix revealed that NH9 wasvery distinct from all other isolates included in thisstudy except MD3 (D = 0.22), particularly fromthose from SA (D > 0.82), VIC (D > 0.62) and NSW(D> 0.67).
Principal coordinates analysis Principal coordinates analysis (PCA) demonstrated that the firstthree axes (or eigenvalues) accounted for almost90% of the total variation among isolates (74%,10% and 4%, respectively). Although the third axisexplained very little of the total variation, it wasuseful in discriminating several of the isolates,explaining a large proportion of the variationbetween isolates PK13, PKl4 and H2(2). Hence a
3-D representation ofthe isolates was plotted whichdemonstrated their genetic structure in a clearermanner than the dendrogram (Figure 2). In particular, the WA isolates MD3 and NH9 appeared verydistant from other Australian isolates.
Analysis of molecular variance - pathotypediversity Data from the isolate H2(2) (VIC), werenot included in the analyses due to the atypicallylarge genetic distances revealed between H2(2) andthe remaining isolates ofthe same region. This maybe related to the fact that isolate H2(2) originatedfrom a seed sample from Pakistan but this seed hadbeen trialled in WA in the previous growing season.
The AMOVA showed that the variation withingroups defined as 'within Australia' and 'outsideAustralia' (96.3%) was much greater than the variation between them (3.7%). This was significant atP<O.Ol.
The genetic variability revealed among Australian isolates was as large as the genetic variability
TF6TF15YLIOYL13Ra6
Ral2H3
L2USAI
S10
JU5JU6MT3C13
MT12 ----SK6
NH14MD5
HZ(2)PK13
NH9MD3PK14
i Io ... Averagedistancebetween clusters
Figure 1 A dendrogram showing genetic relationships between 23 isolates ofAscochyta lentis, usingdistances produced with the simple matching coefficient and constructed with the UPGMA algorithm.Isolate details are shown in Table 1. The dotted line represents the point of intersection with which sixclusters are produced (distance = 0.25).
Australasian Plant Pathology Vol. 29 (I) 2000 41

observed within a group of isolates sampled fromdifferent continents outside Australia. However,from the AMOVA between the Australian isolates(excluding H2(2», the variation within groupsdefined as 'VICINSW/SA' or 'WA' (28.8%) wasmuch less than the variation between them (71.2 %).This was significant at P<O.Ol.
Thus there was a clear partitioning of variation(isolates) between eastern (VIC, SA and NSW) andwestern (WA) regions of Australia. When theAMOVA was conducted to observe variationamong groups defined by 'state' oforigin, the greatest 'within state' variation was among isolates fromWA (59.2%). The other three states showed a muchlower variation; SA (1.1%), VIC (7.8%) and NSW(5.6%). Also the total molecular variance between'state' groups (60.8%) was much greater than thevariance within 'state' groups (30.2%).
Prediction ofpathotype class and mating typeResults of analysis of variance for specific RAPDbands are shown in Table 3. Band 7, generated with
primer OPE-07, explained the most variation inpathotype classes (R-square of 0.36, P<O.O 1;Table 3).The other bands, significant at 5% (4, 69, 72, 84 and86) had an R-square value of 0.19 (Table 3).
When both band 4 and either band 69, 72, 84 or86 were declared in a two-way ANOVA, they didnot explain more than a single band (same R-squarevalue; Table 4), indicating that the second band was
Table 3 ANOVA models of single RAPDmarkers best able to explain isolate pathotype
RAPD Sum of Rvsquare" F value Prob.band squares
4 13.04 0.19 4.57 0.057 24.49 0.36 10.88 0.003869 13.04 0.19 4.57 0.0572 13.04 0.19 4.57 0.0584 13.04 0.19 4.57 0.0586 13.04 0.19 4.57 0.05
AR-square is the coefficient ofdetermination ofthemodel.
----
-----NH9L~
----
/ ..,. .__,,-.__ MD3 PKly.///~/"'/" -----t-·-·--·,··--···---·-.-.-+-
./~// I',~~ !
I _,,,,,,-..>""-
0.49!'!lI
Ii __----I.
0.14 ~// ....../ JU5 T3iC1~:L. S~h~.> ' 1"'7 :i 3· aWl- • ~- -J. --._, I
II, t.1 ,"- ;--:\'. "- •-> -----.-.----... -.
i.. __TF~TF15 '-:r-:» ' . ''.-. -.-..-:: 0.384
I"./ I --- ...-...-~.-.'",./' I :.- ..... ---.--.,.. ..' '-. ,/'
-0.21 K:_ I .>: .>: ., -.-.-.-. ""-" .. , .• ' ;/·~.1230.969 .--------.,.l.:.:.:.' . '.---" . ,//
0761 -----_ •••• -. -.-/ PC 3 - 3.6 %. ---_-,../ /~ -0.138
PC 1 - 73.9 % LA 0.554 --------___ ,/'/'----~...
'"oGo
0.346' -.0.398
Figure 2 Principal Coordinates Analysis of 23 isolates of Ascochyta lentis produced using the simplematching coefficient. The three major axes are shown. Isolates represented by a pyramid originated fromAustralia, cross = Canada, heart = Pakistan, square = Syria, circle = China and flag = America.
42 Australasian Plant Pathology Vol. 29 (1) 2000
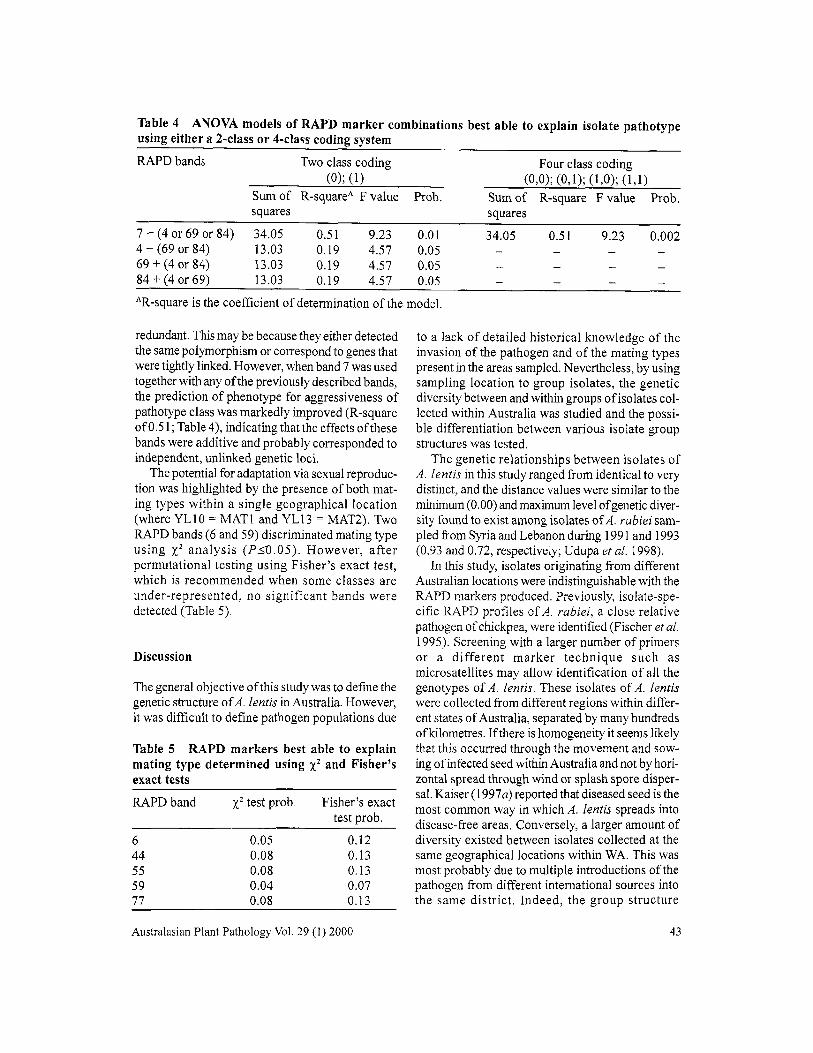
Table 4 ANOVA models of RAPD marker combinations best able to explain isolate pathotypeusing either a 2-class or 4-class coding system
RAPDbands Two class coding(0); (1)
Sum of Rssquare" F value Prob.squares
Four class coding(0,0); (0,1); (1,0); (1,1)
Sum of R-square F value Prob.squares
7 + (4 or 69 or 84)4 + (69 or 84)69 + (4 or 84)84 + (4 or 69)
34.0513.0313.0313.03
0.510.190.190.19
9.234.574.574.57
0.010.050.050.05
34.05 0.51 9.23 0.002
AR-square is the coefficient of determination of the model.
redundant. This may be because they either detectedthe same polymorphism or correspond to genes thatwere tightly linked. However, when band 7 was usedtogether with any ofthe previously described bands,the prediction of phenotype for aggressiveness ofpathotype class was markedly improved (R-squareofO.51; Table 4), indicating that the effects ofthesebands were additive and probably corresponded toindependent, unlinked genetic loci.
The potential for adaptation via sexual reproduction was highlighted by the presence ofboth mating types within a single geographical location(where YLlO == MATI and YLl3 == MAT2). TwoRAPD bands (6 and 59) discriminated mating typeusing X2 analysis (P5D.05). However, afterpermutational testing using Fisher's exact test,which is recommended when some classes areunder-represented, no significant bands weredetected (Table 5).
Discussion
The general objective ofthis study was to defme thegenetic structure ofA. lentis in Australia. However,it was difficult to define pathogen populations due
Table 5 RAPD markers best able to explainmating type determined using X2 and Fisher'sexact tests
RAPD band X2 test prob. Fisher's exacttest prob,
6 0.05 0.1244 0.08 0.1355 0.08 0.1359 0.04 0.0777 0.08 0.13
Australasian Plant Pathology Vol. 29 (I) 2000
to a lack of detailed historical knowledge of theinvasion of the pathogen and of the mating typespresent in the areas sampled. Nevertheless, by usingsampling location to group isolates, the geneticdiversity between and within groups ofisolates collected within Australia was studied and the possible differentiation between various isolate groupstructures was tested.
The genetic relationships between isolates ofA. lentis in this study ranged from identical to verydistinct, and the distance values were similar to theminimum (0.00) and maximum level ofgenetic diversity found to exist among isolates ofA. rabiei sampled from Syria and Lebanon during 1991 and 1993(0.93 and 0.72, respectively; Udupa et al. 1998).
In this study, isolates originating from differentAustralian locations were indistinguishable with theRAPD markers produced. Previously, isolate-specific RAPD profiles of A. rabiei, a close relativepathogen ofchickpea, were identified (Fischer et al.1995). Screening with a larger number of primersor a different marker technique such asmicrosatellites may allow identification of all thegenotypes of A. lentis. These isolates of A. lentiswere collected from different regions within different states of Australia, separated by many hundredsofkilometres. Ifthere is homogeneity it seems likelythat this occurred through the movement and sowing ofinfected seed within Australia and not by horizontal spread through wind or splash spore dispersal. Kaiser (1997a) reported that diseased seed is themost common way in which A. Ientis spreads intodisease-free areas, Conversely, a larger amount ofdiversity existed between isolates collected at thesame geographical locations within WA. This wasmost probably due to multiple introductions of thepathogen from different international sources intothe same district. Indeed, the group structure
43

revealed by the dendrogram and principlecoordinates analysis demonstrated that several international isolates clustered with isolates collectedwithin Australia.
It is difficult to link the introduction ofspecificisolates ofthe fungus into Australia with individualseed import events, particularly when dealing withsuch a small sized isolate population. The presenceof genetically distinct isolates of A. lentis in WAmay, however, be connected with field trials ofseedimported from Pakistan in 1995. The cluster comprising WAisolates NH9 and MD3, was associatedmost closely with the cluster comprising Pakistanisolate PK14. Pakistan seed lines were also broughtfrom WA into VIC and field trials were performedin Horsham in 1995 (M. Materne, personal communication). It is possible that H2(2) is a hybrid produced from sexual recombination between a Pakistan and WAisolate, which would be consistent withits placement in the dendrogram, clustering outsidethe large group comprising all the other VIC isolates. Furthermore, lentil lines were recently introduced to SA from VIC. This may account for theclose relatedness ofthese isolates. Together, thesescenarios represent examples of the way in whichA. lentis spread throughout the lentil growing areasof Australia.
In this study, two RAPD bands were identifiedthat, when used in unison, were able to significantlypredict the pathotype class of an isolate of A. lentis.The lack of interaction between the marker loci mayindicate that pathogenicity is oligogenic. Screeningmore markers is likely to increase the amount ofvariation explained. However, a relatively largenumber of markers may be required since pathogenicity genes are thought to occupy only 0.1 % ofa 20 Mb fungal genome (Fischer et al. 1995). Similarly, no RAPD markers significantly discriminatedthe mating types of A. lentis, most probably due tothe small amount of the genome occupied by themating type gene(s).
Analysis of molecular variance revealed thatvariation among isolates ofA. lentis collected fromwithin Australia was of similar magnitude to variation among isolates originating from outside Australia. There was greater variability among isolatescollected in WAthan isolates collected from a muchlarger area ofeastern Australia. Furthermore, therewas significant partitioning of variation between thewestern and eastern states ofAustralia. Using a setofeight lentil lines, Nasir (1998) reported that variation in pathogenicity between Australian isolates
44
was greater than between the Canadian isolatesexamined by Ahmed et al. (1996). However, differences in differential host set, methodology ofdisease screening, geographical distribution ofsamples, time of sampling as well as presence ofmore than one mating type are reasons for cautionwhen comparing studies.
In conclusion, due to diversity in isolates ofdifferent mating type, the potential for adaptation viasexual reproduction is great. Ahmed and Morrall(1995) reported that in Canada, changes in a population of A. lentis over a 15-year period hadoccurred by selection pressure for greater virulence.Therefore, management strategies aimed towardscontrol of A. lentis in Australia need to be formulated and applied quickly in order to prevent anincrease in the current threat ofthis pathogen to thelentil industry. Apart from the existing managementpractices (such as the use of fungicides and resistant germplasm) testing for the presence of multiplemating types prior to sowing may be a considerationof the future.
Acknowledgement
Funded support for this project was provided by anAustralian Postgraduate Award (Industry) grantfrom the Australian Research Council.
References
Ahmed, S.K. and Morrall, R.AA. (1995) - Populationchanges in Ascochytafabae f. sp. lentis over IS yearsoflentil cultivation in Saskatchewan. In Proceedings2nd European Conference on Grain Legumes, Copenhagen. p. 76.
Ahmed, S.K., Morrall, R.A.A and Kaiser, WJ. (1996)- Distribution of mating types of Ascochytafabae f.sp. lentis. Canadian Journal ofPlant Pathology 18:347-353.
Ali, S.M., Nitschke, L.P, Dube, A.J., Krause, M.R. andCameron, B. (1978) - Selection ofpea lines for resistance to pathotypes ofAscochyta pinodes, A. pisi, andPhoma medicaginis val'.pinodella. Australian Journal ofAgricultural Research 29: 841-849.
Apostol, B.L., Black, w.e., Miller, B.R., Reiter, P. andBeaty, BJ. (1993) - Estimation of the number offul!sibling families at an oviposition site using RAPD-PCRmarkers: Applications to the mosquito Aedes aegypti.Theoretical and Applied Genetics 86: 991-1000.
Australasian Plant Pathology Vol. 29 (1) 2000

Arnau, 1, Housego, AP. and Oliver, KP. (1994) - The useofRAPD markers in the genetic analysis of the plantpathogenic fungus. Current Genetics 25: 438-444.
Excoffier, L. (1993) - WINAMOVA. Genetics andBiometry Laboratory, Department of Anthropology,University of Geneva, Switzerland: ftp:anthropologie.unige.ch
Excoffier, L., Smouse, P.E. and Quattro, J.M. (1992) Analysis of molecular variance inferred from metricdistances among DNA haplotypes: Application tohuman mitochondrial DNA restriction data. Genetics131: 479-491.
Fischer, C., Porta-Puglia, A and Barz, W. (1995) RAPD analysis ofpathogenic variability in Ascochytarabiei. Journal ofPhytopathology 143: 601-607.
Gossen, B.D., Sheard, J.W., Beauchamp, CJ. andMorrall, RAA (1986) - Ascochyta lentis renamedAscochyta fabae f. sp. lentis. Canadian Journal ofPlant Pathology 8: 154-160.
Kaiser, WJ. (1997a) - Intra- and international spread ofascochyta pathogens of chickpea, faba bean and lentil. Canadian Journal ofPlant Pathology 19: 215224.
Kaiser, W.J. (1997b) - Distribution of mating types andthe teleomorph ofAscochyta rabiei on chickpea inTurkey. Plant Disease 81: 1284-1287.
Kaiser, WJ. and Hallier, B.C. (1993) - Didymella sp., theteleornorphof Ascochytafabae f. sp. lentis, on lentilstraw Phytopathology 83: 692 (Abstr.).
Kaiser, WJ., Wang, B.C. and Rogers, J.D. (1997)Ascochytafabae and A. lentis: Host specificity, teleomorphs (Didymella), hybrid analysis and taxonomicstatus Plant Disease 81: 809-816.
Kolmer, JA, Liu, J.Q. and Sies, M. (1995) - Virulenceand molecular polymorphism in Puccinia reconditef. sp. tritici in Canada. Phytopathology 85: 276-285.
McDonald, BA and McDermott, J.M. (1993) - Population genetics of plant pathogenic fungi. Bioscience43: 311-319.
Morjane, H., Geistlinger, J., Harrabi, M., Weising, K. andKahl, G. (1994) - Oligonucleotide fingerprintingdetects genetic diversity among Ascochyta rabiei isolates from a single chickpea field in Tunisia. CurrentGenetics 26: 191-197.
Nasir, M (1998) - Improvement of drought and diseaseresistance in lentils in Nepal, Pakistan and Australia.Mid-Term Report, Australian Centre for InternationalAgricultural Research project PN-9436.
Nasir M. and Bretag T. W. (1997a) - Prevalence ofAscochyta fabae f. sp. lentis on lentil seed from
Australasian Plant Pathology Vol. 29 (1) 2000
Victoria, Australia. Australasian Plant Pathology 26:117-120.
Nasir, M. and Bretag, T. W (1997b) - Pathogenic variability in Australian isolates ofAscochyta lentis. Australasian Plant Pathology 26: 217-220.
Nasir, M. and Hoppe, H. H (1991) - Studies on pathotype differentiation within Mycosphaerella pinodes(Berk and Bloxam) Vestergren, a component of theAscochyta-disease-cornplex of peas (Pisum sativumL.). Zeitschrift fur Pflanzen-krankheiten undPflanzenschutz 98: 616-626.
Peltonen,S., Jalli, M., Kammiovirta, K., and Karjalainen,R. (1996) - Genetic variation in Drechslera terespopulations as indicated by RAPD markers. Annals ofApplied Biology 128: 465-477.
Plummer, K.M., Dunse, K. and Howlett, BJ. (1994)Non-aggressive strains of the blackleg fungus,Leptosphaeria maculans, are present in Australia andcan be distinguished from aggressive strains by molecular analysis. Australian Journal ofBotany 42: 1-8.
Porta-Puglia, A., Crino, P and Mosconi, C. (1996)Variability in virulence to chickpea ofan Italian population ofAscochyta rabiei. Plant Disease 80: 39-41.
Rashid, KY, Bernier, C.c. and Conner, RL (1991)Evaluation offaba bean for resistance to Ascochytafabae and development of host differentials for raceidentification. Plant Disease 75: 852-855.
Schafer, C. and Wostemeyer. J.(1992)- Random primerdependent PCR differentiates aggressive from nonaggressive isolates of oilseed rape pathogen Phomalingam (Leptosphaeria maculans). Journal ofPhytopathology 136: 124-136.
Sicard, D., Michalakis, Y, Dron, M. and Neerna, C.(1997) - Genetic diversity and pathogenic variationof Colletotrichum lindemuthianum in the three centres of diversity of its host, Phaseolus vulgaris. Phytopathology 87: 807-813.
Taylor, P.W.J., Geijskes, J. R., Ko, H-L., Fraser, T.A.,Henry, RJ. and Birch, R.G. (1995) - Sensitivity ofrandom amplified polymorphic DNA analysis to detect genetic changes in sugarcane during tissue culture. Theoretical and Applied Genetics 90: 11681173.
Udupa, S.M., Weigand, F, Saxena, M.C. and Kahl, G.(1998) - Genotyping with RAPD and microsatellitemarkers resolves pathotype diversity in the ascochytablight pathogen ofchickpea. Theoretical and AppliedGenetics 97: 299-307.
Manuscript received 26 July 1999, accepted 23September 1999.
45


![Genetic diversity in green gram [Vigna radiata (L.)] landraces analyzed by using random amplified polymorphic DNA (RAPD)](https://img.pdfslide.net/doc/110x75/635c9c7988f33c6f8200465d/genetic-diversity-in-green-gram-vigna-radiata-l-landraces-analyzed-by-using.jpg)


