Embed Size (px)
Citation preview
Edith Cowan UniversityResearch Online
EDU-COM International Conference Conferences, Symposia and Campus Events
2008
Students Ranking, Based on their Abilities onObjective Type Test: Comparison of CTT and IRTAmir ZamanInternational Islamic University Islamabad
Atiq-Ur-Rehman KashmiriInternational Islamic University Islamabad
Mamoon MubarakAl Hussain Bin Talal University Jordon
Arshad AliUniversity of Peshawar
Originally published in the Proceedings of the EDU-COM 2008 International Conference. Sustainability in Higher Education: Directions for Change,Edith Cowan University, Perth Western Australia, 19-21 November 2008.This Conference Proceeding is posted at Research Online.http://ro.ecu.edu.au/ceducom/52
591
Zaman, A., Kashmiri, A., Mubarak, M. and Ali, A., International Islamic University Islamabad, Al Hussain Bin Talal University Jordon and University of Peshawar
Students Ranking, Based on their Abilities on Objective Type Test: Comparison of CTT and IRT Amir Zaman
1, Atiq-Ur-Rehman Kashmiri
2, Dr Mamoon Mubarak
3, Arshad Ali
4
1PhD Scholar (Education)
International Islamic University Islamabad.
E-mail: [email protected]
2Phd Scholar (Econometrics)
International Islamic University Islamabad.
E-Mail: [email protected]
3Al Hussain Bin Talal University Jordon
4University of Peshawar
ABSTRACT
The focus of this paper is to investigate the idea of differential ability for students ranking on a
multiple choice test in the subject of physics at secondary level. The weakness of Classical Test
Theory (CTT) in measuring the ability with continuity and consequently its ranking ability of students
on the basis of ability has been highlighted in this paper. In CTT, a student attempting a difficult
question and an easy question get equal credit which is not the case in Item Response Theory (IRT).
Moreover in CTT two students with equal raw score have the same ranking while in IRT they have
different ranking, making the job of policy maker easier to take decision. Two contemporary
approaches, CTT and IRT were compared on their suitability for ranking and measuring true ability on
teacher made test. The sample was 400, 9th grade students taken randomly from a variety of
population in Pakistan. A content valid test of 80 multiple choice items was used as instrument .This
attempt is an illustrative example that this problem can be overcome by using of Item Response theory
in measurement. The implication of this work for the teachers is to give more stress on teaching
cognitive skills rather than knowledge and for the policy maker to evaluate the students on the basis of
their cognitive skills achievement to award scholarship and recruitment.
Keywords: Ranking of Students, Item Response Theory, Students Ability, Classical Test Theory
INTRODUCTION
Assessment is an indispensable part of educational process. A major purpose of assessment in
educational settings is to measure students‘ achievement in order to make a variety of decisions based
on students‘ performance like to know their present level of learning and to what extent are they
ready for next learning experiences? ―Advances in technology and the growing presence of computers
in assessment provide tremendous opportunity to explore new ways to improve the quality of
assessment data‖ (Klein & Hamilton, 1999). The innovation in testing techniques like computer based
administration of tests enables us to collect additional information related to the interaction between
each individual examinee and a single item on the test. In theory of measurement in education and
psychology there are two contemporary approaches namely Classical Test Theory (CTT) and Item
Response Theory (IRT). Both are used to measure a sample of behaviour and a numerical value is
assign to the behaviour for quantification. In CTT the number of correct score is often taken as ability.
Moreover CTT measurement is holistic in nature and is based on the test as a whole while in IRT item
592
is the unit of assessment. Many studies have been conducted to investigate the comparability of items
and person statistic. Theoretically CTT is simple and easy to apply that is why its test statistics are still
commonly used in test construction process, however many researchers have questioned their utility in
the modern era. Hambelton and Jones (1993) also expressed their reservation about the use of
classical test theory estimators by saying that ―classical item statistics such as item difficulty and item
discrimination (i.e., point biserial correlations) and test statistics such as test reliability are dependent
on the examinee sample in which they are obtained‖. Similarly Fan (1998), Cantrell (1997) and
Henson (1999) has summarized and noted this problem as the estimators coming from CTT are
circular dependant i.e. the items parameter depends upon the examinee and the abilities of examinees
are function of items parameter.) This circular dependency in the case of easy test can exaggerate the
ability estimates of the students and difficult test can do the reverse job by underestimating the
abilities of examinees. Therefore, it is difficult to generalize the classical test theory estimators across
populations especially when they are at variance in abilities. Courville (in Traub and Rowley, 1991)
wrote that classical test reliability shows the quality of a set of test scores and hence, reliability is
dependent on characteristics of the group of students who take the test, in addition to being dependent
on characteristics administration of the test. Comparison of performance of different examinees is
another noteworthy limitation of CTT because the examinees must be given either the same or parallel
items. The problem is further accented by a third limitation of classical test theory in that parallel
forms are difficult to achieve. A fourth problem of classical test theory as reported by Courville (in
Hambelton & Swaminathan ,1985) is that it provides no basis for determining how an examinee
might perform when confronted with a test item. Finally, the theoretical assumption that the
measurement error is the same for all examinees is another limitation of CTT which may lead to
inappropriate ability measures.
Due to these criticisms there is a trend for shifting the focus to the Item Response Theory among test
developers and other stake holders. Furthermore the appropriateness of both frameworks for ranking
of students on the basis of their ability is an open question which we have addressed in this study.
ITEM RESPONSE THEORY: Item response theory (IRT) is, for some researchers, the answer to the
limitations of classical test theory as stated by Courville (2004, p.44). Item response theory (IRT)
looks at the examinee‘s performance by using item as the unit of assessment. Cantrell (1999),
Hambleton & Swaminathan, (1985) and Henard (2000) consider IRT as a modelling technique that
tries to describe the relationship between an examinee‘s test performance and the latent trait
underlying the performance.
There are two general factors in measurement while using CTT approach, an observed response (X)
i.e. scored obtained by the students on a particular task and a true ability (T) which is the real potential
in a student. This relationship in theoretical model of CTT can be written as X=T+E where E is
random error of measurement . IRT in comparison to CTT is based upon a family of the mathematical
models. Thus, both models are liable to mislead because they are dependent on the assumptions a
researcher is putting forward while working with given data (Hambleton & Swaminathan, 1985).
Hambleton and Swaminathan (1985) have pointed out the following four characteristics of an item
response model. (1) An IRT model must give specification the relationship between the measured
score and the underlying unobservable construct. (2) the model must provide a way to estimate scores
on the ability. (3) The examinee‘s scores will be the basis for the estimation of the underlying
unobservable construct. (4) this model assumes that the performance of an examinee is completely
predictable or can be explained from one or more abilities.
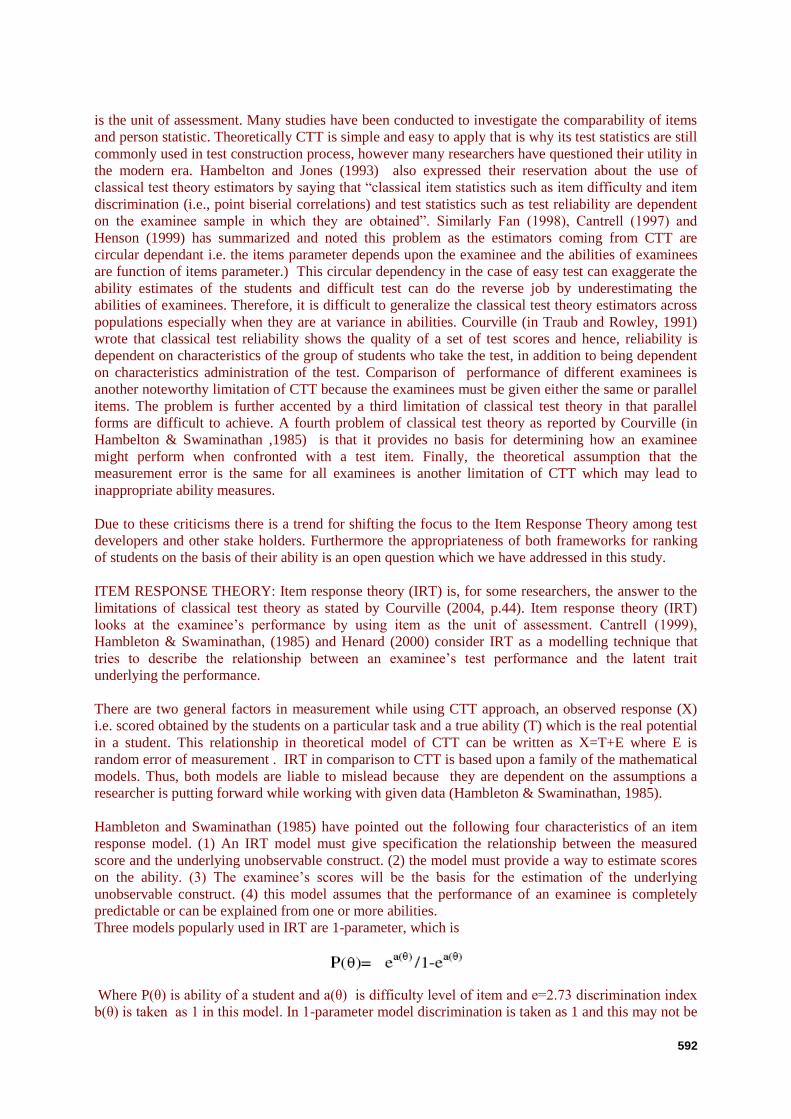
Three models popularly used in IRT are 1-parameter, which is
Where P(θ) is ability of a student and a(θ) is difficulty level of item and e=2.73 discrimination index
b(θ) is taken as 1 in this model. In 1-parameter model discrimination is taken as 1 and this may not be
593
of great utility where sharp measurement is required e.g. students with equal raw score will have equal
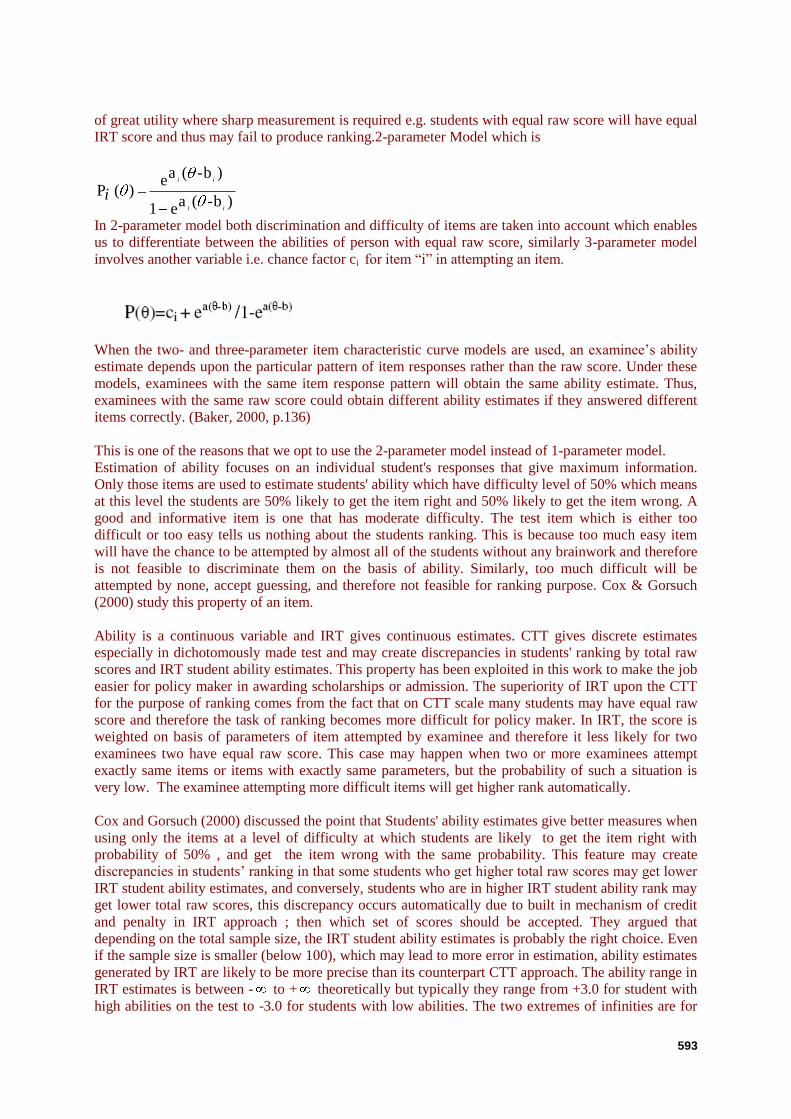
IRT score and thus may fail to produce ranking.2-parameter Model which is
)b-(ae1
)b-(ae
)( Pii
ii
i
In 2-parameter model both discrimination and difficulty of items are taken into account which enables
us to differentiate between the abilities of person with equal raw score, similarly 3-parameter model
involves another variable i.e. chance factor ci for item ―i‖ in attempting an item.
When the two- and three-parameter item characteristic curve models are used, an examinee‘s ability
estimate depends upon the particular pattern of item responses rather than the raw score. Under these
models, examinees with the same item response pattern will obtain the same ability estimate. Thus,
examinees with the same raw score could obtain different ability estimates if they answered different
items correctly. (Baker, 2000, p.136)
This is one of the reasons that we opt to use the 2-parameter model instead of 1-parameter model.
Estimation of ability focuses on an individual student's responses that give maximum information.
Only those items are used to estimate students' ability which have difficulty level of 50% which means
at this level the students are 50% likely to get the item right and 50% likely to get the item wrong. A
good and informative item is one that has moderate difficulty. The test item which is either too
difficult or too easy tells us nothing about the students ranking. This is because too much easy item
will have the chance to be attempted by almost all of the students without any brainwork and therefore
is not feasible to discriminate them on the basis of ability. Similarly, too much difficult will be
attempted by none, accept guessing, and therefore not feasible for ranking purpose. Cox & Gorsuch
(2000) study this property of an item.
Ability is a continuous variable and IRT gives continuous estimates. CTT gives discrete estimates
especially in dichotomously made test and may create discrepancies in students' ranking by total raw
scores and IRT student ability estimates. This property has been exploited in this work to make the job
easier for policy maker in awarding scholarships or admission. The superiority of IRT upon the CTT
for the purpose of ranking comes from the fact that on CTT scale many students may have equal raw
score and therefore the task of ranking becomes more difficult for policy maker. In IRT, the score is
weighted on basis of parameters of item attempted by examinee and therefore it less likely for two
examinees two have equal raw score. This case may happen when two or more examinees attempt
exactly same items or items with exactly same parameters, but the probability of such a situation is
very low. The examinee attempting more difficult items will get higher rank automatically.
Cox and Gorsuch (2000) discussed the point that Students' ability estimates give better measures when
using only the items at a level of difficulty at which students are likely to get the item right with
probability of 50% , and get the item wrong with the same probability. This feature may create
discrepancies in students‘ ranking in that some students who get higher total raw scores may get lower
IRT student ability estimates, and conversely, students who are in higher IRT student ability rank may
get lower total raw scores, this discrepancy occurs automatically due to built in mechanism of credit
and penalty in IRT approach ; then which set of scores should be accepted. They argued that
depending on the total sample size, the IRT student ability estimates is probably the right choice. Even
if the sample size is smaller (below 100), which may lead to more error in estimation, ability estimates
generated by IRT are likely to be more precise than its counterpart CTT approach. The ability range in
IRT estimates is between - to + theoretically but typically they range from +3.0 for student with
high abilities on the test to -3.0 for students with low abilities. The two extremes of infinities are for
594
over fit cases where the students either gives correct answers for all items or gives no correct answer,
such cases are omitted from IRT analysis. The difficulty estimates in IRT for items range from +3 to -
3. The item with difficulty level +3 and -3 are labelled as ―very difficult," and "very easy"
respectively.
PURPOSE OF THE STUDY
The main objective of this work is to compare CTT and IRT for their suitability of students ranking on
the basis of their scores for awarding scholarships or admission.
METHODS AND MATERIAL Data Source Four hundred students selected randomly from both private and public schools in District Malakand of
Pakistan, including both genders provided data for this study. A test with 80 multiple choice items was
administered.
Sample
Due to tedious nature of IRT analysis without a specialized software and manual marking 100 students
were selected randomly for final analysis.
Tools
Matlab software was used for programming to calculate IRT estimates. For this purpose the researcher
developed the programming themselves and no specialized software for IRT was used. The program
coding can be seen in appendix B.
Description of the Test
The test was developed by the researcher according to table of specification and was validated with the
help of subject teacher. Item analysis revealed that the test is consisted of a variety of items from very
difficult item with difficulty level of 20 to very easy item with difficulty level of 83.
Item difficulty of each of items in the test was computed by means of the following formula, in which
R is the number of students who answered the item correctly and T is the total number of students in
the test:
Item difficulty= 100T
R
To calculate the difficulty level of each item, 27% high achiever and 27% low achiever were taken. It
was assumed that the responses of the students in the middle group follow essentially the same pattern.
Item discriminating power of a test item refers to the degree to which it discriminates between students
with high and low scores. Discrimination power was computed as the difference between the averages
percent score of high and low achiever.
RESULT AND DISCUSSION
The test was scored using both approaches and ranking was made on the basis of both CTT and IRT
scores. It was observed from the ranking that there is considerable shift of students ranking when it
was made on basis of IRT. For example in CTT the top students was with score 72 and second was
who scored 68 but in IRT ranking this ranking changed and 68 was on top of the ranking. When the
595
answer sheet was analysed it was evident that IRT ranking is better because student with score 68
selected wrong choices for easy items and thus got less penalty while students with 72 in CTT
relatively could not answer the difficult items and got more penalty consequently lost his ranking.
Similarly two students who got 64 score in CTT were placed 4th in CTT ranking while in IRT ranking
they were placed 4th and 6
th respectively. Four students obtained 60 scores and were all in the same
ranking in CTT clearly showing the inability CTT approach to decide which one was better while they
were given different ranking in IRT where item was playing the role to decide. Students No.9 who was
placed 19th in CTT ranking was given better position in ranking due to the fact that he gave correct
choices for most difficult items. During the analysis it was found that only 9 students out of 100 had
the same ranking on both scales, 52 students got better ranking while 39 lost their position. This
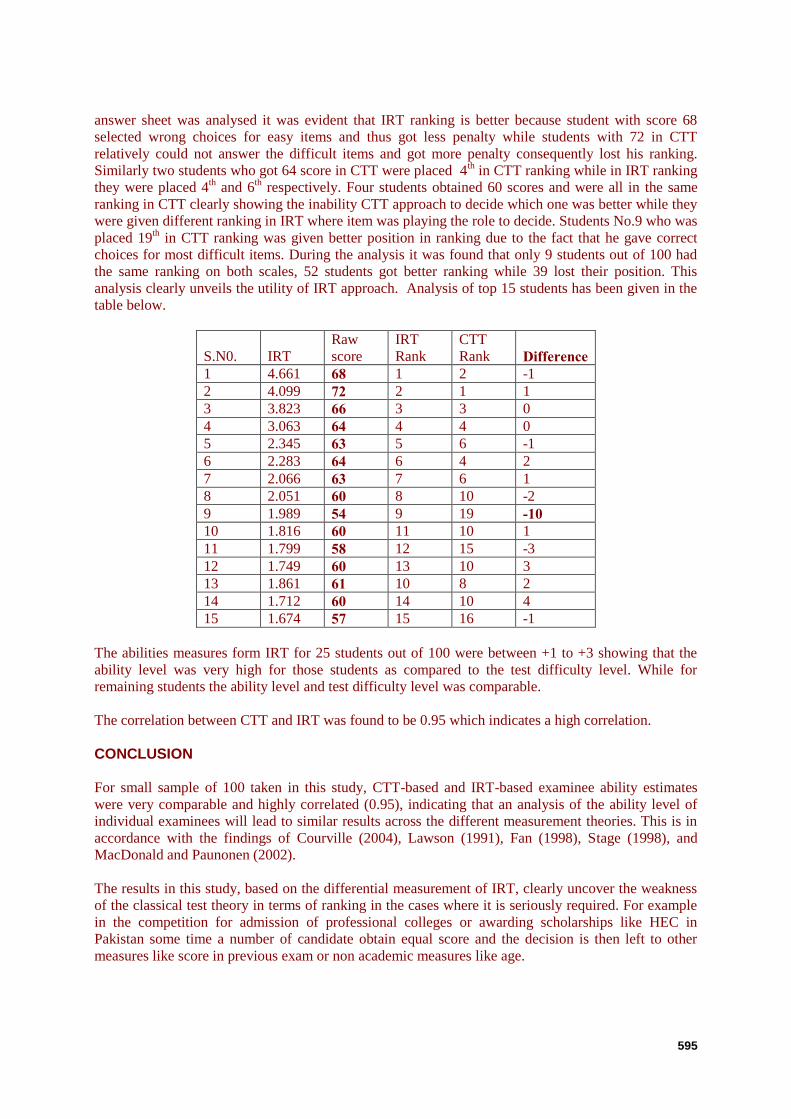
analysis clearly unveils the utility of IRT approach. Analysis of top 15 students has been given in the
table below.
S.N0. IRT
Raw
score
IRT
Rank
CTT
Rank Difference 1 4.661 68 1 2 -1
2 4.099 72 2 1 1
3 3.823 66 3 3 0
4 3.063 64 4 4 0
5 2.345 63 5 6 -1
6 2.283 64 6 4 2
7 2.066 63 7 6 1
8 2.051 60 8 10 -2
9 1.989 54 9 19 -10 10 1.816 60 11 10 1
11 1.799 58 12 15 -3
12 1.749 60 13 10 3
13 1.861 61 10 8 2
14 1.712 60 14 10 4
15 1.674 57 15 16 -1
The abilities measures form IRT for 25 students out of 100 were between +1 to +3 showing that the
ability level was very high for those students as compared to the test difficulty level. While for
remaining students the ability level and test difficulty level was comparable.
The correlation between CTT and IRT was found to be 0.95 which indicates a high correlation.
CONCLUSION
For small sample of 100 taken in this study, CTT-based and IRT-based examinee ability estimates
were very comparable and highly correlated (0.95), indicating that an analysis of the ability level of
individual examinees will lead to similar results across the different measurement theories. This is in
accordance with the findings of Courville (2004), Lawson (1991), Fan (1998), Stage (1998), and
MacDonald and Paunonen (2002).
The results in this study, based on the differential measurement of IRT, clearly uncover the weakness
of the classical test theory in terms of ranking in the cases where it is seriously required. For example
in the competition for admission of professional colleges or awarding scholarships like HEC in
Pakistan some time a number of candidate obtain equal score and the decision is then left to other
measures like score in previous exam or non academic measures like age.
596
This study has the implications for teacher as well in the sense that teacher should stress in the
learning of skill and higher order thinking instead of knowledge based domain which has less value
than the former.
The result of this study support the claim of (A. Hotui, 2006) that objective type test can be used to
measure high order skills because it was observed that the item which were falling in domain of higher
cognitive skill were difficult and thus those students who failed to give correct response got more
penalty in terms of losing score . The scores were from both CTT and IRT with a correlation
coefficient of 0.95 which supports Courville (2004, p.113) and courville (in Nunnally‗s, 1979)
assertion that when scores obtained by two approaches are correlated they correlate by degree of 0.90
or higher; thus it is really hair splitting to argue about any difference between the two approaches.
RECOMMENDATION The result of this study is a guide line for policy makers specially those who are engaged in awarding
scholarships or giving admission in professional institutions on the basis of test scores to adapt the IRT
approach while measuring the abilities which clearly has the advantage of differentiating among
students having equal raw score.
This work was carried with a 2-parmeter model which takes into account the difficulty and
discrimination of items, to exhibit the ability of IRT approach in measuring the ability along
continuous line enabling us to distinguish between students with different abilities clearly. The area of
possible research is to replicate this study with 3-parameter model where chance factor also comes
into play and to see what difference it makes in the ranking of the students.
REFERENCES
Baker F. (2001). The Basic of Item Response Theory. Test calibration. Pp. 136-137 Eric Clearing
House ISBN 1-886047-03-0 retrieved from http//ericae.net/irt. Dated 31-01-08.
Cantrell, C.E. (1999). Item response theory: Understanding the one-parameter rasch model. In B.
Thompson, Advances in social science methodology (Vol. 5, pp. 171-192). Stamford, CT: JAI Press.
Crocker, L., & Algina, J. (1986). Introduction to classical and modern test theory. New York: Holt,
Rinehart & Winston.
Douglas F.; Robert A. (1992). An Empirical Investigation of Thurstone and IRT Methods of Scaling
Achievement Tests.Journal of Educational Measurement, Vol. 29, No. 4. pp. 341-354.
Faisal A. Abdelfattah(2007). Response Latency Effects On Classical And Item Response Theory
Parameters Using Different Scoring Procedures.A dissertation the College of Education of Ohio
University.
Fan X. Item response theory and classical test theory: an empirical comparison of their item/person
statistics. Educational and Psychological Measurement June 1998 v58 n3 p357(25)
Greta J. Gorsuch and Tom Cox.(2000) Teaching of English as Foreign Lanuage or second language
Texas Tech University. Retrieved from http://www-writing.berkeley.edu/TESL-EJ/ej16/toc.html
Hambleton, R. & Swaminathan, H. (1985). Item response theory. Boston: Kluwer Nijhoff.
Hambleton, R. K., Swaminathan, H., & Rogers, H. J. (1991). Fundamentals of item response theory.
Newbury Park, CA: Sage.
597
Hambelton, R. & Jones, R. (1993). Comparison of classical test theory and item response theory and
their applications to test development. Educational Measurement: Issues and Practice, 12, 38-47.
Henard, D.H. (2000). Item response theory. In L. Grimm & P. Yarnold (Eds.), Reading and
understanding more multivariate statistics (pp. 67-97). Washington, DC: American Psychological
Association.
Henson, R. (1999, January) . Understanding the one-parameter Rasch model of item response theory.
Paper presented at the annual meeting of the Southwest Educational Research Association, San
Antonio, TX. (ERIC Document Reproduction Service No. ED 428 078).
H.Angelica (2006). The relationship between item difficulty and Discrimination indices in multiple-
choice tests in a Physical science course. Master Thesis. Florida Atlantic University Boca Raton,
Florida.
Klein, S. & Hamilton, L. (1999). Large-scale testing current practices and new directions. Pittsburgh,
PA: RAND.
Leonardo S. et al (2003). Some Applications of Item Response Theory to Testing. The Philippine
Statistician, Vol. 52, Nos. 1-4, pp. 81-92
Lawson, S. (1991). One Parameter latent trait measurement: Do the results justify the effort?. In B.
Thompson (Ed.), Advances in educational research: Substantive findings, methodological
developments (Vol. 1, pp. 159-168). Greenwich, CT: JAI Press.
Lutfi A. Lutfiyya. Mathematical thinking of high school students in Nebraska. INT. J. Math. Educ.
SCI.Technol., 1998, VOL. 29, NO. 1, 55-64
MacDonald, P. & Paunonen, S. (2002). A Monte Carlo comparison of item and person statistics based
on item response theory versus classical test theory. Educational and Psychological Measurement, 62,
921-943.
Stage, C. (1998). A comparison between item analysis based on item response theory and classical test
theory: A study of the SweSAT ERC. (Educational Measurement No 30). Umea University,
Department of Educational Measurement.
Stage, C. (1999). A comparison between item analysis based on item response theory and classical test
theory: A study of the SweSAT test READ. (Educational Measurement No 31). Umea University,
Department of Educational Measurement.
Susan E. Embretson(1996). The New Rules of Measurement Psychological Assessment. 1996, Vol. 8,
No. 4. 341-349 1040-3590 University of Kansas.
Traub, R. & Rowley, G.(1991). Understanding reliability. Educational Measurement: Issues and
Practice, 8, 8-14.
Troy C.G. (2004).An Empirical Comparison of Item Response Theory and Classical Test theory
item/person statistics. PhD dissertation Texas A&M University.
van der Linden, W. J., & Glas, C. A. (2000). Computerized adaptive testing: theory and practice.
Dordrecht: Kluwer Academic Publisher.
Wiberg m(2004). Classical test theory vs. Item response theory. An evaluation of the theory test in the
Swedish driving-license test. EM no 50, ISSN 1103-2685
598
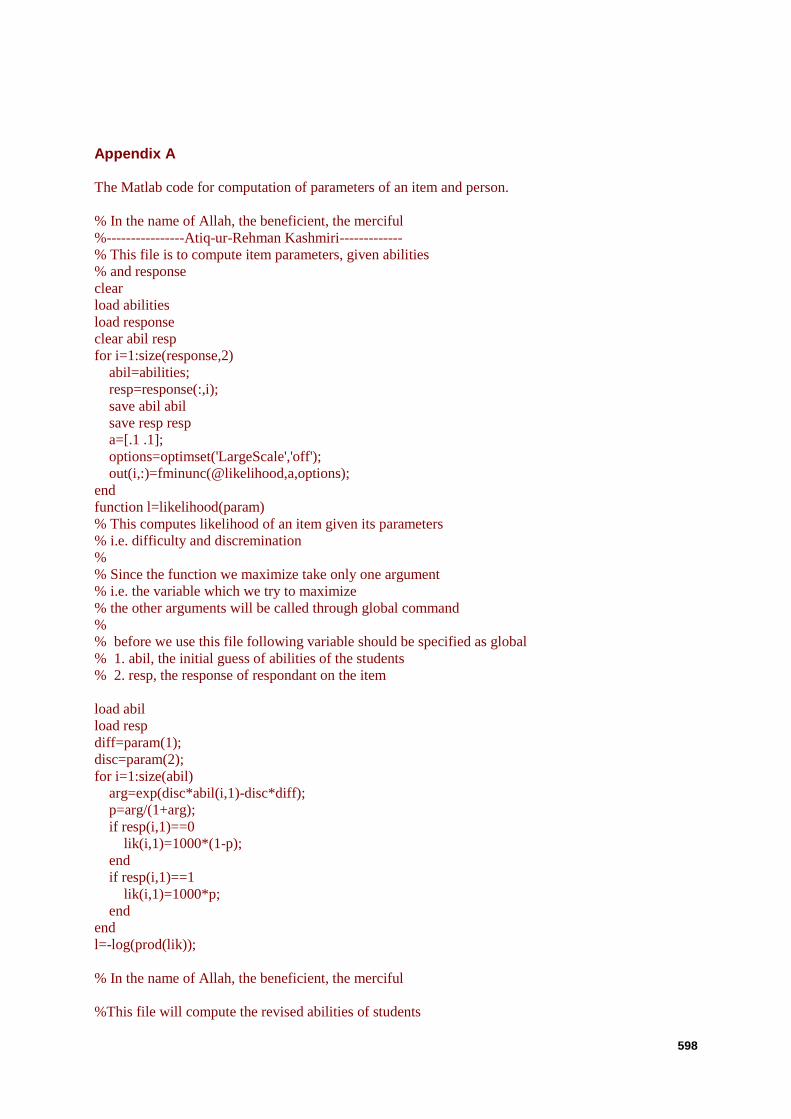
Appendix A
The Matlab code for computation of parameters of an item and person.
% In the name of Allah, the beneficient, the merciful
%----------------Atiq-ur-Rehman Kashmiri-------------
% This file is to compute item parameters, given abilities
% and response
clear
load abilities
load response
clear abil resp
for i=1:size(response,2)
abil=abilities;
resp=response(:,i);
save abil abil
save resp resp
a=[.1 .1];
options=optimset('LargeScale','off');
out(i,:)=fminunc(@likelihood,a,options);
end
function l=likelihood(param)
% This computes likelihood of an item given its parameters
% i.e. difficulty and discremination
%
% Since the function we maximize take only one argument
% i.e. the variable which we try to maximize
% the other arguments will be called through global command
%
% before we use this file following variable should be specified as global
% 1. abil, the initial guess of abilities of the students
% 2. resp, the response of respondant on the item
load abil
load resp
diff=param(1);
disc=param(2);
for i=1:size(abil)
arg=exp(disc*abil(i,1)-disc*diff);
p=arg/(1+arg);
if resp(i,1)==0
lik(i,1)=1000*(1-p);
end
if resp(i,1)==1
lik(i,1)=1000*p;
end
end
l=-log(prod(lik));
% In the name of Allah, the beneficient, the merciful
%This file will compute the revised abilities of students
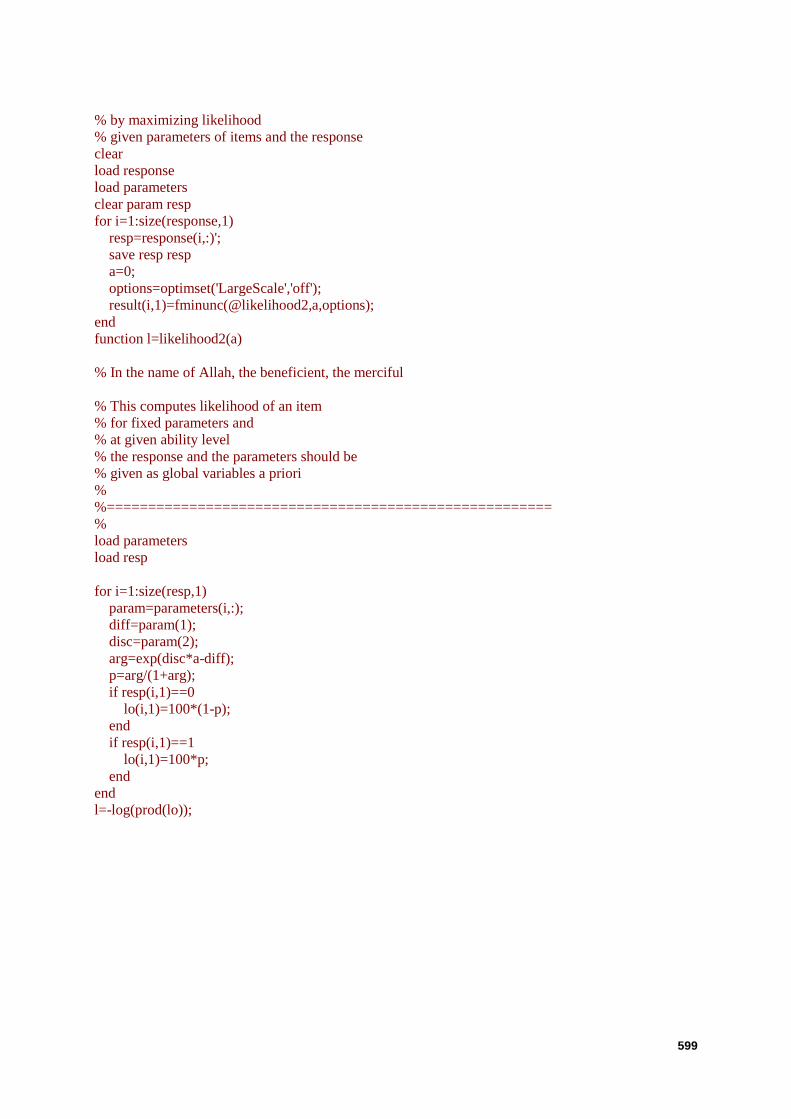
599
% by maximizing likelihood
% given parameters of items and the response
clear
load response
load parameters
clear param resp
for i=1:size(response,1)
resp=response(i,:)';
save resp resp
a=0;
options=optimset('LargeScale','off');
result(i,1)=fminunc(@likelihood2,a,options);
end
function l=likelihood2(a)
% In the name of Allah, the beneficient, the merciful
% This computes likelihood of an item
% for fixed parameters and
% at given ability level
% the response and the parameters should be
% given as global variables a priori
%
%======================================================
%
load parameters
load resp
for i=1:size(resp,1)
param=parameters(i,:);
diff=param(1);
disc=param(2);
arg=exp(disc*a-diff);
p=arg/(1+arg);
if resp(i,1)==0
lo(i,1)=100*(1-p);
end
if resp(i,1)==1
lo(i,1)=100*p;
end
end
l=-log(prod(lo));


