Embed Size (px)
Citation preview

STUDIES OF MOLECULAR BONDING , INTERACTIO NS
AN D DECOMPOSITION REACTIO NS ON
THE (001) SURFACE OF RUTHENIUM.
Thesis by
Brian H . Toby
In Partial Fulfillment of the R equirements
for t he Degree of
Doctor of Philosophy
California Institute of Technology
Pasadena, Californ ia
1987
(Submitted October 2, 1986)
This thesis is dedicated to the memory of three
inspirational people who did not live to see the
completion of this work ,
Violetta Adams, Mirra Breitman
and Stan Rogers.
Their presence is missed by many.

.. nz
Acknowledgments
My years at Cal t ee h have b een extrem ely fruitful and I have grown consider ab ly - if not in stature, at least in breadth. I have found myself to be part of a warm support ive community and have had t he chance to fulfill a number of life-long dreams. To all those who have helped make this possible, I a.m very grateful. I wish to express my appreciation to all those people without whom I would Tl<'Ver have arr ived at Caltech or without whom I n ever would have stayed. But to attempt to mention everyone in a s ingle page is futile. To all thos<' whom I have not thanked explicitly, blame not my memory, rather t h e lack of space and time.
I am grateful to my research advisor, W. Henry Weinberg, for giving me the opportunity to follow my interests, both inside and outside the laboratory. I remember with appreciation everyone in the Weinberg group whose paths overlapped with mine. I particularly wish to thank Eric Hood, Ted Madey, Ne il A very and Udo Schwa.lke for their friendship , instrnr.t.ion and collahora.t.ion. My special thanks to my coworker Malina Hills ; her help and friendship came to me at several dark times of true need. Thanks to ZAR (Dan Zirin) for a superbly run computer system.
Many members of the Rutgers School of Chemistry served as sources of advice a nd inspiration. Particular thanks go to Frina Toby, Sidney Toby, Harvey Schugar and Joseph Potenza.
I thank my supervisors at Union Carbide, Herb Hillery and Gordon Cagle, for doing so much over the last year to ease my path while working to complete this Thesis .
California may be a long way from my relatives, but I have never been shor t on family while here. I already miss the chance to see the Nimoys , the Josephs , t he Manzano j Noor family and the Organj Satz / Metz brouhaha. Without my adoptive families, life at Caltech could never have b een as comfortable, secure, fun or fatt ening.
Caltech is not just. a place to do science , b u t is an institution filled with active, motivat~d people. I had the great fortune to be involved in the Graduate Student Council, the Caltcch Y, J. A. Profrock House (on-campus) and KPFK , the LA Reader, and the D emocratic C lub of Pasadena Foothills (off-campus). I also worked to found the the Caltech Folk Mus ic Society and the R ed Door Cafe . B est wishes to the folks who keep them running in my absen ce. My gratitude to the Caltech administration and staff for giving this student the latitude to fo llow his dreams.
I have gotten by with a little help from my friends Simon, Ronnie , M yra, Joanne, Roz and Howa rd. I have basked in the love of the closest friends that I have ever m a d e, Kath, Bruce and Joanna. Words fail when I try to express the debt I feel. Thanks to you too Carole. Jackie, thanks for your patience and sagacious advice.

zv
Abstract
The interactions of N2, formic ac id and acetone on thE> Ru(OOl) surface are
studi<'d u sing t herma l desorption mass spectrometry (TDMS), e lectron energy
loss sp<'r.troscopy (EELS) , and computer modeling .
Low Pn ergy elect ron diffraction (LEED), EELS and TDMS were used t o
study ch<:misorption of N2 on Ru(OOl). Adsorption at 75 K produces two
desorption states. Adsorption at 95 K fills only the higher energy desorption
state and produces a ( v3 x \/3)R30" LEED pattern. EEL spectr a indicate both
desorption states are populated by N2 molecules bonded "on-top" of Ru atoms.
Monte Carlo s imulation results a re presented on Ru (OOl ) using a kinetic
lat t ice gas model with precursor mediated adsorption, d esorption and migration.
The model gives good agreement with experimental data. The island growth
r ate was computed us ing the sam e model and is well fit by R(t) m - R(t 0 )rn = At ,
with m approximately 8. The island s ize was determined from the width of t h e
superlattice diffraction feature.
The techniques, algorithms and computer programs used for simulations a re
documented. Coordinate schem es for indexing s ites on a 2-D hexagon a l lattice,
programs for s imulation of adsorption and desorption, t echniques for a n a lysis of
ordering , and computer graphics rout ines are discussed .
The a dsorption of formic acid on Ru(OOl) has been studied by EELS and
TDMS. La rge exposures produce a molecular multilayer species. A mono den tate
formate, bidentate formate, and a hydroxy l species a re stable intermediates in
formic acid decompos ition . The monodentate formate species is con verted to
t h e bidentate species by heating. Formic acid decomposition products a re C02 ,
CO, H2, H20 and oxygen a d atoms. The ratio of desorbed CO with respect to
C02 incr eases both with s lower heating r ates and with lower cover ages.
The existence of two different forms of a dsorbed acetone , s ide-on , bonded
through the oxygen and acyl carbon, and end-on, bonded through the oxygen ,
have been verified by EELS. On Pt(lll) , only the end-on species is observed .

v
On dean Ru(OOl) and p(2 ·· 2)0 pr<'<:over t> d Ru(OOl), both forms coexist. The
side-on species is dominant on clean Ru(OOl) , while 0 s tabilizes the end-on form.
The end-on form desorbs molecu larly. Bonding geometry stabilit y is explained
by surfacf' Le"' ' is acidity and by comparison to organometallic coordination
cmnplex<~s .

Acknow ledgrnen ts
Abstract
Table of Contents
Section I: Nitrogen on R.u(001) : Local Surface Structure and its Effect on Adsorption and Desorption Kinetics
Chapter 1. Introduction .... . . 2
Chapter 2. Precursor-Mediated Molecular Chemisorption and Thermal Desorption: The Interrelationship:; among Energetics, Kinetics and Adsorbate Lattice Structures . . 8
Chapter 3. Simulation of N 2 Island Growth on Ru(001): Evidence for a New "Universality Class" . . . . . . . . . . . . 13
Appendix A: The:> Chemisorption of Nitrogen on the (001) Surface of Ruthenium . . . . . . . . . . . . . . . . . . . . . . . 57
Appendix B: Methodology for N2 Simulation Calculations . . . . 64
Appendix C: Listings of Computer Programs for N2 Simulations 94
Section II: Reaction of Carboxylate and Ketone Ligands on Metal Surfaces
Chapter 4. Introduction ....
Chapter 5. Decomposition of Formic Acid on Ru(001): An EELS
. . 180
Search for a Formic Anhydride Intermediate . . 186
C:havter G. Electron Energy Lo:;s Spectroscopy of the Decomposition of Formic Acid on Ru(001) . . 192
Chapter 7. The Adsorption of Formic Acid and the Decomposition of the Formate Intermediate on the (001) Surface of Ruthenium . . . . . . . . . . . . . . . . . . . . . . . 198
C hapter 8 . Contrasting Bonding Configurations of Acetone on Pt(111) and Ru(001) Surfaces . . . . . . . . . . . . . . . 243
Appendix D: End-On and Side-On Bonding of K etones to Surfaces : Acetone on the Ru(001) and Pt(ll1) Surfaces . . . . . . 249
Appendix E: Adsorption of Acetone both on the Clean Ru(OOl) Surface and on the R.u(001) Surface Modified Chemically by the Presence of an Ordered Oxygen Adatom Overlayer . . . . . . . . . . . . . . . 254

1
Section I.
Nitrogen on Ru(OOI): Local Surface Structure and
its Effect on Adsorption and Desorption Kinetics
Chapter l. Introduction
Chapter 2. Precursor-Mediated Molecular Chemisorption and Thermal
Desorption: The Interrelationships among Energetics, Kinetics
and Adsorbate Lattice Structures
Chapter 3. Simulation of N 2 Island Growth on Ru(OOl): Evidence for a
New "Universality Class"
Appendix A: The Chemisorption of Nitrogen on the (001) Surface of Ruthe-
n1um
Appendix B: Methodology for N 2 Simulation Calculations
Appendix C: Listings of Computer Programs for N2 Simulations

6 )
-~
Chapt<'r 1:
Introduction to Section I.
Nitrogen on Ru(OOI): Local Surface Structure and
its Effect on Adsorption and Desorption Kinetics
,1
The goals of sc ientific resea rch are to observe and class ify natura l
phenomena, and then to construct an interpretation within the context of
theory that applies to a more broad range of systems. Where theory cannot
be extended to agree with observation. new or more refined ideas must b e
developed. Theories are never prov<'n and are rarely disproven. They gain
acceptance when they are shown to he relevant to a wide range of problems.
Conversely, a theory that is never disproven, but is very limited in scope, loses
favor compared to a more utilizable theory.
The first section of this Thesis presents an example of this process in science .
The initial experimental results presented here h ave several unusual features that
require an unconventional interpretation. From the interpretation, a model for
the system was developed. The model was first demonstrated to be consistent
with the experimental results and finally it has been extended to predict results
for experiments yet unmade.
The initial electron energy loss spectroscopy (EELS) and thermal desorption
mass spectrometry (TDMS) and low energy electron diffraction (LEED) data
are presented in Appendix A. Interpretation of data for adsorption of N 2 at 95 K
is relatively straightforward. Nitrogen molecules adsorb in an end-on bonding
configuration on on-top (six-fold) Ru sites in a ( v3 X v'3)R30° overlayer with a
coverage of 1/ 3 monolayer, corresponding to adsorption at next-nearest-neighbor
positions. These molecules desorb in a single thermal desorption peak. If
adsorption is carried out at 75 K , additional molecules adsorb and a second,
low temperature thermal desorption feature is observed. Yet, the nitrogen
vibrational modes of the low temperature state molecules have approximately
the same frequencies as the high temperature state molecules . Thus , the two
states must both adsorb at the same sites.
Other unusual phenomena observed for N 2 adsorption, that arc not reported
here, are that if N 2 molecules are adsorbed at lOOK and additional N 2 is allowed
to adsorb after the surface has been cooled to 75 K, the number of molecules

4
desorbing in the high terrqwra turc st at<• mcrcases a t the expense of the t otal
saturation coverage on the surfar<' [ 1 j. If the t wo adsorpt ion steps are repeated
with different isotopes of N 2, most of t.h<· first isotope to be adsorbed desorbs in
the high temperature state . Finally, t h<' probability for N 2 molecules to adsorb
to the surface rises with coverage. reaching a maximum of approximately thrice
the initia l value at approximately 10% of a monolayer coverage [1,2]. Only a
few other cases had been noted in the literature, prior to t his work, where t h e
adsorption probability increases with coverage: oxygen on W(llO) [3] and N 2
on several W surfaces [ 4].
A method of correlating the seemingly contradictory isotopic labeling
results , which indicate two types of adsorption sites, the EELS results , which
indicate only one type of N 2 bonding, and the annealing population results ,
which indicate that the high temperature state partially blocks the low
temperature state, was initially suggested by N . R . A very. He proposed that
N 2 molecules form isla nds - small ordered ( yl3 x vi3)R30° domains - which
start from random nucleation points. When the is lands grow with increased
coverage, some islands will merge, but s ince there are three possible degenerate
( yl3 x yi3)R30° lattices, r elated by a single Ru unit cell t ranslation, out of
phase islands will grow until they "run into" each other . The molecules that
adsorb at antiphase domain boundaries are force d to adsorb on nearest-neighbor
sites, which are relatively unfavorable in energy. These low energy s it es w ill
be the last to b e filled and molecules which adsor b at these sites desorb a t
low temperatures even though there is no phys ical difference between them
and the high temper ature s ites. Higher temperature adsorption encourages the
formation of larger is lands, which have a smaller ratio of edge s ites to total s ites
and t hus the number of high tempf'r a.ture s ites is r aised while the number of low
temperature sites is lowered.
The explanation described above has a major failing. The saturation
coverage for N 2 adsorption at 75 K is approximately 50% of a monolayer and

5
this is well beyond the range of coverages that can be accommodated by the
additional sites created by antiphase boundaries. Nonetheless , it has served as
a s tarting point for the development of the more d etailed lattice gas model for
N2 adsorption and desorption which is presented in Chapter 2. It was found
to be necessary to incorporate precursor-mediated adsorption into the model to
give reasonable values for the probability of adsorption. The concept of a mobile
precursor state has been discussed in the literature since the mid-1970's [5], but
this is the first inclusion of a mobile precursor into a kinetic lattice gas model
for simulation of both adsorption and desorption. The model was adapted into
algorithms for Monte Carlo simulation of adsorption and thermal desorption,
which are described in Appendix B, and FORTRAN implementations of the
algorithms are given in Appendix C.
The results from the Monte Carlo simulations give excellent quantitative
agreement with the experimental probability of adsorption data and the thermal
desorption spectra. Simulations of isotope labeling duplicate the experimental
results, which show that the last molecules to be adsorbed are primarily the
first to be desorbed [6]. Saturation coverages are also in close agreement with
experimental results. The mode by which adsorption occurs for coverages above
approximately 40% of a monolayer was unanticipated. Islands do not stop
growing after they "run into" the edges of neigh boring islands. Rather, islands
continue to grow by "overlapping" each other, creating thick antiphase domains.
Adsorption continues in the antiphase domain regions at low rates until an
equilibrium is established when the adsorption rate matches the desorption rate .
The model was then applied to the kinetics of ordering for islands of N 2
on Ru(OOl) . The method for and results from these calculations are presented
in Chapter 3. There is considerable current interest in the theory of order
disorder phenomena because of its relevance to the study of interactions between
adspecies and diffusion [7,8]. Direct experimental measurements may be made
for island growth rates but the level of analysis that can be accomplished will

6
d ep end on the extent to which t he th('ory has ])('en <kveloped.
There h ave been many t h Poretical studies and Monte C arlo s imulations
m a d e for island growth r a t es ou surfaces [9]. Theoretical r esults predict tha t
the average island radius, R , should increase as R(t) ~ tn, where n :::::: 1/ 2,
hut the results from simulations have not all been in agreement. The model
dev eloped for N2 on Ru(OOl) is ideal for computation of island growth, because
a ll the parameters for adsorption and d esorption have b een determined to
fit experimental data. The value of n determined from the N2 on Ru(OOl)
simulation is approximately 1/ 8 . The requirements for accurate experimental
m easurements in this system may be beyond the state of the art. While the
re ason that this result differs from theory could not be determined, it is hoped
that this will spur additional investigation into the role of precursor mediated
diffusion in island growth.

7
References
[1] A. B . Anton, N. R. Avery, T . E. Madey and W. H. Weinberg , .J. Chcm.
Phys. Surfac.e Sc.i. 85 , 507 ( 1986).
[2] P . Feulner and D. Menzel. Phys. R<•v. B 25 , 4295 (1982); D . Mcn;~;cl,
H. Pfniir and P. Feulner, Surface Sci. 126, 374 (1983) .
[3] C . Wang a nd R. Gomer, Surface S\ i. 84 . 329 (1979) .
[4] M. Bowker and D . A. King, .J . Chern. Soc. Faraday I , 75 , 2100 (1979).
[ 5] Sec references 3 and 4 in Chapter 2.
[6] E . H . Hood, B. H . Toby and W . H . Weinberg, in p repar ation .
[7] K . Binder , Ber. Bunsenges. Phys. Ch ern. 90, 257 (1986).
[8] J. D. Gnnt.on and K . Kaski, Surface Sci. 144, 290 (1984); J.D . Gunt on,
M. San Miguel and P. S. Sahni, in Phase Transitions and Critical
Phenomena, Vol. 8, edited by C. Domb and J. Lebowitz (Academic, New
York, 1983).
[9] See references 7 and 11-27 in Chapter 3 of this Thesis .

8
Cha pter 2:
Precursor-Mediated Molecular Chemisorption and Thermal
Desorption: The Interrelationships among Energetics,
Kinetics and Adsorbate Lattice Structures

- 9 -
Vou; ~tE 55, NL:tvtuER 22 PHYSICAL REVIEW LETTERS 25 NOVE~1BER 1985
Precursor-Mediated Molecular Chemisorption and Thermal Desorption: The Interrelationships among Energetics, Kinetics,
and Adsorbate Lattice Structure
Eric S. Hood, Brian H. Toby, and W. H. Weinberg Division of Chemistry and Chemical Engineering, California lnslitwe of Technology, Pasadena, California 91125
(Received 24 June 1985)
Pre.cursor-mediated molecular chemisorption and thermal desorption are examined by means of a latttce-gas model using a combination of time-dependent Monte Carlo simulations and deterministic rate equations. Lateral interactions between coadsorbates are assumed to be both pairwise addntve and limned m range to nearest and next-nearest neighbors. The interrelationships among kmeucs, energeucs: and adsorbate overlayer structures are analyzed in detail. The method is applied to the mteracuon of molecular nitrogen with the Ru(OOI) surface.
PACS numbers: 68.40. +e. 68.20. +t, 82.65.0p
Although the concept of a physically adsorbed, "mobile precursor" state is not new, 1 much recent experimental effort has been directed toward the understanding of the phenomenon of precursor-mediated chemisorption.2 Likewise, the influence of mobile precursor states on the kinetics of molecular chemi· sorption and desorption has been examined theoreti· cally both by a reaction kinetics approach3 and by statistical modeling.4 In this Letter we introduce a theoretical modeling scheme for the study of precursor-mediated molecular chemisorption and thermal desorption, incorporating a combination of Monte Carlo simulations and deterministic rate equations with a stochastic formulation. The novelty of our approach lies in the simultaneous treatment of the various, competing elementary processes (physical adsorption, migration, chemisorption, and desorption) within a single, integrated model. In contrast to previous theoretical treatments, the microscopic detail inherent in our approach allows direct examination of the interrelationships among kinetics, energetics, and the formation and evolution of structure within the adsorbate overlayer. Numerical simulations provide a clear demonstration of the profound effects of island formation and growth.
Molecular chemisorption from a mobile precursor state is examined by use of a lattice gas model and time-dependent Monte Carlo (TDMC) simulations. 5
Molecules are placed sequentially on randomly chosen surface sites to simulate trapping from the gas phase into a physically adsorbed precursor state. Each precursor molecule migrates across the surface in single jumps to nearest-neighbor (nn) sites. This mobile intermediate state is occupied until dther desorption or chemisorption occurs. The binding energy of the precursor is a function of the local molecular environ· ment because of lateral interactions with previously chemisorbed molecules [assumed to be pairwise addi· tive and limited in range to nn and nnn (next-nearest neighbor) adsorbates). The binding energy of a
molecule physically absorbed over an unoccupied lattice site (the intrinsic precursor state) is given by
(I)
where Eo is the binding energy of an isolated precursor to the surface, and E, and E• are the repulsive and attractive energies of interaction between the precursor and a neighboring chemisorbed molecule. The sums in Eq. (1) are performed over nn (j) and nnn ( k) lattice sites, and rr1 and "t are occupation numbers. The binding energy (E.) of a molecule physically absorbed over a lattice site occupied by a chemisorbed molecule (the extrinsic precursor state) is assumed to have a constant value, 85% of E0 .6
Each precursor molecule is temporarily confined to a particular lattice site by a periodic potential parallel to the surface, represented by adjacent, intersecting harmonic wells. The relative depths of neighboring potential-energy minima are computed according to Eq. (I). The activation barrier to precursor migration is given by the energy at the intersection point between adjacent harmonic potentials:
E, ~ E~ + tH1 ( i,j)/2 + (AE1 ( i,j) J2/ 16E2,, (2)
where E2, is the activation barrier to migration of an isolated intrinsic precursor molecule, and AE ( i,j) is the difference in precursor binding energies between the ith and jth sites [AE
1(i,j)•E
1(j)-E
1(i)). The
probability for precursor migration from the ith to the neighboring jth lattice site is given by P, ( i,j) - N exp ( - E ,/ ks T), where the constant N ensures unitarity. The probability for precursor desorption is given by Pd- NX exp(- E,/ k8 T), where the dynamical factor X is the ratio between desorption and migration prefactors. The probability of molecular chemisorption is
P, ~ [NXS0 exp(- E{)"' k8 T) )/(I- S0 ),
where S0 is the initial (zero coverage) adsorption coef-
© 1985 The American Physical Society 2437

- 10 -
VOllME 55, N UMBER 22 PHYSICAL REVIEW LETTERS 25 NOVEMBER 1985
0.8 .--~-,---,.-----..~-,---.-.~-,---,
. .§ ~- 06~ ' · · :. ' jj §" ~ ~ 0.4f' . . ' -'0 ~ . . . l <I: u 02. I · ..... _ I
_ I I - ... _:;-,.
o.oo':-.o-::----~o=' . .,--1 --,o~. ~2 ~--=o=""=.3=----=o.LA=------=-o~.s
Fractroal Coverage.eN 2
FIG. I. Adsorption coefficient as a function of coverage for N2 on Ru(OOI) at 77 K. Vertical bars represent experimental results (Ref. 9) , while squares represent averages over eight TDMC simulations.
ficient. The relative probabilities of precursor desorption, migration to an adjacent site, or chemisorption are all functions of the local molecular environment. Maps displaying the locations of chemisorbed molecules can be constructed which detail the growth of adsorbate lattice structure as a function of coverage.
Thermal-desorption spectra (TDS) have been computed by use of a combination of deterministic rate equations with a Monte Carlo formalism. 5 Even though a single binding site and geometry are assumed, chemisorbed molecules can populate a number of energetically distinct binding states, characterized by different activation barriers to desorption [fib(i) I which are determined by the numbers and magnitudes of lateral interactions between the chemisorbed molecules, i.e.,
fib(i)- fig- I 1 n1i, +It nti • . (3)
In Eq. (3) fig is the binding energy of an isolated chemisorbed molecule, and i, and i. are the repulsive and attractive energies of interaction between neighboring chemisorbed molecules. The rate of desorption from each chemisorption state is computed with use of a modified first-order Polanyi-Wigner equation with a coverage-dependent preexponential factor , 7
d u;/ dt- - v(ll)u; exp[- Eb (i)/ ksTI. (4)
with v(ll) •v0 exp(a0).8 In Eq. (4) u 1 is the occupation number of the ith chemisorption state, and 0 is the fractional coverage of chemisorbed molecules. The system of coupled differential equations describing desorption from all chemisorption states is solved numerically. During each computational cycle (6. T .$. 0.5 K), the appropriate number of molecules is selected from each chemisorption state according to Eq. (4) and removed from randomly chosen lattice sites to avoid the introduction of artificial correlation effects. The calculation is repeated until all molecules have desorbed.
2438
2 0
0::
(a) r•·..,_ ,-.•. (- 1r" '•. 8 lr' '--'.-._\ \ Nz
/,' ,..-....._../~ '·1"-- 0.53 ~ ~ ( ..
'} r;:'\~ g:~; :_;'_,,r- ~\.:--- 0.34 ._...,... / '\ '--- 0.29 _____./ __,;..-·--\ \...._ 0 .2 2
·s .~ "---- 0.!5
·-Q)~ I (b) I / .-._ u • • ', I ......, ·,
':'\ \/:· ·. ·. eN o I II \ '/ ,~, ·. '· z
I _.' : ,-\ - / . - •• ',\-- C. 53
I ,/1 ,~··· ··.·, ·. ·1 49
I - / ,./ / -·. ·. \ -- :::· c:. __, / • · . . -- ._;,4__, ----~ /
1
~#~~ ..... . · ·.\·-· - C;. 34 __ ... / •• · # •• ··~- C.29 _ .... ... '~\'··- 8.22 _ __....· ·_ 0 .1 5
I I 1 ___.__, -:----::c-::---' 60 80 100 !20 140 160
Temperature, K FIG. 2. Thermal-desorption spectra for N2 on Ru (OOl) at
various adsorbate coverages: (a) experimental results (Ref. 9), and (b) TDMC simulation and thermal-desorption modeling.
The interaction of N2 with the Ru(OOI) surface has been examined by this methodology. The results of TDMC simulations are in good agreement with the experimentally measured adsorption coefficient9· 10 (cf. Fig. I). Experimentally measured TDS are shown in Fig. 2(a). Although two peaks are observed at adsorbate coverages above 0.25, electron energy-loss spectra indicate that chemisorption of N2 occurs only at atop sites.1° Figure 2(b) shows TDS computed with the assumption of a single binding geometry at atop sites. Quantitative agreement between calculated and experimental thermal-desorption spectra is obtained for all adsorbate coverages.
TDMC simulations of N2 adsorption on Ru(OOJ ) have been performed for a surface temperature of 77 K on a lattice composed of 9216 Ru atoms. Maps indicating the locations of chemisorbed N2 molecules chart the growth of adsorbate lattice structure as a function of coverage (cf. Fig. 3). Because of the hexagonal geometry of Ru(OOl) and the nature and magnitude of adsorbate interactions, the energetically favored overlayer structure (as indicated by a well-developed LEED pattern9 at 95 K) possesses (.J)x.J3)R3o• symmetry. However, three independent, degenerate adsorbate phases can exist on this hexagonal surface which are distinguishable by 120• rotations about a
- 11 -
YOLCME 55 , Nt:\1BER 22 PHYSICAL REVIEW LETTERS 25 NOVEMBER 198 5
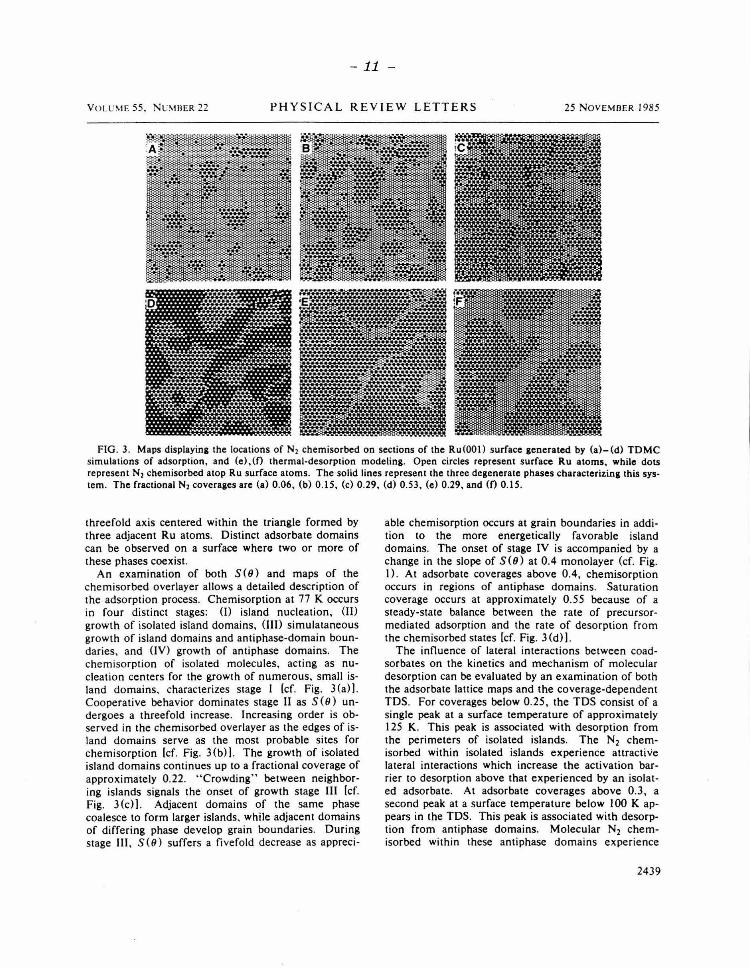
FIG. 3. Maps displaying the locations of N2 chemisorbed on sections of the Ru(OOI) surface generated by (a)-(d) TDMC simulations of adsorption, and (e),(f) thermal-desorption modeling. Open circles represent surface Ru atoms, while dots represent N2 chemisorbed atop Ru surface atoms. The solid lines represent the three degenerate phases characterizing this system. The fractional N2 coverages are (a) 0.06, (b) 0.15, (c) 0.29, (d) 0 .53, (e) 0.29, and (0 0.15.
threefold axis centered within the triangle formed by three adjacent Ru atoms. Distinct adsorbate domains can be observed on a surface where two or more of these phases coexist.
An examination of both S(9) and maps of the chemisorbed overlayer allows a detailed description of the adsorption process. Chemisorption at 77 K occurs in four distinct stages: (I) island nucleation, {II) growth of isolated island domains, (Ill) simulataneous growth of island domains and antiphase-domain boundaries, and (IV) growth of antiphase domains. The chemisorption of isolated molecules, acting as nucleation centers for the growth of numerous, small island domains, characterizes stage I [cf. Fig. 3 (a)]. Cooperative behavior dominates stage II as S(O) unde rgoes a threefold increase. Increasing order is observed in the chemisorbed overlayer as the edges of island domains serve as the most probable sites for chemisorption lcf. Fig. 3(b)) . The growth of isolated island domains continues up to a fractional coverage of approximately 0.22. " Crowding" between neighboring islands signals the onset of growth stage III [cf. Fig. 3 (c)]. Adjacent domains of the same phase coalesce to form larger islands, while adjacent domains of differing phase develop grain boundaries. During stage III, S(9} suffers a fivefold decrease as appreci-
able chemisorption occurs at grain boundaries in addition to the more energetically favorable island domains. The onset of stage IV is accompanied by a change in the slope of S(9) at 0.4 monolayer (cf. Fig. I) . At adsorbate coverages above 0.4, chemisorption occurs in regions of antiphase domains. Saturation coverage occurs at approximately 0.55 because of a steady-state balance between the rate of precursormediated adsorption and the rate of desorption from the chemisorbed states [cf. Fig. 3 (d)].
The influence of lateral interactions between coadsorbates on the kinetics and mechanism of molecular desorption can be evaluated by an examination of both the adsorbate lattice maps and the coverage-dependent TDS. For coverages below 0.25, the TDS consist of a single peak at a surface temperature of approximately 125 K. This peak is associated with desorption from the perimeters of isolated islands. The N2 chemisorbed within isolated islands experience attractive lateral interactions which increase the activation barrier to desorption above that experienced by an isolated adsorbate. At adsorbate coverages above 0.3, a second peak at a surface temperature below 100 K appears in the TDS. This peak is associated with desorption from antiphase domains. Molecular N2 chemisorbed within these antiphase domains experience
2439

- 12-
PHYSICAL REVIEW LETTERS 25 NOVt'-fllER 1985
TABLE I. Kinetic and energetic parameters characterizing the interaction· of molecular nitrogen with Ru(OOI} with energy in units of kcal!mole.
Eo: Intrinsic precursor binding energy E.: Extrinsic precursor binding energy Ef: Chemisorption state binding energy E~ : Precursor state migration barrier E 0 , i 0 : Attractive next-nearest-neighbor
interaction energy
1.6 1.4 5.8 0.3
E,, i,: Repulsive nearest-neighbor interaction energy X: Ratio of precursor preexponential factors
0.45 0.25
of desorption to migration v0 : Desorption preexponential factor
(low coverage limit}
500-1000
a : Desorption preexponential coverage dependence
repulsive lateral interactions which decrease the activation barrier to desorption. At saturation coverage, the number of molecules desorbing from antiphase domains and the number desorbing from isolatedisland perimeters are nearly equal, as are the intensities of the two thermal desorption peaks. The value of this type of numerical simulation is clearly evident: By the relating of the adsorbate structure to kinetic measurements, the two peaks appearing in the "high"coverage (8 ~ 0.3) TDS are shown to result solely from lateral interactions between molecules chemisorbed only at atop sites [cf. Figs. 3 (d) -3 (f)).
Numerical values of the parameters characterizing the system N2 on Ru(OOI) (Table I) are obtained by minimization of the differences between the calculated and experimental coverage-dependent adsorption coefficients and TDS. Although precursor-state-chemisorption-state and chemisorption-state-chemisorption-state lateral interaction energies are treated as separate parameters, adsorption and desorption simulations yield nearly identical values for both. This similarity in lateral interaction energetics is due primarily to the weak binding energy of chemisorbed molecular nitrogen on this surface.
Examination of the maps of adsorbate positions as a function of coverage reveals obvious differences between the mechanisms of precursor-mediated molecular chemisorption and thermal desorption from the chemisorbed state. The absorption mechanism is dominated by kinetic trapping which results in the formation of numerous, small island domains [cf. Fig. 3 (al-3 (d)). Thermal desorption is dominated by relaxation (annealing), as evidenced by the formation of fewer, but much larger, island domains [cf. Figs. 3(e) and 3(f)] . The ability to disclose in microscopic detail the interrelationships among energetics, kinetics, and adsorbate overlayer structures demonstrates the value of this integrated approach to molecular chemisorption
2440
and thermal-desorption simulations. This work was supported by the National Science
Foundation under Grant No. CHE-8206487. One of us (E.S.H .) acknowledges receipt of a Bantrell Postdoctoral Fellowship.
IJ. B. Taylor and I. Langmuir, Phys. Rev. 44.423 (1933) . 2p_ Alnot and D. A. King, Surf. Sci. 126. 359 0983):
H. Pfniir and D. Menzel, J. Chern. Phys. 79, 2400 0983): M. Grunze, J. Fuhler. M. Neumann, C. Brundle , D. Auerbach, and J. Behm. Surf. Sci. 139. 109 (1984} : S. Tang, M. Lee, J. Beckerle, M. Hines, and S. Ceyer. J. Chern. Phys. 82, 2826 0985}; M. Shayegan, E. D. Williams. R. E. Glover. and R. L. Park, Surf. Sci. 154, L239 0985).
lD. A. King and M. Wells, Proc. Roy. Soc. London, Ser. A 339, 245 0974}: R. Gorte and L. Schmidt, Surf. Sci. 76, 559 0978): D. L. Freeman and J. D. Doll. J. Chern. Phys. 78, 6002 (1983}, and 79,2343 0983).
4P. Kisliuk, J. Phys. Chern. Solids 3, 95 0957), and 5. 78 (1958) : D. A. King, Surf. Sci. 64. 43 (1977) : A. Cassuto and D. A. King, Surf. Sci. 102,388 (1981) : J . E. Adams and J. D. Doll. Surf. Sci. 103,472 (1981}. and 111 . 492 (1981 ).
5E. S. Hood. B. H. Toby, and W. H. Weinberg, unpublished.
6K. Christmann and J. Demuth, Surf. Sci. 120. 291 (1982}.
7P. Redhead. Vacuum 12, 203 (1962): D. Adams. Surf. Sci. 42, 12 (1974).
8A number of different functional forms for v(9) have been tested, including the form presente by P. Feulner and D. Menzel. Phys. Rev. B 25, 4295 (1982}. and D. Menzel. H. Pfniir. and P. Feulner, Surf. Sci. 126, 374 (1983). TDS computed with use of the exponential coverage dependence were in closest agreement with experimental results.
9Feulner and Menzel, Ref. 8: Menzel, Pfniir, and Feulner, Ref. 8.
lOA. Anton. N. Avery, B. Toby, and W. H. Weinberg, J. Electron Spectrosc. Relat. Phenom. 29, 181 (1983) .
1 3 -
Chapter 3:
Simulation of N 2 Island Growth on Ru(OOI):
Evidence for a New "Universality Class"
Abstract
1. Int roduction
2. Methods Used for Calculations
2.1 Description of the Model
2 .2 Calculation of the Star ting Surface
2 .3 Time Evolution of the Starting Surface
2.4 Fourier Transform of the Surface Maps
2.5 Intensity Lineshape Analysis
2.6 Growth Law Fitting
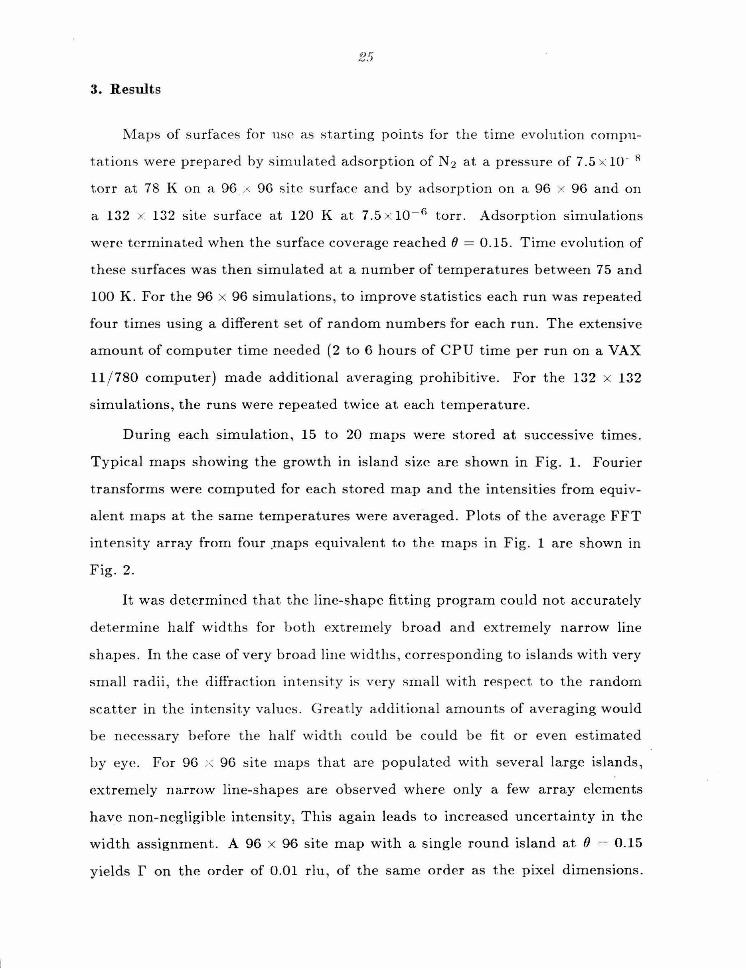
3. Results
4 . Discussion and Conclusions

14 -
ABSTRACT
Monte Carlo s imulation r esul ts a re presented for N2 is land growth on t h e
R u(OOl) surface us ing a kinetic lattice gas model wi t h precursor m ediated ad
sorp tion , d esorption and migrat ion. The model has been p reviously d emon
s trated to give good agreem ent with experimental data . The observed growth
r a t e is w ell fit by an growth law of R(t)"' -- R(t 0 )rn = At , with m approximately
8. The island size was de t ermined from the width of the super lattice diffraction
feature . R esults from other r ecent theoretical and Monte Carlo studies of is land
ordering are also presented.

15
1. Introduction
The diffusion of adspec ies on ~urfaces plays a major role in the kinetics of
heterogenous chemical reactions. For example , in a surface-activated bimolecu
lar chemical rf'action, two reactant molecules must adsorb at or migrate to an
active site before the reaction can be completed and the products must desorb or
migrate away from the site before the site is again catalytically active. Despite
the importance of the field, relatively little is known about surface-adspecies and
adspecies-adspecies energetics. Nor have the mechanisms which govern molecu
lar diffusion been well explored.
Experiments which directly probe surface-adspecies and adspecies-adspecies
energetics are often difficult to design. Relatively few experiments can yield
direct measurements of diffusion rates , either. However, information about both
interaction energy and diffusion can be built into models for the kinetics of
disorder-order transitions. Thus, the field of disorder-order kinetics provides a
testing ground for the comparison of dynamical theory with experiment results.
When the state of a disordered system is changed to a set of conditions
which favor greater order, local domains of higher order develop and grow in
s ize with time until an equilibrium distribution of domain sizes is obtained. In
two-dimensional systems, such as the aggregation of atoms or molecules on a
surface, the local domains of order are called islands. Island growth has long
been of major interest in surface science because it provides insight into the
nature of adspecies interactions jl , 2].
Understanding the growth of domains in three dimensions is central in the
fields of metallurgy, mineralogy and materials science because of the importance
of microcrystalline structure in the macroscopic properties of materials. Two
dimensional models for domain growth are often chosen for study by workers in
those fields because the lower dimensionality offers greater simplicity for both
theory and calculations. It is widely accepted that growth laws in two and three
dimensions are closely related [3].

16
Early theoretical work by Lifshitz J4 ]. Allen and Cahn [5], resulted in a
growth law for the average diameter , R , for islands (in two dimensions) and
grains (in three dimensions) as a function of time, t, of
(1)
where the order parameter is not conserved. Equation (1) is known either as
the Allen-Cahn or as the Lifshitz-Allen-Cahn (LAC) equation. Reduction in the
curvature of domain walls is the driving force behind LAC growth. A second
theory, governed by an "evaporation-condensation" growth mechanism predicts
a R(t) """t 113 rate law for systems with a conserved order parameter (e.g., the
population of phases is time invariant, as would be found in alloy separation [6].)
More recent theoretical work by Safran predicts that domain growth follows the
rate equation:
(2)
for systems where the dimensionality (d) is less than the degeneracy ( q) by one
or more or the growth equation
R ( t) """ In ( t ) , (3)
for other systems where d > q ·I 1 [3]. These series of findings prompted the
concept of "universality classes" - the growth law for a system is dependent
on the number s>f degenerate phases, the dimensionality of the system; but the
growth law is independent of the geometry of the lattice, the migration barrier
or the adspecies-adspecies interaction energies . In a generalized Monte Carlo
study in two dimensions, equation (2) was found to be valid for all q between 2
and 74. The value of n dropped linearly from 0.5 for the Ising (q = 2) model to
0.38 for systems with approximately 25 degenerate phases and did not change
for systems with q values above 25 [7].
While static order-disorder measurements, such as definition of phase dia
grams, have been made for a relatively large number of 2-D systems, very few

17
dynamic measurements of island growth rates have been made, attesting to the
degree of experimental difficulty associated with these measurements. For ad
sorbate ordering on surfaces, the only low energy electron diffraction (LEED)
measurements that have been reported are for the ordering of 0 adatoms on
W(llO) [1 , 8] and on W(l12) [9 ].
In contrast, there has been a. wealth of theoretical and Monte Carlo sim
ulation studies in recent years of ordering growth rates in two dimensions
[ 10, 11- 27]. While many of the studies have been made for generalized systems
using arbitrarily chosen parameters and geometries, some specific systems that
have been modeled using Monte Carlo techniques include: 0 on W(llO) [11] ,
H on Fe(llO) [12] and N2 on graphite [13,14]. Most of these studies are made
using q-state Potts models ( antiferromagnetic spin-flip and spin-exchange mod
els), where the q degenerate phases on the surface are each assigned a unique
spin state. In the case of a system where the degeneracy is two, the Potts model
is equivalent to a Ising model. In the simulations of N 2 on graphite, the N 2
molecules are assumed to have their molecular axis parallel to the surface. The
angle of molecular axis with respect to an arbitrary reference vector is allowed
to take any value. Thus, this model is a oo-state Potts model. Some Monte
Carlo simulations have been done using more generalized, kinetic lattice gas
models, which incorporate various extensions beyond the Potts model, such as
more complex models for diffusion. A kinetic lattice gas model has also been
used to study the effects of island growth on surface reaction kinetics [ 15] . This
work will present the first reported growth law results for a lattice gas model
incorporating precursor mediated adsorption, desorption and migration.
A large number of theoretical and Monte Carlo studies have been made
where island growth obeyed the classical LAC law (algebraic growth with n =
1/ 2) [16-22]. However, several studies have been published where non-classical
growth behavior is observed. These provide insight into factors which can change
the universality class. Sadiq and Binder modeled growth rates for 0 adatoms on

18
W(llO), using non-physical interaction cnergic's and found that if surface d ens ity
is conserved the growth exponent , n, is 0.35 for q - 4, while if the density is not.
conserved n has the classical value~ of 1/ 2. This contrasts a similar system where
q ~ 2 the value for n is 1/ 2, with or without conservation of d ensity [11[. Two
studies by Mazenko and coworkers d emonstrate that conservation of the order
parameter also affects the growth law. In a theoretical Ginzburg-Landau model
for systems with large q values , they found n = . 1 j 4 if the order parameter
is conserved, but n - 1/ 2 if not [23] . For a study with Monte Carlo Ising
model, n = 1/ 2 (LAC) growth is observed for a non-conserved order parameter,
but if Kawasaki spin-exchange dynamics , which conserve the order parameter ,
are used, a growth rate of R(t) = In t is observed [24]. In their model for
H on Fe (llO), Viiials and Gunton determined that n = 1/ 2 for growth of a
(2 x 1) overlayer, with () = 0.5, but the growth of the (3 x 1) overlayer, with
0 - 0 .667 , followed a more complex growth law that could be approximated
by 0 .15 < n < 0.25 [12]. Systems have also been modeled where t he growth
behavior is too complex to express in terms of a simple law [25 ,26].
The most controversial studies in t he current literature of island growth
concern N 2 on graphite, often called the herringbone model b ecause the N 2
molecules tend to align in alternating rows with perpendicular molecular axes,
creating a herringbone pattern. Mouritsen , in his initial study, found growth
could be fitted with n = 0.4 at early times and n = 1/ 4 at later t imes [ 13[.
From this result he proposed a new universality r.lass for systems with soft
domain walls. For systems with small q, domain boundaries are sharply defined,
meaning that all adspecies are members of clearly defined islands . In Mouritsen 's
nomenclature, such domain boundaries are deemed hard. In contrast , in the
herringbone model, N2 molecules may adopt any orientation and t hus domain
boundaries may be several layers thick. The domain boundary regions arc
populated by a disordered phase containing molecules unaligned with either
surrounding phase. K aski et al. have also modeled N 2 on graphite and reach

19
the conclusion that the growth obeys the LAC equation, if ordering at early
times is ignored or an additional term is included in the growth law for this
transient period [14]. Subsequent work by Mouritsen demonstrated n -·· 1/ 4
growth for a wide range in his "softness parameter" [27]. The debate over the
role of soft domain walls in island growth has not been resolved in the literature.
This study presents recent Monte Carlo simulation results for island growth
of N 2 molecules on the hexagonal Ru(001) surface using a kinetic lattice gas
model with precursor mediated adsorption, desorption and migration. The
model has previously been demonstrated to give excellent agreement with exper
imental thermal desorption, probability of adsorption and low energy electron
energy loss data [28]. The model incorporates realistic microscopic detail in its
treatment of molecular processes. Another significant advantage of this model
is that its probabilistic formulations directly incorporate time as a parameter,
thus eliminating the serious problem faced in other Monte Carlo simulations for
correlating the Monte Carlo time scale to a real time scale. The growth rate
observed in this study is well fit by an algebraic law with a growth order of
approximately 1/ 8.

20
2. Methods Used for Calculations
Calculation of is land growth is made in five steps:
( 1) computation of a. starting surface;
(2) simulation of the time evolution of the surface;
(3) calculation of a Fourier transform of surface maps;
( 4) fitting of an intensity profile equ ation to t he sup erlattice Fourier trans
form intensity feature;
(5) fitting of growth law p arameters to the intensity profiles versus time.
The same simulation model was used for steps ( 1) and (2), but under different
conditions. Each of these steps will be described in greater detail in this section.
2.1 Description of the Model
The model has been described elsewhere, but will be briefly recapitulated
here [28 ,29]. A rectangular section of hexagonal lattice with either 962 or
1322 sites was used for simulations. Cyclic boundary conditions were imposed.
Absorption of molecules is simulated by computing a flux of incident molecules
for the chosen pressure and it is assumed that all incident molecules enter
the precursor state. Precursor molecules hop from latt ice site to lattice s ite
until they either desorb back into the gas phase or chemisorb . At periodic
intervals, randomly selected chemisorbed molecules are either returned to the
mobile precursor state or removed from the surface. All migration is via the
precursor state.
A site energy, {j, is defined for each site on the lattice and is determined
from the number of filled nearest neighbor sites ( nr) and the number of filled
next n earest neighbor sites (na) by (j = {o - nrEr + na E a. If the site has
already been filled , (j = Enf.o (regardless of the number of filled neighbor s ites.)
The values used for {o, En , Er and Ea are respectively 1.6, 0.86, 0.25 and 0.45
kcal j mole. These values yielded the best fit for the experimental data.
Precursor molecules may hop from their current site, i , to any of the six
neighboring sites, j, where the probability for migration Pj,?." , depends on the

21
difference in site energy, ~( 1.1 - c7 (i.
P ij = 111
The probability for the precursor molecule to chemisorb, P~, is given by
pi N . [-Eo + Ec] c - X exp kT ,
unless site i already occupied, in which case P; is zero. The probability for the
precursor molecule to desorb from site i is
[ - (. •] Pd. = Nxexp k;
The values used for X and Em are 1000 s - 1 and 0 .284 kcal / mole, respectively,
which yielded the b est fit for the experimental data. The value for Ec , is
calculated from E c = 77k ln(1 / So - 1) , where So, the clean-surface adsorption
probability is 0.125 at 77 K. The normalization constant, N, is determined such 6
that Pd_ + P~ + L Pj_ = 1. j = !
At periodic time intervals desorption scans are made and molecules may
be removed from the surface or returned into the precursor phase. The total
p robability for a molecule to be excited out of the chemisorbed state either into
t he precursor or gas phase is Pt . The p ercentage of these excited molecules that
return to t he precursor phase versus those that desorb directly is Pp . While Pt
is independent of t he number of filled neighbor sites, Pp is a function of f.i which
is defined as n,.E,. - na Ea.
[ - E c +Eo]
Pt = v(n,. , na)LH exp kT .
1 [ E c + (i] 1 - 2 exp kT ,
0,
E c + f.i < 0,
E c + f. i ~ 0,

22
where v(nr , n 0 ) is the prefartor for site i. v(nr. na) = 10 13 exp(vrnr + V 0 n 0 ) , J6.l
is the time between desorption scans (in seconds), Eo is the chemisorption well
depth, 5.8 Kca l/ mole, Vr and Va were set at 1 a nd 0.35, respectively. Desorption
scans were rru1.de a t sufficiently frequent intervals so that the average number
of molecules excited into the precursor phase was no more than 2% of the total
covera ge . Computation of desorption scans at more frequent intervals did not
result in a significant change in the simulations.
2.2 Calculation of the Starting Surface
The previous model was used to compute a starting surface by simulating
adsorption with conditions of a fixed temperature and pressure. Adsorption
was terminated at () = 0.15 monolayer and a "map" or "snapshot" of the
surface distribution of molecules was saved for use in future runs. The coverage
of 15% was chosen b ecause it corresponds at equilibrium to a surface that is
approximately one-half covered hy islands. Also, with higher coverages, islands
develop "domain overlap" (antiphase domains several layers thick) at early times
and this considerably complicates analysis.
2.3 Time Evolution of the Starting Surface
Time evolution of a populated surface was computed usmg the previous
model. The density was constrained to be constant by allowing sufficient inci
dent molecules to readsorb following each desorption scan to restore the coverage
to the original level. The order parameter was not conserved. For one set of
calculations , Pd_ and Pp were artificially constrained to be zero and one, respec
tively, allowing d esorption into the precursor state but not allowing molecules
to leave the surface.
At p eriodic intervals throughout the s imulations, maps of the surface were
stored for later analysis. Several sets of simulations were performed starting
from the same surface, using identical paramet er s but a different sequence of
random numbers. Computations were also performed at a number of different
surface temperatures using the same starting surface.

f!3
2.4 Fourier Transform of the Surface Maps
A facile method for computation of a kinematical "diffraction pattern" was
developed to utilize a fast Fourier transform (FFT) from a hexagonal surface.
The usual 2-D FFT algorithm is restricted to coordinate systems with orthogonal
axes. However, the N x N lattic:e site section of a hexagonal lattice can be
reindexed in a 2N x N element rectangular coordinate system, where half of the
array elements correspond to sites in the hexagonal lattice. Fourier transform
intensities were then computed using standard IMSL 1-D FFT subroutines with
time savings of several orders of magnitude over the direct computation of the
Fourier transform, despite the doubled number of array elements.
Scattering from the Ru substrate atoms, the Bragg angular dependence of
the scattering factor and the De bye-Waller factor are not relevant to the analysis
applied to the FFT intensities and corrections for these factors were not applied .
2.5 Intensity Lineshape Analysis
It is possible to compute the distribution of island sizes from the the profile
of the superlattice diffraction feature [30,31]. In this study no attempt was
made to determine the distribution function. However, the approximation that
R 2 ex 1/ f, where r is the full-width at half-maximum of the beam profile, was
employed. It has been noted that the theoretical profile of a diffraction beam
from a surface with an ensemble of islands is neither Gaussian nor Loren tzian,
but has aspects of each [30]. The Voigt function, the convolution of a Gaussian
and a Cauchy (Lorentz) function, is a logical choice for a profile function.
However, the pseudo-Voigt is computationally much simpler to use and is a very
good approximation of the Voigt [32,33]. A radially symmetric 2-D pseudo-Voigt
intensity profile function, I(Mi, Ni) gave good fits to the FFT intensity map of
the super lattice ( V3 X y3) diffraction feature with the mixing parameter, TJ ,

24
typically lwtw<'cn 0.2 and 1.
- 2; ~ ~;- ( ~~ C )' + (I
w here D.r2 - ( Mi ·- M e )
2 ( Ni - N,. )
2 ) . . . M + 3 N · , I(Mi, Ni 1s the mtens1ty of array
element (Mi, Ni) and (Me, N c) corresponds to the beam center !at substrate
reciprocal lattice coordinates ( ~, k)). The integrated beam intensity is 27rK. A
least-squares refinement was used to determine the best values for the parame
ters TJ , K and f.
2.6 Growth Law Fitting
The Sahni growth equation, (2) , is derived from equation ( 4) , below,
R(t) m - R[{'- = a t , (4)
with m = l j n and making the assumption that R0 , which is defined as R(t) at
t = 0 , is n egligible compared to R(t) . This approximation is not necessary and
indeed is invalid for this study. Substituting r = Kj R 2 into equation (4) yields
f(t) = fo( ,Bt + 1)- 2/ m , ( 5)
wh ere ,B = a rmi 2 K - m . A least-squares refinement procedure is used to fi t f o,
p and m using the fit values for f . When one than one set of runs is made from
the sam e starting surface, the same value of f o is used for a ll runs and only i3
and m are refined.
25
3. Results
Maps of surfaces for use as starting points for the time evolution compu
tations were prepared hy simulated adsorption of N 2 at a pressure of 7 .5 x 1W H
torr at 78 K on a 96 . ..< 96 s ite surface and by adsorption on a 96 x 96 and on
a 132 x. 132 site surface at 120 K at 7.5 x w - n torr. Adsorption simulations
were t erminated when the surface coverage reached () = 0 .15. Time evolution of
these surfaces was then simulated at a number of temperatures between 75 and
100 K. For the 96 x 96 simulations, to improve statistics each run was repeated
four times using a different set of random numbers for each run. The extensive
amount of computer time needed (2 to 6 hours of CPU time per run on a VAX
11/ 780 computer) made additional averaging prohibitive. For the 132 x 132
simulations, the runs w ere repeated twice at each temperature.
During each simulation, 15 to 20 maps were stored at successive times.
Typical maps showing the growth in island size are shown in Fig. 1. Fourier
transforms were computed for each stored map and the intensities from equiv
alent maps at the same temperatures were averaged. Plots of the average FFT
intensity array from four .maps equivalent to the maps in Fig . 1 are shown in
Fig. 2 .
It was determined that the line-shape fitting program could not accurately
determine half widt hs for b o th extrem e ly broad and extremely narrow line
shapes. In the case of very broad line widths, corresponding to islands with very
small radii , the diffraction intensity is very small with respec.t. to t h e r andom
scatter in the intensity values. Greatly additional amounts of averaging would
b e necessary b efore the h a lf w idth could be could be fit or even estimated
by eye. For 96 x 96 site maps that are populated with several large islands,
extremely narrow line-shapes are observed where only a few array elements
have non-negligible intensity, This again leads to increased uncertainty in the
width assignment. A 96 x 96 site map with a single round island at () = 0.15
yields r on the order of 0.01 rlu , of the same order as the pixel dimensions .

26
The uncer tainty in fitting t he line w idth for a surface w ith la rge radius is lands
can only be improv_ed through calculations on a larger s ize map , ·which yie lds a
great er d ens ity of p oints in rec iprocal space. The m ethod u1;ed here does yield
good fits fo r r b etween 0.02 and 0.3 reciprocal lattice units (riu) on a 96 :< 96
site map. The estimated errors in the fit for r for the values presented in this
work are typically on the order of a few p ercent.
The change in r with time is well fit by equation (5) . However , the estimated
error and the scatter in the fit growth parameter are relatively high. This result
is not surprising because of t he uncertainty is high when fitting an exponential
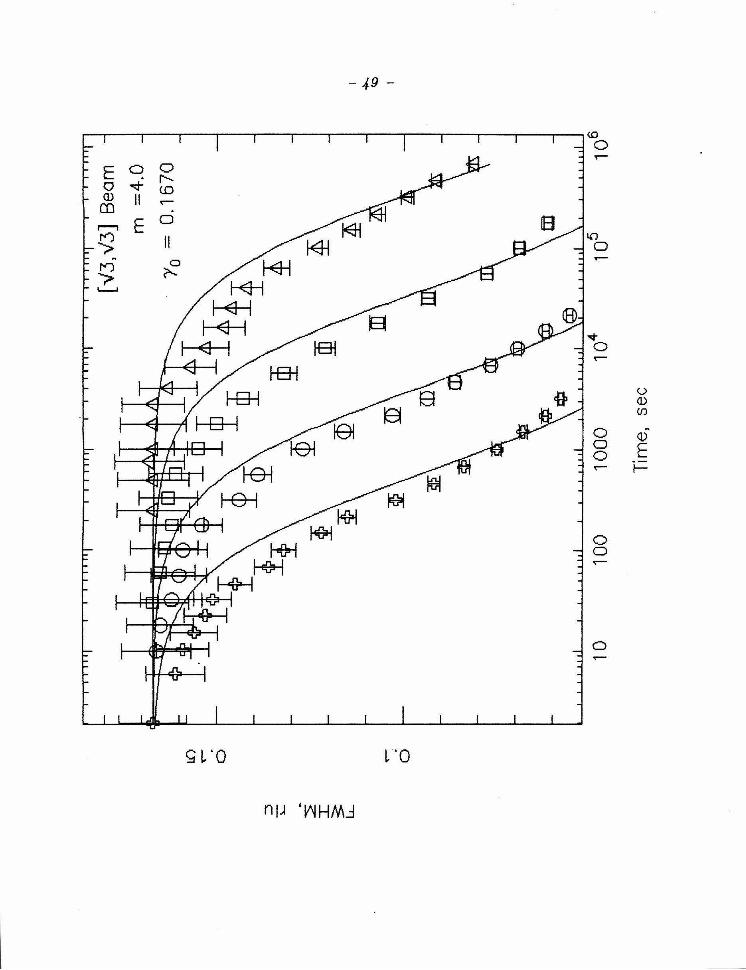
function with a relatively small change in the observable paramet er. Fig. 3 shows
a sequence of runs with curves d efined by the fitted values of m and /3 . A plot
of m values from 19 sets of averaged runs is shown in Fig. 4. In contrast to the
studies discussed previous ly where the growth order , n, is b etween 0.2 and 0.5,
the values for m here are in the range of 8 ± 2, corresponding to n := 1/ 8.
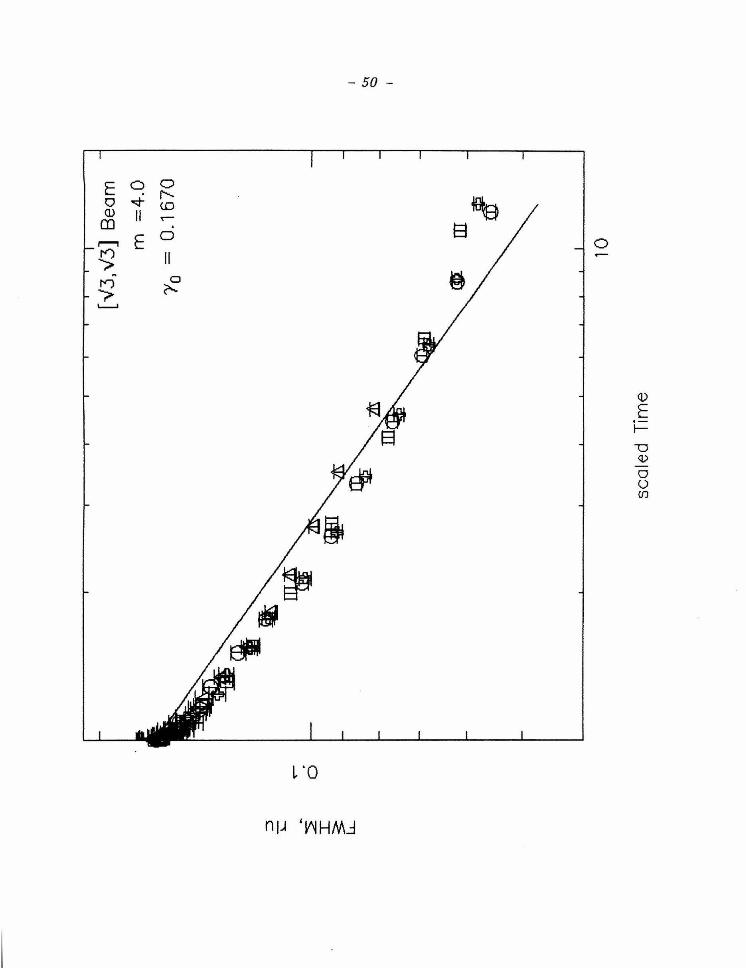
R esults are also plotted with fixed values of m to show that data are clearly
not well fit by m = 2 or m = 4 , while m = 8 does allow a good fit. In most
Monte Carlo simulations in the literature, r esults are plotted as R(t) versus t on
logarithmic axes , yielding a straight line, where the slope is n. To incorporate a
non-negligible Ro t erm and still h ave a straight line, one must plot R(t) against
a r educed time, a t + 1. This requires assumpt ion of a value for m, to d etermine
a. Plot s of r versus time and r versus (J t + 1, where j3 has been refined but m
has b een fixed at 8 , 4 and 2, a r c shown in Figs. 5-7 , resp ectively for t he sam e
data shown in Fig. 3.
An attempt was m ade to determine the sensit iv ity of m to parameters
w ithin the model. There exist two mechanisms for m igrat ion of a molecule from
one s ite to another. Molecules may desorb from the surface into the gas phase
and then reenter the precursor phase a t a randomly chosen s ite, or they may
desorb into the precursor phase and then hop from site to s ite until r eadsorbing.
The effect of desorption into the gas phase on the growth order was investigated

27
by s<>tting P~ 0 and P1, 1, thu::; ''turniug oft··· d<>sorption. This had no aft"0ct
on n~, within the scatter of the fi tted results . Relat ively la rge changes were also
rnadc to the values of Em, En, Er , Ea , Vr and Va, again w ith no affect on m ,
within t he scatter of t he fitted resul ts.

28
4. Discussion and Conclusions
This study has demonstrated that a mobile precursor model for N 2 island
growth on Ru(OOl) is well fit by the growth equation R(t)m - R0t = at, where
m is 8 ± 2. This value for m is much larger than that determined for other
theoretical and Monte Carlo studies and is well outside the range for known
universality classes. In practical terms, for a similar overall growth rate, a
higher value for m translates to more rapid ordering at early times but slower
ordering at later times. The question of why this unusual result is obtained
cannot be answered within this study.
Experimental results for this system demonstrate two unusual features: two
thermal desorption peaks from a single binding site and a probability for ad
sorption that rises with increasing coverage [28,34 ,35]. The model has several
unusual features which allow the reproduction of the experimental results. The
high value of the attractive interaction energy, Ea with respect to the repulsive
interaction energy, Er, the precursor binding energy, t:o, and the chemisorption
well binding energy, Eo, respectively, all increase the probability for adsorption
of molecules which can attach themselves to island edges with respect to adsorp
tion on the clean surface and decrease the probability for molecules in islands
to desorb. The model incorporates both intrinsic and extrinsic precursor states,
also necessary for good agreement with probability of adsorption versus cover
age data. The model also features a prefactor formulation which depends on the
number of attractive and repulsive interactions. This formula was chosen over
the coverage-dependent prefactor, which was previously employed [28], because
the former prefactor function is based on microscopic rather than macroscopic
detail. However, either type of coverage dependence, local or global, is needed to
insure that the high temperature thermal desorption peak does not rise with in
creased coverage, in agreement with experiment, but contrary to usual behavior
for first-order desorption.
It might be suggested that the unusual parameter values chosen for this

29
model result in th<' atyp ical m Yalue determined here . This conclus ion s<'em s
unlike ly given the result that ne it h er changes in parameter values nor temper a
ture h ad a s ignificant effect on the growth order. This leads to the conclusion
that m -- 8 is characteristic of the model rather than the parameter values .
In the herringbone model for N 2 on graphite, m appears to have a value
intermediate to the LAC theoretica l value of 2 and the value determined here.
The h erringbone model and th e Ru(OOl) model are quite different, despite use of
the same adsorbate molecule and the identical symmetry of the surfaces, largely
due to the difference in the assumed bonding geometry. There can be no soft
domain walls in the model presented h ere b ecause th e phases are determined by
lattice s ite rather than by rotational ordering.
Experimental measurement of the island growth rate for N 2 seems to be
unlike ly with the current level of LEED and vacuum technology. A factor of two
chan ge in t h e full-width of t he superlattice beam, not allowing for experimental
broadening, would require annealing for time periods in the range of hours ,
unless an annealing temperature close to the desorption t emperature is chosen.
The latter choice would r equire a relatively large backing pressure of N 2 . In
either the case of high pressure or long annealing times, adsorption of impurities
would be likely. Coadsorption of CO and 02 is known to h ave a major effect
on N 2 thermal desorption [ 36] and could a lso be expected to affect ordering. In
addition, very low electron beam currents would need to be utilized, as N2 is
subject to electron stimulated disordering [37].
It is unlikely that a non-precursor m ediated model for N 2 on Ru(OOl) could
be constructed that would yield close agreement with experimental results, so
construction of a three-state Potts simulation for this system would not provide
exp erimentally reasonable results. Further work will be necessary to determine
if N 2 on Ru(OOl) is the first reported member of a new universality class ,
determined by factors that are now unclear, or if precursor mediation, when
in tegrated into the models for other syst ems, results in higher values for m in

general.
Acknowledgment
This work was supported by the National Science Foundation under Grant
Number CHE-8206487.
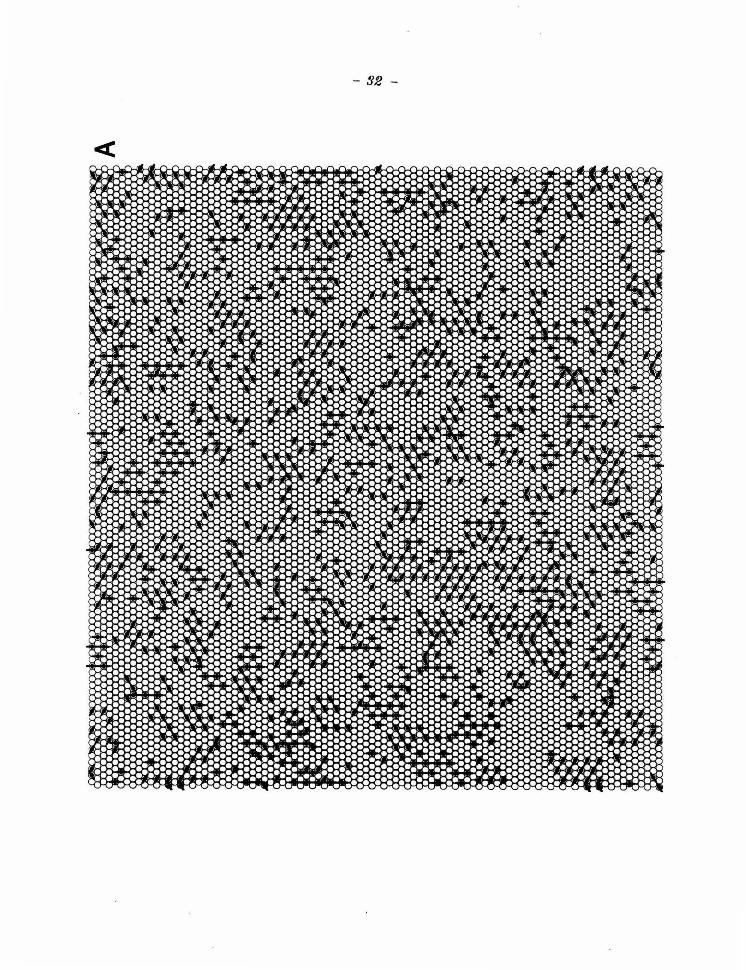
31
Figure 1. Maps displaying the locations of N 2 molecules on a 96 x 96 site
Ru(001) lattice. The open circles represent Ru surface atoms,
while the smaller closed circles represent N 2 molecules adsorbed
on six-fold sites. The direction of the solid lines designates the
three different degenerate phases for a ( y3 x v3)R30° overlayer.
The maps demonstrate the increase in island size for a () = 0.15
monolayer surface adsorbed at 120 K with 7.5 x w- 6 torr N 2 down
quenched to 87.5 K for (a) 10, (b) 100, (c) 1000 and (d) 21500
seconds.
- 92-

- 99 -
m·

- 94 -
()

- 95-
0

S6
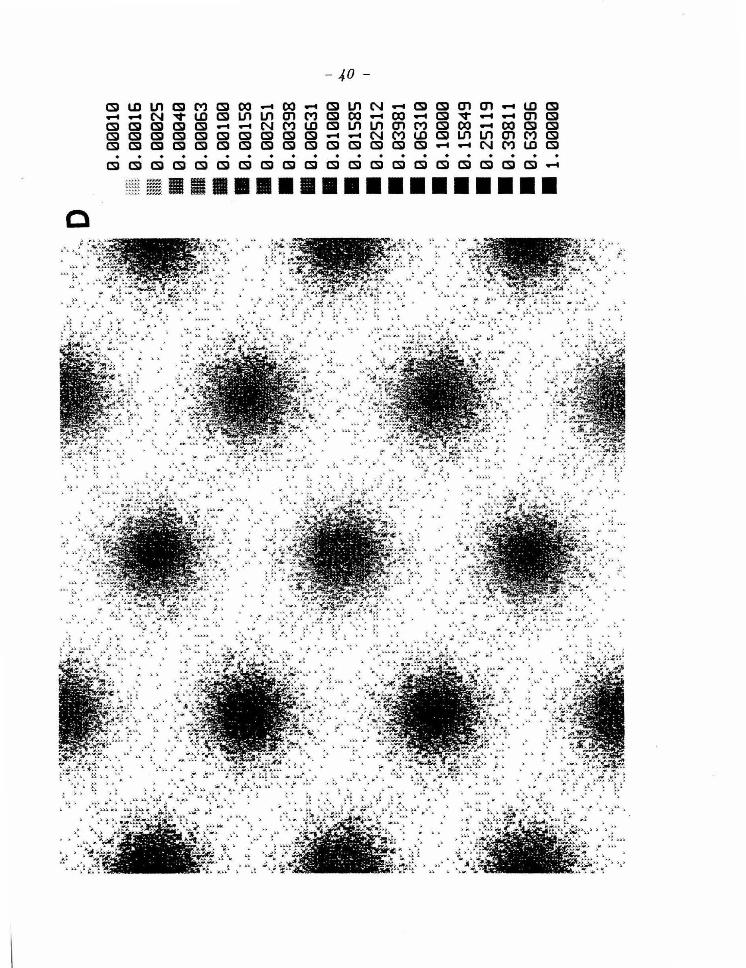
Figure 2. Plots of the Fourier transforms of the maps from Figure 1. The
first order substrate diffraction maxima appear on the edges of
the plot . The Fourier transform intensity is designated by the
darkness of each pixel. The gray scale covers four orders of mag
nitude scaled to the maximum intensity pixel at {0,0). The plots
demonstrate the decrease in width of the six symmetry related
overlayer d~ffraction peaks for a 0 = 0.15 monolayer surface ad
sorbed at 120 K with 7.5 x 10- 6 torr N 2 down-quenched to 87.5 K
for (a) 10, (b) 100, (c) 1000 and (d) 21500 seconds .

- 97 -
Ci)U)Ul Ci) M Ci) 00 -00 -Ci) Ul N- Ci) Ci) 01 01 -U) Ci) --N v lD Ci) Ul Ul 01 M Ci) 00 - 00 - Ci) v --01 Ci) Ci) Ci) Ci) Ci) Ci) --N M lD Ci) Ul Ul 01 M Ci) 00 -00 Ci) Ci) Ci) Ci) Ci) Ci) Ci) Ci) Ci) Ci) Ci) Ci) --N M lD Ci) Ul Ul 01 M Ci) Ci) Ci) Ci) Ci) CSI CSI CSI CSI CSI CSI CSI CSI CSI Ci) Ci) --N M lD CSI . • . . . . . . • . . . . . • . . . . CSI CS)Ci) CSI CSI CSiei:» CSI CSI CSICSI CSI Ci) CSI Ci) Ci) CSI CSI CSI CSI -~ -· ················· . <

I
Oo
Q)
aaaaa·1 • 96a£9 ·a • 1186£ ·a • 611SZ ·a
. 6t8st ·a • aaaat·a • at£9a·a • 186£a·a • z1sza·a • s8s1a·a • aaa1a·a • 1£9aa·a • 86£aa ·a • 1szaa·a • 8S1aa·a • aa1aa·a • £9aaa·a a ataaa ·a 111 szaaa ·a mn 91
oo
o •o
:.::u
U
tJtJ
U
:·::!·~
a1aaa ·a .

- 99 -
~ LO L.n ~ M ~ 00 - 00 -~ L.n N..-t ~ ~ en en - LO ~ --N ..q- LO ~ L.n L.n en M~ 00 -oo -~ '-.:t..-t -en ~ ~ ~ ~ ~ ~ -- N M LO ~ L.n L.nen M ~ 00 -00 ~ ~ ~ ~ ~ ~ ~ ~ ~ ~ ~ ~- -NM LO ~ L.n L.n en M ~ ~ ~ ~ ~ ~ ~~ ~ ~ ~~ ~ ~ ~ ~ --N M LO ~ . . . . . . . . . . . ~ ~ ~ ~ ~ ~ ~ ~ ~ ~ ~ ~ ~ ~ ~ ~ ~ ~ ~ ~ -~ ··················· 0
I
C:l
""<t-
1
e0
ee
0·t •
96
0£
9.0
• tts
sE
·0 •
6ttS
Z ·0
.
s~sst ·0
• 00001 ·0
• 0
tE9
0 ·e
• t8
6E
0 ·0
• zts
z0
·0 •
ssst0
·0 •
00010 ·0 •
t£9
00
.0 •
86Ee0 ·0
• ts
ze
0·0
• sst0
0·0
• 0
01
00
·0 •
£9000 ·0 n
e~e00 • 0 1111
sze0
0 • 0 !tim
........ 9
t00
0 ·0
::::;u ·-~
-~ ..
et0
00
·e
a
• ·'\_l' .•
..:= ~: ... ~
··_ .. .;_,-•
'""' :; ~-· : ... : ·.:-·! ... .
. ti ......
...
............ --:: .....
·-·:: J ; .• · .• ·"_ ...
ti-~ ::
:~·
...
~·· ... ~:::·-~!
·-! ... ---~: ..... ,:·! _..
:~... "'_ ....
.. ·!-· •
ti-· .> -· .~! -· ...... _.
··::····_.·· ':=_.······ _.,.~o•
::
.• ·.:\<• . .:"1.._ ..... •::
"::{ .. ; i;· : '·;
·• ..... -~~
_)" .... _!·· .
_ ...... . -·-·
. ..
. ...... .
:'·. ~::;. ~;~ ~-; :;:: ... ·'-:.
... : . ...
·:··::
-. -~ .
.. .-"' ... ·~ · .. . .:
~ ·;.-·_:" .•.. .. -·
-"~ ..: .:··
... .• ::
{. ··::.:=·· .. ~
l -•
.:Iii_,
-:: .... -'
:"'···" . . l··:~t:;' ::: . ',·_ ....
. .
• "!
·. ..,-.:::

41
Figure 3. A graph of r in reciprocal lattice units versus annealing time in
seconds for a () = 0.15 monolayer, 96 x 96 site map where the
starting surface was adsorbed at 120 K and 7.5 x 10- 6 torr. The
r values were fit from Fourier transform intensities that were were
averaged for four runs with the same starting map. Annealing
temperatures are 77.5, 82.5, 87.5 and 92.5 K, represented by tri
angles, squares, circles and crosses, respectively. The estimated
error in the_ fit from the least-squares procedure is represented by
the error bars; the actual error is likely to be larger. Lines have
heen drawn for growth equations with the hest fit values for (J and
rn.

E 0 0 0
"' v <D co ..--,..--,0 I"")
>n ~ 0 1-.1
('-...
- 42 -
Ill 0
~ 0
0 0 0 ..--
0 0 ,..--
0 ..--
u v "' v E ~

Figure 4. A graph of the fit values of m versus the annealing temperature.
Circles represent runs from an "up-quenched," () = 0.15 mono
layer, 96 x 96 site map where the starting surface was adsorbed at
78 K and 7.5 x 10- 8 torr. Squares represent runs from a "down
quenched," 0 = 0.15 monolayer, 96 x 96 site map where the starting
surface was adsorbed at 120 K and 7 .5 x 10- 6 torr . Crosses rep
resent runs with the same starting map as was used for the runs
designated with squares, however for these runs desorption was
"turned off~' (see text.) Triangles represent runs from a "down
quenched ," 0 - 0.15 monolayer, 132 x 132 site map where the
starting surface was adsorbed at 120 K and 7.5 x w- 6 torr . The
four equivalent runs were averaged for the 96 x 96 site maps, and
two runs were averaged for the 132 x 132 maps.

I I
0
-
0
I I 0~
- .u-
I I I I l
0 0 <I
<I 0 0
0
c(}> 0 0<1
0
0 <I
I I I I I s
W '..J~:j.~WD.JDd LlfMO.J8
I I
I I
- 0 (J)
- 0 CQ
~
-(l) 1.,_
::J -+-' 0 1.,_
(l) Q_
E (l)
I-

Figure 5. (a), A graph of r in reciprocal lattice units versus the annealing
time in seconds for the same results presented in Figure 3, but
where the lines represent best fits for /3, where m has been fixed
at 8. (b), A graph of r versus {3t + 1 on a log-log scale. The line
indicates the slope expected for m = 8. Note the good agreement
between the m easured values and the fitted lines.

E 0 0 . r---Q co <.0 (1) II m ,..-
E 0 ,......, ~ II
R
0 n ?---> L--1
- 46 -
e
np 'V'lHMJ
<0 0 ,..-
\()
0
..r 0 ,..-
0 0 0 ,..-
0 0 ,..-
0
0 Q) (/J
Q)
E t-=

-47-
0 0 .--
E 0 0
0 (JJ " Q) II <.D
co .--
,..--, E 0
~ II I"") 0
? ('-..
Q)
E i-=
0 ""0 <I)
0 () {{)
nl...l '~HM..:l

Figure 6. (a), A graph of f in reciprocal lattice units versus the annealing
time in seconds for the same results presented in Figure 3, but
where the lines represent best fits for {3 , where m has been fixed
at 4. (b) , A graph of r versus {3t + 1 on a log-log scale. The
line indicates the slope expected for m = 4. Note the relatively
poor agreement between the measured values and the fitted lines
in comparison to Figure 5 .
E 0 0 . "" 0 ~ (D
Q) II ..-CO 0
E II
-49-
f8l s
0 0 0 ..--
0 0
0
<.) (}) (f)
~
<l)
E i-=
E 0 0 .q-(1) II m
E ,......, ~
~
n "";> ~
-50 -
0
""' <D ~ . 0
II 0
?---
De s
0
Q)
E
u Q)
0 0 UJ

51
Figure 7. (a), A graph of r in reciprocal lattice units versus the annealing
time in seconds for the same results presented in Figure 3, but
where the lines represent best fits for /3, where m has been fixed
at 2. (b) , A graph of r versus (3 t + 1 on a log-log scale. The
line indicates the s lope expected for m = 2. Note the relatively
poor agreement between the measured values and the fitted lines
in comparison to Figure 5.

-52 -
E 0 0 r---
8
0 ('J <D
~ Q) II ~ m
0 ~ ,.-, E
~ ~ II 0 n ?---"'?'
1..-....1
®
~
1-B-l v (]) (/) s
0 Q) 0 E
f8l 0 ·-~ 1-tet ~
~
0 0 ~
0

E 0 0 0J Q) II co
E ,......., t0 > n "'? .___.
-59 -
0
"' CD ...--0
II 0
?---
**e s
Q)
E
-o Q)
0 0 (f)

54
ii J M . G. La.gally, G.-C. Wang and T.-M. Lu. in C:herm'stry and Physics of
8ol£d Surfaces. Vol. II , edited by R. Van~elow (CRC Press , Boca Raton ,
Florida, 1979).
\2\ W. H. Weinberg, Ann. Rev. Phys. C hern. 34, 217 (1983).
/3 ] S. A. Safran, Phys . Rev. Lett. 46, 1581 (1981).
j4 j I. M. Lifshitz, Zh. Eksp. T eor. Fiz . 42 , 1354 (1962) [Sov. Phys . JETP 15,
939 (1962) ].
j5j S.M. Allen and J. W. Calm, Acta Metall. 27, 1085 (1979).
J6] J.D. Gunton and M. Droz , in Introduction to the Theory of Metastable and
Unstable States, Vol. 183 of Lecture Not es in Physics, edited by J . Zittarz ,
(Springer , Berlin , 1980).
[7] S. A. Safran, P. S. Sahni and G. S . Grest, Phys. Rev. B 28, 2693 (1983);
P . S. Sahni, D. J . Srolovitz, G . S . Grest, M . P . Anderson and S. A. Safran,
Phys. Rev . B 28, 2705 (1983) ; P. S. Sahni, G. S. Grest, M.P. Anderson and
D. J. Srolovitz , Phys. Rev. Lett. 50, 263 (1983); P. S. Sahni, G. S. Grest
and S . A. Safran, Phys. Rev. Lett. 50, 60 (1983).
[8] M. Tringides , P. K. Wu, W . Moritz and M. G. Lagally, Ber. Bunsenges.
Phys. Chern. 90, 277 (1986) ; P . K . Wu, J. H . P erepezko, .J. T. McKinney
and M.G. Lagally, Phys. Rev . Lett. 51 , 1577 (1983) ; J. C. Buchholtz and
M. G. Lagally, Phys . Rev. Lett. 35, 442 (1975).
[9 ] G.-C. Wang and T .-M. Lu, Phys. Rev. B 31 , 5918 (1985) ; G.-C. Wang a n d
T.-M. Lu, Phys . R ev. Lett. 50 , 2014 (1983).
[10] For recent reviews see K. Binder , Bcr. Dunsenges. Phys. Chern. 90 ,
257 (1986) ; .J. D . Gunton and K . K aski , Surface Sci. 144 , 290 (1984);
J. D. Gunton , M. San Miguel and P . S. Sahni, in Phase Transitions and
Critical Phenomena, Vol. 8 , edited by C. Domb and J . Lebowitz (Academic ,
New York, 1983).
[11] A. Sadiq and K. Binder, Phys. Rev. Lett. 51, 674 (1983) .
[12] J. Vinals and J. D . Gunton, Surface Sci. 157, 473 (1985).

55
[13) 0. G. Mouritsen, Phys. Rev. B 28. 3150 (1983).
[14] K. Kaski , D. Kumar, J. D . Gunton and P . A. Rikvold, Surface Sci.
152 / 153,859 (1985); K . Kaski , B. Kumar , J.D. Gunt.on and P. A . Rikvold,
Phys. Rev. B 29, 4420 (1984).
[15[ M. Silverberg, A. Ben-Shaul and F. Rebentrost, J . Chern. Phys . 83 , 6501
(1985) .
[16] J. Vi:ii.als, M. Grant, M . San Miguel, J. D . Gunt.on and E. T. Gawlinski ,
Phys. Rev. Lett. 54 , 1264 (1985).
[17] K . Kaski, M. C. Yalabik, J. D. Gunton and S. A. Sahni, Phys. Rev . B 28 ,
5263 (1983).
[18] K . Kaski, T. Ala-Nissila and J.D . Gunton, Phys. Rev . B 31, 310 (1985).
[19] M . Grant and J. D. Gunton, Phys. Rev. B 28 , 5496 (1983).
[21 ] T. Ala-Nissila, .J.D. Gunton and K. Kaski , Phys. Rev. B 33 , 7583 (1986).
[22] .J. Vi:ii.als and J.D. Gunton, Phys. R ev. B 33 , 7795 (1986) .
[23 ] G. F. Mazenko and M. C. Zannetti, Phys. Rev. B 32 , 4565 (1985) .
[24] G. F . Mazenko, 0. T. Valls and F. C. Zhang, Phys. Rev. B 31, 4453 (1985).
[25] E . T . Gawlinski, S. Kumar, M . Grant, J.D . Gunton and K. Kaski, Phys.
Rev . B 32, 1575 (1985); E. T . Gawlinski, S. Kumar, M. Grant, and
J . D . Gunton, Phys. Rev. Lett. 53, 2266 (1984).
[26] K . Kaski, M . Grant and J. D . Gunton, Phys. Rev. B 31 , 3040 (1985).
[27] 0 . G. Mouritsen, Phys . Rev. Lett. 56, 850 (1986) ; 0 . G. Mouritsen , Phys.
Rev . B 31 , 2613 (1985) .
[28 ] E. S. Hood, B. H. Toby and W. H. Weinberg, Phys. R ev. Lett. 55 2437
(1985).
[29] See Appendices B and C for a description of t.ll<' a lgorithms and computer
programs .
[30] T.-M. Lu, G.-C. Wang and M. G. Lagally, Surface Sci. 108, 494 (1981) .
[31] D . Saloner, P. K . Wu and M . G. Lagally , J . Vac. Sci. Technol. A 3, 1531
(1985).

S6
[32 \ R. A. Young and D . B. \Viles, .J. Appl. C ryst . 15 430 (1982).
[33J J. B . Hastings , W. Thomlinson and D. E. Cox, .J. Appl. Cryst . 17 85
(1984).
\34) A. B . Anton, N. R. Avery, D. H. Toby and W . H. Weinberg , .J. Electron
Spectrosc. Rela t. Phenom. 29, 181 (1983).
[35] P. Feulner and D. Menzel, Phys . Rev. B 25, 4295 (1982); D. Menzel, H.
Pfnur and P . Feulner , Surface Sci. 126, 374 {1983).
[36] A. B. Anton, N. R. Avery, T. E. Madey and W. H. Weinberg, J. Chern.
Phys . Surface Sci. 85, 507 (1986).
j37] T . E . Madey and W. H. Weinberg, unpublished communication.

.'>7
App<'ndix A:
The Chemisorption of Nitrogen on
the (001) Surface of Ruthenium

-58-
Journal of Electron Spectroscopy and Related Phenomena, 29 (1983) 181-186 Elsevier Scientific Publishing Company, Amsterdam- Printed in The Netherlands
THE CHEMISORPTION OF NITROGEN ON THE (001) SURFACE OF RUTHEN IUM }":,
A.B. ANTON, l N.R. AVERY, 2 B.H. TOBY 1 and W.H. WEINBERG 1
1Division of Chemistry and Chemical Engineering, California Institute of Technology, Pasadena, CA 91125 USA
2Division of Materials Science, CSIRO, University of Melbourne, Parkville, Australia 3052
ABSTRACT
181
High resolution electron energy loss spectroscopy (EELS), thermal desorption mass spectrometry (TDt1S) ilnd low energy electron diffraction (LEED) have been used to investigate the molecular chemisorption of N2 on Ru(OOl) at 75 K and 95 K. Adsorption at 95 K produces a single chemisorbed state, and, at saturation, a (/)x/3lR30° LEED pattern is observed . Adsorption at 75 K produces an additiona I chemisorbed state of lower binding energy, and the probabi I ity of adsorp ti on increases by a factor of two from its zero coverage value when the second chemisorbed state begins to populate. EEL spectra recorded for alI coverages at 75 K show only two dipolar modes -- v (Ru-N 2 ) at 280-300 cm- 1 and v (N-N) at 2200-2250 cm-1- i nd icating adsorption at on .-top sites with the axis of the molecular standing perpendicular to the surface . The intensities of these loss features increase and v (N-N) decreases with increasing surface cover age of both chemisorbed states .
INTRODUCTION
For years CO ha s served as the prototype for mo lecular chemisorption studies
on well characterized sur.faces (ref .l ) . Although the surface chemical bond in
N2 adsorption is fundamentally different from that of CO due to subtle differ
ences in the electronic structure of the two molecules (ref.2), N2
is isoelec
tronic with CO, making the investigation of N2 adsorption and its comparison to
CO a logical next step in understanding the surface chemical bond and inter
actions among chemisorbed molecules. With this goal in mind, the presen t inves
tigation concerns the chemisorption of N2 on the Ru(OOl) surface.
EXPERIMENTAL
The experiments described here were performed in two separate UHV systems,
one equipped for LEED and Auger electron spectroscopy (AES) (ref.3), and the
other f or TDMS and EELS (ref.4). Ru(OOl) samples for both systems were prepared
and cleaned by s tandard techniques (ref.5). Sample cooling allowed ad s orption
at 95 K in the LEED sys tem and 75 K in the EELS system.
··supported by the National Science Foundation under Grant No. CHE82-06487.
0368-2048/83/0000-0000/$03.00 © 1983 Elsevier Scientific Publishing Company

182
RESULTS AND DISCUSSION
Adsorption of N2
at 95 K
-59-
Exposure of the Ru(001) surface to N2 at 95 K gives a single, first order,
TOMS feature, the binding energy of which shifts from 31.4 kJ/mole at low
coverage to 29.4 kJ/mole at saturation (via the method of Redhead, ref .6). Sat
uration coverage at this temperature also produces a strong (/3x(3)R}0° LEED
pattern (ref.7). Coverage estimates for these conditions, ob tained by compari
son of TOMS spectra to those obtained for desorption of a known coverage o f CO,
yield 6( sat. at 95 K)=0.35±0. 10, implying formation of a complete (/3x/3)R30°/6
=0.33 ove r layer .
EEL spectra recorded for adsorption at 95 K show only two dipo lar modes-
v( Ru-N2), appearing initially at 280 cm-1
and shifting upward with increasing
coverage to 301 cm- 1 at saturation; and v( N-N), appearing initially at 2252 cm- 1
and shifting downward to 2212 cm- 1 at saturation. These frequencies are plotted
as a function of exposure in Fig. 1.
The absence of bending modes in the EEL spectra indicates that the chemi
sorbed N2 molecules have their axes perpendicular to the surface plane, and the
frequency of v(N -N) indicates that they are coordinated to single Ru atoms. The
latter conclusion is substantiated by data for 1 inear Ru-N2
complexes which show
v( N-N) >2000 cm- 1 (ref.B).
As is the case for CO, the bonding of N2 to a metal center is primarily via
a donation from the valence orbitals o• N2 to the metal (ref . 2) . The valence
orbitals in N2 , 2o u and 3og' are shared equally between the two nitrog en atoms,
'e u
N2 EELS FREQUENC IES vs.
EXPOSURE T
0 ~ 95 K
2 EXPOSURE, L
4
Fig. 1. EELS frequencies as a function of exposure for adsorption at 95 K.
and, although they mix upon
interaction with a metal center
to form two new o orbitals with
some lone pair character, the
resulting donor bond i s we ak
compared to that of CO, which
bond s through its So lone pair
o rbital, localized strongly on
the carbon atom. Back-donation
from the drr levels of the metal
to the 1rrg anti-bonding level
of N2
weake ns the N-N bond, and
changes in the amount of drr
back-donation with surface
coverage can cause v( N-N) to
vary with coverage.

- 60 -
183
Wei 1-establ ished theo ry (re f . 9) which describes the interaction of an inci
dent electron with an array of dipoles on a metal surface shows that the same
properties of an adlayer which produce dipolar scattering also produce dipolar
coupli ng in the ad layer, and t his coupling interaction causes vibrational fre
quencies to increase monat on ically with coverage. The intensity of the v( N-N)
mode seen in EELS is comparable to that seen for v(C -0) at the same coverage
(ref .l O), indicating that N2 is strong ly polarized upon adsorption and has an
induced dipolar moment approximately equal to that of CO. I t follows that a
30-40 cm-l upwa rd shift of v (N-N ) from zero coverage to completion of a (/3x/3)
R30°/6=0.33 overlayer occu rs due t o d ipola r coupling (ref . 10 ) , as has been shown
for CO on Ru(001 ) (refs.9,11 ) . Then the data in Fig. 1 indicate that v ( N-N )
shifts downward by 70-80 cm- 1 due to coverage dependent changes in the N-N bond.
Although negative f requency shifts with increasing surface cove rage have
been reported for CO adsorption on Cu(111) ( ref.12) and on polycrystalline Au
(ref.13) and for N2 adsorption on Ni ( 110 ) (ref.14), the change in v (C-0) and
v (N-N) observed in these investigations was less than ~10 cm- 1 and no detailed
explanations of the change in the C-0 o r N-N bond with coverage were offered. A
plausible explanation describes the decrease in v (N-N) with increasing coverage
as being due to formation o f a lrrg band with increasing coverage, broadening the
1r.g level and changing its population due t o overlap wi th the fermi level of the
s ubst r ate (ref. 15).
If the energ y of the 1rrg l evel for an isolated N2 molecul e chemisorbed on
Ru(001) is above the fermi level of the metal, the l ng level i s unpopulated and
does not af fect v (N-N ). Increasi ng the density o f N2
admolecules on the surface,
however, could cause the l rrg orbitals of adjacent molecules to overlap, forming
a band and broadening the l rrg level due to dispersion . Band formation at low
coverage (6<0.33) is not unreasonable- the spatial extent of the 1rr orbitals 0 g
would be greater than the Vander \~aals' diameter of N2 (~5 A), allowing s ignifo
icant ove rlap at the .13 intermo lecular spacing of 4.6
l ow coverage, as i s seen for CO adsorpti on on Ru(OOJ)
A. Island formation at
(ref. 11 ) , would enhance
the e ff ect. If the 1rrg level broadens sufficiently in energy to cross the fermi
level, increasing population of this band woul d cause the N-N bond to weaken and
decrease v (N-N) for the adlayer . Broadening on the order o f 1 eV due to disper
s ion i s quite reasonable and has been reported fo r the l rr leve l of CO adsorbed
on Ni(110) (ref.2).
Adsorption of N2
at 75 K
Initial exposure of N2
at 75 K produces the high temperature state seen f o r
adsorption at 95 K. For exposures o f 1.0 Lor greater (6/6max>0.4), however, a
second feature appear s with an initial binding energy of 24.4 kJ /mo le, shrfting
to 21.3 kJ/mole at saturation. The probability of adsorption, 5(6), doubles

- 61 -
184
from its initia l value of 0 . 4~0 . 2 when the low tempera ture state beg i ns to popu-
I ate, then gradua l ly decreases as the surface coverage approaches s aturation
(ref.7}. TOMS spectra recorded after a 2.0 L exposure of 15N 2 at 100 K, then a
2 . 0 L exposure of 14N 2 at 75 K (or vice versa ) , show on l y part i a I mix i ng of the
two isotopes upon desorpti on , verifying the existence of two distinct binding
states on the surface a nd ru l ing out the possibi I ity of a compres sion structure
at hig h coverage, as is seen for CO on Ru(OOl) (ref.3 ) . Cove rage es timates for
saturation at 75 K y i e l d 6=0 .58~0 . 17 and indi ca t e that the su rface density (N2
/
Ru surface atoms) in the low temperature state i s approxi matel y twice tha t in
the high temperature state.
Although TOMS results s how two dis t inct bi nding states, EELS r esults for ad
sorption at 75 K, illustrated in Fig. 2, aga in show only two modes , v(Ru- N2) and
v( N- N) . Figure 3 shows the coverage depende nce o f the freque ncies of these two
modes. As was shown in Fig . 1 for adsorpt i on
with increas ing coverage, a tota l shift of 49
in thi s case, and v (Ru- N2
) shifts upward from
at 95 K, v (N- N) shifts -1 -1
em from 2247 em to
278 cm-l to 291 cm- 1 •
downwa rd
2198 em - 1
"' a. u
>-1-
(f)
z w 1-z
ENERGY LOSS, meV 0 50 100 150 200 250 300
•100
N2 on Ru(OOI)
T0 = 75 K
J 291 em- • 2198cm·1 j
EXPOSURE
2 .5L
2216cm·• I
Ocnl'l ~ I 285cm- 1
~ ~ ~~. ~~·----·~ Vlc_~l '._
0 500 1000 1500 2000 2500 ENERGY LOSS, cm- 1
1.5L
O.SL
0.3L
Fig. 2 . Representative EEL spectra fo r adsorption at 75 K.
The addition of the second chemi
sorbed state, present only for adso rp
t i on at 75 K, contributes no new
features t o t he specular EEL spectrum,
causes no new features to appear in
of f - specu l a r measurements, causes no
abrupt changes in surface ref lectivity,
and cause s no noticeable increase in
t he linewidth of e ither EE LS band.
Also , the intensities of both EELS
bands , shown i n Fi g. 4, grow monotoni
cal l y with total su rface coverage of
both chemisorbed sta tes, exceeding the
intens ities of v (Ru-N2) and v (N-N) seen
for satura tion at 95 K by 20% and 50%,
respectively (ref. l O) . Although it has
been shown that intensities of EE LS
bands are no t abso lu te i nd i cators of
s urface coverage (ref.9) , the monatonic
increase in the intensity of both modes
with su r fac e coverage and t he absence
of new features in the EE L spectra
at t ributab le to the other species does
~ugge s t that EELS is p robing both
c hemi sorbed states , i . e . the vibrationa l

- 62-
185
spect ra of the two states are identical within instrumental resolution. By
these arguments, N2 molecules in the low temperature state are a l so bonded with
their mo lecular axes perpendicu l ar to the surface, but, as was shown by TOMS
coverage comparisons for adsorption at 95 K and 75 K, they are bonded in areas
"crowded" with N2 molecules, as surface density i n the low temperature state is
approximately twice that of the high temperat u re 13 sta te.
CONC LUSIONS
The conclusions of this work can be summarized as fo ll ows:
1. Adsorption of N2
on Ru(OOl) at 95 K produces an ordered (/3x/3)R30°/8=
0 . 33 overlayer with the N2
molecules at on-top sites, standing perpe ndicular to
the surface plane . The binding energy of N2 in this state is 31.4 kJ/mo l e at
low coverage , shifting to 29.4 kJ/mole at saturation.
2. Adsorption at 75 K produces a second, d i stinct chem i sorbed state,
a ppeari ng f or relative coverages (8/8max) greater than 0 . 4 with an i n it i a l
binding energy of 24.4 kJ /mo le and shif ting to 21 . 3 kJ/mole at saturation . This
state i s indistinguishable from the 13 state i n EE LS and is therefore also
attr i buted to molecules standing upright ·o n the surface.
3. Changes in the N- N bond with coverage, due presumably to changes in the
relative amount o f 1TI backbonding, cause v (N -N ) to decrease wit h increasing g
coverage for adsorption at bo t h 75 K a nd 95 K.
2250
2240
IE 2230
v 2220
>-~ 2210 w 5 2200 w a: 2190 u..
300
290
280
0
N2 EELS FREQUENCIES vs.
COVERAGE
v (N-NI
v (Ru-N2 l
~t f 0.2 0 .4 0.6 0.8
RELAT IVE COVERAGE. 8 !8max
f 1.0
Fig. 3. EELS freq~e~cies as a function of coverage for adsorption at "75 K.
1.0
::.: N2 EELS INTENSITIES ~ w vs. a.. 0.8
~ COVERAGE 1-<f) T0 = 75 K :5 0.6 w • (Ru-N2) u.. 0
~ 0 .4
,: 1-<f)
z 0 .2 w 1-~
0 0 0 .2 0.4 0.6 0.8
RELATIVE COVERAGE, 818max
Fig. 4. EELS intensities as a function of coverage for adsorption at "75 K.
1.0

- 69-
186
ACKNOW LE DGMENTS
lie wish to acknowledge the assis tance of Ted Madey in the collection and
interpreta ti on of data at the beginning of thi s p roject
REFERENCES
See, for example, Vibrat ional Spectroscopy of Ads o rbates, R.F . \Iii I is, ed ., (Springer -Ver lag, Berl in, 1980) .
2 K. Horn , J. DiNardo, II. Eberhardt, H.-J. Freund and E.W. Plummer , Su rface Sc i . 118 (1982) 465.
3 E.D. WT!Jiams and \I.H. Weinberg, Surface Sc i . 82 ( 1979) 93. 4 G.E. Thomas and W.H. Weinberg , Rev . Sc i. lnstr-:-50 (1979) 497 . 5 G. E. Thomas and W.H. Weinberg, J. Chern. Phys. 69-r1978) 3611; 70 (1979) 954. 6 P.A . Redhead, Vacuum 12 (1979) 203 . -7 P. Feul ner and D. Menzel, Phys. Rev . B 25 (1982) 4295 . 8 B. Fo l kesson, Acta. Chern. Scand. 26 (19721 4008. 9 B.N. J. Persson and R. Ryberg, Phy~ Rev. B 24 (1981) 6954, and references
there i n . -10 A.B. Anton , N.R. Avery, B.H. Toby a nd W.H. Weinberg , in preparation. 11 H. Pfnur, D. Me nzel , F. M. Hoffmann, A. Ortega and A.M. Bradshaw, Surface.
Sci. 93 (1980) 431. 12 P. HoTTins and J. Pritchard, Surface Sci. 89 (1979) 486. 13 M.L. Kottke , R.G. Greenler and H.G. Tompkins, Surface Sci . 32 (1972) 231. 14 M Grunze, R.K. Driscoll, G.N . Burland, J.C. L. Co r nish and J.-Pritchard,
Surface Sci . 89 (1979) 381. 15 A.M . Bradshaw:-pri vate communication.
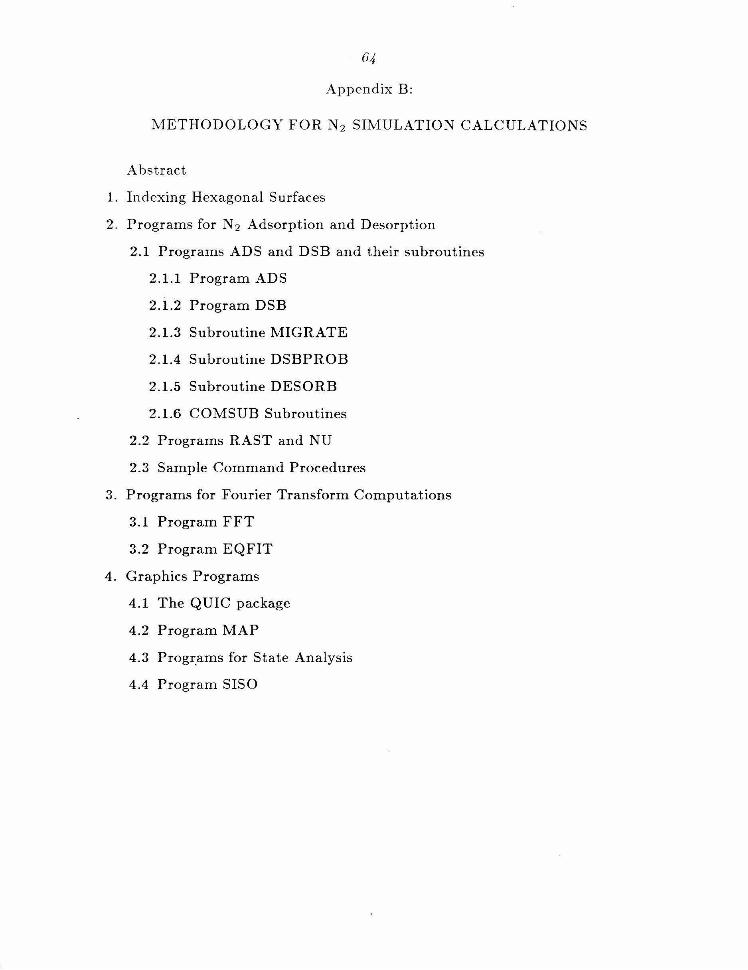
Appendix D:
METHODOLOGY FOR N2 SIMULATION CALCULATIONS
Abstract
1. Indexing Hexagonal Surfaces
2. Programs for N2 Adsorption and Desorption
2.1 Programs ADS and DSB and their subroutines
2.1.1 Program ADS
2.1.2 Program DSB
2.1.3 Subroutine MIGRATE
2.1.4 Subroutine DSBPROB
2.1.5 Subroutine DESORB
2.1.6 COMSUB Subroutines
2 .2 Programs RAST and NU
2.3 Sample Command Procedures
3 . Programs for Fourier Transform Computations
3.1 Program FFT
3.2 Program EQFIT
4. Graphics Programs
4.1 The QUIC package
4.2 Program MAP
4.3 Progr_ams for State Analysis
4.4 Program SISO

6.5 -
ABSTRACT
The a lgorithms and techniques used for a number of computer programs are
documt'nted. The first section details coordinate schemes developed for indexing
s ites on a 2-D hexagonal lattice. The second section covers a set of programs
which simulate adsorption and desorption of N2 molecules on the Ru(OOl)
surface. The third section documents a set of programs used to analyze the
ordering of N 2 molecules from t he adsorption/ desorption simulation results. The
final section details several graphics programs and a graphics package written
for plotting results from the previous programs.
Introduction
A senes of programs have been developed for simulation of N 2 adsorp
tion and desorption, for analyzing the island distributions from the simulation
programs by computation of Fourier transforms of the "maps" which contain
the locations of molecules on the simulated surface, and for graphic display of
program results . This Appendix contains detailed descriptions of the most im
portant of these programs. Less detailed descriptions are included for programs
that are fairly straight forward to use. Listings of the programs discussed in this
Appendix may be found in Appendix C.
This Appendix is written in four sec.tions. The first sedion disc.usses
methods used for indexing hexagonal coordinate systems. The second section
discusses the adsorption and thermal desorption simulation programs. The third
section discusses programs for computing Fourier transforms from maps, for
fitting a line shape function to peaks in the FFT intensities and for fitting the
widths of the line shapes to growth laws. The fourth section discusses programs
used for plotting the results of the previous two programs.
The programs documented here were written to run on Digital Equipment
Corporation VAX 11/780 and p,VAX-II computers running the VAX/VMS
operating system (Version 4.2) using FORTRAN 77 (Version 4.2). The larger
programs were further adapted to run on a Floating Point Systems FPS-164
array processor (referred to hereafter as the AP), which uses an ANSI standard
FORTRAN 77 cross c.ompiler under the FPS Single .Toh Entry (S.TE) system
(both compiler and SJE are release Gl). No attempt will be made to acquaint
the reader with the details of the VAX/VMS or FPS operating systems or give
detailed descriptions of VAX and SJE commands used for compiling, linking
or running these programs, as minor reconfigurations of the computer systems
would render this information obsolete and it can be guaranteed that these
commands will need modification for other VAX systems. Nonetheless, for the
adsorption and desorption programs, a sample input deck has been included, as

67
well as a command file to cross-nnnpik and link the progr ams for the AP.

fiR
1. Indexing Hexagonal Surfaces
Positions of atoms in a hexagonal unit cell are normally indexed by frac-
tional coordinates ( x, y,z), which are interpreted to mean the atom is located
by position vector r- -= xa + yb + zc , where a , b and c are the unit cell vectors
with c perpendicular to both a and b, and a is rotated 120° from b. On the
(001) or basal plane of a hexagonal unit cell, all surface atoms have the same z
value and only two coordinates, (x,y), need be used to specify a position. This
coordinate system has some disadvantages when used for computer calculations
and two alternate coordinate systems were developed for use in the simulation
calculations. The adsorption and desorption programs use a coordinate system
with a one-to-one mapping between atoms in a rectangular portion of a hexago
nal lattice to elements in a two dimensional array. In this system, rows of atoms
are placed one under another, but the even numbered rows are translated a half
unit cell with respect to the odd rows, as diagrammed below.
{ 1, 1} {1,2} {1 ,3} {1,4}
{2 , 1} {2,2} {2,3} {2,4}
{3,1} {3,2} {3,3} {3, 4}
{4,1} {4,2} {4,3} {4,4}
This method of indexing will be referred to as the "pseudo-rectangular" coor
dinate scheme. Pseudo-rectangular coordinates, { m, n}, can be converted to
Cartesian coordinates by the relationships:
x = masin(60° ),
{ na,
y ::-- (n- 1/ 2)a, m odd, m even,

6.9
where a is the the cell length. ~ot<' that th<' x-axis is vertical in this diagram.
The six nearest-neighbor s ites and six next-nearest-neighbor sites to site
{ m, n} are given by
m odd
Nearest-Neighbors { m, n + 1}
{m .:L 1,n}
{m ± 1, n + 1}
Next-Nearest-Neighbors { m ± 2, n}
{m ::L: 1, n-1}
{m±1,n + 2}
rn even
{m,n ± 1}
{m 1: 1,n}
{m ± 1,n - 1}
{m ± 2, n}
{m .1 1,n+1}
{m ± 1, n-2}.
For computation of a fast Fourier transform, it is necessary to use a coor
dinate system with two orthogonal axes . So, the "true-rectangular" coordinate
scheme was developed. This is similar to the pseudo-rectangular system, but
the density of lattice points in each row is doubled and the rows are no longer
offset with respect to each other, as shown below. [Note that square brackets
([ ]) are used to indicate true-rect angular coordinates and braces ( {}) are used
for pseudo-rectangular coordinates.]
[1 ,1] [1,2] [1,3] [1,4] [1,5] [1,6] [1,7] [1,8]
[2,1 ] [2 ,2] [2 ,3] [2,4] [2,5] [2,6] [2,7] [2,8]
[3,1] [3,2] [3 ,3] [3,4] [3,5][3,6] [3,7] [3 ,8]
[4,1 ] [4,2] [4 ,3] [4 ,4] [4,5] [4,6] [4,7] [4,8]
For example , site {2, 1} m a ps to site [2,1] and site {1, 1} maps to site [1,2].
In general, site { m , n} tra nsforms to [ i,j ] with i = m and j = 2m for m
odd a nd j = 2m - 1 for m even . Thus , s it e [i,j] , where i + j is even, does
not correspond to a n a tomic p osition in the hexagonal lattice ; such sites are

70
assigned a scattering amplitude of zero. ·while this transformation doubles the
number of array elements to be processed. t he greater speed of the fast Fourier
transform a lgorithm often yielus an order of magnitude better performance
than direct Fourier transform of t h e pseudo-rectangular array. True-rectangular
coordinates, [ ij J, can he converted to Cartesian coordinates by the relationships,
x = ia sin(60°) and y = Ja / 2 , where a is the the cell length .

71 -
2. Programs for N '2 Adsorption and Desorption
There exist three different versions of the system of programs for simulation
of adsorption and desorption of N 2 on Ru(OOl) which are found in three
directories, [BHT.N2.APJ, [BHT.N2.NEWJ and [llHT.N2 .COVJ. The programs
found in fBHT.N2.COV j are an older modeling approach using a coverage
dependant prefactor and will not be discussed. The programs in the other
two directories are largely similar, where the [BHT.N2.APJ programs are array
processor versions, while the [BHT.N2.NEW] programs are VAX versions. The
latest version of each of the programs discussed in the following sections is listed
in Appendix C . The directory name will identify target computer.
The complete adsorption/desorption system consists of four programs. In
addition there are also several graphics programs, which are discussed in Section
4 of this Appendix. The four programs are:
ADS simulates adsorption and desorption of N 2 molecules from the
Ru(OOl) surface during the adsorption process,
DSB simulates thermal desorption spectra from maps produced by
ADS,
RAST creates a pseudo-random rastering list input to ADS and DSB,
NU creates an input file and matrix of prefactor values for ADS
and DSB.
A full list of the parameters required as input to these programs are listed in
the Table at the end of this Appendix.
2.1 Programs ADS and DSB
Programs ADS and DSB are very similar and have been written to use the
same COMMON blocks and the same subroutines . The unique portion of each
program is contained in file ADS.FOR for ADS and file DSB.FOR for DSB.
The COMMON blocks are found in files SIMCOMA.FOR, SIMCOMB.FOR,
SIMCOMC.FOR, SIMCOMD.FOR and SIMCOME.FOR and the shared sub
routines are found in files MIG.FOR and COMSUB.FOR; these files are listed in
Appendix C. Since the programs use very similar algorithms, the two programs

72
will be described together, follow<'d by more detailed descriptions of the shared
subroutines.
Both ADS and DSB start by initializing variables and by reading input
parameters from input filc:s . Both programs require input of: (1) a rastering
sequence tile, written by program RAST, (2) an array of prefactor values, written
by program NU, and (3) a number of input parameters. Program DSB also
requires a map file, which is written by ADS. The map file also includes most of
the parameter values input to ADS, so the same parameters do not need to be
reinput to DSB. Optionally, ADS can read in a map as a starting point for the
computation. However, if no map file is specified, the program starts with an
empty lattice. Parameters are input in free format and after reading each group
of parameters, the program skips the following card, so that comments may be
included in the input deck.
2.1.1 Program ADS
Program ADS is written in two major sections. The first is used to adsorb
molecules onto the surface. Computation of adsorption begins with selection of
a random position on the lattice as a starting point for a precursor molecule.
Subroutine MIGRATE is then used to allow that molecule to hop from site to site
until the molecule either adsorbs or desorbs into the gas phase. At this point the
exposure, coverage and time counters are updated. The adsorption/migration
process then is repeated. At periodic intervals , statistical information is written
to tiles and desorption scans are made. At points during the run, as selected by
input parameters, maps may be written or new parameters may be read.
The second major section of ADS computes desorption. Subroutine DES
ORB scans the surface and, for each occupied site, computes the probability
for the molecule at that site to desorb either into the gas phase or back into
the precursor state, where again it migrates until it readsorbs or desorbs. The
desorption probabilities are recomputed after MP ASS desorption scans by sub
routine DSBPROB. Variable DSBINT defines the interval in seconds between

- 73 -
successtve desorption S<'ans and should be specified so the excitation rate per
scan (the number of molecules that desorb into the precursor state) is small,
on the order of a few percent of the adsorbed molecules, but not too small, as
that unnecessarily increases the time needed to run the program. The optimum
value is established by successively lowering DSBINT until smaller values do not
produce any change in the results.
The pressure parameter (PRES) 1s used to specify one of three different
adsorption modes. If PRES is input as greater than zero, the value is the N2
p a rtial pressure in Torr and the value used to define the average time between
collisions of N2 molecules with the portion of the surface being modeled . In this
approach, the time scale of the simulations is fixed by the number of molecules
that have been placed onto the surface. At time intervals set by parameter
DSBINT, desorption scans are made. The other two options are available for
closed system calculations using prepopulated surfaces. With these options, the
interval between desorption scans defines the time scale for the simulations. If
PRES is input as less than zero, desorption and adsorption proceed as before,
except that adsorption cycles are terminated and a desorption scan started, each
time the coverage reaches its initial value. If PRES is input as zero, no molecules
are allowed to adsorb from the gas phase or desorb into the gas phase. Thus, the
adsorption section is not used and, while molecules are allowed to desorb into
the precursor phase, they are not allowed to desorb into the gas phase . This
will be explained in more detail in the descriptions of subroutines MIGRATE
and DBSPROB.
The program ca n b e set to change some of the input parameters at a
prespecified point. Following each desorption scan, if the time counter (variable
TIME) is greater than variable ANNEAL (assuming ANNEAL has been input
non-zero), the program reads in a new set of parameters. Also, array CDESPL
can be used to trigger reading of a n ew set of parameters. Arrays CDESPL and
TDESPL contain input coverage and time values , respectively, which determine

74
when maps will be written to the map file . After writing a map, the program
checks the next value of CDESPL. If the value is 1.0, the program stops . If it is
2 .0, the program reads in a new parameter set. If the value of TIME or EXPOS
(the exposure counter, in units of mono layers) exceeds TMAX or EXPMAX,
respectively, the program will stop.
Variable DMPINT specifies the exposure interval (in monolayers) for print
mg statistical information and for computation of the average probability of
adsorption (the increase in coverage divided by the increase in exposure). Most
of these calculations are performed in subroutine DUMP. Also, the program can
be set to stop or read in new parameters when the average probability of adsorp
tion drops below a given threshold; if the sum of the previous four adsorption
probability values drops below value input for variable STKMIN, the program
will read in new parameter values {if ANNEAL is non-zero) or will write a map
file and then stop {if ANNEAL is zero). Variable PLTINT specifies the exposure
interval for writing exposure and coverage values to file.
2.1.2 Program DSB
Program DSB is a simplified version of program ADS, although original
versions of DSB differed greatly from ADS. Program DSB computes desorption
scan using the same subroutines as in ADS, but does not compute absorption
cycles. The surface temperature is incremented following each desorption scan.
The surface heating rate defines the simulation time scale.
The program begins by reading a map file written by a previous run of
ADS. After reading the last map on the file, flag IFLG is set to one, which
signals that maps will be written out at various coverages as molecules are
desorbed, provided variable MAPN has been input as zero. The program then
calculates the energy state distribution (the number of adsorbed molecules with
each number of nearest- and next-nearest-neighbor molecules) and initializes a
number of variables before starting the first desorption scan.
Desorption scans are made using subroutine DESORB and desorption

- 75
probabilities are computed in subroutine DSBPROB. To increase the speed of
program DSB , desorption probabilities are computed at temperature intervals
specified by variable DT (usually 0.5 K), but as many as 1000 desorption
scans are made over this temperature interval, so that the excitation rate is
kept at a reasonable level. The number of desorption scans to be made in
temperature increment DT is stored in variable NPASS, which is computed so
that the predicted excitation rate will does not exceed input parameter ATMAX.
Prior to each desorption scan, a small correction t erm for the temperature
change is applied to the desorption probabilities . To prevent roundoff errors
in the temperature counter, the temperature is r eset every time desorption
probabilities are recomputed.
After the temperature has been incremented by NINT*DT, (NINT is
usually 4, corresponding to a temperature change of 2 K), the distribution
of molecules by energy state is recomputed and is output. Array DSBENG,
containing the number of molecules that desorbed in the last increment, sorted
by their energy state before desorption is also output. The next value for NP ASS
is set so that the estimated excitation rate does not exceed ATMAX and a
number of counters are reset. At this point, if there are still molecules on
the surface and the maximum temperature, TMAX, has not been reached, the
program continues with more d esorption scans. If the end of the scan has been
reach ed and there are more maps to read, the program continues by reading the
n ext map, otherwise the program s tops.
2.1.3 Subroutine MIGRATE
Subroutine MIGRATE allows a single precursor molecule at a g iven latt ice
site to migrate until it either adsorbs and becomes chemisorbed or desorbs into
the gas phase. Variables MX and NX are set to reflect the true distance the
molecule has traveled from its original position, even if the molecule hops over
an edge of the lattice, (cyclic boundary conditions are enforced). For each site
the molecule hops to, starting with its initial site, the subroutine first calculates
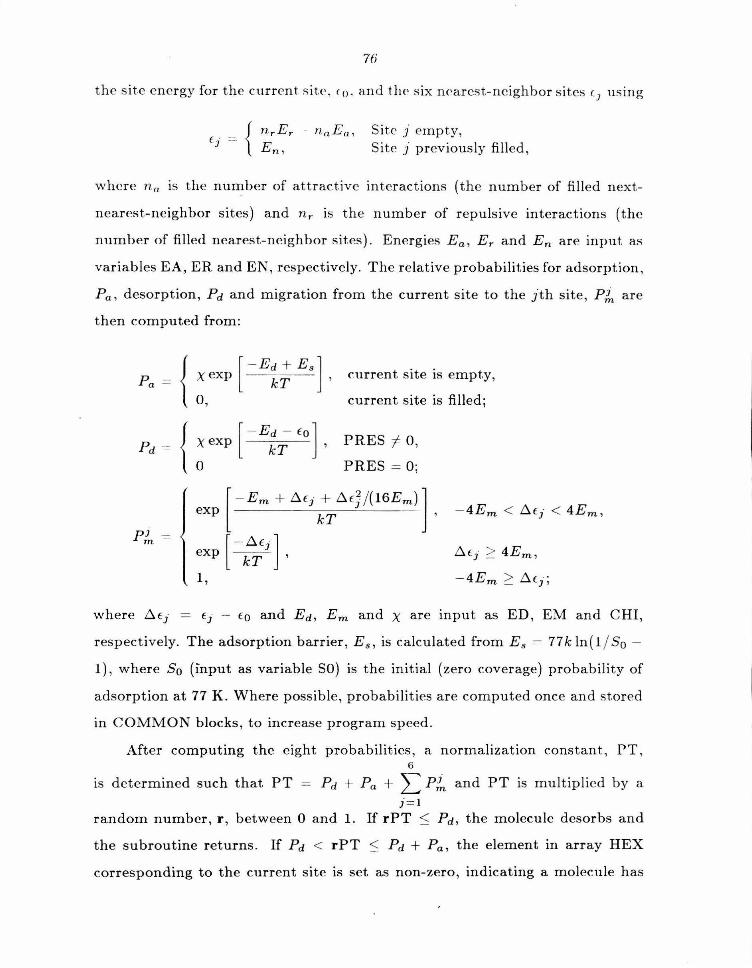
76
t h e site energy for the current s it<'. ( 0 . and tlH' six nearest-neighbor s ites c1
u sing
Site j empty, Site j prev ious ly filled,
w here n" is t he number of at tract ive interactions (the number of filled next
nearest-neighbor sites) and n ,. is the number of repulsive interactions (the
number of filled nearest-neighbor sites). Energies Ea, Er and En a re input. as
variables EA, ER and EN, respectively. The relative probabilities for adsorption,
Pa, d esorption , Pd and migration from the current site to the jth site, Plr, are
then computed from:
Pa = { Pr {
pl -m
[ - Ed + E s ] xexp kT ,
0,
[ - Ed - Eo] xexp kT ,
0
c.urrent site is empty,
current site is filled;
PRES i 0 ,
PRES = 0 ;
i:J. c1 ;=:: 4Em ,
- 4Em ;=:: i:J.f.J;
where i:J. EJ = f.j f.o and Ed, Em and X are input as ED, EM and CHI,
respectively. The adsorption barrier , E 5 , is calculated from Es = 77k ln(l / So -
1), where So (input as variable SO) is t he initial (zero coverage) probability of
adsorption at 77 K . Where possible, probabilities a re computed once and stored
in C OMMON blocks , to increase program speed.
After computing the e ight probabilities, a normalization constant, PT, 6
1s determined such that PT = Pd t Pa + L P/n and PT is mult iplied by a J=l
random number, r , between 0 a nd 1. If rPT ~ Pd, the molecule dcsorhs and
the subroutine returns . If Pd < rPT :S Pd + P0 , the elem ent in array HEX
corresponding to the current s ite is set as non-zero , indicating a molecule h as
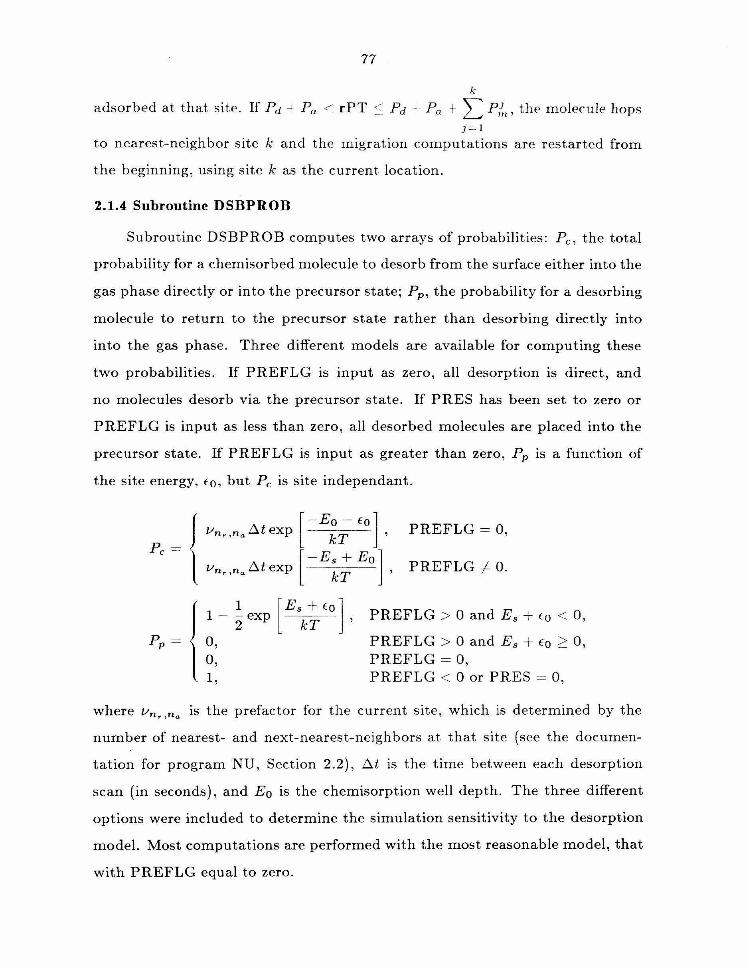
77
k
adsorbed at that site. If Pd -l Pa < rPT :_:: Pd + Pa t L P!,,, the molecule hops j = I
to nearest-neighbor site k and the migration computations are restarted from
the beginning, using site k as the current location.
2.1.4 Subroutine DSBPROB
Subroutine DSBPROB computes two arrays of probabilities: Pc, the total
probability for a chernisorbed molecule to desorb from the surface either into the
gas phase directly or into the precursor state; Pp, the probability for a desorbing
molecule to return to the precursor state rather than desorbing directly into
into the gas phase. Three different models are available for computing these
two probabilities . If PREFLG is input as zero, all desorption is direct, and
no molecules desorb via the precursor state. If PRES has been set to zero or
PREFLG is input as less than zero, all desorbed molecules are placed into the
precursor state. If PREFLG is input as greater than zero, Pp is a function of
the site energy, f:o, but Pc is site independant.
{ [-Eo - Eo] PREFLG = 0, Vn. ,na ilt exp kT '
Pc = [ -Es +Eo] Vn n ilt exp , PREFLG i 0.
., a kT
l 1 [ Es +Eo] PREFLG > 0 and Es + to < 0, 1- - exp 2 kT '
Pp = 0, PREFLG > 0 and Es +Eo 2: 0, 0, PREFLG = 0, 1, PREFLG < 0 or PRES = 0,
where Vn. ,na is the prefactor for the current site, which is determined by the
number of nearest- and next-nearest-neighbors at that site (see the documen
tation for program NU, Section 2.2), ilt is the time between each desorption
scan (in seconds), and Eo is the chemisorption well depth. The three different
options were included to determine the simulation sensitivity to the desorption
model. Most computations are performed with the most reasonable model, that
with PREFLG equal to zero.

78
2.1.5 Subroutine DESORB
Subroutine DESORB scans the surface, allowing molecules either to remain
adsorbed at their current site , to desorb directly into the gas phase, or to desorb
into the precursor state, where they hop from site to site until they either
readsorh or desorb. The subroutine scans each site in a predetermined random
order to minimize correlation between sequential desorption events that might
occur if scans were done on a row-by-row basis. The same random sequence of
sites is used for all scans in a given run. The random sequence is read from a
file prepared using program RAST.
Desorption scans are made by selecting each occupied site in turn and
determining the value of Pc for that site. A random number between zero
and one is computed and then compared to the value of Pc. If the random
number is less than or equal to Pc, a second random number is compared to
Pp to determine if the molecule will desorb directly or into the precursor state.
If the molecule does desorb into the precursor, subroutine MIGRATE is used.
If the molecule desorbs (either directly or via the precursor), the element in
array DSBENG corresponding to the site energy of the molecule when it was
last adsorbed to the surface is incremented.
2.1.6 COMSUB Subroutines
There are six short utility subroutines in file COMSUB.FOR. Subroutine
CYCLE is used to imposes cyclic boundary conditions, but it also updates
variables MX and NX to reflect the position on an infinite lattice, so that
migration distances can be computed. Function DIST is used to compute the
actual distance between two sites. Functions NEAR and NEXT compute the
number of filled nearest- and next-nearest-ne ighbor sites, respectively. Functions
EREDHD and TREDHD use the method of Newtonian approximations to solve
the Redhead equation v exp [- E I RT] = --{3 E I RT2 for E and T, respectively
(1). Function EREDHD is used to compute Eo from the input v values ,
and parameters that fix the low coverage temperature thermal desorption
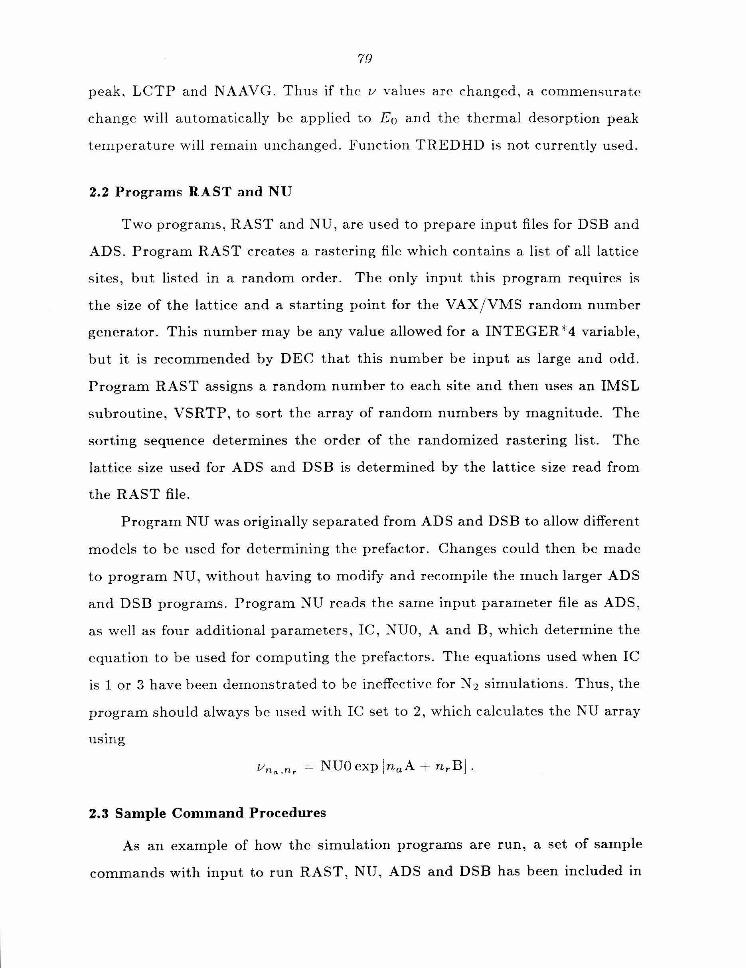
7.rJ
peak, LCTP and NAAVG. Thus if the v values are c.hangcd, a commensurate
change will automatically be applied to Eo and the thermal desorption peak
t emperature will remain unchanged. Function TREDHD is not currently used.
2.2 Programs RAST and NU
Two programs, RAST and NU, are used to prepare input files for DSB and
ADS . Program RAST creates a rastering file which contains a list of all lattice
sites, but listed in a random order. The only input this program requires is
the size of the lattice and a starting point for the VAX/ VMS random number
generator. This number may be any value allowed for a INTEGER. '14 variable ,
but it is recommended by DEC that this number be input as large and odd.
Program RAST assigns a random number to each site and then uses an IMSL
subroutine, VSRTP, to sort the array of random numbers by magnitude. The
sorting sequence determines the order of the randomized rastering list. The
lattice size used for ADS and DSB is determined by the lattice size read from
the RAST file.
Program NU was originally separated from ADS and DSB to allow different
models to be used for determining the prefactor. Changes could then be made
to program NU, without having to modify and recompile the much larger ADS
and DSD programs. Program NU reads the same input parameter file as ADS,
as well as four additional parameters, IC , NUO, A and B, which determine the
equation to be used for computing the prefactors. The equations used when IC
is 1 or 3 have been demonstrated to be ineffective for N 2 simulations. Thus, the
program should always be used with IC set to 2 , which calculates the NU array
usmg
2.3 Sample Command Procedures
As an example of how the simulation programs are run, a set of sample
commands with input to run RAST, NU, ADS and DSB has been included in

80
Appendix C. This is an input d C'ck for a fa irly complicated run. The procedure'
first ass igns a DCL symbol , which defines the suffix to be used for file names
of the output and intermediate files. The procedure then copies the input
parameters to a file , where t hey are later read by progra ms NU and ADS.
(Note the use of cori1ment. lines between input. lines.) The programs RAST
and NU a re run . Processing is then started on the AP by us ing the SJE
command and commands are given t o the AP to start running program ADS.
The ATTACH/ WAIT command causes SJE to wait until the AP is available, if it
is currently in use, and the SET / LIMIT= 16000 sets a CPU time limit of 16,000
seconds (approximately four hours) for the running of each program. The next
step is to copy the input files for program ADS from the VAX to the AP and
then program ADS is executed. In this run, desorption is done at two different
temperatures and different (isotopic) labels are used for the molecules adsorbed
at each temperature. After ADS finishes, output files from ADS are copied to
the VAX and then program DSB is run. After the final results are copied out of
the AP, all the output files are renamed to share the common suffix. This suffix
is then passed to command procedure PLT which plots the results.
Also included in Appendix C is a sample command file showing how
programs ADS and DSB should be cross-complied and linked on the VAX to
run on the AP. Note that the OPT = flag specifies to what level the compiler will
attempt to optimize the program when compiling. Higher OPT levels may yield
more efficient code, b ut m ay a lso introduce errors. The programs have been
ca refully t ested at the current levels but higher leve ls have not been attempted.
Fo llowing linking , t h <> image file (the linked program) is then copied over to the
AP and s tored on the AP using SJE.

81
3. Programs for Fourier Transform Computations
Two programs perform most of the calculations used for computing Fourier
transforms of surfaces. One is program FFT, which computes a fast Fourier
transform from a map output by ADS or DSB and fits a Voigtian line shape
to a peak in the Fourier transform intensities . The second program is EQFIT,
which optimizes parameters for an island-growth expression to give the b est
fit to the full-widths at half-maximum Voigt function as computed by program
FFT.
3.1 Program FFT
Program FFT reads maps from up to ten different map files and averages
the FFT intensities computed from each map to improve the the signal-to-noise
in the transform. If requested, FFT will also plot the Fourier transform intensity
results and/ or plot graphs of the radially averaged profile of the intensities and
the fitted line shape.
The program first reads input values for the flags which determine what
maps will b e used and whether results will be plotted. Subroutine OPENIN
reads a file name and reads the header on each file. Subroutine READIN reads
in a map from each file. The dimensions of the lattice of each map should be
divisible by two and all maps must be the same lattice size. The program then
prepares to plot the intensity, if requested, by defining a set of pixels of different
shades for use on the laser plotter.
Subroutine DIFFRACT is used to compute t he Fourier transform intensity.
The subroutine first expands the pseudo-rectangular array from the map file
into a true-rectangular array, SCAT, using the coordinate transformations
discussed in Section 1. Array elements corresponding to empty sites in the
hexagonal lattice are assigned a scattering amplitude equal to variable RSCAT
(usually 0); filled sites are assigned scattering amplitude equal to the sum of
variables RSCAT and NSCAT (usually 1). The "extra" array elements, those
not corresponding to a site in the hexagonal array, are always set to zero.

- 82
Subroutine DIFFRACT computes a two-dimensional fast Fourier transform
by computing a one dimensional real-to-complex transform along the columns
of SCAT, placing the results into a complex array, DPAT. Each row is then
removed from array D PAT and is transformed using a one dimensional complex
to-complex fast Fourier to another complex vector, which is reinserted into the
array DPAT. The fast Fourier transform routines used are both from the IMSL
library, FFTRC for real-to-complex transforms and FFTCC for complex-to
complex transforms. The final section of DIFFRACT computes the magnitude
(intensity) of each complex value in the DPAT matrix. Intensity values are
summed into array INTEN and are later normalized to yield the intensity
average values.
The intensity map is plotted by choosing one of twenty rectangular pixels
for each array element, where the grey level of the pixel is chosen to match the
scaled intensity. Intensity map plotting is done using the QUIC package (see
Section 4 .1). Function ARR is used to map any point in reciprocal space into
a calculated intensity array element. Array element (Mi, Ni) are related to the
reciprocal cell position vector ha* + kb* by the equations
M N h =-t _ _ t M N
and k = Ni N'
where the original dimensions of the map array are (M, N /2).
The program calculates a profile for the ( ~, ~) diffraction feature (also
referred to as the y3 beam). Subroutine LSTFIT uses a least-squares refinement
procedure to determine the best values for the parameters rJ, K and f to fit the
two dimensional pseudo-Voigt equation
Mi - Me Ni - Ne . . )2 )2
where D.r2 = ( M + 3 ( N , I(Mi, Ni) IS the Founer transform
intensity of array element (Mi, Ni) and (Me, Ne) corresponds to the beam center .

8 .1
The full-width at half-maximum of the beam profile is r and the integrated beam
intensity is 2mc The a lgorithm used in subroutine LSTFIT is discussed in more
detail in Section 3.2, below. Program FFT uses subroutine TFIT to plot out the
actual intensity points , radially aver aged points and the fitted Voigtian function.
3.2 Program EQFIT
Program EQFIT uses a leas t-squares refinement procedure to determine the
best values for parameters. The method of least-squares determines th e best fit
for a function Y (Xi , p 1 , P2, . . . , Pm) to a set of n data points Xi , Yi by minimizing
the function n
E = L Wi [Y(xi,Pt,P2, · .. , Pm)- Yi ]2
, i = I
where p 1,p2, . .. ,pm are them parameters to be fit and Wi is the weight, usually
1/ oi, where Oi is the estimated error in Yi (2) . The best fit then will be given
when aE j aP1 = 0 for all j. Direct solution of this equation is not usually
possible, but if function Y is approximated by a Taylor expansion of Y about
values at,a2, .. . , am for Pt , P2, · · · ,Pm, where the non-linear terms [those of
higher power than ( ai - Pi) ] are neglected, then the problem can be solved
usmg
m I ( ) "'""' aY(xi, al, a2, ... , am)
Y ~ Y = Y Xi,a i,a2, ·· · ·am + ~ ---- 6.pk, k = l Pk
where 6.pk = Pk - ak. The m coupled aE I api = 0 equations may then be
written as aE
= 0
= a a . t wi (Y' - Yi) 2
,
PJ i = I
n aY' = L wi (Y' - Yi) ap . .
i = 1 J
Substitution for Y' and rearrangement yields
~ ) ] aY(xi, a1, a 2, ... , am) ~ Wi [Yi - Y(xi,a1,a2, .. . , am i = t Pi

Note that ay I I dPJ = ay (X;' 0.( '02' ... '0-rn) I Py. By defining two m element
column vectors B and P and an m by m diagonally-symmetric matrix A such
that
n
B "' [ Y( )]oY(xi,a!,a.2,···,am) J = ~ Wi Yi - Xi, a 1, a2, ... , am . , i = l PJ
and P 1 = b. pi = p1 - a1, the previous m coupled equations can be combined
into one equation
B = AP or A-lB = P .
Thus, with a given set of starting values, a 1 , a 2 , ... , am, for the parameters
p 1, P2, ... , Pm, the correction terms to improve the fit of function Y (Xi, p 1 ,
P2, ... ,Pm) will be P, which can be computed by numerically evaluating the
B and A elements and then inverting the m by m matrix. This procedure can
be run iteratively until the correction terms become negligible.
Program EQFIT reads in the data to be fit, computes the starting values
for the parameters, uses a least-squares refinement to improve the fit of the
parameters and then plots the fitted equation and the data. Programs EQFIT
and FFT both use subroutine LSTFIT to find the best fit to the equation coded
in function DIRV. The version of LSTFIT in EQFIT is a better commented
version of the routine, but the routine used in FFT is more efficient.
For equations that are difficult to fit - equations where the parameters
are highly correlated - LSTFIT has a tendency to compute correction terms
that are too large for the first few cycles, causing the refinement to diverge.
For this reason a muting factor, SP, is applied. In the first cycle, correction
terms are multiplied by this number (usually less than 0.5) and in subsequent
cycles the muting factor is automatically raised to 1.0 before the last allowed

85
cycle, which is determined by variable NCYC. If the refinement cycles fail to
show an improvement, as noted by negligible change in the goodness of fit,
~ Wi [Yi - Y(x, , a,, a,, ... , a,., )[2 / (n - m), the , efinement twninates.
Subroutine DIR.V evaluates the function to be fit and the derivatives of the
function with respect to all parameters tha t will b e refined. The parameters are
passed in array PAR and the independent variable in X. The array PI selects
which derivative will be computed, i.e. , 0 to compute the function itself and 2
to compute the derivative with respect to PAR(2) . While both LSTFIT and
DIRV are dimensioned to fit a four-parameter equation, this number could be
increased, if needed, with little effort.

4. Graphics Programs
Five graphics packages have been used in this thesis . The standard p ackage's
for the Vers a t ec , Nicolet (Zet a ) and T a laris plotters, VERSAPLOT, FPS and
QMSPLOT , respectively, are documented both through manuals supplied by
the vendors and through the XHMEIA on-line help facility (by typing HELP
@USER GRAPHICS). Another package used , GRPPKG / PGPLOT, was written
by Tim P earson of the Caltech Astronomy Department . This fine package
allows plotting of graphics on a number of d evices including several types of
computer terminals and the versatec plotter. Further information about the
GRPPKG/ PGPLOT package may b e obtained through the XHMEIA on-line
help facility, which will also give instructions for printing the manuals for the
package, which are also stored on-line. A small graphics package, QUIC, was
written by the author specifically for use in this thesis . This package, which
will be described later in more d etail, plot maps in high resolution on the laser
plotter.
The graphics programs written for this thesis fall into three classes: pro
grams for plotting numerical results from ADS and DSB (e.g., probability of ad
sorption, thermal desorption intensity), programs for graphical display of maps ,
and three dimensional plotting programs for diagrams showing the number of
molecules in selected energy states versus temperature and versus energy.
4.1 The QUIC package
The QUIC package was written for the Talaris laser plotter after it was
discovered that the QMSPLOT package produced complex plots very slowly and
inefficiently, because the QMSPLOT package fails to utilize most of the plotter' s
more advanced features . The QUIC package prepares a set of commands in the
plotter's native command language , also called QUIC, which can then be sent
directly to the plotter. Maps plotted using the specialized MAP program and
the QUIC package plot approximately a factor of one hundred faster than a
simpler program written to use QMSPLOT. The code for the package including

X7
doc umen tation and sample routines a r<' list<'d in Appendix C .
4.2 Program MAP
Progr am MAP uses the QUIC package t o create two fon ts (collect ions of
symbols ): one fon t conta ins only two symbo ls, a filled circle and an open c ircle ;
the o t her font conta ins four symbols, one is blank and the other three a re lines in
three different directions. The program then reads in a m ap file and assembles
a character string for each row in the map, using the letter A for an empty site
a nd B for a fill ed s ite . The string is then written to disk where it can the be
sent to the laser plotter . The laser plotter interna lly translates these characters
to the previously defined circle symbols and constructs a diagram showing the
empty sites as open circles and the filled s ites as open circles with a filled closed
circle inside .
The phase of each adsorbed atOitl, with respect to the three phases of
( y3 x y'3) domains, is indicated by the direction of the line drawn through
the site. Three additional plots are superimposed on the plo t showing filled and
empt y sites. In each of these plots , lines are drawn through a ll of t he fill ed s ites
in each of the three phases .
4.3 Programs for State Analysis
It is informative to analyze , as a function of t emperature , the number of
m o lecules adsorbed in a given energy state and the number of molecules that
desorb from a given energy stat e . The d esorption progra m , DSB, wri tes two
files containing information about the states of molecules . The FOR.OlO fil e
contains, for each temperature , an array conta ining the numbers of molecules in
a ll 49 adsorption states. The FOR015 fi le contains an array w ith the number of
m o lecules that have desorbed from each of the 49 energy s t a tes in the previous
temperat ure increm ent . A set of progra ms , 3A, 3D , 3DV and 3DR have b een
written to plot three dimensional r epresentations of the number of molecules
a d sorbe d or d esorbed from a series of states versus both temperature and en ergy.
The only input to programs 3A and 3D are the names of the data files

8R
to be aver aged and a list of the energy states to be plotted (read from file
STATE.DAT). Programs 3A and 3D read t he FOROlO and FOR015 files ,
r esp ectively, and create interme diate files with t he numbers of a dsorbed and
d csorhed m olecules, resp ectively, for the subset of t he 49 energy states which
will be plotted.
The intermediate files are then plotted by program 3DV, which plots three
dimens ional diagrams on Versatec plot ter u sing th~ VERSAPLOT package. The
diagrams can also b e plotted on a terminal using a similar program , 3DR which
uses the GRPPKG / PGPLOT package. The only input to programs 3DR and
3DV is the name of the intermediate file, a flag to determine whether to use a
file from program 3A or 3D, and two scaling parameters, THETA and R.
Programs 3DR and 3DV plot temperature along the vertical axrs, the
number of molecules along the horizontal axis and the energy of the s tate
projected out of the page. The projected length a nd angle of the energy axis ,
with respect to the vertical and horizontal axes , is determined by the values
of R. and THETA. States are plotted in order of increasing energy, which is
equivalent to plotting from front to back. For each energy state, a plot of t h e
number of adsorbed (or desorbed) molecules versus temperature is projected
onto the plane of the paper. The program maintains an a rray with the largest
y va lue that has already been plotted at a given x va lue , in the plane of the
paper . (The maximum y values a re d etermined by interpolating the projected
y values to each x value.) E ach t ime the program plots a line , it checks to see if
any section of the line is obscured "behin<.r a prev iously plotted line and if so,
the section is not plotted or is plotted as dashed. This very s imple algorithm is
adequate to solve the "hidden line" proble m for t hese plots.
4.4 Program SISO
Program SISO plots the probability of adsorption results from ADS and
the thermal desorption intensities from DSB. The program computes smoothed
derivatives in subroutine DERIV using the m ethod of Savitzky and Golay (3).

8 9
It c.an aver age results from up to ten d iffcr Pn t runs to r educ<' random noise. It
can a lso be used to p lot t he desorpt ion spectra of two differently labeled Sf'ts
of molecules, if t he "isotope" labeling opt ion was used in ADS . The input to
t he program consis ts of a scaling fac t or , SCLFCT, which multiplies the therma l
desorption spectra, t he la b eling selection flag , ISO , which se lect s the "isotope"
t yp e. A selection integer , I OMIT , is input for each thermal d esorption spectrum.
If IOMIT is one for an y sp ectrum, that spectrum is not plotted .

[)()
Table. Input paramct<'rs for p rograms RAST. :\U. ADS and DSB. Param
eters are lis t ed in the order they arc normally input.
TITLEc (72)
EDR
EMR
EA R
ERR
ENH
C Hin
son TS R
EXPMAXR
TMAXR
PRESR
D SBINTR
PLTINTR
DMPINTH
BETAR
DTR
Program RAST
The lattice s ize to he used in RAST , ADS and DSB
The starting point for the r andom number generator
Programs ADS and NU
A title for the set of runs; the tit le will be stored on all files read or written by ADS, NU and DSB
The precursor well depth or desorption energy, Ed
The energy harrier to migration, Em
The attractive (next-nearest-neighbor) interaction energy, Ea
The repulsive (nearest-neighbor) interaction energy, Er
The d estabilization energy for filled s ites, En
The ratio of prefactors for desorption and migration , x
The initial probability of adsorption at 77 K , So
The surface temperature
Maximum allowed exposure (in monolayer) before program
ADS stops
Maximum allowed time (in seconds) before program ADS stops
Pressure (in Torr)
Time interval between desorption scans (in seconds )
Exposure interval (in monolayer) be tween points written to
the FOR008 file.
Exposure interval (in monolayer) hdw<'cn calls of snhrontinP DUMP
Temperature assignment (in I{) for the low coverage TDS ·
p eak; used to compute Eo
Number of attractive interactions assigned to the low cover age
TDS peak; used to compute E 0 ; usually set to 1.5
TDS h eating r ate (in K / s)
Temperature interval (in K) for program DSB

ANNEALH
STKMINH
PREFLG 1
NPASS 1
TDESPLR (20)
TMIN1
TMAX1
TINT1
91
Flag for paranwter changes; ·when the tirne counter equals ANNEAL (for ANNEAL ·.; 0) u ew values will Le read for TS , ISO, PRES , DSBINT, PLTINT, DMPINT, ANNEAL, STKMIN, NPASS
Minimum probability of adsorption, if the actual value is less than this threshold and ANNEAL S 0, program ADS stops; if ANNEAL > 0, new parameters are read (see ANNEAL)
Flag indicating method for desorption; PREFLG = 0 -normal ; PREFLG < 0 - all desorption is via precursor; PREFLG > 0 - all desorption is direct.
Number of desorption scans between each desorption probability calculation
Array of coverages (in monolayers) where maps will be stored; if after storing a map, the next value is 1.0, the program stops; if it is 2.0, new parameters are read (see ANNEAL)
Array of times (in seconds) where maps will be stored
Program NU
Indicates the equation to b e used for computing v values , should always be input as 1
Desorption prefactor for an isolated molecule
Increase v by exp ( na A) for na attractive interactions
Increase v by exp(nrA) for nr repulsive interactions
Program ADS
The starting point for the random number gen erator
Program DSB
Starting point for the TD scan (in K)
Ending point for the TD scan (in K)
Specifies how often desorption statistics should b e stored on file; information will be written following TINT desorption calculations (corresponding to DT*TINT degrees Kelvin)
Minimum coverage (in monolayer) for TDS calculations; maps with lower coverages will be skipped.
The starting point for the random number generator
Flag for writing map files during desorption: 0 prevents
writing of maps

PREFLG 1
ATMAXR
CDESPLn (20)
92
Flag indicating the model for desorption;
1wnual; PREFLG < , 0 - all Jesorptioll
PREFLG > 0 ·- all desorption is direct.
PREFLG 0
1s v1a precursor;
Maximum number of precursor excitations allowed p er des
orption scan; program DSB will attempt t o set NPASS so
that this value is not exceeded
Array of coverages (in monolayers) for which maps should b e
written.
Superscripts i11dicatf' thP FORTRAN variable type. The types i11teger, real
and character are indicated by superscripts I, R and C, resp ectively. A number
in parenthesis following the variable name indicates the parameter has been
dimensioned to that number of elements, or in the case of character variables,
that number of characters.

fJ.'I
References
Jl J P. A. Redhead, Va.cuurnl2 , 203 {1062) .
J2 J G. H. Stout and L. H . .Jenson, X-ray Structure Determination, Macmillan
Publishing Co., Inc., New York, 1068.
J3J A. Savitzky and M . .J. E. Golay, Anal. Chern 36, 1627 {1964); J. Steinier,
Y . Termonia, J. Dcltour, Anal. Chern 44, 1906 {1972).

- 94 -
Appendix C:
COMPUTER PROGRAM LISTINGS
1. Programs for N 2 Adsorption and Desorption
1.1 Programs ADS and DSB
1.2 Subroutines MIGRATE, DSBPROB and DESORB, COMSUB subrou
tines and COMMON blocks
1.3 Programs RAST and NU
1.4 Sample Command Procedures
2. Programs for FFT Computations
2.1 Program FFT
2.2 Subroutine LSTFIT
3. Graphics Programs
3.1 The QUIC package
3.2 Program MAP
3.3 Programs for State Analysis: 3A, 3D, 3DR and 3DV
3.4 Program SISO
3.5 Program FFTMAP

- 95-
Programs for N 2 Adsorption and Desorption
1.1 Programs ADS and DSB
[BHT .N2.AP]ADS.FOR C***************************************************************************** c•••••••••••••••••••••••••••••••••••****************************************** C**** . ***** C**** PROGRAM TO MODEL N ADSORPTION ON Ru(0001) ***** C**** 2 ***** c•••• ***** C**** Using true Monte-Carlo type model ***** C**** ***** C**** BRIAN TOBY 12/83 ***** C**** ***** C**** ADAPTED FOR ARRAY PROCESSOR (BHT 6/84) ***** C**** Change isotope label during annealing (BHT 8/85) ***** C•••• Read in new parameters when time = ANNEAL (BHT 0/85) ***** C**** Several changes : (BHT 10/85) ***** C**** CDESPL = 2.0 ==> treat as ANNEAL command ***** C**** PRES = 0 .0 ==> reset DT1MOL, branch around adsorption , ***** C•••• and disable desorption from precursor (set Pd to 0) ***** C**** Print running sum of # of molecules desorbed after ***** C•••• adsorption , print info before probability computation ***** C**** Changed to allow "closed system" calculations : (BHT 5/86) ***** C•••• PRES < 0.0 ==> adsorption only occurs until the coverage ***** C**** reaches the initial coverage . ***** C**** Map files may now be input to the program on file FOR022 ***** C**** ***** C**** Environment Dependant Prefactor Model ***** C**** ***** C***************************************************************************** C***************************************************************************** C•• C** C•• C•• C•• c•• C•• C** C•• c••
HEXAGONAL LATTICE IS STORED BY COORDINATES (m,n) WHICH ARE RELATED TO CARTESIAN COORDINATES (x,y) BY
X y y
m * A * .sin(60) n • A n • A A I 2
WHERE A IS THE LATTICE SPACING
BLOCK DATA c INCLUDE 'SIMCONA.FOR/list' $INSERT SIMCONA.FOR c INCLUDE 'SIMCONB .FOR/list' $INSERT SIMCONB.FOR c INCLUDE 'SIMCOMC .FOR/list ' $INSERT SIMCOMC.FOR c INCLUDE 'SIMCOND .FOR/list' $INSERT SIMCOMD .FOR c INCLUDE ' SIMCONE .FOR/list' $INSERT SIMCONE.FOR c••
DATA NEARM/-1,-1,0,0,1,1/
(m ODD) (m EVEN)
FOR VAX
FOR VAX
FOR VAX
FOR VAX
FOR VAX
DATA NEARN/0,1 , -1,1 , 0,1 , -1 ,0 , -1,1 , -1 , 0/ C** NEARN(i),NEARN(i,j) DESCRIBE THE NEAREST NEIGHBOR SITES RELATIVE TO C•• THE CENTER SITE . j IS 1 FORm ODD ; 2 FORm EVEN. c••
DATA NEXTM/-2 , -1,-1 , 1,1,2/ DATA NEXTN/0,-1,2,-1,2,0,0,-2,1,-2,1,0/
C** NEXTM(i) ,NEXTN(i,j) DESCRIBE THE NEXT NEAREST NEIGHBOR SITES RELATIVE C** TO THE CENTER SITE . j IS 1 FORm ODD ; 2 FORm EVEN. c••
DATA HEX/10000•0/,SIZE/100/ C•• SIZE IS THE DIMENSION OF THE [SQUARE] LATTICE

- 96 -
DATA IR/266/ C** IR IS THE STARTING POINT FOR THE RANDOM NUMBER GENERATOR
END C!** C***************************************************************************** C***************************************************************************** C** c INCLUDE 'SINCONA.FOR' FOR VAX $INSERT SINCONA.FOR c INCLUDE 'SINCONB.FOR' FOR VAX $INSERT SINCONB.FOR c INCLUDE 'SINCONC.FOR' FOR VAX $INSERT SINCONC.FOR c INCLUDE 'SINCOND.FOR' FOR VAX $INSERT SINCOND.FOR c INCLUDE 'SINCONE.FOR' FOR VAX $INSERT SINCONE.FOR C•• C•• LIST is the (decoded) random order rastering sequence
INTEGER•2 LIST(2,10000) REAL E,T,NAAVG,LCTP REAL NRM,DSBINT CHARACTER•7~ LINE,TITLE REAL CDESPL(20),time,dtim,tmax integer TDESPL(20) INTEGER DSBENG(40,2) real v1(40),v2(40) DATA DCDEO,DCDE1,DCDE2,DCDE3/4*1.0/ DATA CDESPL/20•1 .0/,TDESPL/20•-1/ DATA time/0.0/,dtim/0 .0/
C••AP TO VAX!*** COMMENT OUT FOLLOWING LINES C•• Open output files C UNIT=7 ==> : OUTPUT (by default) override to save VAX CPU:
OPEN(UNIT=7, FILE=':S(XHNEIA):BHTOUT.ADS, FNT=F', 1 ACCESS= 'SEQUENTIAL', RECL=132, STATUS='unknown') OPEN(UNIT=8,FILE='FOR008.DAT, FNT=F', STATUS='unknown') OPEN(UNIT=O,FILE='FOROOO.DAT, FNT=F', STATUS='unknown')
C STATUS_CODE = SYS$GETTINE (CTIN, WTIN) C WRITE(7,108) CTIM,CTIN•0.0036,WTIN,WTIM•0 .0036
108 FORMAT(' CPU TINE=' ,F10.2,' ($' ,F7.2,') REAL TINE= ' 1 F10.2,' ($',F7 .2,')')
IDESPL = 1 JDESPL = 1 N1 = 1 N2 = 0 IPLT = 1 IDNP = 1
C•• Exposure/coverage intervals for desorption, plot points, and interactions c DSBINT = 0.06 c PLTINT = -0.02 c DNPINT = 0 . 02 c••
EXPNAX = 4 .0 C** EXPNAX IS THE MAXIMUM EXPOSURE (IN MONOLAYER) C••
NEXP = 0 C** NEXP IS THE NUMBER OF MOLECULES "EXPOSED" TO THE SURFACE C**
NADS = 0 MADS = 0 NADSP = 0 NADS1 = 1000 NADStr = 0
C** NADS IS THE NUMBER OF MOLECULES "ADSORBED" ON THE SURFACE c••
NOES = 0 DHOP = 0 AHOP = 0 ADIS = 0 .0

C••
.A.DIS2 = 0 .0 DDIS = 0 .0 DDIS2 = 0 .0 SIZE = 40
C*** P.A.R.A.METER DEFINITIONS : C**
ED = 1.6
- 97 -
C Desorption energy from clean surface (Kcal/mol) ER = 0.320
C Energy of a repulsive interaction (Kcal/mol) E.A. = 0.160
C Energy of an attractive interaction (Kcal/mol) EN = 0.8
C Energy difference for precursor on empty site vs . filled site (Kcal/mol) CURV = 0.1630041
C Curvature of well (in Kcal/.A.••2/mol) CURV = Emig(0)•4/R••2 CHI = 1.E3
C Controls number of hops RA = 2.7068
C Lattice spacing (in .A.) R = 1.0872 K = 1 .0872E-3
C UNITS: Kcal or cal/(K-mol) TS = 80 .
C Temperature of surface (K) so = .26
C initial sticking coefficient DT = 0 . 6
C UNITS : K / iteration PRES = 1.E-8
C PRESSURE: units of Torr N.A..A.VG = 2.
C LOW COVERAGE PE.A.K TEMPERATURE LCTP = 130 .
C .A.NNE.A.L : If non-zero change parameters at time = .A.NNE.A.L .A.NNE.A.L = 0.0
C NP.A.SS : # of desorption scans/probability computation NP.A.SS = 1
c C****************************************************************************** C•• Open/read rastering sequence array C••.A.P TO VAX!*** COMMENT OUT FOLLOWING LINE
OPEN(UNIT=20 ,FILE='RAST.D.A.T, FKT=F', ST.A.TUS= ' OLD') RE.A.D (20,202) SIZE,N2
202 FORK.A.T(1X, 2I6) siz2 = SIZE**2 IF (N2 . HE . SIZ2) STOP '***WRONG RASTER LIST DIMENSION***' RE.A.D (20,212) (LIST(1,I),LIST(2,I),I=1,N2)
212 FORK.A.T(1X,20I6) CLOSE(20)
C****************************************************************************** C•• Open/read prefactor (NU) array C••.A.P TO VAX!*** COMMENT OUT FOLLOWING LINE
OPEN(UNIT=21,FILE='NU.D.A.T, FKT=F', ST.A.TUS='OLD') RE.A.D (21,222) (nu(i),i=1,40)
222 FORK.A.T(1X,7E10 . 3) CLOSE(21)
C****************************************************************************** C•• Now open file/read in input parameters C••.A.P TO VAX!*** COMMENT OUT FOLLOWING LINE
OPEN(UNIT=4,FILE='.A.DS . D.A.T, FKT=F', ST.A.TUS='OLD') RE.A.D (4,0000) TITLE RE.A.D (4,0000) LINE
0000 FORK.A.T(.A.72) RE.A.D (4,•,END=OO) ED,EK,E.A.,ER,EH RE.A.D (4,0000) LINE RE.A.D (4,•,END=OO) CHI,SO,TS RE.A.D (4,0000) LINE
C RE.A.D (4,•,END=OO) EXPK.A.X,Tmax,IR,PRES

- 98 -
READ (4 , •,END=99) EXPMAX,Tmax,PRES READ (4,9999) LINE READ (4.•,END=99) DSBINT,PLTINT,DMPINT READ (4,9999) LINE READ (4,•,END=99) LCTP , NAAVG,BETA,DT READ (4,9999,END=99) LINE READ (4,•,END=99) ANNEAL,STKKIN,PREFLG,NPASS READ (4,9999,END=99) LINE READ (4,•,END=99) (CDESPL(I),I=1,20) READ (4,0990 ,END=99) LINE READ (4,•,END=99) (TDESPL(I),I=1,20)
99 CURV =EN •4./RA••2 READ (6,•) IR
C•• COMPUTE THE CHANGE IN TIME FOR EXPOSURE OF ONE MOLECULE IF (PRES .LE. 0) THEN
DT1KOL = dsbint ELSE
DT1KOL = 4 . 08E-6 / (siz2 * PRES) END IF
C••• PROBABILITIES ARE: C Desorption = NRN • CHI • EXP( - (ED - EO) / KT) C Migration = NRN • EXP(- (EN + DE/2.) / KT) C Sticking = NRN * CHI * 1./(1./SO - 1.) * EXP( - ED / KT) C (N .B. probability for sticking is site independant if site is not filled) C where EO = NRO•ER - NAO•EA or EO = EN (if site is filled) C Ei = NRI•ER - NAI•EA or Ei = EN (if Ith site is filled) C DE = Ei - EO C and NRO, NAO are # of repulsions/attractions for current site, C NRI, NAI are# of rep/att for migration to the Ith site (O<I<7), C NHOP is the number of hops the molecule has taken C NRN = 1 . /(Desorption + Migration + Sticking) c•••••••••••••••••••••••••••••••••••••••••••••••••••••••••••••••••••••••••••••• c•••
WRITE(7,20) TITLE,SIZE,SIZE,EXPMAX,EXPNAX•4.08,tmax,ED,EN, 1 ER,EA,CURV,EN,SO,CHI,IR,TS
29 FORMAT(' ',72('*'),/,1X,A72,/,1X,72('•'),//' LATTICE IS' ,I4, 1 'BY' , I4,/,' MAXIMUM EXPOSURE: ',F6.3,' (monolayer) ',F6 . 2, a ' (L . )',/,' MAXIMUM TIME: ',1pe10.3,' (See) ',/, b ' DESORPTION ENERGY: ',OPF6 . 3, 2 /,' DESTABILIZATION ENERGY FOR FILLED SITE:' ,F6 .3,/, 3 'REPULSIVE INTERACTION ENERGY : ' ,F6.3,/, 4 'ATTRACTIVE INTERACTIVE ENERGY:' ,F6 .3,/, 6 ' CURVATURE : ',F6.4,' (EN : ',F7 .4, ')' ,/, 6 ' INITIAL STICKING COEFFICIENT: ',F6.4,/, 7 ' CHI=' ,F12.6,' SEED : ',IO,/,' TEMPERATURE:' ,F6.1,//)
IF (ANNEAL . NE. 0.0) WRITE (7,•) 'EXPOSE FOR ',ANNEAL, 1 'See, THEN CHANGE INPUT PARAMETERS' WRITE(7,228) DSBINT,NPASS,PLTINT,DNPINT,
1 (CDESPL(I),I=1,20),(TDESPL(I),I=1,20),PRES,STKNIN/4 228 FORMAT(/,' CALCULATE DESORPTION SCAN EVERY' ,F6.2,
a ' See-- RECALCULATE PROBABILITIES EVERY' ,I3,' SCANS',/, 1 'PLOT A POINT EVERY' ,F6.3,' N (Exposure)',/, 2 'PRINT SUMMARY EVERY' ,F6 .3,' N (Exposure)'./. 3 ' SAVE NAPS AT:' , /, 4 1x,6f6.2,10F6.2,6f7.2, • M (Cov)' ,/, 6 1x,6I6,10i6,6i7,' S (Time)',/, 6 • Pressure is • ,1P1E10.3,' Torr',/, 7 • Minimum average Sticking Coeffient =',OPF8 .6 , //)
RATIO = ER / EA E = EREDHD(LCTP,BETA,NU(1),R,N) EO = E - EA * NAAVG WRITE(7,128) LCTP,E,NAAVG,EO,DT
128 FORMAT(' TDS PEAK AT ',F6 .0, 'K (E = ',F6.3, 2 'Keal) IS ASSIGNED TO ',f3.1,'•EA STATE',/, 3 ' ISOLATED N2 MOLECULE - ENERGY IS ASSIGNED AS ' , 4 F6 . 3,' (Keal)',/,' TEMPERATURE INCREMENT' ,F8 .4,//)
WRITE (8,21) SIZE,ED,EN,EA,ER,EN,SO,CHI,TS,DSBINT ,IR,TITLE , 1 LCTP,E,EO,NAAVG,DT,BETA

C**
- 99 -
~RITE (9,21) SIZE ,ED,EN,EA,ER,EM,SO , CHI,TS,DSBINT,IR, TITLE, 1 LCTP,E,EO,NAAVG,DT,BETA
21 FORMAT(I6,6F10.6,/,3F10.3,I12,/,A72,/,F10 . 1,2F10 .6,F6.2, 1 F6.4,16x ,F6 . 1)
C** CALCULATE ARRAY CONTENTS AT CURRENT TEMPERATURE KT = K * TS
C** If desorption into precursor is allowed (PREFLG <> 0) IF (PREFLG .NE. 0) THEN
~RITE(7,*) 'Desorption via precursor atate ia allowed' IF (PREFLG . lt . 0)
1 ~RITE(7,*) 'No direct desorption ia allowed' ELSE
~RITE(7,•) 'Desorption ia direct, not via precursor state' END IF ES =I* 77. * LOG(1 . /SO- 1.) PSO = CHI * EXP( - (ED + ES)/ KT) PMO = EXP(- EN / KT) IF (PRES .EQ . 0) THEN
PDEN = 0 .0 PDO = 0.0
ELSE PDEN = CHI * EXP((EN - ED) / KT) PDO = CHI * EXP( - ED / KT)
END IF NRN = 1 . / (PSO + e . •PMO + PDO) DO 312 I= 1,7 DO 312 J = 1,7
L = I + (J-1)*7 DSBENG(L,1) = 0 DSBENG(L,2) = 0 EI(L) = (I-1.)>~<EA - (J-1.)*ER
C** Thia compute• PDI (P=O, NO DESORPTION FRON PRECURSOR STATE) IF (PRES .EQ. 0) THEN
PDI(L) = 0 ELSE
PDI(L) = CHI * EXP(- (ED + EI(L)) I KT) END IF
Cu PROBABILITY FOR "DESORPTION" VIA PRECURSOR STATE va . DIRECT DESORPTION IF (PREFLG .LT. 0 .or . prea . eq. 0 .0) THEN
PCPD (L) = 1. 0 elaeiF (PREFLG .EQ . 0 . OR . EI(L) .LT. ES) THEN
PCPD(L) = 0 .0 ELSE
PCPD(L) = 1 . - 0.6 * EXP((ES-EI(L))/KT) END IF
312 CONTINUE
~RITE(7,311) (J-1,J=1,7),(J-1,(EI(I+7>~<(J-1)),I=1 , 7),J=1,7) 311 FORMAT(/,38X,'ENERGY OF MOLECULES BY INTERACTIONS (Kcal/mole)',
1 /,46X , 'NUNBER OF ATTRACTIVE INTERACTIONS' , / 2 20X, 7I 10 ,/, ' NUMBER OF' ,/, 3 ' REPULSIVE ',I6,2X,7F10 .4,6(/ , 12X,I6,2X,7F10.4) , /) ~RITE(7,313) (J-1,J=1,7),(J-1,(nu(I+7*(J-1)),I=1,7),J=1,7)
313 FORMAT(/,40X,'PREFACTOR BY NUMBER OF INTERACTIONS (aec-1)', 1 /,46X, 'NUMBER OF ATTRACTIVE INTERACTIONS',/ 2 20X, 7I10 , / , ' NUMBER OF',/, 3 'REPULSIVE ',I6 , 2X,1P7E10.3,6(/,12X,I6,2X,7E10.3),/)
~RITE(7,772) TS,((PCPD(i+7>~<(j-1)),i=1,7),j=1,7) 772 FORMAT (' PROBABILITY FOR DESORPTION TO PRECURSOR ' ,
1 '(VS . DIRECT DESORPTION) AT T = ',F7.2,7(/,2X,7E13.4) , //) WRITE(7,28) PSO,PSO>~<NRN,PDO,PDO*NRM,PNO,PNO*NRM
28 FORMAT(' ZERO COVERAGE LIMIT: ' , /, 1 6X,'STICKING PROBABILITY: ',F6.4,3X,F6.4,/, 2 6X,'DESORPTIOH PROBABILITY: ',F6.4,3X,F6.4,/, 3 6X,'KIGRATION PROBABILITY: ',F6.4,3X,F6.4,/)
IDSB = 1

MDSB = 0 MMOVE = 0 MDSBP = 0 MMOVEP 0 MATMP 0 MATMPP = 0 MDIR = 0 NDSB = 0 MPASS = 0 ISO = 1 dmpmin 0.0 pltmin = 0.0 pltlvl = pltint dmplvl = dmpint
-100 -
C***************************************************************************** C** Before getting started, is there a map to read from file?
OPEN(UNIT=22,FILE='MAP.DAT, FMT=F' , STATUS='OLD' ,err=1009) READ (22,221,end=1009,err=1009) m,line,cov,n
221 FORMAT(I6,II,A72,II,6x,f6 . 3,22x,i14) IF (M .ne . size) stop 'Incorrect Map size . ' DO 224 I = 1, SIZE
READ (22,011,end=1000,err=1000) (HEX(I,J),J=1,SIZE) do 224 j=1,size
if (hex(i,j) .ne. 0) HADS = HADS + 1 224 continue
write (7,223) line,cov,nads,n 223 format ('OMAP FILE READ ON UNIT 22: ',a72,l, ' Coverage=' ,£6 . 3,
1 ' HADS =' ,i7,' IR (on file)=' , i14,ll) HADStr = nads
1000 IF (PRES .LE. 0 .and. HADS .LE. 0) stop 'Nothing to anneal.' C***************************************************************************** C** MOLECULE "HITS" SURFACE C*****************************************************************************
1000 IF (PRES .EQ. 0) goto 1001 C•• Zero pressure ==> just go on to next scan
HEXP = HEXP + 1 C*** HOW CALCULATE A STARTING SITE ON LATTICE
M = 1. + SIZE * RAH(IR) N = 1. + SIZE * RAN(IR)
C MINT ~ HINT are molecule's initial position on lattice MINT = M HINT = N
C** NOW ALLOW MOLECULE TO MIGRATE ON SURFACE DSBFLG = 1 CALL MIGRATE(ISO) D = DIST(MINT,NINT,M+MX,N+NX,RA) IF (DSBFLG .EQ. 0) THEN
C** Molecule was adsorbed: AHOP = AHOP + HHOP ADIS = ADIS + D ADIS2 = ADIS2 + D••2 HADS = HADS + 1
ELSE C•• Molecule was desorbed:
c••
HDES = HOES + 1 DDIS = DDIS + D DDIS2 = DDIS2 + D••2 DHOP = DHOP + HHOP
END IF
C** IF CURRENT COVERAGE IS LESS THAN INITIAL COVERAGE, CONTINUE ADSORBING if (nads .lt. nadstr .and. pres .lt . 0) goto 1000
C***************************************************************************** C** NOW CHECI IF THE SYSTEM "STATE" SHOULD BE DUMPED c•••***************************************************************************
EXPOS = HEXP I SIZ2 1001 COY = NADS I SIZ2
DTIM = DTIM + DT1NOL c••••••••••••****************************************************************** C••DESORPTION INTERVAL: (Time)

- 101 -
IF (DTIN .LT . DSBINT) GOTO 001 C****************************************************************************** C*** NOW DESORB MOLECULES FROM SURFACE C****************************************************************************** C** SHOULD WE RECALCULATE THE DESORBTION PROBABILITIES ON THIS PASS?
IF (MOD(NPASS,NPASS) .EQ . 0) THEN C** COMPUTE THE DESORPTION PROBABILITIES
c
1 324
1
CALL DSBPROB(DTIM) WRITE(7,324) TINE,NEXP,NADS,MMOVE,MMOVE-MKOVEP, mdab,mdab-mdabP,(NATMP-NATNPP)/(1.•NPASS) FORMAT(' DESORBED AT ' , 1PG10 . 3,' S, (' ,I6 , I6, ' Mol) Nove : ', I7, '(' ,I3,'), Dab : ',i7,'(' ,i3,'), Excit/acan' ,1PG10.3) WRITE(7,313) (J-1,J=1 , 7),(J-1,(PCTD(I+7•(J-1)),I=1 , 7),J=1,7)
NKOVEP = KNOVE NDSBP = NDSB NA TNPP = NA TNP
END IF NATNP = 0 NDIR = 0 NDSB = 0 INOVE = 0 CALL DESORB(NDIR,NATNP , LIST,NPASS,1. , DSBENG , INOVE) NPASS = NPASS + 1 MKOVE = MKOVE + INOVE KDIR = NDIR + NDIR NDSB = NDSB + NDSB NATNP = NATNP + NATKP TINE = TINE + DTIN DTIN = 0
c WRITE(7,323) TINE, NEXP,NATNP,NDIR,NDSB,INOVE c 323 FORMAT( ' DESORBED AT' ,F0 .1,' S, (' , I6, ' Nol) : ' ,4I4 c 1 , • Nolecule(a) ' ) C****************************************************************************** C** CHECK EXPOSURE AGAINST CUTOFF ONLY AFTER DOING A DESORPTION SCAN
IF (TINE .LT. ANNEAL . OR . ANNEAL .EQ . 0 .0) GOTO 001 C•• NOW CHANGE THE SURFACE TEMPERATURE
WRITE (7,•) ' ***CHANGE OF PARAMETERS AT' ,time,'Sec (' 1 ,EXPOS•4 .08,'L)'
908 dmplvl = DKPINT * IDKP dmpmin = dmplvl IDKP = 0 pltlvl = pltiNT * Iplt pltmin = pltlvl Iplt = 0 read (4 , 0000,end=2000) LINE READ (4 , •,END=2000) TS,ISO,PRES read (4,0009,end=2000) LINE READ (4 , •,END=OO) DSBINT,PLTINT,DKPINT read (4,0990 ,end=2000) LINE READ (4,•,END=2000) ANNEAL,STKNIN , NPASS WRITE(7,720) ISO,TS
720 FORMAT(' ISOTOPE:' ,I2,' ADSORPTION TEMPERATURE:' ,F6.1) IF (ANNEAL . NE. 0 .0) WRITE (7,•) 'EXPOSE FOR ',ANNEAL,
1 'Sec , THEN CHANGE INPUT PARAMETERS (AGAIN) ' WRITE(7,228) DSBINT,NPASS,PLTINT,DKPINT,
1 (CDESPL(I) , I=1,20),(TDESPL(I) , I=1,20),PRES,STKNIN/4 C** COMPUTE THE CHANGE IN TINE FOR EXPOSURE OF ONE MOLECULE C•• (or per scan if PRES <= 0)
IF (PRES .LE. 0) THEN DT1NOL = dabint
ELSE DT1NOL = 4 .08E-6 / (aiz2 * PRES)
END IF C** FORCE NEW DSBPROB CALCULATION AT START OF NEXT SCAN
KPASS = 0 KT = K * TS
C** CALCULATE ARRAY CONTENTS AT CURRENT TEMPERATURE IF (PRES .EQ . 0) THEN
C•• AP!: This computes POI (P=O, NO DESORPTION FROM PRECURSOR STATE)

- 102 -
CALL VCLR(pdi,1,49) C•* VAX!: This computes POI (P=O, NO DESORPTION FROM PRECURSOR STATE) c DO 414 L = 1,49 c PDI(L) = 0 replace above for VAX c414 CONTINUE
PDEN = 0 .0 PDO = 0.0
ELSE C** AP! : This computes POI (DESORPTION PROBABILITIES FROM PRECURSOR STATE)
call zvsmsa(ei,1,-1.lkt,-edlkt,v1,1,49) call vexp(v1,1,v2,1,49) call zvamul(v2,1,chi,pdi , 1,49)
C** VAX!: This computes POI (DESORPTION PROBABILITIES FROM PRECURSOR STATE) c DO 413 L = 1 , 49 c PDI(L) = CHI * EXP(- (ED + EI(L)) I KT) ! replace above for VAX c413 CONTINUE
PDEN = CHI * EXP((EN - ED) I KT) PDO = CHI * EXP( - ED I KT)
END IF
C** PROBABILITY FOR "DESORPTION" VIA PRECURSOR STATE va. DIRECT DESORPTION DO 412 L = 1,40 IF (PREFLG .LT. 0 .or . pres .eq . 0.0) THEN
PCPD (L) = 1. 0 else IF (PREFLG .EQ . 0 .OR . EI(L) .LT. ES) THEN
PCPD(L) = 0 .0 ELSE
PCPD(L) = 1. - 0.6 * EXP((ES-EI(L))IKT) END IF
412 CONTINUE
PSO = CHI * EXP( - (ED + ES)I IT) PMO = EXP(- EM I IT) WRITE (7,772) TS,((PCPD(i+7•(j-1)),i=1,7),j=1,7)
C*** WAIT A FEW ADSORPTION CYCLES AT NEW TEMPERATURE BEFORE STOPPING DCDE1 = 1.0
c•••••••••••••••••••••••••••••••••••••••••••••••••••••••••••••••••••••••••••••• C•• MAP INTERVAL : (coverage)
001 IF (COV .GE . CDESPL(IDESPL)) THEN C•• NOW WRITE OUT HEX MATRIX
WRITE (0,012) 1,cov,expoa,time+dtim,ir 012 FORMAT(1X,I6,f6 . 3,f11.3,f11.1,i14)
DO 3000 I = 1, SIZE WRITE (0 ,011) (HEX(I,J),J=1,SIZE)
011 FORMAT(1X,100I1) 3000 CONTINUE
if (ideapl . lt. 20) then IDESPL = IDESPL + 1
else CDESPL(IDESPL) = 100 .
end if IF (CDESPL(IDESPL) .EQ . 2 .0) THEN
IDESPL = IDESPL + 1 WRITE (7,•) '***CHANGE OF PARAMETERS AT ',time,'Sec (COV='
1 , COV, 'N)' GOTO 008
END IF IF (CDESPL(IDESPL) . EQ . 1 . 0) GOTO 2000
END IF c•••••••••••••••••••••••••••••• •••••••••••••••••••••••************************* C** MAP INTERVAL: (TIME)
IF (time+dtim . GE. TDESPL(JDESPL)) THEN C** HOW WRITE OUT HEX MATRIX
WRITE (0,012) 1,cov,expoa,time+dtim,ir DO 3001 I = 1, SIZE
WRITE (0,011) (HEX(I,J),J=1,SIZE) 3001 CONTINUE
if (jdeapl .lt. 20) then JDESPL = JDESPL + 1
else

tDESPL(jDESPL) = 99999999 end if
END IF
-109 -
C****************************************************************************** IF (EXPOS .GE. EXPMAX .or. time . GE . tmax) GOTO 2000 IF (EXPOS . LT . dmplvl) GOTO 903
C** CHECK FOR SATURATION COVERAGE IF (DCDEO + DCDE1 + DCDE2 + DCDE3 .LE . STKNIN) GOTO 2006 DCDE3 = DCDE2 DCDE2 = DCDE1 DCDE1 = DCDEO CALL DDUNP(DCDEO,NDSB,NADS,time+dtim)
C••AP TO VAX!*** COMMENT OUT FOLLOWING LINES STATUS_CODE = SYS$GETTINE (CTIN, WTIN) WRITE(6,108) CTIN,CTIN•0 .0036,WTIN,WTIN•0.0036 IDNP = IDNP + 1 dmplvl = dmpmin + dmpiNT * Idmp
C****************************************************************************** 903 IF (EXPOS .GE . pltlvl) THEN
WRITE (8,23) NEXP,NADS,TINE+DTIM 23 FORNAT(1X,2I7,f11.1)
IPLT = IPLT + 1 pltlvl = pltmin + PLTINT * IPLT
END IF C** CONSTANT CCV SYSTEM? DON'T ADSORH MORE IF CCV IS ABOVE INITIAL VALUE.
if (nada .GE . nadatr .and. pres . lt . 0) goto 1001 GOTO 1000
C****************************************************************************** C HAVE WE HAVE HIT SATURATION AT FIRST PARAMETER SET? IF SO CHANGE AND RESUME C******************************************************************************
2006 IF (ANNEAL .NE. 0 .0) THEN WRITE (7,*) '***CHANGE OF PARAMETERS AT' ,time+dtim,'Sec ('
1 ,EXPOS•4.08,'L) (SATURATION REACHED)' GOTO 008 END IF
C** NOW WRITE OUT HEX MATRIX WRITE (9,912) 1,cov,expoa,time+dtim,ir DO 3006 I = 1, SIZE
WRITE (0,011) (HEX(I,J),J=1,SIZE) 3006 CONTINUE
2000 CALL DDUNP(DCDEO ,NDSB,NADS,time+dtim) CLOSE(8)
c** write flag - no more mapa follow WRITE (0,012) 0 CLOSE(O) WRITE (7,326) NDIR,NDSB
326 FORNAT(//,1X,'Total Deaorbed: ',16,' (DIRECT), ',16, 1 ' (TOTAL)')
C**AP TO VAX!*** COMMENT OUT FOLLOWING LINES STATUS_CODE = SYS$GETTINE (CT1M , WT1N) WRITE(6,108) CTIN,CTIN•0.0036,WTIN,WTIN•0.0036 WRITE(7,108) CTIN,CTIN•0.0036,WTIN,WTIN•0.0036 CLOSE(7) STOP END
C!** C***************************************************************************** C** C** SUBROUTINE TO DUMP INFO ABOUT THE STATE OF THE SYSTEM C** C***************************************************************************** C**
SUBROUTINE DDUNP(DCDE,NDSB,NADS,time) c INCLUDE 'SINCONA .FOR' $INSERT SINCONA.FOR c INCLUDE 'SIMCONB .FOR' $INSERT SINCONB .FOR c INCLUDE 'SINCONC.FOR' $INSERT SINCONC.FOR
FOR VAX
FOR VAX
FOR VAX

INTEGER ODD SAVE EXPPRV,COVPRV DATA EXPPRV/0.0/,COVPRV/0 .0/
C** C DO 6 L=1,40 ! For AP :
-104 -
C 6 INT(L) = 0 ! Replace with VCLR CALL VCLR(INT,1,49) DCCV = COV - COVPRV DEXP = EXPOS - EXPPRV COVPRV = COV EXPPRV = EXPOS if (DEXP .eq. 0) then
DCDE = 0.0 else
DCDE = DCOV / DEXP end if tmp = NADS + MDSB - MADS if (tmp .eq. 0) then
AVGAD2 = 0. ASIG = 0. ADIS = 0. TAHOP = 0.
else AVGAD2 = ADIS2/tmp ASIG = SQRT(AVGAD2 - (ADIS/tmp)**2) ADIS = ADIS/tmp TAHOP = AHOP/tmp
endif if (NOES .eq . 0) then
DDIS = 0 . TDHOP = 0. AVGDD2 = 0. DSIG = 0.
else DDIS = DDIS/NDES TDHOP = DHOP/(1.*NDES) AVGDD2 = DDIS2/NDES DSIG = SQRT(AVGDD2 - (DDIS/NDES)**2)
end if WRITE(6,11) EXPOS*4.08,NEXP,COV,NADS ,DCDE,time
11 FORMAT(' EXP:' ,F6 . 3, ' L (' ,I6, ' ) ', 2 ' COV: ' , F6 . 3, ' N ( ' , I6, ' ) ' , 3 ' STI CO:' ,F6 . 2,' TIME : ' ,1pe10.3) WRITE(7,10) EXPOS,NEXP ,EXPOS*4.08,COV,NADS,DCDE,TAHOP ,
1 ADIS,SQRT(AVGAD2),ASIG,TDHOP,DDIS,SQRT(AVGDD2),DSIG 10 FORMAT(/ , ' EXPOSURE:' ,F6 .3,' M (' , I6, ' MOLECULES) '
1 F6 . 2,' (LANGMUIR)',/, 2 'FRACTIONAL COVERAGE: ',F6.4,' (',I6,' MOLECULES)',/, 3 ' DIFFERENTIAL STICKING COEFFICIENT : ', 4 F10 .6,/,' AVERAGES : (ABSORBED)' ,F6.2,' (HOPS)' ,F6.2 , ' (NET) ', 6 F6 . 2,' (RNS)',' SIGNA= ',F6 . 3 , /, 6 'AVERAGES: (DESORBED)' ,F6.2,' (HOPS)' ,F6 . 2,' (NET)', 7 F6.2,' (RNS)',' SIGNA= ' ,F6.3,/)
MADS = NADS + NDSB DHOP = 0 AHOP = 0 ADIS = 0 .0 ADIS2 = 0.0 DDIS = 0.0 DDIS2 = 0 .0 DO 100 M=1,SIZE ODD = 2 - MOD(N , 2) DO 101 N=1,SIZE IF (HEX(M,N) .EQ . 0) GOTO 101 NREP = NEAR(M,N , ODD) NATT = NEXT(M,N,ODD) INT(NATT+1+7•NREP) = INT(NATT+1+7*NREP) + 1
101 CONTINUE 100 CONTINUE

-105 -
DO 6 J1=1,7 J = 7•(J1-1) + 1 INTS(J1) = INT(J) + INT(1+J) + INT(2+J) + INT(3+J) + INT(4+J) +
1 INT(6+J) + INT(6+J) 6 CONTINUE
WRITE(7 , 30) (I-1 , I=1,7),0,(INT(I),I=1,7),INTS(1) 30 FORNAT(/,17X,'BREAKDOWN OF MOLECULES BY INTERACTIONS',
1 //,20X, 'NUMBER OF ATTRACTIVE INTERACTIONS',/ 2 20X, 1!6,' TOTAL',/,' NUMBER OF ' ./, 3 'REPULSIVE ',I6,2X,8I6)
33 FORMAT(12X,I6,2X,8I6) DO 3~ J=~ . 1 IF (INTS(J) .NE. 0) WRITE(7,33) J-1,(INT((J-1)*7+I),I=1,7) ,INTS(J)
32 CONTINUE C Now print a blank line for better readability
WRITE(7,33) RETURN END
[BHT .N2.AP]DSB.FOR C***************************************************************************** C***************************************************************************** C**** ***** C**** PROGRAM TO MODEL N DESORPTION ON Ru(0001) ***** c•••• ~ ***** C**** U•ing Monte-Carlo type model ***** C**** ***** C**** BRIAN TOBY 1~/83 ***** C**** ***** C**** ADAPTED FOR ARRAY PROCESSOR (BHT 6/84) ***** C•••• Change i•otope label during annealing (BHT 8/86) ***** C**** Environment Dependant Prefactor Model ***** C**** ***** C***************************************************************************** C***************************************************************************** C** C•• c•• C** C•• C** c•• C** C** C••
HEXAGONAL LATTICE IS STORED BY COORDINATES (m,n) WHICH ARE RELATED TO CARTESIAN COORDINATES (x,y) BY
x = m • A * •in(60) y = n • A y = n • A A I ~
(m ODD) (m EVEN)
WHERE A IS THE LATTICE SPACING
BLOC!: DATA C INCLUDE 'SIMCONA.FOR' $INSERT SIMCONA .FOR C INCLUDE 'SIMCOMB.FOR' $INSERT SIMCOMB.FOR C INCLUDE 'SIMCOMC.FOR' $INSERT SIMCOMC.FOR C INCLUDE 'SIMCOND .FOR' $INSERT SIMCOND.FOR C INCLUDE 'SIMCOME .FOR' $INSERT SINCOME.FOR C**
DATA NEARN/-1,-1,0,0,1,1/
FOR VAX
FOR VAX
FOR VAX
FOR VAX
FOR VAX
DATA NEARN/0,1,-1,1,0,1,-1,0,-1,1,-1,0/ C•• NEARN(i),NEARN(i,j) DESCRIBE THE NEAREST NEIGHBOR SITES RELATIVE TO C** THE CENTER SITE . j IS 1 FORm ODD; 2 FORm EVEN. C**
DATA NEXTN/-2,-1,-1,1,1.~/ DATA NEXTN/0,-1,~.-1,2,0,0,-2,1,-~.1,0/
C** NEXTN(i),NEXTN(i,j) DESCRIBE THE NEXT NEAREST NEIGHBOR SITES RELATIVE C•• TO THE CENTER SITE . j IS 1 FORm ODD; ~FORm EVEN. c•• C** SIZE IS THE DIMENSION OF THE [SQUARE] LATTICE

C!**
DATA HEX/10000•0/,SIZE/100/ END
-106 -
C***************************************************************************** c••••••••********************************************************************* C•• C INCLUDE 'SIMCOKA.FOR' FOR VAX $INSERT SIMCOKA.FOR C INCLUDE 'SIMCOMB.FOR' FOR VAX $INSERT SINCONB.FOR C INCLUDE 'SINCONC.FOR' FOR VAX $INSERT SINCONC . FOR C INCLUDE 'SINCOND . FOR' FOR VAX $INSERT SINCOND .FOR C INCLUDE 'SINCONE.FOR' FOR VAX $INSERT SINCONE.FOR C•• C** LIST is the (decoded) random order rastering sequence
INTEGER•2 LIST(2,10000) INTEGER ODD REAL COVI(40) , COVIP(40) REAL TEMP (200) INTEGER TNIN,TNAX,TINT REAL BETA,E,T,NAAVG,LCTP REAL CDESPL(20) INTEGER DSBENG(40,2) CHARACTER•72 LINE,TITLE
C•• IR IS THE STARTING POINT FOR THE RANDOM NUMBER GENERATOR C••
DATA CDESPL/20•-1./ DATA IR/266/
C••AP TO VAX!••• COMMENT OUT FOLLOWING LINES C•• Open output files
OPEN(UNIT=10,FILE='FOR010.DAT , FMT=F', STATUS='NEW') OPEN(UNIT=14,FILE='FOR014 .DAT , FNT=F ' , STATUS='NEW') OPEN(UNIT=16,FILE='FOR016.DAT, FNT=F', STATUS='NEW')
C UNIT=6 ==> :OUTPUT (by default) override to save VAX CPU:
C••
OPEN(UNIT=7, FILE=':S(XHNEIA):BHTOUT . DSB, FNT=F', 1 ACCESS = 'SEQUENTIAL', RECL=132, STATUS='unknown')
STATUS_CODE = SYS$GETTINE (CTIN, WTIN) WRITE(7 , 108) CTIN,CTIN•0.0036,WTIN,WTIN•0 .0036
C••• PARAMETER DEFINITIONS: C••
R = 1.0872 K = 1 .0872E-3
C UNITS : Kcal or cal/(K-mol) BETA = 6 .
C UNITS : K/sec CVINT = 0.05 DT = 0 . 6 .
C UNITS: I I iteration NAAVG = 2.
C LOW COVERAGE PEAK TEMPERATURE: LCTP = 130 . RA = 2 . 7068
C Lattice spacing (in A) c••
ED = 1.6 C Desorption energy from clean surface (Kcal/mol)
ER = 0.320 C Energy of a repulsive interaction (Kcal/mol)
EA = 0 . 160 C Energy of an attractive interaction (Kcal/mol)
EN = 0 . 8 C Energy difference for precursor on empty site vs . filled site (Kcal/mol)
CHI = 1.E3 C Controls number of hops
TS = 80. C Temperature of surface during adsorption (K)
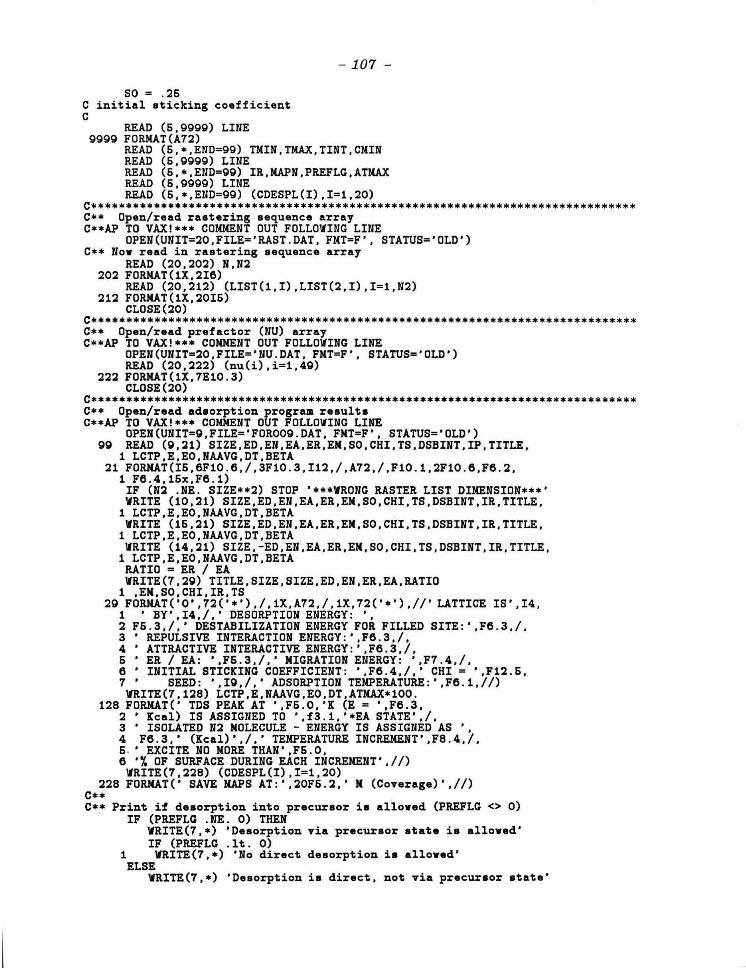
so = . 26 C initial sticking coefficient c
READ (6,9999) LINE 9999 FORMAT(A72)
- 107-
READ (6,•,END=99) TMIN,TMAX , TINT , CMIN READ (6,9999) LINE READ (6 , •,END=99) IR,MAPN,PREFLG,ATNAX READ (6 ,9999) LINE READ (6,•,END=99) (CDESPL(I),I=1,20)
c•••••••••••••••••••••••••••••••••••••••••••••••••••••••••••••••••••••••••••••• C•• Open/read rastering sequence array C••AP TO VAX!*** COMMENT OUT FOLLOWING LINE
OPEN(UNIT=20,FILE='RAST . DAT, FMT=F' , STATUS='OLD') C•• Now read in rastering sequence array
READ (20 , 202) N,N2 202 FORMAT(1X,2I6)
READ (20,212) (LIST(1,I) , LIST(2,I) , I=1,N2) 21~ FORMAT(1X . ~OI6)
CLOSE(20) C****************************************************************************** C** Open/read prefactor (NU) array C••AP TO VAX!*** COMMENT OUT FOLLOWING LINE
OPEN(UNIT=~O.FILE='NU . DAT, FMT=F ' , STATUS='OLD') READ (20,~~~) (nu(i),i=1,40)
22~ FORMAT(1X,7E10 . 3) CLOSE(20)
C****************************************************************************** C•• Open/read adsorption program results C••AP TO VAX!*** COMMENT OUT FOLLOWING LINE
OPEN(UNIT=O,FILE= ' FOR009 . DAT , FMT=F' , STATUS='OLD') 90 READ (0 , ~1) SIZE,ED,EN ,EA,ER,EM, SO,CHI,TS,DSBINT,IP,TITLE,
1 LCTP,E,EO,NAAVG,DT,BETA ~1 FORNAT(I6,6F10.6,/,3F10.3,I12,/,A7~./.F10 . 1,2F10.6,F6.2,
1 F6 .4,16x,F6 . 1) IF (N~ . NE. SIZE••2) STOP '***WRONG RASTER LIST DIMENSION***' WRITE (10.~1) SIZE,ED,EN,EA,ER ,EM,SO,CHI,TS,DSBINT,IR,TITLE,
1 LCTP,E,EO,NAAVG,DT, BETA WRITE (16,21) SIZE,ED,EN,EA,ER ,EM,SO,CHI,TS ,DSBINT , IR,TITLE,
1 LCTP,E,EO,NAAVG,DT,BETA WRITE (14 , ~1) SIZE, - ED , EN ,EA , ER,EM,SO , CHI ,TS,DSBINT,IR ,TITLE,
1 LCTP ,E, EO , NAAVG , DT , BETA RATIO = ER / EA WRITE(7,29) TITLE , SIZE,SIZE,ED,EN ,ER,EA,RATIO
1 ,EM,SO , CHI,IR,TS 29 FORMAT( ' O' ,72('•') , /,1X,A72,/,1X,72( ' *'),//' LATTICE IS' ,I4,
1 ' BY' ,I4./,' DESORPTION ENERGY: ', 2 F6 . 3 , /,' DESTABILIZATION ENERGY FOR FILLED SITE : ' ,F6 .3,/, 3 'REPULSIVE INTERACTION ENERGY : ' ,F6 .3,/, 4 ' ATTRACTIVE INTERACTIVE ENERGY : ' ,F6 . 3,/, 6 ' ER / EA: ',F6.3,/, ' MIGRATION ENERGY : ',F7 .4,/, 6 ' INITIAL STICKING COEFFICIENT: ' ,F6 .4,/,' CHI= ',F12 . 6, 7 ' SEED : ',IO,/ , ' ADSORPTION TEMPERATURE:' ,F6 . 1,//) WRITE(7,1~8) LCTP,E,NAAVG,EO,DT , ATNAX•100 .
128 FORMAT( ' TDS PEAK AT' ,F6.0,'K (E = ',F6.3, ~ 'Kcal) IS ASSIGNED TO ',f3 . 1,'•EA STATE',/ , 3 ' ISOLATED N~ MOLECULE - ENERGY IS ASSIGNED AS ' , 4 F6.3 , ' (Kcal)' , / , 'TEMPERATURE INCREMENT' ,F8 .4 , /, 6. ' EXCITE NO MORE THAN ', F6 .0, 6 · ~ OF SURFACE DURING EACH INCREMENT',//) WRITE(7.~28) (CDESPL(I),I=1,20)
228 FORMAT(' SAVE MAPS AT : ' ,20F6 . ~ . · M (Coverage)',//) C•• C** Print if desorption into precursor is allowed (PREFLG <> 0)
IF (PREFLG .NE. 0) THEN WRITE(7,•) ' Desorption via precursor state is allowed' IF (PREFLG .lt. 0)
1 WRITE(7,•) ' No direct desorption is allowed' ELSE
WRITE(7,•) 'Desorption is direct, not via precursor state'

END IF DO 312 I= 1,7 DO 312 J = 1,7 L = I + (J-1)•7 EI(L) = (I-1.)•EA- (J-1.)•ER
312 CONTINUE
-108 -
VRITE(7,311) (J-1,J=1,7),(J-1,(EI(I+7•(J-1)),I=1,7),J=1,7) 311 FORNAT(38X,'ENERGY OF MOLECULES BY INTERACTIONS (Kcal/mole)',
1 /,46X, 'NUMBER OF ATTRACTIVE INTERACTIONS',/ 2 20X,7I10,/,' NUMBER OF',/, 3 ' REPULSIVE ',I6,2X,7F10 .4 , 6(/,12X,I6,2X,7F10.4),//)
WRITE(7,321) (J-1 , J=1,7),(J-1,(NU(I+7•(J-1)),I=1,7),J=1 , 7) 321 FORKAT(/,40X,'PREFACTOR BY NUMBER OF INTERACTIONS (sec-1)' ,
1 /,46X,'NUMBER OF ATTRACTIVE INTERACTIONS',/ 2 20X, 7I 10 ./, ' NUMBER OF' ./, 3 ' REPULSIVE ',I6,2X,1P7E10.3 , 6(/,12X,I6,2X,7E10 .3),/)
ES =I* 77. * LOG(1./SO- 1.) c•••••••••••••••••••••••••••••••••••••••••••••••••••••••••••••••••••••••••••••• c•••••••••••••••••••••••••***************************************************** C•• NOW READ IN MATRIX C•••
READ (0,012,END=OOO) imore NPLT = 0
1000 DO 3000 I = 1 , SIZE READ (0,011,END=OOO) (HEX(I,J) , J=1,SIZE)
011 FORMAT(1X,100I1) 3000 CONTINUE
c•• Ia there another map on the file? imore = 0 READ (0,012,END=013) imore
012 FORNAT(1X,I6,f6 .3) C••
013 IF (imore .EQ. 0 .and. mapn .ne. 0) then IFLG = 1
else IFLG = 0
end if N1 = 0
C•• NOW SCAN LATTICE FOR DISTRIBUTION BY # OF INTERACTIONS
c c c c c
NADS = 0 DO 6 L=1,40 PCPD(L) = 0.0 DSBENG(L,1) = 0 DSBENG(L,2) = 0
6 INT(L) = 0 !
For AP: Replace with VCLR Replace with VCLR Replace with VCLR Replace with VCLR
CALL VCLR(INT,1,40) CALL VCLR(DSBENG,1,08) CALL VCLR(PCPD,1,40) DO 100 11=1,SIZE ODD = 2 - NOD(N,2) DO 101 N=1,SIZE IF (HEX(M,N) .EQ. 0) GOTO 101 NADS "" NADS + 1 NREP = NEAR(N,N,ODD) NATT = NEXT(N,N,ODD)
(below) (below) (below) (below)
INT(NATT+1+7•NREP) = INT(NATT+1+7•NREP) + 1 101 CONTINUE 100 CONTINUE
DO 6 J1=1,7 J = 7•(J1-1) + 1 INTS(J1) = INT(J) + INT(1+J) + INT(2+J) + INT(3+J) + INT(4+J) +
1 INT(6+J) + INT(6+J) 6 CONTINUE
COVO = (1 . •NADS)/SIZE••2 IF (COVO .LT. CMIN) GOTO 1000
C Don't try to store mapa which are lower coverage than the initial coverage DO 313 !=1,20 MAP= I IF (CDESPL(MAP) .LT. COVO) GOTO 314
313 CONTINUE

314 NADSO = NADS VRITE(7,34) NADSO,COVO WRITE(6,34) NADSO,COVO
- 109 -
34 FORMAT(//,3X,'NADS =',IS,' COVERAGE=' ,F6.3) WRITE(7,30) 'ADSORBED' ,(I-1,I=1,7),0, (INT(I),I=1,7),INTS(1)
30 FORMAT(/ , 23X, 'BREAKDOWN OF ',AS,' MOLECULES BY INTERACTIONS', 1 /,30X,'NUMBER OF ATTRACTIVE INTERACTIONS',/ 2 20X,7I6,' TOTAL'./,' NUMBER OF',/, 3 'REPULSIVE ',I6,2X,8I6)
33 FORMAT(12X,I6,2X,8I6) DO 32 J=2,7 IF (INTS(J).NE . 0) VRITE(7 , 33) J-1,(INT((J-1)•7+I),I=1,7),INTS(J)
32 CONTINUE STATUS_CODE = SYS$GETTINE (CTIN, VTIM) WRITE(6,108) CTIN,CTIN•0 .0036,WTIN,WTIN•0.0036
C****************************************************************************** C****************************************************************************** C** PREPARE FOR START OF TDS SCAN c C STARTING TEMPERATURE FOR SCAN
T = TNIN TEMP(1) = T N = (TNAX-TNIN)/(TINT•DT) + 1 WRITE (10,126) N,COVO,NADSO
126 FORNAT(IS,F8.4,I7) WRITE (10,24) TEMP(1) WRITE (10,26) (INT(I),I=1,40) WRITE (16,126) N,COVO,NADSO WRITE (16,24) TEMP(1)
126 FORNAT(7I6,3x,7I6) WRITE (16,126) (((DSBENG(I,ik),I=J,j+6),ik=1,2),j=1,43,7) NT = 2 NDSB = 0 NDSB = 0 imove = 0 NDIR = 0 NATMP = 0
C NPASS: # of desorption scans/probability computation NPASS = 2 NADSP = NADSO MPASS = NPASS + 1 NINT = 0
c C****************************************************************************** c•••••••••••••••••••••••••••••••••••••••••••••••••••••••••••******************* C** NOW START DESORPTION PROCESS
36 cov = (1.•NADS) I SIZE••2 C CHECK TO WRITE DESORPTION NAP FILE
IF (COV .GT. CDESPL(NAP) . OR. IFLG .EQ. 0) GOTO 316 IF (NAP .LT. 20) NAP= NAP+ 1 WRITE (14,012) 1,cov DO 3000 I = 1, SIZE WRITE (14,011) (HEX(I,J),J=1,SIZE)
3000 CONTINUE C•• C** 316
SHOULD WE RECALCULATE THE DESORBTION PROBABILITIES ON THIS PASS? IF (MPASS .GE. NPASS) THEN
T = TNIN + NINT * DT KT = T * I NINT = NINT + 1 MPASS = 0 OTT = DT / NPASS
COMPUTE THE CHANGE IN TINE FOR CURRENT OTT DTIN = OTT / BETA
CALCULATE DESORPTION PROBABILITIES ONLY IF MIGRATION WILL BE NEEDED IF (PREFLG .NE. 0) THEN
DO 316 L = 1,40 PDI(L) = CHI * EXP(- (ED + EI(L)) / KT)
PROBABILITY FOR "DESORPTION" VIA PRECURSOR STATE vs. DIRECT DESORPTION IF (PREFLG .LT. 0) THEN
PCPD (L) = 1. 0
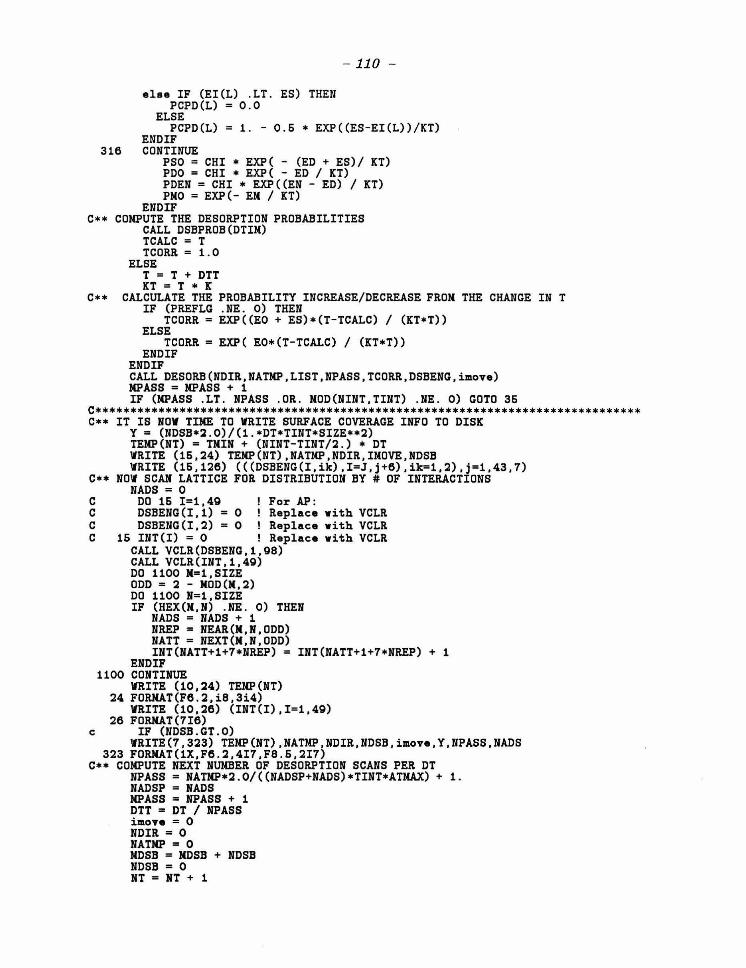
else IF (EI(L) . LT . ES) THEN PCPD(L) = 0 .0
ELSE
-110 -
PCPD(L) = 1 . - 0 . 5 * EXP((ES-EI(L))/KT) END IF
316 CONTINUE PSO = CHI * EXP( - (ED + ES)/ KT) PDO = CHI * EXP( - ED / KT) PDEN = CHI * EXP((EN - ED) / KT) PNO = EXP(- EN / KT)
END IF C** COMPUTE THE DESORPTION PROBABILITIES
CALL DSBPROB(DTIN) TCALC = T TCORR = 1.0
ELSE T = T + DTT KT = T * K
C** CALCULATE THE PROBABILITY INCREASE/DECREASE FROM THE CHANGE IN T IF (PREFLG . NE . 0) THEN
TCORR = EXP((EO + ES)•(T-TCALC) I (KT•T)) ELSE
TCORR = EXP( EO•(T-TCALC) / (KT•T)) END IF
END IF CALL DESORB(NDIR,NATMP,LIST,NPASS,TCORR,DSBENG,imove) MPASS = MPASS + 1 IF (MPASS .LT. NPASS . OR . NOD(NINT,TINT) . NE. 0) GOTO 35
C****************************************************************************** C** IT IS NOW TINE TO WRITE SURFACE COVERAGE INFO TO DISK
Y = (NDSB•2.0)/(1 . *DT*TINT•SIZE••2) TEMP(NT) = TNIN + (NINT-TINT/2.) * DT WRITE (15,24) TEMP(NT),NATMP,NDIR,INOVE,NDSB WRITE (15,126) (((DSBENG(I,ik),I=J,j+6),ik=1,2),j=1,43,7)
C** NOW SCAN LATTICE FOR DISTRIBUTION BY # OF INTERACTIONS NADS = 0
C DO 15 I=1,40 ! For AP : C DSBENG(I,1) = 0 ! Replace with VCLR C DSBENG(I,2) = 0 ! Replace with VCLR C 15 INT(I) = 0 ! Replace with VCLR
CALL VCLR(DSBENG,1,08) CALL VCLR(INT,1,40) DO 1100 N=1, SIZE ODD = 2 - NOD(N,2) DO 1100 N=1, SIZE IF (HEX(N,N) . NE. 0) THEN
NADS = NADS + 1 NREP = NEAR(N,N,ODD) NATT = NEXT(N , N,ODD) INT(NATT+1+7•NREP) = INT(NATT+1+7•NREP) + 1
END IF 1100 CONTINUE
WRITE (10,24) TENP(NT) 24 FORMAT(F6.2,i8,3i4)
WRITE (10,26) (INT(I),I=1,40) 26 FORMAT(7I6)
c IF (NDSB.GT .O) WRITE(7,323) TEMP(NT),NATNP,NDIR,NDSB,imove,Y,NPASS,NADS
323 FORMAT(1X,F6.2,4I7,F8 . 5,2I7) C** COMPUTE NEXT NUMBER OF DESORPTION SCANS PER DT
NPASS = NATNP•2 .0/((NADSP+NADS)•TINT*ATNAX) + 1 . NADSP = NADS MPASS = NPASS + 1 DTT = DT I NPASS imove = 0 NDIR = 0 NATMP = 0 NDSB = NDSB + NDSB NDSB = 0 NT = NT + 1

- 111 -
IF (TEMP(NT-1) .GE. TMAX) GOTO 441 IF (NADS .GT. 0) GOTO 36
C****************************************************************************** C****************************************************************************** C•• NO N2 LEFT ON SURFACE -- WRITE OUT ZERO ARRAYS C J = TEMP(NT-1) + TINT•DT C I = TINT•DT C DO 442 I=J,TMAX,I C TEMP(NT) = I C WRITE (10,24) TEMP(NT) C WRITE (10 ,26) (INT(J1),J1=1 , 4Q) C NT = NT + 1 C 442 CONTINUE
441 NT = NT - 1 C•• write negative T to indicate last entry in file
WRITE (10,24) -1 . WRITE (16 , 24) - 1 . WRITE(7,326) COVO,MDSB,NADS
326 FORMAT(1X,F8 . 6 , ' TOTAL DESORBED = ',I6,' FINAL COVERAGE',I3) if (imore .ne. 0) GOTO 1000
QQQ CLOSE(Q) CLOSE(10) CLOSE(16)
c** write flag - no more maps follow WRITE (14,Q12) 0 CLOSE(14)
C••AP TO VAX!*** COMMENT OUT FOLLOWING LINES STATUS_CODE = SYS$GETTIME (CTIN, WTIN) WRITE(7,108) CTIN,CTIN•0.0036,WTIN,WTIN•0 .0036
108 FORMAT(' CPU TIME=' ,F10.2,' ($' ,F7.2 , ') REAL TIME 1 F10.2,' ($' ,F7 .2, ') ')
CLOSE(7) STOP END
1.2 Subroutines MIGRATE, DSBPROB and DESORB, COMSUB subroutines
and COMMON blocks
[BHT .N2.AP]MIG.FOR C***************************************************************************** C***************************************************************************** C**** Environment Dependant Prefactor Model ***** C**** Change isotope label during annealing (BHT 8/86) ***** C••
SUBROUTINE NIGRATE(ISO) c INCLUDE ! SINCOKA.FOR' $INSERT SINCOKA .FOR c INCLUDE 'SINCONB.FOR' $INSERT SINCONB .FOR c INCLUDE 'SINCONC.FOR' $INSERT SINCONC.FOR c INCLUDE 'SINCOND .FOR' $INSERT SINCOND.FOR c INCLUDE 'SINCOME .FOR' $INSERT SINCOME.FOR c••
INTEGER ODD,ODDI REAL P(6),PC,PT,PS ,PD
NHOP = 0 C NX ~ NX Define the quadrant
NX = 0 NX = 0
C••
FOR VAX
FOR VAX
FOR VAX
FOR VAX
FOR VAX
C** CALCULATE MIGRATION ~ DESORPTION PROBABILITIES

-112 -
c•• 500 ODD = 2 - MOD(M,2)
C** COMPUTE SITE ENERGY - current site C** Is site filled?
IF (HEX(M,N) . NE. 0) THEN C Site is filled, so prevent sticking
PS = 0 C Calculate site energy level (independant of the number of interactions)
EIO = EN C Desorption probability: (independant of the number of interactions)
PO = PDEN ELSE
C Site is not filled, so allow sticking PS = PSO NRO = NEAR(M,N,ODD) NAO = NEXT(M,N,ODD)
C Desorption probability : (depends on number of interactions) PD = PDI(NA0+1+7•NRO)
C Calculate energy level of current site (EIO) EIO = NRO•ER - NAO•EA
END IF C** COMPUTE # OF ATTRACTIVE ~ REPULSIVE INTERACTIONS - for each neighbor site
DO 100 I = 1,6 MI = M + NEARM(I) NI = N + NEARN(I,ODD) IF (MI . LE. 0) THEN
MI = MI + SIZE ELSE IF (MI .GT. SIZE) THEN
MI = NI - SIZE END IF IF (NI .LE . 0) THEN
HI = HI + SIZE ELSE IF (NI . GT. SIZE) THEN
HI = HI - SIZE END IF EJ = EN IF (HEX(NI,NI) .NE. 0) GOTO 105 ODDI = 2 - NOD(MI,2)
C•• CALCULATE ENERGY LEVEL OF NEIGHBOR SITE (EJ) NRI = NEAR(MI,NI,ODDI) NAI = NEXT(MI,NI,ODDI) EJ = NRI•ER - HAI•EA
106 DE = EJ - EIO C Migration probability:
IF (DE .EQ. 0) THEN P(I) = PMO
ELSE if (de .le. -4.•EM) then p(i) = 1
else if (de .ge. 4•EM) then P(I) EXP(- DE I KT)
else P(I) = EXP(- (EN + DEI2 . + DE••21(16 . •EM)) I KT)
END IF 100 CONTINUE
C Total probability (before normalizing) : PT = PD + P(1) + P(2) + P(3) + P(4) + P(6) + P(6) + PS
101 PC = PT • RAN(IR) C Should we desorb?
·IF (PC .LE. PD) RETURN C Should we migrate?
PT = PD DO 110 I = 1,6 PT = PT + P(I) IN = I
C Is random number in range for Ith site? If true, migrate to that site IF (PC .LE . PT) GOTO 260
110 CONTINUE C Should we stick at current site?
IF (PC .LE. PT+PS) GOTO 300 C•• No migration or desorption -- What are we doing here?!

-119 -
WRITE(6,*) ' ****ERROR- MOLECULE DIDN''T DO ANYTHING**** ' GOTO 101
C•• Migrate: 250 NHOP = NHOP + 1
N = N + NEARN(IN) N = N + NEARN(IN,ODD) CALL CYCLE(N,NX,N,NX,SIZE) GOTO 500
300 IF (HEX(M,N) . NE . 0) WRITE(6,*) 1 '**** ERROR - ADSORPTION ON FILLED SITE **** ' ,N ,N
HEX(N,N) ISO DSBFLG = 0 RETURN END
C!** C***************************************************************************** C***************************************************************************** C**** Environment Dependant Prefactor Model ***** C**** Change isotope label during annealing (BHT 8/85) ***** c••
SUBROUTINE DSBPROB(DTIN) c INCLUDE 'SINCONA.FOR' $INSERT SINCONA. FOR c INCLUDE 'SINCONB .FOR' $INSERT SIMCONB.FOR c INCLUDE 'SIMCOMC .FOR' $INSERT SIMCONC.FOR c INCLUDE 'SIMCOND .FOR' $INSERT SINCOND.FOR c INCLUDE 'SIMCOME.FOR' $INSERT SIMCOME.FOR C**
REAL PCT INTEGER ODD
C•• Next is needed for AP only! REAL V1(40),V2(49)
FOR VAX
FOR VAX
FOR VAX
FOR VAX
FOR VAX
C****************************************************************************** IF (PREFLG .EQ. 0) THEN
C•• This block computes desorption probabilities for non-precursor desorption C****************************************************************************** C•• AP!: The following 4 lines compute PCTD
call zvsmsa(ei,1 , -1 . /kt,-e0/kt,v1,1,49) call vexp(v1,1,v2,1,40) CALL ZVSNUL(V2,1,dtim, v1,1,40) call zvmul(v1,1,nu,1,pctd,1,40)
C•• VAX!: The following do loop (up to 300) computes PCTD c DO 300 L = 1,40 c PCTD(L) = NU(L) * DTIM * EXP(-(EO + EI(L))/KT) c 300 CONTINUE C******************************************************************************
ELSE C•• This block computes desorption probabilities for precursor desorption C******************************************************************************
PCT = EXP(- (ES + EO)/KT) * DTIM C•• AP! : The following line computes PCTD
CALL ZVSNUL(NU,1,PCT,PCTD,1,49) C•• VAX! : The following do loop (up to 305) computes PCTD c DO 305 L = 1,40 c PCTD(L) = NU(L) * PCT c 305 CONTINUE C******************************************************************************
END IF RETURJf END
c••••••••••••••••••••••••***************************************************** C***************************************************************************** C**** Environment Dependant Prefactor Model ***** C**** Change isotope label during annealing (BHT 8/85) ***** C**

- 114 -
SUBROUTINE DESORB(NDIR , NATMP,LIST , NPASS,TCORR,DSBENG , imove) c INCLUDE ' SIMCOKA .FOR' ! FOR VAX $INSERT SIMCOMA .FOR c INCLUDE 'SIMCOMB .FOR' FOR VAX $INSERT SIMCOMB .FOR c INCLUDE 'SIMCOMC .FOR' FOR VAX $INSERT SIMCOMC .FOR c INCLUDE 'SIMCOMD .FOR ' FOR VAX $INSERT SIMCOMD .FOR c INCLUDE 'SIMCOME.FOR' FOR VAX $INSERT SIMCOME.FOR c•• C•• LIST is the (decoded) random order rastering sequence
INTEGER•2 LIST(2,10000) INTEGER ODD REAL TCORR,PCT(40) INTEGER DSBENG(40,2) MDSB = 0
C** APPLY ERROR CORRECTION TERM TO PCTD C** AP!: The following statement computes PCT
CALL ZVSMUL(pctd,1,Tcorr,pct , 1,40) C** VAX! : The following do loop computes PCT c DO 60 L=1,40 c PCT(L) = PCTD(L)•TCORR c 60 CONTINUE C** SCAN LATTICE IN RANDOM SEQUENCE
DO 100 I=1 , SIZE**2 C** NOW DETERMINE LOCATION OF SITE TO BE TESTED
M = LIST(1,I) N = LIST(2,I)
C** IS THERE A MOLECULE AT THAT SITE? IF (HEX(N,N) .EQ . 0) GOTO 100
C** SITE IS OCCUPIED -- FIND NUMBER OF INTERACTIONS ODD = 2 - MOD(N,2) NREP = NEAR(M,N,ODD) NATT = NEXT(M, N,ODD) L = NATT+1+7•NREP
C** NOW WE KNOW WHAT THE MOLECULE'S ENERGY STATE IS C** SHOULD IT BE REMOVED FROM THE CHEMISORPTION WELL? C** Total probability for chemisorbed species to desorb to precursor or C** gas phase in time interval DTIM is PCT(L) = PCTD(NATT+7• NREP+1)•TCORR
IF (RAN(IR) . GT . PCT(L)) GOTO 100 C** MOLECULE WILL DESORB . SHOULD IT DESORB DIRECTLY TO GAS PHASE? C•• NATMP is total # of molecules which leave chemisorbed state (some reabsorb)
NATMP = NATMP + 1 ISO = HEX(H,N) HEX(M,N) = 0
C** Probability for desorbing species to enter precursor state C** is PCPD(NATT+7•NREP+1)
IF (PREFLG .EQ . 0 . OR . PCPD(L) .EQ . 0 .0) THEN C** DESORPTION IS DIRECT FOR THIS STATE C NDIR is # of molecules which desorb directly (from chemisorbed state to gas)
NDIR = NDIR + 1 C MDSB is total # of molecules which have desorbed (in this scan only)
HDSB = HDSB + 1 C Now update desorption energy array
DSBENG(L,iso) = DSBENG(L,iso) + 1 ELSEIF (RAN(IR) .GT. PCPD(L)) THEN
C** DESORPTION IS DIRECT ANYWAY NDIR = NDIR + 1 HDSB = HDSB + 1
C Now update desorption energy array DSBENG(L,iso) = DSBENG(L,iso) + 1
ELSE C** OH BOY , BACK INTO THE PRECURSOR STATE AGAIN
DSBFLG = 1 HINT = H NINT = H CALL HIGRATE(ISO) IF (DSBFLG .EQ. 0) THEN

- 115 -
C•• Molecule was adsorbed : did it move? IF (NINT .NE. N+MX . OR. NINT .NE. N+NX) IMOVE=IMOVE+1
ELSE C** Molecule was desorbed : C** If the flag is still 1 , the molecule has desorbed
MDSB = NDSB + 1 C Now update desorption energy array
DSBENG(L,iso) = DSBENG(L,iso) + 1 END IF
END IF 100 CONTINUE
C!**
NADS = NADS - MDSB NDSB = NDSB + NDSB RETURN END
[BHT .N2.AP]COMSUB.FOR
C***************************************************************************** C** C•• SUBROUTINE TO IMPOSE CYCLIC BOUNDARIES C** C***************************************************************************** C••
SUBROUTINE CYCLE(N,MX,N,NX,ISIZE) IF (N .GT. 0) GOTO 1 N = K + ISIZE MX = MX - ISIZE GOTO :l
1 IF (K .LE . ISIZE) GOTO :l N = K - ISIZE MX = MX + ISIZE
:l IF (N .GT . 0) GOTO 3 N = N + ISIZE NX = NX - ISIZE RETURN
3 IF (N .LE. ISIZE) RETURN N = N - ISIZE NX = NX + ISIZE RETURN END
C!** C***************************************************************************** c•• C•• SUBROUTINE TO DETERMINE HOW MANY NEAREST NEIGHBORS A MOLECULE HAS C** C***************************************************************************** C**
INTEGER FUNCTION NEAR(NO,NO,ODD) C INCLUDE 'SINCOMA .FOR' ! FOR VAX $INSERT SINCOMA.FOR C INCLUDE 'SINCONC.FOR' ! FOR VAX $INSERT SINCONC.FOR
INTEGER ODD NEAR = 0 DO 100 I = 1,6 M = NO + NEARN(I) N = NO + NEARN(I , ODD) IF (M .LE . 0) K = K + SIZE IF (N . GT . SIZE) M = M - SIZE IF (N .LE . 0) N = N + SIZE IF (N .GT. SIZE) N = N - SIZE IF (HEX(N,N) .NE. 0) NEAR = NEAR + 1
100 CONTINUE RETURN END
C*****************************************************************************

-116 -
C** C** SUBROUTINE TO DETERMINE HOW MANY NEXT NEAREST NEIGHBORS A MOLECULE HAS C** C***************************************************************************** C**
INTEGER FUNCTION NEXT(MO,NO , ODD) C INCLUDE ' SIMCOMA .FOR' ! FOR VAX $INSERT SIMCOKA.FOR C INCLUDE 'SIMCOMC .FOR' ! FOR VAX $INSERT SIMCOMC.FOR
INTEGER ODD NEXT = 0 DO 100 I = 1,6 M = NO + NEXTM(I) N = NO + NEXTN(I,ODD) IF (M .LE. 0) M = M + SIZE IF (M .GT. SIZE) M = M - SIZE IF (N .LE. 0) N = N + SIZE IF (N .GT. SIZE) N = N - SIZE IF (HEX(M,N) . NE. 0) NEXT = NEXT + 1
100 CONTINUE RETURN END
Cl** C***************************************************************************** C** C** SUBROUTINE TO SOLVE REDHEAD EQUATION FOR E KNOWING T c•• C***************************************************************************** C**
FUNCTION EREDHD(T ,BETA,NU,R,N) REAL BETA,NU,E,R,T F(E) = (NU I BETA ) * EXP(-EI(R•T)) - EI(R•T••2) FP(E) = (-1I(R•T)) * (1 . IT + (NU I BETA ) * EXP(-EI(R•T)))
C INITIAL GUESS: E = T * 30000 . I 600. E = 30000. * T I 600. N = 0
10 CORR = F(E) I FP(E) N = N + 1 E = E - CORR IF (ABS(CORRIE) .GT. 0.001 .AND. N .LE . 26) GOTO 10 EREDHD = El1000 .
C cal ==> :teal RETURN END
C***************************************************************************** c•• C** SUBROUTINE TO SOLVE REDHEAD EQUATION FOR T KNOWING E c•• C***************************************************************************** C**
FUNCTION TREDHD(ET,BETA,NU,R,N) REAL BETA,NU,E,ET,R,T F(T) = (BETA I NU) * EXP(EI(R•T)) - R•T••2IE FP(T) =-(BETA* E / (T**~ * NU)) * EXP(E/(R•T)) - 2 . •R•TIE E = ET*1000 .
C Kcal ==> cal C INITIAL GUESS: T = 600. * E I 30000.
T = 600. * E I 30000 . N = 0
10 CORR = F(T) I FP(T) N = R + 1 T = T - CORR IF (ABS(CORRIT) .GT . 0 .001 .AND. N .LE. ~6) GOTO 10 TREDHD = T RETURN END
C***************************************************************************** C**

- 117 -
C** SUBROUTINE TO CALCULATE DISTANCES C** C***************************************************************************** C**
FUNCTION DIST(M1,N1,N2,N2,R) X(M) = M * 0.866025403 Y(M,N) = N + 0 . 5•ABS(1.•NOD(N,2)) DIST = R * SQRT((Y(M1,N1)-Y(N2,N2))••2 + (X(N1)-X(N2))••2) RETURN END
[BHT.N2.AP]SIMCOMA.FOR COMMON /A/ NEARN, NEARN,NEXTM,NEXTN,NADS,NEXP,NDES,COV,DHOP
1 ,AHOP,ADIS,ADIS2,DDIS,DDIS2,EXPOS INTEGER NEARN(6),NEARN(6,2),NEXTN(6),NEXTN(6,2) INTEGER NADS,NEXP,NDES,AHOP,DHOP REAL COV,ADIS,ADIS2,DDIS,DDIS2,EXPOS
[BHT.N2.AP]SIMCOMB.FOR COMMON /B/ EI,NU,EA,ER,EO,EN,ED,NDSB,IR,K,KT,CHI,EM,ES
1 ,INT,INTS INTEGER NDSB,IR,INT(4Q),INTS(7) REAL EI(4Q),NU(4Q),EA,ER,EO,EN,ED,K,KT,CHI,EN,ES
[BHT .N2.AP]SIMCOMC.FOR COMMON /C/ SIZE,HEX INTEGER•2 HEX(100,100) INTEGER SIZE
[BHT.N2.AP]SIMCOMD.FOR COMMON /D/ PMO,PDO,PSO,PDEN,PDI,PCPD,PCTD REAL PMO,PDO,PSO,PDEN,PDI(4Q),PCPD(4Q),PCTD(4Q)
[BHT.N2.AP]SIMCOME.FOR COMMON /E/ M,N,NHOP,DSBFLG,NX,NX,PREFLG INTEGER M,N,NHOP,DSBFLG,NX,NX,PREFLG

- 118 -
1.3 Programs RAST and NU
[BHT .N2.NEW]RAST .FOR C•• PROGRAM TO DEVELOP A RANDOM ORDERED RASTER LIST FOR A n BY n ARRAY C••
INTEGER RAS(10000),LIST(2,10000) REAL RN(10000) TYPE *,'Input N, IR' ACCEPT •, N, IR DO 10 I = 1,N DO 10 J = 1,N I = J + (I-1)•N RAS(K) = I•10000 + J RN(I) = RAN(IR)
10 CONTINUE CALL VSRTP(RN,I,RAS) DO 30 I=1,I LIST(1,I) = RAS(I) / 10000 LIST(2,I) = RAS(I) - 10000 * LIST(1,I)
30 CONTINUE WRITE (20,20) N,I
20 FORMAT(1X,2I6) WRITE (20,212) (LIST(1,I),LIST(2,I),I=1,I)
212 FORMAT(1X,20I6) STOP END
[BHT .N2.NEW]NU.FOR c•••••••••••••••••••••••••••••••••••••••••••••••••••••••••••••••••••••******** c••••••••••••••••••••••••••••••••••• ••••••••••••••••••••••••••••••************ C•••• ***** C•••• PROGRAM TO MODEL R ADSORPTION ON Ru(0001) ***** C•••• 2 ***** C**** Compute Prefactor ***** c••••••••••••••••••••••••••••••••••••••••••••••••••••••••••••••••••••••••••••• c•••••••••••••••••••••• •••••••••••••••••••••••••••••••••••••••••••••••********
INCLUDE 'AP:SIMCOMA.FOR' ! FOR VAX INCLUDE 'AP:SIMCOMB.FOR' FOR VAX INCLUDE 'AP:SINCOMC.FOR' FOR VAX INCLUDE 'AP:SINCOMD .FOR' FOR VAX INCLUDE 'AP:SIMCOME.FOR' FOR VAX
REAL E, T ,NAAVG ,LCTP REAL NRN,DSBINT,nuO,a CHARACTER•72 LINE,TITLE REAL CDESPL(20)
accept •,ic,nuO,A,B c•••••••••••••••••••••••••••••••••••••••••••••••••••••••••••••••••••••••••••••• C•• Now open file/read in input parameter•
READ (1,QQQQ) TITLE READ (1,QQ9Q) LINE
Q99Q FORNAT(A72) READ (1,•,EHD=QQ) ED,EN,EA,ER,EH READ (1,QQQ9) LINE READ (1,•,END=QQ) CHI,SO,TS READ ( 1 , gQgg) LINE READ (1,•,END=Q9) EXPMAX,IR,PRES READ ( 1 , gQgg) LINE READ (1,•,END=9Q) DSBINT,PLTINT,DMPINT READ (1,QQQQ) LINE READ (1,•,END=QQ) LCTP,NAAVG,BETA,DT T2 = TS READ (1,9999,END=QQ) LINE READ (1,• ,END=99) ANNEAL,T2,PREFLG,NPASS READ (1,9Q99,END=QQ) LINE

- 119 -
READ (1,•.END=OO) (CDESPL(I),I=1,20) c•••
00 ~RITE(6,20) TITLE,ED,EN,ER,EA,EM,SO,CHI,IR,TS 20 FORNAT('1' ,72('*'),/,1X,A72,/,1X,72('•'),//
1 , ' DESORPTION ENERGY: ' , 2 F6 .3,/,' DESTABILIZATION ENERGY FOR FILLED SITE:' ,F6.3,/, 3 ' REPULSIVE INTERACTION ENERGY:' ,F6.3,/, 4 ' ATTRACTIVE INTERACTIVE ENERGY:' ,F6 .3,/, 6 ' MIGRATION ACTIVATION BARRIER: ',F7.4,/, 6 ' INITIAL STICKING COEFFICIENT : ',F6 .4,/, 7 ' CHI= ',F12 .6,' SEED: ',IO,/,' TEMPERATURE : ' ,F6 .1,//)
if (ie .lt. 0) type * • 1 'NU(L) = ',nuO, 'E(L) >' ,B,' ELSE NU = ' , A•NUO if (ie .gt. 0) type *• 1 'NU(L) = ',nuO, '•exp((' ,B,' - EI(L))•' ,A,')' if (ie . eq . 0) type *• 1 'NU(L) ',nuO, '*exp(NR(L)•' ,A,' + NA(L)*' ,B, ')'
DO 312 NA = 1,7 DO 312 NR = 1,7 L = NA + (NR-1)•7 EI(L) = (NA-1 . )•EA- (NR-1 . )•ER
if (ie) 601,602,603 601 if (EI(L) .LE. B) then
else
endif goto 312
NU(L) = A*NUO
HU(L) = NUO
602 NU(L) = nuO•exp((NR-1)•A + (NA-1)•B) goto 312
603 NU(L) = HUO•exp((B - EI(L))•A) 312 CONTINUE
c•••••••••••••••••••••••••••••••••••••••••••••••••••••••••••••••••••••••••••••• C•• Open/write prefaetor (NU) array C OPEN(UNIT=20, FILE='NU .DAT', STATUS='NEW')
write (20,222) (nu(i),i=1,40) 222 FORNAT(1X,1P7E10.3)
CLOSE(20) ~RITE (6,311) (J-1,J=1,7),(J-1,(EI(I+7•(J-1)),I=1,7),J=1,7)
311 FORNAT(/,38X,'ENERGY OF MOLECULES BY INTERACTIONS (Kcal/mole)' , 1 /,46X,'HUNBER OF ATTRACTIVE INTERACTIONS',/ 2 20X, 7!10, /,' NUMBER OF'./, 3 'REPULSIVE ' , I6,2X,7F10.4,6(/,12X,I6 , 2X,7F10.4),/) ~RITE (6,313) (J-1,J=1,7),(J-1,(nu(I+7•(J-1)),I=1,7),J=1,7)
313 FORNAT(/,40X,'PREFACTOR BY NUMBER OF INTERACTIONS (aec-1)', 1 /,46X,'HUNBER OF ATTRACTIVE INTERACTIONS',/ 2 20X,7I10,/,' NUMBER OF',/, 3 'REPULSIVE ',I6,2X,1P7E10.3,6(/,12X,I6,2X,7E10.3),/)
STOP END

-120 -
1.4 Sample Command Procedures
[BHT.N2.AP]FM1.COM $ SETNAME "N2 Simulation" $ SET DEF [BHT . N2.AP] $ queue :=b4 $ temp :==scr01 : [s.bht) $ ASSIGN 'TEMP' TEMP : ·
! Queue for plotting ! location for output files
$ delete TEMP:ada.out;•,dsb . out;•,ADS . DAT;•/NOLOG $ ass TEMP :raat.dat FOR020 $ RUN [BHT . N2.NEW]RAST 96,100001 ! Lattice size , random number $ name :=FlU ! Run name $ copy SYS$CONMAND TEMP : ads.dat/L ! input to ADS and NU follows FM1 (A2) -- 96K FOR 4.0 L (P=7.6E-8) , THEN 78K (P=7 . 6E-8) , ED , EM, EA, ER, EN, 1.6, 0.284, 0.46, 0 . 276, 0.22 CHI, SO, TS 1000., 0.126, 86 EXPM.AX, TM.AX, PRES 2.0 , 106.7, 7 . 6E-8 DSBINT, PLTINT, DMPINT 0 . 1. 0 . 02 , 0 . 1 LCTP, <NA> , BETA, DT 116.0 , 1.6, 6.0, .6 ANNEAL, STKMIN , PREFLG, NPASS 63 . 333, 0 . 00, 1, 10 ARRAY OF 20 MAP INTERVALS (COVERAGE): 0 . 336,0.412,0. 443,0 . 483,0 .630,1.0,1,1 , 1,1,1,1 1 . 0 , 1 . 0,1 . 0,1 .0,1 . 0 , 1 .0,1 . 0 , 1.0,1 . 0 ARRAY OF 20 MAP INTERVALS (TIME) : 63.333,10000,10000 , 10000,10000,10000,10000,10000,10000,10000,10000 10000,10000,10000,10000,10000,10000,10000,10000,10000,10000 New Parma : T, ISO, PRES
78, 2, 7.6E-8 DSBINT, PLTINT , DMPINT 0 . 4, 0 . 02, 0 . 1 ANNEAL, STKMIH, NPASS
0.0 , -0 . 1, 10 $ ass TEMP : ads .dat for001 $ ASS TEMP : NU . DAT FOR020 $run [BHT.H2 .new)nu 0,1.e13,1.,0.36 $ SJE attach/wait aet/limit=16000 copyin TEMP:nu.dat, nu . dat copyin TEMP : ada .dat, ads . dat copyin TEMP :raat.dat, rast . dat : s(xhmeia):bht : ads . img 100001 copyout/CC :s(xhmeia) :bhtout . ads, TEMP:ads . out copyout for008.dat, TEMP :for008. copyout forOOO .dat, TEMP : forOOO . del : s(xhmeia) :bhtout.ads :s(xhmeia) :bht :dsb.img TMIN , TKAX, TINT, CMIH 76, 160, 4, 0 . 14 IR, MAPH, PREFLG, ATM.AX 100001, 1, 1, .26 ARRAY OF 20 MAP INTERVALS : 0.483,0.443,0 . 411,0 . 336 ,0.270,0 . 210,0.138,0.068,0.027,-1 . 0 -1.0 , -1 .0,-1 .0,-1 . 0, - 1.0,-1.0,-1 . 0,-1 .0,-1.0,-1.0 copyout/CC :s(xhmeia) :bhtout . dsb, TEMP : dab . out copyout for010.dat, TEMP : for010 . copyout for016.dat, TEMP :for015 . copyout for014.dat , TEMP:for014. del : s(xhmeia):bhtout . dsb

detach quit
-121 -
$rename TENP :raat.dat,NU . DAT,forO%%.,%%% . OUT .'name'/1 $ O[bht]chkque ' queue' $ 'queue • /PAR= ( • NAME • , • TEMP • , "" , 11 11 , • queue • ) /NAME= • NAME' PL T /LOG= • temp • PL T $ nextjob ARRAY
[BHT.N2.AP]COMPCPY.COM $ SET DEF [BHT.N~ . AP] $ apftn64/LIN/LIST/OPT=2/onetrip ADS $ apftn64/LIN/LIST/OPT=~/onetrip DSB $ apftn64/LIN/LIST/OPT=~/onetrip MIG $ apftn64/LIN/LIST/OPT=3/onetrip CONSUB $ PURGE • . LIS,•.AOB $ aplink64 ada , mig,comaub $ aplink64 dab,mig,comaub $DEL ADS .AOB;,DSB.AOB; $ PURGE •.img,•.AOB $ aje attach/wait/PRIORITY=1 copyin/binary ada.img, : a(xhemia) :bht :ada.img copyin/binary dab.img, : a(xhemia):bht:dab.img detach quit $ nextjob array
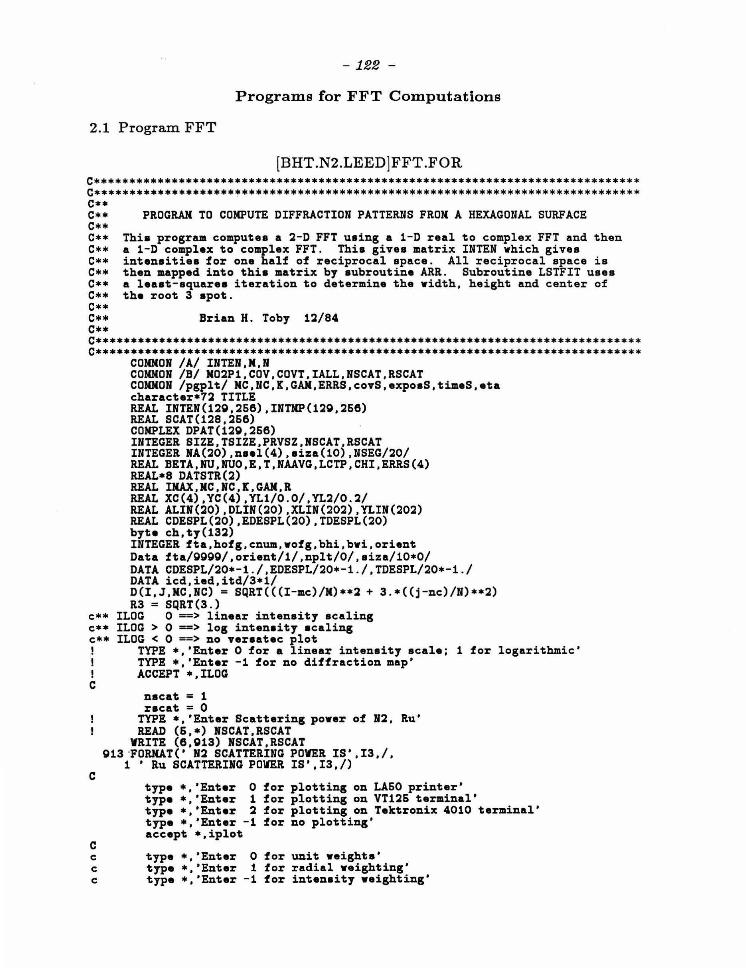
-122 -
Programs for FFT Computations
2.1 Program FFT
[BHT .N2.LEED ]FFT .FOR C****************************************************************************** C****************************************************************************** C•• c•• C•• c•• c•• C•• C•• C•• c•• C•• C•• C**
PROGRAM TO COMPUTE DIFFRACTION PATTERNS FROM A HEXAGONAL SURFACE
This program computes a 2-D FFT using a 1-D real to complex FFT and then a 1-D complex to complex FFT. This gives matrix INTEN which gives intensities for one half of reciprocal apace. All reciprocal apace is then mapped into this matrix by subroutine ARR. Subroutine LSTFIT uses a least-squares iteration to determine the width, height and center of the root 3 spot.
Brian H. Toby 12/84
c•••••••••••••••••••••••••••••••••••••••••••••••••••••••••••••••••••••••••••••• C******************************************************************************
CONNON /A/ INTEN,M,N CONNON /B/ M02P1,COV,COVT,IALL,NSCAT,RSCAT COMMON /pgplt/ MC,NC,K,GAM,ERRS,covS,exposS,timeS,eta character•72 TITLE REAL INTEN(12Q,266),INTNP(12Q,266) REAL SCAT(128,266) COMPLEX DPAT(12Q,266) INTEGER SIZE,TSIZE,PRVSZ,NSCAT,RSCAT INTEGER NA(20),nael(4),aiza(10) , NSEG/20/ REAL BETA,NU,NUO,E,T,NAAVG,LCTP,CHI,ERRS(4) REAL•S DATSTR(2) REAL INAX,KC,NC,K,GAM,R REAL XC(4),YC(4),YL1/0.0/,YL2/0.2/ REAL ALIN(20),DLIN(20),XLIN(202),YLIN(202) REAL COESPL(20),EDESPL(20),TDESPL(20) byte ch,ty(132) INTEGER fta,hofg,cnum,wofg,bhi,bwi,orient Data fta/QQQQ/,orient/1/,nplt/0/,siza/10•0/ DATA CDESPL/20•-1 . /,EDESPL/20•- 1./,TDESPL/20•-1 . / DATA icd,ied,itd/3•1/ D(I,J,MC,NC) = SQRT(((I-mc)/M)••l + 3 . •((j-nc)/N)••2) R3 = SQRT(3.)
c** ILOG 0 ==> linear intensity scaling c** ILOG > 0 ==> log intensity scaling c•• ILOG < 0 ==> no versatec plot ! TYPE *,'Enter 0 for a linear intensity scale; 1 for logarithmic '
TYPE *·'Enter -1 for no diffraction map'
c
c
c
ACCEPT •.ILOG
nscat = 1 rscat = 0
TYPE *,'Enter Scattering power of N2, Ru' READ (6,•) NSCAT,RSCAT
WRITE (6,Q13) NSCAT,RSCAT Q13 ·FORMAT(' N2 SCATTERING POWER IS',I3,/,
1 'Ru SCATTERING POWER IS',I3,/)
type *,'Enter 0 for plotting on LA60 printer' type *,'Enter 1 for plotting on VT126 terminal' type •,'Enter 2 for plotting on Tektronix 4010 terminal' type *, ' Enter -1 for no plotting ' accept *,iplot
c type *,'Enter 0 for unit weights ' c type *,'Enter 1 for radial weighting' c type •,'Enter -1 for intensity weighting'

-129 -
c accept *,iweigh c IF (!WEIGH) 1,2,3 c1 type *,'Using intensity weighting' c goto 001 c2 type *,'Using unit weights' c goto 001 c3 type *,'Using radial weighting' C**************************************************************************** 001 type *,'Enter 0 to process all spectra, 1 to select by coverage'
ACCEPT *,iall c
IPASS1 = 0 iwr = 1 ! IWR is a flag -- 0 ==> Write intensity data on file
IF (IALL .EQ . 0) THEN WRITE (6,014)
014 FORMAT(' PROCESS ALL NAPS',/) ELSE
write (6,•) 'Enter map coverages' READ (6,•,END=100) (CDESPL(I),I=1,20)
100 write (6,•) 'Enter map exposures' READ (6,•,END=200) (EDESPL(I),I=1,20)
200 write (6,•) ' Enter map times' READ (6,•,END=300) (TDESPL(I),I=1,20)
END IF 300 continue c
if (iplot .eq. 0) then CALL pgbegin(1,'tmp :printronix.raat/pri' ,1,1) CALL PGPAPER(10.,0.8,0.)
elseif (iplot .eq. 1) then CALL pgbegin(1,'/vt' ,1,1)
elaeif (iplot .eq . 2) then CALL pgbegin(1,'/tek',1,1)
endif C******************************************************************************* C•• FILE DEFINITIONS ! LUNQ = 1 ! QUIC FILE
LUNo = 0 LUNJI =- 10 LUN = LURK
IF(IWR .eq. 0) then IWRT 0 Open output file • write header now
else IWRT = 1
end if C*******************************************************************************
DO 210 J=1,10 CALL OPENIH(LUB,LUNo,NSCAT,RSCAT,TSIZE,IWRT,TITLE,ts)
!C** don't open file again ! IWRT = 1
SIZA(J) = TSIZE IF (TSIZE .LE . 0) GOTO 010
C** NOW REDUCE TSIZE SO THAT SIZE = 2•N SIZE = 2 * IFIX(TSIZE / 2.) IF (SIZE .HE . TSIZE) WRITE (6,002) TSIZE,SIZE
002 FORMAT(' REDUCING LATTICE SIZE FROM' ,13,' TO',I3,/) IF (J .EQ. 1) PRVSZ = size IF (PRVSZ .HE. size) then
WRITE(6,003) PRVSZ,SIZE 003 FORMAT(' ***ERROR*** UNEQUAL LATTICE SIZES',I3,'<>' ,I3)
goto 008 end if LUB = LUB + 1
210 CONTINUE C******************************************************************************* C*******************************************************************************
010 IF (LUI .EQ. LURK) GOTO 008 LUI = LUI - 1 K = SIZE

N = 2 * SIZE M02P1 = SIZE / 2 + 1
C** Write results on file 922 format(a72)
write (8,922) title
-124 -
write (8,023) M,N,NSCAT,RSCAT,ts 923 format(4i12,f8.2) C****************************************************************************** ! INCLUDE 'QPLOT1.FOR' C****************************************************************************** C** NOW READ IN MAPS C****************************************************************************** 1000 SUMSIZE = 0
WRITE (e,33) 33 FORMAT( ' 0',76('*'))
C•• IADD = 0 ==> Zero INTEN array before computing FFT intensity IADD = 0 covS = 0.0 exposS = 0 .0 timeS = 0 .0 imap = 0 DO 220 L=LUNN,LUN
C SKIP OVER FILE IF IT HAS ENDED ALREADY taize = SIZA(1+L-LUNM) IF (taize .EQ. 0) GOTO 220 CALL READIN(L,taize,covO,expoa,time) IF (covO .LE. 0) THEN
C** END OF FILE -- SKIP OVER FILE NEXT TIME SIZA(1+L-LUNM) = 0 CLOSE(L) GOTO 220
end if covS = covS + covO•taize•taize expoaS = expoaS + expoa•tsize•taize timeS = timeS + time imap = imap + 1
C** SHOULD WE DIFFRACT THIS NAP? IF (IALL .EQ. 0 . OR. IADD .NE. 0) THEN
IFLAG = 1 ELSE
IFLAG = 0 IF (ABS(COVO - CDESPL(ICD)) .le. 0 .011) THEN
IFLAG = 1 ICD = ICD + 1
end if IF (ABS(expos/eDESPL(IeD)-1) . le. 0.06) THEN
IFLAG = 1 IeD = IeD + 1
end if IF (ABS(time/tDESPL(ItD)-1.) . le. 0 .06) THEN
IFLAG = 1 ItO = ItO + 1
end if endif IF (IFLAG .EQ . 1) then
C•* Calculate the FFT CALL DIFFRACT(SCAT,DPAT,IADD) IADD = IADD + 1 I Number of averaged FFTa
C•• IADD >= 1 ==> Add to INTER array next time end if SUMSIZE = SUNSIZE + SIZA(1+L-LUNM)••2 WRITE (e,34) L,COVO,expoa,time,IFLAG
34 FORMAT (' File #' , i3, ' COVERAGE = ' , Fe . 3, 1 'M, EXPOS =',f7 . 2,'M, TIME =',f13.1,' See (',I1,')')
220 CONTINUE C****************************************************************************** C IF SUNSIZE IS ZERO THEN ALL FILES ARE NOW EMPTY
IF (SUNSIZE .LE . 0) goto 000 covS = covS/aumsize expoaS = 4 .08•expoaS/aumaize

timeS = timeS/imap avgSIZE = SQRT(SUMSIZE) WRITE (6,36) covS , expoaS,timeS
-125 -
36 FORMAT(' Averages: COVERAGE= ',F6 . 3, 1 'N, EXPOS =',f7 .2,'L, TIME =',f13.1,' Sec' , /,' ',76('*')) IF (IFLAG . NE. 1) goto 1000
c•• Adjust intensities to reflect number of averaged mapa IF (IADD .gt. 1) THEN
DO 206 I=1,M02P1 DO 206 J=1,N
INTEN(I,J) = INTEN(I,J) / iadd 206 CONTINUE
END IF c•••••••••********************************************************************* C** Write results on file
write (8,012) O,covS,exposS,timeS,iadd 912 FORNAT(1X,I6,f6 .3,f11.3,f11.1,i6) C** Write out file? C IF (IWR . eq. 0) THEN C Write (luno,012) imore,covS,exposS,timeS C DO 206 J=1,N C write (luno,207) (INTEN(I,J),I=1,N02P1) C206 CONTINUE C207 format(1x,1P12E10 . 3) C ENDIF c•••••••••••••••••••••••••••••••••••••••••••••••••••••••••••••••••••••••••••••• ! INCLUDE 'QPLOT2 . FOR' c••••••••••••••••••••••••••••••••••••••••••••••••••••••••••••••••••••••••••••• C•• Find the root 3 spot beam profile
2000 NC = 0 NC = N/3.
start with small radius r = .10 GAM = .02
ETA= 1. Lorentzian ETA = 0.6
C•• find approximate peak area as starting point for l NCPR = NC + R * N + 0.6 NCNR = NC - R * N - 0.6 K = 0 DO 6 I=NCNR,NCPR l = l + ARR(I,J)
6 CONTINUE C refine K and GAMMA
nsel(1) = 1 n .. l(2) = 0 nsel(3) = 1 CALL LSTFIT(R,nsel, . 4,7)
C refine K, GAMMA and Eta nsel(1) = 1 n .. l(2) = 1 nsel(3) = 1
C increase the size of the radius to 0.26 rlu r = 0.26 CALL LSTFIT(R,nsel,.6,8) CALL tfit(iplot,nplt,r,1,title)
C•• Write results on file write (8,008) K,ERRS(1),ETA,ERRS(2),GAN,ERRS(3) write (7,000) K,ERRS(1),ETA,ERRS(2),GAN,ERRS(3)
908 FORNAT(1P8G10.3) 000 FORMAT(' K = ',G10.3,' +or- (' ,G10.4,')',/,
2 ' Eta= ',1PG10.3,' +or- (' ,G10.3,')' ,/, 2 ' Gamma (FWHN) = ',1PG10.3,' +or- (' ,G10.3,')')
2600 continue ! include 'OOfit.for' 3000 CONTINUE
C IF (IALL .HE. 0) then C type *,'Enter coverage'

C READ (5,*,end=999) COVT C endi:f
GOTO 1000 c• Delete :font, close :files 999 CONTINUE
IF (ILOG .ge . 0) then call q:fnt(-1,:fta,orient) CALL qini(1)
endi:f IF (Iplot .ge . 0) CALL pgend
IF (IVR .eq. 0) CLOSE(LUNo) 998 STOP
END
-126 -
C!***************************************************************************** FUNCTION ARR(I,J) COMMON /A/ INTEN,M,N REAL INTEN(129,256) IP = MOD(I,M) + 1 IF (IP . LE . 0) IP = IP + N JP = NOD(J,N) + 1 IF (JP .LE. 0) JP = JP + N IF (IP .GT. N/2+1 .AND. JP .EQ. 1) THEN
ARR = INTEN(M+2-IP,1) ELSE IF (IP .GT. N/2+1) THEN
ARR = INTEN(N+2-IP,H+2-JP) ELSE
ARR = INTEH(IP , JP) END IF RETURB END
[BHT .N2.LEED ]DIFFRACT .FOR C!*****************************************************************************
SUBROUTINE DIFFRACT(SCAT,DPAT,IADD) COMMON /A/ IHTEN,N,N COMMON /B/ N02P1,COV,COVT,IALL,NSCAT,RSCAT COMMON /C/ SIZE,HEX
REAL SCAT(N,H),WX(1486) COMPLEX DPAT(M02P1,N),CVEC(256) REAL IHTEN(129,256) INTEGER HEX(128,128) INTEGER SIZE,TSIZE,NSCAT,RSCAT
C******************************************************************************* C•• Leta start by expanding the "Quasi-rectangular" HEX matrix into the C "True Rectangular" matrix SCAT
DO 1000 J = 1 ,N NJ = (J + 1)/2 DO 1000 I · = 1,11 SCAT(I,J) = 0 IF (MOD(I+J,2) .EQ. 0) GOTO 1000 SCAT(I,J) = &SCAT * HEX(I,HJ) + RSCAT
1000 CONTINUE C******************************************************************************* C•• How compute the FFT o:f the matrix C******************************************************************************* C** COMPUTE THE FFT ALONG THE FIRST AXIS .
DO 240 J=1,1 CALL FFTRC(SCAT(1,J),N,DPAT(1,J),WX,WX)
240 CONTINUE C** COMPUTE THE FFT ALONG THE SECOND AXIS
DO 250 I=1,M02P1 C•• REMOVE ROW FROM MATRIX
DO 251 J = 1,111 CVEC(J) = DPAT(I,J)
261 CONTINUE C•• NOW TRANSFORM THE VECTOR
CALL FFTCC(CVEC,N,VI,WX)

C•• PUT ROW BACK INTO MATRIX DO 262 J = 1,N DPAT(I,J) = CVEC(J)
262 CONTINUE 260 CONTINUE
-127-
C******************************************************************************* C•• Now calculate intensity (magnitude ••2) from complex matrix
IF (!ADD .eq . 0) THEN DO 206 I=1,N02P1 DO 206 J=1,N
INTEN(I,J) = 4.•(CABS(DPAT(I,J)) I (N•N))••2 c•• the 4 adjusts the intensities to reflect that the SCAT array is half zeros 206 CONTINUE
ELSE DO 206 I=1,N02P1 DO 206 J=1,N
INTEN(I,J) = INTEN(I,J) + 4.•(CABS(DPAT(I,J)) I (N•N))••2 c** the 4 adjusts the intensities to reflect that the SCAT array is half zeros 206 CONTINUE
END IF C•******************************************************************************
RETURN END
[BHT.N2.LEED]OPENIN.FOR C!*****************************************************************************
SUBROUTINE OPENIN(LUN,LUNo,NSCAT,RSCAT ,TSIZE,IWR,TITLE,ts) CONNON lpgpltl NC,NC,K,GAN,ERRS,covS,expoaS,timeS REAL ERRS(4) character•72 TITLE character•60 fnaa INTEGER LUN,LUNo,NSCAT,RSCAT,TSIZE,IWR REAL BETA,NU,NUO,E,T,NAAVG,LCTP,CHI
C******************************************************************************* WRITE (6,•) 'Enter filename' read (6,036,end=008) fnaa
036 format(A60) open (unit=lun, file=fnam, status='old', err=008)
c•••••************************************************************************** READ (LUN,21,ERR=008,END=008) TSIZE,ED,ER,EA,ER,EN,SO , CHI,TS ,
1 DSBINT,IR,TITLE,LCTP,E,EO,NAAVG,DT,A,NUO,BETA 21 FORKAT(I6,6F10 .6, I, 3F10·. 3, I12,/,A72,1 ,F10.1, 2F10 .6,F6 . 2,
1 F6 .4,F6.2,E0.2,F6.1) RATIO = ER I EA
211 WRITE(6,20) TITLE,TSIZE,TSIZE,ABS(ED),EN,ER,EA , 1 RATIO,EM,SO,CHI,TS,IR
20 FORKAT('0',72('*'),1,1X,A72,I,1X,72('*'),11' LATTICE IS' ,!4, 1 'BY',I4,I,' DESORPTION ENERGY: ' , 2 F6 .3,l,' DESTABILIZATION ENERGY FOR FILLED SITE : ' ,F7.3,I, 3 'REPULSIVE IHTERACTION ENERGY:' ,F6.3 , I, 4 'ATTRACTIVE INTERACTIVE ENERGY:',F6.3,I, 6 'ER I EA: ',F6.3,I,' MIGRATION ENERGY: ',F7.4,I, 6 ' INITIAL STICKING COEFFICIENT: ' ,F6.4,I,' CHI=' ,F12.6, 7 I,' ADSORPTION TENPERATURE : ',F6.1,I, 8' RANDOM STARTING POINT:',I10,II)
c••••••••••••••••••••••••••••••••••••••••••••••••••••••••••••••••••••••••••••••• ! IF (IWR .De. 0) RETURJI c•••••••••••••••••••••••••••••••••••••••••••••••••••••••••••••••••••••••••••• ! Write (LUBo,21) SIZE,ED,ER,EA,ER,EN,SO,CHI,TS,
1 DSBIHT,IR,TITLE,LCTP,E,EO,NAAVG,DT,A,NUO,BETA Write (LUNo,•) HSCAT,RSCAT
RETURJI C•• return to main prosram - Unexpected end of file or other error 008 TSIZE = -1
RETURJI END

-128 -
[BHT.N2.LEED]READIN.FOR C!*****************************************************************************
SUBROUTINE READIN(LUN,taize , covO,expoa,time) CONNON /C/ SIZE,HEX
INTEGER HEX(128,128) INTEGER SIZE,TSIZE
C******************************************************************************* C•• readin preface of map
READ (LUN,012,END=OOO) imore,covO, expoa,time 012 FORNAT(1X,I5,f6.3,f11 . 3 , f11.1)
if (imore .eq . 0) goto 000 C******************************************************************************* C** NOW READ IN NAP (HEX MATRIX) C******************************************************************************
1000 ICOV = 0 DO 1003 I = 1, TSIZE READ (lun,011,END=008) (HEX(I,J),J=1,TSIZE)
011 FORNAT(1X,100I1) C•• now compute actual coverage on surface c DO 1003 J = 1, TSIZE c IF (HEX(I,J) .NE. 0) ICOV = ICOV + 1
1003 CONTINUE c COV = ICOV / (1.•TSIZE **2) C****************************************************************************** C•• return to aain program - readin successful
RETURI C•• return to aain program - no aore mapa on file 000 covo ~ 0.0
RETURK C•• return to aain program - Unexpected end of file or other error ooa covo • -1.0
RETURK END
[BHT.N2.LEED]TFIT.FOR C!*****************************************************************************
SUBROUTINE tfit(iplot ,nplt,Rp,itype,title) CONNOR /A/ INTEN,M,R COMMOI /pgplt/ NC,NC,I,GAM,ERRS,covS,expoaS,timeS,eta character•72 TITLE
REAL INTEN(120,256) INTEGER NA(20),NSEG/20/ Character•36 ty Character•40 ty1 REAL ERRS(4) ,par(4) REAL ALII(20),DLIN(20),R,Rp ,XLIN(202),YLIN(202),MC,NC,I,GAM integer zero(4)/4•0/ D(I,J,MC,IC) • SQRT(((I-mc)/N)••2 + 3 . •((j-nc)/N)••2) R3 = SQRT(3.)
R = 2 . •gam R = Rp
C•• Now compute the radially averaged beaa profile PAR(1) = I PAR(2) "' ETA PAR(3) = GAM AKAX = DI(O. ,PAR,zero) NCPR = MC + R * M + 0.5 NCNR = MC - R * M - 0.5 NCPR = NC + R * N / R3 + 0.5 NCNR = NC - R * I / R3 - 0.5 DO 220 I=1,RSEG ALIN(I) 0. DLIN(I) 0. NA(I) = 0

220 CONTINUE DO 230 I=MCKR,MCPR DO 230 J=NCMR,NCPR
-129 -
if (i .eq. 0 . and . j . eq . 0) goto 230 omit center spot ID = NSEG • D(I,J,MC,NC) / R + 1 IF (ID .GT. NSEG) GOTO 230 A = ARR(I,J) ALIN(ID) = ALIN(ID) + A DLIN(ID) = DLIN(ID) + D(I,J,MC,NC) NA(ID) = NA(ID) + 1
230 CONTINUE Write (7,24~) (NA(I),I=1,NSEG)
~4~ FORMAT(1X.~OI&) ~41 FORMAT(1X,~OF6 . 3)
Write (7,241) (ALIN(I)/(AMAX•MAX(NA(I),1)),I=1,NSEG) if (iplot .lt. 0) return
c if (nplt .ge . 0) CALL PGADVANCE nplt = nplt + 1 CALL pgsetc(1.2) CALL pgenv(-r,r,0 . ,1.,0,0)
encode (40,701,ty1) covs,expoas,times 701 format('Cov:' ,F4.~. ', Exp: • ,F6 . 1, 'L, Time =' ,1PG10.3, • a')
if (itype .eq. 0) then CALL pglabel('Distance from [0,0] Beam (rlu)'
1 ,'Scaled Intensity',ty1) else
CALL pglabel('Distance from [\(~266)3,\(2266)3] Beam (rlu)' 1 ,'Scaled Intensity',ty1) end if call pgMtext('R',1.6,0 .6,0.6,title) if (iplot . lt. 0) then
CALL pg .. tc (. 8) cspa = 0.026
else CALL pgaetc(1.4) cspa = 0.06
endif encode (36,703,ty) gam,erra(3)
703 format('FWHX (\gG) : • ,1peQ.3,'\(2~33)',1pe8.~) xt = -.Q& • R yt = O.Q6 call pgtext(xt,yt,ty)
encode (36,704,ty) I,errs(1) 704 format('k: ',1peQ.3,'\(~~33)',1pe8.~.2x)
yt = yt - cspa call pgtext(xt,yt,ty)
encode (36,706,ty) Eta,erra(2) 706 format('\sy: ',1peQ.3,'\(2233)',1pe8.~)
yt = yt - cspa call pstext(xt,yt,ty)
C•• Row calculate and plot the fit beam profile J1 = 0 DO 4~0 J=RSEG,1,-1 IF (RA(J) .LE . 0) GOTO 4~0 J1 '"' J1 + 1 YLIR(J1) a ALIR(J)/(AMax•RA(J)) XLIR(J1) = - DLIR(j)/RA(j)
4~0 CORTIRUE C if (iplot .eq. 0) then C CALL GRSETLW(3) darker points c else C CALL GRSETCOL(~) red C endif
call pgpoint(j1,xlin,ylin,2) plot points J1 = 0 CALL GRSETCOL(3) sreen DO 430 I=KCKR,KCPR DO 430 J=RCKR,RCPR

-190 -
if (i .eq . 0 . and. j .eq. 0) goto 430 omit center spot Dt = D(I,J,NC , NC) IF (Dt .GT. r) GOTO 430 if (j1 . ge. 200) then
call pgpoint(j1,xlin,ylin,-1) plot points J1 = 0
end if J1 = J1 + 1 yLIN(j1) = ARR(I,J)Iamax xLIN(j1) = Dt
430 CONTINUE call pgpoint(j1,xlin,ylin,-1) plot points
C if (iplot . eq. 0) then C CALL GRSETLW(1) back to normal C else C CALL GRSETCOL(1) white C endif
J1 = 0 DO 630 J=0,100 J1 = J1 + 1 XLIN(J1) = -J • R I 100. YLIN(J1) = DI(XLIN(J1),PAR,zero)lamax
630 CONTINUE call pgline(j1,xlin,ylin) ! draw connected line
J1 = 0 DO 640 J=0,100 J1 = J1 + 1 XLIN(J1) = J * R I 100. YLIN(J1) = DI(XLIN(J1),PAR,zero)lamax
640 CONTINUE call pgline(j1,xlin,ylin) ! draw connected line CALL PGADVANCE
ggg RETURN END

-191 -
2.2 Subroutine EQFIT
[BHT.N2.LEED]LSTFIT.FOR C!********************************* ******************************************** C** This subroutine calculates the beat fit parameters for the n parameter C** equation DI using a least squares iteration . C** C** NOTE: DI ( . .. , NSEL ,.DERIV) returns the function and DERIV contains the C** derivatives with respect to the parameters for which NSEL is non-zero C** C******************************************************************************
SUBROUTINE LSTFIT(R,Nael ,SP,NCYC) COMMON /A/ INTEN,M,N COMMON /pgplt/ NC,NC,K , GAM,ERRS,covS,expoaS,timeS,eta REAL INTEN(120,266),ERRS(4) REAL DI,MC,NC,K , eta,GAM,DP(4) , IMAX,PAR(4),TPAR(4),SFT , deriv(4) INTEGER PI,PJ,M,N,MI,NI,nael(4),ipar(4),npar,zero(4) REAL•8 A(4,4),B(4) REAL•S D1/-1.0/,D2,WX(8) data zero/4•0/
C* set up variables before starting R3 = SQRT(3.) SFT = SP PAR(1) = K PAR(2) = ETA PAR(3) = GAM MCPR = MC + R * N + 0 . 6 MCMR = MC - R * M - 0 . 6 NCPR = NC + R * N / R3 + 0 .6 NCMR = NC - R * N / R3 - 0 . 6 RFACP = 0. GOFP = 0. SUMARR = 1 .E-20 SUMVA2 = 1 .E-20 NP = 0 NPAR = 0
C•• Select parameters to be varied DO 101 I=1,3
iPAR(I) = 0 ERRS(I) = 0.0 if (nsel(I) .ne . 0) then
npar = npar + 1 iPAR(npar) = i
end if 101 CONTINUE
C** Compute initial R factor and Goodness of fit C**
DO 130 I=MCMR,NCPR DO 130 J=NCMR,NCPR D = SQRT(((I-NC)/M)••2 + 3.•((J-NC)/N)••2) if (D .eq. 0) goto 130 ! omit center spot
C if (i . eq. 0 . and. j .eq. 0) goto 130 ! omit center spot NP = NP + 1 SUMARR = SUMARR + ARR(I,J) SUKWA2 = SUMVA2 + ARR(I,J)••2 ERR = ARR(I , J) - DI(D,PAR,zero,deriv) RFACP = RFACP + ABS(ERR) GOFP = GOFP + ERR••2
130 CONTINUE GOFP = SQRT(GOFP/(NP - NPAR)) WRFACP = SQRT(GOFP/SUMWA2) RFACP = RFACP/SUMARR ICNT = 0
C** create working copy of parameters (TPAR), zero matrix and vector terms 10 DO 100 PI=1 , 4
TPAR(PI) = PAR(PI) B(PI) = 0 .0 DO 100 PJ=1,4
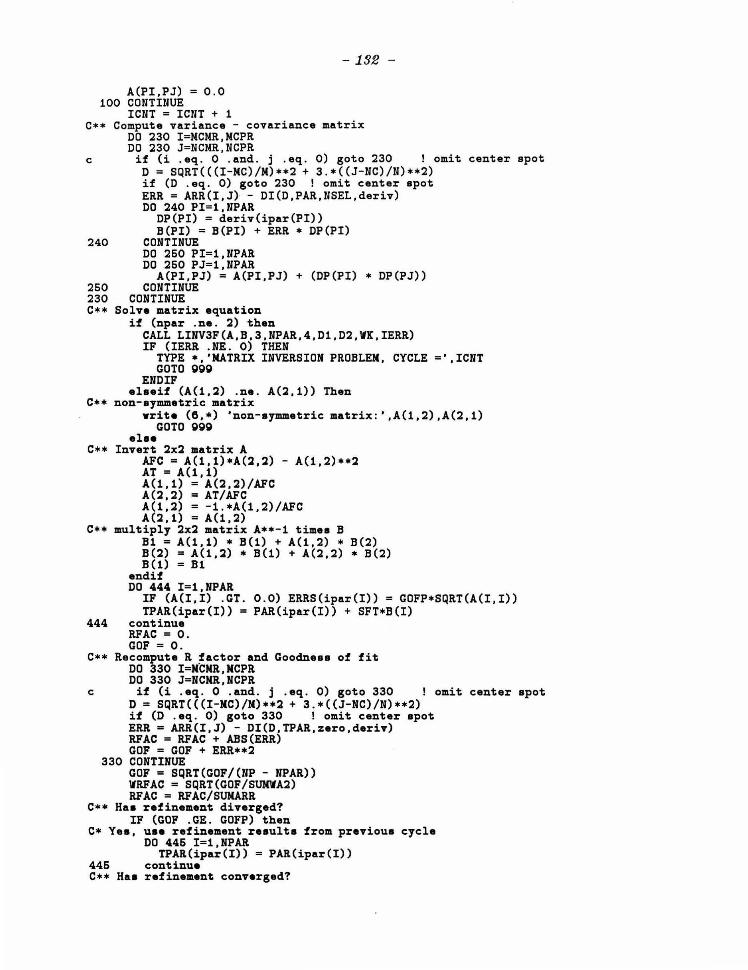
A(PI,PJ) = 0 .0 100 CONTINUE
ICNT = ICNT + 1
-192 -
C** Compute variance - covariance matrix DO 230 I=NCNR,NCPR DO 230 J=NCNR,NCPR
c if (i . eq. 0 .and. j . eq. 0) goto 230 ! omit center spot D = SQRT(((I-NC)/M)**2 + 3 . •((J-NC)/N)••2) if (D . eq. 0) goto 230 ! omit center spot ERR = ARR(I,J) - DI(D,PAR, NSEL,deriv) DO 240 PI=1,NPAR
DP(PI) = deriv(ipar(PI)) B(PI) = B(PI) + ERR * DP(PI)
240 CONTINUE DO 260 PI=1,NPAR DO 260 PJ=1,NPAR
A(PI,PJ) = A(PI,PJ) + (DP(PI) * DP(PJ)) 260 CONTINUE 230 CONTINUE C** Solve matrix equation
if (npar .ne . 2) then CALL LINV3F(A,B,3 , NPAR,4,D1,D2,WK,IERR) IF (IERR .NE. 0) THEN
TYPE *• 'MATRIX INVERSION PROBLEM, CYCLE=' ,ICNT GOTO ggg
END IF elseif (A(1,2) .ne. A(2,1)) Then
C•• non-symmetric matrix write (6 , *) 'non-symmetric matrix : ' ,A(1,2),A(2,1)
GOTO ggg else
C•• Invert 2x2 matrix A AFC = A(1,1)•A(2,2) - A(1,2)**2 AT=A(1,1) A(1,1) = A(2,2)/AFC A(2,2) = AT/AFC A(1,2) = -1.*A(1,2)/AFC A(2,1) = A(1,2)
C•• multiply 2x2 matrix A••-1 times B B1 = A(1,1) * B(1) + A(1,2) * B(2) B(2) = A(1,2) * B(1) + A(2,2) * B(2) B(1) = B1
end if DO 444 I=1, NPAR
IF (A(I,I) . GT. 0.0) ERRS(ipar(I)) = GOFP•SQRT(A(I,I)) TPAR(ipar(I)) = PAR(ipar(I)) + SFT•B(I)
444 continue RFAC = 0. GOF = 0.
C** Recompute R ~actor and Goodness of fit DO 330 I=MCMR,MCPR DO 330 J=NCMR,NCPR
c if (i .eq . 0 . and. j .eq. 0) goto 330 ! omit center spot D = SQRT(((I-NC)/M)**2 + 3.•((J-NC)/N)••2) if (D .eq. 0) goto 330 ! omit center spot ERR= ARR(I,J) - DI(D,TPAR,zero,deriv) RF AC = RF AC + ABS (ERR) GOF = GOF + ERR**2
330 CONTINUE GOF = SQRT(GOF/(NP - NPAR)) WRFAC = SQRT(GOF/SUKWA2) RFAC = RFAC/SUHARR
C** Has refinement diverged? IF (GOF .GE. GOFP) then
C• Yea, use refinement results from previous cycle DO 446 I=1,NPAR
TPAR(ipar(I)) = PAR(ipar(I)) 446 continue C** Has refinement converged?

-199 -
elseiF (GOF•1.000001 .LT. GOFP .and . ICNT .LE. NCYC) then C• No, use refinement results as starting point for next cycle
SFT = AMIN1(1 . , SFT + (1. - SP)/(NCYC - 2 . )) RFACP = RFAC WRF ACP = WRF AC GOFP = GOF DO 446 I=1,4
446 PAR(I) = TPAR(I) GOTO 10
end if 999 K = TPAR(1)
ETA = TPAR(2) GAM = TPAR(3)
WRITE (7,•) WRITE (7,•)'CYCLE ' ,ICNT WRITE (7, •)' R factor = ', RFAC, ' FROM (', RFACP, ') ' WRITE (7,•)'Weighted R factor= ',WRFAC, ' FROM(' ,WRFACP,')' WRITE (7,*)' Goodness of fit= ',GOF,' FROM(' ,GOFP,')' WRITE (7,•)'Shifts muted by factor of' ,SFT WRITE (7,•)'K ',PAR(1),TPAR(1),errs(1) WRITE (7,•)'Eta = ',PAR(2),TPAR(2),errs(2) WRITE (7,•)'GAMMA =' ,PAR(3),TPAR(3),errs(3) WRITE (7 , •)'CORRELATION COEF . MATRIX:' write (7,4) ((A(I,J)/SQRT(A(I,I)•A(J,J)),J=1,NPAR),I=1,NPAR)
4 FORMAT(4(1X,1P<NPAR>G13.6,/)) RETURN END
C!***************************************************************************** C** This subroutine calculates the Paeudo-Voigt intensity function in two space C•• and ita derivatives with respect to each parameter C******************************************************************************
FUNCTION DI(D,PAR,nsel,deriv) COMMON /A/ INTEN,N,N REAL INTEN(129,256) REAL G,L,c1,y1,X,X2,D,DI,PAR(4),Pi,DERIV(4) INTEGER NSEL(4) data C4Ln2,C8Ln2/2.7725887,5.5451774/,Pi/3.14159265/ data Sln2Pi/0 . 4697186/
C PAR(1) ==> K -- integrated intensity C PAR(2) ==> eta -- 0 -> Gaussian; 1 -> Lorentzian C PAR(3) ==> gamma -- Full Width at Half maximum (FWHN) C****************************************************************************** C•• Compute needed intermediates (in hopes of saving time)
X = D I PAR(3) X2 = X•X
C Gaussian G = EXP(-C4ln2•X2)
C Lorentzian L = 1./(1 . +4 . •X2)
C weighted Lorentzian + Gaussian y1 = (PAR(2)•L/Pi + (1 . -PAR(2))•G•Sln2Pi)
C coefficient c1 = 2 . * PAR(1) I PAR(3)
C****************************************************************************** C** ALWAYS -- CALCULATE INTENSITY FUNCTION c••••••••••••••••••••••••••••••••••••••••••••••••••••••••••••••••••••••••••••••
DI = c1 * Y1 C****************************************************************************** C•• NSEL(1) Non-zero -- CALCULATE DERIVATIVE W/R TO PAR(1) C******************************************************************************
if (NSEL(1) .ne. 0) DERIV(1) = 2. * y1 I PAR(3) c•••••••• ••••••••••••••••••••••••••••••••••••••••••••************************** C** NSEL(2) Non-zero -- CALCULATE DERIVATIVE W/R TO PAR(2) C******************************************************************************
if (NSEL(2) .ne . 0) DERIV(2) = c1 * (L/Pi - G•Sln2Pi) c••**************************************************************************** C** NSEL(3) Non-zero -- CALCULATE DERIVATIVE W/R TO PAR(3) C******************************************************************************
if (NSEL(3) .ne . 0) then DL = 2./(PAR(3)•( .5/X + 2 . •X)••2)

DG = G • C8ln2 • X2 I PAR(3) DERIV(3) =
- 194 -
1 c1 * ((PAR(2)•DLIPi + (1.-PAR(2))•DG•Sln2Pi) - y1 I PAR(3)) end if RETURN END

-195 -
Graphics Programs
3.1 The QUIC package
[BHT.LASER]QUIC.DOC QUIC -- Graphics for the QMS/Talaris Laser Plotter ==================================================
Yet another package for doing graphics on XHMEIA is available . The laser plotter has a very powerful graphics language, called QUIC which has capabilities for shading, automatic generation of circles, sophisticated lettering , user definable fonts and numerous other features . Users who wish to use simple, error-resistant, graphics routines for the laser plotter, will be better off using the QMSPLOT package, which does not make use of many of QUIC features (for example it does lettering by drawing the letters with vectors!) . However, for more demanding applications the loss of versatility and speed from QMSPLOT may be intolerable. Or, the size of the "qms" files produced by QMSPLOT may be much larger than acceptable.
As an alternative to use of QMSPLOT a library for functions, QUIC has been prepared to allow simple use of many QUIC features. Alas, the two packages cannot be used together (mostly because QMSPLOT is very badly designed) . The QUIC routines are very fast, but require that the user know something about the quic language (see the QMS QUIC Programming Manual, next to the plotter). As an example of it's power, a fairly complex graphics program for the Versatec was relinked to QMSPLOT and produced "qms" files averaging greater than 10,000 blocks per page and took 20 minutes (or more) per page to print . The program was redesigned around the QUIC package using specially designed fonts, the resulting "qma" files were reduced to 60 blocks/page and print in well under a minute.
The QUIC routines do not perform any error checking. It is the users responsibility to feed them meaningful parameters and to be sure that commands are given in the proper sequences (e.g. do not do vector plotting before turning vector mode on). Nor do the routines currently allow access to all QMS features . Additions of more routines to the library is strongly encouraged.
All output is buffered, to optimize the number of characters per line sent to the plotter. Brief descriptions of the routines follow; for more detail look as the library source code and consult the QUIC manual.
Subroutine QINI(ini,LUNI , orient,fname) Used to start and atop plotting and to start a new page .
Subroutine QARC(x,y,r,ia1,ia2,iw) Used to generate an arc or circle
Subroutine QLBL(x,y,r,n,arr,id) Used to generate labels of adjustable sized lettering .
Subroutine QTONE(x,y,ip) Used to fill an enclosed area with a fill pattern
Subroutine QVEC(in,ipen) Used to enter/leave vector plotting mode
Subroutine QVMOV(x,y,in,im) Used to move/draw/erase while in vector mode
Subroutine QAPOS(r,im) Used for absolute positioning when not in vector mode
Subroutine QBUFF(NCHR,ENTRY,iclear) Used to buffer output from the above routines
Subroutine QFNT(iact,ftno,orient,ver,fnam,glyh,bas)

- 196 -
Used to select/delete and define fonts
Subroutine QFDEF(iact,char , qlyw,bitmh,bitmw , voff,hoff) Used to prepare plotter to receive bit mapa defining characters when loading fonts into the plotter .
Two sample programs which demonstrate the usage of these routines :
QDEMO - QUIC graphics demonstration . FONTDEN - Demonstration of simple font design and printing .
Comments and questions are welcome, suggestions for improvmenta will be are also welcome, provided the person suggesting ia willing to make the appropriate changes himaelf/herself .
Brian Toby (XHMEIA: :BHT) 6/16/86
[BHT.LASER]QUIC.FOR C***************************************************************************** c • C Routines to create QUIC commands for a TALARIS 800 Laser Printer • c • C Brian Toby June 1986 • c • C!****************************************************************************
c c c c c c c c c c
SUBROUTINE QTONE(x,y,ip)
Subroutine to generate a QUIC command to fill an area with a pattern on Talaris Laser Printer. (x,y) may be any point inside the area to be filled.
Parameters : x interior point meaaured from left margin y interior point measured from top margin ip fill pattern number (integer between 0 and 24)
C All of the above parameters are REAL, except ip which is INTEGER c•••••••••••••••••••••••••••••••••••••••••••••••••••••••••••••••••••••••••••••
701
include 'quic.cmn' ix = (1000. * x) + 0.6 iy = (1000. * y) + 0 . 6 encode (18 , 701,buff) ix,iy,ip format ('-LAF',2I6 . 6,i2 . 2,'-G')
CALL qbuff(18,buff,O) return end
C!****************************************************************************
c c c c c c c c c c c c c c
SUBROUTINE QARC(x,y,r,ia1,ia2,iw)
Subroutine to generate a QUIC command to draw an arc on the Talaris Laser Printer. (x,y) will be the focus of the arc (which need not lie on the page.) To draw a circle set ia1 = ia2
Parameters: x arc center measured from left margin (inches) y r ia1 ia2 iw
arc center measured from top margin (inches) radius of arc center (inches) starting angle for are (degrees from x axis)
= ending angle for arc (degrees from x axis) width of are in dots (odd integer between 3 and 31)
C x,y,r are REAL, ia1,ia2 , iw are INTEGER

-197-
C***************************************************************************** include 'quic . cmn' ix (1000. * x) + 0.6 iy = (1000 . * y) + 0 . 6 ir = (1000. * r) + 0 . 6 encode (28,701 , buff) ix,iy,ir , ia1,ia2,iw
CALL qbuff(28,buff,O) 701 format ('-LA',3I6.6 , 2i3.3,i2 . 2,'-G')
return end
C!**************************************************************************** SUBROUTINE QLBL(x,y,r,n,arr,id)
c c c c c c c c c c c c c c c c
Subroutine to generate QUIC labeling
Parameters : x height of letters (inches) y width of letters (inches) r distance from previous pass (inches) n number of characters to be printed arr BYTE array of characters id direction
1 for horizontal 2 for vertical - right 3 for vertical - left 4 for horizontal - upside down
if id is negative, decenders are turned
· C x,y,r are REAL, n,id are INTEGER
off
C***************************************************************************** include 'quic.cmn'
701
c
byte arr(1),dir(4) data dir/ ' M'. •v•. 'E' . •u• I ix = (100. * x) + 0 . 6 iy = (100 . * y) + 0.6 ir = (1000. * r) + 0.6 encode (13,701,buff) dir(abs(id)),ix,iy,ir
CALL qbuff(13,buff,O) format(•-•,a1,2i3.3,i6 . 6) if (id . gt . 0) CALL qbuff(3, ·-nL' ,0)
CALL qbuff(n,arr,O) CALL qbuff(2,•--• ,0) return end
C!**************************************************************************** SUBROUTINE QVEC(in,ipen)
c c c c c c c c
Subroutine to enter/leave vector mode
Parameters : in
ipen
= 0 vector mode on <> 0 vector mode off
width of 'pen' in dots (odd integer between 3 and 31)
C in,ipen are INTEGER C*****************************************************************************
include 'quic . cmn' if (in .eq. 0) then
c Vector mode on; pen up; define pen width CALL qbuff(6,'-IGV-U',O)
encode (6,701,buff) ipen 701 format (•-pw' , i2 . 2)
CALL qbuff(S,buff,O) else
c Vector mode off CALL qbuff(4,'-IGE ',O) end if
return
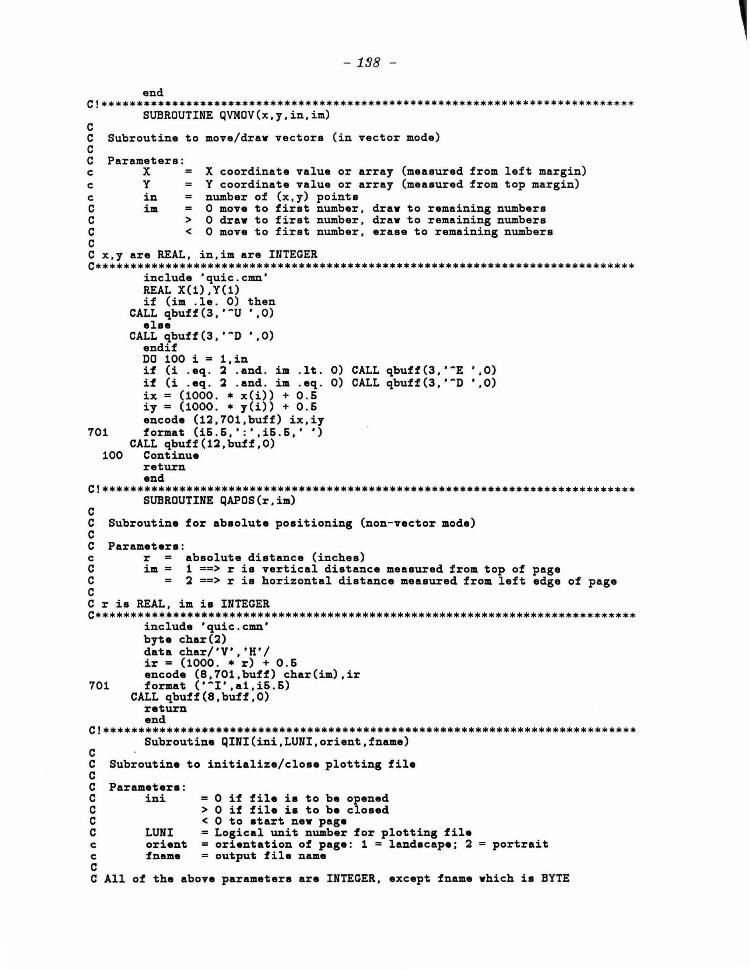
-198 -
end C!****************************************************************************
SUBROUTINE QVMOV(x,y,in,im) c c c c c c c c c c c
Subroutine to move/draw vectors (in vector mode)
Parameters: X y in im
> <
X coordinate value or array (measured from left margin) Y coordinate value or array (measured from top margin) number of (x,y) points 0 move to first number, 0 draw to first number, 0 move to first number,
draw to remaining numbers draw to remaining numbers erase to remaining numbers
C x , y are REAL, in,im are INTEGER C*****************************************************************************
701
100
include 'quic.cmn' REAL X(1), Y(1) if (im . le . 0) than
CALL qbuff(a,•-u ',0) else
CALL qbuff(3 ,'-D ',0) endif DO 100 i = 1,in if (i .eq. ~ .and. im . lt. 0) CALL qbuff(3, •-E ',0) if (i . eq . ~ .and. im .eq. 0) CALL qbuff(a,·-o ',0) ix = (1000 . * x(i)) + 0.6 iy = (1000. * y(i)) + 0.6 encode (1~.701 , buff) ix , iy format (i6 . 6,' :' ,i6 . 6,' ')
CALL qbuff(1~.buff , O) Continue return end
C!****************************************************************************
c c c c c c c c
SUBROUTINE QAPOS(r,im)
Subroutine for absolute positioning (non-vector mode)
Parameters : r absolute distance (inches) im = 1 ==> r is vertical distance measured from top of
~ ==> r is horizontal distance measured from left page edge of page
C r is REAL, im is INTEGER C*****************************************************************************
701
include 'quic.cmn' byte char(~) data char/'V','H'/ ir = (1000 . • r) + 0.6 encode (8,701,buff) char(im),ir format ('-I',a1,i6.6)
CALL qbuff(S,buff,O) return end
C!**************************************************************************** Subroutine QINI(ini,LUNI,orient,fname)
c c c c c c c c c c c
Subroutine to initialize/close plotting file
Parameters : ini
LUNI orient fname
0 if file is to be opened > 0 if file is to be closed < 0 to start new page
Logical unit number for plotting file orientation of page : 1 = landscape; ~ output file name
= portrait
C All of the above parameters are INTEGER, except fname which is BYTE

-199 -
c••••••••••••••••••••••••••*************************************************** include 'quic.cmn' byte char(2),fname(1) byte reaet(16) integer orient data char/'L' ,'P'/ data reaet/'R','e','S', 'e','T', 'r', 'E', 'a', 'E','t' 1 ,'R','e','S','e','T'/
if ( ini) 3 , 1 , 2 C•• Open file and initialize Laser printer 1 LUN = luni
open(unit=LUN,atatus='new' ,carriagecontrol='liat', 1 name=fname) loc = 0 call QHUFF(16,reset,1) call QHUFF(s,•-py--• ,1) call QHUFF(10,'-DFEA-G-IO' ,0) call QHUFF(1,char(orient),O) call QHUFF(38,'-ISYNTAXOOOOO-IFXXOX-IJOOOOO-ITOOOOO-F' ,1) return
C•• Terminate plot and close file 2 call QHUFF(30,'-ITOO-IJOO-IOL-IS1217-IFXXOX-0',1)
call QHUFF(7,•---pN--',1) close (LUN) return
C•• Start new page 3 call QHUFF(4,•---,',1)
return end
C!***************************************************************************** SUBROUTINE QHUFF(NCHR,ENTRY,iclear)
C Subroutine to buffer output c C Parameters: c nchr number of characters to be added to buffer (must be < 132) c 0 do not add any characters, write out buffer c c c c c c
entry
iclear
HYTE array of characters
0 save array in buffer, empty buffer first, if needed <> 0 aa above, plus write out buffer after adding array
C All of the above parameters are INTEGER, except entry which is HYTE c•••••••••••••••••••••••••••••••••••••••••••••••••••••••••••••••••••••••••••••
include 'quic . cmn' HYTE ENTRY(!) INTEGER iclear,nchr if (nchr .eq. 0) goto 120
c•• will current line fit in buffer? 100 IF (loc+NCHR .LE. 132) GO TO 102 c no: empty the buffer
701 write (LUN,701) (line(i),i=1,loc) format (132A1) loc = 0
c yea: line will fit 102 L2=loc+NCHR
110
J=O DO 110 I=loc+1,L2
J=J+1 line(I)=ENTRY(J)
CONTINUE Loc=L2
c Should we clear the buffer before exiting? if (iclear .eq. 0) return (no)
c yea: empty the buffer 120 write (LUN,701) (line(i),i=1,loc)
loc = 0 return END

-140 -
C!**************************************************************************** SUBROUTINE QFNT(iact,ftno , orient,ver,fnam,glyh,bas)
c c c c c c c c c c c c c c c
Subroutine to select/delete/start definition of a font
Parameters: iact
ftno orient ver fnam glyh bas
action to take: 1 define 0 select
-1 delete Font number
font font as default font
orientation of page : 1 = landscape ; 2 = portrait version number (0-0) font name (4 characters) height of glyph (in dots, 300 dots/inch)
= baseline height (in dots)
C All of the above parameters are INTEGER, except fnam which is BYTE C*****************************************************************************
include 'quic.cmn' byte fnam(1),dir(2) integer iact,ftno,orient,ver,glyh,bas data dir/'Y' ,'X'/ if (iact) 000,100,400
c** Select font as default 100 encode (8,101,buff) ftno 101 format('~IS',i6 . 6)
call qbuff(S,buff,O) return
c** Define font 400 encode (20,401,buff) ftno , dir(orient),ver,fnam,glyh,bas 401 format('~DF' , i6.6,a1,i1,a4,2i3.3)
call qbuff(20,buff,O) return
c** Delete font 000 encode (11,001,buff) ftno,dir(orient) 901 format('~DF' , i6.6 , a1, '~G')
call qbuff(11,buff,O) return end
C!**************************************************************************** SUBROUTINE QFDEF(iact,char,qlyw,bitmh,bitmw,voff,hoff)
c c c c c c c c c c c c c c
Subroutine to define characters by of a font
Parameters: iact
char glyw bitmh bitmw voff hoff
action to take: 0 define character in font
-1 end font definition character to be defined (BYTE) width of glyph (in dots, 300 dots/inch) height of bit map (in dots) width of bit map (in dots) vertical offset (in dots) horizontal offset (in dots)
C All of the above parameters are INTEGER, except char which is BYTE C*****************************************************************************
include 'quic.cmn' byte char integer iact,qlyw,bitmh,bitmw,voff,hoff if (iact .ge. 0) goto 000
c** close font definition call qbuff(2,'~G' ,0) return
c** Define font 000 encode (10,001,buff) char,qlyw,bitmh,bitmw,voff,hoff 001 format(', ',z2 . 2,6i3 . 3)
call qbuff(10,buff , O)

return end
- 141 -
[BHT.LASER]QUIC.CMN COMMON /QUIC/ LOC,LUN,LINE,BUFF BYTE LINE(132),BUFF(132) INTEGER LOC,LUN
[BHT .LASER]FONTDEM.FOR INTEGER SIZE,NC(4) INTEGER fta,ftb , hofg,cnum,wofg,bhi,bwi,orient/1/
logical•1 ty(100),tyn(4) data tyn/'A' , 'B','C' ,'D'/
Data fta/0990/,ftb/9998/ DATA SIZE/100/ SIN60 = SIN(3 . 14169/3.)
LUN = 30 C•• START Plot -- landscape mode
call qini(O,LUN,orient,'font.qms') c** define the glyph heigth and width
Hofg = 8.6 * 300. I 70 . ! Font size in dots (300 dots/inch) wofg = hofg ! square font: glyph height is same as width bhi = hofg ! height of bit map (in dots) bwi = hofg ! width of bit map (in dots)
c** define the diameter of a circle in inches SCL = hofg I 300.
C****************************************************************************** C•NOW DEFINE THE FONT SET
call qfnt(1,fta,orient,O,'bht1' ,wofg,O) C* CHAR 41 (A) -- An open circle
call qfdef(O,'A' ,hofg,bwi,bhi,O,O) CALL font(LUN,bhi,bwi,1,2)
C• CHAR 42 (B) -- An open circle and a concentric filled circle call qfdef(O,'B' , hofg,bwi,bhi,O,O)
CALL font(LUN,bhi,bwi,3,6) c** End font definition
call qfdef ( -1) C****************************************************************************** c** Fill page with circles
call qfnt(O,fta) DO 100 N=1,16 ODD = 2 - NOD(N,2) X= (1. - (ODD - 1.)/2.) • eel + 3 . Y = N * SIN60 * eel + 3 .
do 110 n=1, 16 if (NOD(n,3) + odd .ne. 3) then
ty(n) tyn(1) ! Empty Site - Open circle else
ty(n) = tyn(2) Filled Site - Two circles end if
110 continue call qapos(x,2) x coordinate call qapos(y,1) ! y coordinate
CALL qbuff(size,ty,O) CALL qbuff(2,•--• ,0)
100 CONTINUE call qfnt(-1,fta,orient)
CALL qini(1) STOP END
C!**************************************************************************** subroutine font(LUN,nr,nc,ntyp,w)
C**** Program to create PIXEL Array for LASER PRINTER

- 142 -
C* nc is number of columna (bits per row); C* nr is number of rows (bits per column);
integer w byte pixel(60) , ca(16),lpixel(200) data ca/'0','1','2','3', ' 4', '6','6','7','8','0', 1 'A','B','C','D','E ' ,'F'/ ncp = (nc + 16 . )/16 . nch = 4*ncp ncp = 16*ncp
C* ncp is nc after padding to a multiple of 16 C* nch is number of characters per row
type *,nc,nr , ncp,nch c** Now for the "rule" to determine the pattern
cnc = (nc+1.) /:2 . cnr = (nr+1.)/2 . do 100 j=1,nr do 200 i=1,ncp lpixel (i) = 0 if (i .gt. nc) goto 200 r = sqrt((i-cnc)**2 + (j-cnr)**2)
C* -- An open circle if (ntyp . lt . 4 . and. r . le. cnc . and. r .gt. cnc-2) 1 lpixel(i) = 1
c** Now for the "rule" to determine the pattern goto (200,92,93,94,96,96,200) ntyp goto 200
C* Cross 02 if (abs(i-cnc) . le . w .or. abs(j-cnr) .le . w) lpixel(i) 1
goto 200 C* Concentric circles 93 if (r .le. (nc•w/20.)) lpixel(i) = 1
goto 200 C* A horizontal line 04 if (abs(j-cnr) . le . w*.6) lpixel(i) 1
goto 200 C* A upward line 96 if (abs(j-cnr) . gt . (nr+3.)/4 . . or. abs(i-cnc) . gt . (nr+6 . )/6 . )
1 goto 200 yc = (1 . /sqrt(3.))*j + 1. if (abs(yc-i) . le. w•.68) lpixel(i) = 1 goto 200
C* A downward line 96 if (abs(j-cnr) .gt. (nr+3.)/4 . . or . abs(i-cnc) . gt . (nr+6 . )/6 . )
1 goto 200 yc = nc ~ (1 . /sqrt(3.))*j if (abs(yc-i) . le . w• . 68) lpixel(i) 1
200 continue type 1,(lpixel(i) , i=1,ncp)
1 format(1x,100i1)
do 400 i=1,ncp,4 num = 1 + lpixel(i)*8 + lpixel(i+1)*4 + lpixel(i+2)*2 1 + lpixel(i+3) pixel((i-1)/4+1) = ca(num)
400 continue CALL qbuff(nch,pixel,O)
type 2,(pixel(i),i=1,nch) 2 format(1x,20a1)
100 continue return end

-149 -
[BHT.LASER]QDEMO.FOR c****************************************************************************** c QUIC demo program Brian Toby, June 1986 c******************************************************************************
integer orient/1/ real x1(6)/6. ,6. ,7.6,7.6,6./,y1(6)/1.,2.6,2.6,1.,1./ real x2(3)/Q.,8. ,10./,y2(3)/1 . ,2.6,2.6/ real x3(2)/4 . 6,6 . 6/,y3(4)/1 . 6,2.6,2.6,1.6/ real x4(2)/2.76,4 .6/,y4(2)/2. ,2./ LUN = 30 ! Logical device # for plot file
C** START Plot -- landscape mode (Xmax>Ymax) call qini(O,LUN,orient,'qdemo.qms')
C** Draw two overlapping circles call qarc(~ .. ~ . • 1 ., 0,0,3) call qarc(3.6,2 . ,1.,0,0,17)
C** Shade area where circles overlap
thin border thicker border
call qtone(~.76,~ .• 24) ! (any point in region , pattern #24) C** Shade area of second circle
call qtone(3.76,~.~.19) ! (any point in region, pattern #19) c** Move to (1.,4.) and label with QUIC letters
call qapos(1 .• ~) ! x coordinate call qapos(4 . ,1) ! y coordinate call qlbl(0 . ~6,0.4,0. ,22,'This is QUIC lettering' ,1)
C** Now draw some things in vector mode call qvec(0,6) ! enter vector mode - thin line call qvmov(x1,y1,6,0) ! draw a square - move first call qvec(0,16) ! enter vector mode - thicker line
C** "Erase" a line partly through the overlapping cicrles call qvmov(x4,y4.~,-1) call qvmov(x2(3),y2(3),1,0) ! draw a triangle- move to last point call qvmov(x~.y2,3 , 1) ! draw a triangle - draw only
C** The following is an example of how to enter a QUIC command which does C** not have a subroutine defined for it
CALL QBUFF(3,'AV6' ,0) ! SET LINE PATTERN TO TYPE #6 call qvmov(x3,y3.~.0) ! draw an X piece #1 call qvmov(x3,y3(3).~,0) ! draw an X piece#~ call qvec(1) ! exit vector mode
c** Move to (1.,8.) and label with QUIC letters call qapos(1.26.~) ! x coordinate call qapos(6.6,1) ! y coordinate
C** More QUIC lettering, no decenders this time call qlbl(1 . 6, .7,0.,12,'QDEMO sample' ,-1)
C** END Plot CALL qini(1,LUN) STOP END

-144 -
3.2 Program MAP
[BHT.N2.LASERJMAP.FOR c••••••••••••••••••••••••••••••••••••••••••••••••••••••••••••••••••••••••••••• C**************************************************************************** * C**** ***** C**** PROGRAM TO MODEL N DESORPTION ON Ru(0001) ***** C**** ~ ***** c•••• ***** C•••• Program to plot mapa on Laser Plotter - - Brian Toby 6185 ***** c•••• ••••• c••••••••••••••••••••••••••••••••••••••••••••••••••••••••••••••••••••••••••••• c••••••••••••••••••••••••••••••••••••••••••••••••••••••••••••••••••••••••••••• C••
INTEGER•~ HEX(100,100) INTEGER SIZE,ODD,INT(8,7),NC(4)
c INTEGER NEARN(6),NEARN(6,2),NEXTN(6),NEXTN(6 . ~) REAL BETA,NU,NUO,E,R,T,NAAVG ,LCTP,CHI REAL CDESPL(20),EDESPL(20),TDESPL(20) byte TITLE(7~) INTEGER fta,ftb,hofg,cnum,wofg,bhi,bwi,orientl11
logical•1 ty(100),tyn(4) data tyni'A','B','C','D'I
Data ftaiOOOOI,ftbi0998I DATA HEXI10000•0I,SIZEI100I
c DATA NEARNI-1,-1,0,0,1,11 c DATA NEARNI0 , 1,-1,1,0,1,-1,0,-1,1 , -1,0I c DATA NEXTMI-~.-1,-1,1,1,~1 c DATA NEXTNI0,-1.~.-1.~.0.0,-~.1.-~.1.01
DATA CDESPLI20•-1.I,EDESPLI20•-1.I , TDESPLI20•-1 .1 DATA icd,ied,itdl3•11 R30~ = SQRT(3 . )1~ . SIN60 = SIN(3 . 14150I3 . )
LUN = 30 C•• START Plot -- landscape mode
call qini(O,LUN,orient,'map.qms') READ (0.~1.ERR=211) SIZE,ED,EN,EA,ER,EM,SO,CHI,TS,
1 DSBINT,IR , (TITLE(i),i=1,72),LCTP,E,EO,NAAVG,DT,A,NUO,BETA 21 FORNAT(I5,6F10 .6,I , 3F10 . 3,I12,I,72A1,I,F10 . 1,2F10.6,F6 . 2,
1 F6.4,F6.~,1PEO . ~.F6 . 1) C*** 211 RATIO = ER I min(EA , 1.)
VRITE(6,20) (TITLE(i),i=1,72),SIZE,SIZE,abs(ED),EN,ER,EA 1 ,RATIO,EM , SO,CHI,TS,IR
29 FORNAT(I , 1X,7~('*'),1,1X,72A1,I,1X,72('*'),11' LATTICE IS' ,I4, 1 ' BY', I4./,' DESORPTION ENERGY: ', 2 F5.3,l,' DESTABILIZATION ENERGY FOR FILLED SITE : ' ,F6 .3 , I, 3 'REPULSIVE INTERACTION ENERGY:' ,F6.3,I, 4 'ATTRACTIVE INTERACTIVE ENERGY:' ,F6.3,I, 5 'ER I EA: ',F5.3 , I,' MIGRATION ENERGY: ',F7 .4,I, 6 ' INITIAL STICKING COEFFICIENT: ',F6.4,1,' CHI = ',F12.5, 7 I,' ADSORPTION TEMPERATURE:' ,F6 .1,I, 8 'RANDOM STARTING POINT :' ,I10,II)
NPLT = -1 icir = 7 ilin = 8
READ (6,•) icir,ilin type * , 'Enter 0 to process all spectra, 1 to select by coverage' READ (6,•) iall IF (IALL . EQ . 0) THEN
WRITE (6,014) 014 FORMAT(' PLOT ALL NAPS' ,I)
ELSE write (6,•) 'Enter map coverages' READ (6,•,END=100) (CDESPL(I),I=1,20)
100 write (6,•) 'Enter map exposures' READ (6,• ,END=200) (EDESPL(I),I=1 , 20)
209 write (6,•) 'Enter map times'

399
- LJ5 -
READ (6,•,END=399) (TDESPL(I),I=1,20) END IF
continue c** define the glyph heigth and width in terms of the number of sites
Hofg = 8 . 6 * 300 . I size ! Font size in dots (300 dots/inch) wofg = hofg ! square font: glyph height is same as width bhi = hofg ! height of bit map (in dots) bwi = hofg ! width of bit map (in dots)
c•• define the diameter of a circle in inches SCL = hofg / 300.
C****************************************************************************** C•NOW DEFINE THE FONT SET
call qfnt(1,fta,orient,O,'bht1' , wofg,O) C• CHAR 41 (A) -- An open circle
call qfdef(O,'A',hofg,bwi,bhi,O,O) CALL font(LUN,bhi,bwi,1,2)
C• CHAR 4~ (B) -- An open circle and a concentric filled circle call qfdef(O,'B',hofg,bwi,bhi,O,O)
CALL font(LUN,bhi,bwi,3,icir) c** End font definition
call qfdef(-1) C****************************************************************************** c•• define the glyph heigth and width in terms of the number of sites
Hofg = ~ . *sin60•hofg ! Font size in dots (300 dots/inch) wofg = 3•wofg ! glyph width is three times height bhi = hofg ! height of bit map (in dots) bwi = wofg ! width of bit map (in dots)
c** define the width of the connecting line through filled sites : iwidth = ilin * 100 . / size
C****************************************************************************** C•NOW DEFINE THE FONT SET
call qfnt(1,ftb,orient,O,'bht2' ,hofg,O) C• CHAR 41 (A) -- A blank
call qfdef(O,'A' ,wofg,bwi,bhi,O,O) CALL font(LUN,bwi,bhi,7,0)
C• CHAR 4~ (B) -- An horizontal line call qfdef(O,'B' ,wofg,bwi,bhi,O,O)
CALL font(LUN,bwi,bhi,4,iwidth) C• CHAR 43 (C) -- An upward sloping line
call qfdef(O,'C' , wofg,bwi,bhi,O,O) CALL font(LUN,bwi,bhi,S,iwidth)
C• CHAR 44 (D) -- An downward sloping line call qfdef(O,'D' ,wofg,bwi,bhi,O,O)
CALL font(LUN,bwi,bhi,6,iwidth) c•• End font definition
call qfdef(-1) C****************************************************************************** C*** ! IF (IALL . ne. 0) then
TYPE *,'Enter COVT' READ (S,•,END=OOO) COVT
end if C****************************************************************************** C•• NOW READ IN MATRIX 1000 if (CDESPL(ICD) .eq. -1 .and. eDESPL(IeD) .eq. -1 .and.
1 tDESPL(ItD) . eq . -1 . and . iall .ne . 0) goto 999 READ (0,01~,END=OOO) imore,cov , expos,time if (imore . eq . 0) goto 090
912 FORNAT(1X,I6,f6.3,f11 . 3,f11.1)
DO 3000 I = 1, SIZE READ (0,911,END=090) (HEX(I,J),J=1,SIZE)
011 FORNAT(1X,100I1) 3000 CONTINUE
C•• NPLT = NPLT + 1 NADS = 0 DO 110~ M=1,SIZE

- 146 -
DO 1102 N=1,SIZE IF (HEX(M,N) . NE. 0) NADS = NADS + 1
1102 CONTINUE COV = (1.•NADS)/SIZE••2
1103 WRITE (6,34) COV,expoa,time 34 FORMAT(//,' COVERAGE= ',F6.3, ' , EXPOSURE= ',F10 . 2,
1 ',TIME= ',F11.1) IF (IALL .EQ. 0) THEN
IFLAG = 1 ELSE
IFLAG = 0 IF (ABS(COV - CDESPL(ICD)) .le . 0 .011) THEN
IFLAG = 1 ICD = ICD + 1
end if IF (ABS(expoa/eDESPL(IeD)-1) .le. 0.05) THEN
IFLAG = 1 IeD = IeD + 1
end if IF (ABS(time/tDESPL(ItD)-1 . ) . le . 0 . 05) THEN
IFLAG = 1 ItO = ItO + 1
end if end if IF (IFLAG .NE . 1) goto 1000
write (6,•) 'PLOTTING MAP' call qapoa(Q . 75 , 2) ! x coordinate
IF (ED . GT. -1) then encode (5Q,731,ty) cov,expoa,time
731 format('ADSORBED TO',F5.2,', EXPOSURE =',F5.1,'L, TIME=', 1 1PG11 .4,' Sec' ) call qapoa( . 5,1) ! y coordinate call qlbl(0.12 , 0 . 12,0 . ,5Q,ty,3)
ELSE call qapoa(6 . ,1) ! y coordinate encode (16 , 701,ty) 'DESORBED TO' ,cov
701 format(A,F5 . 2) call qlbl(0.15,0 . 15,0 . ,16 , ty,3)
END IF c•• Fill page with circles ·
call qfnt(O,fta) DO 100 M=1,SIZE ODD= 2 - MOD(M , 2) X= (1. - (ODD - 1 . )/2 . ) • acl + 0 . 5 Y = M • SIN60 * acl + 0 . 25
do 110 n=1, size IF (HEX(M,N) .EQ . 0) then
ty(n) = tyn(1) ! Empty Site - Open circle alae
ty(n) = tyn(2) Filled Site - Two circles end if
110 continue call qapos(x,2) x coordinate call qapoa(y,1) ! y coordinate
CALL qbuff(size,ty,O) CALL qbuff(2 , 'A-• ,0)
100 CONTINUE call qapoa(3.,1) · 1 y coordinate call qapos(10.26,2) ! x coordinate call qlbl(0 . 1,0.1,10.5,72 , title,3)
c• • Fill page with horizontal linea call qfnt(O,ftb)
DO 200 M=1,SIZE ODD = 2 - MOD(M,2) nO = 1 if (odd . eq . 2) nO = 3 X= (nO - 1. - (ODD - 1 . )/2 . ) * acl + 0 . 5
-141-
Y = M • SIN60 • scl - (SIN60-0 . 5) • scl + 0 . 25 ip = 0 do 210 n=n0,size,3 ip = ip + 1
IF (HEX(M,N) .EQ . 0) then ty(ip) tyn(1) Empty Site - no line
else ty(ip) = tyn(2) Filled Site - line
endi:f 210 continue
call qapos(x,2) x coordinate call qapoa(y,1) y coordinate
CALL qbuff(ip,ty,O) CALL qbuff(2,'A-• ,0)
c•• Fill page with upward linea nO = 2 if (odd .eq. 2) nO = 1 X= (nO - 1. - (ODD - 1 . )/2 . ) • scl + 0.5
ip = 0 do 220 n=n0,aize,3 ip = ip + 1
IF (HEX(M,H) .EQ. 0) then ty(ip) tyn(1) Empty Site - no line
else ty(ip) = tyn(3) Filled Site - line
endif 220 continue
call qapoa(x,2) x coordinate call qapoa(y,1) y coordinate
CALL qbuff(ip,ty,O) CALL qbuff(2, •A-• ,0)
c•• Fill page with downward linea nO = 3 if (odd .eq. 2) nO = 2 X = (nO - 1 . - (ODD - 1.)/2. ) • acl + 0.5
ip = 0 do 230 n=n0,aize,3 ip = ip + 1
IF (HEX(M,N) .EQ. 0) then ty(ip) tyn(1) ! Empty Site - no line
else ty(ip) = tyn(4) Filled Site - line
end if 230 continue
call qapoa(x,2) x coordinate call qapoa(y,1) y coordinate
CALL qbuf~(ip,ty,O) CALL qbuff(2,•A-• ,0)
200 CONTINUE
IF (IALL .HE. 0) then type •,•Enter coverage• READ (6,•,end=OOO) COVT
! endif C•• START HEW PAGE
CALL qini(-1) GOTO 1000
c• Delete font 000 call qfnt(-1,fta,orient)
call qfnt(-1.ftb,orient) CALL qini(1)
013 STOP END
C!••••••••••••••••••••••••••••••••••••••••••••••••••*************************** subroutine font(LUH,nr,nc,ntyp,w)
C**** Program to create PIXEL Array for LASER PRINTER

- 148 -
C* nc is number of columns (bits per row); C* nr is number of rows (bits per column);
integer w byte pixel(60),ca(16),lpixel(200) data ca/'0', '1', '2', '3', '4', '6 ' , •e•, '1', '8', •g•, 1 'A' , 'B ' ,'C','D','E' , 'F ' / ncp = (nc + 16 . )/16 . nch = 4•ncp ncp = 16*ncp
C• ncp is nc after paddi ng to a multiple o£ 16 C• nch is number of characters per row ! type *,nc,nr,ncp,nch c** Now for the "rule" to determine the pattern
cnc = (nc+1 . )/2 . cnr = (nr+1.) /2 . do 100 j=1,nr do 200 i=1,ncp lpixel(i) = 0 if (i .gt . nc) goto 200 r = sqrt((i-cnc)**2 + (j-cnr)**2)
C* -- An open circle if (ntyp . lt. 4 . and . r . le . cnc . and . r . gt. cnc-2) 1 lpixel(i) = 1
c** Now for the "rule" to determine the pattern goto (200,92,93,94,96,96,200) ntyp goto 200
C* Cross 92 if (abs(i-cnc) .le. w . or. abs(j-cnr) .le . w) lpixel(i) 1
goto 200 C• Concentric circles 93 if (r .le. (nc•w/20 . )) lpixel(i) = 1
goto 200 C* A horizontal line 94 if (abs(j-cnr) . le. w• . 6) lpixel(i) = 1
goto 200 C• A upward line 96 if (abs(j-cnr) .gt. (nr+3 . )/4 . . or . abs(i-cnc) . gt . (nr+6.)/6 . )
1 goto 200 yc = (1 . /sqrt(3 . ))•j + 1 . if (abs(yc-i) . le . w•.68) lpixel(i) = 1 goto 200
C* A downward line 96 if (abs(j-cnr) . gt. (nr+3.)/4 .. or. abs(i-cnc) . gt. (nr+6.)/6.)
1 goto 200 yc = nc - (1 . /sqrt(3.))•j if (abs(yc-i) . le. w• . 68) lpixel(i) = 1
200 continue type 1,(lpixel(i),i=1,ncp)
1 format(1x,100i1)
do 400 i=1,ncp , 4 num = 1 + lpixel(i)•8 + lpixel(i+1)•4 + lpixel (i+2)*2 1 + lpixel(i+3) pixel((i-1)/4+1) = ca(num)
400 continue CALL qbuff(nch,pixel,O) ·type 2,(pixel(i) , i=1,nch)
2 format(1x,20a1)
100 continue return end

- 149 -
3.3 Programs 3A, 3D, 3DR and 3DV
[BHT.N2.AVGJ3A.FOR
C***************************************************************************** C***************************************************************************** C**** ***** C**** PROGRAM TO MODEL N ADSORPTION ON Ru(0001) ***** C**** 2 ***** C**** ***** C**** Using true Monte-Carlo type model ***** C**** ***** C**** BRIAN TOBY 6/86 ***** C**** ***** C**** Plot results from array processor program ***** C**** State analysis of adsorbed molecules as a function of T ***** C***************************************************************************** C***************************************************************************** c••
C••
INTEGER SIZE,SIZA(10),NP(10),int(7),ndm(7,7) ,ndmt(7,7) INTEGER nr(40),na(40) REAL TEMP ( 100) INTEGER NI(7,7),TNIN,TMAX,nd(7,7 , 100),ndt(100) REAL BETA,E,R,TS,NAAVG,LCTP,CHI,nuO
BYTE NAM(3) ,FNAM(60),TITLE(72) INTEGER TYP
LUNN = 10 LUN = LUNM SUMSIZE = 0
TYP = 10 C******************************************************************************
DO 410 J=1,10 type *,'Enter File: • READ (6,701 ,END=060) HAM
701 FORMAT(3A1) ENCODE(16,702,FNAM) TYP , NAN
702 FORMAT('INP :FOR ', I3 .3,'. ',3A1,1X) OPEN(UNIT=LUN,ERR=060,FILE=FNAM,TYPE='OLD')
READ(LUN,121,END=060,ERR=060) SIZE,ED,EN,EA,ER,EM,SO,CHI, 1 TS,DSBINT,IR,TITLE,LCTP,E,EO,NAAVG,DT,A,NUO, 2 BETA
121 FORMAT(I6,6F10.6,/,3F10.3,I12/,72A1,/,F10.1,2F10.6,3F6.2, 1 1PE0.2,F6 . 1) SIZA(J) = SIZE SUMSIZE = SUNSIZE + SIZA(J)••2
20 FORMAT(/,' File#' ,I3 , ' = ' ,16A1 A ,/,' ',72('•'),/,1X,72A1,/,1X,72('*') 1 ,/' LATTICE IS' ,I4,' BY' ,I4,/,' DESORPTION ENERGY: ', 2 F6 .3,/,' DESTABILIZATION ENERGY FOR FILLED SITE:' ,F6.3,/, 3 ' REPULSIVE INTERACTION ENERGY:' ,F6.3,/, 4 ' ATTRACTIVE INTERACTIVE ENERGY:' ,F6.3,/, 6 'MIGRATION ENERGY: ',F7.4,')' ,/, 6 ' INITIAL STICKING COEFFICIENT: ' ,F6 .4,/, 7 ' CHI= ',F12 .6,/,' ADSORPTION TEMPERATURE : ',F6.1,/ 8 'RANDOM STARTING POINT : ' ,I10,//)
TYPE 20,LUN,(FNAM(I),I=1,16),TITLE, SIZE,SIZE 1 ,ABS(ED),EN,ER,EA,EM,SO,CHI,TS,IR
LUN = LUN + 1 WRITE (6,128) EO,DT,NUO,A,BETA
128 FORMAT(' ISOLATED N2 ATTRACTION IS E = ', 3 F6 .3,' (Kcal)',/,' TEMPERATURE INCREMENT' ,F8.4,/,1X, 4 'PREFACTOR:' ,1P1E0.2,' * EXP(' ,OPF6.2, 6' * COV)' , /,' BETA:',F6 . 1.//)
410 CONTINUE 060 IF (LUN .EQ. LUNM) GOTO 2000
LUN = LUN - 1 C****************************************************************************** C** NOW READ IN STATES TO BE TRACKED FROM FILE 4

-150 -
NSTATE = 0 OPEN(UNIT=4,ERR=3999,FILE='state .dat' ,TYPE='OLD') DO 38~ K=1,30
read (4,•,end=381) NA(K),NR(K) natate = natate + 1
382 CONTINUE C** REORDER STATES BY INCREASING ENERGY 381 DO 380 K=1,natate
DO 380 J=K+1,natate if (NA(K)•EA- NR(K)•ER .LE. NA(J)•EA- NR(J)•ER) GOTO 380 I = NA(K) NA(K) = NA(J) NA(J) = I I = NR(K) NR(K) = NR(J) NR(J) = I
380 CONTINUE C****************************************************************************** C** NOW READ IN POINTS FROM FILE
1100 N~ = 0 COVP = 0.0 SUNSIZE = 0 TP = 0.0
DO 420 L=LUNN,LUN C SKIP OVER FILE IF IT HAS ENDED ALREADY
IF (SIZA(1+L-LUNN) .EQ. 0) GOTO 420 READ (L,125,END=969) NP(1+L-LUNN),COVO,nads0
C TYPE •,l,np(1+1-lunm),' COVERAGE' ,COVO 125 FORNAT(I5,F8 .4,I7)
N2 = max(N2,NP(1+L-LUNN))
IF (L . NE . LUNN .AND . ABS(COVO-COVP) .GT . 0.0~) THEN TYPE *,'ERROR WRONG COVERAGE' ,L,COVO,COVP STOP
ELSE COVP = COVO
END IF SUNSIZE = SUNSIZE + SIZA(1+L-LUNN)••2 GOTO 420
C END OF FILE -- SKIP OVER FILE NEXT TINE 969 SIZA(1+L-LUNN) = 0
CLOSE(L) 420 CONTINUE
C IF SUNSIZE IS ZERO THEN ALL FILES ARE NOW EMPTY IF (SUNSIZE .EQ. 0) goto 1999 NPLT = NPLT + 1 mdes = 0
ICOV = 100 * COVO NDSB = 0
C****************************************************************************** C*** NOW READ IN T AND DESORPTION STATE DATA
DO 400 K=1,N~ if (k .gt. 3) TENP(K) = 2 . •TENP(K-1) - TENP(K-2) NDT(k) = 0 clear total per T increment DO ~01 I=1,7 DO 201 J=1,7 ND(i,j,k) = 0 clear state counter
201 CONTINUE
DO 202 L=LUNN,LUN C SKIP OVER FILE IF IT HAS ENDED ALREADY OR IF WE HAVE READ ALL C POINTS FROM THIS TDS SCAN
IF (SIZA(1+L-LUNN) .EQ. 0 .or. NP(1+L-LUNN) .EQ. 0) GOTO 202 READ (L, 124) TP
124 FORNAT(F6 . 2)

- 151 -
c** Is this T < 0 IF (TP .lt . 0.) THEN
NP(l+L-LUNN) = 0 ! prevent reading more points from current file goto 202
END IF IF (L . NE. LUNN .AND . ABS(TEMP(K)-TP) . GT. 0 . 1) THEN
TYPE * • 'ERROR WRONG TEMPERATURE ' ,K,L,TENP(K),TP STOP
END IF TENP(K) = TP READ (L,126) ((NI(I,J),I=1,7),J=1,7)
126 FORNAT(716) DO 202 1=1,7 DO 202 J=1,7
ndt(k) = ndt(k) + NI(I,J) desorbed per T increment nd(i,j,k) = nd(i,j,k) + NI(I,J) desorbed by state
202 CONTINUE ndsb = ndsb + ndt(k)
400 CONTINUE
nads = ndt(1) ! total adsorbed type 770,nads/sumsize,nads
770 format('Oaveraged coverage:' , f7 .3,', total adsorbed : ' ,i6,/)
DO 302 1=1,7 DO 302 J=1,7
ndm(i,j) = nd(i,j,1) 302 CONTINUE
n1 = 0 DO 206 :l=2,N2 ndtrk = 0 DO 360 j=1,nstate
ndtrk = ndtrk + ND(NA(j)+1,NR(j)+1,k) 360 CONTINUE
if (ndt(k) .ne . 0 . ) type 771, 1 temp(k),ndtrk,ndt(k),ndt(k)/sumsize,(100.*ndtrk)/ndt(k)
771 format(1x,f4 . 0,2i7 , 2f7.2) DO 206 I=1,7 DO 206 J=1,7
ndm(i,j) = max(nd(i,j,k),ndm(i,j)) 206 CONTINUE
DO 6 J=1,7 INT(J) = ndm(1,J) + ndm(2,J) + ndm(3,J) + ndm(4,J) + ndm(6,J) +
1 ndm(6,J) + ndm(7,J) 6 CONTINUE
WRITE (6,30) 'Maximum number', (I-1,I=1,7),0 1 ,(ndm(I,1),I=1,7),int(1)
30 FORMAT(/,23X,a,' of molecules by interactions', 1 /,30X,'NUNBER OF ATTRACTIVE INTERACTIONS',/ 2 20X,7I6,' TOTAL',/, ' NUMBER OF',/, 3 ' REPULSIVE ' , 16,2X,816)
33 FORMAT(12X,I6,2X,8I6) DO 32 J=2,7 IF (INT(J) .NE. 0) WRITE (6,33) J-1,(ndm(I,J),I=1,7),int(j)
32 CONTINUE DO 7 J=1, 7 INT(J) = nd(1,J,1) + nd(2,J,1) + nd(3,J,1) + nd(4,J,1) +
1 nd(6,J,1) + nd(6,J , 1) + nd(7,J,1) 7 CONTI!IUE
WRITE (6,30) '#(at start)' ,(I-1,I=1,7),0, 1 (nd(I , 1 , 1),I=1,7),int(1)
DO 34 J=2,7 IF (INT(J) . HE . 0) WRITE (6,33) J-1,(nd(I,J,1),I=1,7),int(j)
34 CONTINUE
type 322,'Natt' ,(NA(k),k=1,nstate) type 320,'Nrep' , (Nr(k),k=1,nstate) type 320,'Dsta',(ND(NA(k)+1,NR(k)+1,1),k=1,nstate)

-152 -
type 320, 'Dmax ' ,(NDN(NA(k)+1,NR(k)+1),k=1 ,nstate) type 321, 'E', (NA(K)•EA - NR(k)•ER,k=l,natate)
322 format(//,1x,a4,1x,20i6,: ,/,3x,20i6) 320 format(1x,a4,1x,20i6,: , /,3x,20i6) 321 format(1x,a4,1x,20f6 . 2,/, :, 3x,20£6.2)
C** NOW OPEN FILE 2 -- T VS. Ndsb for selected states ENCODE(16,704,FNAN) NAN,ICOV,'DAT'
704 FORNAT('OUT:' ,3A1,'A',I2.2,' .' ,A3,1X) OPEN(UNIT=2,FILE=FNAN,TYPE='NEW' ,FORN='FORMATTED') nsize = sqrt(sumaize) write (2,323) natate,nsize write (2,323) (NA(k),k=1,nstate) write (2,323) (Nr(k),k=l,natate) write (2,323) (ND(NA(k)+1,NR(k)+1,1),k=1,nstate) write (2,323) (NDN(NA(k)+1,NR(k)+1),k=1,nstate) write (2,324) (NA(K)•EA - NR(k)*ER,k=1,nstate)
323 format(30i6) 324 format(30f6.2)
DO 330 IC=1,N2 write (2,341) temp(k),(ND(NA(i)+1,NR(i)+1,k),i=1,nstate) if (ndt(k) .ne . 0) 1 type 340,temp(k),(ND(NA(i)+1,NR(i)+1,k),i=1,natate)
c type 340,temp(k),(ND(NA(i)+1,NR(i)+1,k),i=1,natate) 340 format(1x,f6.0,20i6, : ,/,3x,20i6) 341 format(f6 .0,20i6)
330 CONTINUE close (2)
GOTO 1100 1000 continue 2900 continue 3900 STOP
END
[BHT.N2.AVG]3D.FOR C***************************************************************************** C***************************************************************************** C**** ***** C**** PROGRAM TO MODEL N ADSORPTION ON Ru(0001) ***** C**** 2 ***** C**** ***** C•*** Using true Monte-Carlo type model ***** C**** ***** C**** BRIAN TOBY 6/86 ***** C**** ***** C**** Plot results from array processor program (BHT 6/84) ***** C**** State analysis of adsorbed molecules as a function of T ***** C***************************************************************************** C*************************************************************************** ** C**
INTEGER SIZE,SIZA(10),NP(10),int(7),ndm(7,7),ndmt(7,7),ndtot(7,7) INTEGER nr(49),na(49) REAL TENP(100),cov(100) INTEGER NI(7,7),TNIN,TNAX,nd(7,7,100),ndt(100) REAL BETA,E,R,TS,NAAVG,LCTP,CHI,nuO
BYTE NAN(3),FNAN(60),TITLE(72) INTEGER TYP
c CALL PLOTS(0,2,0) LUNM = 16 LUN = LUNN SUMSIZE = 0
TYP = 16 C READ (6,•) TYP C******************************************************************************
DO 410 1=1,10

type *• 'Enter File : ' READ (6,701,END=969) NAN
701 FORHAT(3A1) ENCODE(16,702,FNAM) TYP,NAM
-159 -
702 FORHAT( ' INP :FOR' , I3.3,' . ',3A1,1X) OPEN(UNIT=LUN ,ERR=969,FILE=FNAM,TYPE='OLD')
READ(LUN,121 ,END=969 ,ERR=969) SIZE ,ED,EN,EA,ER,EM,SO , CHI , 1 TS,DSBINT,IR,TITLE,LCTP ,E,EO,NAAVG,DT,A,NUO, 2 BETA
121 FORMAT(I6 , 6F10.6,/ , 3F10.3,I12/ , 72A1 , /,F10.1,2F10.6,3F6.2, 1 1PE9 . 2,F6.1) SIZA(K) = SIZE SUMSIZE = SUMSIZE + SIZA(K)••2
29 FORMAT(/, ' File # ' , I3, ' = ' , 16A1 A , / ,' ',72('*'),/ , 1X,72A1,/,1X,72('* ' ) 1 ,/ ' LATTICE IS ' ,I4,' BY ' ,I4,/,' DESORPTION ENERGY: ', 2 F6 .3,/, ' DESTABILIZATION ENERGY FOR FILLED SITE : ' ,F6 . 3 , / , 3 ' REPULSIVE INTERACTION ENERGY : ' ,F6 .3,/, 4 'ATTRACTIVE INTERACTIVE ENERGY : ' ,F6.3,/, 6 'MIGRATION ENERGY: ',F7 .4, ' )' ,/, 6 ' INITIAL STICKING COEFFICIENT : ',F6 . 4,/ , 7 ' CHI= ',F12.6 , /,' ADSORPTION TEMPERATURE:' ,F6 . 1 , / 8 'RANDOM STARTING POINT : ' ,I10 , //)
TYPE 29,LUN , (FNAN(I) , I=1,16),TITLE , SIZE , SIZE 1 ,ABS(ED),EN , ER ,EA ,EM,SO , CHI , TS,IR
960 LUN = LUN + 1 WRITE (6,128) EO ,DT,NUO,A,BETA
128 FORMAT(' ISOLATED N2 ATTRACTION IS E = ', 3 F6 .3,' (Kcal)' ,/,'TEMPERATURE INCREMENT' ,F8.4 , /,1X, 4 'PREFACTOR:' ,1P1E9 . 2,' * EXP(' ,OPF6.2 , 6 ' * COV)',/, ' BETA: ' ,F6 . 1,//)
410 CONTINUE 969 IF (LUN .EQ. LUNM) GOTO 2999
LUN = LUN - 1 C****************************************************************************** C•• NOW READ IN STATES TO BE TRACKED FROM FILE 4
NSTATE = 0 OPEN(UNIT=4 ,ERR=3999,FILE='atate.dat' ,TYPE= ' OLD ' ) DO 382 K=1 , 30
read (4,• , end=381) NA(K),NR(K) natate = natate + 1
382 CONTINUE C•• REORDER STATES BY INCREASING ENERGY 381 DO 380 K=1,natate
DO 380 J=K+1,natate if (NA(K)•EA - NR(K)•ER .LE. NA(J)•EA- NR(J)•ER) GOTO 380 I = NA(K) . NA(K) = NA(J) NA(J) = I I = NR(K) NR(K) = NR(J) NR(J) = I
380 CONTINUE C****************************************************************************** C•• NOW READ IN POINTS FROM FILE 1100 N2 = 0
COVP = 0.0 SUMSIZE = 0 TP = 0 .0
DO 420 L=LUNM,LUN IF (SIZA(1+L-LUNM) .EQ. 0) GOTO 420 ! Has file ended already? READ (L,126,END=969) NP(1+L-LUNM),COVO,nada0 TYPE *,l,np(1+1-lunm),' COVERAGE',COVO
126 FORNAT(I6,F8 .4,I7) N2 = max(N2,NP(1+L-LUNM))
IF (L . HE . LUNM .AND. ABS(COVO- COVP) . GT . 0.02) THEN TYPE *,'ERROR WRONG COVERAGE' ,L , COVO,COVP STOP
ELSE COVP = COVO
END IF
- 154 -
SUMSIZE = SUMSIZE + SIZA(1+L-LUNM)••2 GOTO 420
060 SIZA(1+L-LUNM) = 0 ! END OF FILE -- SKIP OVER FILE NEXT TIME CLOSE(L)
420 CONTINUE
IF (SUMSIZE .EQ. 0) goto 1999 ! IF ZERO - - ALL FILES ARE NOW EMPTY ICOV = 100 • COVO
C Clear total and max arrays before starting DO 30~ I=1 , 7 DO 302 J=1,7
ndm(i,j) = 0 ndtot(i,j) = 0
302 CONTINUE NDSB = 0
C****************************************************************************** C*** NOW READ IN T AND DESORPTION STATE DATA
DO 400 K=1,N2 if (k .gt . 3) TEMP(K) = 2.•TEMP(K-1) - TEMP(K-2) NDT(k) = 0 clear total per T increment DO ~01 I =1 , 7 DO 201 J=1,7 ND(i , j , k) = 0 clear state counter
201 CONTINUE
DO 202 L=LUNM, LUN C SKIP OVER FILE IF IT HAS ENDED ALREADY OR IF WE HAVE READ ALL C POINTS FROM THIS TDS SCAN
124
IF (SIZA(1+L-LUNM) . EQ . 0 .or . NP(1+L-LUNM) .EQ . 0) GOTO 202 READ (L,124) TP FORMAT(F6.~)
C** Is this T < 0
126
20~
IF (TP . lt . 0 . ) THEN NP(1+L-LUNM) = 0 goto 202
END IF
! prevent reading more points from current file
IF (L .NE. LUNM .AND . ABS(TEMP(K)-TP) . GT . 0 . 1) THEN TYPE *, ' ERROR WRONG TEMPERATURE' ,K ,L,TEMP(K),TP STOP
END IF TEMP([) = TP READ (L,126) ((NI(I , J),I=1,7),J=1,7) FORMAT(7I6) DO ~02 I=1 ,7 DO 202 J=1,7
ndt(k) = ndt(k) + NI(I,J) ndtot(i,j) = ndtot(i,j) + NI(I,J) nd(i,j,k) = nd(i , j , k) + NI(I,J)
CONTINUE ndsb = ndsb + ndt(k)
desorbed per T increment total per T increment deaorbed by state
400 CONTINUE nads = ndsb ! total adsorbed ndtrk = 0 DO 360 I=1,nstate
ndtrk = ndtrk + NDtot(NA(k)+1 , NR(k)+1) 360 CONTINUE
type 770,nads/sumsize,nads,ndtrk,(100 . *ndtrk)/nads 770 format('Oaveraged coverage:',f7 .3,', total adsorbed:' ,i6 ,
1 / , ' deaorbed from tracked states : ' ,i6,' (' , f7.3, ' ~)' , /) n1 = 0 DO 206 I=1,N2
ndsb = ndsb - ndt(k) cov(k) = ndsb/aumaize
DO 206 I=1, 7 DO 206 J =1 ,7
ndm(i , j) = max(nd(i , j,k) ,ndm( i ,j)) maximum deaorbed for each state

- 155 -
205 CONTINUE c if (ndt(k) .ne. 0) type *,temp(k),cov(k),ndt(k)
206 CONTINUE close (1)
DO 6 J=1, 7 INT(J) = ndm(1 , J) + ndm(2,J) + ndm(3,J) + ndm(4,J) + ndm(5,J) +
1 ndm(6,J) + ndm(7,J) 6 CONTINUE
WRITE (6,30) 'Maximum' ,(I-1,I=1,7),0,(ndm(I,1),I=1 ,7),int(1) 30 FORMAT(/, 23X, a,'- de sorbed molecules by interactions',
1 /,30X,'NUMBER OF ATTRACTIVE INTERACTIONS',/ 2 20X,7I6,' TOTAL',/, ' NUMBER OF'./, 3 ' REPULSIVE ' , I6,2X, 8I6)
33 FORMAT(12X,I6,2X,8I6) DO 32 J=2,7 IF (INT(J) . NE. 0) WRITE (6,33) J-1 , (ndm(I,J),I=1,7),int(j)
32 CONTINUE DO 7 J=1,7 INT(J) = ndtot(1,J) + ndtot(2,J) + ndtot(3 , J) + ndtot(4,J) +
1 ndtot(5,J) + ndtot(6,J) + ndtot(7,J) 7 CONTINUE
WRITE (6,30) 'Total' , (I-1,I=1,7) ,0,(ndtot(I , 1) , I=1,7),int(1) DO 34 J=2,7 IF (INT(J) . NE. 0) WRITE (6,33) J-1,(ndtot(I , J),I=1,7),int(j)
34 CONTINUE c** Find Top ten desorbing states by total desorbed c DO 300 1=1,10 c IMAX = -1 c DO 310 I=1 , 7 c DO 310 J=1,7 c IF (K .EQ. 1) NDNT(I , J) = NDTOT(I,J) c IF (IMAX . LT . NDNT(I,J)) THEN c NA(K) = I - 1 c NR(K) = J - 1 c INAX = NDNT(I,J) c ENDIF c 310 CONTINUE c NDNT(NA(k)+1,NR(k)+1) = 0 c 300 CONTINUE
type 322,'Natt' ,(NA(k) ,k=1,nstate) type 320,'Nrep' ,(Nr(k),k=1 ,nstate) type 320, ' Dtot' ,(NDtot(NA(k)+1,NR(k)+1),k=1,nstate) type 320, ' Dmax' ,(NDN(NA(k)+1,NR(k)+1),k=1,nstate) type 321, ' E',(NA(K)*EA- NR(k)•ER,k=1,nstate)
322 format(//,1x,a4,1x,20i5, :,/,3x,20i5) 320 format(1x , a4,1x,20i5,: ,/,3x,20i5) 321 format(1x,a4 , 1x,20f5 .2,/, :, 3x , 20f5.2) C** NOW OPEN FILE 2 -- T VS . Ndsb for selected states
ENCODE(16,704,FNAN) NAN,ICOV,'DAT ' 704 FORNAT('OUT:',3A1,'D',I2 . 2,' .' ,A3 , 1X)
OPEN(UNIT=2,FILE=FNAN, TYPE= ' NEW',FORN= ' FORNATTED ' ) nsize = sqrt(sumsize) write (2,323) natate,nsize write (2,323) (NA(k),k=1,natate) write (2,323) (Nr(k),k=1,natate) write (2,323) (NDtot(NA(k)+1 , NR(k)+1) , k=1,nstate) write (2,323) (NDN(NA(k)+1,NR(k)+1) ,k=1,nstate) write (2,324) (NA(K) *EA - NR(k)•ER , k=1,nstate)
323 format(30i5) 324 format(30f5 . 2)
DO 330 IC=1,N2 write (2,341) temp(k),(ND(NA(i)+1,NR(i)+1,k),i=1,nstate) if (ndt(k) .ne. 0) 1 type 340,temp(k) , (ND(NA(i)+1,NR(i)+1 ,k),i=1,nstate)
340 format(1x,f5 .0,20i5, : , /,3x , 20i5) 341 format(f5.0,20i5)
330 CONTINUE close (2)
GOTO 1100

-156 -
1999 continue 2999 continue 3999 STOP
END
[BHT .N2.AVG]3DR.FOR C***************************************************************************** c••••••••••••***************************************************************** c•••• ***** C**** PROGRAM TO MODEL N ADSORPTION ON Ru(0001) ***** C•••• 2 ***** C**** ***** C**** Using true Monte-Carlo type model ***** c•••• ***** C**** BRIAN TOBY 6/86 ***** C**** ***** C**** Plot results from array processor program (BHT 6/84) ***** C•••• State analysis of adsorbed molecules as a function of T ***** c••••••••••••••••••••••••••••••••********************************************* c••••••••••••••••••••••••••*************************************************** c••
C••
INTEGER nr(49),na(49),ndm(49) REAL TENP(100),es(49),x(200),y(200) REAL ym(200),yz(200),xf(400),yf(400) REAL x1(102),y1(102) INTEGER nd(49,100),ndtot(49)
BYTE NAN(3),PNAN(60),FNAN(60),Q,TITLE(72)
C** NOW OPEN FILE 2 -- T VS . Ndsb for selected states 1 TYPE *,'ENTER FILE PREFIX'
READ (6,701,END=969) NAN 701 FORNAT(3A1)
TYPE *,'ENTER FILE TYPE (A- Adsorbed/ D- Desorbed)' READ (6,701,END=969) Q
2 TYPE *,'ENTER COVERAGE' c cov = 0.63
READ (6,•,END=1) CCV ICOV = 100.•COV + 0.6 ENCODE(14,704,FNAN) NAN,Q,ICOV,'DAT'
704 FORNAT('INP:',4A1,I2.2,' .' ,A3) OPEN(UNIT=2,FILE=FNAN,TYPE='OLD' ,FORN='FORNATTED' ,ERR=2) OPEN(UNIT=2,FILE=FNAM,TYPE='OLD' ,FORN='FORNATTED' ,ERR=1) read (2,323) nstate read (2,323) (NA(k),k=1,nstate) read (2,323) (Nr(k),k=1,nstate) read (2,323) (NDtot(k),k=1,nstate) read (2,323) (NDM(k),k=1,nstate) read (2,324) (ES(K),k=1,nstate)
323 format(30i6) 324 format(30f6.2)
n = 0 Tmax = -Q.EQ Tmin = 9 .E9
DO 330 1"=1,100 read (2,340,end=360) temp(k),(ND(i,k),i=1,nstate)
340 format(f6.0,20i6) if (temp(k) .gt. Tmax) Tmax temp(k) if (temp(k) . lt. Tmin) Tmin = temp(k) n = n + 1
330 CONTINUE 360 close (2)
ndmax = ndm(1) DO 311 I=2,nstate
if (ndm(k) .gt. ndmax) ndmax ndm(k) 311 CONTINUE

-157-
3 typ~ *,'enter theta, R,inum' READ (5,•,END=2),theta,R,inum mpower 4 nseg = 7 io = 1 navg = 3 dx = tmax - tmin dy = ndmax zm = (es(nstate) - ES(1))/r cost = cos(theta•3.14159/180.)*dx sint = sin(theta•3.14159/1BO.)*dy xmax = tmax + zm*cost Dmax = NDmax + zm*sint
CALL pgbegin(1, '/vt' ,1,1) c CALL GRSCR(IC,RED,G,B)
CALL GRSCR(3,0 .0,0 . 5,0 . 0)
g CALL pgenv(tmin,xmax,O.,dmax,O,O) c Draw lines in Z direction
y(1) = 0.0 y(2) = zm•sint do 530 j=80,160,20
x(1) = j x(2) = j + zm*cost call pgline(2,x,y)
530 continue
c! CALL pglabel('Temperature', 'Number Desorbed',' ') CALL pglabel('T', ' N' ,' ') DO 501 i=1,nstate
z = (es(I)-ES(1))/r cosz = z*cost sinz = z•sint
DO 500 I=1,N x(k) = temp(k) + cosz y(k) = nd(i,k) + sinz x1(k) = temp(k) y1(k) = nd(i,k)
500 CONTINUE CALL GRSETCOL(1)
if (inum .ne . 0) call pgpoint(n,x,y,47+i) j = 1 ivis = 2 j1 = 0 DO 502 I=1,200 if (i .eq. 1) ym(k) = -1. xt = tmin + (xmax-tmin)•(k-1)/200 . xtz = xt - cosz if (xtz _.le. temp(1) .or . xtz .ge . temp(n)) goto 502 if (xtz .gt . temp(j)) then
xO = x1(j) yO = y1(j) j = j + 1
end if yt = yO + (xtz - xO)•(y1(j) - yO)/(x1(j) - xO) j1=j1+1 x(j1) = xt y(j1) = yt + sinz yz(j1) = max(sinz , ym(k)) if (ym(k) .le. yt + sinz) then
c line is visible c draw previous invisible line first if last point was invisible
if (ivis .eq. 1) then CALL GRSETCOL(2) call pgpoint(j1,x,y,-1) j 1 = 1 x(1) = xt
! red ! plot points

y(1) = yt + sinz yz(1) = max(sinz , ym(k))
end if ym(k) = yt + sinz ivis = 0
else c line is invisible
- 158 -
c draw previous visible line first, if last point was visible if (ivis .eq . 0) then
is = 0 · j4 = 0
do 541 j2 = 1,j1 if (y(j2) . le . yz(j2) . or . j2 . eq . j1) goto 542 is = 1 j4 = j4 + 1 xf(j4) = x(j2) yf(j4) = y(j2) goto 541
c start/end of fill area : 542 if (is .eq . 0) then !line not started- use as first point
xf(1) = x(j2) yf(1) = y(j2) j4 = 1
else j4 = j4 + 1 xf(j4) = x(j2) yf(j4) = y( j 2)
do 543 j3 = 1,j4-1 now load in last n points xf(j4+j3) = x(j2-j3) yf(j4+j3) = yz(j2-j3)
543 CONTINUE CALL GRSETCOL(3) green call pgpoly(2•j4-1,xf,yf) is = 0
end if 541 CONTINUE
CALL GRSETCOL(1) white CALL GRSETCOL(2) red call pgline(j1,x , yz) CALL GRSETCOL(2) red call pgline(j1,x,y) j 1 = 1 x(1) = xt y(1) = yt + sinz yz(1) = max(sinz,ym(k))
end if ivis = 1
end if 602 CONTINUE
if (ivis .eq. 0) then is = 0 j4 = 0
do 551 j2 = 1,j1 if (y(j2) .le . yz(j2) . or . j2 . eq . j1) goto 652 is= 1 j4 = j4 + 1 xf(j4) = x(j2) yf(j4) = y(j2) goto 651
c start/end of fill area : 662 i f (is . eq . 0) then !line not started - use as first point
xf(1) = x(j2) yf(1) = y(j2) j4 = 1
else j4 = j4 + 1 xf(j4) = x(j2)

y:f(j4) = y(j2) do 663 j3 = 1,j4-1
xf(j4+j3) = x(j2-j3) yf(j4+j3) = yz(j2-j3)
-159 -
now load in last n points
663 CONTINUE CALL GRSETCOL(3) call pgpoly(2•j4-1,xf,yf) is = 0
end if
green
661 CONTINUE CALL GRSETCOL(1) CALL GRSETCOL(2) call pgline(j1,x,yz) CALL GRSETCOL(2) call pgline(j1,x,y)
else CALL GRSETCOL(2) call pgpoint(j1,x,y,-1)
end if
white red
red
red plot points
601 CONTINUE CALL pgend
READ (6,701,END=060) NTNP GOTO 3
060 STOP END
[BHT .N2.AVG]3DV.FOR C***************************************************************************** C**********************~****************************************************** c•••• ••••• C**** PROGRAM TO MODEL N ADSORPTION ON Ru(0001) ***** c•••• :z ••••• c•••• ••••• C•••• Using true Monte-Carlo type model ••••• C•••• ***** C**** BRIAN TOBY 6/86 ***** c•••• ••••• C•••• Plot results from array processor program (BHT 6/84) ***** C•••• State analysis of adsorbed molecules as a function of T ***** C***************************************************************************** c••••••••••••••••••••••••••••••••••••••••••••••••••••••••••••••••••••••••••••• C••
c••
REAL TENP(100),es(40),x(402),y(402) REAL ym(402) , yz(40:Z),xf(800),yf(800) INTEGER nr(40),na(40),ndm(40),ipat(16) INTEGER nd(40,100),ndtot(40)
BYTE NAM(3),PNAM(60),FNAM(60),Q,TITLE(72) data ipat/Z0001,Z0002,Z0004,Z0008, 1 Z0010,Z0020,Z0040 , Z0080, :Z Z0100,Z0200,Z0400,Z0800, 3 Z1000,Z2000,Z4000,ZBOOO/
C** NOW 1
OPEN FILE :Z -- T VS. Ndsb for selected states TYPE *• 'ENTER FILE PREFIX'
701
2
704
READ (6,701,END=060) NAM FORMAT(3A1) TYPE *,'ENTER FILE TYPE (A- Adsorbed/ D- Desorbed)' READ (6,701,END=060) Q TYPE *• 'ENTER COVERAGE ' READ (6 , •,END=1) COV ICOV = 100.•COV + 0 . 6 ENCODE(14,704,FNAM) NAM,Q,ICOV,' DAT ' FORMAT('INP : ',4A1,I:Z.2,'.',A3) OPEN(UNIT=:Z,FILE=FNAM,TYPE='OLD',FORM='FORMATTED',ERR=2) OPEN(UNIT=:Z,FILE=FNAM,TYPE='OLD',FORM='FORMATTED',ERR=1) read (:Z,323) nstate,nsize
-160 -
read (2 , 323) (NA(k),k=1 , nstate) read (2,323) (Nr(k),k=1 , nstate) read (2,323) (NDtot(k),k=1,nstate) read (2,323) (NDN(k),k=1 , nstate) read (2,324) (ES(K),k=1,nstate)
323 format(30i6) 324 format(30f6 . 2)
n = 0 Tmax = -!LEO Tmin = O.EO
DO 330 K=1,100 read (2,340,end=360) temp(k),(ND(i,k),i=1,nstate)
340 format(f6 . 0,20i6) if (temp(k) . gt . Tmax) Tmax = temp(k) if (temp(k) . lt . Tmin) Tmin = temp(k) n = n + 1
330 CONTINUE 360 close (2)
ndmax = ndm(1) DO 311 [=2,nstate
if (ndm(k) .gt. ndmax) ndmax = ndm(k) 311 CONTINUE
type •,'Energy range : ' ,es(1),es(nstate) type •,'Enter plotting limits:' EMIR = 0. EMAX = 3.001 accept •,emin,emax THETA = 46 R = 2 . 0 type •,'enter theta, R' type •,'enter R' READ (6,•,END=2) R
dx = tmax - tmin temperature range of spectra dy = ndmax maximum state deb rate npoint = 300 zm = (emax - emin)/r ! energy range of Z axis cost= cos(theta•3.14169/180.)•dx sint = sin(theta•3.14169/180.)•dy xmax = tmax + zm•cost ! maximum X point on plot Dmax = NDmax + zm•sint ! maximum Y point on plot xlen = 6.0 length of T scale (x axis) xmin = 80. start labeling X axis at 80K xscale = 80 .0/xlen axis runs to 160 K xlbl = 70 .96/xscale length of drawn axis -- almost to 160 K ylen = 4. length of highest peak (y axis) yscale = Ndmax/ylen scale Y axis zlen = zm•sqrt((cost/xscale)••2 + (sint/yscale)••2) zinc = (emax-emin)/zlen ang = atand((sint•xscale)/(cost•yscale)) type •,'Maximum page dimensions: X=',(xmax-xmin)/xscale, 1 • Y= ' ,dmax/yscale, • Z= ' ,zlen type •,'Actual Z axis angle:' ,ang x(1) = (160 - xmin)/xscale if (nam(1) .ge. 97) nam(1) = nam(1) - 32 if (nam(2) .ge. 97) nam(2) = nam(2) - 32 if (nam(3) . ge . 97) nam(3) = nam(3) - 32
CALL PLOTS(0,2,0) CALL PLOT(.6, . 76, - 3) CALL SYKBOL( . 6,2., .16,'FILE : ',90 . ,+6) CALL SYKBOL(999.,999.,.16,nam,00.,+3) CALL SYKBOL(999 . ,990 . , . 16, ' , COVERAGE: ',90 ., +12) CALL NUNBER(999 . ,990 . , . 16 , COV,90 ., +3) CALL SYKBOL(909 . ,990 . , . 16,' , EQV . SIZE : ' , 90.,+13) CALL NUMBER(909.,999 . , .16 , 1.•nsize,00.,-1) CALL SYKBOL(.B,2., .1,'Y SCALE : 1 INCH=' ,00. ,+18)
- 161 -
CALL NUNBER(999 . ,999 . , . 1,yscale,90. ,+1) CALL SYMBOL(999 . ,999 . , .1 , ' MOLECULES ' ,90 . ,+10)
CALL TONE(O . ,O.,ipat,-16) CALL NAXIS(O. , O. ,'TENPERATURE',-11 , xlbl , O. ,xmin,xscale
1 , 2 . /xscale, 6,0 . ,0 . , -1,0 . ,0.) CALL NAXIS(O . , 0. ,'NUMBER DESORBED' ,16,6. ,90. ,O ., yscale
1 ,0 .• o.o . . o .. -1,0 . ,0.) CALL NAXIS(x(1),0 . , ' RELATIVE ENERGY' ,-16,zlen , ang , emi n , zinc
1 ,.1/zinc,6 , 0 . ,0. , 1 , 0 . ,0 . )
c Draw lines in Z direction y(1) = 0 . 0 y(2) = zm•aint/yacale do 630 j=80,160,10
x(1) = (j - xmin)/xacale x(2) = (j + zm• coat - xmin)/xacale CALL DASHLN(X,Y,2, . 1, . 1)
630 continue DO 601 i=1,nstate
z = (es(I)-emin)/r cosz = z•cost sinz = z•sint
c DO 600 I=1,N C X(k) = temp(k) + COSZ c y(k) = nd(i,k) + sinz c 600 CONTINUE c x(N+1) xmin c x(N+2) = xscale c y(N+1) = 0.0 c y(N+2) = yscale c if (inum .ne. 0) CALL LINE(X,Y,N,1,-1,I) c****************************************************************************** c** Draw a dashed baseline -- the visible parts will be covered by a filled c•• line
CALL NE'IIPEN(3) x(1) temp(1) + COIIZ x(2) temp(N) + cosz y(1) sinz y(2) ainz x(3) = xmin x(4) xscale y(3) 0.0 y(4) yscale
CALL CURVE(X,Y,-2,-0.02) c******************************************************************************
j = 1 ivis = 2 j1 = 0 DO 602 I=1,npoint if (i .eq. 1) ym(k) = -1 . xt = tmin + (xmax-tmin)•(k-1)/(1 . •npoint) xtz = xt - coaz if (xtz .le . temp(1) . or . xtz .ge . temp(n)) goto 602 if (xtz .gt . temp(j)) then
xO = temp(j) yO = nd(i , j) j = j + 1
endif yt =yO+ (xtz - xO)•(nd(i,j) - yO)/(temp(j) - xO) j1 = j1 + 1 x(j1) = xt y(j1) = yt + sinz yz(j1) = max(sinz,ym(k)) if (ym(k) . le . yt + sinz) then
c line is visible c draw previous invisible line first if last point was invisible
if (ivis . eq. 1) then

CALL NE\fPEN(3) x(j1+1) = xmin x(j1+2) = xscale y(j1+1) = 0.0 y(j1+2) = yscale CALL CURVE(X,Y,-J1,-0 . 02) j 1 = 1 x(1) = xt y(1) = yt + ainz yz(1) = max(sinz,ym(k))
end if ym(k) = yt + sinz ivis = 0
else c line is invisible
- 162 -
c draw previous visible line first, if last point was visible if (ivis .eq. 0) then
x(j1+1) = xmin x(j1+2) = xscale y(j1+1) = 0.0 y(j1+2) = yscale yz(j1+1) = 0.0 yz(j1+2) = yscale CALL NE\fPEN(4) CALL LINE(X,YZ,J1,1,0,0) CALL NE\fPEN(6) CALL LINE(X,Y,J1,1,0,0) is = 0 j4 = 0
do 641 j2 = 1 , j1 if (y(j2) .le. yz(j2) .or. j2 . eq . j1) goto 642 is = 1 j4 = j4 + 1 xf(j4) = (x(j2) - xmin)/xscale yf(j4) = y(j2)/yscale goto 641
c start/end of fill area: 642 if (is .eq. 0) then !line not started- use as first point
xf(1) = (x(j2) - xmin)/xscale yf(1) = yz(j2)/yscale j4 = 1
else j4 = j4 + 1 xf(j4) = (x(j2) - xmin)/xscale yf(j4) = yz(j2)/yscale
do 643 j3 = 1,j4-1 ! now load in last n points xf(j4+j3) = (x(j2-j3) - xmin)/xscale yf(j4+j3) = yz(j2-j3)/yacale
643 CONTINUE CALL TONE(XF,YF,2•J4-1,1) is = 0
end if 641 CONTINUE
j 1 = 1 x(1) = xt y(1) = yt + sinz yz(1) = max(ainz,ym(k))
endif ivis = 1
end if 602 CONTINUE
x(j1+1) = xmin x(j1+2) = xscale y(j1+1) = 0.0 y(j1+2) = yscale if (ivis .eq. 0) then

yz(j1+1) = 0.0 yz(j1+2) = yscale CALL NE11PEN(4) CALL LINE(X,YZ,J1,1,0,0) CALL NE\fPEN(6) CALL LINE(X,Y,J1 , 1,0 , 0) is = 0 j4 = 0
do 661 j2 = 1 , j1
-169 -
if (y(j2) .le . yz(j2) . or. j2 .eq. j1) goto 662 is = 1 j4 = j4 + 1 xf(j4) = (x(j2) - xmin)/xscale yf(j4) = y(j2)/yscale goto 661
c start/end of fill area: 662 if (is . eq . 0) then !line not started - use as first point
xf(1) = (x(j2) - xmin)/xscale yf(1) = y(j2)/yscale j4 = 1
else j4 = j4 + 1 xf(j4) = (x(j2) - xmin)/xscale yf(j4) = y(j2)/yscale
do 663 j3 = 1,j4-1 ! now load in last n points xf(j4+j3) = (x(j2-j3) - xmin)/xscale yf(j4+j3) = yz(j2-j3)/yscale
663 CONTINUE CALL TONE(XF,YF,2•J4-1,1) is = 0
end if 661 CONTINUE
else CALL HE\fPEN ( 3) CALL CURVE(X,Y,-J1,-0 . 02)
end if 601 CONTINUE
CALL PLOT(O.,O . ,000) c READ (6,701,END=060) NTNP 960 STOP
END

-164 -
3.4 Program SISO
[BHT.N2.LASER]SISO.FOR C**************************************************************************** C**************************************************************************** C**** ***** C**** PROGRAM TO MODEL N ADSORPTION ON Ru(0001) ***** C**** 2 ***** C**** ***** C•••• Using true Monte-Carlo type model ***** C**** ***** C**** BRIAN TOBY, ERIC HOOD 12/83 ***** C**** ***** C**** Plot results from array processor program (BHT 6/84) ***** C**** Compute smoothed derivatives (BHT 11/85) ***** C**** ***** C**************************************************************************** C**************************************************************************** C••
INTEGER SIZE,SIZA(10),NP(10),NDSB1(200),NDSB2(200) REAL•8 TITLE(O),DATSTR(2) DIMENSION X1(504),Y1(504),X2(504),Y2(504),c(20),s(20) REAL TENP(200),COVI(7,7),COVIP(7,7),EI(7,7),TINT INTEGER NI(7,7,2),TMIN,TNAX REAL BETA,NU,NUO,E,R,T,NAAVG,LCTP,CHI
BYTE BUFF(llO)
CALL PLOTS(O,O,O) CALL DATE(DATSTR) N1 = 0 SUNSIZE = 0 LUNM = 10 LUN = LUNM
specapc = 1.0 sclfct = 1 .0 type •, 'enter scale factor, spacing between spectra' read (6,•,end=222) aclfct,specspc
222 DO 210 J=1 , 10 READ(LUN,121,END=010 ,ERR=010) SIZE,ED,EN,EA,ER,EM,SO,CHI,
1 TS,DSBINT,IR, (TITLE(I),I=1,0),LCTP,E,EO,NAAVG,DT, 2 BETA
121 FORMAT(I6,6F10 .8,/,3F10.3,I12/,0A8,/,3F10.3,2F6.2,16x,f6 . 3) SIZA(J) = SIZE SUNSIZE = SUNSIZE + SIZA(J)••2 TYPE 20,LUN,(TITLE(I),I=1,0),SIZE,SIZE,ED,EN,ER,EA,
1 EM , SO,CHI,TS,IR 20 FORMAT(/,' File#' ,I3,/,' ',72('*'),/,1X,OA8,/,1X,72('*')
1 ,/' LATTICE IS',I4,' BY' ,I4,/,' DESORPTION ENERGY: ', 2 F6.3,/,' DESTABILIZATION ENERGY FOR FILLED SITE : ',F6.3,/, 3 'REPULSIVE INTERACTION ENERGY:' ,F6 .3,/, 4 'ATTRACTIVE INTERACTIVE ENERGY:' ,F8.3,/, 6 'MIGRATION ENERGY: ',F7.4,')' ,/, 6 ' INITIAL STICKING COEFFICIENT: ',F6 .4,/, 7 ' CHI = ',F12 .6,/,' ADSORPTION TEMPERATURE:' ,F6.1,/ 8 'RANDOM STARTING POINT:' ,I10,//)
LUN = LUN + 1 210 CONTINUE 010 IF (LUN .EQ. LUNN) GOTO 020
LUN = LUN - 1 avgSIZE = SQRT(SUNSIZE)
X1(1) = 0 ! EXPOSURE (in L.) Y1(1) = 0 ! COVERAGE N1 = 1
C** NOW READ IN POINTS FROM FILE 100 NADSS = 0
NEXPS = 0 SUNSIZE = 0

- 165 -
DO 220 L=LUNM , LUN C SKIP OVER FILE IF IT HAS ENDED ALREADY
IF (SIZA(1+L-LUNM) .EQ . 0) GOTO 220 READ (L,22,END=939) NEXP , NADS
22 FORMAT(1X,2I7) NADSS = NADSS + NADS NEXPS = NEXPS + NEXP SUMSIZE = SUMSIZE + SIZA(1+L-LUNM)••2 GOTO 220
C END OF FILE -- SKIP OVER FILE NEXT TIME 939 SIZA(1+L-LUNM) = 0
CLOSE(L) 220 CONTINUE
C IF SUMSIZE IS ZERO THEN ALL FILES ARE NOW EMPTY IF (SUMSIZE . EQ . 0) goto 949 COV = NADSS I SUMSIZE EXPOS = NEXPS I SUMSIZE
C** NOTE EXPOSURE FROM FILE IS IN "MONOLAYERS" AND MUST BE CONVERTED C•• TO LANGMUIR (L) USING THE RELATION : C• • Flux = 4 .08 L I MONOLAYER C•• From Dushman p. 14, and B. Anton (private comm.) using : C•• Flux= 3.513E22 P • (MOL. WT. • T)•• -0 . 5 I cm••2 • sec C• • T = 295 I C•• MONOLAYER DENSITY= 1.58E15 Ru Atomslcm•• 2 C•• C• • NOW SET UP ARRAYS FOR PLOTTING c••
N1 = Hi + 1 X1(N1) =EXPOS * 4 .08 Y1(N1) = COV GOTO 100
C•• Now compute d(coverage)ld(exposure) 040 N2 = 0
ipol = 3 DCDV = 11 type •,'Sticking Coef: polynomial size , convolute size ' read (5,• , end=223) ipol ,ncnv
C X2(0) = 0 ! COVERAGE C Y2(0) = Sinit ! d(coverage)ld(exposure) 223 continue
TYPE • , (X1(I) , I=1,N1) TYPE •,(Y1(I),I=1,N1) OX = (X1(11) - X1(1))140.8
TYPE • , 'OX = ',OX call SDRV(y1 , y2,n1,ncnv,ndrop , ipol)
N2 = 0 C now drop points on ends
DO 200 I=ndrop,N1-ndrop- 1,2 N2 = N2 + 1 X2(N2) = (Y1(I)+Y1(I+1))12. COVERAGE Y2(N2) = (Y2(I)+Y2(I+1))1(DX•2 . ) dCidE
200 CONTINUE TYPE •,(X2(I) , I=1,N2) TYPE •,(Y2(I),I=1 , N2)
C••• NOW START PLOTTING c CALL FACTOR(0.5) c CALL PLOT(.45,.75 , -3)
X = 0 .5 y = 0.5 XL = 0.10 YL = 0.125 iX = (1000 . • X) + 0 . 5 iY = (1000 . • Y) + 0 . 5 ixL = (100 . • xL) + 0 . 5 iyL = (100 . * yL) + 0 . 5
C ir = (1000 . • r) + 0.6 ir = 0 encode (10e,701,buff) iX,IY,IXL,IYL,IR,TITLE
701 format ('~IV' ,i5 . 5, · - IH ' ,i5 . 5,'-M' ,2i3 . 3 , i6 . 6 , '-DL ' , 9AB) CALL qUIC(BUFF,106)

N = N1 X1 (N+1) X1(N+2) = Y1 (N+1) Y1(N+2) =
0 0.6 0 0 .06
-166 -
DO 1st PLOT -- Coverage va Exposure for : all, with ~ w/o repulsions
c CALL AXIS(O . ,O . ,'EXPOSURE',-8, . 1•N/X1(N+2)+1 . ,0 .,X1(N+1),X1(N+2)) C•• C•• NOTE: previous line assumes 0 .02•4.08 L per point C** c CALL AXIS(O . ,O . ,'COVERAGE',8,12.,QO . ,Y1(N+1),Y1(N+2)) c CALL PLOT(O . ,O.,-QQO) C** DO 2nd PLOT -- Sticking coeffient c••
CALL FACTOR(0 .6) CALL PLOT(2. ,2 . ,-3) X2(N2+1) = 0 X2(N2+2) = 1 . /30. Y2(N2+1) = 0 Y2(N2+2) = 0 . 1 CALL AXIS(O.,O., 'ADSORPTION COEFFICIENT' ,22,10 . ,QO.,
1 Y2(N2+1),Y2(N2+2)) CALL AXIS(O. ,0 . , 'COVERAGE' ,-8,16 . ,0 . ,X2(N2+1) ,X2(N2+2)) CALL SYNBOL(1 . , 18., . 16,TITLE,0.,+72)
call newpen(6) CALL LINE(X2,Y2,N2,1,-1,0)
CALL CURVE(X2,Y2,-N2,-0.06) c C** Now plot known - Sticking coeffient
606 600
610
c
620
open (unit=Q,atatua='OLD' , form='formatted' ,err=02Q) n1 = 0
call newpen(6) DO 600 1=1,20 read (0,606,err=610) C(I),X2(I),S(I),Y2(I) n1 = n1 + 1 format(7x,4f7 .4) CONTINUE close (Q) c(N1+1) = 0 c(N1+2) = 1./30. s(N1+1) = 0 a(N1+2) = 0.1
CALL LINE(C,S,N1,1,-1,4) x1(3) 0 x1(4) = 1./30. y1(3) = 0 y1(4) = 0.1 DO 620 I=1,n1 X1(1) c(i) X1(2) = c(i) Y1(1) = s(i) - y2(i)/2. Y1(2) = s(i) + y2(i)/2 . CALL LINE(x1,y1,2,1,0,4) X1(1) c(i) - x2(i)/2. X1(2) = c(i) + x2(i)/2. Y1(1) = s(i) Y1(2) = s(i) CALL LINE(x1,y1,2,1,0,4) CONTINUE
C!**************************************************************************** C How Plot TDS files C***************************************************************************** C*****************************************************************************
020 LUNN = 20 LUH = LUNN
call newpen(3) ISO = 0 TYPE *,'ENTER ISOTOPE TO BE PLOTTED (O=BOTH)' read (6,•,end=333) ISO
333 TYPE *,'ISOTOPE =' , ISO

SUMSIZE = 0 DO 410 J=1 , 10
-167-
READ(LUN,121,END=959,err=959) SIZE,ED,EN,EA ,ER,EM,SO,CHI, 1 TS,DSBINT,IR,(TITLE(I),I=1,9),LCTP,E,EO,NAAVG,DT,BETA
LUN = LUN + 1 SIZA(J) = SIZE SUNSIZE = SUMSIZE + SIZA(J)••2 IF (N1 .NE. 0 . and . J .EQ . 1) CALL PLOT(O. ,0.,-999) TYPE 29,LUN,(TITLE(I),I=1,9),SIZE,SIZE,ED,EN,ER,EA,
1 EM,SO,CHI,TS,IR LUN = LUN + 1 VRITE (6,128) EO,DT,NUO , A,BETA
128 FORMAT(' ISOLATED N2 ATTRACTION IS E = ' , 3 F6 .3,' (Kcal) ' ,/,'TEMPERATURE INCREMENT' ,F8.4,/,1X, 4 'PREFACTOR:' ,1P1E9.2,' * EXP(' ,OPF5.2, 5 ' *COY)',/,' BETA:' ,F5.1,//)
410 CONTINUE 959 IF (LUN .EQ. LUNN) GOTO 2999
LUN = LUN - 1 C****************************************************************************
call portr X = 0.6 y = 0.6 XL = 0 .07 YL = 0.10 iX = (1000 . • X) + 0 . 6 iY = (1000. * Y) + 0.6 ixL = (100. * xL) + 0.6 iyL = (100. * yL) + 0 . 6
· C ir = (1000. • r) + 0.6 ir = 0 . encode (106,701,buff) iX,IY,IXL,IYL,IR,TITLE ipol = 3 ncnv = 6 type *,'TDS: polynomial size, convolute size' read (6,•,end=224) ipol,ncnv
224 CALL qUIC(BUFF , 106) CALL FACTOR(0.6) CALL PLOT(2. , 2.,-3) CALL AXIS (0., 0., 'TEMPERATURE', -11,14 . , 0., 50 ., 10.) CALL SYNBOL(1. ,16., .2,'ISOTOPE = ',0. ,+10)
IF (iso .eq. 0) THEN CALL SYNBOL(999.,999 . , . 2,'BOTH' ,0 . ,+4)
else CALL HUMBER(999.,999., . 2,1.•iso,O. ,-1)
end if call newpen(3)
C**************************************************************************** C•• NOV READ IN POINTS FROM FILE
TINT = 0.0001 ! So that we don't divide by zero HPLT = -1 ·
1100 N2 = 0 COVP = 0 .0 SUMSIZE = 0 TP = 0 .0 DO 420 L=LUNN, LUH
C SKIP OVER FILE IF IT HAS ENDED ALREADY IF (SIZA(1+L-LUNN) .EQ. 0) GOTO 420 READ (L,126,END=969) NP(1+L-LUNN),COVO
126 FORMAT(I6,F8.4) H2 = max(H2,HP(1+L-LUNN)) IF (L .HE . LUNN .AND. ABS(COVO-COVP) . GT . 0 .02) THEN
TYPE *,'ERROR VRONG COVERAGE' ,L,COVO,COVP STOP
ELSE COVP = COVO
END IF SUNSIZE = SUNSIZE + SIZA(1+L-LUNN)••2 GOTO 420
C END OF FILE -- SKIP OVER FILE NEXT TIME
969 SIZA(1+L-LUNN) = 0 CLOSE(L)
420 CONTINUE
- 168 -
C IF SUNSIZE IS ZERO THEN ALL FILES ARE NOW EMPTY IF (SUNSIZE .EQ . 0) goto 1999
mdea = 0 NADS1 = 0 NADS~ = 0 DO 300 K=1,N~ NDSB1(K) = 0 NDSB2(K) = 0 if (k . gt. 3) temp(k) = temp(k-1) + tint DO 202 L=LUNN,LUN
C SKIP OVER FILE IF IT HAS ENDED ALREADY OR IF \fE HAVE READ ALL C POINTS FROM THIS TDS SCAN
IF (SIZA(1+L-LUNN) .EQ. 0 . or . K .GT . NP(1+L-LUNN)) GOTO 202 READ (L,124,end=2999) TP
124 FORNAT(F6 . 2) c•• Is this T < 0
IF (tp .lt. 0.) THEN NP(1+L-LUNN) = 0 ! prevent reading more points from current file goto 202
END IF IF (L .EQ. LUNN .AND. k . le. 3) TENP(K) = TP IF (ABS(TENP(K)-TP) . GT . 0 . 1) THEN
TYPE * , 'ERROR WRONG TEMPERATURE' , K, L, TEMP (K) , TP STOP
END IF 126 FORNAT(7I6,3x , 7I6)
READ (L,126,end=2999) (((NI(I,J,IK),I=1,7),IK=1 , 2),J=1,7) DO 202 I=1,7 DO 202 J=1,7 NDSB1(K) = NDSB1(K) + HI(I,J,1) NDSB2(K) = NDSB2(K) + NI(I,J,2)
202 CONTINUE NADS1 = NADS1 + NDSB1(K) NADS2 = NADS2 + NDSB2(K) IF (K .EQ. 3) TINT = TENP(3) - TENP(2)
300 CONTINUE NADS = 0
IF (ISO . HE . 2) NADS = NADS + NADS1 IF (ISO .HE . 1) NADS = NADS + HADS2 NDSB = 0
DO 306 K=1,N2 IF (ISO . NE. 1) NDSB = NDSB + NDSB2(K) IF (ISO . HE . 2) NDSB = NDSB + NDSB1(K)
y1(k) = HADS - NDSB 306 CONTINUE
DX = -0 . 6•(TIHT•SUNSIZE) I sclfct c•• pad coverage with zeros
y1(n2+1) = 0 y1(n2+2) = 0 y1(n2+3) = 0 y1(n2+4) = 0 y1(n2+6) = 0 type *,'Averaged coverage= •, (1 . •nada)laumaize,' Type 1 to omit' read (6,•,end=226) iomit if (iomit .eq . 1) goto 1100
226 NPLT = NPLT + 1 TYPE 449,(Y1(I),I=1,N2) TYPE * , 'DX = ' , DX call SDRV(y1 , y2,n2+6 ,ncnv ,ndrop , ipol)
DO 206 I=1,N2 Y2(I) = Y2(I) I DX ! dCidE
206 CONTINUE TENP(N2+1) = 60. TENP(N2+2) = 10. Y2(N2+1) = -O .OOS•(specape * NPLT + 0 . 26)

Y2(N2+2) = 0.008 TYPE 440,(TEMP(I),I=1,N2+2) TYPE 440,(Y2(I),I=1,N2+2)
440 FORMAT(1X,8F10.6) CALL LINE(TENP,Y2,N2,1,1,NPLT)
CALL CURVE(TENP,Y2,-N2,-0.06)
-169 -
CALL NUNBER(12.6, .1+1.•NPLT, . 2,COV0,0 ., +3) GOTO 1100
1900 CALL SYNBOL(12 . 4,1.1+NPLT, . 2,'COVERAGE' ,0.,+8) 2009 CALL PLOT ( 0. , 0 . , +090)
STOP END
[BHT .N2.LASER]DERIV:FOR C!***************************************************************************** c•••••••••••••••••••••••••••••••••••••••••••••••••••••••••••••••••••••••••***** C•• Program to smooth data using method of Savitsky and Golay from C•• Analytical Chemistry, Vol 36, 1627-1630 (1964) c•• C•• Also see: Steinier, Tremonia ~ Deltour, Analytical Chemistry, Vol 44 C•• 1006- 1000 (1072) C•• C** Modified to compute derivatives c•••••••••••••••••••••••••••••••••••••••••••••••••••••••••••••••••••••••••••••• C************************* Brian Toby 11/86 ******************************* C******************************************************************************
Subroutine SDRV(y,yt,n,np,ncm1o2,ipol) C Parameters: c c c c c c c c c c c c
Y (real, array, input) YT (real, array, output) R (integer, input) NP (integer, input)
NCN102 (integer, output)
IPOL
real y(1) ,yt(1) integer coef(60),sum,s,n,nc,np data nc/-0000/ save nc,coef,sum,ipolprev
data array to be smoothed resultant smoothed data number of points in Y and YT number of points in smoothing
convolute, larger ==> more smoothing -- number of unsmoothed points at beginning and end of array YT = (NC-1)/2 where NC is the actual convolute size -- order of smoothing polynomial (3<= IPOL <= 6)
if (np .eq. nc .and. ipol .eq. ipolprev) 1 goto 4 ! have we already read in this convolute? if (ipol .le. 3) then
open(file='pub:quaddirv',unit=1,status='old', 1 shared,readonly) elseif (ipol .eq. 4) then
open(file='pub:cubdirv',unit=1,status='old', 1 shared,readonly) else
open(file='pub:quintdirv',unit=1,status='old', 1 shared,readonly) end if
1 read (1,•,end=OOO) i read (1,•) (coef(j),j=1,i),sum if (i .eq. np) goto 3 if (i . lt . np) goto 1 C•• This is the largest or closest sized convolute we'll get
000 type •,'Size ',np,' not found on data file . Using',i 3 close(1)
nc = i ipolprev = ipol

4 ncm1o~ = (nc-1)/2 do 100 i=1,N
-110 -
if (i .gt. ncm1o2 . and . n-i . gt. ncm1o2) then C** Go ahead and apply the convolute
t = 0 do 200 j=1,nc
t = t + coef(j)•y(i+j-ncm1o2) 200 continue
Yt(i) = t/aum elae
C** Nope we're on the wings and can't smooth it, stick in "simple deriv" if (i .lt. n) then
Yt(i) = Y(i+1) - Y(i) else
Yt(i) = Y(i) - Y(i-1) end if
endif 100 continue
6
return end
-2,-1,0,1.~.10 7 -3,-~.-1,0,1.~.3.~8 0
[BHT.N2.LASER]QUADDIRV.DAT
-4,-3,-~.-1,0,1,~.3.4,60 11 -6,-4,-3,-2,-1,0,1,~.3.4,6,110

-171 -
3.5 Program FFTMAP
[BHT.N2.LASER]FFTMAP.FOR C****************************************************************************** c•••••••••••••••••••••••••••••••••••••••••••••••••••••••••••••••••••••••••••••• C•• C•• C•• c•• c•• C•• c•• c•• C•• C•• C•• C••
PROGRAM TO COMPUTE DIFFRACTION PATTERNS FROM A HEXAGONAL SURFACE
This program computes a 2-D FFT using a 1-D real to complex FFT and then a 1-0 complex to complex FFT. This gives matrix INTEN which gives intensities for one half of reciprocal apace . All reciprocal apace is then mapped into this matrix by subroutine ARR. Subroutine LSTFIT uses a least-squares iteration to determine the width, height and center of the root 3 spot.
Brian H. Toby 12/84
c•••••••••••••••••••••••••••••••••••••••••••••••••••••••••••••••••••••••••••••• c•••••••••••••••••••••••••••••••••••••••••••••••••••••••••••••••••••••••••••••• CONNON /A/ INTEN,N,N CONNON /B/ N02P1,COV,COVT,IALL,NSCAT,RSCAT CONNON /pgplt/ NC,NC,K,GAN,ERRS,covS,exposS,timeS character•72 TITLE REAL INTEN(129,266),INTMP(129,266) REAL•S SCAT(128,266) COMPLEX•16 DPAT(129,266) INTEGER SIZE,TSIZE,PRVSZ,NSCAT,RSCAT INTEGER NA(20),nsel(4),siza(10) REAL BETA,NU,NUO,E,T,NAAVG,LCTP,CHI,ERRS(4) REAL•8 DATSTR(2) REAL INAX,NC,NC,I,GAN,R REAL XC(4),YC(4),YL1/0.0/,YL2/0 . 2/ REAL ALIN(20),DLIN(20) , XLIN(202),YLIN(202) REAL CDESPL(20),EDESPL(20),TDESPL(20) byte ch, ty(132) INTEGER fta,hofg,cnum,wofg,bhi,bwi,orient,NSEG/20/ Data fta/9999/,orient/1/,nplt/0/,siza/10•0/ DATA CDESPL/20•-1./,EDESPL/20•-1./,TDESPL/20•-1./ DATA icd,ied,itd/3•1/ D(I,J,NC,NC) = SQRT(((I-mc)/N)••2 + 3 . •((j-nc)/N)••2) R3 = SQRT(3.)
c•• ILOG 0 ==> linear intensity scaling c•• ILOG > 0 ==> log intensity scaling c•• ILOG < 0 ==> no versatec plot
c
c c
TYPE •,'Enter 0 for a linear intensity scale' TYPE •,'Enter n>O logarithmic (10••n is the intensity range)' TYPE *,'Enter -1 for no diffraction map' ACCEPT •,ILOG
TYPE *,'Enter Scattering power of N2, Ru' READ (6,•) HSCAT,RSCAT WRITE (6,913) NSCAT,RSCAT
g13 FORMAT(' N2 SCATTERING POWER IS',I3,/, 1 ' Ru SCATTERING POWER IS' ,I3,/)
c type *,'Enter 0 for unit weights' c type •,'Enter 1 for radial weighting' c type *,'Enter -1 for intensity weighting' c accept •,iweigh c IF (IWEIGH) 1,2,3 c1 type •,'Using intensity weighting' c goto 901 c2 type •,'Using unit weights' c goto 901 c3 type *,'Using radial weighting' c•••••***********************************************************************

-172 -
901 type •,'Enter 0 to process all spectra, 1 to select by coverage' ACCEPT *, iall
c IPASS1 = 0 IF (IALL .EQ. 0) THEN
WRITE (6,014) 914 FORMAT(' PLOT ALL NAPS' ,I)
ELSE write (6,•) 'Enter map coverages' READ (6,•,END=100) (CDESPL(I),I=1,20)
190 write (6,•) 'Enter map exposures' READ (6,•,END=200) (EDESPL(I),I=1,20)
290 write (6,•) 'Enter map times' READ (6,•,END=399) (TDESPL(I),I=1,20)
END IF 390 continue c C******************************************************************************* C•• FILE DEFINITIONS
LUNQ = 1 ! QUIC FILE LUNo = 0 LUNM = 10 LUN = LUNM
c••••••••••••••••••••••••••••••••••••••••••••••••••••••••••••••••••••••••••••••• DO 210 J=1,10 CALL OPENIN(LUX,LUNo,NSCAT,RSCAT,TSIZE,TITLE) SIZA(J) = TSIZE IF (TSIZE .LE. 0) GOTO 010
. C•• NOW REDUCE TSIZE SO THAT SIZE = 2•R SIZE= 2 * IFIX(TSIZE I 2 . ) IF (SIZE .RE. TSIZE) WRITE (6,002) TSIZE,SIZE
002 FORMAT(' REDUCING LATTICE SIZE FROM' ,I3,' TO' ,I3,1) IF (J .EQ. 1) PRVSZ = size IF (PRVSZ .RE. size) then
WRITE(6,003) PRVSZ,SIZE 003 FORMAT(' ***ERROR••• UNEQUAL LATTICE SIZES' ,I3,'<>' ,I3)
goto 008 end if LUN = LUX + 1
210 CONTINUE c••••••••••••••••••••••••••••••••••••••••••••••••••••••••••••••••••••••••••••••• c•••••••••••••••••••••••••••••••••••••••••••••••••••••••••••••••••••••••••••••••
010 IF (LUX .EQ. LUNM) GOTO 008 LUll = LUll - 1 M = SIZE N = 2 * SIZE N02P1 = SIZE I 2 + 1
c•• INITIALIZE KAP? IF (ILOG . LT. 0) GOTO 008
C YES ************************************************************************** C•• START Plot -~ landscape mode
call qini(O,LUHQ,orient,'leed.qms') c•• define the glyph heigth and width in terms of the number of sites
hofg = 7. • 300. I (2•size + 1.) ! Font size in dots (300 dotslinch) c(7 inches==> lattice fro• -size ... 0 ... size)
wofg = hofg • 2. I r3 + 0.6 ! adjust font for scaling of n to m bhi = hofg ! height of bit map (in dots) bwi = wofg ! width of bit map (in dots)
C type *,'font height:',hofg,'dots ',hofgl300. ,' inches' C type *,'font width: ',wofg,'dots ',wofgl300.,' inches' C type *,'font ratio: ' , wofg • 1 . lhofg,' (' ,2.lr3,' perfect)' c•••••••••••••••••••••••••••••••••••••••••••••••••••••••••••••••••••••••••••••• C•NOW DEFIRE THE FONT SET
call qfnt(1,fta,orient,O,'bht1',hofg,O) nchar = 20 do 212 i=O,nchar
ch = 66 + i den = i I 20 .
C• N. B. for landscape BWI and BHI are reversed
-179 -
call qfdef(O,ch,wofg,bwi,bhi , O, O) CALL font(LUNQ,bwi,bhi,den)
212 continue c•• End font definition
call qfdef (-1) c CALL DATE(DATSTR) C!****************************************************************************** C•• NOW READ IN MAPS c••• ••••••••••••••••• •••••••••••••••••••*************************************** 1000 SUMSIZE = 0
WRITE (e,33) 33 FORNAT('0' ,76('*'))
C•• IADD = 0 ==> Zero IHTEN array IADD = 0 covS = 0 .0 expoaS = 0 .0 timeS = 0 .0 IFLAG = 0 DO ~~0 L=LUHN,LUN
C SKIP OVER FILE IF IT HAS ENDED ALREADY taize = SIZA(1+L-LUHN) IF (taize .EQ. 0) GOTO ~20 CALL READIH(L,taize,covO,expoa,time) IF (covO .LE . 0) THEN
C** END OF FILE -- SKIP OVER FILE NEXT TINE SIZA(1+L-LUHN) = 0 CLOSE(L)
elae covS = covS + covO•taize•taize expoaS = expoaS + expoa•taize•taize timeS = timeS + time
C•• SHOULD WE DIFFRACT THIS NAP? IF (IALL .EQ . 0 .OR. Iflag .NE. 0) THEN
IFLAG = 1 ELSE
IFLAG = 0 IF (ABS(COVO - CDESPL(ICD)) . le . 0.011) THEN
IFLAG = 1 ICD = ICD + 1
end if IF (ABS(expoa/eDESPL(leD)-1) . le. 0.06) THEN
IFLAG = 1 leD = leD + 1
end if IF (ABS(time/tDESPL(ItD)-1 . ) .le. 0.06) THEN
IFLAG = 1 ltD = ltD + 1
end if end if IF (IFLAG .EQ . 1)
C•• Calculate the FFT 1 CALL DIFFRACT(SCAT,DPAT,IADD)
C•• IADD >= 1 ==> Add to INTEN array next time IADD = IADD + 1 SUNSIZE = SUNSIZE + SIZA(1+L-LUHN) ••~ WRITE (e,34) LUH,COVO,expoa , time,IFLAG
34 FORMAT(' File #', i 3,' COVERAGE= ',Fe.3, 1. ', EXPOS =' , fe.l, ', TINE =' ,fQ. 1, ' Sec (' ,11 , ' ) ')
end if ~20 CONTINUE
c•••••••••••••••••••••••••••••• •••••••••••••••••••***************************** C IF SUMSIZE IS ZERO THEN ALL FILES ARE NOW EMPTY
IF (SUMSIZE .LE . 0) goto ggg covS = covS/aumaize expoaS = 4 . 08•expoaS/aumaize timeS ~ timeS/iadd avgSIZE = SQRT(SUMSIZE) WRITE (6,36) covS,expoaS,timeS
36 FORMAT(' Average• : COVERAGE= ',F6.3,

-174 -
1 , EXPOS =' , f6 . 2, ' , TIME =' • fO. 1, ' Sec' , I, ' ' , 75 ( '*')) IF (IFLAG .NE. 1) goto 1000
c•• Adjust intensities to reflect number of averaged mapa IF (IADD .gt . 1) THEN
DO 205 I=1,N02P1 DO 205 J=1,N
INTEN(I,J) = INTEN(I,J) I iadd 205 CONTINUE
END IF c•••••••••••••••••••••••••••••••••••••••••••••••••••••••••••••••••••••••••••••• c•••••••••••••••••••••••••••••••••••••••••••••••••••••••••••••••••••••••••••••• C** DRAW INTENSITY NAP?
INAX = 1.E-30 DO 200 I=1,B DO 200 J=1,N02P1 IF (INTEN(J,I) . GT. INAX) INAX = INTEN(J,I)
200 CONTINUE C•• START NEW PLOT IF THIS IS NOT THE FIRST PASS
IF (IPASS1 .NE . 0) CALL qini(-1)
731
701
711
IPASS1 = 1 CALL QAPOS(7.8 , 1) ! Y COORDINATE IF (ED . GT . -1) then CALL QAPOS(1 . 6,2) ! X COORDINATE
encode (58,731,ty) covS,expoaS,timeS format('ADSORBED TO' ,F6 .2,' , EXPOSURE=' ,F6.1,'L, TINE=' 1 1PG10 . 3, ' Sec ' ) call qlbl(0.16,0.16,0.,58,t1,1)
ELSE CALL QAPOS(2.6,2) ! X COORDINATE
encode (16,701,t1) 'DESORBED TO',cova format(.A.,F6 . 2) call qlbl(0 . 16,0.16,0.,16,t1,1)
END IF call qapoa(0 . 26,1) call qapoa(1.26,2) encode (72,711,t1) format(.A.72)
! 1 coordinate ! x coordinate
TITLE
call qlbl(0 . 1,0 . 1,0 . ,72,TY, 1) C•• Now plot contents of intensity matrix
NL = -II NH = II NL = -HI2 NH = Hl2
c••••••••••••••••••••••••••••••••••••••••••••••••••••••••••••••••••••••••••••• C•• call qfnt(O,fta)
ii = 0 DO 120 J=liL,IH ii = ii + 1 X = 0.26 Y • II • hofg I 300. + 0.6
call qapoa(x , 2) ! x coordinate call qapoa(1,1) ! 1 coordinate
jj = 0 DO 130 I =JIL, J1H If(jj .ge . 100) then
CALL qbuff(jj,t1,0) jj "' 1
elae jj = jj + 1
endif IF (ILOG .EQ. 0) XINT = 20. * .A.RR(I,J) I INAX + 0 . 6 IF (ILOG . GT. 0) XINT = 20. * (1.+ ALOG10(ARR(I,J)IINAX+1.E-20)
1 lilog)+ 0.6 ty(jj) = 66 + JNAXO(O,JNINO(JINT(XINT),20))
130 CONTINUE CALL qbuff(jj,t1,0) CALL qbuff(2,'A-',0)
120 COIITINUE

-175 -
C***************************************************************************** C** now put squares of known density on page
ii = 60.Ihofg ! number of pixels per square DO 320 J=O,nchar DO 320 I=1,ii Y = I • hofg I 300. + 0 . 26 • J + 1 .0
call qapos(8.6,2) ! x coordinate call qapoa(y,1) ! y coordinate
DO 330 k=1, ii ty(k) = 66 + J
330 CONTINUE CALL qbuff(ii,ty,O) CALL qbuff(2, ' --' ,0)
320 CONTINUE DO 340 J=O,nchar
call qapoa(8.8,2) ! x coordinate Y = hofg I 300 . + 0.26 * J + 1 .06
call qapoa(y,1) ! y coordinate IF(ILOG .EQ . 0) THEN
XINT = J I (1.•nchar) encode (6,702 , ty) xint
702 format(f6.3) call qlbl(0.1,0.06,0.,6,ty,1)
ELSE XIRT = 10 ** ((J-HCHAR) * ilogl20.)
encode (7,703,ty) xint 703 format(f7 . 6)
call qlbl(0.16,0.12,0 . ,7,ty,1) END IF
340 CONTINUE CALL qbuff(2,'--',0)
c••••••••••••••••••••••••••••••••••••••••••••••••••••••••••••••••••••••••••••• C** Find the root 3 spot beam profile
GOTO 1000 c• Delete font, close files ggg IF (ILOG .ge. 0) then
call qfnt(-1,fta,orient) CALL qini(1)
end if QQ8 STOP
END C!*****************************************************************************
SUBROUTINE READIR(LUH,taize,covO,expoa,time) CONNOR ICI SIZE,HEX
INTEGER HEX(128,128) INTEGER SIZE,TSIZE
c••••••••••••••••••••••••••••••••••••••••••••••••••••••••••••••••••••••••••••••• C•• readin preface of map
READ (LUR,Q12,END=QQQ) imore,covO,expos,time Q12 FORMAT(1X, I6,f6.3,f11.3,f11.1)
if (imore .eq. 0) goto ggg c••••••••••••••••••••••••••••••••••••••••••••••••••***************************** C•• NOW READ II KAP (HEX MATRIX) c••••••••••••••••••••••••••••••••••••••••••••••••••••••••••••••••••••••••••••••
1000 ICOV • 0 DO 1003 I = 1, TSIZE READ (lun,Q11,END=9Q8) (HEX(I,J),J=1,TSIZE)
Q11 FORMAT(1X,100I1) C•• now compute actual coverage on surface c DO 1003 J = 1, TSIZE c IF (HEX(I,J) .HE . 0) ICOV = ICOV + 1
1003 CONTINUE c COY= ICOV I (1.•TSIZE ••2) c••••••••••••••••••••••••••••••••••••••••••••••••••••••••••••••••••••••• ******* C•• return to main program - readin successful
RETURI C•• return to main program - no more mapa on file

000 covo = 0 .0 RETURN
-176 -
C•• return to main program - Unexpected end of file or other error 008 covo = -1.0
RETURN END
C!***************************************************************************** SUBROUTINE DIFFRACT(SCAT,DPAT,IADD) COMMON /A/ INTEN,M,N COMMON /B/ M02P1,COV,COVT,IALL,NSCAT,RSCAT COMMON /C/ SIZE,HEX
REAL•S SCAT(M,H),WK(1486) COMPLEX*16 DPAT(M02P1,N),CVEC(256) REAL INTEN(120,256) INTEGER HEX(128,128) INTEGER SIZE,TSIZE,HSCAT,RSCAT
C******************************************************************************* C•• Leta start by expanding the "Quasi-rectangular" HEX matrix into the C 11 True Rectangular" matrix SCAT
DO 1000 J = 1,H aJ = <J + 1>n DO 1000 I = 1,M SCAT(I,J) = 0 IF (MOD(I+J,2) .EQ. 0) GOTO 1000 SCAT(I,J) = NSCAT * HEX(I,NJ) + RSCAT
1000 CONTINUE C******************************************************************************* C•• Now compute the FFT of the matrix C******************************************************************************* C** COMPUTE THE FFT ALONG THE FIRST AXIS
DO 240 J=1,11 CALL FFTRC(SCAT(1,J),M,DPAT(1 , J),WK , WK)
240 CONTINUE C** COMPUTE THE FFT ALONG THE SECOND AXIS
DO 250 I=1,M02P1 C•• REMOVE ROW FROM MATRIX
DO 261 J = 1,ll CVEC(J) = DPAT(I,J)
251 CONTINUE C** NOW TRANSFORM THE VECTOR
CALL FFTCC(CVEC,H,WK,WK) C•• PUT ROW BACK INTO MATRIX
DO 252 J = 1 , ll DPAT(I,J) = CVEC(J)
252 CONTINUE 250 CONTINUE
C******************************************************************************* C** Now calculate intensity (magnitude ••2) from complex matrix
IF (IADD .eq. 0) THEil DO 206 I=1,M02P1 DO 205 J=1,11
IHTEII(I,J) = 4 . •(CDABS(DPAT(I,J)) / (M•N))••2 c** the 4 adjusts the intensities to reflect that the SCAT array is half zeros 205 COHTIHUE
ELSE DO 208 I=1,M02P1 DO 208 J=1,11
INTEII(I,J) = IHTEli(I,J) + 4.•(CDABS(DPAT(I,J)) / (M•N))**2 c** the 4 adjusts the intensities to reflect that the SCAT array is half zeros 206 CONTINUE
END IF c•••••••••••••••••••••••••••••**************************************************
RETURJI END
C!••*************************************************************************** SUBROUTINE OPEliiN(LUli,LURo,NSCAT,RSCAT,TSIZE,TITLE) COMMOII /pgplt/ MC,NC,K,GAM,ERRS,covS,expoaS,timeS REAL ERRS ( 4) character•72 TITLE

-177-
character•50 fnam INTEGER LUN,LUNo,NSCAT,RSCAT,TSIZE REAL BETA,NU,NUO,E,T,NAAVG,LCTP,CHI
c••••••••••••••••••••••••••••••••••••••••••••••••••••••••••••••••••••••••••••••• WRITE (6,•) 'Enter filename' read (5,035,end=008) fnam
035 format(A50) open (unit=lun, file=fnam, status=' old', err=008)
c•••••••••••••••••••••••••••••••••********************************************** READ (LUN,21,ERR=008,END=008) TSIZE,ED,EN,EA,ER,EN,SO,CHI,TS,
1 DSBINT,IR,TITLE,LCTP ,E,EO,NAAVG,DT,A,NUO,BETA 21 FORNAT(I5,6F10.6,/,3F10 . 3,I12,/,A72,/,F10 . 1,2F10.6,F6.2,
1 F6 .4,F6 .2,E0 . 2,F6 . 1) RATIO = ER / EA
211 WRITE(6,20) TITLE,TSIZE,TSIZE,ABS(ED),EN,ER,EA, 1 RATIO,EN,SO,CHI,TS,IR
20 FORNAT('0',72('*'),/,1X,A72,/,1X,72('*'),//' LATTICE IS ' ,I4, 1 ' BY' , I4, /, ' DESORPTION ENERGY: ' , 2 F5.3,/,' DESTABILIZATION ENERGY FOR FILLED SITE:' ,F7.3,/ , 3 'REPULSIVE INTERACTION ENERGY:' ,F6.3,/, 4 'ATTRACTIVE INTERACTIVE ENERGY:' ,F6 . 3,/, 5 'ER / EA: ',F6.3,/,' MIGRATION ENERGY: ',F7.4,/, 6 ' INITIAL STICKING COEFFICIENT: ',F6.4,/,' CHI=' ,F12.6, 7 /,'ADSORPTION TENPERATURE:',F6 .1,/, 8 'RANDOM STARTING POINT:',I10,//)
C******************************************************************************* RETURI
C•• return to main program - Unexpected end of file or other error 008 TSIZE = -1
RETURH END
C!***************************************************************************** FUNCTION ARR(I,J) CONNON /A/ INTEN,M,H REAL INTEN(120,266) IP = MOD(I,M) + 1 IF (IP .LE. 0) IP = IP + K JP = MOD(J,N) + 1 IF (JP .LE. 0) JP = JP + ll IF (IP .GT. M/2+1 .AND. JP .EQ. 1) THEN
ARR = INTEN(M+2-IP,1) ELSE IF (IP .GT. M/2+1) THEH
ARR INTEN(M+2-IP,N+2-JP) ELSE
ARR = IlfTEN (IP. JP) END IF RETURH END
C!**************************************************************************** subroutine font(LUH,nr,nc,den) Program to create PIXEL Array for LASER PRINTER is number"of columna (bits per row); is number of rows (bits per column) ;
C• ncp C• nch ! c•• How
byte pixel(60),ca(16),lpixel(100,100) data ca/'0','1','2','3','4','6', '6','7','8','0' , 1 'A', ' B', 'C', 'D', 'E', 'F'/ data ir/1010101/ ncp = (nc + 16.)/16 . nch = 4•ncp ncp = 16•ncp
ia nc after padding to a multiple of 16 ia number of characters per row type •,nc,nr,ncp,nch for the "rule" to determine the pattern if (den .ge. 0 . 6) then
fill = 1 oTer = 0 idota = (1. - den) * nr * nc + 0.6
else fill = 0
number of dota to set

-178 -
over = 1 idots = den * nr * nc + 0 . 5 number of dots to set
end if do 200 j=1,nr do 200 i=1,ncp if (i .gt. nc) then
lpixel(i , j) 0 else
lpixel(i,j) =fill end if
200 continue do 210 k=1,idots
211 i = nc * ran(ir) + 1 j = nr • ran(ir) + 1 if (lpixel(i,j) .eq . over) goto 211
lpixel(i,j) = over 210 continue
Dlll = 0 do 100 j=1,nr type 1,(lpixel(i,j) , i=1,ncp)
1 format(1x,100i1) do 400 i=1,ncp , 4 num = 1 + lpixel(i,j)•8 + lpixel(i+1,j)•4 + 1 lpixel(i+2,j)•2 + lpixel(i+3 , j) Dlll = Dlll + lpixel(i,j) + lpixel(i+1,j) + 1 lpixel(i+2,j) + lpixel(i+3,j) pixel((i-1)/4+1) = ca(num)
400 continue CALL qbuff(nch, pixel,O)
c type 2,(pixel(i),i=1,nch) 2 format(1x,20a1) 100 continue ! type •,'density : ' ,den, :DJD/(1 . •nr•nc) , '(actual)'
return end

179
Section II.
Reaction of Carboxylate and Ketone
Ligands on Metal Surfaces
Chapter 4. Introduction
Chapter 5. Decomposition of Formic Acid on Ru(OOl): An EELS Search
for a Formic Anhydride Intermediate
Chapter 6. Electron Energy Loss Spectroscopy of the Decomposition of
Formic Acid on Ru(OOl)
Chapter 7. The Adsorption of Formic Acid and the Decomposition of the
Formate Intermediate on the (001) Surface of Ruthenium
Chapter 8. Contrasting Bonding Configurations of Acetone on Pt(lll)
and Ru(OOl) Surfaces
Appendix D: End-On and Side-On Bonding of Ketones to Surfaces: Acetone
on the Ru(OOl) and Pt(lll) Surfaces
Appendix E: Adsorption of Acetone both on the Clean Ru(OOl) Surface and
on the Ru(OOl) Surface Modified Chemically by the Presence
of an Ordered Oxygen Adatom Overlayer

1?<0
C h apter 4:
Introduction to Section II.
Reaction of Carboxylate and Ketone
Ligands on Metal Surfaces.

1 81
The interactions of molecules with surfaces has been an important field of
study since the pioneering work of Langmuir. VVith the advent of modern ultra
high vacuum techniques and continua l improvements in sensitivity, reliability
and decreased cost of solid-state electronic devices, new fields have opened.
Detailed study of the bonding and reactions of molecules and m etal surfaces is
now possible .
Signal detection is a fundamental difficulty in these systems. Techniques
used in surface science must measure a signal corresponding to a density
on the order of 10 13 to 1015 surface species per cm2 • Thus, the number
of interactions that occur between a probe and surface species is limited
by the physical size of the sample and experimental system. Techniques
must also b e able to distinguish surface properties from properties of the
bulk material. The work described in the following section of this Thesis
relies on two complementary techniques , high-resolution electron energy loss
spectroscopy and thermal desorption mass spectrometry, techniques which
are very well suited to the problem of determining adsorbate geometry and
desorption/ decomposition reaction kinetics.
Electron energy loss spectroscopy (EELS) allows measurement of the
vibrational modes of adsorbed molecules. For the experimental results presented
in this Thesis, a highly monochromatic beam of electrons (typically with an
energy of 4 eV) is focused on a small area of the sample, which in the case
of these studies is the [001] face of a Ru crystal. While most of the electrons
incident on the sample are captured and conducted to ground, those electrons
which are scattered from the surface (usually 1 to 10%) can be detected by
an electron multiplier mounted in the energy analyzer, a second independent ·
electron monochromator [1]. An EELS spectrum is measured by counting the
number of scattered electrons while sweeping the energy of the analyzer.
While most of the electrons are scattered elastically, that is retaining their
incident energy, a small number of electrons, (usually less than 1%) lose or gain

182 -
characteristic amounts of energy by coupling to vibrational modes of the surface
or the adsorbate molecules. Two mechanisms have been have been determined
for electron scattering, dipolar scattering and impact scattering.
In dipolar scattering, incident electrons couple to a time-dependent elec
tronic (vibrational) dipole caused by instantaneous charge separation between
two (or more) atoms. The metal surface can be modeled as a gas of free electrons
which interacts with vibrational mode dipoles by creating an image dipole. This
image dipole is parallel to the component of a vibrational mode dipole perpen
dicular to the surface and is antiparallel to the component of the vibrational
mode dipole parallel to the surface. This effect cases the surface to enhance the
dipole moment of vibrational modes with dipoles perpendicular to the surface
and shield dipoles parallel to the surface. This results in the surface selection
rule, which predicts that only modes with a perpendicular component to their
dipole moment will have a high cross-section for dipolar scattering. The cross
section is highest for dipolar scattering the specular direction [2].
The mechanism of impact scattering involves short-range interaction be
tween the incident electron and an electron potential function of an atom. There
is no requirement for dipole orientation, but impact scattering is most commonly
observed for modes of hydrogen atoms at the incident electron energies used for
these experiments. The scattering is diffuse and, unlike dipole scattering, is not
strongly peaked in the specular direction [ 2].
Thermal desorption mass spectrometry (TDMS) is performed by adsorbing
molecules onto a surface and then heating the surface while monitoring the
partial pressures of desorbing molecules with a mass spectrometer as a function
of surface temperature. If the heating rate is slow and the rate of pumping is
high, as is the case for the experiments described in this Thesis, the rate of
desorption of a species can be well approximated by its partial pressure and
the surface coverage can be determined by integrating the mass spectrometer
intensity as a function of time. Analysis of thermal desorption lineshapes and
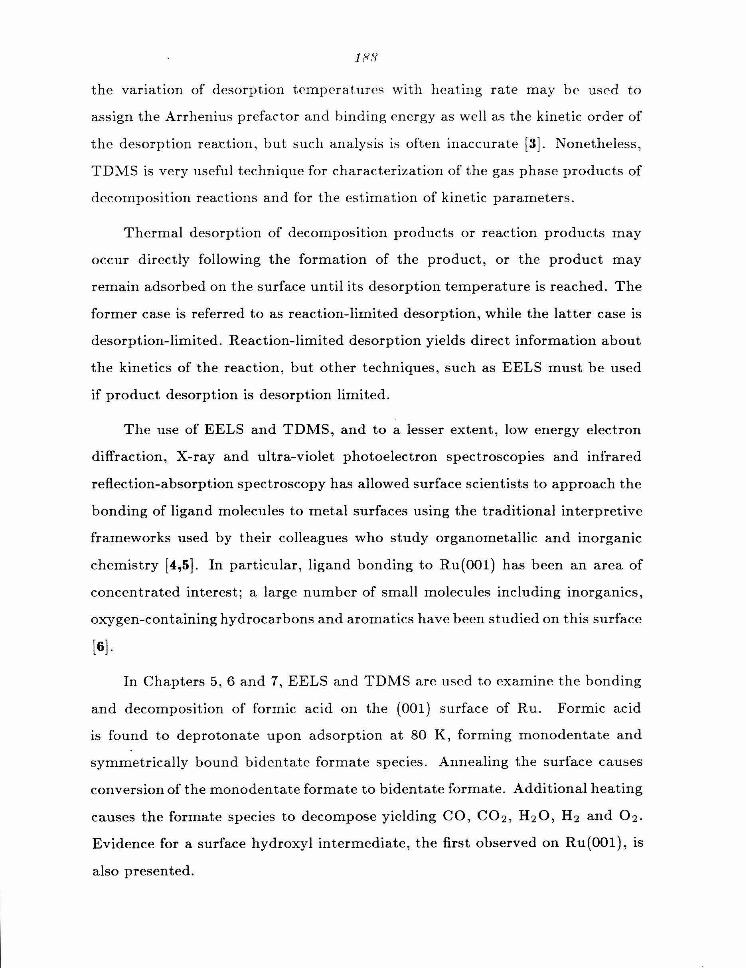
1 ?<.'1
the variation of desorption temperatures with heating rate may be us<'d to
assign the Arrhenius prefactor and binding energy as well as the kinetic order of
the desorption reattion, but such analysis is often inaccurate [3]. Nonetheless,
TDMS is very useful technique for characterization of the gas phase products of
decomposition reactions and for the estimation of kinetic parameters.
Thermal desorption of decomposition products or reaction products may
occur directly following the formation of the product, or the product may
remain adsorbed on the surface until its desorption temperature is reached. The
former case is referred to as reaction-limited desorption, while the latter case is
desorption-limited . Reaction-limited desorption yields direct information about
the kinetics of the reaction, but other techniques, such as EELS must be used
if product desorption is desorption limited.
The use of EELS and TDMS, and to a lesser extent, low energy electron
diffraction, X-ray and ultra-violet photoelectron spectroscopies and infrared
reflection-absorption spectroscopy has allowed surface scientists to approach the
bonding of ligand molecules to metal surfaces using the traditional interpretive
frameworks used by their colleagues who study organometallic and inorganic
chemistry [4,5]. In particular, ligand bonding to Ru(OOl) has been an area of
concentrated interest; a large number of small molecules including inorganics,
oxygen-containing hydrocarbons and aromatics have been studied on this surface
[6].
In Chapters 5, 6 and 7, EELS and TDMS are used to examine the bonding
and decomposition of formic acid on the (001) surface of Ru. Formic acid
is found to deprotonate upon adsorption at 80 K, forming monodentate and
symmetrically bound bidentate formate species. Annealing the surface causes
conversion of the monodentate formate to bidentate formate. Additional heating
causes the formate species to decompose yielding CO, C02, H20, H2 and 02.
Evidence for a surface hydroxyl intermediate, the first observed on Ru(OOl), is
also presented.

184
In Chapter 8, Appendix D and Appendix E, the bonding and decompo~ition
of acetone is studied on Ru(OOl) using EELS and TDMS. Molecular acetone
is found to bond to the Ru(OOl) surface in two configurations, an rJ 1 species,
bonded through the oxygen atom, and an rt 2 species bonded side-on through
the 0-C bond. The ry 2 species is bonded irreversibly and decomposes with
heating, while the rt 1 desorbs molecularly. The rt 1 species is present in small
concentrations on clean Ru(OOl), but preadsorption of an ordered p(2 x 2) 0
adatom over layer increases the concentrations of the rt 1 species with respect to
the ry 2 form. In Chapter 8, results for acetone adsorbed on the Pt(lll) are also
presented. On this surface only the rt 1 species is observed and acetone does not
decmnpose. Frorn this work, a correlation can be made between surface Lewis
acidity and bonding configurations of ketones.

18S
References
[1] G. E. Thomas and W. H . Weinberg. Rev . Sci. Instrum. 50, 497 (1979).
[2] H. lhac:h and D. L. Mills , Electron Energy Loss Spectroscopy and Surface
Vibrations , (Academic Press, New York, 1982).
[3] J . M. Soler and N. Garcia, Surface Sci. 124, 563 (1983).
[4] N.D. S. Canning and R .. J. M adix, J. Phys. Chern. 88, 2437 (1984).
[5] N. R. Avery, .J. Vac. Sci. Technol. A 3, 1459 (1985).
[6] K. L. Shanahan and E. L. Muetterties, J . Phys. Chern. 88, 1996 (1984).

186
Chapter 5:
Decomposition of Formic Acid on Ru(OOl):
An EELS Search for a Formic Anhydride Intermediate
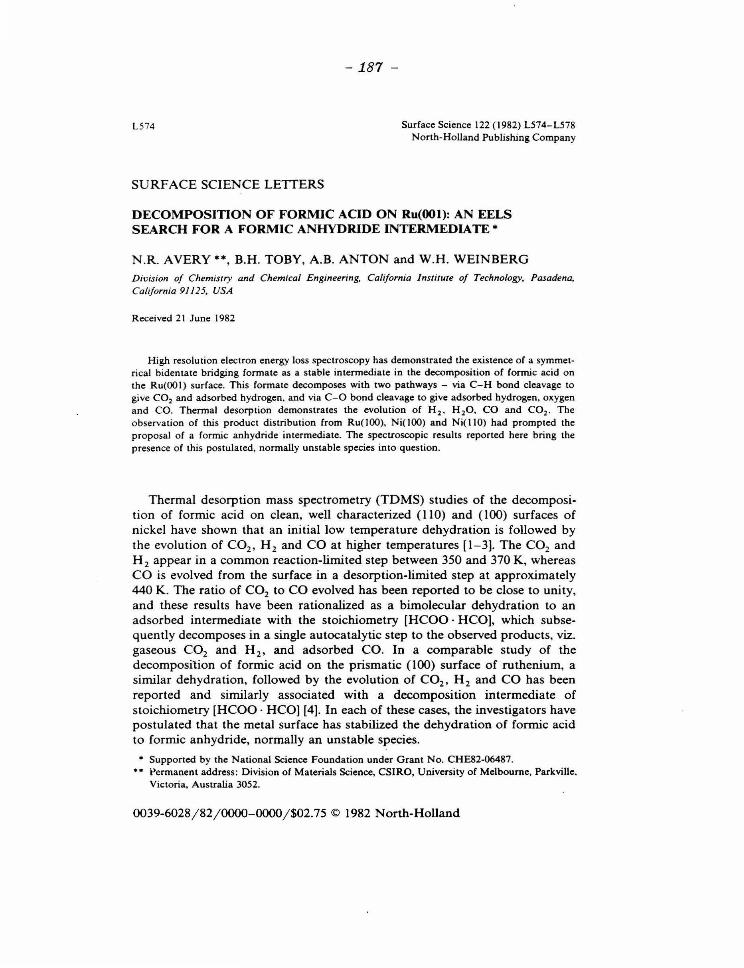
L574
SURF ACE SCIENCE LEITERS
-187-
Surface Science 122 (1982) L574-L578 North-Holland Publishing Company
DECOMPOSITION OF FORMIC ACID ON Ru(OOl): AN EELS SEARCH FOR A FORMIC ANHYDRIDE INTERMEDIATE*
N .R. AVERY**, B.H . TOBY, A.B. ANTON and W.H. WEINBERG Division of Chemistry and Chemical Engineering, California Institute of Technology, Pasadena, Califoroia 91125, USA
Received 21 June 1982
High resolution electron energy loss spectroscopy has demonstrated the existence of a symmetrical bidentate bridging formate as a stable intermediate in the decomposition of formic acid on the Ru(OOl) surface. This formate decomposes with two pathways - via C-H bond cleavage to give C02 and adsorbed hydrogen, and via C-0 bond cleavage to give adsorbed hydrogen, oxygen and CO. Thermal desorption demonstrates the evolution of H 2 , H 20, CO and C02 . The observation of this product distribution from Ru(lOO), Ni(lOO) and Ni(llO) had prompted the proposal of a formic anhydride intermediate. The spectroscopic results reported here bring the presence of this postulated, normally unstable species into question.
Thermal desorption mass spectrometry (TDMS) studies of the decomposition of formic acid on clean, well characterized (1 10) and (100) surfaces of nickel have shown that an initial low temperature dehydration is followed by the evolution of C02 , H 2 and CO at higher temperatures [1-3). The C02 and H 2 appear in a common reaction-limited step between 350 and 370 K, whereas CO is evolved from the surface in a desorption-limited step at approximately 440 K . The ratio of C02 to CO evolved has been reported to be close to unity, and these results have been rationalized as a bimolecular dehydration to an adsorbed intermediate with the stoichiometry [HCOO · HCO], which subsequently decomposes in a single autocatalytic step to the observed products, viz. gaseous C02 and H 2 , and adsorbed CO. In a comparable study of the decomposition of formic acid on the prismatic (100) surface of ruthenium, a similar dehydration, followed by the evolution of C02 , H 2 and CO has been reported and similarly associated with a decomposition intermediate of stoichiometry [HCOO · HCO] [4). In each of these cases, the investigators have postulated that the metal surface has stabilized the dehydration of formic acid to formic anhydride, normally an unstable species.
• Supported by the National Science Foundation under Grant No. CHE82-06487. Permanent address: Division of Materials Science, CSIRO, University of Melbourne, Parkville, Victoria, Australia 3052.
0039-6028j 82j 0000- 0000j $02.75 © 1982 North-Holland

-188-
N.R. Avery eta/. /Decomposition of formic acid on Ru(OOJ) L575
By contrast, the decomposition of formic acid on Cu(100) [5], Ag(IIO) [6] and Pt(l11) [7] yields only C02 and H 2 in a simple unimolecular dehydrogenation of an adsorbed formate intermediate. In each of these instances, Bronsted deprotonation of the adsorbed formic acid to the adsorbed formate intermediate has been confirmed spectroscopically by electron energy loss spectroscopy (EELS).
In this Letter we report some pertinent aspects of a TOMS and EELS study of the decomposition of formic acid on the close-packed (001) surface of ruthenium [8). Although this is not the same surface of ruthenium for which TOMS has implied the existence of a formic anhydride intermediate [4], we expect that the fundamental chemistry of the two ruthenium surfaces will be quite similar, as is the case for the (I 00) and ( 110) surfaces of nickel [3]. The aim of this study is to determine unequivocally, via EELS, the structure of the
(f)
1-z :::l
~ 0:: <!: 0:: 1-as 0:: <!:
80 ~ 1-V) z w 1-z
J 0
Ru(OOI) + HCOOH
SOK
~I X IOO I --~----- (d) BOOK
(b) 320 K
~ XIOOO
(a) 200K
I 000 2000 3000
ENERGY LOSS, cm-1
Fig. I. EEL spectra obtained after adsorption of fonnic acid on a clean Ru(OOI) surface at 80 K followed by annealing to the indicated temperatures.

-189 -
L576 N. R. Avery• er a/. / Decomposition of formic acid on Ru(OOJ)
prominent adsorbed intermediate formed by decomposition of formic acid on Ru(OOl) and to reevaluate the feasibility of a decomposition scheme which proceeds through formation of a normally unstable formic anhydride intermediate. The electron energy loss spectrometer used in this work and the ultrahigh vacuum apparatus in which it is housed have been described in detail previously [9].
Fig. 1 shows a sequence of EEL spectra which were obtained after the adsorption at 80 K of slightly in excess of one monolayer of formic acid on a clean Ru(OO l) surface, followed by annealing to the indicated temperatures. Annealing to 200 K causes molecularly adsorbed (multilayer) formic acid to desorb, and the resulting EEL spectrum (fig. la) shows four conspicuous bands at 382, 807, 1358 and 2917 em- 1 which are easily assigned to the v(Ru-0), c5(0CO), v,(OCO) and v(CH) modes of an adsorbed formate, respectively [5-7]. Note also the absence of vibrational bands at 1040-1175 and 1700- 1775 em- 1 in this spectrum, as would be seen for the v,(COC) and v,(CO) modes of an adsorbed anhydride, respectively [10]. The inherently strong v,(OCO) mode, expected at 1600 em- 1 for an adsorbed formate, has B 1 symmetry and could not be detected. This indicates, according to the surface selection rule for dipole excitations, an equivalence of the two oxygen atoms. Furthermore, the similarity between the frequencies of the v,(OCO) mode for the adsorbed formate (1358 cm - 1
) and the free formate ion (1366 cm- 1) suggests a
symmetric bidentate bridging configuration, as shown below [7,11]:
H
I c
0!.-\ I
- Ru- Ru-
The only other surface species which could be detected is a weak band at 1999 em -I (fig. 1a) due to adsorbed CO [12]. This CO, representing Jess than 0.05 monolayer, is due to the onset of decomposition of the adsorbed formate and correlates with the evolution of H 20 below 200 K . Further annealing to 320 K (fig. 1 b) causes the intensities of the bands due to the adsorbed formate to decrease and those due to adsorbed CO to increase, At 350 K (fig. 1c), the decomposition of the adsorbed formate is complete. Annealing to 800 K (fig. 1 d) resulted in the desorption of CO, revealing a weak band at 541 em- 1 which could be removed by further annealing to 1630 K. This band is due to a small residual concentration of oxygen adatoms [13].
TOMS results demonstrate the evolution of HCOOH, H 20, H 2 , C02 and CO from the Ru(OO I) surface and reveal a complicated mechanism of decomposition. For initial coverages in excess of one monolayer, molecular formic

-190 -
N.R. Avery era/. / Decomposition of f ormic acid on Ru(OOI) L577
acid from condensed multilayers desorbs with a peak temperature of 195 K. A second molecular formic acid desorption feature is seen at 350 K for low coverages, shifting to 375 K and saturating for all initial coverages of a monolayer or greater. No molecular formic acid is detected by EELS above 200 K, suggesting that the desorption of formic acid at 350-375 K is due to recombination of adsorbed hydrogen and formate. For submonolayer initial coverages, H 20 desorbs in two peaks with maxima at 160 and 275 K . As mentioned earlier, this H 20 results from decomposition of the adsorbed formate and correlates with the appearance of CO in the EEL spectra. Carbon dioxide is evolved in a single reaction-limited step with a peak temperature of 300 K for low initial coverages, shifting to 365 K for saturation coverage. This temperature shift results from increased stability of the adsorbed formate at higher coverage [8). Hydrogen is evolved in a single desorption-limited step with a peak temperature of 455 K for low initial coverages, shifting to 375 Kat saturation. In this case the temperature shift probably results from repulsive interactions among hydrogen adatoms and other adsorbed species, the net effect of which increases with total surface coverage [14). Carbon monoxide is evolved in a single desorption-limited step with a peak temperature of 480 K, and a trace of adsorbed oxygen remains to approximately 1600 K.
Since the probability of CO oxidation to C02 on Ru(001) under the conditions prevailing in these experiments is on the order of 0.1% of the probability of CO desorption [15], the appearance of both C02 and CO in TOMS results indicates that formic acid decomposes by two competing mechanisms on Ru(OO 1 ). Initial dehydrogenation of formic acid to an adsorbed formate intermediate is followed by decomposition of the formate through dehydrogenation or through C-0 bond cleavage. The integrated intensities of the C02 and CO desorption peaks, corrected for the relative sensitivity of the quadrupole mass spectrometer to each species, yield a ratio of CO to C02
evolution of approximately three to one, indicating that formate decomposition through C-0 bond cleavage is more rapid than by simple dehydrogenation. An overall reaction scheme consistent with all EELS and TOMS results for formic acid decomposition on Ru(001) can be written as follows ((a) denotes an adsorbed species, (g) denotes a gaseous species):
Following adsorption of formic acid in excess of one monolayer, molecules in multilayers desorb intact near 195 K, while those in contact with the surface decompose to yield an adsorbed formate. Some recombination occurs on the surface to yield molecular formic acid near 375 K;
HCOOH(g).: HCOOH(a), HCOOH(a).: HCOO(a) + H(a).
The formate species decomposes by two competing mechanisms to yield adsorbed CO over a broad temperature range (150-400 K) and gaseous C02
between 300 and 365 K Mechanism (1) is more rapid than mechanism (2):

-191 -
L57H N.R. Avery eta/. I Decomposition of formic acid on Ru(OOI)
( ) _.. H{a) + CO{ a)+ O{a) ,
HCOO a"' H{a) + C02 {g).
{1)
{2)
Hydrogen adatoins and oxygen adatoms from formate decomposition recombine to yield water at 160 and 275 K:
H{a) + O{a)-+ OH{a) , OH{a) + H{a)--+ H 20{g).
Hydrogen and CO are evolved in desorption-limited steps at 375-455 K and 480 K, respectively. The oxygen ada toms, present in low concentration, are dissolved into the bulk of the Ru at approximately 1600 K,
2 H{a)-+ H 2{g) , CO( a)- CO{g), O{a)- O(disso1ved).
In conclusion, the products of the decomposition of formic acid on Ru(OOI) are the same as those observed on Ru(IOO), Ni(IOO) and Ni(110), yet only a formate intermediate is present on Ru(001) as verified by EELS. The adsorbed formate intermediate present on Ru(001) does not decompose exclusively by dehydrogenation, as observed for formate intermediates on Cu(100) [5], Ag(110) [6] and Pt(111) [7], but also by C-0 bond cleavage. These results bring into question earlier speculation of the presence of a formic anhydride intermediate on Ru( 1 00), Ni( I 00) and Ni( 11 0) which was inferred from the distribution of desorbing products of the decomposition reaction [ 1-4].
References
[I) R.J. Madix and J .L. Falconer, Surface Sci. 5 I (I 975) 546. (2) J .B. Benzinger and R.J. Madix, Surface Sci. 79 (1979) 394. (3) R.J. Madix, Advan. Catalysis 29 (1980) I. (4) L.A. Larsen and J.T. Dickinson, Surface Sci. 84 (1979) 17. (5] B.A. Sexton, Surface Sci. 88 (1979) 319. (6) B.A. Sexton and R.J. Madix, Surface Sci. 105 ( 1981) 177. [7) N.R. Avery, Appl. Surface Sci. I 1/ 12 (1982) 774. [8) B.H. Toby, N .R . Avery, A.B. Anton and W.H . Weinberg, in preparation;
also, B.H. Toby, N .R. Avery, A.B. Anton and W.H . Weinberg. in: Proc. 3rd Intern. Conf. on Vibrations at Surfaces, Asilomar, CA, 1982, to be published.
(9) G .E. Thomas and W.H. Weinberg, Rev. Sci. Instr. 50 (1979) 497. [10) N .B. Colthup. J . Opt. Soc. Am. 40 (1950) 397. (I I) K. Nakamoto, Infrared and Raman Spectra of Inorganic and Coordination Compounds
(Wiley, New York, 1978) p . 232. (12) G.E. Thomas and W .H. Weinberg. J . Chern. Phys. 70 (1979) 1437. [13) G.E. Thomas and W.H. Weinberg, J . Chern. Phys. 69 (1978) 361 I. (14) This effect has been demonstrated for the coadsorption of H 2 and CO on Ru(OOJ). See: D .E.
Peebles, J.A. Schreifels and J.M. White, Surface Sci. I 16 (1982) I 17. (15) H.l. Lee, G. Praline and J.M. White. Surface Sci. 91 (1980) 581.

192
C h apter 6 :
Electron Energy Loss Spectroscopy of the
Decomposition of Formic Acid on Ru(OOl)

-199 -
Journal of Electron Spectroscopy and Related Phenomena, 29 (1983) 317-321 Elsevier Scientific Publishing Company, Amsterdam- Printed in The Netherlands
317
ELECTRON ENERGY LOSS SPECTROSCOPY OF THE DECOMPOSITION OF FORMIC ACID ON Ru(OOl)*
B. H. TOBY1, N.R . AVERY2 , A.B. ANTON1 and W.H. WEINBERG1
1Division of Chemistry and Chemical Engineering, California Institutue of Technol ogy, Pasadena, California 91125 U.S.A.
2Division of Materials Science, C. S.I .R.O., University of Melbourne, Parkville,
Victoria, Australia 3052.
ABSTRACT Electron energy loss spectroscopy has demonstrated the existence of both a mono
dentate and a symmetric bidentate bridging formate as stable intermedi ates in the decomposition of formic acid on the Ru(OOl) surface . The monodentate formate converts upon heating to the bidentate formate which decomposes via two pathways: C-H bond cleavage to yie ld C02 and adsorbed hydrogen; and C-0 bond cleavage to yield adsorbed hydrogen, oxygen and CO . Thermal desorption spectra demonstrate the evolution of H2, H20, CO and C02 as gaseous products of the decomposition reaction. The observation of this product distribution from Ru(lOO), Ni(lOO) and Ni(llO) had prompted the proposal of a formic anhydride intermediate, the existence of which is rendered questionable by the spec troscopic results reported here.
INTRODUCTION Recently, electron energy loss spectroscopy (EELS) has shown clearly that a
formate is the stable surface intermediate in the decomposition of formic acid on (lOO)Cu (ref.l,2), Ag(llO) (ref.3) and Pt(lll) (ref.4) surfaces. However,
based on indirect evidence, namely the product distribution in thermal desorption spectra, formic anhydride has been postulated to be a stable intermediate
in the decomposition of formic acid on Ni(lOO) and (110)(ref . 5-7) and Ru(lOO) (ref .8 ) surfaces . The present work was undertaken in order to decide whether a
formic anhydride species exists on the (001) surface of Ru under any
circumstances.
EXPERIMENTAL PROCEDURES All relevant experimental details including a description of the EEL spec
trometer (ref.9), the preparation of the clean Ru(OOl) surface (ref.lO) and the handling of formic acid in the UHV system (ref.ll) have been described
previously.
* Supported by the National Science Foundation under Grant No. CHE82-06487.
0368-2048/83/000CJ-Q000/$03.00 © 1983 Elsevier Scientific Publishing Company

- 194 -
318
RESULTS AND DISCUSSION
Electron energy los s spectra corresponding to exposures of formic ac id greater than 4L at 80 K show bands characteristic of the molecular species, indicating
multilayer condensation. Annealing to 200 K causes the multilayers of formic acid to desorb, and the resulting EEL spectrum [Fig . 1(a)] shows four ba nds at
382, 807 , 1358 and 2917 cm-l whi ch are assigned easily to the vs(Ru-0), c(OCO) ,
vs(OCO) and vs (CH) modes of an adsorbed formate, respectively (ref.l-4,11).
The inherently strong v (OCO) mode, expected near 1600 cm-1 for an adsorbed fo r -a mate , ha s s1 symmetry and could not be detected. Thi s indicates, according to
the surface selection rule for di polar excitations, an equivalence of the two
oxygen atoms . Furthermore, the similarity between the frequencies of the vs(OCO) mode for the adsorbed formate (1358 cm-1) and the free formate ion
(1366 cm- 1) suggests a symmetri c bidentate bridging configuration of c2v symmetry, as shown schematically in (a) below (ref.12) .
H I
c o.l-~~ I I
- Ru - Ru -
(a)
0~ c
/ ......._ H
0 : I I
- Ru -(b)
Ru(OQI) + HCOOH SOK
.~ldi BOOK
Fig. 1. EEL spectra obtained after the adsorption at 80 K of slightly in excess of one monolayer of formic acid on a clean Ru(001) surface, followed by annealinq to the indicated temperatures.

- 195 -
319
The wea k band at 1999 cm- l in Fig. l(a ) is due to adsorbed CO (ref.l3). This
CO , represen ting les s than 0.05 monolayer, is due to the onset of decompositi on
of the adsorbed formate and cor relates with the evolut i on of H20 below 200 K. Further annealing to 320 K [Fig . l (b)] causes the i ntensities of the bands due to the adsorbed f ormate t o decrease and those due to adsorbed CO to increa se . At 350 K [Fi g. l (c )] , the decomposition of the adsorbed formate i s complete. Annea l ing to 800 K [Fig. l (d)] results i n t he desorption of CO , revealing a weak
band at 541 cm-l which could be removed by further annealing to 1630 K. Thi s
band i s due to a small resi dua l concent ra tion of oxygen adatoms (ref. 10). An EEL spectrum corresponding to a submonolayer coverage of dissocia tively ad
sorbed formic acid at 80 K is shown i n Fig. 2. In addition to those modes
observed i n Fig . l (a), there are additional bands at 11 58, 1681, and 2357 cm- l.
The latter are assigned to the ~(CH), the va(OCO) , and a "softened" vs(CH) mode [verified with DCOOD (ref . l4 )] , respectively, for a monodentate f ormate , shown
schemati cal l y i n (b) above. Si nce both the n(CH) mode of s2 symmetry and the va(OCO) mode of s1 symmetry are dipolar all owed, the formate is of c1 symmetry, i.e. tilted with respect to the page in (b) above. The "softening" of the
vs(CH) mode, wh ich is manifest by a dec rease of its f reque ncy by over 500 cm- l,
indicates an H- Ru interact i on in the chemisorbed monodentate formate . Below 200 K, both the monodentate and bidentate formate s coex i st on the Ru surface.
An neali ng the surface with both types of formate present to 200 K causes the bands corres ponding t o the mo nodentate species t o disappear, and those
Vi 10°c.ps.
f-
z :::::>
>a:: <l: a:: f-
Ill
~~~· I >f-
(f)
z w fz
371
Ru (001) + HCOOH SOK
1343 f.l\_23~7 2934
1681 I I 1975
1 ~1000
3000
Fig . 2. EEL spectrum obtained after the adsorpti on at 80 K of a submonolayer amount of formi c acid on a clean Ru(OO l ) surface .

-196 -
320
corresponding to the bidentate spec i es to increase i n intens ity. This i s clea r
evidence of the irreverible conversion of a monodentate t o a bidentate bridging
formate on the Ru(OOl) s urface.
Thermal desorption results demonstrate the evolution of HCOOH, H20, H2, co2 and CO from the Ru( OO l ) surface and reveal a complicated mechani sm of decomposi
tion . For init ia l coverages in excess of one monolayer, molecular f ormic aci d
from condensed multilayers desorbs wi t h a peak temperature of 195 K. A second
molecular formic acid desorpti on feature i s seen at 350 K for low coverages,
shifting to 375 K and saturat i ng for all initia l coverages of a monolayer or
greater. No molecular formi c aci d is detected by EELS above 200 K, suggesting
t ha t the desorption of formic acid at 350- 375 K is due to recombination of ad
sorbed hydrogen and formate. For submonolayer initial coverages, H20 desorbs in
two peaks with maxima at 160 and 275 K. As mentioned earlier, this H2o result s
from decomposition of the adsorbed formate and correlates with the appearance of
CO i n the EEL spectra. Carbon dioxide is evolved in a single reaction-limited
step with a peak temperature of 300 K for low initial coverages, shifting to
365 K for saturati on coverage. Thi s temperature shift results from an increased
s ta bi lity of the adsorbed formate at higher coverage (ref.ll,l4). Hydrogen i s
evolved in a single desorption-limited step with a peak temperature of 455 K for
low initial coverages, shifting t o 375 K at saturation. Carbon monoxide is
evolved in a single desorption-li mi ted step with a pea k temperature of 480 K. Since the probability of CO ox idati on to C0 2 on Ru(OOl ) under the conditions
preva il ing in these experi men t s is on the order of 0. 1 percent of the probability
of CO desorption (ref . 15) , the appearance of bo th C02 and CO in the thermal de
so rption spectra indicates that formic acid decomposes by two competing mechan
isms on Ru(OOl) . Initial dehyd rogenation of formic acid to an adsorbed formate
intermediate is followed by decomposition of the formate e~tner through dehydro
genation or through C- 0 bond cleavage with the latter favored somewhat, as
judged by relat ive areas of thermal desorption peaks, i.e., CD
HCOO( a ) - H(a) + CO( a) + O(a)
~ H(a) + C02( g)
Reaction(l)is not only slightl y favored kinetically over reaction ®, it is
also (marginally ) favored thermodynamically, by appro xi mately 6 kcal /mol (ref.l6).
Formic acid dehydrogenates upon adsorption on Cu( l 00)(ref.l,2 ), Ag(llO) (ref.3), and Pt(lll)(ref.4) to yield a chemisorbed formate intermediate which decomposes
via C-H bond cleavage exclusively . However, on Ni( llO), Ni(lOO)(ref.5-7) and
Ru(l00)(ref .8) , the s ame distribution of the products of decomoosition was ob
served as that reported here. On these surfaces, a formic anhydride intermedi
ate was postu lated to explain the observed product distribution. The fact that
the f ormic anhydride intermediate does not exist on Ru(OOl) under any

-197 -
321
circumstances brings i nto considerable doubt its existence on Ni(110), Ni(100),
and Ru(100).
REFERENCES
1 B.A. Sexton, Surface Sci. 88, 319 (1979). 2 8.E. Hayden and A.M. Bradshaw (private communica tion). 3 B.A. Sexton and R. J . Madix, Surface Sci. 105, 177 (1981). 4 N.R . Avery, Appl . Surface Sci. 11 /12, 774 (1982). 5 R.J . Madix and J.L . Falconer, Surface Sci. 51, 546 (1975). 6 J . B. Benzinger and R.J. Madix, Surface Sci. 79, 394 (1979). 7 R. J . Madix, Advan. Catal. 29, 1 (1980). 8 L.A . Larsen and J .T. Dickinson, Surface Sci. 84, 17 (1979) . 9 G.E . Thomas and W. H. Weinberg , Rev. Sci. Instrum. 50, 497 (1979) . 10 G.E. Thomas and W.H. Weinberg, J. Chern. Phys. 69, 3611 (1978); 70, 954
( 1979) 0
11 N.R. Avery, B.H. Toby, A. B. Anton and W.H. Weinberg , Surface Sci. (in press) . 12 K. Nakamoto, Infrared and Raman Spec~ra of I norganic and Coordinat ion
Compounds, Wiley, New York, 1978. 13 G.E. Thomas and W.H. Weinberg, J. Chern . Phys . 70, 1437 (1979) . 14 B.H. Toby, N.R. Avery, A.B. Anton and W.H . Wein berg (in preparation) . 15 H.l. Lee, G. Praline and J.M. White, Su r face Sci. 91, 581 (1980). 16 W.H. Weinberg, unpublished results.

198
Chapter 7:
The Adsorption of Formic Acid and the Decomposition of
the Formate Intermediate on the (001) Surface of Ruthenium
Abstract
1. Introduction
2 . Experimental Procedures
3. EELS Identification of Adsorbed Species
3.1 Molecular Formic Acid
3.2 Monodentate Formate
3.3 Bidentate Formate
3.4 Surface Hydroxyl
3.5 Formate Decomposition Products
4. Thermal D esorption Mass Spectrometry Results
4 .1 Formic Acid D esorption
4.2 C02 Desorption
4 .3 CO Desorption
4.4 Hydrogen Desorption
4.5 Water Desorption
5 . Conclusions

199
ABSTRACT
The adsorption offormic acid on the clean Ru(OOl) surface has been studied
by electron energy loss vibrational spectroscopy and thermal desorption mass
spectrometry. Large exposures of formic acid produce a molecular multilayer
species with vibrationa.l frequencies similar to those of crystalline formic acid .
Two different formate species (a monodentate and a bidentate formate) and a
surface hydroxyl have been identified as stable inter!.nediates in the decomposi
tion of formic acid on the Ru(OOl) surface. The monodentate formate species
has a v(C= O) mode at 1345 cm- 1 and a softened C-H stretching mode, charac
teristic of a surface-hydrogen interaction. The monodentate formate species is
completely converted to the bidentate specie~ by heating to 200 K. The biden
tate formate species is believed to bridge two adjacent binding sites. The formic
acid decomposition products are C02, CO, H2 , H20 and oxygen adatoms. The
ratio of desorbcd CO with respect to desorbed C02 increases both with slower
heating rate and with lower formate coverages.

20()
1. INTRODUCTION
Among the goals of surface sc ience are the identification and characteriza
tion of adsorbed intermediates which serve to delimit the number of possible
reaction mechanisms in catalytic reactions. The study of adsorbate structure
and bonding provides a basis for understanding the role of the catalytic sur
face in heterogeneous catalysis. Of particular interest are reactions of molecules
containing carbon-oxygen bonds , since numerous catalytic reactions involve the
formation or cleavage of C-0 bonds or the activation of carbon centers bonded
to oxygen atoms in elimination, addition or reduction reactions. For this rea
son, there has been considerable interest in the interactions of formic acid with
metal and metal oxide surfaces as model systems for carboxylate catalysis [1].
A goal of this work has been determining reaction m echanisms and the factors
that influence catalytic specificity for different decomposition products.
Single crystalline surfaces offer the advantage of having well defined ge
ometrical structures to which a wide array of surface sensitive spectroscopies
may be applied. Using a number of these techniques , a large data base has been
developed concerning the mechanism and the kinetics of the decomposition of
formic acid. Most metal surfaces fall into two distinct classes with respect to
the product selectivity of formic acid decomposition. On the majority of single
crystalline surfaces that have been studied, including Fe(lOO) [2], Ni(lll) [3],
Ni(llO) [4] , Ni(lOO) [5], Ru(OOl) [6] and Ru(lOO) [7], the decomposition prod
ucts ;ur> C02, CO, H20 and H2. On Pt(lll) [8], Cu(lOO) [9] and Cu(llO) [10],
however, the decomposition products are C02 and H2 . Coadsorbates have been
found to affect both the reactivity and selectivity. For example, on the clean
Ag(llO) surface, formic acid adsorbs molecularly and desorbs reversibly; but on
a surface with presaturated oxygen adatoms (IJ ~ 0.33), dissociative adsorption
occurs with C02, H 20 and H2 desorption [11]. The preadsorption of an ordered
( y5 x y'5)0 adatom on Mo(lOO) causes formic acid to decompose to C02, CO,
H 20, CH4 and H2, as compared to the clean Mo(lOO) surface on which the
201
decomposition products ar <> CO. H10 and H 1 [12]. The formation of CO on
the Ni(llO) surface can be completely inhibited by a ordered (4 x 5) carbide
overlayer [ 13].
Vibrational spectroscopy of surfaces on which formic acid is adsorbed h as
b een employed on the Ag(llO) [11], Al(llO) [14], Au(llO) [15], Au(lll) [15],
Cu(llO) [16] , Cu(lOO) [9], Mo(lOO) [12], Ni(llO) [13] , Pt(lll) [8], Pt(llO) [17]
and Ru(OOl) [6] surfaces using either electron energy loss spectroscopy (EELS)
or infrared reflection-absorption spectroscopy (IRAS). Formate intermediates,
usually symmetrically bound (i. e., bidentate with equivalent oxygen atoms),
have been identified on a ll these surfaces . These symmetric formatcs arc char
acterized by four strong vibrational modes, v(M-0), b(OCO) , v5 (0CO) and
v(CH). On the Cu(lOO) [9], Mo(lOO) [12] , Pt(llO) [17], Ru(OOl) [6], oxygen
saturated Ag(llO) [11], and Ni(ll0)-(4 x 5)C [13] surfaces, the presence of ad
ditional dipolar enhanced vibrational modes, in particular the va(OCO) mode
which is forbidden by the surface selection rule for a symmetric formate [18],
indicates the presence of an asymmetrically bound formate, which may be either
an asymm<'tric , bidcntatc f0rmatc or a monodcntatc formate. The v(C-0) and
v(C = O) modes of monodentate formates are located at similar frequencies to
the v5 (0CO) and va (OCO) modes of bidcntatc formates . These asymmetric
· formates a re observed at low temperatures (usually b elow 200 K) and heating
causes an irreversible change in orientation to a symmetric formate. Two ex
ceptions to this pattern are Cu(lOO) where the intensity of the va(OCO) mode
on the annea led s urface increases if the surface is held at 100 K for 10 to 20
minutes, suggesting a reversible change in orientation [9,19], and Ni(llO) where
o nly the symmetric formate is observed on the clean surface and only the asym
metric formate is observed on the Ni(ll0)-(4 x 5)C surface [13]. On Pt(llO),
the bonding configur ation has b een assigned as an asymmetric bidentate for
mate where a vector through the oxygen atoms is at an angle of approximately
10° with resp ect to the plane of the surface [ 17] . All of the other asymmetric

formates appear to be monodentate [8,12].
Determinations of the bonding geometry of the symmetric formate inter
mediate on the Cu(llO) [20] and Cu(lOO) [21] surfaces have b een made using
extended X-ray absorption fine structure (EXAFS) measurements. Different
bonding geometries have been found for this formate on the two different sur
faces. On Cu(lOO) each formate oxygen resides at a site between four copper
surface atoms [21], while on Cu(llO) each oxygen bonds in an "on-top" arrange
ment above adjacent Cu atoms, with the plane of the formate parallel to the
[liO]lattice vector and perpendicular to the surface [20]. Ab initio geometrical
optimization calculations for a model of formate on a. Ni(OOl) surface yield a
similar geometry to that determined by EXAFS for the Cu(lOO) surface [22].
Vibrational spectroscopic comparisons of the two different geometrical bonding
configurations on the Cu(lOO) and Cu(llO) surfaces, as measured by EELS and
IRAS, respectively, are limited by the restricted frequency bandwidth of the lat
ter technique. Thus only two modes may be contrasted. The vs(OCO) mode at
1330 em- 1 on Cu( 100) is found at 1350-1360 em -I on Cu( 110) and the v( CH)
modes at 2840 and 2910 em - I on Cu(100) occur at 2900-2980 cm- 1 on Cu(llO)
[9,16].
In this extension of our previous studies of the adsorption of formic acid
on the Ru(001) surface [6], we present EEL spectral assignments for condensed
(molecular) formic acid, bidentate and monodentate formate species and the first
direct spectroscopic evidence for a surface hydroxyl species on Ru(001). Thermal
desorption mass spectrometry (TDMS) results demonstrate two decomposition
pathways leading either to CO desorption or to C0 2 desorption. This study
is part of our ongoing investigations into the interactions of organic carbonyl
ligands with the Ru(001) surface. Other reactants that have been investigated
include acetone [23] and formaldehyde [24].
20S
2. EXPERIMENTALPROCEDURES
The ultrahigh vacuum system and tht> EEL spectrometer used for these
studies have been described previously [25]. EEL spectra were recorded with
a beam energy of approximately 5 eV. Count r a t es were typically 1 to 3 x 10⁵
counts per second for the specularly scattered elastic beam, while maintaining a
reso lution equal to or better than 80 em- 1 (full-width at half-maximum inten
sity of the elastically scattered beam). Changes in EEL spectra as a function
of temperature were observed by heating the crystal to various temperatures,
followed by immediate cooling before recording the spectrum. All EELS mea
surements wer e made with the surface at a temperature of approximately 80
K .
Thermal desorption spectra were recorded in a second ultrahigh vacuum
system equipped with Varian low-energy electron diffraction (LEED) optics,
a Varian single pass cylindrical mirror Auger electron spectrometer, and a
UTI lOOC quadrupole mass spectrometer. A Digital Equipment Corp. LSI-
11 computer was used to collect TDMS data, and the smoothing procedure of
Savit;.>;ky and Golay was used to improve the signal-to-noise r a tio [26]. Since no
ordered superstructures were observed, no LEED results are presented.
The Ru(001) surfaces were cleaned chemically by exposure to 0 2 at pressure
of 5 x w- 8 torr while cycling the surface temperature between 300 and 800 K ,
followed by annealing in vacuum at 1650 K to remove adsorbed oxygen, and with
occasional Ar + sputtering cycles [27]. Surface cleanliness was confirmed with
Auger spectroscopy, EELS or by thermal d esorption of H 2 and CO. Formic acid
samples, HCOOH (MCB spectroscopic grade), DCOOD (Stohler spectroscopic
gra d e, nominal 99% D 2 ), HCOOD and DCOOH (Merck spectroscopic grade ,
nomina l 99% D), were given a minimum of three freeze-thaw-pump cycles for
additional purification before use, and gas handling lines were exposed numerous
times to the deuterated formic acid to reduce isotopic exchange. Despite these
precautions there appeared to be significant isotopic exchange of the hydroxyl

204
deuterium with hydrogen prior to the adsorption of formic acid on the surface.
The Ru(OOl) surfaces were exposed to formic acid by backfilling the bell jars.
Exposures quoted are not corrected for ionization gauge sensitivities . The mass
spectrometer sensitivity was calibrated by integrating TDMS from saturation
coverages of CO and H2. Mass spectrometer sensitivities for other species,
r e lative to CO , were estimated using information provided by the manufacturer.

205
3. EELS IDENTIFICATION OF ADSORBED SPECIES
Formic acid adsorption on the Ru(001) surface g ives rise to several adspecies
which can be identified by their characteristic EEL features . The species are
described below, along- with their spectral assignments.
3.1 Molecular Formic Acid
Molecular formic acid is observed by EELS on the Ru(001) surface following
exposures greater than 6 L at 80 K. EELS spectra following greater exposures are
similar, but spectra at exposures above 10 L are less well resolved. The HCOOH
spectrum shown in Fig. 1 (a) is characterized by intense bands at 720, 940, 1235,
1370 and 1690 em- 1 , which are assigned as the o (OCO), 1r(OH), v( C-0), o ( CH),
and v(C= O) modes, respectively, of condensed multilayer formic acid. Also
present are weaker, broader bands at 2640 and 2960 cm- 1 which can be assigned
as v( OH) and v( CH) modes, respectively. The significantly lowered frequency
of the v(OH) mode compared to that in the HCOOH monomer, 3570 em - 1 , is
a consequence of the extensive hydrogen bonding in crystalline formic acid [28] .
These assignments arc confirmed by comparison to the DCOOD spectrum in
Fig. 1b, where the bands observed at 970, 1260, and 1680 cm- 1 , are assigned as
the o(CD), v(C-0) and v(C = O) modes, respectively. The most intense band at
690 cm- 1 is the unresolved sum of the o(OCO) and 1r(OD) modes. The v(OD)
and v(CD) modes shift to 2020 and 2260 cm- 1, respectively. The small band at
2960 cm - 1 is assigned as a v(CH) mode from an HCOOH or HCOOD impurity.
Evidence is also seen for a broad v(OH) mode from a DCOOH or HCOOH
impurity at approximately 2600 cm- 1 • These energies agree well with those of
crystalline formic acid and less well with those of liquid ( dimerized) formic acid
(cf. Table 1). The mode at 230 (220) cm- 1 in the HCOOH (DCOOD) spectrum
is assigned as a frustrated translational mode of molecules within the condensed
lattice. A band at similar frequencies is observed for crystalline formic acid [28],
as we ll as condensed formic acid on other m etal surfaces [9,11] .

206
3.2 Monodentate Formate
A monodentate formate species is observed on the Ru(001) surface following
submonolayer exposures at 80 K as well as following the desorption of a formic
acid multilayer at 170 K. Spec tra of submonolayer exposures of HCOOH and
D COOD ar e. shown in Fig. 2. The. intense b a nd a t 1680 cm- 1 in Fig. 2(a) is
assigned to the v( C= O) mode; this band cannot be the va(OCO) mode which
occurs at a s imilar frequency for symmetrical bidentate formates [8,9,11-17,29],
since this mode would have a dipole para llel to the surface and thus is forbidden
by the surface selection rule [18]. The band observed at 2355 cm- 1 is the
v( CH) mode. The downward shift of this mode by over 500 em - 1 from its usua l
frequency implies that the hydrogen atom strongly interacts with t he Ru(001)
surface [18]. The assignment of this mode is confirmed by the deutero-formate
spectrum, where this mode shifts to approximately 1700 em- 1 and is obscured
by the 1650 em- 1 v ( C = 0) mode. The observation of this "softened" C H mode.
has not been reported for a ny other monodentate surface formate species . These
two modes allow the monodentate formate geometry to be assigned:
The EELS spectra exhibit bands at 370 (365), 775 (775) , and 1345 (1315 )
cm- 1 which are assigned as the v (Ru-0) , bs(O CO) and Vs (OCO) modes for the
monodentate HCOO (DCOO) species, respectively. The 1160 cm- 1 band in the
monodentate HCOO sp ectrum is assigned as a 1r(CH) mode. This mode is is
obscured in the DCOO spect rum by the b5 (0CO) mode. The upward shift of
this mode may be indicative of a hydrogen interaction with the surface. The
1015 cm - 1 band in the rnonodentate DCOO spectrum, is assigned as a b(CD)
mode and is obscured in the H C OO spectrum by the v8 (0CO) mode.

207
The high frequency v(CH) mode at 2935 cm- 1 is best explained by the
presence of a bidentate formate, discussed further in Section 3.3. The assignment
of the 610 em·--1 peak observed in the monodentate DCOO spectrum will be
discussed further in Section 3.4. Table 2 contains assignments for both Ru(001 )
formate species, along with those for analogous metal-formate complexes and for
forma.tes adsorbed on other single crystalline metal surfaces.
3.3 Bidentate Formate
Annealing of the surface on the monodentate formate is present to temper
atures above 200 K leaves a formate species with only four bands at 380, 805,
1360 and 2915 cm - 1 , which are assigned as the v(Ru-0), bs(OCO), Vs(OCO)
and v( CH) modes, respectively, of a. symmetrically bonded bidentate formate
species [cf. Figs. 3(a.) and 4(a)]. As the surface is heated from 80 K to 200
K, the vibrational bands due to the monodentate formate disappear with little
increase in the intensity of the CO vibrational modes and no C02 production.
This indicates that most, if not all, of the monodentate formate converts to the
bidentate formate, rather than decomposes directly.
Metal complexes of carboxylic acids, particularly acetate complexes, have
been studied extensively [29] . Two different bonding configurations of symmet
rical bidentate forma.tes are known: the bidentate bridging species, shown below
as (a), and the bidentate chela.ting species, (b).
H I c
o/ 'a I I
-M-M-(a)
H I c /' 0 0 '/ -M-
(b)
While the difference in frequency between the va(OCO) and the v5 (0CO) modes
provides the most conclusive diagnostic for discriminating between these two

2 0R
bonding geom etries, the va(OCO) mode• should not b<' observ ed in a symmetric
bidentate formate b ecause it does not. have a dynamic dipole perpendicular to
t h e surface. However , by compa rison to the 1/5 ( OCO) mode in transit ion metal
formate and acetate sp ecies , the bonding geometry can be assigned as bridging
bidentate. In group VIII transition m etal acetate complexes , the vs(OCO) mode
h as been reporte d in the ra nge 1450-1465 em- 1 for the chelating configurations
contrasting the range of 1410-1440 em- 1 for the bridging configurations [29].
However, the vs(OCO) mode of the t h e "free" (solvated) acetate ion at 1416
em- 1 is very close to that of the bridging configuration acetate liga nd . By anal
ogy to the acetate results, the 1/5 ( OCO) mode at 1360 em - I in the bidentate
surface formate closely correlates with the same mode in transition m etal bridg
ing formate complexes at approximately 1370 em - I and in the "free" formate
ion at 1351 cm- 1 (cf. Table 2) .
3.4 Surface Hydroxyl
The weak band observed in the both the monodentate and the bidentate
formate EEL spectra from D COOD at 610 cm - 1 [cf. Figs. 2(b) and 4 ) cannot
be assigned to either of t hese two species because no normal vibrational mode
of either of these species corresponds to this frequency, and because its intensity
correlates with neither species . It is observed in all DCOOD EELS spectra taken
a t temperatures up to 250 K , well a bove the convers ion t emperature for the
monodentate formate , but it disappears by 300 K , w hile t h e bidentate formate
modes remain strong . While water has been ohservcd to d esorb following
form ic acid exposures with a d esorption maximum a t 275 K [6], this mode
cannot be due to adsorbed D 2 0 , which h as b een observed to h ave a frustrated
rotational (librational) mode a t 520 em - 1 a t low coverages , increasing to 620
em - 1 at monolayer coverage, b ecause submonolayer coverages of water desorb
completely from the Ru(001) surface by 220 K [30] . This mode at 610 cm- 1 is
ass igned as a b(Ru-OD) mode from a small concentration of surface-hydroxyl
(OD) groups which a re produced a long with CO by low temper ature formate

209
decomposition. The presence of thi::; hydroxyl species has not been observed
spectroscopically heretofore on the Ru(OOl) surface, but it has b een reported
on the Pd(l00)[31,32], Ag(ll0) [33) and Pt(lll) [34] surfaces w ith b(M-OH)
frequ encies in the range between 670 and 1015 em - I [490 and 750 em- 1 for
8(M-OD) ). This assignment cannot b e confirmed by comparison to HCOOH
spectra, b ecause the b(Ru-OH) mode is obscured by the strong bs(OCO) mode
at 775-805 crn- 1 . The intensity of the v(OH) mode _for surface hydroxyl, which
has been reported between 3200 and 3500 cm- 1 [v(OD), between 2400 and 2600
em- I), is considerably less in tense than the b (M-0 H) mode and would not be
expected to be observed in these spectra, where the fractional coverage of surface
OH is estimated to be 011 the order of 5%. The frustrated translational mode,
v(M-OH) , which has been reported between 280 and 460 em - I, is obscured by
the strong v(Ru-0) formate mode at 380 cm- 1 •
3.5 Formate Decomposition Products
As may been seen in Figs. 2-4, there is spectroscopic conformation of two
other adsorbed products of formate decomposition, CO and oxygen adatoms.
Loss features from low concentrations of CO, v(Ru-CO) at approximately 460
em- I and v (CO) at approximately 2000 em- 1 , appear in all spectra measured
immediately following adsorption, and increase in intensity as the surface is
annealed. There is some formate decomposition below 200 K , as judged by the
small increase in the intensity of the v(CO) mode of C O , and the b(Ru-OD )
of surface-hydroxyl (OD) , prompting speculation that the small amount of low
temperature decomposition of formate to CO a11d OH takes place at defect sites .
The weak Ru-0 stretching mode at 540 em- 1 from oxygen adatoms produced
by formate decomposition is obscured by t he v(Ru-CO) mode of adsorbed C O ,
but it can be seen clearly at temperatures above those where CO desorbs !cf. Fig. 3(d) ).
At t emperatures above 300 K, formate continues to decompose yielding C O ,
as evidenced by the increased intensity of the C O modes, yet no surface hydroxy l
210
IS observed by EELS above 300 K nor 1s water observed as a d ecomposition
product. Thus, at temperatures above 300 K either the hydroxyl species quickly
decomposes to 0 and H adatoms , or above 300 K another mechanism allows
formate to decompose forming the CO, 0 and H adspecies directly, without the
hydroxyl intermediate. These two mechanisms cannot be discerned on the basis
of evidence presented in this study.

211
4. THERMAL DESORPTION MASS SPECTROMETRY RESULTS
Six spec ies , molecula r formic ac id . C02 , CO, H 20 , 0 2 and H2 , desorb
from t lw Rn(001) snrfac.e following formic acid adsorpt ion and heating of t he
surface . The thermal d esorption spectr a of molecula r formic acid, C02 , C O,
isotopes of hydrogen, and water arc presented in Figs. 5 , 6, 7, 9, and 10,
resp ectively. Interpretations of these therma l desorption spectra are discussed
in Sections 4 .1 through 4 .5 . The oxygen a d atoms observed by EELS desorb as
02 at approximately 1500 K. No attempt was made to record TDMS in this
temperature r ange .
4.1 Formic Acid Desorption
Figure 5 exhibits d esorption of molecular formic acid for several formic acid
exposures. At an exposure of 5 L [cf. Fig. 5(c) ], formic acid desorbs molecularly
with a p eak at approximate ly 200 K . With exposures in excess of 10 L , an
additional lower temperature peak d evelops at 170 K w hich does not saturate,
due to multilayer (condensed) formic acid, as shown in Fig. 5(d). The 200
K feature is attributed to adsorption of a nondissociated layer of formic acid
above the first layer of formate adsorbed on the Ru surface. This second layer
comprised of molecular formic acid has a higher binding energy than condensed
formic acid multilayers . The 200 K feature cannot be attributed to adsorbed
formate recombining with surface hydrogen to yie ld formic acid. The p eak does
not shift with temperature as would accompany second-order d esorption. There
is no evidence for the rcc.ombination of surface formate with h ydrogen adatoms;
if a surface with adsorbed formate is heated to 200 K to desorb a ll molecula r
formic acid and then is cooled and exposed to H2, no further molecular formic
acid d esorption is observed.
There is no molecula r desorption of formic acid ab ove 200 K. The t enta
tive suggestion of formic acid desorption between 300 and 350 K [6] has been
shown to b e due to an overlap with significant desorption of C02 for the mass
sp ectrometric resolution employed previously.

212
4.2 C0 2 Desorption
There is a negligible amount of C02 desorption following a formic acid
exposure of 0.4 L , which corresponds to a formate coverage of 10% of the
saturation formate coverage lcf. 6(a) l, as estimated from the TDMS of CO and
C02. At higher formate coverages, a C02 desorption feature appears at 310 K
and the desorption peak shifts to higher temperatures with increasing coverage,
reaching 365 K for a saturation formate coverage ( cf. Fig. 6). This desorption
of C02 is "reaction-limited" since it has been demonstrated that C02 does not
adsorb on Ru(001) at temperatures above 77 K [35].
The presence of both CO and C02 as decomposition products from surface
formate demonstrates the existence of two decomposition pathways since the
probability of the reaction CO( a) + O(a) ---+ C02 is less than w- 3 at tempera
tures below 400 K [35-37].
4.3 CO Desorption
The decomposition of the surface formate also yields adsorbed CO and
hydroxyl fragments or hydrogen and oxygen adatoms, as discussed previously.
While the onset of formate decomposition to CO is observed by EELS at tem
peratures b elow 200 K, all CO extrusion from the surface is "desorption-limited"
(cf. Fig. 7) [38]. Thus, no kinetic information concerning the decomposition of
formate to CO may be derived from these thermal desorption spectra.
Integration ~f the thermal desorption peaks of CO and C02 establishes the
saturation formate coverage to b e 0 .28 ± 0.04 monolayer (0.28 formate adspecies
per surface Ru ada tom). Two interesting effects are noted in the branching ratio ,
the relative amounts of desorbing CO and C02. Figure 8(a) shows the amounts
of formate that decompose to yield CO and C02, relative to the saturation
formate coverage, as well as the ratio of desorbed CO to C02. As noted
previously, the onset of C02 desorption is at approximately 10% of saturation
coverage. The CO desorption feature saturates well before the C02 desorption
feature saturates. In contrast, for formic acid decomposition on Ru(100) , the
21:1
branching ratio is independent of coverage [7] . The branching ratio on Ru(OOl)
is also influenced by the heating rate. Figure 8(b) shows the ratio of CO to
C0 2 as a function of h eating rate for a formate surface at approximately 40%
of saturation coverage . The rela tive amount of C0 2 is minimized by reducing
the heating rate . If the R.u surface is precovered with formate at 40% of the
saturation coverage and is then annealed at 240 K for 5 minutes prior to the
commencement of TDMS, the amount of C02 is decreased by a factor of five .
The change in branching ratio with coverage is explained by an increase in
the activation barrier for the the CO decomposition reaction due to accumulation
of product oxygen adatoms. Precoverage of the surface with oxygen adatoms
also lowers the ratio of CO to C02 [39]. The change in branching ratio is
consistent with the CO reaction having a lower preexponential factor than the
C02 decomposition reaction.
4.4 Hydrogen Desorption
and
Hydrogen adatoms may be produced from three different reactions:
HCOOH(a) ___. HCOO(a) + H(a) ,
HCOO(a) ___. CO(a) + H(a) + O(a),
HCOO(a) ___. C02(g) + H(a).
(A)
(B)
(C).
Deuterium-labeled formic acid, DCOOH, was used in the thermal desorption
measurements so that "hydrogen" from the dehydrogenation reaction (A) could
be distinguished from that resulting from the formate decomposition reactions
(B) and (C).
Thermal desorption spectra of H2, HD and D2 from DCOOH are shown in
Figs. 9(A) , 9(B) and 9(C), respectively. The poor signal-to-noise ratio seen for
the D 2 thermal desorption spectra compared to the H2 and HD spectra results
because the the mass spectrometer has a sensitivity of approximately 25% for
D 2 with respect to H2.

214
As demonstrated by thC' EELS results presented in Section 3 .2, a ll adsorbed
D C OOH decomposes b elow 200 K via reaction (A ) to form adsorbed formate
and H adatorns . These H ada toms combine to produce desorption-limited H2 [cf.
Fig 9(A) j. At format e coverages of approximately 10% of saturat ion , the peak
for H2 desorption is at 410 K, but shifts to lower temper ature with increasing
formate coverage. At saturation formate coverage, the desorption-limited peak
s hifts to 310 K and a second, reaction-limited peak is seen at 350 K, as the
desorption-limited peak shifts to lower temperatures. The reaction-limited peak
is 10 to 20 K below the C02 desorption peak temperature. The second peak
correlates with the C02 desorption p eak and is a result of a shift in the thermal
desorption peak to lower temperatures due to the higher coverage of hydrogen
ada toms.
Reaction (B), the decompos ition of formate to produce CO, hydrogen, hy
droxyl and 0 adspecies, is evidenced by the increased intensity of modes at
tributed to adsorbed CO in the EELS spectra, as discussed previously in Section
3.5. This reaction b egins below the temperature for hydrogen desorption. The
D adatoms from reaction (B) combine with the H adatoms from reaction (A)
producing desorption-limited HD at the same temperatures as H 2 desorption [cf.
Fig. 9(B) j. Reaction (C), the decomposition of formate to yield D adatoms and
C0 2 , h as b een discussed in Section 4.2. At low formate coverages, all decompo
s ition occurs below the desorption temperature for hydrogen and all evolution
of HD from the surface is desorption-limited . At saturation formate coverage ,
there are two peaks , a desorption-limited p eak at 310 K and a r eaction-limited
p eak at 350 K , similar to H2 TDMS.
Desorption of D 2 is qualitatively s imilar to HD desorption. At low formate
coverages , all decomposition occurs below the hydrogen desorption temperature
and all evolution of D 2 from the surface is desorption-limited [cf. Fig. 9( C)]. At
higher formate coverages, desorption- limited hydrogen evolution shifts to lower
temperatures. Consequently, the H adatom coverage is lower when reaction (C)

215
1s active and this reaction produces increased amounts of D2 with respect to
HD. This is also reflected by a shift of the reaction-limited D 2 peak 10 to 20 K
higher than the H 2 and HD peaks .
The peak temperatures for desorption-limited hydrogen evolution have
shifted to lower t emperatures with respect to H 2 on clean Ru(001), where hy
drogen desorbs at 440 K at low coverage and 340 Kat saturation coverage [40].
Similar shifts have been seen for the coadsorption of CO and hydrogen [41].
4.5 Water Desorption
Water has been reported as a maJor decomposition product from formic
acid on the (100) surface of Ru [7], but only very small amounts of water
are a product on Ru(001), desorbing at 275 K [cf. Fig. 10]. The reaction
of hydrogen and oxygen adatoms to give H20 does not occur on the Ru(001)
surface at temperatures below that at which hydrogen adatoms recombine and
desorb thermally as H2 [42]. Thus this small amount of desorbed water must
be produced by the recombination of hydroxyl fragments and surface hydrogen
from formic acid dehydrogenation. Integration of CO, C02 and H2 TDMS from
HCOOH, with heating rates of approximately 15 K/s, yields an estimate for
the total H 2 0 production as 0 .02 ± 0.01 molecule per surface Ru atom. Slow
heating rates increase the amount of water and the slow annealing cycles used
for EELS measurements would be expected to increase the hydroxyl coverage in
those experiments.

216
5. CONCLUSIONS
This study has demonstrated the existence of two formate intermediates to
formic acid decomposition on the Ru(OOl) surface, a monodentate formate and
a bidentate formate . The bidentate formate bonds in a bridging configuration.
The formate molecules decompose to produce CO, C02, water, 0 adatoms
and hydrogen. Two forms of molecular formic acid are observed, a first-layer
state which dcsorbs at 200 K and a multilayer state which desorbs at 170 K.
Small exposures of formic acid dehydrogenate upon adsorption to produce a
monodentate formate. The formate species do not recombine with H adatoms.
On the basis of EELS and TDMS results , the following reaction sch eme can
be constructed for formic acid decomposition of the Ru(OOl) surface.
, ( ) <80K HCOOH g ---+ monodentate-HCOO(a) + H(a)
80-200K . monodentate-HCOO(a) ---+ b1dentate-HCOO(a)
bidentate-HCOO(a) <~K OH(a) + CO(a)
bidentate-HCOO(a) 200~°K O(a) + H(a) + CO(a)
bidentate-HCOO(a) 300~°K H(a) + C02(g)
OH(a) + H(a ) ~~K H 20(g)
2H(a) 3oo~oK H 2(g)
C O(a) 4SO~OK CO (g)
The r atio of products is influenced by two factors, the formate coverage
and the heating r ate. At a formate coverage of 10% of saturation, almost all
decomposition yields CO. The amounts of both C O and C02 increase with
. formate coverage, but the CO decomposition channel saturates before the C02
ch annel. Slower heating rates arc found to increase the relative amounts to
water and CO . This is expla ined by deactivation of the surface by 0 adatoms
and by a lower prefactor for HCOO decomposition to CO than to C02.

217
Two interesting features of this study are : the first spectroscopic evidence
for a surface hydroxyl species on Ru(OOl) and the first reported observation of a
softened v( C H) mode for a surface formate species. While mono dentate formate
species have been proposed for other metal surfaces, this argument has been
advanced solely on the assignment of a band at approximately 1660 em- 1 as the
v(C = O) mode in a rnonodentate formate, rather than the va(OC O) mode of a
bidentat e formate, which would b e dipolar allowed for an asymmetric bidentate
bonding configuration. The observation of a softened v(CH) mode provides
additional evidence for the existence of a surface monodentate formate and
indicates an interaction between the hydrogen atom and the surface, indicative
of a short H-surface distance.
ACKNOWLEDGMENTS
The authors wish to thank Dr. Theodore E . Madey, John Parmeter and
Dr. Udo Schwalkefor extremely useful discussions. This research was supported
by the National Science Foundation under Grant No. CHE82-06487.

218
Table 1
Ass ignments of vibrationa l modes observed using EELS for molecular
H C OOH and D C OOD on Ru(OOl) from this work. The fundamental mode
ass ignments for formic a cid m onomers , dimers and crystalline formic acid are
list ed a lso [28 ]. All frequencies a re in em - 1 .
Mode HCOOH DCOOD HCOOH DCOOD
Monon1er Dirner Solid Dimer Solid Ru(001)
v(OH) 3570 3110 2532 2323 2041 2640 2020
v(CH) 2943 2957 2958 2226 2272 2960 2260
2247
v(C = O) 1770 1754 1703 1720 1671 1690 1680
1609 1590
v(C-0) 1105 1218 1255 1246 1270 1235 1260
1224 1253
b(CH) 1387 1365 1380(a) 987 993 1370 970
976
b(OH) 1229 1450 1560 1055 1090
1075
1r(CH) 1033 1050 1083 890 899
b(OCO) 636 397 720 642 662 720 (b)
1r(OH) 636 917 974 678 708 940 (b)
(a) composed of three bands at closely spaced frequencies.
(b) a band with intensity due to both these modes appears at 690 em- 1 . The
ex act positions of the two modes can not b e determined.

Tab
le 2
A
ssig
nmen
ts a
nd f
requ
enci
es
(in
cm-1
) of
vib
rati
onal
mod
es f
or v
ario
us f
orm
ate
spec
ies.
N
umbe
rs i
n pa
rent
hese
s ar
e fo
r th
e eq
uiv
alen
t de
uter
ated
for
mat
e sp
ecie
s.
Mod
e In
orga
nic
For
mat
e C
ompl
exes
(IR
) S
urfa
ce F
orm
ate
Spec
ies
(EE
LS
)
bide
ntat
e m
onod
enta
te
Sol
utio
n M
onod
enta
te
Bid
enta
te
Mon
oden
tate
B
iden
tate
Cr
Fe
Pt
Cr
Fe
Ag(
110)
-0
Mo(
110)
R
u(00
1)
Pt(
110)
N
i(11
0)
Ru(
001)
(F
ree)
(t
ilte
d)
this
(t
ilte
d)
this
[2
9,43
] [4
4]
[45]
[4
6]
[44]
[4
4]
[11]
[1
2]
wor
k [1
7]
[13]
w
ork
v(C
H)
2803
29
75
2975
29
00
2910
23
55
2950
29
50
2915
28
98
2953
(2
150)
(2
185)
(2
200)
v.(O
CO
) v(
C..O
) 13
51
1310
12
93
1310
13
74
1369
13
40
1320
13
45
1340
13
70
1360
(1
310)
(1
315)
(1
320)
(1
340)
77o(
o)
760(
b)
I c5
.(0C
O)
760
771
770
750
775
785
780
805
~
761
(770
) (7
75)
(785
) (8
00)
to
v.(O
CO
) v
(C=
O)
1585
15
74
1620
16
20
1644
16
35
1640
16
50
1680
15
60
1625
(1
640)
(1
660)
(1
560)
c5 1(C
H)
1385
13
91
1385
(1
010)
(1
015)
(1
010)
w-(C
H)
1069
10
50
1040
10
52
1050
11
60
1050
v(M
-0)
280
380
370
355
430
380
(260
) (3
65)
(410
)
(a)
Ram
an f
requ
ency
.
(b)
Com
pose
d o
f thr
ee c
lose
ly s
pace
d ba
nds.

f:!20
Figure Captions
Figure 1: Electron en ergy loss spectra of molecular formic acid multilayers
on Ru(OOl) at 80 K following exposures of 10 L of HCOOH, (a),
and 10 L of DCOOD, (b).

MULTILAYER Ru (001) 80K
~ z :::>
>-0::: <( 0::: I-OJ
~ >-I-(f)
z w I-z 230
I
0
-221 -
FORMIC ACID
690 I
2260 I
970 I
1680 I
2020 I
1260
X 10
940 I
1690 I
(CO)
1000 2000
ENERGY LOSS, cm-1
(b) DCOOD
(DCOOH) I
x33
(a) HCOOH
2960 I
3000

222
Figure 2: Electron energy loss spectra of monodentate formate on Ru(OOl)
at 80 K following exposures of 4 L of HCOOH, (a), and 2 L of
DCOOD , (b) .

~ z ::::>
>-0::: <t 0::: I-CD 0::: <t: ->I-(f)
z w 1-z
-229 -
Ru (001) + FORMIC ACID MONODENTATE FORMATE
0
365 I
370 I
1000
1315 I
1345 I
1660 I
1680 I
2200 ( 8 identate) - I
2355 I
X 100
2000
(b) DCOOD
X 1000
X 100
(a) HCOOH
2935 (Bidentate) I
X 1000
3000
ENERGY LOSS, cm-1

224
Figure 3: Electron energy loss spectra showing bidentate formate decompo
sition on Ru(OOl) following a 10 L exposure of HCOOH at 80 K
and annealing to the indicated temperatures.

(f) 5 r- 10 c .p.s.
z :=J
>-0:::: <I: 0:::: ·r-m 0:::: <I:
XIOO
>r(f) z W XIOO
r-z
(CO)
380
-225 -
Ru(OOI) + HCOOH 80 K .
(d) BOOK
(CO)
(c) 350 K
(b) 320 K
(a) 200K
. I cm-1 805 I cm-1
1360cm-1 2915 cm-1
XIOOO
0 1000 2000 3000
ENERGY LOSS, cm-1

226
Figure 4: Electron energy loss spectra showing bidentate formate on Ru(OOl)
following a 4 L exposure of DCOOD at 80 K and annealing to the
indicated temperatures. Note that the intensity of the 610 cm- 1
band due to a surface deuteroxyl does not correlate with the other
spectral features.

-(f) 1-z ::l
~ 0::: I-£D 0::: :::!. >-1-(f)
z w 1-z
-227-
Ru(OOl) + DCOOD- BIDENTATE FORMATE
0
{CO)
410 I
800
1000
1340 (CO)
(c) 340K
(b) 250K
"""'....._,.- x iOO
(a) 190K
2000 3000
ENERGY LOSS, cm-1

22H
Figure 5: Thermal desorption mass spectra of molecular formic acid desorp
tion from Ru(OOl) following exposures of (a) 3 L, (b) 5 L, (c) 10
L and (d) 20 L of DCOOH.
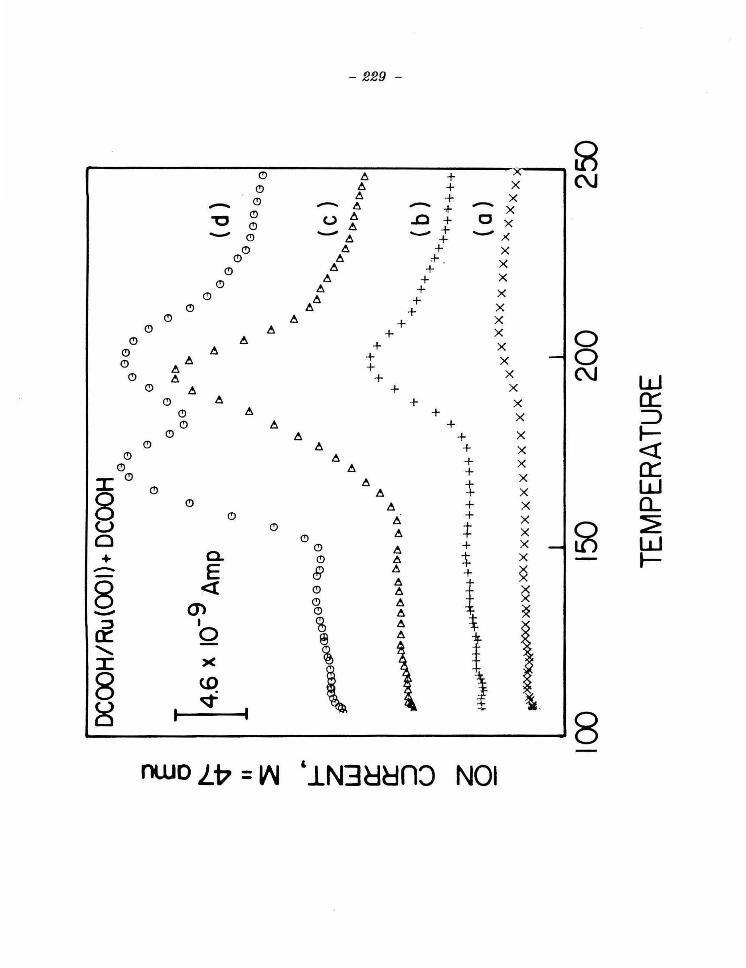
~ 0 ~
II
~ .. .._ z w
a:
a::
:::::> u z 0 -
DC
OO
H/R
u(O
OI)+
DCO
OH G
GG
G
GG
G
G
G
G
G
G
G
GG
1>
1>
I>
I>
G
I 4.6 x
10-9
Amp
G
G
G
G
~~GJGCH; '<
3r:;
G Q
~1>1>1>1>1>1> 1>
1>1>
I>
I>.
I>
I>
I>
I>
I>
I>
I>
I>
+
H~
-+-++-
Nt--f+
+-tH-+
+ + ++
+ ++
+ +
++
+ +
+ +
I>
I> +
+
+
I> I>
I> I>
++
+
+
+
G
(d)
GG
G G
oo
oo
o0
1>1>
1>1>
( c
) I>
I> I>
I> I
> I>
I> I>
I> I>
++
++
+
(b)
++
.
+++
++
++
+
XX
( Q
) x
xx
x
xx
xx
x
~~XX: XX
XX
X X
X X
X X
X
X
X
X
X X
X
X
X X
X )
c
1 I
100
150
200
2~
TEM
PERA
TURE
I ~
10

2.10
Figure 6: Thermal desorption mass spedra of C02 desorption from Ru(OOI)
following exposures of (a) 0.4 L , (b) 0 .6 L, (c) 1 L, (d) 3 L, (e) 5
L and (f) 10 L of DCOOH.

~
E 0
II
1-z w 0:: 0:: :::> u
C02/Ru(001) + DCOOH
-291 -
+ +
+ +
<33 G G
G G
G G
+
+
+
p.
p.
p. [>[),
Dr>:
+ +++-+I I I I 1-H+++++ ++11 ill I 1 I I 11111-Ft+
+
+~io '~-++++++-+~+!- i-1 1-1 II l+t-f-+t+++~
200 250 300 350 400 450 500
TEMPERATURE

2S2
Figure 7: Thermal desorption mass spec.tra of CO desorption from Ru(OOl)
following exposures of (a) 0.4 L, (b) 0.6 L, (c) 1 L , (d) 3 L, (e) 5
L and (f) 10 L of DCOOH.

::3 E 0 co N II
:2
f--"" z w 0::: 0::: ::) u z 0
-299 -
CO/Ru(OOI)+DCOOH
300 350 400 450 500 550 600
TEMPERATURE
Figure 8: Formic acid decomposition products on Ru(001) as a function of
reaction conditions: (A) the amounts of CO and C02 evolved
relative to a saturation coverage of formate and the ratio of C02
to CO versus the formic acid exposure (in L) for a h eating rate
of approximately 15 K / s; (B) the ratio of C02 to CO versus the
heating rate (in K / s) for a 1 L exposure (approximately 40% of
saturation) . The r atio of products from a surface annealed at 240
K for 300 s and then ramped at 13 K / s was used as the zero
heating rate extrapolation.

I.{)
0
OJ ONV 20:) O.l NOISCI3AN0:) .l'J'~CIO.:I
_.J
w 0:::: ::::> Cf)
0 a.. X w

2.'/6
Figure 9: Thermal desorption mass spectra of (A) H2, (B) HD and (C) D 2
desorption from Ru(001) following exposures of (a) 0.4 L, (b) 0.6
L, (c) 1 L, (d) 3 L , (e) 5 Land (f) 10 L of DCOOH.

-291-
M=2omu
----······----··
15.3 X 10·· ~
/:.:... .. - ---- " '\.. ,•'-•~ { C) ................ · ......... ~
•• ••• {b) ............. -~·---....... - ... ~ ......... -~ ....... ~--··········-·· ... ...... !.?.: .. ~ { 6 ) HD
M = 3 omu
(CJ Dz M s 4omu
.. """".·
..__ ..... ,..._,.~'>'> ..
.. ···
> ,
·""· , '
> { f) ' • •• -,_.. ...... ,. .... CJil<t_u~,..l).IJ.(O
·...._, __ ....;{,;;•:.,1_ .. _~
0 0 ""' .. 0 0 • ILB x 1o·•~
• ', ! f I "' .. 0%~~
.···· • { e I ·~
! d I ·-.-- ....... -·-·-...... -
••• ~ .. ~~_....~1>0"""'*"'""~ ... ~) "-"
.... _~ ... ··-................ - ..... ·--·--· ..... -·-· .......... ~!... ... . 200 250 300 350 400 450 500
TEMPERATURE

2.'/R
Figure 10: Thermal desorption mass spectra of H20 desorption from Ru(OOl)
following an exposure of 5 L of DCOOH.

200
H20
/Ru(
QO
I)+ D
COO
H
GG
G
G
GG
G
(j
JG
G
'G
G
GC
GG
I 250
G
G
GG
G
G
cPG
GG
G
G
G G
- 2.2
x I0
-10 Am
p
.....
G
G G
G
G
G
G G
GG
GG
GG
GG
I 30
0 35
0
TEM
PER
ATU
RE
I ~
c.e
co

References
[1] See for example, R. J. Madix, Advan. Catal. 29, 1 (1980) ; E . Iglesia and M.
Boudart, .J. Catal. 81, 224 (1983); and N.D. S. Canning and R. J. Madix,
J. Phys. Chern. 88, 2437 (1984).
\2 \ J. B. Bcnziger and R. J. Madix, J. Catal. 65, 49 (1980).
[3] J. B. Benziger and G. R. Schoofs, J . Phys. Chern. 88, 4439 (1984).
[4 ] See J. L. Falconer and R. J. Madix, J. Catal. 31, 47 (1978) and references
cited therein.
[5] J. B. Benziger and R. J. Madix, Surface Sci. 79, 394 (1979).
[6] N. R. Avery, B. H. Toby, A. B. Anton and W. H. Weinberg, Surface Sci.
122, L574 (1982); and B. H. Toby, N. R . Avery, A. B. Anton and W. H.
Weinberg, J. Electron Spect. 29, 233 (1983).
[7] L. A. Larson and J. T. Dickinson, Surface Sci. 84, 17 (1979).
[8] N. R. Avery, Appl. Surface Sci. 11/12, 774 (1982).
[9 ] B. A. Sexton, Surface Sci. 88, 319 (1979).
[10] D. H. S. Ying and R . J. Madix, J. Catal. 61, 48 (1980) .
[11] B. A. Sexton and R. J. Madix, Surface Sci . 105, 177 (1981).
[12] S. L. Miles, S . L. Bernasek and J. L. Gland, Surface Sci. 127, 271 (1983).
[13] R. J. Madix, J. L. Gland, G. E. Mitchell and B. A. Sexton, Surface Sci. 125,
481 (1983).
[14] M. Liehr, P. A. Thirty, J. J . Pireaux and R. Caudano, Phys. Rev. B 31, 42
(1985).
[15] M. Chtaib, P. A. Thirty, J. P. Delrue, J. J. Pireaux and R. Caudano, J.
Electron Spect. 29, 293 (1983).
[16) B. E. Hayden, K. Prince, D.P. Woodruff and A.M. Bradshaw, Surface Sci.
133, 589 (1983).
[17] P. Hofmann, S. R. Bare, N. V. Richardson and D. A. King, Surface Sci.
133, L459 (1981).
[18] H. Ibach and D. L. Mills, Electron Energy Loss Spectroscopy and Surface
Vibrations, Academic Press, New York, 1982.
[19] Other workers have suggested that the reappearance of the band assigned as
the v A ( OCO) mode is due to adsorption of molecular formic acid desorbing
from other surfaces within the belljar (14).

[20] A. Puschmann and J. Haase, M. D. Crappcr, C. E. Riley and D. P .
Woo Jruff, Phys. Rev . Letters 54 , 2250 (1985).
[21) J. Stohr, D. A . Outka, R. J. Madix and U. Dobler , Phys . Rev. Letters 54,
1256 (1985).
[22 ] T . H. Upton, J. Chern. Phys. 83 , 5084 (1985) .
[23) N. R. Avery, W. H. Weinberg, A. B. Anton and B. H. Toby, Phys . Rev.
Letters 51, 682 (1983); A. B . Anton, N. R . Avery, B. H. Toby and W. H.
Weinberg , J. Am. Chern. Soc. , 108,684 (1986).
[24] A. B. Anton , J. E. Parmeter and W. H. Weinberg, J. Am. Chern. Soc. , in
press .
[25) G. E. Thomas and W . H . Weinberg, Rev. Sci . Instrum. 50, 497 (1979).
[26) A. Savitzky and M. J . E. Golay, Anal. Chern 36, 1627 (1964); and J. Steinier ,
Y. Termonia and J. Deltour, Anal. Chern 44, 1906 (1972).
[27) G. E . Thomas and W. H. Weinberg, J . Chern. Phys. 70, 954 (1979).
[28] R . C . Millikan and K. S. Pitzer, J. Am. Chern. Soc. 80, 3515 (1958) .
[29] K. Nakamoto, Infrared and Raman Spectra of Inorganic and Coordination
Compounds, Wiley, New York , 1978.
[30] P . A. Thiel , F. M. Hoffmann and W. H. Weinberg, J. Chern. Phys. 75 , 5556
( 1981).
[31) E. M. Stuve, S. W. Jor_gensen and R. J. Madix, Surface Sci. 146, 179 (1984) .
[32] C. Nyberg and C . G. Tengstal, J. Chern. Phys. 80, 3463 (1984).
[33] E . M. Stuve, R. J . Madix and B. A. Sexton, Surface Sci . 111, 11 (1981).
[34) G . B. Fisher and B. A. Sexton, Phys. Rev. Letters 44, 683 (1980).
[35] N . R. Avery and A. B. Anton, unpublished results.
[36) H. I. Lee , G. Praline and J. M. White , Surface Sci. 91, 581 (1980) .
[37] T . E. Madey, H. A. Engelhardt and D. M enzel, Surface Sci . 48, 304 (1975).
[38] T . E. Madey and D . Menze l, Japan. J. Appl. Phys ., Suppl. 2, Pt. 2 , 229
(1974).
[39) B . H. Toby, M. M. Hills and W. H. Weinberg, unpublished results.
[40] H. Shimizu, K. Christmann and G. Ertl, J. Catal. 61, 412 (1980).
[41] D. E. Peebles, J. A. Schreifels and J. M. White , Surface Sci. 116, 117 (1982) .
[42] S. K . Shi, J. A. Schreifels and J. M. White, Surface Sci. 105, 1 (1981).
[43 ] K. Ito and H. J . Bernstein, Can. J . Chern. 34, 170 (1956).
- 242
1441 M. K . Johnson, D. B. Powell and R. D. Cannon, Spectrochim. Acta 37A,
995 (1981).
I45 J D . J. D a rensbourg, M. B. Fischer, R. E. Schmidt, Jr. and B. J. Baldwin, J.
Am. Chern. Soc. 103, 1297 (1981).
1461 A. Immirzi and A. Musco, Inorg. Chim. Acta 22 , 135 (1977).

Chapt<'r 8:
Contrasting Bonding Configurations of Acetone
on Pt(lll) and Ru(OOl) Surfaces

-244 -
Journal of Electron Spectroscopy and Related Phenomena, 29 (1983) 233-237 Elsevier Scientific Publishing Company, Amsterdam- Printed in The Netherlands
233
CONTRASTING BONDING CONFIGURATIONS OF ACETONE ON Pt(111) AND Ru(001) SURFACES.
N.R. AVERY, 1 A.B. ANTON, 2 B.H. TOBY 2 and W.H. WEINBERG2 1CSIRO Division of Materials Science, University of Melbourne, Parkville, 3052, Victoria, Australia.
2Division of Chemistry and Chemical Engineering, California Institute of Technology, Pasadena, CA 91125, USA.
ABSTRACT
The comparative chemistry of acetone adsorption on Pt(l11) and Ru(001) has been studied by EELS. On the more easily oxidized Ru(001) surface, acetone bonded in a side-on, ~2(0,C) configuration, whereas on the well -defined, closepacked regions of the Pt(111) surface acetone adopted a weak adduct-like, endon, ~1(0) configuration. On Pt(111), some ~2(0,C) was also observed and associated with adsorption at low coordination accidental step sites.
INTRODUCTION
As part of a continuing study of the organometallic chemistry of weak j0'1or
ligands on metal surfaces, we have studied the interaction of acetone 1~it :1 t1·10 single crystal metal surfaces viz. Pt(111) and Ru(001). In this way, it has
been shown that acetone bonds either through the oxygen in an end-on or ~ 1 (0) configuration or through the oxygen and ketonic carbon atoms in a lying-down or ~2 (0,C) configuration.
EXPERH1ENTAL
Descriptions of the EEL spectrometers used for the Pt(l11) (ref.l) and Ru(001) (ref.2) work have been given previously. All spectra were taken in the specularly reflected beam. Clean surfaces were prepared by well-established Ar+ sputtering and oxidation techniques. Thoroughly degassed acetone was ad
sorbed either by back-filling the vacuum chamber in the Ru(001) work or with a movable doser located in front of the Pt(111) crystal. Base pressures of <l0-10
torr were routinely obtained with both systems.
RESULTS AND INTERPRETATION Multilayer acetone. The EEL spectrum from multilayer acetone on Pt(111) at
130 K (Fig. 1) may be assigned according to Derlepiane and Overend (ref.3). Acetone (C2v point group) has 24 normal modes which may be divided into 18 internal methyl modes and 6 modes involving the Me2co (Me= methyl) skeleton.
The skeletal modes involve dynamic dipole moments along the two-fold axis (A1)
-0368-2048/83/0000-{)000/$03.00 © 1983 Elsevier Scientific Publishmg Company

234
6(C0) 030
I
....
V.a(CC) 12:11
I
I 6.CCH,I
Pt(111) + <CH,J2CO
130 K
1000 2000 3000 ENERQY lOSS (cm' 1)
Fig . 1 . EEL spectrum f r om multilayer a cetone on ?t( l l l ) a t 1 30 K.
or perpendicular to the two-fold axis but either in the mo lecular plane
(81) or perpendicul ar to it (82) . There are three A1 modes viz . v(C=O),
vs (f·1ecr1e) and 6(MeCMe), two strong 81 modes viz . vasU·1eC~1e ) and 6(CO) and a s ingle weak 82 mode viz rr(CO) wh ich
coul d not be resolved from the 6(CO) in the present spectrum.
r1ono 1 aye r acetone on Ru ( OQll.
Heating the Ru(001) surface, which had previously been covered with multi
l ayer acetone, to 190 K desorbed the excess adsorbate and revea led t he
spectrum of monolayer acetone ( Fig. 2a). This spectrum showed a systemat i c
absence of the intrinsically strong A1 and 81 modes, indicating, according to the surface selection rule for dipol e excitations, that the CO bond is parallel,
or almost so , to the surface. Instead, conspicuous bands at 3000 cm-1, 1385 cm- 1 and 990 cm-l are seen and ass i gned to methyl s tretching, deformation and
rock ing modes, respec t ivel y. The 675 cm- 1 band is assigned to a s keletal angle
co. CCH,),CO • Ru(001)
co.
v(CH1)
W&5 I
110
0 1000 2000 3000 ENERGY LOSS (em' ')
oJ 180 K
Fig . 2 . EEL spectra f r om ( a ) monolay er acetone on Ru(OOl ) at 190 K and after heating to (b) 290 K and (c) 330 K.
deformation mode.
ACETONE - Pt( 1 t 1) USO K
575
'
... \ ,.c- ....
0 I
"?/~ 77.
3000 I
~ 50 A ~ 8! ~
i ~
•1000
x333 (•) CCH,),CO
L-LL0~----,-000~----~2~000~-----3~000~--~
ENERGY LOSS (em·' )
Fig . 3 . EEL spectrum f rom monolayer acet one on ?t (lll) at 160 K.

-246 -
235
In the absence of a clearly detectable v(CO) mode or the ability to
measure the C-0 bond length, it is not possible to estimate the bond-order and
with it the extent of rehybridization of the ketonic carbon atom. Conceivable
bonding configurations include I, II and III. In I it is envisaged that the
II I I I
ketonic carbon atom retains its sp2 character whereas in II and III substantial
rehybridization to sp3 occurs. The real structure of adsorbed acetone on
Ru(001) probably lies between these extremes . The resulting species is desig
nated n2(D,C) acetone to signify the involvement of both the oxygen and carbon
atoms in bonding to the metal atom.
With further heating to 2g0 K (Fig. 2c), EEL bands due to adsorbed CO appear
and dominate the spectrum after a further flash to 330 K (Fig. 2d). ~olecular
acetone does not desorb in this temperature regime suggesting that instead,
n2(0,C) acetone decomposes to adsorbed CO and by inference adsorbed H and C thu~
n2(o,c) acetone ~co + c + H a a a ( 1)
r1onolayer acetone on Pt(111). An EEL spectrum of acetone adsorbed on Pt(11D
at 160 K is shown in Fig. 3. This spectrum shows the presence of methyl
stretching, deformation and rocking modes which are essentially unperturbed from
their free acetone frequencies indicating that the methyl groups are inert and play no role in the bondi·ng to the surface. Of greater diagnostic significance
is the presence of the two B1 modes viz. 6(CO) (575 cm-1 ) and vas(CC) (1245 cm-1)
both slightly blue-shifted from their free acetone frequencies and a v (CO) band
(A1 symmetry) which is similarly red-shifted by 80 cm-1. This indicates that
the adsorbed species on Pt (111) is bond,ed through the oxygen a tom and fror.1 the
surface selection rule for dipole excitations, that the Pt-0-C bond must be bent
significantly from 180°, as in IV. The bands in this spectrum are attenuated,
IV
in unison, after heating to 180-1go K corresponding to a thermal
desorption pulse of molecular acetone seen in the same tempera
ture range. When regions of crystal closer to the edge were
probed by the EELS beam weak residual methyl stretching, deform
ation and rocking bands were seen after the n1(0) species was desorbed at 190 K. No adsorbed CO bands arising fror.1 acetone de-
composition were seen. These bands are attributed to a small concentration of
n2(0,C) acetone, analogous to that which forms the majority species on Ru(OOl),
confined to the accidental step sites which inevitably contribute to a real

236
crystal surface, particularly near the edges. The n2(0,C) species on Pt(lll)
is a minority state and its properties will be discussed more fully elsewhere
(ref.lb) . By inference, the n1(0) species is associated with adsorption on the well-defined, close-packed regions of the Pt(lll) surface and is the majority species.
DISCUSSION
In summary, EELS has identified two basically different forms of adsorbed
acetone which have been designated n1(0) and n2(0,C) for end-on and side-on bonding configurations , respectively. On Ru(OOl) , the n2(0 ,C) form is the majority species. On Pt(l11), the n1(0) form has been identified as the major
ity species on the well-defined, close-packed regions of the surface whereas a small contribution from the n2(0,C) form has been associated with accidental
step sites. In inorganic coordination compounds, acetone bonded in an end-on n1(0) con
figuration are well known. Labile donor ligands of this kind are easily ex
changed for other ligands and consequently are widely exploited in synthesis reactions . In X-ray structure analysis of · two ruthenium complexes, the Ru-0-C bond has been shown to be bent at angles of 153° (ref.S) and 138° (ref.6) in, or
close to, the molecular acetone plane . A bondi ng scheme for both these complexes and n1(0) adsorbed acetone may be devised by reference to the frontier
orbitals of acetone (ref.?). The highest filled orbital is a non-bonding atomic
p-like orbital located on the oxygen atom and oriented in the molecular plane. If one lobe of this orbital is regarded as a Lewis base and interacts with an
empty Pt orbital, the desired bent Pt-0-C bond is formed. Clearly, there is a strong si milarity between n1(0) acetone and these inorganic acetone complexes .
Inorganic compounds with acetone bonded in an n2(0,C) configuration have not
been isolated. However, comparable compounds with the more e lectrophilli c (CF3)
2co are well known in both three (ref.8) and four (ref.9) membered hetero
cycl ic ring configurations analogou s to the surface s tructure I I and III . In these compounds, almost complete rehybridization of the ketonic carbon to sp3
has occurred, whereas in a nickel (CF3)2co complex (ref.lO) only partial rehybridization occurs and bonding must be regarded as being more ~ -like. In the
latter case, the (CF3)2co skeleton is much less di s torted from the plannar free (CF3)2co configurati on than in the ruthenium complexes. The ni ckel complex is the organic analog of I whereas the ruthenium complexes correspond to II and
I II. The ability of the Ru(OOl) surface to adsorb acetone in the n2(0 ,C) config
uration would indicate that the solid surface is more easily able to raise its oxidation state than the i solated atoms in the inorganic compounds. Similarly, the close -packed regions of the Pt(lll) surface wi ll be less easily oxidized

-248 -
237
and therefore failed to form a comparable species but instead adsorb acetone in
a weak donor ligand, or adduct configuration . The minority component of
n2(0,C) acetone on the Pt(111) surface is confined to the low coordination and therefore more easily oxidized step sites.
REFERENCES
N.R. Avery , (a) Appl Surface Sci. ll (1982) 171; and (b) Surface Sci. (submitted).
2 G.E. Thomas and W.H. Weinberg, Rev . Sci . lnstrum. 50 (1979) 497. 3 G. Dellepiane and J . Overend, Spectrochimica Acta 22 (1966) 593 . 4 Introduction to Infrared and Raman S ectrosco , 2nd Edition (Academic
Press 1975. 5 R.D. Gould, W.J. Sime and T.A. Stephenson, J.C.S. Dalton (1978) 76. 6 r-l.A. Bennett, T.W. 11atheson, G.B. Robertson, W.L. Steffen and T.IL Turney,
J.C .S . Chern. Comm. (1979) 32. 7 W.L. Jorgensen and C. Sa lem, The Organic Chemist's Book of Orbitals (Aca
demic Press) 1973. 8 B. Clarke, 11 . Green, R.B.L. Osburn, F.G.A . Stone, J . Chern. Soc. (A) (1969 )
20. 9 t1. Green, J .A.K . Howard, A. Laguna, L.E. Smart , J.L. Spencer and F.G.A.
Stone, J. Chern. Soc. (Dalton)(1977) 278 . 10 R. Countryman and B.R. Penfold, J. Crys. 11olec . Structure~ (1972) 281.

Appendix D:
End-On and Side-On Bonding of Ketones to Surfaces:
Acetone on the Ru(OOl) and Pt(lll) Surfaces

-250 -
PHYSICAL REVIEW LETTERS
End-On and Side-On Bonding of Ketones to Surfaces: Acetone on the Ru(OOl) and Pt (111) Surfaces
N. R. Avery,<• l W. H. Weinberg , A. B. Anton, and B. H. Toby Division of Chemistry and Chemical Engineering, California Institute of Technology,
Pasadetul, California 91125
(Received 10 February 1983)
High-resolution electron-energy-loss spectroscopy has verified the existence of two fundamentally different types of adsorbed acetone, 7J 1-bonded acetone on Ft(lll) and 7J 2_
bonded acetone on Ru(OOl). On a Ru(OOl) surface, the Lewis acidity of which has been increased by the presence of oxygen adatoms, the 7J1 and 11 2 forms of acetone coexist. The 111-bonded acetone desorbs molecularly, whereas ,f- bonded acetone Is a precursor to dissociation on the surface.
PACS numbers: 68.30.+z, 61.14.-x, 68.20.+t, 82.65.Jv
Previous investigations•- •s concerning the bonding of prototypical ketones to metal centers in organometallic complexes have provided a qualitatively consistent picture of the effect of the Lewis acidity of a metal on its selectivity toward various possible configurations for the bonding of the ketonic ligands. The advent of high-resolution electron-energy-loss spectroscopy (EELS) for the vibrational analysis of adsorbed overlayera on solid surfaces has rendered feasible incisive studies of the organometallic chemistry of macroscopic, well-defined single-crystalline surfaces18 and a rigorous comparison to the chemistry of analogous homogeneous complexes. In this Letter, new and unprecedented results are reported concerning the interaction of acetone (a weak donor ligand) with the close-packed Pt(111) and Ru(OOl) surfaces, as well as the Ru(001) surface on which an ordered p(2x 2) overlayer17 of atomic oxygen is present. 18" 20 The contrasting bonding configurations and the possible decomposition of acetone observed on these surfaces systematize the chemical effects of relative Lewis acidities of metals/' while clarifying the comparative chemistry of these surfaces and their relationship to analogous coordination complexes.
Descriptions of the EEL spectrometers (and the UHV chambers in which they are contained) used for the Ru (Ref. 22) and Pt (Ref. 23) studies have been published previously. A typical resolution in both spectrometers (for a disordered overlayer of low electron reflectivity) is 80 em· 1
(full width at half maximum of the elastically scattered electron beam), and optimum resolutions are below 40 em· 1. Atomically clean singlecrystalline surfaces were prepared by Ar• sputtering and chemical cleaning with oxygen followed
by high-temperature reductive annealing. 24 The ordered p (2x 2) overlayer of atomic oxygen on Ru(001) was prepared by exposing the clean surface to 0.8 L of oxygen (1 L= !langmuir= 10" 8
Torr s) at 95 K, followed by thermal ordering at a temperature of approximately 350 K. 18" 20 The Pt crystal was exposed to acetone with a directional beam doser consisting of a multichannel array of microcapillaries, whereas the Ru crystal was exposed to acetone by backfilling the UHV chamber. The acetone was degassed with multiple freeze-pump-thaw cycles before use, and its purity was verified in situ mass spectrometrically.
EEL spectra for acetone adsorbed on the three surfaces are shown in Fig. 1, and a summary of the surface structures, the measured vibrational frequencies, and the mode assignments is presented in Table I. Spectra obtained for adsorption of (CD3) 2CO rather than (CH3 ) 2CO are shown in Figs. l(b) and l(c), since they afford better clarity and resolution of the signature modes critical to the identification of the adsorbed species.
On the Pt(lll) surface, the EEL spectrum of adsorbed acetone, shown in Fig. l(a), exhibits (dipolar enhanced) modes of both A, and 8 1 symmetry and a down-shifted carbonyl stretching frequency (relative to liquid acetone or acetone multilayers condensed on the Pt and Ru surfaces). Consequently, on Pt(111) acetone is bonded in an 71 1 (end on) fashion through the oxygen atom with c. symmetry (a mirror plane through the plane of the molecule, perpendicular to the surface), and a Pt-0 = C bond angle that is less than 180", as shown in Fig. 2(a). The bonding of the acetone to the Pt(lll) surface is typical of a weak donor ligand since the temperature corresponding to the maximum rate of desorption of molecular ace-
682 © 1983 The American Physical Society

-251 -
PHYSICAL REVIEW LETTERS 22 Avc.uT 1983
>-1-(/)
z w 1-z
0
- o Oo N u <»
.,.; <[)
" ~I
(c ) r)'+ r; 2 (C0312CO/ Ru (001)- p (2X2) - 0, 275K
o-o !DO C> U
(b)
X333
r;2 (C03)2CO / Ru (OOI ), 275 K
x 333
r;' (CH3)2CO / Pt (Ill), 160K
~ 1000 2000 3000
ENERGY LOSS, cm-1
FIG . 1. EEL spectra for (a) a monolayer of (CH:J)2CO on the Ft(l11) surface; (b) a monolayer of (CD3) 2CO on the Ru(001) surface; and (c) a monolayer of (CDy2CO on the Ru( 001) surface with an ordered p (2 x 2) overlayer of oxygen adatoms present. Features at 455 and 1980-2000 cm" 1 in spectra (b) and (c) are due to adsorbed CO from the onset of decompsotion of the 71 2
acetone. All spectra were recorded in the specular direction where dipolar scattering dominates the Inelastic electron scattering cross section (Ref. 16).
tone is 185 K, suggesting a binding energy of approximately 11.5 kcal/mol.
It has been recognized for a number of years that acetone can bond coordinately in an 7'/ 1 configuration in various organometallic complexes. I-
8
The frequencies observed for 711 acetone on the Pt surface are in good agreement with those reported previously for homogeneous (monometallic) complexes of 11 1 -bonded acetone. 1
•7
•8
• In xray diffraction crystallographic structural determinations of Ru complexes of 7)
1 -bonded acetone, the Ru-O=C bond angle ranges from 135° to 153°, and the Ru-O=C-C2 torsional angles are within
CH3 \
/ c - cH 0 3
• - Pt-
(a ) (b )
CH3
' o- c...-CH3 t
-Ru-Ru-
(c)
FIG. 2 . Schematic bonding configurations for (a) 771
acetone on Ft(lll) and Ru(OOl) on which a p(2 x 2) oxygen adatom superstructure exists; (b) , (c) .,f acetone on Ru(OOl) .
7° of planarity. 7' 8 The frequency of the carbonyl
stretching mode shifts from 1710 em- 1 in liquid acetone to approximately 1630 cm- 1 on the Pt surface and is down shifted similarly in the organometallic complexes of Ru. 7• 8 Consequently, especially since the acetone is adsorbed with c, symmetry, quite similar bonding occurs in TJ 1
-
bonded acetone complexes and on the extended, close-packed surface of pt,
At 275 K on the Ru(001) surface, a temperature at which all the acetone has desorbed reversibly from Pt, the acetone is bonded in an 712 (side on) configuration as indicated schematically in Figs. 2(b) and 2(c).27 This form of adsorbed acetone is identified by a substantially down-shifted carbonyl stretching mode at 1280 em- 1
, isopropyl-like rocking modes at 990 and 1170 em- 1
, and a skeletal mode at 670 cm- 1 [at 1280, 820, and 880, and 620 em -• for (CD3 ) 2CO, respectively; see Table I and Fig. l(b)]. The feature at 670 em· 1 is due to the lT(CO) mode of acetone which is transformed from B 2 to A' symmetry as the symmetry of the acetone skeleton is lowered from C2• to C • (a mirror plane through the C = 0 bond, perpendicular to the surface) with the rehybridization of the ketonic carbon atom from sp 2 to nearly sp 3 upon adsorption. This 712 form of acetone on Ru is a stable intermediate in the decomposition of the acetone. The rapid decomposition of 7)
2 acetone to adsorbed CO, CH, fragments (x "' 3), and hydrogen adatoms occurs at temperatures slightly above 275 K.
A number of side-on bonded ketonic and related homogeneous complexes which resemble the 112
-
bonded acetone on the Ru(001) surface have been reported.,_ 15 In particular, the analogy with two zero-valent complexes of nickel are noteworthy , namely, (hexafluoroacetone )bis (triphenylphosphine) nickel(O) ,g and (benzophenone)bis (triethylphosphine) nickel(O). 13 An extension of the carbonyl bond length by approximately 0.1 A in both
683

-252-
V OI.L'ME 51. NL' Mll[R 8 PHYSICAL REVIEW LETTERS
TABLE I. Vibrational frequencies (in inverse centimeters) observed with high-resolutio n electron-energy-loss spectroscopy o(ry1 acetone on Pt(l11) , r( acetone on Ru(001), and a mixture of ry1 a nd r( acetone on Ru(001)p(2 x 2)-0. (Corresponding frequencies for deute rated acetone, (CD:J 2CO, are given In brackets. The mode assignments, their symmetry types, and the lr and Raman frequencies of liquid acetone are listed as well.)
Symmetry · 1r and Raman EE IB on Pt(111) EEL'l on Ru(001) EEL'l on Ru(001lp(2x 2)-0 Mode c2u c. of l!quld0 '71 '72 'II '1%
3004[!l255] (s)
v(CH,l 2964[2222] (s) 3000[2250) 2970[2220] 2970[2240] 2970[2240] 2924[2111] (s)
v4 (CO) A1 A' 1710[1701](vs) 1630{1630] 1280[1280] 1660[1660) 1280[1270) 1430{1085) (s) 1430 1420[1040)
6(CH,l 1361[1037) (vs) 1350[1030) 1370[1070) 1370[1040) 1356[1036] (w)
v. (Me-C-Me) Ba A" 1220{ 1245) (vs) 1245[1290) 1092 (m) 1170[880) 1090
w(CH,l 1066[890) (m) 1080 990[820) 960[810) 902 (m) 910 890[750)
v. (Me-C-Me) A a A' 786[695] (w) 6(CO) Ba A" 530[478) (s) 575[530] b 11'(CO) B2 A' 393[331) (w)c 670[620) 6(Me-C-Me) A a A' 493[410) (w) c
0 Ref. 25. bQbscured by the very strong ., • (Ru = 0) mode at 530 em "1
•
cThe original assignments of these modes (Ref. 25) have been reversed by Raman polarization measurements (Ref. 26).
complexes is strong evidence of 1r bonding to the nickel (i.e. , rr donation and ll'* back-donation). If the bonding is thought of in terms of the DewarChatt-Duncanson model,2a. 29 then in view of the importance of back-bonding, side-on (11-bonded) ligands are stabilized by electronegative substituents on the ligand which serve to lower the energy of the rr• orbital. There is a concomitant need for "electron rich" metals, i.e., those in low formal oxidation states, to facilitate this type of bonding. This is the reason why only rather recently has 172-bonded acetone been observed in a low-valent homogeneous Ta complex1s compared to the earlier observation of an 7)2 -bonded hexafluoroacetone complex with Ni. • This is also the reason why the more "electron rich" Ru surface binds acetone in an 7)2 configuration, whereas a geometrically identical surface of Pt does not. The degree of rehybridization of the ketonic carbon atom is similar in the Ta(7)sC,MesH7J2-acetone)Me2 complex (Me= CH3 )
15 compared to 7)2 acetone on the Ru surface as judged by the carbonyl stretching frequencies, 1200 cm" 1 in the former and 1280 cm" 1 in the latter.
If the Lewis acidity of the Ru surface is increased by the adsorption of an ordered p (2x 2) overlayer of oxygen adatoms (corresponding to a
684
quarter-monolayer surface coverage), the behavior of the (subsequently) chemisorbed acetone is qualitatively different from that of acetone on reduced Ru, as is evident from the EEL spectrum in Fig. 1(c). In the presence of the oxygen over layer, a significant fraction of the adsorbed acetone exists as an 7)1 ligand which desorbs molecularly near 300 K. This is a consequence of a through-metal depletion of the electron density on the surface Ru atoms due to the presence of the electronegative oxygen adatoms. On this modified Ru surface of greater Lewis acidity, the acetone adsorbs as a donor ligand with a binding energy considerably greater than on the reduced Pt surface. Consequently , the modified surface of Ru behaves similarly, but not identically, to the Pt surface. This fact is also apparent from the coexistence of 7)1 and 7)2 acetone on the Ru(001)p(2x 2)-0 surface [cf. Table I and Fig. 1(c)], whereas the 7)2 form of acetone does not exist on reduced Pt.
To summarize, high-resolution EELS measurements have verified the existence of two fundamentally different types of adsorbed acetone, 1)
1-
bonded acetone on Pt(111) and 7) 2-bonded acetone on Ru(001). On a Ru(001) surface, the Lewis acidity of which has been increased by the pres-

- 25:1 -
PHYSICAL REVIEW LETTERS
ence of oxygen ada toms, the 17 1 and 172 forms of acetone coexist. The 1) '-bonded acetone de sorbs molecularly, whereas 17 2 -bonded acetone is a precursor to dissociation to chemisorbed CO, CH, fragments, and hydrogen. These results systematize the nature of the bonding of (ketonic) organometallic ligands to metal clusters and to metal surfaces, i.e . , they provide a quantification of the so-called "metal-cluster, metal-surface analogy." More detailed descriptions and discussions of the results reported here are in preparation. 3 o, 31
This research was supported by the National Science Foundation under Grant No. CHE82-06487.
<•)permanent address : Division of Materials Science, CSIRO, Catalysis and Surface Science Laboratory, University of Melbourne, Parkville 3052 Victoria, Australia.
1W . L. Driessen and W. L. Groeneveld, Reel. Trav. Chim. Pays-Bas 88, 977-988 (1969).
2W. L. Driessei""and W. L. Groeneveld, Reel. Trav. Chim. Pays-Bas 90, 258-264 (1971).
3K. Jackowski and Z . Kecki, J . lnorg. Nucl. Chem. 39, 1073-1078 (1977). -:cc. White, S. J. Thompson, and P. M. Maitlis, J. Chern. Soc. Dalton Trans. 1977, 1654-1661.
5c. White, S. J. Thompson, and P. M. Maltlis, J . Organomet. Chern. 134, 319-325 (1977>.
SS. J. Thompson, C. White, and P . M. Maitlls, J. Organomet. Chern. 136, 87-93 (1977) .
7R. 0 . Gould, W. Uime, and T. A. Stephenson, J . Chern. Soc. Dalton Trans. 1978, 76-79.
8M. A. Bennett, T. W. Matheson, G. B. Robertson, W. L. Steffen, and T. W. Turney, J . Chern. Soc. Chern. Commun. 1979, 32-33.
3R. Countryman and B. R . Penfold, J. Cryst. Mol. Struct. 2, 281-290 (1972) .
10D. w;;:lther, Z. Chern. 15, 490-491 (1975). 11S. D. lttel, J . Organom-;;t. Chern. 13 7, 223-228 (1977). ' 2S. D. Ittel, Inorg. Chern. 16, 2589-2597 (1977). 13T. T. Tsou, J . c. Huffman-;- and J. K. Koehl, Inorg .
Chern . 18, 2311-2317 (1979). 14W. R-:-Roper, G. E. Taylor, J. M. Waters, and L. J.
Wright, J. Organomet. Chern. 182, C46-C48 (1979) . •sc. D. Wood and R. R. Schro~ J. Am. Chern. Soc.
101, 5421-5422 (1979). !'SSee, for example, H. Ibach and D. L. Mills, Elec tron Energy Loss Spectroscopy and Surface Vibrations (Academic, New York, 1982); W. H. Weinberg, in Experimental Methods of Surface Phys!cs, edited by R. L. Park and M. G. Lagally (Academic, New York, 1983).
17In a p(2x 2) overlayer, both edges of the primitive unit cell of the adsorbate lattice are twice the magnitude of those of the primitive unit cell of the substrate, i.e ., the area of the former is four times that of the latter, and the fractional surface coverage is 0.25. For a detailed discussion of surface crystallography, seeM. A. Van Hove, W. H. Weinberg, and c .-M. Chan, Low-Energy Electron Diffraction (Elsevier, Amsterdam, 1983).
1BT. E. Madey, H. A. Englehardt, and D. Menzel, Surf. Sci. 48, 304-328 (1975) .
••o. E. Thomas and W. H. Weinberg, J. Chern. Phys. 69, 3611-3613 (1978) . "'ToT. S. Rahman, A. B. Anton, N. R. Avery, and W. H. Weinberg, to be published.
21p, c. Stair, J . Am. Chern. Soc. 104, 4044 (1982). 220 . E. Thomas and W. H. Weinberg, Rev. Sci. In
strum. 50, 497-501 (1979) . 2~. R:-Avery, Appl. Surf. Sci. 13, 171-179 (1982) . 24o. E. Thomas and W. H. Weinberg, J . Chem. Phys.
70, 954-961 (1979). no. Dellepiane and J. Over end, Spectrochim. Acta 22, 593-614 (1966). "'1i;J. R. Allkins and E. R. Lippincott, Spectrochim. Acta, Part A 25, 761-764 (1968).
2'Whether th;acetone is bound to a single ruthenium atom as in Fig. l(b) or is bridging two (or three) ruthenium atoms as in Fig. 1(c) cannot be determined from the high-resolution EELS data.
28M. J . S. Dewar, Bull. Soc . Chim. Fr. 18, C74-C79 (1951). -
23J . Chatt and L.A. Duncanson, J . Chern. Soc. 1953, 2939-2947.
30N. R . Avery, to be published. l1B. H. Toby, A. B. Anton, N. R. Avery, and W. H.
Weinberg, to be published.
685

2.54
Ap p endix E:
Adsorption of Acetone both on the Clean Ru(OOI) Surface
and on the Ru(OOI) Surface Modified Chemically by
the Presence of an Ordered Oxygen Adatom Overlayer

-255-
Reprinted from the Journal of t he American Ch<'mical Socic!y, 1986, /08, 6S4. Copyright © 19R6 by the American Chemical Society and reprinted by permi•sion of th<' copyright owner.
Adsorption of Acetone Both on the Clean Ru(OOl) Surface and on the Ru(OOI) Surface Modified Chemically by the Presence of an Ordered Oxygen Adatom Overlayer
A. B. Anton, N. R. Avery,t B. H. Toby, and W. H. Weinberg*
Contribution from tht! Division of Chemistry and Chemical Engineering, California Institute of Technology, Pasadena, California 91125. Received August 23. 1985
Abstract: The adsorption of acetone on the clean Ru(OOI) surface and the Ru(OOI) surface on which an ordered p(2 x 2) overlayer of oxygen ada toms is present has been investigated via electron energy loss vibrational spectroscopy and thermal desorption mass spectrometry. On both surfaces, two fundamentally different forms of adsorbed acetone coe><ist at temperatures below approximately 200 K --an 771 species, bonded end-on through the o><ygen atom. and an 112 species. bonded side-on through both the oxygen atom and the acyl carbon atom. Both of these types of bonding have been identified previously in homogeneous organometallic comple><es. On the clean Ru(OO I) surface, the 112 species is dominant, with the 171 species present only in low concentrations. Addition of the p(2 X 2)0 overlayer increases the Lewis acidity of the Ru(OOI) surface, stabilizing 17
1-acetone with respect to 172-acetone. The 771 species desorbs molecularly upon heating of the surface, whereas the more strongly bound 11' species is an intermediate to dissociation. The results are compared with acetone adsorption on the Pt( Ill) surface and to the chemistry of analogous organometallic coordination comple><es. The nature of the bonding on the two Ru(OOI) surfaces is interpreted in terms of the electronic structures of both the ketonic ligand and the metallic substrate.
I. Introduction
One of the principal aims of organometallic chemistry is to provide an interpretive framework in which the mechanistic details of metal-catalyzed reactions can be undentood.1 Reactions are conducted under carefully controlled conditions, and all reactants and products are thoroughly characterized with regard to their structural and chemical properties, both by spectroscopic tech· niques and by comparison to theoretical descriptions of the metal-ligand bonding interactions which govern their behavior. The stable coordination geometries for reactants, intermediates, and products represent local minima on the potential energy surface which describes all the possible metal-ligand interactions for the particular system investigated, and both transition-state structures and microscopic reaction mechanisms can often be inferred without ambiguity by this procedure. Our present understanding of metal-assisted chemical reactions in solution is a tribute to, and a direct result of, the success of this type of analysis.
One of the obvious goals of modern surface science research is to e><tend these results to the understanding of analogous reactions which occur under heterogeneous conditions, catalyzed by (e><tended) metal surfaces. A similar procedure must be followed, including careful control of reaction conditions and thorough characterization of the metal surface on which the reactions occur. Again. the structures of adsorbed (i.e., coordinated) intermediates can be used to delimit the transition-state structure(s) and microscOpic mechanism(s) which describe the surface reaction(s) observed. Within this context. it is clear that heterogeneous catalysis is in fact the organometallic chemistry of extended metal surfaces, and as one might expect, results obtained for metal- ligand interactions in homogeneous systems prove to be very valuable in the interpretation of results obtained on metal surfaces .
The success of this approach for both homogeneous and heterogeneous systems relies on the ability to determine experimentally the structures of coordinated reaction intermediates. In homogeneous studies. stable products can often be separated, purified, and CTystallized, allowing detailed deduction of chemical bond lengths and bond angles via X-ray crystallography.' The surface-sensitive analogue, low-energy electron diffraction (LEED),> can be applied most easily to systems where a single reaction intermediate is formed in a translationally periodic, two-dimensional lattice on a single-crystalline metal surface. 4
' Current addn:ss: Division o( Materials Science, CS.I.R.O., Catalysis and Surface Science Laboratory. University of Melbourne, Parkville 3052, Vic· toria. Australia.
0002-7863/ 86/ !508-0684$01 .50/ 0
Even on single-crystalline metal surfaces, more than one intermediate is frequently formed with no long-range order to facilitate a LEED analysis. Thus, other approaches must be taken to identify surface structures. Of the various spectroscopic techniques available presently for the identification of reaction intermediates on surfaces, both the sensitivity and the wide spectral range of high-resolution electron energy loss vibrational spectroscopy (EELS) make it arguably the most powerful tool for chemical analysis of adsorbed species on well-characterized surfaces of low area.5 Although the structural information provided by vibrational spectroscopy does not directly measure bond lengths and bond angles, it docs identify both the nature of the bond and the bond order, and through application of the selection rules appropriate to EELS on metal surfaces,6 the chemical identity and orientation of adsorbed species can be determined. With this type of information at hand, a rigorous comparison of the chemistry of extended metal surfaces to that of corresponding organometallic complexes can be made.
This paper reports results obtained via EELS and thermal desorption mass spectrometry for the interaction of acetone with the clean Ru(OOl) surface and the Ru(OO I) surface on which there is an ordered p(2 X 2) overlayer of oxygen adatoms.7 The results help to quantify the relationship between the Lewis acidity of a metal surface and its selectivity toward both react ive and nonreactive bonding configurations of adsorbed acetone, providing an enlightening comparison of the chemist ry of these surfaces to the chemistry of analogous organometallic complexes.•
The interaction of acetone and similar substituted ketones, R 1R2CO, with metal centers in homogeneous systems has been
( I) Sec, for example: Collman, J. P.; He sed us. L. S . "Principles and Apptications of Orsanotransition Metal Chemistry"; University Science: Mill Valley, 1980.
· (2) Wells, A. F. "Structural lnorpnic Chemistry". 4th cd .• Clarendon Preaa: Oxford, 1975.
(3) Pendry, J . P. "Low EnerJY Electron Diffraction"; Academic Press: London, 1974.
(4) One notable example is the succc:asful determination via LEED of the structure of the ethylidyne specica which ethylene and acetylene form upon reaction with the Pt( Ill) surface. Sec: Kcsmodel, L. L.; Dubois, L. H.; Somorjai, G. A. J . Clltm. Pllys. 1979, 70, 2180. Steininser, H .; Ibach, H .; Lebwald, S. Surftu:t Sci. 1911. lt7, 685.
(5) Ibach, H .; Milts, D. L. "Electron Ener&y Lou Spectroocopy and Surface Vibrations"; Academic Preas: New York, 1982; Chapter 6.
(6) Reference 5, Chapter 3. (7) Rahman, T. S .; Anton, A. 8.; Avery, N . R.; Weinbcra. W. H . Phys.
Rro. Lm. 1913. J /, 1979. (8) Avery. N . R.; Wcinbcr&. W. H.; Anton, A. 8.; Toby, B. H . Phys. Rtv.
utt. 1983, J/, 682.
·:0 1986 American Chemica l Society

-256 -
Adsorption of A cetone
the subject of a number of investigations. Two general classes of bonding configurations have been identified, characterized structurally, and correlated with the electronic properties of both of the (R1 and R 2) substituents of the ketonic ligands and the metal centers to which they bond. Electron-deficient metals (those in high formal oxidation states, for example) and weakly electronegative substituents (such as the CH3 groups of acetone) generally facilitate bonding via u donation from the ligand to the metal to produce an 171(0) configuration (bonded end-on to the metal through the oxygen atom and hereafter referred to as 171).9-12 In this case, the metal serves as a weak Lewis acid and accepts an electron pair from the ketonic ligand. For metals weakly basic in the Lewis sense, i.e., those in a low formal oxidation state, or for ketonic ligands with more electronegative substituents (R1 and R 2 =H. CF3, and Ph), an 172(0,C) configuration (bonded side-on to the metal through both the carbon and oxygen atoms and hereafter referred to as 172) occurs.1l-2° This type of interaction, first described by Dewar and by Chatt and Duncanson, 21 results from simultaneous donation of electrons from the 1t orbital of the ligand to t he d orbitals of the metal and backdonation of metal d electrons to the 7T 0 -antibonding orbital of the ligand. This is a general feature of the interaction of many unsaturated ligands with metals.22- 24 The understanding of conditions prevailing at metal surfaces which yield selectively these two types of coordination interactions is an important and worthwhile pursuit. For example, q 1-carbonyl ligands are quite labile and nonreactive, exchanging easily in solution with other more tightly bound ligands,10 whereas 172 bonding is postulated to be important in the formation of reactive intermediates in heterogeneously catalyzed reactions such as the Fischer-Tropsch synthesis.2.!
Although several investigations of acetone adsorption on metal surfaces have appeared in the literature,26•27 only one report has presented an unequivocal determination of the binding configurations of acetone on a single-crystalline metal surface. 27 In this case of acetone adsorption on the clean Pt( Ill) surface, EELS and thermal desorption mass spectrometry were used to identify an 171 species which dcsorbed reversibly and a small concentration of an '72 species, some of which decomposed upon heating the crystal. These results provide a particularly useful contrast and comparison to the results reported here for the adsorption of acetone on the Ru(OOI) and Ru(OOI)-p(2 X 2)0 surfaces.
(9) Driessen. W. L.; Groeneveld. l . Rrd. Trav. Chim. PhyJ·Ba.s 1969, 88, 977.
(10) Thompson. S. J.; White, C.; Maitlia, P. M. J. O..ganomtr. Chrm. 1977, 1)6, 87.
(I I) Gould. R. 0.; Sime, W. J .; Stephenson, T. A. J . Chrm. Soc. Dalton TranJ. 1978, 76.
( 12) Bennett. M. A.; Matheson, T . W.; Robertson. G. 8 .; Steffen. W. L.; Tumey, T. W. J. Chrm. Soc., Chrm. Commun. 1979, 32.
(13) Brown, K. L.; Clark, G. R. ; Headford, C. E. L.; Manden, K.; Roper, W. R. J. Am. Chrm. Soc. 1979. 10/, SOl.
( 14) Berke, H .; Bankhardt, W.; Huttner, G.; Seyer!, J . V.; Zsolnai, l. Chrm. Brr. 1911, I U. 27S4.
(IS) Clarke. B.; Green, M.; Osborn, R. B. L. ; Stone. F. G. A. J. Chrm. Soc. A 1961. t67.
( t6) BrowninJ, J.; Cundy, C. S.; Green, M.; Stone, F. G. A. J. Chrm . Soc. A 1969. 20.
( 17) Countryman, R.; Penfold, B. R. J. CryJI. Mol. Struct. 1911, 1, 281. (18) Wood, C. D.; Schrock. R. R. J. Am. Chrm. Soc. 1919, 101 , S421. ( 19) Green, M.; Howard, J . A. K.; laguna, A.; Smart, l . E.; Spencer, J .
l.; Stone, F. G. A. J . Chrm. Soc. Dalton Trans . 1977. 278. (20) Adams. H. ; Bailey. N. A.; Gauntlet!, J. T.; Winter, M. J. J. Ch<m.
Soc. , Ch<m. Commun. 1914. 1360. (21) Dewar, M. J . S. Bull. Soc. Chim. Fr. 1~1. 18. C19. Chan. J .;
Duncanson. L. A. J . Chrm. Soc. 1~3. 2939. (22) Greaves, E. 0 .; Lock. C. J. L.; Maitlis, P. M. Can. J. Chrm. 1961.
46, 3879. (23) Chisholm. M. H.; Clark. H. C. Ace. Chrm. Rrs. 1973, 6. 202. (24) lttel. S. D. lnorg. Chrm. 1977. 16, 2S89. (2S) Henrici-Oiivl. G.; Olivl. S. An,_w. Chrm .. Int. Ed. Engl. 1976, 15,
1 )6 :and references therein. (26) Blyholder. G.; Neff. L. D. J . PhyJ. Chrm. 1966. 70. 893. Young. R.
P.; Sheppard. N . J . Catal. 1967. 7, 223. Blyholder, G.; Shihabi . D. J. Catal. 1977. 46. 91. Liith. H.; Rubloff. G. W.; Grobman. W . D. SurfauSci. 1977. 63. 325.
(27) Avery, N. R. Surfau Sci. 1913. 125.771.
-"' 'Q ,_.. z w ~ 10 ~ u z 2
~ ..., .,. " E
0
J. Am. Chern. Soc., Vol. /08. No. 4. 1986 685
(C~I2CO/Ru(001 1 +(CH~lO
T00, = 80K , ({3) = ISK/ s
EXPOSURES, L
15 10
7 4 2
100 150 200 = 300 350 400 450 500 TEMPERA TURE.K
Figure I. Thermal desorption spectra for increasing exposures of (CH3),CO on the clean Ru(OOI) surface at 80 K. The most abundant cracking fragment of (CH3),CO, m = 43 amu , was monitored. and the average heating rate (tJ) was 15 K/s.
II. Experimental Procedures
A description of the EEL spectrometer and the ultrahigh vacuum (UHV) system in which it is contained has been published previously" EEL spectra were recorded at a resolution of apprmtimately 80 cm· 1
(full-width at half-maximum) with a maximum count rate of 10' H z in the spccularly reflected, elastically scattered electron beam. Beam kinetic energies at the sample were between approximately 5 and 6 eV.
The Ru(OOI) surface was cleaned by thermal cycling between 400 and I I 00 K in I 0"7 torr of oxygen to remove surface impurities. followed by reductive annealing in vacuum at 1750 K.19 Occasional Ar+ sputtering was also used to clean the surface. Surface cleanliness was monitored via EELS and thermal desorption mass spectrometry, the surface was judged clean when the EEL spectrum was featureless, and the peak pooitions and intensities in thermal desorption spectra for various coverages of CO were reproduoed. The ordered p(2 X 2) overlayer of oxygen ada toms, with an ideal surface coverage of 0.25 monolayer, was prepared by exposing the clean surface to 0.8 L of oxygen (I L • to-< torr-s) at 95 K, followed by thermal ordering at a temperature of approximately JSO K.7•30
The (CH3),CO and (CD,),CO used in the experiment.s were degassed with multiple freeze-pump-thaw cycles, and their purities were verified in situ via mass spectrometry. The isotopically labeled compounds, 110 1 and (CD3),CO, were >99% purity in their specified isotopes. The crystal was exposed to all gases by backfilli ng the UHV chamber through leak valves, and exposures quoted in the text were measured with a BayardAlpert ionization gauge uncorrected for relative ionization cross sections.
Thermal desorption measurements were made in a line-of-sight mode with a UTI I OOC quadrupole mass spectrometer, oriented approximately 40° from the surface normal. Surface coverages of hydrogen and CO reported for the (reaction product) thermal desorption measurements were obtained by comparing the time-integrated ion c urrent for the desorption spectra to those obtained for desorption of known coverages of hydrogen11 and C0.12 The accuracy in this comparison is approximately ±10%.
Since the adsorbed overlayers were prepared by backfilling the Li HY chamber, exposing uniformly all cold surfaces in the chamber to the particular adsorbate. and since the mass spectrometer had no provision for selective sampling of the single-crystalline surface. the features in the thermal desorption spectra associated with desorption from the crystal surface were superposed on a brood background signal due to desorption from all other chilled surfaces which are warmed during the collection of a thermal desorption trace. This is a pa rticularly important consideration for a species such as acetone which condenses in UHV at liquid nitrogen temperatures. In the apparatus used for the experiments reported here. the Ru(OO I) sample was supported by two 0.020 in. diameter tantalum wires which were spot-welded to its rear face and clamped by two 0.109 in. diameter copper wires to form an electrical current path through the sample. The copper wires were in contact with a liquid nitrogen reservoir to provide conductive cooling of the sample. a nd
(28) Thomas, G. E.; Weinbera. W. H. Rro. Sci. /nstrum. 1979, 50, 497. (29) Thomas. G. E.; Weinber1. W. H. J . Chrm. Ph}'J. 1979. 70. 954. (30) Madey. T . E.; Engelhardt, H. A.; Menzel. D. Sur faa Sci. 1975, 48,
304. (31) Shimizu, H.; Christmann, K.; Ertl, G. J. Coral. 1980. 61, 412. (32) Williams, E. D.; Weinbera. W. H. Sur faa Sci. 1979, 82. 93.

-£57-
6g6 J. Am. C/s~m. s~ .. Vol. /08, No. 4, /986
<l
Q ,.: z w &':10 :::> u z 0
~ 0
"' ... . E
0
ICHY2 CO/RuiOOl+p( 2•210 + 1~2co T..,. • SOK, (/3) • 15 K/s
EXPOSURES L I ~ 10 7 • 2
LIOO±!-~,~:;o;:-""=200~~=~~:300~~350-t!c'-'-!co000~~4:.0~ .... :;oo~ T EMPERATURE, K
fipre 2. Thermal desorption spectra rcrorded under conditions identical with those of figure I except for adsorption on the Ru(OOI )-p(2 X 2)0 surface.
heating was accomplished by conduction of the heat generated almoot totally by the tantalum wires to the S3mple as an electric current was passed through the sample via the copper and tantalum support leads. The heavy copper leads were also warmed by conduction of heat from the tantalum support wireo. but their temperature lagged weD behind that of the Ru(OOI) sample. The net result of these effects, then, for 1
thermal desorption spectrum of the mass spectrometer signal intensity Yl. sample temperature for acetone desorption was to yield first 1 smoll, narrow signal burst at the beginnin& of the temperature ramp due to desorption from the rapidly heated tantalum leads and then features 11
their cbaracterutic temperatures for deso<ption from the Ru(OOI) surface. supcTllOSCCI on 1 broad. slowly varyin& backaround due to dc:!orption of condenoed 1caonc from tbe slowly worming copper leads. For ratber sharp desorption features, u were observed in the thermal desorption spectr1 for the H, ond CO dccompooition product&. tbe bacq,ound bue lines in the spectn can be identified unambicuouJJy, and tbe oootn"bution due to desorption from the Ru(OOI) surfoce can be separated c:lea.rly. For broad features. however. u were oboc:rved for tbe desorption of molecular acetooe from both the clan Ru(OOI) and the Ru(OOI )-p(2 X 2)0 surfaces. the ba.se lines were less certain. In all thermal deso<ption spectra presented below, the sharp burst 11 low temperatures and best estimates of the base lines due to background deso<ption have been subtracted for a more useful illustration of the experimental resulu. For the molecular ocetone desorption spectra of Fipres I and 2, however. the uncertainty in the amplitudes of the brood feature which extends from opproximately 200-450 K prevents 1 quantita tive determination of the total amounu of acetone desorption in the spectra. The qualitative differences in the spectra. to be discussed later. namely the increased amount of molecular desorption from the Ru(OOI )-p(2 X 2)0 surface for I aiven acetone exposure as compared to the clean surface. are reliable and are the moot noteworthy results evident in figures I and 2.
III. R~ulb A. ~rmal Desorption Spectra o( Acetone from the Cleaa
Ru(001) and t~ Ru(OOI)-p(l X :Z)O Surfaces. Thermal desorption spectra recorded after the indicated eJtposures of the clean Ru(OOI) surface to (CH 1) 2CO at 80 K are shown in Figure I. For exposures below 4 L. almost no molecular acetone desorption is observed. For exposures of 4 L and above, however, a broad feature with a desor-ption rate maximum near 220 K. shifting with increasing exposure to 180 K for a monolayer saturation exposure. is observed. A peak due to the formation of a condensed multilayer appears at 140-150 K for exposures greater than 7 L. This multilayer state lirst appears at exposu res below that necessary to saturate the monolayer state, suggesting that some "clusterina• may occur, as has b=l observed in the thermal desorption spectra of H 20 from the Ru(OOI) surface.H No evidence for a "second layer" desorption state. lilr.e that observed for acetone adsorption on Pt(lll),21 can be extracted unambiguously from the thermal desorption spectra of Figure I, although some evidence for such a state is observed in the EELS results to be presented below.
Noteworthy is the "tailing" of the monolayer desorption feature from its desorption rate maximum near 200 K to approximately
(33) Thiel. P. A.; Hoffmann. F. M.; Weinber&. W. H. J. CMm. P•ys. t911. 75, SSS6.
... z .., a: a: :::> u
z Q
CO/ Ru!OOU•ICH,J,CO
T-· 80K. (/3) • 15K/•
le i Q.)l co .... lt_
'-------'~·0."'
·~~Y-10600 660 10:)~
TEMPERATURE, K
Anton n a/.
fiprt 3. Thermal desorption spectra for the CO decomposition product from I S·L exposures of the clean Ru(OOI) and the Ru(OOI }-p(2 X 2)1'0 surfaces to (CH1) 2CO. The top spectrum shows CO desorption following exposure of the clean surface to 0.5 L of CO for comparison.
g' 'Q ,.: z w
:i ' :::> u z Q
N (c) p(2•Z>O•~L~CO
... •0.10
400 = 600 700 TEMP£RATURE. K
rope •· Thermal desorption spectra for the H, decompooition productS from I 5-L <>posures of the clean Ru(OOI) and the Ru(OOI )-p(2 X 2)0 surfaces to (CH1),CO. The top spectrum shows H, desorption followina exposure of the clean surface to • L of H, for comparison.
400 K. This indicates a broad range of binding energies for tbe monolayer molecular species, due perhaps to repulsive interactions which lower its binding energy at high coverages and are relieved as desorption progresses, or to attractive interactions of acetone with surface species present at higher temperatures (and lower surface coverages).
A series of thermal desorption spectra for exposures equal to those of Figure I, but instead on the Ru(001)-p(2 X 2)0 surface, are shown in Figure 2. Although qualitatively similar, several quantitative differences are apparent: more molecular acetone is evolved in the temperature range between 200 and 450 K for all exposures: two rate maxima for monolayer desorption. ncar 180 and 200 K. are observed: and the multilayer feature is clearly evident for lower exposures, appearing lirst at 7 L.
B. Thfflnal Desorpdoa SpKtn1 of lbe Decompositioa Products, CO and H~ from the Clean Ru(OOI) aad the Ra(OOI)-?(l X 2)0 Surfac~ Hydrogen and CO are t he only products of the decomposition of (CH1hCO on the clean and the Ru(OOI )- p(2 x 2)0 surfaces, as detected by thermal desorption spectra. The desorption spectra reoordod for these products arc shown in Figures 3 and 4 following multilayer exposures (I 5 L) of both surfaces to (CH1) 2CO at 80 K. For comparison. spectrum a of Figure 3 shows desor-ption of CO from the clean Ru(OOI) surface following exposure to 0.5 L of CO (IJco adsorbed CO molecules per ruthenium surface atom = 0.20), and spectrum a of Figure • shows desorption of H 2 from the clean Ru(OOI) surface following exposure to • L of H 2 (IJH • 0.85). For spectra c of both Figures 3 and 4, p(2 X 2)0 overlayers were produced via adsorption of 110 2 to allow separate detection of the CO produced by the decomposition of adsorbed (CH1hCO, appearing at m =- 2g amu, and that produced by reaction of adsorbed carbon from CH1 decomposition, with tbc 110 of the p(2 X 2)0 overlayer appearing

-258 -
Adsorption of Acetone
at m = 30 amu. Furthermore. this increases the sensitivity of the the rmal desorption measurement to H 20 (m = 20 amu), which might be expected to be a product of the reaction of (CH,),CO wi th the Ru(OOI )- p(2 X 2)0 surface. However, no l·h" O was detected under a ny circumstances.
The CO evolution from a saturated monolayer of (CH1),CO on the clean Ru(OOI) surface, shown in Figure Jb, yields Oco = 0.12. and since no C02, H 20. or other oxygen-containing desorption products were observed. this demonstrates that the clean surface is active for the decompoo;ition of approximately one-eighth of a monolayer of adsorbed acetone. This is to be compared with the m = 28 amu spectrum below it for the same expoo;ure on the Ru(OOI )-p(2 X 2)0 surface, Figure 3c, where Oco = 0 .02. Obviously, the presence of the ordered oxygen overlayer decreases the decompoo;ition activity of the Ru(OOI) surface by a Factor of approximately 6.
Proper stoichiometry in the overall surface decomposition reaction,
(CH3),CO + 2 110- CO+ JH2 + 2C110
would suggest that Oc"o for the m = 30 amu desorption spectrum of Figure 3d should be equal to 0.04 rather tban 0 .03. This discrepancy may be a result of an inaccurate base-line determination in the spectra, or more likely is due to slight (Oco = 0 .05) adsorption of background CO (m = 28 amu) from the chamber a mbient during expoo;ure to (CH,),CO, making Oco for the associated m = 28 amu spectrum (Figure 3c) larger than the value of 0 .015 necessary by stoichiometry to match the Oc"o = 0.03 of the m = 30 amu spectrum.
The m = 30 amu desorption spect rum of Figure 3d identifies the temperature range over which adsorbed carbon and oxygen react to form and evolve CO, i.e., between appro1timately 400 and 700 K . The absence of CO desorption in this temperature range for the m = 28 amu spectra conflrms that no carbon-oxygen bond cleavage occurs in the decompoo;ition of adsorbed acetone.
The m = 28 amu desorption spectra of Figure Jb and c for the clean Ru(OOl) and the Ru(OOI)- p(2 X 2)0 surfaces have the temperatures corresponding to their muimum desorption rates downshifted from 490 K. shown in the clean surface CO desorption spectrum of Figure 3a, to 470 and 455 K. respectively. This can be attributed to interactions between the adsorbed CO molecules and adsorbed hydrocarbon fragments'"' and the oxygen ada toms of the p(2 X 2)0 overlayer.35
Comparison of the thermal desorption spectrum b of Figure 4, which shows H 2 evolution from a saturated monolayer of (CH 3),CO on the clean Ru(OOl) surface, to that of Figure 4c for the same e1tpoo;ure on the Ru(OOI )- p(2 X 2)0 surface shows an approximate sevenfold decrease in the amount of acetone decompoo;ition upon the addition of the oxygen overlayer to the Ru(OOI) surface, a value that is consistent, within e1tperimental uncertainties. with the results shown previously in Figure 3. Furthermore, the hydrogen coverages. obtained by comparison to the spectrum of Figure 4a For desorption From a saturation expoo;ure of the clean surface to H,, compare well with the values expected on the basis of the corresponding observed CO coverages and the stoichiometry expected from the aforementioned surface decompoo;ition reaction. i.e. , OH = 60co = 0.72 and 0 .12, respectively.
The peak shapes of the thermal desorption spectra shown in Figure 4b and c are of particular interest. Comparison to results of therma l desorption measurements for coadsorbed overlayers of CO and hydrogen on Ru(OOI ),. indicates that the H2 desorption features appearing in Figure 4b between 280 and 450 K are due solely to the recombination of hydrogen ada toms on the Ru(OOI) surface in the presence of coadsorbed CO. The series of weak features between approximately 450 and 750 K are due to the decompoo;ition of adsorbed hydroca rbon fragments which result
(34) Hills. M. M.; Weinberg. W . H .. unpublished rcsult.s. (35) Lee. H.· I.: Praline. G.: White. J . M. Surfac. Sd . t980. 91. 5g1. ( 36) Peebles. D. E. : Schreifels. J. A.: White. J. M. Surfac. Sci . 1912. 116.
117.
J . Am. Chern. Soc. , Vol. 108. N o . 4. 1986 687
CH3 \
C - CH /j 3
0
I M
(o)
/ ' o--cc...---Rz I I M--M
(c)
R,
o-/-Rz \I
M
(b)
R,
1_.........-Rz ':I>?T O~M
(d )
Fieur• 5. Schematic~· (a) and~' (b. c, and d) bond ing configura t ions for ketonic ligands observed in homogeneous complexes.
from the decomposition of adsorbed acetone. In Figure 4c, the sharp feature at 220 K is due to hydrogen ada toms recombining in the presence of adsorbed oxygen, its shape and peak temperature depending sensitively on the presence of the p(2 x 2)0 overlayer." Features above 250 K in this spectrum, representing slightly more than half of the total yield of hydrogen from the surface, a rc due to the decomposition of adsorbed hyd rocarbon fragments from acetone decomposition in this temperature range.
Also noteworthy is the absence of H 20 production from the decomposition of (CH1),CO in the presence of the p(2 x 2)0 overlayer. Although evidence for the reaction of disordered, adsorbed oxygen with hydrogen on Ru(OOI) to evolve H 20 has been obtained in the thermal decomposition of adsorbed HCOOH." thermal desorption measurements recorded following hydrogen adsorption on the Ru(OOI )-p(2 x 2)0 surface produce no H 20 , only desorption of H 2Y Thus, the relative probability of H 20 production vs. H 2 desorption depends sensitively on the long-range order of the oxygen overlayer. This can be explained by consideration of two important effects of the oxygen order on these reactions, both of which act to make hydrogen adatom recombination and desorption more likely. First, the formation of the ordered p(2 X 2)0 overlayer upon the annealing of a disordered over layer of adsorbed o1tygen '.lO indicates that attractive interactions which increase the Ru=O binding energy are maximized in the p(2 X 2) configuration, increasing the energy barrier to the abstraction of adsorbed oxygen by reaction with hydrogen. Second, the p(2 X 2)0 overlayer destabilizes adsorbed hydrogen into a new binding state with an act ivation energy of desorpt ion below 9 kcal j mol, desorbing near 220 K , as compared with the clean surface state, dcsorbing near 400 K with an activation energy of desorption of approximately 17 kcal j mol."
C. EELS of Acetooe oo the Clean Ru(OOI) Surface. Exposures of the Ru(OOI) surface to 15 L or more of acetone a t 95 K produces EEL spectra typical of the condensed species and virtually identical with the mult ilayer spectra reported for acetone adsorption on Pt( Ill ).21 The modes observed for mul tilayer (CH3hCO and their assignments based on a comparison with the IR and Raman spectra of liquid acetone'• are listed in Table I.
The EEL spectra for the monolayer states of acetone both on the c lean Ru(OOI) and the Ru(OOI )- p(2 X 2)0 surfaces show evidence for species coordina ted both in 771 and 772 configurations. Before attempting to assign the spectra, however, a review of the vibrational structure expected for both of these species will be helpful.
Consideration of the a -bonding interaction which leads to coordination in an 771 configuration, to he discussed later, indica tes
(37) Anton, A. 8 .; Weinbera. W. H .. unpublished rcsult.s. (3g) Avery, N. R.; Toby. B. H .; Anton. A. B.; Weinberg, W. H . S urfau
Sci. 1911. I 11. LS74. Toby. B. H.; Avery. N. R.; Anton. A. B.: Weinberg. W . H. J . Elurron S{Hctrosc. 1913. l9. 233.
(39) Dellepiane. G.; Overend. J. Sp«rrrxhim. Acta 1966. 11. 593. Allkins. J . R.: Lippinocott. E. R. S{Hctroc~im. A<ra 1968. 1SA . 761.

- 259 -
688 J. Am. Chern. Soc .. Vol . /08, No. 4. 1986 Anton e t a/.
Table I. Assignments of Vibrational Bands ( in cm- 1) Observed with High- Resolution Electron Energy Loss Spectroscopy of IC H J)~CO and
(CD,),CO on Ru(OOI ) a nd Ru(OO I )- p(2 X 2)0. Also Listed Are the Raman and IR Ba nds of Liqu id Acetone and T heir Symmetry Types fo r the Free Acetone Molecule
EELS-acetone on Ru (OO I)
liquid acelone39 (CH 3)C0 (CD,),CO
mode symmetry (C,.) (CH,),CO (CD,),CO multila yer ~ · (95 K) ~' (275 K) ~· (95 K) ~' (275 K)
v(CO) A, 1711 (vs) 1701 (vs) 1720 1690 1300 1665- 1675 1275 •,(C-c-C) B, 1221 (vs) 1249 (vs) 1240 1260 v,(c-c-c) A, 787 (w) 696 (m) 78Q-825 715- 720 6(CO) B, 530 (m) 478 (s) 535 515- 540" 495-505' 6(C...C...C) A, 493 (w) 410 (w) r(CO) B, 393 (w) 331 (w) 655 6 10
3006 (s) 2257 (s) 22 1Q-2240 v(CH,) 2967 (s) 2222 (s) 3030 295Q-2995 2955 2220
2922 (s) 2109 (s) 207Q-2090 1430 (s) 1088 (s)
6(CH,) 1361 (vs) 1037 (vs) 1380 1395- 1440 1370 103Q- 1045 1075 1356 (w) 1006 (w) 1092 (m) 105Q-1110 1170 880
w(CH,) 1066 (m) 889 (m) 905 980 920 902 (m) 89Q-905 820
• Not resolved from the mode at 530 em·• due to oxygen ada toms of the p(2 X 2)0 over layer.
that little perturbation of the structure of the acetone skeleton from that of the free molecule is expected in the , 1 configuration, depicted in Figure Sa. This is manifest in the vibrational spectra of 171-acetone complexes by a preservation of the polarizations and only a weak perturbation of the frequencies of the methyl and nearly all of the skeletal vibrations of free acetone.21 The only strongly affected mode is the v(CO), which is red-shifted from its free acetone value of 1711 cm· 1 to ncar 1650 cm·1 in a range of organometallic complexes of the type I[(CH1) 2C0)6MIH,9 to 1661 11 and 1665 cm· 112 in two , 1-acctone complexes of ruthenium, and to 1630 cm· 1 for 171-(CH1hCO adsorbed on the Pt(lll) surface. 21 The presence of a carbonyl band in this frequency range and methyl vibrations at frequencies characteristic of free acetone in the EEL spectra identify unambiguously the presence of '11-
acetone. The appearance in the spectra of other unperturbed skeletal vibrations with polarizations well-defined with respect to the symmetry properties of the acetone skeleton-v.(CCC), v,(CCC), .S(CO), .S(CCC), and r(CO)-will depend on the orientation of the adsorbed acetone skeleton with respect to the surface plane through consideration of the *dipolar selection rules" for adsorbate vibrations . .o Such considerations can be used to determine the symmetry of the 771-surface complex.21
The vibra tional spectrum expected for acetone coordinated in an ~configuration is not so weU-defined. Several ~configurations have been identified in the homogeneous chemistry of ketonic-like ligands with the general formula R 1R 2C O, including rigid three-membered rings with single metal centers, as in Figure Sb (e.g., R1 = R 2 = H, M = Os. 11 M = Fe;14 R 1 = R2 = CF,, M = Pt.'s M = Ni;16•11 and R, = R2 = CH1, M = Ta11
) , a rigid four-membered ring with two metal centers, as in Figure Sc ( R 1 = R 2 = CF1 and M1 = M 2 = Pt19 ) , and a perpendicular bridge (J<--,2) configuration where the carborH>xygen bond of the ligand bisects the bond between the two metal atoms, as in Figure Sd (e.g., R1 = CH1, R2 = H, and M 1 = M 2 = MolO). Any of these configurations must be considered a possible product of the interaction of acetone with the Ru(OOI) surface. Those complexes which have been characterized by vibrational spectroscopy show bands ascribed to v(CO) in the range 1017- 1220 cm-1,11·14•11
signifying in all cases a substantial lowering of tbe carborH>xygen bond order of the free ligand from two to nearly one upon coordination and rehybridization of the ketonic carbon from spl to nearly spl. Those complexes characterized by an X-ray structural analysis show c-o bond lengths between 1.32 and I .59 A and significant deviation of the R 1-<:-R2 plane and the c-o bond from the coplanar configurations of the free ligands.ll·11•19.lll This is indicative of the rehybridization of the ketonic carbon which occurs as a result of electron donation to the r• co·antibonding orbital of the ligand in all these configurations. Consequently, an adsorbed 772-acetone should display a c-o vibration that is
>... V> z ... ... z
~ OX) ~~ 2000 2!100 .)000 l!IOO
ENERGY LOSS, cni1
Fipre 6. EEL spectra recorded a fter exposure of the clean Ru(OO 1) surface to 6 L of (CH1),CO at 95 K. The symbol • b. • signifies momentary heating to the indicated temperatures, followed by cooling to 95 K to record the spectra.
red-shifted by several hundred wavenumbers from that of the 77 1
species and skeletal vibrations that are consistent with the rehybridization of the ketonic carbon to nearly sp3.
With this framework established, the results of the EELS experiments can now be interpreted. Figures 6 and 7 show EEL spectra recorded after exposure of the clean Ru{OO I) surface at 95 K to 6 L of (C H,hCO and 6 L of (CD3hCO, respectively, followed by momentary annealing at the indicated temperatures and recooling to 95 K to record the spectra. Assignments of the

-260 -
Adsorption of Acetone
500 I(JC() ·~ 0!000 ~ ENERGY LOSS , cm-t
Figure 7. EEL s~ra recorded after exposure of the clean Ru(OOI) surface to 6 L of (CD3),CO at 95 K. heating to the indicated temperatures, and recooling to 95 K.
surface species that are identified are listed in Table I. Spectrum a of Figure 6. recorded immediately after adsorption
at 95 K, shows strong modes at 2950, 1395, 1050, and 905 em·• due to the v, o, and w modes of the CH3 groups of adsorbed (CH3),CO. The shoulder at 1620 em·•. its apparent position red-shifted somewhat from its true position by overlap with the tail of the strong o(CH3) band, signifies the existence of some (CH3),CO adsorbed in an .,• configuration. The v, o, and w modes of CH 3 appear with an intensity too great to be attributed solely to the 11 1 species identified by v(CO) at 1620 em·•. however, and must therefore result from the presence of another adsorbed species which coexists with 111-(CH3),CO at thistemperature and exposure. The appearance of clustering in the monolayer, as evidenced by the thermal desorption results discussed previously, and the identification of a Msecond-layer" state in the thermal desorption s~ra for acetone adsorption on Pt( Ill )27 suggest that the Mextra • intensity in these features may be due to the onset of adsorption into the multilayer (or alternatively, a second layer) state at this exposure. A correspondingly strong feature due to the v(CO) mode of A 1 symmetry of the multilayer species, expected at 1720 cm· 1
(cf. Table 1). is conspicuously absent, indicating via the dipolar selection rule that the molecules in this state are oriented with their molecular planes nearly parallel to the surface. This interpretation is substantiated by the presence of a weak mode at 400 em·'. which can be assigned most readily to the 8 2 ..-(CO) vibration of the same second or multilayer species. The mode at 515 em· ' and the poorly resolved feature labeled at 825 em·• are due to the 8 1 o(CO) and A, v,(CCC) vibrations of .,1-(CH3),CO, respectively. and the feature at 655 em· • is the first indication of the presence of an 112 species.
Annealing the surface to 200 K produces spectrum b of Figure 6. Substantial desorption has occurred (note the change of scale between spectra a and b), but a small amount of .,1-(CH3),CO remains. as evidenced by the presence of v(CO) near 1620 em·•. w(CH 3) at 890 em· ' . and v,(CCC) at 780 em·' . New bands associated with .,2-(CH3)2CO appear near 995 and 1130 em·•. the feature near 650 em·' gains intensity relative to the other modes in the spectra. and the broad band associated with o(CH3) shifts noticeably from 1395 to 1350 em·•. Some decomposition
J. Am. Chern. Soc. , Vol. /08, No. 4, /986 689
is evidenced by bands near 470 and 2000 em·' due to v(RuC) and v(CO) of the adsorbed C0.29
Before proceeding further with the (CH3),CO spectra, the corresponding behavior in the (C D3)2CO spectra of Figure 7 should be addressed. The presence of 11'-(CD3),CO in spectrum a at 95 K is revealed by the v(CO) mode at 1665 em·• and the A, v,(CCC) mode at 715 em· •. Again, the methyl vibrationsv(CD3) at 2210 and 2090 em·•. o(CD3) at 1030 em·•, and w(CD3)
near 920 cm' 1--appear with anomalously high intensity compared to the v(CO) mode at 1665 em·•, suggest ing the presence of a second layer species, and the 8 2 r(CO) of the latter is visible at 360 em·•. Other modes at 1260 and 495 em· ' can be assigned to the 8 1 •.(CCC) and 8 1 o(CO) modes of 11 1-(CD3),CO, respectively. Heating the surface to 200 K initiates decomposition, desorbs most of the 111-(CD3hCO, and reveals featu res due to 112-(CD3),CO near 1260, 890, 800, and 590 em·•.
The EEL spectra of 112-(CH3),CO and >72-(CD3),CO are developed fully after annealing the surface to 275 K and are shown in Figu_res 6c and 7c, respectively, with assignments of these spectra hsted tn Table I. The band at 1300 em· ' in the (CH3),CO spectrum, which is barely resolved from the o(CH3) band at 1370 em~'· and the band at 1275 em·• in the (CD3),CO spectrum are asstgned to the v(CO) mode of 112-acetone, red-shifted by over 400 em·• from v(CO) for free acetone and implying considerable skeletal reorga~i:z:ati~n in this bonding configuration. This signtficant rehybndtzatton of the ketonic carbon atom from sp2 toward sp3
, analogous to that observed in the .,2 complexes of related ligands described earlier, reduces the c-c-c bond angle of acetone toward a tetrahedral configuration, which is manifest in two other features of the ~-acetone spectra. First, the w(CH3)
modes typical of free and '7'-(CH3hCO, expected near 900 and 1100 em· • (cf., Table I), are replaced by a strong band at 980 em·' and a weaker band at 1170 em·• in the spectrum of 112. (CH?)2CO. This is a result of strong coupling between the methyl rocking modes and the c-c stretching mode of a CH3 group bonded to an sp3 carbon atom and is typical of isopropyl and tert-butyl configurations." In isopropyl alcohol, for example similar coupling leads to a strong band at 950 em·• and a weake; band at 1140 cm-1.'2 As a result of this coupling, CH3 rocking modes often do not yteld good group frequencies, and the disparity between the frequencies of the coupled rocking modes in isopropyl alcohol and m ~-(CH3)2CO is of lesser significance than the fact that a strong band in the 9()()-1 000 em·' region is expected for thts type of structural configuration. In the spectrum of 112. (CD,),CO, the difference in frequency between the w(CD3) modes and the c-c stretching vibrations precludes strong coupling, and the w(CD3) modes appear with low intensity at 820 and 880 cm· 1,
close to the values obtained for the corresponding vibrations of free (CD3),CO. The second manifestation of the skeletal reorganization in 112-acetone is the appearance of the band at 655 em·' for 112· (CH3),CO and at 610 em· ' for .,2-(CD3),CO, which develops concomitantly with the other features ascribed to the 112 species. This band is assigned to an o-c-c2 angle bending vtbrauon, whtch may be regarded as being derived from the weak r(CO) mode of free acetone at 393 em·' for (CH3),CO and 331 em·' for (CD3),CO, respectively. With both the oxygen and carbon atoms of the carbonyl function bonded to the ruthenium surface in the 112 configuration. this mode corresponds to the motion of the two methyls in unison up-and-down against the surface.
Further evidence justifying the assignment of bands near 655 and I 300 em·' in the 112-acetone spectra to the signature skeletal vibrations can be obtained by consideration of the spectra shown in Figure 8. The bottom spectrum, recorded in the specular direction where dipolar inelastic scattering is dominant, is identical with that shown in Figure 6c. The top spectrum, recorded with the EELS analyzer rotated 6" toward the surface normal from the specular direction, is expected to show enhancement of features
(40) Reference 39, Chapter 4. (41) Coltup. N. B.; Daly, L. H.; Wiberley, S. E. "Introduction to lnrrared
and Raman Spectroscopy .. ; Academic Press: New York. 1975: Chapter S. (42) Rererence 41, p 458.

-261 -
690 J. Am. Chern. S oc .. Vol. /08. No. 4. 1986
:.oo ooo ·~ 2000 noo lOOO ~
ENERGY LOSS, cm·1
Figure 8. EEL spectra recorded in the specular direction (a) and 6° out of the specular direction (b), after exposure of the clean Ru(OOI) surface to 6 L of (CH,),CO at 95 K, heating to 275 K, and rccooling to 95 K.
which include a significant contribution from (short-range) impact inelastic scattering relative to the (long-range) dipolar scattering. As has been shown previously, impact scattering is significant only for vibrational modes dominated by hydrogen or deuterium motion at the electron beam kinetic energy employed in these measurements.6 Thus, the top spectrum of Figure 8 should show enhancement of the CH, modes relative to the skeletal modes. As may be seen, the v(CO) and r(CO) modes at 1300 and 655 em-1, respectively, as well as the dipolar modes due to cbemisorbod CO at 475 and 1970 em· •. have lost intensity relative to v(CH1) at 2955 em· •. o(CH1) at 1370 em· •, and w(CH1) at 1170 and 980 em-•, confirming the previous assignments and the correspondence indicated between the spectra for >r-(CH1) 2CO and >r-(CD1hCO.
The dipolar selection rule for adsorbate vibrations indicates that only those vibrations which involve a component of motion perpendicular to the surface plane, i.e., only those modes which belong to the totally symmetric representation of the point symmetry group of the adsorbate-substrate complex, should couple to the metdent EELS beam to produce inelastic scattering via the dipolar mcchanism.6 One might then ask why such a strong loss feature is observed for the v(CO) mode of >r-acetone, which for aU possible 112 configurations depicted in Figure 5 is polarized nearly parallel to the surface. First, the highest point group symmetry attainable by each of the possible 172-acetone configurations is C,, which results when a mirror symmetry plane exists through the carbon-oxygen bond perpendicular to the surface. In this case, the A 1 v(CO) mode of free acetone (point group C2o) transforms to the A ' representation of the C, adsorbate complex and is dipolar-active by symmetry considerations alone. Furthermore, the population of the ..-• co orbital of 172-acetone varies with the carbon-oxygen bond length, causing charge flow to and from the surface as the carbon-oxygen bond vibrates, producing the strong dynamic dipole which leads to the intense inelastic scattering observed for this mode. Comparable effects have been observed for similar parallel modes of C,H2 and C 2H, [v(CC)) on Pt(lll )." (CH1)CN [v(CN)) on Pt(lll)."' and 0 2 [v(OO)) on Pt(lll).•s and Ag( II 0).46
No distinction between configurations such as b, c. or d of Figure 5 for 172-acetone on Ru(OO I) can be made on the basis of the EELS results. Each would be expected to give methyl and skeletal vibrations similar to those observed and would differ only in the low-frequency vibrations which represent motion of the bonds which coordinate the acetone molecule to the ruthenium surface atoms. These modes are not resolved in the EEL spectra. and no vibrational data in this frequency range for model complexes are available to allow a useful diagnostic comparison. The
(43) Ibach . H.; Hopslcr. H.; SeXIon. B. App/. Surfaco Sci. 1977. 1. 1. (44) Se<~on. B. A.; Avery. N. R. S urfaa Sci. 1983. 129. 21. (45) Gland. J . l.; Se<~on. B. A.; Fisher. G. B. Surfaa S<i. 1980. 95. 581. (46) Baclu. C.; DeGrool. C. P.M.; Bilocn. P. Surfa« Sd. t981. /{}4, 300.
0. u
!il
CJ.6 750K
a. o.et.. Oz. Todt • 9 5 K, 6 400K
(p(2x2JO) oo
- ""'
Anton eta/.
Ru(OOI I + p(2•21 0+ (CO,~ CO
~ ; J~ '"~" \.A T 1.... - · · " I~ · ----:LU
•oOO • 100
\Ai A n j --=· v vrv;·\tJ~.
XI) 000 0 :100 QX) 1"-10 zooo ~ lOOO
ENERGY L OSS. e m· • Flpre 9. EEL spectra recorded after preparation or a p(2 x 2)0 overlayer on the Ru(OOI) surface (a), followed by exposure to 4 L of (CD,),CO at 95 K. heating to the indicated temperatures, and recooling to 95 K.
details of the 172-coordination geometry are, of course. far less significant than the fact that '12 coordination occurs.
Further beating of the Ru(OOI) surface to 31Q-315 K results in an attenuation of the features due to 17
2-acetone and an increase in the intensiti~s of the features due to adsorbed CO, resulting from decompos1110n of 172-acetone (cf. Figure 6d and 7d). Finally, after healing to 340 K, the EEL spectrum of the decompos ition products of '72-(CH1hCO, shown in Figure 6e, displays broad, weak bands at 825, 1120, 1370. a nd 2945 em· • due to CH, (x 5 3) hydrocarbon fragments.
D. EELS of Acetone oa the Ru(001)- p(2 x 2)0 Surface. Exposure of the clean Ru(OOI) surface to 0.8 L of 0 , at 95 K followed by annealing to 400 K, produces the EEL s~ctrum of the p(2 X 2)0 overlayer shown in Figure 9a. In addition to the feature at 530 cm-1 due to motion of the oxygen adatoms in threefold sites perpendicular to the surface, a mode appears at 250 em·• which results from coupling of the overlayer to a ruthemum surface phonon.7 Addition of the p(2 X 2)0 overlayer. with an ideal fractional surface coverage of 0.25, changes the work function of the Ru(OOI) surface by +0.20 eV.10 When a Ru=O bond length of 2.05 A7 is employed and depolarization effects are ignored, this change in work function can be s hown•7 to be equivalent to the transfer of 0 .02 electron from the ruthenium surface. to each oxygen adatom of the p(2 x 2)0 overlayer. producmg a quantifiable increase in the Lewis acidity of the surface ruthenium atoms.
The effects of the addition of the p(2 X 2)0 overlayer on the properties of the acetone adsorbed on the Ru(OO I) surface are demonstrated dramatically in the EEL spectra of Figures 9 and 10. recorded after exposure of the Ru(001)- p(2 X 2)0 surface to 4 L of (CD,)zCO and 6 L of (CH1) 2CO at 95 K. respect ively,
(47) Topping. J . Proc. R . Soc. London Su. A t927. 114. 67.

-262 -
Adsorption of Acetone J. Am. Chern. S oc .. Vol. 108. No. 4. / 986 691
Table II. Point Groups and Symmetry Types of Ae<:tone Skeletal Vibrations for Free Acetone and the Adsorbed Configurations Shown in Figure I I
configurat ion point group •(CO) v,(CCC) free c,., A, A, (a) ~~ c,. A, A, (b) ~I c, A' A' (c)~~ c, A' A' (d)~' c, A A (e)~' c, A' A'
followed again by momentary annealing to the indicated temperatures.
The 95 K spectra, Figures 9b and lOa, are dominated by modes due to 711-acetone and permit rather straightforward assignments (Table I) and interpretation. In the (CD3)zCO spectrum, modes at 1675 and 720 em· ' are due to the A 1 v(CO) and v,(CCC) modes of , 1-(CD 3)zCO, while those at 2070 and 2240 cm·1 a re due primarily to the v(CD3) modes of 7J'·(CD3)zCO and partly to simila r modes of a small amount of 772-(CD3),CO . The feature at 1260 em·' contains contributions both from the 8 1 •,(CCC) vibration of 771-(CD3) 2CO and the v(CO) mode of 772-(CD3)zCO . The o(CD3) modes from both species are evident at 1045 em·'. a nd the broadened band at 505 cm· 1 results from both the v(Ru=O) mode of chemisorbed oxygen and the 8 1 o(CO) mode of , 1-(CD3)zCO. Although the strong w(CH3) and v(CH3) modes in the corresponding (CH3),CO spectrum may indicate the presence of some multilayer or second layer acetone from the slightly larger initial exposure in this spectrum, the observed features can be assigned confidently to 771-(CH3),CO as follows: v(CH 3) at 2995 em·'. A, v(CO) at 1690 em·•. o(CH3) at 1440 em· ' . w(CH3) at 1110 and 900 em·' . and 8 1 o(CO) unresolved from the mode due to adsorbed oxygen at 540 em·'.
Annealing to progressively higher temperatures attenuates the bands due to 771-(CH3),CO and 771-(CD3),CO concomitantly (cf., Figure 9c-1: and Figure I Ob-;1) and reveals bands due to low concentrations of 'I'·(CH3)zCO and '7'-(CD3) 2CO, the assignments of which parallel those given earlier for the clean surface spectra. The most significant aspect of these annealing sequences is the presence of 77 1-acetone at temperatures approaching 300 K. correlating well with the increased stability of molecularly adsorbed acetone at higher temperatures evident in the thermal desorption spectra from the p(2 X 2)0 overlayer in comparison to the clean Ru(OOI) surface. On the clean Ru(OOI) surface, 711-acetone was barely detectable by EELS at 200 K, and it was not detected at 275 K. On the Pt(lll) surface, ,•-acetone desorbs at 185 K. Consequently, the presence of the f(2 X 2)0 over layer serves to stabilize 771-acetone compared to 77 -acetone, not only increasing the concentration of the 71 1 bonded species, but also increasing its binding energy to the Ru(OOI) surface, as evidenced by the increased temperature of desorption.
Further heating attenuates the remaining bands due to 772•
acetone as it decomposes. Finally. heating to 750 K retrieves the spectrum of atomic oxygen (cf .• Figure 9g). the intensity of which is d iminished due to depletion of the oxygen adatoms via reaction with the surface carbon from the decomposition of 712-acetone.
E. EELS ud tbe Orieatatioa of tbe Acl!orbed Species. The vibrational spectrum of free acetone contains 24 fundamental normal modes, six of which are due to the motion of the C 2CO skeleton, and the remainder of which are due to the internal motion of the methyl groups. The symmetry types of the six skeletal vibrations of free acetone (point group C2o). as well as their frequencies for liquid (CH3),CO and (CD3),C0,39 are listed in Table I.
As was mentioned earlier, the polarizations of the acetone skeletal vibrations (i.e .• the orientation of the transition dipole moment of each mode with respect to the symmetry elements of the acetone skeleton) are preserved when acetone is coordinated in an 771 configuration. For simplicity in the analysis that follows, the surface is assumed to be a structureless Oat plane. Inclusion of the effects of the surface structure on the symmetry of the adsorbed species is necessary only when the atoms of the adsorbate
skeletal mode o(CCC)
A, A, A' A' A A'
-n u
>.... <I)
z "' .... z
•,(CCC)
B, B, A' A" A A "
o(CO) r(CO)
B, B, B, B, A' A" A" A ' A A A" A'
Figur~ 10. EEL spectra recorded after e•posure of the Ru(OOI )- p(2 x 2)0 surface to 6 L of (CH1),CO at 95 K, heating to the indica ted temperatures. and rccooling to 95 K.
interact strongly with surface atoms other than those to which the adsorbate is coordinated and is therefore superfluous in this analysis for adsorbed acetone. The dipolar activity of each of the acetone skeletal modes as a function of the orientation of the acetone skeleton with respect to the surface plane can be deduced by consideration of the possible coordination geometries shown schematically in Figure II . The results of this analysis are listed in Table II .
Figure II a shows the acetone skeleton coordinated to the surface plane in the 71 1 configuration of highest possible symmetry ( C2o). preserving the C2 rotational axis and both mirror planes of the free acetone molecule. The A 1 modes of the free acetone skelcton-v(CO), v,(CCC), and o(CCC)-are polarized parallel to the C 2 axis and strictly perpendicular to the surface plane in this configuration and are therefore dipolar-active. The 8 1 modes-v.(CCC) and o(CO)-are polarized in the u1 mirror plane strictly parallel to the surface and are dipolar-inactive. The 8 2 modc---r(CO)-is polarized in the u2 plane, parallel to the surface, and is also dipolar-inactive. Tilting the molecule in the 111 plane, as in Figure II b , reduces the symmetry of the adsorbate complex from C2o to C,. transforming the A 1 and 8 1 modes of C,_ to A' of C, and the 8 2 mode to A". Only the A' modes arc dipolar-active.

692 J . Am. Chem. Soc .. Vol. /08. No. 4, /986
(b) 'J' - Cs :---.. j; g :~ .... ' ---
(c) '11-Cs (d l "J ' - c, (e) T-Cs
-269 -
--' '
Figu"' II. Schematic bonding configurations for ~'-acetone on a structureless nat surface (a-<l). illustrating the symmetry elements preserved in each configuration. The ~1 configuration (e) is shown for comparison. In each case, the larger circles represent methyl groups, and the smaller circles represent the carbon and oxygen atoms.
Tilting the molecule in the <T2 plane produces the C, configuration shown in Figure lie, with the A1 and 8 2 modes transforming to A'and the 8 1 modes to A '~ In Figure lid, the molecule has been tilted away from both mirror planes, reducing the symmetry to C1• All modes transform to A of C1 and arc dipolar-active. By the same reasoning as was applied in these examples, an acetone molecule lying flat on the surface could have symmetry no higher than C,. as is shown for the rr configuration in Figure lie. Note that in tenns of symmetry arguments, this configuration is fonnally equivalent to Figure lie, and the differences in their vibrational spectra would depend on the effects of the skeletal rchybridization which accompanies the ~2 interaction d,epicted in Figure II c.
Returning to the results listed in Table I, obtained from the most clearly resolved spectra of the monolayer~~ and q2 species, only modes of A1 and 8 1 symmetry arc observed for ~1 -acetonc on Ru(OOI ), confirming as correct the configuration shown in Figure II b. This is also the configuration that would be expected to result from the interaction of a single lobe of the oxygen lone pair orbital, a p-type orbital in the plane of the molecule,41 with a single metal atom of the surface, and agrees with the results obtained for acetone adsorption on Pt( Ill )27 and two structurally characterized q1 complexes of ruthenium, where Ru-0-C bond angles of 153" 11 and 135" 12 have been reported. For the rr species, modes derived from the A1 v(CO) and v,(CCC) and the 8 2 11'(CO) arc observed, confirming c of Figure I I as the appropriate configuration .
IV. Discussion The dramatic effect of oxygen preadsorption on the selectivity
of the Ru(OOI) surface toward the nonreactive (q 1) and reactive (~2) coordination geometries for adsorbed acetone has important implications in the understanding of more complex catalytic reactions. Two possibilities come immediately to mind. The ability to identify and modify selectively those properties of a heterogeneous catalyst which produce the adsorbed intermediate structures which ultimately lead to the desired products could be used to increase the rate and especially the yield for the catalytic reaction. Furthermore. these results may lead directly to a better understanding of how otherwise "inert" coadsorbed species can act as promoters or poisons to affect the product distribution in a heterogeneously catalyzed reaction. To appreciate these possibilities more fully. an understanding of the acetone-ruthenium
(48) Hess. 8 .: Bruna. P. J .: Buenker. R. J .: PeyerimhoiT. S.D. Ch•m. Phys. t980. 18. 267.
Anton eta/.
bonding interaction with and without the effects of coadsorbed oxygen will be developed.
Three factors can be identified which control the type and strength of bonding which coordinate a ligand to a metal center or surface. 22 First, orbitals of the same symmetry must exist on both the ligand and the metal to allow their mixing; second, the spatial extent of the orbitals must be sufficient to facilitate significant overlap; and third, the energies of the interacting orbitals must be similar. Changes in the relative importance of these three factors make one coordination geometry favored over another for a particular ligand-metal system.
Let us first consider the q1• and 112-coordination geometries observed for acetone 'in terms of the "frontier" orbitals of the free acetone ligand. 41 The lowest unfilled orbital is the ,..• co-anti· bonding orbital, which lies at +4.4 cV with respect to the vacuum level and bas its amplitude more strongly localized on the acyl carbon atom than on the oxygen atom. The highest filled molecular orbital is the nonbonding oxygen lone pair, resembling an atomic p-like orbital with lobes localized strongly on the oxygen atom and in the skeletal plane. Its energy lies at 11.2 cV below the vacuum level. The next highest filled level is the " co· bonding orbital at -12.9 cV, the amplitude of which is slightly greater on the oxygen than on the acyl carbon atom.
An 11 1-coordination geometry for organometallic complexes of acetone results from overlap of a single lobe of the non bonding oxygen lone pair orbital of acetone with a d. acceptor orbital of the metal, resulting in a net transfer of electron density from the ligand to the metal. The bent M-0-C bond, identified for the two 111-acctone complexes of ruthenium mentioned earlier11•12 and for the orientation of 111-acetone on both Pt(lll)27 and Ru(OOI), is a consequence of the spatial distribution of this lone pair donor orbital on acetone. Presumably due to the low amplitude of the ,..• co-anti bonding orbital on the oxygen atom, little backdonation from the metal d.,. levels to this ligand orbital occurs, as evidenced by the rather small (less than 100 cm- 1) red-shifts of the v(CO) mode observed for homogeneous complexes,...12 and metal surfaces27 which bind acetone in this configuration. The role of the metal in this type of interaction is that of a weak Lewis acid, and the purely dative metal-acetone bond which results is correspondingly weak. In many cases, depending on the metal and the properties of other ligands coordinated to it which affect its electronic structure, 111-acetonc complexes arc too unstable to be isolated and characterized structurally.9•10 Thermal desorption results suggest a binding energy of 11.6 kcal j mol for 171-acetone on the Pt( Ill) surface, 27 and a similar analysis•• of the thermal desorption data for Ru(OO I) suggests binding energies in the range of IG-15 kcalj mol on the clean surface and IG-19 kcal j mol on the Ru(OOI )- p(2 X 2)0 surface.
An 112-coordination geometry for organometallic complexes of acetone results from overlap of the ..-co-bonding orbital of acetone with a d, or sp hybrid acceptor level of the metal, along with backdonation from metal d.,. levels into the "'co·antibonding orbital of the acetone ligand. 21 The strength of this interaction, and therefore the probability of its occurrence relative to the 11' interaction, depends critically on the ability of the ligand- metal bond to facilitate backdonation, since in the absence of backdonation the remaining ..--donor bond is particularly weak and unstable.22
Indeed, each of the organometallic complexes isolated and characterized structurally which shows 112 coordination of ligands similar to acetoncll·lO and the 112-acctonc identified on Ru(OOI) in this work display substantial rchybridization of the acyl carbon from sp2 to nearly sp3, giving clear evidence of efficient backdonation. The fact that backdonation dominates the 11' interaction has been concluded in similar studies of olefin><> and acetylene= bonding to transition metals and illustrates the function of the metal as a Lewis base in these cases. so Since transition-metal atoms provide both orbitals of,.. symmetry to match the symmetry of the ..-•co·antibonding orbital and spatial extent to afford efficient overlap, 22 it is the energy match of the interacting orbita ls
(49) Redhead, P. A. Vacuum 1961. I], 203. (50) Ugo. R. CooTd. Ch<m. Rro. 1961. J. 319.

-264
Adsorption of Acetone
which most strongly affects this backbonding interaction. The effect of d. and ,..• co-orbital energies on '12 bonding is
illustrated in the properties of the complexes with acetone-like ligands in "'-coordination geometries. Recall that coordination of acetone to a number of transition metals, including rhodium a nd iridium10 and ruthenium,11•12 produces"' complexes. Substitution of hydrogen for CH3 in acetone, however, lowers the energy of the r*c0 -antibonding orbital from +4.4 to +3.1 cV,41
decreasing the energy gap between the r• co and d. levels. This enhances d. to ,..• co backdonation, and ~-formaldehyde complexes with a number of metals, including osmium 13 and iron, 14 result. Substitution of the more electronegative CF3 for CH3 depolarizes the carbon-Qxygen bond of hcxafluoroacetone relative to acetone, lowering its ,..• co-orbital energy dramatically and yielding '12
complexes with electronegative metals such as platinum15•19 and nickel. 16•17 Of particular significance with respect to these arguments is that the only unsubstituted '12-acetone complex isolated to date is formed with a low valent and electropositive tantalum center. 11 The lower d-level occupancy of tantalum (5d36s2) relative to rhodium (4d15s1), iridium (5d76s2), and ruthenium (4d75s1)
ensures that its d levels have higher energy and therefore can more easily populate the ,..• co level of acetone to facilitate '12 bonding.
On the basis of these arguments, the formation of '12-acetone on the Ru(OOI) surface can be understood. Interactions among metal atoms at a surface broaden the d levels to form bands which extend to higher energies than the d levels of isolated metal atoms (i.e., the Fermi level of a bulk metal is at a higher energy than the highest occupied level of an isolated metal center),51 causing the atoms of the surface to behave as isolated metal atoms of lower net d-level occupancy. In effect, metal atoms at a surface are more electron rich than isolated atoms in a complex and can therefore raise their formal oxidation state more easily to yield backdonor bonding. The r• co orbital of acetone is apparently at the appropriate energy to allow a dramatic distinction between the behavior of the Ru(OOI) surface, where the Fermi level is at -5.4 eV52 and where substantial~ bonding of acetone occurs, and the Pt( Ill) surface, the increased d-level occupancy of which (5d96s1) lowers its Fermi level to -5.9 eVH and thus favors 'I' bonding.
It remains to explain in these same terms the effect of coadsorbed oxygen on the bonding of acetone on Ru(OOI). As was discussed previously, the p(2 X 2)0 overlayer increases substantially both the concentration and the stability of '!1-acetone on the Ru(OOI) surface. We attribute this to a "short-range" through-metal electron deficiency at neighboring ruthenium surface sites, due to the presence of the electronegative oxygen ada toms, increasing the Lewis acidity of the former. The stability of other surface species coordinated to the Ru(OOI) surface via a-donor bonds shows a similar enhancement in the presence of coadsorbed oxygen, including N,, 54 N 20," and bridge-bonded formate. 56
Addition of the p(2 x 2)0 overlayer increases the work function of the Ru(OOI) surface by 0.20 eV (i.e., lowers the Fermi level by 0.20 to -5.6 eV),30 increasing the disparity between the energy of the occupied d band of the metal and that of the ,..• co acceptor level of acetone. This renders backdonation more difficult and causes Ru(OOI) to behave more like Pt(lll). The implications of this for the effects of catalyst poisons and promoters are interesting: adsorption of electronegative substituents such as sulfur would produce an increase in the surface work function similar to oxygen and should therefore inhibit reactions which proceed through backbonded intermediates, whereas the adsorption of
(51) Saillard, J.-Y.; Hoffmann, R. J. Am. Ch<m. Soc. 1984, /06, 2006. (52) Himpoel, F. J .; Christmann. K.; Heinmann, P.: Eastman, D. E. PhyJ.
Rro. 8 1981, ]J, 2546. (53) Nieuwenhuys, B. E.; Sacbtler, W. H. M. Swrfau Sci. 1973. 34, 317. (54) Anton, A. B.; Avery, N. R.; Madey, T. E. ; Weinberg, W. H .. in
preparation. (55) Madey. T. E.; Anton, A. B.; Avery, N . R .; Weinberg, W. H .• in
preparation. (56) Toby, B. H .; Avery. N. R.; Anton. A. B.; Weinbera. W. H .. in
preparation.
J . Am. Chern. Soc .. Vol. 108. No. 4. 1986 693
"cationic" species such as potassium would decrease the surface work function and should ·promote the formation of back bonded intermediates (based solely on the shift in energy difference between the donor and acceptor levels caused by each). The net effects of these bonding interactions on the surface chemistry of acetone adsorbed on both the clean Ru(OOI) and the Ru (OO I )- p(2 X 2)0 surfaces may be illustrated by overall reaction schemes for the monolayer species adsorbed on both surfaces, which result from consideration of both the EELS and thermal desorption results discussed previously.
On the clean Ru(OO I) surface, both '!'- and '!'-acetone are produced upon adsorption of a saturated first layer of acetone at 95 K
and
Heating the surface causes '1 1-acctonc to desorb molecularly in the temperature range between approximately 150 and 250 K,
'!1-(CH3),CO - (CH3),CO(g)
whereas '12-acetonc decomposes between approximately 200 and 320 K to adsorbed CO and CH3 fragments:
~2-(CH 3),CO - CO(a) + 2CH3(a)
Decomposition of the CH3 fragments follows rapidly through CH, (x < 3) intermediates
CH3(a) - CH2(a) + H(a) - CH(a) + 2H(a) -C(a) + 3H(a)
Adsorbed CO is evolved from the surface in a desorption ratelimited reaction ncar 470 K,
CO(a) - CO(g)
and hydrogen ada toms from CH, decomposition recombine on the surface to evolve H 2 in a desorption rate-limited reaction ncar 330 Kanda series of reactions between 400 and 750 K which have their desorption rates limited by the rates of decomposition of the CH, fragments on the surface in this temperature range:
2H(a) - H2(g)
Adsorbed carbon from the methyl groups remains on the surface. The total amount of CO and H 2 evolution from the surface indicates that approximately one-eighth of the monolayer of " ' acetone adsorbs and decomposes on the clean Ru(OO I) surface under these conditions.
On the Ru(OOI )- p(2 X 2) 110 surface, substantially more '!'-acetone and less '!' -acetone are formed upon adsorption at 95 K compared to the clean surface. Heating of the surface causes '! '-acetone to desorb molecularly in the temperature range between approximately 150 and 320 K, a nd the remaining '!' -acetone decomposes to adsorbed CO and CH 1 fragments in the temperature range between 200 and 350 K. The p(2 X 2) oxygen ovcrlaycr not only increases the yield of '!' -acetone and stabilizes it to higher desorption temperatures, but it also retards the rate of decomposition of ~2-acetone, as evidenced by its persistence in EEL spectra of higher temperatures on the Ru(OO I )-p(2 X 2)0 surface than on the clean surface. Decomposition of the CH1
fragments follows rapidly after their formation. producing H 2 in desorption rate-limited reactions near 220 K and a series of reactions between 250 and 550 K, the desorption rates of which arc limited by the rates of decomposition of the adsorbed CH, fragments. The CO produced from the decomposition of '!2-
acctonc (m = 28 amu) is evolved in a desorption rate-limited reaction at 450 K, and C 180 produced by the reaction of adsorbed carbon from CH1 decomposition with the oxygen adatoms ( 110) of the p(2 X 2) over layer (m = 30 amu) is evolved between 400 and 700 K. The total amounts of CO (m = 28 amu) , H 2, and C"O (m = 30 amu) evolution from the surface indicate that

-265 -
694 J. Am. Chern. Soc .. Vol. 108. No. 4, 1986
approximately 0.02 monolayer of q2-acetone adsorbs and decomposes on the Ru(OOI )- p(2 X 2)0 surface under these conditions.
Two pathways can be postula ted for the decomposit ion of q2-acetone on the Ru(OOI ) surface. In one case, the acetone skeleton would decompose initially through c-c bond cleavage to produce CO and methyl groups on the surface. Since molecular dissociation in general proceeds lhrough population of an antibonding molecular orbital,li.S7 the difference in reactivity of the Ru(OOI) surface toward 11'· and q2-acetone would be a clear and obvious manifestation of the bonding interactions which lead to the formation of each species if c-c bond cleavage were the dominant dissociation channel. The reaction coordinate for this mechanism would be the v(CO) vibration of 172-acetone. since its amplitude controls most directly the population of the ,..• co-anti bonding orbital, and this orbital in turn controls the integrity of the acetone skeleton. A second possible mechanism invokes first C-H bond cleavage, with decomposition of the destabilized acetone skeleton following rapidly thereafter. In this case, 17
2-
acetone, with its methyl groups in closer proximity to the ruthenium surface atoms than the 171 species, would again be expected to be more reactive. Decomposition would proceed via population of the ,..•CH,-anitbonding orbital of acetone, and either the 1r(CO) vibration of 172-acetone near 600 cm' 1, the motion of which controls the approach of the methyl groups to the surface, or the v(CH) vibration would represent the reaction coordinate. A distinction between these possibilities could only be made if the experimental results showed clear evidence of a kinetic isotope effect. For example, if the decomposition of q2-(CD3),CO occurred at higher temperatures than q2-(CH3),CO, this would identify v(CH) as the reaction coordinate and C-H bond cleavage as the rate-limiting step in 172-acetone decomposition. Such a kinetic isotope effect was not observed, however. Since the ,..• co orbital of acetone is
(57) Sung. S.-S.: Hoffmann. R. J. Am. Ch•m. Soc. 1985, 107, 578.
A nron era/.
already partially populated in the stable 172 configuration, and since the_,..•cH, orbital is at sign ificantly higher energy than the ,..•co orb1 tal ( 16 .5 vs. 8.2 eV for free acetone .. ). decomposition of '7' -acetone via c-c bond cleavage would appe:lr to be the favored mecha nism.
V. Summary The important conclusions of this work may be summarized
as follows: ( I) Acetone bonds molecularly to the Ru(OOI) surface at 95
K in two different configurations: an 11 ' (end-on) configurat ion which desorbs reversibly and an 112 (side-on) configuration which dissociates upon heating of the surface.
(2) The 112 configuration is the majority species on the clean Ru(OOI) surface. The appearance of a red-shifted v(CO) vibration near 1300 cm· 1 indicates significant rehybridization of the acyl carbon in this configuration, to that found for homogeneous organometallic complexes with q2-ketonic ligands.
(3) The 111 configuration is adsorbed with C, symmetry a nd a nonlinear Ru-o-c bond, as has been observed in analogous organometallic 171 complexes of acetone.
( 4) Addition of an ordered p(2 x 2) overlayer of oxygen ada toms to the Ru(OOI) surface stabilizes the 11
1 configuration of adsorbed acetone, rendering it the majority surface species and increasing its binding energy relative to the clean surface.
(5) The selectivity of the Ru(OOI) and the Ru(OOI)-p(2 x 2)0 surfaces toward the 11'· and q2-acetone bonding configurations can be explained in terms of the electronic properties of these surfaces and their effects on the bonding interactions which dictate the two coordination geometries.
Acknowledgment. We thank Profs. R. H . Grubbs and J . E. Bercaw for valuable discussions during the preparation of this manuscript. This research was supported by the National Science Foundation under Grant CHE82-06487.