Embed Size (px)
Citation preview
arX
iv:h
ep-e
x/04
0701
4 v1
8
Jul 2
004
Study of the doubly and singly Cabibbo
suppressed decays D+ → K+π+π− and
D+s → K+π+π−
The FOCUS Collaboration
J. M. Link a P. M. Yager a J. C. Anjos b I. Bediaga b C. Gobel b
A. A. Machado b J. Magnin b A. Massafferri b
J. M. de Miranda b I. M. Pepe b E. Polycarpo b A. C. dos Reis b
S. Carrillo c E. Casimiro c E. Cuautle c A. Sanchez-Hernandez c
C. Uribe c F. Vazquez c L. Agostino d L. Cinquini d
J. P. Cumalat d B. O’Reilly d I. Segoni d K. Stenson d
J. N. Butler e H. W. K. Cheung e G. Chiodini e I. Gaines e
P. H. Garbincius e L. A. Garren e E. Gottschalk e P. H. Kasper e
A. E. Kreymer e R. Kutschke e M. Wang e L. Benussi f
M. Bertani f S. Bianco f F. L. Fabbri f A. Zallo f M. Reyes g
C. Cawlfield h D. Y. Kim h A. Rahimi h J. Wiss h R. Gardner i
A. Kryemadhi i Y. S. Chung j J. S. Kang j B. R. Ko j
J. W. Kwak j K. B. Lee j K. Cho k H. Park k G. Alimonti ℓ
S. Barberis ℓ M. Boschini ℓ A. Cerutti ℓ P. D’Angelo ℓ
M. DiCorato ℓ P. Dini ℓ L. Edera ℓ S. Erba ℓ M. Giammarchi ℓ
P. Inzani ℓ F. Leveraro ℓ S. Malvezzi ℓ D. Menasce ℓ
M. Mezzadri ℓ L. Moroni ℓ D. Pedrini ℓ C. Pontoglio ℓ F. Prelz ℓ
M. Rovere ℓ S. Sala ℓ T. F. Davenport III m V. Arena n G. Boca n
G. Bonomi n G. Gianini n G. Liguori n M. M. Merlo n
D. Pantea n D. Lopes Pegna n S. P. Ratti n C. Riccardi n
P. Vitulo n H. Hernandez o A. M. Lopez o H. Mendez o A. Paris o
J. Quinones o J. E. Ramirez o Y. Zhang o J. R. Wilson p
T. Handler q R. Mitchell q A. D. Bryant r D. Engh r M. Hosack r
W. E. Johns r E. Luiggi r M. Nehring r P. D. Sheldon r
E. W. Vaandering r M. Webster r M. Sheaff s
aUniversity of California, Davis, CA 95616
bCentro Brasileiro de Pesquisas Fisicas, Rio de Janeiro, RJ, Brasil
cCINVESTAV, 07000 Mexico City, DF, Mexico
Preprint submitted to Elsevier Science 8th July 2004

dUniversity of Colorado, Boulder, CO 80309
eFermi National Accelerator Laboratory, Batavia, IL 60510
fLaboratori Nazionali di Frascati dell’INFN, Frascati, Italy I-00044
gUniversity of Guanajuato, 37150 Leon, Guanajuato, Mexico
hUniversity of Illinois, Urbana-Champaign, IL 61801
iIndiana University, Bloomington, IN 47405
jKorea University, Seoul, Korea 136-701
kKyungpook National University, Taegu, Korea 702-701
ℓINFN and University of Milano, Milano, Italy
mUniversity of North Carolina, Asheville, NC 28804
nDipartimento di Fisica Nucleare e Teorica and INFN, Pavia, Italy
oUniversity of Puerto Rico, Mayaguez, PR 00681
pUniversity of South Carolina, Columbia, SC 29208
qUniversity of Tennessee, Knoxville, TN 37996
rVanderbilt University, Nashville, TN 37235
sUniversity of Wisconsin, Madison, WI 53706
See http://www-focus.fnal.gov/authors.html for additional author information.
Abstract
Using data collected by the high energy photoproduction experiment FOCUSat Fermilab we study the doubly and singly Cabibbo suppressed decays D+ andD+
s → K+π+π−. Our measurements of Γ(D+ → K+π+π−)/Γ(D+ → K−π+π+) =0.0065 ± 0.0008 ± 0.0004 and Γ(D+
s → K+π+π−)/ Γ(D+s → K+K−π+) = 0.127 ±
0.007 ± 0.014 are based on samples of 189± 24 D+ and 567 ± 31 D+s reconstructed
events, respectively. We also present Dalitz plot analyses of the two decay channels;the amplitude analysis of the D+
s → K+π+π− mode is performed for the first time.
1 Introduction
A thorough understanding of D hadronic decays requires both branching ratiomeasurements of all the hadronic modes and Dalitz plot analyses to investigatethe decay dynamics and probe the role of final state interactions. In thisletter we present branching ratio measurements and Dalitz plot analyses ofthe doubly and singly Cabibbo suppressed decays D+ → K+π+π− and D+
s →K+π+π−.
The naıve expectation for the ratio of Doubly Cabibbo Suppressed (DCS)
2

to Cabibbo Favored (CF) branching fractions is tan4 θC ∼ 0.25%. Howeverthe CF D+ → K−π+π+ rate could be suppressed by destructive interfer-ence between spectator amplitudes with indistinguishable quarks in the finalstate; this is the argument generally proposed to explain the lifetime dif-ference between D+ and D0. For the hadronic DCS D+ decay all the finalstate quarks are different and no destructive interference is present. In thissimple picture we would expect, neglecting effects of final state interactions,τ(D+)/τ(D0) = Γ(D0
CF)/Γ(D+CF) = (1/ tan4 θC)×Γ(D+
DCS)/Γ(D+CF). The com-
parison of the precise FOCUS lifetime ratio [1] τ(D+)/τ(D0) = 2.538± 0.023with the branching ratio Γ(D+
DCS)/Γ(D+CF) measurement reported here will
test this interpretation.
The final D+ and D+s samples are selected with cuts to reduce reflections from
the more copious Cabibbo favored modes and to optimize the signal to noiseratios, which are crucial for reliable decay amplitude analyses. Dalitz plotanalyses have indeed emerged as a unique tool to fully exploit the availablecharm statistics allowing, besides the simple branching ratio evaluation, toinvestigate the underlying decay dynamics. Our understanding of the charmdecay dynamics has already considerably improved in the last years, but isstill limited to a few decay channels. The Dalitz plot analysis of the SinglyCabibbo Suppressed decay (SCS) D+
s → K+π+π− is performed for the firsttime.
2 Signal selection
The data for this analysis were collected during the 1996–1997 run of thephotoproduction experiment FOCUS at Fermilab. The detector, designed andused to study the interaction of high-energy photons on a segmented BeOtarget, is a large aperture, fixed-target magnetic spectrometer with excellentCerenkov particle identification and vertexing capabilities. Most of the FOCUSexperiment and analysis techniques have been described previously [2–4].
The suppressed nature of the channels under study requires severe cuts toeliminate reflections, both in the signal and sideband regions, from more co-pious and favored decays, when one or two charged particles are Cerenkovmisidentified and/or one neutral particle is missing. Tight cut choices are alsorequired to improve the signal-to-noise ratio to perform a reliable Dalitz plotanalysis.
The D+ and D+s candidates are obtained using a candidate driven vertex
algorithm. A decay vertex is formed from three reconstructed charged tracks.The momentum of the D candidate is used to intersect other reconstructedtracks to form a production vertex. The confidence levels (C.L.) of each vertex
3

is required to exceed 1%. From the vertexing algorithm, the variable ℓ, whichis the separation of the primary and secondary vertices, and its associatederror σℓ are calculated. We reduce backgrounds by requiring ℓ/σℓ > 14 and 10for the D+ and D+
s , respectively. The two vertices are also required to satisfyisolation conditions. The primary vertex isolation cut requires that a trackassigned to the decay vertex has a C.L. less than 1% to be included in theprimary vertex. The secondary vertex isolation cut requires that all remainingtracks not assigned to the primary and secondary vertex have a C.L. smallerthan 0.1% to form a vertex with the D candidate daughters. The decay vertexis required to be 3 σ outside of the target material to reduce the backgrounddue to hadronic re-interactions in the target.
The Cerenkov particle identification is based on likelihood ratios betweenthe various stable particle hypotheses [3]. The product of all firing probabil-ities for all cells within the three Cerenkov cones produces a χ2-like variableWi=-2ln(likelihood) where i ranges over the electron, pion, kaon and protonhypothesis. For the D+ selection, we require ∆WK = Wπ − WK > 4 and∆Wπ = WK − Wπ > 3.5 for both pions in the final state. For the D+
s candi-dates we require ∆WK > 4 for the kaon, ∆Wπ > 2 for opposite-sign pion and∆Wπ > 1 for same-sign pion. These selections minimize the contaminationfrom charm background.
A detailed Monte Carlo study is performed to evaluate the possible contami-nations and structures induced by reflections both in the signal and sidebandregions. 1 The considered sources of background are the D+ and D+
s three-body hadronic decays, where one or two particles are misidentified, and four-body hadronic and semileptonic decays, where charged particles are misiden-tified and neutrals are missing, namely: D+ → K−π+π+, D+
s → K−K+π+,D+ → K−K+π+, D+ → π+π−π+, D+ → K−π+µ+ν, D+
s → K−K+µ+ν andD+ → K−π+π+π0. For each of them we evaluate the number and the dis-tribution shape of events which survive the selection cuts and penetrate intothe D+ and D+
s → K+π+π− signal and sideband regions. From this study,we find that the major contributions for D+ come from D+ → K−π+π+,D+
s → K−K+π+ and D+ → K−π+π+π0, and for D+s from D+ → K−π+π+,
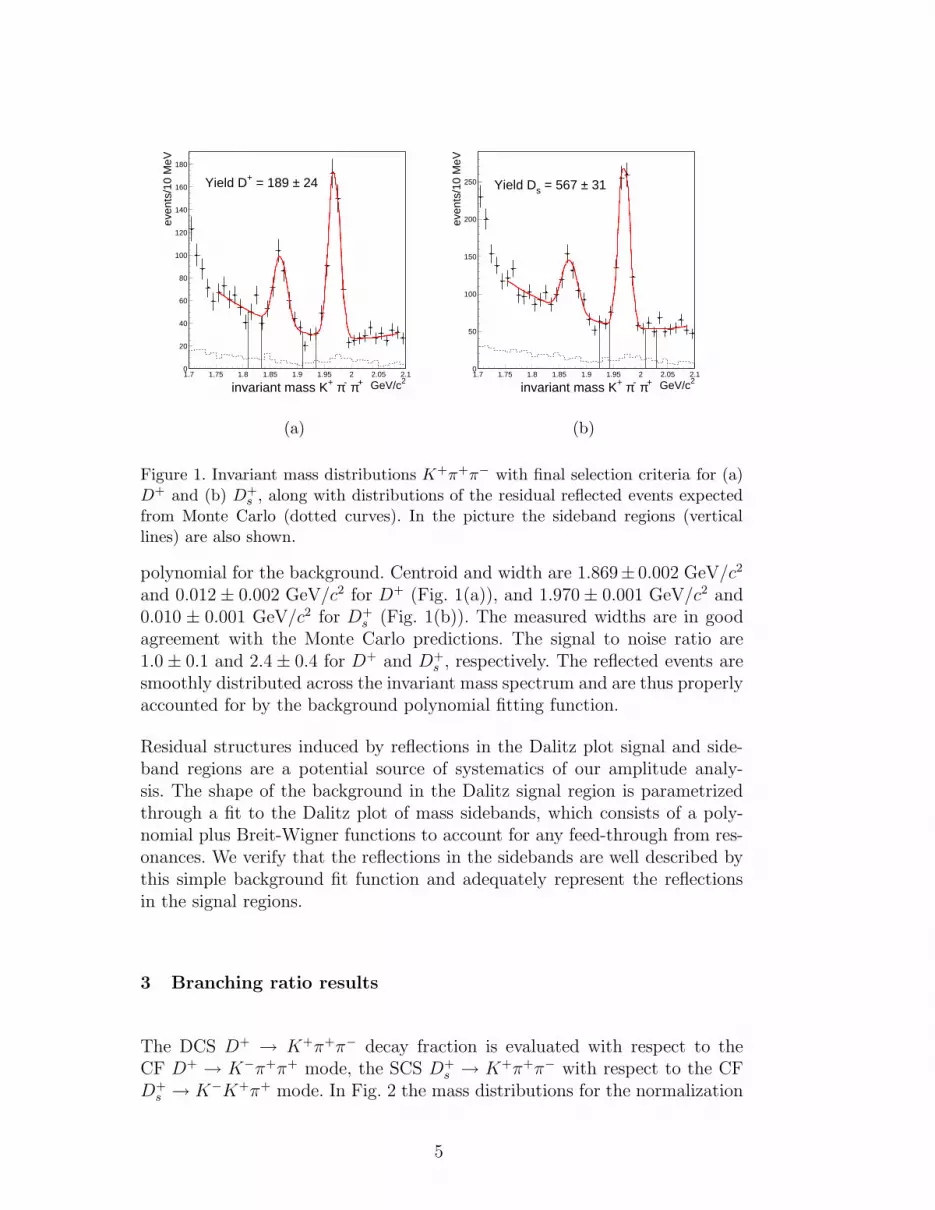
D+ → π+π−π+ and D+ → K−π+π+π0. In Fig. 1 the selected K+π+π− com-binations for D+ and D+
s are shown, along with the distribution of the MonteCarlo reflected events. We choose to start our fit from the 1.75 GeV/c2 energythreshold since the region below is dominated by the partial reconstructionof multi-body charm channels where neutrals are missing. The signal yieldsconsist of 189 ± 24 events for D+ and 567 ± 31 events for D+
s . The fits areperformed with two Gaussian functions for the signals and a second order
1 The sidebands for D+ cover the −5σ to −3σ and the 3σ to 5σ regions from theD+ peak. For the D+
s the left sideband covers the −5σ to −3σ region and the rightsideband covers the 4σ to 6σ region, both from the D+
s peak.
4
invariant mass K+ π- π+
0
20
40
60
80
100
120
140
160
180
1.7 1.75 1.8 1.85 1.9 1.95 2 2.05 2.1
GeV/c2
even
ts/1
0 M
eV
Yield D+ = 189 ± 24
(a)
invariant mass K+ π- π+
0
50
100
150
200
250
1.7 1.75 1.8 1.85 1.9 1.95 2 2.05 2.1
GeV/c2
even
ts/1
0 M
eV
Yield Ds = 567 ± 31
(b)
Figure 1. Invariant mass distributions K+π+π− with final selection criteria for (a)D+ and (b) D+
s , along with distributions of the residual reflected events expectedfrom Monte Carlo (dotted curves). In the picture the sideband regions (verticallines) are also shown.
polynomial for the background. Centroid and width are 1.869± 0.002 GeV/c2
and 0.012 ± 0.002 GeV/c2 for D+ (Fig. 1(a)), and 1.970 ± 0.001 GeV/c2 and0.010 ± 0.001 GeV/c2 for D+
s (Fig. 1(b)). The measured widths are in goodagreement with the Monte Carlo predictions. The signal to noise ratio are1.0 ± 0.1 and 2.4 ± 0.4 for D+ and D+
s , respectively. The reflected events aresmoothly distributed across the invariant mass spectrum and are thus properlyaccounted for by the background polynomial fitting function.
Residual structures induced by reflections in the Dalitz plot signal and side-band regions are a potential source of systematics of our amplitude analy-sis. The shape of the background in the Dalitz signal region is parametrizedthrough a fit to the Dalitz plot of mass sidebands, which consists of a poly-nomial plus Breit-Wigner functions to account for any feed-through from res-onances. We verify that the reflections in the sidebands are well described bythis simple background fit function and adequately represent the reflectionsin the signal regions.
3 Branching ratio results
The DCS D+ → K+π+π− decay fraction is evaluated with respect to theCF D+ → K−π+π+ mode, the SCS D+
s → K+π+π− with respect to the CFD+
s → K−K+π+ mode. In Fig. 2 the mass distributions for the normalization
5

invariant mass K- π+ π+
0
1000
2000
3000
4000
5000
6000
7000
1.7 1.75 1.8 1.85 1.9 1.95 2 2.05 2.1
GeV/c2
even
ts/5
MeV
invariant mass K- K+ π+
0
200
400
600
800
1000
1200
1400
1.7 1.75 1.8 1.85 1.9 1.95 2 2.05 2.1
GeV/c2
even
ts/5
MeV
Figure 2. Invariant mass distributions of D+ → K−π+π+ and D+s → K−K+π+
normalization channels.
channels are shown. The CF D+ → K−π+π+ sample is selected with thesame set of cuts as for the DCS channel, in order to minimize systematiceffects; the signal yield is 32714 ± 184. The CF D+
s → K+K−π+ is obtainedrequiring for K− a ∆WK > 2 similar to the ∆Wπ for the opposite-sign pionin the SCS selection; kinematical cuts are applied to remove the reflections inthe K−K+π+ mode from the CF D+ → K−π+π+ and from D∗+ → D0π+,followed by the D0 decay to K−π+. The D+
s → K−K+π+ signal yield is4033 ± 68. A fully coherent generation is used both for the channels understudy and the normalization modes; the relative efficiencies are measured tobe
ǫ(D+ → K+π+π−)
ǫ(D+ → K−π+π+)= 0.888 ± 0.006 (1)
andǫ(D+
s → K+π+π−)
ǫ(D+s → K−K+π+)
= 1.106 ± 0.009 . (2)
From the yields and efficiency ratios, we measure the following branchingratios,
Γ (D+ → K+π+π−)
Γ (D+ → K−π+π+)= 0.0065 ± 0.0008 ± 0.0004 (3)
andΓ (D+
s → K+π+π−)
Γ (D+s → K+K−π+)
= 0.127 ± 0.007 ± 0.014 . (4)
The first error reported is statistical and the second is systematic.
To evaluate the systematic error we consider, as done in other FOCUS anal-yses [5, 6], three contributions, which are added in quadrature to obtain theglobal systematic error: the split sample, fit variant and cut variant compo-nents. The split sample component takes into account the systematics intro-
6

duced by residual difference between data and Monte Carlo, due to a possiblemismatch in the reproduction of the D momentum and the changing experi-mental conditions of the spectrometer during data collection. This componenthas been determined by splitting data into four independent subsamples, ac-cording to the D momentum range (high and low momentum) and the con-figuration of the vertex detector. The S-factor method from the Particle DataGroup [7] was used to try to separate true systematic variations from statisticalfluctuations. The branching ratio is evaluated for each of the four statisticallyindependent subsamples and a scaled variance is calculated σ (the errors areboosted when χ2/(N − 1) > 1). The split sample variance is defined as thedifference between the reported statistical variance and the scaled variance, ifthe scaled variance exceeds the statistical variance. Another possible sourceof systematics uncertainty is the fit variant. This component is computed byvarying the fitting conditions on the whole data set. In our study fit variantsinclude the background and signal shape, the bin size of the mass-distributionhistogram and the Monte Carlo generation modeling. More precisely differentdegrees of the polynomial functions are used for the background parametriza-tion and two Gaussian peaks with the same mean but different widths are usedfor the signal, to take into account the different resolution in momentum ofour spectrometer. The fully coherent generation for the decays under analysisis based on the results of the Dalitz plot study presented in this paper (seeparagraph 4.3). To access a possible systematics effect in the branching ratioevaluation coming from our amplitude analysis we vary coefficients and phasesreturned by the Dalitz plot fit within their errors. The branching ratio valuesobtained by these variants are all a priori likely, therefore this uncertaintycan be estimated by the standard deviation of the measurements. To inves-tigate the dependence of the branching ratio on the particular choice of cutswe calculate a cut variant error, analogously to the fit variant, by using thestandard deviation of different branching ratio measurements obtained withseveral sets of cuts; this error is actually overestimated since the statistics ofthe cut samples are different.
For the D+ the dominant systematic effect comes from the cut variant, whilefor the D+
s the main source of uncertainty comes from the split sample compo-nent. Our results are consistent with previous determinations from the E687 [8]and E791 [9] experiments. Our measurements reduce the statistical errors byabout a factor of 2 and 5 for the D+ and D+
s , respectively.
4 Dalitz plot analysis
Events within ±2σ of the mass peak are used to perform the Dalitz plotanalysis for D+ and D+
s → K+π+π−; the D+ and D+s Dalitz plots are shown
in Fig.3 a) and b), respectively.
7

0
0.25
0.5
0.75
1
1.25
1.5
1.75
2
0 0.5 1 1.5 2 2.5 3 3.5
m2 K+ π-(GeV2/c4)
m2 π+
π-(G
eV2 /c
4 )
(a)
0
0.25
0.5
0.75
1
1.25
1.5
1.75
2
2.25
2.5
0 0.5 1 1.5 2 2.5 3 3.5
m2 K+ π-(GeV2/c4)
m2 π+
π-(G
eV2 /c
4 )(b)
Figure 3. a) D+ and b) D+s Dalitz plots in K+π− and π+π− squared mass contri-
butions.
4.1 The decay amplitude
For this analysis we use a formalization of the decay amplitude based onthe simple isobar model, which is viewed as an effective description of themain dynamical features of the decay. More rigorous treatments, such as thatbased on the K-matrix formalism [10], are not viable for this analysis becauseof the limited statistics of the samples, along with the large number of freeparameters necessary to account for the simultaneous presence of both π+π−
and K+π− resonances.
The decay matrix element for the analysis reported here is written as a co-herent sum of amplitudes corresponding to a constant term for the uniformdirect three-body decay and to different resonant channels:
M = a0eiδ0 +
∑
j
aj eiδj B(abc|r) (5)
where a, b and c label the final-state particles. B(abc|r) = B(a, b|r)S(a, c)where B(a, b|r) is the Breit-Wigner function
B(a, b|r) =FDFr
M2r − M2
ab − iΓMr
(6)
and S(a, c) = 1 for a spin-0 resonance, S(a, c) = −2c ·a for a spin-1 resonanceand S(a, c) = 2(|c||a|)2(3 cos2 θ∗ − 1) for a spin-2 state. a and c are the three-
8

momenta of particles a and c measured in the ab rest frame, and cos θ∗ =c · a/|c||a|. The momentum-dependent form factors FD and Fr represent thestrong coupling at each decay vertex. For each resonance of mass Mr and spinj we use a width
Γ = Γr
(p
pr
)2j+1Mr
Mab
F 2r (p)
F 2r (pr)
(7)
where p is the decay three-momentum in the resonance rest frame and thesubscript r denotes the on-shell values. The order of the particle labels is im-portant for defining the phase convention; here the first particle is the opposite-sign one.
For the f0(980) a simple single-channel Breit-Wigner is used. The mass andwidth values of 0.972 ± 0.002 GeV and 0.059 ± 0.004 GeV, respectively, areobtained from a fit to our FOCUS Dalitz plot of the D+
s → π+π−π+ chan-nel, where the f0(980) is the dominant component. Given the questionableassumption of a single channel Breit-Wigner, where a coupled-channel oneshould be more properly used, we have checked that the final results do notchange when a Flatte parametrization [11] is used.
4.2 The likelihood function and fitting procedure
Following our previous analyses [10,12,13] we perform a maximum likelihoodfit to the Dalitz plots to measure the coefficients of the various decay am-plitudes as well as their relative phases. The probability density function iscorrected for geometrical acceptance and reconstruction efficiency. The shapeof the background in the signal region is parametrized through an incoherentsum of a polynomial function plus resonant Breit-Wigner components, whichare used to fit the Dalitz plot of mass sidebands. The number of backgroundevents expected in the signal region is estimated through fits to the K+π+π−
mass spectrum. All background parameters are included as additional fit pa-rameters and tied to the results of the sideband fits through the inclusion inthe likelihood of a χ2 penalty term derived from the covariance matrix of thesideband fit. The D+ and D+
s samples are fitted with likelihood functions Lconsisting of signal and background probability densities. Checks for fittingprocedure are made using Monte Carlo techniques and all biases are found tobe small compared to the statistical errors. The systematic errors on our resultsare evaluated following the strategy already explained for the branching ratiomeasurements, defining a split-sample and a fit-variant component. The as-sumption that the shape of the background in the sideband is a good represen-tation of the background in the signal region potentially constitutes a source
9

of systematic error. We take into account this effect in the fit-variant error,by varying the polynomial function degree and adding/removing the Breit-Wigner terms, which are introduced to take into account any feed-throughfrom resonances in the background, and computing the standard deviation ofthe different results.
In our Dalitz plot analysis we allow for the possibility of contributions fromall known K+π− and π+π− resonances [7] and from a flat non-resonant contri-bution accounting for the direct decay of the D mesons into three-body finalstates. The fit parameters are amplitude coefficients aj and phases δj .
2 Thegeneral procedure, adopted for all the fits reported here, consists of severalsuccessive steps in order to eliminate contributions whose effects on our fit aremarginal. Contributions are removed if their amplitude coefficients, a0 and ai
of Eq. 5 are less than 3 σ significant and the fit confidence level increases dueto the decreased number of degrees of freedom in the fit. The fit confidencelevels (C.L.) are evaluated with a χ2 estimator over a Dalitz plot with bin sizeadaptively chosen to maintain a minimum number of events in each bin. Oncethe minimal set of parameters is determined, addition of each single contribu-tion previously eliminated is reinstated to verify if the C.L. improves; in thiscase the contribution is added in the final set.
4.3 Results
The D+ and D+s Dalitz plots present a different event intensity distribution.
The D+ appears highly structured and dominated by ρ(770) and K∗(892). TheD+
s channel, instead, presents a much more complex structure diffused over allthe phase-space together with ρ(770) and K∗(892), whose main characteristicsare still visible. These general features are confirmed by our fits.
In Table 1, fit fractions, 3 phases and coefficients of the various amplitudesdescribing the D+ → K+π+π− decay are reported. The vector resonancesρ(770) and K∗(892) account for about 90% of the D+ decay fraction. Theirrelative phase difference, almost real, suggests a marginal role for final stateinteractions in this decay. The C.L. of our Dalitz plot fit is 9.2%. The three-lobe helicity structure visible in the D+ Dalitz plot justifies the presence ofthe tensor K∗
2 (1430), at more than three sigma statistical significance, in thefinal set of resonances. The band of events at about (1 GeV/c2)2 in the m2
π+π−
mass combination indicates the presence of the scalar f0(980) in the decay at a
2 Coefficients and phases of the ρ(770), which is a dominant mode in both decays,are fixed to 1 and 0, respectively.3 The quoted fit fractions are defined as the ratio between the intensity for a singleamplitude integrated over the Dalitz plot and that of the total amplitude with allthe modes and interferences present.
10
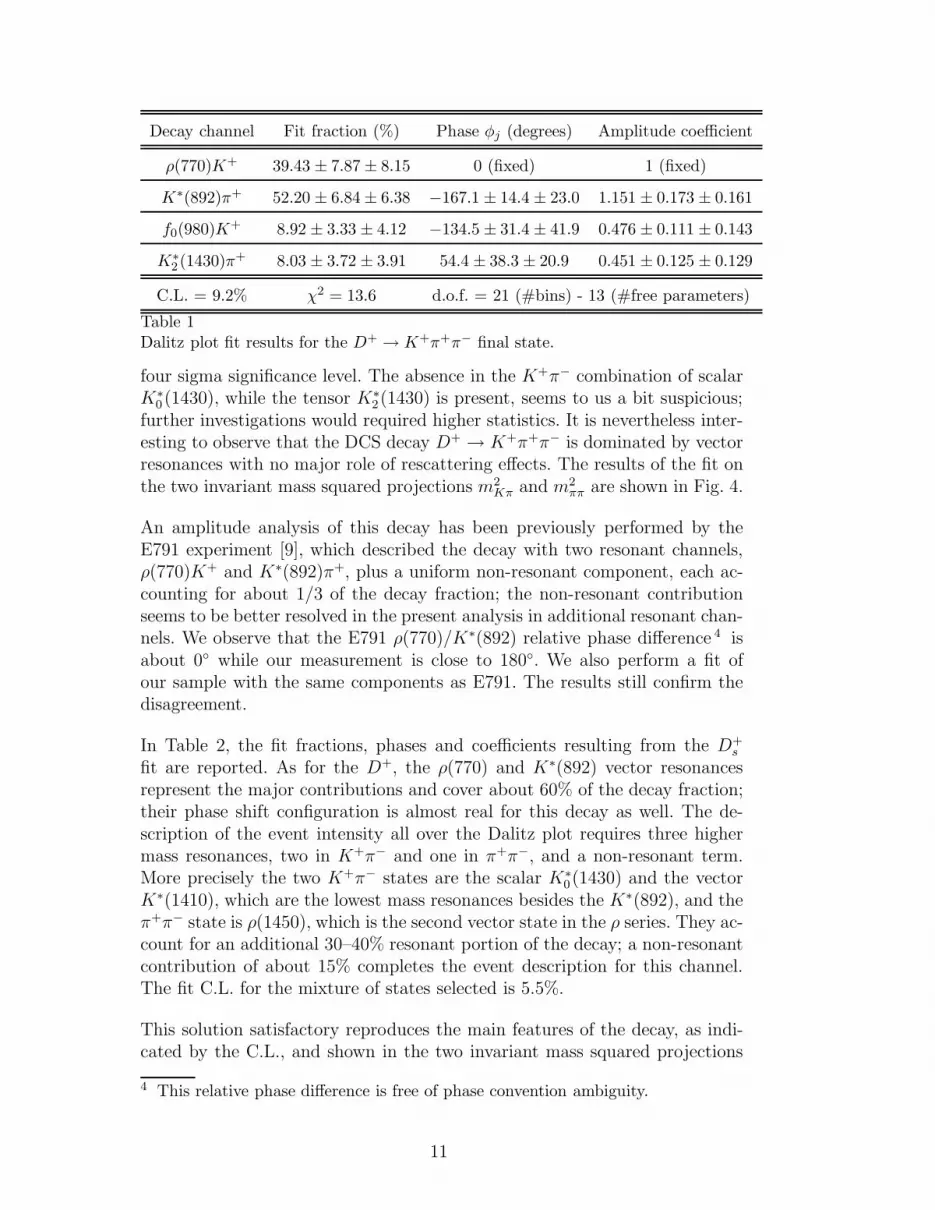
Decay channel Fit fraction (%) Phase φj (degrees) Amplitude coefficient
ρ(770)K+ 39.43 ± 7.87 ± 8.15 0 (fixed) 1 (fixed)
K∗(892)π+ 52.20 ± 6.84 ± 6.38 −167.1 ± 14.4 ± 23.0 1.151 ± 0.173 ± 0.161
f0(980)K+ 8.92 ± 3.33 ± 4.12 −134.5 ± 31.4 ± 41.9 0.476 ± 0.111 ± 0.143
K∗
2 (1430)π+ 8.03 ± 3.72 ± 3.91 54.4 ± 38.3 ± 20.9 0.451 ± 0.125 ± 0.129
C.L. = 9.2% χ2 = 13.6 d.o.f. = 21 (#bins) - 13 (#free parameters)
Table 1Dalitz plot fit results for the D+ → K+π+π− final state.
four sigma significance level. The absence in the K+π− combination of scalarK∗
0 (1430), while the tensor K∗
2(1430) is present, seems to us a bit suspicious;further investigations would required higher statistics. It is nevertheless inter-esting to observe that the DCS decay D+ → K+π+π− is dominated by vectorresonances with no major role of rescattering effects. The results of the fit onthe two invariant mass squared projections m2
Kπ and m2ππ are shown in Fig. 4.
An amplitude analysis of this decay has been previously performed by theE791 experiment [9], which described the decay with two resonant channels,ρ(770)K+ and K∗(892)π+, plus a uniform non-resonant component, each ac-counting for about 1/3 of the decay fraction; the non-resonant contributionseems to be better resolved in the present analysis in additional resonant chan-nels. We observe that the E791 ρ(770)/K∗(892) relative phase difference 4 isabout 0◦ while our measurement is close to 180◦. We also perform a fit ofour sample with the same components as E791. The results still confirm thedisagreement.
In Table 2, the fit fractions, phases and coefficients resulting from the D+s
fit are reported. As for the D+, the ρ(770) and K∗(892) vector resonancesrepresent the major contributions and cover about 60% of the decay fraction;their phase shift configuration is almost real for this decay as well. The de-scription of the event intensity all over the Dalitz plot requires three highermass resonances, two in K+π− and one in π+π−, and a non-resonant term.More precisely the two K+π− states are the scalar K∗
0(1430) and the vectorK∗(1410), which are the lowest mass resonances besides the K∗(892), and theπ+π− state is ρ(1450), which is the second vector state in the ρ series. They ac-count for an additional 30–40% resonant portion of the decay; a non-resonantcontribution of about 15% completes the event description for this channel.The fit C.L. for the mixture of states selected is 5.5%.
This solution satisfactory reproduces the main features of the decay, as indi-cated by the C.L., and shown in the two invariant mass squared projections
4 This relative phase difference is free of phase convention ambiguity.
11

Decay channel Fit fraction (%) Phase φj (degrees) Amplitude coefficient
ρ(770)K+ 38.83 ± 5.31 ± 2.61 0 (fixed) 1 (fixed)
K∗(892)π+ 21.64 ± 3.21 ± 1.14 161.7 ± 8.6 ± 2.2 0.747 ± 0.080 ± 0.031
NR 15.88 ± 4.92 ± 1.53 43.1 ± 10.4 ± 4.4 0.640 ± 0.118 ± 0.026
K∗(1410)π+ 18.82 ± 4.03 ± 1.22 −34.8 ± 12.1 ± 4.3 0.696 ± 0.097 ± 0.025
K∗
0 (1430)π+ 7.65 ± 5.0 ± 1.70 59.3 ± 19.5 ± 13.2 0.444 ± 0.141 ± 0.060
ρ(1450)K+ 10.62 ± 3.51 ± 1.04 −151.7 ± 11.1 ± 4.4 0.523 ± 0.091 ± 0.020
C.L. = 5.5% χ2 = 38.5 d.o.f. = 43 (#bins) - 17 (#free parameters)
Table 2Dalitz plot fit results for the D+
s → K+π+π− final state.
m2 K+ π- mass projection (GeV2 /c4)
0
5
10
15
20
25
30
35
40
0 1 2 3
m2 π+ π- mass projection (GeV2 /c4)
0
5
10
15
20
25
0 0.5 1 1.5 2
Figure 4. The Dalitz plot projections and, superimposed, the fit results for D+. Thebackground shape under the signal is also shown.
m2Kπ and m2
ππ of the Dalitz plot in Fig. 5. However the absence of the f0(980) inthe fit is a bit suspicious; an accumulation of events at (1 GeV/c2)2 π+π− masssquared, to some extent visually recognizable in the Dalitz plot, would indeedsuggest its selection in the resonance final set. On the other hand we knowthat the isobar model is too naive to describe more complex decays dynamics,which intervenes in the presence of the K+π− and π+π− S-waves states. Morerigorous treatments, such as that based on the K-matrix model [10], will benecessary at higher statistics. The results of the fit on the squared invariantmasses m2
Kπ and m2ππ are shown in Fig. 5.
The dominant systematic uncertainties on coefficients and phases for both D+
and D+s decays come from the low/high momentum split and the fit variant
component.
12

m2 K+ π- mass projection (GeV2 /c4)
0
5
10
15
20
25
30
35
40
0 1 2 3
m2 π+ π- mass projection (GeV2 /c4)
0
5
10
15
20
25
30
35
0 0.5 1 1.5 2
Figure 5. The Dalitz plot projections and, superimposed, the fit results for D+s . The
background shape under the signal is also shown.
5 Conclusions
We have presented a study of the doubly and singly Cabibbo suppressed decaysD+ and D+
s → K+π+π−. Our measurements of Γ(D+ → K+π+π−)/Γ(D+ →K−π+π+) = 0.0065 ± 0.0008 ± 0.0004 and Γ(D+
s → K+π+π−)/Γ(D+s →
K+K−π+) = 0.127 ± 0.007 ± 0.014 improve the statistical accuracy by ap-proximately a factor of 2 and 5 with respect to previous determinations. Inparticular the comparison of (1/ tan4 θC) × Γ(D+
DCS)/Γ(D+CF) = 2.60 ± 0.32
with the FOCUS lifetime ratio of τ(D+)/τ(D0) = 2.538 ± 0.023 and themarginal role of FSI inferred by our Dalitz plot analysis of this decay sup-ports the interpretation that destructive interference between spectator am-plitudes with indistinguishable quarks in the CF D+ final state is responsiblefor the lifetime difference between D+ and D0. The FOCUS collaboration hasalready analysed the doubly Cabibbo suppressed decay of the neutral mesonD0 → K+π− [14]; the study of the DCS decay of the charged D+ mesonpresented in this paper, free of any possible uncertainty due to D0D0 mix-ing effects, provides complementary information. The amplitude analysis ofD+ and D+
s → K+π+π− final states have also been performed, providingthe first amplitudes and phases for the D+
s channel. We have discussed themajor achievements and indicated possible improvements for a better decaydynamics interpretation at higher statistics.
We wish to acknowledge the assistance of the staffs of Fermi National Ac-celerator Laboratory, the INFN of Italy, and the physics departments of thecollaborating institutions. This research was supported in part by the US Na-tional Science Fundation, the US Department of Energy, the Italian IstitutoNazionale di Fisica Nucleare and Ministero dell’Istruzione dell’Universita e
13

della Ricerca, the Brazilian Conselho Nacional de Desenvolvimento Cientıficoe Tecnologico, CONACyT-Mexico, the Korean Ministry of Education, and theKorean Science and Engineering Foundation.
References
[1] J. M. Link et al., Phys. Lett. B 537 (2002) 192.
[2] P. L. Frabetti et al. Nucl. Instrum. Meth. A 320 (1992) 519.
[3] J. M. Link et al., Nucl. Instrum. Meth. A 484 (2002) 270.
[4] J. M. Link et al., Phys. Lett. B 485 (2000) 62.
[5] J. M. Link et al., Phys. Lett. B 555 (2003) 167.
[6] J. M. Link et al., Phys. Lett. B 575 (2003) 190.
[7] K. Hagiwara et al. (Particle Data Group), Phys. Rev. D 66 (2002) 010001.
[8] P. L. Frabetti et al., Phys. Lett. B 359 (1995) 403.
[9] E. M. Aitala et al., Phys. Lett. B 404 (1997) 187.
[10] J. M. Link et al., Phys. Lett. B 585 (2004) 200.
[11] S. M. Flatte, Phys. Lett. B 63 (1976) 228.
[12] P. L. Frabetti et al., Phys. Lett. B 407 (1997) 79.
[13] P. L. Frabetti et al., Phys. Lett. B 351 (1995) 591.
[14] J. M. Link et al., Phys. Rev. Lett. 86 (2001) 2955.
14


![Cucurbit[n]urils as a potential fine-tuned instrument for modifying photophysical properties of D-π-A+-π-D "push-pull" chromophores](https://img.pdfslide.net/doc/110x75/6332b4d44e0143040300cb9e/cucurbitnurils-as-a-potential-fine-tuned-instrument-for-modifying-photophysical.jpg)


![Search for b→u transitions in B→[K+π-π0]DK](https://img.pdfslide.net/doc/110x75/631f510d63ac2c35640ac0a5/search-for-bu-transitions-in-bkp-p0dk.jpg)


