Embed Size (px)
Citation preview

Study on internal to surfacefingerprint correlation using opticalcoherence tomography and internalfingerprint extraction
Luke Nicholas DarlowJames Connan

Study on internal to surface fingerprint correlation usingoptical coherence tomography and internal fingerprintextraction
Luke Nicholas Darlowa,b,* and James Connana
aRhodes University, Computer Science Department, Prince Alfred Street, Grahamstown, Eastern Cape 6139, South AfricabModelling and Digital Science, Council for Scientific and Industrial Research, Meiring Naude Road, Pretoria, Gauteng 0184, South Africa
Abstract. Surface fingerprint scanners are limited to a two-dimensional representation of the fingerprinttopography, and thus, are vulnerable to fingerprint damage, distortion, and counterfeiting. Optical coherencetomography (OCT) scanners are able to image (in three dimensions) the internal structure of the fingertipskin. Techniques for obtaining the internal fingerprint fromOCT scans have since been developed. This researchpresents an internal fingerprint extraction algorithm designed to extract high-quality internal fingerprints fromtouchless OCT fingertip scans. Furthermore, it serves as a correlation study between surface and internalfingerprints. Provided the scanned region contains sufficient fingerprint information, correlation to the surfacetopography is shown to be good (74% have true matches). The cross-correlation of internal fingerprints (96%have true matches) is substantial that internal fingerprints can constitute a fingerprint database. The internalfingerprints’ performance was also compared to the performance of cropped surface counterparts, to eliminatebias owing to information level present, showing that the internal fingerprints’ performance is superior 63.6% ofthe time. © 2015 SPIE and IS&T [DOI: 10.1117/1.JEI.24.6.063014]
Keywords: optical coherence tomography; computer vision; clustering; machine learning; image enhancement; fingerprints; internalfingerprint; fingerprint spoofing.
Paper 15590 received Jul. 22, 2015; accepted for publication Nov. 4, 2015; published online Dec. 10, 2015.
1 IntroductionThe authenticity and performance of biometrics such asfingerprints are under constant scrutiny. Matsumoto et al.1
highlighted the lack of fingerprint authenticity detection.Although liveness detection has come a long way,2,3 thereis nevertheless a limit to surface fingerprints.
The inherent limit is that the current surface fingerprintscanning standard provides a two-dimensional (2-D) finger-print representation that accommodates fingerprint spoof-ing,1,4 thus requiring sophisticated methods for authenticitydetection.3 The surface scanners are touch-based, and thus,introduce distortion.5 Surface fingerprint skin is also prone todamage.
Solutions to mitigate surface fingerprint disadvantageshave been developed. Three-dimensional (3-D) surface finger-print imaging with 3-D to 2-D unwrapping,6 fingerprintdistortion removal,5 fingerprint recognition in low-qualityfingerprint images,7 fingerprint enhancement,8 and fingerprintliveness detection3 are all noteworthy contributions to thistask. However, a solution exists that is able to compensatesimultaneously for all the deficiencies of the surface finger-print: the internal fingerprint.
There is a layer of skin, known as the papillary junction,that has the same topography as the surface. Thus, the sur-face and internal fingerprint have the same structure.9 Owingto the relative reflectivity of the papillary junction to theepidermis, the upper edge of the papillary junction containsthe most pertinent internal fingerprint information.
The imaging of subsurface layers of skin is carried outusing a tool known as optical coherence tomography(OCT).10 OCT has become known as a powerful and non-invasive biomedical imaging tool. It is touchless and canimage the papillary junction in high-resolution 3-D. OCTis subject to signal-degrading speckle noise that originatesfrom reflective elements of roughly the same size as the im-aging wavelength.11 An OCT volume consists of a series ofimage slices (known as B-scans) that consist of a series ofone-dimensional (1-D) signals (known as A-lines). A-linesare columns in a B-scan.
Various successful attempts12–16 have made use of OCT toimage the internal fingerprint. However, these works usuallydefine the location of the papillary junction manually.Furthermore, most employed either simple en face slice aver-aging (over a static region) or used a single en face slice forinternal fingerprint extraction. Although the use of a glassslide during the scanning process (as was the case in thework of Bossen et al.12) does stabilize the location of thepapillary junction to a relatively fixed depth, it mitigatesthe touchless capability of OCT. This earlier researchlacked automatic internal fingerprint zone detection andwas technically inefficient regarding internal fingerprintextraction. The result was low-quality internal fingerprints.An improved approach was developed by Khutlang andNelwamondo:17 Novelty detection was used to locate thepapillary junction. Compared to human observers, this tech-nique performed well. However, their method requiredB-scan images to be processed to reduce noise and the data-set for testing was small.
*Address all correspondence to: Luke Nicholas Darlow, E-mail: [email protected] 1017-9909/2015/$25.00 © 2015 SPIE and IS&T
Journal of Electronic Imaging 063014-1 Nov∕Dec 2015 • Vol. 24(6)
Journal of Electronic Imaging 24(6), 063014 (Nov∕Dec 2015)
Darlow et al.18 used heuristic techniques to detect the pap-illary junction upper edge and developed an improved tech-nique for en face slice averaging. Slice averaging consistedof averaging pixels over a fixed region (surrounding thedetected fingerprint zone) in each B-scan. Akhoury andDarlow19 applied an automatic papillary junction detectionapproach and mapped the obtained 3-D papillary junctioncoordinates to a 2-D fingerprint representation. In addition,internal fingerprint zone detection was accomplished byDarlow et al.:20 the approximate location of the papillaryjunction was detected by applying k-means clustering toA-line local maxima; a fine-tuning procedure was appliedto localize the papillary junction upper edge (i.e., the internalfingerprint zone). However, the fingerprints obtained in allcases were not quantitatively tested for correlation withtheir surface counterparts, nor was the dataset large enoughto conclude robustness with regard to internal fingerprintextraction.
The research presented here is an improvement on, andconglomeration of, the above-mentioned works. Internalfingerprint zone detection is an improvement as it usesfuzzy c-means to improve clustering performance, usesbetter cluster result postprocessing, and improves uponthe fine-tuning procedure through the application of Sobeland Feldman21 edge detection. The fingerprint extractionapproach is an improvement on the work by Darlow et al.18
in that it is localized to individual A-lines, instead of beingfixed on a B-scan basis.
No research has been undertaken to show the correlationbetween surface and internal fingerprints in a decisive quan-titative manner. This is necessary to provide evidence that(1) the internal fingerprint is a viable replacement for thesurface fingerprint and (2) the internal fingerprint can beincorporated into legacy fingerprint databases.
To accomplish this, an internal fingerprint extraction algo-rithm is developed in this research, tested, and applied toOCT fingertip scans. The approach is novel and technicallyadvanced in its use of computer vision techniques. Althoughthe origin of this algorithm has its roots in earlier works,the deviations, improvements, and consequent additions aresignificant.
This algorithm uses clustering and image-enhancementprocedures to detect the upper edge of the papillary junctionwith high accuracy. Following this, the papillary junctionundulation zone is described in a local fashion for internalfingerprint extraction.
This paper is structured as follows. The internal finger-print extraction algorithm is presented in Sec. 2. The exper-imental setup is detailed in Sec. 3, and the results obtainedare exhibited in Sec. 4. The conclusions are drawn and futurework is suggested in Sec. 5.
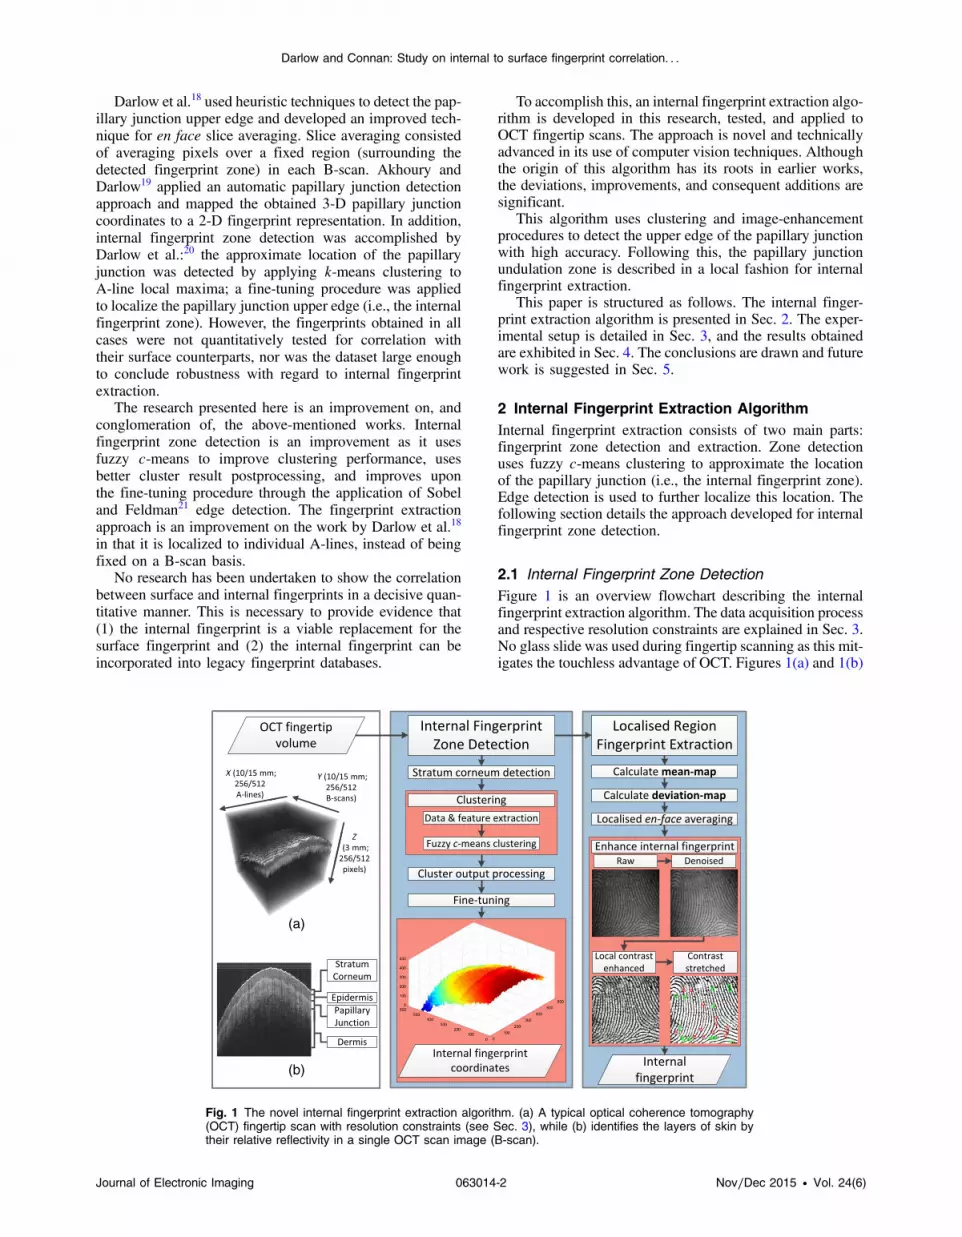
2 Internal Fingerprint Extraction AlgorithmInternal fingerprint extraction consists of two main parts:fingerprint zone detection and extraction. Zone detectionuses fuzzy c-means clustering to approximate the locationof the papillary junction (i.e., the internal fingerprint zone).Edge detection is used to further localize this location. Thefollowing section details the approach developed for internalfingerprint zone detection.
2.1 Internal Fingerprint Zone DetectionFigure 1 is an overview flowchart describing the internalfingerprint extraction algorithm. The data acquisition processand respective resolution constraints are explained in Sec. 3.No glass slide was used during fingertip scanning as this mit-igates the touchless advantage of OCT. Figures 1(a) and 1(b)
(a)
(b)
Fig. 1 The novel internal fingerprint extraction algorithm. (a) A typical optical coherence tomography(OCT) fingertip scan with resolution constraints (see Sec. 3), while (b) identifies the layers of skin bytheir relative reflectivity in a single OCT scan image (B-scan).
Journal of Electronic Imaging 063014-2 Nov∕Dec 2015 • Vol. 24(6)
Darlow and Connan: Study on internal to surface fingerprint correlation. . .

are indicative of the visible curvature of the scannedfingertips.
There is an intensity depth dependency roll-off probleminherent in OCT scans of a curved object. Regionsfurther from the scanner have lower intensity, and the naturalfinger curvature makes internal fingerprint zone detectioncomplex. This research endeavors to detect the internalfingerprint zone in unprocessed, touchless OCT finger-tip scans.
To do so, fuzzy c-means clustering is applied to en face1-D intensity signals (known as A-lines, exemplified inFig. 2) for internal fingerprint zone detection. This informa-tion is used to define en face localized regions for eachA-line over which to average pixel intensities for the 2-Dinternal fingerprint. Following this, the internal fingerprintis enhanced.
Fuzzy c-means22 clustering is applied to internal finger-print zone detection as: it suits the task of papillary junctiondetection, has been implemented and tested in variousscenarios, and is highly robust against outliers. The outlierdetection capacity of fuzzy c-means is used by setting ahigh threshold for cluster membership [Eq. (1)] and dulyaccommodated for by coordinate interpolation.
Clustering requires input data and descriptive features. Anumber (n) of intensity local maxima in each A-line areextracted as data. Examples of this data are the (green)dots in Fig. 2. Refer to this graph for visual descriptors ofthe following features:
1. Relative distance to the stratum corneum: Blackarrows in Fig. 2. The stratum corneum is detectedas detailed in Fig. 3(a). The distances from this esti-mate—the dashed (green) line in Fig. 2—to theextracted data points are normalized on a B-scan basisby estimating the average (median) distance betweenthe two strongest peaks in all A-lines in the respectiveB-scan.
2. Relative intensity: Height of the (green) dots in Fig. 2.The second strongest local maximum usually (but notalways) corresponds with the papillary junction. Themedian (on a B-scan basis) of these maxima is used tonormalize this feature. The median is used as it isrobust regarding outliers.
3. Peak width: Bottom (blue, above peaks) arrows inFig. 2. Calculated as twice the distance from thedata point to the next upper local minimum.
4. Standard deviation: Top (purple, above peaks) arrowsin Fig. 2. Calculated over the region defined by thepeak width.
5. Gradient: Measured atX, half the distance between thedata point and the next upper local minimum.
It is the normalization of the distance and intensity fea-tures that adjusts fingertip curvature and roll-off. Clustermembership is defined by
EQ-TARGET;temp:intralink-;e001;326;653TðcÞ ¼ min
�mc; threshold
�; (1)
where m > 1 is the multiplication factor, c is the number ofclusters, and threshold is the maximum membership valueand is set to 0.9. Threshold exists to ensure at least somemembership in fringe cases (i.e., when m is high and c islow). m was set to 1.6 for this research, although it mustbe noted that this parameter is not sensitive. If a data pointdoes not have a membership of at least T in any of the cclusters, it is an outlier. A large number of outliers mustnot be interpreted as poor performance. Instead, it servesto ensure strong cluster membership. Figure 3(b) is an exam-ple of clustering output.
The cluster best describing the internal fingerprint zone isdetermined by comparing each cluster to the estimate usedfor relative distance normalization. The data contained in thechosen cluster are denoted as C.
Owing to the imposed requirement of strong cluster mem-bership, it is entirely possible that A-lines may contain nodata within C. Interpolating missing data is thus required.
The inpaint_nan23 interpolation algorithm is used to cal-culate missing values in C. A median filter is applied to thecoordinates to reduce anomalies. The resultant coordinatesare denoted as PC. The process followed is exhibited inFig. 4.
PC describes the center of the papillary junction only andis thus inefficient at capturing the internal fingerprint undu-lations. PC is fine-tuned into papillary junction upper-edge coordinates (denoted as P). P describes the internalfingerprint zone entirely. Fine-tuning involves processingsmall image regions. This region is exemplified as the regionbetween the (red and blue) lines in Figs. 3(c) and 3(d).These image regions contain the papillary junction upperedge.
100 150 200 250 300 3500
50
100
150
200
250
Pixel depth
Inte
nsity
A−lineSmoothed A−lineDistance to stratum corneumStratum corneum estimateLocal maximaStandard deviationPeak Width, Gradient measured at
Fig. 2 A region of interest in a single one-dimensional A-line intensity profile. The features extracted forfuzzy c-means clustering are exemplified herein.
Journal of Electronic Imaging 063014-3 Nov∕Dec 2015 • Vol. 24(6)
Darlow and Connan: Study on internal to surface fingerprint correlation. . .

The optimized blockwise nonlocal means (OBNLM)speckle filter was shown by Darlow et al.24 to performwell regarding OCT fingertip scans and is applied in succes-sion to the regions. Local intensity normalization is usedto alleviate the effects of the curvature roll-off problem.The Sobel and Feldman21 operator detects the horizontaledges, and unsharp masking enhances them. The thresholdedresult is processed for edge coordinates and used to adjustPC, yielding P. This process is demonstrated in Fig. 5.PC and P are illustrated as the bottom (cyan) and top(green) lines in Fig. 6(a), respectively.
An earlier work by Darlow et al.20 served as a precursor tothis approach. In that work, k-means clustering was used,and a different set of procedures was used for fine-tuning.The novelty of this work is found in the manner in whichfuzzy c-means is able to identify outliers, the approach tocluster result postprocessing, and the use of Sobel edgedetection for fine-tuning.
Since there should only be a single data point per A-linethat corresponds to the papillary junction, and because fuzzyc-means performs well regarding outlier detection, a ratio ofc∶nwhere c > n is hypothesized to yield satisfactory results.
Fig. 3 Clustering process. (a) Exemplifies stratum corneum detection: the thin (yellow) line indicates thelocal maxima estimates closest to the previous B-scan’s stratum corneum and a polynomial fitted tostrong data points [i.e., the thick (cyan) line]; the (green) crosses are outliers; and the (red) dots arecorrected outliers. (b) An example of output clusters: different color/marker combinations are differentclusters; large (green) circles encircle the outliers; and the bottom (red) and top (green) lines showthe region extracted for fine-tuning (Fig. 5).
Fig. 4 Cluster result processing. (a) A region of interest in a B-scan: the (red) crosses are cluster results,(b) the (blue) dots are interpolated values; (c) the deviating (green) line is prior to median smoothing; and(d) the smooth (blue) line is after smoothing. (b), (c), and (d) are en face perspectives of the papillaryjunction center coordinates before interpolation, after interpolation, and after smoothing, respectively.
Fig. 5 Fine-tuning process. (a) An example of the small image regions processed for fine-tuning,extracted from between the lines in Fig. 3(b). (b) After the successive application of optimized blockwisenonlocal means (OBNLM) (in three stages) and local normalization. (c) The application of the Sobeloperator yields. The edge detected is shown in (d).
Journal of Electronic Imaging 063014-4 Nov∕Dec 2015 • Vol. 24(6)
Darlow and Connan: Study on internal to surface fingerprint correlation. . .

This is shown in Sec. 4. Fingerprint extraction using P isdiscussed in the following section.
2.2 Localized Internal Fingerprint ExtractionA 2-D en face coordinate mean-map and standard deviation-map is calculated from P. These are P convolved with aver-aging and standard deviation filters, respectively. They arelocalized to an individual XY pixel and are used to providestatistical evaluations of the papillary junction undulations.The region describing the internal fingerprint starts at themean-map adjusted by some offset (meano), and ends atthe deviation-map multiplied by a constant (devm) andadjusted by some offset (devo). This region is demonstratedin Fig. 6(b) as the region between the middle (green) and top(blue and white) lines.
The statistical evaluation of the fingerprint zone results inresistance toward deviation in the detected zone. Thus, thismanner of fingerprint extraction is insensitive to incon-sistencies in detection, whether from poor algorithmic per-formance or deviations introduced owing to coordinateinterpolation.
The internal fingerprint is extracted by averaging the pix-els in the above-mentioned region. It is enhanced followingthe procedure outlined in Fig. 7: speckle noise is reducedusing OBNLM, contrast is normalized on a local basis, andthe intensity values are saturated. The experimental setup,designed to test the correlation between internal and surfacefingerprints, and the extraction algorithm are detailed in thefollowing section.
3 Experimental SetupFingertips were scanned using a swept-source OCT system(OCS1300SS, Thorlabs). It has a central wavelength of1325 nm, a spectral bandwidth of 100 nm, an axial scanrate of 16 kHz, and a coherence length of 6 mm. Noglass slide was used for stabilization. The depth and resolu-tion of A-lines obtained were set at 3 mm and 512 pixels,respectively. En face areas of 10 mm × 10 mm and 15 mm ×15 mm were combined with resolutions of 512 × 512 pixelsand 256 × 256 pixels. Multiple instances of 10 fingers werescanned, totaling 55 OCT volumes.
P was tested against a ground-truth estimation (G) thatwas manually performed on a single OCT volume. The pap-illary junction upper edge (i.e., fingerprint zone) was man-ually detected. The mean squared error (MSE) and theHausdorff25 distance metric (H) were used to assess the per-formance of the proposed algorithm. The tested range forboth n and c is 2∶23. This limit was imposed by the lengthytime taken to process when c and n are high.
The G’MIC26 image computing library was used for localnormalization. All other image-enhancement procedureswere carried out in MATLAB.
The volumes obtained were within three subjectivelydefined categories: (1) small region and bad area (i.e., farfrom the fingerprint core); (2) small region and good area(i.e., at or near the fingerprint core); and (3) large regionand good area. The area- and resolution-based categorizationwere used to emphasize internal fingerprint performancedependency on the imaged region (i.e., available minutiae).
The Integrated Biometrics Watson Mini (and theIBScanUltimate 1.6.10 software) and the SecuGen Hamster
Fig. 6 Adjustments owing to fine-tuning and the localized region for extraction. (a) A region of interest in aB-scan: PC and P are the bottom (cyan) and top (green) lines, respectively. (b) The localized regioncapturing the internal fingerprint: A-lines are averaged between the top (blue and white) and middle(green) lines, while the bottom (red and white) line is the mean-map used to describe this region.Meano ¼ 2, devo ¼ 3, and devm ¼ 5.
Fig. 7 Internal fingerprint enhancement: (a) an internal fingerprint extracted from the OCT volume usingP and the technique shown in Fig. 6; (b) after OBNLM speckle noise reduction; (c) after local contrastnormalization; and (d) after global intensity saturation.
Journal of Electronic Imaging 063014-5 Nov∕Dec 2015 • Vol. 24(6)
Darlow and Connan: Study on internal to surface fingerprint correlation. . .

Plus (and the device software) were used to capture surfacefingerprints. Eight surface fingerprints were provided byeach of these scanners, resulting in 16 full-sized correspond-ing surface scans for each finger.
The NIST27 fingerprint minutiae extractor (mindtct) andmatching algorithm (bozarth3) were used to evaluate internalto surface fingerprint correlation and internal fingerprintcross-correlation. Since high-surface fingerprint quality is500 ppi, the internal fingerprints were scaled to correspondto this. Regarding fingerprint quality evaluation, the NISTfingerprint score (NFIQ) and the orientation certaintylevel (OCL)28 were calculated for all fingerprints. NFIQ isa category-based score that ranges from 1 (best) to 5(worst) and is dependent on information level (i.e., numberand quality of minutiae points), while lower OCL scoresindicate better energy concentration along the dominantridge-valley orientation.
In order to provide a thorough qualitative assessment ofthe performance of the internal fingerprint, some referencepoint must be given. To provide such a reference point,three conventional surface fingerprints were obtained (usingthe Integrated Biometrics Watson Mini) and cropped to cor-respond each internal fingerprint. This process mitigated thepotential for bias based on fingerprint region size (and, thus,number of minutiae present for matching) and locality (i.e.,orientation about the center of the fingerprint). Where nec-essary, comparisons were made between the internal and thesurface-region-of-interest-fingerprints (SROI-fingerprints).
The capture and subjective division of OCT fingertipscans into three categories are advantageous in the compari-son between internal fingerprints and SROI-fingerprints.Testing different fingerprint area sizes and localities provideda means of assessment dependent upon a similar level ofaccessible information (i.e., available minutiae points). Thiswas paramount in comparatively understanding the internalfingerprint in the context of current surface fingerprintingtechnology.
The following section exhibits the results obtained andprovides a discussion thereof.
4 ResultsOn average, 45.4� 9.6% of C was interpolated to yield PC;this is due to the strong cluster membership requirement.Figure 8 conveys the performance analysis of the internalfingerprint extraction algorithm. Although the error metricsmeasured were never zero—on account of human error inG—there is a clearly evident region of stable high perfor-mance. The lowest MSE and H values are 21.65 and147.78, respectively. In contrast, the work presented inRef. 20 yielded a minimum MSE of 23.6 and similar H val-ues. Furthermore, the region of stable performance evident inboth Figs. 8(a) and 8(b) is more significant than the regionobserved in the earlier work.20 These results are evidence ofthe robustness of the algorithm in detecting the internalfingerprint zone.
The internal and surface fingerprints’ OCL scores areshown in Table 1, and the NFIQ scores are given inFig. 9. Although the category 1 internal fingerprints had,on average, higher OCL scores than the surface fingerprints,both the category 2 and 3 internal fingerprints outperformedthe surface fingerprints. The NFIQ pie charts demonstratethat the subjective division of internal fingerprints into
three categories is dependent upon minutiae present (sincethe NFIQ score itself is dependent on this): 36.8% of the cat-egory 3 internal fingerprints had an NFIQ score of 1, com-pared to 22.2% and 5.6% for category 2 and 3 internalfingerprints, respectively. Furthermore, category 3 internalfingerprints outperformed the surface fingerprints in thisregard, indicating superiority regarding minutiae availableand the quality thereof.
Table 1 also presents the quantitative results of internalfingerprint to surface fingerprint and cross-correlation. Thematch scores were calculated as the mean (i.e., averagematch score when comparing an internal fingerprint to 16surface counterparts) and maximum (i.e., the maximumscore obtained considering all comparisons) scores. Bothmean and maximum match scores were given as each is use-ful to fingerprint verification and identification processes.Figure 10 accompanies this, providing (a) the internal to sur-face correlation scores and (b) the internal cross-correlationscores, arranged in ascending order (denoted as the internalfingerprint index) by fingerprint category, NFIQ, and OCL.NIST states that a “true match” must have a score greaterthan 40; the dashed horizontal lines indicate this.
None of the category 1 fingerprints and only one of thecategory 2 fingerprints met the true match criteria, whencompared to their surface counterparts. However, 74% ofthe category 3 fingerprints met this criterion. Thus, providedthe OCT fingertip scan covers a sufficiently large area(15 mm × 15 mm, in this research) and the internal
Fig. 8 Quantitative results comparing G and P over a range ofn ¼ c ¼ 2∶23. (a) The mean squared error results and (b) the Hresults.
Journal of Electronic Imaging 063014-6 Nov∕Dec 2015 • Vol. 24(6)
Darlow and Connan: Study on internal to surface fingerprint correlation. . .

fingerprint is extracted using the algorithm presented here,the internal fingerprint can be integrated with current surfacefingerprints. The top-right block of Fig. 10(a) is evidence ofthis. The dependence of the match score on the fingerprintquality (NFIQ) is evident in the upward trend exhibited inFig. 10(a).
Ninety-six percentage of the internal fingerprints had acorresponding true match with another internal fingerprint.Therefore, a fingerprint database consisting only of internalfingerprints may perform well.
Figure 10(b) serves to exhibit internal fingerprint to sur-face and cross correspondence. Each conventional surfacescan was compared to all others, of the same finger, in
order to assess the relative performance of internal finger-prints. The surface fingerprints yielded an average matchscore of 97� 76. Although the average surface-to-surfacematch score is well above the “true match” threshold, thehigh standard deviation present is evidence of inconsistency.These scores are comparable to the internal-to-internal matchscores, but may seem to indicate that internal fingerprints donot perform sufficiently when a comparison is made betweeninternal and surface fingerprints. However, the followingfactors must be taken into account:
1. A combination of the distortion induced by 3-D to 2-Dplanar extraction, “jitter” from the touchless OCT
Table 1 Average fingerprint match results for each internal fingerprint category.
Fingerprint type OCL Surface score (mean; max) Cross score (mean; max)
Category 1 0.234� 0.074 11.0� 3.3; 18.0� 6.1 59.3� 35.3; 112.3� 62.3
Category 2 0.168� 0.028 15.4� 4.9; 24.9� 9.3 65.8� 34.8; 128.6� 56.9
Category 3 0.133� 0.056 37.4� 11.5; 61.6� 32.1 57.9� 48.8; 152.0� 77.4
Surface 0.182� 0.056 — —
Fig 9 NFIQ scores. (a), (b), and (c) The NFIQ scores for category 1, 2, and 3 internal fingerprints, respec-tively. (d) The NFIQ scores for the full-sized corresponding surface fingerprints. The numbers insidethe pie charts denote the NFIQ scores.
Journal of Electronic Imaging 063014-7 Nov∕Dec 2015 • Vol. 24(6)
Darlow and Connan: Study on internal to surface fingerprint correlation. . .

imaging, and surface fingerprint distortion have aneffect on the surface to internal correlation. Thisneeds to be addressed in future research. The category3 internal fingerprint given in Fig. 11 shows signifi-cant jitter. The touchless OCT scans take approxi-mately 20 s to complete and it is difficult for anindividual to keep still for this period. Although itis difficult to attribute precise performance degrada-tion owing to jitter, this must be dealt with in hardwaredesign as a future task, but it is outside the scope ofthis research. Furthermore, future research will entailassessing various fingerprint matching algorithmswith regard to invariance toward jitter.
2. The scan area size and localization are inconsistentbetween conventional surface and extracted internalfingerprints but consistent across all the surfacescans. This is mainly owing to the difference in
acquisition procedure—a hardware constraint to beimposed in future research.
3. The characteristics of the surface scans are similarbecause they have the same or similar origins: the sur-face scanners. The OCT scan results in qualitativelydifferent scans. This effect is difficult to quantify,but Fig. 11 shows examples of the three internalfingerprint categories with corresponding surfacecounterparts.
Figure 11 also shows that surface anomalies, such aswrinkles, are seen on the surface fingerprints, but not onthe corresponding internal fingerprints; the internal finger-print is resistant to damage due to everyday wear andtear.
It should be noted that the viability of this methodfor extracting internal fingerprints is independent of the
Fig. 10 Fingerprint match score results. (a and b) Encapsulate the NIST match scores for internal tosurface and internal cross-correlation, respectively. The vertical divisions denote the three internal finger-print categories. The vertical light to dark colors are the NFIQ scores. Within each vertical color bar, thefingerprints are ordered according to their orientation certainty level scores. The dashed horizontal linedenotes a true match.
Journal of Electronic Imaging 063014-8 Nov∕Dec 2015 • Vol. 24(6)
Darlow and Connan: Study on internal to surface fingerprint correlation. . .

performance of the fingerprint itself (i.e., whether the imagedarea is sufficient or not). The subjective classification ofinternal fingerprint categories used throughout this researchexhibits the dependence of fingerprint performance on thescanned area itself. Therefore, for the internal fingerprint
to be considered a viable replacement for current surfacefingerprints, the scanned area must be sufficient.
To test this hypothesis, three surface fingerprints wereobtained and cropped (denoted as SROI-fingerprints) foreach internal fingerprint. Figure 12 exhibits the results
Fig. 11 Fingerprint category examples. C is indicative of fingerprint category. The category 1 internalfingerprint shown here encompasses a region overlapping with the joint/fold of the finger, thus it exhibitssignificant artifacts.
Fig. 12 Match performance results when compared to corresponding surface region. The (blue) dotsshow the score of the internal fingerprints. The (brown) dots and error boxes show the average corre-sponding surface-region-of-interest-fingerprints’ scores and the standard deviation thereof, respectively.
Journal of Electronic Imaging 063014-9 Nov∕Dec 2015 • Vol. 24(6)
Darlow and Connan: Study on internal to surface fingerprint correlation. . .

obtained when comparing the internal fingerprints’ perfor-mance to that of the SROI-fingerprints’ performance. Themajority of internal fingerprints performed either as well(within the measured error) or better than their correspondingSROI-fingerprints. Furthermore, the internal fingerprints hadhigher average match scores than their SROI-fingerprintcounterparts’ 63.6% of the time. Notwithstanding other fac-tors biasing these results toward the SROI-fingerprints (suchas different fingerprint distortion sources from internal andsurface fingerprints), the internal fingerprints perform at alevel comparable to the SROI-fingerprints.
The internal fingerprint could serve as a replacement forthe surface fingerprint. However, the assessments providedin this section are not consistent with a traditional perfor-mance evaluation of a biometric system. Instead, they areto serve as an initial assessment of the internal fingerprint inthe context of the performance of identical fingerprintsextracted using traditional means (i.e., the surface scanner).In addition, this research endeavors to provide an advancedtechnique for fingerprint extraction from OCT fingertipscans. That said, the results shown in Fig. 12 give themost useful internal fingerprint performance indication.Future research will certainly entail error rate assessmentsusing a large database of OCT scans and will provide a tradi-tional biometric system evaluation.
Although not provided in this assessment, it would beuseful to compare the internal fingerprint to a conventionalsurface fingerprint taken from an individual that has verypoor fingerprints, very dry skin, or a skin disease (such aseczema). This will be carried out as future research.
The following section serves to draw conclusions regard-ing these results.
5 ConclusionsThe internal fingerprint extraction algorithm proposed in thisresearch has been shown to perform well regarding errorminimization against a manually estimated internal finger-print zone. The critical component of the algorithm is fuzzyc-means clustering. Since interpolation and image-enhance-ment-based fine-tuning procedures were employed, the sta-ble region (regarding the number of data points and numberof clusters) of high performance was large. The internalfingerprint zone was detected accurately.
Internal fingerprints were successfully extracted from 55OCT fingertip volumes of varying spatial area and resolu-tion. The OCL of the internal fingerprints was high whencompared to their surface counterparts. When the capturedinternal fingerprints contain sufficient fingerprint details,they correlate well with their surface counterparts. Seventy-four percent of category 3 internal fingerprints had a truematch with a surface counterpart. Furthermore, the cross-cor-relation of internal fingerprints was high, with 96% having acorresponding true match. Internal fingerprint cross-correla-tion was shown to be comparable to conventional surfacefingerprint cross-correlation.
Three corresponding surface counterparts were obtainedand cropped to provide a reference comparison. This wasdone to alleviate bias present due to the limitation of theOCT scanner in providing sufficient fingerprint area andlocality. That is, the cropped surface counterparts containeda similar set of minutiae points to those contained in theinternal fingerprints. This was necessary to quantitatively
assess the performance of the internal fingerprint itself,rather than the area it constituted. The results of this testingshowed that the internal fingerprint performed as well orbetter than cropped surface counterparts.
Procedural qualitative explanations of the algorithm weregiven throughout this work, and example internal finger-prints (with corresponding surface counterparts) were alsogiven.
This work served to show quantitatively the internal tosurface fingerprint correlation. Future work will be under-taken to show the performance of internal fingerprintsthrough identification against existing fingerprint databases.
The work presented here detailed and tested an advancedtechnique for internal fingerprint extraction from touchlessOCT fingertip scans. A 3-D to 2-D unwrapping6 procedureis needed to reduce distortion and will be investigated infuture work. Hardware constraints will be developed andemployed, in a future work, to ensure the scanned area isconsistently large and central enough to maximize finger-print performance. In addition, error rate assessments willbe carried out using a large dataset in order to complywith traditional biometric systems assessment.
AcknowledgmentsThe authors would like to thank the CSIR National LaserCenter for providing the OCT scans used in this research,and the Information Security team at Modelling and DigitalScience for their assistance in obtaining surface scans.
References
1. T. Matsumoto et al., “Impact of artificial gummy fingers on fingerprintsystems,” Proc. SPIE 4677, 275–289 (2002).
2. Y. S. Moon et al., “Wavelet based fingerprint liveness detection,”Electron. Lett. 41(20), 1112–1113 (2005).
3. C. Gottschlich et al., “Fingerprint liveness detection based on histo-grams of invariant gradients,” in 2014 IEEE Int. Joint Conf. onBiometrics (IJCB), pp. 1–7, IEEE (2014).
4. S. Prabhakar, S. Pankanti, and A. K. Jain, “Biometric recognition: secu-rity and privacy concerns,” IEEE Secur. Privacy 1(2), 33–42 (2003).
5. A. W. Senior and R. M. Bolle, “Improved fingerprint matching by dis-tortion removal,” IEICE Trans. Inf. Syst. 84(7), 825–832 (2001).
6. Y. Wang, D. L. Lau, and L. G. Hassebrook, “Fit-sphere unwrapping andperformance analysis of 3D fingerprints,” Appl. Opt. 49(4), 592–600(2010).
7. L. Coetzee and E. C. Botha, “Fingerprint recognition in low qualityimages,” Pattern Recognit. 26(10), 1441–1460 (1993).
8. S. Chikkerur, A. N. Cartwright, and V. Govindaraju, “Fingerprintenhancement using STFT analysis,” Pattern Recognit. 40(1), 198–211(2007).
9. C. Champod et al., Fingerprints and Other Ridge Skin Impressions, CRCPress, Boca Raton, Florida (2004).
10. A. Fercher et al., Optical Coherence Tomography, John Wiley & Sons,Ltd., Hoboken, New Jersey (2006).
11. J. M. Schmitt, S. H. Xiang, and K. M. Yung, “Speckle in optical coher-ence tomography,” J. Biomed. Opt. 4(1), 95–105 (1999).
12. A. Bossen, R. Lehmann, and C. Meier, “Internal fingerprint identifica-tion with optical coherence tomography,” Photonic Technol. Lett. 22(7),507–509 (2010).
13. M.-R. Nasiri-Avanaki et al., “Anti-spoof reliable biometry of finger-prints using en-face optical coherence tomography,” Opt. PhotonicsJ. 1, 91 (2011).
14. F. Harms, E. Dalimier, and A. C. Boccara, “En-face full-field opticalcoherence tomography for fast and efficient fingerprints acquisition,”Proc. SPIE 9075, 90750E (2014).
15. G. Liu and Z. Chen, “Capturing the vital vascular fingerprint withoptical coherence tomography,” Appl. Opt. 52(22), 5473–5477 (2013).
16. A. Zam et al., “Feasibility of correlation mapping optical coherencetomography (CMOCT) for anti-spoof sub-surface fingerprinting,”J. Biophotonics 6(9), 663–667 (2013).
17. R. Khutlang and F. V. Nelwamondo, “Novelty detection-based internalfingerprint segmentation in optical coherence tomography images,” in2014 Second Int. Symp. on Computing and Networking (CANDAR),pp. 556–559, IEEE (2014).
Journal of Electronic Imaging 063014-10 Nov∕Dec 2015 • Vol. 24(6)
Darlow and Connan: Study on internal to surface fingerprint correlation. . .

18. L. N. Darlow, S. S. Akhoury, and J. Connan, “Internal fingerprintacquisition from optical coherence tomography fingertip scans,” in2015 Third Int. Conf. on Digital Information, Networking, andWireless Communications (DINWC), pp. 188–191, IEEE (2015).
19. S. S. Akhoury and L. N. Darlow, “Extracting subsurface fingerprintsusing optical coherence tomography,” in The Third Int. Conf. onDigital Information, Networking, and Wireless Communications, IEEE(2015).
20. L. N. Darlow, J. Connan, and S. S. Akhoury, “Internal fingerprint zonedetection in optical coherence tomography fingertip scans,” J. Electron.Imaging 24(2), 023027 (2015).
21. I. Sobel and G. Feldman, “A 3 × 3 isotropic gradient operator for imageprocessing,” in Stanford Artificial Intelligence Project (1968).
22. J. C. Bezdek, R. Ehrlich, and W. Full, “FCM: the fuzzy c-meansclustering algorithm,” Comput. Geosci. 10(2), 191–203 (1984).
23. D. Garcia, “Robust smoothing of gridded data in one and higher dimen-sions with missing values,” Comput. Stat. Data Anal. 54(4), 1167–1178(2010).
24. L. N. Darlow, S. S. Akhoury, and J. Connan, “A review of state-of-the-art speckle reduction techniques for optical coherence tomographyfingertip scans,” Proc. SPIE 9445, 944523 (2015).
25. D. P. Huttenlocher, G. A. Klanderman, and W. J. Rucklidge,“Comparing images using the Hausdorff distance,” IEEE Trans.Pattern Anal. Mach. Intell. 15(9), 850–863 (1993).
26. David Tschumperlé, “GREYC'S magic for image computing,” http://gmic.eu/ (November 2015).
27. U.S Department of Commerce, “National Institute of Standards andTechnology,” http://www.nist.gov/ (November 2015).
28. E. Lim, X. Jiang, and W. Yau, “Fingerprint quality and validity analy-sis,” in Proc. of Int. Conf. on Image Processing, Vol. 1, pp. I–469, IEEE(2002).
Luke Nicholas Darlow is a researcher at Modelling and DigitalScience, Council for Scientific and Industrial Research, SouthAfrica. He obtained his BSc degree in computer science fromRhodes University and is passionate about pursuing avenues asso-ciated with fingerprint extraction from OCT fingertip scans.
James Connan is a senior lecturer at Rhodes University inGrahamstown, South Africa. He received his MSc degree in computerscience from the University of Stellenbosch in 2004. His researchinterests include computer vision and image processing.
Journal of Electronic Imaging 063014-11 Nov∕Dec 2015 • Vol. 24(6)
Darlow and Connan: Study on internal to surface fingerprint correlation. . .


