Embed Size (px)
Citation preview

Fuel 90 (2011) 3390–3397
Contents lists available at ScienceDirect
Fuel
journal homepage: www.elsevier .com/locate / fuel
Sub- and super-critical carbon dioxide flow behavior in naturally fracturedblack coal: An experimental study
M.S.A. Perera a, P.G. Ranjith a,⇑, D.W. Airey b, S.K. Choi c
a Department of Civil Engineering, Building 60, Monash University, Clayton VIC 3800, Australiab School of Civil Engineering, University of Sydney, Sydney NSW 2006, Australiac Australian Commonwealth Scientific and Industrial Research Organization (CSIRO), Locked Bag 10, Clayton South VIC 3169, Australia
a r t i c l e i n f o
Article history:Received 15 March 2011Received in revised form 13 May 2011Accepted 17 May 2011Available online 31 May 2011
Keywords:Naturally fractured coalSuper critical carbon dioxidePermeability
0016-2361/$ - see front matter � 2011 Elsevier Ltd. Adoi:10.1016/j.fuel.2011.05.016
⇑ Corresponding author. Tel.: +61 3 9905 4982; faxE-mail address: [email protected] (P.G. Ranj
a b s t r a c t
A proper understanding of super-critical carbon dioxide (CO2) flow behavior in coal is essential, as CO2
normally exists in its super-critical state in deep coal seams and studies are lacking. The main objectiveof this study is to distinguish the permeability behavior of coal for sub-critical and super-critical CO2
flows. Therefore, a series of triaxial experiments was conducted on naturally fractured black coal speci-mens. Permeability tests were carried out for 15, 20 and 25 MPa confinements at 33.5 �C temperature.Three test scenarios were conducted to investigate, (1) variation of the permeability behavior of coal withCO2 phase condition, (2) the swelling effect on sub- and super-critical CO2 permeability patterns, and (3)the potential of nitrogen (N2) to reverse CO2-induced swelling. According to the test results, the perme-ability of super-critical CO2 is significantly lower than sub-critical CO2 due to the higher viscosity andswelling associated with super-critical CO2. Moreover, at super-critical state there is a higher declineof CO2 permeability with increasing injecting pressure due to the higher increments in the associated vis-cosity and swelling. Although CO2 adsorption-induced swelling causes permeability of both CO2 and N2 tobe reduced at low injection pressures the poro-elastic effect becomes more dominant and may cause CO2
permeability to increase for higher injecting pressures, because CO2 flow behavior may transfer fromsuper-critical to sub-critical after the swelling due to the decline of downstream pressure development.Moreover, N2 has the potential to reverse some swelling effects due to CO2 adsorption, and this recoveryrate is higher at lower injecting pressures and higher confining pressures.
� 2011 Elsevier Ltd. All rights reserved.
1. Introduction
During the last century, the average world temperature rose byaround 1 �C, as a result of warming of the Earth’s lower atmosphereand surface by anthropogenic addition of greenhouse gases to theatmosphere (from agricultural practices, deforestation, and burn-ing of fossil fuels) and the associated greenhouse effect [1]. Withrapid industrial development and massive population growth fore-casted for the developing countries, significant increases in theconcentration of greenhouse gases in the lower atmosphere andaugmented rates of global warming are predicted [1]. In Australia,approximately 50% of greenhouse gas emissions are from energyindustries (particularly coal-fired electricity generation), whiletransport accounts for 15% [2]. Since CO2 is one of the leadinggreenhouse gases (it makes a 26% contribution to the greenhouseeffect), a great deal of research has been initiated to discoverappropriate methods to capture and store anthropogenic CO2
emissions [3]. Among the various CO2 sequestration methods,
ll rights reserved.
: +61 3 9905 1483.ith).
CO2 storage in deep unmineable coal seams has been recognizedas attractive, due to the large-scale capacity of such reservoirsand the fact that CO2 injection into coal seams can be used to en-hance production of methane (CH4), a valuable, low-greenhouse-emission energy source, from the coal seam [4,5]. White et al. [4]estimated that major coal basins in the USA contain about 400–700 Tcf of CH4 that can be harnessed for cleaner energy production.Therefore, enhanced production of CH4 from coal seams during CO2
sequestration represents a potential economic advantage that mayhelp offset the costs of CO2 capture and storage [6].
To date, several CO2 sequestration projects are in progressworldwide, including the San Juan basin in the USA [7], the Ishikaribasin in Japan [8] and the Williston basin in the USA [9]. However,none of these CO2 sequestration projects have succeeded to date inachieving significant CO2 injection capacity due to drastic reduc-tions in coal-seam permeability (and CO2 injectibility) with time[7–9]. For instance, in the case of the Ishikari basin in Japan, duringthe first year of injection, a 70% reduction in injection capacity wasobserved [8]. Adsorption of CO2 on to the coal matrix significantlychanges its chemical and physical properties. CO2 is a reactive or-ganic solvent and its reaction with the coal mass is therefore highly
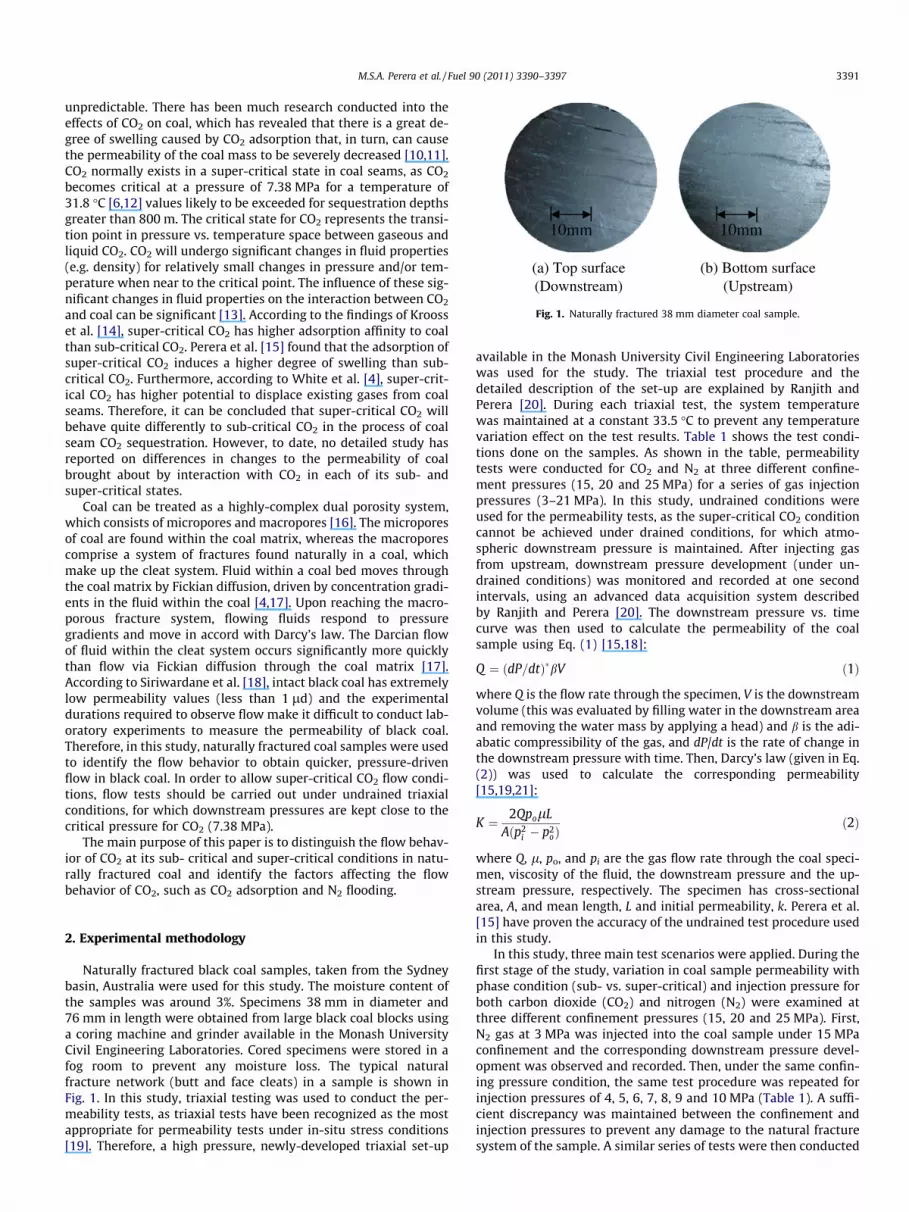
(a) Top surface (Downstream)
(b) Bottom surface (Upstream)
Fig. 1. Naturally fractured 38 mm diameter coal sample.
M.S.A. Perera et al. / Fuel 90 (2011) 3390–3397 3391
unpredictable. There has been much research conducted into theeffects of CO2 on coal, which has revealed that there is a great de-gree of swelling caused by CO2 adsorption that, in turn, can causethe permeability of the coal mass to be severely decreased [10,11].CO2 normally exists in a super-critical state in coal seams, as CO2
becomes critical at a pressure of 7.38 MPa for a temperature of31.8 �C [6,12] values likely to be exceeded for sequestration depthsgreater than 800 m. The critical state for CO2 represents the transi-tion point in pressure vs. temperature space between gaseous andliquid CO2. CO2 will undergo significant changes in fluid properties(e.g. density) for relatively small changes in pressure and/or tem-perature when near to the critical point. The influence of these sig-nificant changes in fluid properties on the interaction between CO2
and coal can be significant [13]. According to the findings of Kroosset al. [14], super-critical CO2 has higher adsorption affinity to coalthan sub-critical CO2. Perera et al. [15] found that the adsorption ofsuper-critical CO2 induces a higher degree of swelling than sub-critical CO2. Furthermore, according to White et al. [4], super-crit-ical CO2 has higher potential to displace existing gases from coalseams. Therefore, it can be concluded that super-critical CO2 willbehave quite differently to sub-critical CO2 in the process of coalseam CO2 sequestration. However, to date, no detailed study hasreported on differences in changes to the permeability of coalbrought about by interaction with CO2 in each of its sub- andsuper-critical states.
Coal can be treated as a highly-complex dual porosity system,which consists of micropores and macropores [16]. The microporesof coal are found within the coal matrix, whereas the macroporescomprise a system of fractures found naturally in a coal, whichmake up the cleat system. Fluid within a coal bed moves throughthe coal matrix by Fickian diffusion, driven by concentration gradi-ents in the fluid within the coal [4,17]. Upon reaching the macro-porous fracture system, flowing fluids respond to pressuregradients and move in accord with Darcy’s law. The Darcian flowof fluid within the cleat system occurs significantly more quicklythan flow via Fickian diffusion through the coal matrix [17].According to Siriwardane et al. [18], intact black coal has extremelylow permeability values (less than 1 ld) and the experimentaldurations required to observe flow make it difficult to conduct lab-oratory experiments to measure the permeability of black coal.Therefore, in this study, naturally fractured coal samples were usedto identify the flow behavior to obtain quicker, pressure-drivenflow in black coal. In order to allow super-critical CO2 flow condi-tions, flow tests should be carried out under undrained triaxialconditions, for which downstream pressures are kept close to thecritical pressure for CO2 (7.38 MPa).
The main purpose of this paper is to distinguish the flow behav-ior of CO2 at its sub- critical and super-critical conditions in natu-rally fractured coal and identify the factors affecting the flowbehavior of CO2, such as CO2 adsorption and N2 flooding.
2. Experimental methodology
Naturally fractured black coal samples, taken from the Sydneybasin, Australia were used for this study. The moisture content ofthe samples was around 3%. Specimens 38 mm in diameter and76 mm in length were obtained from large black coal blocks usinga coring machine and grinder available in the Monash UniversityCivil Engineering Laboratories. Cored specimens were stored in afog room to prevent any moisture loss. The typical naturalfracture network (butt and face cleats) in a sample is shown inFig. 1. In this study, triaxial testing was used to conduct the per-meability tests, as triaxial tests have been recognized as the mostappropriate for permeability tests under in-situ stress conditions[19]. Therefore, a high pressure, newly-developed triaxial set-up
available in the Monash University Civil Engineering Laboratorieswas used for the study. The triaxial test procedure and thedetailed description of the set-up are explained by Ranjith andPerera [20]. During each triaxial test, the system temperaturewas maintained at a constant 33.5 �C to prevent any temperaturevariation effect on the test results. Table 1 shows the test condi-tions done on the samples. As shown in the table, permeabilitytests were conducted for CO2 and N2 at three different confine-ment pressures (15, 20 and 25 MPa) for a series of gas injectionpressures (3–21 MPa). In this study, undrained conditions wereused for the permeability tests, as the super-critical CO2 conditioncannot be achieved under drained conditions, for which atmo-spheric downstream pressure is maintained. After injecting gasfrom upstream, downstream pressure development (under un-drained conditions) was monitored and recorded at one secondintervals, using an advanced data acquisition system describedby Ranjith and Perera [20]. The downstream pressure vs. timecurve was then used to calculate the permeability of the coalsample using Eq. (1) [15,18]:
Q ¼ ðdP=dtÞ�bV ð1Þ
where Q is the flow rate through the specimen, V is the downstreamvolume (this was evaluated by filling water in the downstream areaand removing the water mass by applying a head) and b is the adi-abatic compressibility of the gas, and dP/dt is the rate of change inthe downstream pressure with time. Then, Darcy’s law (given in Eq.(2)) was used to calculate the corresponding permeability[15,19,21]:
K ¼ 2QpolLAðp2
i � p2oÞ
ð2Þ
where Q, l, po, and pi are the gas flow rate through the coal speci-men, viscosity of the fluid, the downstream pressure and the up-stream pressure, respectively. The specimen has cross-sectionalarea, A, and mean length, L and initial permeability, k. Perera et al.[15] have proven the accuracy of the undrained test procedure usedin this study.
In this study, three main test scenarios were applied. During thefirst stage of the study, variation in coal sample permeability withphase condition (sub- vs. super-critical) and injection pressure forboth carbon dioxide (CO2) and nitrogen (N2) were examined atthree different confinement pressures (15, 20 and 25 MPa). First,N2 gas at 3 MPa was injected into the coal sample under 15 MPaconfinement and the corresponding downstream pressure devel-opment was observed and recorded. Then, under the same confin-ing pressure condition, the same test procedure was repeated forinjection pressures of 4, 5, 6, 7, 8, 9 and 10 MPa (Table 1). A suffi-cient discrepancy was maintained between the confinement andinjection pressures to prevent any damage to the natural fracturesystem of the sample. A similar series of tests were then conducted

Table 1Test conditions.
Confining pressure (MPa) CO2 injecting pressure(MPa)
N2 injecting pressure(MPa)
15 6 37 48 59 6
10 711 812 913 10
20 10 811 912 1013 1114 1215 1316 14
25 14 1215 1316 1417 1518 1619 1720 1821 –
3
4
5
6
7
8
9
10
nstr
eam
Pre
ssur
e (M
Pa)
3392 M.S.A. Perera et al. / Fuel 90 (2011) 3390–3397
for 20 and 25 MPa confining pressure conditions. The injectionpressures for these confinement values are also shown in Table 1.Subsequently, CO2 was used as the injected phase and the sameseries of tests were conducted (Table 1). The CO2 injection pres-sures were quite similar to the N2 injection pressures. However,since the CO2 gas flow rate through the sample was much slower,higher injection pressures could be used without damaging thesample’s fracture system (Table 1). The main intention of this firsttest scenario was to investigate the phase condition and injectionpressure effects on coal sample permeability, and in particular, toinvestigate how CO2 permeability varies with a change from sub-to super-critical fluid state and how permeability behavior of coalwith exposure to reactive CO2 differs from that of N2.
In the second experimental scenario, the coal sample was al-lowed to swell due to super-critical CO2 adsorption for 45 h andthen the same test series, described in the previous paragraphwas conducted for both CO2 and N2. The main intention of this testscenario was to investigate how the coal sample permeabilitytrends change with swelling. For a swelling duration of 45 h waschosen as, according to Perera et al. [15] and Siriwardane et al.[18], the swelling process in coal will be almost completed duringthe first 45 h of super-critical CO2 injection. Super-critical adsorp-tion during the swelling period was confirmed by maintaining a7.4 MPa downstream pressure for 13 MPa CO2 injection at a con-stant temperature of 33.5 �C. Confining pressure was maintainedat 16 MPa during the swelling period.
The final stage of the study aimed to investigate a potentialmethod to reverse the swelling due to CO2 adsorption. In this,the third test scenario, N2 gas was allowed to flow through theswelled coal sample for 24 h before CO2 and N2 permeability (asdescribed for test scenario one) tests were repeated to check forany improvement in coal sample permeability after the N2
flooding.
0
1
2
00:0 01:30 03:0 04:30 05:59 07:29 08:59 10:29 11:59 13:29
Dow
Time (Minutes)
16 MPa 15 MPa 14 MPa 13 MPa
12 MPa 11 MPa 10 MPa
Fig. 2. Measurement of downstream fluid pressure for CO2 injection under 20 MPaconfining pressure.
3. Results and discussion
3.1. Coal permeability with CO2 and N2 pore pressure
In the first stage of the study, CO2 was injected into a naturallyfractured coal sample at various injection pressures under three
different confinements, as shown in Table 1 and the correspondingdownstream pressure development was recorded. The down-stream pressure developments for CO2 injection under 20 MPaconfinement is shown in Fig. 2. Then, the downstream pressuredevelopment, after 4 min of CO2 injection (a duration consideredsufficient to ensure a reasonable steady-state behavior in down-stream pressure and permeability curves as shown in Fig. 2) foreach injection pressure is shown in Fig. 3a and the correspondingcoal sample permeability values for the each injecting pressure isshown in Fig. 3b. Then, these two figures were combined to obtainFig. 3c, which shows the coal sample permeability variation withthe downstream pressure (after 04 min of injection). It is apparentfrom Fig. 3b that coal sample permeability for CO2 reduces withincreasing injection pressure for all the confinements. It appearsthat coal sample permeability for CO2 reduces with increasinginjection pressure, regardless of depth (confining pressure). Thisis consistent with the findings of Perera et al. [15], who showeda similar permeability reduction for CO2 injection in fractured coal.This reduction is due to the swelling caused by CO2 adsorption,which is significant, even for durations as short as the injectionperiod. According to Fig. 3b, the permeability reduction increaseswith increasing confining pressure, with the average permeabilityreduction gradient for 15, 20 and 25 MPa confinement experimentsbeing 10%, 13% and 18% per MPa increase in downstream pressure,respectively. This observation may be related to the greater capac-ity for pore space dilation and permeability increase by the effec-tive stress principle and thus the smaller degree of interactionbetween CO2 and coal (and thus less adsorption-related swelling)for scenarios where the ratio of confinement to injection pressureis lower.
Interestingly, when the downstream pressure is increased fromabout 6.5–7.2 MPa, an unexpectedly greater reduction in CO2 per-meability can be seen for all three confinements (Fig. 3c). The aver-age permeability reduction gradients are about 30%, 42% and 46%,for the 15, 20 and 25 MPa confinements, respectively. This is likelyto be due to phase transformation of CO2 from sub- to super-crit-ical within the sample across this region. In the present study,the entire triaxial set-up was maintained at 33.5 �C constant tem-perature, which is higher than the critical temperature of CO2
(31.8 �C). At temperatures above 31.8 �C, CO2 will become super-critical for pressures greater than 7.38 MPa [6,12]. It is clear that,for downstream pressures greater than 6.5 and less than 7.2 MPa,CO2 was super-critical over some part of its flow path. For down-stream pressures greater than 7.2 MPa, CO2 was super-critical foreffectively its entire flow path. This observation proves that thepermeability of coal in the presence of super-critical CO2 is sub-stantially lower than that for coal in the presence of sub-critical

0
2
4
6
8
10
Dow
nstr
eam
Pre
ssur
e (M
Pa)
Upstream Pressure (MPa)
15 MPa
20 MPa
25 MPa
1E-05
0.0001
0.001
0.01
Perm
eabi
lity
(md)
Upstream Pressure (MPa)
15 MPa
20 MPa
25 MPa
T1
T2
T3
1E-05
0.0001
0.001
0.01
5 10 15 20 0 5 10 15 20 25 0 2 4 6 8 10
Perm
eabi
lity
(md)
Downstream Pressure (MPa)
15 MPa
20 MPa
25 MPa
Transition from sub critical to super crtitical
(a) Downstream Pressure
(b) Peremeability with upstream pressure
(c) Peremeability with downstream pressure
Fig. 3. Downstream pressure developments after 04 min of CO2 injection for different injecting pressures and corresponding permeability values with upstream anddownstream pressures for 15, 20 and 25 MPa confining pressure conditions (T1, T2 and T3 are transition periods for 15, 20 and 25 MPa confining pressures).
M.S.A. Perera et al. / Fuel 90 (2011) 3390–3397 3393
CO2. According to Perera et al. [15], super-critical CO2 produces amuch higher swelling effect compared to sub-critical CO2. How-ever, in the present study permeability testing for one injectionpressure was completed within a duration as short as 20 min,which is not sufficient to complete the swelling process [15].Therefore, there must be another strong reason for this permeabil-ity reduction: it must be related to the properties of the super-crit-ical CO2. According to Huang et al. [22], conversion of CO2 to itssuper-critical state will coincide with a sudden increase in viscos-ity, as it converts to a liquid and this viscosity increment causes tohave thicker fluid with less penetration, resulting in lesser com-pressibility. If the compressibility of fluid is high and viscosity islow, the mean free flow path of the gas molecules approachesthe pore radius, which causes to accelerate the collision betweengas molecules and to pore-walls. This additional flux (slip flow)causes to enhance the flow rate and this phenomenon is calledKlinkenberg effect [23]. This effect is especially important for gasflows due to high compressibility values in gas. In this study asthe temperature remained at 33.5 �C, sub-critical CO2 is basicallygas CO2 and therefore had higher Klinkenberg effect. When thesub-critical CO2 converts to its super-critical condition, this Klin-kenberg effect significantly reduces, resulting in decline of flowrate and the permeability. The other important observation is thatfor the super-critical region there is a larger decrease in CO2 per-meability with increasing downstream pressure compared to thatfor the sub-critical state (Fig. 3c). For instance, for the 15 MPa con-fining pressure condition, for a downstream pressure increase from6 to 6.5 MPa (CO2 in its sub-critical state) there is a permeabilityreduction of about 7%, whereas for the downstream pressure in-creases from 7.4 to 7.6 MPa (during the super-critical phase) a per-meability reduction of about 31% can be seen. This can beexplained by a greater proportional increase in super-critical CO2
viscosity with increasing pressure when compared to that forsub-critical CO2 [22], which causes the Klinkenberg slip flow to re-duce, resulting in lower permeability. According to Perera et al.[15], there is a significantly higher swelling effect with super-crit-ical CO2 adsorption than sub-critical CO2 adsorption, which causesa significant reduction in coal mass permeability. Therefore, thecombined effect of augmented viscosity with increasing pressureand super-critical CO2 adsorption-induced swelling can accountfor a steeper decline in permeability with increasing injection pres-sure for super-critical CO2, when compared to sub-critical CO2.
Fig. 4 shows downstream pressure (after 4 min of gas injection)and permeability behavior of coal with N2 injection for differentinjection pressures at confining pressures of 15, 20 and 25 MPa.According to Fig. 4a, downstream pressure increases almost line-arly with increasing upstream pressure. Fig. 4b and c show thatthe corresponding permeability values also vary linearly withincreasing upstream and downstream pressures. This scenario is
significantly different to what was observed for CO2 (Fig. 3).According to Harpalani and Chen [24], exposure to N2 does notcause any swelling to occur in coal. Therefore, the effect of effectivestress reduction with increasing injecting pressure is the only sig-nificant physical process for N2 injection, as has been shown inmany studies [25–28].
3.2. Coal permeability with swelling
In the next stage of the study, the effects of coal mass swellingon the permeability behavior of both CO2 and N2 were considered.First, a coal sample was allowed to undergo swelling under super-critical CO2 adsorption for 45 h and the CO2 and N2 permeabilitytests were then repeated. The observed permeability reductionsfor both CO2 and N2 are shown in Fig. 5, which to maintain consis-tency between tests, shows results for the tests after 4 min of CO2
injection. As Fig. 5 shows, there is a clear reduction in permeabilityof both gases with swelling. This swelling process is believed to becaused by the highly cross-linked macromolecular network of coal,which swells in the presence of CO2 and causes the pore spaceavailable for gas movement to be reduced, resulting in permeabil-ity reduction [5]. However, the permeability reduction is more sig-nificant at lower gas injection pressures and decreases withincreasing injection pressures [15]. This may be due to the de-crease in effective stress for higher injection pressures, whichmay allow dilation of fractures to some extent. The obtained aver-age permeability reduction gradients for 15, 20 and 25 MPa confin-ing pressures under CO2 injection were about 28%, 37% and 42%,respectively (Fig. 5a–c) and those for under N2 injections wereabout 9%, 13% and 20%, respectively (Fig. 5d–f). The lower perme-ability reductions for N2 injection and for lower confining pres-sures also confirm the relationship between the swelling effectand flow rate.
It is interesting to note that, for significant injection pressures(greater than 10.5, 13.5 and 18.5 MPa for the 15, 20 and 25 MPaconfining pressure experiments, respectively), the ‘initial’ samplesdisplay lower permeability than the ‘after swelling’ samples(Fig. 5a–c). Fig. 3a shows that for injection pressures greater than10.5, 13.5 and 18.5 MPa (for the 15, 20 and 25 MPa confining pres-sure experiments, respectively), downstream pressures remain rel-atively constant (at about 7.4 MPa) for significant variation inupstream pressure. For these cases, the CO2 flow through the spec-imen will be entirely super-critical and, for the ‘initial’ samples ofFig. 5a–c, significant swelling may be responsible for the drasticdecrease in permeability with increasing injection pressure. Onthe other hand, the ‘after swelling’ samples of Fig. 5a–c, which pre-viously experienced a 45 h CO2 adsorption period, will have hadlower initial permeability and may not have allowed developmentof downstream pressures as significant as those for the ‘initial’

0
2
4
6
8
10
12
14
Dow
nstr
eam
Pre
ssur
e (M
Pa)
Upstream Pressure (MPa)
15 MPa
20 MPa
25 MPa
0.001
0.01
0.1
Perm
eabi
lity
(md)
Downstream Pressure (MPa)
15 MPa
20 MPa
25 MPa
0.001
0.01
0.1
2 7 12 17 0 5 10 150 5 10 15 20
Perm
eabi
lity
(md)
Upstream Pressure (MPa)
15 MPa
20 MPa
25 MPa
(a) Downstream Pressure
(b) Peremeability with upstream pressure
(c) Peremeability with downstream pressure
Fig. 4. Downstream pressure developments after 04 min of N2 injection for different injecting pressures and corresponding permeability values with upstream anddownstream pressures for 15, 20 and 25 MPa confining pressure conditions.
0.00001
0.0001
0.001
0.01
Perm
eabi
lity
(md)
Upstream Pressure (MPa)
Initial After Swelling
0.00001
0.0001
0.001
0.01
Perm
eabi
lity
(md)
Upstream Pressure (MPa)
Initial After Swelling0.00001
0.0001
0.001
0.01
Perm
eabi
lity
(md)
Upstream Pressure (MPa)
Initial After Swelling
0.001
0.01
Perm
eabi
lity
(md)
Upstream Pressure (MPa)
Initial After Swelling
0.001
0.01
Perm
eabi
lity
(md)
Upstream Pressure (MPa)
Initial After Swelling
0.001
0.01
5 7 9 11 13 10 12 14 16 18 12 14 16 18 20 22
3 5 7 9 5 7 9 11 13 10 12 14 16 18
Perm
eabi
lity
(md)
Upstream Pressure (MPa)
Initial After Swelling
(a) CO2 at 15 MPa (b) CO2 (c) CO2 at 25 MPa
(d) N2 (e) N2 (f) N2 at 25 MPa
at 20 MPa
at 15 MPa at 20 MPa
Fig. 5. Effect of CO2 induced swelling on CO2 and N2 permeabilities for 15, 20 and 25 MPa confining pressure conditions.
3394 M.S.A. Perera et al. / Fuel 90 (2011) 3390–3397
sample set. Lower CO2 flow pressures for the ‘after swelling’ sam-ples may result in higher permeabilities as the sub-critical compo-nent of the CO2 flow will cause less limited permeabilityreductions. For instance, the downstream pressures after 4 minfor the 15 MPa injection and 20 MPa confinement pressure case be-fore and after swelling are about 7.4 and 4 MPa, respectively (Figs. 2and 6). Here, Fig. 6 illustrates downstream pressure developmentduring the CO2 injection period, for samples after swelling, forCO2 injection at various injection pressures and 20 MPa of confine-ment. This means that after swelling a significant component of theCO2 flow through the sample became sub-critical. The differencebetween CO2 behavior under sub- and super-critical states can beattributed to the difference in permeability variation with varyinginjection pressure (between original and pre-swollen specimens)for values of injection pressure greater than 14 MPa, in the20 MPa confining pressure case.
After swelling, contrary to the behavior of the coal sample in itsoriginal condition, CO2 permeability does not exhibit a reductionwith increasing injection pressure (Fig. 5a–c). Instead, for the swol-len coal samples, permeability increases with increasing injectionpressure, in accord with fracture dilation in response to an effec-tive stress reduction. However, the coal sample does not show as
significant an increase in permeability with increasing injectionpressure as it does for N2, suggesting that the fracture dilation byeffective stress reduction is more significant for the N2 case. Thismay be related to the increasing proportion of super-critical CO2
with increasing injection pressure, which may result in a reductionin permeability that compensates for the effective stress relatedpermeability increase for the CO2 case.
According to Fig. 2 (for CO2 injection under 20 MPa confine-ment), before swelling (under the original condition) downstreampressure development curves merge with increasing injectionpressure, possibly due to permeability reduction with swellingduring the injection. Moreover, the gap between the curves rapidlydiminishes and curves forms are similar for injection pressures of14 MPa or more. This is due to the fact that for injection pressuresof 14 MPa or more, the majority of CO2 inside the coal sample re-mains super-critical throughout the injection period. Moreover,Fig. 3a shows that for injection pressures of 14 MPa or more under20 MPa confining pressure, downstream CO2 pressure becomessuper-critical by the 4 min of injection. Fig. 3b shows that perme-ability reduces significantly for small variations in injection pres-sure after super-critical conditions are attained. This can accountfor the similar curve forms of the 15 and 16 MPa curves of Fig. 2.

0
1
2
3
4
5
6
7
8
9
10
00:0 01:30 03:0 04:30 05:59 07:29 08:59 10:29 11:59 13:29
Dow
nstr
eam
Pre
ssur
e (M
Pa)
Time (Minutes)
16 Mpa 15 Mpa 14 Mpa 13 Mpa
12 MPa 11 Mpa 10 MPa
Fig. 6. Measurement of downstream fluid pressure for CO2 injection under 20 MPaconfining pressure after swelling.
0
2
4
6
8
10
12
14
Dow
nstr
eam
Pre
ssur
e (M
Pa)
Time (Minutes)
14 MPa 13 MPa 12 MPa 11 MPa
10 MPa 9 MPa 8 MPa
00:0 01:30 03:0 04:30 05:59 07:29 08:59 10:29 11:59 13:29
(a) Before Swelling
Fig. 7. Measurement of downstream fluid pressure for N2 injectio
0.00001
0.0001
0.001
0.01
Perm
eabi
lity
(md)
Upstream Pressure (MPa)
InitialAfter SwellingAfter Nitrogen Flooding
0.00001
0.0001
0.001
0.01
Perm
eabi
lity
(md)
Upstream
InitialAfter SweAfter Nitr
(a) CO2 at 15 MPa (b) CO
0.001
0.01
Perm
eabi
lity
(md)
Upstream Pressure (MPa)
InitialAfter SwellingAfter Nitrogen Flooding
0.001
0.01
Perm
eabi
lity
(md)
Upstream
InitialAfter SweAfter Nitr
5 7 9 11 10 12
3 5 7 9 5 7
(d) N2 at 15 MPa (e) N2
Fig. 8. Effect of N2 flood on CO2 and N2 permeabilities fo
M.S.A. Perera et al. / Fuel 90 (2011) 3390–3397 3395
However, permeability reduction for small variations in injectionpressure are less significant for the ‘after swelling’ condition ofFig. 5. This is due to the fact that the downstream pressure for allinjection pressure cases remains below 7 MPa for the entire injec-tion period, making a significant proportion of the CO2 flowthrough the coal sample sub-critical (Fig. 6). Additionally, the formof the various curves of Fig. 6 is uniform, suggesting that swelling(and associated permeability modifications) has not occurred dur-ing the injection period. Fig. 7 shows downstream pressure devel-opments for N2 injection for the same conditions as those shownfor CO2 in Fig. 6. The curves of Fig. 7 maintain uniform form andseparation for both the ‘before swelling’ and ‘after swelling’ cases.This is due to the fact that N2 does not adsorb into the coal matrixand therefore, does not cause any swelling effect, meaning that,unlike for CO2, the permeability effect on the time-dependentdevelopment of downstream pressure is uniform throughout theinjection period.
0
2
4
6
8
10
12
14
00:0 01:30 03:0 04:30 05:59 07:29 08:59 10:29 11:59 13:29
Dow
nstr
eam
Pre
ssur
e (M
Pa)
Time (Minutes)
14 Mpa 13 Mpa 12 MPa 11 Mpa
10 MPa 9 MPa 8 MPa
(b) After Swelling
n under 20 MPa confining pressure before and after swelling.
Pressure (MPa)
llingogen Flooding
0.00001
0.0001
0.001
0.01
Perm
eabi
lity
(md)
Upstream Pressure (MPa)
InitialAfter SwellingAfter Nitrogen Flooding
2 (c) CO2 at 25 MPa
Pressure (MPa)
llingogen Flooding
0.001
0.01
14 16 18 12 14 16 18 20
9 11 13 10 12 14 16 18
Perm
eabi
lity
(md)
Upstream Pressure (MPa)
InitialAfter SwellingAfter Nitrogen Flooding
(f) N2 at 25 MPa
at 20 MPa
at 20 MPa
r 15, 20 and 25 MPa confining pressure conditions.

3396 M.S.A. Perera et al. / Fuel 90 (2011) 3390–3397
3.3. Coal permeability with N2 flooding to reverse CO2-related swelling
The last stage of the study was conducted to investigate a po-tential method to reverse coal swelling caused by CO2 adsorption.N2 gas was injected into the coal sample for 24 h and permeabilitytests were repeated to investigate changes in permeability withboth CO2 and N2 injection pressure, after the N2 flooding (Fig. 8).As shown in Fig. 8, both CO2 and N2 permeability values show var-iation in permeability with changes in injection pressure after theN2 flooding period. In the case of CO2 injection, a marginal increasewas observed with increasing injection pressure for low values ofinjection pressure, whereas a more significant decrease in perme-ability was observed with increasing injection pressure for highvalues of injection pressure (Fig. 8a–c). In the case of N2 injection,a uniform but relatively modest increase in permeability was ob-served with increasing injection pressure (Fig. 8d–f). The averagepermeability increase gradients for CO2 injection at 15, 20 and25 MPa confining pressures are about 9%, 11% and 14%, respec-tively, whereas the average permeability increase gradients forN2 injection at the same confining pressures are about 5%, 6%and 9%, respectively. Comparison of the results of Fig. 5a–c to thosein Fig. 8a–c demonstrates that N2 flooding can reverse some of theswelling caused by CO2 adsorption. This is consistent with the find-ing of Kiyama et al. [28], who discussed the ability of N2 moleculesto displace adsorbed CO2 from the coal matrix and consequentlypartially reverse adsorption-related swelling. Fig. 8 demonstratesthat the amount of permeability recovered by N2 flooding is depen-dent on both the injection pressure and confining pressure: theswelling recovery rate is higher at lower injection pressures andhigher confining pressures. Each of these conditions cause slowergas flow rate through the coal sample and, therefore, a greaterswelling effect (see the results of Fig. 5) due to longer residencetimes for CO2 and greater adsorption and thus these conditionsalso yield greater reversal of swelling by N2 flooding. The perme-ability reduction observed for higher injecting pressure (Fig. 8a–c) is due to the fact that increasing of injecting pressure causesto have a more percentage of super critical CO2 inside the coal sam-ple. Therefore, this CO2 permeability reduction after the N2 floodfor higher injecting pressures may be related to the greater capac-ity for super-critical CO2 (when compared to sub-critical CO2) toreproduce swelling in areas, where swelling was partially recov-ered by N2 flooding. This is confirmed by the continuous perme-ability increment from low to high injecting pressures observedfor the N2 injection after the N2 flood (Fig. 8d–f). However, themaximum amount of permeability that can be recovered by N2
flooding is uncertain as in this study N2 flooding was only allowedto occur for 24 h. The influence of greater N2 flooding periods onthe reversal of CO2-induced swelling of coal warrant additionalinvestigation.
4. Conclusions
Coal permeability for CO2 reduces with increasing injectingpressure at any depth due to the swelling process which occursin the coal matrix caused by CO2 adsorption, even during the injec-tion period. Moreover, the permeability reduction rate increaseswith increasing depth, as the compressive force created by higherconfinements at higher depths causes the pore space available forgas movement to shrink considerably, resulting in higher tortuos-ity and consequently lower flow rate through the coal mass. Thepermeability of super-critical CO2 is greatly lower than that ofsub-critical CO2 for two main reasons. Firstly, super-critical CO2
causes a much greater swelling effect than sub-critical CO2.
Super-critical CO2 also has significantly higher viscosity valuescompared to sub-critical CO2 and this produces a more liquid-like
fluid. Moreover, at super-critical states there is a higher decline ofCO2 permeability with increasing downstream pressure for twomain reasons, (1) super-critical CO2 exhibits much higher incre-ments in its viscosity with increasing pressure compared to sub-critical CO2 and (2) super-critical CO2 produces a much greaterswelling effect. However, for N2 injection, downstream pressure in-creases almost linearly with increasing injecting pressure and cor-responding permeability values also increase linearly. This is dueto the fact that no process like swelling occurs during the N2 injec-tion and therefore, only the effect of effective stress reduction withincreasing injecting pressure exists, resulting in lower tortuosityand higher permeability for gas movement.
CO2 adsorption-induced swelling causes significantly reducedpermeability of both CO2 and N2. This reduction is higher at low-er gas injection pressures and decreases with increasing injectingpressure. This may be due to the increasing dominance of poro-elastic effect on porosity change over adsorption-induced matrixswelling at higher injection pressures. However, the swelling pro-cess may also cause the permeability of the coal mass to increasefor higher injecting pressures, under which CO2 was initiallysuper-critical. The reason is that the permeability of a coalsample is much lower after swelling and therefore, pressuredevelopment throughout the coal sample is lower, resulting insub-critical CO2 mainstream throughout the coal sample, insteadof the previous super-critical CO2 mainstream for the sameinjecting pressures. Since sub-critical CO2 always has much high-er permeability than super-critical CO2, the permeability of thecoal sample will be increased by the swelling process for thesehigher pressures.
N2 has potential to reverse the swelling effect due to CO2
adsorption as a 24 h N2 flood causes both CO2 and N2 permeabilityvalues to increase, which had previously reduced due to swelling.This is due to the fact that N2 molecules have the ability to displacethe adsorbed phase CO2 from the coal matrix and consequently re-verse the swelled areas to some degree. Moreover, the N2 perme-ability recovery rate is higher at lower injecting pressures and athigher confining pressures. Both of these conditions produceslower gas flow rate through the coal sample and therefore, havegreater swelling effects, resulting in greater recovery.
References
[1] Le Treut H, Somerville R, Cubasch U, Ding Y, Mauritzen C, Mokssit A, et al.Historical overview of climate change. In: Solomon S, Qin D, Manning M, ChenZ, Marquis M, Averyt KB, et al., editors. Climate Change: the physical sciencebasis, contribution of working group 1 to the fourth assessment report of theintergovernmental panel on climate change. Cambridge: Cambridge UniversityPress; 2007.
[2] Department of Resource Energy and Tourism. Energy in Australia. Canberra;2010.
[3] Kiehl J, Trenberth KE. Earth’s annual global mean energy budget. Bull AmMeteorol Soc 1997;78(2):197–208.
[4] White CM, Smith DH, Jones KL, Goodman AL, Jikich SA, LaCount RB, et al.Sequestration of carbon dioxide in coal with enhanced coalbed methanerecovery: a review. Energy Fuels 2005;19(3):659–724.
[5] Katyal S, Valix M, Thambimuthu K. Study of parameters affecting enhancedcoal bed methane recovery. Energy Sources 2007;29:193–205.
[6] Curtis O. Geologic carbon sequestration: CO2 transport in depleted gasreservoirs. In: Ho CK, Webb SW, editors. Gas transport in porousmedia. Netherlands: Springer Inc; 2006. p. 419–26.
[7] Reeves S. Geological sequestration of CO2 in deep, un-mineable coal beds: anintegrated research and commercial-scale field demonstration project. In:Proceedings of society of petroleum engineers annual technical conference andexhibition, New Orleans, LA. USA; 2001.
[8] Ohga K, Fujioka M, Yamaguchi S. Pilot test of CO2 sequestration and ECBM inJapan. Reduction of CO2 emission by means of CO2 storage in coal seams.Silesian Coal Basin of Poland Workshop, Szczyrk, Poland; 2005.
[9] Botnen LS, Fisher DW, Dobroskok AA, Bratton TR, Greaves KH, McLendon TR,et al. Field test of CO2 injection and storage in lignite coal seam in NorthDakota. Energy Procedia 2009;1(1):2013–9.
[10] Mazumder S, Wolf KH. Differential swelling and permeability change of coal inresponse to CO2 injection for ECBM. Int J Coal Geol 2008;74(2):123–38.

M.S.A. Perera et al. / Fuel 90 (2011) 3390–3397 3397
[11] Faiz MM, Saghafi A, Barclay SA, Stalker L, Sherwood NR, Whitford DJ.Evaluating geological sequestration of CO2 in bituminous coals: Thesouthern Sydney basin, Australia as a natural analogue. Int J Greenhouse GasControl 2007;1(2):223–35.
[12] Perera MSA, Ranjith PG, Choi SK, Bouazza A, Kodikara J, Airey D. A review ofcoal properties pertinent to carbon dioxide sequestration in coal seams: withspecial reference to Victorian brown coals. Environ Earth Sci, in press. doi:10.1007/s12665-010-0841-7.
[13] Holloway S. Underground sequestration of carbon dioxide-a viable greenhousegas mitigation option. Energy 2005;30(11–12):2318–33.
[14] Krooss BM, Bergen FV, Gensterblum Y, Siemons N, Pagnier HJM, David P. High-pressure methane and carbon dioxide adsorption on dry and moisture-equilibrated Pennsylvanian coals. Int J Coal Geol 2002;51(2):69–92.
[15] Perera MSA, Ranjith PG, Choi SK, Airey D. Comparison of subcritical and supercritical carbon dioxide adsorptions induced coal matrix swelling effects onpermeability of naturally fractured black coal. Energy, in preparation.
[16] Sing KSW, Everett DH, Haul RW, Moscou L, Pierotti RA, Rouquerol J, et al.Reporting physisorption data for gas/solid systems with special reference tothe determination of surface area and porosity. Pure Appl Chem 1985;57:603.
[17] Scott AR. Hydrogeologic factors affecting gas content distribution in coal beds.Int J Coal Geol 2002;50:363–87.
[18] Siriwardane H, Haljasmaa I, McLendon R, Irdi G, Soong Y, Bromhal G. Influenceof carbon dioxide on coal permeability determined by pressure transientmethods. Int J Coal Geol 2009;77(1–2):109–18.
[19] Perera MSA, Ranjith PG, Choi SK, Airey DA. Numerical simulation of gas flowthrough porous sandstone and its experimental validation. Fuel2011;90(2):547–54.
[20] Ranjith PG, Perera MSA. A new triaxial apparatus to study the mechanical andfluid flow aspects of carbon dioxide sequestration in geological formations.Fuel. doi: 10.1016/j.fuel.2011.04.004.
[21] Jasinge D, Ranjith PG, Choi SK. Effects of effective stress changes onpermeability of latrobe valley brown coal. Fuel 2011;90(3):1292–300.
[22] Huang J, Moriyoshi T, Manabe H. Patterning of fine particles by means ofsupercritical CO2. J Mater Sci 2006;41(5):1605–10.
[23] Klinkenberg LJ. The permeability of porous media to liquids and gases. DrillProduct Pract 1941:200–13.
[24] Harpalani S, Chen G. Estimation of changes in fracture porosity of coal with gasemission. Fuel 1995;74:1491–8.
[25] Somerton WH. Effect of stress on permeability of coal. Int J Rock Mech Min Sci1975;12(5–6):129–43.
[26] McKee CR, Bumb AC, Koenig RA. Stress-dependent permeability and porosityof coal and other geologic formations. Soc Petrol Eng 1988;3(1):81–91.
[27] Huy PQ, Sasaki K, Sugai Y, Satoshi I. Carbon dioxide gas permeability of coalcore samples and estimation of fracture aperture width. Int J Coal Geol2010;83(1):1–10.
[28] Kiyama T, Nishimoto S, Fujioka M, Xue Z, Ishijima Y, Pan Z, et al. Coal swellingstrain and permeability change with injecting liquid/supercritical CO2 and N2
at stress-constrained conditions. Int J Coal Geol 2011;85(1):56–64.


