Embed Size (px)
Citation preview

(
EPA 910/9-91-005
WETLAND ECOSYSTEM TEAM Fisheries Research Institute School of Fisheries WH-10 University of Washington
Seattle, WA 98195
FRI-UW-9008 June 1990
LONG-TERM CHANGES IN THE AREAL EXTENT OF TIDAL MARSHES, EELGRASS MEADOWS AND
KELP FORESTS OF PUGET SOUND
RONALD M. THOM AND LOANN HALLUM
WETLAND ECOSYSTEM TEAM
FINAL REPORT to
OFFICE OF PUGET SOUND REGION 10
U.S. ENVIRONMENT AL PROTECTION AGENCY
Approved
Submitted ____ 4 _____ ..... _\ ....... ~_-_1 _\ __ Director


CONTENTS
Page
LIST OF FIGURES .... ..... .... ..... ......... ......... ......... ........ ..... .... ..... .... ..... .... .... IV
LIST OF TABLES..................................................................................... V
EXECUTIVE SUMMARY ............................................................................ vii INTRODUCTION ...... ·................................................................................ 1 STUDY REGIONS AND HABITATS ... .. ... . . .. .. .. . . .... .. . .. .... .. .. . . .. . .. . . .. . ... .. .. . .... .. . 2 METHODS AND MATERIALS ...................................................................... 8
Sources of Information . . . . . . . . . . . . . . . . . . . . . . . . . . . . . . . . . . . . . . . . . . . . . . . . . . . . . . . . . . . . . . . . . . . . . . . . . . . . 8 Tidal Marshes and Swamps . . . . . . . . . . . . . . . . . . . . . . . . . . . . . . . . . . . . . . . . . . . . . . . . . . . . . . . . . . . . . . . . . . 10 Eelgrass Meadows .. . . . . . .. . . . . . .. . . . . . . .. . . . . . . . . . .. . . .. . . . . . . . . . . . . . . . . . . . . . . . . . . . . . . . .. . . . . . 11 Kelp Forests ... .. ...... .. .. ..... .. .... .. ...... .. .. .. ....... .. .. .. .. .. .. .... .. .. .. .. . . . .. .... .. .. 13
Introduced Species ............................ ........................... ................ .......... 15 Spartina s~p .... : . . . . . . . . . . . . . . . . . . . . . . . . . . . . . . . . . . . . . . . . . . . . . . . . . . . . . . . . . . . . . . . . . . . . . . . . . . . . . . . 15 Zostera Japonica .. ... . . .. ... .... .. ... .. ..... .. .. .. ... .. ..... .. .. .. ... .. ..... .. .. .. ... .... ... .. .. 15 Sargasswn muticum . . . . . . . . . . . . . . . . . . . . . . . . . . . . . . . . . . . . . . . . . . . . . . . . . . . . . . . . . . . . . . . . . . . . . . . . . . . 16
RESULTS............................................................................................... 16 Tidal Marshes and Swamps ....................................................................... 16 Eelgrass Meadows . . . . . . . . . . . . . . . . . . . . . . . . . . . . . . . . . . . . . . . . . . . . . . . . . . . . . . . . . . . . . . . . . . . . . . . . . . . . . . . . . 22 Kelp Forests . . . . . . . . . . . . . . . . . . . . . . . . . . . . . . . . . . . . . . . . . . . . . . . . . . . . . . . . . . . . . . . . . . . . . . . . . . . . . . . . . . . . . . . . 31 Introduced Species ....................................................... .... ...................... 42
Spartina spp. . . . . . . . . . . . . . . . . . . . . . . . . . . . . . . . .. . . . . . . . . . . . . . . . . . . . . . . . . . . . . . . . . . . . . . . . . . . . . . . . . . . 42 Zostera japonica .. ... .. .. ... .. .. .. ... .. .. ... .. .. .. ... .. .. ... .. .. .. ... .. .. . .. .. .. .. ... .. .. ... .. .. 43 Sargasswn muticum . . . . . . . . . . . . . . . . . . . . . . . . . . . . . . . . . . . . . . . . . . . . . . . . . . . . . . . . . . . . . . . . . . . . . . . . . . . 43
DISCUSSION . . . . . . . . . . . . . . . . . . . . . . . . . . . . . . . . . . . . . . . . . . . . . . . . . . . . . . . . . . . . . . . . . . . . . . . . . . . . . . . . . . . . . . . . . . 43 CONCLUSIONS AND RECOMMENDATIONS .................................................. 50 REFERENCES......................................................................................... 52 APPENDIX 1 . . . . . . . . . . . . . . . . . . . . . . . . . . . . . . . . . . . . . . . . . . . . . . . . . . . . . . . . . . . . . . . . . . . . . . . . . . . . . . . . . . . . . . . . . . . 57 APPENDIX 2 . . . . . . . . . . . . . . . . . . . . . . . . . . . . . . . . . . . . . . . . . . . . . . . . . . . . . . . . . . . . . . . . . . . . . . . . . . . . . . . . . . . . . . . . . . . 83
iii

LIST OF FIGURES
Figure Page
1. The study area showing the five subregions................................................ 3
2. A composite illustration of the general distribution of nearshore habitats in the study area....................................................................... 7
3. Changes in wetland area in the Snohomish River estuary................................. · 19
4. Changes in tidal marshes and swamps, unvegetated shallows and flats and total wetland area in the Duwamish River estuary . . . . . . . . . . . . . . . . . . . . . . . . . . . . . . . 20
5. Changes in vegetated wetland, unvegetated flats and total wetland area in the Puyallup River estuary............................................................ 21
6. Changes in the tidal marsh area of the Skagit River according to Bortelson et al. and Brewer . . . . . . . . . . . . . . . . . . . . . . . . . . . . . . . . . . . . . . . . . . . . . . . . . . . . . . . . . . . . . . . . . . . 23
7. Changes in the tidal marsh area of the Stillaguamish River according to Bortelson et al. and Brewer . . . . . . . . . . . . . . . . . . . . . . . . . . . . . . . . . . . . . . . . . . . . . . . . . . . . . . . . . . . . . . . . 24
8. Length of coastline occupied by kelp forests in subregions within the Straits region for records made in 1911-12 and 1978...................................... 34
9. Length of coastline occupied by kelp forests in subregions within the North Puget Sound region for records made in 1911-12 and 1978 .......... ....... .. . .. 35
10. Length of coastline occupied by kelp forests in subregions within the Hood Canal region for records made in 1911-12 and 1978 ............................... 36
11. Length of coastline occupied by kelp forests in subregions within the MainBasinregionforrecordsmadein 1911-12and 1978................................ 37
12. Length of coastline occupied by kelp forests in subregions within the South Puget Sound region for records made in 1911-12 and 1978 ... .......... ... .. .... 38
13. Changes in mean percent cover of (A) Nereocystis luetkeana and (B) Sargassum muticum in the low intertidal zone at Alki Beach between 1979 and 1989 ............. .... .............................................. ... .... ....... .. . .. 44
iv

LIST OF TABLES
Table Page
1. Regions, subregions and total shoreline lengths............................................ 4
2. Area of tidal marshes and swamps and linear length of dikes in counties bordering Puget Sound in 1883 . . . . . . . . . . . . . . . . . . . . . . . . . . . . . . . . . . . . . . . . . . . . . . . . . . . . 17
3. Comparison of historical and present day intertidal wetland areas in major river deltas . . . . . . . . . . . . . . . . . . . . . . . . . . . . . . . . . . . . . . . . . . . . . . . . . . . . . . . . . . . . . . . . . . . . . . . . . . . . . . . 18
4. Comparison of historical and present subaerial wetland areas in major river deltas according to Bortelson et al. 1980... .. . . ... . . . . . .. . . . .. . . . . . . .. . . .. . . .. . . .. . . .. 18
5. Changes in habitat areas in the Nisqually River delta...................................... 25
6. Estuarine wetland areas for counties bordering Puget Sound............................. 26
7. Eelgrass distributions by subregion.......................................................... 27
8. Length of shoreline occupied by eelgrass based on surveys by Washington Department of Fisheries and by the Washington Department of Wildlife for the Coastal Zone Atlas . . . . . . . . . . . . . . . . . . . . . . . . . . . . . . . . . . . . . . . . . 30
9. Length of shoreline occupied by kelp based on surveys by Rigg in 1911-12 and Washington Department of Wildlife in 1978 ... ........... .................. 32
10. Coastline lengths occupied by kelp in six subregions in the Straits...................... 33
11. Kelp distributions by subregions in 1911-12, 1977-78, and notes and kelp distributions from 1982 and 1988 aerial photographs........................... 39
V

KEY WORDS
Eelgrass meadows, kelp forests, long-term changes, Puget Sound, tidal marshes.
ACKNOWLEDGEMENTS
We sincerely thank the Office of Puget Sound, Region 10 U.S. Environmental Protection
Agency for funding this research. Michael Rylko of the Office of Puget Sound was the project
manager and provided needed direction, comments and impetus. We are indebted to myriad
individuals and organizations for their help in accessing information for us. Included in this group
is Gregory Bargman, U.S. Coast Guard, Seattle District Corps of Engineers, Cecil Hansel,
Douglas Dolstad, John Garrett, Gregory Hueckle, Robert Jeffries, Don Kreage, Michael MacKay,
Thomas Mumford, Margaret Sayer, Anne McBride, Richard Meyer, Donald Peterson, University
of Washington librarians, Robert Waaland, Richard Albright, James Davis, James McDermott,
Daniel Pentilla, Marc Boule, Lauri Hariuchi, Linda Kunze, Ann Shaffer, Ronald Phillips, Ronald
Foreman, Robert Scagel, Thomas Widdowson, Scott Borkland, Bonny Orme, Lyon McCandless,
David Jamison and William Nelson. The review comments of the draft manuscript by Stewart
Toshach, Jeff Stearn, Michael Rylko, John Armstrong, Fred Weinmann and Barbara Aberle
greatly improved the report. Marcus Duke did the final editing and production of the report.
VI

EXECUTIVE SUMMARY
Historical and present-day records on the distribution of marshes, eelgrass meadows and kelp
forests are compiled and compared to evaluate historical changes in these nearshore habitats. The
findings of the study are as follows:
• The most comprehensive records were for tidal marshes, which have decreased 71 % in
area since records made in the 1800s. Much of the loss is due to diking, filling and
dredging.
• Records of eelgrass meadows from before the major influx of humans in the late 1800s
were not comprehensive. However, eelgrass losses of 30% and 15% were estimated for
Bellingham Bay and the Snohomish River delta, respectively.
• Eelgrass cover may have increased by approximately fivefold in Padilla Bay.
• Kelp has apparently increased approximately 58% in Puget Sound and the Straits. The
greatest increases in kelp distribution were documented in the most populated areas
including the Main Basin and south Puget Sound.
• Anecdotal observations indicate that eelgrass and kelp have decreased in distribution in
selected subregions of the Main Basin and south Puget Sound.
• Invading species of algae and flowering plants have had a major impact on the distribution
of eelgrass and kelp, tideflat and estuarine marsh in some subregions.
Recommendations based on the study results are as follows:
• Monitor habitats in a quantitative manner.
• Investigate causal factors related to dramatic changes in kelp distribution.
• Develop methods to quantify subtidal eelgrass distribution.
• Investigate the factors affecting eelgrass distribution, especially subtidal meadows.
• Incorporate only new quantitative habitat records into a Geographic Information System
(GIS) which includes information on water quality and physical site conditions.
vii


INTRODUCTION
The amount of coastal wetlands in the United States has decreased dramatically over the past
70-100 years (Tiner 1984). Of note is the national loss of approximately 120,000 ha of relatively
rare estuarine wetlands due to diking, dredging and filling for agriculture and port development
(Puget Sound Water Quality Authority 1986). Puget Sound has also experienced substantial loss
in the amount of estuarine wetlands for the same reasons (Boule et al. 1983). Intertidal wetlands
of Puget Sound, especially those near urban centers such as Seattle and Tacoma, have suffered
most (Bortleson et al. 1980). Loss of wetlands in this region has taken place primarily over the
past 100 years; concomitant with the period of most rapid human settlement and population
increase. Canning and Stevens (1989) estimated that 58 ha (144 acres) of estuarine wetlands were
being lost in Washington State annually.
A growing awareness of the the unique ecological role of wetlands has resulted in the passage
of federal, state, and local regulations that limit wetland destruction (Canning and Stevens 1989).
Whether the rate of loss of wetlands has occurred in response to these regulations is not known.
To date, studies of the changes in estuarine wetlands of Puget Sound have focused on
emergent marshes, tidal freshwater swamps and, to a lesser extent on, unvegetated intertidal flats
(Bortleson et al. 1980, Boule et al. 1983, Hutchinson 1988). Vegetated habitats that are wide
spread and important to Puget Sound food webs also include macroalgal beds, eelgrass meadows
and kelp forests. These latter habitats dominate nearshore areas outside of the direct influence of
the major rivers that enter Puget Sound. Fish and shellfish utilize these habitats extensively for
food and refuge, and recreational and commercial harvesting of biological resources is heavy in
these habitats (Thom 1987). Loss of eelgrass and kelp due to man's activities in Puget Sound has
occurred, yet it is not known if these habitats have suffered dramatic declines similar to tidal
marshes.
This report summarizes the the spatial extent of the wetland and nearshore plant assemblages in
Puget Sound and contrasts this with historical distributions. Analogous to this study is that of Orth
and Moore (1984) in Chesapeake Bay. Orth and Moore documented widespread changes in sub
merged aquatic vegetation (SA V) (i.e., eelgrass, water milfoil) over the past several hundred years.
Causes for recent declines in SA V may be related to increased eutrophication and turbidity (Orth
and Moore 1984, Davis 1985). Also relevant to the present study is the well-documented decline
and regeneration of the kelp forests of southern California, which has been linked to changes in
water temperature, grazing pressure and sewage pollution in that region (Harger 1983).

2
STUDY REGIONS AND HABITATS
We included in the present study the Strait of Juan de Fuca, the San Juan Islands and Puget
Sound (Fig. 1). Inclusion of the Strait and San Juan Islands provides sources of data on target
habitats from areas which have received relatively less development and disturbance from man as
compared with Puget Sound. Hence, these areas serve as the best available reference for
evaluating man-caused changes in the habitats of Puget Sound. Information on historical wetland
habitat coverage was available for the Strait, San Juan Islands and Puget Sound, although
information on all habitat types were not available from all regions.
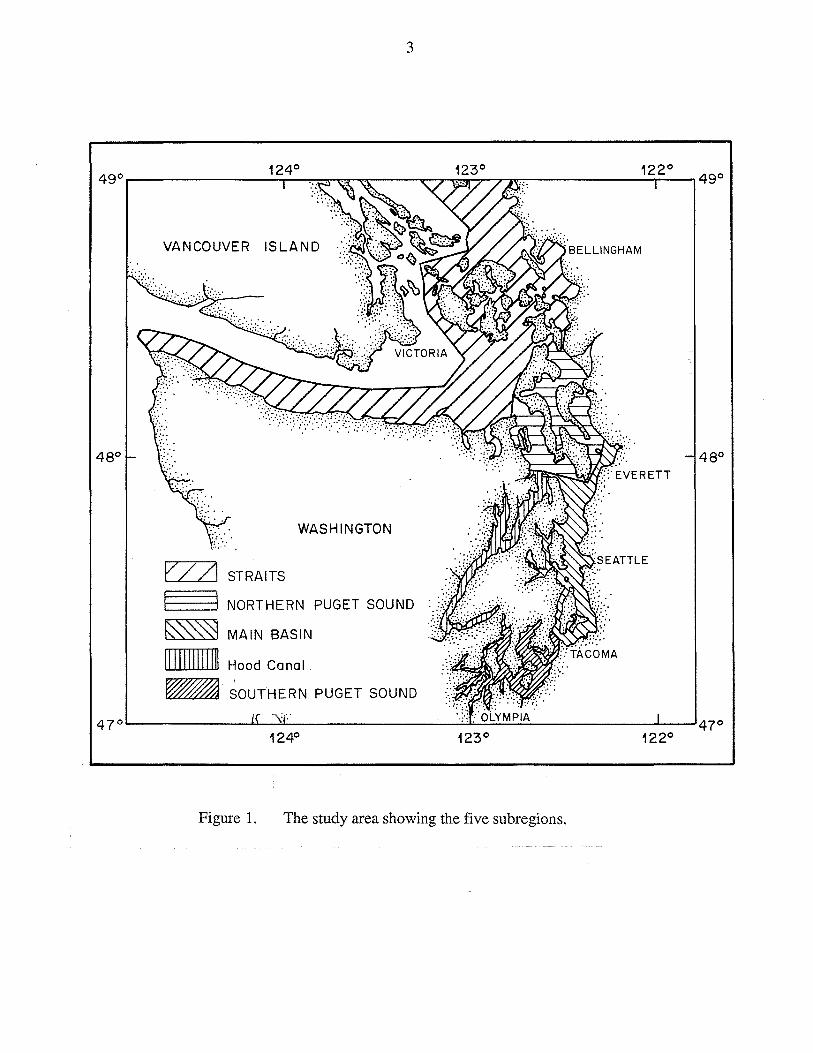
The study area is broken up into five regions: (1) the Strait, which includes the shorelines
from Cape Flattery, the San Juan Islands, and the coast north of Admiralty Inlet; (2) northern
Puget Sound, which encompasses the region of Admiralty Inlet and south to approximately the
southern tip of Whidbey Island; (3) Hood Canal; ( 4) the Main Basin, which stretches from the
southern tip of Whidbey Island (Possession Point) to Point Defiance; and, (5) southern Puget
Sound, which is the area south of Point Defiance (Fig. 1). These regions were further divided into
94 subregions for the purpose of convenience in illustrating eelgrass and kelp bed information on a
more local scale (Table 1). The divisions are geographically defined bays, islands or stretches of
shoreline. Finally, we identified 33 other areas representing points, banks, shoals and portions of
shorelines because of historical references to these specific places (Table 1).
Various schemes have been used to classify vegetated aquatic habitats. The national system
developed by Cowardin et al. (1979) has been applied to Puget Sound. This system has been
recently "regionalized" by Dethier (1989). Albright et al. (1980) utilized a more traditional scheme,
which was applied to all of Puget Sound. Here, we define estuarine wetland and nearshore habitats,
those areas included in our study, as tidally influenced shallow water areas containing macrophytic
vegetation. Although variously defined in the past, these habitats generally include tidal swamps
and marshes, seaweed beds, eelgrass meadows and kelp forests. Tidal flats (i.e., sandflats,
mudflats) containing no macroscopic vegetation, but commonly with abundant microalgae, were
also included in our analysis areas where data were available. Tidal marshes encompass salt and
brackish marshes, which contain a large number of plant species. Eelgrass meadows are formed by
the native species Zostera marina and the introduced species Zostera japonica. The brown alga
Nereocystis luetkeana forms the kelp forests in the region. We did not include other seaweed beds
in our analysis. Our classification scheme generally follows that of Albright et al. (1980).
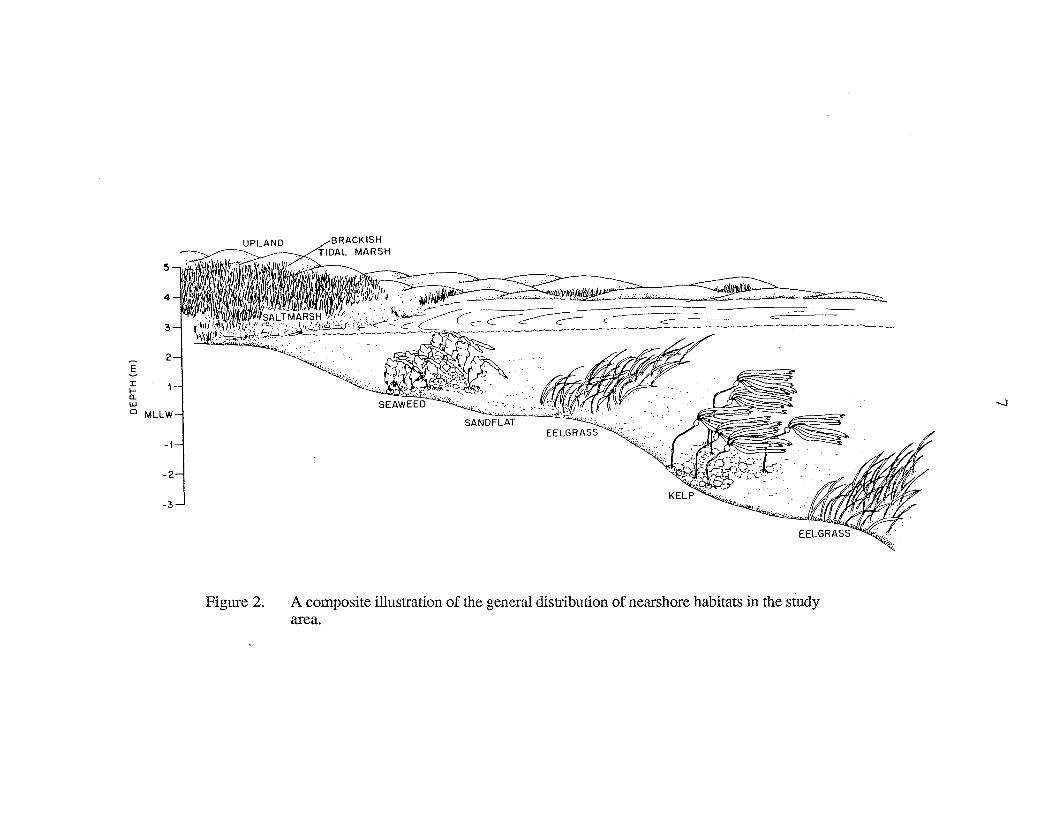
A general habitat distribution by elevation is shown in Fig. 2. Tidal swamps and marshes are
most extensively developed at the mouths of rivers that empty into Puget Sound. Due to the
relatively steep topography of much of Puget Sound's shoreline, tidal flats are either found near
river mouths or in embayments containing small streams. Seaweed beds develop on cobble,
48°
3
VANCOUVER ISLAND
V/21 I I ~~ 1111111111111
~
WASHINGTON
STRAITS
NORTHERN PUGET SOUND
MAIN BASIN
Hood Canal
SOUTHERN PUGET SOUND
48°
47o1--------.i-\~••L~-----------~~;;._ _________ .__ __ 47o 124° 122°
Figure 1. The study area showing the five subregions.

4
Table 1. Regions, subregions and total shoreline lengths.
Subregion Shoreline ser. no. Region Subregion length (m)
1 Straits Cape Flat. to Angeles Pt. 98400 2 Straits Angeles Pt. to NW entr. Sequim Bay 64000 3 Straits NW entr. Sequim Bay to Diamond Pt. 27150 4 Straits Diamond Pt. to Cape George 32250 5 Straits Cape George to McCurdy Pt. 5100 6 Straits Protection Is. 5550 7 Straits Smith Is. 675 8 Straits Mccurdy Pt. to Pt. Wilson 6150 9 Straits Pt. Roberts (US portion) 10400
10 Straits US-CAN border to Sandy Pt. 45000 11 Straits Sandy Pt. to SW tip Lummi Peninsula 15400 12 Straits Portage Is. 11000 13 Straits SW tip Lummi Penin. to William Pt. 54800 14 Straits William Pt. to Anacortes Pt. 38000 15 Straits Anacortes Pt. to Deception Pass 21000 16 Straits Lummi Is. 29000 17 Straits Eliza Is. 4800 18 Straits Hat Is. 1800 19 Straits Guemesis. 20600 20 Straits Sinclair Is. 7600 21 Straits Cyprus Is. 20200 22 Straits Burrows Is. 5520 23 Straits Alan Is. 3480 24 Straits Barnes Is. 1500 25 Straits Clarke Is. 2700 26 Straits Matia Is. 2940 27 Straits Suciais. 10680 28 Straits Patos Is. 4680 29 Straits Waldron Is. 15600 30 Straits San Juan Is. 71800 31 Straits Orcasis. 85400 32 Straits Obstruction Is. 3000 33 Straits Blakely Is. 15800 34 Straits James Is. 9480 35 Straits Decatur Is. 14200 36 Straits Lopez Is. 64000 37 Straits Center Is. 2940 38 Straits Shaw is. 22000 39 Straits Spieden Is. 8400 40 Straits Stuart Is. 18000 41 Straits Henry Is. 12000 42 Straits Crane Is. 8000 43 Straits Jones Is. 3540 44 Straits Vendovi Is. 3000 45 Straits Flattop Is. 1200 46 Straits Deception Pass to Rocky Pt. 58400 47 Straits Hope Is. 3120 48 Straits Goat Is. 2400 49 Straits Ika Is. 1920 50 Straits Deception Pass to Polnell Pt. 26000 51 Straits Deception Pass to Pt. Partridge 22900 52 Straits Swinomish Channel 20200 53 N. Sound Rocky Pt. to Camano Head 29400
5
Table 1--cont.
Subregion Shoreline ser. no. Region Subregion length (m)
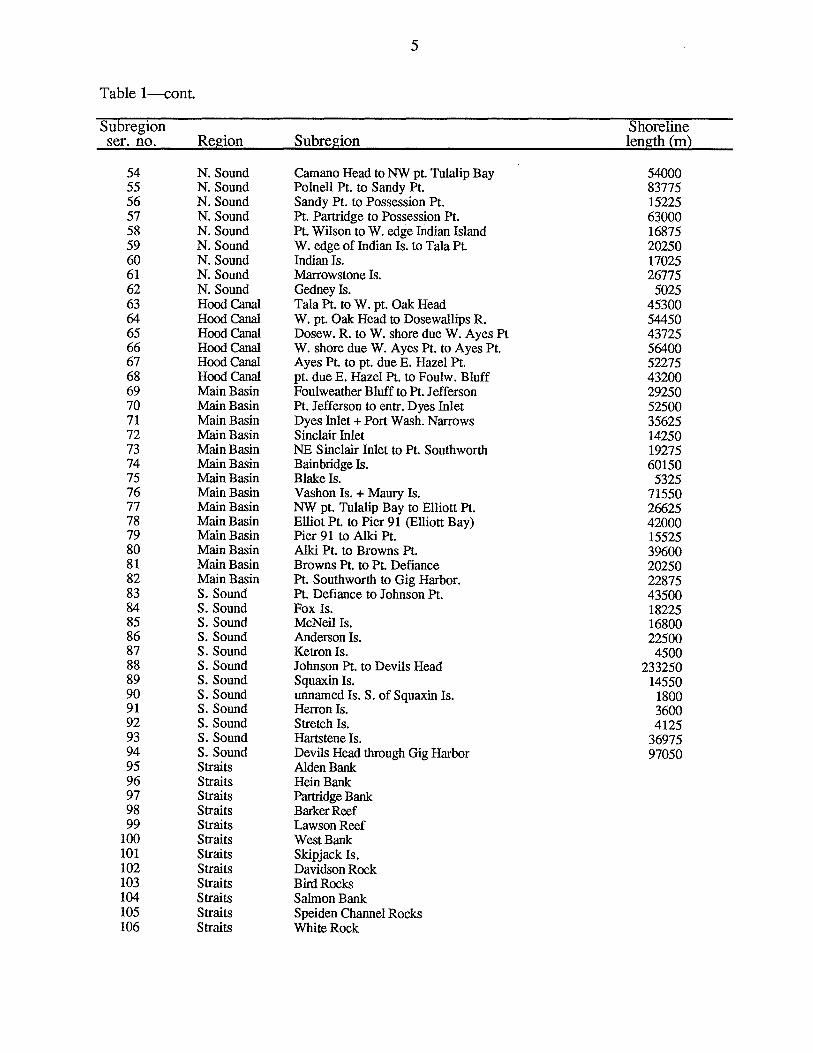
54 N. Sound Camano Head to NW pt. Tulalip Bay 54000 55 N. Sound Polnell Pt. to Sandy Pt. 83775 56 N. Sound Sandy Pt. to Possession Pt. 15225 57 N. Sound Pt. Partridge to Possession Pt. 63000 58 N. Sound Pt. Wilson to W. edge Indian Island 16875 59 N. Sound W. edge of Indian Is. to Tala Pt. 20250 60 N. Sound Indian Is. 17025 61 N. Sound Marrowstone Is. 26775 62 N. Sound Gedney ls. 5025 63 Hood Canal Tala Pt. to W. pt. Oak Head 45300 64 Hood Canal W. pt. Oak Head to Dosewallips R. 54450 65 Hood Canal Dosew. R. to W. shore due W. Ayes Pt 43725 66 Hood Canal W. shore due W. Ayes Pt. to Ayes Pt. 56400 67 Hood Canal Ayes Pt. to pt. due E. Hazel Pt. 52275 68 Hood Canal pt. due E. Hazel Pt. to Foulw. Bluff 43200 69 Main Basin Foulweather Bluff to Pt. Jefferson 29250 70 Main Basin Pt. Jefferson to entr. Dyes Inlet 52500 71 Main Basin Dyes Inlet+ Port Wash. Narrows 35625 72 Main Basin Sinclair Inlet 14250 73 Main Basin NE Sinclair Inlet to Pt. Southworth 19275 74 Main Basin Bainbridge Is. 60150 75 Main Basin Blake ls. 5325 76 Main Basin Vashon Is. + Maury Is. 71550 77 Main Basin NW pt. Tulalip Bay to Elliott Pt. 26625 78 Main Basin Elliot Pt. to Pier 91 (Elliott Bay) 42000 79 Main Basin Pier 91 to Alki Pt. 15525 80 Main Basin Alki Pt. to Browns Pt. 39600 81 Main Basin Browns Pt. to Pt. Defiance 20250 82 Main Basin Pt. Southworth to Gig Harbor. 22875 83 S. Sound Pt. Defiance to Johnson Pt. 43500 84 S. Sound Fox Is. 18225 85 S. Sound McNeil Is. 16800 86 S. Sound Anderson Is. 22500 87 S. Sound Ketron Is. 4500 88 S. Sound Johnson Pt. to Devils Head 233250 89 S. Sound Squaxin Is. 14550 90 S. Sound unnamed Is. S. of Squaxin Is. 1800 91 S. Sound Herron Is. 3600 92 S. Sound Stretch Is. 4125 93 S. Sound Hartstene Is. 36975 94 S. Sound Devils Head through Gig Harbor 97050 95 Straits Alden Bank 96 Straits Hein Bank 97 Straits Partridge Bank 98 Straits Barker Reef 99 Straits Lawson Reef
100 Straits West Bank 101 Straits Skipjack Is. 102 Straits Davidson Rock 103 Straits Bird Rocks 104 Straits Salmon Bank 105 Straits Speiden Channel Rocks 106 Straits White Rock

6
Table 1--cont.
Subregion Shoreline ser. no. Region Subregion length (m)
107 Straits Tum Rock 108 Straits rocks W. of Crane Is. 109 N. Sound Klas Rock 110 Main Basin Blakely Rocks (Bainbridge Is.) 111 S.Sound shoal S. of Gibson Pt. Fox Is. 112 Straits Pillar Pt. to Low Pt. 113 Straits Crescent Rock to Observatory pt. 114 Straits Greene Pt. to Dungeness Spit 115 Main Basin Restoration Pt. to Pt. White 116 Straits Pt. Partridge 117 N. Sound Admiralty Bay to Lagoon pt. 118 N. Sound Possession Pt. 119 N. Sound Alki Pt. 120 Main Basin Edwards Pt. 121 Main Basin Pt. Vashon 122 Main Basin Pt. Defiance 123 S. Sound Pt. Evans 124 S. Sound Gibson Pt. (Fox Is.) 125 S.Sound Brisco Pt. (Hartstene Is.) 126 S. Sound Dickenson Pt. 127 S.Sound Balch Pass (Anderson is.) 128 Main Basin Fauntleroy Cove
TOTAL(m) 2622050 Mean(m) 27894 TOTAL(km) 2622 TOTAL (miles) 1626
Total Straits (km) 1044 Total N. Sound (km) 331 Total Hood Canal (km) 295 Total Main Basin (km) 455 Total S. Sound (km) 497
5
4
3
2 E
I I-a. w 0 MLLW
-1
-2
-3
UPLAND
Figure 2.
BRACKISH MARSH
A composite illustration of the general distribution of nearshore habitats in the study area.

8
boulder and bed-rock substrata along much of the shoreline of Puget Sound. Eelgrass meadows
occur on finer unconsolidated substrata, in protected or semi-exposed areas, at elevations 1.8 m
above MLLW down to depth of as great as 30 m MLLW (Phillips 1984). Kelp forests are
confined to the shallow subtidal zone (down to a depth of approximately 10 m MLLW) in areas
where rocky substrata is available for the attachment of the haptera (holdfast) of the plants.
METHODS AND MATERIALS
SOURCES OF INFORMATION
The search for sources of information was initiated through discussions with approximately 50
State and Federal agency personnel, researchers and others familiar with Puget Sound habitats.
Literature was searched through the computerized system at the University of Washington. Ap
proximately 400 references found in the search appeared to be pertinent, and were then reviewed.
We have largely utilized published information and other documented information (e.g., aerial
photographs) in assessing the historical extent of the habitats. Our discussions with many people
revealed anecdotal information on specific sites. Some of these sites had been observed, many
times by individuals interested in waterfowl and shorebirds, over extended periods of time. These
individuals had observed changes (declines) in the extent of kelp and eelgrass which were not
related to direct disturbance ( e.g., marine dredging). These types of observations are valuable
records of habitat changes, and were the basis for the analysis of massive declines in the aquatic
vegetation of other estuaries (Orth and Moore 1984). Where appropriate below, we note anecdotal
observations but do not include these observations in calculations of quantitative changes in habitat
distributions.
Two comprehensive habitat mappings have been done for Puget Sound. The first of these, the
Coastal Zone Atlas, is a series of folio sized maps which show the distribution of major nearshore
habitats, along with soil and substrata types, land use and other information for the coastal zone of
the State. Marshes, eelgrass and kelp were mapped based on observations from aircraft, aerial
photographs, and groundtruthing. Aerial photographs were taken in 1973-74, and groundtruthing
was carried out in 1977 and 1978 (Richard Albright, pers. comm., telephone, 19 June 1989). The
objective of the Atlas was to provide regional estimates that could be used in initial habitat assess
ments of specific project sites. It was not meant to provide a method or format for routine inven
tory. The minimum polygon mapping unit for wetlands data is approximately 0.1 inch2, which
corresponds to about 1 acre. While certain data such as beach sediment composition were gathered
at a larger scale, heterogeneous areas were lumped together. The widths of boundary lines within
the Atlas are equivalent to about 50 ft at 1 :24,000 scale. Therefore, areas near boundaries must be

9
field-verified to ensure accuracy (Albright et al. 1980). The classification system used was derived
from a combination of other schemes and was further modified based on field experience. It was
hoped that the maps would be used in conjunction with the wildlife descriptions contained within
the two-volume Land Cover/Land Use Narratives published by the Washington State Department
of Ecology (WDOE) in 1980 (Albright et al. 1980).
The second comprehensive mapping was performed by the U.S. Fish and Wildlife Service
(USFWS 1987). This group produced a series of maps, referred to as the NWI (National Wetland
Inventory) maps at a scale of 1:12,000 (7.5-ft USGS quadrangle) on aquatic habitats based on
1:58,000-scale aerial photographs done in the early 1980s and limited groundtruthing. The NWI
maps are digitized for Washington State and are recognized as base maps for federal and state
inventory work. Our examination and that of Mumford et al. (1990) of these maps indicated that
estuarine marshes were generally accurately depicted, but eelgrass meadows and kelp forests were
either absent on the maps or underepresented in terms of areal extent. Mumford et al. (1990)
found that NWI maps contained only presence or absence information and did not include whether
aquatic beds were drift or attached vegetation or what types of vegetation were present.
Several significant sources of marine habitat distribution exist, including aerial photographs taken
periodically by the Seattle District Corps of Engineers. In addition, Washington Department of
Transportation and Washington Department of Natural Resources (WDNR) have aerial photographs
from many areas in Puget Sound. Photos from satellites (LANDSAT) are also available, and have
been used to map some habitats in Puget Sound (Webber et al. 1987). The difficulty with these
records is that season, tidal elevation and area of coverage vary among the records. These factors
affect the accuracy of mapping for plants that show strong seasonality in abundance or cover, and
plants that are at lower intertidal to subtidal depths (e.g., eelgrass meadows and kelp forests).
The U.S. EPA produced aerial photographs of a large portion of the Puget Sound shoreline that
were taken in May and June of 1982 (Duggan 1982). The true-color vertical photographs are pro
duced at a scale of 1 :6,000, are contained in seven folio-sized volumes, and cover the northern shore
of Fidalgo Island, a portion of the Straits (from Low Point east), the west shoreline of Admiralty
Inlet, Hood Canal, Commencement Bay and south Puget Sound. Vegetation habitat types are
outlined on acetate overlays. The vegetation/habitat types delineated include the following: forest
wetlands, shrub wetlands, marsh wetlands, mudflats, beach, rocky shore, rooted aquatics and
floating aquatics. Because the photographs were taken early in summer, kelp forests are not well
represented.
In 1988, approximately 66% of the Puget Sound shoreline was photographed by the Envi
ronmental Monitoring Systems Laboratory in Las Vegas (EMSLV, U.S. Environmental Protection
Agency (EPA)) for the purpose of developing a protocol for mapping and monitoring wetland and
nearshore habitats in Puget Sound (Mumford 1988). The protocol is being developed by WDNR

10
for the Puget Sound Ambient Monitoring Program (PSAMP). Color infrared photographs were
taken at several scales (1:12000; 1:24000; 1:36000) during minus tides in July 1988. In addition,
multispectral scanning imagery was gathered from the same areas. We relied on the aerial
photographs (9- x 9-in prints) from this survey to help verify changes at selected areas in Puget
Sound. A report on the protocol is in preparation (Mumford et al. 1990).
Tidal Marshes and Swamps
Changes in the distribution of the tidal marshes of Puget Sound have received considerable
attention. The most comprehensive early report on areal coverage of tidal marshes and swamps is
Nesbit (1885). These surveys were done to assess the amount of land that could be reclaimed for
agriculture in the region. Nesbit apparently utilized navigation maps, interviews with residents and
field observations to document the extent of the tidal marshes throughout Washington State as of
about 1883.
The most often cited reference documenting changes in tidal wetland for Puget Sound is
Bortelson et al. (1980). Bortelson et al. measured and mapped the changes in the areal cover of
tidal marshes and swamps in 11 major deltas that had taken place since the mid-late 1800s. They
used maps produced either by the U.S. Coast Survey or the U.S. Coast and Geodetic Survey
between 1884 and 1908 for the baseline data, and largely topographic maps made in the 1970s by
the U.S. Geologic Survey for present-day conditions. Bortelson et al. divided tidal wetlands into
subaerial wetlands (i.e., those wetlands landward of the general saltwater shoreline, exclusive of
intertidal wetlands) and intertidal wetlands (i.e., wetlands covered and uncovered by the daily rise
and fall of the tide; the zone between the mean high-water line and the mean low-water line along
the coast). Hutchinson (1988) made estimates of pre-European settlement and present-day cover
of tidal marshes and swamps for areas outside the 11 deltas.
Temporal trends in the changes for the Snohomish River and Puyallup River deltas were
presented by Boule' et al. (1983), and by Blomberg et al. (1988) for the Duwarnish River delta.
These latter studies utilized navigation charts containing symbols for marshes to calculate habitat
areas. Because port development has been extensive in the Snohomish, Puyallup and Duwarnish
deltas, navigation charts were available very early (e.g., 1854 for the Duwarnish) and were revised
relatively often since approximately 1900.
Owing to their importance to waterfowl, the Skagit and Stillaguarnish River deltas have been
the subject of study for over 40 years by wildlife biologists. In 1947, Jeffrey (1947) established
transects at 183-m (200-yd) intervals along the entire extent of the marsh in the Skagit and
Stillaguarnish deltas. The study area extended from Ikai Island in Skagit Bay to Warm Beach in
Port Susan. Transects were aligned along compass bearings that ran approximately perpendicular
from the landward edge to the seaward edge of the marsh. The species that occurred at each pace

11
(calibrated for distance covered) along a transect line was noted. These transects were resurveyed
using identical methods in 1974 (Brewer 1980). Maps of the vegetation distribution were made
from each survey, and the areas occupied by the marsh were calculated.
Finally, Burg (1984) illustrated the historical development of the Nisqually River delta. Her
work shows the effects of diking and agriculture on the tidal marshes and swamps in that delta.
Eelgrass Meadows
Hydrographic charts provide the earliest record of the distribution of eelgrass in Puget Sound.
The information on eelgrass was not nearly as comprehensive as that for kelp or marshes, probably
because eelgrass is not used as a navigational aid and there was no economic justification for
assessing the extent of eelgrass in Puget Sound. Furthermore, eelgrass is generally restricted to
low intertidal to shallow subtidal depths, and, therefore, is not commonly observed. The fact that
the symbols for eelgrass and kelp were combined in 1925 complicated the interpretation of histori
cal meadows (Shallowitz 1962). Many of the early navigation charts have the word "grass" or
"grs" to designate areas of eelgrass, however. We utilized this latter information for determining
historical coverage in Bellingham Bay, Padilla Bay and Snohomish delta; areas for which
nineteenth century hydrographic charts showed eelgrass meadows.
Ronald Phillips (Seattle Pacific University) conducted qualitative surveys of eelgrass at 107
sites throughout Puget Sound and Hood Canal in 1962-3. Surveys were made by boat, and the
relative density (i.e., sparse, common, dense, very dense) of eelgrass was verified by underwater
observations made by divers. In some cases, Phillips noted flowering, kelp forests and seaweeds
associated with the eelgrass. Phillips (1974) stated that nine percent of the bottom (within the
photic zone) below MLL W in Puget Sound was occupied by eelgrass.
The Washington State Department of Fisheries (WDF) manages the herring (Clupea harengus
pallasi) fishery and has conducted herring spawning surveys in Puget Sound since 1975 (Gregory
Bargman, WDF, pers. comm., May 1990). Herring spawn preferentially on eelgrass and certain
seaweed species, and WDF routinely records the vegetation type upon which spawn was found at
their survey sites. D. Pentilla of WDF (Seattle) has been involved in these surveys since 1975,
and has a comprehensive knowledge of the location of eelgrass. Pentilla was the source of
information on eelgrass distribution for WDF. Areas not surveyed or areas surveyed that had no
eelgrass were distinguished and noted.
Although eelgrass was mapped on the Coastal Zone Atlas, we found several locations where
omissions were apparent in the final maps. In particular, Padilla Bay is shown to contain eelgrass
only in the northern one-third of the Bay, with cover in the remaining portion of the Bay obviously
omitted. In addition, the dense and relatively extensive meadows of the Cherry Point region and
Lummi Bay did not appear on the Atlas maps. Eelgrass distribution was mapped by tracing the

12
distribution of meadows on mylar overlays of aerial photographs taken in 1973-1974 (William
Nelson, Washington Department of Wildlife, WDW, Vancouver, WA, pers. comm., April 1990).
Virtually all of the shoreline was groundtruthed in 1977, with the exception of the San Juan
Islands, to verify the presence of eelgrass. According to Richard Albright (Environmental Pro
tection Agency, pers. comm., 1989), the WDW project leader, only the meadows which extended
into the intertidal zone were accurately represented. In addition, some areas were not ground
truthed because of access problems (e.g., Lummi Bay). We obtained the original mylar habitat
maps from W. Nelson and compared the information on the mylars with the Coastal Zone Atlas
maps. The distribution of eelgrass according to the Coastal Zone Atlas, as supplemented by
information on the original mylar field maps, form the most comprehensive distributional informa
tion for eelgrass in the study region. Eelgrass extends into the subtidal zone, especially in areas
where water clarity is high (Phillips 1984). Therefore, the distributions based on the Coastal Zone
surveys are low.
We examined changes in eelgrass distribution for three areas for which detailed 19th century
hydrographic charts showed eelgrass: Bellingham Bay (U.S. Coast Survey, Preliminary survey of
Bellingham Bay, scale= 1:20,000, Register No. 502, August 7-11, 1855, Commander James
Alden U.S.N.), Padilla Bay (U.S. Coast and Geodetic Survey, Padilla Bay, scale= 1:20,000,
Register No. 1815, August 8 - October 28, 1887, Lieut. C.T. Forse, U.S.N.) and Snohomish
delta (U.S. Coast and Geodetic Survey, Possession Sound, scale= 1:20,000, Register No. 1728,
July 6 - September 1, 1886, Lieut. C.T. Forse, U.S.N.). Bellingham Bay and Snohomish delta
have undergone extensive port development which has affected the distribution of eelgrass. Padilla
Bay has been subject to agricultural diking landward of the eelgrass meadow, which has affected
freshwater and sediment input in that Bay. The accuracy and precision of eelgrass distribution on
these maps cannot be totally verified. However, three factors suggest that eelgrass distributions on
the maps are somewhat accurate: (1) all surveys were done during the season of maximum
standing stock of eelgrass; (2) the density of points where depths were recorded along with
substrata observations is high; and (3) relatively small (i.e., <0.1 ha) patches of eelgrass noted on
the Snohomish delta chart are present in the same location on the 1988 photographs.
A straight line was drawn to connect the outermost symbols on the hydrographic charts where
it was apparent to us that the symbols represented a contiguous eelgrass patch. As eelgrass distri
bution extends to the subtidal and may not have been easily observed by during these early sur
veys, we felt that the area enclosed by the lines was a conservative (i.e., low) estimate of the actual
area occupied by the patch. The area of each patch within each bay or delta was then measured
using a calibrated polar planimeter. For comparison, present day meadows in Snohomish delta
were determined from color infra-red aerial photographs (scale = 1 :6,000) taken during low tides
in July 1988. These 1988 photographs were used to develop the protocol for mapping and moni-

13
toring nearshore habitats in Puget Sound (Mumford et al. 1990). Photographs were not available
for Bellingham Bay. Information in the Coastal Zone Atlas and discussion with WDF biologists
(D. Pentilla, K. Fresh) indicated that little eelgrass was present in the vicinity of the Port of
Bellingham. We relied on data from Webber et al. (1987) for the eelgrass meadow in Padilla Bay.
In addition, an estimate of seagrass cover in Padilla Bay was made in 1989 using aerial photo
graphs and groundtruthing by Douglas Bulthuis (Padilla Bay Estuarine Research Reserve, Mount
Vernon, WA). The areas of the patches were determined using a polar planimeter.
The location of eelgrass as indicated on hydrographic charts between 1852 and 1899, Phillips'
notations, Coastal Zone Atlas (including information from the original mylar overlay maps), WDF
herring spawning survey information and other limited observations on eelgrass distribution were
transferred to two U.S. Department of Commerce (NOAA) navigation charts: (A) Strait of
Georgia and Strait of Juan de Puca, map no. 18400, 35th edition, Nov. 22, 1986, scale
1:200,000; and, (B) Puget Sound, map no. 18440, 18th edition, Jan. 3, 1987, scale 1:150,000.
Hereafter these maps are referred to as base maps (see Appendix 1).
The 1988 aerial photographs, WDF, Coastal Zone Atlas photographs in Duggan (1982) and
Phillips' observations indicated that early information available on eelgrass was probably not
comprehensive for Puget Sound. We did measure the length of shoreline occupied by eelgrass
meadows on the base maps based on the data from WDF and the Coastal Zone Atlas. Observa
tions by Phillips in 1962-3 are wide-spread and allow an estimate of range of distribution at that
time. The data available did not allow us to develop an estimate, comparable to that for kelp, of the
total amount of eelgrass in Puget Sound prior to the major influx of people in the 20th century.
Hence, we can only show changes in selected subregions and not for the all Puget Sound regions.
Kelp Forests
Kelp, because it is used as a navigation aid, and because of its commercial importance as a
source of potash, had an extensive amount of historical information on kelp presence. The oldest
information on kelp was found on early navigation maps (1841) made by the Wilkes expedition.
Hydrographic survey maps available as far back as 1852 (U.S. Department of Commerce, Coast
and Geodetic Survey) were examined for kelp. Those produced between 1892 and 1924 had
symbols distinguishing kelp and eelgrass (Shallowitz 1964), although the symbols were very
similar in appearance. From 1925 on, one symbol was used to represent both kelp and eelgrass.
Kelp was noted at several places in Puget Sound in the Coast Pilot, a serial publication used to aid
navigation, since its first publication late in the 1800s. Some information on the distribution of
kelp is summarized by Scagel (1957) based on collections made by phycologists.
The most comprehensive early documentation of the location of kelp forests was developed for
the Department of Agriculture (Cameron 1915) as part of the inventory of fertilizer resources of

14
North America. Surveys were made by George B. Rigg (Rigg 1915) of the entire shoreline in the
Straits of Georgia and Juan de Fuca, Puget Sound and Hood Canal by boat in September and
October of 1912, and the location of kelp was defined on maps. In addition, a density value of
plants within each forest was given. The series of nine maps (sheet numbers 1, 2, 4 to 8, 11, 14)
Rigg produced are 44 cm x 30 cm in size with a scale of 1:100,000. These maps are contained as a
portfolio separate from Cameron's (1915) narrative of the surveys and supersede three preliminary
maps, with a scale of 1 :300,000, which were based upon initial surveys conducted by Rigg in the
summer of 1911 (Senate Document no. 190, 62nd Congress, 2nd session). In August and
September of 1978, the location and areal extent of kelp forests were again mapped, this time from
the air, by the Washington Department of Wildlife (WDW). We obtained the original copies of the
navigation charts upon which WDW biologists marked kelp forests. This information was used in
developing the Coastal Zone Atlas.
A comprehensive mapping of kelp forests was carried out by WDNR in October 1989 using
aerial photographs. The region of coastline included the outer coast from Cape Flattery south a
distance of approximately 100 km, and the mainland portion of the Straits from Cape Flattery east
to Point Wilson. Protection Island was also included. The maps were produced at 1:12,000 scale
by projecting color infrared slides onto base maps of the coastline and marking the location of the
kelp canopy on the base maps. A total of 25 maps entitled the Washington Coastal Kelp Resource
maps (WCKR) were produced. According to documentation provided by WDNR (T. Mumford,
pers. comm.), very sparse (i.e., individual kelp plants) can be resolved using this imagery. In
general, the maps show kelp as small ( <1-mm diameter) specks to larger dark patches on the base
maps.
Kelp data were treated as follows. First, all records of kelp location, except the WCKR maps,
and the areal coverage of forests were transferred onto base maps (see Appendix 2). A different
symbol was used to distinguish each data set (e.g., Rigg 1911-12) on the base maps. The location
of forests as drawn on all of the 19th century hydrographic charts we reviewed was transferred
onto the base maps. We combined the data from these maps primarily because it was apparent that
surveys of shoreline areas became more detailed during the 19th century and the location of kelp
beds was among the details added to the maps. The fact that a bed was added did not mean that it
had suddenly appeared. In the case of the Coast Pilot information, only the records up until 1926
were transferred. It appeared to us that notes on kelp location were not systematically updated for
all regions for each issue of the Coast Pilot. By 1926, however, records on kelp existed for
essentially all of Puget Sound. We, therefore, arbitrarily defined 1926 as the cutoff year for com
parisons of old (pre-1927) records. New (post-1926) records using the Coast Pilot information
was taken from the 1951 publication.

15
We utilized the two comprehensive kelp surveys to quantify changes in kelp distribution. To
do this, we measured the length of shoreline spanned by kelp within the regions of Puget Sound
using distributions on maps produced by Rigg in 1911 and 1912 and the 1978 WDW survey (see
above). In most cases, kelp formed a linear band that followed the contour of the shoreline. In
cases (e.g., Hein Bank) where the forest shape was approximately circular, we recorded the widest
dimension. In addition, we measured the shoreline spanned by kelp in the WCKR maps from
1989.
Finally, for locations where either large differences (i.e., >50%) were found between records
made in 1911-12 and 1978 in subregions 1-94 or between early chart records and modern records
for other subregions, observations on the location of kelp were checked against available aerial
photographs taken in 1982 (Duggan 1982) and 1988 by EPA (Mumford et al. 1990).
INTRODUCED SPECIES
Spartina spp.
Cordgrass (Spartina spp.) was transplanted into several river deltas in Washington for the
purpose of stabilizing dikes and for duck habitat (Parker and Aberle 1979). Much of this planting
was done during the 1940s. Since then, Spartina has spread and may adversely affect the distri
bution of native marsh tax.a (e.g., Scirpus spp.). We summarize what is presently known regard
ing the distribution of Spartina in Puget Sound. At present there is an interagency task force
established to develop information on Spartina and to investigate ways to manage it (T. Mumford,
pers. comm., WDNR, 1989). A map of the locations where Spartina spp. has been documented
was provided by T. Mumford. B. Aberle provided a summary of distribution as of 1990 (letter
dated October 23, 1990 to M. Rylko).
Zostera iaponica
Zostera japonica was introduced to the northwest through the importation of oyster seed. The
first report from the United States was in Willapa Bay in 1956 (Harrison 1976). This annual
species generally is found on mudflats at tidal elevations overlapping, but generally higher than,
the native perennial eelgrass Z. marina (Harrison 1976, Thom 1990). Competition for space does
occur between the two species (Harrison 1982). The ecology of the noh-native species is just
beginning to be studied. Hence, concern among biologists about the effects of the invader on our
native systems has not developed to the degree it has regarding Spartina.
Only limited data exists on the spread of Z. japonica in Puget Sound. This species has been
observed as far south as the Snohomish delta (Thom, pers. observation) where it forms small
patches. Z.japonica forms extensive stands in Padilla Bay (Webber et al. 1987) and Drayton
Harbor (Thom et al. 1989). This species has not been observed in southern Puget Sound.

16
Sargassum muticum The brown seaweed Sargassum muticum was introduced to British Columbia and Washington
with the importation of oyster seed from Japan in approximately 1902 (Scagel 1957). This species
has gained world-wide attention because it has displaced other prominent native seaweed species
because of its invasive characteristics (Norton 1977).
The first report of Sargassum in Washington waters was from Rocky Bay and Andrews Bay,
San Juan Island, in 1955 (Scagel 1957). There, were indications that this species was also present
in Hood Canal and Willapa Bay at this time (Scagel 1957). Sargassum has invaded Puget Sound,
although not much is known regarding the pattern of spread throughout the region. Studies by
Phillips and Fleenor (1970) in Hood Canal, Harlin (1969) at Steamboat Island in southern Puget
Sound and the notes of Phillips from 1962-63 indicate the widespread distribution of Sargassum in
the region.
The primary concern here is that Sargassum has displaced N. luetkeana, Z. marina and other
species, primarily in the low intertidal and shallow subtidal zone (De Wreede 1978). Quantitative
data on the percent cover of seaweeds along a rocky intertidal transect at Alki Point have been taken
in May for most years between 1979 and 1989 (Thom, unpublished data). These data are summar
ized here to show the influence of S. muticum on the distribution of N. luetkeana at that site.
Sargassum requires bare space for initial colonization (De Wreede 1978). Harvesting of seaweeds,
in particular Nereocystis, in the study area may have hastened the decline of kelp and the spread of
Sargassum at this site.
RESULTS
TIDAL MARSHES AND SW AMPS
On the basis of the surveys in the 1880s by Nesbit (1885), tidal marshes and swamps in the
1880s covered a total of 26,792 ha in 7 of the 9 counties bordering Puget Sound (Table 2). Nesbit
estimated that less than 405 ha (1,000 ac) of land which would normally be submerged at high
tides was diked prior to his survey. The original Skagit-Stillaguamish tidelands covered approxi
mately 520 km2 (200 mi2) within 20 km (12 mi) of the present shoreline. Swinomish tide marsh
flats, now behind dikes, was 14.5 km (9 miles) long connecting the Skagit delta with Padilla Bay.
The tide marshes greatly exceeded the tide flats in area on Puget Sound. Nesbit noted that several
rivers including the Skagit, Nooksack, White, Puyallup and Nisqually carried extensive glacial
sediments during periods of heavy runoff. These sediments were responsible for maintaining and
pro grading the deltas and marshes. Nesbit estimated that freshwater marshes of the Puget Sound
area were 3-4 times as great in extent as compared to the tide marshes.

17
Table 2. Area of tidal marshes and swamps and linear length of dikes in counties bordering Puget Sound in 1883 (from Nesbit 1885). (-- = no data)
Tideland County Area (ha) Dikes (mi)
Pierce 2,590 King 486 6 Snohomish 7,285 37 Skagit 12,950 150 Whatcom 1,619 Island 1,619 6 San Juan 243 Total 26792
Hydrographic maps from the era of Nesbit's survey for eleven deltas in the study region when
contrasted with recent maps indicated substantial changes in wetland distribution in several deltas.
Intertidal wetland area had decreased from 7%-100% in 6 of the 8 deltas for which both old and
recent data existed (Table 3). The most urbanized deltas (i.e., Snohomish, Duwarnish and
Puyallup Rivers) had the greatest decline, and the least urbanized (i.e., Dungeness and Nooksack)
showed increases in area (Table 3). Subaerial wetlands (i.e., those wetlands landward of the
general saltwater shoreline, exclusive of intertidal wetlands) in 8 of the 11 deltas decreased in area,
with percentage decreases of 17%-100% (Table 4). Again, non-urbanized deltas showed increases
in subaerial wetlands, and highly urbanized deltas showed the greatest losses. On the basis of data
from Bortelson et al. (1980) plus data on other areas of Puget Sound as summarized by Hutchin
son (1988), total subaerial wetland area in the deltas has decreased by 73% since the late 1800s.
There appears to be differences in tidal marsh and swamp area estimates made by Bortelson et
al. (1980) and Nesbit (1885), especially for the Duwamish River (Tables 2, 4). Of Nesbit's
estimate of 486 ha for King county, the Duwarnish marshes account for 405 ha. In comparison,
Bortelson et al. reported 260 ha. These, and perhaps other discrepancies, may be partially
explained by the fact that different maps were used to produce the estimates and that interpretations
of habitat on historical maps can be speculative. Nesbit had the benefit of groundtruthing the areas
in the mid-1880s. However, his interpretation of the boundaries and definitions of tidal marshes
are also subject to speculation.
Most of the tidal wetland losses in the three most urbanized deltas took place between about
1910 and 1950 (Figs. 3-5). In the Snohomish delta, Boule et al. (1983) found that most of the
losses occurred prior to 1940, and a slight increase occurred between 1940 and 1960 due to marsh
establishment in previously unvegetated areas (Fig. 3). Tidal swamps, marshes and flats exhibited
dramatic declines in the Duwarnish River delta between 1910 and 1940 (Fig. 4). There has been a
continued decline in these habitats in that delta since 1940. Unvegetated flats were initially lost

18
Table 3. Comparison of historical and present day intertidal wetland areas in major river deltas (from Bortelson et al. 1980). (--=no data)
Area(km2) Change River Delta Historical Present Area (km2) Percent
Nooksack 6.7 8.5 +1.8 +26.9 Lummi 14.0 13.0 -1.0 -7.1 Samish 15.0 Skagit 55.0 Stillaguamish 20.0 Snohomish 13.0 8.8 -4.2 -32.3 Duwamish 8.5 0.0 -8.5 -100.0 Puyallup 7.4 0.1 -7.3 -98.6 Nisqually 7.4 5.8 -1.6 -21.6 Skokomish 5.0 4.5 -0.5 -10.0 Dungeness 5.9 6.0 +0.1 +1.7
Total 8 of 11 deltas 67. 9 46.7 -21.2 -31.2 11 of 11 deltas -- 136.7
Table 4. Comparison of historical and present subaerial wetland areas in major river deltas according to Bortelson et al. 1980. Data on other areas from Hutchinson (1988). Values in parentheses indicate wetland area estimated to exist prior to dike construction and prior to the initial C&GS topographic surveys (Bortelson et al. 1980).
Area (km2) Change River delta Historical Present Area (km2) Percent
Nooksack 4.5 4.6 +0.1 +2.2 Lummi 5.8 0.3 -5.5 -94.8 Samish 1.9 (11) 0.4 -1.5 (-10.6) -79.0 (-96.4) Skagit 16.0 (29) 12.0 -4.0 (-17.0) -25.0 (-58.6) Stillaguamish 3.0 (10) 3.6 +0.6 (-6.4) +20.0 (-64.0) Snohomish 39.0 10.0 -29.0 -74.4 Duwamish 2.6 0.03 -2.57 -98.8 Puyallup 10.0 0.0 -10.0 -100.0 Nisqually 5.7 4.1 -1.6 -28.1 Skokomish 2.1 1.4 -0.7 -33.3 Dungeness 0.5 0.5 0.0 0.0 Other areas 3.0 2.5 -0.5 -16.7
Total 94.1(144.1) 39.4 -54.7(-88.7) -58.1(-72.7)

SNOHOMISH RIVER ESTUARY (X 1000)
5
4 ,....
CJ ..c "-'
3 < lJ.J 0::: < ......
\0
:::r:: 2 en 0::: < ~
1
0
1900 1940 1980 1880 1920 1960 2000
YEAR Figure 3. Changes in wetland area in the Snohomish River estuary (from Boule et al. 1983).

,..,. 0
..c '-"'
< w a::: <
(X 100)
16
12
8
4
0
DUWAMISH RIVER ESTUARY -a- TOTAL + MARSHES ·* FLATS B SWAMPS
1870 1910 1950 1990 1850 1890 1930 1970
YEAR
Figure 4. Changes in tidal marshes and swamps, unvegetated shallows and flats and total wetland area in the Duwamish River estuary (from Boule et al. 1983).
N 0

< w et: <
(X 100)
18
15
12
9
6
3
0
+---- ----
PUYALLUP RIVER ESTUARY
--
-e- TOTAL + MARSHES ·* FLATS
-----k * '
1900 1880
' ' ' ' ' )If · · · · · · ~---:-.--:- ,.,_---+-
1940 1980 1920 1960
YEAR
2000
Figure 5. Changes in vegetated wetland, unvegetated flats and total wetland area in the Puyallup River estuary (from Boule et al. 1983).
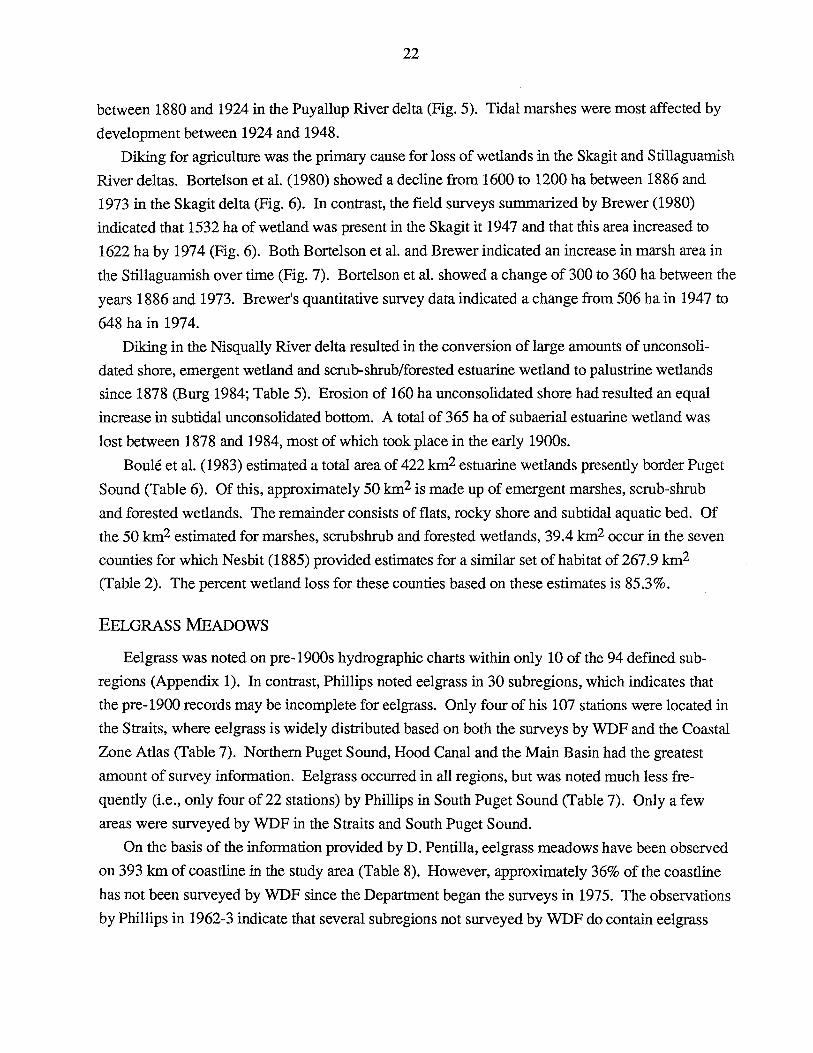
22
between 1880 and 1924 in the Puyallup River delta (Fig. 5). Tidal marshes were most affected by
development between 1924 and 1948.
Diking for agriculture was the primary cause for loss of wetlands in the Skagit and Stillaguamish
River deltas. Bortelson et al. (1980) showed a decline from 1600 to 1200 ha between 1886 and
1973 in the Skagit delta (Fig. 6). In contrast, the field surveys summarized by Brewer (1980)
indicated that 1532 ha of wetland was present in the Skagit it 1947 and that this area increased to
1622 ha by 197 4 (Fig. 6). Both Bortelson et al. and Brewer indicated an increase in marsh area in
the Stillaguamish over time (Fig. 7). Bortelson et al. showed a change of 300 to 360 ha between the
years 1886 and 1973. Brewer's quantitative survey data indicated a change from 506 ha in 1947 to
648 ha in 1974.
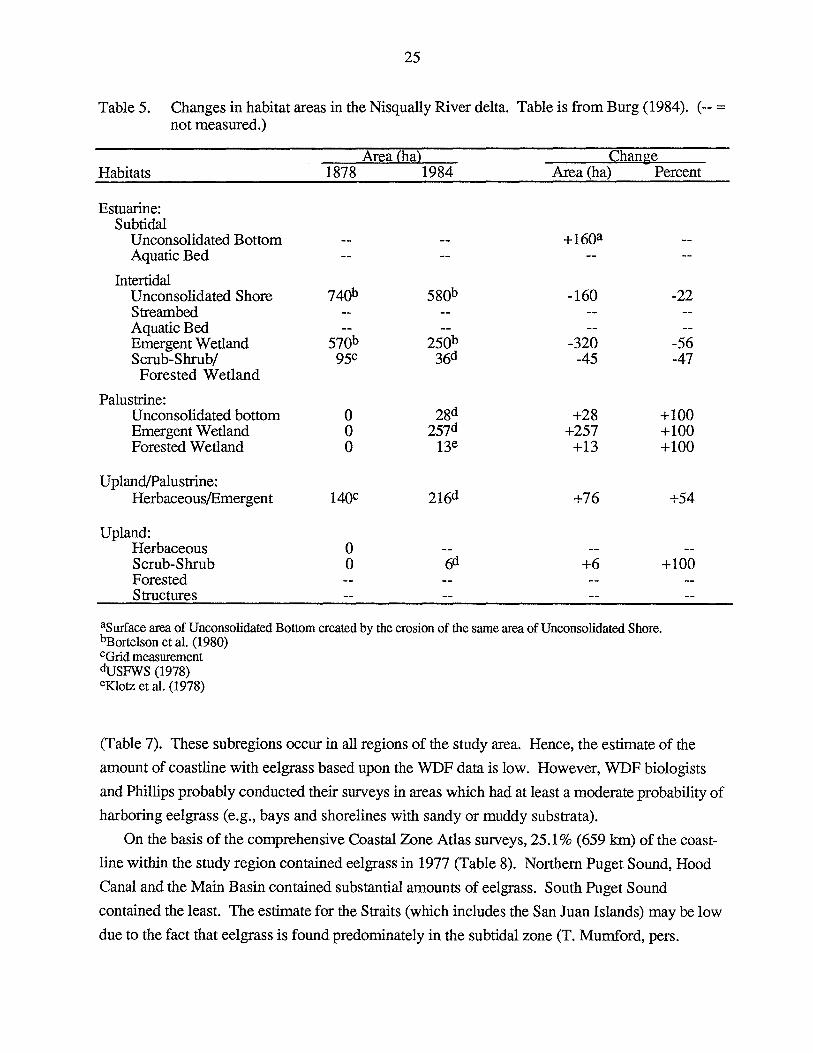
Diking in the Nisqually River delta resulted in the conversion of large amounts of unconsoli
dated shore, emergent wetland and scrub-shrub/forested estuarine wetland to palustrine wetlands
since 1878 (Burg 1984; Table 5). Erosion of 160 ha unconsolidated shore had resulted an equal
increase in subtidal unconsolidated bottom. A total of 365 ha of subaerial estuarine wetland was
lost between 1878 and 1984, most of which took place in the early 1900s.
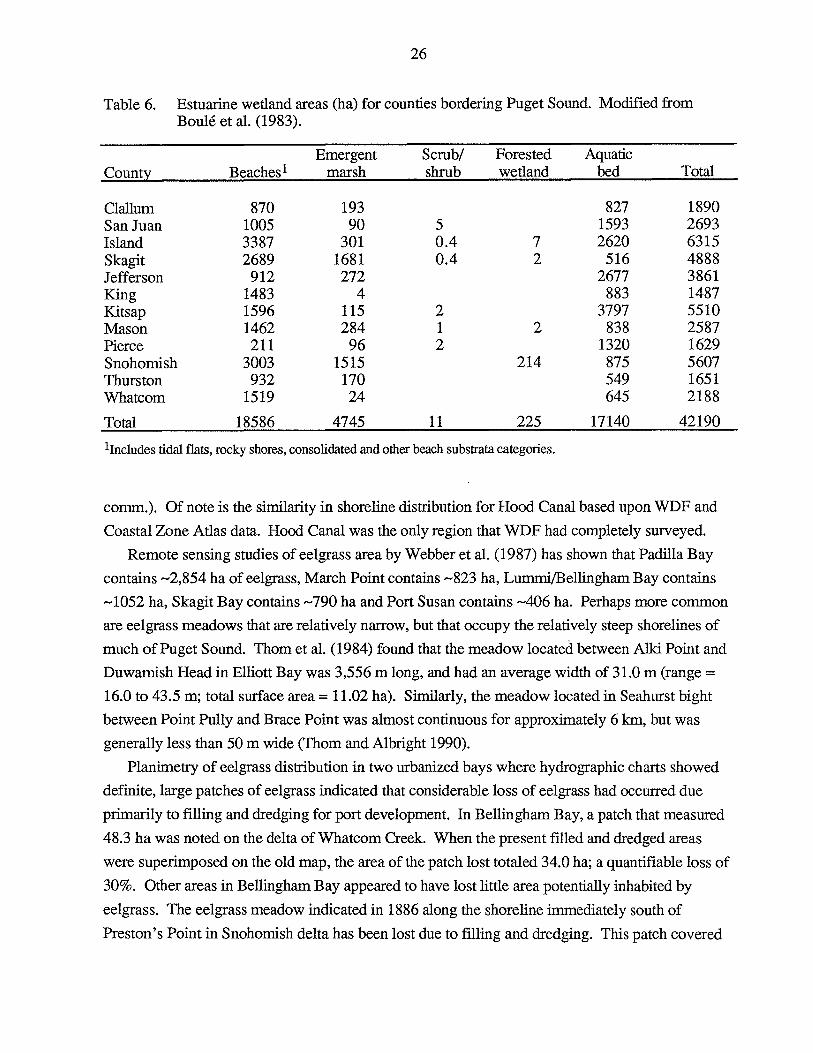
Boule et al. (1983) estimated a total area of 422 km2 estuarine wetlands presently border Puget
Sound (Table 6). Of this, approximately 50 km2 is made up of emergent marshes, scrub-shrub
and forested wetlands. The remainder consists of flats, rocky shore and subtidal aquatic bed. Of
the 50 km2 estimated for marshes, scrubshrub and forested wetlands, 39.4 km2 occur in the seven
counties for which Nesbit (1885) provided estimates for a similar set of habitat of 267 .9 km2
(Table 2). The percent wetland loss for these counties based on these estimates is 85.3%.
EELGRASS MEADOWS
Eelgrass was noted on pre-1900s hydrographic charts within only 10 of the 94 defined sub
regions (Appendix 1). In contrast, Phillips noted eelgrass in 30 subregions, which indicates that
the pre-1900 records may be incomplete for eelgrass. Only four of his 107 stations were located in
the Straits, where eelgrass is widely distributed based on both the surveys by WDF and the Coastal
Zone Atlas (Table 7). Northern Puget Sound, Hood Canal and the Main Basin had the greatest
amount of survey information. Eelgrass occurred in all regions, but was noted much less fre
quently (i.e., only four of 22 stations) by Phillips in South Puget Sound (Table 7). Only a few
areas were surveyed by WDF in the Straits and South Puget Sound.
On the basis of the information provided by D. Pentilla, eelgrass meadows have been observed
on 393 km of coastline in the study area (Table 8). However, approximately 36% of the coastline
has not been surveyed by WDF since the Department began the surveys in 1975. The observations
by Phillips in 1962-3 indicate that several subregions not surveyed by WDF do contain eelgrass

CX
,...... 0 .c '-"'
< w 0:::: < I (f) 0::: < :::r:
SKAGIT RIVER DELTA 100) -e- B0RTELS0N
+ BREWER 18
16
14
12
10
8
6
4
2
0
+-----+
1900 1940 1980 1880 1920 1960
YEAR
6. Changes in the tidal marsh area of the Skagit River according to Bortelson et al. (1980) and Brewer (1980).

r-. a
.r::. """ < w 0:::: < J: U') 0:::: < ::E:
800
600
400
200
0
1880
STILLAGUAMISH RIVER DELTA
-¥/
1900 1940 1920
YEAR
/ /
-e- B0RTELS0N + BREWER
.....-* /
1980 1960
Figure 7. Changes in the tidal marsh area of the Stillaguamish River according to Bortelson et al. (1980) and Brewer (1980).
N +:>,
25
Table 5. Changes in habitat areas in the Nisqually River delta. Table is from Burg (1984). (-- = not measured.)
Habitats
Estuarine: Subtidal
Unconsolidated Bottom Aquatic Bed
Intertidal Unconsolidated Shore Streambed Aquatic Bed Emergent Wetland Scrub-Shrub/
Forested Wetland
Palustrine: Unconsolidated bottom Emergent Wetland Forested Wetland
Upland/Palustrine: Herbaceous/Emergent
Upland: Herbaceous Scrub-Shrub Forested Structures
Area (ha) 1878 1984
740b
570b 95c
0 0 0
140C
0 0
580b
Change Area (ha) Percent
+16()a
-160
-320 -45
+28 +257
+13
+76
+6
-22
-56 -47
+100 +100 +100
+54
+100
asurface area of Unconsolidated Bottom created by the erosion of the same area of Unconsolidated Shore. bBortelson et al. (1980) cGrid measurement dusFWS (1978) eKlotz et al. (1978)
(Table 7). These subregions occur in all regions of the study area. Hence, the estimate of the
amount of coastline with eelgrass based upon the WDF data is low. However, WDF biologists
and Phillips probably conducted their surveys in areas which had at least a moderate probability of
harboring eelgrass (e.g., bays and shorelines with sandy or muddy substrata).
On the basis of the comprehensive Coastal Zone Atlas surveys, 25.1 % (659 km) of the coast
line within the study region contained eelgrass in 1977 (Table 8). Northern Puget Sound, Hood
Canal and the Main Basin contained substantial amounts of eelgrass. South Puget Sound
contained the least. The estimate for the Straits (which includes the San Juan Islands) may be low
due to the fact that eelgrass is found predominately in the subtidal zone (T. Mumford, pers.
26
Table 6. Estuarine wetland areas (ha) for counties bordering Puget Sound. Modified from Boule et al. (1983).
Emergent Scrub/ Forested Aquatic County Beaches1 marsh shrub wetland bed Total
Clallum 870 193 827 1890 San Juan 1005 90 5 1593 2693 Island 3387 301 0.4 7 2620 6315 Skagit 2689 1681 0.4 2 516 4888 Jefferson 912 272 2677 3861 King 1483 4 883 1487 Kitsap 1596 115 2 3797 5510 Mason 1462 284 1 2 838 2587 Pierce 211 96 2 1320 1629 Snohomish 3003 1515 214 875 5607 Thurston 932 170 549 1651 Whatcom 1519 24 645 2188
Total 18586 4745 11 225 17140 42190
lJncludes tidal flats, rocky shores, consolidated and other beach substrata categories.
comm.). Of note is the similarity in shoreline distribution for Hood Canal based upon WDF and
Coastal Zone Atlas data. Hood Canal was the only region that WDF had completely surveyed.
Remote sensing studies of eelgrass area by Webber et al. (1987) has shown that Padilla Bay
contains ~ 2,854 ha of eelgrass, March Point contains ~823 ha, Lummi/Bellingham Bay contains
~ 1052 ha, Skagit Bay contains ~ 790 ha and Port Susan contains ~406 ha. Perhaps more common
are eelgrass meadows that are relatively narrow, but that occupy the relatively steep shorelines of
much of Puget Sound. Thom et al. (1984) found that the meadow located between Alki Point and
Duwamish Head in Elliott Bay was 3,556 m long, and had an average width of 31.0 m (range =
16.0 to 43.5 m; total surface area= 11.02 ha). Similarly, the meadow located in Seahurst bight
between Point Pully and Brace Point was almost continuous for approximately 6 km, but was
generally less than 50 m wide (Thom and Albright 1990).
Planimetry of eelgrass distribution in two urbanized bays where hydrographic charts showed
definite, large patches of eelgrass indicated that considerable loss of eelgrass had occurred due
primarily to filling and dredging for port development. In Bellingham Bay, a patch that measured
48.3 ha was noted on the delta of Whatcom Creek. When the present filled and dredged areas
were superimposed on the old map, the area of the patch lost totaled 34.0 ha; a quantifiable loss of
30%. Other areas in Bellingham Bay appeared to have lost little area potentially inhabited by
eelgrass. The eelgrass meadow indicated in 1886 along the shoreline immediately south of
Preston's Point in Snohomish delta has been lost due to filling and dredging. This patch covered

27
Table 7. Eelgrass distributions by subregion. ND = not determined; blanks indicate no inf onnation.
Es;lgra~~ di~tribnlfon CZ atlas WDF
Subregion Phillips Phillips (1962-1963) Phillips shoreline shoreline ser. no. sta. no. abbreviated station names observations length (m) length (m)
1 2000 3500 2 8000 13000 3 13500 12000 4 18500 15000 5 0 ND 6 0 ND 7 0 ND 8 3500 ND 9 0 6200
10 23500 34000 11 8000 15000 12 0 8500 13 19500 8500 14 27000 27000 15 3500 16 6000 7500 17 0 18 0 19 11000 ND 20 2500 ND 21 800 ND 22 0 ND 23 0 ND 24 0 ND 25 0 ND 26 300 ND 27 3000 ND 28 2000 ND 29 5000 ND 30 14500 ND 31 15000 11000 32 500 2400 33 2000 ND 34 300 ND 35 800 1200 36 18000 8000 37 400 ND 38 4500 5500 39 0 ND 40 1500 ND 41 4500 3500 42 600 ND 43 600 ND 44 0 ND 45 0 ND 46 D-78 in Similk Bay, west shore very sparse 8000 7000 47 0 48 500 49 D-77 SE tip of IKA Is. none 0

28
Table 7--cont.
E~lgra~~ Qi~trib:utiQn CZ atlas WDF
Subregion Phillips Phillips (1962-1963) Phillips shoreline shoreline ser. no. sta. no. abbreviated station names observations length (m) length (m)
50 D-95 Coronet Bay dense 13000 17500 D-79 just S. Pt. Hoypus, Whidbey Is. common D-75 just E. Polnell Pt., Whidbey Is. none
51 D-93 Partridge Pt., Whidbey Is. none 500 ND 52 0 ND 53 8000 1500 54 D-47 just off Camano Head none 20000 5250
D-42 S. side Kayak Pt. luxuriant 55 D-70 Penn Cove dense, subtidal 32500 12000
D-71 North Bluff, E. side Whidbey Is. present ND D-72 S. side Dines Pt., Whidbey Is. none ND D-45 S. side East Pt., Whidbey Is. present ND
56 D-44 S. side Sandy Pt, Whidbey Is. very sparse 7500 ND D-43 Betw. Columbia Bch and Clinton none ND
57 D-67 just N. Lagoon Pt., Admiralty Bay patchy 26000 ND D-68 just S. Bush Pt very dense ND D-69 off Austin, Mutiny Bay very abundant ND BD-5 Useless Bay very dense ND
58 D-80 betw. Pt. Wilson and Pt. Hudson dense, continuous 11500 2500 D-82 N. side Kala Pt. patchy, sparse
59 D-83 upper Oak Bay, S. oflndian Is. patchy 600 1350 D-84 N. side Olele Pt. dense
60 6000 7500 61 D-81 Mystery Bay, N. side Kilisut Hbr. dense 23000 8250 62 D-48 E. side Gedney Is. common, not dense 0 63 BD-6 just S. Tala Pt. dense 24500 8250
D-89 just S. of South Pt., Hood Canal patchy, but dense 64 D-91 just N. of ?Tskutsko Pt. (Oak Head) patchy 15500 23250
D-92 Duckabush dense 65 D-4 betw. Potlatch and Hoodsport very sparse 5000
D-5 off Potlatch very dense 66 13500 34500 67 D-90 near (NE) Lone Rk, S. of Hazel Pt. continuous but not dense 19000 9000 68 D-87 across from Port Gamble continuous but not dense 26500 21000
D-88 Salsbury Pt., at Hood C. bridge dense, subtidal 68 D-97 Kitsap Memorial St. Pk. patchy
D-98 SW comer Foulweather Bluff dense 69 D-86 Skunk Bay dense 15000 70 D-25 N. edge of sand bar, Miller Bay dense 5500 12000
D-26 Agate Pass, W. side, just N. bridge sparse D-27 Liberty Bay, N. side at Poulsbo none D-28 N. shore of inlet to Liberty bay dense D-29 in Port Orchard, just S. Brownsville none
71 D-35 Dyes Inlet, near Tracyton dense 300 72 D-34 SW end Sinclair Inlet, near Garst none 0 73 D-30 Clam Bay, just N. of Middle Pt. dense 7500 2625
D-31 Yukon Hbr, at Colby none D-33 cove just N. Port Orchard sparse
74 D-16 Decatur Reef, off Restoration Pt. none 20500 13875 D-17 S. shore Blakely Hbr. none

29
Table 7--cont.
Eelgra~s di~tribytiQn CZ atlas WDF
Subregion Phillips Phillips (1962-1963) Phillips shoreline shoreline ser. no. sta. no. abbreviated station names observations leng!h {m2 length {m2
74 D-19 Decatur reef, off Restoration pt. very sparse D-20 immed. S. Pt. Monroe, Bainbridge Is. very patchy D-22 just W. Skiff Pt. none
75 D-18 N. side Blake Is. dense in patches 3500 3900 76 D-7 off Ellisport, Vashon Is. dense 34500 7875
D-32 Fem Cove, Vashon Is. none D-36 N. side Beals Pt., Vashon Is. rare D-37 N. of Neill Pt., Vashon Is. sparse D-38 Just N. Pt. Sandford, Vashon Is. abundant but not dense
77 D-41 Tulalip Bay, E. shore sparse and patchy 4000 1125 78 BD-7 CarkeekPk. dense 19500 12000
BD-8 just N. Edmonds ferry dock dense D-8 off 194th Pl., Richmond Bch. patchy D-13 adj. to N. side Edmonds ferry dock dense D-21 S. side of Elliott Pt. present
79 BD-1 just N. Alki Pt. moderately dense 2000 ND D-23 immed. N. Alki Pt. dense D-24 Duwamish Head dense, subtidal
80 D-1 ca .. 25mi. SE Alki Pt. moderately dense 18500 ND D-2 off S. tip Lincoln Pk nr. ferry dk. sparse D-3 immed. E. Pulley Pt. patchy, dense D-6 Poverty Bay, near Zenith patchy, dense D-9 immed. E. of pier at Dash Pt. dense D-99 Seahurst Pk. patchy, dense
81 D-10 Owen Bch., Pt. Defiance, NE section sparse, large plants 1000 82 D-39 at Fragaria, on Peninsula, Colvos abundant 14000 83 D-11 nr Day Is. Yacht Club very dense 2700
D-15 off ferry dock, Stielacoom sparse but large plants D-55 Nisqually Flats none
84 D-49 E. side Fox Is., across from Sylvan none 3500 85 D-53 just N. Still Hbr., McNeil Is. none 0 86 D-54 Oro Bay, nr Vega, Anderson Is. none 0 87 1200 88 D-14 off Dickerson Pt. none 800
D-56 Taylor Bay, acer. from Hartstene Is. none D-58 Vaughn Bay, nr Vaughn none D-60 cove inside Graham Pt. none D-61 off Libby Pt., Hammersley Inlet none D-63 Totten Inlet none D-64 Eld Inlet none D-65 near Gull Hbr, Budd Inlet none
89 D-62 inside Potlatch Pt., Squaxin Is. none 0 D-66 E. side Squaxin Is. none
90 0 91 0 92 0 93 D-57 S. of Dougall Pt., Hartstene Is. none 0
D-59 Gerald Cove, Hartstene Is. none 94 D-40 GigHbr. none 17000 1000
D-50 cove nr Arletta, W. end Hale Pass. sparse D-51 just S. of Raft Is. none D-52 cove inside South Head 12atchi

30
Table 8. Length of shoreline occupied by eelgrass based on surveys by Washington Department of Fisheries (D. Pentilla pers. communication) and by the Washington Department of Wildlife for the Coastal Zone Atlas (CZA). Total coastline lengths for each region are given in parentheses. The percent of coastline surveyed by WDF is shown in parentheses under eelgrass distribution.
WDF 0975-1989) CZA 0977} Region Eelgrass Coastline
distribution with eelgrass Eelgrass Coastline
distribution with eelgrass (km) (%) (km) (%)
Straits 206 19.8 243 23.3 (1044 km) (80%)
N. Sound 38 11.6 141 42.4 (331 km) (55%)
Hood Canal 96 32.5 104 35.2 (295 km) (~100%)
Main Basin 53 11.7 146 32.1 (455 km) (78%)
S. Sound ~O 25 5.1 (497 km) (~0%)
Total 393 15.0 659 25.1 (2,622 km) (64%)
61. 7 ha in 1886. Eelgrass was also indicated on the northern edge of the delta and due west of
Preston's Point. These patches were still present in the 1988 infrared aerial photographs. In
addition, the location of two narrow patches, each about 200- to 300-m long in the north channel
just inside ( east) of Priests Point in 1886, was indicated in the 1886 map. Jetty Island, constructed
with dredged material, is located on the former site of small eelgrass patches. The presence of
eelgrass in virtually the same location in the 1886 map and in the 1988 photographs indicates that
the 1886 maps reliably document at least the major eelgrass patches in the delta. Driscoll (1978)
estimated that 40% ( 465 ha) of the Snohomish delta was covered by eelgrass. In all, a minimum
of about 15% of the eelgrass area probably has been lost in the delta over the past 100 years due to
filling and dredging.
About 598 ha of eelgrass is indicated on the 1887 chart for Padilla Bay. Roughly 475 ha are
located in the northern portion of the Bay (i.e., north of the southern tip of Hat Island), and 123 ha
were located in the southern portion of the Bay. The 1986 estimate of eelgrass (Z. marina + Z.
japonica) area in the Bay is approximately 2,854 ha based on the study of Webber et al. (1987).
Hence, a 4.8-fold increase in Zostera is indicated. According to an 1989 estimate made using

31
aerial photographs and groundtruthing by Douglas Bulthuis (Padilla Bay Research News vol. 2,
no. 1, Padilla Bay Estuarine Research Reserve, Mount Vernon, WA), Padilla Bay contained 2300
ha of eelgrass. We estimate that about one third of the present stand of eelgrass in the Bay is
comprised of the recent invader Z. japonica. The soundings and substrata notes on the 1887 chart
are spatially very close together (i.e., within approximately 50-100 m), and cover the entire bay,
suggesting that the surveys were very comprehensive. In addition, the season of the survey
(August-October) corresponds with the peak biomass of eelgrass in the Bay (Thom 1990).
Anecdotal observations by Ronald Phillips (pers. comm., Seattle Pacific University, telephone,
27 February 1989) indicated that the meadow on the north side of Duwamish Head, in Elliott Bay,
has been declining in size since the 1960s. Observations by a resident of Vashon Island (Scott
Borkland, commercial fisherman, pers. comm., 22 January 1990) over the past ca. 40 years
indicate that eelgrass has declined substantially, particularly in the beach areas located on the
northwest shoreline of the Island. Black Brandt geese, which used to inhabit these meadows for
extended periods during the winter and feed on the eelgrass, are no longer observed. In addition,
young Dungeness crab which inhabited the eelgrass are no longer present in this area. In the area
between Point Robinson and Dolphin Point along the eastern shoreline of Vashon Island, a brown
scum dominates the leaves of eelgrass plants. The scum, which probably is comprised largely of
filamentous and tube-dwelling diatoms, is dense enough in the fall to clog commercial fishing nets
and prevent fishing in the area.
KELP FORESTS
The 1841 maps from the Wilkes survey showed only two locations with kelp patches: near
Port Townsend and in the vicinity ofNeah Bay. The maps are interesting but provide little detail
with regard to kelp.
The shoreline lengths of kelp differed between the surveys of Rigg in 1911-12 and those of the
WDW in 1978 (Table 9). Overall, there was 53% more shoreline with kelp in 1977 as compared
to 1911-12. In 1911-12, 7.8% of the shoreline in the study area was bordered by kelp (Table 9).
Whereas, 12.0% of the shoreline was bordered by kelp in 1978.
Both Rigg and WDW studies showed that the Straits region contained the greatest percentage
of shoreline occupied by kelp. Hood Canal contained the least coverage of kelp in both surveys.
All regions, except Hood Canal, showed increased coverage of kelp in 1978 as compared to 1911-
12. The largest increases were recorded for the Main Basin and south Sound; areas which have
undergone the most extensive human population increases and urbanization since the turn of the
century.

32
Table 9. Length of shoreline occupied by kelp based on surveys by Rigg in 1911-12 and Washington Department of Wildlife rv,IDW) in 1978. Total coastline lengths for each region is given in parentheses.
Percent of total Shoreline with Keln (km} shoreline with keln
Rigg WDW Difference Rigg WDW Region 1911-12 1978 (%) 1911-12 1978
Straits (1044 km) 169.8 180.6 +6.4 16.3 17.3
N. Sound 15.9 36.3 +128.3 4.8 11.0 (331 km)
Hood Canal 1.4 0.8 -42.9 0.5 0.3 (295 km)
Main Basin 11.0 64.1 +482.7 2.4 14.1 (455 km)
S. Sound 7.4 32.0 +332.4 1.5 6.4 (497 km)
Total 205.5 313.8 +52.7 7.8 12.0 (2622 km)
The 1989 WCKR mapping showed kelp shoreline distributions for six subregions in the Straits
as being generally intermediate in length between Rigg and WDW data (Table 10). The WDW and
WCKR maps illustrated a change of +60.7% and+ 13.6% in total kelp distribution, respectively,
as compared with Rigg for the six subregions.
The estimate of kelp distribution in the Straits made by WDW exceeded the estimate by WCKR
by 42% (Table 10). The WDW estimate was greater in five of the six subregions in the region, with
estimates for subregion 2 (Angeles Pt. to NW entrance of Sequim Bay) accounting for much of the
difference. In contrast, the estimate of Rigg for subregion 2 is very similar to that of WCKR. The
reason for the high value for subregion 2 in 1978 is unclear. The data in Table 10 suggest to us that
(1) kelp distribution has been relatively stable in subregions 1, 6, and 8 this century; (2) substantial
increases in kelp may have occurred in subregion 3 and 4 this century; (3) WDW data from
subregion 2 may be anomalous; and (4) because of the relative remoteness and lack of development
and riverine influence, Protection Island (subregion 6) may be the most accurate "barometer" of kelp
variations over time. This latter point needs further study.

33
Table 10. Coastline lengths (in meters) occupied by kelp in six subregions in the Straits. Data are from Rigg (1911-12), Washington Department of Wildlife (WDW 1978) and the Washington Coastal Kelp Resources maps (WCKR 1989).
Subregion Rigg (1911-12) WDW(1978) WCKR (1989)
1. Cape Flattery to Angeles Pt. 69,600 84,000 76,750
2. Angeles Pt. to NW entrance 5,200 32,500 6,500 of Sequim Bay
3. NW entrance of Sequim Bay 0 5,400 2,350 to Diamond Pt.
5. Cape George to McCurdy Pt. 150 2,625 1,050
6. Protection Island 2,100 3,000 4,750
8. Mccurdy Pt. to Pt. Wilson .6...UQ .6...UQ .llQQ TOTAL 83,200 133,675 94,500
Kelp distribution differed considerably in several subregions between the surveys of Rigg and
WDW (Figs. 8-12), and between WDW, Dugan (1982) and WCKR (1989) (Tables 9-11). The
distribution of kelp in the 1988 photographs generally agreed with that shown by WDW in 1978
for the subregion (57) between Point Partridge and Possession Point (Table 11). The same was
true for the subregion (63) between Tala Point and Oak Head, and for the subregion (80) between
Alki Point and Brown's Point. The area just north of Steilacoom, a section of subregion 83 that
hydrographic charts had indicated almost a continuous band of kelp, was largely devoid of kelp in
the 1988 photos. Even with this apparent decrease, WDW data indicated a large increase in kelp
coverage in the subregion since 1912. Incomplete photographic coverage of this subregion
prevented the evaluation of the major differences between Rigg and WDW surveys. No kelp was
evident in the photos of Ketron Island (subregion 87). Rigg had not indicated kelp on Ketron
Island, whereas WDW showed kelp at the north and south points. The south point (Tucksel Point)
of Squaxin Island (subregion 89) had kelp in early hydrographic records and in 1978 and 1988,
but kelp was not indicated in 1912. Although no 1988 photos covered Toliva Shoal (subregion
111), kelp was not noted there in 1978. Thomas Mumford (pers. comm., March 1990) stated that
no kelp has been noted on Toliva Shoals since 1983. Kelp had been reported from this Shoal by
several hydrographic surveys as long ago as 1856, and Rigg noted a kelp forest here in 1912.
Although older records showed a kelp forest distributed almost continuously around the apex of
Point Defiance (subregion 122), a relatively thin band of kelp was noted by us only on either side
of the Point and not at the apex. Brisco Point (subregion 125), Hartstene Island, was shown to
have kelp on 19th century hydrographic charts, but no kelp was noted by Rigg in 1912, WDW in
1978 or on the 1988 aerial photos.

" E "-'
a.. -' w ~
:c I-t-t
3
w z t-t
-' I-(.I) < CJ u
(X 10000)
10
8
6
4
2
0
I I
I I I I I 1 \ \ \ \ \
0
STRAITS
5 15 25 35 10 20 30
SUBREGION NUMBER
45 40
1911-12 1978
50
Figure 8. Length of coastline occupied by kelp forests in subregions within the Straits region for records made in 1911-12 and 1978.
w .j::.

"' E ""' Cl.. _J w ~
:::c I-t-t 3
w z t-t _J I-U)
< • u
NORTH PUGET SOUND <X 10000) 1911-12
1978 3. 5
3 I\ I\ I \
2.5 I \ I \ I \
2 I \ I \
1. 5 I \ I \ I \ 1 I \
I \ 0.5 I \
' I ' 0 ' ---
54 56 58 60 62 53 55 57 59 61
SUBREGION NUMBER
Figure 9. Length of coastline occupied by kelp forests in subregions within the North Puget Sound region for records made in 1911-12 and 1978.
\.>.)
Vl

<X
r"I. E ~
Q_ _J w ~
:c .,_ ...... 3
w z ...... _J .,_ <.n < C) LI
HOOD CANAL 1000) 1911-12
1978 1. 5 I
I I I I
l I I I I
I I
0. 5 I
I I
I I
I I
0
63 64 65 66 67 68
SUBREGION NUMBER Figure 10. Length of coastline occupied by kelp forests in subregions within the Hood Canal
region for records made in 1911-12 and 1978.
w 0\

"' E .._,,
a... _J w ~
I I-...... :3
lJ.J z ...... _J I-ti)
< • u
ex 1000)
20
15
10
5
0
Figure 11.
MAIN BASIN
,~ ,\ I \
I \ I \ I \ I \ I \ I \ I \ I \
'
,, I \ I \ I \ I \
1911-12 1978
I I I I \ I \ \ I \ I \ I
I \ \ I \ I \ I \ I \ \ I I \ I \ I \ \/
' .,,J \ I \I / I 1
70 72 74 76 78 80 82
69 71 73 75 77 79 81
SUBREGION NUMBER
Length of coastline occupied by kelp forests in subregions within the Main Basin region forrecords made in 1911-12 and 1978.
w -....J

,..... E .._,
CL _J w :::s::::
I ..... -3
LLJ z -_J ..... U)
< • u
CX 1000)
15
10
5
0
Figure 12.
\ \ \ \ \ \ \ \ \ \
\
84 83
SOUTH PUGET SOUND
\ \...--..._
'"'-
' ' 86 88 90
85 87 89 91
SUBREGION NUMBER
92
1911-12 1978
I I I I I I I I
94 93
Length of coastline occupied by kelp forests in subregions within the South Puget Sound region for records made in 191 1-12 and 1978.
Vo) 00

39
Table 11. Kelp distributions by subregions in 1911-12, 1978, and notes and kelp distributions from 1982, 1988, and 1989 aerial photographs. Units= length (m) of coastline bordered by kelp; blanks indicate no information; yes = kelp present.
Subregion Rigg WDW WDW Percent Duggan WCKR 1988 aerial photographs ser. no. 1911-12 1978 - Rigg change 1982 1989 (frame no.; flight line)
1 69600 84000 14400 21 76750 2 5200 32500 27300 525 15600 6500 3 0 5400 5400 5400 2350 4 0 0 6 0 5 150 2625 2475 1650 2900 1050 6 2100 3000 900 43 4750 7 2625 0 -2625 -100 8 6150 6150 0 0 3100 9 0 0 0 0
10 4000 0 -4000 -100 11 0 0 0 0 12 1300 0 -1300 -100 13 0 0 0 0 14 0 0 0 0 15 1100 1500 400 36 16 2900 0 -2900 -100 17 0 0 0 0 18 0 0 0 0 19 2700 0 -2700 -100 20 1700 0 -1700 -100 21 0 0 0 0 22 0 0 0 0 23 900 0 -900 -100 24 1000 0 -1000 -100 25 1000 0 -1000 -100 26 1600 1000 -600 -38 27 3000 1600 -1400 -47 28 1700 2000 300 18 29 1300 2100 800 62 30 20400 10700 -9700 -48 31 9600 5100 -4500 -47 32 1600 0 -1600 -100 33 3400 0 -3400 -100 34 1500 0 -1500 -100 35 2300 1700 -600 -26 36 4800 4500 -300 -6 37 0 0 0 0 38 1600 0 -1600 -100 39 2800 0 -2800 -100 40 5700 7300 1600 28 41 2200 0 -2200 -100 42 0 200 200 43 500 0 -500 -100 44 0 0 0 0 45 0 0 0 0 46 0 0 0 0

40
Table 11-cont.
Subregion Rigg WDW WDW Percent Duggan WCKR 1988 aerial photographs ser. no. 1911-12 1978 - Rigg change 1982 1989 (frame no.; flight line)
47 0 0 0 0 48 0 0 0 0 49 0 0 0 0 50 0 0 0 0 51 3400 9200 5800 171 52 0 0 0 0 53 0 3600 3600 54 0 0 0 0 55 0 0 0 0 56 0 0 0 0 57 13650 32700 19050 140 (1084; 1078) kelp in Admiralty
Bay; Admiral. Head-Pt. Partridge 58 750 0 -750 -100 0 59 450 0 -450 -100 0 60 0 0 0 0 61 1050 0 -1050 -100 0 62 0 0 0 0 63 1350 0 -1350 -100 0 (1396-1409; 1418) very little
kelp indicated 64 0 0 0 0 65 0 0 0 0 66 0 0 0 0 67 0 0 0 0 68 0 750 750 69 0 7125 7125 70 1200 2250 1050 88 71 0 0 0 0 72 0 0 0 0 73 0 1200 1200 74 5250 13125 7875 150 75 0 0 0 0 76 1650 2250 600 36 77 0 0 0 0 78 1650 15375 13725 832 79 0 450 450 80 0 12000 12000 (Flt. Line 51) kelp as in 1978;
(1173) none at Brown's Pt. 81 1200 1050 -150 -13 82 0 9300 9300 83 900 12375 11475 1275 0 (Flt Line 91 & 86) only one
small patch at north Steilacoom 84 1275 4425 3150 247 0 85 0 2025 2025 0 86 1050 2250 1200 114 0 87 0 1725 1725 0 (1742-1743) no kelp on N. or
S. end of Island 88 0 750 750 0 89 1725 900 -825 -48 (1642) kelp present

41
Table 11-cont.
Subregion Rigg WDW WDW Percent Duggan WCKR 1988 aerial photographs ser. no. 1911-12 1978 - Rigg change 1982 1989 (frame no.; flight line)
90 0 0 0 0 91 0 0 0 0 92 0 0 0 0 93 0 0 0 0 94 2400 7500 5100 213 0 95 2500 No record 96 No record No record 97 1200 No record 98 600 No record 99 Norecord No record
100 1000 No record 101 800 No record 102 Norecord No record 103 500 No record 104 Norecord No record 105 Norecord No record 106 Norecord No record 107 Norecord No record 108 500 No record 109 300 No record 110 Norecord No record 111 750 0 0 112 Yes Yes 113 No Yes 114 Yes Yes 115 Yes Yes 116 Yes Yes 117 Yes Yes 118 Yes Yes 119 No Yes 120 Yes Yes 121 Yes Yes 122 Yes Yes (1193) narrow band on either
side of point 123 Yes Yes 124 Yes Yes 125 Norecord No record (1664) no kelp at point 126 Norecord Yes 127 Yes Yes 128 1917PUBL. Yes

42
The patches of kelp along Magnolia Bluff (subregion 78), Elliott Bay, were estimated to cover
a total of 13.1 ha by Thom et al. (1984). These beds were noted by WDW but were not shown on
the 1912 Rigg map.
The kelp forest at Lincoln Park Beach (Fauntleroy Cove, subregion 128) was studied by Rigg
(1917) between October 1914 and February 1917. He made notes on the length of the forest,
located immediately to the south of Point Williams, and other aspects of the plants on 15 visits.
Most of the visits were made in spring-summer. Rigg stated that the forest at best development
reached a length exceeding approximately 213 m (700 ft). Of note is the fact that Rigg did not
include this patch in his 1911-12 maps. Observations made almost annually between 1974-1989
(Thom 1978, Thom and Hampel 1985, and Thom unpublished data) indicate that this patch is on
the order of 640 m (2,100 ft) long. This patch was noted on 19th century hydrographic charts.
Anecdotal information indicates that the kelp patches around Fox Island have become less
dense over the past approximately 10 years (Thomas Mumford, pers. comm., 16 July 1984).
Long-time residents of Fauntleroy Cove indicate that kelp has been increasing in its distribution
over the past approximately 40 years. At Fourmile Rock located along the northeast shoreline of
Elliott Bay, kelp appears to have been sparse in 1972, increased in 1980 and showed a decline in
1984 (Bonny Orme, pers. comm., 11 March 1985). Observations made on Vashon Island (Scott
Borkland, pers. comm., 22 January 1990) over the past 40 years have noted a decline in the
distribution of kelp there. Aerial photographs from 1988 of the Vashon Island shoreline were not
available. Lyon McCandless (pers. comm., conversation, 24 February 1990) has observed
widespread a general reduction in kelp distribution along the eastern shoreline of Bainbridge Island
over the past 35 years. McCandless, a long-time member of the Marine Science Society of the
Pacific Northwest (Poulsbo, WA), made these observations primarily by snorkel and SCUBA
diving. He stated that the Wing Point forest, and forests in the Ferncliff and Rockaway Beach
areas, are either much reduced or gone. The change has been gradual over the time period of
McCandless' observations.
INTRODUCED SPECIES
Spartina spp.
Historical evidence suggests that Spartina was planted for either cattle grazing, dike stabili
zation or waterfowl habitat in each of these areas. Spartina alterniflora is presently known from
southern Padilla Bay, Thorndyke Bay, Gibson spit and Kala Point. Spartina patens is presently
found at the mouth of the Dosewallips River. S. townsendii/anglica has invaded the Scirpus
marsh in Port Susan. S. alterniflora and S. patens appear to be spreading very slowly in Puget
Sound (B. Aberle, letter dated October 23, 1990 to M. Rylko). In contrast, S. townsendiilanglica

43
may be spreading rapidly. This species, normally found in low intertidal mudflats and salt
marshes, has recently been observed on sandy and gravel beaches (B. Aberle, ibid.).
Zostera iaponi.ca There is very little information on the present distribution of this species in Puget Sound. It
occurs in dense stands in Boundary Bay (Harrison 1979), Drayton Harbor (Thom et al. 1989),
Lummi Bay (Thom, personal observation, 1989) and Padilla Bay (Thom 1990), and has been seen
in small patches in the flats to the west of Jetty island on the Snohomish River delta (Thom, pers.
observation, 1989). Phillips did not note the presence of Z. japonica during his surveys in 1962-
63. The effect of the invasion of this species on the native eelgrass has yet to be fully evaluated.
Z. japonica now occupies formerly unvegetated mud and sandflats.
Sargassum muticum This species was present throughout the study area by the early 1960s. Phillips noted
Sargassum at Oak Head (subregion 64), near Hoodsport (subregion 65), on Fox Island (subregion
84), and at Dickerson Point (subregion 88) during his eelgrass surveys of 1962-63. During
surveys made in 1966-68, Phillips and Fleenor (1970) collected Sargassum at sites located at the
Hood Canal Bridge (subregion 64), Beacon Point (subregion 65) and just north of Hoodsport
(subregion 65) in Hood Canal. Harlin (1969) recorded Sargassum at Steamboat Island (subregion
88) in South Puget Sound during surveys made approximately monthly from June 1967 through
August 1968.
Quantitative data taken at a site in the lower intertidal zone on the south side of A1ki Point
indicate substantial changes in the percentage cover of Sargassum and N ereocystis since 1979
(Fig. 13; Thom, unpublished data). Nereocystis showed wide fluctuations at this site, which is at
the extreme upper depth limit of its distribution. Between 1984 and 1985, there was a dramatic
decline in Nereocystis and a dramatic increase in cover of Sargassum at this site. Sargassum cover
has remained high since 1985, and Nereocystis cover has remained near zero during this period.
Of note is the fact that heavy harvesting of Nereocystis at this site (Region X, U.S. EPA) was
noted by Thom (unpublished data). Heavy harvesting of kelp was noted by J. Armstrong in the
late 1970s at this beach (pers. comm., January 1991). Harvesting involved removing the blades,
which produce reproductive sori in summer, at the level of the float. The extant plants in the area
indicated that the population was not reproductively mature prior to the harvesting in spring.
DISCUSSION
Changes in the area covered by tidal marshes, eelgrass meadows and kelp forests have taken
place since the mid-1800s in Puget Sound. Declines in tidal marshes are the most well quantified

,,,..... N """ Ct: lLl > 0 u z < w ~
100 B
80
60 /{ /
/ 40 /
/ /
/
20 / /
l---.....,.__ ..... ___ _,.A ~' / /
0 'el
80 82 84 86 88 79 81 83 85 87 89
YEAR
Figure 13. Changes in mean percent cover (±1 SE) of (A) Nereocystis luetkeana and (B) Sargassum muticum in the low intertidal zone at Alk:i Beach between 1979 and 1989.
+:>-+:>-
45
and have been substantial (73% ). The losses are largely due to diking, filling and dredging for
agriculture and port development. Eelgrass meadows have also been lost due to diking, filling and
dredging, but overall changes in Puget Sound could not be assessed due to a lack of comprehen
sive early records. On the basis of two Sound-wide data sets taken 66 years apart, kelp forests
may have increased their distribution this century. Several introduced plant species may have
affected, and will probably continue to affect, the distribution of native salt marshes, eelgrass
meadows and kelp forests.
Tidal marshlands occur primarily at the mouths of rivers and streams that are tributary to Puget
Sound. These areas were considered prime candidates for agriculture which could be accom
plished through diking (Nesbit 1885). The majority of losses of tidal marshlands in Puget Sound
have occurred at the mouths of the largest rivers. Agricultural diking has reduced marsh area in the
Lummi, Samish, Skagit, Nisqually, Skokomish and Snohomish River deltas 25%-95%. Filling
and dredging for port development are primarily responsible for losses of wetlands in the urban
ized estuaries of the Duwamish and Puyallup Rivers; wetland losses in these latter systems are
99% and 100%, respectively. The Nooksack, Stillaguamish and Dungeness River estuaries,
which have remained relatively undisturbed, have either remained the same since the 1800s or have
increased in size (i.e., prograded).
The rate of estuarine wetland loss was greatest in the most urbanized estuaries from about 1900
through about 1950. This was a period when construction of port facilities was most rapid (Boule'
et al. 1983). The rate has slowed either due to decline in economic justification for further port
expansion (i.e., Snohomish) or the fact that very few wetlands remain in the estuary (i.e.,
Duwamish and Puyallup). The passage of the Clean Water Act in the early 1970s has probably
slowed wetland loss in other estuaries (Puget Sound Water Quality Authority 1986, Stevens and
Canning 1989).
Some systems have been subject to extensive diking along the mainstem of the river (e.g.,
Puyallup River). This probably has caused major shifts in the dynamics and spatial patterns of
sediment deposition in the estuaries. The effect of changes in sedimentation could not be assessed
based upon the available data. According to Nesbit (1885) sedimentation was heavy during
periods of heavy runoff in several major river deltas in Puget Sound. Diking and increased
sediment loads due to logging activities in the watersheds of these rivers may have affected the
spatial development of marshes in the estuary. This aspect of habitat changes in Puget Sound has
not been studied.
Marshland changes associated with disease, variations in water temperature, storm events and
decreased water quality (e.g., elevated nutrients, pesticides) were not a part of this study. How
ever, these factors have probably be concomitant with other factors that have resulted in the loss of
wetland area and functional quality in Puget Sound (Puget Sound Water Quality Authority 1986).
46
Functional quality can be measured in terms of primary productivity, numbers of plant and animal
species in a system, contamination of the soils and food web in the system, hydrological aspects,
and sediment trapping. Functional degradation of estuarine wetlands needs further study in Puget
Sound.
Although the changes in marsh dominated wetlands in Puget Sound have been quantified to a
large degree, the accuracy of the estimates of change in area appears to depend upon the methodol
ogy used. Estuarine marsh area was estimated by hydrographic charts (Bortleson et al. 1980) and
intensive transect studies in the field (Brewer 1980) in the Skagit and Stillaguamish deltas. In both
deltas, the field studies estimated a greater marsh area than did the chart studies. For the Stilla
guamish, the field-based estimate in 1974 was approximately twice the chart-based estimate for the
same year. Although the difference in estimates between the two techniques for the Skagit was
less, the field-based method showed progradation since the late 1940s, whereas the chart-based
method indicated a steady decline since the late 1800s. It is our opinion that the field-based method
produced the most accurate estimate. The substantial differences between the two methods
strongly supports the effort of the WDNR to develop accurate methodology for assessing and
monitoring the aerial coverage of nearshore habitats in Puget Sound (Mumford et al. 1990).
At least 25% (659 km) of the shoreline in the study area has documented eelgrass meadows.
Although some bays (e.g., Padilla, Lummi) contain extensive stands of eelgrass, much of the
eelgrass occurs within a narrow band along relatively steeply sloping shores (e.g., Phillips' notes,
Thom and Albright 1990). The availability of early maps depicting the location of eelgrass allowed
us to quantify losses in Bellingham Bay and the Snohomish River delta. In contrast, there may
have been a substantial increase in eelgrass cover in Padilla Bay. A substantial proportion of this
increase is attributable to the invasion of Z. japonica, but may also be due to the spread of the
native Z. marina. Virtually complete diking of the Skagit River delta at the south end of Padilla
Bay, and the restriction of freshwater flow from the Skagit to the Swinomish Channel, may have
reduced the amount of freshwater flowing into the southern end of the Bay. This reduction may
have allowed higher salinities to prevail in the southern end, which would favor the invasion of
Zostera onto previously unvegetated flats. This hypothesis needs further study.
Other changes are very difficult to assess. Anecdotal accounts indicate widespread declines in
eelgrass in certain areas over the last 30-40 years. In these cases, changes in water quality may be
the reason owing to the noted increase in brown scum on eelgrass leaves. Increase in epiphytic
algae is known to significantly reduce the growth of eelgrass. Reduced growth rate is due to
competition between eelgrass and its epiphytic flora for light energy and nutrients. High epiphyte
loads coupled with reduced seagrass growth rates is indicative of eutrophication in estuarine
systems (Zimmerman and Livingston 1976). Orth and Moore (1984) relied in large part on
observations made by fishermen, bird watchers and other careful observers to document the long-

47
term changes in the SA V of Chesapeake Bay. Similarly, our anecdotal information came in part
from professional aquatic ecologists and a professional fisherman, and these observations are at
present our best general indicator of possible degradation of eelgrass meadows in Puget Sound.
Further study is needed on this subject in Puget Sound.
All regions, except Hood Canal, showed an increase in kelp between 1912 and 1978. The
largest relative increases were recorded in the Main Basin and southern Puget Sound, the regions
that have seen the greatest increase in population and urbanization. Several factors may explain the
differences between the two records. First, methods differed: In 1912, all observations were from
a boat; in contrast, all data in 1978 were taken from an airplane. Although not proven, it would
seem that a better indication of kelp location would be gotten from the closest vantage point, and
hence the estimates in 1912 would be most accurate. If this is true, then the increase by 1978 can
be viewed as being a minimal estimate of change. Second, the definition of a patch of kelp may
have differed between the observers. Rigg was interested in patches that were of commercial value
as a source of potash, and hence would have concentrated on relatively large and dense patches
when developing the maps. In contrast, the 1978 observers were interested in indicating where
kelp occurred, and may have noted patches that were smaller or less dense than some lower limit
Rigg set. The fact that Rigg did not map the 213 m long forest at Lincoln Park beach, but that he
was well aware of the size and location of the forest, may indicate that this latter explanation is
true. Furthermore, all but one patch on Rigg's maps was greater than 450-m long. Finally, kelp
distribution varies annually. Several early notes (e.g., Rigg 1917, Coast Pilot) show that this
variation was acknowledged. Crandal (1915) noted that 1912 appeared to be a "bad" year for kelp
in that not as much was visible in the summer of 1912 as had been previously seen in some
locations. In comparison, 1978 may have been a "good" year. Whether this explains the
differences between the two records is questionable because, although kelp density varied
significantly, Foreman (1984) found that semiannual variation in forest patch area was insignificant
between 1974 and 1980 in British Columbia.
The kelp resources maps produced in 1989 (WCKR) from the Straits illustrated kelp distribu
tions quite similar to those illustrated by Rigg in 1911-12. The difference (i.e., 13.6%) between
the two records generally verifies that kelp has probably changed little in that region. Our measure
ments of kelp distribution on the 1989 WCKR maps included the smallest specks indicating kelp.
These specks could indicate the location of one kelp plant. The fact that 1977-78 WDW data and
the 1989 WCKR data differ substantially (i.e., 42%) from each other suggests that changes had
occurred between the two records.
Perhaps the two best examples of changes in kelp that we found were from Lincoln Park beach
where Rigg ( 1917) had documented the length and width of the forest for ca. 3 years, and from
Toliva Shoal. The kelp forest of Toliva Shoal was long used as a navigation aid, and its loss can

48
only be attributed to some change in the aquatic system in South Puget Sound. At Lincoln Park,
the length of the kelp patch has tripled since 1917. This change is probably the best quantified
change available for a kelp patch in Puget Sound. An explanation for this change may be related to
changes in available substrata in the bay. A seawall was built in the mid-1930s to prevent erosion
of the bluff in the northern portion of the bay. This bluff probably supplied sediment to the beach
and adjacent subtidal zone. With the reduction of sediment to the bay, and sediment removal
through shoreline waves and currents, additional stable rocky habitat may have become exposed in
the bay which was colonized by Nereocystis. Erosion at the base of the seawall has been
extensive, and caused failure of the seawall in the early 1950s (Corps of Engineers, 1986).
Continued erosion prompted the City of Seattle to.place fill along the seaward side of the old
seawall in 1989 to prevent the wall from collapsing and affecting the adjacent Park lands. Erosion
had exposed large cobble and boulders on the beach, and hardpan comprised much of the surface
area of substrata near the base of the seawall by 197 4 (Thom, personal observation, Thom and
Hampel 1985).
Water quality changes may also explain an increase in kelp, particularly in the Main Basin and
southern Puget Sound. A recent analysis of nutrients and phytoplankton in Puget Sound showed
that nitrate and phosphate input to Puget Sound have changed this century and that phytoplankton
blooms may explain recently observed declines in nitrates (TetraTech, Inc. 1988). Nereocystis is
an annual kelp with a very high growth rate. Owing to its large size and short growing season,
kelp forests probably require large quantities of inorganic nutrients. Recent evidence suggests that
streams entering Puget Sound carry large concentrations of nutrients, and that the stream entering
in the vicinity of the Lincoln Park forest has extremely high nitrate concentrations (Thom et al.
1988). In addition, nutrient limitation of algal growth is indicated for embayments in Puget Sound
(Thom and Albright 1990). Hence, kelp growth may be nutrient limited and increased nutrient
supplies could stimulate the growth and spread of kelp. Nereocystis also appears to be somewhat
tolerant of contamination. Kelp grows in relatively dense patches near a large combined sewage
overflow in Elliott Bay (Tomlinson et al. 1980). Finally, this species has been shown experimen
tally to dominate, by shading, the assemblage of understory algal species in the forest. Removal of
Nereocystis results in a rapid change in the cover of other algal species in the forest (Thom 1978).
Hence, it is a species with a high growth rate, relatively tolerant of pollution, and tends to dominate
by size and growth rate the subtidal assemblages where it occurs. Obviously, study of the nutrient
requirements and ecology of this species is needed in Puget Sound to fully explain any long term
changes.
Ebbesmeyer et al. (1988) detected a pattern in oceanographic conditions in the North Pacific
that occurs with a period of about a decade. Rensel (1990) suggested that these shifts could have
profound effects on phytoplankton and nutrient dynamics in Puget Sound. Thom and Albright

49
(1990) indicated that the strong El Nino of 1983-1984 had a significant effect on the biomass and
species composition of benthic algae at a site in the East Passage of Puget Sound. It is reasonable
to assume that kelp and other nearshore vegetation could be influenced by the periodic changes
discovered by Ebbesmeyer et al.
If the data from the Straits, the region with the least anthropogenic environmental impacts, are
used as a control for natural changes in kelp and methodological differences, then these factors
explain a 1.0% relative increase in the amount of shoreline occupied by kelp over the 66-year
period between Rigg's and WDW's surveys. In comparison, northern Puget Sound, the Main
Basin and Southern Puget Sound have substantially greater relative changes than is explained by
normal variation and methodological differences. Again, however, the fact that kelp beds are
larger and perhaps denser in the Straits as compared to the other regions, may have reduced the
effect of observer differences in that region as compared to the other regions.
The effect of introduced macrophytes to the habitats we studied appears to be significant.
Although Spartina alterniflora has not spread rapidly in Puget Sound, it does appear that S.
townsendiilanglica is spreading rapidly within natural stands of Scirpus and other marsh species,
and now occupies formerly unvegetated mudflats. These latter habitats are of known importance to
waterfowl and fisheries resources. The continued slow invasion should be of concern. In parti
cular, the spread of S. alterniflora would be a significant threat if flowering and the production of
viable seed were to occur (B. Aberle, letter dated October 23, 1990, to M. Rylko). Viable seed
production is now common in Willapa Bay, where this species is now spreading exponentially.
The invasion of Z. japonica has probably affected the native Zostera at the upper limits of its dis
tribution. These species co-occur at the +0.3 to 1.0 m MLL W elevation on flats, and competition
for space is demonstrated (Harrison 1976). In addition, Z.japonica can invade newly created bare
patches within native Zostera meadows, and hold this space for a considerable amount of time
(Michele Nielsen, University of British Columbia, conversation, 5 May 1990). Z.japonica also
now occupies formerly unvegetated flats. The ecological role of these latter areas has probably
been altered substantially. However, the full impact of this alteration has not been documented. In
a fashion similar to the eelgrass interaction, the highly invasive seaweed Sargassum muticum
appears to be able to hold and dominate space in the low intertidal zone; the zone at the upper depth
limit of Nereocystis. Documented dominance of this zone by Sargassum at Alki beach appears to
be in response to loss of kelp due to harvesting. At this particular beach, harvesting has been
intense enough to reduce the size of the kelp forest significantly over the past 10 years (Thom,
unpublished data). The widespread occurrence of Sargassum in Puget Sound suggests that our
productive low intertidal seaweed dominated systems have been altered significantly.

50
CONCLUSIONS AND RECOMMENDATIONS
Substantial changes have taken place in estuarine habitats in Puget Sound. The easiest to
document are those due to physical disturbances such as the filling and dredging of tidal marshes.
The effects of reductions in water quality, and invasion by non-native macrophytes, on nearshore
vegetated habitats are more difficult to assess. The widespread declines in submerged aquatic
vegetation in Chesapeake Bay is attributed to eutrophication due to increased anthropogenic intro
ductions of nutrients. Recently, Biggs et al. (1989) showed that Chesapeake Bay, due to physical
morphology and hydrological factors, is much more susceptible to eutrophication than is Puget
Sound. Although eutrophication may not be a general concern in Puget Sound, nearshore bays
and river deltas, where eelgrass and other macrophytic assemblages predominate, may be more
vulnerable (Thom et al. 1988, Thom and Albright 1990). The general lack of comprehensive and
quantitative historical data sets on macrophytes hinder the analysis of historical changes. The
monitoring program presently under development by the WDNR (Mumford et al. 1990), along
with other measurements proposed for the comprehensive Puget Sound Ambient Monitoring
Program (PSWQA 1988), is critical in documenting accurately the spatial and temporal patterns of
changes in nearshore habitats in Puget Sound.
The following recommendations can be made based upon our analysis of historical changes in
nearshore habitats:
1. The accuracy of the historical records for all habitat types is questionable. Although the
direction and magnitude of changes are probably valid, the quantification of changes are
subject to considerable error. Hence, it is recommended that changes in habitat be based on
studies developing new records that target specific habitats and are designed for the
purpose of detecting changes.
2. Although large declines in the area covered by marshes and eelgrass can be explained by
physical disturbances such as diking and dredging, we have little information to explain
changes in kelp distribution. It is recommended that changes in kelp distribution be
explored further in terms of possible causal factors. Kelp forests may form the most
noticeable and easily monitored habitat in Puget Sound, and it may be highly sensitive to
changes in water quality.
3. The subtidal distribution of eelgrass is essentially unknown. These meadows may be
extensive and highly important, and could be impacted by increased turbidity linked to
increased phytoplankton blooms or river-borne sediments. It is recommended that the
factors affecting eelgrass distribution be investigated and that the habitat monitoring
program develop methodologies for mapping subtidal meadows.

51
4. New, quantitative records of habitat distribution should be incorporated into a Geographic
Information System (GIS) that can be used to compare records taken over time. This
would greatly facilitate our ability to detect changes and generate hypotheses regarding the
possible reasons for the changes. The GIS should include information on water quality
and physical alterations.

52
REFERENCES
Albright, R., R. Hirschi, R. Vanbianchi and C. Vita. 1980. Coastal zone atlas of Washington land cover/land use narratives. Washington State Dep. Ecology. Olympia, WA.
Biggs, R.B., T.B. Demoss, MM. Carter and E.L. Beasley. 1989. Susceptibility of U.S. estuaries to pollution. Critical Reviews in Aquatic Sciences 1:189-207.
Blomberg, G., C. Simenstad and P. Hickey. 1988. Changes in Duwamish estuary habitat over the past 125 years. Pp. 437-454 in Proceedings First Annual Meeting on Puget Sound research, Vol. 2, Puget Sound Water Quality Authority. Seattle, WA.
Bortelson, G.C., M.J. Chrzastowski and A.K. Helgerson. 1980. Historical changes of shoreline and wetland at eleven major deltas in the Puget Sound region, Washington. Atlas HA-617, Department of the Interior, U.S. Geological Survey.
Boule, M.E., N. Olmsted and T. Miller. 1983. Inventory of wetland resources and evaluation of wetland management in western Washington. Final report to Washington State Department of Ecology, Olympia, WA. 102 p. ·
Brewer, L.W. 1980. Waterfowl habitat inventory. Project No. W-27-R-28. Washington Department of Game, Olympia, WA.
Burg, M.E. 1984. Habitat change in the Nisqually River delta and estuary since the mid-1800s. M.A. thesis, Univ. Washington, Seattle.
Cameron, F.K. 1915. Potash from kelp. Part 1. Pacific kelp beds as a source of potassium salts. U.S.D.A Report No. 100, Washington, D.C. 122 p.
Canning, D.J. and M. Stevens. 1989. Wetlands of Washington: a resource characterization. Environment 2010 Project, Washington Department of Ecology, Olympia, WA. 45 p.
Corps of Engineers. 1986. Lincoln Park shoreline erosion control Seattle, Washington. Final detailed project report and final environmental assessment. Seattle District, Corps of Engineers, Seattle, WA.
Cowardin, L.M., V. Carter, F.C. Golet and E.T. LaRoe. 1979. Classification of wetlands and deepwater habitats of the United States. U.S. Dep. Interior, Fish. Wildl. Serv. FWS/OBS-79-31.
Crandal, W.C. 1915. The kelp beds from lower California to Puget Sound. Part 2. Pp. 33-49 in F.K. Cameron (ed.), Potash from kelp. U.S.D.A. Rep. No. 100. Washington, D.C.
Davis, F.W. 1985. Historical changes in submerged macrophyte communities of Upper Chesapeake Bay. Ecology 66:981-993.
Dethier, M.N. 1989. A marine and estuarine classification system for Washington State. Washington Natural Heritage Progr., Dep. Natural Resources. Olympia, WA. 56 p.
De Wreede, R.E. 1978. Phenology of Sargassum muticum in the Strait of Georgia. Syesis 11:1-9.
Driscoll, A.L. 1978. Delineation of wetland boundaries. Snohomish Estuary Wetlands Study, Vol. IV. Final rep., U.S. Army Corp of Engineers, Seattle District.
Duggan, J.S. 1982. Wetland Inventory Puget Sound. Vols. 1-7. Environmental Monitoring Systems Laboratory, Off. Res. Develop., U.S. EPA, Las Vegas, NV. TS-AMD-82072a-g.
Ebbesmeyer, C.C., C.A. Coomes, J.M. Cox, G.A. Cannon and D.A. Bretschneider. 1988. Decade-long regimes of a fjord basin's oceanography, hydrology, and climatology: Puget Sound, 1916-'87. Pages 50-57 in Proceedings first annual meeting on Puget Sound research, volume 1, Puget Sound Water Quality Authority, Seattle, WA.

53
Foreman, R. 1984. Studies on Nereocystis growth in British Columbia, Canada. Hydrobiologia 116/117:325-332.
Harger, B. 1983. An historical overview of kelp in southern California. Pages 70-83 in The effects of waste disposal on kelp communities. Southern California Coastal Water Research Project, El Segundo, CA.
Harlin, M.M. 1969. A phycological survey of Steamboat Island. Syesis 2: 257-261.
Harrison, P.G. 1976. Zosterajaponica in British Columbia, Canada. Syesis 9:359-360.
Harrison, P.G. 1979. Reproductive strategies in intertidal populations of two co-occurring seagrasses (Zostera spp.). Can. J. Bot. 57:2635-2638.
Harrison, P.G. 1982. Comparative growth of Zosterajaponica Aschers. & Graebn. andZ. marina L. under simulated intertidal and subtidal conditions. Aquatic Botany 14:373-379.
Hutchinson, I. 1988. Estuarine marsh dynamics in the Puget trough-implications for habitat management. Pages 455-462 in Proceedings first annual meeting on Puget Sound research, volume 2, Puget Sound Water Quality Authority, Seattle, WA.
Jeffrey, R.G. 1947. Skagit delta waterfowl studies. Proceedings 28th Annual Conference of the Western Association of State Game and Fish Commission.
Mumford, T.F. 1988. Marine plants on state-owned aquatic lands: their status and management. Pages 479-491 in Proceedings first annual meeting on Puget Sound research, volume 2, Puget Sound Water Quality Authority, Seattle, WA.
Mumford, et al. 1990. Protocol development and characterization of Puget Sound. (In prep.)
Nesbit, D.M. 1885. Tide marshes of the United States. Dep. Agriculture miscellaneous special report No. 7. Washington, D.C. 259 p.
Norton, T. A. 1977. Ecological experiments with Sargassum muticum. J. Mar. Biol. Assoc. U.K. 57:33-43.
Orth, R.J. and K.A. Moore. 1984. Distribution and abundance of submerged aquatic vegetation in Chesapeake Bay: An historical perspective. Estuaries 7:531-540.
Parker, R. C. and B. Aberle. 1979. A situation report on the Spartina infestation in northwest Washington. Washington State Dep. Game. Unpublished.
Phillips, R.C. 1984. The ecology of eelgrass meadows in the Pacific Northwest: a community profile. U.S. Fish Wildl. Serv. FWS/OBS-84/24. 85 p.
Phillips, R.C. and B. Fleenor. 1970. Investigation of the benthic marine flora of Hood Canal, Washington. Pacific Science 24:275-281.
Puget Sound Water Quality Authority. 1986. Habitat and wetlands protection. Issue Paper. Puget Sound Water Quality Authority, Seattle, WA. 70 p.
Puget Sound Water Quality Authority. 1988. Puget Sound ambient monitoring program. Final Report. Puget Sound Water Quality Authority, Seattle, WA. 145 p.
Rensel, J. E., W.A. Clark and R.A. Pastorok. 1990. Nutrients and phytoplankton in Puget Sound. Draft rep. to Region X, U.S. Environmental Protection Agency. PTI Environmental Serv., Bellevue, WA. 156 p.
Rigg, G.B. 1915. The kelp beds of Puget Sound. Part 3, pages 50-59, in Cameron, F.K., Potash from kelp. U.S.D.A. report No. 100. Washington, D.C.
Rigg, G.B. 1917. Seasonal development of bladder kelp. Publ. Puget Sound Biological Station 1:309-318.

54
Scagel, R.F. 1957. An annotated list of the marine algae of British Columbia and Northern Washington. national Museum of Canada, Bulletin No. 150. Ottawa. 289 p.
Shallowitz, A.L. 1962. Shore and sea boundaries. Vol. 1. Boundary problems associated with the submerged lands cases and the submerged lands acts. Publ. 10-1, U.S. Dep. Commerce, U.S. GPO. Washington, D.C.
Shallowitz, A.L. 1964. Shore and sea boundaries. Vol. 2. Interpretation and use of coastal and geodetic survey data. Publ. 10-1, U.S. Dep. Commerce, U.S. GPO. Washington, D.C.
TetraTech, Inc. 1988. Characterization of spatial and temporal trends in water quality in Puget Sound. Final rep. to Region X, U.S. Environmental Protection Agency, Seattle, Washington.
Thom, R.M. 1978. The composition, growth, seasonal periodicity and habitats of benthic algae on the eastern shore of central Puget Sound, with special reference to sewage pollution. Ph.D. Dissertation, University of Washington, Seattle. 237 p.
Thom, R.M. 1987. The biological importance of Pacific Northwest estuaries. The Northwest Environmental Journal 3:21-42.
Thom, R.M. 1990. Spatial and temporal patterns in standing stock and primary production in a temperate seagrass system. Bot. Mar. 33:497-510
Thom, R., R. Albright, C. Simenstad and K. Chew. 1984. Intertidal and shallow subtidal benthic ecology. Sec. 4.0 in Q.J. Stober and K.K. Chew (principal investigators), Renton Sewage Treatment Plant Project: Duwamish Head. Univ. Washington, Fish. Res. Inst. FRIUW-8417. Seattle.
Thom, R.M. and J. Hampel. 1985. Benthic resource assessment of Lincoln Park beach, Seattle, Washington. Final report to Seattle District, Corps of Engineers, Seattle, WA.
Thom, R.M., A.E. Copping and R.G. Albright. 1988. Nearshore primary productivity in central Puget Sound: a case for nutrient limitation in the nearshore system of Puget Sound. Pp. 378-391 in Proceedings, First Annual Meeting on Puget Sound Research. Puget Sound Water Quality Authority, Seattle, WA.
Thom, R.M., C.A. Simenstad, J.R. Cordell and E.O. Salo. 1989. Fish and their prey in a marina and adjacent mudflats and eelgrass meadow in a small estuarine harbor. Univ. Washington, Fish. Res. Inst. FRI-UW-8901, Seattle.
Thom, R.M. and R.E. Albright. 1990. Dynamics of benthic vegetation standing-stock, irradiance, and water properties in central Puget Sound. Marine Biology 104:129-141.
Tiner, R.W. 1984. Wetlands of the United States: current status and recent trends. U.S. Fish and Wildlife Service, Washington, D.C.
Tomlinson, R.D., B.N. Bebee, A.A. Heyward, S.G. Munger, R.G. Swartz, S. Lazoff, D. E. Spyridakis, M.F. Shepard, R.M. Thom, K.K.Chew and R.R. Whitney. 1980. Fate and effects of particulates discharged by combined sewers and storm drains. EP A-600/2-80-111, U.S. Environmental Protection Agency, Cincinnati, Ohio.
U.S. Fish and Wildlife Service. 1987. Photointerpretation conventions for the National Wetlands Inventory. 30 p. + appendices.
Washington Coastal Kelp Resource. 1989. Prepared for Washington Dep. Natural Resources by Ecoscan Resource Data, Freedom, CA.
Webber, H.H., T.F. Mumford and J. Eby. 1987. Remote sensing inventory of the seagrass meadow of the Padilla Bay National Estuarine research Reserve: aerial extent and estimation of biomass. NOAA Tech Report Series OCRM/MEMD. Washington, D.C. 70 p.

55
Zimmerman, M.S. and R.J. Livingston. 1976. Effects of kraft-mill effluents on benthic macrophyte assemblages in a shallow-bay system (Apalachee Bay, North Florida, USA). Marine Biology 34:297-312.


APPENDIX 1
MAPS OF DISTRIBUTION RECORDS OF EELGRASS

58
SYMBOLS USED FOR EELGRASS RECORDS
• Phillips 1962-63
~ Jamison 1970s
xxxnx; U.S. Geological Survey 1886
••••• Coastal Zone Atlas (including supplement from field maps)
66666 Washington Department of Fisheries 1975-1989
000000 Hydrographic Surveys 1852-1899
1/j'///// Thom 1974-1989

59
124°501
124°401
4s0 30'-----------~.......-------------1,-----------=4s0 30'
48°201
48°101
1-1
0 I I I
Scale
PACIFIC OCEAN 48°20
1
48°101
5km
124°501
124°401

60
124°301
124°201
124°101
48°301
48°301
48°201
48°201
48°101
48°101
0 5km I I
Scale
124°301
124°201
124°101
1-2

124°001
48°201
48°101
0 5km I I I I
Scale
124°001
1-3
61
123°501
123°501
123°401
48°301
48°201
48°101
123°401

48°301
48°201
48°101
0 5km I I
Scale
1-4
62
123°301
123°201
STRAIT OF JUAN DE FUCA
123°301
Do --==::::::s Ediz Hook
123°201
48°301
48°201
48°101

48°301
48°201
48°1d
0 I
1-5
123°101
5km ! I
Scale
123°101
63
123°001
STRAIT OF JUAN DE FUCA
123°001
LOPEZ IS.
123°501
c:;,Smith Is.
Protect ion Is.
Cape George
122°501
48°301
48°201
48°101

123°301
123°20
() 0
a
48°401
123°301
123°201
123°101
Stuart~/\
Is. ~~~ns Is.
.. Q
Spieden~ 0
Flattop Is .
123°101
SAN JUAN ISLAND
~ Jones Is.
123°001
D
48°401
123°001

123°301
123°201
123°101
123°001
49°001
49°001
48°501 0 5km
I I I I 48°50
1
Scale
123°301 123°20
1
123°101
423°00

49°001
48°501
122°501
Semiahmoo Bay
STRAIT OF
GEORGIA
0 I I
Scale
5km
122°501
122°401
122°301
122°20'
49°001
Pt.
48°501
122°401
122°301 122°20'

122°501
122°401
Sucia Is.
~ Matia Is.
~
Barnes ~Clark Is. Is. 8 \ q
48°401
ORCAS ISLAND
Sinclair~ Is.~
4Eliza Is.
C::)Vendovi Is.
William
oJack Is.
122°301
I I Scale
122°20'
5km I
48°401

48°301
48°201
ADMIRALTY
48°101
INLET
122°401
Fida Igo Is.
WHIDBEY ISLAND
~22°401
68
122°301
0
122° 301
122°20'
. 48°301
5km I I
Scale
48°201
D DO
D
• Eb ~
122 °20'

123°25' 123°201
123° 151
123°10 123°051
48°15' 48°151
48°10'
48°051 48°05
1
0 5km
Scale
123°251
123°201
123°151
123° 101
123°051

f
l >-' N
48°101
48°051
48°001
123°101
0
123°101
123°051
123°001
5km
Scale
123°051
123°001
122°551
122°501
Protection~
122°55° 122°501
122°451
48°101
Pt. Wilson
48°051
48°001
122°451
--.J 0

48°151
48°101
48°051
0
' Scale
122°451
71
122°401
122°351
48°151
48°101
48°051
48°00L----------1------1--------'------------1..---___;:=---------'48°001
122°451
122°401
122°351
1-13

72
122°451
122°401
47°551
47°501
122°451
122°401
122°351
5km I
122°301
D
122°301
48°001
47°551
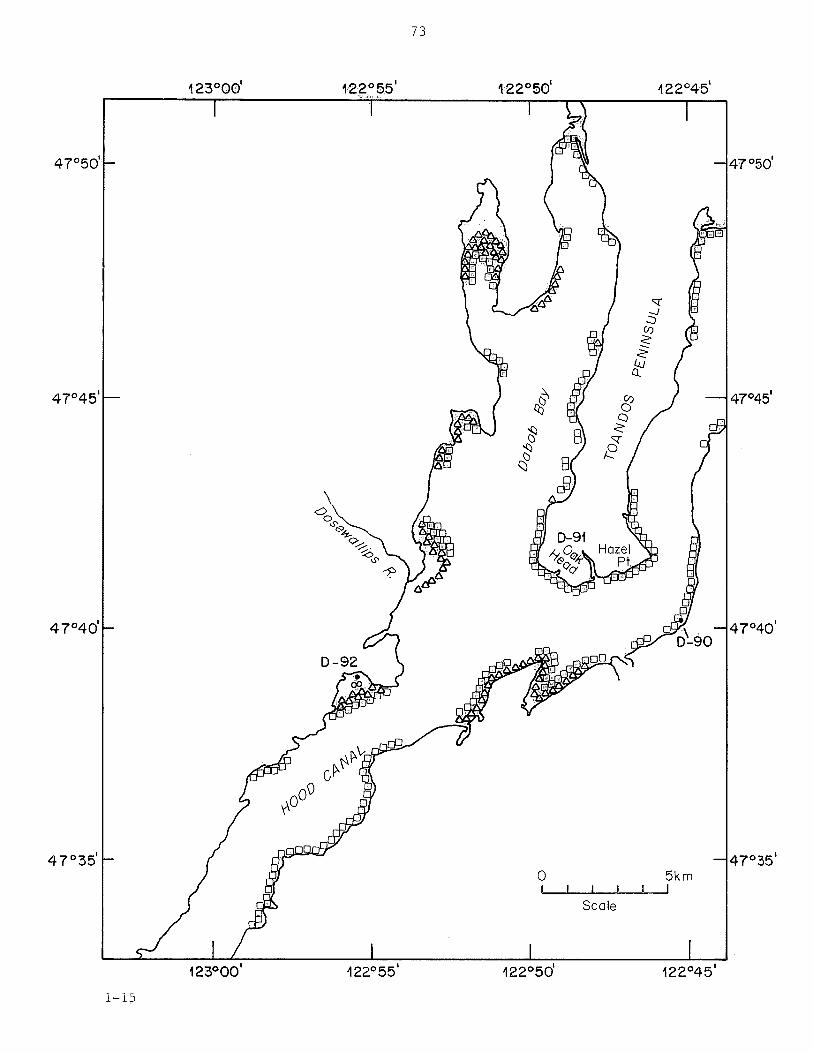
73
123°001
122°551
47°501
47°451
\
47°401
4 7°351
123°001
122°551
1-15
122°501
0
Scale
122°501
122°451
5km I
122°451
47°501
47°451
47°401
47°351

123°101
47°301
47°251
47°201
123° 101
123°051
123°051
123°001
0 I
123°001
Scale
122°551
5km I
122°551
122°501
122°451
47°301
47°251
47°201
122°451

75
122°301
122°251
122°20' 122° 151
4 0°2O'-....,....---...------------,......-...----------.------------r----,49o2O'
48°151
48°101
48°051
1-17
Camano Island
122°301
Ba••• 88°
o•• Qo_, 09~
'1Jo • oD
122°251
8 • •
122°20'
0 I
Scale
5km I
122°151
48°151
48°101
48°051

48°001
47°551
47°501
1-18
122°251
Whidbey Island
122°251
76
122°20'
~8
Gedney Is.
122°20'
122°151
Port Gardner
0 J
122°151
Scale
'122°10
5km I
122°101
48°001
47°551
47°501

122°401
122°351
122°301
47°451
47°401
47°351
0
122°251
122°20'
8-1
(J estPt., Pier 91 u Ellr'ott Boy
47°451
47°401
47°351

r-'
I N 0
122°451
47°25'
47°201
122°451
0 I
Scale
122°401
5km I
122°401
122°351
Gig Harbor
122°351
122°301
VASHON ISLAND
122°301
122°251
D-7-
122°251
122°201
47°301
47°251
D-6
122°201

47°201
47°151
47°101
47°051
1-21
0 I
122°251
TACOMA
Scale
122°251
79
122°201
122°151
47°15
47°101
47°051
5km
122°201
122°151

122°451
47°201
47°151
47°101
47°051
122°451
1-22
80
~ Kentron
Is.
D-55
122°401
122°35 122°301
47°201
0 5km
Scale
122°351
122°301

47°201
47°151
47°101
47°051
0
1-2,3
123°051
Scale
5km I
81
123°001
123°001
122°55 1
Hartstene Island
123°55 1
!;; ~ " ~o 21 Herron
Is.
Johnson Pt.
123°501
47°201
47°151
47°051
APPENDIX 2
MAPS OF DISTRIBUTION RECORDS OF KELP


000000
00000
+++++
84
SYMBOLS USED FOR KELP RECORDS
Rigg 1911-12
Washington Department of Fisheries 1975-89
Washington Department of Wildlife 1977-78
U.S. Geological Survey 1886
U.S. Geological Survey 1875
/////// Washington State University 1954
xxxxxx U.S. Coast Survey 1856
***** U.S. Geological Survey 1854
••••• Coast Pilot 1889
••• • Coast Pilot 1926
0000 Coast Pilot 1951
Hydrographic Surveys 1852-1889
• Phillips 1962-63

48°301
48°201
48°101
2-1
0 I I I
Scale
85
124°501
124°401
PACIFIC OCEAN 48°20
1
48°101
5km
124°501

48°301
48°201
48°101
2-2
124°301
0
Scale
124°301
5km I
86
124°201
124°101
48°301
48°201
48°10
124°201
124°101

124()001
48°301
48°201
48°101
0 5km I I
Scale
124°001
2-3
87
123°501
STR/11 ,... T OF JU, '.4N DE FUc,4
--• ~ DonnnQ, o l,l~o 0
0 00 0-0-0-0
123°501
123°401
48°301
48°201
48°101
123°401

88
123°301
123°201
48°301
48°201
48°201
STRAIT OF JUAN DE FUCA
48°101 48°10
1
0 5km I I
Scale
123°301
123°201
2-4

123°101
48°301
48°201
123°101
2-5
89
123°001
0
••••• ,. ·.: . 6 •• y ,.
•• 6
Hein Bank
• J'Z\.. 00
•(f[!;J c9
LOPEZ IS .
122°501
STRAIT OF JUAN DE FUCA
123°001
t~~ Jl:'o~
~00 0
Partridge Bank
f~
Protect ion rP 0
ls. er'/. Cape George
~22°501
48°301
48°201
48°101

N I
0\
48°401
123°401
0
123°401
d2J
5km I I I I
Scale
123°201
D 0 ~
~ ~ ~
0:++ ~:
123°201
123°101
~ ~
123°10'
123°001
• c9C\:Jo •.o
o• 0
OF lattop Is.
SAN JUAN ISLAND
Patos Is.
48°401
\.0 0

0 ~ (J)
"'" I
2-7
91 0 lO 0 co "'"

N I
(J:J
49°001
48°501
122°501
Semiahmoo Bay
STRAIT OF
GEORGIA
0 L.....l
Scale
5km
\ 122°50
1
122°401
122°301
123°401
122°301
122°301
-------i
49°001
48°501
122°20'
I..O N

N I
'° ~-l'o
• 0 ..
122°501
?:, 00
~
0 oo
rtJ0
a Is .
o~~ Mati~o
:&··oe
Sandy Pt.
122°401
......._• 0:::i
.<::-~
Q_(l;
~~ ::J
-....J
CJ:)
It\ rr----< (;)
Barnes8 ~ Clark Is.
Is. ~(I t ~
48°401
1 \ 1 ORCAS ISLAND
00
Sinclai~0
~~•
0
Is. o
.o 0
-- 0
CJ:)
b '"""-
4Eliza Is.
.('---)Vendovi -~ Is.
William Pt. ~ack Is.
122°301
SAM/SH BAY
Scale
5km I
48°401
0 ,1 ()) ) 5- ~ (\ ~~ ~ C= 148°30 48 30 _ -- _, 1220401 122 30
'° w

48°3d
48°201
48°101
• 0
0
INLET
oo• o ~gg~
/
Pt Wilson
2-10
122°401
Fidalgo Is.
WHIDBEY ISLAND
122°401
94
122°301
Padtl!a Bay
Ponell Pt.
122°301
0 I I
Scale
5km I
122°201
48°301
48°201
48°101
122°201
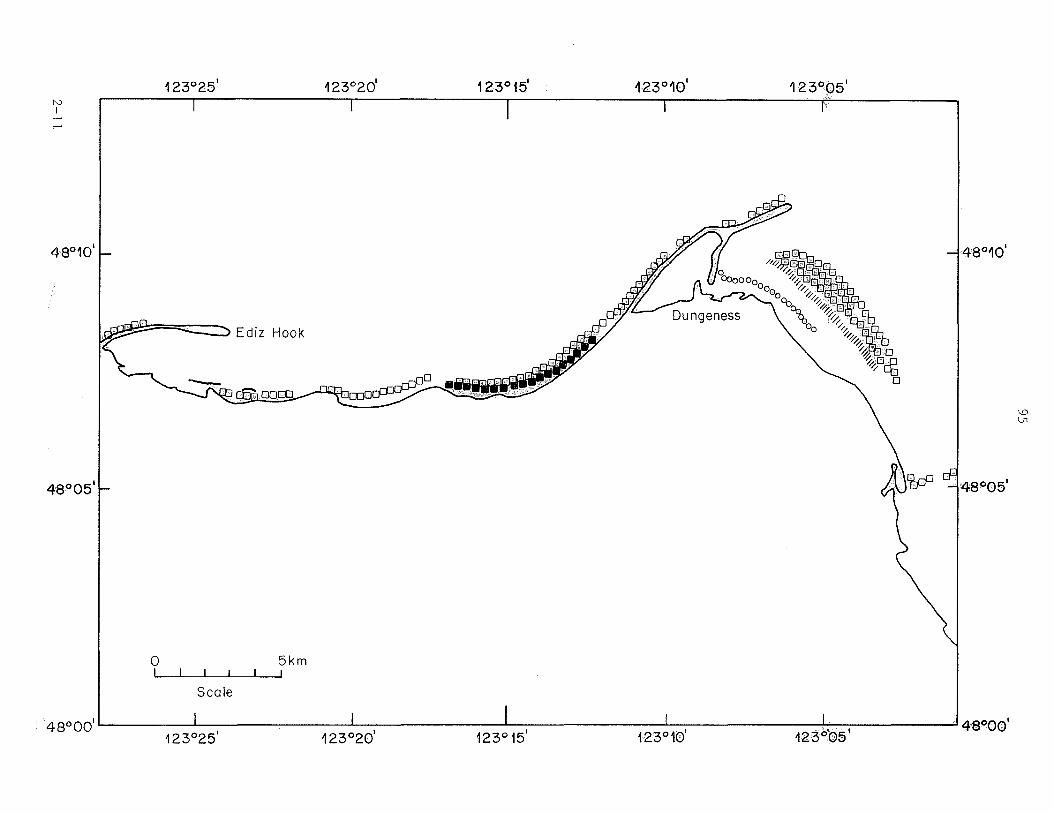
N I ,->---'
48°101
48°051
0 I
123°251
5km
Scale
123°201
123°151
123°101
123°051
48°101
48°051
48°001
. 48°001
123°251 123°201
123°151
123°101
123°051
'° V,

N I
f-' N
48°101
48°051
48°001
123°101
0
~23°101
123°051
5km
Scale
123°051
123°001
122°551
122°501
o:::QJ
123°001
122°551
122°501
122°451
48°101
48°051
48°001
122°451
'° 0-,

123°001
48°151
48°101
48°051
123°001
2-13
Scale
122°551
5km (
122°551
97
122°501
122°451
48°151
48°051
122°501
122°451

98
122°451 122°40
1 122°35
1
48°151
48°151
48°10'
48°051
48°051
0
48°001 ________ __.. _____ ...._ _____ __,_ _________ ...._ ________ _
~22°45° i22°4O1
122°351
122°301
2-14

99
122°451
122°401
122°351
122°301
48°001
48°001
47°551
47°551
47°501
47°501
5km
Scale
122°451
122°401
122°351
122°301
2-15

100
123°001
122°551
47°501
47°451
47°401
47°351
123°00 122°551
2-16
122°501
0 I
122°501
I I Scale
122°451
47°501
- 47°451
5km I
122°45'
47°401
47°351

N I
>--' '1
47°301
47°251
47°201
123°101
123°101
123°051
123°051
123°001
0 I
123°001
123°551
123°501
5km
Scale
122°551
122°501
122°451
47°301
47°251
47°201
~22°451
>--' 0 >-'

102
122°301
122° 251
122°20' 122°15 1
48°201 ---------r-----------......=~---------'T'"'""-----------,----, 48°20
1
48~151
48°151
48°101
2-18
Camano Island
122°301
122°251
~22°20'
0
Scale
Tula/Ip Bay
5km I
122°151
48°151
48°151
48°101

48°001
47°551
2-19
122°251
Sandy Pt.
Whidbey Island
122°251
103
122°201
~ Gedney ls.
122°20'
122°~5•
Port Gardner
0
122°151
Scale
~ 22°10
48°001
47°551
47°501
5km

N I
N 0
47°451
4 7°401
47°351
0
122°401
122°401
122°351
122°351
Bainbridge Island
122°301
Pt. .• Jefferson
·--+ oo •
122°301
122°15 1
122°151
D D
122°10'
122°10'
47°451
47°401
47°351

N I
N ,-...
122°451
4 7°251
47°201
0 I I
Scale
122°401
122°351
5km D I
. . . Gig
Harbor
122°401
422°351
. .
122°301
VASHON ISLAND
. . . . .
122° 301
122°251
.
122°251
122°20'
47°301
47°251
D D D D
~ 60 g8 ~ 6
47°201
122°201

47°201
47°101
47°051
2-22
122°251
~~
0 I
TACOMA
Scale
122°251
5km I
106
122°20' 122°151 122°10'
47°201
47°151
41°m'
47°051
122°20' 122°151
122° 101

107
122°45° 122°401
122°351
122°301
47°201
47°201
47°151
47°151
47°101
47°051 47°05
1
0 5km
Scale
122°451
122°401
122°351
~22°301
2-23

47°20°
47°101
47°051
0
2-24
123°051
Scale
123°051
5km )
123°001
123°001
108
122°551
Hartstene Island
122°551
~22°501
!;; ?
()! {} c}
Herron Is.
Johnson • Pt.
00
122°501
47°201
47°101
47°051


