Embed Size (px)
Citation preview
SUEZ H1 2021 Results
July 29th, 2021
28-July-21 SUEZ H1 2021 Results 1
H1 2021 RESULTS
July 28th, 2021

Bertrand Camus
Chief Executive Officer
28-July-21 SUEZ H1 2021 Results 2
PERFORMANCE
AND STRATEGY
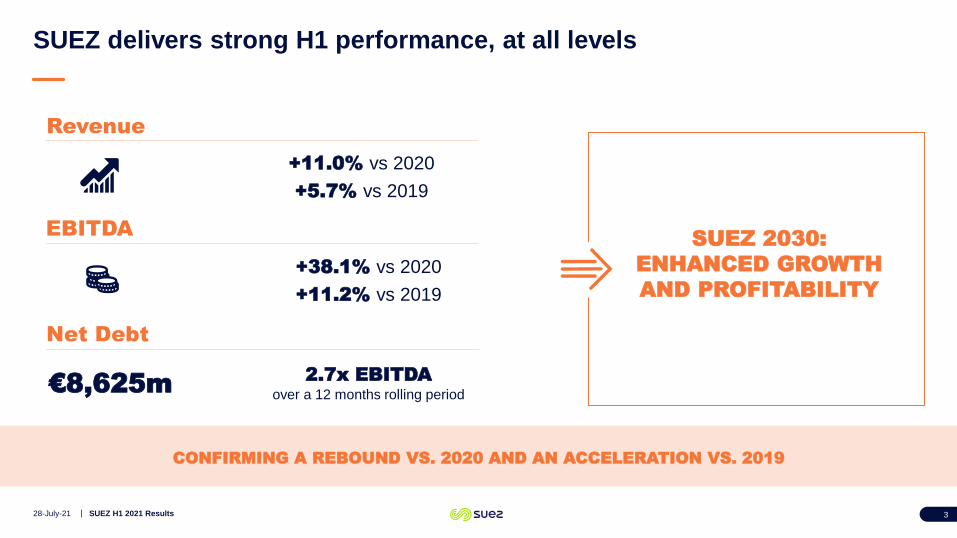
SUEZ delivers strong H1 performance, at all levels
28-July-21 SUEZ H1 2021 Results 3
CONFIRMING A REBOUND VS. 2020 AND AN ACCELERATION VS. 2019
SUEZ 2030:
ENHANCED GROWTH
AND PROFITABILITY
Revenue
EBITDA
+11.0% vs 2020
+5.7% vs 2019
+38.1% vs 2020
+11.2% vs 2019
Net Debt
€8,625m 2.7x EBITDAover a 12 months rolling period
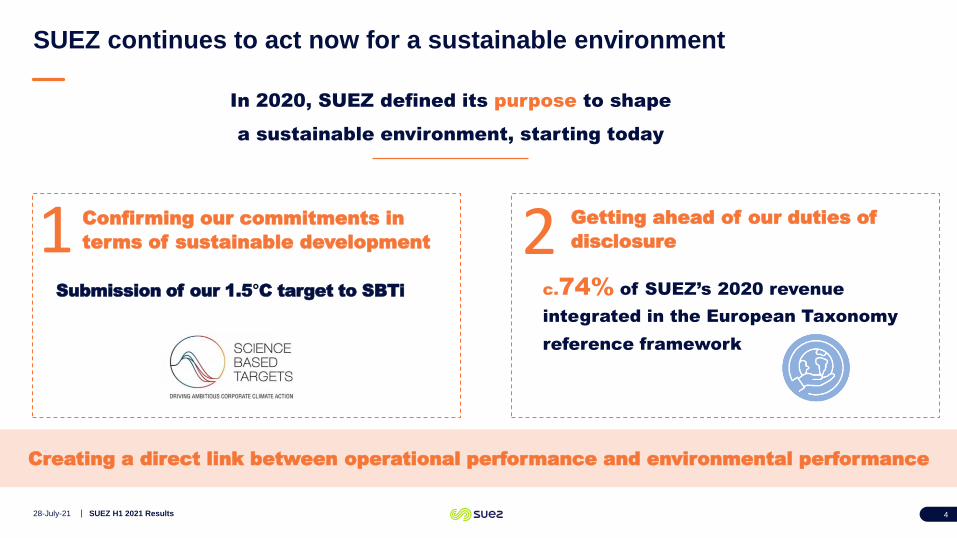
SUEZ continues to act now for a sustainable environment
428-July-21 SUEZ H1 2021 Results
Creating a direct link between operational performance and environmental performance
Confirming our commitments in
terms of sustainable development
Getting ahead of our duties of
disclosure
Submission of our 1.5°C target to SBTi c.74% of SUEZ’s 2020 revenue
integrated in the European Taxonomy
reference framework
In 2020, SUEZ defined its purpose to shape
a sustainable environment, starting today
1 2
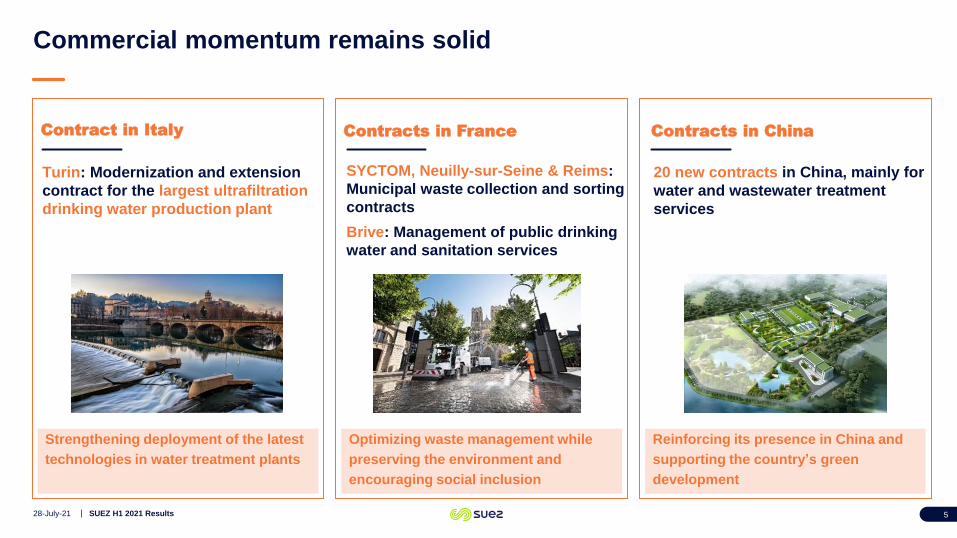
Commercial momentum remains solid
528-July-21 SUEZ H1 2021 Results
Contracts in France
SYCTOM, Neuilly-sur-Seine & Reims:
Municipal waste collection and sorting
contracts
Brive: Management of public drinking
water and sanitation services
Contracts in ChinaContract in Italy
Turin: Modernization and extension
contract for the largest ultrafiltration
drinking water production plant
Strengthening deployment of the latest
technologies in water treatment plants
Optimizing waste management while
preserving the environment and
encouraging social inclusion
Reinforcing its presence in China and
supporting the country’s green
development
20 new contracts in China, mainly for
water and wastewater treatment
services
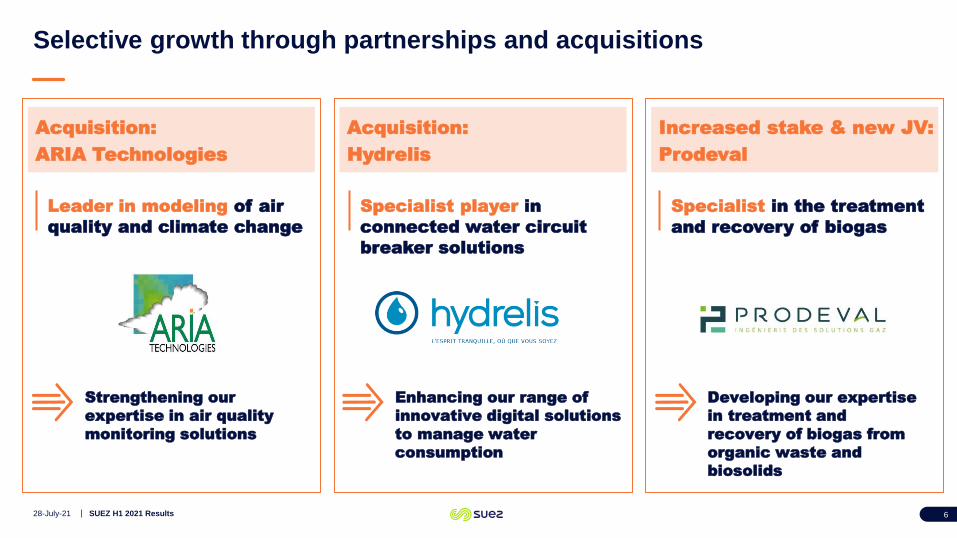
Increased stake & new JV:
Prodeval
Selective growth through partnerships and acquisitions
628-July-21 SUEZ H1 2021 Results
Leader in modeling of air
quality and climate change
Specialist player in
connected water circuit
breaker solutions
Strengthening our
expertise in air quality
monitoring solutions
Enhancing our range of
innovative digital solutions
to manage water
consumption
Acquisition:
ARIA Technologies
Acquisition:
Hydrelis
Specialist in the treatment
and recovery of biogas
Developing our expertise
in treatment and
recovery of biogas from
organic waste and
biosolids
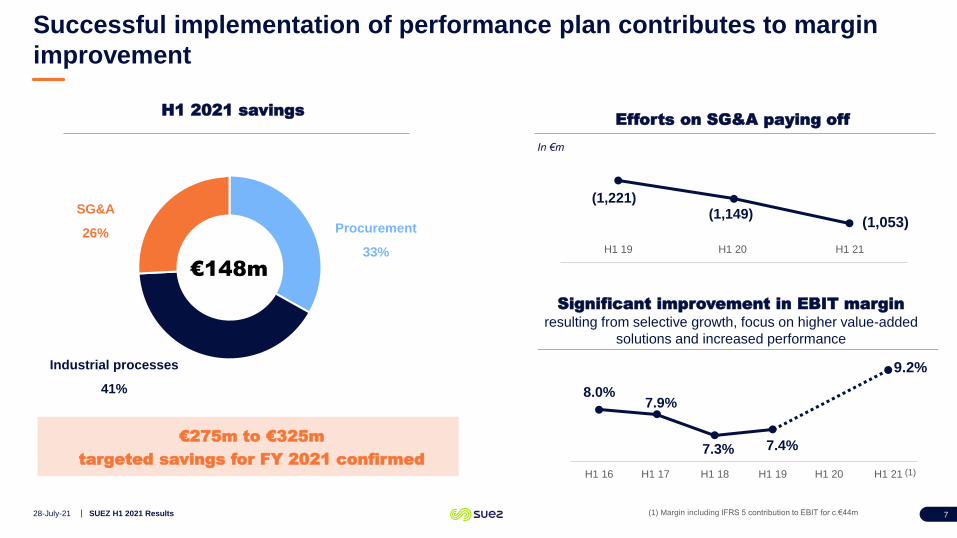
Successful implementation of performance plan contributes to margin
improvement
728-July-21 SUEZ H1 2021 Results
H1 2021 savings
SG&A
26%
Industrial processes
41%
Procurement
33%
8.0%7.9%
7.3% 7.4%
9.2%
H1 16 H1 17 H1 18 H1 19 H1 20 H1 21 (1)
(1) Margin including IFRS 5 contribution to EBIT for c.€44m
Significant improvement in EBIT marginresulting from selective growth, focus on higher value-added
solutions and increased performance
Efforts on SG&A paying off
(1,221)(1,149)
(1,053)
H1 19 H1 20 H1 21
In €m
€275m to €325m
targeted savings for FY 2021 confirmed
€148m
98
119107
160
+1.4%
(8.7)%
+57.7%
0
0
0
0
0
0
0
1
1
1
0
20
40
60
80
100
120
140
160
180
H1 18 H1 19 H1 20 H1 21
EBITDA
(35)
(86)
+16
+81
0
0
0
1
1
1
1
-100
-80
-60
-40
-20
0
20
40
60
80
100
H1 18 H1 19 H1 20 H1 21
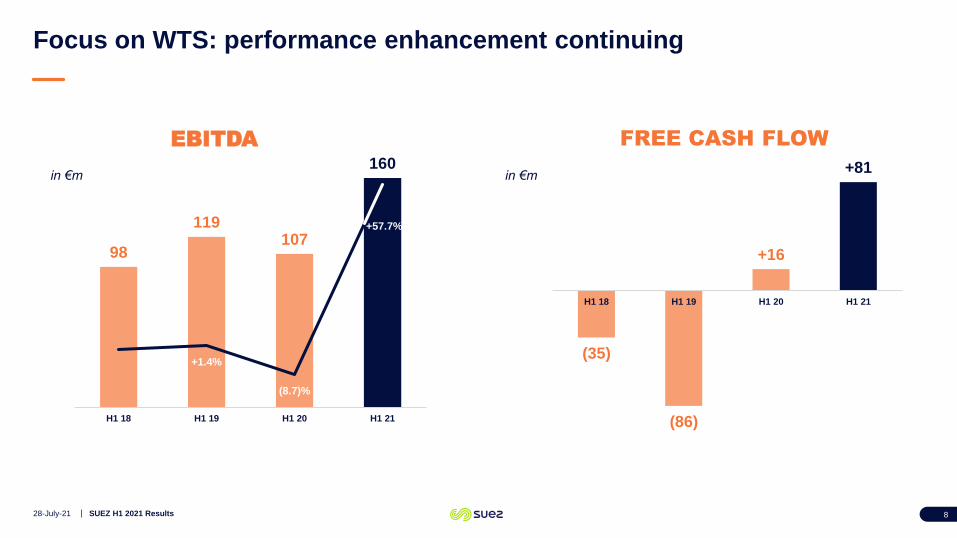
Focus on WTS: performance enhancement continuing
828-July-21 SUEZ H1 2021 Results
in €m
FREE CASH FLOW
in €m
Julian WALDRON
Chief Financial Officer
28-July-21 SUEZ H1 2021 Results
H1 2021
FINANCIAL RESULTS
9
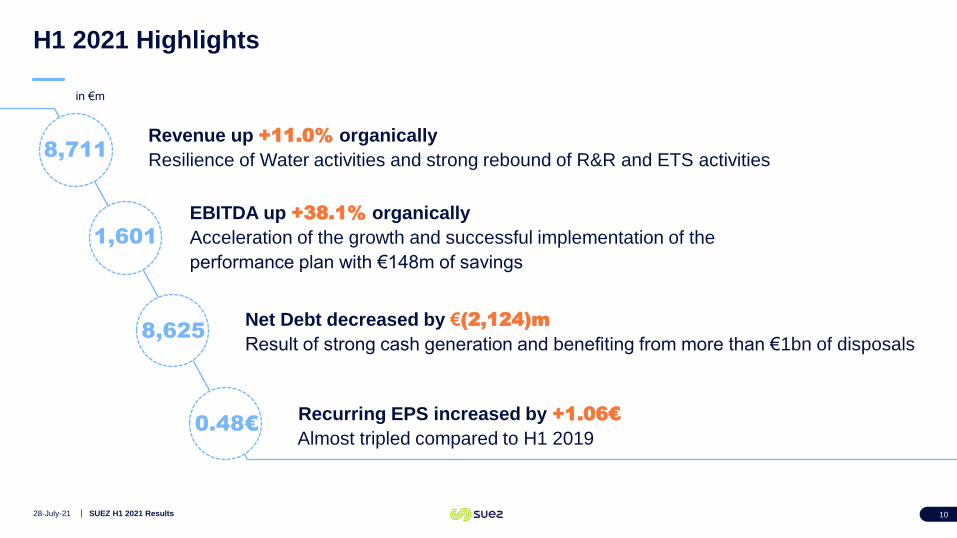
H1 2021 Highlights
28-July-21 SUEZ H1 2021 Results 10
8,711Revenue up +11.0% organically
Resilience of Water activities and strong rebound of R&R and ETS activities
1,601EBITDA up +38.1% organically
Acceleration of the growth and successful implementation of the
performance plan with €148m of savings
8,625Net Debt decreased by €(2,124)m
Result of strong cash generation and benefiting from more than €1bn of disposals
0.48€Recurring EPS increased by +1.06€
Almost tripled compared to H1 2019
in €m
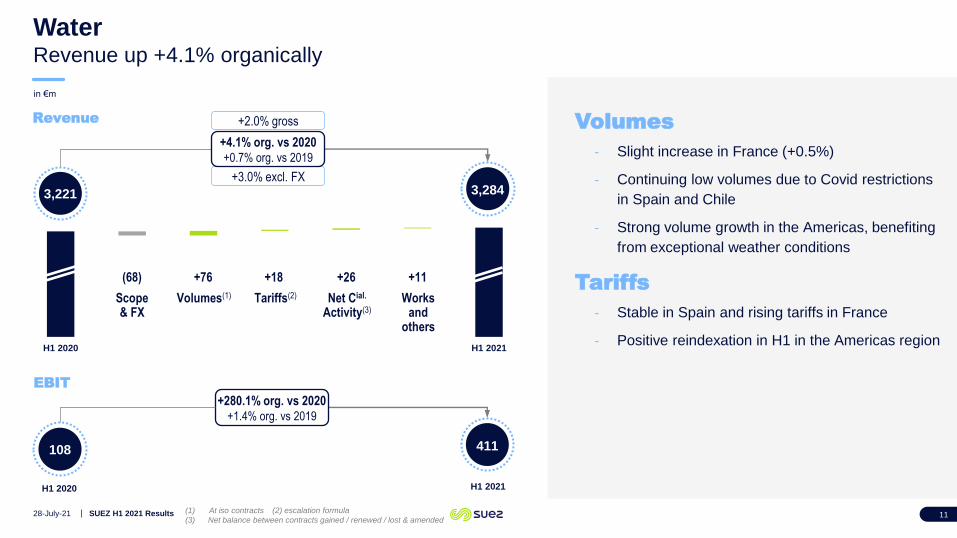
WaterRevenue up +4.1% organically
28-July-21 SUEZ H1 2021 Results 11
H1 2020 H1 2021
Net Cial.
Activity(3)Scope& FX
Volumes(1) Tariffs(2)
(68) +76 +18 +26 +11
in €m
+2.0% gross
3,221 3,284+3.0% excl. FX
+4.1% org. vs 2020+0.7% org. vs 2019
Works and
others
(1) At iso contracts (2) escalation formula
(3) Net balance between contracts gained / renewed / lost & amended
Volumes
- Slight increase in France (+0.5%)
- Continuing low volumes due to Covid restrictions
in Spain and Chile
- Strong volume growth in the Americas, benefiting
from exceptional weather conditions
Tariffs
- Stable in Spain and rising tariffs in France
- Positive reindexation in H1 in the Americas region
108 411
+280.1% org. vs 2020+1.4% org. vs 2019
H1 2020 H1 2021
Revenue
EBIT
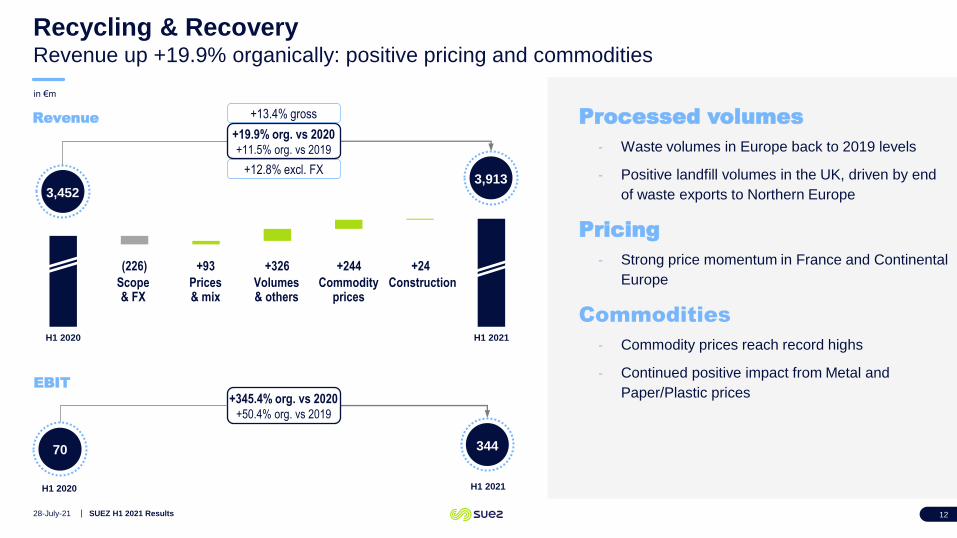
Recycling & RecoveryRevenue up +19.9% organically: positive pricing and commodities
28-July-21 SUEZ H1 2021 Results 12
H1 2020 H1 2021
+12.8% excl. FX
Processed volumes
- Waste volumes in Europe back to 2019 levels
- Positive landfill volumes in the UK, driven by end
of waste exports to Northern Europe
Pricing
- Strong price momentum in France and Continental
Europe
Commodities
- Commodity prices reach record highs
- Continued positive impact from Metal and
Paper/Plastic prices
Scope& FX
Prices& mix
Volumes& others
Commodity prices
Construction
(226) +93 +326 +244 +24
+13.4% gross
3,4523,913
in €m
70 344
+345.4% org. vs 2020+50.4% org. vs 2019
H1 2020 H1 2021
Revenue
EBIT
+19.9% org. vs 2020+11.5% org. vs 2019
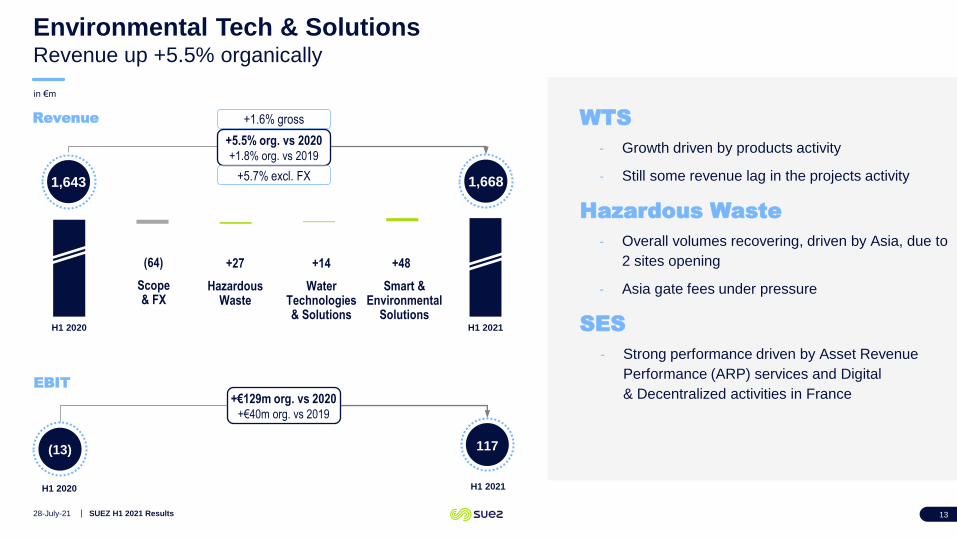
Environmental Tech & SolutionsRevenue up +5.5% organically
28-July-21 SUEZ H1 2021 Results 13
H1 2020 H1 2021
Scope& FX
HazardousWaste
Water Technologies & Solutions
Smart & Environmental
Solutions
(64) +27 +14 +48
+1.6% gross
+5.5% org. vs 2020+1.8% org. vs 2019
+5.7% excl. FX1,643 1,668
WTS
- Growth driven by products activity
- Still some revenue lag in the projects activity
Hazardous Waste
- Overall volumes recovering, driven by Asia, due to
2 sites opening
- Asia gate fees under pressure
SES
- Strong performance driven by Asset Revenue
Performance (ARP) services and Digital
& Decentralized activities in France
in €m
(13) 117
+€129m org. vs 2020+€40m org. vs 2019
H1 2020 H1 2021
Revenue
EBIT
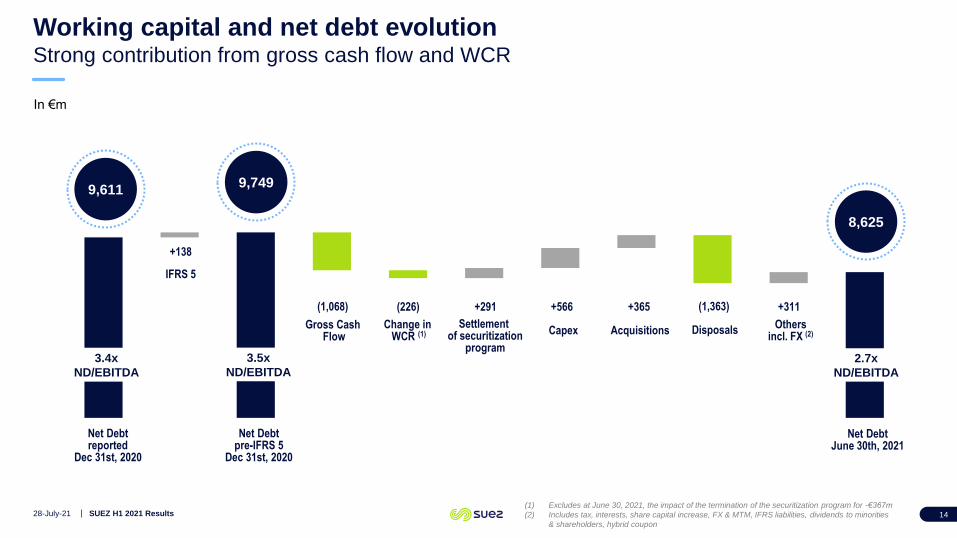
Working capital and net debt evolutionStrong contribution from gross cash flow and WCR
28-July-21 SUEZ H1 2021 Results 14
(1,068)
Gross CashFlow
(226)
Change in WCR (1)
+566
Capex
+311
Othersincl. FX (2)
+365
Acquisitions
Net Debtreported
Dec 31st, 2020
Net DebtJune 30th, 2021
In €m
8,625
9,749
2.7x
ND/EBITDA
3.4x
ND/EBITDA
+291
Settlement of securitization
program
9,611
+138
3.5x
ND/EBITDA
IFRS 5
Net Debtpre-IFRS 5
Dec 31st, 2020
(1) Excludes at June 30, 2021, the impact of the termination of the securitization program for -€367m
(2) Includes tax, interests, share capital increase, FX & MTM, IFRS liabilities, dividends to minorities
& shareholders, hybrid coupon
(1,363)
Disposals
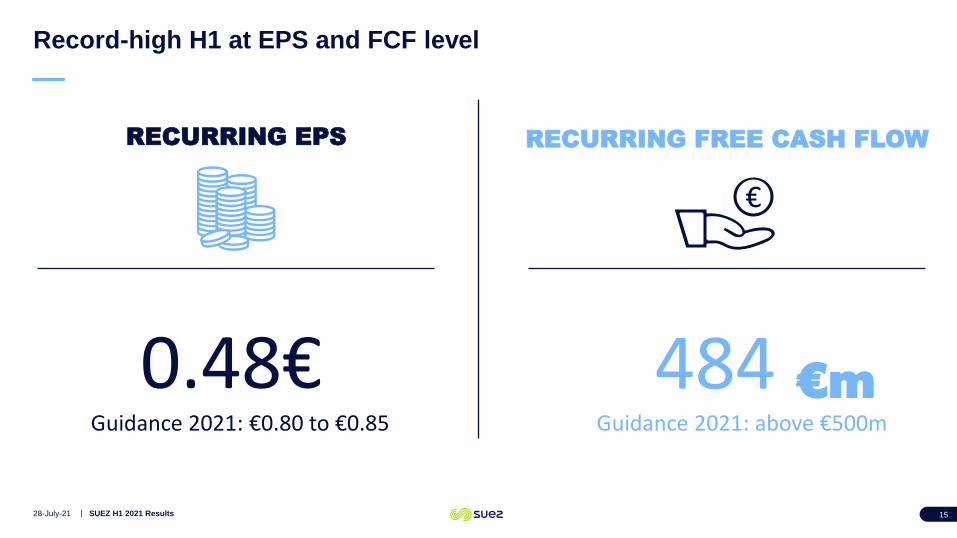
Record-high H1 at EPS and FCF level
28-July-21 SUEZ H1 2021 Results 15
RECURRING EPS RECURRING FREE CASH FLOW
0.48€ 484 €m
€
Guidance 2021: €0.80 to €0.85 Guidance 2021: above €500m

Bertrand Camus
Chief Executive Officer
28-July-21 SUEZ H1 2021 Results 16
SUEZ – VEOLIA
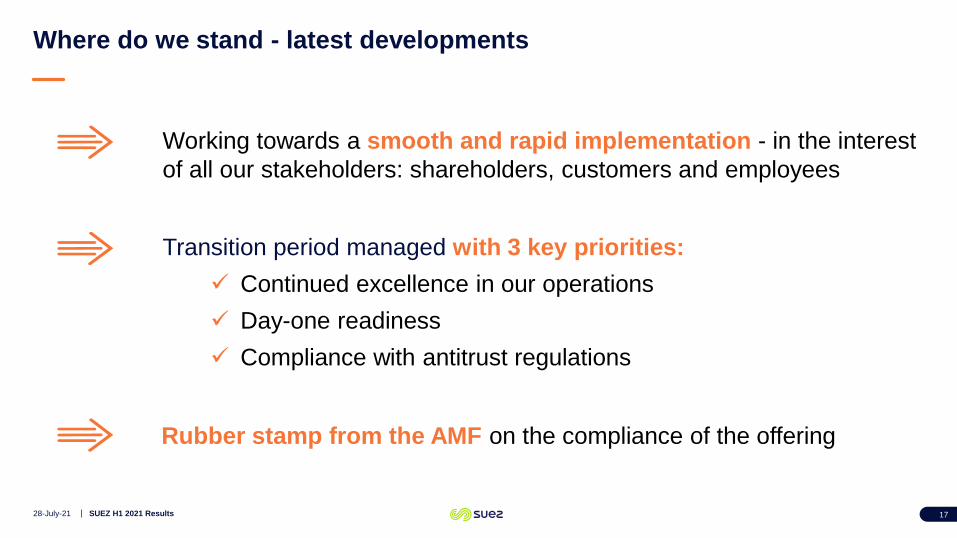
Where do we stand - latest developments
28-July-21 SUEZ H1 2021 Results 17
Working towards a smooth and rapid implementation - in the interest
of all our stakeholders: shareholders, customers and employees
Transition period managed with 3 key priorities:
✓ Continued excellence in our operations
✓ Day-one readiness
✓ Compliance with antitrust regulations
Rubber stamp from the AMF on the compliance of the offering
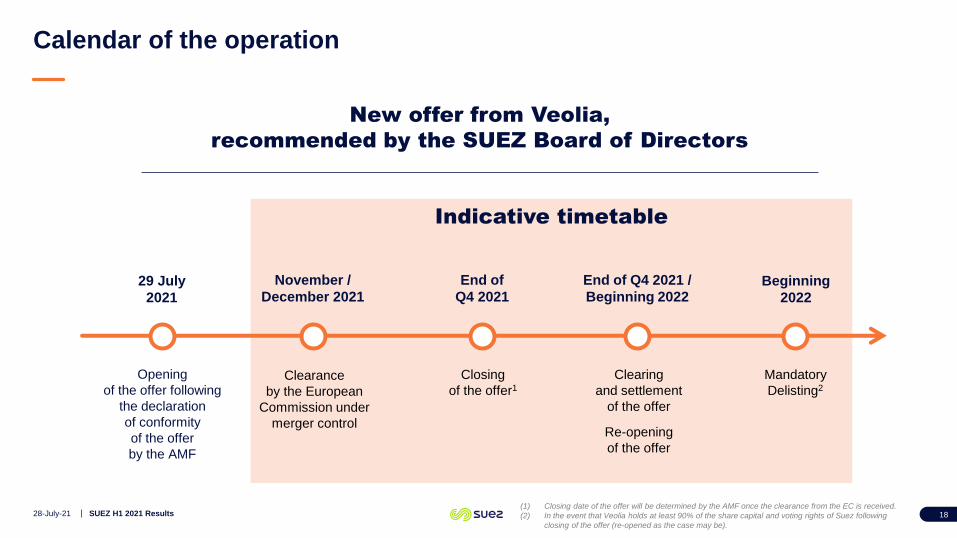
Calendar of the operation
1828-July-21 SUEZ H1 2021 Results
New offer from Veolia,
recommended by the SUEZ Board of Directors
Indicative timetable
29 July
2021
November /
December 2021
End of
Q4 2021
End of Q4 2021 /
Beginning 2022Beginning
2022
Opening
of the offer following
the declaration
of conformity
of the offer
by the AMF
Clearance
by the European
Commission under
merger control
Closing
of the offer1
Clearing
and settlement
of the offer
Re-opening
of the offer
Mandatory
Delisting2
(1) Closing date of the offer will be determined by the AMF once the clearance from the EC is received.
(2) In the event that Veolia holds at least 90% of the share capital and voting rights of Suez following
closing of the offer (re-opened as the case may be).
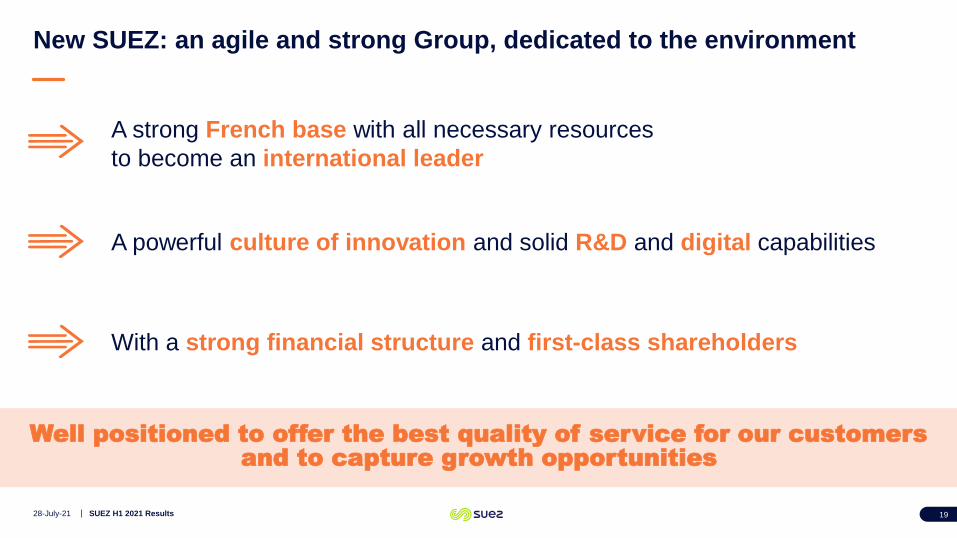
New SUEZ: an agile and strong Group, dedicated to the environment
28-July-21 SUEZ H1 2021 Results 19
Well positioned to offer the best quality of service for our customers and to capture growth opportunities
A strong French base with all necessary resources
to become an international leader
A powerful culture of innovation and solid R&D and digital capabilities
With a strong financial structure and first-class shareholders

Bertrand Camus
Chief Executive Officer
28-July-21 SUEZ H1 2021 Results 20
CONCLUSION
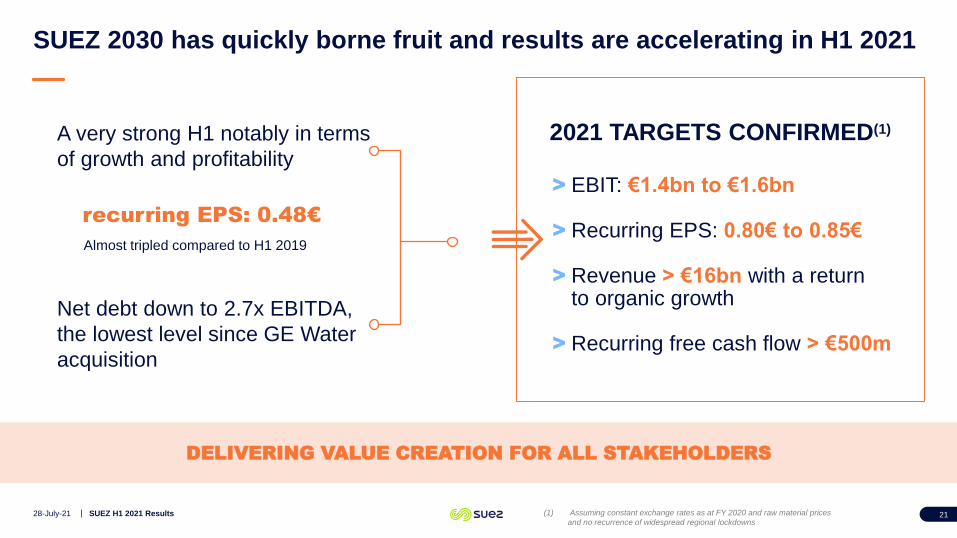
2021 TARGETS CONFIRMED(1)
> EBIT: €1.4bn to €1.6bn
> Recurring EPS: 0.80€ to 0.85€
> Revenue > €16bn with a return to organic growth
> Recurring free cash flow > €500m
SUEZ 2030 has quickly borne fruit and results are accelerating in H1 2021
28-July-21 SUEZ H1 2021 Results 21
A very strong H1 notably in terms
of growth and profitability
Net debt down to 2.7x EBITDA,
the lowest level since GE Water
acquisition
DELIVERING VALUE CREATION FOR ALL STAKEHOLDERS
(1) Assuming constant exchange rates as at FY 2020 and raw material prices
and no recurrence of widespread regional lockdowns
recurring EPS: 0.48€
Almost tripled compared to H1 2019

APPENDICES
28-July-21
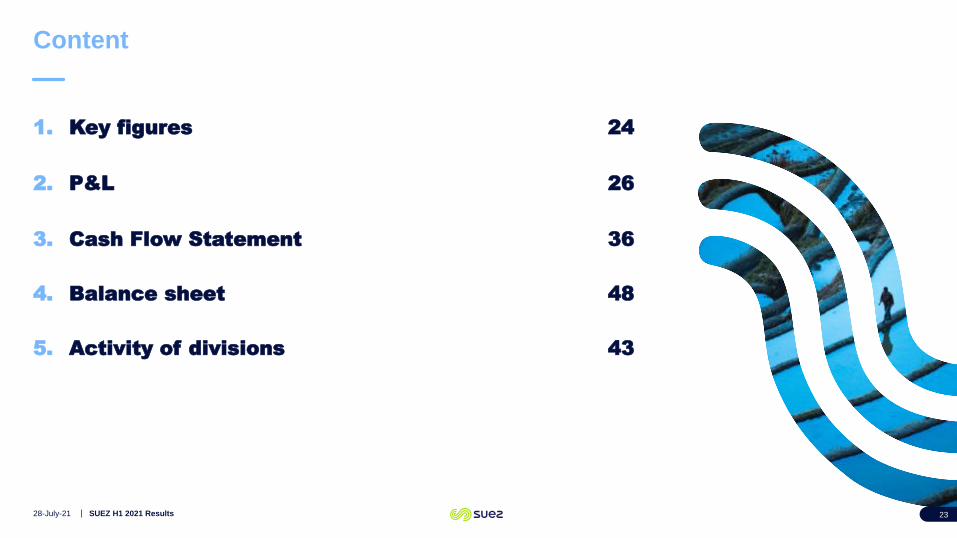
Content
1. Key figures 24
2. P&L 26
3. Cash Flow Statement 36
4. Balance sheet 48
5. Activity of divisions 43
28-July-21 SUEZ H1 2021 Results 23

1Key figures
28-July-21 SUEZ H1 2021 Results 24
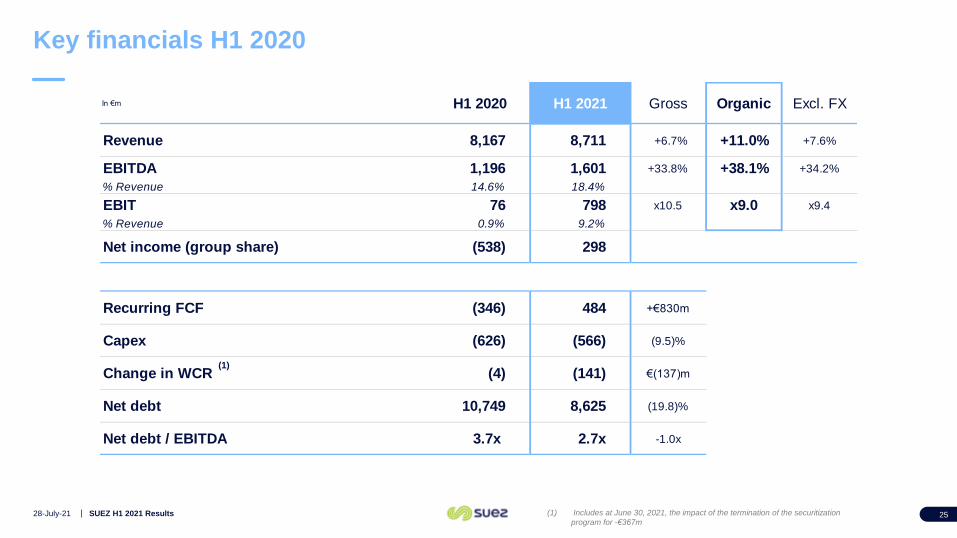
Key financials H1 2020
Revenue 8,167 8,711 +6.7% +11.0% +7.6%
EBITDA 1,196 1,601 +33.8% +38.1% +34.2%
% Revenue 14.6% 18.4%
EBIT 76 798 x10.5 x9.0 x9.4
% Revenue 0.9% 9.2%
Net income (group share) (538) 298
Recurring FCF (346) 484 +€830m
Capex (626) (566) (9.5)%
Change in WCR (4) (141) €(137)m
Net debt 10,749 8,625 (19.8)%
Net debt / EBITDA 3.7x 2.7x -1.0x
Excl. FXGrossIn €m H1 2020 H1 2021 Organic
28-July-21 SUEZ H1 2021 Results 25
(1)
(1) Includes at June 30, 2021, the impact of the termination of the securitization
program for -€367m

2P&L
28-July-21 SUEZ H1 2021 Results 26
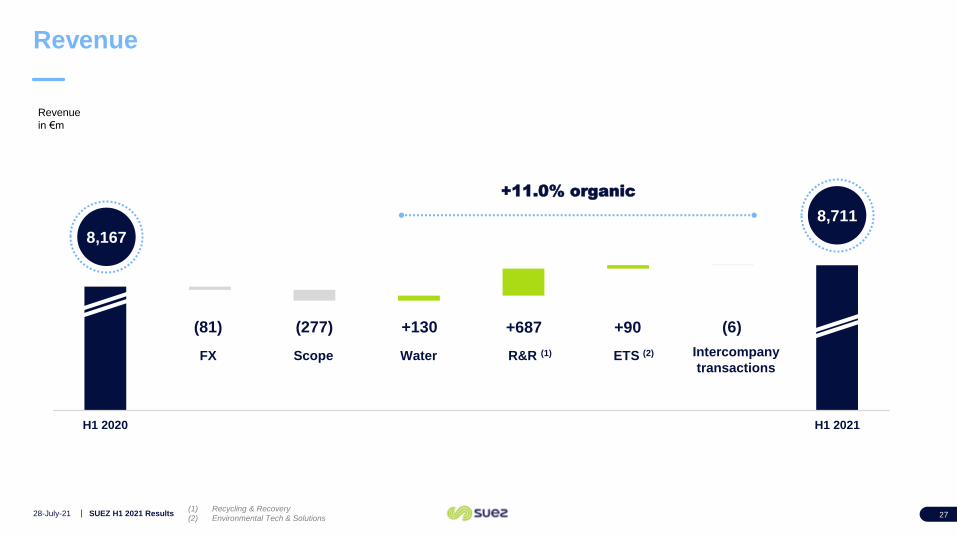
Revenue
28-July-21 SUEZ H1 2021 Results 27
H1 2020 H1 2021
8,167
8,711
FX
(81)
Scope
(277)
Intercompany
transactions
(6)
R&R (1)
+11.0% organic
ETS (2)
+90+687
Revenue
in €m
Water
+130
(1) Recycling & Recovery
(2) Environmental Tech & Solutions
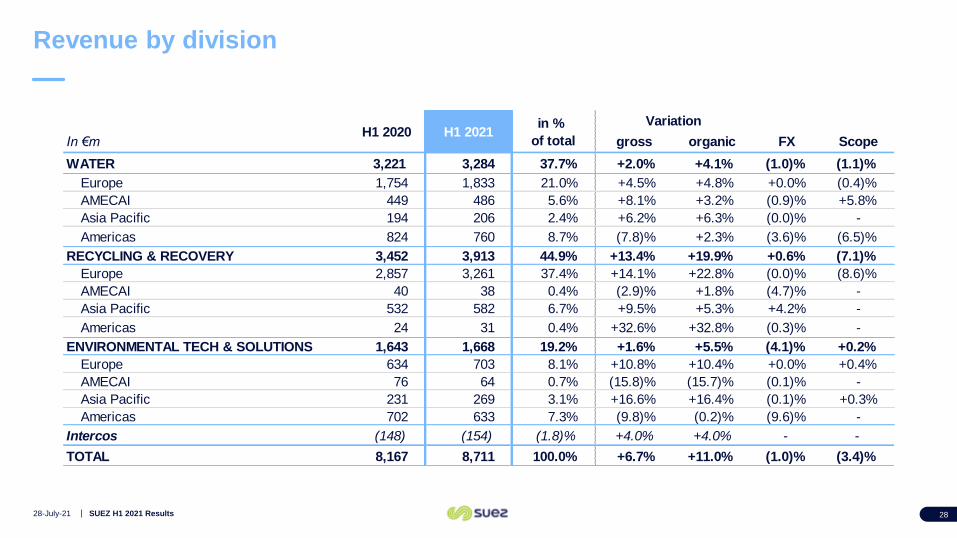
Revenue by division
28-July-21 SUEZ H1 2021 Results 28
In €m gross organic FX Scope
WATER 3,221 3,284 37.7% +2.0% +4.1% (1.0)% (1.1)%
Europe 1,754 1,833 21.0% +4.5% +4.8% +0.0% (0.4)%
AMECAI 449 486 5.6% +8.1% +3.2% (0.9)% +5.8%
Asia Pacific 194 206 2.4% +6.2% +6.3% (0.0)% -
Americas 824 760 8.7% (7.8)% +2.3% (3.6)% (6.5)%
RECYCLING & RECOVERY 3,452 3,913 44.9% +13.4% +19.9% +0.6% (7.1)%
Europe 2,857 3,261 37.4% +14.1% +22.8% (0.0)% (8.6)%
AMECAI 40 38 0.4% (2.9)% +1.8% (4.7)% -
Asia Pacific 532 582 6.7% +9.5% +5.3% +4.2% -
Americas 24 31 0.4% +32.6% +32.8% (0.3)% -
ENVIRONMENTAL TECH & SOLUTIONS 1,643 1,668 19.2% +1.6% +5.5% (4.1)% +0.2%
Europe 634 703 8.1% +10.8% +10.4% +0.0% +0.4%
AMECAI 76 64 0.7% (15.8)% (15.7)% (0.1)% -
Asia Pacific 231 269 3.1% +16.6% +16.4% (0.1)% +0.3%
Americas 702 633 7.3% (9.8)% (0.2)% (9.6)% -
Intercos (148) (154) (1.8)% +4.0% +4.0% - -
TOTAL 8,167 8,711 100.0% +6.7% +11.0% (1.0)% (3.4)%
H1 2020 H1 2021in %
of total
Variation
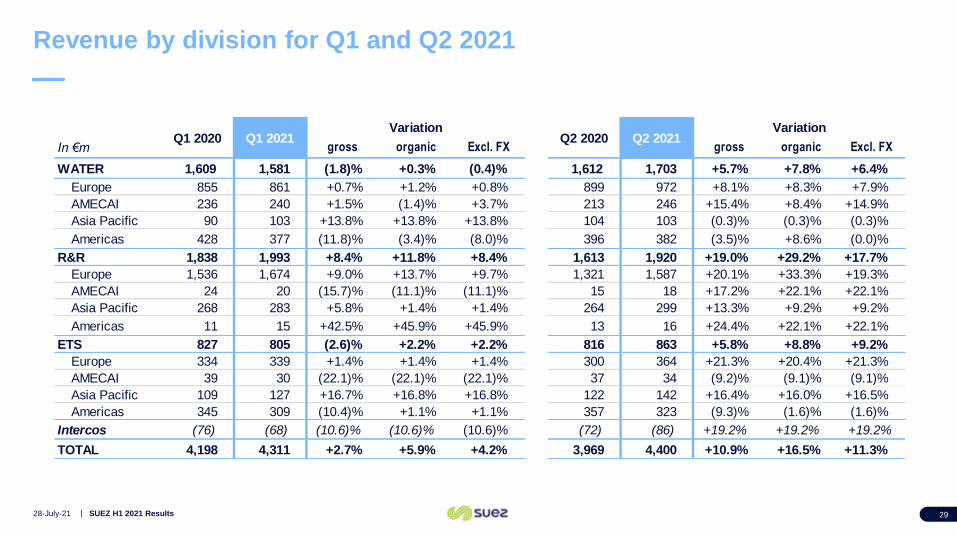
Revenue by division for Q1 and Q2 2021
28-July-21 SUEZ H1 2021 Results 29
In €m gross organic Excl. FX gross organic Excl. FX
WATER 1,609 1,581 (1.8)% +0.3% (0.4)% 1,612 1,703 +5.7% +7.8% +6.4%
Europe 855 861 +0.7% +1.2% +0.8% 899 972 +8.1% +8.3% +7.9%
AMECAI 236 240 +1.5% (1.4)% +3.7% 213 246 +15.4% +8.4% +14.9%
Asia Pacific 90 103 +13.8% +13.8% +13.8% 104 103 (0.3)% (0.3)% (0.3)%
Americas 428 377 (11.8)% (3.4)% (8.0)% 396 382 (3.5)% +8.6% (0.0)%
R&R 1,838 1,993 +8.4% +11.8% +8.4% 1,613 1,920 +19.0% +29.2% +17.7%
Europe 1,536 1,674 +9.0% +13.7% +9.7% 1,321 1,587 +20.1% +33.3% +19.3%
AMECAI 24 20 (15.7)% (11.1)% (11.1)% 15 18 +17.2% +22.1% +22.1%
Asia Pacific 268 283 +5.8% +1.4% +1.4% 264 299 +13.3% +9.2% +9.2%
Americas 11 15 +42.5% +45.9% +45.9% 13 16 +24.4% +22.1% +22.1%
ETS 827 805 (2.6)% +2.2% +2.2% 816 863 +5.8% +8.8% +9.2%
Europe 334 339 +1.4% +1.4% +1.4% 300 364 +21.3% +20.4% +21.3%
AMECAI 39 30 (22.1)% (22.1)% (22.1)% 37 34 (9.2)% (9.1)% (9.1)%
Asia Pacific 109 127 +16.7% +16.8% +16.8% 122 142 +16.4% +16.0% +16.5%
Americas 345 309 (10.4)% +1.1% +1.1% 357 323 (9.3)% (1.6)% (1.6)%
Intercos (76) (68) (10.6)% (10.6)% (10.6)% (72) (86) +19.2% +19.2% +19.2%
TOTAL 4,198 4,311 +2.7% +5.9% +4.2% 3,969 4,400 +10.9% +16.5% +11.3%
Q1 2020 Q1 2021 Q2 2020Variation Variation
Q2 2021
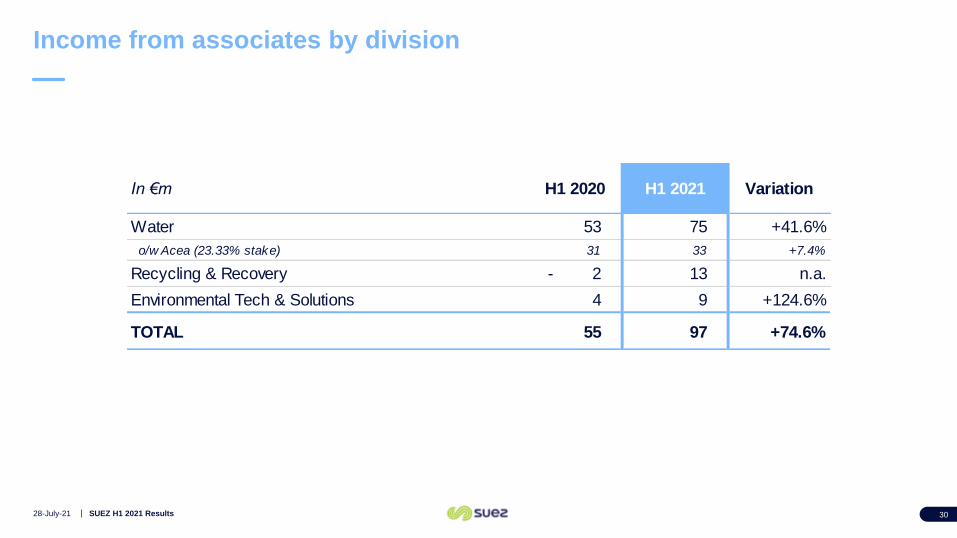
Income from associates by division
28-July-21 SUEZ H1 2021 Results 30
In €m H1 2020 H1 2021 Variation
Water 53 75 +41.6%
o/w Acea (23.33% stake) 31 33 +7.4%
Recycling & Recovery - 2 13 n.a.
Environmental Tech & Solutions 4 9 +124.6%
TOTAL 55 97 +74.6%
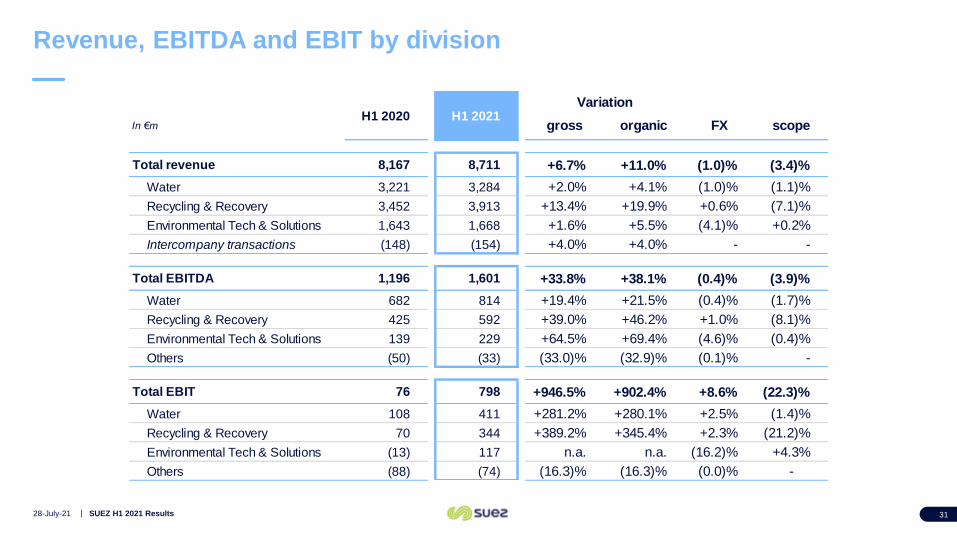
Revenue, EBITDA and EBIT by division
28-July-21 SUEZ H1 2021 Results 31
In €m gross organic FX scope
Total revenue 8,167 8,711 +6.7% +11.0% (1.0)% (3.4)%
Water 3,221 3,284 +2.0% +4.1% (1.0)% (1.1)%
Recycling & Recovery 3,452 3,913 +13.4% +19.9% +0.6% (7.1)%
Environmental Tech & Solutions 1,643 1,668 +1.6% +5.5% (4.1)% +0.2%
Intercompany transactions (148) (154) +4.0% +4.0% - -
Total EBITDA 1,196 1,601 +33.8% +38.1% (0.4)% (3.9)%
Water 682 814 +19.4% +21.5% (0.4)% (1.7)%
Recycling & Recovery 425 592 +39.0% +46.2% +1.0% (8.1)%
Environmental Tech & Solutions 139 229 +64.5% +69.4% (4.6)% (0.4)%
Others (50) (33) (33.0)% (32.9)% (0.1)% -
Total EBIT 76 798 +946.5% +902.4% +8.6% (22.3)%
Water 108 411 +281.2% +280.1% +2.5% (1.4)%
Recycling & Recovery 70 344 +389.2% +345.4% +2.3% (21.2)%
Environmental Tech & Solutions (13) 117 n.a. n.a. (16.2)% +4.3%
Others (88) (74) (16.3)% (16.3)% (0.0)% -
H1 2020 H1 2021Variation
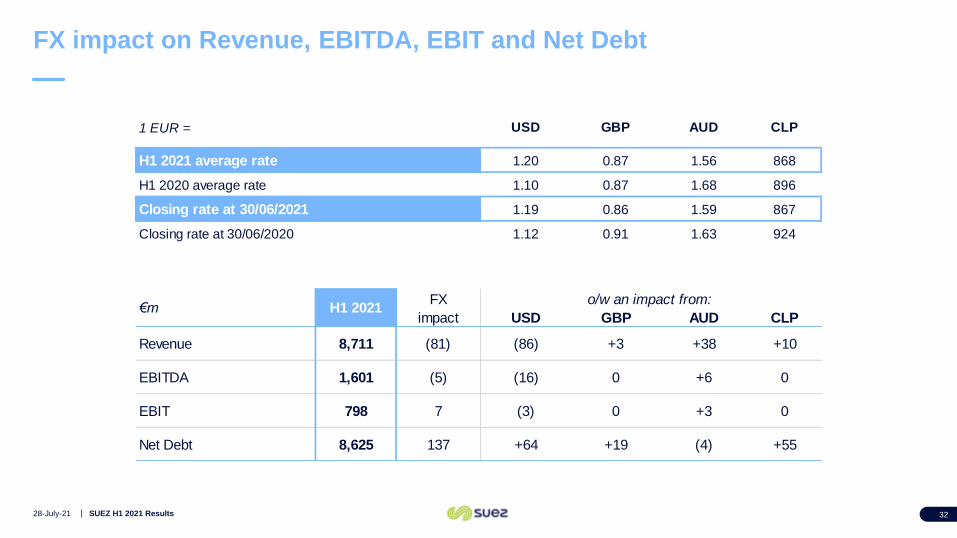
FX impact on Revenue, EBITDA, EBIT and Net Debt
28-July-21 SUEZ H1 2021 Results 32
1 EUR = USD GBP AUD CLP
1.20 0.87 1.56 868
H1 2020 average rate 1.10 0.87 1.68 896
1.19 0.86 1.59 867
Closing rate at 30/06/2020 1.12 0.91 1.63 924
USD GBP AUD CLP
Revenue 8,711 (81) (86) +3 +38 +10
EBITDA 1,601 (5) (16) 0 +6 0
EBIT 798 7 (3) 0 +3 0
Net Debt 8,625 137 +64 +19 (4) +55
o/w an impact from:
H1 2021 average rate
Closing rate at 30/06/2021
€m H1 2021FX
impact
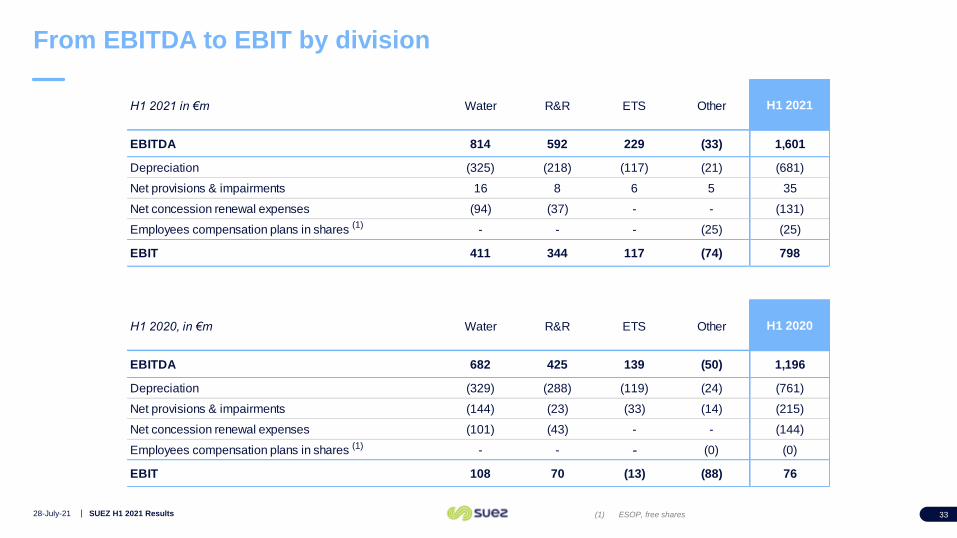
H1 2021 in €m Water R&R ETS Other H1 2021
EBITDA 814 592 229 (33) 1,601
Depreciation (325) (218) (117) (21) (681)
Net provisions & impairments 16 8 6 5 35
Net concession renewal expenses (94) (37) - - (131)
Employees compensation plans in shares - - - (25) (25)
EBIT 411 344 117 (74) 798
H1 2020, in €m Water R&R ETS Other H1 2020
EBITDA 682 425 139 (50) 1,196
Depreciation (329) (288) (119) (24) (761)
Net provisions & impairments (144) (23) (33) (14) (215)
Net concession renewal expenses (101) (43) - - (144)
Employees compensation plans in shares - - - (0) (0)
EBIT 108 70 (13) (88) 76
From EBITDA to EBIT by division
28-July-21 SUEZ H1 2021 Results 33
(1)
(1)
(1) ESOP, free shares
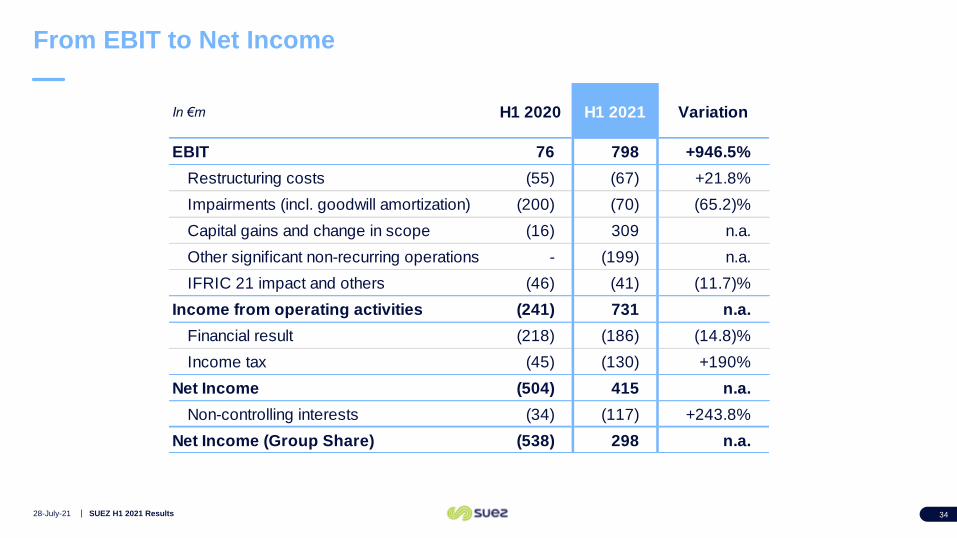
From EBIT to Net Income
28-July-21 SUEZ H1 2021 Results 34
In €m H1 2020 H1 2021 Variation
EBIT 76 798 +946.5%
Restructuring costs (55) (67) +21.8%
Impairments (incl. goodwill amortization) (200) (70) (65.2)%
Capital gains and change in scope (16) 309 n.a.
Other significant non-recurring operations - (199) n.a.
IFRIC 21 impact and others (46) (41) (11.7)%
Income from operating activities (241) 731 n.a.
Financial result (218) (186) (14.8)%
Income tax (45) (130) +190%
Net Income (504) 415 n.a.
Non-controlling interests (34) (117) +243.8%
Net Income (Group Share) (538) 298 n.a.
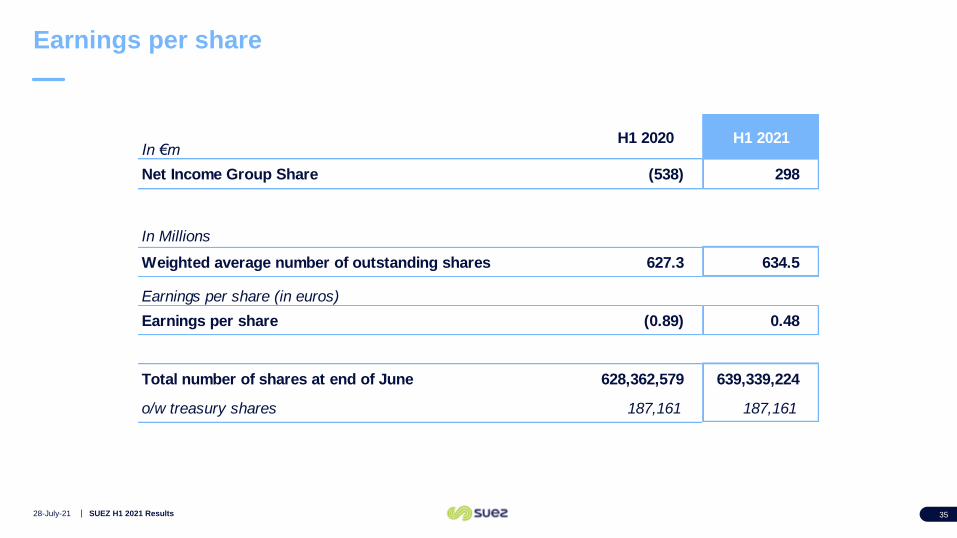
Earnings per share
28-July-21 SUEZ H1 2021 Results 35
In €mH1 2020 H1 2021
Net Income Group Share (538) 298
In Millions
Weighted average number of outstanding shares 627.3 634.5
Earnings per share (in euros)
Earnings per share (0.89) 0.48
Total number of shares at end of June 628,362,579 639,339,224
o/w treasury shares 187,161 187,161
3Cash Flow Statement
28-July-21 SUEZ H1 2021 Results 36
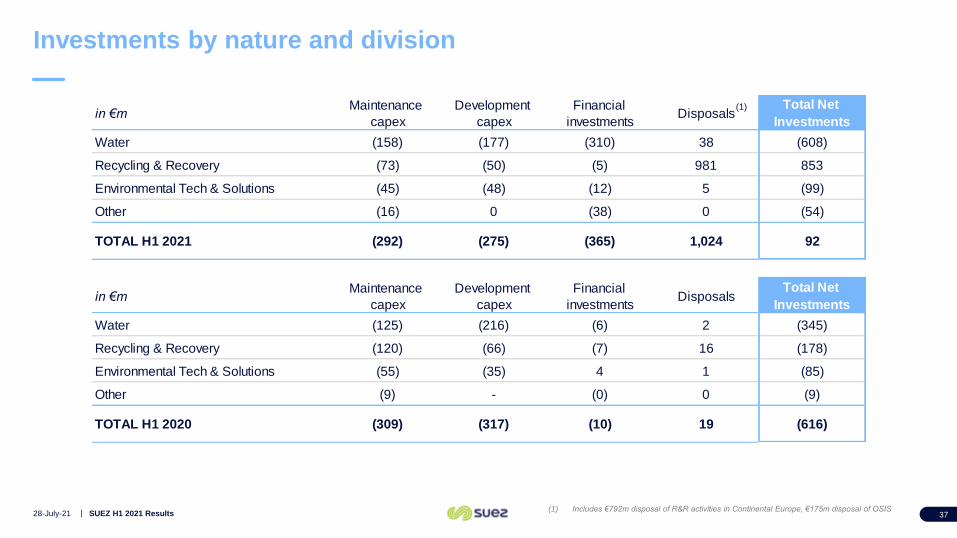
Investments by nature and division
in €mMaintenance
capex
Development
capex
Financial
investmentsDisposals
Total Net
Investments
Water (158) (177) (310) 38 (608)
Recycling & Recovery (73) (50) (5) 981 853
Environmental Tech & Solutions (45) (48) (12) 5 (99)
Other (16) 0 (38) 0 (54)
TOTAL H1 2021 (292) (275) (365) 1,024 92
in €mMaintenance
capex
Development
capex
Financial
investmentsDisposals
Total Net
Investments
Water (125) (216) (6) 2 (345)
Recycling & Recovery (120) (66) (7) 16 (178)
Environmental Tech & Solutions (55) (35) 4 1 (85)
Other (9) - (0) 0 (9)
TOTAL H1 2020 (309) (317) (10) 19 (616)
28-July-21 SUEZ H1 2021 Results 37
(1)
(1) Includes €792m disposal of R&R activities in Continental Europe, €175m disposal of OSIS

4Balance sheet
28-July-21 SUEZ H1 2021 Results 38
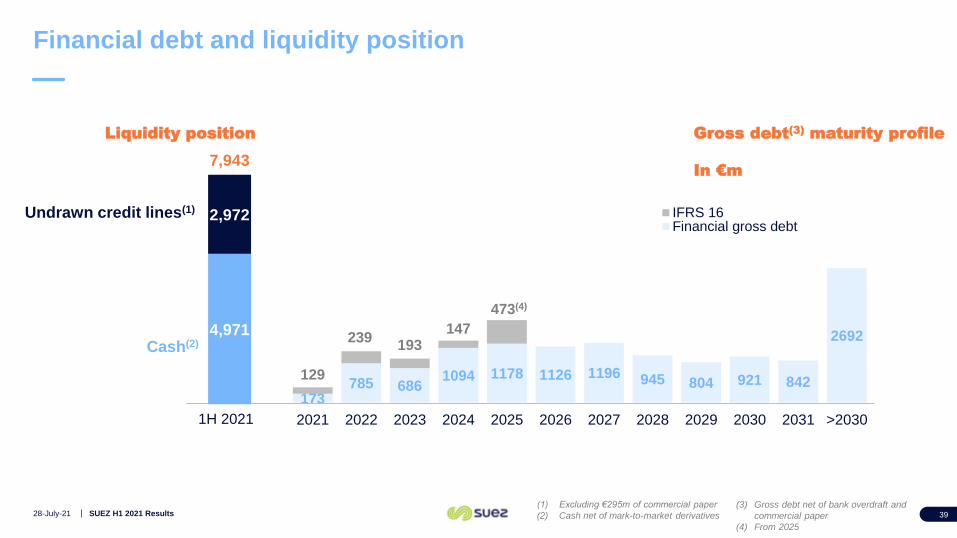
Financial debt and liquidity position
28-July-21 SUEZ H1 2021 Results 39
(3) Gross debt net of bank overdraft and
commercial paper
(4) From 2025
173785 686
1094 1178 1126 1196 945 804 921 842
2692
129
239193
147
473(4)
2021 2022 2023 2024 2025 2026 2027 2028 2029 2030 2031 >2030
IFRS 16Financial gross debt
7,943
1H 2021
Undrawn credit lines(1)
Cash(2)
2,972
1,1164,971
Liquidity position Gross debt(3) maturity profile
In €m
(1) Excluding €295m of commercial paper
(2) Cash net of mark-to-market derivatives
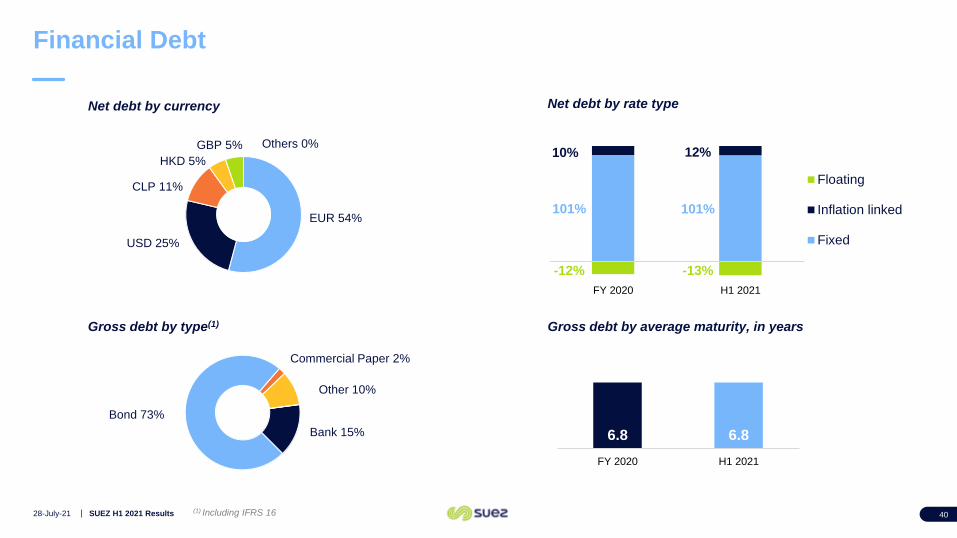
Financial Debt
28-July-21 SUEZ H1 2021 Results 40
101% 101%
10% 12%
-12% -13%
FY 2020 H1 2021
Floating
Inflation linked
Fixed
Gross debt by type(1)
Net debt by currency Net debt by rate type
Gross debt by average maturity, in years
EUR 54%
USD 25%
CLP 11%
HKD 5%
GBP 5% Others 0%
Bank 15%
Bond 73%
Commercial Paper 2%
Other 10%
6.8 6.8
FY 2020 H1 2021
(1) Including IFRS 16
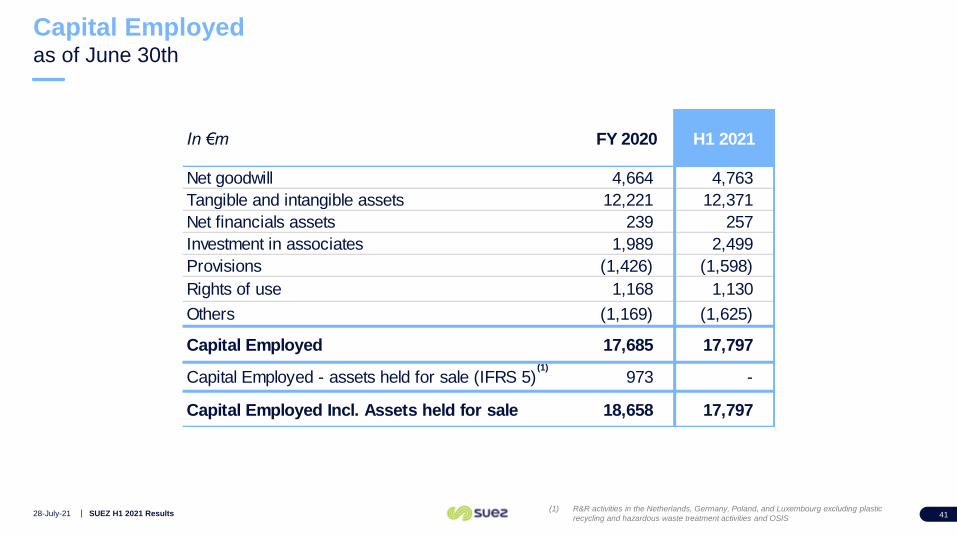
Capital Employedas of June 30th
28-July-21 SUEZ H1 2021 Results 41
(1)
(1) R&R activities in the Netherlands, Germany, Poland, and Luxembourg excluding plastic
recycling and hazardous waste treatment activities and OSIS
In €m FY 2020 H1 2021
Net goodwill 4,664 4,763
Tangible and intangible assets 12,221 12,371
Net financials assets 239 257
Investment in associates 1,989 2,499
Provisions (1,426) (1,598)
Rights of use 1,168 1,130
Others (1,169) (1,625)
Capital Employed 17,685 17,797
Capital Employed - assets held for sale (IFRS 5) 973 -
Capital Employed Incl. Assets held for sale 18,658 17,797
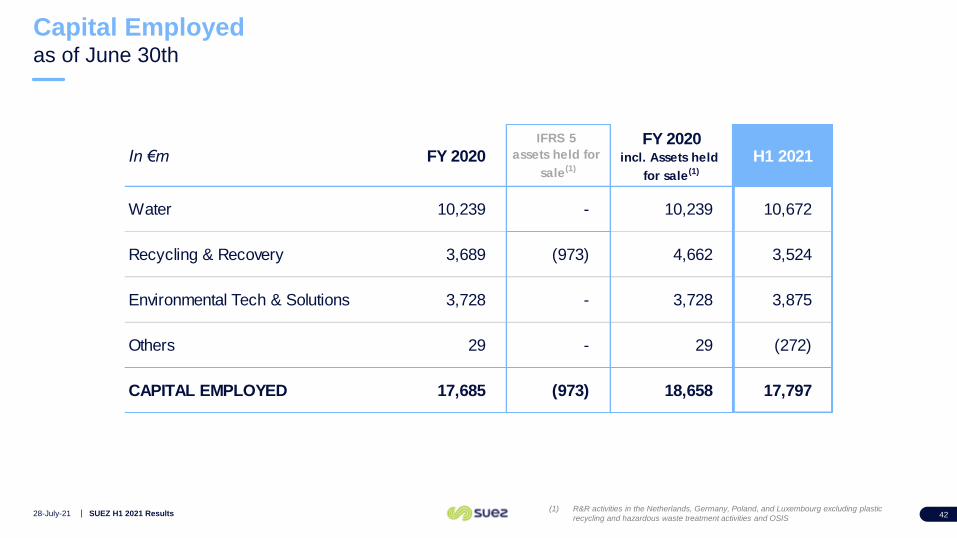
Capital Employedas of June 30th
28-July-21 SUEZ H1 2021 Results 42(1) R&R activities in the Netherlands, Germany, Poland, and Luxembourg excluding plastic
recycling and hazardous waste treatment activities and OSIS
In €m FY 2020
IFRS 5
assets held for
sale(1)
FY 2020incl. Assets held
for sale(1)
H1 2021
Water 10,239 - 10,239 10,672
Recycling & Recovery 3,689 (973) 4,662 3,524
Environmental Tech & Solutions 3,728 - 3,728 3,875
Others 29 - 29 (272)
CAPITAL EMPLOYED 17,685 (973) 18,658 17,797

5Activity of divisions
28-July-21 SUEZ H1 2021 Results 43
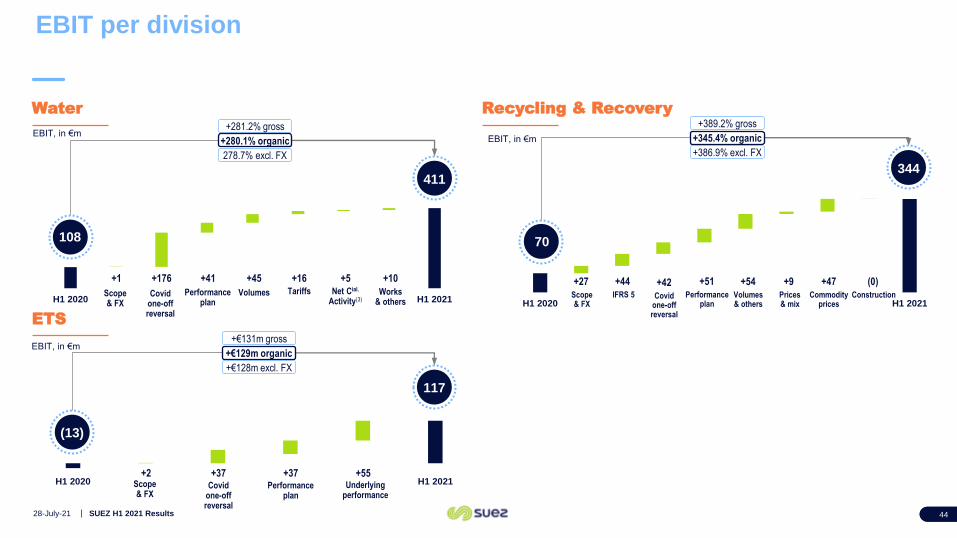
EBIT per division
28-July-21 SUEZ H1 2021 Results 44
H1 2020 H1 2021
EBIT, in €m
Scope& FX
+1
Volumes
+45
+281.2% gross
+280.1% organic
278.7% excl. FX
108
411
H1 2020 H1 2021
EBIT, in €m
Scope& FX
+27
Volumes& others
+54
Prices& mix
+9
Commodityprices
+47
+389.2% gross
+345.4% organic
+386.9% excl. FX
70
344
H1 2020 H1 2021
EBIT, in €m
Scope& FX
+2Performance
plan
+37
+€131m gross
+€129m organic
+€128m excl. FX
(13)
117
Water Recycling & Recovery
ETS
44
Covidone-off reversal
+176
Performanceplan
+41Tariffs
+16
Construction
(0)
Underlyingperformance
+55
Net Cial.
Activity(3)
+5
Works& others
+10
IFRS 5
+44
Covidone-offreversal
+42Performance
plan
+51
Covidone-offreversal
+37
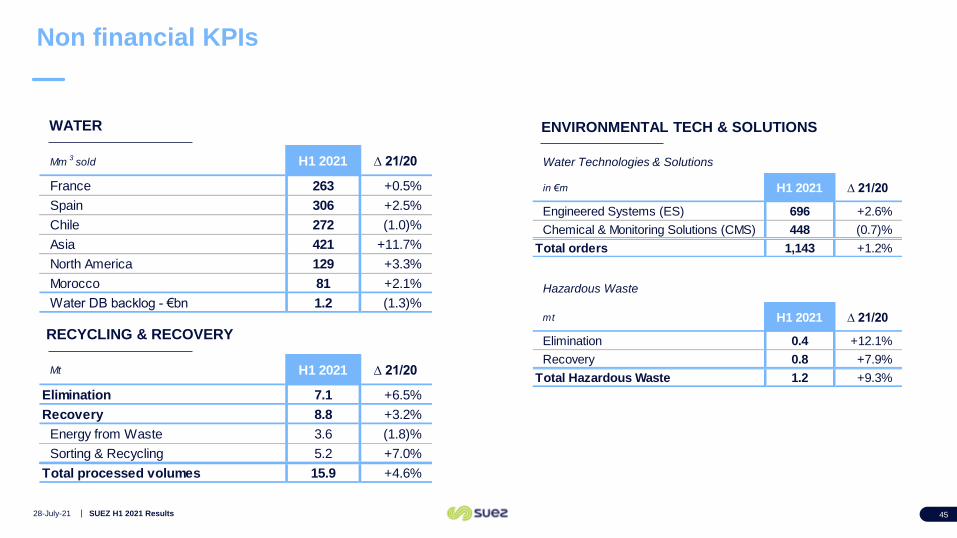
Non financial KPIs
28-July-21 SUEZ H1 2021 Results 45
WATER
RECYCLING & RECOVERY
ENVIRONMENTAL TECH & SOLUTIONS
Water Technologies & Solutions
Hazardous Waste
Mm3
sold H1 2021 ∆ 21/20
France 263 +0.5%
Spain 306 +2.5%
Chile 272 (1.0)%
Asia 421 +11.7%
North America 129 +3.3%
Morocco 81 +2.1%
Water DB backlog - €bn 1.2 (1.3)%
Mt H1 2021 ∆ 21/20
Elimination 7.1 +6.5%
Recovery 8.8 +3.2%
Energy from Waste 3.6 (1.8)%
Sorting & Recycling 5.2 +7.0%
Total processed volumes 15.9 +4.6%
in €m H1 2021 ∆ 21/20
Engineered Systems (ES) 696 +2.6%
Chemical & Monitoring Solutions (CMS) 448 (0.7)%
Total orders 1,143 +1.2%
mt H1 2021 ∆ 21/20
Elimination 0.4 +12.1%
Recovery 0.8 +7.9%
Total Hazardous Waste 1.2 +9.3%
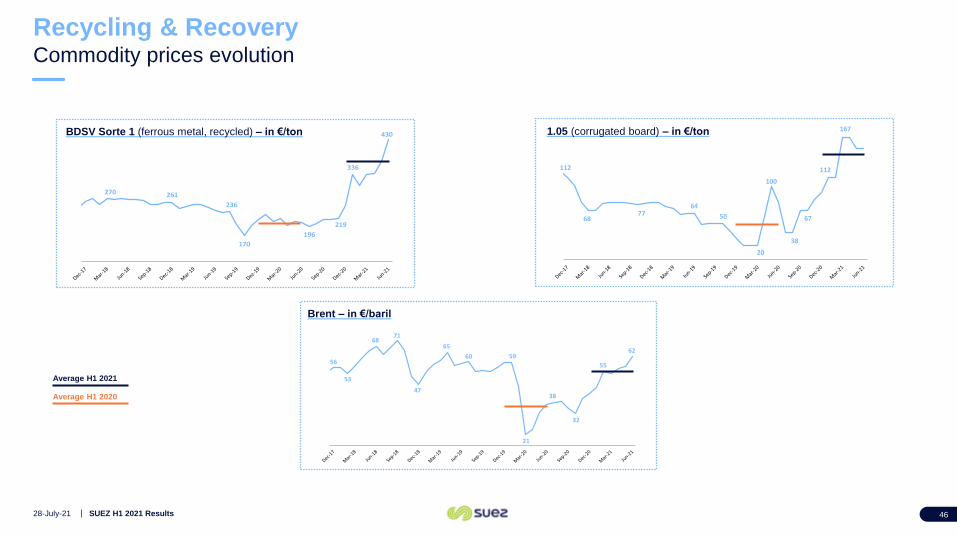
Recycling & RecoveryCommodity prices evolution
28-July-21 SUEZ H1 2021 Results 46
112
6877
64
50
20
100
38
67
112
167BDSV Sorte 1 (ferrous metal, recycled) – in €/ton 1.05 (corrugated board) – in €/ton
Brent – in €/baril
Average H1 2021
56
53
6871
47
65
60 59
21
38
32
55
62
270 261
236
170
196
219
336
430
Average H1 2020
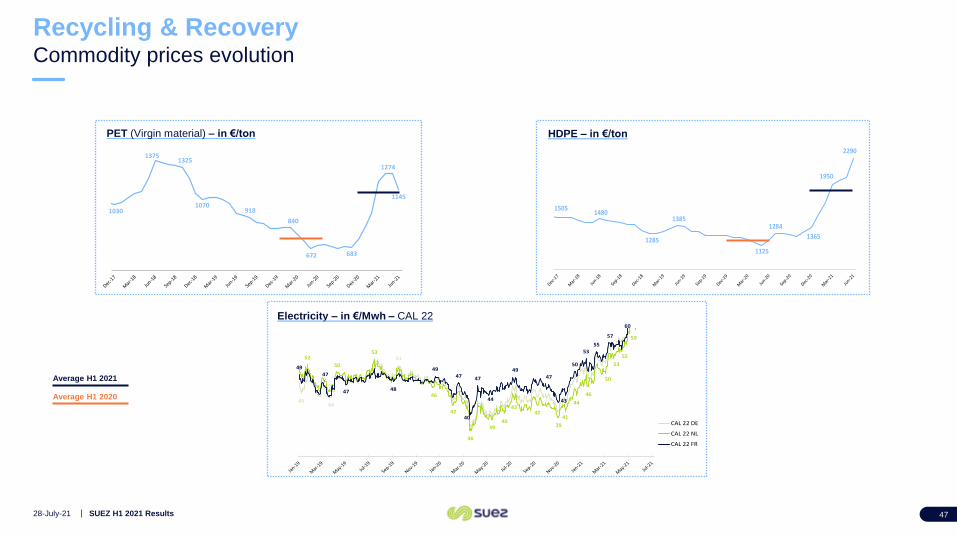
Recycling & RecoveryCommodity prices evolution
28-July-21 SUEZ H1 2021 Results 47
Electricity – in €/Mwh – CAL 22
HDPE – in €/tonPET (Virgin material) – in €/ton
Average H1 2021
1030
13751325
1070918
840
672 683
1274
1145
15051480
1285
1385
1125
1284
1365
1950
2290
Average H1 202045
44
5152
50
53
46
42
36
3940
4342
39
41
44
46
50
53
55
59
4947
47 48
4947
40
47
44
4947
43
50
5355
57
60
CAL 22 DE
CAL 22 NL
CAL 22 FR
Disclaimer
28-July-21 SUEZ H1 2021 Results 48
This presentation contains estimates and/or forward-looking statements and information. These statements include
financial projections, synergies, estimates and their underlying assumptions, statements regarding plans, expectations
and objectives with respect to future operations, products and services, and statements regarding future performance.
Such statements do not constitute forecasts regarding SUEZ’s results or any other performance indicator, but rather
trends or targets, as the case may be. No guarantee can be given as to the achievement of such forward-looking
statements and information.
Investors and holders of SUEZ securities are cautioned that forward-looking information and statements are subject
to various risks and uncertainties, which are difficult to predict and generally beyond the control of SUEZ, and that such
risks and uncertainties may entail results and developments that differ materially from those stated or implied in
forward-looking information and statements. These risks and uncertainties include, but are not limited to, those
discussed or identified in the public documents filed with the Autorité des Marchés Financiers (AMF). Investors and
holders of SUEZ securities should consider that the occurrence of some or all of these risks may have a material
adverse effect on SUEZ. SUEZ is under no obligation and does not undertake to provide updates of these forward-
looking statements and information to reflect events that occur or circumstances that arise after the date of this
document.
More comprehensive information about SUEZ may be obtained on its website (www.suez.com).
This document does not constitute an offer to sell, or a solicitation of an offer to buy SUEZ securities in any jurisdiction.

suez.com
CONTACTS
Financial Communication
+33 (0)1 58 81 24 05
Cécile Combeau
Baptiste Fournier
Julien Minot


