Embed Size (px)
Citation preview

Deep-Sea Research I 58 (2011) 493–504
Contents lists available at ScienceDirect
Deep-Sea Research I
0967-06
doi:10.1
n Corr
Kongsva
E-m
journal homepage: www.elsevier.com/locate/dsri
Sulfate reduction below the sulfate–methane transition in BlackSea sediments
Lars Holmkvist a,b,n, Alexey Kamyshny Jr.a,c, Christoph Vogt d, Kyriakos Vamvakopoulos a,Timothy G. Ferdelman a, Bo Barker Jørgensen a,e
a Biogeochemisty Group, Max Planck Institute for Marine Microbiology, Celsiusstrasse 1, 28359 Bremen, Germanyb Life Science Division, Danish Technological Institute, Kongsvang Alle 29, 8000 Aarhus C, Denmarkc Department of Geology and Earth System Science, Interdisciplinary Center, University of Maryland, College Park, MD 20742, USAd Fachgebiet Kristallographie, Fachbereich Geowissenschaften, Universitat Bremen, Klagenfurter Str. 2, 28359 Bremen, Germanye Center for Geomicrobiology, Department of Biological Sciences, Aarhus University, Ny Munkegade 114-116, 8000 Aarhus C, Denmark
a r t i c l e i n f o
Article history:
Received 15 February 2011
Accepted 18 February 2011Available online 24 February 2011
Keywords:
Black Sea
Sulfate reduction
Potential sulfate reduction
Re-oxidation
Sulfur species
37/$ - see front matter & 2011 Elsevier Ltd. A
016/j.dsr.2011.02.009
esponding author at: Life Science Division, Da
ng All�e 29, 8000 Aarhus C, Denmark. Tel.: +
ail address: [email protected] (L. Holmkvist)
a b s t r a c t
A sudden increase in salinity about 7000 years ago caused a shift in the deposited sediments of the
Black Sea from limnic to brackish-marine. Due to the development of an anoxic deep water basin and a
relatively high sulfate concentration, organic matter is mineralized primarily through sulfate reduction
in modern Black Sea sediments. Earlier studies showed that sulfate-reducing bacteria are abundant
within the limnic sub-surface sediment in spite of extremely low concentrations of sulfate and organic
carbon. A main objective of the present study was therefore to understand the depth distribution of
sulfate reduction across the different sediment units, even deep below the sulfate–methane transition.
Our study combined experimental measurements of sulfate reduction using 35S radiotracer with
analyses of sulfur and iron geochemistry in pore water and sediment. Potential sulfate reduction rates
were measured with 35S in sediment samples that were amended with sulfate and organic substrates
and incubated in time-series up to 48 h. Sulfate reduction could thereby be detected and quantified at
depths where concentrations of sulfate were otherwise too low to enable calculation of the rates. The
results demonstrate that sulfate-reducing bacteria are active several meters below the sulfate–methane
transition in Black Sea sediments. The cryptic sulfate reduction below the sulfate–methane transition
may be driven by sulfate produced from re-oxidation of reduced sulfur species with oxidized iron
minerals buried in the deep limnic sediment.
& 2011 Elsevier Ltd. All rights reserved.
1. Introduction
The Black Sea, the largest anoxic and sulfidic marine basin onEarth, has changed from limnic to marine conditions during theHolocene. The first evidence of seawater intrusion through theBosporus into the post-glacial lake comprising the Black Sea datesback to about 9800 yr B.P. (Arthur and Dean, 1998; Jones andGagnon, 1994). A permanent rise in salinity occurred a fewthousand years later as seawater flowed through the Bosporusand marine conditions were established. At least three differentsedimentary units have been recognized over the past 25,000years in slope and deep-sea deposits (Ross and Degens, 1974).Unit I is carbonate-rich micro-laminated sediment depositedunder anoxic marine conditions within the last 3000 years,following the invasion of planktonic coccolithophorids, Emiliania
ll rights reserved.
nish Technological Institute,
45 72 70 23 95.
.
huxleyi. Unit II is organic-rich micro-laminated sediment (sapro-pel) deposited under anoxic marine conditions between 3000 and7000 yr B.P. Unit III consists of alternating light and dark lutite, anorganic-poor limnic sediment type of clay or silt with grain sizeless than 1/16 mm, deposited before 7000 yr B.P. under oxiclimnic conditions. These Pleistocene deposits of limnic originare found throughout the modern Black Sea below a sedimentdepth of about 1 m (Hay et al., 1991).
Sulfate reduction within Units I–II of the modern Black Seadominates the benthic mineralization of organic carbon. Sulfate isthe main electron acceptor due to the anoxic and sulfidic bottomwater and diffuses one to several meters down into the sediment.Sulfate reduction rates (SRR) have a sharp peek at the sediment–water interface and a secondary peak in the sulfate–methanetransition (SMT) where the activity of sulfate-reducing prokar-yotes (SRP) is stimulated by the anaerobic oxidation of methane(AOM) (Jørgensen et al., 2004; Knab et al., 2008).
The high SRR within the SMT leads to an enhanced productionof sulfide, which shows peak concentration at the SMT, fromwhere it diffuses upwards and downwards in the sediment

L. Holmkvist et al. / Deep-Sea Research I 58 (2011) 493–504494
(Neretin et al., 2004). The downward diffusing sulfide reacts withoxidized iron species in the sediment below and forms a distinctdiagenetic sulfidization front. This front is recognized as a blackband or a series of bands due to a high content of iron mono-sulfides (FeS) and greigite (Fe3S4) (Berner, 1970, 1984; Jørgensenet al., 2004; Neretin et al., 2004; Pyzik and Sommer, 1981).Elemental sulfur is formed at the sulfidization front and reactswith iron sulfides through diagenetic reactions that ultimatelylead to pyritization (formation of FeS2). The different productsof sulfide oxidation, including intermediates such as zero-valent sulfur (ZVS, i.e. elemental sulfur and polysulfides), thio-sulfate and sulfite, may undergo disproportionation reactionsto form sulfide and sulfate (Jørgensen, 1990; Thamdrup et al.,1993, 1994).
Only few studies have addressed the potential for sulfatereduction below the SMT in marine sediments. The experimentalmeasurement of deep sulfate reduction is generally avoided dueto the low concentrations of sulfate (o50 mM), which have beendifficult to analyze by ion chromatography on the background ofhigh chloride. Thus, the activity and role of sulfate-reducingcommunities below the SMT are not known. It is possible thatSRP deep down in the methane zone have an important impact onthe cycling of carbon, sulfur and iron. It was recently shown thatsulfate-reducing communities are present several meters belowthe SMT in Black Sea sediments (Leloup et al., 2007). This wasdemonstrated by quantitative PCR targeting their metabolic keygene, the dissimilatory (bi)sulfite reductase (dsrA). However, thetype of energy metabolism of SRP below the SMT is not known.Many SRP have a versatile metabolism, which apparently enablesthem to live under the conditions of sub-surface sediments withlow availability of electron donors and acceptors. For example,pure culture studies of the sulfate-reducing archaea, Archaeoglo-
bus fulgidus, show an ability to shift metabolic pathway to utilizedifferent carbon sources when grown under different sulfateconcentrations (0.3–14 mM) (Habicht et al., 2005). Other expla-nations for the presence of active sulfate reducers beneath theSMT could be the ability to ferment small organic molecules(Widdel and Hansen, 1992) or to use poorly crystalline Fe(III)oxides as electron acceptor (Coleman et al., 1993).
By combining sulfate reduction rate measurements withgeochemical data on sulfur and iron, we studied the activity anddepth distribution of active SRP below the SMT. The resultsdemonstrate the presence of active SRP several meters belowthe sulfate zone in Pleistocene limnic sediments of the Black Sea.We present a possible explanation for the presence of active SRPby which sulfate is produced within the methane zone fromoxidation of reduced sulfur compounds with iron(III) minerals.
2. Materials and methods
2.1. Sampling and site description
The present study is based on two gravity cores (GC A and B)and a multi-corer core (MUC) taken during research cruise M72-5of the RV METEOR in the Black Sea from May 11 to June 6, 2007.Cores were collected at Station 9 (44139.080N, 3211.000E) in theDniepr paleodelta in the northwestern region of the Black Sea at awater depth of 1000 m. The position of this station is identical toStation ‘‘P824GC’’ described by Knab et al. (2008) and Station P12described by Leloup et al. (2007). Absolute depth correction of theGC A and B cores relative to the sediment surface was not possiblebecause sulfate was not measured in the MUC. Instead, a depthcorrection between the GC A and B cores was made by overlayingthe two pore water concentration profiles of sulfide. This correc-tion demonstrated that only about 5 cm more sediment had been
lost from the surface during coring of GC A as compared to GC B.Yet, the penetration depth of sulfide was different betweenthe A and B cores since the location of the black band differed(see Fig. 5B and C).
2.2. Core processing
Immediately after retrieval of the first gravity core (GC A)methane samples were taken at 80–100 cm depth intervalsthrough small windows cut with a vibrating saw into the coreliner. Sediment samples of 3 cm3 were transferred into 20 mLserum vials with 6 mL Milli-Q water, closed with a butyl rubberstopper, and crimp sealed.
The GC A and B cores as well as the MUC cores were processedin a 4 1C cold room on board the METEOR within a few days afterretrieval. Rhizone soil moisture samplers (Rhizosphere ResearchProducts, Wageningen, Netherlands) were used for the extractionof pore water. The rhizones consist of an inert porous polymertube with a length of 10 cm and a pore size of 0.1 mm. Pore fluid isextracted by vacuum created with disposable 10 mL syringesconnected to the Rhizone. Pore water for sulfate and sulfidemeasurements in GC A were extracted from pre-drilled holes at10 cm depth intervals and fixed with 250 mL of 2 wt% zinc acetate.The first �0.5 mL of extracted pore water was discarded to limitoxidation by oxygen. Samples for dissolved iron were collected atthe same depths as for sulfate and preserved by acidifying �1 mLpore water with 100 mL 10% HCl. Pore water samples for analysisof zero-valent sulfur (ZVS) in polysulfide species were extractedin-between the sulfate and sulfide pore water samples at30–60 cm depth intervals within the upper 500 cm of the sedi-ment and at a depth of 775 cm. At least 5–6 mL of pore water wasrequired from each depth in order to detect the ZVS species. Thepore water for ZVS analysis was transferred into anoxic vialsimmediately after extraction and analyzed within a few hours toprevent oxidation by oxygen.
Pore water was extracted from GC B with 10 cm long Rhizonesby gently pushing them into pre-drilled holes at 5 cm depthintervals along the core. Pore water samples for the later deter-mination of sulfate, sulfide and dissolved iron were prepared aswith the GC A core.
Solid-phase sub-samples were taken from the GC A and Bcores at 10 and 5 cm depth intervals, respectively, in-between thedepths where pore water was extracted. Sediment sub-sampleswere collected in plastic bags for analysis of carbon and ironand plastic centrifuge tubes containing 10 mL of zinc acetate(20% w/v) for later analysis of sulfur geochemistry. Sedimentsub-samples were immediately frozen at �20 1C after sampling.Within two weeks after sampling, sediment sub-samples from theGC A core were scanned for magnetic susceptibility and all othersub-samples from both GC A and B were analyzed for carbon,sulfur and iron speciation.
2.3. Pore water analyses
Methane in the headspace of the 20 mL serum vials wasanalyzed on a gas chromatograph (5890A, Hewlett Packard)equipped with a packed stainless steel Porapak-Q column(6 ft, 0.125 in, 80/100 mesh, Aglient Technology) and a flameionization detector. Sulfate was analyzed by non-suppressedion chromatography (100 mL injection volume, Waters, columnIC-PakTM, 50�4.6 mm). The eluent was 1 mM isophthalate bufferin 10% methanol, adjusted to pH 4.5 with saturated Na borohy-drate and the flow rate was 1.0 mL min�1. Hydrogen sulfide(H2S and HS�) was determined spectrophotometrically at670 nm (Shimadzu UV 1202) on zinc-preserved pore water and

L. Holmkvist et al. / Deep-Sea Research I 58 (2011) 493–504 495
bottom water samples by the methylene blue method (Cline,1969). Dissolved iron (Fe2 +) in the pore water was measuredaccording to Stookey (1970) with Ferrozine (1 g L�1 in 50 mMHEPES buffer, pH 7) spectrophotometrically at 562 nm (ShimadzuUV 1202). The analysis of zero-valent sulfur (ZVS) speciesincluded solid sulfur (S8), colloidal sulfur (S0), polysulfides (Sn
2�)and polythionates (SnO6
2�). The pH of each pore water sample wasmeasured with a pH electrode before the analysis and the valuewas used later for ZVS concentration calculations. A newlydeveloped protocol for detection of ZVS species was based onfour steps (Kamyshny et al., 2009): (1) The detection of inorganicpolysulfides by fast single-phase derivatization with methyltrifluoromethanesulfonate (Kamyshny et al., 2006), (2) detectionof the sum of colloidal S0 and polysulfide ZVS and polythionateZVS (n43) with hydrogen cyanide derivatization, followed byHPLC analysis of thiocyanate (Kamyshny, 2009; Rong et al., 2005),(3) detection of the sum of polysulfide ZVS, colloidal S0 and solidsulfur by treatment with zinc chloride followed by extractionwith chloroform and (4) the detection of polythionates (n¼4–6)by HPLC (Kamyshny et al., 2009). The concentration of polysulfideZVS was calculated as the sum of all ZVS species detected afterderivatization with methyl triflate. The concentration of colloidalZVS was calculated as the difference between results from thecyanolysis and the concentration of polysulfide ZVS. Finally,the concentration of dispersed solid sulfur was calculated as thedifference between the chloroform extraction and results of thecyanolysis.
2.4. Solid-phase analyses
Sediment sub-samples were placed in a Bartington InstrumentsMS2 meter equipped with a MS2C sensor and scanned for magneticsusceptibility using a scan rate of 1 cm min�1. The sediment densitywas determined as the wet weight per cm3. The water content inthe sediment was determined from the weight loss after dryingat 60 1C until constant weight and sediment density as the wetweight per cm3. Total organic carbon (TOC) was determined infreeze dried sediment that was pretreated with HCl in silver cups toremove inorganic carbon, dried again and analyzed on a CNSanalyzer (FisonsTM Na 1500 elemental analyzer).
AVS (acid volatile S¼dissolved sulfide+iron monosulfide) andCRS (Cr-reducible S¼pyrite+elemental sulfur) were determinedusing the two step acidic Cr-II method (Fossing and Jørgensen,1989). The volatilized and trapped sulfide was determined spec-trophotometrically at 670 nm (Shimadzu UV 1202) by the methy-lene blue method of Cline (1969). Total zero-valent sulfur (ZVS)was extracted from zinc acetate preserved sediment samples in10 mL pure methanol on a rotary shaker for at least 16 haccording to Zopfi et al. (2004). Total ZVS was separated on anHPLC with a Zorbax ODS column (125�4 mm, 5 mm; Knauer,Germany) with methanol as the eluent (1 mL min�1) and deter-mined from the absorption at 265 nm.
Reactive iron is here defined as the fraction of iron that mayreact with sulfide to form iron sulfide minerals (Berner, 1970;Canfield and Berner, 1987). The degree of reactivity towardssulfide among the various forms of iron present in marinesediments differs in time scale from hours to millions of years(Canfield et al., 1992; Raiswell and Canfield, 1996). The differentfractions of reactive iron were determined using chemical extrac-tions on separate sub-samples of frozen sediment (i.e. not byconsecutive extractions of the same sub-samples).
(A)
Highly reactive Fe(III): The most readily acid-soluble ironminerals were extracted with cold 0.5 M HCl for 1 h on arotary shaker. The Fe(II) fraction of the extracted iron wasthen determined in the HCl extracts by the Ferrozine method(Stookey, 1970). Extracted highly reactive Fe(III) was deter-mined as the difference between the iron (Fe(II)+Fe(III)),extracted with Ferrozine+1% w/v hydroxylamine hydrochlor-ide, and the Fe(II) fraction.
(B)
Dithionite reactive iron was extracted by reductive dissolutionwith dithionite-citrate-acetic acid according to Canfield(1989). The extracted iron was determined with Ferro-zine+1% w/v hydroxylamine hydrochloride. This reactive ironfraction consists mostly of more crystalline iron oxides suchas goethite and hematite (e.g. Canfield, 1989) as well as FeCO3and FeS. The FeS, determined as acid volatile sulfide, con-stituted only an insignificant fraction of this iron pool.
(C)
Total reactive iron was extracted by boiling sub-samples of thesediment in 12.5 M HCl for 1 min according to Berner (1970)and Raiswell et al. (1988). The extracted iron was determinedwith Ferrozine+1% w/v hydroxylamine hydrochloride. Totalreactive iron includes both the more readily reactive ironfractions and reactive silicate-bound iron.Total dithionite extractable manganese was measured on thesupernatant of the dithionite-extracts by flame atomic absorptionspectrometry (Perkin Elmer, Atomic Absorption Spectrometer3110). The concentrations of total manganese were calculatedaccording to a standard curve with a detection limit of 25 ppb.
2.5. Sulfate reduction
Sulfate reduction rates (SRR) in the MUC core were determinedusing the whole-core 35SO4
2� incubation method (Jørgensen,1978). A sub-core taken from the MUC was injected with radio-tracer (�300 kBq per injection) at depth intervals of 1 or 2 cmand the injected core was incubated for 24 h at 4 1C. Sulfatereduction was terminated by sectioning the sediment cores, fixingthe sections with 20 mL of 20% (w/v) zinc acetate, and freezing.A measured sulfate concentration of 16.5 mM was used forcalculating the SRR in the MUC.
For the measurement of SRR in GC A, triplicate samples of5 cm3 were carefully collected in butyl rubber stoppered glasstubes. Sampling was done at 10 cm depth intervals, alternatingwith the depths of pore water extraction. The glass tubes wereinjected with 5 mL carrier-free 35SO4
2� tracer (�300 kb per 5 cm3)and incubated for 24 h at ca. 4 1C. The process was stopped bymixing the sample with 10 mL cold zinc acetate (20% w/v) andfreezing. All samples were treated by cold chromium distillationafter Kallmeyer et al. (2004) and SRR were calculated accordingto Jørgensen (1978):
SRR¼ ½sulfate� � ð35S-CRS=35S-sulfateÞ
� 1:06=tpmolcm�3 d�1ð1Þ
where [sulfate] is the sulfate concentration in pmol/cm3 of wetsediment (1 pmol¼10�12 mol), 35S-CRS is the radioactivity oftotal reduced sulfur at the end of incubation, 35S-sulfate is theinitial radioactivity of sulfate added to the experiment, 1.06 is acorrection factor for the expected isotope discrimination against35S-sulfate versus the bulk 32S-sulfate by the SRP, and t isincubation time measured in days.
In the deeper, methanogenic part of the sediment, beneath themain sulfate zone, we determined ‘‘potential sulfate reductionrates’’ (P-SRR) in similar 5 cm3 samples. In this sulfate-depletedsediment below 300 cm depth, the samples were first injectedunder N2 with non-radioactive sulfate (2 mM final concentrationin sediment) and organic substrates (100 mM final concentrationsof propionate, acetate, lactate and formate). Samples were thenpre-incubated for 12 h to allow the injected solutes to diffuse out

L. Holmkvist et al. / Deep-Sea Research I 58 (2011) 493–504496
into the sediment. Subsequently, 10 mL carrier-free 35SO42� tracer
(�600 kb) was injected into each sample. A five point time-seriesexperiment with incubations stopped after 0, 12, 24, 36 and 48 hwas done, using triplicate samples of 5 cm3 sediment for eachtime point. The incubations were stopped by adding the sampleinto 10 mL cold zinc acetate (20% w/v), immediately freezing, andsubsequently treating as described above.
2.6. X-ray diffraction pattern analyses (XRD)
Samples for XRD analyses of mineral phases were collected fromthe GC A core at 30, 103, 163, 246, 316, 345 and 410 cm depths. Bulksamples were dried, carefully ground to a fine powder (o20 mmparticle size), and prepared with a Philips back-loading system.X-ray diffractograms were measured on a Philips X’Pert Pro multi-purpose diffractometer equipped with a Cu-tube (k(a) 1.541, 45 kV,40 mA), a fixed divergence slit of 1/41, a sample changer, asecondary monochromator and an X’Celerator detector system.The measurements were done as a continuous scan from 31 to 8512y, with a calculated step size of 0.0161 2y (calculated time per stepwas 100 s). Mineral identification was done using the Philips soft-ware X’Pert HighScoreTM, which, besides the mineral identification,gives a semi-quantitative value for each identified mineral on thebasis of Relative Intensity Ratio (RIR-values). The RIR-values werecalculated as the ratio between the strongest signal from a specificmineral phase to the strongest signal from pure corundum (I/Ic),referred to as the ‘‘matrix-flushing method’’ after Chung (1974). Inaddition, mineral identification was checked with the freewareMacDiff 4.5 (Petschick et al., 1996). Full quantification was doneusing the full-pattern quantification software QUAX (Vogt et al.,2002).
2.7. Magnetic nodules
Sediment for the study of magnetic nodules was sampledduring an earlier Black Sea cruise (METROL cruise 2004) at St.‘‘P824GC’’ that was the same sample station as St. 9. Singlemagnetic nodules were collected from the sulfidization front at388 cm depth using a handheld magnet. The nodules wereimmediately embedded in a methacrylate resin, trimmed with adiamond band saw, and polished with an Al2O3 paraffin suspen-sion. Prior to scanning electron microscopy (SEM), the surface ofthe polished nodules was coated with carbon to avoid chargingeffects. The surface morphology and texture were recorded byconventional backscattered electron and secondary electron
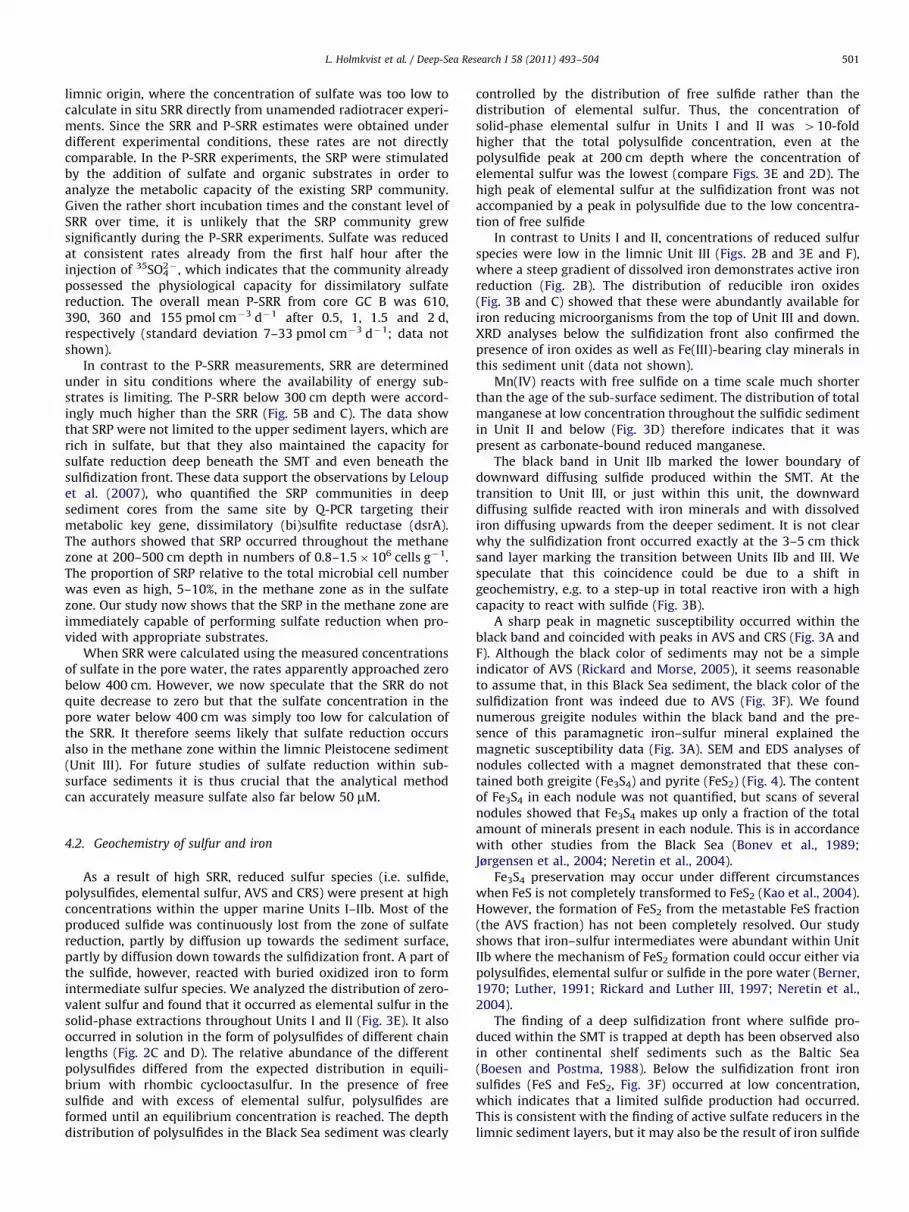
Fig. 1. Total organic carbon (% dry weight) distribution at St. 9.
imagery. Specific elements inside the nodules were identifiedusing energy dispersive X-ray analysis (EDS) (Oxford INCA 300).
3. Results
3.1. Sediment stratigraphy
Sediments from below the Black Sea chemocline consist of limnicclay, deposited before 7500 yr BP, and overlain by microlaminated,organic-rich sapropel and modern marine coccolith ooze (Calvertand Karlin, 1991; Ross et al., 1970). We identified four sedimentaryunits between the top of the GC cores and a depth of 8 m accordingto color, sand layers and organic carbon content. In GC A these unitswere recognized as Unit I, IIa, IIb and III according to the stratigraphydefined during earlier studies (Hay et al., 1991) (Fig. 1). Note,however, that the description of the different depth zones of theGC cores is of uncorrected depths because absolute depth correctionof the GC cores and the MUC could not be made, as described above.Based on our previous experience in the Black Sea, 10–30 cm ofsediment was probably lost from the surface during GC coring.
Unit I: 0–30 cm depth. Laminated marine coccolith ooze depos-ited under anoxic conditions. Some of this upper layerwas lost during GC coring. TOC values were 5–6 wt%.
Unit IIa: 30–65 cm depth. Brown, marine sapropel depositedunder anoxic conditions. TOC values were 7.5–15 wt%.
Unit IIb: 65–326 cm depth. Grayish sediment of both brackishand limnic origin deposited under oxic conditions.A black band was found at 304–323 cm depth and asand layer of about 3 cm thickness occurred at 323–326 cm. TOC values were 0.5–5 wt%.
Unit III: 326–757 cm depth. Reddish-brown limnic clay depos-ited under oxic conditions. The sediment was unaffectedby the sulfidization process. TOC values were o1 wt%.
The TOC content was high, 5–15% dry weight, within therecent marine coccolith ooze and sapropel layers (Units I andIIa). TOC dropped steeply with depth (o5%) in the underlyinglimnic Units IIb and III (Fig. 1). TOC peaked twice within Unit IIbwith values reaching 5% at 148 cm and 1.4% at 306 cm. TOCremained below 0.5% throughout Unit III in which it decreasedgradually from 0.48% to 0.33% between 325 and 650 cm depth.
The depth and thickness of the black band and of the sandlayer differed slightly between the GC A and B core. In GC B, theblack band was located at 359–371 cm depth. The porosity of the
The different sedimentary units (Units I–III) are indicated.

L. Holmkvist et al. / Deep-Sea Research I 58 (2011) 493–504 497
GC A core decreased roughly linearly with depth in the interval15–752 cm according to:
Porosity¼ 0:825�0:0005� depth ðcmÞ ð2Þ
3.2. Pore water chemistry
Pore water concentrations of sulfate, methane, sulfide anddissolved iron in core GC A are presented in Fig. 2A and B. Thesulfate concentration decreased from 12 mM at the top of the core(Unit I) to 0.1 mM at 230 cm, and further to below the detectionlimit of 0.01 mM at 400 cm (Fig. 2A). From 250 cm depth, wherethe concentration had dropped below 0.05 mM, sulfate could nolonger be calibrated accurately although it still generated detect-able peaks on the ion chromatograms. Between 250 and 400 cmthe low concentrations of sulfate showed a very gradual decreasewith depth. Methane increased below 100 cm (Fig. 2A). Methanehad probably out-gassed below a depth of about 250 cm uponcore recovery. Below 400 cm the sediment was observed to crackdue to gas expansion at atmospheric pressure. The sulfate–methane transition (SMT), where anaerobic oxidation of methaneoccurs, was very broad and situated at 120–220 cm depth.
Free sulfide was present from the top of the core and down to321 cm depth in Unit IIb (Fig. 2B). Sulfide showed a minor peakwithin the Units I–IIa layers and a large distinct peak within the
Fig. 2. Pore water concentrations of (A) sulfate and methane, (B) dissolved sulfide an
present in different specific polysulfide species, and (D) the sum of all polysulfides com
SMT with a maximum concentration of 4 mM. Dissolved iron wasnot detected in the sulfide zone but increased downwards fromthe black band in Unit IIb (Fig. 2B). Within the non-sulfidizedlimnic sediment of Unit III, the concentration of dissolved ironwas generally in the range 0.4–0.8 mM.
Peak concentrations of individual polysulfide ZVS speciesoccurred in Unit IIb (Fig. 2C). Our calculations revealed thatindividual polysulfides were not in equilibrium with elementalsulfur under the moderately alkaline conditions of the pore wateras would have been expected according to Kamyshny et al.(2004). The sum of polysulfide ZVS species peaked at 158 cmdepth with highest concentrations reaching 44 mM (Fig. 2D). Thedepth of this peak coincided with the 100-fold higher peak insulfide, suggesting that polysulfide ZVS species were in equili-brium with sulfide in the pore water. It was assumed thatoxygenation of the extracted pore water did not occur since thefirst �0.5 mL of extracted pore water was discarded. Hence, nooxidation of sulfide to polysulfide with molecular oxygen wasexpected to take place. Concentrations of ZVS species below thesulfidization front were too low to be detected.
3.3. Sediment geochemistry
Two distinct peaks in magnetic susceptibility were observed, aminor peak within the organic-rich Unit IIa and a large peak
d iron, meeting within the black band and the sand layer, (C) zero-valent sulfur
pared to the free sulfide.

Fig. 3. Depth distributions of (A) magnetic susceptibility, (B) reactive iron species, (C) highly reactive ferric iron, (D) total dithionite extractable manganese, (E) elemental
sulfur, and (F) acid volatile sulfide (AVS) and chromium reducible sulfur (CRS).
L. Holmkvist et al. / Deep-Sea Research I 58 (2011) 493–504498
within the black band of Unit IIb, with maximum values reaching68�10�5 and 203�10�5 SI units, respectively (Fig. 3A). Thelarge peak in Unit IIb coincided with abundant magnetic nodulesobserved in the black band and is expectedly due to diageneticgreigite. Magnetic susceptibility was relatively high, 11–12�10�5 SI,throughout the iron-rich and brown colored limnic sediment ofUnit III.
Total reactive iron in Units I–IIb peaked at around 100 cm depthwith highest concentration of 170 mmol cm�3 (Fig. 3B). Totalreactive iron increased further within the limnic Unit III and reachedconcentrations of 500 mmol cm�3. Dithionite reactive iron was low
(o10 mmol cm�3) within the sulfidic Units I–IIb and increasedsharply to about 100 mmol cm�3 in Unit III just below the sulfidiza-tion front (Fig. 3B). Highly reactive Fe(III) was generally low withinthe upper Units I–IIb and increased in Unit III to values reaching7 mmol cm�3 at 405 cm, below which the concentration decreasedagain (Fig. 3C). Sediment of Unit III was less reduced as theconcentrations of reactive iron (Fig. 3B) and highly reactive Fe(III)(Fig. 3C) increased. The concentration of total dithionite extractableMn was low throughout the core (Fig. 3D). Total dithionite extrac-table Mn peaked twice in Unit IIb with maximum concentrations of6 and 5 mmol cm�3 at 148 and 276 cm, respectively.

Fig. 4. Scanning electron micrographs of sliced magnetic nodules from the black band with peak magnetic susceptibility at 388 cm. (A) Surface scan of sliced nodule that
consists mostly of iron sulfide minerals. EDS analysis revealed the presence of FeS2 in the center and Fe3S4 in the light-gray periphery of the nodule. The same image as in
(A) is shown for only iron (B) and sulfur (C).
L. Holmkvist et al. / Deep-Sea Research I 58 (2011) 493–504 499
The concentration of total ZVS in the sediment was generallylow except for a sharp peak situated right within the black bandwith a maximum concentration of 16 mmol S cm�3 (Fig. 3E).There was a minor peak in AVS concentration within Unit IIabelow which the concentration stayed relatively constant around5 mmol cm�3 down to the black band where there was a distinctpeak with a maximum concentration of 36 mmol cm�3 at 316 cm(Fig. 3F). Within Unit III, AVS remained low (o1 mmol cm�3)throughout the rest of the core. High concentrations of chromiumreducible sulfur (CRS, mainly FeS2) were found in Units I–IIb(ca. 100–300 mmol S cm�3) whereas CRS was low (o10 mmolS cm�3) through the non-sulfidized Unit III (Fig. 3F).
3.4. Magnetic nodules
Magnetic nodules collected in the black band within Unit IIb ofGC A varied in size but were typically o500 mm. Surface scans ofcut and polished nodules (collected in 2004) by SEM and EDSanalysis showed that they had a heterogeneous interior consistingmainly of iron and sulfur. From the atomic ratios, we identifiediron monosulfide (FeS), greigite (Fe3S4) and pyrite (FeS2) in mostof the nodules studied. As an example, the nodule presented inFig. 4 had a core of FeS2 surrounded by Fe3S4. However, a generalpattern was not found in the distribution of various iron sulfideminerals within six investigated nodules. Mixed concretions ofgreigite and pyrite have also previously been observed in BlackSea sediment (e.g. Bonev et al., 1989).
3.5. X-ray diffraction (XRD)
XRD analysis was performed on sediment collected from eachof the different sediment units in order to identify Fe(III)-bearingminerals. It should be noted, however, that the individual miner-als recognized with the XRD method show statistical distributionsof minerals only and not their concentrations.
We detected iron oxides, goethite and hematite, only in thenon-sulfidized limnic Unit III below a depth of 300 cm (i.e. belowthe sulfidization front) where they reached 1% dry wt. at 410 cm(data not shown). There was a great variety of silicate mineralsfound throughout the sediment core of which some containedFe(III) (data not shown). These were mainly of the subclassesphyllosilicates (sheet silicates) and cyclosilicates. The largestfraction of the phyllosilicates was made up by the sum of illiteand micas, ranging from 11% to 36% dry wt., whereas otherindividual phyllosilicates did not exceed 6% dry wt. The differentcyclosilicates did not show any particular trend with depth exceptthat the sum of illite and micas, montmorillonites and smectites,as well as kaolinite and biotite all increased in concentrationbelow the SMT (data not shown).
3.6. Sulfate reduction
The SRR data are separated into two graphs with differentscales in order to better describe the rates within the differentdepth intervals of the upper 400 cm (Fig. 5A and B). Note that thedepths of the SRR for the MUC core are given relative to thesediment surface while depths for the GC A core are given relativeto the core top and should therefore be shifted down, probably by10–20 cm, to be aligned with the MUC data.
The highest SRR in the MUC reached 38,000 pmol cm�3 d�1
(or 38 nmol cm�3 d�1) at 0.5 cm (Unit I), below which depththere was a steady decrease down to 230 pmol cm�3 d�1 at24 cm (Fig. 5A). In the GC A core, SRR generally decreased withdepth but peaked in the SMT with a mean rate of410 pmol cm�3 d�1 at 123 cm (Unit IIb, Fig. 5A). The SRR withinthe 200–400 cm depth interval decreased steeply and generallyfollowed the decreasing trend of sulfate in the pore water. TheSRR data below 250 cm are, however, somewhat inaccurate as thesulfate concentration approached the detection limit of our ionchromatographic technique. Below 400 cm, sulfate could not bedetected and the SRR could therefore not be calculated.
We measured potential sulfate reduction rates, P-SRR, at300–800 cm depth in GC B in the deepest part of Unit IIb andwithin the limnic Unit III (Fig. 5C) in order to test whether SRPpresent within the deeper sulfate-depleted parts of the sedimentwere metabolically active. (Note that the depth of the black banddiffers slightly between the GC A and B cores, as described above.)The P-SRR was 4–9 pmol cm�3 d�1 in the lower part of Unit IIbwith a peak of 20 pmol cm�3 d�1 in the black band (UnitIIb, Fig. 5C). In Unit III, P-SRR varied from 4 pmol cm�3 d�1 at400–500 cm to 15–24 pmol cm�3 d�1 at a depth of 600–700 cm(Fig. 5C).
Based on these results, our study demonstrates that active SRPmust be present in the limnic Unit III where the concentration ofsulfate was below detection. The combined time course of P-SRRfrom all depths within the 325–725 cm depth interval showedthat P-SRR started right away from the first incubation period andthat showed no systematic variations during incubation (data notshown). This suggests that the size of the SRP communities didnot change during the 48 h time course experiments.
The depth distribution of SRR within the sulfate zone isgenerally controlled by the availability of degradable organicmatter, which decreases over many orders of magnitude withdepth and age in the sediment. In order to show this we plottedall the experimentally measured SRR as a function of depth in adouble-log plot (Fig. 5D). (Fig. 5D includes both MUC and GC Adata but the inaccurate SRR below 250 cm were omitted.Note that the depths of the SRR in the GC A core relative to theMUC are not correct since it was not possible to make anabsolute depth correction.) The plot shows that a linear regression

Fig. 5. Sulfate reduction rates (SRR) measured experimentally using 35SO42� from (A) 0–24 cm depth in the MUC (open circles, upper scale) and 0–200 cm depth in GC A
(closed circles, lower scale), and (B) 200–400 cm depth in GC A. The shaded zone indicates the sulfidization front with a sand layer at the bottom. Error bars show standard
deviation of triplicate measurements. (C) Potential sulfate reduction rates (P-SRR) measured experimentally using 35SO42� at 300–800 cm depth. (D) Log–log plot of sulfate
reduction rates vs. depth in the MUC (open circles) and the GC A (closed circles). The linear regression line of the log–log transformed data above the AOM is shown.
Encircled data points from within and below the AOM zone were not included in the linear regression.
L. Holmkvist et al. / Deep-Sea Research I 58 (2011) 493–504500
analysis could be made for all the SRR data down to the SMT zonewhere AOM-enhanced sulfate reduction occurred. The SRRfrom within and below the SMT are not included in the linearregression since sulfate reduction in this zone is primarilyAOM driven. The linear regression showed that the SRRdecreased with depth in the sediment according to the follow-ing power law function: Log(SRR)¼4.60�1.25� Log(Z) orSRR¼40,000� Z�1.25 pmol cm�3 d�1, where Z is depth in thesediment (cm). In the methane zone, below the SMT, the SRRdata were below the extrapolated linear regression from thesulfate zone.
4. Discussion
4.1. Sulfate reduction
In a study by Jørgensen et al. (2001), modeling of SRR withinthe upper 2 m of a Black Sea sediment core resulted in averagerates of around 100 pmol cm�3 d�1. The experimentally mea-sured SRR in GC A of the upper 2 m (Fig. 5A) were in average260 pmol cm�3 d�1 and thus slightly above the model results.This difference is consistent with earlier observations as themodeling approach measures net sulfate reduction whereas the
35S-technique measures gross sulfate reduction. The differencebetween net and gross rates is expectedly due to a re-oxidation ofsulfide to sulfate due to reaction with oxidized iron species(Jørgensen et al., 2004). The SRR within and above the SMT (UnitsI–IIb) are in general comparable to the high SRR measuredexperimentally with 35SO4
2� tracer in sediments from the samearea of the Black Sea (Knab et al., 2008).
The steep decrease in sulfate and the broad peak in sulfide inUnit IIb point to a stimulated sulfate reduction due to anaerobicoxidation of methane within the SMT (Fig. 2A and B). This wasalso demonstrated by the local peak in SRR at 123 cm (Fig. 5A)and the depletion of methane up through the SMT (100–200 cmdepth interval) (Fig. 2A). The minor peak in sulfide in Unit I(Fig. 2B) and the high SRR in this zone (Fig. 5A) are, on the otherhand, consistent with the high content of organic carbon near thesediment surface (Fig. 1). It is not clear whether the near-surfaceH2S peak is a transient phenomenon or an artifact. If the near-surface H2S peak is correct and not transient, then the H2Sminimum at the Unit IIa/IIb transition at 65 cm depth shouldindicate an H2S sink right at that depth. This is consistent with apeak in CRS but it is not consistent with the depth distribution ofreactive iron.
The P-SRR experiments were used to detect bacteria with theability to reduce sulfate in the deep methanogenic sediment of
L. Holmkvist et al. / Deep-Sea Research I 58 (2011) 493–504 501
limnic origin, where the concentration of sulfate was too low tocalculate in situ SRR directly from unamended radiotracer experi-ments. Since the SRR and P-SRR estimates were obtained underdifferent experimental conditions, these rates are not directlycomparable. In the P-SRR experiments, the SRP were stimulatedby the addition of sulfate and organic substrates in order toanalyze the metabolic capacity of the existing SRP community.Given the rather short incubation times and the constant level ofSRR over time, it is unlikely that the SRP community grewsignificantly during the P-SRR experiments. Sulfate was reducedat consistent rates already from the first half hour after theinjection of 35SO4
2� , which indicates that the community alreadypossessed the physiological capacity for dissimilatory sulfatereduction. The overall mean P-SRR from core GC B was 610,390, 360 and 155 pmol cm�3 d�1 after 0.5, 1, 1.5 and 2 d,respectively (standard deviation 7–33 pmol cm�3 d�1; data notshown).
In contrast to the P-SRR measurements, SRR are determinedunder in situ conditions where the availability of energy sub-strates is limiting. The P-SRR below 300 cm depth were accord-ingly much higher than the SRR (Fig. 5B and C). The data showthat SRP were not limited to the upper sediment layers, which arerich in sulfate, but that they also maintained the capacity forsulfate reduction deep beneath the SMT and even beneath thesulfidization front. These data support the observations by Leloupet al. (2007), who quantified the SRP communities in deepsediment cores from the same site by Q-PCR targeting theirmetabolic key gene, dissimilatory (bi)sulfite reductase (dsrA).The authors showed that SRP occurred throughout the methanezone at 200–500 cm depth in numbers of 0.8–1.5�106 cells g�1.The proportion of SRP relative to the total microbial cell numberwas even as high, 5–10%, in the methane zone as in the sulfatezone. Our study now shows that the SRP in the methane zone areimmediately capable of performing sulfate reduction when pro-vided with appropriate substrates.
When SRR were calculated using the measured concentrationsof sulfate in the pore water, the rates apparently approached zerobelow 400 cm. However, we now speculate that the SRR do notquite decrease to zero but that the sulfate concentration in thepore water below 400 cm was simply too low for calculation ofthe SRR. It therefore seems likely that sulfate reduction occursalso in the methane zone within the limnic Pleistocene sediment(Unit III). For future studies of sulfate reduction within sub-surface sediments it is thus crucial that the analytical methodcan accurately measure sulfate also far below 50 mM.
4.2. Geochemistry of sulfur and iron
As a result of high SRR, reduced sulfur species (i.e. sulfide,polysulfides, elemental sulfur, AVS and CRS) were present at highconcentrations within the upper marine Units I–IIb. Most of theproduced sulfide was continuously lost from the zone of sulfatereduction, partly by diffusion up towards the sediment surface,partly by diffusion down towards the sulfidization front. A part ofthe sulfide, however, reacted with buried oxidized iron to formintermediate sulfur species. We analyzed the distribution of zero-valent sulfur and found that it occurred as elemental sulfur in thesolid-phase extractions throughout Units I and II (Fig. 3E). It alsooccurred in solution in the form of polysulfides of different chainlengths (Fig. 2C and D). The relative abundance of the differentpolysulfides differed from the expected distribution in equili-brium with rhombic cyclooctasulfur. In the presence of freesulfide and with excess of elemental sulfur, polysulfides areformed until an equilibrium concentration is reached. The depthdistribution of polysulfides in the Black Sea sediment was clearly
controlled by the distribution of free sulfide rather than thedistribution of elemental sulfur. Thus, the concentration ofsolid-phase elemental sulfur in Units I and II was 410-foldhigher that the total polysulfide concentration, even at thepolysulfide peak at 200 cm depth where the concentration ofelemental sulfur was the lowest (compare Figs. 3E and 2D). Thehigh peak of elemental sulfur at the sulfidization front was notaccompanied by a peak in polysulfide due to the low concentra-tion of free sulfide
In contrast to Units I and II, concentrations of reduced sulfurspecies were low in the limnic Unit III (Figs. 2B and 3E and F),where a steep gradient of dissolved iron demonstrates active ironreduction (Fig. 2B). The distribution of reducible iron oxides(Fig. 3B and C) showed that these were abundantly available foriron reducing microorganisms from the top of Unit III and down.XRD analyses below the sulfidization front also confirmed thepresence of iron oxides as well as Fe(III)-bearing clay minerals inthis sediment unit (data not shown).
Mn(IV) reacts with free sulfide on a time scale much shorterthan the age of the sub-surface sediment. The distribution of totalmanganese at low concentration throughout the sulfidic sedimentin Unit II and below (Fig. 3D) therefore indicates that it waspresent as carbonate-bound reduced manganese.
The black band in Unit IIb marked the lower boundary ofdownward diffusing sulfide produced within the SMT. At thetransition to Unit III, or just within this unit, the downwarddiffusing sulfide reacted with iron minerals and with dissolvediron diffusing upwards from the deeper sediment. It is not clearwhy the sulfidization front occurred exactly at the 3–5 cm thicksand layer marking the transition between Units IIb and III. Wespeculate that this coincidence could be due to a shift ingeochemistry, e.g. to a step-up in total reactive iron with a highcapacity to react with sulfide (Fig. 3B).
A sharp peak in magnetic susceptibility occurred within theblack band and coincided with peaks in AVS and CRS (Fig. 3A andF). Although the black color of sediments may not be a simpleindicator of AVS (Rickard and Morse, 2005), it seems reasonableto assume that, in this Black Sea sediment, the black color of thesulfidization front was indeed due to AVS (Fig. 3F). We foundnumerous greigite nodules within the black band and the pre-sence of this paramagnetic iron–sulfur mineral explained themagnetic susceptibility data (Fig. 3A). SEM and EDS analyses ofnodules collected with a magnet demonstrated that these con-tained both greigite (Fe3S4) and pyrite (FeS2) (Fig. 4). The contentof Fe3S4 in each nodule was not quantified, but scans of severalnodules showed that Fe3S4 makes up only a fraction of the totalamount of minerals present in each nodule. This is in accordancewith other studies from the Black Sea (Bonev et al., 1989;Jørgensen et al., 2004; Neretin et al., 2004).
Fe3S4 preservation may occur under different circumstanceswhen FeS is not completely transformed to FeS2 (Kao et al., 2004).However, the formation of FeS2 from the metastable FeS fraction(the AVS fraction) has not been completely resolved. Our studyshows that iron–sulfur intermediates were abundant within UnitIIb where the mechanism of FeS2 formation could occur either viapolysulfides, elemental sulfur or sulfide in the pore water (Berner,1970; Luther, 1991; Rickard and Luther III, 1997; Neretin et al.,2004).
The finding of a deep sulfidization front where sulfide pro-duced within the SMT is trapped at depth has been observed alsoin other continental shelf sediments such as the Baltic Sea(Boesen and Postma, 1988). Below the sulfidization front ironsulfides (FeS and FeS2, Fig. 3F) occurred at low concentration,which indicates that a limited sulfide production had occurred.This is consistent with the finding of active sulfate reducers in thelimnic sediment layers, but it may also be the result of iron sulfide

L. Holmkvist et al. / Deep-Sea Research I 58 (2011) 493–504502
formation during the earlier history of the Black Sea, at the timewhen the limnic deposit was formed.
4.3. Deep production of sulfate and active SRP below the SMT
One of the aims of the present study was to demonstratewhether SRP below the SMT do indeed reduce sulfate and toexplain their presence within sub-surface sediments in terms ofthe availability of electron donors and acceptors. The SRR measure-ments showed that SRP, which are present several meters belowthe SMT (Leloup et al., 2007), are indeed actively reducing sulfate.The P-SRR data showed that their capacity for sulfate reduction inthe 326–395 cm depth interval was 3–140-fold higher than themeasured in situ rates and probably relatively even higher deeperin the limnic Unit III (Fig. 5C). The in situ activity was thus highlyconstrained by the low concentration and reactivity of TOC andpossibly also by the low sulfate concentration.
Sulfate dropped steeply with depth from 12 mM at the GC coretop to about 0.01 mM at 400 cm, below which we could no longerdetect sulfate. We suggest that the measured low concentrationof sulfate below the SMT was not just an artificial ‘‘background’’,although the concentrations below 250 cm were inaccurate, butthat sulfate is indeed present at low concentration in the methanezone and is actively turning over here. We provide the followingarguments to support this:
(a)
The background could be a handling artifact due to chemicalor biological oxidation of free sulfide during the time betweencoring and sulfate measurement. However, the storage, sam-pling and analysis of the cores were done very carefully inorder to minimize sample oxidation and to exclude suchpossible artifacts. For example, gravity cores were sectionedand kept upright in the core liners on the ship and duringtransport to avoid air contact at the outside of the sedimentcore. The sampling of pore water using rhizons inserted intothe middle of the core took place on the day of coring whichshould not have allowed sufficient time for diffusion ofoxygen and sulfate from the core periphery to the center.The first extracted pore water was always discarded as it hadbeen in contact with air and pore water was immediatelyfixed with zinc acetate to prevent sulfide oxidation. It istherefore most probable that there was no significant oxida-tion of sulfide during the pore water extraction, which couldhave affected the extracted sulfate data. This was alsodemonstrated in a study from Aarhus Bay, where pore waterwas extracted under anoxic conditions inside an anaerobicglove box in order to test whether auto-oxidation of sulfideoccurred during the extraction in open air. That experimentshowed that there was no significant difference between thelow concentrations of sulfate extracted in open air with thoseextracted under controlled anoxic conditions.(b)
The sulfate could be a biologically unavailable background oreven be passively diffusing down into the methane zone,because it was not being consumed by sulfate-reducing micro-organisms. The sulfate background could be biologically una-vailable because the concentration was below a physiologicalthreshold for uptake and respiration. However, the fact that thesulfate concentration did drop to undetectable concentrationbeneath 400 cm speaks against the hypothesis of an energeti-cally unavailable threshold concentration at this level.(c)
The sulfate could be generated in situ down in the methanezone by reaction between free sulfide or iron sulfide mineralsand oxidized iron buried in the sediment. We propose thatthis is indeed the main explanation for the measured lowsulfate concentrations (cf. Holmkvist et al., in prep.).The iron oxides within the non-sulfidized Unit III (Fig. 3B–D)constitute an efficient barrier, which oxidizes and traps thedownward diffusing sulfide at the sulfidization front as describedabove. The parallel decrease in sulfide and sulfate above thesulfidization front suggests a close association between theformation of sulfate and in situ re-oxidation of sulfide. From theXRD analyses we found that hematite and goethite were presentbelow the sulfidization front. This was consistent with an increasein dithionite reactive iron below the sulfidization front (Fig. 3B)since the dithionite method extracts hematite and goethite(Kostka and Luther, 1994).
The cryptic formation of sulfate within the methane zone is,however, not simple to explain based on reactions between freesulfide and solid-phase Fe(III). In a study from Aarhus Bay wepropose a combination of well-known reactions between sulfideand oxidized iron. We thereby hypothesize first an oxidation ofsulfide by a Fe(III) species to an intermediate oxidation state, suchas elemental sulfur or thiosulfate. Thiosulfate is chosen herebecause we assume a subsequent disproportionation reaction,and the disproportionation of elemental sulfur is not exergonicunder the high sulfide concentration available in the methanezone of the Black Sea sediment. Iron oxy-hydroxide (goethite,FeOOH) is chosen only as an example for the proposed reaction.Other less reactive Fe(III)-containing minerals, such as the sheetsilicates detected with XRD, are more likely to be involved.
The first proposed series of reactions thus lead to a net partialoxidation of sulfide by oxidized iron:
2H2S+8FeOOH+14H+-S2O32� +8Fe2 + +13H2O (3)
The sulfur intermediate is then disproportionated by bacteria,a reaction that does not require additional energy sources(Jørgensen, 1990):
S2O32� +H2O-H2S+SO4
2� (4)
The Fe2 + formed in Eq. (3) will spontaneously precipitate freeH2S from the pore water:
8H2S+8Fe2 +-8FeS+16H+ (5)
Pyrite, rather than FeS, is by far the predominant iron-sulfurspecies in the methane zone (Fig. 3F) and a further reaction of FeSto pyrite must take place. We propose here, as one of severalpossible pathways, the Wachtershauser reaction whereby H2S isoxidized with the concomitant formation of molecular hydrogen(Drobner et al., 1990; Rickard, 1997):
8H2S+8FeS-8FeS2+8H2 (6)
The sum of reactions 3 to 6 thus leads to the following netEq. (7). Thereby, the reaction of oxidized iron with free sulfideleads primarily to pyrite but also generates a small amount ofsulfate as well as excess reducing power in the form of H2:
17H2S+8FeOOH-SO42� +8FeS2+8H2+12H2O+2H+ (7)
The excess H2 may in the methanogenic sediment be oxidizedwith HCO3
� by methanogenic archaea. The produced methanediffuses upwards to be oxidized at the expense of sulfate at theSMT. The excess reducing power is thereby exported from thesulfate-depleted sediment and enables the formation of a moreoxidized product, FeS2, from the net reaction of sulfide andoxidized iron. A part of the H2 may also be oxidized with SO4
2�
by the sulfate-reducing bacteria and thereby contribute to themeasured sulfate reduction.
We propose that this transient production of sulfate couldstimulate and maintain active SRP within the methane zone.In the Black Sea sediments, the abundance of elemental sulfur

L. Holmkvist et al. / Deep-Sea Research I 58 (2011) 493–504 503
(the bulk of the total sum of ZVS in Fig. 3E) is evidence that sulfideis oxidized chemically by iron according to well-known oxidationreactions described by Burdige and Nealson (1986) and Pyzik andSommer (1981). Oxidation of sulfide (or other sulfur intermedi-ates) seems to be particularly intense at the sulfidization front asindicated by the large peak in elemental sulfur (Fig. 3E). Thisfinding is in agreement with the increasing content of easilyreducible iron oxides down through the sulfidization front(dithionite reactive iron in Fig. 3B). Further, the presence of ZVSspecies, ranging 0.2–2 mmol cm�3, in sediment extending fromthe SMT and down to the sulfidization front (Fig. 3E) supports ourargument for Fe(III) driven sulfide oxidation.
It is an interesting observation that active SRP were found alsowithin the limnic sediment of Unit III (Fig. 5C), although sulfateand sulfide were not detected in the pore water. We suspect thatthe SRP present in Unit III reduce sulfate also in situ since theradioactive 35S counts in the TRIS fraction from the SRR sampleswere significantly above the blank values (data not shown). Ittherefore seems likely that sulfate was also present below thesulfidization front, but concentrations were too low to be quanti-fied (o50 mM), and that the sulfide produced from sulfatereduction was removed immediately from the pore water dueto reaction with Fe(III).
ZVS species could not be detected below a depth of 345 cm(Figs. 2D and 3E). This indicates that only a very limited re-oxidationof free sulfide occurs in Unit III and that rapid removal of ZVS viadisproportionation prevented accumulation. Re-oxidation of freesulfide according to Eq. (7) may not be the only explanation forthe production of sulfate below the sulfidization front, however. Re-oxidation of iron sulfide minerals, such as FeS or FeS2 (the AVS andCRS fraction, respectively, Fig. 3F) to elemental sulfur or thiosulfateand subsequent disproportionation, might also lead to a sub-surfaceproduction of sulfate in Unit III. The re-oxidation of iron sulfide withiron oxide minerals has been proposed from several previous studies(Burdige and Nealson, 1986; Pyzik and Sommer, 1981; Steudel,1996; Yao and Millero, 1996).
The oxidation of FeS2 could theoretically also be due to deeplyburied Mn(IV). However, since this buried manganese would havebeen exposed to high concentrations of reactive sulfide overthousands of yours, it is assumed that the extracted manganesewas not in an oxidized form but was primarily present asmanganese carbonate (Fig. 3D).
The P-SRR in Unit III increased with depth (Fig. 5C) andshowed a high potential for sulfate reduction of the microbialcommunity. The SRP living down in the methane zone areapparently adapted to low concentrations of sulfate and musthave high affinity to sulfate at low concentrations. Ingvorsen andJørgensen (1984) found that freshwater strains of SRP grown inbatch culture were able to sustain growth at sulfate concentra-tions down to 5 mM. Perhaps the SRP within Unit III originatefrom freshwater strains from the time when the Black Sea wasstill a lake. Alternatively, it may be well that marine sulfate-reducing bacteria develop high sulfate affinity when growingunder limiting sulfate concentrations. Incubation experimentswith marine surface sediment have recently shown that the SRPunder energetically favorable conditions may deplete sulfate too1 mM (Tarpgaard, Jørgensen and Røy, in prep.).
5. Conclusions
The potential sulfate reduction rates measured in this studyshow for the first time that the sulfate-reducing prokaryotes thatare present several meters below the SMT in Black Sea sedimentmay live as active sulfate reducers. We propose that there is anongoing cryptic sulfur cycle in the deep methane-rich sediment
by which Fe(III) minerals oxidize sulfide or other reduced sulfurspecies in pore water and sediment. The immediate oxidationproducts are sulfur species of intermediate oxidation steps, suchas elemental sulfur or thiosulfate. Through disproportionationreactions these may be partly oxidized to sulfate, which thenserves as electron acceptor for the sulfate-reducing bacteria.
Acknowledgement
We thank Martina Meyer, Thomas Max, Andrea Schipper andKirsten Imhoff at the Max Planck Institute for Marine Microbiol-ogy for assistance in the laboratory with analyses of sulfurspeciation. We thank Natascha Riedinger from The Max PlanckInstitute for Marine Microbiology and Antje Vossmeyer fromDepartment of Marine Sciences, University of Georgia (Athens,USA), for assistance with methane analysis. We thank Nina Knab(University of Southern California, USA) for sampling the sedi-ment used to study the magnetic nodules and Vera Lukies fromthe Center for Marine Environmental Sciences (MARUM in Bre-men, Germany) for assistance with magnetic susceptibility mea-surements. XRD analyses were performed by the research groupCrystallography, Dept. of Geosciences, University of Bremen. Weare grateful to Christian Borowski from the MPI for planning andleading the M72-5 METEOR cruise. Finally, we thank the captainand crew of the RV METEOR for a successful expedition. This studywas financially supported by the Max Planck Society and theDanish National Research Foundation.
References
Arthur, M.A., Dean, W.E., 1998. Organic-matter production and preservation andevolution of anoxia in the Holocene Black Sea. Paleoceanography 13, 395–411.
Berner, R.A., 1970. Sedimentary pyrite formation. American Journal of Science 268,1–23.
Berner, R.A., 1984. Sedimentary pyrite formation: an update. Geochimica etCosmochimica Acta 48, 605–615.
Boesen, C., Postma, D., 1988. Pyrite formation in anoxic environments of the Baltic.American Journal of Science 288, 575–603.
Bonev, I.K., Khrischev, K.G., Neikov, H.N., Georgiev, V.M., 1989. Mackinawite andgreigite in iron sulphide concretions from Black Sea sediments. ComptesRendus, Academie Bulgare des Sciences 42, 97–100.
Burdige, D.J., Nealson, K.H., 1986. Chemical and microbiological studies of sulfide-mediated manganese reduction. Geomicrobiology Journal 4, 361–387.
Calvert, S.E., Karlin, R.E., 1991. Relationships between sulphur, organic carbon, andiron in the modern sediments of the Black Sea. Geochimica et CosmochimicaActa 55, 2483–2490.
Canfield, D.E., Berner, R.A., 1987. Dissolution and pyritization of magnetite inanoxic marine sediments. Geochimica et Cosmochimica Acta 51, 645–659.
Canfield, D.E., 1989. Reactive iron in marine sediments. Geochimica et Cosmochi-mica Acta 53, 619–632.
Canfield, D.E., Raiswell, R., Bottrell, S., 1992. The reactivity of sedimentary ironminerals toward sulfide. American Journal of Science 292, 659–683.
Chung, F.H., 1974. Quantitative interpretation of X-ray diffraction patterns,I. Matrix-flushing method of quantitative multicomponent analysis. Journalof Applied Crystallography 7, 513–519.
Cline, J.D., 1969. Spectrophotometric determination of hydrogen sulfide in naturalwaters. Limnology and Oceanography 14, 454–458.
Coleman, M.L., Hedrick, D.B., Lovley, D.R., White, D.C., Pye, K., 1993. Reduction ofFe(III) in sediments by sulfate-reducing bacteria. Nature 361, 436–438.
Drobner, E., Huber, H., Waechtershaeuser, G., Rose, D., Stetter, K.O., 1990. Pyriteformation linked with hydrogen evolution under anaerobic conditions. Nature346, 742–744.
Fossing, H., Jørgensen, B.B., 1989. Measurement of bacterial sulfate reduction insediments: evaluation of a single-step chromium reduction method. Biogeo-chemistry 8, 205–222.
Habicht, K.S., Salling, L., Thamdrup, B., Canfield, D.E., 2005. Effect of low sulfateconcentrations on lactate oxidation and isotope fractionation during sulfatereduction by Archaeoglobus fulgidus strain Z. Applied and EnvironmentalMicrobiology 71, 3770–3777.
Hay, B.J., Arthur, M.A., Dean, W.E., Neff, E.D., Honjo, S., 1991. Sediment depositionin the Late Holocene Abyssal Black-Sea with Climatic and chronologicalimplications. Deep-Sea Research 38, 1211–1235.
Ingvorsen, K., Jørgensen, B.B., 1984. Kinetics of sulfate uptake by freshwater andmarine species of Desulfovibrio. Archives of Microbiology 139, 61–66.

L. Holmkvist et al. / Deep-Sea Research I 58 (2011) 493–504504
Jones, G., Gagnon, A., 1994. Radiocarbon chronology of Black Sea sediments.Deep-Sea Research Part I 41, 531–557.
Jørgensen, B.B., 1978. A comparison of methods for the quantification of bacterialsulfate reduction in coastal marine sediments. III. Estimation from chemicaland bacteriological field data. Geomicrobiology Journal 1, 49–64.
Jørgensen, B.B., 1990. A thiosulfate shunt in the sulfur cycle of marine sediments.Science 249, 152–154.
Jørgensen, B.B., Weber, A., Zopfi, J., 2001. Sulfate reduction and anaerobicmethane oxidation in Black Sea sediments. Deep-Sea Research Part I 48,2097–2120.
Jørgensen, B.B., Boettcher, M.E., Lueschen, H., Neretin, L.N., Volkov, I.I., 2004.Anaerobic methane oxidation and a deep H2S sink generate isotopically heavysulfides in Black Sea sediments. Geochimica et Cosmochimica Acta 68,2095–2118.
Kallmeyer, J., Ferdelman, T.G., Weber, A., Fossing, H., Jørgensen, B.B., 2004.A cold chromium distillation procedure for radiolabeled sulfide applied tosulfate reduction measurements. Limnology and Oceanography: Methods 2,171–180.
Kamyshny, A., Borkenstein, C.G., Ferdelman, T.G., 2009. Protocol for quantitativedetection of elemental sulfur and polysulfide zero-valency sulfur distributionin natural aquatic samples. Geostandards and Geoanalytical Research 33,415–435.
Kamyshny Jr, A., 2009. Improved cyanolysis protocol for detection of zero-valentsulfur in natural aquatic systems. Limnology and Oceanography: Methods 7,442–448.
Kamyshny, A., Ekeltchik, I., Gun, J., Lev, O., 2006. Method for the determination ofinorganic polysulfide distribution in aquatic systems. Analytical Chemistry 78,2359–2400.
Kamyshny, A., Goifman, A., Gun, J., Rizkov, D., Lev, O., 2004. Equilibrium distribu-tion of polysulfide ions in aqueous solutions at 25 1C: a new approach for thestudy of polysulfides equilibria. Environmental Science and Technology 38,6633–6644.
Kao, S.J., Horng, C.S., Roberts, A.P., Liu, K.K., 2004. Carbon–sulfur–iron relationshipsin sedimentary rocks from southwestern Taiwan: influence of geochemicalenvironment on greigite and pyrrhotite formation. Chemical Geology 203,153–168.
Knab, N.J., Cragg, B.A., Hornibrook, E.R.C., Holmkvist, L., Borowski, C., Parkes, R.J.,Jørgensen, B.B., 2008. Regulation of anaerobic methane oxidation in sedimentsof the Black Sea. Biogeosciences Discussions 5, 2305–2341.
Kostka, J.E., Luther, G.W., 1994. Partitioning and speciation of solid-phase iron insalt-marsh sediments. Geochimica et Cosmochimica Acta 58, 1701–1710.
Leloup, J., Loy, A., Knab, N.J., Borowski, C., Wagner, M., Jørgensen, B.B., 2007.Diversity and abundance of sulfate-reducing microorganisms in the sulfateand methane zones of a marine sediment, Black Sea. Environmental Micro-biology 9, 131–142.
Luther, G.W., 1991. Pyrite synthesis via polysulfide compounds. Geochimica etCosmochimia Acta 55, 2839–2849.
Neretin, L.N., Bottcher, M.E., Jørgensen, B.B., Volkov, I.I., Lueschen, H., Hilgenfeldt,K., 2004. Pyritization processes and greigite formation in the advancingsulfidization front in the upper Pleistocene sediments of the Black Sea.Geochimica et Cosmochimica Acta 68, 2081–2093.
Petschick, R., Kuhn, G., Gingele, F., 1996. Clay mineral distribution in surfacesediments of the South Atlantic: sources, transport, and relation to oceano-graphy. Marine Geology 130, 203–229.
Pyzik, A.J., Sommer, S.E., 1981. Sedimentary iron monosulfides: kinetics andmechanism of formation. Geochimica et Cosmochimica Acta 45, 687–698.
Raiswell, R., Buckley, F., Berner, R.A., Anderson, T.F., 1988. Degree of pyritization ofiron as a paleoenvironmental indicator of bottom water oxygenation. Journalof Sedimentary Petrology 58, 812–819.
Raiswell, R., Canfield, D.E., 1996. Rates of reaction between silicate iron anddissolved sulfide in Peru Margin sediments. Geochimica et Cosmochimica Acta60, 2777–2787.
Rickard, D., 1997. Kinetics of pyrite formation by the H2S oxidation of iron (II)monosulfide in aqueous solutions between 25 and 125 degrees Celsius:the rate equation. Geochimica et Cosmochimica Acta 61, 115–134.
Rickard, D., Morse, J.W., 2005. Acid volatile sulfide (AVS). Marine Chemistry 97,141–197.
Rickard, D.T., Luther III, G.W., 1997. Kinetics of pyrite formation by the H2Soxidation of iron (II) monosulfide in aqueous solutions between 25 and 125degrees Celsius: the mechanism. Geochemica et Cosmochimica Acta 61,135–147.
Rong, L., Lim, L.W., Takeuchi, T., 2005. Determination of iodide and thiocyanate inseawater by liquid chromatography with poly(ethylene glycol) stationaryphase. Chromatographia 61, 371–374.
Ross, D.A., Degens, E.T., 1974. Recent sediments of the Black Sea. AmericanAssociation of Petroleum Geologists 20, 183–199.
Ross, D.A., Degens, E.T., Macllvaine, J., 1970. Black Sea: recent sedimentary history.Science 170, 163–165.
Steudel, R., 1996. Mechanism for the formation of elemental sulfur from aqueoussulfide in chemical and microbiological desulfurization processes. Industrial &Engineering Chemistry Research 35, 1417–1423.
Stookey, L.L., 1970. Ferrozine—a new spectrophotometric reagent for iron.Analytical Chemistry 42, 779–781.
Thamdrup, B., Finster, K., Hansen, J.W., Bak, F., 1993. Bacterial disproportionationof elemental sulfur coupled to chemical reduction of iron or manganese.Applied and Environmental Microbiology 59, 101–108.
Thamdrup, B., Fossing, H., Jørgensen, B.B., 1994. Manganese, iron, and sulfurcycling in a coastal marine sediment, Aarhus Bay, Denmark. Geochimica etCosmochimica Acta 58, 5115–5129.
Vogt, C., Lauterjung, J., Fischer, R.X., 2002. Investigation of the clay fraction(o2 mm) of the clay mineral society reference clays. Clays and Clay Minerals50, 388–400.
Widdel, F., Hansen, T., 1992. The dissimilatory sulfate- and sulfur- reducingbacteria. In: Balows, A., Trruper, H., Dworkin, M., Harder, W., Schleifer, K.H.,(Eds.), The Prokaryotes. Springer-Verlag, pp. 583–624.
Yao, W.S., Millero, F.J., 1996. Oxidation of hydrogen sulfide by hydrous Fe(III)oxides in seawater. Marine Chemistry 52, 1–16.
Zopfi, J., Ferdelman, T.G., Fossing, H., 2004. Distribution and fate of sulfurintermediates – sulfite, tetrathionate, thiosulfate, and elemental sulfur – inmarine sediments. In: Amend, J.P., Edwards, K.J., Lyons, T.W. (Eds.), Distribu-tion and Fate of Sulfur Intermediates – Sulfite, Tetrathionate, Thiosulfate, andElemental Sulfur – in Marine Sediments. The Geological Society of America,Colorado, pp. 1–205.


![Bis[diamino(ethoxycarbonylamino)methylium] sulfate](https://img.pdfslide.net/doc/110x75/6323db435f71497ea90487bd/bisdiaminoethoxycarbonylaminomethylium-sulfate.jpg)

