Embed Size (px)
Citation preview
ABDELAAZIZ AZIZI
GOLD CYANIDATION REVISITED – KINETIC &
ELECTROCHEMICAL STUDIES OF GOLD –
SULFIDIC ORE MIXED/MULTILAYER FIXED BEDS
Thèse présentée
à la Faculté des études supérieures de l’Université Laval
dans le cadre du programme de doctorat en génie chimique
pour l’obtention du grade de Philosophie Doctor (Ph.D.)
DÉPARTEMENT DE GÉNIE CHIMIQUE
FACULTÉ DES SCIENCES ET DE GÉNIE
UNIVERSITÉ LAVAL
QUÉBEC
2011
© Abdelaaziz Azizi, 2011
i
Résumé
Pour déchiffrer le rôle de minerais sulfureux sur la cyanuration de l’or, une étude détaillée
sur l’importance relative des phénomènes de passivation (PP) et d’interactions galvaniques
(IG) a été menée dans le présent travail de thèse. Une électrode tournante à disque (RDE)
Au/Ag plongée successivement dans une série de pulpes préparées à partir d’une large
gamme de sulfures métalliques a révélé l’impact négatif de ces derniers sur la lixiviation de
l’or. Puisque les contacts galvaniques permanents entre électrode tournante à disque d’or
(RDE) et suspensions de minerais sulfureux sont difficiles à mettre en œuvre, les tests
standards de cyanuration réalisés en mode RDE/slurry ont plutôt tendance à surestimer
l’importance des PP sur l’effet aidant des IG, intrinsèquement présents dans les particules
minérales. Ainsi, un nouveau réacteur électrochimique à lit fixe (PBER) a été développé et
testé pour découpler et quantifier les contributions individuelles des PP et d’IG sur la
lixiviation de métaux précieux (or et argent, PM) lors de la cyanuration de minerais riches
en sulfures. Le réacteur a été chargé de mélanges homogénéisés, de sulfures et de poudres
d’or et d’argent, où y sont établis les contacts galvaniques permanents à l’échelle inter-
particulaire entre tous les constituants. Les IG améliorent, à des degrés variables, la
lixiviation des métaux précieux, particulièrement celles dues à la pyrite, à la chalcopyrite et
à un minerai industriel ont été tellement positives qu’elles l’emportent largement sur les
effets négatifs dus aux PP.
L’extension de la nouvelle approche du PBER pour prendre en considération les
caractéristiques minéralogiques de plusieurs systèmes multi-minéraux a montré que les IG
Au- sulfures ont été le paramètre le plus important contrôlant la lixiviation de l’or.
Finalement, plusieurs stratégies ont été testées pour améliorer la cinétique de cyanuration
de l’or en présence de sulfures inhibiteurs. La galène neutralise largement l’effet négatif de
la dissolution des minéraux sulfureux sur la lixiviation de l’or. Des tests de pré-oxydation
menés sur des sulfures individuels puis sur leurs mélanges associés ont montré que les IG
sulfure-sulfure se produisant lors de l’étape de pré-oxydation au sien du mélange peuvent
donner lieu à des résultats totalement différents pendant la cyanuration.
ii
Abstract
To elucidate the role of sulfide ores on gold cyanidation, a detailed study on the relative
importance of passivation phenomena (PP) and galvanic interactions (GI) was carried out
in the present thesis work. A Rotating Disc Electrode (RDE) Au/Ag disc immersed
successively in slurries of a wide range of sulfide rich ores emphasized the negative impact
of sulfide minerals on the gold leaching rate. Because permanent GI between gold RDE and
slurried sulfide-rich ores are uneasy to achieve, the standard gold RDE/slurry cyanidation
arrangement has a tendency to inflate overly the importance of PP over the corrective trend
of GI inherently present within the ore grains. A new packed-bed electrochemical reactor
(PBER) was thus developed and tested to decouple and quantify the individual
contributions of PP and GI on precious metal (gold and silver, PM) leaching rates during
cyanidation of sulfidic ores. The PBER was filled with mixtures of sulfide minerals, gold
and silver powders, where permanent (inter)particle-particle electrical contacts were
ensured among all constituents. GI were found to ameliorate, to various degrees, the
leaching of PM, particularly those due to pyrite, chalcopyrite and an industrial ore were so
positive that they largely outweighed the negative impact of PM passivation.
Extending the new PBER approach to consider the mineralogical characteristics of several
multi-mineral systems indicated that GI between gold and sulfide mineral particles were the
most important parameters affecting gold leaching. Several leveraging strategies were
tested to increase gold cyanidation kinetics in the presence of PM-leaching inhibiting
sulfide minerals. Galena was found to largely neutralize the negative effect of sulfide
minerals dissolution on gold leaching. Pre-oxidation tested on individual sulfide minerals
and on their associated mixtures revealed that GI occurring between conducting phases
present in the ore may give rise to totally different cyanidation responses.
iii
Avant-Propos
Cinq chapitres composent le présent mémoire de thèse. Le chapitre I (Introduction) est
dédié à une revue de la littérature sur les principaux facteurs ayant une influence sur la
cinétique de l’oxycyanolixiviation de l’or dans un milieu typique de sulfures alors que les
chapitres II-V portent sur les travaux expérimentaux expressément réalisés pour l’obtention
du doctorat. Ces travaux ont donné lieu à quatre publications scientifiques dont deux ont
déjà été acceptées dans le journal international hydrometallurgy. Deux autres publications
sont soumises au même journal.
[1] Azizi, A., Petre, C.F., Olsen, C., Larachi, F., 2010. Electrochemical behavior of gold
cyanidation in the presence of a sulfide-rich industrial ore versus its major constitutive
sulfide minerals. Hydrometallurgy 101, 108-119.
[2] Azizi, A., Petre, C.F., Olsen, C., Larachi, F., 2011a. Untangling galvanic and
passivation phenomena induced by sulfide minerals on precious metal leaching using a new
packed-bed electrochemical cyanidation reactor. Hydrometallurgy, accepted paper.
[3] Azizi, A., Petre, C.F., Olsen, C., Larachi, F., 2011b. The effect of gold mineralogical
associations on its recovery by cyanidation from multi-mineral systems: packed-bed
electrochemical reactor approach. Hydrometallurgy, submitted paper.
[4] Azizi, A., Petre, C.F., Olsen, C., Larachi, F., 2011c. Leveraging strategies to increase
gold cyanidation in the presence sulfide minerals: packed-bed electrochemical reactor
approach. Hydrometallurgy, submitted paper.
Chaque publication constitue un chapitre séparé du corps de la thèse. Cependant quelques
parties superflues ont été éliminées des introductions du troisième et du quatrième article
pour éviter certaines répétitions. Les publications ont été rédigées par moi-même et
corrigées par mon directeur et mon codirecteur.
iv
Remerciements
Ce travail a pu être à terme grâce aux orientations et au soutien de mon directeur
scientifique de thèse, Professeur Faïçal Larachi. Qu’il trouve ici la preuve de toute ma
reconnaissance et mes remerciements pour sa grande disponibilité et pour le temps qu’il a
consacré au bon déroulement des travaux de doctorat en me faisant bénéficier de ses vastes
connaissances scientifiques.
Je tiens à remercier Monsieur Catalin Florin Petre, qui a bien voulu être mon codirecteur de
thèse, à qui je dois une reconnaissance particulière pour sa grande contribution scientifique,
pour ses critiques et pour ses encouragements. Qu’il veuille bien trouver ici l’expression de
ma profonde reconnaissance de m’avoir aidé à la réalisation de ce travail.
Ce travail a bénéficié d’une collaboration fructueuse dans le cadre d’un projet de recherche
et développement coopératif entre l’Université Laval et le Consortium de Recherche
Minérale du Québec (COREM). Je tiens à remercier COREM pour le financement qui m’a
permis de réaliser cette thèse. Les interactions rapprochées et nombreuses avec les
chercheurs et techniciens de COREM et les rétroactions mutuelles ayant eu lieu ont été une
source d’enrichissement permanent. Je pense particulièrement à Caroline Olsen, merci pour
son intérêt, sa collaboration et sa chaleur humaine.
Je tiens à remercier également Monsieur Abdelaziz Baçaoui, Professeur à l’université Cadi
Ayyad au Maroc pour son aide et ses précieux conseils.
Un grand merci à tous mes amis, professeurs et corps administratif et technique du
département de génie chimique de l’Université Laval. Si par hasard, je venais d’oublier
certaines personnes, qu’elles sachent que ma reconnaissance va bien au-delà de ces
remerciements
Il est difficile de trouver des mots assez forts pour exprimer mon immense gratitude et ma
plus grande affection à deux personnes à qui je dois tout : mes parents. Pour leur amour,
leurs sacrifices, leur dévouement et leur encouragement inlassable; qu’ils acceptent que je
leur dédie ce travail.
v
Table des matières
Résumé ..................................................................................................................................... i Abstract .................................................................................................................................. ii Avant-Propos ........................................................................................................................ iii Remerciements ....................................................................................................................... iv
Table des matières .................................................................................................................. v Liste des tableaux ................................................................................................................ viii Liste des figures ..................................................................................................................... ix CHAPITRE I. Introduction et objectifs .............................................................................. 1
I.1 Généralités ..................................................................................................................... 1
I.2 Cyanuration de l’or ........................................................................................................ 6 I.2.1 Complexe Au(CN)2
- ............................................................................................... 6
I.2.2 Mécanismes de dissolution de l’or ......................................................................... 7 I.2.3 Cinétique de la réaction de dissolution de l’or ....................................................... 9
I.2.3.1 Cyanure et Oxygène Dissous ........................................................................... 9 I.2.3.2 Effet de la Température ................................................................................. 11
I.2.3.3 Effet du pH .................................................................................................... 13 I.2.3.4 Surface de contact .......................................................................................... 15 I.2.3.5 Agitation ........................................................................................................ 15
I.2.3.6 Effet des dopants métalliques ........................................................................ 16 I.2.3.7 Phénomènes de passivation & d’interactions Galvaniques ........................... 17
I.3.1 Dissolution des minéraux sulfureux dans les solutions de cyanure ..................... 20 I.3.1.1 Minéraux de Cuivre ....................................................................................... 21 I.3.1.2 Minéraux de fer ............................................................................................. 24
I.3.1.3 Minéraux de zinc ........................................................................................... 25
I.3.1.4 Minéraux d’antimoine ................................................................................... 26 I.3.2 Spéciation du soufre dans les solutions de cyanure et passivation ....................... 28 I.3.3 Phénomènes de passivation et d’interactions galvaniques ................................... 30
I.4 Objectifs du projet ....................................................................................................... 36 I.5 Bibliographie ............................................................................................................... 40
CHAPITRE II. Electrochemical behavior of gold cyanidation in the presence of a sulfide-
rich industrial ore versus its major constitutive sulfide minerals ......................................... 43 II.1. Introduction ............................................................................................................... 45 II.2. Experimental ............................................................................................................. 48
II.2.1. Reagents ............................................................................................................. 48 II.2.2. Materials ............................................................................................................. 48 II.2.3. Electrochemical Campaign ................................................................................ 50
II.2.3.1 Preparation of Disc Electrodes ..................................................................... 50
II.2.3.2 Anodic and Cathodic Behavior of Gold and Mineral Disc Electrodes ........ 51 II.2.3.3 Disc Electrode Galvanic Couples ................................................................. 51
II.2.4. Sulfide Minerals and Gold Dissolution in Slurry Reactor ................................. 52
II.3. Results and discussion ............................................................................................... 53 II.3.1. Anodic and Cathodic Behavior of Gold and Mineral Disc Electrodes .............. 53 II.3.2. Disc Electrode Galvanic Couples ....................................................................... 56
vi
II.3.3. Disc Electrodes Passivation and Galvanic Interactions Effects on Gold
Leaching ........................................................................................................................ 59
II.3.4. Electrochemical Pre-oxidation of Mineral Disc Electrodes and Gold Leaching
...................................................................................................................................... 61 II.3.5. Sulfide Minerals and Gold Dissolution in Slurry Reactor ................................. 63 II.3.6. Alkaline Pre-oxidation of Sulfide Ores and Gold Leaching .............................. 65 II.3.7. Gold leaching, NaOH vs. Ca(OH)2 and pre-oxidation by DO2 vs. H2O2 ........... 77
II.4. Conclusion ................................................................................................................. 79 II.5. References ................................................................................................................. 81
CHAPITRE III. Untangling galvanic and passivation phenomena induced by sulfide
minerals on precious metal leaching using a new packed-bed electrochemical cyanidation
reactor 84
III.1 Introduction ............................................................................................................... 86 III.2. Experimental ............................................................................................................ 88
III.2.1. Materials and reagents ...................................................................................... 88
III.2.2. Equipment and procedures ................................................................................ 90
III.2.2.1. Sulfide minerals and PM dissolution in a packed bed electrochemical
reactor ....................................................................................................................... 90
III.2.2.2. Electrochemical campaign ......................................................................... 93 III.3. Results and Discussion ............................................................................................ 94
III.3.1. Effect of Pyrite (MRI-2) on Gold and Silver Leaching .................................... 94
III.3.2. Effect of Chalcopyrite (MRI-3) on Gold and Silver Leaching ......................... 98 III.3.3. Effect of Sphalerite (MRI-4) on Gold and Silver Leaching ........................... 101
III.3.4. Effect of Chalcocite (MRI-5) on Gold and Silver Leaching .......................... 106 III.3.5. Effect of galena (MRI-6) on gold and silver leaching .................................... 109 III.3.6. Effect of stibnite (MRI-7) on gold and silver leaching ................................... 111
III.3.7. Effect of industrial gold-containing ore (MRI-1) on gold leaching ................ 113
III.3.8. Effect of silver on gold leaching in the presence of sulfides .......................... 116 III.4. Concluding remarks ............................................................................................... 118 III.5. References .............................................................................................................. 119
CHAPITRE IV. The role of multi-sulfidic mineral binary and ternary galvanic
interactions in gold cyanidation in a multi-layer packed-bed electrochemical reactor ...... 122
IV.1. Introduction ........................................................................................................... 123 IV.2. Experimental .......................................................................................................... 126
IV.2.1. Materials and Reagents ................................................................................... 126 IV.2.2. Equipment and procedures ............................................................................. 127 IV.2.3. Electrochemical campaign .............................................................................. 129
IV.3. Results and discussion ........................................................................................... 130 IV.3.1. Gold Cyanidation and the Pyrite-Chalcopyrite-Silica System ....................... 130 IV.3.2. Gold Cyanidation and the Pyrite-Sphalerite-Silica System ............................ 136
IV.3.3. Gold Cyanidation and the Pyrite-Chalcocite-Silica System ........................... 139
IV.3.4. Effect of - -Au Areal Ratio on Gold Cyanidation in the Pyrite-Chalcocite-
Silica System ............................................................................................................... 142 IV.4. Conclusions ........................................................................................................... 145 IV.5. References ............................................................................................................. 146
CHAPITRE V. Leveraging strategies to increase gold cyanidation in the presence of
sulfide minerals - Packed-bed electrochemical reactor approach ....................................... 148
vii
V.1. Introduction ............................................................................................................. 149
V.2. Experimental ........................................................................................................... 151
V.2.1. Materials and Reagents .................................................................................... 151 V.2.2. Equipment and procedures ............................................................................... 152 V.2.3. Electrochemical campaign ............................................................................... 153 V.2.4. Alkaline pre-oxidation of sulfide ores in PBER .............................................. 154
V.3. Results and Discussion ........................................................................................... 155
V.3.1. Effect of Galena on the Leaching of Free Gold in the Presence of Pyrite ....... 155 V.3.2. Effect of Galena on the Leaching of Free Gold in the Presence of Chalcopyrite
.................................................................................................................................... 158 V.3.3. Effect of Galena on the Leaching of Free Gold in the Presence of Sphalerite 161 V.3.4. Effect of Galena on the Leaching of Free Gold in the Presence of Chalcocite164
V.3.5. Effect of Alkaline pre-Oxidation of Pyrite, Chalcopyrite and Sphalerite on Gold
Leaching ...................................................................................................................... 167
V.3.6. Combined pre-Oxidation and Lead Nitrate Addition on Gold Leaching in
Presence of Pyrite ....................................................................................................... 171
V.4. Concluding remarks ................................................................................................ 174 V.5. References ............................................................................................................... 175
CONCLUSION GENERALE ............................................................................................. 177 PERSPECTIVES ................................................................................................................ 180 APPENDIX A. Capillary electrophoretic analysis of sulfur and cyanicides speciation
during cyanidation of gold complex sulfidic ores .............................................................. 182 APPENDIX B. Untangling galvanic and passivation phenomena induced by sulfide
minerals on precious metal leaching using a new packed-bed electrochemical cyanidation
reactor - Supplementary Data SD-1 .................................................................................... 191 APPENDIX C. PBER: time-on-stream vs. physical time .................................................. 195
viii
Liste des tableaux
Tableau I-1 Constantes de stabilité et potentiels standards de réduction des complexes d’or
ayant une importance hydro métallurgiques (Zhang, 1997) ........................................... 3
Tableau I-2 Solubilité de minéraux de cuivre dans une solution 0.1 M CN- (Hedley et
Tabachnick, 1958) ........................................................................................................ 21
Tableau I-3 Solubilité de minéraux de zinc dans une solution de cyanure (Hedley &
Tabachnik, 1958) .......................................................................................................... 25
Tableau I-4 Constantes d’équilibres (K) (Marsden et House, 2006) .................................... 29
Table II-1 Mineralogical composition of the four sulfide ore samples. ............................... 49
Table II-2 Chemical composition of the four sulfide ore samples. ...................................... 49
Table III-1 Mineralogical composition of sulfide ore samples investigated in this study. ... 89
Table III-2 Elemental composition of sulfide ore samples investigated in this study. ......... 89
Table III-3 Sulfide/PM areal ratios implemented in cyanidation experiments. .................... 92
Table III-4 Relative gold recoveries (normalized with respect to silica base cases) from
Au/Ag disc immersed in slurries of minerals and from PM-mineral mixtures (case B)
in PBER. ..................................................................................................................... 116
ix
Liste des figures
Figure I-1 Schéma simplifié d’un circuit de cyanuration avec charbon actif en pulpe
(Jeffrey, 1997) ................................................................................................................. 5
Figure I-2 Diagramme potentiel-pH du système Au-CN-H2O à 25ºC (Osseo-Assare et al.,
1984) ............................................................................................................................... 6
Figure I-3 Schématisation du mécanisme de dissolution de l’or (Habashi, 1967) ................. 8
Figure I-4 Courbes de polarisation linéaire d’oxydation de l’or et de réduction de
l’oxygène, Conditions : 400ppm NaCN et 16ppm d’O2 (Heath & Rumball, 1998) ..... 10
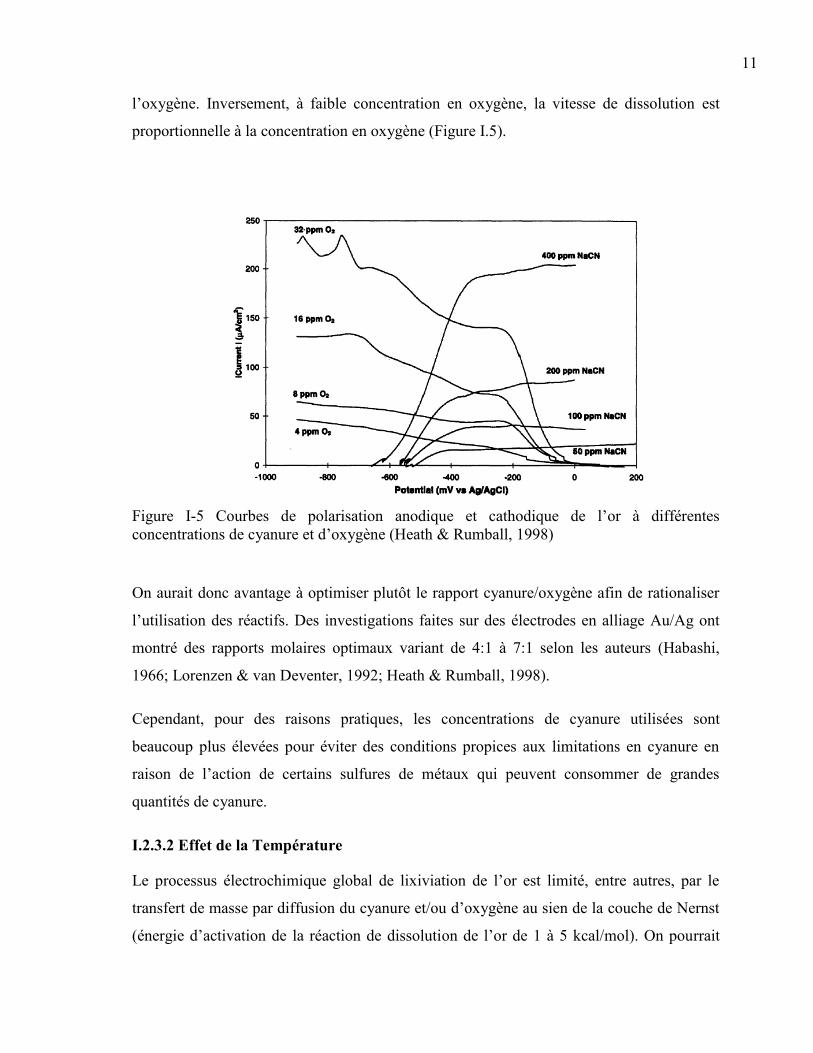
Figure I-5 Courbes de polarisation anodique et cathodique de l’or à différentes
concentrations de cyanure et d’oxygène (Heath & Rumball, 1998) ............................. 11
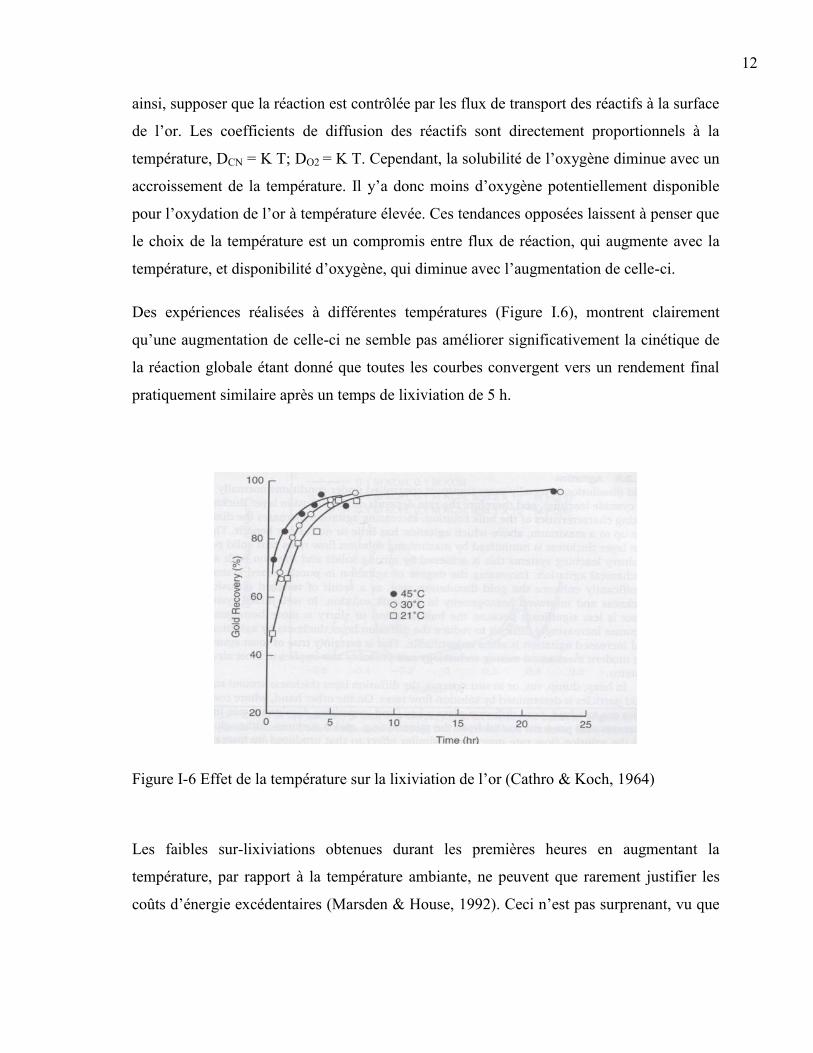
Figure I-6 Effet de la température sur la lixiviation de l’or (Cathro & Koch, 1964) ........... 12
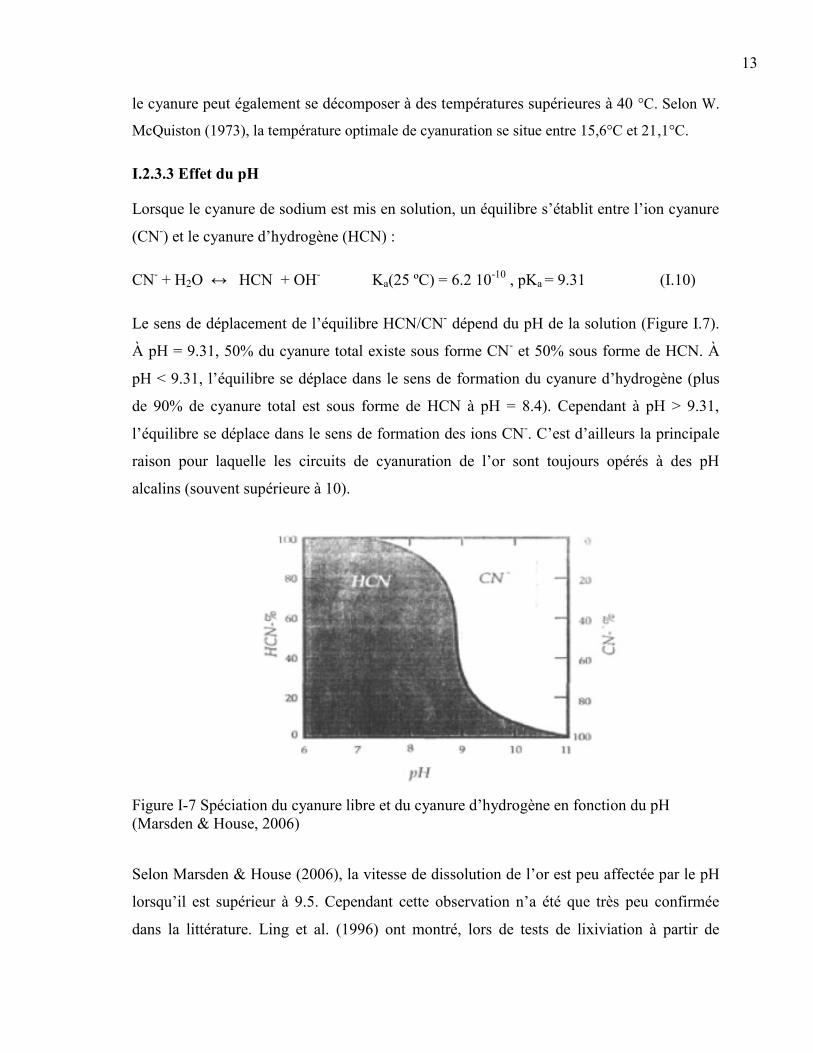
Figure I-7 Spéciation du cyanure libre et du cyanure d’hydrogène en fonction du pH
(Marsden & House, 2006) ............................................................................................ 13
Figure I-8 Effet du pH sur la consommation du cyanure (Ling et al., 1996) ....................... 14
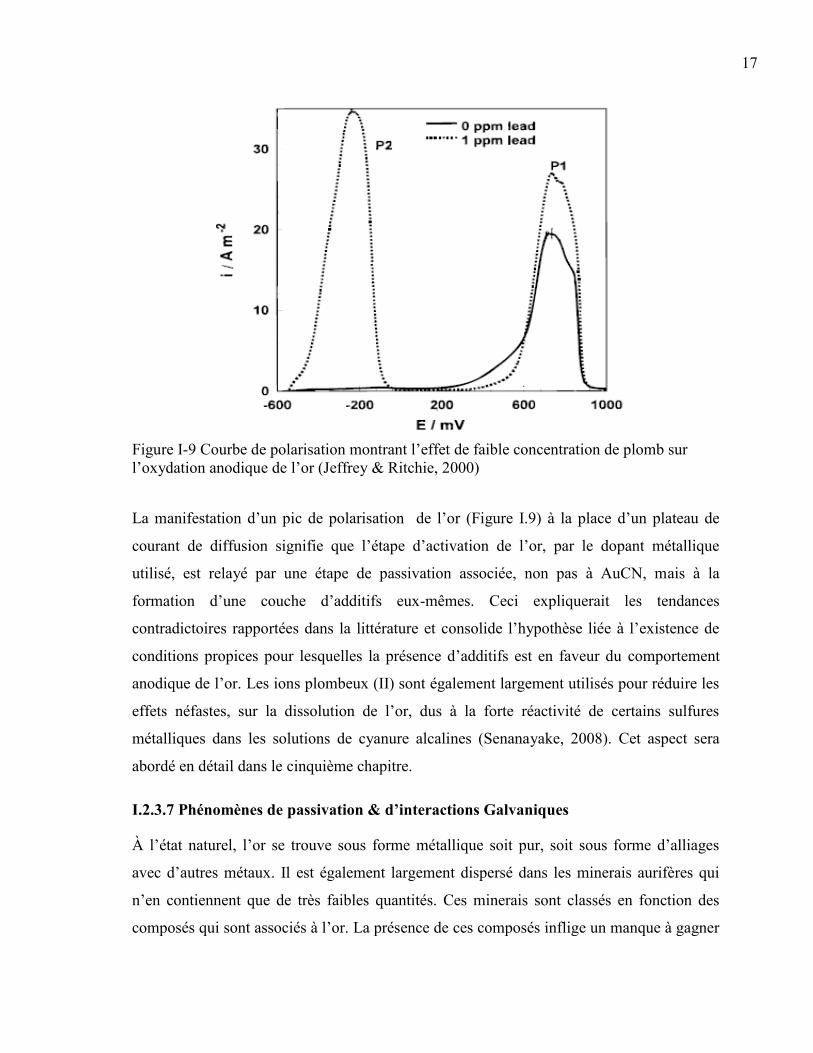
Figure I-9 Courbe de polarisation montrant l’effet de faible concentration de plomb sur
l’oxydation anodique de l’or (Jeffrey & Ritchie, 2000) ............................................... 17
Figure I-10 Spéciation du cuivre et du cyanure en fonction de la concentration total du
cyanure dans une solution contenant 2mM de Cu(I) (Huang & Young, 1996) ............ 22
Figure I-11 Diagramme E-pH du système Cu-CN-H2O à 25ºC (Osseo-Assare, et al., 1984)
...................................................................................................................................... 23
Figure I-12 Diagramme E-pH du système Fe-CN-S-H2O à 25ºC (Osseo-Assare et al., 1984)
...................................................................................................................................... 24
Figure I-13 (a) produits d’oxydation des hydrosulfures dans une solution de cyanure aérée
(b) effet du pH sur la spéciation des polysulfures à 25 ºC (Senanayake, 2008) ........... 28
Figure I-14 Effets des interactions galvaniques Au-Sulfures sur la dissolution de l’or, pH=
10.5, [CN-] =10mM, T=25ºC (Aghamirian & Yen, 2005) ........................................... 33
Figure I-15 (a) Courbes de polarisation anodiques de l’électrode d’or et minérales (b) Effet
du contact galvanique Au-Chalcocite sur la lixiviation de l’or et potentiel mixte, [CN-]
=10mM (Dai & Jeffrey, 2006) ...................................................................................... 34
Figure II-1 Optical microscopic images of MRI-1: (a) chalcopyrite associated with pyrite,
500X and (b) sphalerite associated with pyrite, 500X. ................................................. 50
Figure II-2 Anodic voltammograms of Au/Ag, MRI-1 and MRI-2 electrodes; CN- = 10
mmol/L, DO2 = 0 mmol/L, pH = 11, ΔE/Δt = 0.5 mV/s, electrode rotation rate = 600
rpm. ............................................................................................................................... 54
Figure II-3 Cathodic voltammograms of Au/Ag, MRI-1 and MRI-2 electrodes; CN- = 0
mmol/L, DO2 = 0.25 mmol/L, ΔE/Δt = 0.5 mV/s, electrode rotation rate = 500 rpm,
pH = 11. ........................................................................................................................ 54
Figure II-4 Effect of coupling Au/Ag and MRI-1 electrodes in one electrochemical cell
(OEC) and in two electrochemical cells (TEC) on gold leaching rate. Reaction
conditions: CN- = 10 mmol/L, DO2 = 0.25 mmol/L, electrode rotation rate = 500 rpm,
pH = 11. ........................................................................................................................ 57
Figure II-5 Effect of galvanic interactions in MRI-1 on the evolution of galvanic potential
and galvanic current vs. time in one electrochemical cell (OEC), CN- = 10 mmol/L,
DO2 = 0.25 mmol/L, electrode rotation rate = 500 rpm, pH = 11. ............................... 58
x
Figure II-6 Effect of galvanic interaction of MRI-1 on the evolution of galvanic potential
and galvanic current vs. time in two electrochemical cells (TEC), CN- = 10 mmol/L,
DO2 = 0.25 mmol/L, electrode rotation rate = 500 rpm, pH = 11. ............................... 58
Figure II-7 Effect of electrode rotational speed on molar flux densities for gold leaching in
the presence of passivation and galvanic interactions. Also shown are the calculated
lines representing the diffusion of oxygen with the reduction of oxygen to (line a)
hydroxide and (line b) peroxide, respectively. Reaction conditions: CN- = 10 mmol/L,
DO2 = 0.25 mmol/L, pH = 11. ...................................................................................... 60
Figure II-8 Coupling Au/Ag and MRI-1 electrodes in one electrochemical cell (OEC):
effect of mineral electrode electro-oxidation on gold leaching. Reaction conditions:
CN- = 10 mmol/L, DO2 = 0.25 mmol/L, pH = 11, electrode(s) rotation rate = 500 rpm.
...................................................................................................................................... 62
Figure II-9 Effect of sulfide minerals on gold dissolution in slurry reactor: industrial ore
(MRI-1) and the equivalent of its major sulfide constituents (MRI-2, MRI-3 and MRI-
4). Reaction conditions CN- = 10 mM, DO2 = 0.25 mM, pH = 11, electrode rotation
rate = 500 rpm. .............................................................................................................. 64
Figure II-10 Cyanidation of Au/Ag electrode in the presence of MRI-1 slurry. Pre-oxidation
effect on: (a) gold leaching rate, (b) sulfur speciation and (c) metals speciation. Full
symbols: tests without pre-oxidation; empty symbols: tests with pre-oxidation.
Reaction conditions: CN- = 10 mM, DO2 = 0.25 mM, pH = 11.5, electrode rotation
rate = 500 rpm. .............................................................................................................. 68
Figure II-11 Cyanidation of Au/Ag electrode in the presence of MRI-2 slurry. Pre-oxidation
effect on: (a) gold leaching rate, (b) sulfur speciation and (c) metals speciation. Full
symbols: tests without pre-oxidation; empty symbols: tests with pre-oxidation.
Reaction conditions: CN- = 10 mM, DO2 = 0.25 mM, pH = 11.5, electrode rotation
rate = 500 rpm. .............................................................................................................. 70
Figure II-12 Cyanidation of Au/Ag electrode in the presence of MRI-3 slurry. Pre-oxidation
effect on: (a) gold leaching rate, (b) sulfur speciation and (c) metals speciation. Full
symbols: tests without pre-oxidation; empty symbols: tests with pre-oxidation.
Reaction conditions: CN- = 10 mM, DO2 = 0.25 mM, pH = 11.5, electrode rotation
rate = 500 rpm. .............................................................................................................. 73
Figure II-13 Cyanidation of Au/Ag electrode in the presence of MRI-4 slurry. Pre-oxidation
effect on: (a) gold leaching rate, (b) sulfur speciation and metals speciation. Full
symbols: tests without pre-oxidation; empty symbols: tests with pre-oxidation.
Reaction conditions: CN- = 10 mM, DO2 = 0.25 mM, pH = 11.5, electrode rotation
rate = 500 rpm. .............................................................................................................. 75
Figure II-14 Effect of lime (Ca(OH)2) on the gold leaching rate. Reaction conditions: 50%
solids by mass, CN- = 20 mM, DO2 = 0.25 mM, pH = 11.5, electrode rotation rate =
500 rpm. ........................................................................................................................ 78
Figure II-15 Cyanidation of Au/Ag electrode in the presence of MRI-1 slurry: effect of the
type of pre-oxidant (O2 or H2O2) on gold leaching rate. Reaction conditions: 50%
solids by mass, CN- = 20 mM, DO2 = 0.25 mM, pH = 11.5, electrode rotation rate =
500 rpm, 3.2% w H2O2. ................................................................................................ 79
Figure III-1 Sketch of a new packed-bed electrochemical reactor (PBER). Legend as
follows: 1, inlet section; 2, working section (Teflon); 3, outlet section; 4, stainless-
steel cylinder; 5, sintered-glass distributor; 6, peristaltic pump; 7, magnetic stirrer; 8,
oxygen probe electrode; 9, pH-meter electrode; 10, air bubbling system. ................... 91
xi
Figure III-2 Effect of pyrite (MRI-2) on: (a and a`) gold and silver dissolution, (b) the
evolution of galvanic potential and galvanic current vs. time between Au and MRI-2.
Reaction conditions: CN- = 30 mM, DO2 = 0.25 mM, pH = 11. .................................. 96
Figure III-3 Effect of chalcopyrite (MRI-3) on: (a) gold and silver dissolution, (b) the
evolution of galvanic potential and galvanic current vs. time between Au and MRI-3.
Reaction conditions: CN- = 30 mM, DO2 = 0.25 mM, pH = 11. ................................ 100
Figure III-4 Effect of sphalerite (MRI-4) on: (a) gold and silver dissolution, (b) the
evolution of galvanic potential and galvanic current vs. time between Au and MRI-4.
Reaction conditions: CN- = 30 mM, DO2 = 0.25 mM, pH = 11. ................................ 103
Figure III-5 Effect of galvanic interactions between gold and MRI-4 on: (a) oxy-sulfur ions
speciation and (b) cyanicides formation. Reaction conditions: CN- = 30 mM, DO2 =
0.25 mM, pH = 11. ...................................................................................................... 105
Figure III-6 Effect of chalcocite (MRI-5) on: (a) gold and silver dissolution and (b) the
evolution of galvanic potential and galvanic current vs. time between Au and MRI-5.
Reaction conditions: CN- = 30 mM, DO2 = 0.25 mM, pH = 11. ................................ 107
Figure III-7 Effect of galvanic interactions between gold and MRI-5 on the reactivity of
MRI-5. Reaction conditions: CN- = 30 mM, DO2 = 0.25 mM, pH = 11. ................... 108
Figure III-8 Effect of galena (MRI-6) on: (a) gold and silver dissolution and (b) the
evolution of galvanic potential and galvanic current vs. time between Au and MRI-6.
Reaction conditions: CN- = 30 mM, DO2 = 0.25 mM, pH = 11. ................................ 110
Figure III-9 Effect of stibnite (MRI-7) on: (a) gold dissolution, (b) the evolution of galvanic
potential and galvanic current vs. time between Au and MRI-7. Reaction conditions:
CN- = 30 mM, DO2 = 0.25 mM, pH = 11. .................................................................. 112
Figure III-10 Effect of the industrial gold ore (MRI-1) on: (a) gold dissolution and (b) the
evolution of galvanic potential and galvanic current vs. time between Au and MRI-1.
Reaction conditions: CN- = 30 mM, DO2 = 0.25 mM, pH = 11. ................................ 114
Figure III-11 Effect of silver on gold leaching in the presence of pyrite (MRI-2). Reaction
conditions: CN- = 30 mM, DO2 = 0.25 mM, pH = 11. ............................................... 118
Figure IV-1 Sketch of packed-bed electrochemical reactor (PBER) strategies used to study
the effect of gold distribution and mineralogical associations on gold recovery. (a)
pyrite mineral phase: ; chalcopyrite, sphalerite or chalcocite mineral phase: X; silica
layer; insulator sintered-glass disc filter; (b) homogenized mixture of mineral phases and X. .......................................................................................................................... 128
Figure IV-2. Effect on gold leaching of Au distribution within (a) electrically-disconnected
pyrite, chalcopyrite and silica layers: Au within pyrite (A), Au within chalcopyrite (B),
Au within silica (C,D); (b) electrically-connected pyrite-chalcopyrite//silica systems:
Au within pyrite-chalcopyrite (A’), Au within silica (B’). Inset: Effect of pyrite-
chalcopyrite galvanic association on free-gold leaching from inert silica layer.
Reaction conditions: CN- = 30 mM, DO2 = 0.25 mM, pH = 11. ................................ 131
Figure IV-3 Measured galvanic current and potential vs. time for pyrite-chalcopyrite
galvanic couple in the PBER. Reaction conditions: CN- = 30 mM, DO2 = 0.25 mM,
pH = 11. ...................................................................................................................... 133
Figure IV-4 Effect of galvanic interactions between pyrite and chalcopyrite on: (a) Fe-
cyanide and Cu-cyanide evolution and (b) sulfur-bearing anions speciation. Reaction
conditions: CN- = 30 mM, DO2 = 0.25 mM, pH = 11. .............................................. 135
xii
Figure IV-5. Effect on gold leaching of Au distribution within (a) electrically-disconnected
pyrite, sphalerite and silica layers: Au within pyrite (A), Au within sphalerite (B), Au
within silica (C,D); (b) electrically-connected pyrite-sphalerite//silica systems: Au
within pyrite-sphalerite (A’), Au within silica (B’). Inset: Effect of pyrite-sphalerite
galvanic association on free-gold leaching from inert silica layer. Reaction conditions:
CN- = 30 mM, DO2 = 0.25 mM, pH = 11. ................................................................. 137 Figure IV-6. Measured galvanic current and potential vs. time pyrite-sphalerite galvanic
couple in the PBER. Reaction conditions: CN- = 30 mM, DO2 = 0.25 mM, pH = 11.
.................................................................................................................................... 138 Figure IV-7. Effect of galvanic interactions between pyrite and sphalerite on SO4
2- and
SCN- evolution. Reaction conditions: CN
- = 30 mM, DO2 = 0.25 mM, pH = 11. ..... 139
Figure IV-8. Effect on gold leaching of Au distribution within (a) electrically-disconnected
pyrite, chalcocite and silica layers: Au within pyrite (A), Au within chalcocite (B), Au
within silica (C,D); (b) electrically-connected pyrite-chalcocite//silica systems: Au
within pyrite-chalcocite (A’), Au within silica (B’). Reaction conditions: CN- = 30
mM, DO2 = 0.25 mM, pH = 11. .................................................................................. 140
Figure IV-9 Measured galvanic current and potential vs. time for pyrite and chalcocite
galvanic couple in the PBER. Reaction conditions: CN- = 30 mM, DO2 = 0.25 mM,
pH = 11. ...................................................................................................................... 141 Figure IV-10 . Effect of galvanic interactions between pyrite and chalcocite on: Fe-cyanide
and Cu-cyanide evolution. Reaction conditions: CN- = 30 mM, DO2 = 0.25 mM, pH =
11. ............................................................................................................................... 142 Figure IV-11. Effect of (a) pyrite-Au and (b) pyrite-chalcocite-Au areal ratios on gold
leaching from multi-mineral systems containing pyrite, chalcocite, gold and silica.
Reaction conditions: CN- = 30 mM, DO2 = 0.25 mM, pH = 11. ................................ 144
Figure V-1. Sketch of packed-bed electrochemical reactor (PBER) strategies used to study
the effect of gold distribution and galena mineralogical associations on gold recovery
with/without pre-oxidations. (a) mineral phase: X (= pyrite; chalcopyrite, sphalerite or
chalcocite) or homogenized mixture of mineral phase X + galena: X + ; silica layer;
insulator sintered-glass disc filter; (b) mineral phase: X (= pyrite; chalcopyrite,
sphalerite or chalcocite); galena: ; silica layer; insulator sintered-glass disc filter. .. 153
Figure V-2. Effect of galena ( ) in the presence of pyrite ( ) on the evolution of: (a and a`)
free gold dissolution and (b) -Au galvanic current. Reaction conditions: CN- = 30
mM, DO2 = 0.25 mM, pH = 11. .................................................................................. 157
Figure V-3. Effect of galena ( ) in the presence of chalcopyrite ( ) on the evolution of: (a)
free gold dissolution, (b) -Au galvanic current, (c) sulfur anions speciation. Reaction
conditions: CN- = 30 mM, DO2 = 0.25 mM, pH = 11. ............................................... 160
Figure V-4. Effect of galena ( ) in the presence of sphalerite ( ) on the evolution of: (a)
free gold dissolution, (b) -Au galvanic current, (c) sulfur anions speciation. Reaction
conditions: CN- = 30 mM, DO2 = 0.25 mM, pH = 11. ............................................... 163
Figure V-5. Effect of galena ( ) in the presence of chalcocite ( ) on the evolution of: (a)
free gold dissolution, (b) -Au galvanic current, (c) sulfur anions speciation. Reaction
conditions: CN- = 30 mM, DO2 = 0.25 mM, pH = 11. ............................................... 166
Figure V-6. Effect of pre-oxidation on gold leaching in presence of pyrite. Full symbols:
tests without pre-oxidation; empty symbols: tests with pre-oxidation. Reaction
conditions: CN- = 30 mM, DO2 = 0.25 mM, pH = 11. ............................................... 170
xiii
Figure V-7. Effect of pre-oxidation on gold leaching in presence of chalcopyrite. Full
symbols: tests without pre-oxidation; empty symbols: tests with pre-oxidation.
Reaction conditions: CN- = 30 mM, DO2 = 0.25 mM, pH = 11. ............................... 170
Figure V-8. Effect of pre-oxidation on gold leaching in presence of sphalerite. Full
symbols: tests without pre-oxidation; empty symbols: tests with pre-oxidation.
Reaction conditions: CN- = 30 mM, DO2 = 0.25 mM, pH = 11. ............................... 171
Figure V-9. Effect of pre-oxidation of mixed mineral systems containing pyrite and
chalcopyrite or pyrite and sphalerite on free gold leaching. Full symbols: tests without
pre-oxidation; empty symbols: tests with pre-oxidation. Reaction conditions: CN- = 30
mM, DO2 = 0.25 mM, pH = 11. .................................................................................. 171
Figure V-10 Effect of lead nitrate addition strategy in presence of pyrite, on: (a) gold
leaching and (b) pyrite oxidation products speciation. Reaction conditions: CN- = 30
mM, DO2 = 0.25 mM, 5 mg/L Pb-Pb(NO3)2, pH = 11. ............................................ 173
1
CHAPITRE I. Introduction et objectifs
I.1 Généralités
L’or est un métal précieux. Il est inaltérable, malléable, recyclable mais aussi rare. Il
demeure indéniablement l’un des repères économiques importants dans nos sociétés. En
raison de sa rareté et de ses propriétés chimiques et physiques, l’or est depuis longtemps un
des matériaux les plus convoités. Aujourd’hui, en plus de ses applications dans les sociétés
traditionnelles et dans les systèmes financiers internationaux où il constitue une valeur
refuge, sa vocation grandissante de métal de haute technologie dans divers secteurs
industriels n’est plus à prouver.
L’or et/ou ses alliages sont de plus en plus utilisé(s) au cours des vingt dernières années en
électronique (Maxey et al., 1997) pour sa conductivité électrique élevée, dans les industries
spatiales et aéronautique (Jeffrey, 1997) pour sa réflectivité élevée aux infrarouges, dans
l’industrie chimique comme catalyseur des réactions d’hydrogénation, d’isomérisation, de
craquage des hydrocarbures (Chandler et al., 2000) et en médecine (Jeffrey, 1997) pour le
traitement des arthrites, la radiothérapie de certains cancers et pour plusieurs diagnostics
comme l’observation de la moelle des os ou la délimitation du foie et du poumon.
Aujourd'hui la production mondiale de l'or est d'environ 2 300 tonnes métriques (tm) et est
en progression constante avec les nouvelles technologies d'extraction (Gavin, 2007). Les
principaux gisements d’or se trouvent en Afrique du sud (500 tm/an), aux États-Unis (350
tm/année) et au Canada (150 tm/année) (Gavin, 2007). On en trouve aussi en Indonésie et
Nouvelle-Zélande (200 tm/an), en Russie (80 tm/an) et au Ghana (75 tm/année). L’or se
trouve dans la nature sous différentes formes : or natif, sulfure d’or, électrum. Il est
habituellement associes à des veines de quartz et de sulfures métalliques.
Le procédé le plus utilisé pour la production de l’or est l’extraction hydrométallurgique par
cyanuration (80% de la production mondiale) rendue possible suite à la découverte de la
grande solubilité de ce métal dans une solution de cyanure aérée par Elsner en 1846
(Marsden & House, 2006). Avant cette découverte, l’or était récupéré par gravimétrie, une
2
méthode qui ne permettait pas de récupérer les fines particules d’intérêt. Le procédé par
cyanuration est celui le plus répandu dans l’industrie minière aurifère. Malgré les coûts
attachés à la cyanuration, à la sécurité liée à la toxicité du cyanure et aux effets néfastes sur
l’environnement exigeant plusieurs traitements, cette méthode est la plus efficace jusqu'à ce
jour pour satisfaire la demande en or trop élevée dans le marché international.
De tous les métaux l’or est le métal le plus noble (Nicol et al., 1987) et existe naturellement
à l’état métallique. C’est là une conséquence de la stabilité de l’électron 6 S qui engendre
une faible activité chimique de l’or en solution aqueuse qui est fonction de son potentiel
standard de réduction.
Les états d’oxydation les plus communs de l’or sont Au(I) et Au(III) avec des potentiels
standards de réduction qui sont respectivement 1690 mV et 1500 mV (Nicol et al., 1987).
Ces valeurs de potentiel sont nettement supérieures au potentiel de réduction de l’eau, 1230
mV (Bard, 1973), indiquant ainsi que les formes aureuse (Au(I)) et aurique (Au(III)) sont
thermodynamiquement instables sous forme de composés ioniques en solution aqueuse.
Cependant, les cations aureux et auriques peuvent être stabilisés par un certain nombre de
ligands fortement donneurs permettant ainsi la formation de complexes peu dissociés
(Marsden & House, 2006).
La réaction de complexation des ions aureux par un ligand Ln, avec n charges positives ou
négatives, peut être représentée par la réaction I.1 dont la constante de stabilité est calculée
selon l’équation I.2.
Au+
+ xLn
→ 1 nx
xAuL (I.1)
Ks =
1 nx
X
xn
AuL
Au L (I.2)
Le potentiel standard de réduction du complexe peut être exprimé en fonction du potentiel
de réduction des ions aureux E0 Au
+/Au et de la constante de stabilité, Ks, selon
l’équation I.3,
3
0 0
/ln( )complexe Au Au
RTE E Ks
F (I.3)
Où ;
R : Constante des gaz parfait (J K-1
mol-1
)
T : Température absolue (K)
F : Nombre de Faraday (C mol-1
)
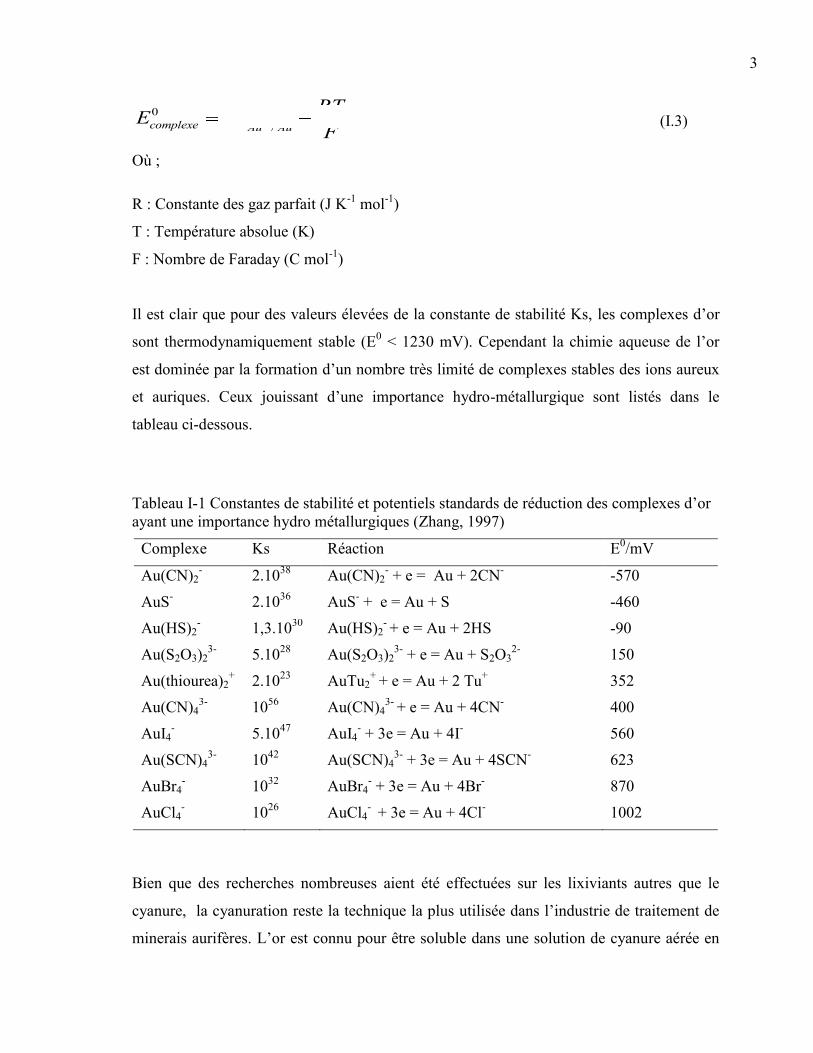
Il est clair que pour des valeurs élevées de la constante de stabilité Ks, les complexes d’or
sont thermodynamiquement stable (E0 < 1230 mV). Cependant la chimie aqueuse de l’or
est dominée par la formation d’un nombre très limité de complexes stables des ions aureux
et auriques. Ceux jouissant d’une importance hydro-métallurgique sont listés dans le
tableau ci-dessous.
Tableau I-1 Constantes de stabilité et potentiels standards de réduction des complexes d’or
ayant une importance hydro métallurgiques (Zhang, 1997)
Complexe Ks Réaction E0/mV
Au(CN)2-
2.1038
Au(CN)2- + e = Au + 2CN
- -570
AuS-
2.1036
AuS- + e = Au + S -460
Au(HS)2-
1,3.1030
Au(HS)2- + e = Au + 2HS -90
Au(S2O3)23-
5.1028
Au(S2O3)23-
+ e = Au + S2O32-
150
Au(thiourea)2+
2.1023
AuTu2+
+ e = Au + 2 Tu+
352
Au(CN)43-
1056
Au(CN)43-
+ e = Au + 4CN-
400
AuI4-
5.1047
AuI4- + 3e = Au + 4I
- 560
Au(SCN)43-
1042
Au(SCN)43-
+ 3e = Au + 4SCN-
623
AuBr4-
1032
AuBr4- + 3e = Au + 4Br
- 870
AuCl4-
1026
AuCl4- + 3e = Au + 4Cl
- 1002
Bien que des recherches nombreuses aient été effectuées sur les lixiviants autres que le
cyanure, la cyanuration reste la technique la plus utilisée dans l’industrie de traitement de
minerais aurifères. L’or est connu pour être soluble dans une solution de cyanure aérée en
4
raison de l’abaissement du potentiel de réduction du métal en-deçà de celui de l’oxygène
dissous, mais aussi grâce à la grande stabilité en solution du complexe dicyanoaureux. L’or
métallique est également connu pour développer dans une solution de cyanure un potentiel
moindre que certain sulfures métalliques, électriquement conducteurs, avec lesquels il est
naturellement en contact au sein du minerai. C’est pour cela que le cyanure continue d’être
l’agent de lixiviation par excellence utilisé en industrie pour la dissolution oxydative et la
complexation de l’or (présent à l’état de traces, 1-5ppm) à partir des minerais aurifères
sulfureux (Hilson & Monhemius, 2006).
Le procédé d’extraction de l’or par cyanuration a été breveté par MacArthur & Forrest en
1887 (Marsden & House, 2006), et depuis, ce procédé reste le plus largement utilisé en
hydrométallurgie extractive de l’or. Le procédé d’extraction de l’or est effectué
généralement en trois étapes principales (voir Figure I.1), auxquelles peuvent s’ajouter des
étapes supplémentaires selon le type de minerai à traiter :
1. Broyage du minerai en milieu humide et généralement alcalin afin de libérer les
particules d’or et rendre leurs surfaces plus accessibles au cyanure. On ajoute usuellement
du cyanure à cette étape afin d’augmenter le temps de contact entre le minerai et la solution
lixiviante. Le degré de broyage est souvent élevé en raison de la finesse des particules d’or.
2. Le minerai broyé est ensuite transféré vers les cuves de cyanuration. Ces cuves, dont un
modèle simple est montré à la Figure I.1, fonctionnent à la pression atmosphérique avec
agitation. Les dimensions et le nombre de cuves sont choisis pour assurer un temps de
séjour moyen de la pulpe dans le milieu réactionnel de 20 à 48 heures. De l’air et une
solution de cyanure sont ajoutés dans les cuves pour permettre la lixiviation de l’or. L’air
fournit l’oxygène soluble nécessaire à l’oxydation en solution de l’or. La complexation des
cations aureux par le cyanure et la formation du complexe dicyanoaureux peuvent être
représentées selon la réaction globale classique d’Elsner :
4 Au +8CN-
+ O2 + 2H2O → 4Au(CN)2- + 4OH
- (I.4)
3. Une fois que l’étape de l’oxycyanolixiviation est achevée, et que le métal visé est mis en
solution sous forme de complexe dicyanoaurate, Au(CN)2-, l’or peut être récupéré des
solutions de cyanure. Il existe actuellement deux méthodes qui sont mises en œuvre à
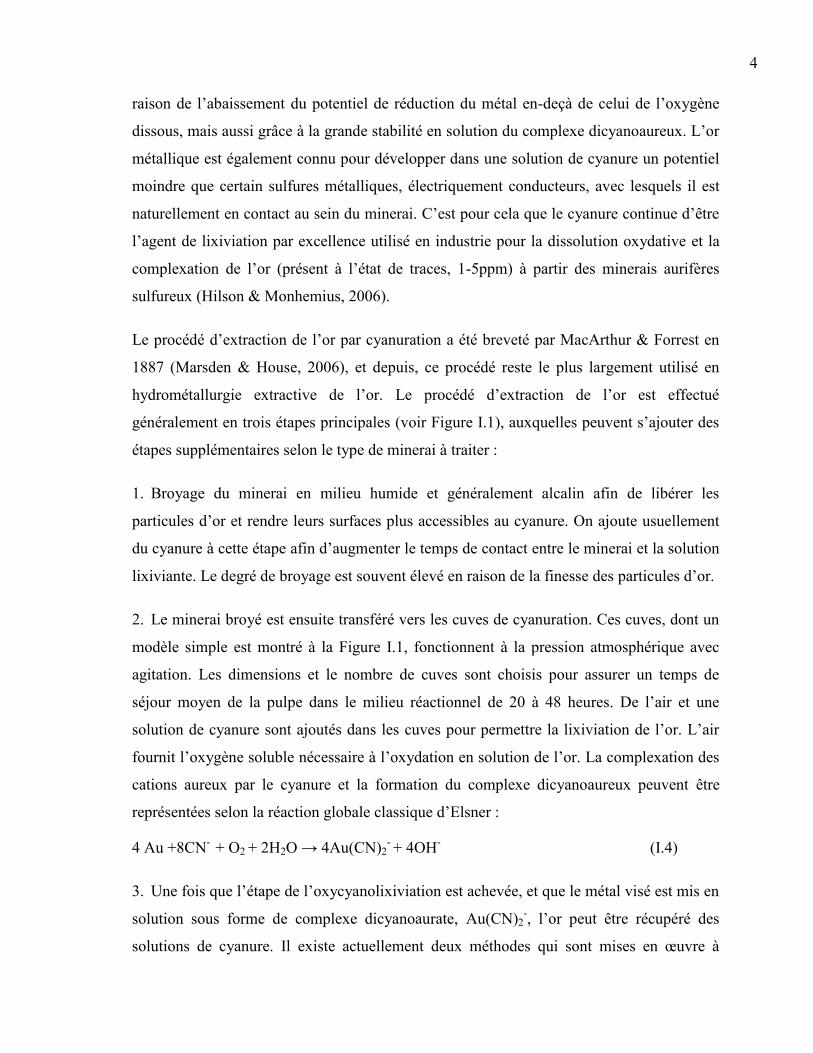
5
l’échelle industrielle : la méthode du charbon actif en pulpe et celle de la précipitation par
cémentation avec la poudre de zinc. Bien que les nouvelles usines préfèrent utiliser la
première (Figure I.1), la majorité des concentrateurs actuels utilisent encore la seconde. La
première méthode consiste à faire adsorber l’or dissous sur le charbon actif en grain, et à
séparer celui-ci du reste de la pulpe par des tamis. On procède ensuite à l’élution du
charbon actif et on récupère l’or par électrolyse de la solution résultante sur un treillis de
fer. La deuxième méthode consiste à séparer les solides de la solution par des filtres ou par
des épaississeurs à contre-courant. L’or de la solution traitée et ensuite précipité par l’ajout
de la poudre de zinc et récupéré par filtration.
Figure I-1 Schéma simplifié d’un circuit de cyanuration avec charbon actif en pulpe
(Jeffrey, 1997)
6
I.2 Cyanuration de l’or
I.2.1 Complexe Au(CN)2-
Le complexe Au(CN)2- est le plus stable de tous les complexes que peut former l’or avec
les ligands ioniques, d’où sa grande importance en hydrométallurgie de l’or (Nicol, 1980a).
La grande affinité du cyanure pour l’or est attribuée à sa charge négative et à sa capacité à
entrer dans une liaison Π avec l’or (Wang & Forssberg, 1990). Dans ce complexe l’état
d’oxydation de l’or est (+1) et le nombre de ligands préféré est deux (Nicol et al., 1987).
La grande valeur de la constante de stabilité, Ks = 2.1038
M (Nicol, 1980a), du complexe
Au(CN)2- est d’une importance capitale dans le procédé d’extraction d’or dans la mesure où
la concentration en cyanure pourrait diminuer dans les cuves de cyanuration sans pour
autant engendrer une dissociation conséquente du complexe dicyanoaurate.
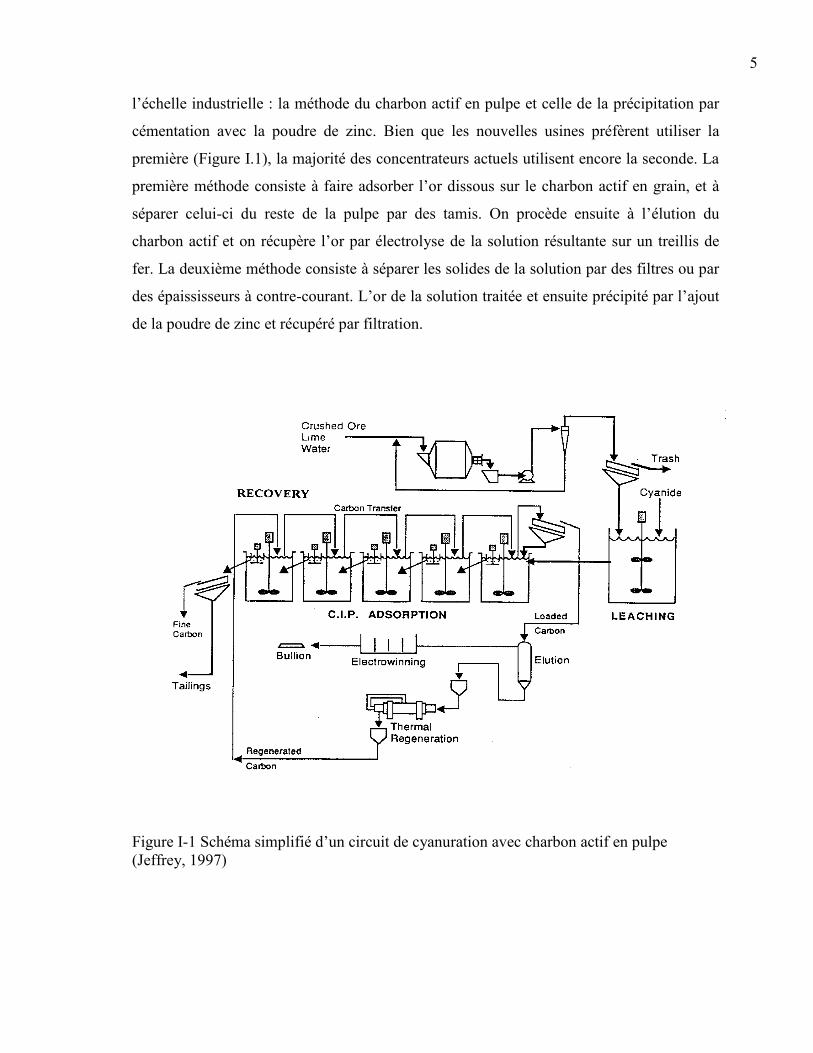
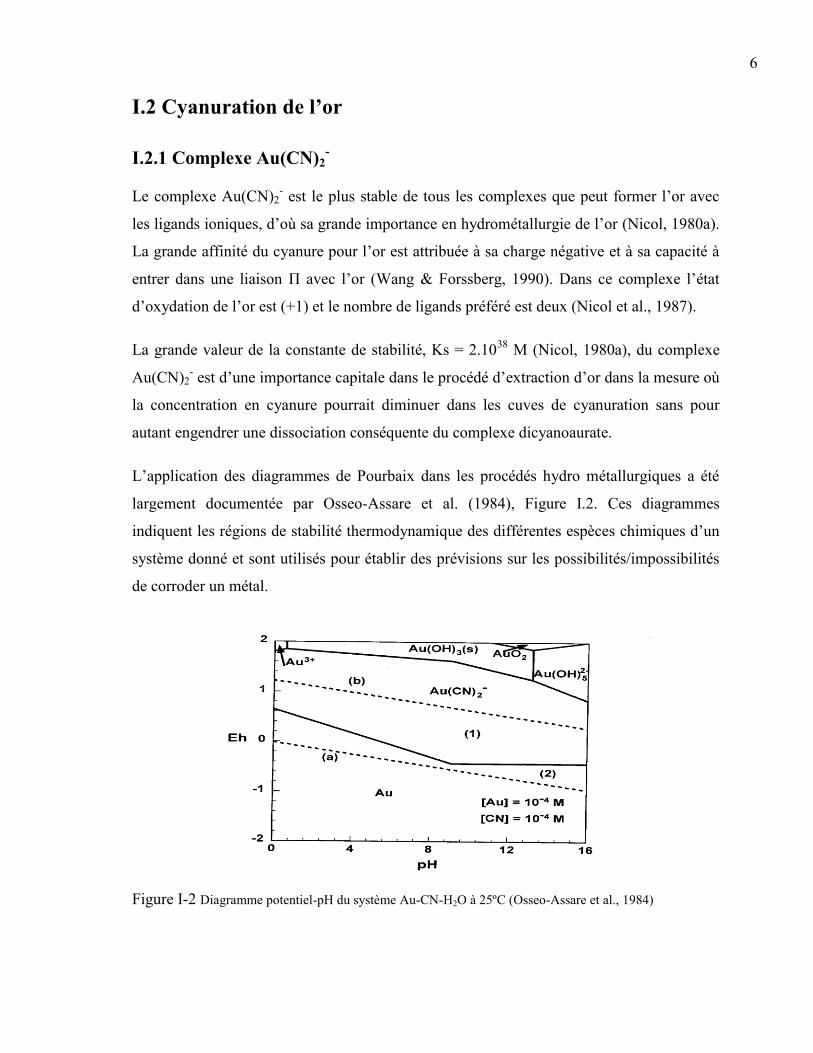
L’application des diagrammes de Pourbaix dans les procédés hydro métallurgiques a été
largement documentée par Osseo-Assare et al. (1984), Figure I.2. Ces diagrammes
indiquent les régions de stabilité thermodynamique des différentes espèces chimiques d’un
système donné et sont utilisés pour établir des prévisions sur les possibilités/impossibilités
de corroder un métal.
Figure I-2 Diagramme potentiel-pH du système Au-CN-H2O à 25ºC (Osseo-Assare et al., 1984)
7
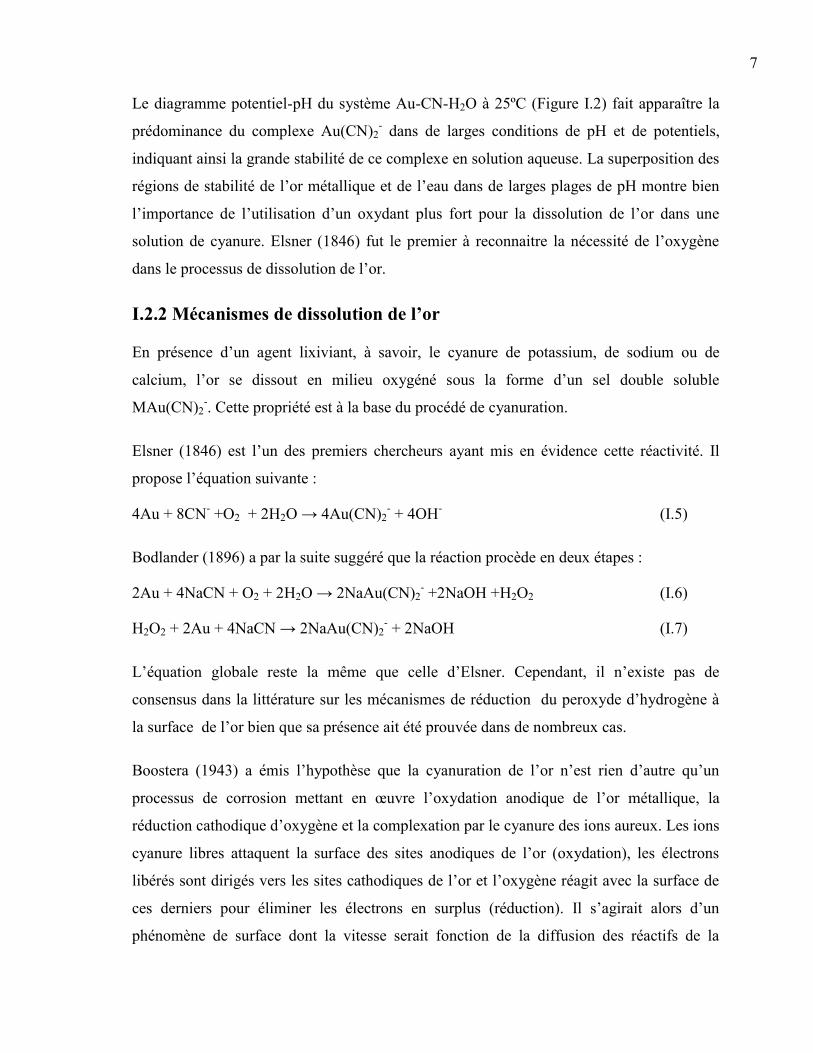
Le diagramme potentiel-pH du système Au-CN-H2O à 25ºC (Figure I.2) fait apparaître la
prédominance du complexe Au(CN)2- dans de larges conditions de pH et de potentiels,
indiquant ainsi la grande stabilité de ce complexe en solution aqueuse. La superposition des
régions de stabilité de l’or métallique et de l’eau dans de larges plages de pH montre bien
l’importance de l’utilisation d’un oxydant plus fort pour la dissolution de l’or dans une
solution de cyanure. Elsner (1846) fut le premier à reconnaitre la nécessité de l’oxygène
dans le processus de dissolution de l’or.
I.2.2 Mécanismes de dissolution de l’or
En présence d’un agent lixiviant, à savoir, le cyanure de potassium, de sodium ou de
calcium, l’or se dissout en milieu oxygéné sous la forme d’un sel double soluble
MAu(CN)2-. Cette propriété est à la base du procédé de cyanuration.
Elsner (1846) est l’un des premiers chercheurs ayant mis en évidence cette réactivité. Il
propose l’équation suivante :
4Au + 8CN- +O2 + 2H2O → 4Au(CN)2
- + 4OH
- (I.5)
Bodlander (1896) a par la suite suggéré que la réaction procède en deux étapes :
2Au + 4NaCN + O2 + 2H2O → 2NaAu(CN)2- +2NaOH +H2O2 (I.6)
H2O2 + 2Au + 4NaCN → 2NaAu(CN)2- + 2NaOH (I.7)
L’équation globale reste la même que celle d’Elsner. Cependant, il n’existe pas de
consensus dans la littérature sur les mécanismes de réduction du peroxyde d’hydrogène à
la surface de l’or bien que sa présence ait été prouvée dans de nombreux cas.
Boostera (1943) a émis l’hypothèse que la cyanuration de l’or n’est rien d’autre qu’un
processus de corrosion mettant en œuvre l’oxydation anodique de l’or métallique, la
réduction cathodique d’oxygène et la complexation par le cyanure des ions aureux. Les ions
cyanure libres attaquent la surface des sites anodiques de l’or (oxydation), les électrons
libérés sont dirigés vers les sites cathodiques de l’or et l’oxygène réagit avec la surface de
ces derniers pour éliminer les électrons en surplus (réduction). Il s’agirait alors d’un
phénomène de surface dont la vitesse serait fonction de la diffusion des réactifs de la
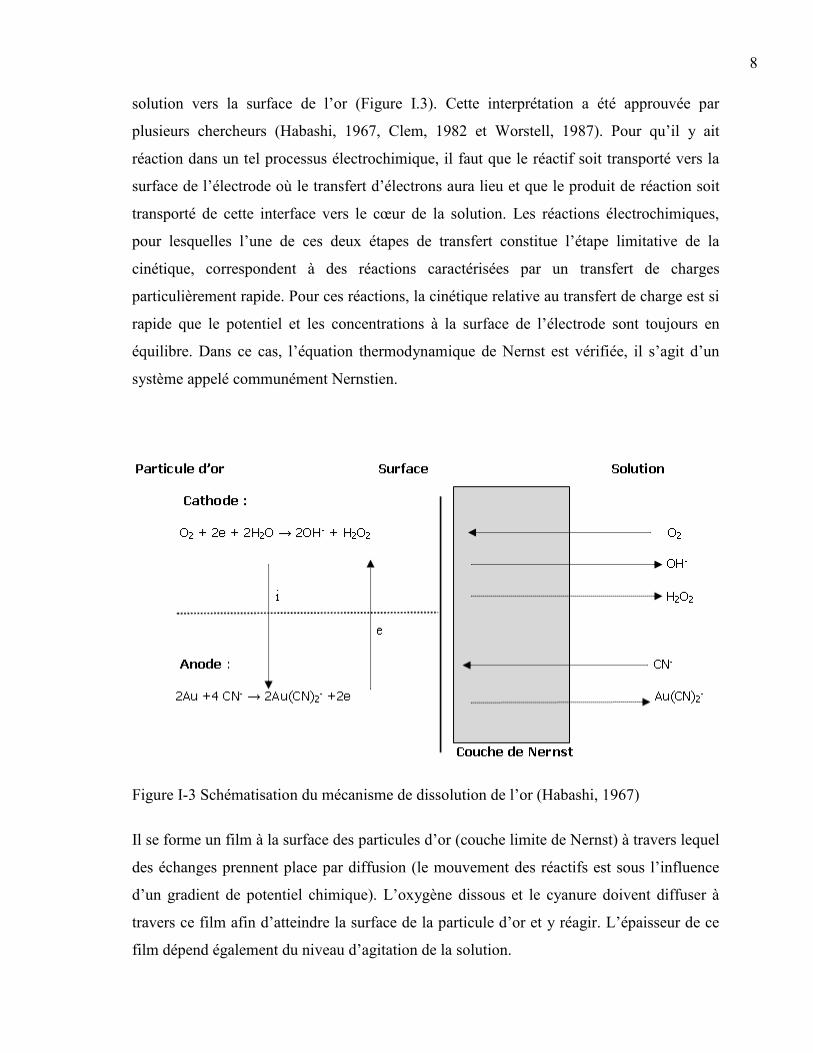
8
solution vers la surface de l’or (Figure I.3). Cette interprétation a été approuvée par
plusieurs chercheurs (Habashi, 1967, Clem, 1982 et Worstell, 1987). Pour qu’il y ait
réaction dans un tel processus électrochimique, il faut que le réactif soit transporté vers la
surface de l’électrode où le transfert d’électrons aura lieu et que le produit de réaction soit
transporté de cette interface vers le cœur de la solution. Les réactions électrochimiques,
pour lesquelles l’une de ces deux étapes de transfert constitue l’étape limitative de la
cinétique, correspondent à des réactions caractérisées par un transfert de charges
particulièrement rapide. Pour ces réactions, la cinétique relative au transfert de charge est si
rapide que le potentiel et les concentrations à la surface de l’électrode sont toujours en
équilibre. Dans ce cas, l’équation thermodynamique de Nernst est vérifiée, il s’agit d’un
système appelé communément Nernstien.
Figure I-3 Schématisation du mécanisme de dissolution de l’or (Habashi, 1967)
Il se forme un film à la surface des particules d’or (couche limite de Nernst) à travers lequel
des échanges prennent place par diffusion (le mouvement des réactifs est sous l’influence
d’un gradient de potentiel chimique). L’oxygène dissous et le cyanure doivent diffuser à
travers ce film afin d’atteindre la surface de la particule d’or et y réagir. L’épaisseur de ce
film dépend également du niveau d’agitation de la solution.
9
La cinétique de la réaction de lixiviation de l’or est alors contrôlée par la vitesse de
diffusion des réactifs au travers de la couche limite, de la concentration des réactifs, du
degré d’agitation, de la surface d’or disponible et des phénomènes de passivation de
surface.
I.2.3 Cinétique de la réaction de dissolution de l’or
Le contrôle du procédé de cyanuration et l’amélioration de ses performances ne seraient
possibles qu’à travers une compréhension adéquate des mécanismes d’action de tous les
facteurs pouvant influencer la cinétique de dissolution de l’or.
I.2.3.1 Cyanure et Oxygène Dissous
En se basant sur la réaction de dissolution de l’or (two-electron process), il apparait qu’une
mole d’or nécessite 0.5 mole d’oxygène et 2 moles de cyanure dépendamment de
l’efficacité de réduction du peroxyde d’hydrogène en anion hydroxyde. Les conditions de
diffusion limite s’établissent quand la vitesse de diffusion du cyanure et/ou de l’oxygène est
proportionnelle à la vitesse de lixiviation de l’or. Ce flux à la surface de l’or est maximal
lorsque les conditions de potentiel à l’interface sont telles que les concentrations [CN-]
et/ou [O2] sont (est) nulle(s) (les réactifs sont instantanément consommés à la surface du
métal). De tels flux maximaux sont alors proportionnels à la concentration de réactif(s) au
sien de la solution. Le flux de diffusion limite pour une électrode à disque rotatif est calculé
selon l’équation de Levich (Heath & Rumball, 1998) :
Jx = 0.62D2/3
V-1/6 1/2
C(X) (I.8)
Avec,
J : Flux de diffusion (mol m2 s
-1) de l’espèce X
D : Coefficient de diffusion de l’espèce X en solution (m2 s
-1)
V : Viscosité cinématique de la solution (m2
s-1
)
: Vitesse angulaire de rotation de l’électrode en tours par seconde (s-1
)
C(X) : Concentration de l’espèce X (mol m-3
)
10
En utilisant la loi de Faraday et à partir de l’équation de Levich, le courant de diffusion
théorique peut être calculé selon l’équation suivante :
Id = 0.62nFAD2/3
V-1/6 1/2
C(X) (I.9)
Avec,
n : Nombre d’électrons échangés
F : Nombre de Faraday
A : Surface de l’électrode
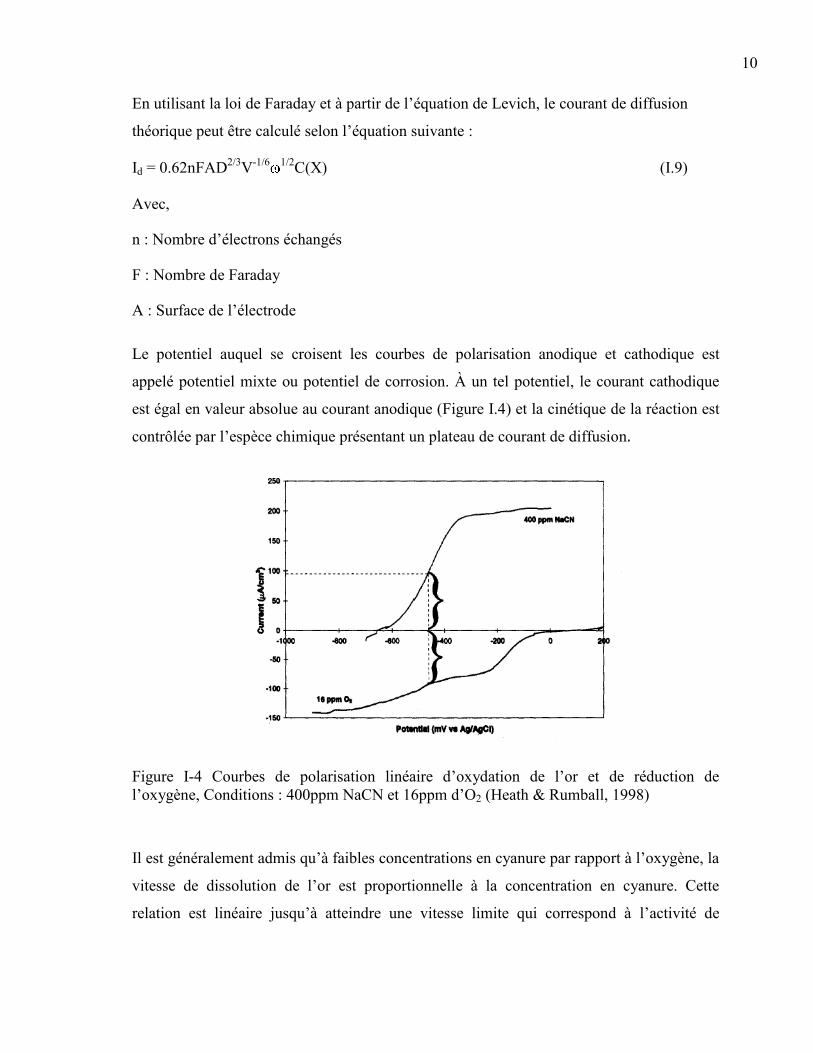
Le potentiel auquel se croisent les courbes de polarisation anodique et cathodique est
appelé potentiel mixte ou potentiel de corrosion. À un tel potentiel, le courant cathodique
est égal en valeur absolue au courant anodique (Figure I.4) et la cinétique de la réaction est
contrôlée par l’espèce chimique présentant un plateau de courant de diffusion.
Figure I-4 Courbes de polarisation linéaire d’oxydation de l’or et de réduction de
l’oxygène, Conditions : 400ppm NaCN et 16ppm d’O2 (Heath & Rumball, 1998)
Il est généralement admis qu’à faibles concentrations en cyanure par rapport à l’oxygène, la
vitesse de dissolution de l’or est proportionnelle à la concentration en cyanure. Cette
relation est linéaire jusqu’à atteindre une vitesse limite qui correspond à l’activité de
11
l’oxygène. Inversement, à faible concentration en oxygène, la vitesse de dissolution est
proportionnelle à la concentration en oxygène (Figure I.5).
Figure I-5 Courbes de polarisation anodique et cathodique de l’or à différentes
concentrations de cyanure et d’oxygène (Heath & Rumball, 1998)
On aurait donc avantage à optimiser plutôt le rapport cyanure/oxygène afin de rationaliser
l’utilisation des réactifs. Des investigations faites sur des électrodes en alliage Au/Ag ont
montré des rapports molaires optimaux variant de 4:1 à 7:1 selon les auteurs (Habashi,
1966; Lorenzen & van Deventer, 1992; Heath & Rumball, 1998).
Cependant, pour des raisons pratiques, les concentrations de cyanure utilisées sont
beaucoup plus élevées pour éviter des conditions propices aux limitations en cyanure en
raison de l’action de certains sulfures de métaux qui peuvent consommer de grandes
quantités de cyanure.
I.2.3.2 Effet de la Température
Le processus électrochimique global de lixiviation de l’or est limité, entre autres, par le
transfert de masse par diffusion du cyanure et/ou d’oxygène au sien de la couche de Nernst
(énergie d’activation de la réaction de dissolution de l’or de 1 à 5 kcal/mol). On pourrait
12
ainsi, supposer que la réaction est contrôlée par les flux de transport des réactifs à la surface
de l’or. Les coefficients de diffusion des réactifs sont directement proportionnels à la
température, DCN = K T; DO2 = K T. Cependant, la solubilité de l’oxygène diminue avec un
accroissement de la température. Il y’a donc moins d’oxygène potentiellement disponible
pour l’oxydation de l’or à température élevée. Ces tendances opposées laissent à penser que
le choix de la température est un compromis entre flux de réaction, qui augmente avec la
température, et disponibilité d’oxygène, qui diminue avec l’augmentation de celle-ci.
Des expériences réalisées à différentes températures (Figure I.6), montrent clairement
qu’une augmentation de celle-ci ne semble pas améliorer significativement la cinétique de
la réaction globale étant donné que toutes les courbes convergent vers un rendement final
pratiquement similaire après un temps de lixiviation de 5 h.
Figure I-6 Effet de la température sur la lixiviation de l’or (Cathro & Koch, 1964)
Les faibles sur-lixiviations obtenues durant les premières heures en augmentant la
température, par rapport à la température ambiante, ne peuvent que rarement justifier les
coûts d’énergie excédentaires (Marsden & House, 1992). Ceci n’est pas surprenant, vu que
13
le cyanure peut également se décomposer à des températures supérieures à 40 °C. Selon W.
McQuiston (1973), la température optimale de cyanuration se situe entre 15,6°C et 21,1°C.
I.2.3.3 Effet du pH
Lorsque le cyanure de sodium est mis en solution, un équilibre s’établit entre l’ion cyanure
(CN-) et le cyanure d’hydrogène (HCN) :
CN- + H2O ↔ HCN + OH
- Ka(25 ºC) = 6.2 10
-10 , pKa = 9.31 (I.10)
Le sens de déplacement de l’équilibre HCN/CN- dépend du pH de la solution (Figure I.7).
À pH = 9.31, 50% du cyanure total existe sous forme CN- et 50% sous forme de HCN. À
pH < 9.31, l’équilibre se déplace dans le sens de formation du cyanure d’hydrogène (plus
de 90% de cyanure total est sous forme de HCN à pH = 8.4). Cependant à pH > 9.31,
l’équilibre se déplace dans le sens de formation des ions CN-. C’est d’ailleurs la principale
raison pour laquelle les circuits de cyanuration de l’or sont toujours opérés à des pH
alcalins (souvent supérieure à 10).
Figure I-7 Spéciation du cyanure libre et du cyanure d’hydrogène en fonction du pH
(Marsden & House, 2006)
Selon Marsden & House (2006), la vitesse de dissolution de l’or est peu affectée par le pH
lorsqu’il est supérieur à 9.5. Cependant cette observation n’a été que très peu confirmée
dans la littérature. Ling et al. (1996) ont montré, lors de tests de lixiviation à partir de
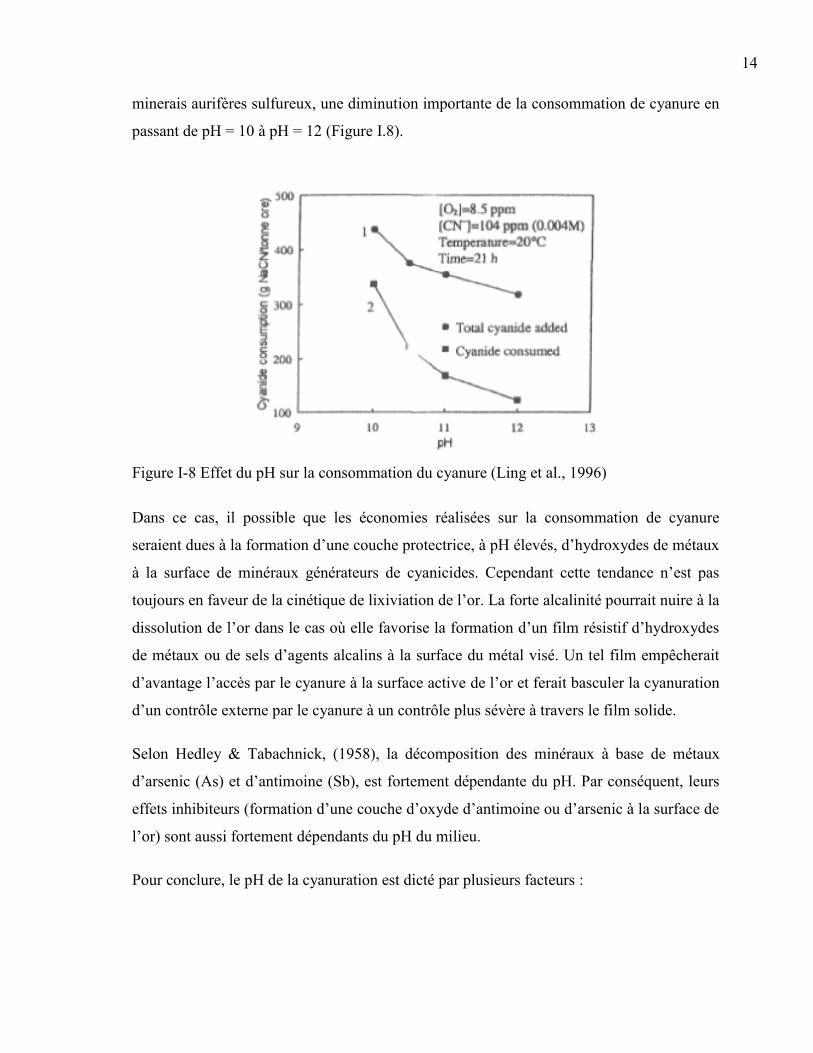
14
minerais aurifères sulfureux, une diminution importante de la consommation de cyanure en
passant de pH = 10 à pH = 12 (Figure I.8).
Figure I-8 Effet du pH sur la consommation du cyanure (Ling et al., 1996)
Dans ce cas, il possible que les économies réalisées sur la consommation de cyanure
seraient dues à la formation d’une couche protectrice, à pH élevés, d’hydroxydes de métaux
à la surface de minéraux générateurs de cyanicides. Cependant cette tendance n’est pas
toujours en faveur de la cinétique de lixiviation de l’or. La forte alcalinité pourrait nuire à la
dissolution de l’or dans le cas où elle favorise la formation d’un film résistif d’hydroxydes
de métaux ou de sels d’agents alcalins à la surface du métal visé. Un tel film empêcherait
d’avantage l’accès par le cyanure à la surface active de l’or et ferait basculer la cyanuration
d’un contrôle externe par le cyanure à un contrôle plus sévère à travers le film solide.
Selon Hedley & Tabachnick, (1958), la décomposition des minéraux à base de métaux
d’arsenic (As) et d’antimoine (Sb), est fortement dépendante du pH. Par conséquent, leurs
effets inhibiteurs (formation d’une couche d’oxyde d’antimoine ou d’arsenic à la surface de
l’or) sont aussi fortement dépendants du pH du milieu.
Pour conclure, le pH de la cyanuration est dicté par plusieurs facteurs :
15
1. La vitesse de dissolution des différentes phases minérales entrant la composition
des minerais industriels. Ces dernières, peuvent affecter soit directement ou
indirectement le rendement global de la cyanuration;
2. Les coûts engendrés par l’ajustement du pH;
3. La précipitation des espèces en solution (CaSO4, Fe(OH)3, etc.)
De ce fait, le pH optimal de la cyanuration devrait être déterminé dépendamment de la
composition minéralogique du minerai à traiter et de la nature chimique des eaux de
procédé industriel.
I.2.3.4 Surface de contact
La cyanuration de l’or est un processus électrochimique (Boostra, 1943) de corrosion dont
la vitesse serait fonction de la diffusion des réactifs de la solution à la surface des particules
ciblées. La cinétique de la lixiviation est alors proportionnelle à la surface d’or exposée à la
solution. Un broyage poussé augmente considérablement les surfaces granulaires et facilite
théoriquement le contact des grains d’or avec la solution de cyanure.
Il est généralement admis que la vitesse de lixiviation est inversement proportionnelle à la
taille des particules minérales à cause de l’augmentation du degré de libération de l’or par
broyage de plus en plus fin. Cependant ce n’est pas toujours le cas, car des broyages
extrêmement fins font augmenter aussi la surface des métaux et des minéraux
consommateurs de cyanure et générateurs des anions sulfures (HS-), ce qui peut réduire les
bénéfices d’une plus grande surface de contact avec la solution de cyanure (Cornejo, 1984).
Pour l’optimisation du circuit de broyage, on aurait donc avantage à chercher plutôt un
compromis entre le pourcentage de l’or lixivié et le cyanure consommé.
I.2.3.5 Agitation
La lixiviation de l’or correspond à un phénomène de surface dont la vitesse est contrôlée
par la diffusion des réactifs au travers de la couche limite qui se forme autour des particules
d’or (couche de Nernst). L’épaisseur de cette couche est fonction du degré d’agitation de la
solution par rapport aux grains d’or. Plus l’agitation est importante, moins la couche de
16
Nernst est épaisse, plus la diffusion des réactifs à la surface de l’or est rapide. Cette
hypothèse a été validée lors de tests de lixiviation réalisés avec une électrode d’or tournante
(Heath & Rumball, 1998). Cependant, le contrôle de la cinétique de la lixiviation d’or à
partir de minerais réels peut être mixte, et les lois de diffusion ne déterminent que
partiellement la vitesse de dissolution de l’or dans la mesure où les phénomènes de
passivation bloquent la surface de l’or par un film résistif. Auquel cas, l’agitation
mécanique et/ou l’augmentation du flux volumétrique d’aération dans le réacteur ne
seraient susceptibles de compenser qu’en partie le déclin de la lixiviation d’or.
I.2.3.6 Effet des dopants métalliques
La passivation de l’or concernée dans la pratique industrielle de la cyanuration nous oblige
à nous intéresser au premier pic de polarisation survenant dans les régions des potentiels
négatifs (Figure I.9). Il existe un consensus dans la littérature à l’effet que la passivation
serait due à la formation d’un film ou d’un adsorbat du complexe neutre monocyanoaurate,
AuCN, (Jeffrey & Ritchie, 2000) à la surface de l’or. Des études ont montré que l’or pur
(ca. 100%) est plus vulnérable à la passivation et que la présence de certains additifs ou
cations bivalents peut, par l’entremise de mécanismes complexes de surface, accélérer la
cinétique de dissolution de l’or (Senanayake, 2008).
Selon Marsden et House (2006), la présence de faibles concentrations de plomb, de
mercure, de thallium ou de bismuth améliore nettement la vitesse de lixiviation de l’or en
évitant ou en réduisant l’effet de passivation survenant à -0.4 V. D’autres auteurs
(Deschênes et al., 2000; Jeffrey & Ritchie, 2000) rapportent que des concentrations de
plomb variant de 10-6
à 10-5
M sont bénéfiques alors qu’à des concentrations dépassant 10-4
M, les effets de Pb(II) sur la vitesse de dissolution de l’or sont plutôt négatifs.
Il existerait alors des conditions propices pour que ces additifs puissent s’adsorber à la
surface de l’or sous forme d’un dépôt (par cémentation par exemple), activer les atomes
d’or (entre autres, en catalysant la réaction cathodique de réduction de l’oxygène) et
empêcher ainsi la formation de la couche de passivation d’AuCN.
17
Figure I-9 Courbe de polarisation montrant l’effet de faible concentration de plomb sur
l’oxydation anodique de l’or (Jeffrey & Ritchie, 2000)
La manifestation d’un pic de polarisation de l’or (Figure I.9) à la place d’un plateau de
courant de diffusion signifie que l’étape d’activation de l’or, par le dopant métallique
utilisé, est relayé par une étape de passivation associée, non pas à AuCN, mais à la
formation d’une couche d’additifs eux-mêmes. Ceci expliquerait les tendances
contradictoires rapportées dans la littérature et consolide l’hypothèse liée à l’existence de
conditions propices pour lesquelles la présence d’additifs est en faveur du comportement
anodique de l’or. Les ions plombeux (II) sont également largement utilisés pour réduire les
effets néfastes, sur la dissolution de l’or, dus à la forte réactivité de certains sulfures
métalliques dans les solutions de cyanure alcalines (Senanayake, 2008). Cet aspect sera
abordé en détail dans le cinquième chapitre.
I.2.3.7 Phénomènes de passivation & d’interactions Galvaniques
À l’état naturel, l’or se trouve sous forme métallique soit pur, soit sous forme d’alliages
avec d’autres métaux. Il est également largement dispersé dans les minerais aurifères qui
n’en contiennent que de très faibles quantités. Ces minerais sont classés en fonction des
composés qui sont associés à l’or. La présence de ces composés inflige un manque à gagner
18
important aux industries durant la lixiviation de l’or par cyanuration. L’effet inhibiteur de
ces composés est essentiellement lié à leur nature chimique. On distingue l’or associé à des
sulfures de fer (pyrite : FeS2, pyrrhotite : Fe1-xS), de l’or associé à des sulfures d’arsenic
(arsénopyrite : FeAsS) ou d’antimoine (stibine : Sb2S3) et de l’or associé à des sulfures de
cuivre (chalcopyrite : CuFeS2, chalcocite : CuS2).
Lorsque l’or et les sulfures métallique sont en contact, ces derniers pourront influencer sa
vitesse de lixiviation selon deux mécanismes :
1. Phénomènes de passivation qui résultent de la formation d’une couche protectrice à
la surface de l’or entravant sévèrement sa dissolution.
2. Phénomènes d’interactions galvaniques entre l’or et les sulfures métalliques,
électriquement conducteurs. Dans ce cas, la dissolution de l’or peut être soit
favorisée, soit ralentie, dépendamment des conditions de potentiels aux interfaces
Au-sulfures.
Il s’agit alors d’un éventail de processus redox complexes mis en jeu au cours de la
cyanuration dont l’ampleur, de l’effet négatif ou positif, est étroitement liée aux spécificités
du minerai à traiter.
Ces phénomènes de passivation et d’interactions galvaniques seront largement détaillés
dans la partie suivante.
I.3 Effet des sulfures métalliques sur la cyanuration de l’or (passivation &
Interactions galvaniques)
Étant donné que de larges proportions de l’or sont étroitement associées à d’autres sulfures
métalliques, l’effet de ces derniers sur l’extraction de l’or par cyanuration a stimulé l’intérêt
de nombreux chercheurs en hydrométallurgie de l’or. Des travaux de recherche sur la
dissolution de l’or par cyanuration ont montré que certains métaux, en particulier le cuivre,
le zinc et le fer, provenant de la dissolution de sulfures métalliques, peuvent se complexer
avec le cyanure pour former des cyanocomplexes, et ainsi ralentir la vitesse de dissolution
de l’or en réduisant la concentration des réactifs disponibles pour l’oxycyanolixiviation de
19
l’or (Habashi, 1967). Vu la forte réactivité des sulfures métalliques associés à l’or dans les
solutions alcalines de cyanure, des réactions secondaires impliquant le cyanure, les
hydrosulfures et les oxysulfures instables peuvent se produire. Il est généralement accepté
que ces réactions parasites nuisent aux performances du procédé de cyanuration via les
surconsommations de cyanure et d’oxygène engendrées. Cependant, la mise en œuvre de
cinétiques de dissolution de l’or en présence des anions sulfures (HS-) a permis de suggérer
une incidence directe de ces derniers sur la vitesse de lixiviation du métal. Weichselbaum et
al. (1989) ont montré que des traces de sulfures de sodium inhibent dramatiquement la
cyanuration de l’or. Cet effet serait imputable à la formation d’une couche protectrice
d’Au/Sx à la surface du métal visé. Des résultats similaires ont été trouvés par Lorenzen et
van Deventer (1992) ayant étudié l’effet de sulfures modèles, très réactifs, à base de cuivre,
de fer et de zinc sur la cinétique lixiviation de l’or. Dans le même sens, Jeffrey et Breuer
(2000) ont utilisé une électrode en alliage Au(96%)-Ag(4%) pour investiguer l’effet des
sulfures. Les résultats obtenus montrent que les anions sulfures sont fortement incriminés
dans la passivation de la surface de l’or. Une telle passivation pencherait en faveur d’un
blocage de la surface de l’or par un film résistif d’Au/Sx.
Les phénomènes d’interactions galvaniques entre l’or et les sulfures métalliques,
électriquement conducteurs, sont également soupçonnés d’influencer directement la vitesse
de lixiviation de l’or, bien qu’il n’existe pas un consensus dans la littérature sur leurs effets.
Lorenzen et van Deventer (1992) ont tenté de séparer l’effet des interactions galvaniques de
celui de la passivation de la surface l’or en conduisant des tests de cyanuration sur un
montage électrochimique à une et à deux cellules. Les résultats obtenus montrent que
lorsque l’électrode d’or et l’électrode minérale sont électriquement en contact,
l’accentuation du courant cathodique occasionne indirectement un manque à gagner sur la
vitesse de dissolution de l’or en raison du déplacement du potentiel mixte dans les régions
de potentiels où l’or est passif. Cependant, d’autres chercheurs (Aghamirian & Yen, 2005;
Dai & Jeffrey, 2006) rapportent plutôt des effets positifs sur la lixiviation de l’or de telles
interactions galvaniques.
Les tendances contradictoires rapportées dans la littérature sur l’incidence de nombreux
sulfures métalliques sur les profils de dissolution de l’or pourraient être expliquées, en
20
partie, par le fait que les tests de cyanuration n’ont pas été réalisés dans les mêmes
conditions.
Une meilleure évaluation des phénomènes de passivation et d’interactions galvaniques ne
serait alors possible qu’à travers une meilleure compréhension des comportements des
différents minéraux sulfureux dans les solutions de cyanures en fonction des conditions
physicochimiques du milieu.
I.3.1 Dissolution des minéraux sulfureux dans les solutions de cyanure
Plusieurs minéraux de métaux de base tels que le cuivre, le zinc et le fer, plus abondants
dans les minerais industriels, notamment sous forme de sulfures, peuvent se dissoudre dans
les cuves de cyanuration. Ces réactions indésirables sont responsables de surconsommation
importantes de cyanure et d’oxygène, potentiellement disponibles pour
l’oxycyanolixiviation de l’or.
Au contact des solutions de cyanure aérées, les cinétiques de lixiviation de minéraux
sulfureux sont très rapides, et le milieu réactionnel se charge en produits d’oxydation qui
sont généralement des ions métalliques, des complexes cyanométalliques, des oxydes de
métaux ainsi que d’autres espèces de soufre incluant des thiocyanates, des sulfures, des
polysulfures, des thiosulfates, des sulfites, des sulfates, etc.
La lixiviation des minéraux sulfureux, contenant des métaux bivalents, peut avoir lieu selon
la réaction globale suivante (Marsden & House, 2006) :
2MS + 2(x + 1)CN- + O2 +2H2O ↔ 2M(CN)x
(x-2) + 2SCN
- + 4OH
- (I.10)
Mis à part les minéraux sulfureux, la plupart des complexes de métaux de transition, à
savoir les hydroxydes, les sulfates et les carbonates, sont solubles dans les solutions
alcalines de cyanure (voir Tableaux I.2, I.3). Cependant, les réactions de décomposition de
ces derniers ont moins d’effet sur les profils de dissolution de l’or en raison d’une part, du
fait qu’ils consomment moins de cyanure par apport aux sulfures métalliques, et d’autre
part, de l’absence du soufre pouvant passiver la surface de l’or.
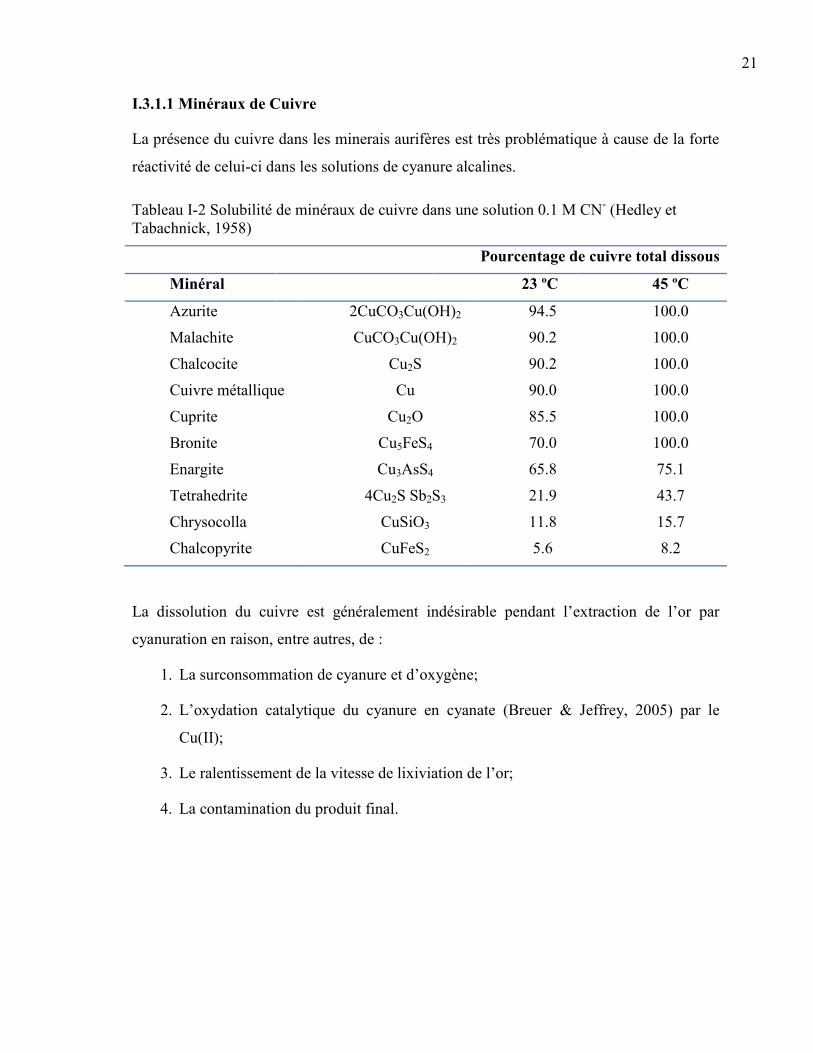
21
I.3.1.1 Minéraux de Cuivre
La présence du cuivre dans les minerais aurifères est très problématique à cause de la forte
réactivité de celui-ci dans les solutions de cyanure alcalines.
Tableau I-2 Solubilité de minéraux de cuivre dans une solution 0.1 M CN- (Hedley et
Tabachnick, 1958)
Pourcentage de cuivre total dissous
Minéral 23 ºC 45 ºC
Azurite 2CuCO3Cu(OH)2 94.5 100.0
Malachite CuCO3Cu(OH)2 90.2 100.0
Chalcocite Cu2S 90.2 100.0
Cuivre métallique Cu 90.0 100.0
Cuprite Cu2O 85.5 100.0
Bronite Cu5FeS4 70.0 100.0
Enargite Cu3AsS4 65.8 75.1
Tetrahedrite 4Cu2S Sb2S3 21.9 43.7
Chrysocolla CuSiO3 11.8 15.7
Chalcopyrite CuFeS2 5.6 8.2
La dissolution du cuivre est généralement indésirable pendant l’extraction de l’or par
cyanuration en raison, entre autres, de :
1. La surconsommation de cyanure et d’oxygène;
2. L’oxydation catalytique du cyanure en cyanate (Breuer & Jeffrey, 2005) par le
Cu(II);
3. Le ralentissement de la vitesse de lixiviation de l’or;
4. La contamination du produit final.
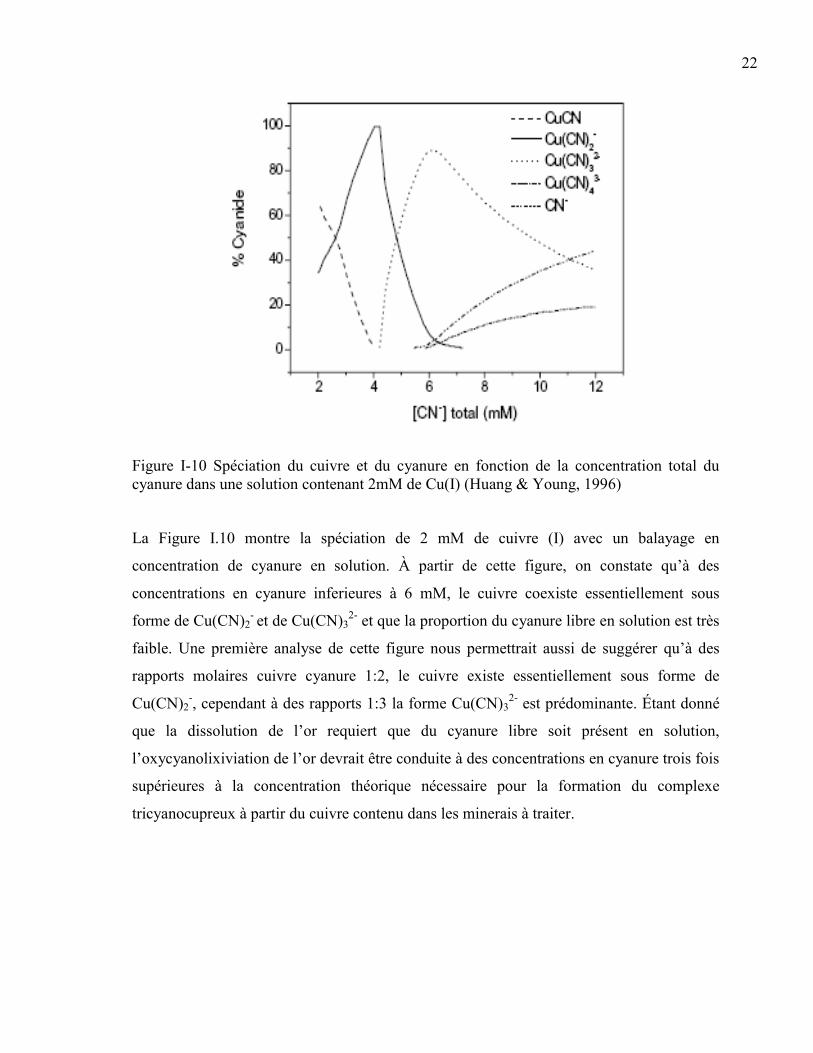
22
Figure I-10 Spéciation du cuivre et du cyanure en fonction de la concentration total du
cyanure dans une solution contenant 2mM de Cu(I) (Huang & Young, 1996)
La Figure I.10 montre la spéciation de 2 mM de cuivre (I) avec un balayage en
concentration de cyanure en solution. À partir de cette figure, on constate qu’à des
concentrations en cyanure inferieures à 6 mM, le cuivre coexiste essentiellement sous
forme de Cu(CN)2- et de Cu(CN)3
2- et que la proportion du cyanure libre en solution est très
faible. Une première analyse de cette figure nous permettrait aussi de suggérer qu’à des
rapports molaires cuivre cyanure 1:2, le cuivre existe essentiellement sous forme de
Cu(CN)2-, cependant à des rapports 1:3 la forme Cu(CN)3
2- est prédominante. Étant donné
que la dissolution de l’or requiert que du cyanure libre soit présent en solution,
l’oxycyanolixiviation de l’or devrait être conduite à des concentrations en cyanure trois fois
supérieures à la concentration théorique nécessaire pour la formation du complexe
tricyanocupreux à partir du cuivre contenu dans les minerais à traiter.
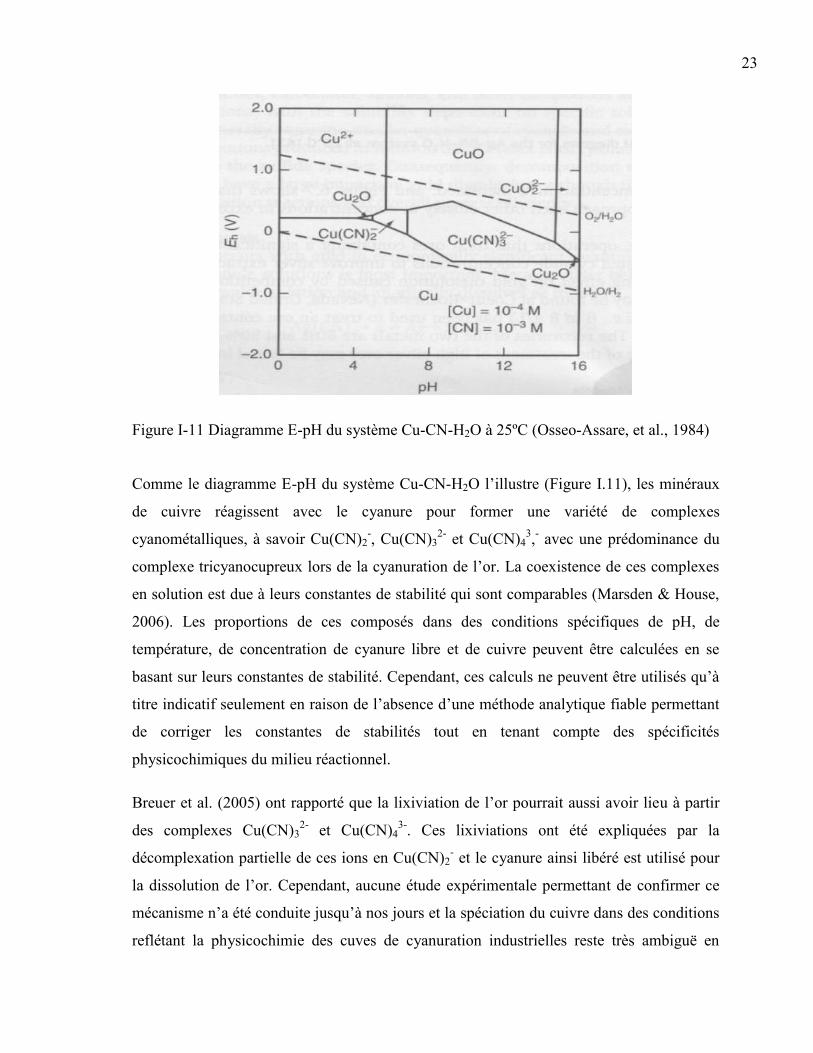
23
Figure I-11 Diagramme E-pH du système Cu-CN-H2O à 25ºC (Osseo-Assare, et al., 1984)
Comme le diagramme E-pH du système Cu-CN-H2O l’illustre (Figure I.11), les minéraux
de cuivre réagissent avec le cyanure pour former une variété de complexes
cyanométalliques, à savoir Cu(CN)2-, Cu(CN)3
2- et Cu(CN)4
3,- avec une prédominance du
complexe tricyanocupreux lors de la cyanuration de l’or. La coexistence de ces complexes
en solution est due à leurs constantes de stabilité qui sont comparables (Marsden & House,
2006). Les proportions de ces composés dans des conditions spécifiques de pH, de
température, de concentration de cyanure libre et de cuivre peuvent être calculées en se
basant sur leurs constantes de stabilité. Cependant, ces calculs ne peuvent être utilisés qu’à
titre indicatif seulement en raison de l’absence d’une méthode analytique fiable permettant
de corriger les constantes de stabilités tout en tenant compte des spécificités
physicochimiques du milieu réactionnel.
Breuer et al. (2005) ont rapporté que la lixiviation de l’or pourrait aussi avoir lieu à partir
des complexes Cu(CN)32-
et Cu(CN)43-
. Ces lixiviations ont été expliquées par la
décomplexation partielle de ces ions en Cu(CN)2- et le cyanure ainsi libéré est utilisé pour
la dissolution de l’or. Cependant, aucune étude expérimentale permettant de confirmer ce
mécanisme n’a été conduite jusqu’à nos jours et la spéciation du cuivre dans des conditions
reflétant la physicochimie des cuves de cyanuration industrielles reste très ambiguë en
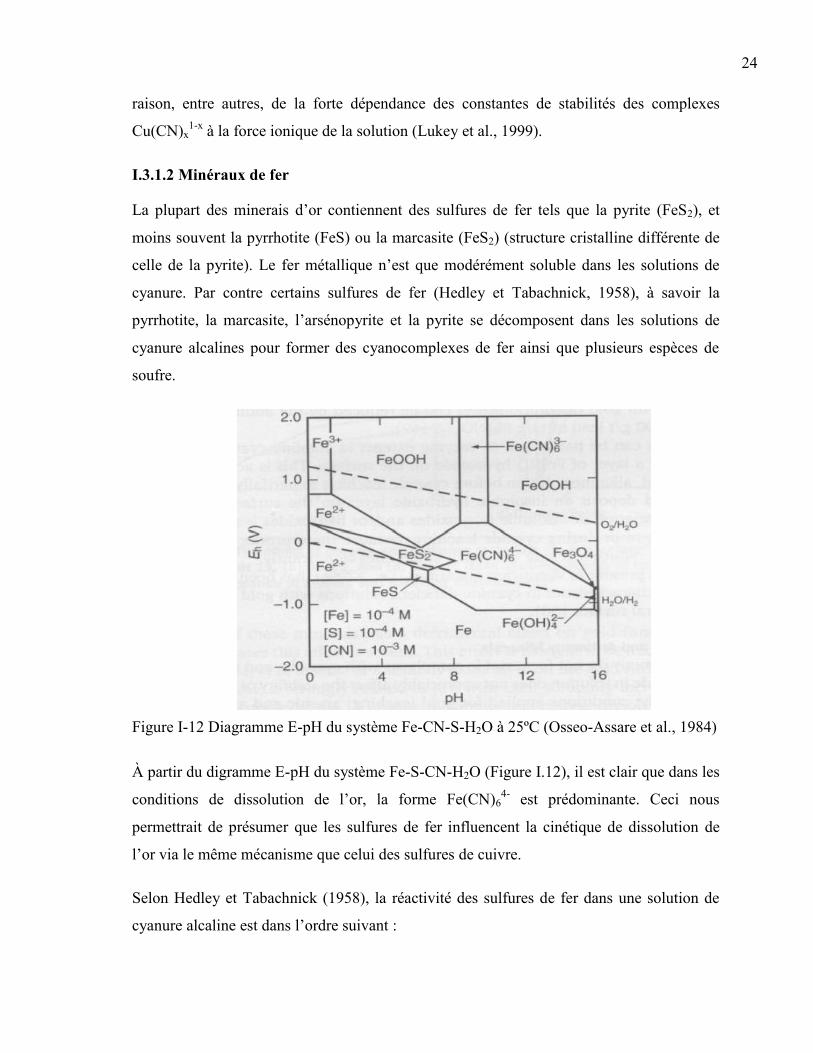
24
raison, entre autres, de la forte dépendance des constantes de stabilités des complexes
Cu(CN)x1-x
à la force ionique de la solution (Lukey et al., 1999).
I.3.1.2 Minéraux de fer
La plupart des minerais d’or contiennent des sulfures de fer tels que la pyrite (FeS2), et
moins souvent la pyrrhotite (FeS) ou la marcasite (FeS2) (structure cristalline différente de
celle de la pyrite). Le fer métallique n’est que modérément soluble dans les solutions de
cyanure. Par contre certains sulfures de fer (Hedley et Tabachnick, 1958), à savoir la
pyrrhotite, la marcasite, l’arsénopyrite et la pyrite se décomposent dans les solutions de
cyanure alcalines pour former des cyanocomplexes de fer ainsi que plusieurs espèces de
soufre.
Figure I-12 Diagramme E-pH du système Fe-CN-S-H2O à 25ºC (Osseo-Assare et al., 1984)
À partir du digramme E-pH du système Fe-S-CN-H2O (Figure I.12), il est clair que dans les
conditions de dissolution de l’or, la forme Fe(CN)64-
est prédominante. Ceci nous
permettrait de présumer que les sulfures de fer influencent la cinétique de dissolution de
l’or via le même mécanisme que celui des sulfures de cuivre.
Selon Hedley et Tabachnick (1958), la réactivité des sulfures de fer dans une solution de
cyanure alcaline est dans l’ordre suivant :
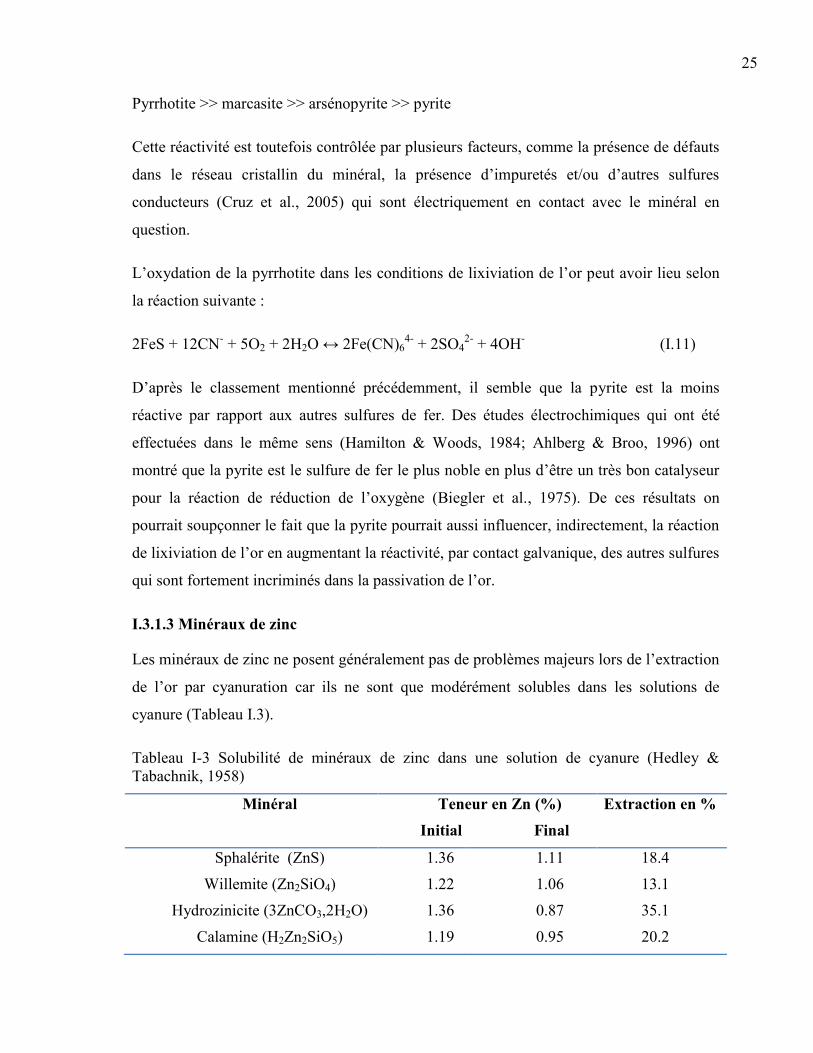
25
Pyrrhotite >> marcasite >> arsénopyrite >> pyrite
Cette réactivité est toutefois contrôlée par plusieurs facteurs, comme la présence de défauts
dans le réseau cristallin du minéral, la présence d’impuretés et/ou d’autres sulfures
conducteurs (Cruz et al., 2005) qui sont électriquement en contact avec le minéral en
question.
L’oxydation de la pyrrhotite dans les conditions de lixiviation de l’or peut avoir lieu selon
la réaction suivante :
2FeS + 12CN- + 5O2 + 2H2O ↔ 2Fe(CN)6
4- + 2SO4
2- + 4OH
- (I.11)
D’après le classement mentionné précédemment, il semble que la pyrite est la moins
réactive par rapport aux autres sulfures de fer. Des études électrochimiques qui ont été
effectuées dans le même sens (Hamilton & Woods, 1984; Ahlberg & Broo, 1996) ont
montré que la pyrite est le sulfure de fer le plus noble en plus d’être un très bon catalyseur
pour la réaction de réduction de l’oxygène (Biegler et al., 1975). De ces résultats on
pourrait soupçonner le fait que la pyrite pourrait aussi influencer, indirectement, la réaction
de lixiviation de l’or en augmentant la réactivité, par contact galvanique, des autres sulfures
qui sont fortement incriminés dans la passivation de l’or.
I.3.1.3 Minéraux de zinc
Les minéraux de zinc ne posent généralement pas de problèmes majeurs lors de l’extraction
de l’or par cyanuration car ils ne sont que modérément solubles dans les solutions de
cyanure (Tableau I.3).
Tableau I-3 Solubilité de minéraux de zinc dans une solution de cyanure (Hedley &
Tabachnik, 1958)
Minéral Teneur en Zn (%)
Initial Final
Extraction en %
Sphalérite (ZnS) 1.36 1.11 18.4
Willemite (Zn2SiO4) 1.22 1.06 13.1
Hydrozinicite (3ZnCO3,2H2O) 1.36 0.87 35.1
Calamine (H2Zn2SiO5) 1.19 0.95 20.2
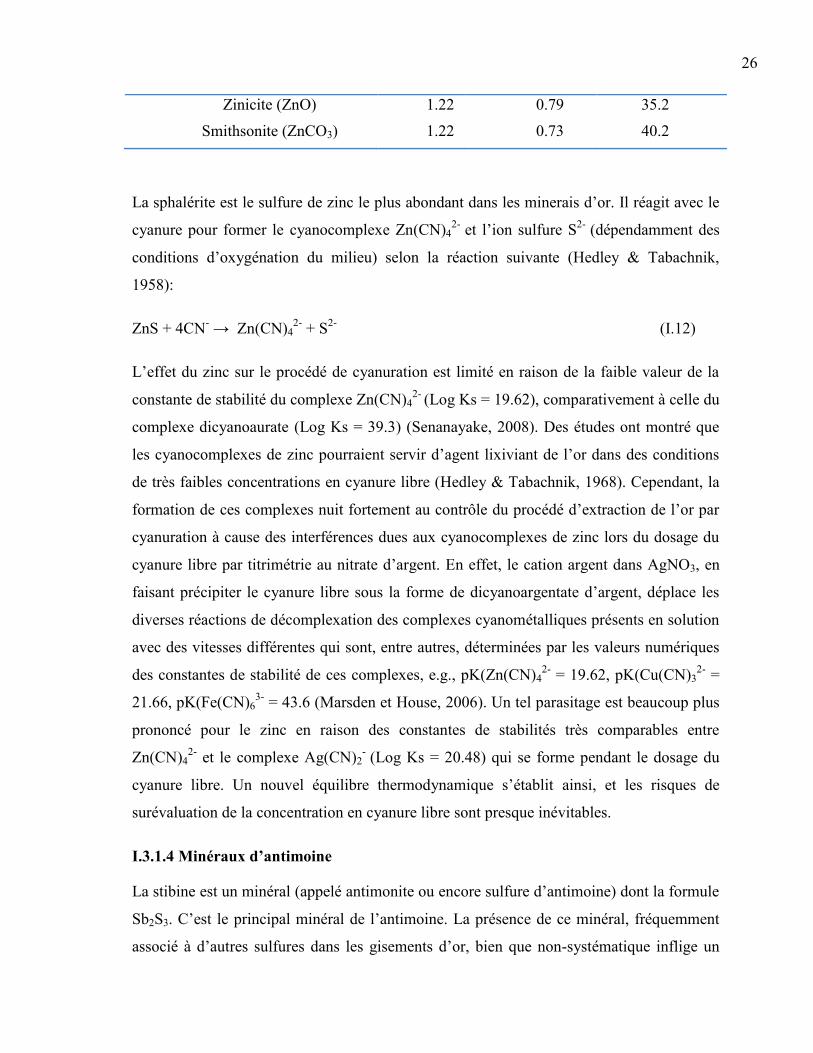
26
Zinicite (ZnO) 1.22 0.79 35.2
Smithsonite (ZnCO3) 1.22 0.73 40.2
La sphalérite est le sulfure de zinc le plus abondant dans les minerais d’or. Il réagit avec le
cyanure pour former le cyanocomplexe Zn(CN)42-
et l’ion sulfure S2-
(dépendamment des
conditions d’oxygénation du milieu) selon la réaction suivante (Hedley & Tabachnik,
1958):
ZnS + 4CN- → Zn(CN)4
2- + S
2- (I.12)
L’effet du zinc sur le procédé de cyanuration est limité en raison de la faible valeur de la
constante de stabilité du complexe Zn(CN)42-
(Log Ks = 19.62), comparativement à celle du
complexe dicyanoaurate (Log Ks = 39.3) (Senanayake, 2008). Des études ont montré que
les cyanocomplexes de zinc pourraient servir d’agent lixiviant de l’or dans des conditions
de très faibles concentrations en cyanure libre (Hedley & Tabachnik, 1968). Cependant, la
formation de ces complexes nuit fortement au contrôle du procédé d’extraction de l’or par
cyanuration à cause des interférences dues aux cyanocomplexes de zinc lors du dosage du
cyanure libre par titrimétrie au nitrate d’argent. En effet, le cation argent dans AgNO3, en
faisant précipiter le cyanure libre sous la forme de dicyanoargentate d’argent, déplace les
diverses réactions de décomplexation des complexes cyanométalliques présents en solution
avec des vitesses différentes qui sont, entre autres, déterminées par les valeurs numériques
des constantes de stabilité de ces complexes, e.g., pK(Zn(CN)42-
= 19.62, pK(Cu(CN)32-
=
21.66, pK(Fe(CN)63-
= 43.6 (Marsden et House, 2006). Un tel parasitage est beaucoup plus
prononcé pour le zinc en raison des constantes de stabilités très comparables entre
Zn(CN)42-
et le complexe Ag(CN)2- (Log Ks = 20.48) qui se forme pendant le dosage du
cyanure libre. Un nouvel équilibre thermodynamique s’établit ainsi, et les risques de
surévaluation de la concentration en cyanure libre sont presque inévitables.
I.3.1.4 Minéraux d’antimoine
La stibine est un minéral (appelé antimonite ou encore sulfure d’antimoine) dont la formule
Sb2S3. C’est le principal minéral de l’antimoine. La présence de ce minéral, fréquemment
associé à d’autres sulfures dans les gisements d’or, bien que non-systématique inflige un
27
manque à gagner très important aux industries durant la lixiviation de minerais aurifères par
cyanuration.
Guo et al. (2005) ont montré que lors de tests de lixiviation de minerais synthétiques
contenant de très faibles concentrations en stibine (0.002% w/w), les taux de récupération
de l’or ne dépassent pas 38% au lieu de 90% en absence de celle-ci. Cet effet inhibiteur est
accentué en augmentant la concentration en stibine dans le minerai; seulement 22% d’or
disponible a été récupéré en présence de 0.01% de stibine. Il existe un consensus dans la
littérature à l’effet que les faibles taux de récupération d’or enregistrés en présence de
stibine seraient dus à la formation d’une couche d’oxyde d’antimoine (probablement
Sb2O5) insoluble à la surface de l’or (Senanayake, 2008). Cette explication pourrait être
supportée par le fait que l’antimoine ne forme pas des complexes stables avec le cyanure
libre en solution (Marsden & House, 2006). De ce fait, cette passivation pourrait être le
résultat d’un phénomène de surface incluant l’oxydation de la stibine, la réduction de
l’oxygène et la précipitation d’oxyde d’antimoine à la surface de l’or. Pour décrire ce
mécanisme, Guo et al. (2005) proposent les réactions suivantes :
Sb2S3 + 8 OH- → 2SbO2
- + 3S
o + 4H2O + 6e
- (I.13)
2SbO2- +2OH
- → Sb2O5 + H2O + 4e
- (I.14)
La réaction (I.13) aurait lieu préférablement à la surface de l’or en raison de la forte
conductivité électrique de ce métal favorisant ainsi le transfert d’électrons à l’oxygène.
L’effet du pH sur la solubilité de la stibine a été étudié afin d’appréhender l’influence de la
dissolution de ce minéral sur la lixiviation de l’or. Il est montré que la cinétique de
dissolution de la stibine est fortement accélérée en augmentant le pH. À pH = 12, la vitesse
de dissolution est trop élevée par contre à pH = 10, elle est très ralentie (Hedley &
Tabachnick, 1958). En conséquence, l’effet inhibiteur de la stibine sur l’extraction de l’or
dépend à son tour du pH. Pour alléger l’effet inhibiteur des oxydes d’antimoine résultant de
la dissolution de la stibine, des tests de lixiviation en réacteur slurry ont été réalisés par Guo
et al. (2005) en présence de dopants métalliques, en l’occurrence le nitrate de plomb, à
différentes concentrations. Les résultats obtenus montrent que la combinaison de faibles
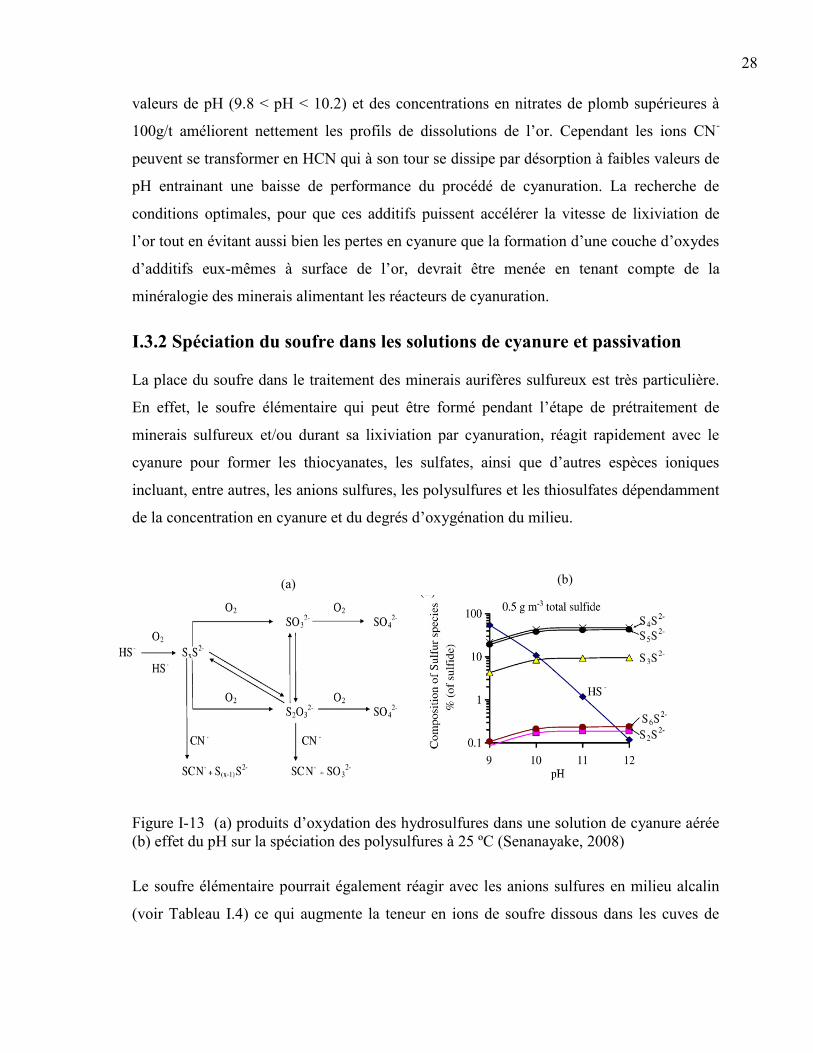
28
valeurs de pH (9.8 < pH < 10.2) et des concentrations en nitrates de plomb supérieures à
100g/t améliorent nettement les profils de dissolutions de l’or. Cependant les ions CN-
peuvent se transformer en HCN qui à son tour se dissipe par désorption à faibles valeurs de
pH entrainant une baisse de performance du procédé de cyanuration. La recherche de
conditions optimales, pour que ces additifs puissent accélérer la vitesse de lixiviation de
l’or tout en évitant aussi bien les pertes en cyanure que la formation d’une couche d’oxydes
d’additifs eux-mêmes à surface de l’or, devrait être menée en tenant compte de la
minéralogie des minerais alimentant les réacteurs de cyanuration.
I.3.2 Spéciation du soufre dans les solutions de cyanure et passivation
La place du soufre dans le traitement des minerais aurifères sulfureux est très particulière.
En effet, le soufre élémentaire qui peut être formé pendant l’étape de prétraitement de
minerais sulfureux et/ou durant sa lixiviation par cyanuration, réagit rapidement avec le
cyanure pour former les thiocyanates, les sulfates, ainsi que d’autres espèces ioniques
incluant, entre autres, les anions sulfures, les polysulfures et les thiosulfates dépendamment
de la concentration en cyanure et du degrés d’oxygénation du milieu.
Figure I-13 (a) produits d’oxydation des hydrosulfures dans une solution de cyanure aérée
(b) effet du pH sur la spéciation des polysulfures à 25 ºC (Senanayake, 2008)
Le soufre élémentaire pourrait également réagir avec les anions sulfures en milieu alcalin
(voir Tableau I.4) ce qui augmente la teneur en ions de soufre dissous dans les cuves de
(b) (a)
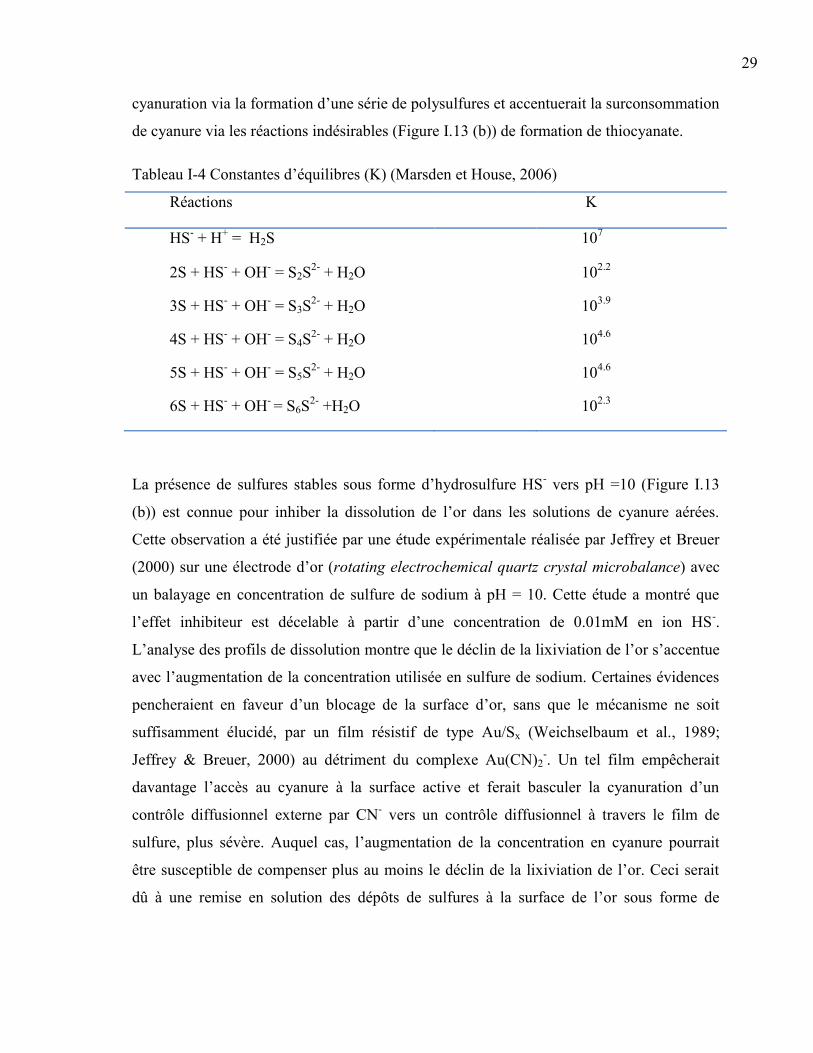
29
cyanuration via la formation d’une série de polysulfures et accentuerait la surconsommation
de cyanure via les réactions indésirables (Figure I.13 (b)) de formation de thiocyanate.
Tableau I-4 Constantes d’équilibres (K) (Marsden et House, 2006)
Réactions K
HS- + H
+ = H2S 10
7
2S + HS- + OH
- = S2S
2- + H2O 10
2.2
3S + HS- + OH
- = S3S
2- + H2O 10
3.9
4S + HS- + OH
- = S4S
2- + H2O 10
4.6
5S + HS- + OH
- = S5S
2- + H2O 10
4.6
6S + HS- + OH
- = S6S
2- +H2O 10
2.3
La présence de sulfures stables sous forme d’hydrosulfure HS- vers pH =10 (Figure I.13
(b)) est connue pour inhiber la dissolution de l’or dans les solutions de cyanure aérées.
Cette observation a été justifiée par une étude expérimentale réalisée par Jeffrey et Breuer
(2000) sur une électrode d’or (rotating electrochemical quartz crystal microbalance) avec
un balayage en concentration de sulfure de sodium à pH = 10. Cette étude a montré que
l’effet inhibiteur est décelable à partir d’une concentration de 0.01mM en ion HS-.
L’analyse des profils de dissolution montre que le déclin de la lixiviation de l’or s’accentue
avec l’augmentation de la concentration utilisée en sulfure de sodium. Certaines évidences
pencheraient en faveur d’un blocage de la surface d’or, sans que le mécanisme ne soit
suffisamment élucidé, par un film résistif de type Au/Sx (Weichselbaum et al., 1989;
Jeffrey & Breuer, 2000) au détriment du complexe Au(CN)2-. Un tel film empêcherait
davantage l’accès au cyanure à la surface active et ferait basculer la cyanuration d’un
contrôle diffusionnel externe par CN- vers un contrôle diffusionnel à travers le film de
sulfure, plus sévère. Auquel cas, l’augmentation de la concentration en cyanure pourrait
être susceptible de compenser plus au moins le déclin de la lixiviation de l’or. Ceci serait
dû à une remise en solution des dépôts de sulfures à la surface de l’or sous forme de
30
thiocyanate (voir réaction I.15) et à la formation du complexe Au(CN)2- au détriment de la
couche passivante d’Au/Sx (Jeffrey & Breuer, 2000).
S + CN- SCN
- (I.15)
Cependant, pour une meilleure compréhension de l’effet de sulfures sur la lixiviation de
l’or et afin d’identifier les espèces soufrées incriminées dans la passivation, il serait crucial
de compléter ces études par des études cinétiques de lixiviation de l’or en présence des
anions sulfures (HS-) à différentes concentrations d’oxygène dissous, de cyanure libre et
dans une gamme de pH entre 10 et 12 pour avoir des conditions représentatives des
solutions industrielles où le soufre s’oxyde graduellement en sulfate. Parallèlement à ces
études, le dépistage de la surface de l’or, par les techniques de caractérisation de surface,
serait très utile pour la mise en évidence de la passivation ainsi que la détermination de la
nature chimique du film passivant.
I.3.3 Phénomènes de passivation et d’interactions galvaniques
Lorsque l’or et les sulfures métalliques, électriquement conducteurs, sont mis en contact,
une pile galvanique s’établit et la différence de potentiel entre les deux matériaux indique le
sens de la corrosion. Un des deux matériaux (le moins noble) s’oxyde et se dissout (anode),
tandis que sur l’autre (le plus noble) a lieu la réduction d’oxygène (cathode). Les
interactions galvaniques peuvent alors empêcher la dissolution de l’or si le potentiel des
sulfures métalliques est inférieur à celui de l’or, favorisant la réduction de l’oxygène au lieu
de la dissolution du métal. Idéalement, lorsque le potentiel de ce dernier est inférieur à celui
des sulfures métalliques, les interfaces Au-sulfures représentent autant de lieu propices aux
interactions galvaniques en faveur d’un comportement anodique de l’or est donc conduisant
à sa dissolution accrue. Étant donné que l’or est connu pour développer dans une solution
de cyanure un potentiel moindre que certains sulfures métalliques, e.g. pyrite, pyrrhotite et
chalcopyrite (Aghamirian & Yen, 2005; Dai & Jeffrey, 2006), avec lesquels il est
naturellement en contact, un accroissement de la vitesse de l’oxycyanolixiviation de l’or
résultant de la corrosion galvanique est attendu. Cependant, il n’existe pas un large
consensus autour des hypothèses fondamentales qui sous-tendent cette tendance à la
lumière des résultats contradictoires rapportés dans la littérature. Filmer (1982) et Paul
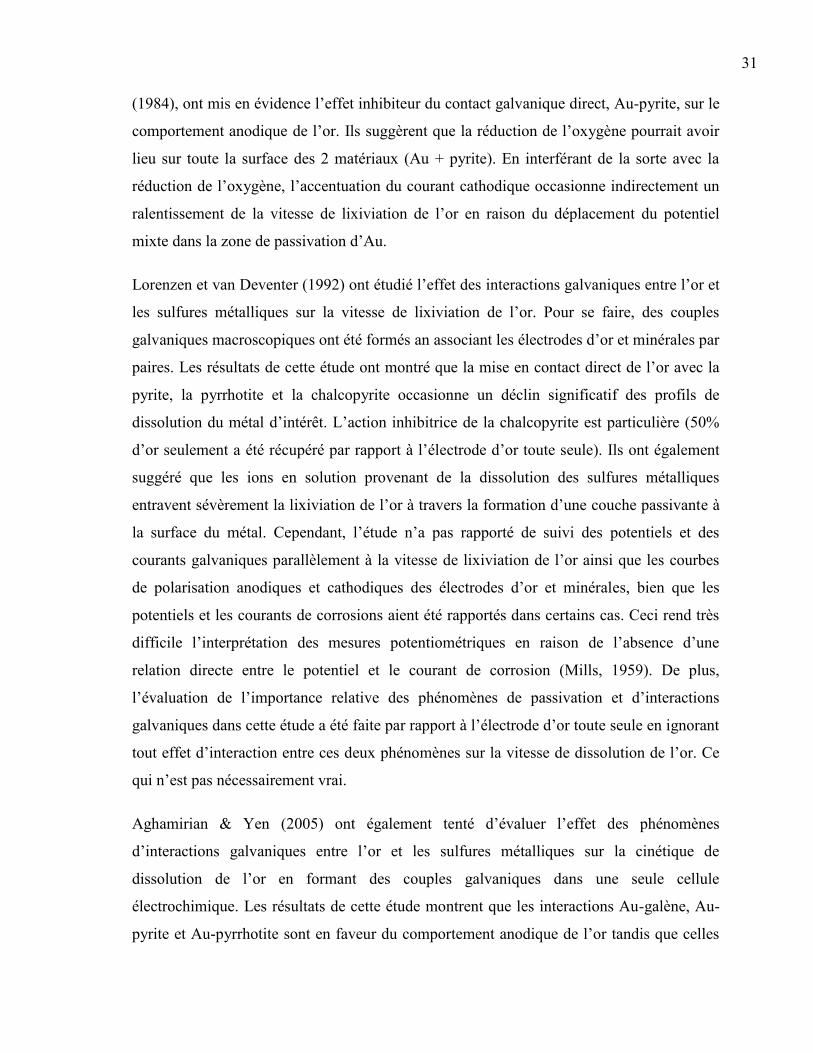
31
(1984), ont mis en évidence l’effet inhibiteur du contact galvanique direct, Au-pyrite, sur le
comportement anodique de l’or. Ils suggèrent que la réduction de l’oxygène pourrait avoir
lieu sur toute la surface des 2 matériaux (Au + pyrite). En interférant de la sorte avec la
réduction de l’oxygène, l’accentuation du courant cathodique occasionne indirectement un
ralentissement de la vitesse de lixiviation de l’or en raison du déplacement du potentiel
mixte dans la zone de passivation d’Au.
Lorenzen et van Deventer (1992) ont étudié l’effet des interactions galvaniques entre l’or et
les sulfures métalliques sur la vitesse de lixiviation de l’or. Pour se faire, des couples
galvaniques macroscopiques ont été formés an associant les électrodes d’or et minérales par
paires. Les résultats de cette étude ont montré que la mise en contact direct de l’or avec la
pyrite, la pyrrhotite et la chalcopyrite occasionne un déclin significatif des profils de
dissolution du métal d’intérêt. L’action inhibitrice de la chalcopyrite est particulière (50%
d’or seulement a été récupéré par rapport à l’électrode d’or toute seule). Ils ont également
suggéré que les ions en solution provenant de la dissolution des sulfures métalliques
entravent sévèrement la lixiviation de l’or à travers la formation d’une couche passivante à
la surface du métal. Cependant, l’étude n’a pas rapporté de suivi des potentiels et des
courants galvaniques parallèlement à la vitesse de lixiviation de l’or ainsi que les courbes
de polarisation anodiques et cathodiques des électrodes d’or et minérales, bien que les
potentiels et les courants de corrosions aient été rapportés dans certains cas. Ceci rend très
difficile l’interprétation des mesures potentiométriques en raison de l’absence d’une
relation directe entre le potentiel et le courant de corrosion (Mills, 1959). De plus,
l’évaluation de l’importance relative des phénomènes de passivation et d’interactions
galvaniques dans cette étude a été faite par rapport à l’électrode d’or toute seule en ignorant
tout effet d’interaction entre ces deux phénomènes sur la vitesse de dissolution de l’or. Ce
qui n’est pas nécessairement vrai.
Aghamirian & Yen (2005) ont également tenté d’évaluer l’effet des phénomènes
d’interactions galvaniques entre l’or et les sulfures métalliques sur la cinétique de
dissolution de l’or en formant des couples galvaniques dans une seule cellule
électrochimique. Les résultats de cette étude montrent que les interactions Au-galène, Au-
pyrite et Au-pyrrhotite sont en faveur du comportement anodique de l’or tandis que celles
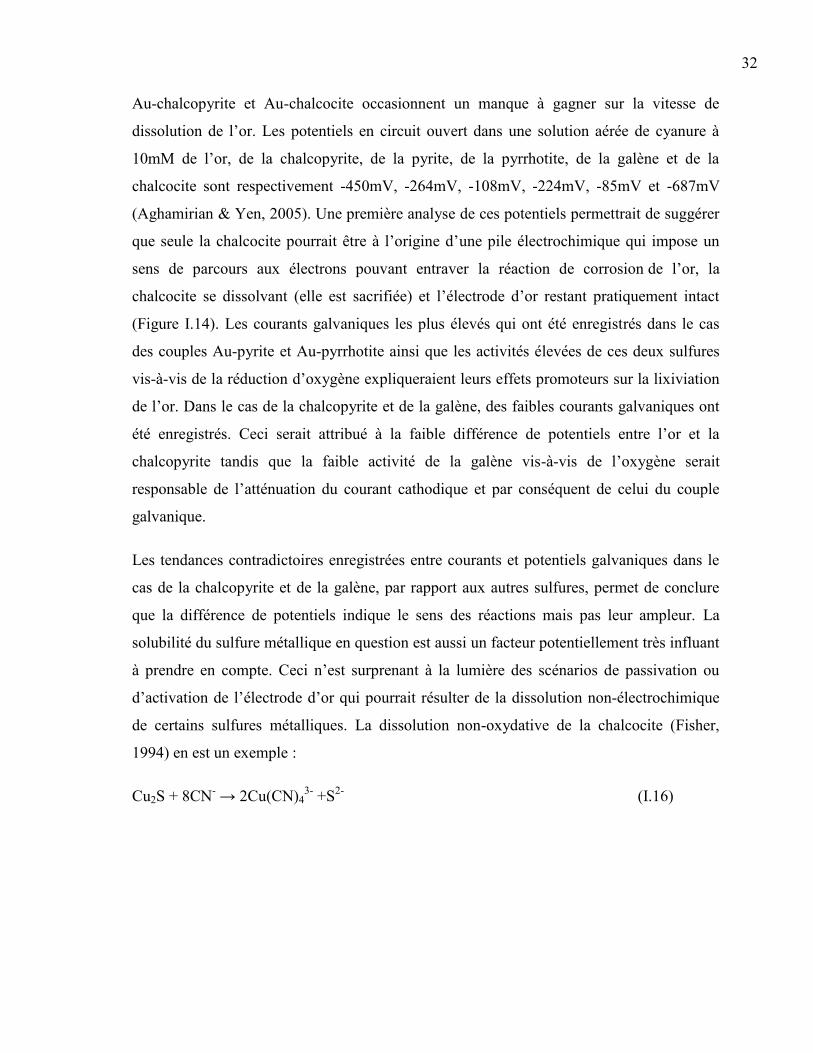
32
Au-chalcopyrite et Au-chalcocite occasionnent un manque à gagner sur la vitesse de
dissolution de l’or. Les potentiels en circuit ouvert dans une solution aérée de cyanure à
10mM de l’or, de la chalcopyrite, de la pyrite, de la pyrrhotite, de la galène et de la
chalcocite sont respectivement -450mV, -264mV, -108mV, -224mV, -85mV et -687mV
(Aghamirian & Yen, 2005). Une première analyse de ces potentiels permettrait de suggérer
que seule la chalcocite pourrait être à l’origine d’une pile électrochimique qui impose un
sens de parcours aux électrons pouvant entraver la réaction de corrosion de l’or, la
chalcocite se dissolvant (elle est sacrifiée) et l’électrode d’or restant pratiquement intact
(Figure I.14). Les courants galvaniques les plus élevés qui ont été enregistrés dans le cas
des couples Au-pyrite et Au-pyrrhotite ainsi que les activités élevées de ces deux sulfures
vis-à-vis de la réduction d’oxygène expliqueraient leurs effets promoteurs sur la lixiviation
de l’or. Dans le cas de la chalcopyrite et de la galène, des faibles courants galvaniques ont
été enregistrés. Ceci serait attribué à la faible différence de potentiels entre l’or et la
chalcopyrite tandis que la faible activité de la galène vis-à-vis de l’oxygène serait
responsable de l’atténuation du courant cathodique et par conséquent de celui du couple
galvanique.
Les tendances contradictoires enregistrées entre courants et potentiels galvaniques dans le
cas de la chalcopyrite et de la galène, par rapport aux autres sulfures, permet de conclure
que la différence de potentiels indique le sens des réactions mais pas leur ampleur. La
solubilité du sulfure métallique en question est aussi un facteur potentiellement très influant
à prendre en compte. Ceci n’est surprenant à la lumière des scénarios de passivation ou
d’activation de l’électrode d’or qui pourrait résulter de la dissolution non-électrochimique
de certains sulfures métalliques. La dissolution non-oxydative de la chalcocite (Fisher,
1994) en est un exemple :
Cu2S + 8CN- → 2Cu(CN)4
3- +S
2- (I.16)
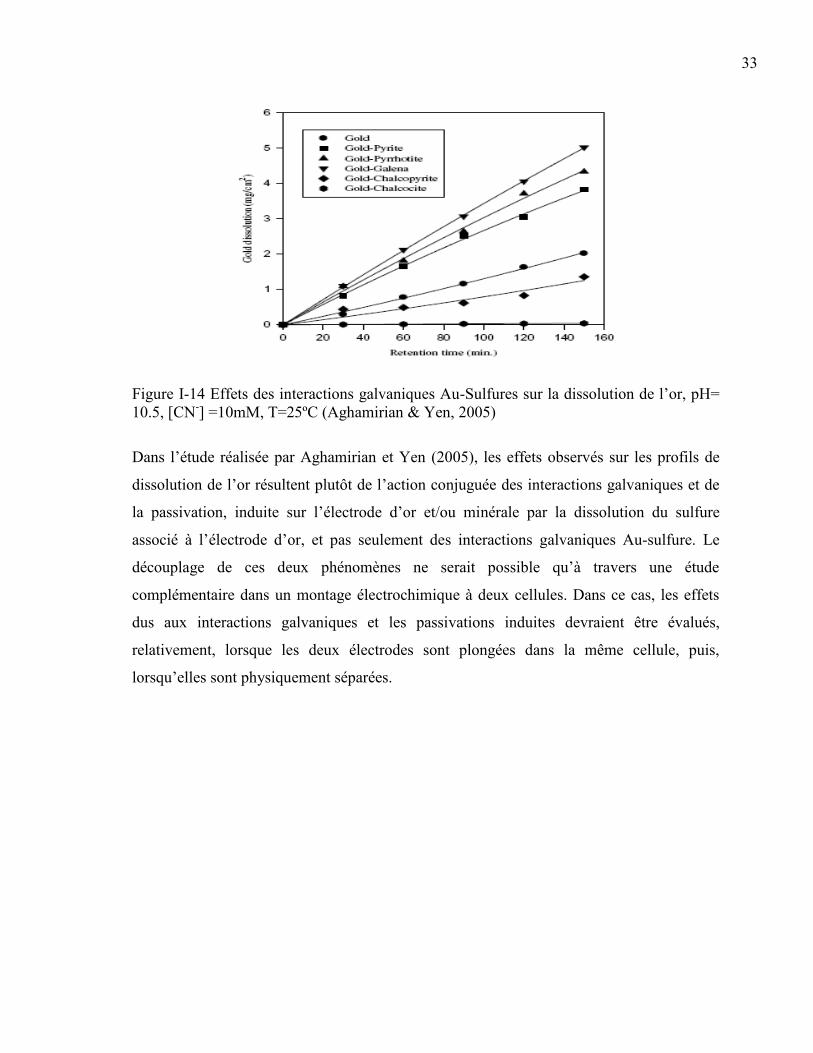
33
Figure I-14 Effets des interactions galvaniques Au-Sulfures sur la dissolution de l’or, pH=
10.5, [CN-] =10mM, T=25ºC (Aghamirian & Yen, 2005)
Dans l’étude réalisée par Aghamirian et Yen (2005), les effets observés sur les profils de
dissolution de l’or résultent plutôt de l’action conjuguée des interactions galvaniques et de
la passivation, induite sur l’électrode d’or et/ou minérale par la dissolution du sulfure
associé à l’électrode d’or, et pas seulement des interactions galvaniques Au-sulfure. Le
découplage de ces deux phénomènes ne serait possible qu’à travers une étude
complémentaire dans un montage électrochimique à deux cellules. Dans ce cas, les effets
dus aux interactions galvaniques et les passivations induites devraient être évalués,
relativement, lorsque les deux électrodes sont plongées dans la même cellule, puis,
lorsqu’elles sont physiquement séparées.
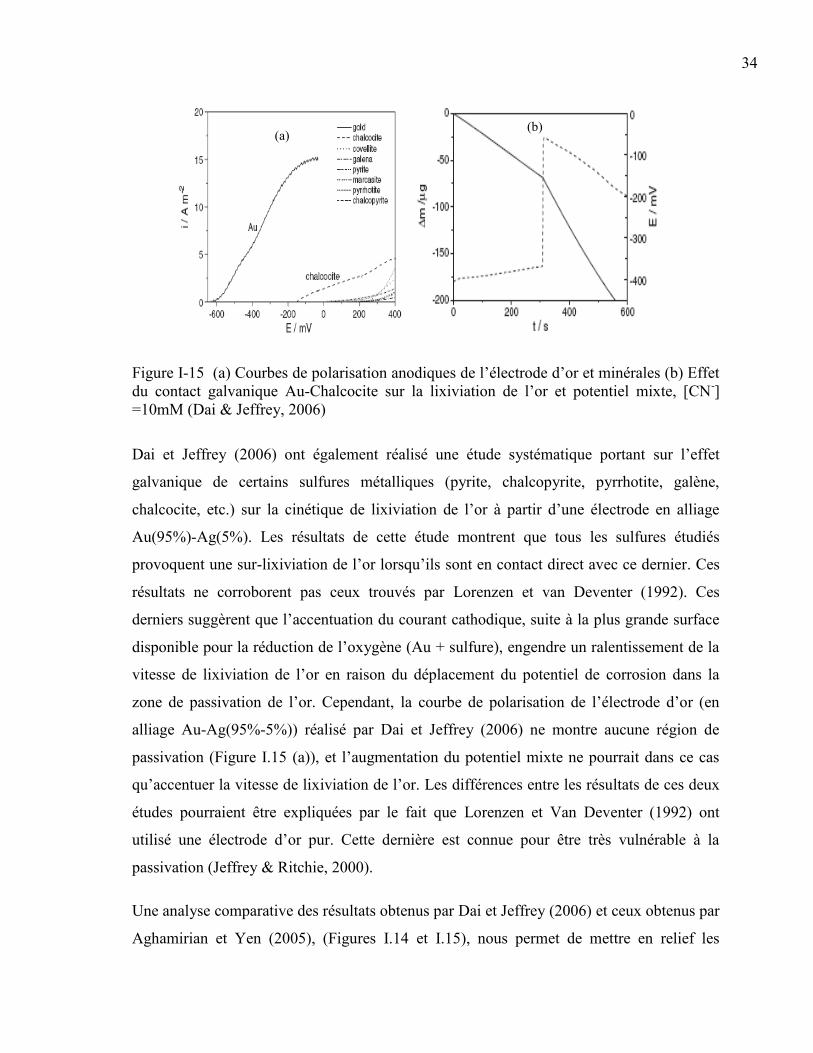
34
Figure I-15 (a) Courbes de polarisation anodiques de l’électrode d’or et minérales (b) Effet
du contact galvanique Au-Chalcocite sur la lixiviation de l’or et potentiel mixte, [CN-]
=10mM (Dai & Jeffrey, 2006)
Dai et Jeffrey (2006) ont également réalisé une étude systématique portant sur l’effet
galvanique de certains sulfures métalliques (pyrite, chalcopyrite, pyrrhotite, galène,
chalcocite, etc.) sur la cinétique de lixiviation de l’or à partir d’une électrode en alliage
Au(95%)-Ag(5%). Les résultats de cette étude montrent que tous les sulfures étudiés
provoquent une sur-lixiviation de l’or lorsqu’ils sont en contact direct avec ce dernier. Ces
résultats ne corroborent pas ceux trouvés par Lorenzen et van Deventer (1992). Ces
derniers suggèrent que l’accentuation du courant cathodique, suite à la plus grande surface
disponible pour la réduction de l’oxygène (Au + sulfure), engendre un ralentissement de la
vitesse de lixiviation de l’or en raison du déplacement du potentiel de corrosion dans la
zone de passivation de l’or. Cependant, la courbe de polarisation de l’électrode d’or (en
alliage Au-Ag(95%-5%)) réalisé par Dai et Jeffrey (2006) ne montre aucune région de
passivation (Figure I.15 (a)), et l’augmentation du potentiel mixte ne pourrait dans ce cas
qu’accentuer la vitesse de lixiviation de l’or. Les différences entre les résultats de ces deux
études pourraient être expliquées par le fait que Lorenzen et Van Deventer (1992) ont
utilisé une électrode d’or pur. Cette dernière est connue pour être très vulnérable à la
passivation (Jeffrey & Ritchie, 2000).
Une analyse comparative des résultats obtenus par Dai et Jeffrey (2006) et ceux obtenus par
Aghamirian et Yen (2005), (Figures I.14 et I.15), nous permet de mettre en relief les
(a) (b)
35
tendances contradictoires rapportés dans le cas de la chalcocite. Contrairement à la
cinétique de dissolution de l’or pratiquement nulle dans le cas de la Figure I.14, le contact
galvanique Au-chalcocite (Figure I.15) occasionne une nette amélioration de la vitesse de
lixiviation de l’or. Ceci pourrait être expliqué en partie par le fait que l’expérience
présentée sur la Figure I.15 a été effectuée pendant une courte durée (3 min) où le
mécanisme de passivation de la surface de l’or par dissolution de la chalcocite est resté très
limité.
La majorité des études ayant été réalisées jusqu'à présent ont porté, seulement, sur la
corrosion de l’or, soit seul (cible monométallique) soit dans le cas bimétallique (Au-Ag,
Au-Cu), soit en contact galvanique avec un seul sulfure métallique. Cependant, l’influence
de l’association galvanique entre les différents sulfures, au sein des minerais aurifères
sulfureux, sur leurs réactivités dans des solutions de cyanure n’a pas été prise en
considération. Par conséquent, l’étude de l’effet des contacts galvaniques sulfures-sulfures
sur la cinétique de dissolution de l’or serait cruciale pour une compréhension intégrée des
phénomènes de passivation et d’interactions galvaniques. Des études réalisées par Cruz et
al. (2005) ont monté que la réactivité de la pyrite, dans une solution de nitrate de sodium
0.1M, est fortement influencée par la présence de traces de sphalérite et/ou de galène dans
la matrice pyritique.
La problématique de dissolution de l’or en présence de sulfures métalliques est très
complexe, en raison de l’interaction d’un grand nombre de facteurs : (i) passivation de la
surface de l’or due à la formation d’une couche protectrice de type Au2S, Ag2S ou d’un
dépôt de soufre, (ii) formation de couches résistives d’oxydes et/ou d’hydroxydes de
métaux, résultants de la dissolution des sulfures, à la surface des particules d’or et
minérales, (iii) oxydation des minéraux sulfureux et surconsommation de cyanure et
d’oxygène via les réactions parasites de formation de complexes cyanométalliques, de
thiocyanate et des oxysulfures et (iv) phénomène d’interactions galvaniques. Très souvent,
l’intrication entre ces différents facteurs contraint à déployer une stratégie ad hoc devant
tenir compte de la spécificité des minerais à traiter afin de maximiser la récupération de
l’or.
36
I.4 Objectifs du projet
Bien que plusieurs études aient porté sur les phénomènes de passivation et d’interactions
galvaniques en présence de sulfures métalliques, celles-ci suscitent, néanmoins, quelques
interrogations. Premièrement, peu d’études ont évalué l’importance relative sur la
dissolution de l’or des phénomènes de passivation et d’interactions galvaniques
corollairement, avec des études cinétiques détaillées d’oxydation des dits sulfures
métalliques. Deuxièmement, la plupart des études ont porté sur l’effet des interactions
galvaniques Au-sulfure, sans tenir compte de l’effet des interactions galvaniques sulfure-
sulfure sur la réactivité de ces derniers, et par conséquent sur la lixiviation de l’or.
Troisièmement, aucune étude de corrosion de l’or n’a été faite sur des cibles minérales
reflétant de façon réaliste la topochimie de surface des minerais industriels en terme de
contacts galvaniques permanents à l’échelle intra-particulaire ainsi que de rapports de
surfaces cathode/anode.
Le présent travail de thèse vise les objectifs suivant :
1. Évaluer l’importance relative sur la dissolution de l’or : (i) des interactions
galvaniques entre l’or et les sulfures métalliques, ii) des interactions galvaniques
permanentes entre les différents sulfures, iii) de la passivation induite sur la surface
de l’or par les réactions indésirables de dissolution des sulfures métalliques. Et
parallèlement à cet objectif, contribuer à une compréhension fiable et plus fine des
aspects fondamentaux de la cyanuration via un suivi méticuleux des cinétiques de
lixiviation de minéraux sulfureux dans les solutions de cyanure alcalines.
2. Rechercher des moyens de réduction de la forte réactivité des sulfures métalliques
et/ou de prévention de la passivation de l’or durant la cyanuration à travers des
études cinétiques et électrochimiques originales.
Au deuxième chapitre de ce mémoire, des études électrochimiques et cinétiques sont
mises en œuvre sur un montage de type Rotating Disk Electrode (RDE). Ce dernier est
constitué de cellules munies d’électrodes tournantes permettant, en sus d’un suivi en ligne
des concentrations d’espèces mises en jeu, de mesurer les réponses électrochimiques des
37
électrodes Au-Ag et minérales étudiées. Pour tenter d’apporter des indices quant au
découplage et au chiffrage de la contribution des phénomènes de passivations versus celles
reliées aux phénomènes d’interactions galvaniques, l’électrode d’Au-Ag a été connectée à
l’électrode minérale (préparée à partir d’un minerai industriel) par une jonction sans
résistance (ZRA) permettant de mesurer, courant et potentiel galvaniques en fonction du
temps. Les effets dus aux interactions galvaniques et à la passivation sont comparés lorsque
les deux électrodes sont plongées dans la même cellule, puis, lorsqu’elles sont
physiquement séparées par immersion dans deux cellules distinctes. La cinétique de
dissolution de l’or est suivie par absorption atomique simultanément avec les signaux de
potentiel et courant galvaniques. Dans le but de comprendre le comportement du minerai
industriel étudié, une étude systématique des effets des sulfures majeurs entrant dans sa
composition a été entreprise. Plus spécifiquement, nous allons présenter des mesures de
cinétique de lixiviation de l’or à partir de l’électrode Au-Ag que nous avons plongée dans
une série de pulpes formés successivement par les sulfures majeurs du dit minerai
industriel, pris séparément. Afin de rechercher des moyens d’atténuation de l’effet
inhibiteur des sulfures majoritaires présents dans le minerai industriel, sur la vitesse de
lixiviation de l’or, des tests de pré-oxydation de ce dernier ainsi que de ses constituants ont
été réalisés en réacteur slurry.
Au troisième chapitre, pour répondre à certaines questions ouvertes sur la dissolution de
l’or en réacteur slurry et en couples galvaniques macroscopiques, il a été décidé
d’investiguer les effets dus aux interactions galvaniques permanentes Au-sulfure, et aux
phénomènes de passivation dans un nouveau réacteur électrochimique à lit fixe. Dans ce
dernier, les minerais (sulfures métalliques commerciaux et industriels) et de la poudre d’or
sont disposés en lit fixe sous forme de mélange alimenté par une solution de cyanure aérée
recirculée en boucle fermée à l’aide d’une pompe péristaltique. Contrairement aux couples
galvaniques utilisés précédemment en mode RDE, la disposition de la poudre d’or et des
sulfures métalliques de manière à refléter de façon réaliste la topochimie de surface des
minerais industriels en termes de contacts galvaniques permanents à l’échelle intra-
particulaire a été possible. Ceci nous a permis de découpler les phénomènes de passivation
des interactions galvaniques et d’évaluer leur importance relative sur la dissolution de l’or
et des sulfures, tout en utilisant des rapports de surfaces cathode/anode plus réalistes, dont
38
la mise en œuvre a été impossible que ce soit en couples galvaniques macroscopiques ou
bien en réacteur slurry.
Dans le quatrième chapitre de ce travail, l’application du réacteur électrochimique à lit
fixe en cyanuration a été étendue pour tenir compte, en plus des interactions galvaniques
Au-sulfure, de l’effet des associations galvaniques sulfure-sulfure sur la réactivité de ces
derniers est par conséquent sur la lixiviation de l’or. Tout en ayant l’avantage de contrôler
les associations galvaniques, au moyen du réacteur à lit fixe, entre les poudres de métaux
précieux (Au & Ag) et celles de sulfures métalliques à l’échelle inter-particulaire, nous
étions capable de démontrer que le comportement électrochimique des différents minéraux
est fortement influencé par leur statut minéralogique dans les systèmes qui les renferment.
Ainsi, la nature de la phase minérale associée à l’Au a été démontrée pour être, souvent, le
principal facteur contrôlant l’oxycyalixiviation de l’or dans les systèmes multi-minéraux
synthétiques étudiés. L’effet du rapport de surface anode/cathode sur la lixiviation de l’Au
a également été pris en considération dans ce chapitre.
Le cinquième et dernier chapitre est dédié à la recherche de moyens d’atténuation de
l’effet inhibiteur des sulfures métalliques sur la vitesse de lixiviation de l’or. Les résultats
trouvés au niveau du deuxième, du troisième et du quatrième chapitre, nous ont permis de
démontrer que le comportement des différents minéraux sulfureux (étudiés séparément)
dans les solutions de cyanure et leur incidence inhibitrice sur la vitesse de lixiviation de
l’or, ne permettaient pas une explication aisée aussi bien du comportement du minerai
mélange natif (minerai industriel) que de celui de plusieurs systèmes synthétiques multi-
minéraux, constitués des mêmes sulfures. Par conséquent, les mesures de prévention de la
passivation investiguées dans le présent chapitre ont été mises en œuvre sur le réacteur
électrochimique à lit fixe. Premièrement, pour ne pas choisir des cations exotiques, l’effet
de la galène, utilisé comme source des ions Pb (II), sur la vitesse de lixiviation de l’or en
présence d’une large gamme de minéraux sulfureux a été exploré aussi bien en présence
qu’en absences des interactions galvaniques galène-sulfure. Deuxièmement, des tests de
pré-oxydation ont été menés en tenant compte des interactions galvaniques Au-sulfure et
sulfure-sulfure à l’échelle inter-particulaire. Une combinaison d’études électrochimiques et
de spéciation chimique des produits de la dissolution des sulfures a été utilisée pour
39
contribuer à une interprétation plus étayée des mécanismes mises en jeu lors des différentes
tentatives d’amélioration de la dissolution de l’or.
Étant donné qu’ une meilleure compréhension des comportements des différents minéraux
sulfureux dans les solutions de cyanure est capitale pour une contribution effective à
l’explication des mécanismes d’extraction de l’or par cyanuration, un protocole d’analyse
par électrophorèse capillaire permettant la séparation et la quantification des principaux
ions résultant de la dissolution des minerais aurifères sulfureux durant la lixiviation de l’or
par cyanuration a été développé. La séparation et la quantification de 11 ions en,
l’occurrence : S2O32-
, Cu(CN)32-
, Fe(CN)64-
, Fe(CN)63-
, SCN-, Au(CN)2
-, Ag(CN)2
-, SO4
2-,
SO32-
, HS- et OCN
- a été possible au moyen d’un protocole indirect (UV-Visible). Pour
plus de détails sur cette étude, voir article publié dans Journal of Separation Science
présenté en annexe A.
40
I.5 Bibliographie
Aghamirian, M.M., Yen, W.T., 2005. Mechanisms of galvanic interactions between gold
and sulfide minerals in cyanide solution. Miner. Eng. 18, 393-407.
Ahlberg, E., Broo, A.E., 1996. Oxygen reduction at sulphide minerals. Int. J. Miner.
Process. 46, 73-89.
Bard, A.J., 1973. Encyclopedia of Electrochemistry of the Elements. Marcel Dekker, New
York.
Biegler, T., Rand, D.A.J., Woods, R., 1975. Oxygen reduction on sulphide minerals. Part 1.
Kinetics and mechanism at rotated pyrite electrodes. J. Electroanal. Chem. 60, 151-162.
Bodlander, G.,1896. Die Chemie des Cyanideverfahrens. Z. Angew. Chem. 9, 583-587.
Cathro, K.J., and Koch, D.F.A., 1964. The anodic dissolution of gold in cyanide solutions.
Journal of Electrochemical Society 111: 1416-1420.
Chandler, B.D., Alexander, B., Schabel, A.B., Pignolet, L.H., 2000. Preparation and
Characterization of Supported Bimetallic Pt–Au and Pt–Cu Catalysts from Bimetallic
Molecular Precursors. Journal of Catalysis. 193, 186-198.
Cruz, R., Luna-Sanchez, R.M., Lapidus, G.T., Gonzalez, I., Monroy, M., 2005. An
experimental strategy to determine galvanic interactions affecting the reactivity of sulfide
mineral concentrates. Hydrometallurgy 78, 198-208
Dai, X., Jeffrey, M.I., 2006. The effect of sulfide minerals on the leaching of gold in
aerated cyanide solutions. Hydrometallurgy 82, 118-125.
Deschênes, G., Lastra, R., Brown, J.R., Jin, S., May, O., Ghali, E., 2000. Effect of lead
nitrate on cyanidation of gold ores: progress on the study of the mechanisms. Miner. Eng.
13, 1263-1279.
Elsner, L., 1846. Über Das Verhallen Verschiedener Metalle İn Einer Wassrigen Lôsung
Von Cyanakalium, J. Prakt. Chem. 37, 441-446
Ficher, W.W., 1994. Comparison of chalcocite dissolution in the sulfate, perchlorate
nitrate, chloride, ammonia, and cyanide system. Miner. Eng. 7, 99-103.
Filmer, A., 1982. The dissolution of gold from roasted pyrite concentrations. J. S. Afr. Inst.
(March), 90-94.
Guo, H., Deschênes, G., Pratt, A., Fulton, M., Lastra, R., 2005. Leaching kinetics and
mechanisms of surface reactions during cyanidation of gold in the presence of pyrite and
stibnite. Miner. Metall. Process. 22, 89-95.
Gavin, M.M., 2007. Global trends in gold mining: Towards quantifying environmental and
resource sustainability. Resources Policy 32, 42–56
Habashi, F. 1967. Kinetics and mechanism of gold and silver dissolution in cyanide
solution. Montana Bureau of Mines and Geology Bulletin. vol. 59.
Habashi, F., 1966. The theory of cyanidation. Transactions of the Mineralogical Society of
AIME 235:236-239.
41
Hamilton, I.C., Woods, R., 1984. A volumetric study of the surface oxidation of sulfide
minerals. In: Richardson, P.E. et al., (Eds.), Proceedings of Int. Sym. On Electrochemistry
in Mineral and Metal Processing. Electrochemical Society Inc., pp. 259-285.
Hedley, N., Tabachnick. H., 1958. Chemistry of cyanidation. Mineral Dressing Note 23.
New York: American Cyanamid Company.
Heath, A.R. and Rumball, J.A., 1998. Optimising cyanide : oxygen ratios in gold CIP/CIL
circuits. Miner. Eng. 11, pp. 999-1010
Huang, H.H., Young, C.A., 1996. Mass-balanced calculations of Eh-pH diagrams using
STABCAL. In: Woods, R., Richardson, P., Doyle, F.M. (Eds), Electrochemistry in
minerals and Metals Processing IV. The Electrochemical Society, Pennington, NJ, pp. 227-
238.
Jeffrey, M.I., Breuer, P.L., 2000. The cyanide leaching of gold in solutions containing
sulfide. Miner. Eng. 13, 1097-1106.
Jeffrey, M.I., Ritchie, I.M., 2000. The leaching of gold in cyanide solutions in the presence
of presence of impurities: I. The effect of silver. J. Electrochem. Soc. 147, 3272-3276.
Jeffrey, M., 1997. PhD thesis: A kinetic and electrochemical study of the dissolution of
gold in aerated cyanide solutions: the role of solid and solution phase purity. Curtin
University of Technology, Western Australia.
Ling, P., Papangelakis, V.G, Argyropoulos, S.A., Kondos, P.D., 1996. An Improved Rate
Equation for Cyanidation of a Gold Ore. Can. Metal. Quaterly. pp. 225-234.
Lorenzen, L., van Deventer, J.S.J., 1992. Electrochemical interactions between gold and its
associated minerals during cyanidation. Hydrometallurgy 30, 177-194.
Lukey, G.C., van Deventer, J.S.J., Huntington, S.T., Chowdhury, R.L., Shallcross. D.C.,
1999. Raman study on the speciation of copper cyanide complexes in highly saline
solutions. Hydrometallurgy 53 (3), 233-244.
MacArthur, J.S., Forrest, R.W., Forrest, W., 1888. Improvements in obtaining gold and
silver from ores and other compounds. British Patent 14174
Marsden, J.O., House, C.I., 2006. The Chemistry of Gold Extraction. 2nd Edition. Society
for Mining, Metallurgy, and Exploration (SME), Littleton. CO, USA.
Medley, C.D., Smith, J.E., Tang, Z., Wu, Y., Bamrungsap, S., Tan, W., 2008. Gold
nanoparticle-based colorimetric assay for the direct detection of cancerous cells. Anal.
Chem. 4, 1067-72
Maxey, A., Gonnella, P., Ball, Y., Herkenhoff, P., 1997. Gold. In Register of Australian
Mining 1996/1997, Ed. Louthean, R., Resource Information Unit Ltd. Bassendean, WA.
Nicol, M., Fleming, C. and Paul, R., 1987. The chemistry of the extraction of gold, in The
Extractive metallurgy of gold, vol. 2, Ed. Stanley, G.G., South African Institute of Mining
and Metallurgy, Johannesburg, S. Africa, pp. 831-905.
Nicol, M.J., 1980. The anodic behaviour of gold, Gold Bulletin. Vol. 13, pp. 105-111
42
Osseo-Assare, K., Xue, T. and Ciminelli, V.S.T., 1984. Solution chemistry of cyanide
leaching systems, in Precious Metals: Mining Extraction and Processing, The Metallurgical
Society/AIME., Warrendale, Pennsylvania, pp. 173-197.
Paul, R.L., 1984. The role of electrochemistry in the extraction of gold. J. Electroanal.
Chem. 168, 147-162.
Senanayake, G., 2008. A review of effects of silver, lead, sulfide, and carbonaceous matter
on gold cyanidation and mechanistic interpretation. Hydrometallurgy. 90, 46-73.
Wang, X. and Forssberg, K.S.E., 1990. The chemistry of cyanide-metal complexes in
relation to hydrometallurgical processes of precious metals, Mineral Processing and
Extractive Metallurgy Review, vol. 6, pp. 81-125.
Weichselbaum, J., Tumilty, J.A., Schmidt, C.G., 1989. The effects of sulfide and lead on
the rate of gold cyanidation. Proceedings Aus. I.M.M. Annual conference Perth/Kalgoorlie.
Australasian Institute of Mining and metallurgy, Melbourne, pp. 221-224.
Zhang, H.G., 1997. PhD thesis: some aspects of the use of thiourea in gold processing,
Murdoch University, Murdoch. WA.
43
CHAPITRE II. Electrochemical behavior of gold
cyanidation in the presence of a sulfide-rich industrial ore
versus its major constitutive sulfide minerals
Abdelaaziz Azizi, Catalin Florin Petre,1 Caroline Olsen,
1 Faïçal Larachi
Department of Chemical Engineering, Laval University, Québec, Canada, G1V 0A6
1- COREM Research Center, 1180 Rue de la Minéralogie, Québec, Canada, G1N 1X7
Abstract/Résumé
A detailed study on the relative importance of passivation phenomena and galvanic
interactions during gold cyanidation was carried out. Mineral disc electrodes consisting of a
sulfide-rich industrial ore and major sulfide components therefrom were prepared along
with an Au electrode (gold/silver alloy) in use for gold leaching rate tests. These leaching
tests conducted by hyphenating gold and mineral disc electrodes conjointly in one
electrochemical cell or in two separate electrochemical cells objectified both passivation-
induced setbacks as well as boosts by Au/mineral galvanic interactions on gold dissolution.
To decipher the role of sulfide ores on gold cyanidation, a systematic study was performed
by monitoring the leaching behavior of an Au disc electrode successively immersed in
slurries of industrial ore and its major sulfide constituents, i.e., pyrite, sphalerite and
chalcopyrite. The tested mineral constituents and ore exhibited an inhibiting effect on gold
leaching, decreasing in the following order: chalcopyrite > sphalerite > industrial ore >
pyrite. Pre-oxidation of the industrial sulfide ore prior to cyanidation improved the gold
leaching rate. However, in spite of noticeable reductions in cyanide consumption, no
beneficial effect of pre-oxidation on gold leaching was observed for the major sulfide (ore)
constituents when tested separately. Although cooperating permanent galvanic interactions
between gold and main constitutive minerals in the industrial ore prompted higher gold
leaching rates, predictability of the latter from lab-controlled leach tests of the nearly pure
constitutive sulfide minerals still remain premature.
44
Une étude détaillée sur l’importance relative des phénomènes de passivation et
d’interactions galvaniques lors de l’extraction de l’or par cyanuration a été menée. Des
électrodes d’or (en alliage Au/Ag) et minérales (un minerai industriel et ses constituants
majeurs) ont été préparées et utilisées pour les expériences de cyanuration. Les tests de
lixiviation réalisés en appariant les électrodes d’or et minérales dans un banc
électrochimique à une et à deux cellules séparées ont montré que les interactions
galvaniques entre l’or et les sulfures étudiés présentent globalement un effet positif sur la
vitesse de dissolution de l’or. Cependant, la passivation de ce dernier inflige un manque à
gagner sur sa dissolution. Pour déchiffrer le rôle de minerais sulfureux sur la lixiviation de
l’or, une étude systématique a été conduites en suivant la cinétique de lixiviation d’une
électrode d’or plongée successivement dans une série de slurries préparés à partir du
minerai industriel étudié et de ses constituants majeurs. Les résultats obtenus montrent que
tous les minerais testés présentent un effet négatif sur la vitesse de lixiviation de l’or. La
gradation de la répression de la plus sévère vers la moins sévère suit l’ordre suivant :
chalcopyrite > sphalérite > minerai industriel > pyrite. La pré-oxydation du minerai
industriel avant sa cyanuration améliore nettement la vitesse de dissolution de l’or.
Cependant, malgré une réduction notable sur la consommation du cyanure, la pré-oxydation
des sulfures métalliques majeurs, pris isolément, ne semble pas améliorer la lixiviation de
l’or durant l’étape de cyanuration. Bien que les interactions galvaniques permanentes entre
l’or et les constituants majeurs dans le minerai industriel favorisent la vitesse de
cyanuration de l’or, la prédiction de cette dernière à partir de tests contrôlés réalisés au
laboratoire sur les sulfures constitutifs reste encore prématurée.
45
II.1. Introduction
Since the discovery of gold dissolution in cyanide solutions in 1783 by Carl Wilhelm
Scheele (Marsden and House, 2006), myriad studies followed to elucidate the mechanisms
in play during this reaction. Elsner (1846) was the first to shed light on the mechanism of
gold dissolution in aerated cyanide solutions while cyanidation evolved coevally into a
commercial process after a patent filed by MacArthur et al. (1887). Nowadays, with
virtually depleted gold-bearing oxide deposits around the globe, gold extraction from less
friendly sulfide deposits is stretching the limits of cyanidation into uncharted territories.
Unlike oxides, which divert marginal quantities of cyanide and have generally minor
impact on gold leaching (Marsden and House, 2006), most of the corresponding metal
sulfides display a range of reactivity in alkaline gold leaching cyanidation (Marsden and
House, 1992; 2006). Due to poor cyanide selectivity for gold over the enclosing sulfide
mineral matrix, such parasitic reactions inflict utility extra costs and profit losses resulting
from high levels of cyanide consumption and/or some side-reaction products which can
directly reduce the gold leaching rate. Consequently, gold processing has become more
complex and early mechanisms, as described by Elsner in simple cyanide solutions, cannot
be relied upon to anticipate the behavior of gold dissolution in the presence of metal
sulfides.
Since most of the sulfide minerals are endowed with significant electric conductivity
allowing charge transfer at their surface, galvanic interactions, by virtue of gold-sulfide
contacts, could substantially increase or decrease the leaching of gold in aerated cyanide
solutions. In principle when gold open circuit potential is lesser than that of sulfides, gold
anodic dissolution can be prompted (Aghamirian and Yen, 2005). Conversely, galvanic
phenomena can also impede gold dissolution when the adjoining sulfide mineral acquires
anodic potential prompting on gold surfaces oxygen reduction rather than gold dissolution
(Aghamirian and Yen, 2005). However, there is still some controversy regarding the role of
galvanic interactions on gold dissolution. Filmer (1982), Paul (1984) and Lorenzen and van
Deventer (1992) postulated that the presence of pyrite and pyrrhotite substantially
decreases gold leaching rate that they ascribed to galvanic effects. Aghamirian and Yen
(2005) and Dai and Jeffrey (2006) interrogated systematically the interrelation between
46
galvanic effects by some sulfides (i.e., pyrite, chalcopyrite, pyrrhotite, galena, chalcocite)
and the kinetics of gold leaching. Their findings concluded that pyrite, pyrrhotite and
galena induce positive galvanic interactions promoting gold dissolution when a gold
electrode was paired with one of those sulfides; unlike chalcopyrite and chalcocite for
which contradictory results were reported in the literature.
Meaningful comparisons of the findings among above studies are difficult to establish since
various experimental strategies were used by different authors. For example, Lorenzen and
van Deventer (1992) used a high-purity gold electrode that is now accepted to be highly
vulnerable to passivation (Jeffrey and Ritchie, 2000) and not representative of the naturally-
occurring gold/silver alloys. In the same study, while a correct approach was devised to
study macroscopic galvanic couples by pairing the gold and mineral electrodes first in one
cell and then in two separate cells, in contrast, the galvanic current and potential as a
function of time were not reported. In addition, no anodic and/or cathodic behaviors of
minerals were considered. In Aghamirian and Yen’s (2005) study, galvanic couples were
tested only in one single electrochemical cell unveiling only global outcomes on gold
leaching from combined galvanic interactions and surface passivation. In Dai and Jeffrey’s
work (2006), the galvanic current/potential conditions relating to the Au-minerals contacts
were barely detailed. In addition, in the majority of the relevant studies, indications about
the mineralogy of the studied minerals were seldom provided. For example, pyrite often
occurs naturally in association with other minor sulfides which, even if present in minute
quantities, tend to play an important role in shaping pyrite reactivity (Cruz et al., 2001) and
as a consequence in affecting the extent of galvanic interactions on gold leaching.
A number of sulfide minerals readily dissolve in aerated cyanide solutions making gold
cyanidation a process difficult to optimize. Hence, numerous investigations were carried
out to understand how the resulting dissolution products would interfere with gold leaching
(Hedley and Tabachnick, 1968; Liu and Yen, 1995; Deschenes et al., 1998; Guo et al.,
2005; Dai and Jeffrey, 2006; Breuer et al., 2008). It is generally accepted that sulfides
interfere with gold dissolution through: (1) excess cyanide and oxygen consumptions as a
result of transition metals (such as Cu, Fe and Zn) dissolution (Habashi, 1967), (2) gold
surface passivation by some reaction products such as Fe(OH)3 (Guo et al., 2005) or sulfur
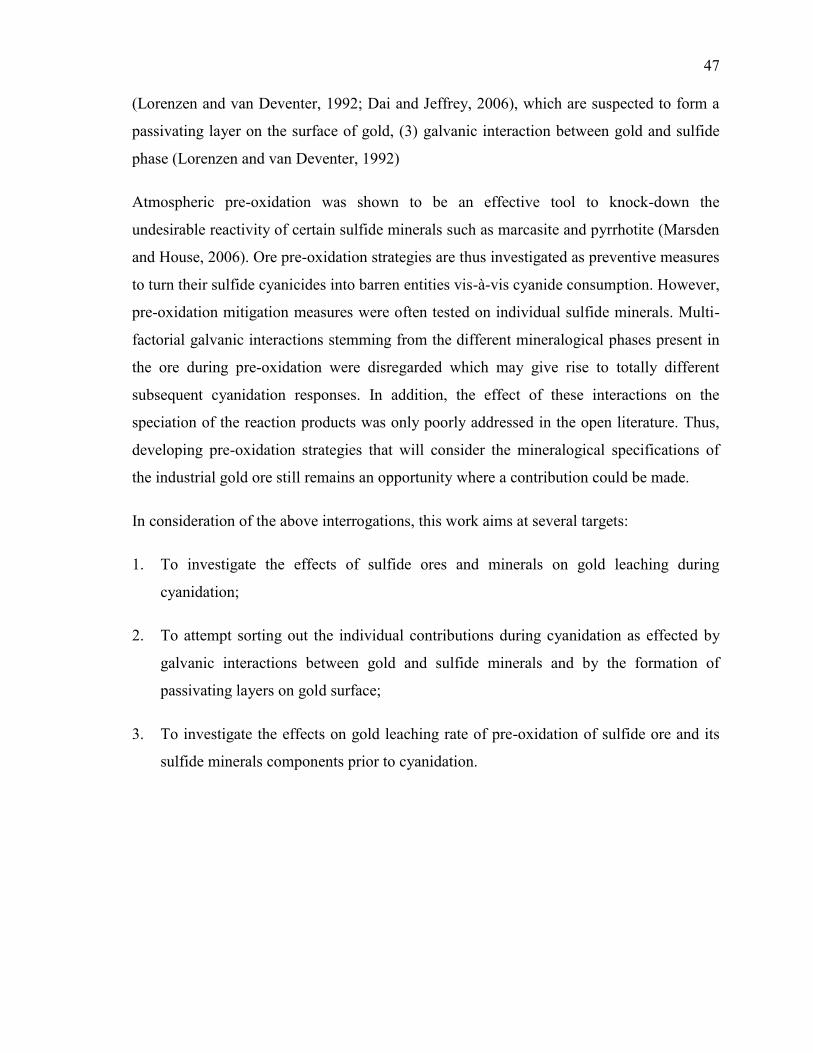
47
(Lorenzen and van Deventer, 1992; Dai and Jeffrey, 2006), which are suspected to form a
passivating layer on the surface of gold, (3) galvanic interaction between gold and sulfide
phase (Lorenzen and van Deventer, 1992)
Atmospheric pre-oxidation was shown to be an effective tool to knock-down the
undesirable reactivity of certain sulfide minerals such as marcasite and pyrrhotite (Marsden
and House, 2006). Ore pre-oxidation strategies are thus investigated as preventive measures
to turn their sulfide cyanicides into barren entities vis-à-vis cyanide consumption. However,
pre-oxidation mitigation measures were often tested on individual sulfide minerals. Multi-
factorial galvanic interactions stemming from the different mineralogical phases present in
the ore during pre-oxidation were disregarded which may give rise to totally different
subsequent cyanidation responses. In addition, the effect of these interactions on the
speciation of the reaction products was only poorly addressed in the open literature. Thus,
developing pre-oxidation strategies that will consider the mineralogical specifications of
the industrial gold ore still remains an opportunity where a contribution could be made.
In consideration of the above interrogations, this work aims at several targets:
1. To investigate the effects of sulfide ores and minerals on gold leaching during
cyanidation;
2. To attempt sorting out the individual contributions during cyanidation as effected by
galvanic interactions between gold and sulfide minerals and by the formation of
passivating layers on gold surface;
3. To investigate the effects on gold leaching rate of pre-oxidation of sulfide ore and its
sulfide minerals components prior to cyanidation.
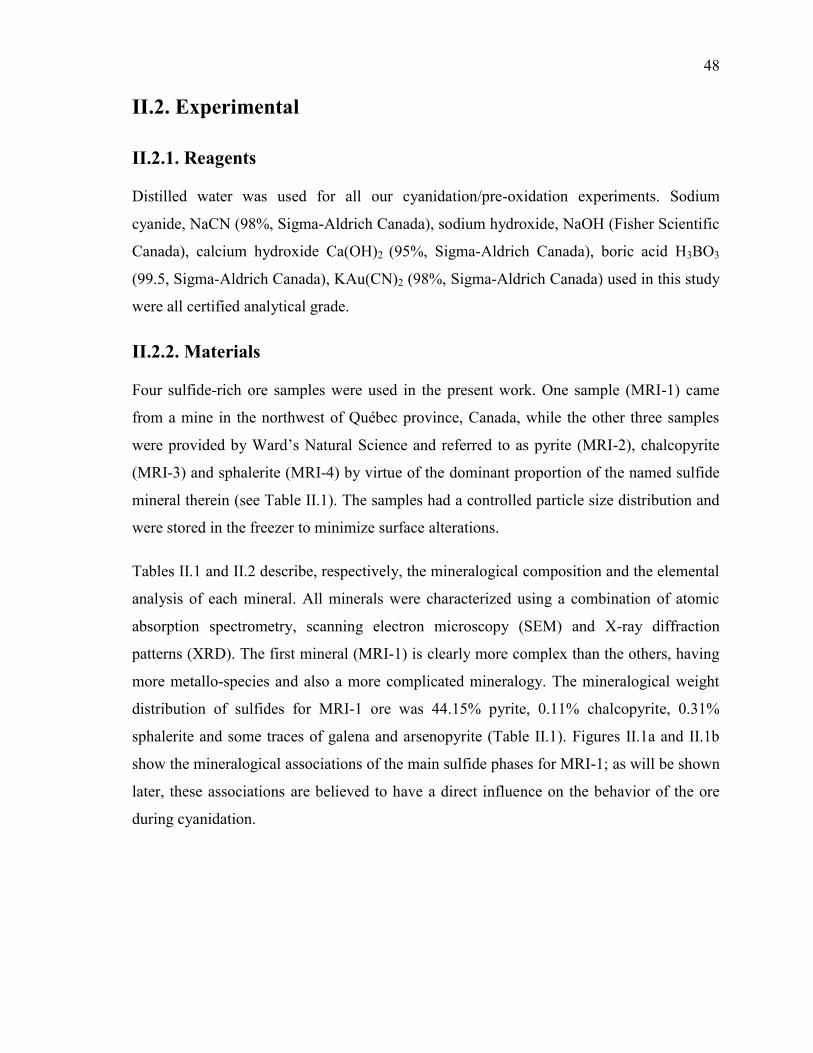
48
II.2. Experimental
II.2.1. Reagents
Distilled water was used for all our cyanidation/pre-oxidation experiments. Sodium
cyanide, NaCN (98%, Sigma-Aldrich Canada), sodium hydroxide, NaOH (Fisher Scientific
Canada), calcium hydroxide Ca(OH)2 (95%, Sigma-Aldrich Canada), boric acid H3BO3
(99.5, Sigma-Aldrich Canada), KAu(CN)2 (98%, Sigma-Aldrich Canada) used in this study
were all certified analytical grade.
II.2.2. Materials
Four sulfide-rich ore samples were used in the present work. One sample (MRI-1) came
from a mine in the northwest of Québec province, Canada, while the other three samples
were provided by Ward’s Natural Science and referred to as pyrite (MRI-2), chalcopyrite
(MRI-3) and sphalerite (MRI-4) by virtue of the dominant proportion of the named sulfide
mineral therein (see Table II.1). The samples had a controlled particle size distribution and
were stored in the freezer to minimize surface alterations.
Tables II.1 and II.2 describe, respectively, the mineralogical composition and the elemental
analysis of each mineral. All minerals were characterized using a combination of atomic
absorption spectrometry, scanning electron microscopy (SEM) and X-ray diffraction
patterns (XRD). The first mineral (MRI-1) is clearly more complex than the others, having
more metallo-species and also a more complicated mineralogy. The mineralogical weight
distribution of sulfides for MRI-1 ore was 44.15% pyrite, 0.11% chalcopyrite, 0.31%
sphalerite and some traces of galena and arsenopyrite (Table II.1). Figures II.1a and II.1b
show the mineralogical associations of the main sulfide phases for MRI-1; as will be shown
later, these associations are believed to have a direct influence on the behavior of the ore
during cyanidation.
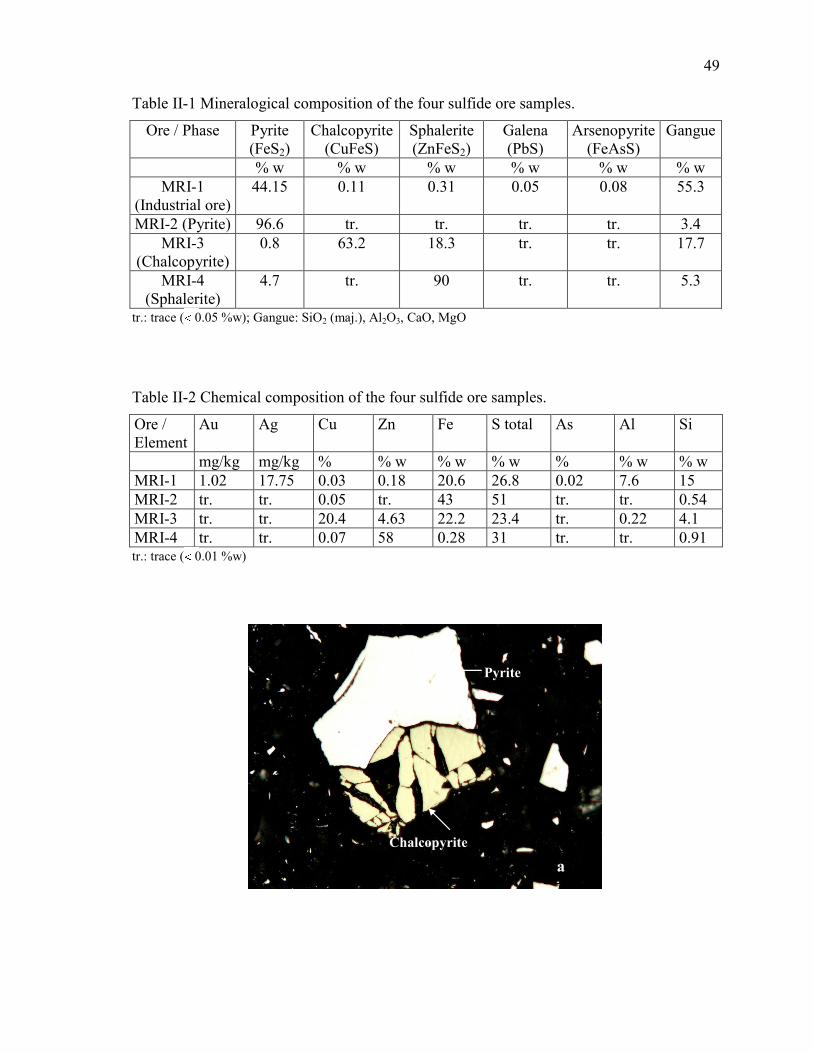
49
Table II-1 Mineralogical composition of the four sulfide ore samples.
Ore / Phase Pyrite
(FeS2)
Chalcopyrite
(CuFeS)
Sphalerite
(ZnFeS2)
Galena
(PbS)
Arsenopyrite
(FeAsS)
Gangue
% w % w % w % w % w % w
MRI-1
(Industrial ore)
44.15 0.11 0.31 0.05 0.08 55.3
MRI-2 (Pyrite) 96.6 tr. tr. tr. tr. 3.4
MRI-3
(Chalcopyrite)
0.8 63.2 18.3 tr. tr. 17.7
MRI-4
(Sphalerite)
4.7 tr. 90 tr. tr. 5.3
tr.: trace ( 0.05 %w); Gangue: SiO2 (maj.), Al2O3, CaO, MgO
Table II-2 Chemical composition of the four sulfide ore samples.
Ore /
Element
Au Ag Cu Zn Fe S total As Al Si
mg/kg mg/kg % % w % w % w % % w % w
MRI-1 1.02 17.75 0.03 0.18 20.6 26.8 0.02 7.6 15
MRI-2 tr. tr. 0.05 tr. 43 51 tr. tr. 0.54
MRI-3 tr. tr. 20.4 4.63 22.2 23.4 tr. 0.22 4.1
MRI-4 tr. tr. 0.07 58 0.28 31 tr. tr. 0.91 tr.: trace ( 0.01 %w)
a
Pyrite
Chalcopyrite
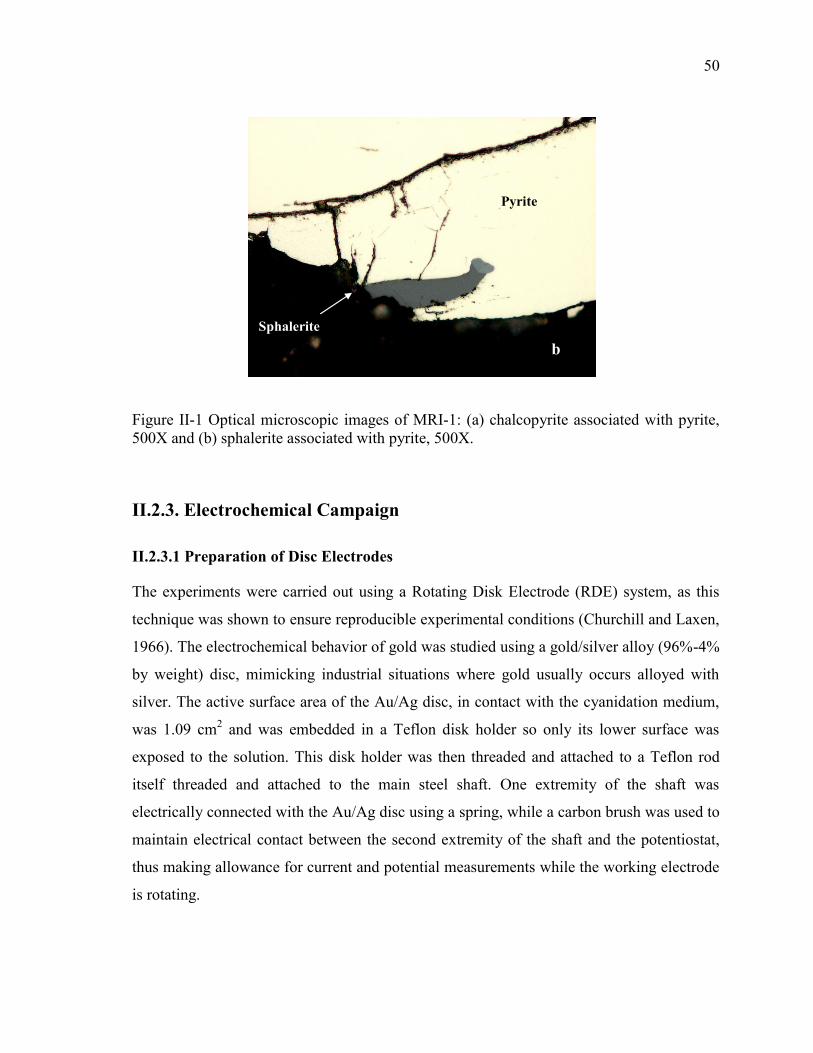
50
Sphalerite
Pyrite
b
Figure II-1 Optical microscopic images of MRI-1: (a) chalcopyrite associated with pyrite,
500X and (b) sphalerite associated with pyrite, 500X.
II.2.3. Electrochemical Campaign
II.2.3.1 Preparation of Disc Electrodes
The experiments were carried out using a Rotating Disk Electrode (RDE) system, as this
technique was shown to ensure reproducible experimental conditions (Churchill and Laxen,
1966). The electrochemical behavior of gold was studied using a gold/silver alloy (96%-4%
by weight) disc, mimicking industrial situations where gold usually occurs alloyed with
silver. The active surface area of the Au/Ag disc, in contact with the cyanidation medium,
was 1.09 cm2 and was embedded in a Teflon disk holder so only its lower surface was
exposed to the solution. This disk holder was then threaded and attached to a Teflon rod
itself threaded and attached to the main steel shaft. One extremity of the shaft was
electrically connected with the Au/Ag disc using a spring, while a carbon brush was used to
maintain electrical contact between the second extremity of the shaft and the potentiostat,
thus making allowance for current and potential measurements while the working electrode
is rotating.
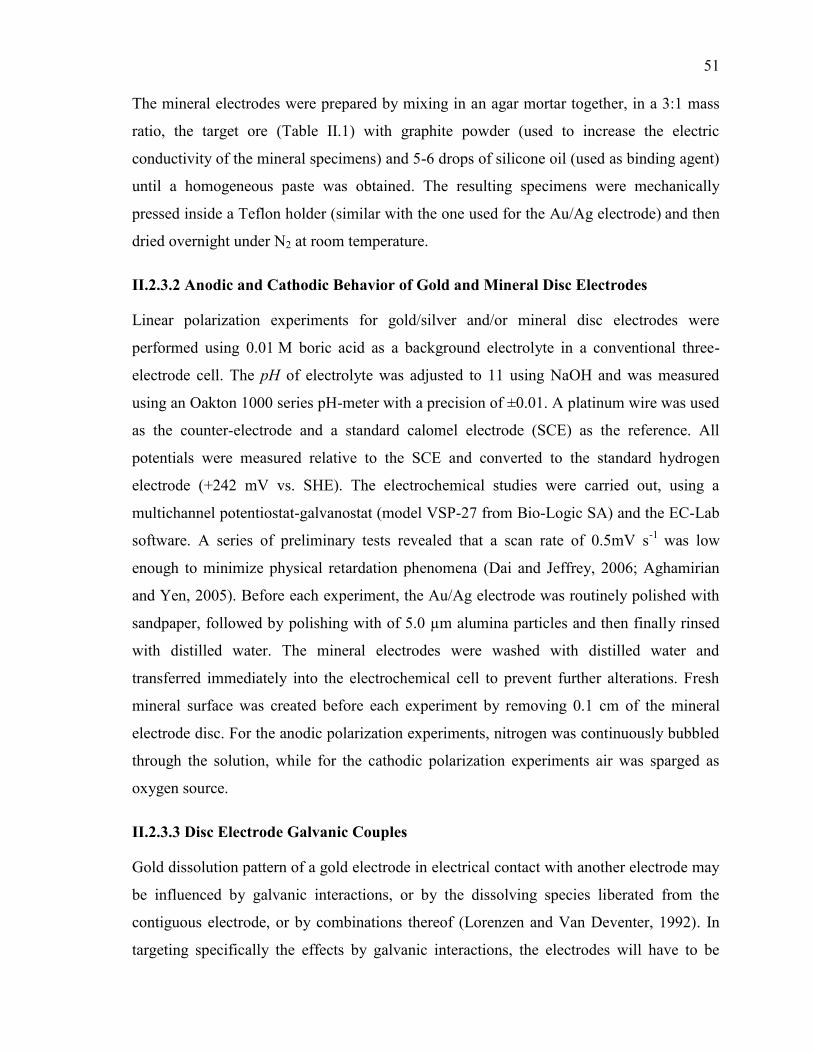
51
The mineral electrodes were prepared by mixing in an agar mortar together, in a 3:1 mass
ratio, the target ore (Table II.1) with graphite powder (used to increase the electric
conductivity of the mineral specimens) and 5-6 drops of silicone oil (used as binding agent)
until a homogeneous paste was obtained. The resulting specimens were mechanically
pressed inside a Teflon holder (similar with the one used for the Au/Ag electrode) and then
dried overnight under N2 at room temperature.
II.2.3.2 Anodic and Cathodic Behavior of Gold and Mineral Disc Electrodes
Linear polarization experiments for gold/silver and/or mineral disc electrodes were
performed using 0.01 M boric acid as a background electrolyte in a conventional three-
electrode cell. The pH of electrolyte was adjusted to 11 using NaOH and was measured
using an Oakton 1000 series pH-meter with a precision of ±0.01. A platinum wire was used
as the counter-electrode and a standard calomel electrode (SCE) as the reference. All
potentials were measured relative to the SCE and converted to the standard hydrogen
electrode (+242 mV vs. SHE). The electrochemical studies were carried out, using a
multichannel potentiostat-galvanostat (model VSP-27 from Bio-Logic SA) and the EC-Lab
software. A series of preliminary tests revealed that a scan rate of 0.5mV s-1
was low
enough to minimize physical retardation phenomena (Dai and Jeffrey, 2006; Aghamirian
and Yen, 2005). Before each experiment, the Au/Ag electrode was routinely polished with
sandpaper, followed by polishing with of 5.0 µm alumina particles and then finally rinsed
with distilled water. The mineral electrodes were washed with distilled water and
transferred immediately into the electrochemical cell to prevent further alterations. Fresh
mineral surface was created before each experiment by removing 0.1 cm of the mineral
electrode disc. For the anodic polarization experiments, nitrogen was continuously bubbled
through the solution, while for the cathodic polarization experiments air was sparged as
oxygen source.
II.2.3.3 Disc Electrode Galvanic Couples
Gold dissolution pattern of a gold electrode in electrical contact with another electrode may
be influenced by galvanic interactions, or by the dissolving species liberated from the
contiguous electrode, or by combinations thereof (Lorenzen and Van Deventer, 1992). In
targeting specifically the effects by galvanic interactions, the electrodes will have to be
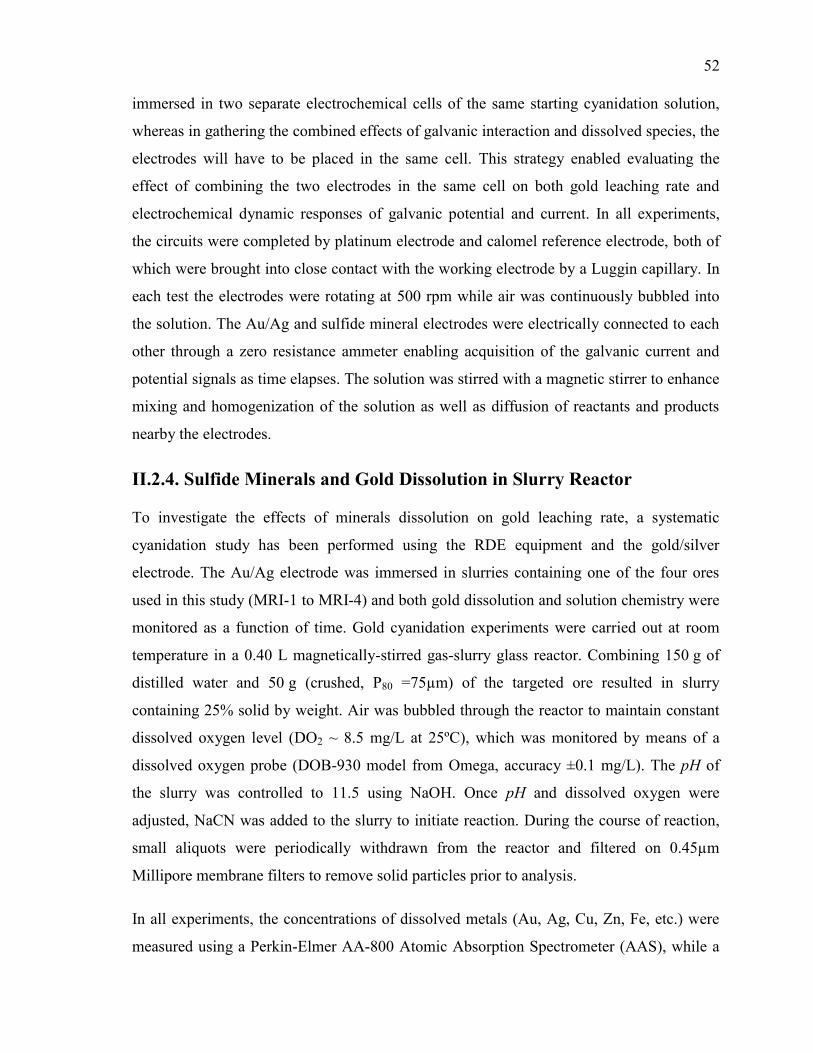
52
immersed in two separate electrochemical cells of the same starting cyanidation solution,
whereas in gathering the combined effects of galvanic interaction and dissolved species, the
electrodes will have to be placed in the same cell. This strategy enabled evaluating the
effect of combining the two electrodes in the same cell on both gold leaching rate and
electrochemical dynamic responses of galvanic potential and current. In all experiments,
the circuits were completed by platinum electrode and calomel reference electrode, both of
which were brought into close contact with the working electrode by a Luggin capillary. In
each test the electrodes were rotating at 500 rpm while air was continuously bubbled into
the solution. The Au/Ag and sulfide mineral electrodes were electrically connected to each
other through a zero resistance ammeter enabling acquisition of the galvanic current and
potential signals as time elapses. The solution was stirred with a magnetic stirrer to enhance
mixing and homogenization of the solution as well as diffusion of reactants and products
nearby the electrodes.
II.2.4. Sulfide Minerals and Gold Dissolution in Slurry Reactor
To investigate the effects of minerals dissolution on gold leaching rate, a systematic
cyanidation study has been performed using the RDE equipment and the gold/silver
electrode. The Au/Ag electrode was immersed in slurries containing one of the four ores
used in this study (MRI-1 to MRI-4) and both gold dissolution and solution chemistry were
monitored as a function of time. Gold cyanidation experiments were carried out at room
temperature in a 0.40 L magnetically-stirred gas-slurry glass reactor. Combining 150 g of
distilled water and 50 g (crushed, P80 =75µm) of the targeted ore resulted in slurry
containing 25% solid by weight. Air was bubbled through the reactor to maintain constant
dissolved oxygen level (DO2 ~ 8.5 mg/L at 25ºC), which was monitored by means of a
dissolved oxygen probe (DOB-930 model from Omega, accuracy ±0.1 mg/L). The pH of
the slurry was controlled to 11.5 using NaOH. Once pH and dissolved oxygen were
adjusted, NaCN was added to the slurry to initiate reaction. During the course of reaction,
small aliquots were periodically withdrawn from the reactor and filtered on 0.45µm
Millipore membrane filters to remove solid particles prior to analysis.
In all experiments, the concentrations of dissolved metals (Au, Ag, Cu, Zn, Fe, etc.) were
measured using a Perkin-Elmer AA-800 Atomic Absorption Spectrometer (AAS), while a
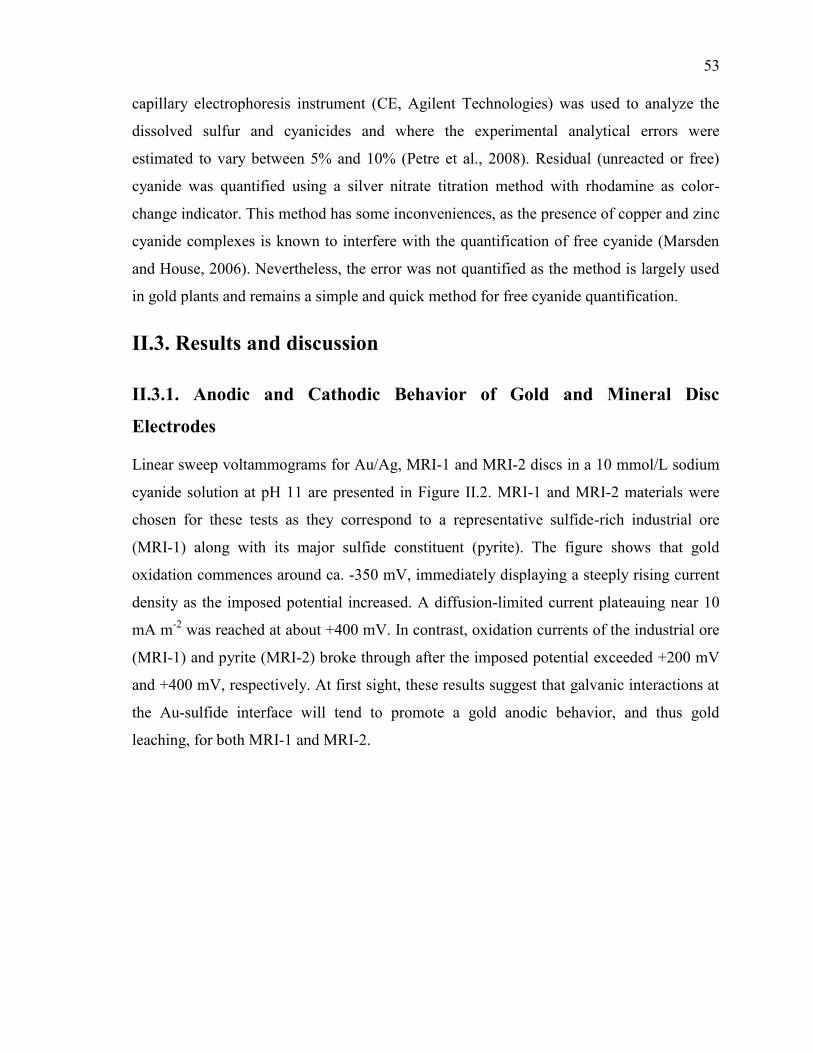
53
capillary electrophoresis instrument (CE, Agilent Technologies) was used to analyze the
dissolved sulfur and cyanicides and where the experimental analytical errors were
estimated to vary between 5% and 10% (Petre et al., 2008). Residual (unreacted or free)
cyanide was quantified using a silver nitrate titration method with rhodamine as color-
change indicator. This method has some inconveniences, as the presence of copper and zinc
cyanide complexes is known to interfere with the quantification of free cyanide (Marsden
and House, 2006). Nevertheless, the error was not quantified as the method is largely used
in gold plants and remains a simple and quick method for free cyanide quantification.
II.3. Results and discussion
II.3.1. Anodic and Cathodic Behavior of Gold and Mineral Disc
Electrodes
Linear sweep voltammograms for Au/Ag, MRI-1 and MRI-2 discs in a 10 mmol/L sodium
cyanide solution at pH 11 are presented in Figure II.2. MRI-1 and MRI-2 materials were
chosen for these tests as they correspond to a representative sulfide-rich industrial ore
(MRI-1) along with its major sulfide constituent (pyrite). The figure shows that gold
oxidation commences around ca. -350 mV, immediately displaying a steeply rising current
density as the imposed potential increased. A diffusion-limited current plateauing near 10
mA m-2
was reached at about +400 mV. In contrast, oxidation currents of the industrial ore
(MRI-1) and pyrite (MRI-2) broke through after the imposed potential exceeded +200 mV
and +400 mV, respectively. At first sight, these results suggest that galvanic interactions at
the Au-sulfide interface will tend to promote a gold anodic behavior, and thus gold
leaching, for both MRI-1 and MRI-2.
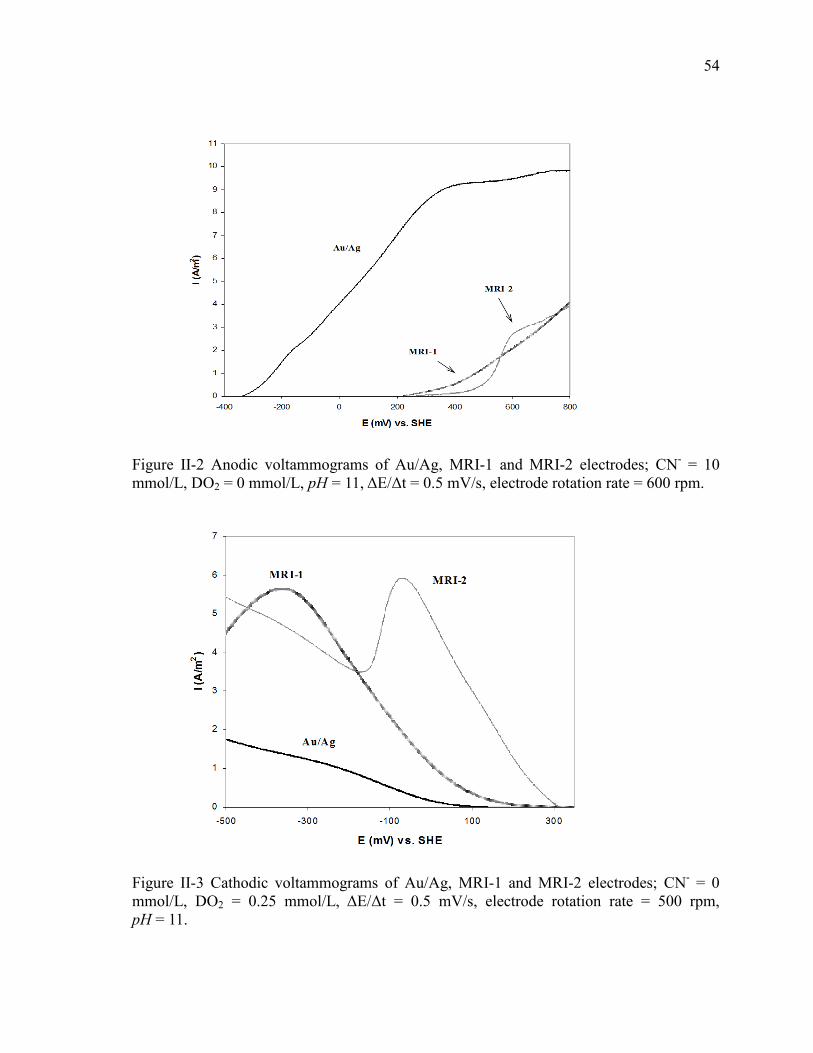
54
Figure II-2 Anodic voltammograms of Au/Ag, MRI-1 and MRI-2 electrodes; CN- = 10
mmol/L, DO2 = 0 mmol/L, pH = 11, ΔE/Δt = 0.5 mV/s, electrode rotation rate = 600 rpm.
Figure II-3 Cathodic voltammograms of Au/Ag, MRI-1 and MRI-2 electrodes; CN- = 0
mmol/L, DO2 = 0.25 mmol/L, ΔE/Δt = 0.5 mV/s, electrode rotation rate = 500 rpm,
pH = 11.
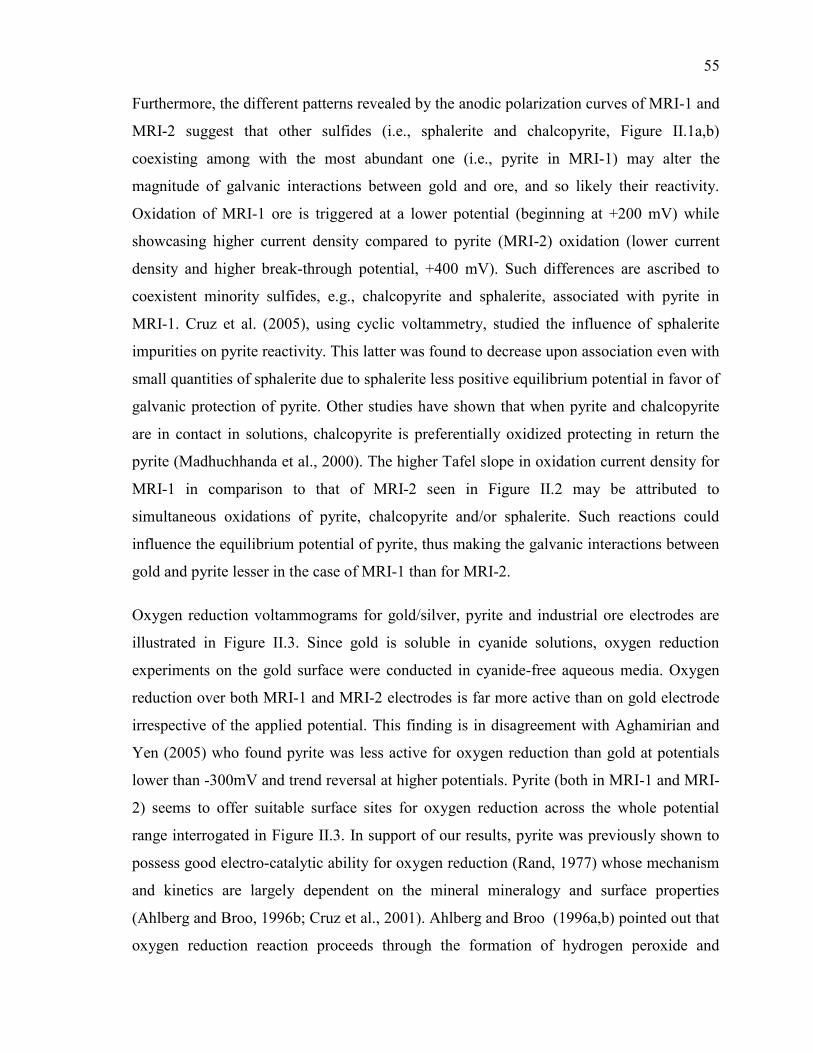
55
Furthermore, the different patterns revealed by the anodic polarization curves of MRI-1 and
MRI-2 suggest that other sulfides (i.e., sphalerite and chalcopyrite, Figure II.1a,b)
coexisting among with the most abundant one (i.e., pyrite in MRI-1) may alter the
magnitude of galvanic interactions between gold and ore, and so likely their reactivity.
Oxidation of MRI-1 ore is triggered at a lower potential (beginning at +200 mV) while
showcasing higher current density compared to pyrite (MRI-2) oxidation (lower current
density and higher break-through potential, +400 mV). Such differences are ascribed to
coexistent minority sulfides, e.g., chalcopyrite and sphalerite, associated with pyrite in
MRI-1. Cruz et al. (2005), using cyclic voltammetry, studied the influence of sphalerite
impurities on pyrite reactivity. This latter was found to decrease upon association even with
small quantities of sphalerite due to sphalerite less positive equilibrium potential in favor of
galvanic protection of pyrite. Other studies have shown that when pyrite and chalcopyrite
are in contact in solutions, chalcopyrite is preferentially oxidized protecting in return the
pyrite (Madhuchhanda et al., 2000). The higher Tafel slope in oxidation current density for
MRI-1 in comparison to that of MRI-2 seen in Figure II.2 may be attributed to
simultaneous oxidations of pyrite, chalcopyrite and/or sphalerite. Such reactions could
influence the equilibrium potential of pyrite, thus making the galvanic interactions between
gold and pyrite lesser in the case of MRI-1 than for MRI-2.
Oxygen reduction voltammograms for gold/silver, pyrite and industrial ore electrodes are
illustrated in Figure II.3. Since gold is soluble in cyanide solutions, oxygen reduction
experiments on the gold surface were conducted in cyanide-free aqueous media. Oxygen
reduction over both MRI-1 and MRI-2 electrodes is far more active than on gold electrode
irrespective of the applied potential. This finding is in disagreement with Aghamirian and
Yen (2005) who found pyrite was less active for oxygen reduction than gold at potentials
lower than -300mV and trend reversal at higher potentials. Pyrite (both in MRI-1 and MRI-
2) seems to offer suitable surface sites for oxygen reduction across the whole potential
range interrogated in Figure II.3. In support of our results, pyrite was previously shown to
possess good electro-catalytic ability for oxygen reduction (Rand, 1977) whose mechanism
and kinetics are largely dependent on the mineral mineralogy and surface properties
(Ahlberg and Broo, 1996b; Cruz et al., 2001). Ahlberg and Broo (1996a,b) pointed out that
oxygen reduction reaction proceeds through the formation of hydrogen peroxide and
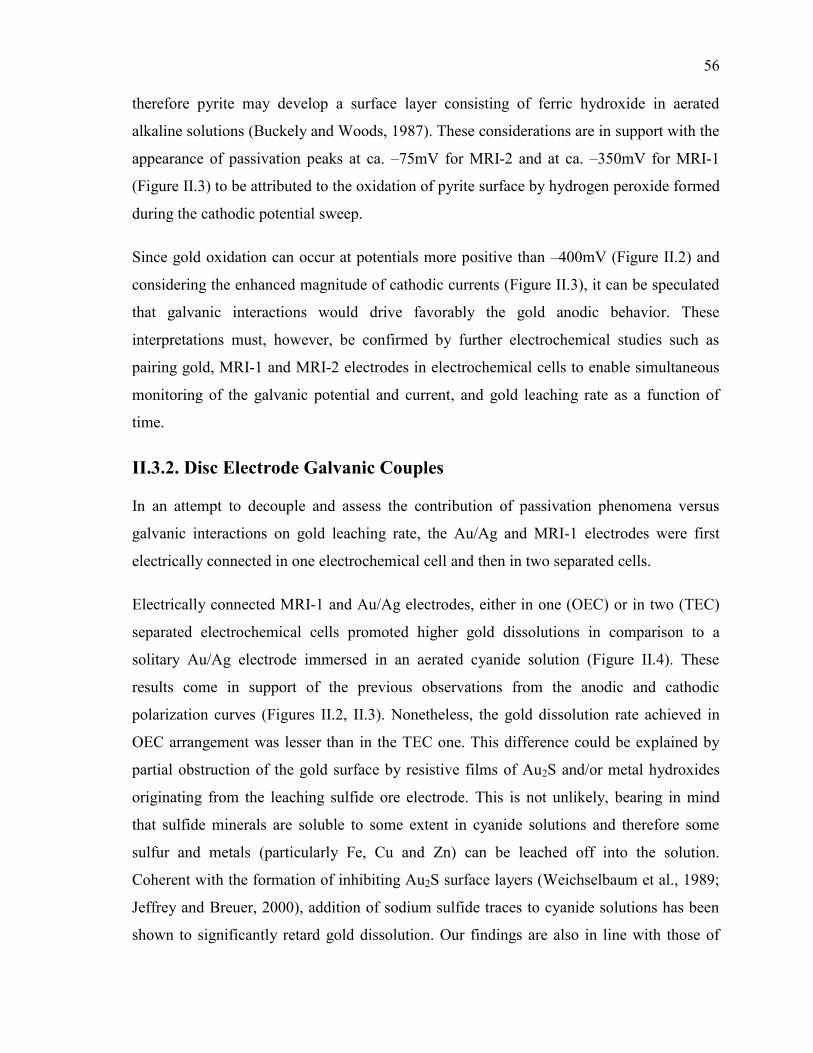
56
therefore pyrite may develop a surface layer consisting of ferric hydroxide in aerated
alkaline solutions (Buckely and Woods, 1987). These considerations are in support with the
appearance of passivation peaks at ca. –75mV for MRI-2 and at ca. –350mV for MRI-1
(Figure II.3) to be attributed to the oxidation of pyrite surface by hydrogen peroxide formed
during the cathodic potential sweep.
Since gold oxidation can occur at potentials more positive than –400mV (Figure II.2) and
considering the enhanced magnitude of cathodic currents (Figure II.3), it can be speculated
that galvanic interactions would drive favorably the gold anodic behavior. These
interpretations must, however, be confirmed by further electrochemical studies such as
pairing gold, MRI-1 and MRI-2 electrodes in electrochemical cells to enable simultaneous
monitoring of the galvanic potential and current, and gold leaching rate as a function of
time.
II.3.2. Disc Electrode Galvanic Couples
In an attempt to decouple and assess the contribution of passivation phenomena versus
galvanic interactions on gold leaching rate, the Au/Ag and MRI-1 electrodes were first
electrically connected in one electrochemical cell and then in two separated cells.
Electrically connected MRI-1 and Au/Ag electrodes, either in one (OEC) or in two (TEC)
separated electrochemical cells promoted higher gold dissolutions in comparison to a
solitary Au/Ag electrode immersed in an aerated cyanide solution (Figure II.4). These
results come in support of the previous observations from the anodic and cathodic
polarization curves (Figures II.2, II.3). Nonetheless, the gold dissolution rate achieved in
OEC arrangement was lesser than in the TEC one. This difference could be explained by
partial obstruction of the gold surface by resistive films of Au2S and/or metal hydroxides
originating from the leaching sulfide ore electrode. This is not unlikely, bearing in mind
that sulfide minerals are soluble to some extent in cyanide solutions and therefore some
sulfur and metals (particularly Fe, Cu and Zn) can be leached off into the solution.
Coherent with the formation of inhibiting Au2S surface layers (Weichselbaum et al., 1989;
Jeffrey and Breuer, 2000), addition of sodium sulfide traces to cyanide solutions has been
shown to significantly retard gold dissolution. Our findings are also in line with those of
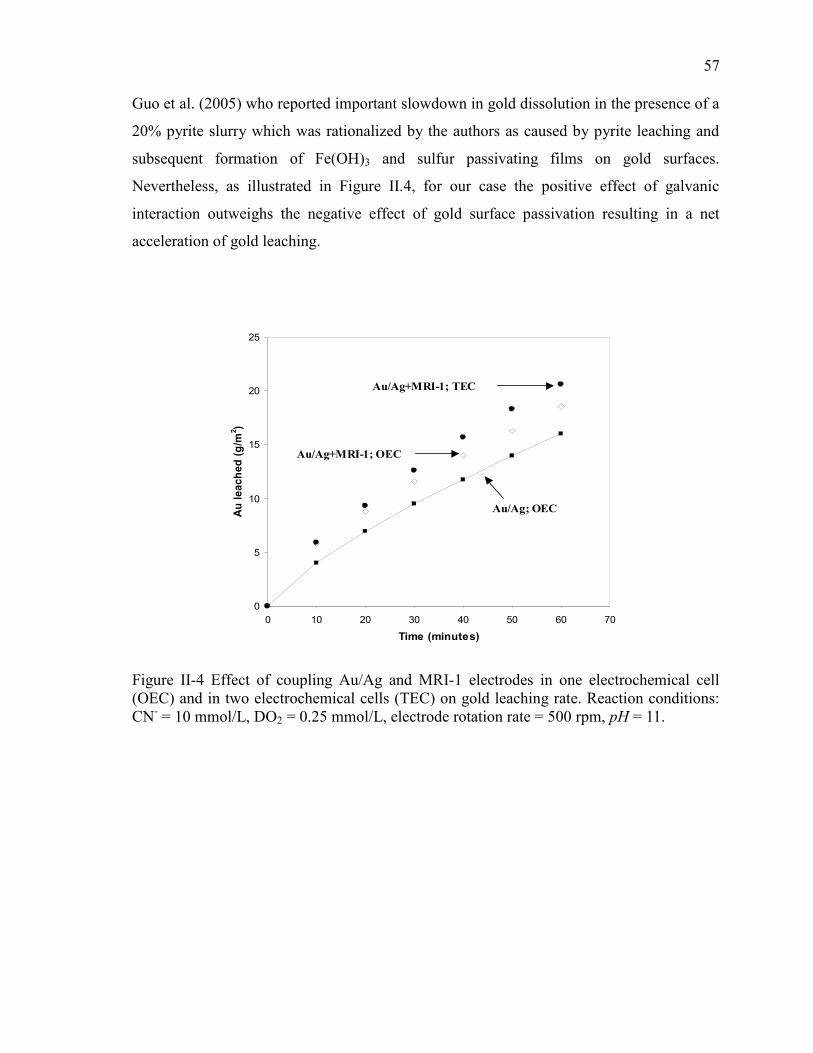
57
Guo et al. (2005) who reported important slowdown in gold dissolution in the presence of a
20% pyrite slurry which was rationalized by the authors as caused by pyrite leaching and
subsequent formation of Fe(OH)3 and sulfur passivating films on gold surfaces.
Nevertheless, as illustrated in Figure II.4, for our case the positive effect of galvanic
interaction outweighs the negative effect of gold surface passivation resulting in a net
acceleration of gold leaching.
Figure II-4 Effect of coupling Au/Ag and MRI-1 electrodes in one electrochemical cell
(OEC) and in two electrochemical cells (TEC) on gold leaching rate. Reaction conditions:
CN- = 10 mmol/L, DO2 = 0.25 mmol/L, electrode rotation rate = 500 rpm, pH = 11.
0
5
10
15
20
25
0 10 20 30 40 50 60 70
Time (minutes)
Au
le
ac
he
d (
g/m
2)
Au/Ag+MRI-1; OEC
Au/Ag+MRI-1; TEC
Au/Ag; OEC
0
5
10
15
20
25
0 10 20 30 40 50 60 70
Time (minutes)
Au
le
ac
he
d (
g/m
2)
Au/Ag+MRI-1; OEC
Au/Ag+MRI-1; TEC
Au/Ag; OEC
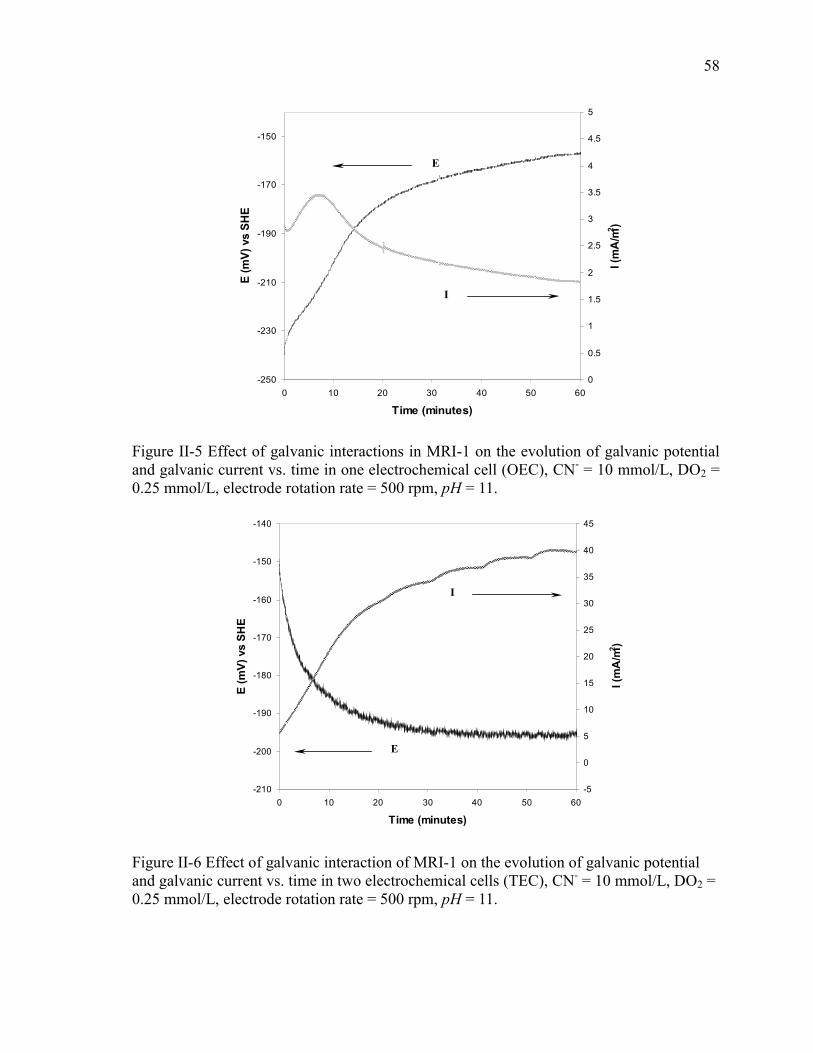
58
Figure II-5 Effect of galvanic interactions in MRI-1 on the evolution of galvanic potential
and galvanic current vs. time in one electrochemical cell (OEC), CN- = 10 mmol/L, DO2 =
0.25 mmol/L, electrode rotation rate = 500 rpm, pH = 11.
Figure II-6 Effect of galvanic interaction of MRI-1 on the evolution of galvanic potential
and galvanic current vs. time in two electrochemical cells (TEC), CN- = 10 mmol/L, DO2 =
0.25 mmol/L, electrode rotation rate = 500 rpm, pH = 11.
-250
-230
-210
-190
-170
-150
0 10 20 30 40 50 60
Time (minutes)
E (
mV
) vs S
HE
0
0.5
1
1.5
2
2.5
3
3.5
4
4.5
5
I (m
A/m
2)
E
I
-250
-230
-210
-190
-170
-150
0 10 20 30 40 50 60
Time (minutes)
E (
mV
) vs S
HE
0
0.5
1
1.5
2
2.5
3
3.5
4
4.5
5
I (m
A/m
2)
E
I
-210
-200
-190
-180
-170
-160
-150
-140
0 10 20 30 40 50 60
Time (minutes)
E (
mV
) vs S
HE
-5
0
5
10
15
20
25
30
35
40
45
I (m
A/m
2)
E
I
-210
-200
-190
-180
-170
-160
-150
-140
0 10 20 30 40 50 60
Time (minutes)
E (
mV
) vs S
HE
-5
0
5
10
15
20
25
30
35
40
45
I (m
A/m
2)
E
I
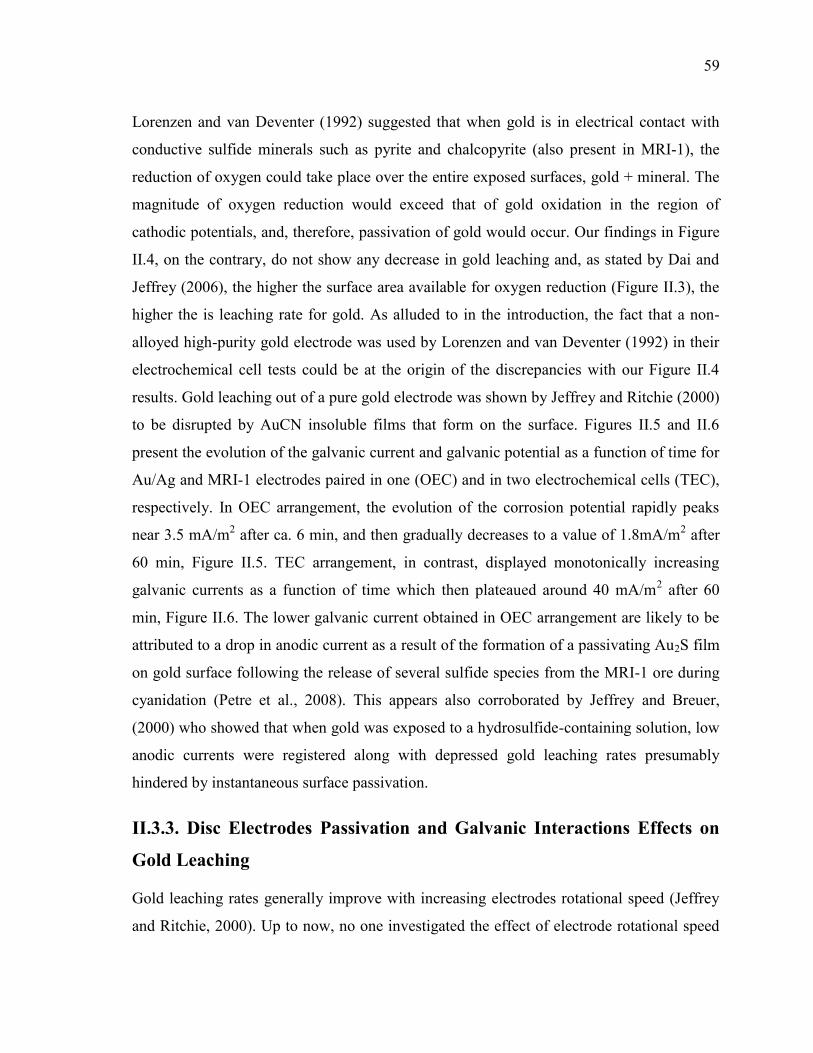
59
Lorenzen and van Deventer (1992) suggested that when gold is in electrical contact with
conductive sulfide minerals such as pyrite and chalcopyrite (also present in MRI-1), the
reduction of oxygen could take place over the entire exposed surfaces, gold + mineral. The
magnitude of oxygen reduction would exceed that of gold oxidation in the region of
cathodic potentials, and, therefore, passivation of gold would occur. Our findings in Figure
II.4, on the contrary, do not show any decrease in gold leaching and, as stated by Dai and
Jeffrey (2006), the higher the surface area available for oxygen reduction (Figure II.3), the
higher the is leaching rate for gold. As alluded to in the introduction, the fact that a non-
alloyed high-purity gold electrode was used by Lorenzen and van Deventer (1992) in their
electrochemical cell tests could be at the origin of the discrepancies with our Figure II.4
results. Gold leaching out of a pure gold electrode was shown by Jeffrey and Ritchie (2000)
to be disrupted by AuCN insoluble films that form on the surface. Figures II.5 and II.6
present the evolution of the galvanic current and galvanic potential as a function of time for
Au/Ag and MRI-1 electrodes paired in one (OEC) and in two electrochemical cells (TEC),
respectively. In OEC arrangement, the evolution of the corrosion potential rapidly peaks
near 3.5 mA/m2 after ca. 6 min, and then gradually decreases to a value of 1.8mA/m
2 after
60 min, Figure II.5. TEC arrangement, in contrast, displayed monotonically increasing
galvanic currents as a function of time which then plateaued around 40 mA/m2 after 60
min, Figure II.6. The lower galvanic current obtained in OEC arrangement are likely to be
attributed to a drop in anodic current as a result of the formation of a passivating Au2S film
on gold surface following the release of several sulfide species from the MRI-1 ore during
cyanidation (Petre et al., 2008). This appears also corroborated by Jeffrey and Breuer,
(2000) who showed that when gold was exposed to a hydrosulfide-containing solution, low
anodic currents were registered along with depressed gold leaching rates presumably
hindered by instantaneous surface passivation.
II.3.3. Disc Electrodes Passivation and Galvanic Interactions Effects on
Gold Leaching
Gold leaching rates generally improve with increasing electrodes rotational speed (Jeffrey
and Ritchie, 2000). Up to now, no one investigated the effect of electrode rotational speed
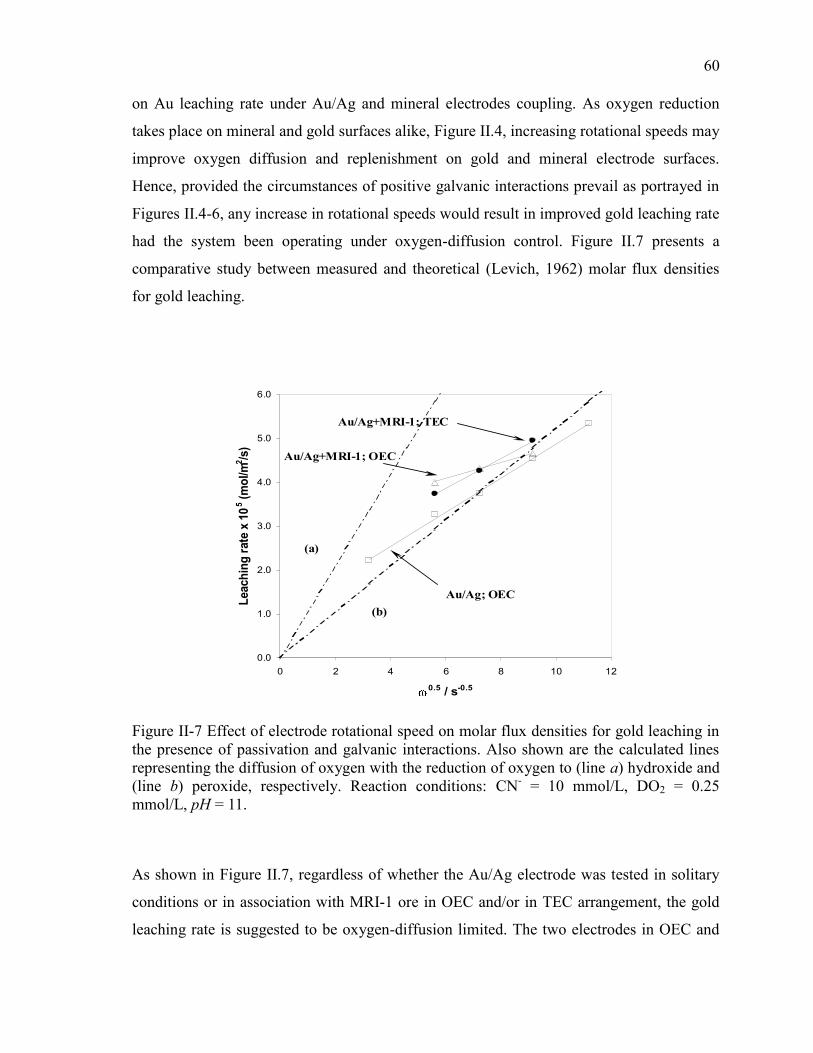
60
on Au leaching rate under Au/Ag and mineral electrodes coupling. As oxygen reduction
takes place on mineral and gold surfaces alike, Figure II.4, increasing rotational speeds may
improve oxygen diffusion and replenishment on gold and mineral electrode surfaces.
Hence, provided the circumstances of positive galvanic interactions prevail as portrayed in
Figures II.4-6, any increase in rotational speeds would result in improved gold leaching rate
had the system been operating under oxygen-diffusion control. Figure II.7 presents a
comparative study between measured and theoretical (Levich, 1962) molar flux densities
for gold leaching.
Figure II-7 Effect of electrode rotational speed on molar flux densities for gold leaching in
the presence of passivation and galvanic interactions. Also shown are the calculated lines
representing the diffusion of oxygen with the reduction of oxygen to (line a) hydroxide and
(line b) peroxide, respectively. Reaction conditions: CN- = 10 mmol/L, DO2 = 0.25
mmol/L, pH = 11.
As shown in Figure II.7, regardless of whether the Au/Ag electrode was tested in solitary
conditions or in association with MRI-1 ore in OEC and/or in TEC arrangement, the gold
leaching rate is suggested to be oxygen-diffusion limited. The two electrodes in OEC and
0.0
1.0
2.0
3.0
4.0
5.0
6.0
0 2 4 6 8 10 12
0.5 / s-0.5
Leach
ing
rate
x 1
05 (
mo
l/m
2/s
)
Au/Ag+MRI-1; OEC
Au/Ag+MRI-1; TEC
(b)
Au/Ag; OEC
(a)
0.0
1.0
2.0
3.0
4.0
5.0
6.0
0 2 4 6 8 10 12
0.5 / s-0.5
Leach
ing
rate
x 1
05 (
mo
l/m
2/s
)
Au/Ag+MRI-1; OEC
Au/Ag+MRI-1; TEC
(b)
Au/Ag; OEC
(a)
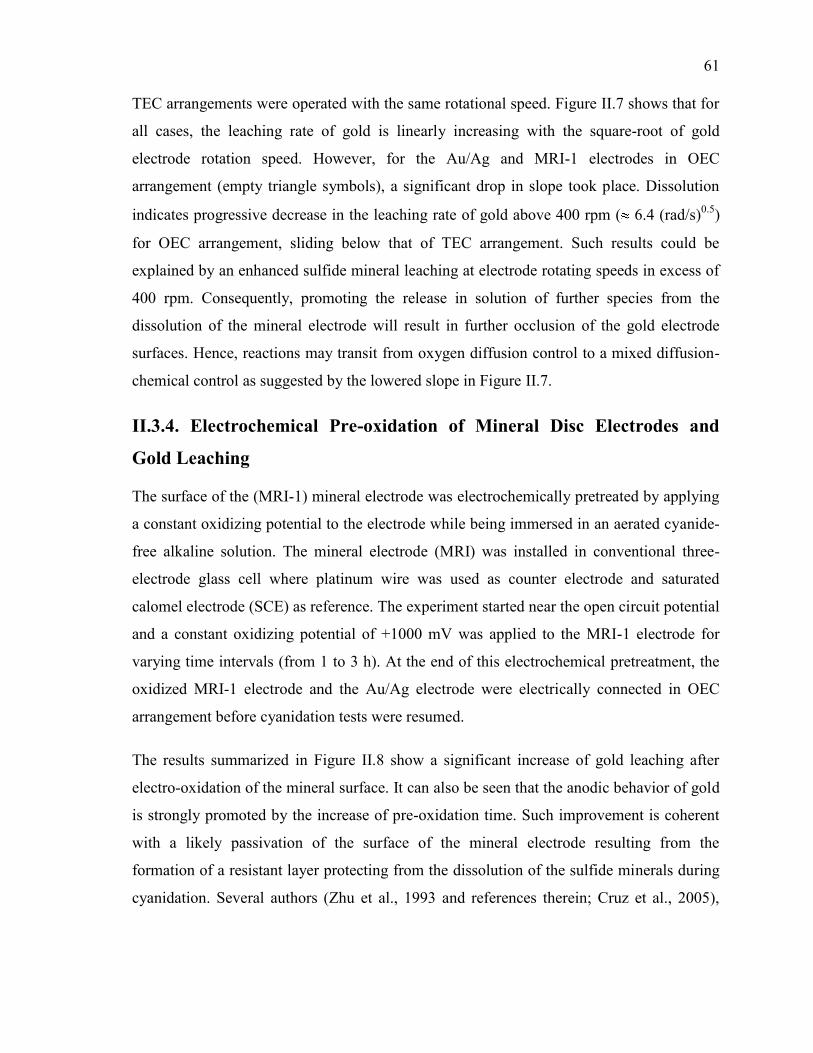
61
TEC arrangements were operated with the same rotational speed. Figure II.7 shows that for
all cases, the leaching rate of gold is linearly increasing with the square-root of gold
electrode rotation speed. However, for the Au/Ag and MRI-1 electrodes in OEC
arrangement (empty triangle symbols), a significant drop in slope took place. Dissolution
indicates progressive decrease in the leaching rate of gold above 400 rpm ( 6.4 (rad/s)0.5
)
for OEC arrangement, sliding below that of TEC arrangement. Such results could be
explained by an enhanced sulfide mineral leaching at electrode rotating speeds in excess of
400 rpm. Consequently, promoting the release in solution of further species from the
dissolution of the mineral electrode will result in further occlusion of the gold electrode
surfaces. Hence, reactions may transit from oxygen diffusion control to a mixed diffusion-
chemical control as suggested by the lowered slope in Figure II.7.
II.3.4. Electrochemical Pre-oxidation of Mineral Disc Electrodes and
Gold Leaching
The surface of the (MRI-1) mineral electrode was electrochemically pretreated by applying
a constant oxidizing potential to the electrode while being immersed in an aerated cyanide-
free alkaline solution. The mineral electrode (MRI) was installed in conventional three-
electrode glass cell where platinum wire was used as counter electrode and saturated
calomel electrode (SCE) as reference. The experiment started near the open circuit potential
and a constant oxidizing potential of +1000 mV was applied to the MRI-1 electrode for
varying time intervals (from 1 to 3 h). At the end of this electrochemical pretreatment, the
oxidized MRI-1 electrode and the Au/Ag electrode were electrically connected in OEC
arrangement before cyanidation tests were resumed.
The results summarized in Figure II.8 show a significant increase of gold leaching after
electro-oxidation of the mineral surface. It can also be seen that the anodic behavior of gold
is strongly promoted by the increase of pre-oxidation time. Such improvement is coherent
with a likely passivation of the surface of the mineral electrode resulting from the
formation of a resistant layer protecting from the dissolution of the sulfide minerals during
cyanidation. Several authors (Zhu et al., 1993 and references therein; Cruz et al., 2005),
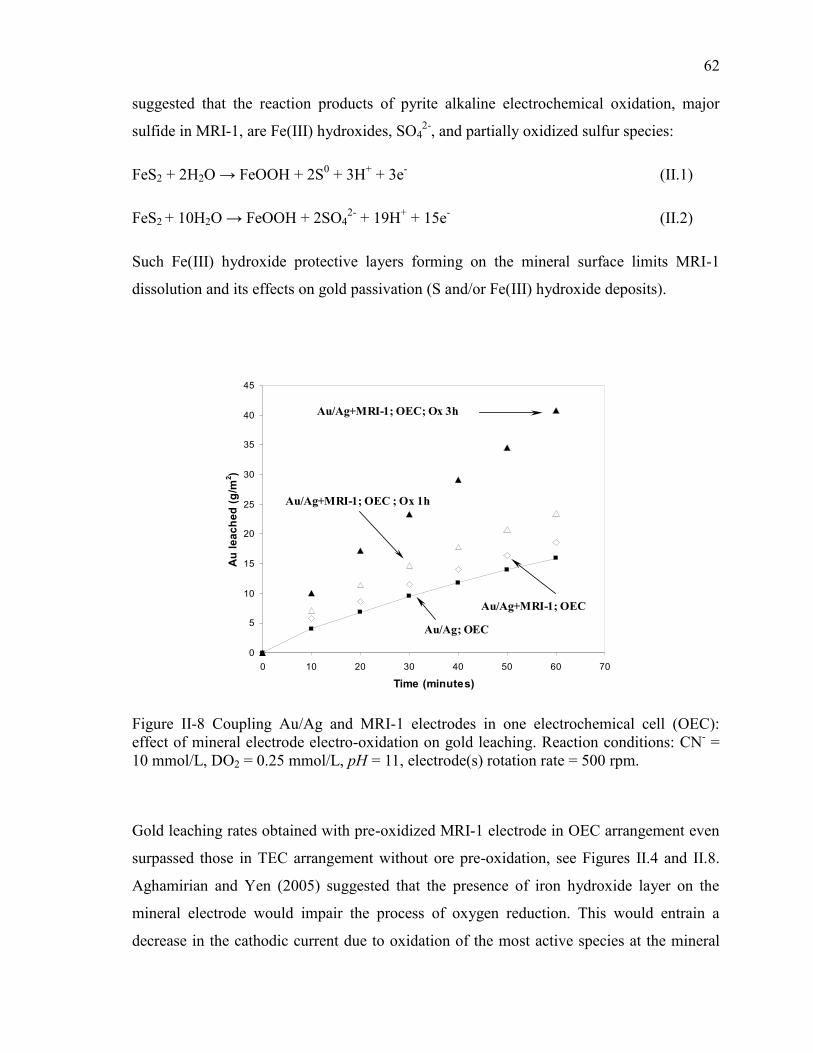
62
suggested that the reaction products of pyrite alkaline electrochemical oxidation, major
sulfide in MRI-1, are Fe(III) hydroxides, SO42-
, and partially oxidized sulfur species:
FeS2 + 2H2O → FeOOH + 2S0 + 3H
+ + 3e
- (II.1)
FeS2 + 10H2O → FeOOH + 2SO42-
+ 19H+ + 15e
- (II.2)
Such Fe(III) hydroxide protective layers forming on the mineral surface limits MRI-1
dissolution and its effects on gold passivation (S and/or Fe(III) hydroxide deposits).
Figure II-8 Coupling Au/Ag and MRI-1 electrodes in one electrochemical cell (OEC):
effect of mineral electrode electro-oxidation on gold leaching. Reaction conditions: CN- =
10 mmol/L, DO2 = 0.25 mmol/L, pH = 11, electrode(s) rotation rate = 500 rpm.
Gold leaching rates obtained with pre-oxidized MRI-1 electrode in OEC arrangement even
surpassed those in TEC arrangement without ore pre-oxidation, see Figures II.4 and II.8.
Aghamirian and Yen (2005) suggested that the presence of iron hydroxide layer on the
mineral electrode would impair the process of oxygen reduction. This would entrain a
decrease in the cathodic current due to oxidation of the most active species at the mineral
0
5
10
15
20
25
30
35
40
45
0 10 20 30 40 50 60 70
Time (minutes)
Au
le
ac
he
d (
g/m
2)
Au/Ag+MRI-1; OEC ; Ox 1h
Au/Ag+MRI-1; OEC; Ox 3h
Au/Ag; OEC
Au/Ag+MRI-1; OEC
0
5
10
15
20
25
30
35
40
45
0 10 20 30 40 50 60 70
Time (minutes)
Au
le
ac
he
d (
g/m
2)
Au/Ag+MRI-1; OEC ; Ox 1h
Au/Ag+MRI-1; OEC; Ox 3h
Au/Ag; OEC
Au/Ag+MRI-1; OEC
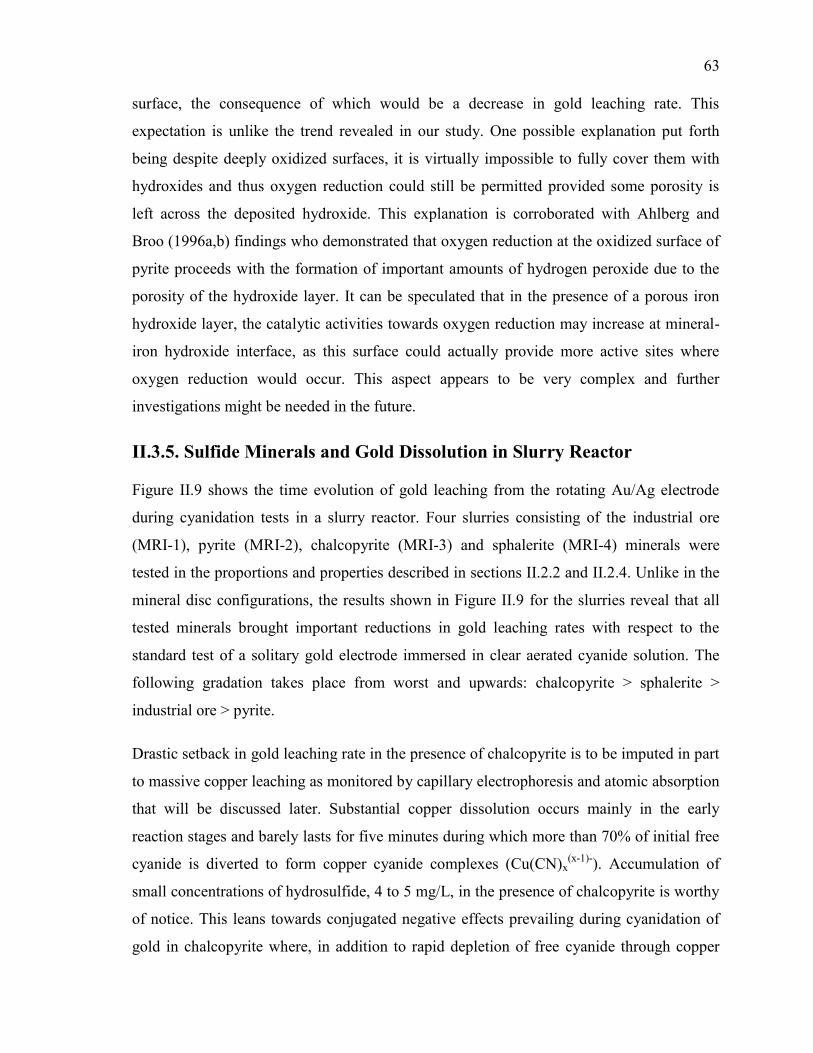
63
surface, the consequence of which would be a decrease in gold leaching rate. This
expectation is unlike the trend revealed in our study. One possible explanation put forth
being despite deeply oxidized surfaces, it is virtually impossible to fully cover them with
hydroxides and thus oxygen reduction could still be permitted provided some porosity is
left across the deposited hydroxide. This explanation is corroborated with Ahlberg and
Broo (1996a,b) findings who demonstrated that oxygen reduction at the oxidized surface of
pyrite proceeds with the formation of important amounts of hydrogen peroxide due to the
porosity of the hydroxide layer. It can be speculated that in the presence of a porous iron
hydroxide layer, the catalytic activities towards oxygen reduction may increase at mineral-
iron hydroxide interface, as this surface could actually provide more active sites where
oxygen reduction would occur. This aspect appears to be very complex and further
investigations might be needed in the future.
II.3.5. Sulfide Minerals and Gold Dissolution in Slurry Reactor
Figure II.9 shows the time evolution of gold leaching from the rotating Au/Ag electrode
during cyanidation tests in a slurry reactor. Four slurries consisting of the industrial ore
(MRI-1), pyrite (MRI-2), chalcopyrite (MRI-3) and sphalerite (MRI-4) minerals were
tested in the proportions and properties described in sections II.2.2 and II.2.4. Unlike in the
mineral disc configurations, the results shown in Figure II.9 for the slurries reveal that all
tested minerals brought important reductions in gold leaching rates with respect to the
standard test of a solitary gold electrode immersed in clear aerated cyanide solution. The
following gradation takes place from worst and upwards: chalcopyrite > sphalerite >
industrial ore > pyrite.
Drastic setback in gold leaching rate in the presence of chalcopyrite is to be imputed in part
to massive copper leaching as monitored by capillary electrophoresis and atomic absorption
that will be discussed later. Substantial copper dissolution occurs mainly in the early
reaction stages and barely lasts for five minutes during which more than 70% of initial free
cyanide is diverted to form copper cyanide complexes (Cu(CN)x(x-1)-
). Accumulation of
small concentrations of hydrosulfide, 4 to 5 mg/L, in the presence of chalcopyrite is worthy
of notice. This leans towards conjugated negative effects prevailing during cyanidation of
gold in chalcopyrite where, in addition to rapid depletion of free cyanide through copper
64
complexation, gold could also have been passivated as indicated by the presence of
hydrosulfide ions in the leaching solution in accordance with literature findings
(Weichselbaum et al., 1989; Jeffrey and Breuer, 2000).
0,0
5,0
10,0
15,0
20,0
25,0
0 10 20 30 40 50 60 70
Au
leach
ed
(g
/m2)
Au/Ag
Au/Ag-MRI-2
Au/Ag-MRI-1
Au/Ag-MRI-3
Au/Ag-MRI-4
Time (minutes)
Figure II-9 Effect of sulfide minerals on gold dissolution in slurry reactor: industrial ore
(MRI-1) and the equivalent of its major sulfide constituents (MRI-2, MRI-3 and MRI-4).
Reaction conditions CN- = 10 mM, DO2 = 0.25 mM, pH = 11, electrode rotation rate = 500
rpm.
Regarding gold leaching profiles for the tests with MRI-1 and MRI-2, a slight decline of
the dissolution rate was noted in the presence of MRI-1 ore in comparison with MRI-2
mineral. This reflects the inter-dependence between ore reactivity and its mineralogical
composition. Indeed, the measured concentrations of S2O32-
and SO42-
after 60 min of
cyanidation were, respectively, 13 mg/L and 512 mg/L for MRI-2, and 53 mg/L and 1000
mg/L for MRI-1. The galvanic effects between the main associated mineralogical phases
(pyrite, chalcopyrite and sphalerite) in the industrial ore speak for themselves where despite
a lesser content of total sulfur in MRI-1 (total sulfur = 26.8%w, Table II.2), more soluble
65
oxy-sulfur species were generated from MRI-1 comparatively to MRI-2 (total sulfur =
51%w, Table II.2).
On the contrary, more thiocyanate was generated (63 mg/L) from MRI-2 dissolution than
from MRI-1 (45 mg/L) with no hydrosulfide ions formation with both slurry materials.
Some studies reported that autogenous hydrosulfide produced in cyanide solutions in the 8-
12 pH range can be oxidized by O2 into polysulfides, thiocyanate, thiosulfate and sulfate
ions (Luthy and Bruce, 1979; Marsden and House, 2006; Bard and Startmann, 2006).
Recently, Breuer et al (2007, 2008) reported that pyrite is able to catalyze the oxidation of
dissolved sulfide ions via electron transfer from the sulfide ion to dissolved oxygen on the
pyrite surface, with polysulfides formed as intermediate oxidation products. Then,
polysulfides undergo homogeneous oxidation in the presence of cyanide to form mainly
thiocyanate, along with some thiosulfate and sulfite. This explanation is partially in
agreement with our results, as no hydrosulfide ions were detected while thiocyanate
concentration constantly increased with the increase of pyrite (MRI-2) cyanidation time
(data shown later). However, unlike Breuer et al (2007, 2008) findings, high sulfate
concentrations were detected whereas sulfite remained below instrumental detection limits.
The absence of sulfite in this study can be explained by its possible reaction with
polysulfides to form thiosulfate as explained by the same authors, Breuer et al. (2007,
2008).
Finally, the inhibiting effect on gold leaching rate of sphalerite (MRI-4) was found to be
more pronounced than for MRI-1 ore or MRI-2 mineral, Figure II.9. This result appears
odd in light of sphalerite low reactivity (Hedley and Tabachnik, 1968) in aerated cyanide
solutions as confirmed by the low amounts of produced SO42-
(20 mg/L) and SCN- (6
mg/L). Further investigations are needed to decipher the behavior of this mineral.
II.3.6. Alkaline Pre-oxidation of Sulfide Ores and Gold Leaching
The industrial gold ore (MRI-1) as well as the three mineral constituents (MRI-2, MRI-3
and MRI-4) were pre-oxidized prior to cyanidation tests. Room-temperature oxidative pre-
treatments were conducted by sparging, for varying periods of time, pure oxygen through
each of the designated slurries prior to cyanidation. Note that the Au/Ag electrode was not
66
immersed into the slurry. After pre-oxidation was completed, a sample aliquot was
withdrawn from the reactor for analysis to set the initial solution concentrations;
cyanidation was then initiated by immersing the Au/Ag electrode into the oxidized slurry.
A series of preliminary tests was carried out using MRI-1 to identify the optimal pre-
oxidation time. This optimal time corresponds to the duration that maximizes cyanidation
efficiency which is defined as the ratio of leached gold divided by the consumed free
cyanide. The optimal pre-oxidation time was found to be 4 h. Hence, high cyanidation
efficiency combines the highest gold leaching achievable for minimum cyanide
consumption. The benchmark gold leaching curve is the usual solitary Au/Ag electrode in a
clear O2-NaCN solution and is shown in Figures II.10a to II.13a as filled diamond symbols.
The most remarkable pre-oxidation effects are obtained with the industrial ore (MRI-1,
Figure II.10a) where the gold leaching rate increased from 6.6x10⁻⁶
mol/m2/s for non-
pretreated ore to 2.16x10⁻⁵
mol/m2/s after 4h ore pre-oxidation. Considering the pre-
oxidized slurries for the individual sulfide minerals, Figure II.11a identifies pyrite (MRI-2)
pre-oxidation as counter-productive for leveraging gold leaching rate, whereas pre-
oxidation of chalcopyrite (MRI-3, Figure II.12a) or sphalerite (MRI-4, Figure II.13a) led to
marginal gold leaching improvements on already low performances.
To assess the impact of any deposits and/or alteration of the gold surface during pre-
oxidation on the gold leaching by cyanidation, further pre-oxidation of MRI-1 has been
carried out with the gold electrode being immersed in the slurry during the pre-treatment
phase. Although immersing the gold electrode in the MRI-1 pulp during pre-oxidation may
lead to some losses in gold cyanidation rate comparatively to the normal pre-oxidation
procedure described above, yet a significant improvement of gold leaching rate was
obtained (two times, Figure II.10a) in comparison with cyanidation without slurry
pretreatment. In addition, the difference in gold leaching rates between the two pre-
oxidation tests stems from likely passivating layers of mineral oxidation products forming
on the gold surface during pre-treatment.
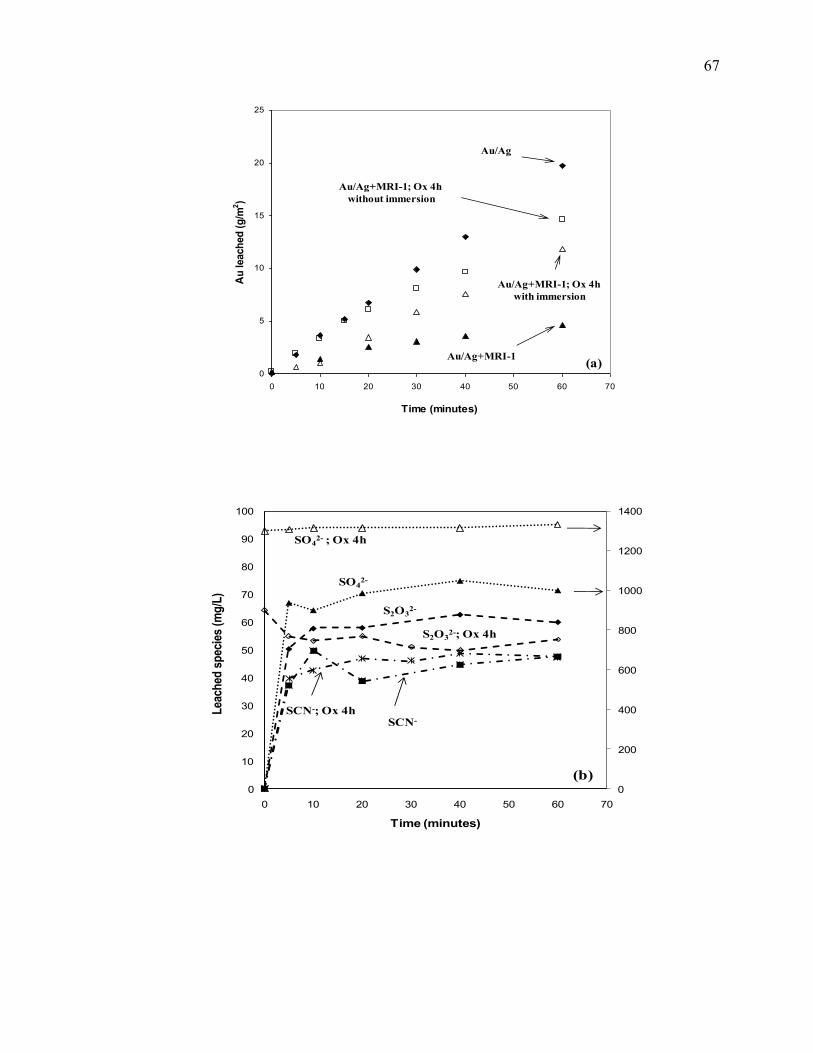
67
0
5
10
15
20
25
0 10 20 30 40 50 60 70
Time (minutes)
Au
leach
ed
(g
/m2)
Au/Ag
Au/Ag+MRI-1; Ox 4h
without immersion
Au/Ag+MRI-1(a)
Au/Ag+MRI-1; Ox 4h
with immersion
0
200
400
600
800
1000
1200
1400
0
10
20
30
40
50
60
70
80
90
100
0 10 20 30 40 50 60 70
Lea
ched
sp
ecie
s (m
g/L
)
Time (minutes)
SO42- ; Ox 4h
SO42-
S2O32-
S2O32-; Ox 4h
SCN-; Ox 4hSCN-
(b)
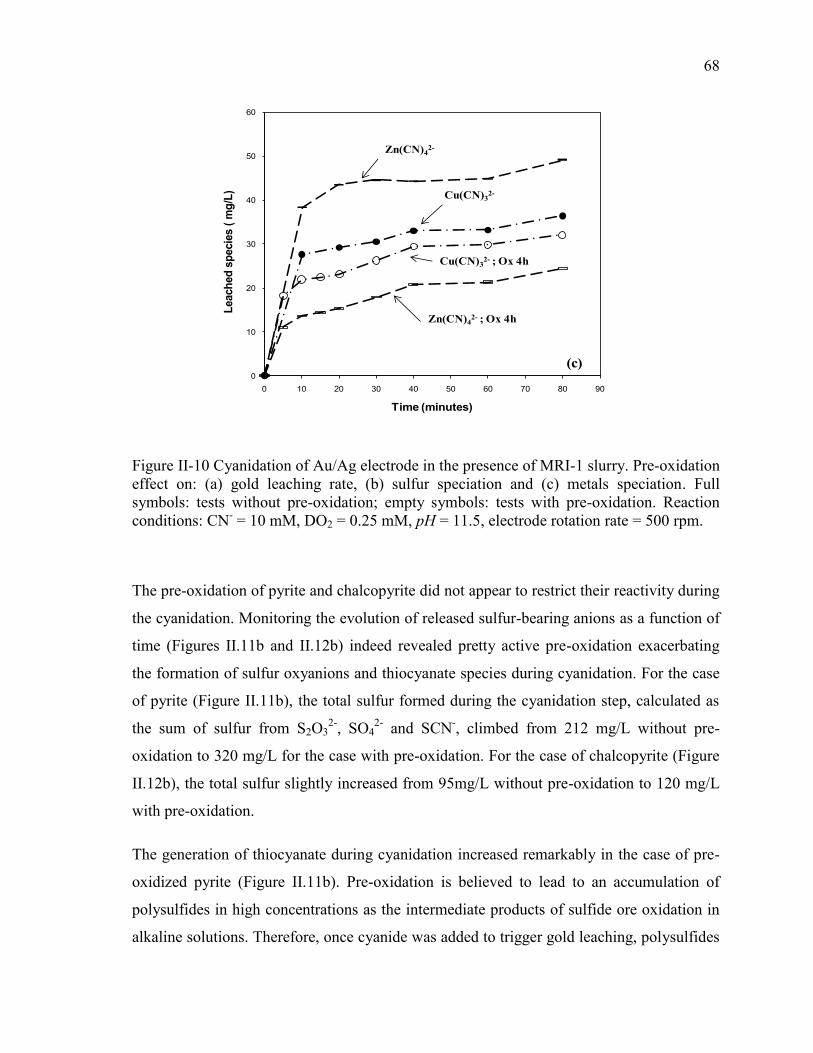
68
0
10
20
30
40
50
60
0 10 20 30 40 50 60 70 80 90
Leach
ed
sp
ecie
s (
mg
/L)
Time (minutes)
Zn(CN)42- ; Ox 4h
Zn(CN)42-
Cu(CN)32-
Cu(CN)32- ; Ox 4h
(c)
Figure II-10 Cyanidation of Au/Ag electrode in the presence of MRI-1 slurry. Pre-oxidation
effect on: (a) gold leaching rate, (b) sulfur speciation and (c) metals speciation. Full
symbols: tests without pre-oxidation; empty symbols: tests with pre-oxidation. Reaction
conditions: CN- = 10 mM, DO2 = 0.25 mM, pH = 11.5, electrode rotation rate = 500 rpm.
The pre-oxidation of pyrite and chalcopyrite did not appear to restrict their reactivity during
the cyanidation. Monitoring the evolution of released sulfur-bearing anions as a function of
time (Figures II.11b and II.12b) indeed revealed pretty active pre-oxidation exacerbating
the formation of sulfur oxyanions and thiocyanate species during cyanidation. For the case
of pyrite (Figure II.11b), the total sulfur formed during the cyanidation step, calculated as
the sum of sulfur from S2O32-
, SO42-
and SCN-, climbed from 212 mg/L without pre-
oxidation to 320 mg/L for the case with pre-oxidation. For the case of chalcopyrite (Figure
II.12b), the total sulfur slightly increased from 95mg/L without pre-oxidation to 120 mg/L
with pre-oxidation.
The generation of thiocyanate during cyanidation increased remarkably in the case of pre-
oxidized pyrite (Figure II.11b). Pre-oxidation is believed to lead to an accumulation of
polysulfides in high concentrations as the intermediate products of sulfide ore oxidation in
alkaline solutions. Therefore, once cyanide was added to trigger gold leaching, polysulfides
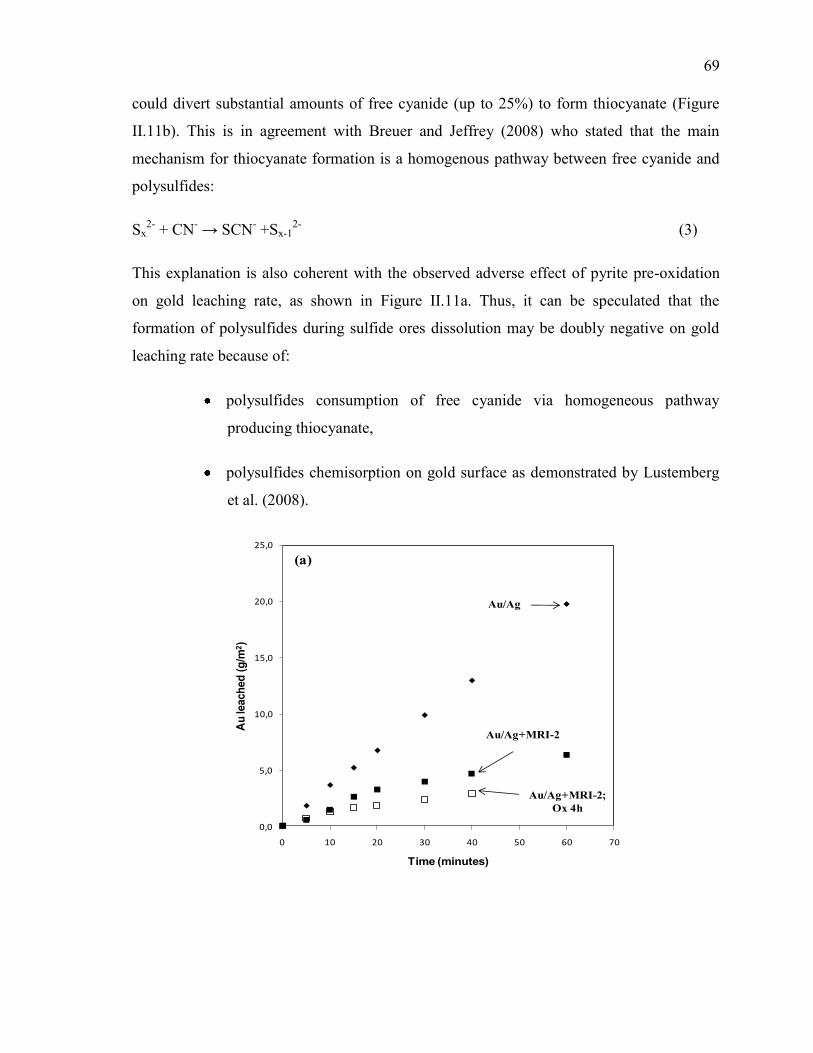
69
could divert substantial amounts of free cyanide (up to 25%) to form thiocyanate (Figure
II.11b). This is in agreement with Breuer and Jeffrey (2008) who stated that the main
mechanism for thiocyanate formation is a homogenous pathway between free cyanide and
polysulfides:
Sx2-
+ CN- → SCN
- +Sx-1
2- (3)
This explanation is also coherent with the observed adverse effect of pyrite pre-oxidation
on gold leaching rate, as shown in Figure II.11a. Thus, it can be speculated that the
formation of polysulfides during sulfide ores dissolution may be doubly negative on gold
leaching rate because of:
polysulfides consumption of free cyanide via homogeneous pathway
producing thiocyanate,
polysulfides chemisorption on gold surface as demonstrated by Lustemberg
et al. (2008).
0,0
5,0
10,0
15,0
20,0
25,0
0 10 20 30 40 50 60 70
Au
leach
ed
(g
/m2)
Time (minutes)
Au/Ag
Au/Ag+MRI-2;
Ox 4hAu/Ag+MRI-2;
Ox 4h
(a)
Au/Ag+MRI-2
Au/Ag
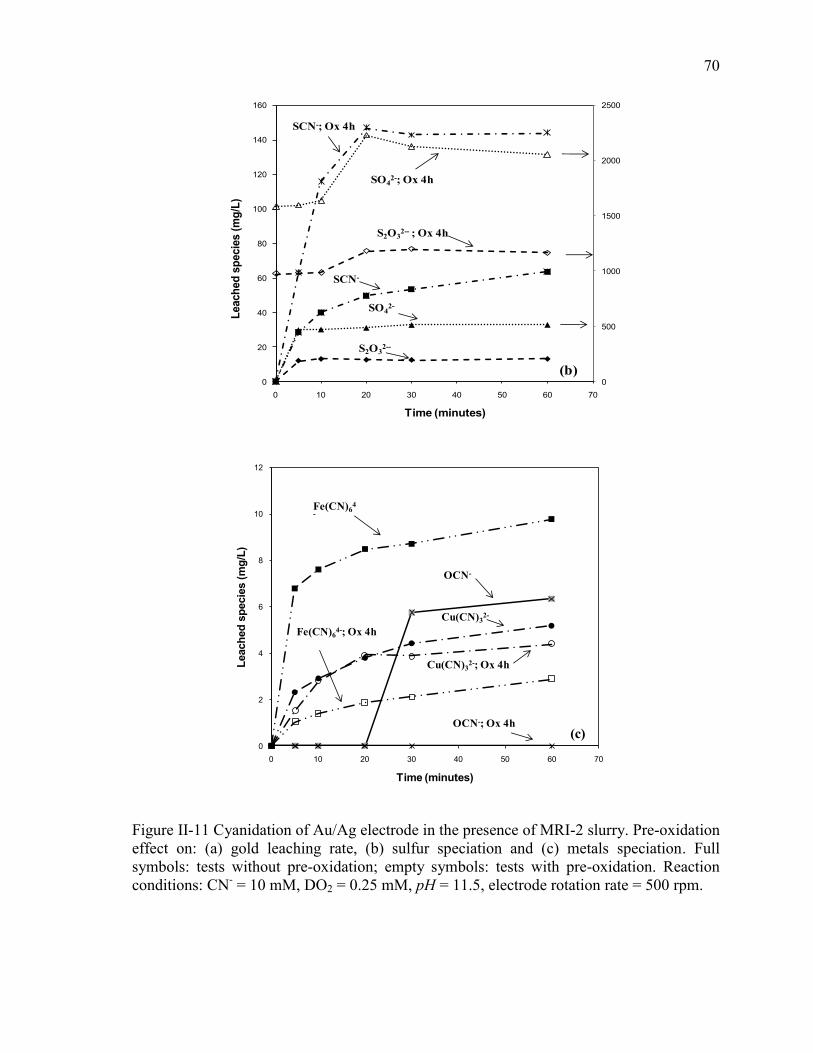
70
0
500
1000
1500
2000
2500
0
20
40
60
80
100
120
140
160
0 10 20 30 40 50 60 70
Leach
ed
sp
ecie
s (
mg
/L)
Time (minutes)
SCN-; Ox 4h
SO42-; Ox 4h
S2O32-- ; Ox 4h
SCN-
SO42-
S2O32--
(b)
0
2
4
6
8
10
12
0 10 20 30 40 50 60 70
Leach
ed
sp
ecie
s (
mg
/L)
Time (minutes)
Fe(CN)64
-
Fe(CN)64-; Ox 4h
OCN-
OCN-; Ox 4h
Cu(CN)32-; Ox 4h
Cu(CN)32-
(c)
Figure II-11 Cyanidation of Au/Ag electrode in the presence of MRI-2 slurry. Pre-oxidation
effect on: (a) gold leaching rate, (b) sulfur speciation and (c) metals speciation. Full
symbols: tests without pre-oxidation; empty symbols: tests with pre-oxidation. Reaction
conditions: CN- = 10 mM, DO2 = 0.25 mM, pH = 11.5, electrode rotation rate = 500 rpm.
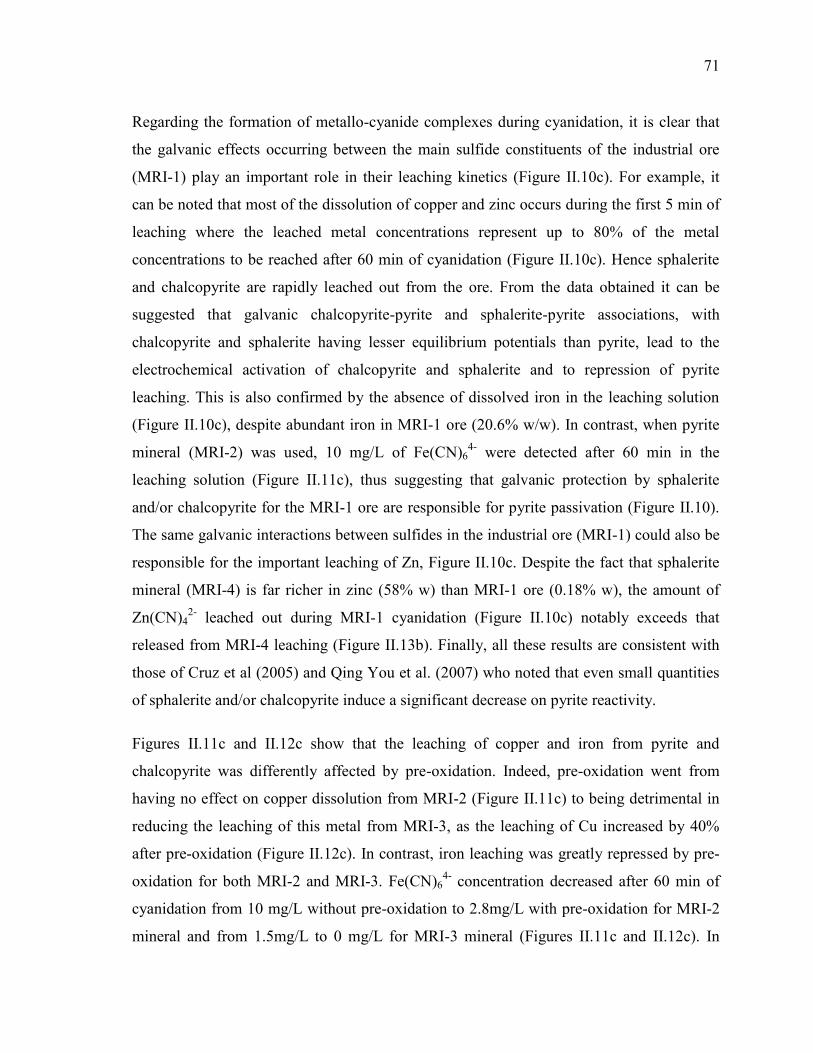
71
Regarding the formation of metallo-cyanide complexes during cyanidation, it is clear that
the galvanic effects occurring between the main sulfide constituents of the industrial ore
(MRI-1) play an important role in their leaching kinetics (Figure II.10c). For example, it
can be noted that most of the dissolution of copper and zinc occurs during the first 5 min of
leaching where the leached metal concentrations represent up to 80% of the metal
concentrations to be reached after 60 min of cyanidation (Figure II.10c). Hence sphalerite
and chalcopyrite are rapidly leached out from the ore. From the data obtained it can be
suggested that galvanic chalcopyrite-pyrite and sphalerite-pyrite associations, with
chalcopyrite and sphalerite having lesser equilibrium potentials than pyrite, lead to the
electrochemical activation of chalcopyrite and sphalerite and to repression of pyrite
leaching. This is also confirmed by the absence of dissolved iron in the leaching solution
(Figure II.10c), despite abundant iron in MRI-1 ore (20.6% w/w). In contrast, when pyrite
mineral (MRI-2) was used, 10 mg/L of Fe(CN)64-
were detected after 60 min in the
leaching solution (Figure II.11c), thus suggesting that galvanic protection by sphalerite
and/or chalcopyrite for the MRI-1 ore are responsible for pyrite passivation (Figure II.10).
The same galvanic interactions between sulfides in the industrial ore (MRI-1) could also be
responsible for the important leaching of Zn, Figure II.10c. Despite the fact that sphalerite
mineral (MRI-4) is far richer in zinc (58% w) than MRI-1 ore (0.18% w), the amount of
Zn(CN)42-
leached out during MRI-1 cyanidation (Figure II.10c) notably exceeds that
released from MRI-4 leaching (Figure II.13b). Finally, all these results are consistent with
those of Cruz et al (2005) and Qing You et al. (2007) who noted that even small quantities
of sphalerite and/or chalcopyrite induce a significant decrease on pyrite reactivity.
Figures II.11c and II.12c show that the leaching of copper and iron from pyrite and
chalcopyrite was differently affected by pre-oxidation. Indeed, pre-oxidation went from
having no effect on copper dissolution from MRI-2 (Figure II.11c) to being detrimental in
reducing the leaching of this metal from MRI-3, as the leaching of Cu increased by 40%
after pre-oxidation (Figure II.12c). In contrast, iron leaching was greatly repressed by pre-
oxidation for both MRI-2 and MRI-3. Fe(CN)64-
concentration decreased after 60 min of
cyanidation from 10 mg/L without pre-oxidation to 2.8mg/L with pre-oxidation for MRI-2
mineral and from 1.5mg/L to 0 mg/L for MRI-3 mineral (Figures II.11c and II.12c). In
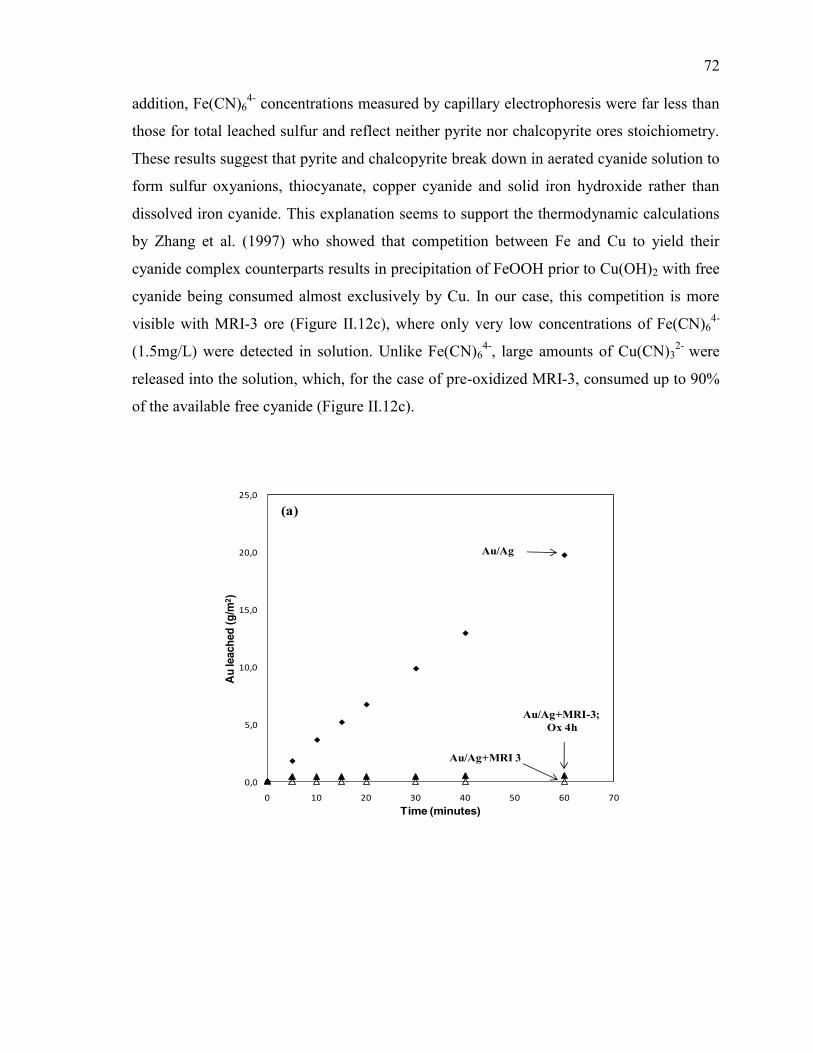
72
addition, Fe(CN)64-
concentrations measured by capillary electrophoresis were far less than
those for total leached sulfur and reflect neither pyrite nor chalcopyrite ores stoichiometry.
These results suggest that pyrite and chalcopyrite break down in aerated cyanide solution to
form sulfur oxyanions, thiocyanate, copper cyanide and solid iron hydroxide rather than
dissolved iron cyanide. This explanation seems to support the thermodynamic calculations
by Zhang et al. (1997) who showed that competition between Fe and Cu to yield their
cyanide complex counterparts results in precipitation of FeOOH prior to Cu(OH)2 with free
cyanide being consumed almost exclusively by Cu. In our case, this competition is more
visible with MRI-3 ore (Figure II.12c), where only very low concentrations of Fe(CN)64-
(1.5mg/L) were detected in solution. Unlike Fe(CN)64-
, large amounts of Cu(CN)32-
were
released into the solution, which, for the case of pre-oxidized MRI-3, consumed up to 90%
of the available free cyanide (Figure II.12c).
0,0
5,0
10,0
15,0
20,0
25,0
0 10 20 30 40 50 60 70
Au
leach
ed
(g
/m2)
Time (minutes)
Au/Ag+MRI-3;
Ox 4h
Au/Ag
Au/Ag+MRI 3
(a)
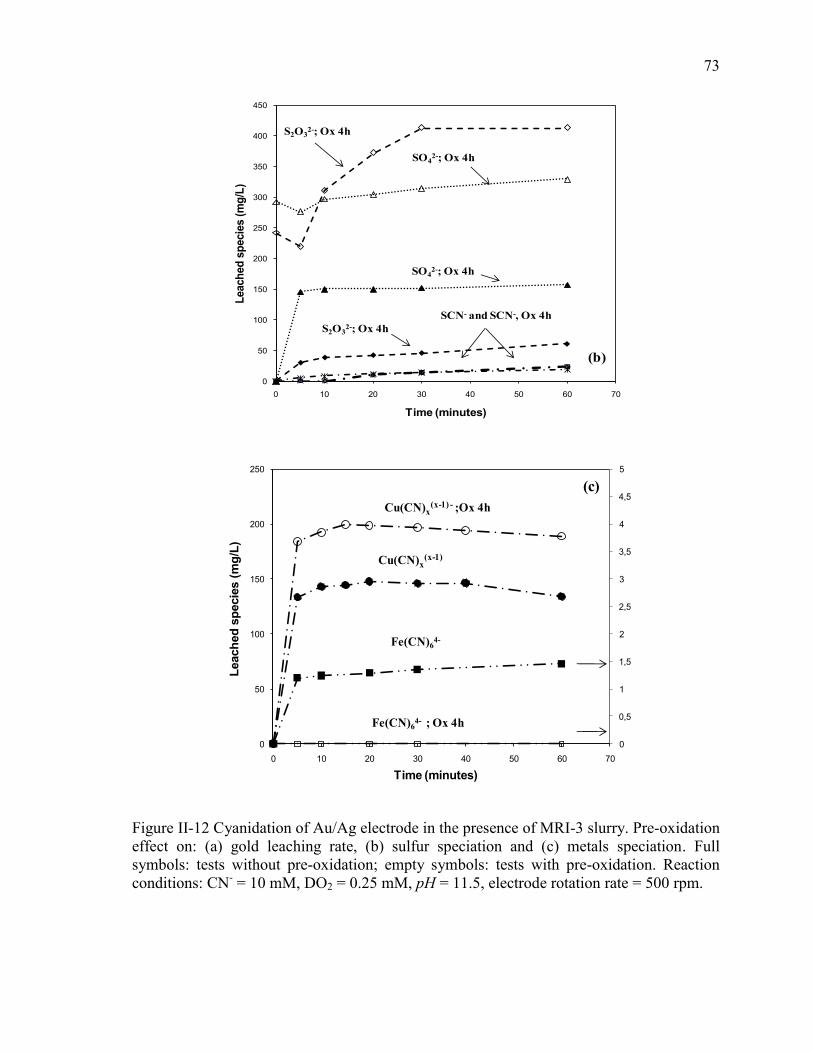
73
0
50
100
150
200
250
300
350
400
450
0 10 20 30 40 50 60 70
Leach
ed
sp
ecie
s (
mg
/L)
Time (minutes)
S2O32-; Ox 4h
SO42-; Ox 4h
SO42-; Ox 4h
S2O32-; Ox 4h
SCN- and SCN-, Ox 4h
(b)
0
0,5
1
1,5
2
2,5
3
3,5
4
4,5
5
0
50
100
150
200
250
0 10 20 30 40 50 60 70
Leach
ed
sp
ecie
s (
mg
/L)
Time (minutes)
Cu(CN)x(x-1)
Cu(CN)x(x-1) - ;Ox 4h
Fe(CN)64- ; Ox 4h
Fe(CN)64-
(c)
Figure II-12 Cyanidation of Au/Ag electrode in the presence of MRI-3 slurry. Pre-oxidation
effect on: (a) gold leaching rate, (b) sulfur speciation and (c) metals speciation. Full
symbols: tests without pre-oxidation; empty symbols: tests with pre-oxidation. Reaction
conditions: CN- = 10 mM, DO2 = 0.25 mM, pH = 11.5, electrode rotation rate = 500 rpm.
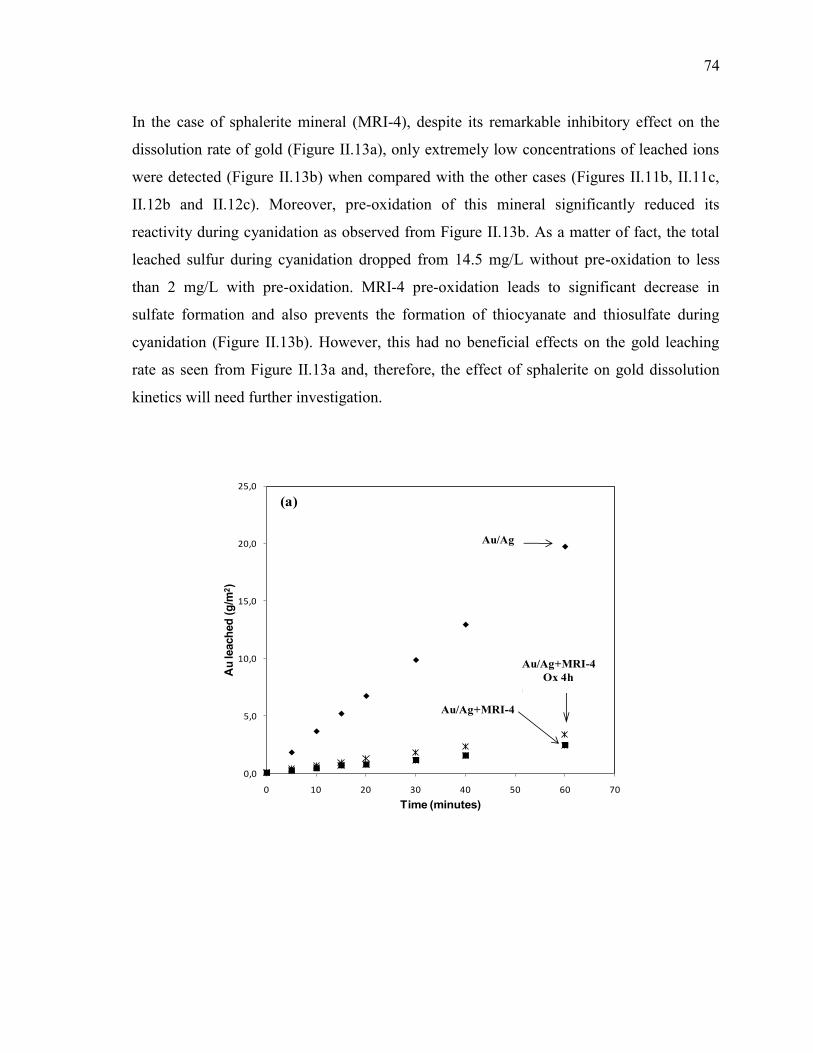
74
In the case of sphalerite mineral (MRI-4), despite its remarkable inhibitory effect on the
dissolution rate of gold (Figure II.13a), only extremely low concentrations of leached ions
were detected (Figure II.13b) when compared with the other cases (Figures II.11b, II.11c,
II.12b and II.12c). Moreover, pre-oxidation of this mineral significantly reduced its
reactivity during cyanidation as observed from Figure II.13b. As a matter of fact, the total
leached sulfur during cyanidation dropped from 14.5 mg/L without pre-oxidation to less
than 2 mg/L with pre-oxidation. MRI-4 pre-oxidation leads to significant decrease in
sulfate formation and also prevents the formation of thiocyanate and thiosulfate during
cyanidation (Figure II.13b). However, this had no beneficial effects on the gold leaching
rate as seen from Figure II.13a and, therefore, the effect of sphalerite on gold dissolution
kinetics will need further investigation.
0,0
5,0
10,0
15,0
20,0
25,0
0 10 20 30 40 50 60 70
Au
leach
ed
(g
/m2)
Time (minutes)
Au/Ag+MRI 4; Ox 4h
Au/Ag+MRI 4
Au/Ag
(a)
Au/Ag+MRI-4
Ox 4h
Au/Ag+MRI-4
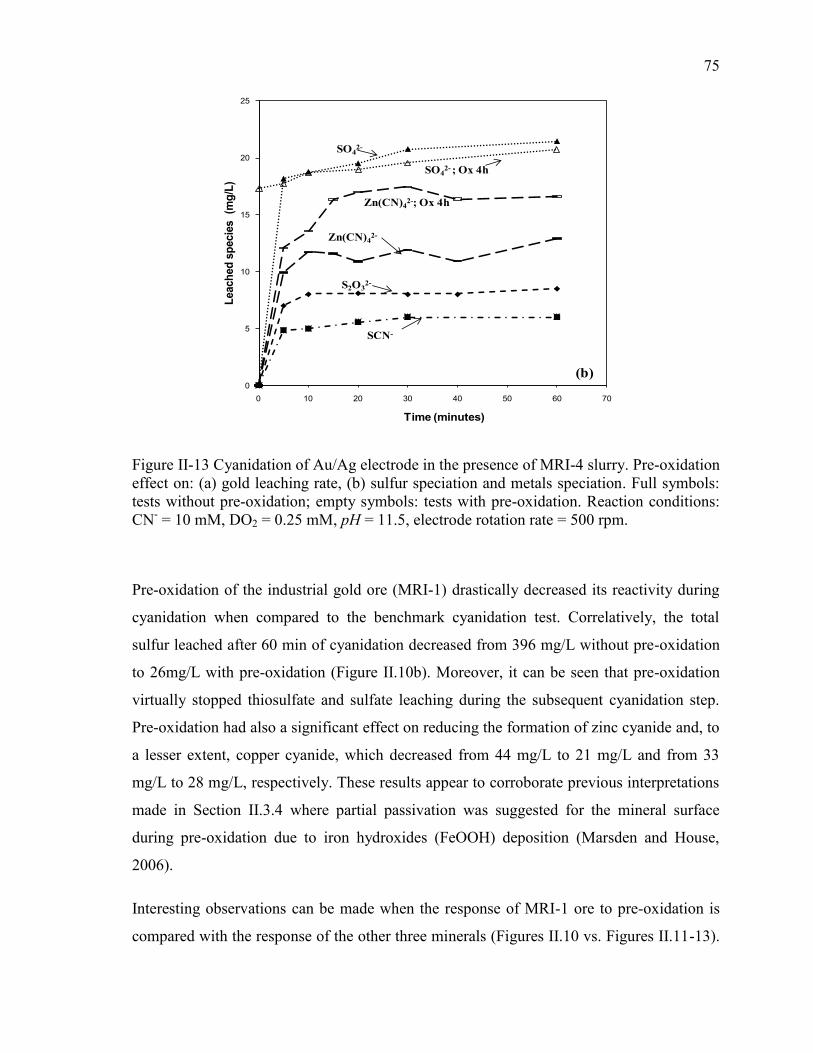
75
0
5
10
15
20
25
0 10 20 30 40 50 60 70
Leach
ed
sp
ecie
s
(mg
/L)
Time (minutes)
SO42-
SO42- ; Ox 4h
Zn(CN)42-; Ox 4h
Zn(CN)42-
S2O32-
SCN-
(b)
Figure II-13 Cyanidation of Au/Ag electrode in the presence of MRI-4 slurry. Pre-oxidation
effect on: (a) gold leaching rate, (b) sulfur speciation and metals speciation. Full symbols:
tests without pre-oxidation; empty symbols: tests with pre-oxidation. Reaction conditions:
CN- = 10 mM, DO2 = 0.25 mM, pH = 11.5, electrode rotation rate = 500 rpm.
Pre-oxidation of the industrial gold ore (MRI-1) drastically decreased its reactivity during
cyanidation when compared to the benchmark cyanidation test. Correlatively, the total
sulfur leached after 60 min of cyanidation decreased from 396 mg/L without pre-oxidation
to 26mg/L with pre-oxidation (Figure II.10b). Moreover, it can be seen that pre-oxidation
virtually stopped thiosulfate and sulfate leaching during the subsequent cyanidation step.
Pre-oxidation had also a significant effect on reducing the formation of zinc cyanide and, to
a lesser extent, copper cyanide, which decreased from 44 mg/L to 21 mg/L and from 33
mg/L to 28 mg/L, respectively. These results appear to corroborate previous interpretations
made in Section II.3.4 where partial passivation was suggested for the mineral surface
during pre-oxidation due to iron hydroxides (FeOOH) deposition (Marsden and House,
2006).
Interesting observations can be made when the response of MRI-1 ore to pre-oxidation is
compared with the response of the other three minerals (Figures II.10 vs. Figures II.11-13).
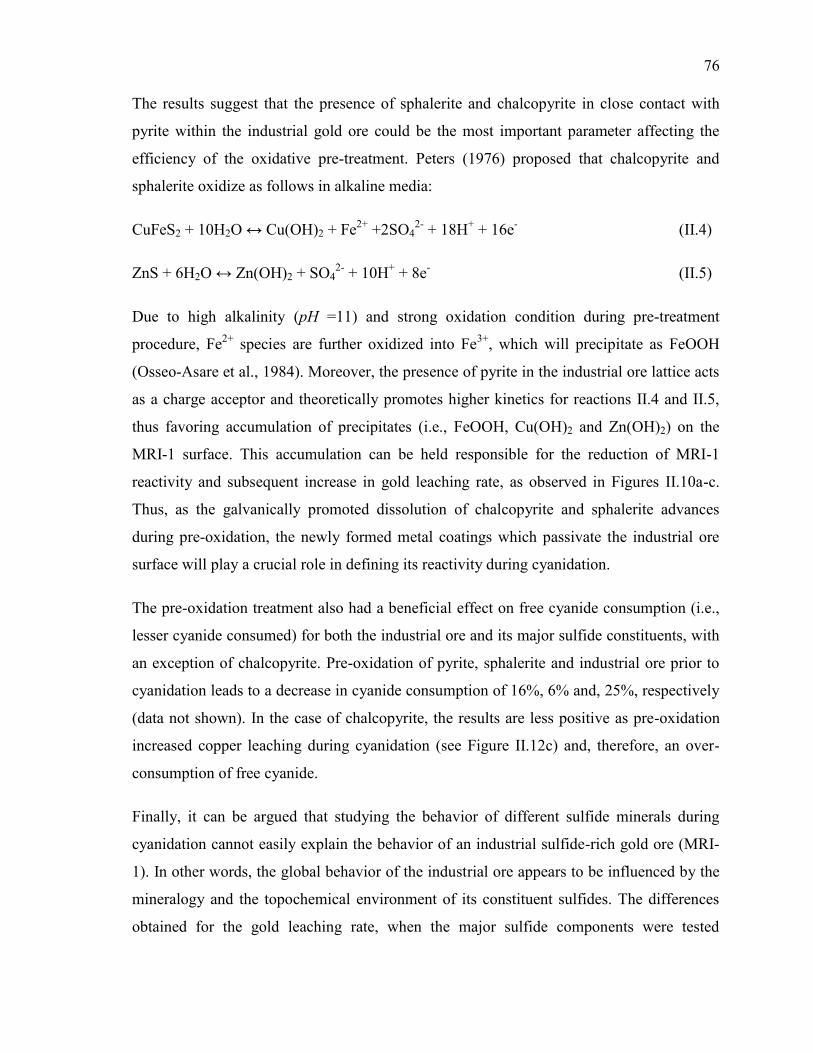
76
The results suggest that the presence of sphalerite and chalcopyrite in close contact with
pyrite within the industrial gold ore could be the most important parameter affecting the
efficiency of the oxidative pre-treatment. Peters (1976) proposed that chalcopyrite and
sphalerite oxidize as follows in alkaline media:
CuFeS2 + 10H2O ↔ Cu(OH)2 + Fe2+
+2SO42-
+ 18H+ + 16e
- (II.4)
ZnS + 6H2O ↔ Zn(OH)2 + SO42-
+ 10H+ + 8e
- (II.5)
Due to high alkalinity (pH =11) and strong oxidation condition during pre-treatment
procedure, Fe2+
species are further oxidized into Fe3+
, which will precipitate as FeOOH
(Osseo-Asare et al., 1984). Moreover, the presence of pyrite in the industrial ore lattice acts
as a charge acceptor and theoretically promotes higher kinetics for reactions II.4 and II.5,
thus favoring accumulation of precipitates (i.e., FeOOH, Cu(OH)2 and Zn(OH)2) on the
MRI-1 surface. This accumulation can be held responsible for the reduction of MRI-1
reactivity and subsequent increase in gold leaching rate, as observed in Figures II.10a-c.
Thus, as the galvanically promoted dissolution of chalcopyrite and sphalerite advances
during pre-oxidation, the newly formed metal coatings which passivate the industrial ore
surface will play a crucial role in defining its reactivity during cyanidation.
The pre-oxidation treatment also had a beneficial effect on free cyanide consumption (i.e.,
lesser cyanide consumed) for both the industrial ore and its major sulfide constituents, with
an exception of chalcopyrite. Pre-oxidation of pyrite, sphalerite and industrial ore prior to
cyanidation leads to a decrease in cyanide consumption of 16%, 6% and, 25%, respectively
(data not shown). In the case of chalcopyrite, the results are less positive as pre-oxidation
increased copper leaching during cyanidation (see Figure II.12c) and, therefore, an over-
consumption of free cyanide.
Finally, it can be argued that studying the behavior of different sulfide minerals during
cyanidation cannot easily explain the behavior of an industrial sulfide-rich gold ore (MRI-
1). In other words, the global behavior of the industrial ore appears to be influenced by the
mineralogy and the topochemical environment of its constituent sulfides. The differences
obtained for the gold leaching rate, when the major sulfide components were tested
77
individually and in association within the industrial ore, can be assigned to the permanent
galvanic contacts between the major constituents in the industrial ore. However, further
investigations are needed to improve the fundamental understanding of the reactions and
mechanisms involved during pre-oxidation and/or cyanidation of the naturally associated
sulfides as in actual industrial ores.
II.3.7. Gold leaching, NaOH vs. Ca(OH)2 and pre-oxidation by DO2 vs.
H2O2
To mimic closely conditions similar to those encountered in gold plants, cyanidation
experiments were carried out in a slurry reactor using lime as an alkaline reagent and slurry
concentration at 50% solid by weight, everything else being kept identical as described
above (particle sizes (P80 <75µm), sodium cyanide and dissolved oxygen concentrations).
Cyanidation tests were performed to study the effect of lime (Ca(OH)2) on gold leaching
kinetics. The results of the experiments carried out using the Au/Ag RDE in aerated
cyanide solutions, show that the use of lime as alkaline reagent causes an important decline
in gold leaching when compared to cyanidation with sodium hydroxide (Figure II.14). In an
attempt to explain this phenomenon the Au/Ag electrode disc was analyzed by back scatted
electron imagining (SEM) coupled with X-ray energy dispersion spectroscopy (EDS). The
analysis showed that deposits containing calcium, oxygen and carbon were formed on the
gold surface, probably point to the formation of a passivating film of Ca(OH)2 and/or
CaCO3 (see also Li et al., 2006) on the gold surface, thus affecting gold leaching.
In a recent study, Davidson and sole (2007) suggested that the presence of lime causes the
formation of low-solubility calcium aurocyanide complex (Ca[Au(CN)2]2) which was held
responsible for the losses in gold recovery in plant circuits using lime to control pH.
Therefore, to check whether possible precipitation of aurocyanide complex with calcium
could also be involved in the observed decline in gold recovery (Figure II.14), a solution
containing 22.4 mg/L of Au(CN)2- was mixed during 1 h with 5 g/L of lime. These values
represented, respectively, the concentration of Au(CN)2- recovered from the gold electrode
in a clear solution in the presence of NaOH (black squares in Figure II.14) and the amount
of lime normally needed to maintain pH at 11.5 for 1 h in MRI-1 cyanidation tests. After 60
78
min of stirring, an aliquot was withdrawn and filtered on 0.45 m Millipore membrane filter
to remove solid particles, and then gold concentration was measured by atomic absorption.
The concentration of dissolved gold found (22.2 mg/L) indicated, in our case, that gold
surface passivation by gold-free calcium-bearing precipitates is the main cause for the
observed gold leaching losses in the presence of lime.
0,0
2,0
4,0
6,0
8,0
10,0
12,0
14,0
16,0
18,0
20,0
22,0
24,0
0 20 40 60 80
Au
leach
ed
(g
/m2)
Time (minutes)
Au/Ag-NaOH
Au/Ag-Ca(OH)2
Figure II-14 Effect of lime (Ca(OH)2) on the gold leaching rate. Reaction conditions: 50%
solids by mass, CN- = 20 mM, DO2 = 0.25 mM, pH = 11.5, electrode rotation rate = 500
rpm.
Figure II.15 shows the beneficial effect of the oxidative pre-treatment of MRI-1 ore, either
by dissolved oxygen or by hydrogen peroxide, on the gold leaching rate. Pre-oxidation tests
were conducted in the same manner as previously when dissolved oxygen was used as
oxidizing reagent. However, when hydrogen peroxide was used, 10 mL of H2O2 solution at
32% w was added to a suspension of 100 g of ore and 90 mL of distilled water and the pre-
oxidation time was varied from 1 h to 1.5 h. The results showed that the percentages of
gold recovery, calculated on the basis of gold leached in a clear solution after 60 min
(benchmark cyanidation test, black squares in Figure II.15) were 34%, 66%, 72% and 79%,
respectively, in direct cyanidation without pretreatment, cyanidation after pre-oxidation
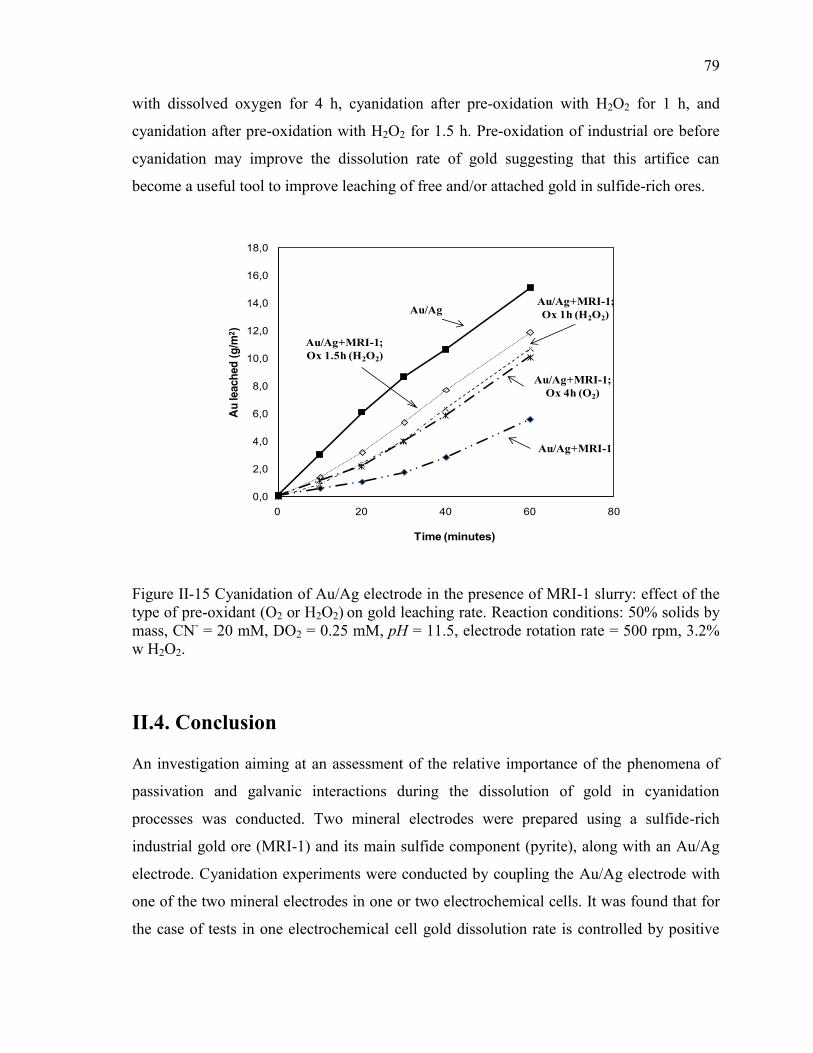
79
with dissolved oxygen for 4 h, cyanidation after pre-oxidation with H2O2 for 1 h, and
cyanidation after pre-oxidation with H2O2 for 1.5 h. Pre-oxidation of industrial ore before
cyanidation may improve the dissolution rate of gold suggesting that this artifice can
become a useful tool to improve leaching of free and/or attached gold in sulfide-rich ores.
0,0
2,0
4,0
6,0
8,0
10,0
12,0
14,0
16,0
18,0
0 20 40 60 80
Au
leach
ed
(g
/m2)
Time (minutes)
Au/Ag
Au/Ag+MRI-1
Au/Ag+MRI-1;
Ox 4h (O2)
Au/Ag+MRI-1;
Ox 1h (H2O2)
Au/Ag+MRI-1;
Ox 1.5h (H2O2)
Figure II-15 Cyanidation of Au/Ag electrode in the presence of MRI-1 slurry: effect of the
type of pre-oxidant (O2 or H2O2) on gold leaching rate. Reaction conditions: 50% solids by
mass, CN- = 20 mM, DO2 = 0.25 mM, pH = 11.5, electrode rotation rate = 500 rpm, 3.2%
w H2O2.
II.4. Conclusion
An investigation aiming at an assessment of the relative importance of the phenomena of
passivation and galvanic interactions during the dissolution of gold in cyanidation
processes was conducted. Two mineral electrodes were prepared using a sulfide-rich
industrial gold ore (MRI-1) and its main sulfide component (pyrite), along with an Au/Ag
electrode. Cyanidation experiments were conducted by coupling the Au/Ag electrode with
one of the two mineral electrodes in one or two electrochemical cells. It was found that for
the case of tests in one electrochemical cell gold dissolution rate is controlled by positive
80
galvanic interactions rather than by passivation. However, when gold and mineral
electrodes are immersed in two distinct cells, gold leaching is controlled only by positive
galvanic effects giving rise to high galvanic currents.
To understand the influence of sulfide ores on gold cyanidation, a systematic study was
performed by immersing a gold/silver electrode disc successively in slurries containing the
industrial ore or one of its major sulfide constituents (pyrite, sphalerite and chalcopyrite). In
addition, solution speciation by capillary electrophoresis was used to quantify sulfur and
cyanicides for better depiction of the reactions taking place during cyanidation. The results
showed that all minerals had a negative effect on the leaching rate of gold. Moreover, the
mineralogy of the ore was found to directly influence its dissolution, both the nature and
the abundance of species released being affected by the galvanic interactions between the
main mineralogical phases present in the ore. This was also confirmed by the results
obtained when pre-oxidation was applied to the sulfide minerals. Pre-oxidation was
effective to improve gold leaching in the case of industrial ores while, despite a decrease in
cyanide consumption, no beneficial effect of pre-oxidation was observed for the major
sulfide constituents of MRI-1 ore.
Finally, it can be concluded that the behavior of an industrial sulfide-rich gold ore during
cyanidation cannot be easily explained only by studying the individual behavior of its
different sulfide mineral constituents. The global behavior of the industrial ore appears to
be influenced both by the mineralogy and the topochemical environment of its constituent
sulfides.
81
II.5. References
Aghamirian, M.M., Yen, W.T., 2005. Mechanism of galvanic interactions between gold
and sulfide minerals in cyanide solution. Minerals Engineering 18, 393-407.
Ahlberg, E., Broo, A.E., 1996a. Oxygen reduction at sulphide minerals. 1. A rotating ring
disc (RRDE) study at galena and pyrite. International Journal of Mineral Processing 46, 35-
52.
Ahlberg, E., Broo, A.E., 1996b. Oxygen reduction at sulphide minerals. 3. The effect of
surface pre-treatment on the oxygen reduction at pyrite. International Journal of Mineral
Processing 47, 49-60.
Bard, A.J., Startmann, M., 2006. Encyclopedia of Electrochemistry. In: Fritz, S., Pickett,
C.J. (Eds.), Inorganic Chemistry, vol. 7a. Wiley-VCH Verlag GmbH & Co. KGaA,
Weinheim, Germany.
Breuer, P.L., Hewitt, D.M., Jeffrey, M.I., Rumball, J.A, 2007. The leaching and oxidation
of sulfide minerals in cyanide solutions - Quantification of reaction products and the effect
of lead and oxygen. World Gold Conference. 183-189.
Breuer, P.L., Jeffrey, M.I., Hewitt, D.M., 2008. Mechanisms of sulfide ion oxidation during
cyanidation. Part I: The effect of lead (II) ions. Minerals Engineering 21, 579-586.
Buckley, A.N., Woods, R., 1987. The surface oxidation of pyrite. Applied Surfcae Science
27, 437-452.
Churchill, M., Laxen, P.A., 1966. The rotating disc system and its applications in the
dissolution of gold. Nat. Inst. Metall. Johannesburg (Mintek), pp.11.
Cruz, R., Bertrand, V., Monroy, M., González, I., 2001. Effect of sulfide impurities on the
reactivity of pyrite and pyritic concentrates: a multi-tool approach. Applied Geochemistry
16, 803-819.
Cruz, R., Luna-Sánchez, R.M., Lapidus, G.T., González, I., Monroy, M., 2005. An
experimental strategy to determine galvanic interactions affecting the reactivity of sulfide
mineral concentrates. Hydrometallurgy 78, 198-208.
Dai, X., Jeffrey, M.I., 2006. The effect of sulfide minerals on the leaching of gold in
aerated cyanide solutions. Hydrometallurgy 82, 118-125.
Davidson, R.J., Sole, M.J., 2007. The major role played by calcium in gold plant circuit.
The Journal of the Southern African Institute of Mining and Metallurgy 107, 463-467.
Deschenes, G., Rousseau, M., Tardif, J., Prud’homme, P.J.H., 1998. Effect of the
composition of some sulfide minerals on cyanidation and use of lead nitrate and oxygen to
alleviate their impact. Hydrometallurgy 50, 205-221.
Elsner, L., 1846. Über das Verhalten regulinischer Mettale in einer wässrigen Lösung von
Cyankalium. Journal für Praktische Chemie 37, 441-446 (DOI:
10.1002/prac.18460370167).
82
Filmer, A.O., 1982. The dissolution of gold from roasted pyrite concentrations. The Journal
of the Southern African Institute of Mining and Metallurgy 82, 90-94.
Guo, H., Deschenes, G., Pratt, A., Fulton, M., Lastra, R., 2005. Leaching kinetics and
mechanisms of surface reactions during cyanidation of gold in the presence of pyrite and
stibnite. Minerals and Metallurgical Processing 22, 89-95.
Habashi, F., 1967. Kinetics and mechanism of gold and silver dissolution in cyanide
solution. Montana Bureau of Mines and Geology Bulletin 59, Montana Bureau of Mines
and Geology, Butte, Montana, USA.
Hedley, N., Tabachnick, H., 1968. Mineral Dressing Notes No 23, Chemistry of
Cyanidation. American Cyanamid Company, New Jersey, USA.
Jeffrey, M.I., Breuer, P.L., 2000. The cyanide leaching of gold in solution containing
sulfide. Minerals Engineering 13, 1097-1106.
Jeffrey, M.I., Ritchie, I.M., 2000. The leaching of gold in cyanide solution in the presence
of impurities II. The effect of silver. Journal of Electrochemical Society 147, 3272-3276.
Levich, V.G., 1962. Physicochemical Hydrodynamics, Prentice Hall, Englewood Cliffs,
NJ.
Li, J., Dabrowski, B., Miller, J.D., Acar, S., Dietrich, M., LeVier, K.M., Wan, R.Y., 2006.
The influence of pyrite pre-oxidation on gold recovery by cyanidation. Minerals
Engineering 19, 883-895.
Liu, G.Q., Yen, W.T., 1995. Effects of sulfide minerals and dissolved oxygen on the gold
and silver dissolution in cyanide solution. Minerals Engineering 8, 111-123.
Lorenzen, L., van Deventer, J.S.J., 1992. Electrochemical interactions between gold and its
associated minerals during cyanidation. Hydrometallurgy 30, 177-194.
Lustemberg, P.G., Vericat, C., Benitez, G.A., Vela, M.E., Tognalli, N., Fainstein, A.,
Martiarena, M.L., Salvarezza, R.C., 2008. Spontaneously formed sulfur layers on gold in
electrolyte solutions: Adsorbed sulfur or gold sulfide? The Journal of Physical Chemistry
C. 112, 11394-11402.
Luthy, R.G., Bruce, S.G., 1979. Kinetics of reaction of cyanide and reduced sulfur species
in aqueous solution. Environmental Science & Technology 13, 1481-1487.
MacArthur, J. S., Forrest, R. W., Forrest, W, 1887. Improvements in obtaining gold and
silver from ores and other compounds. British Patent 14 174.
Madhuchhanda, M., Devi, N.B., Rao, K.S., Rath, P.C., Paramguru, R.K., 2000. Galvanic
interaction between sulfide minerals and pyrolusite. Journal of Solid State Electrochemistry
4, 189-198.
Marsden, J.O., House, C.I., 1992. The Chemistry of Gold Extraction. Ellis & Horwood,
London.
Marsden, J.O., House, C.I., 2006. The Chemistry of Gold Extraction. 2nd Edition. Society
for Mining, Metallurgy and Exploration (SME), Littleton, Co, USA.
83
Osseo-Asare, K., Xue, T. and Ciminelli, V.S.T., 1984, Solution chemistry of cyanide
leaching systems, in Precious Metals: Mining Extraction and Processing, The Metallurgical
Society/AIME., Warrendale, Pennsylvania, pp. 173-197.
Paul, R.L., 1984. The role of electrochemistry in the extraction of gold. Journal of
Electroanalytical Chemistry 168, 147-162.
Peters, E., 1976. Direct leaching of sulphides: Chemistry and applications. Metallurgical
Transactions B 7, 505-517.
Petre, C.F., Azizi, A., Olsen, C., Baçaoui, A., Larachi, F., 2008. Capillary electrophoretic
analysis of sulfur and cyanicides speciation during cyanidation of gold complex sulfidic
ores. Journal of Separation Science 31, 3902-3910.
Qing You, L., Heping, L., Li, Z., 2007. Study of galvanic interactions between pyrite and
chalcopyrite in a flowing system: implications for the environment. Environmental
Geology 52, 11-18.
Rand, D.J.A., 1977. Oxygen reduction on sulfide minerals. Part III. Comparison of
activities of various copper, iron, lead, and nickel mineral electrodes. Journal of
Electroanalytical Chemistry 83, 19-32.
Weichselbaum, J., Tumilty, J.A., Schmidt, C.G., 1989. The effect of sulphide and lead on
the rate of gold cyanidation. Proceedings Aus. I.M.M. Annual conference Perth/Kalgoorlie.
Australasian Institute of Mining and Metallurgy, Melbourne, pp. 221-224.
Zhang, Y., Fang, Z.H., Muhammed, M., 1997. On the solution chemistry of cyanidation of
gold and silver bearing sulphide ores. A critical evaluation of thermodynamic calculations.
Hydrometallurgy 46, 251-269.
Zhu, X., Li, J., Wastworth, M.E., 1993. Kinetics of transpassive oxidation of pyrite. In:
Hager, J.P. (Ed.), EPD Congress. The Minerals, Metals & Materials Society 355-368.
84
CHAPITRE III. Untangling galvanic and passivation
phenomena induced by sulfide minerals on precious
metal leaching using a new packed-bed electrochemical
cyanidation reactor
Abdelaaziz Azizi,1 Catalin Florin Petre
1, Caroline Olsen
2, Faïçal Larachi
1
1Department of Chemical Engineering, Laval University, Québec, Canada, G1V 0A6;
2COREM Research Center, 1180 Rue de la Minéralogie, Québec, Canada, G1N 1X7
Abstract/Résumé
Because permanent galvanic contacts between gold rotating disc electrodes and slurried
sulfide-rich ores are uneasy to achieve, the standard gold rotating-disc-electrode/slurry
cyanidation arrangement has a tendency to inflate overly the importance of passivation
phenomena over the corrective trend of galvanic interactions inherently present within the
ore grains. A new packed-bed electrochemical reactor (PBER) was thus developed and
tested to decouple and quantify the individual contributions of passivation phenomena (PP)
and galvanic interactions (GI) on precious metal (gold and silver, PM) leaching rates during
the cyanidation of sulfide-rich ores. The PBER was filled with homogenized mixtures of
minerals (pyrite, chalcopyrite, sphalerite, chalcocite, galena, stibnite, industrial ore), gold
and silver powders, which were arranged as electrically-isolated sulfide-quartz segregated
bilayer(s) with permanent (inter)particle-particle electrical contacts among all constituents
in each layer. Implantation of PM powders successively in the quartz layer and then in the
sulfide layer, enabled PP and GI to be singled out and quantified separately for each
sulfide. Galvanic interactions were found to ameliorate, to various degrees, the leaching of
PM. Locating the PM powders in the quartz layer emphasized the negative impact of PP of
the sulfide layer on Au and Ag dissolution, except for galena which enhanced gold leaching
kinetics. Galvanic interactions due to pyrite, chalcopyrite and an industrial ore were so
85
positive that they largely outweighed the negative impact of PM passivation. The galvanic
current measured between Au/Ag electrode and each of the above minerals confirmed the
positive effect of GI on gold leaching rate. In close agreement with PM recoveries, stronger
galvanic currents were measured for Au-pyrite, Au-chalcopyrite and Au-industrial ore
galvanic couples in comparison to those for Au-sphalerite, Au-chalcocite and Au-stibnite.
Puisque les contacts galvaniques permanents entre électrode tournante à disque d’or (RDE)
et suspensions de minerais sulfureux (slurries) sont difficiles à mettre en œuvre, les tests
standards de cyanuration réalisés en mode RDE/slurry ont plutôt tendance à surestimer
l’importance des phénomènes de passivations sur l’effet aidant des interactions galvanique,
intrinsèquement présents dans les particules minérales. Un nouveau réacteur
électrochimique à lit fixe (PBER) a été alors développé et testé pour découpler et quantifier
les contributions individuelles des phénomènes de passivations (PP) et d’interactions
galvaniques (IG) sur la lixiviation de métaux précieux (or et argent, PM) lors de la
cyanuration de minerais riches en sulfures. Le réacteur a été chargé de mélanges
homogénéisés de sulfures (pyrite, chalcopyrite, sphalérite, chalcocite, galène, stibine et
minerai industriel) et de poudres d’or et d’argent, lesquels ont été disposés en bicouche(s),
électriquement-séparées (sulfure-quartz), où le contact galvanique permanent à l’échelle
inter-particulaire a été possible entre tous les constituants de chaque couche. L’implantation
des poudres d’or et d’argent (PM) successivement dans la couche de quartz puis dans la
couche de sulfure a permis de découpler les phénomènes de passivations des interactions
galvaniques et de les quantifier à titre individuel pour chaque sulfure. Les interactions
galvaniques améliorent, à des degrés variables, la lixiviation des métaux précieux. La
localisation des poudres de métaux précieux dans la couche de quartz a permis de souligner
l’impact négatif des phénomènes de passivation induite par les couches de sulfures sur la
dissolution de l’or et de l’argent, à l’exception de la galène qui influence positivement la
cinétique de lixiviation de l’or. Les interactions galvaniques dues à la pyrite, à la
chalcopyrite et au minerai industriel ont été tellement positive qu’elles l’emportent
largement sur les effets négatifs dus aux phénomènes de passivation. Le courant galvanique
mesuré entre l’électrode d’Au/Ag et chacun des sulfures précités confirme l’effet positif des
86
interactions galvaniques sur la vitesse de dissolution de l’or. Corroborant les résultats
obtenus sur la lixiviation de l’or, le courant galvanique mesuré a été plus élevé dans le cas
des couples galvaniques Au-pyrite, Au-chalcopyrite et Au-minerai industriel qu’avec les
couples Au-sphalérite, Au-chalcocite et Au-stibine.
III.1 Introduction
Precious metals (PM), gold in particular, naturally occur in contact within a wide range of
refractory sulfide mineral systems. Hence, one of today’s most challenging R&D tasks
consists in turning to account the presence of sulfides on the cyanidation behavior of gold.
An important body of knowledge reveals that metal sulfides display a range of reactivities
and interferences in alkaline cyanide solutions (Marsden and House, 1992; 2006).
Refractory ores genuinely reflect in fine Au inclusions entwined within the metal sulfide
matrix calling for its heedful breakage prior to cyanidation. Gold in the form of coarse
inclusions in the so-called transition sulfide ores is exposed and thus subject to three
specific interferences: (1) waste of reagents due to (cyanide and dissolved oxygen)
consumption by the sulfide matrix components (Habashi, 1967) increasing reagent cost or
decreasing gold leaching activity, (2) gold surface passivation by solid reaction products
from the reacting sulfides, e.g., precipitating dissolved iron or sulfur species on the gold
surface (Guo et al., 2005; Jeffrey and Breuer, 2000), or loss of dissolved gold cyanide by
re-precipitation on sulfide surfaces driven by surface Fe(OH)2 oxidation to Fe(OH)3 (Linge,
1995 and references therein), (3) galvanic interaction between the sulfide phase and gold
surface (Lorenzen and van Deventer, 1992; Aghamirian and Yen, 2005a).
In principle, gold anodic dissolution can be prompted when gold open circuit potential is
lesser than that of the coexisting sulfides. Conversely, when the adjoining sulfide mineral
acquires an anodic potential, galvanic interactions impede gold dissolution and prompt,
instead of gold dissolution, oxygen reduction on the gold surfaces. Apart from such a
straightforward dichotomy, the outcome from galvanic phenomena related to real ores is
difficult to anticipate as numerous experiments led to ambiguous electrochemical behaviors
of gold and their sulfide mineral components. Despite several studies on the subject, there
is still some controversy regarding the role of galvanic interactions on gold dissolution

87
(Lorenzen and Van Deventer, 1992; Aghamirian and Yen, 2005a; Dai and Jeffrey, 2006;
Azizi et al., 2010). Thus far, experimental strategies to study such interactions on gold
cyanidation used galvanic cells in which mineral and gold monolithic electrodes, either
naturally occurring or fabricated wafers, were short-circuited or attached together through a
conductor wire (Lorenzen and Van Deventer, 1992; Aghamirian and Yen, 2005a; Azizi et
al., 2010); the anodic and cathodic behaviors of gold and sulfide minerals being compared
individually (Dai and Jeffrey, 2006). However, in such cells, the contact between gold and
mineral is made via an external circuit and/or an electrolyte solution (Lorenzen and van
Deventer, 1992; Aghamirian and Yen, 2005a; Dai and Jeffrey, 2006; Azizi et al., 2010).
This might not be representative of the micro-environments present within the industrial
sulfide-gold ores, in which intimate permanent (intra)particle-particle contacts exist
between all the components forming the galvanic cell. Therefore, these experimental
strategies might not reflect the actual surface topochemistry of industrial ores in terms of
permanent galvanic contacts at an intra-particle scale. In the case of fabricated wafer
mineral electrodes, another disadvantage relates to their preparation which requires mixing
hydrophobic (binding) mineral oils with mineral and graphite powders to increase electrode
electric conductivity powders (Azizi et al., 2010). The presence of such foreign additives
does not guaranty electrochemical representativeness of the behavior of mineral particles.
In most of the available electrochemical studies, the effects of galvanic interactions (GI)
and passivation phenomena (PP) via mineral dissolution were often studied separately
because of limitations inherent to the experimental strategies (Lorenzen and van Deventer,
1992; Dai and Jeffrey, 2006). First, when using mineral electrodes, the concentrations of
species liberated in the solution were insufficient to allow investigation of those species’
effects on gold dissolution kinetics. In addition, the anode/cathode areal ratio being often
close to unity didn’t reflect the usual industrial cyanidation conditions. Setting
representative ratios between mineral and gold surfaces is crucial to capture both PP and GI
effects. Second, when gold leaching is studied in slurries containing sulfide mineral
particles and gold/silver powder (Guo et al., 2005; Dai and Jeffrey, 2006) or an Au/Ag disc
immersed in slurry (Lorenzen and van Deventer, 1992; Liu and Yen, 1995), permanent
galvanic contacts between gold and mineral particles, as in real ores, were virtually
impossible to achieve. Therefore, the effects of galvanic interactions on the speciation of
88
dissolved species were ignored leaving unexplored instances in which certain sulfides
would benefit from PM-mediated galvanic protection. It is believed that current
electrochemical strategies exhibit limited reliability for both prediction and assessment of
the various reactivity scenarios of Au, Ag and minerals in cyanidation circuits.
In consideration of the above restrictions, this work aims at the following targets:
1. To present a new simple electrochemical technique and methodology that can be
applied to understand and evaluate the effects of GI and PP on PM cyanidation
kinetics via sulfide minerals dissolution. This system, consisting of a packed-bed
electrochemical reactor (PBER), was developed and tested to investigate the
effects of a wide range of sulfide-rich ores on the PM leaching rates in aerated
cyanide solutions;
2. To attempt, using this new PBER configuration during cyanidation, sorting out
the individual contributions of galvanic interactions between Au, Ag and several
sulfide minerals and/or the formation of passivating layers on PM surfaces.
III.2. Experimental
III.2.1. Materials and reagents
Seven sulfide-rich ore samples were tested. The first sample (MRI-1) came from a mine in
the northwest of Québec province (Canada), while the other six samples were provided by
Ward’s Natural Science and referred to as pyrite (MRI-2), chalcopyrite (MRI-3), sphalerite
(MRI-4), chalcocite (MRI-5), galena (MRI-6) and stibnite (MRI-7) by virtue of the
preponderant sulfide mineral therein (Table III.1). The samples were sieved to remove
particles coarser then 90 µm and finer than 45 µm. Consequently, the same granulometric
fraction was used for the different ores, providing nearly equal total area per unit mass in
all cyanidation experiments. Tables III.1 and III.2 describe, respectively, the mineralogical
and elemental composition of each mineral. Pure gold (P80 = 39 µm, Alfa Aesar, 99,998%
USA) and pure silver (P80 = 26 µm, Alfa Aesar, 99,9% USA) powders were also used in
the present work. All powders were characterized using a combination of atomic absorption
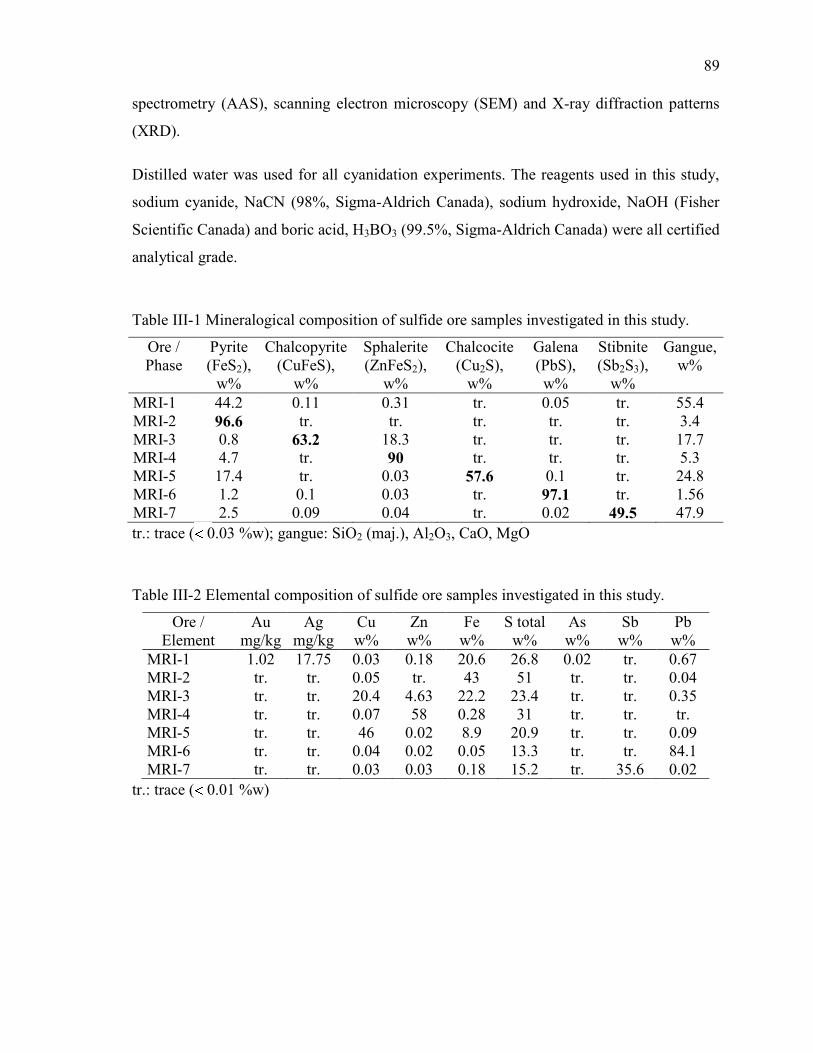
89
spectrometry (AAS), scanning electron microscopy (SEM) and X-ray diffraction patterns
(XRD).
Distilled water was used for all cyanidation experiments. The reagents used in this study,
sodium cyanide, NaCN (98%, Sigma-Aldrich Canada), sodium hydroxide, NaOH (Fisher
Scientific Canada) and boric acid, H3BO3 (99.5%, Sigma-Aldrich Canada) were all certified
analytical grade.
Table III-1 Mineralogical composition of sulfide ore samples investigated in this study.
Ore /
Phase
Pyrite
(FeS2),
w%
Chalcopyrite
(CuFeS),
w%
Sphalerite
(ZnFeS2),
w%
Chalcocite
(Cu2S),
w%
Galena
(PbS),
w%
Stibnite
(Sb2S3),
w%
Gangue,
w%
MRI-1 44.2 0.11 0.31 tr. 0.05 tr. 55.4
MRI-2 96.6 tr. tr. tr. tr. tr. 3.4
MRI-3 0.8 63.2 18.3 tr. tr. tr. 17.7
MRI-4 4.7 tr. 90 tr. tr. tr. 5.3
MRI-5 17.4 tr. 0.03 57.6 0.1 tr. 24.8
MRI-6 1.2 0.1 0.03 tr. 97.1 tr. 1.56
MRI-7 2.5 0.09 0.04 tr. 0.02 49.5 47.9
tr.: trace ( 0.03 %w); gangue: SiO2 (maj.), Al2O3, CaO, MgO
Table III-2 Elemental composition of sulfide ore samples investigated in this study.
Ore /
Element
Au
mg/kg
Ag
mg/kg
Cu
w%
Zn
w%
Fe
w%
S total
w%
As
w%
Sb
w%
Pb
w%
MRI-1 1.02 17.75 0.03 0.18 20.6 26.8 0.02 tr. 0.67
MRI-2 tr. tr. 0.05 tr. 43 51 tr. tr. 0.04
MRI-3 tr. tr. 20.4 4.63 22.2 23.4 tr. tr. 0.35
MRI-4 tr. tr. 0.07 58 0.28 31 tr. tr. tr.
MRI-5 tr. tr. 46 0.02 8.9 20.9 tr. tr. 0.09
MRI-6 tr. tr. 0.04 0.02 0.05 13.3 tr. tr. 84.1
MRI-7 tr. tr. 0.03 0.03 0.18 15.2 tr. 35.6 0.02
tr.: trace ( 0.01 %w)
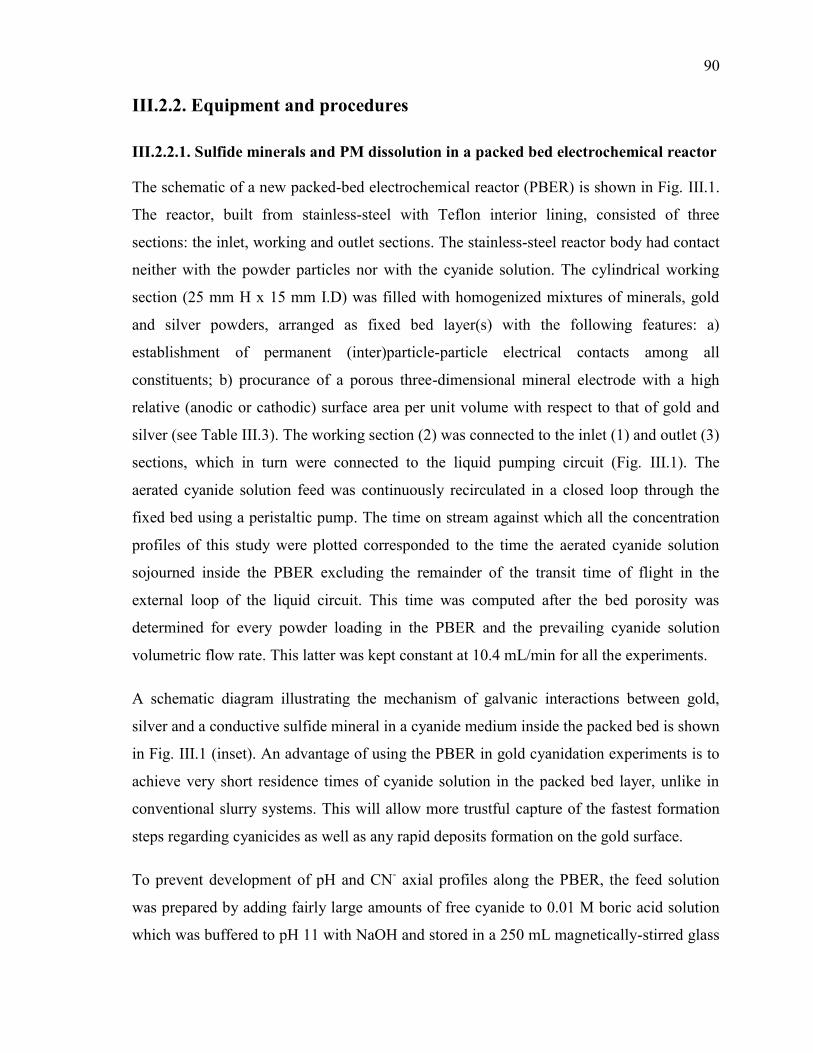
90
III.2.2. Equipment and procedures
III.2.2.1. Sulfide minerals and PM dissolution in a packed bed electrochemical reactor
The schematic of a new packed-bed electrochemical reactor (PBER) is shown in Fig. III.1.
The reactor, built from stainless-steel with Teflon interior lining, consisted of three
sections: the inlet, working and outlet sections. The stainless-steel reactor body had contact
neither with the powder particles nor with the cyanide solution. The cylindrical working
section (25 mm H x 15 mm I.D) was filled with homogenized mixtures of minerals, gold
and silver powders, arranged as fixed bed layer(s) with the following features: a)
establishment of permanent (inter)particle-particle electrical contacts among all
constituents; b) procurance of a porous three-dimensional mineral electrode with a high
relative (anodic or cathodic) surface area per unit volume with respect to that of gold and
silver (see Table III.3). The working section (2) was connected to the inlet (1) and outlet (3)
sections, which in turn were connected to the liquid pumping circuit (Fig. III.1). The
aerated cyanide solution feed was continuously recirculated in a closed loop through the
fixed bed using a peristaltic pump. The time on stream against which all the concentration
profiles of this study were plotted corresponded to the time the aerated cyanide solution
sojourned inside the PBER excluding the remainder of the transit time of flight in the
external loop of the liquid circuit. This time was computed after the bed porosity was
determined for every powder loading in the PBER and the prevailing cyanide solution
volumetric flow rate. This latter was kept constant at 10.4 mL/min for all the experiments.
A schematic diagram illustrating the mechanism of galvanic interactions between gold,
silver and a conductive sulfide mineral in a cyanide medium inside the packed bed is shown
in Fig. III.1 (inset). An advantage of using the PBER in gold cyanidation experiments is to
achieve very short residence times of cyanide solution in the packed bed layer, unlike in
conventional slurry systems. This will allow more trustful capture of the fastest formation
steps regarding cyanicides as well as any rapid deposits formation on the gold surface.
To prevent development of pH and CN- axial profiles along the PBER, the feed solution
was prepared by adding fairly large amounts of free cyanide to 0.01 M boric acid solution
which was buffered to pH 11 with NaOH and stored in a 250 mL magnetically-stirred glass
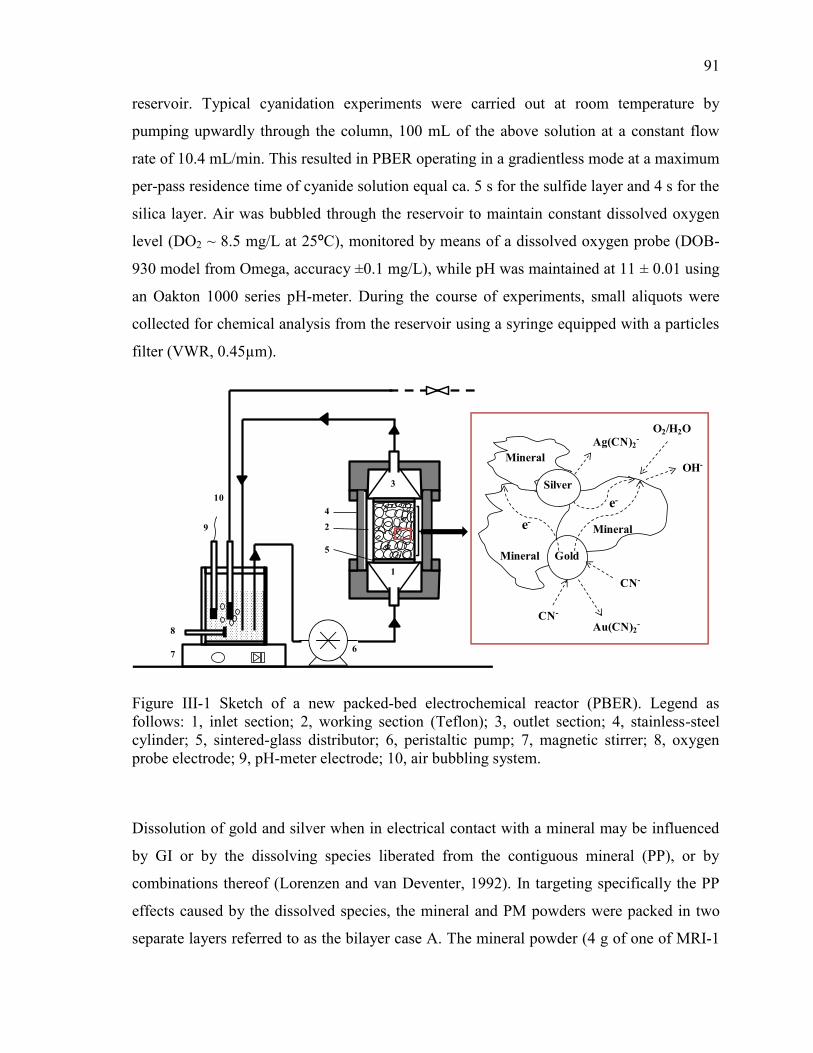
91
reservoir. Typical cyanidation experiments were carried out at room temperature by
pumping upwardly through the column, 100 mL of the above solution at a constant flow
rate of 10.4 mL/min. This resulted in PBER operating in a gradientless mode at a maximum
per-pass residence time of cyanide solution equal ca. 5 s for the sulfide layer and 4 s for the
silica layer. Air was bubbled through the reservoir to maintain constant dissolved oxygen
level (DO2 ~ 8.5 mg/L at 25ºC), monitored by means of a dissolved oxygen probe (DOB-
930 model from Omega, accuracy ±0.1 mg/L), while pH was maintained at 11 ± 0.01 using
an Oakton 1000 series pH-meter. During the course of experiments, small aliquots were
collected for chemical analysis from the reservoir using a syringe equipped with a particles
filter (VWR, 0.45µm).
O2/H2O
OH-
e-
e-
Gold
CN-
CN-
Au(CN)2-
Silver
Ag(CN)2-
Mineral
Mineral
Mineral
3
1
2
4
67
5
8
9
10
Figure III-1 Sketch of a new packed-bed electrochemical reactor (PBER). Legend as
follows: 1, inlet section; 2, working section (Teflon); 3, outlet section; 4, stainless-steel
cylinder; 5, sintered-glass distributor; 6, peristaltic pump; 7, magnetic stirrer; 8, oxygen
probe electrode; 9, pH-meter electrode; 10, air bubbling system.
Dissolution of gold and silver when in electrical contact with a mineral may be influenced
by GI or by the dissolving species liberated from the contiguous mineral (PP), or by
combinations thereof (Lorenzen and van Deventer, 1992). In targeting specifically the PP
effects caused by the dissolved species, the mineral and PM powders were packed in two
separate layers referred to as the bilayer case A. The mineral powder (4 g of one of MRI-1
92
to MRI-7) was packed in the lower part of the PBER working section and was electrically
isolated from the upper PM-containing powder layer by a sintered-glass filter disc (VWR
International, USA). This upper PBER powder layer consisted of a known amount of inert
quartz particles (P80 ≤ 149 µm Sigma Aldrich, Canada) in which 50 mg Au and 20 mg Ag
were dispersed. It is also worthy of mention that the quartz particles are chemically and
electrochemically inert thus having no effect whatsoever on the leaching of gold in aerated
cyanide solutions (Aghamirian and Yen, 2005b). Alternatively, the combined GI and PP
effects were assessed after the mineral and PM powders were mix-packed altogether. The
same amounts of PM powders (as in case A) were mixed with 4 g of mineral powder to
form the PBER lower-layer whereas the quartz upper layer was left unloaded with PM, thus
kept chemically and electrochemically inactive. This was referred to as the bilayer case B.
The sulfide/PM areal ratios relevant to case B are listed in Table III.3. Finally, a benchmark
test in which both PP and GI were simultaneously incapacitated was carried out and was
referred to as case C. It consisted of a quartz monolayer that filled the whole cylindrical
working section of the PBER after the sulfide mineral powder lower layer and the sintered-
glass filter disc were substituted by extra quartz particles. Powdered Au (50 mg) and Ag
(20 mg) were dispersed beforehand in the quartz monolayer for the benchmark test. In all of
cases A-C, to minimize adventitious losses of fine PM particles out of the PBER -especially
for the very high leaching levels-, the sintered glass discs (pore sizes < 2µm) were covered
on both sides by means of Whatman filter paper filters (porosity ˂ 1 µm).
Table III-3 Sulfide/PM areal ratios implemented in cyanidation experiments.
Areal ratio MRI-1 MRI-2 MRI-3 MRI- 4 MRI-5 MRI-6 MRI-7
MRI/Au 1476 1095 1390 1335 1138 738 1483
MRI/Ag 1263 936 1189 1142 973 631 1268
In all the experiments, the concentration of dissolved metals was measured using a Perkin
Elmer AA-800 atomic absorption spectrometer (AAS), while a capillary electrophoresis
instrument (CE, Agilent Technologies) was used to analyze the dissolved sulfur and
cyanicides (Azizi et al., 2010). The experimental analytical errors were estimated to vary
between 5% and 10% for the analyzed elements (Petre et al., 2008). Up to 4 repeat tests
under the same cyanidation operating conditions were carried out to judge of the tests’
93
reproducibility. In this work, gold and silver leaching performance was expressed in terms
of leaching conversion (or percentage) of dissolved metal with respect to the initial PM
loading. Residual (unreacted or free) cyanide was quantified using a silver nitrate titration
method with rhodamine as color-change indicator.
Although the PBER metal sulfide/PM weight ratios as used in this work do not reflect those
encountered in an industrial context, our choice of using 50 mg Au/ 4 g sulfide and 20 mg
Ag/ 4g sulfide was motivated by two factors constraints: 1) to achieve very short PBER
residence times by minimizing the amount of sulfide minerals; 2) as a requirement of the
CE protocol and its limited sensitivity, to identify the fastest kinetic steps by tracking more
accurately and in quantitative terms the most problematic cyanicides during gold leaching.
III.2.2.2. Electrochemical campaign
The electrochemical behavior of gold in electrical contact with various minerals was
studied in the same PBER using a gold/silver alloy (96%-4% by weight) electrode (Fig.
SD-1-1, supplementary data, Appendix B). The choice of this specific Au/Ag alloy
composition was explained elsewhere (Azizi et al., 2010). The gold alloy electrode, shaped
as a rectangular rod (14 mm x 3 mm x 1 mm), had an active surface area in contact with the
cyanidation medium of 1.18 cm2. The Au-Ag rod was threaded and attached to an insulated
platinum wire, itself attached to a carbon brush to maintain electrical contact between the
gold electrode and a potentiostat. The alloyed rod was inserted in the upper layer of the
working section that was packed with quartz particles.
The mineral electrodes were prepared by packing the lower part of the PBER working
section with 4 g of the targeted mineral (i.e., MRI-1 to MRI-7). A platinum spring was
inserted inside the mineral packed bed and an insulated platinum wire was used to establish
electrical contact (via a carbon brush) between the mineral layer and the potentiostat. The
PBER top and bottom layers were separated by an insulator sintered-glass disc filter to
prevent interlayer electrical contacts with the Au-Ag rod inserted in the upper quartz-
containing layer in a manner reminiscent of case A depicted above. The reference electrode
consisted of Ag/AgCl in saturated AgCl-KCl solution (+197 mV vs. standard hydrogen
electrode). A Luggin capillary tube housing the reference electrode was placed inside the
94
previously described 250 mL glass reservoir containing the NaCN solution which was
prepared using boric acid, adjusted to pH 11using NaOH, as background electrolyte. In this
three-electrode electrochemical cell configuration, the electrodes were exposed to the same
reacting solution while being recirculated through the reactor in an upward manner. Thus,
the established galvanic potentials and the galvanic corrosion currents flowing between the
upper and lower compartment pairs were recorded using the zero resistance ammeter
(ZRA) technique. A multichannel potentiostat-galvanostat (model VSP-27 from Bio-Logic
SA) was used along with EC-Lab software, allowing on-line data acquisition as time
elapses. Since Au/Ag was used as the main electrode in all our experiments, the current was
positive when the direction of electrons was from Au/Ag electrode, i.e., PM preferentially
corroding, towards the porous 3-D mineral electrode, while negative current values
corresponded to electrons moving in the opposite direction, i.e., PM cathodically protected.
Before each experiment, the Au/Ag electrode was systematically polished with sand paper,
followed by polishing with alumina particles and finally rinsed with nitric acid and distilled
water, while the platinum spring and the platinum wire were washed successively by nitric
acid and distilled water. Before starting the ZRA experiments, the gold and mineral
electrodes were maintained in aerated cyanide solution for about 30 min to allow the open
circuit potential (OCP) to stabilize.
III.3. Results and Discussion
III.3.1. Effect of Pyrite (MRI-2) on Gold and Silver Leaching
A strategy is devised to decouple and assess the contributions of passivation phenomena
(PP) and galvanic interactions (GI) on gold and silver leaching in the case of pyrite. Figs.
III.2a and III.2a` show the evolution of gold leaching as a function of time-on-stream and
of the actual (physical) time, respectively. The time on stream is expressed as multiples of
the PBER space time of the aerated cyanide solution for each circulation within the overall
loop, whereas the physical time represents the actual duration of the experiment (see
appendix C for more details).
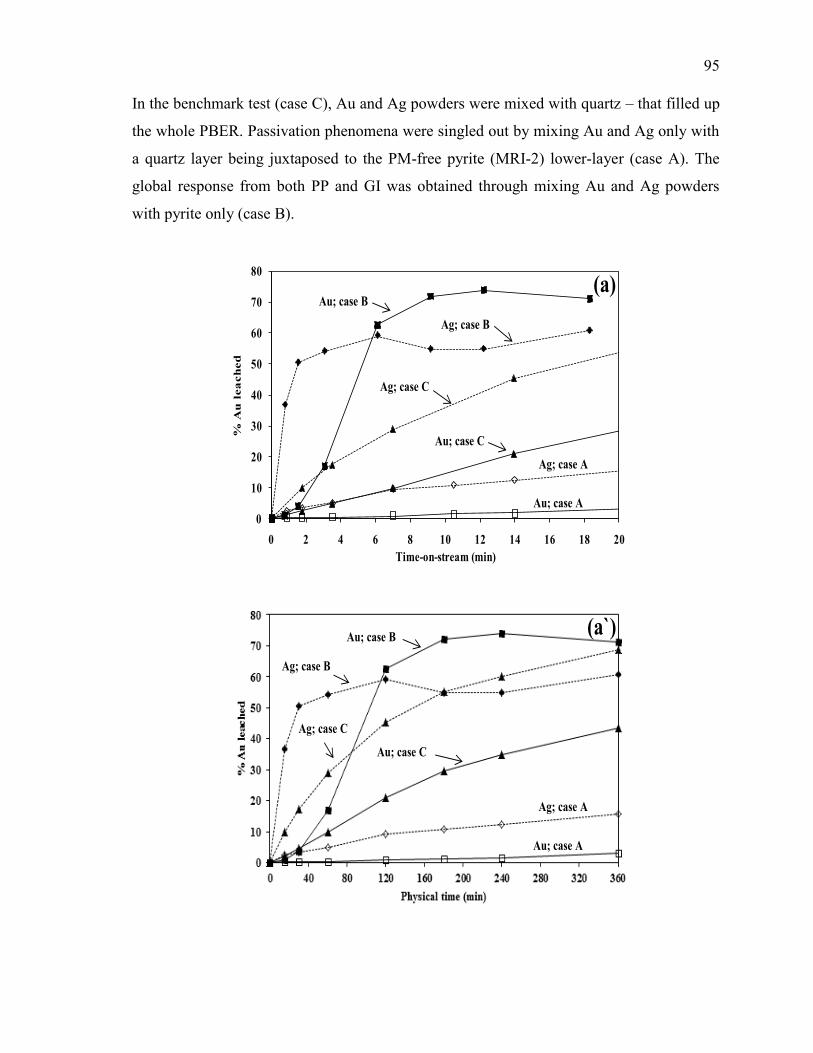
95
In the benchmark test (case C), Au and Ag powders were mixed with quartz – that filled up
the whole PBER. Passivation phenomena were singled out by mixing Au and Ag only with
a quartz layer being juxtaposed to the PM-free pyrite (MRI-2) lower-layer (case A). The
global response from both PP and GI was obtained through mixing Au and Ag powders
with pyrite only (case B).
0
10
20
30
40
50
60
70
80
0 2 4 6 8 10 12 14 16 18 20
% A
u l
ea
ch
ed
Time-on-stream (min)
Au; case B
Ag; case C
Au; case C
Ag; case A
Au; case A
Ag; case B
(a)
Au; case B
Ag; case C
Au; case C
Ag; case A
Au; case A
Ag; case B
(a`)
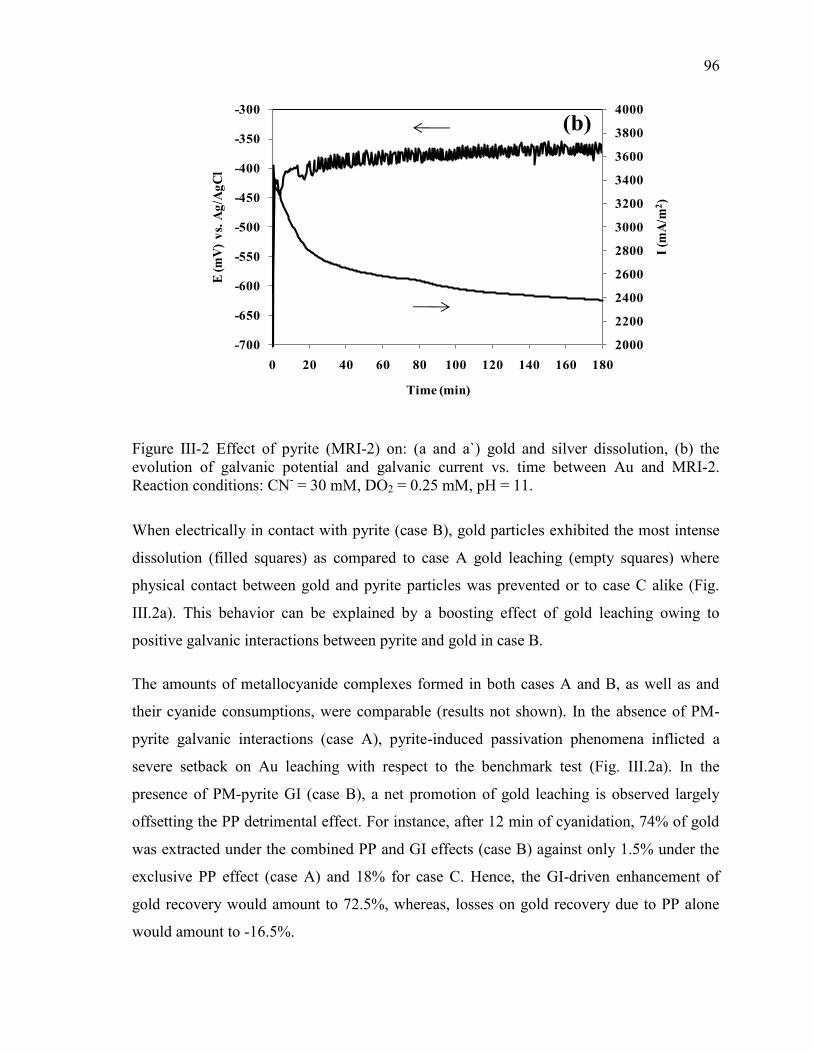
96
2000
2200
2400
2600
2800
3000
3200
3400
3600
3800
4000
-700
-650
-600
-550
-500
-450
-400
-350
-300
0 20 40 60 80 100 120 140 160 180
I (m
A/m
2)
E (m
V)
vs.
Ag
/Ag
Cl
Time (min)
(b)
Figure III-2 Effect of pyrite (MRI-2) on: (a and a`) gold and silver dissolution, (b) the
evolution of galvanic potential and galvanic current vs. time between Au and MRI-2.
Reaction conditions: CN- = 30 mM, DO2 = 0.25 mM, pH = 11.
When electrically in contact with pyrite (case B), gold particles exhibited the most intense
dissolution (filled squares) as compared to case A gold leaching (empty squares) where
physical contact between gold and pyrite particles was prevented or to case C alike (Fig.
III.2a). This behavior can be explained by a boosting effect of gold leaching owing to
positive galvanic interactions between pyrite and gold in case B.
The amounts of metallocyanide complexes formed in both cases A and B, as well as and
their cyanide consumptions, were comparable (results not shown). In the absence of PM-
pyrite galvanic interactions (case A), pyrite-induced passivation phenomena inflicted a
severe setback on Au leaching with respect to the benchmark test (Fig. III.2a). In the
presence of PM-pyrite GI (case B), a net promotion of gold leaching is observed largely
offsetting the PP detrimental effect. For instance, after 12 min of cyanidation, 74% of gold
was extracted under the combined PP and GI effects (case B) against only 1.5% under the
exclusive PP effect (case A) and 18% for case C. Hence, the GI-driven enhancement of
gold recovery would amount to 72.5%, whereas, losses on gold recovery due to PP alone
would amount to -16.5%.
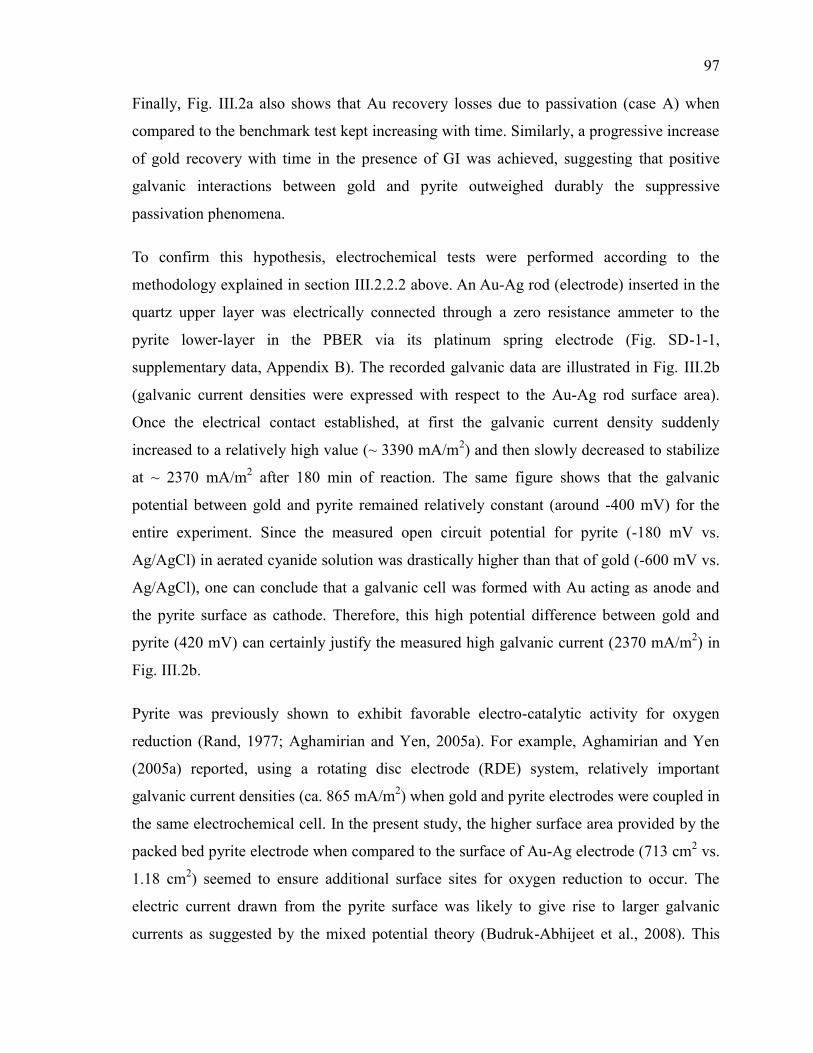
97
Finally, Fig. III.2a also shows that Au recovery losses due to passivation (case A) when
compared to the benchmark test kept increasing with time. Similarly, a progressive increase
of gold recovery with time in the presence of GI was achieved, suggesting that positive
galvanic interactions between gold and pyrite outweighed durably the suppressive
passivation phenomena.
To confirm this hypothesis, electrochemical tests were performed according to the
methodology explained in section III.2.2.2 above. An Au-Ag rod (electrode) inserted in the
quartz upper layer was electrically connected through a zero resistance ammeter to the
pyrite lower-layer in the PBER via its platinum spring electrode (Fig. SD-1-1,
supplementary data, Appendix B). The recorded galvanic data are illustrated in Fig. III.2b
(galvanic current densities were expressed with respect to the Au-Ag rod surface area).
Once the electrical contact established, at first the galvanic current density suddenly
increased to a relatively high value (~ 3390 mA/m2) and then slowly decreased to stabilize
at ~ 2370 mA/m2 after 180 min of reaction. The same figure shows that the galvanic
potential between gold and pyrite remained relatively constant (around -400 mV) for the
entire experiment. Since the measured open circuit potential for pyrite (-180 mV vs.
Ag/AgCl) in aerated cyanide solution was drastically higher than that of gold (-600 mV vs.
Ag/AgCl), one can conclude that a galvanic cell was formed with Au acting as anode and
the pyrite surface as cathode. Therefore, this high potential difference between gold and
pyrite (420 mV) can certainly justify the measured high galvanic current (2370 mA/m2) in
Fig. III.2b.
Pyrite was previously shown to exhibit favorable electro-catalytic activity for oxygen
reduction (Rand, 1977; Aghamirian and Yen, 2005a). For example, Aghamirian and Yen
(2005a) reported, using a rotating disc electrode (RDE) system, relatively important
galvanic current densities (ca. 865 mA/m2) when gold and pyrite electrodes were coupled in
the same electrochemical cell. In the present study, the higher surface area provided by the
packed bed pyrite electrode when compared to the surface of Au-Ag electrode (713 cm2 vs.
1.18 cm2) seemed to ensure additional surface sites for oxygen reduction to occur. The
electric current drawn from the pyrite surface was likely to give rise to larger galvanic
currents as suggested by the mixed potential theory (Budruk-Abhijeet et al., 2008). This
98
was confirmed by the important current density recorded in Fig. III.2b. The decrease of
galvanic current density as time elapsed (Fig. III.2b) could be attributed to the formation of
passivating films and/or increase of passivation thickness on gold surface following the
release of several sulfide and iron species from the pyrite layer. The gold OCP shifted with
time to nobler values resulting in subsequent decrease of the potential difference with
respect to pyrite. On the other hand, a possible progressive formation of a protective layer
on the pyrite surface (likely ferric hydroxide) may reduce its activity toward oxygen
reduction which would also be reflected on the galvanic current.
Regarding silver cyanidation, it is clear from Fig. III.2a that when in electrical contact with
pyrite, Ag dissolves much faster (solid diamonds, case B) then when placed in an
electrochemically inauspicious environment (empty diamonds, case A) or when under
benchmark test conditions (solid triangles, case C). Furthermore, Fig. III.2a shows that the
positive galvanic effects between Ag and pyrite play the most important role in the leaching
kinetics of the former. It can be seen that under combined GI and PP effects, silver recovery
after 4 min of cyanidation had already amounted to ca. 90% of that accumulated after 20
min (case B); the latter representing more than 60 % of the total available Ag being leached
out. On the contrary, under the exclusive influence of PP (case A), only 15% of available
silver leached off after 20 min of cyanidation. Hence, as in the case of gold, galvanic
corrosion had a tremendous positive effect on silver dissolution, not only that the
detrimental effect of passivation was neutralized but also an important acceleration of Ag
dissolution rate was prompted. The effect of Au/Pyrite and Ag/pyrite galvanic associations
on the speciation of pyrite reaction products species are illustrated in Fig. SD-1-2
(supplementary data, appendix B).
III.3.2. Effect of Chalcopyrite (MRI-3) on Gold and Silver Leaching
The effect of chalcopyrite (MRI-3) on PM recovery was also investigated in both presence
(case B) and absence (case A) of permanent galvanic contacts. As illustrated in Fig. III.3a,
mixing PM and MRI-3 in the same layer (case B) led to measured gold recovery (solid
squares) higher than the one obtained in the benchmark test (solid triangles). However, Au
recovery remained low (ca. 31% after 12 min) in comparison with the sibling case B for
pyrite (Fig. III.2a). This important setback in gold leaching rate was qualitatively similar to
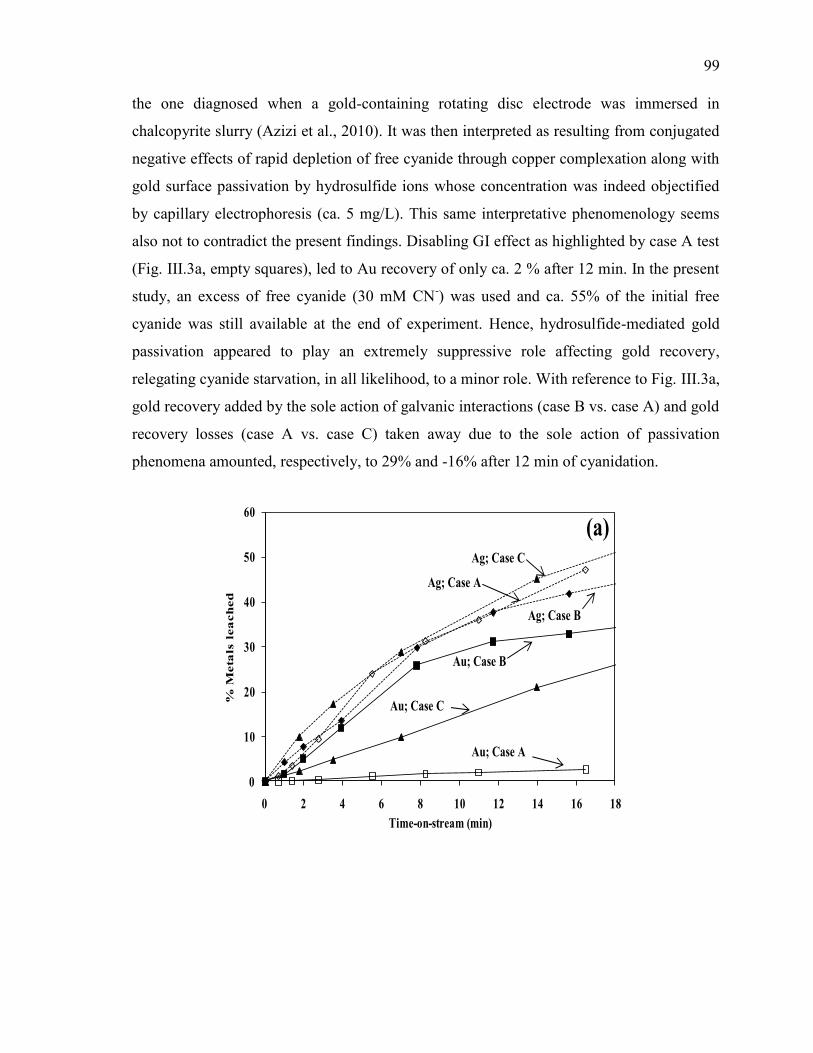
99
the one diagnosed when a gold-containing rotating disc electrode was immersed in
chalcopyrite slurry (Azizi et al., 2010). It was then interpreted as resulting from conjugated
negative effects of rapid depletion of free cyanide through copper complexation along with
gold surface passivation by hydrosulfide ions whose concentration was indeed objectified
by capillary electrophoresis (ca. 5 mg/L). This same interpretative phenomenology seems
also not to contradict the present findings. Disabling GI effect as highlighted by case A test
(Fig. III.3a, empty squares), led to Au recovery of only ca. 2 % after 12 min. In the present
study, an excess of free cyanide (30 mM CN-) was used and ca. 55% of the initial free
cyanide was still available at the end of experiment. Hence, hydrosulfide-mediated gold
passivation appeared to play an extremely suppressive role affecting gold recovery,
relegating cyanide starvation, in all likelihood, to a minor role. With reference to Fig. III.3a,
gold recovery added by the sole action of galvanic interactions (case B vs. case A) and gold
recovery losses (case A vs. case C) taken away due to the sole action of passivation
phenomena amounted, respectively, to 29% and -16% after 12 min of cyanidation.
0
10
20
30
40
50
60
0 2 4 6 8 10 12 14 16 18
% M
eta
ls l
ea
ch
ed
Time-on-stream (min)
Ag; Case C
Ag; Case A
Ag; Case B
Au; Case B
Au; Case A
Au; Case C
(a)
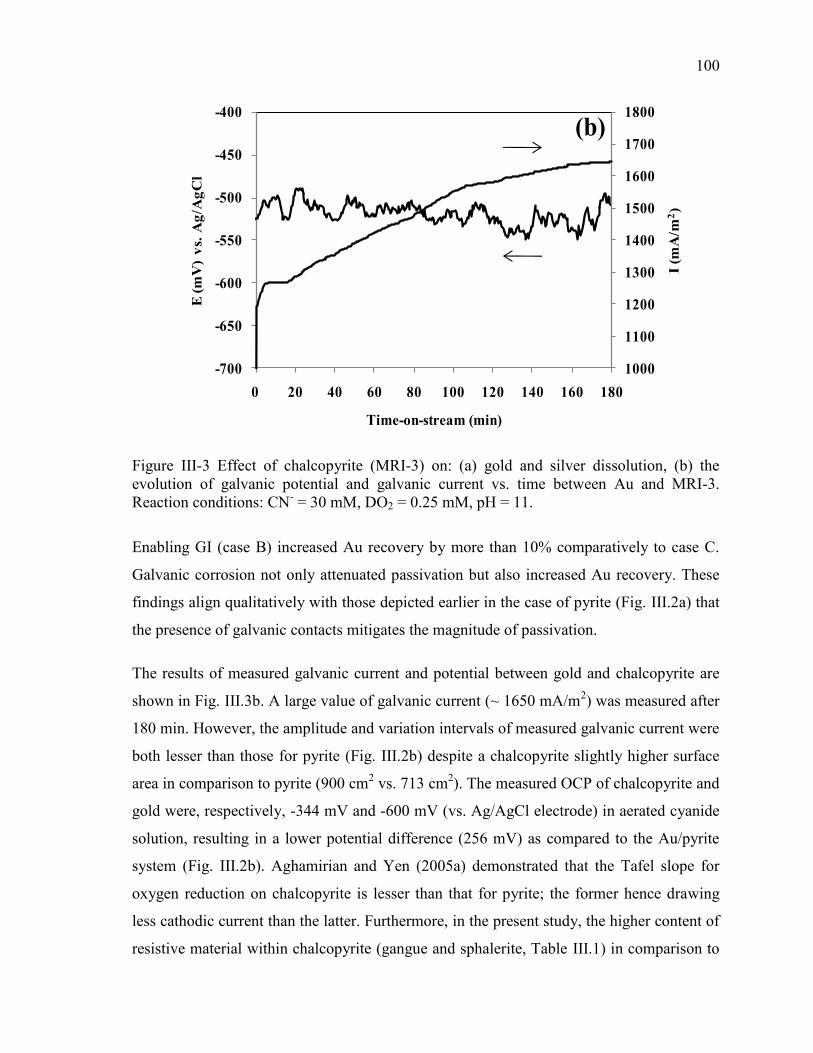
100
1000
1100
1200
1300
1400
1500
1600
1700
1800
-700
-650
-600
-550
-500
-450
-400
0 20 40 60 80 100 120 140 160 180
I (m
A/m
2)
E (m
V)
vs.
Ag
/Ag
Cl
Time-on-stream (min)
(b)
Figure III-3 Effect of chalcopyrite (MRI-3) on: (a) gold and silver dissolution, (b) the
evolution of galvanic potential and galvanic current vs. time between Au and MRI-3.
Reaction conditions: CN- = 30 mM, DO2 = 0.25 mM, pH = 11.
Enabling GI (case B) increased Au recovery by more than 10% comparatively to case C.
Galvanic corrosion not only attenuated passivation but also increased Au recovery. These
findings align qualitatively with those depicted earlier in the case of pyrite (Fig. III.2a) that
the presence of galvanic contacts mitigates the magnitude of passivation.
The results of measured galvanic current and potential between gold and chalcopyrite are
shown in Fig. III.3b. A large value of galvanic current (~ 1650 mA/m2) was measured after
180 min. However, the amplitude and variation intervals of measured galvanic current were
both lesser than those for pyrite (Fig. III.2b) despite a chalcopyrite slightly higher surface
area in comparison to pyrite (900 cm2 vs. 713 cm
2). The measured OCP of chalcopyrite and
gold were, respectively, -344 mV and -600 mV (vs. Ag/AgCl electrode) in aerated cyanide
solution, resulting in a lower potential difference (256 mV) as compared to the Au/pyrite
system (Fig. III.2b). Aghamirian and Yen (2005a) demonstrated that the Tafel slope for
oxygen reduction on chalcopyrite is lesser than that for pyrite; the former hence drawing
less cathodic current than the latter. Furthermore, in the present study, the higher content of
resistive material within chalcopyrite (gangue and sphalerite, Table III.1) in comparison to
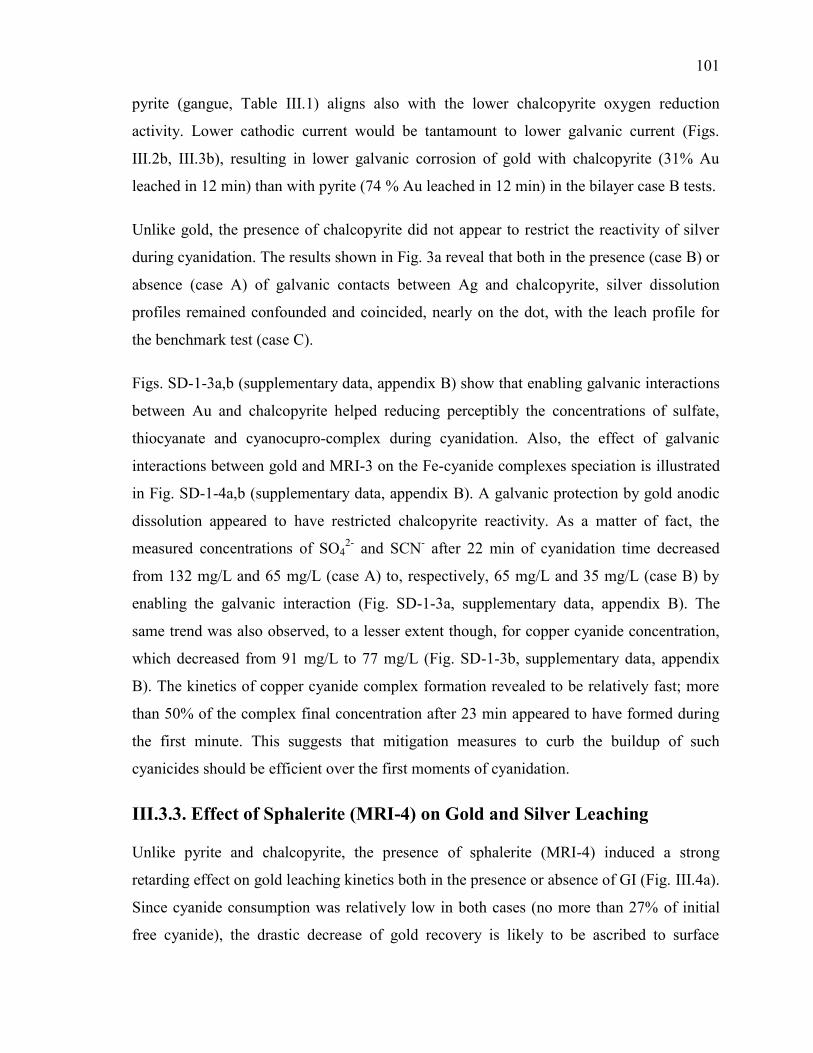
101
pyrite (gangue, Table III.1) aligns also with the lower chalcopyrite oxygen reduction
activity. Lower cathodic current would be tantamount to lower galvanic current (Figs.
III.2b, III.3b), resulting in lower galvanic corrosion of gold with chalcopyrite (31% Au
leached in 12 min) than with pyrite (74 % Au leached in 12 min) in the bilayer case B tests.
Unlike gold, the presence of chalcopyrite did not appear to restrict the reactivity of silver
during cyanidation. The results shown in Fig. 3a reveal that both in the presence (case B) or
absence (case A) of galvanic contacts between Ag and chalcopyrite, silver dissolution
profiles remained confounded and coincided, nearly on the dot, with the leach profile for
the benchmark test (case C).
Figs. SD-1-3a,b (supplementary data, appendix B) show that enabling galvanic interactions
between Au and chalcopyrite helped reducing perceptibly the concentrations of sulfate,
thiocyanate and cyanocupro-complex during cyanidation. Also, the effect of galvanic
interactions between gold and MRI-3 on the Fe-cyanide complexes speciation is illustrated
in Fig. SD-1-4a,b (supplementary data, appendix B). A galvanic protection by gold anodic
dissolution appeared to have restricted chalcopyrite reactivity. As a matter of fact, the
measured concentrations of SO42-
and SCN- after 22 min of cyanidation time decreased
from 132 mg/L and 65 mg/L (case A) to, respectively, 65 mg/L and 35 mg/L (case B) by
enabling the galvanic interaction (Fig. SD-1-3a, supplementary data, appendix B). The
same trend was also observed, to a lesser extent though, for copper cyanide concentration,
which decreased from 91 mg/L to 77 mg/L (Fig. SD-1-3b, supplementary data, appendix
B). The kinetics of copper cyanide complex formation revealed to be relatively fast; more
than 50% of the complex final concentration after 23 min appeared to have formed during
the first minute. This suggests that mitigation measures to curb the buildup of such
cyanicides should be efficient over the first moments of cyanidation.
III.3.3. Effect of Sphalerite (MRI-4) on Gold and Silver Leaching
Unlike pyrite and chalcopyrite, the presence of sphalerite (MRI-4) induced a strong
retarding effect on gold leaching kinetics both in the presence or absence of GI (Fig. III.4a).
Since cyanide consumption was relatively low in both cases (no more than 27% of initial
free cyanide), the drastic decrease of gold recovery is likely to be ascribed to surface
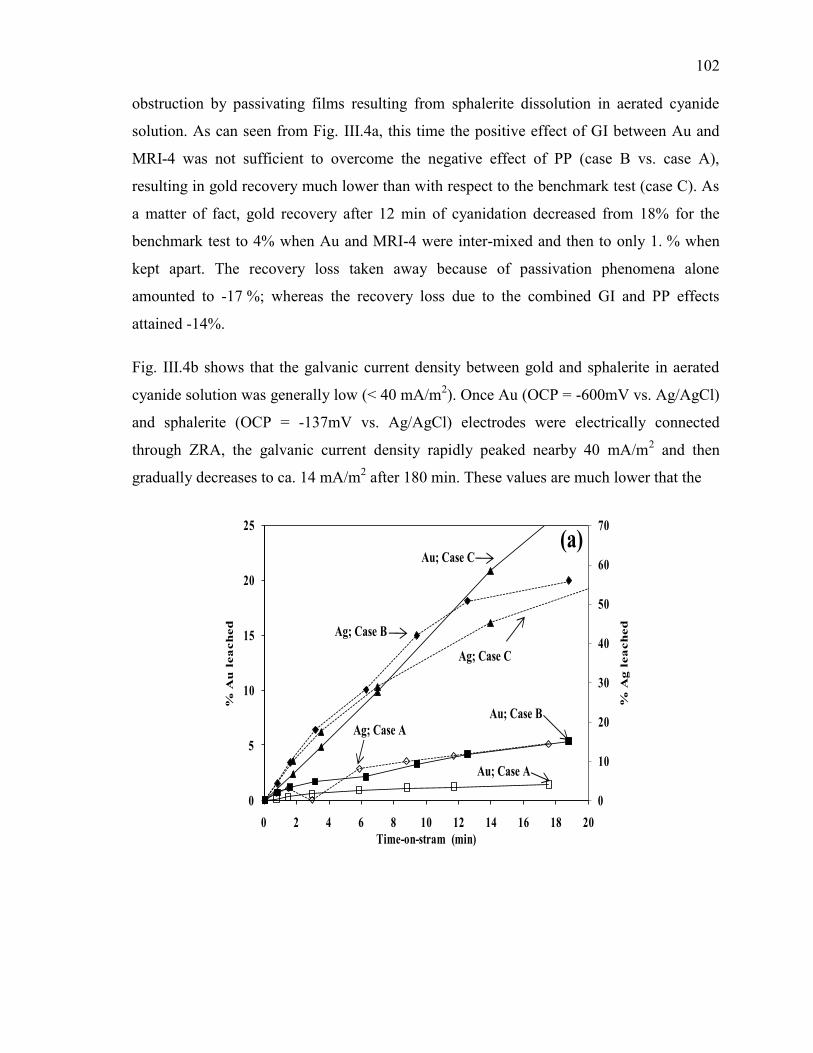
102
obstruction by passivating films resulting from sphalerite dissolution in aerated cyanide
solution. As can seen from Fig. III.4a, this time the positive effect of GI between Au and
MRI-4 was not sufficient to overcome the negative effect of PP (case B vs. case A),
resulting in gold recovery much lower than with respect to the benchmark test (case C). As
a matter of fact, gold recovery after 12 min of cyanidation decreased from 18% for the
benchmark test to 4% when Au and MRI-4 were inter-mixed and then to only 1. % when
kept apart. The recovery loss taken away because of passivation phenomena alone
amounted to -17 %; whereas the recovery loss due to the combined GI and PP effects
attained -14%.
Fig. III.4b shows that the galvanic current density between gold and sphalerite in aerated
cyanide solution was generally low (< 40 mA/m2). Once Au (OCP = -600mV vs. Ag/AgCl)
and sphalerite (OCP = -137mV vs. Ag/AgCl) electrodes were electrically connected
through ZRA, the galvanic current density rapidly peaked nearby 40 mA/m2 and then
gradually decreases to ca. 14 mA/m2 after 180 min. These values are much lower that the
0
10
20
30
40
50
60
70
0
5
10
15
20
25
0 2 4 6 8 10 12 14 16 18 20
% A
g l
ea
ch
ed
% A
u l
ea
ch
ed
Time-on-stram (min)
Au; Case C
Ag; Case B
Ag; Case C
Ag; Case A
Au; Case B
Au; Case A
(a)
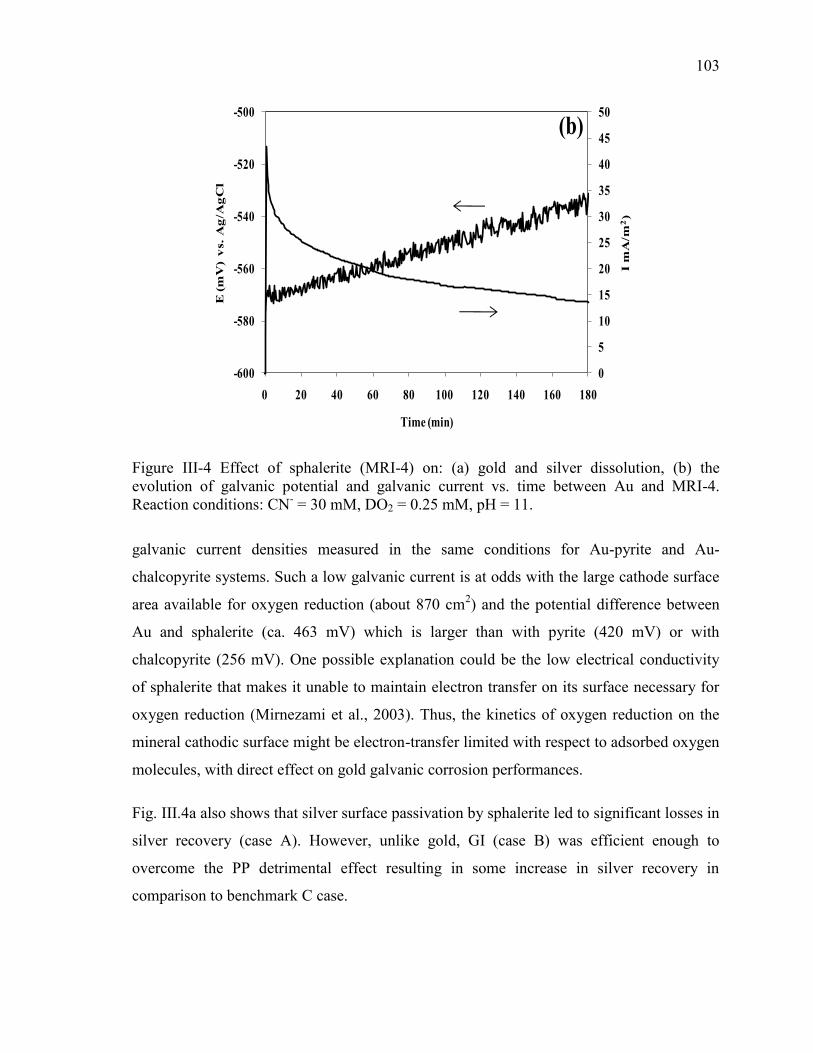
103
0
5
10
15
20
25
30
35
40
45
50
-600
-580
-560
-540
-520
-500
0 20 40 60 80 100 120 140 160 180
I m
A/m
2)
E (m
V)
vs.
Ag
/Ag
Cl
Time (min)
(b)
Figure III-4 Effect of sphalerite (MRI-4) on: (a) gold and silver dissolution, (b) the
evolution of galvanic potential and galvanic current vs. time between Au and MRI-4.
Reaction conditions: CN- = 30 mM, DO2 = 0.25 mM, pH = 11.
galvanic current densities measured in the same conditions for Au-pyrite and Au-
chalcopyrite systems. Such a low galvanic current is at odds with the large cathode surface
area available for oxygen reduction (about 870 cm2) and the potential difference between
Au and sphalerite (ca. 463 mV) which is larger than with pyrite (420 mV) or with
chalcopyrite (256 mV). One possible explanation could be the low electrical conductivity
of sphalerite that makes it unable to maintain electron transfer on its surface necessary for
oxygen reduction (Mirnezami et al., 2003). Thus, the kinetics of oxygen reduction on the
mineral cathodic surface might be electron-transfer limited with respect to adsorbed oxygen
molecules, with direct effect on gold galvanic corrosion performances.
Fig. III.4a also shows that silver surface passivation by sphalerite led to significant losses in
silver recovery (case A). However, unlike gold, GI (case B) was efficient enough to
overcome the PP detrimental effect resulting in some increase in silver recovery in
comparison to benchmark C case.
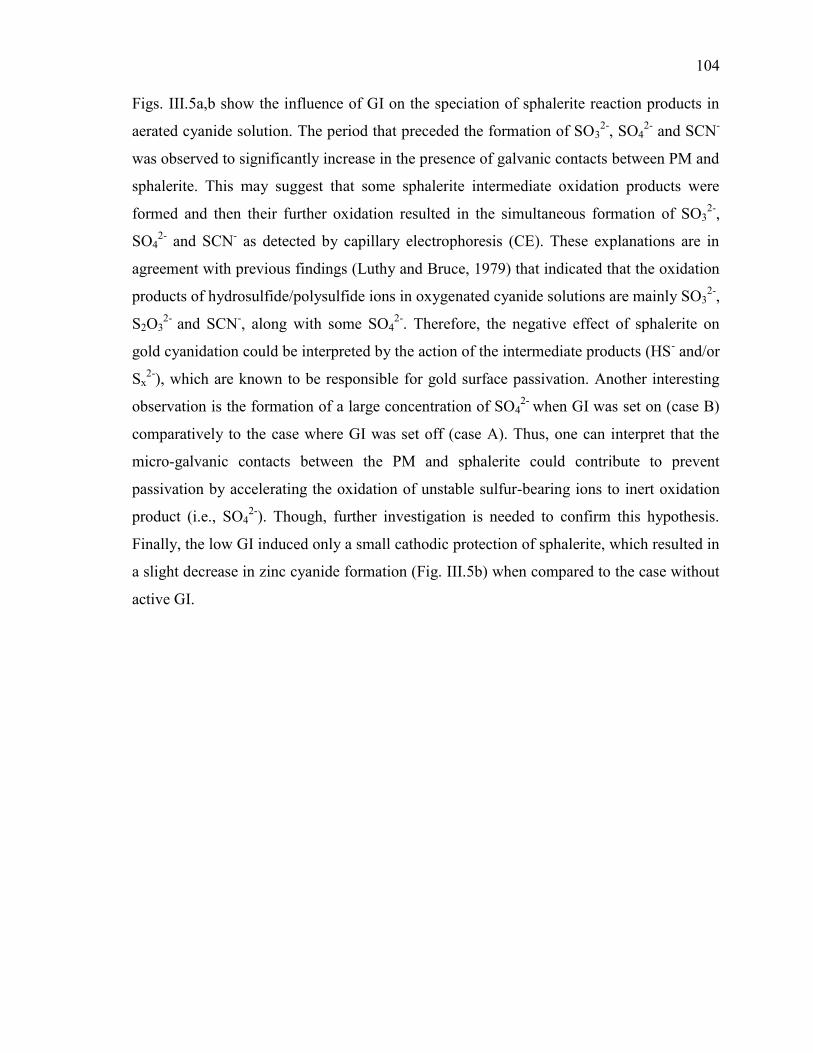
104
Figs. III.5a,b show the influence of GI on the speciation of sphalerite reaction products in
aerated cyanide solution. The period that preceded the formation of SO32-
, SO42-
and SCN-
was observed to significantly increase in the presence of galvanic contacts between PM and
sphalerite. This may suggest that some sphalerite intermediate oxidation products were
formed and then their further oxidation resulted in the simultaneous formation of SO32-
,
SO42-
and SCN- as detected by capillary electrophoresis (CE). These explanations are in
agreement with previous findings (Luthy and Bruce, 1979) that indicated that the oxidation
products of hydrosulfide/polysulfide ions in oxygenated cyanide solutions are mainly SO32-
,
S2O32-
and SCN-, along with some SO4
2-. Therefore, the negative effect of sphalerite on
gold cyanidation could be interpreted by the action of the intermediate products (HS- and/or
Sx2-
), which are known to be responsible for gold surface passivation. Another interesting
observation is the formation of a large concentration of SO42-
when GI was set on (case B)
comparatively to the case where GI was set off (case A). Thus, one can interpret that the
micro-galvanic contacts between the PM and sphalerite could contribute to prevent
passivation by accelerating the oxidation of unstable sulfur-bearing ions to inert oxidation
product (i.e., SO42-
). Though, further investigation is needed to confirm this hypothesis.
Finally, the low GI induced only a small cathodic protection of sphalerite, which resulted in
a slight decrease in zinc cyanide formation (Fig. III.5b) when compared to the case without
active GI.
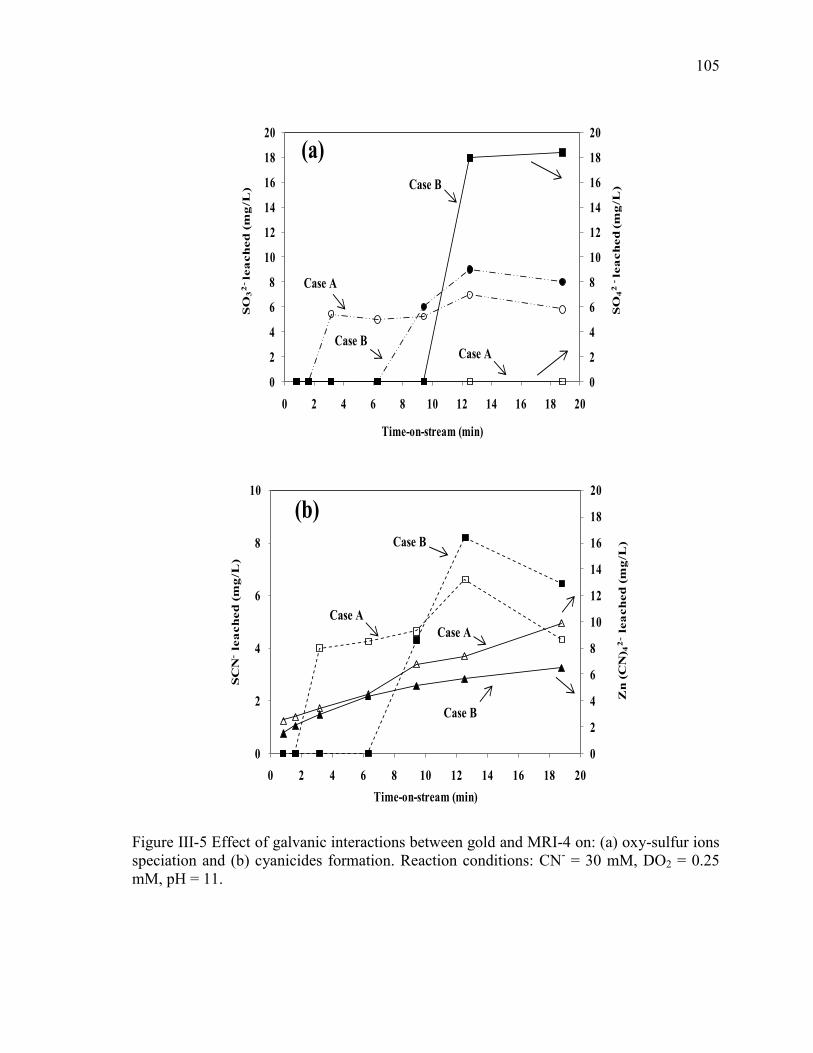
105
0
2
4
6
8
10
12
14
16
18
20
0
2
4
6
8
10
12
14
16
18
20
0 2 4 6 8 10 12 14 16 18 20
SO
42
-le
ach
ed
(m
g/L
)
SO
32
-le
ach
ed
(m
g/L
)
Time-on-stream (min)
Case B
Case ACase B
Case A
(a)
0
2
4
6
8
10
12
14
16
18
20
0
2
4
6
8
10
0 2 4 6 8 10 12 14 16 18 20
Zn
(C
N) 4
2-
lea
ch
ed
(m
g/L
)
SC
N-
lea
ch
ed
(m
g/L
)
Time-on-stream (min)
Case B
Case A
Case A
Case B
(b)
Figure III-5 Effect of galvanic interactions between gold and MRI-4 on: (a) oxy-sulfur ions
speciation and (b) cyanicides formation. Reaction conditions: CN- = 30 mM, DO2 = 0.25
mM, pH = 11.
106
III.3.4. Effect of Chalcocite (MRI-5) on Gold and Silver Leaching
The effect of chalcocite on the gold leaching kinetics was also investigated and the results
are shown in Fig. III.6a. Gold dissolution was for all practical purposes quasi-nil (0.65 %)
after 20 min of cyanidation when gold and chalcocite were in contact (case B, solid
squares), whilst in case A when no contacts were allowed gold dissolution was completely
blocked (empty squares). Two striking features accredited to chalcocite were depletion of
free cyanide and surface passivation of gold. Unlike for the previous sulfides tested in this
study, virtually the whole available cyanide was consumed after 20 min in the case of
chalcocite. In addition, case B galvanic corrosion was next to helpless leading to tiny Au
dissolution as compared to case A leaching test.
Regardless of PBER modality, i.e., whether GI disabled or enabled, silver dissolution was
below detection limits (data not shown) which was explained, as will be discussed next, by
HS--driven passivation of silver surfaces. The role of hydrosulfide in reacting with silver
ions to yield stable Ag2S was already discussed in the literature (Licht, 1988).
Fig. III.6b shows the time evolution of the galvanic potential and current for the Au-
chalcocite assemblage. Although with comparable surface area (about 740 cm2) to that of
pyrite, chalcocite showed a very low negative galvanic current, rapidly decreasing from 68
mA/m2 (absolute value) at the beginning of the test to nearly plateauing around 20 mA/m
2
(absolute value). After 40 min, it again suddenly increased to ca. 76 mA/m2 (absolute
value) then gradually decreasing back to ca. 16 mA/m2 (absolute value) towards the end.
With time, the galvanic potential shifted to less negative values indicating ennoblement or
passivation of gold (Blasco-Tamarit et al., 2009). The galvanic current density being
negative in addition to chalcocite OCP (-722 mV vs. Ag/AgCl) being more negative than
Au’s (-600 mV vs. Ag/AgCl) both pointed out to chalcocite taking part in a prevailing
anodic process. However, this appears to be in contradiction with the small beneficial effect
of the Au/MRI-5 galvanic contact on gold recovery observed in Fig. III.6a (case B vs. case
A).
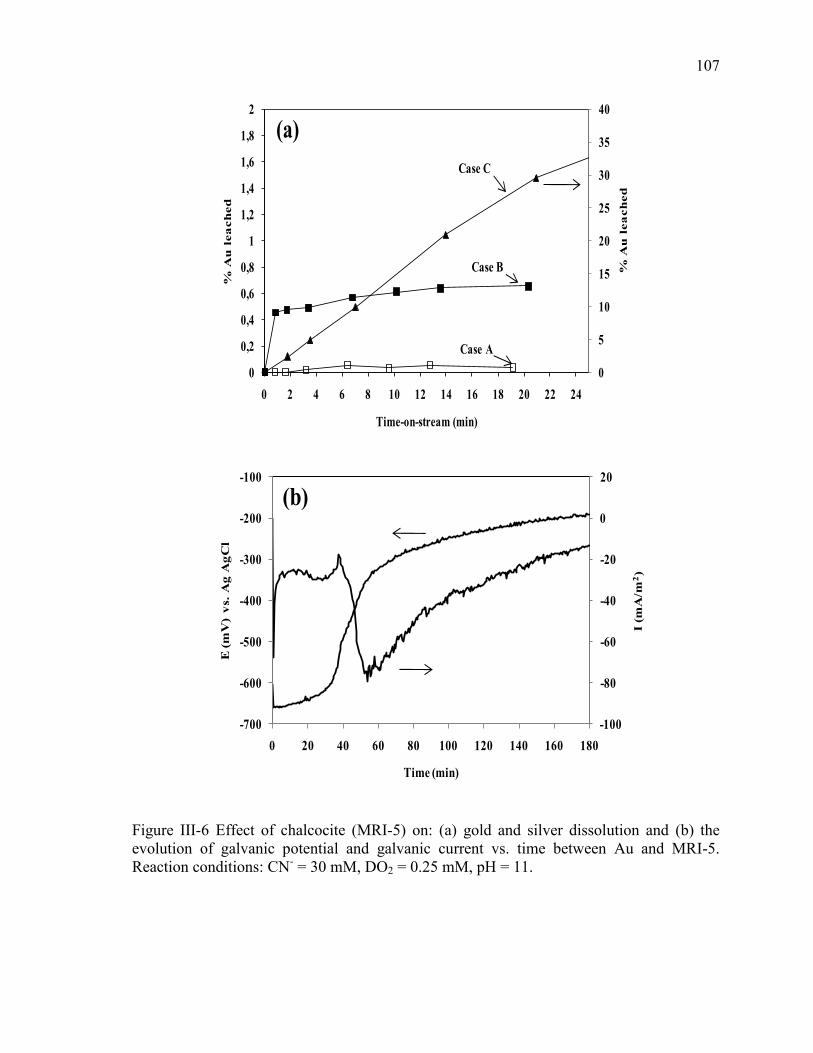
107
0
5
10
15
20
25
30
35
40
0
0,2
0,4
0,6
0,8
1
1,2
1,4
1,6
1,8
2
0 2 4 6 8 10 12 14 16 18 20 22 24
% A
u l
ea
ch
ed
% A
u l
ea
ch
ed
Time-on-stream (min)
Case C
Case B
Case A
(a)
-100
-80
-60
-40
-20
0
20
-700
-600
-500
-400
-300
-200
-100
0 20 40 60 80 100 120 140 160 180
I (
mA
/m2)
E (m
V)
vs.
Ag
Ag
Cl
Time (min)
(b)
Figure III-6 Effect of chalcocite (MRI-5) on: (a) gold and silver dissolution and (b) the
evolution of galvanic potential and galvanic current vs. time between Au and MRI-5.
Reaction conditions: CN- = 30 mM, DO2 = 0.25 mM, pH = 11.
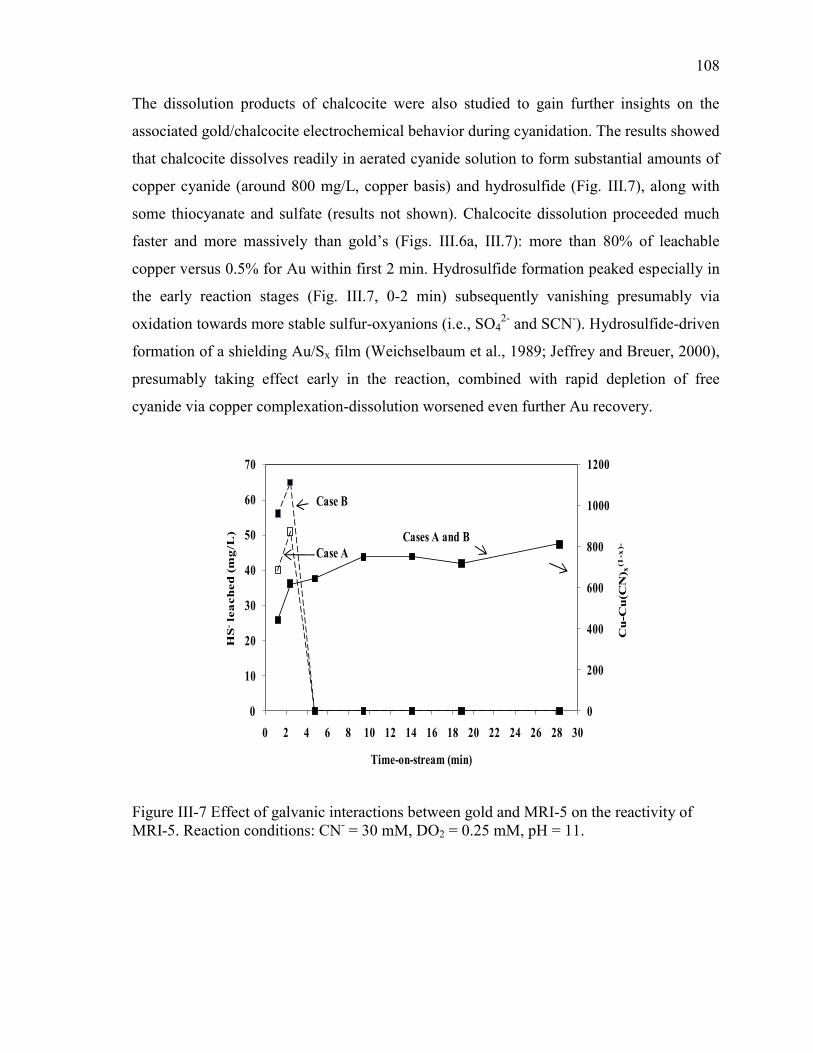
108
The dissolution products of chalcocite were also studied to gain further insights on the
associated gold/chalcocite electrochemical behavior during cyanidation. The results showed
that chalcocite dissolves readily in aerated cyanide solution to form substantial amounts of
copper cyanide (around 800 mg/L, copper basis) and hydrosulfide (Fig. III.7), along with
some thiocyanate and sulfate (results not shown). Chalcocite dissolution proceeded much
faster and more massively than gold’s (Figs. III.6a, III.7): more than 80% of leachable
copper versus 0.5% for Au within first 2 min. Hydrosulfide formation peaked especially in
the early reaction stages (Fig. III.7, 0-2 min) subsequently vanishing presumably via
oxidation towards more stable sulfur-oxyanions (i.e., SO42-
and SCN-). Hydrosulfide-driven
formation of a shielding Au/Sx film (Weichselbaum et al., 1989; Jeffrey and Breuer, 2000),
presumably taking effect early in the reaction, combined with rapid depletion of free
cyanide via copper complexation-dissolution worsened even further Au recovery.
0
200
400
600
800
1000
1200
0
10
20
30
40
50
60
70
0 2 4 6 8 10 12 14 16 18 20 22 24 26 28 30
Cu
-Cu
(CN
) x(1
-x)-
HS
-le
ach
ed
(m
g/L
)
Time-on-stream (min)
Cases A and B
Case A
Case B
Figure III-7 Effect of galvanic interactions between gold and MRI-5 on the reactivity of
MRI-5. Reaction conditions: CN- = 30 mM, DO2 = 0.25 mM, pH = 11.
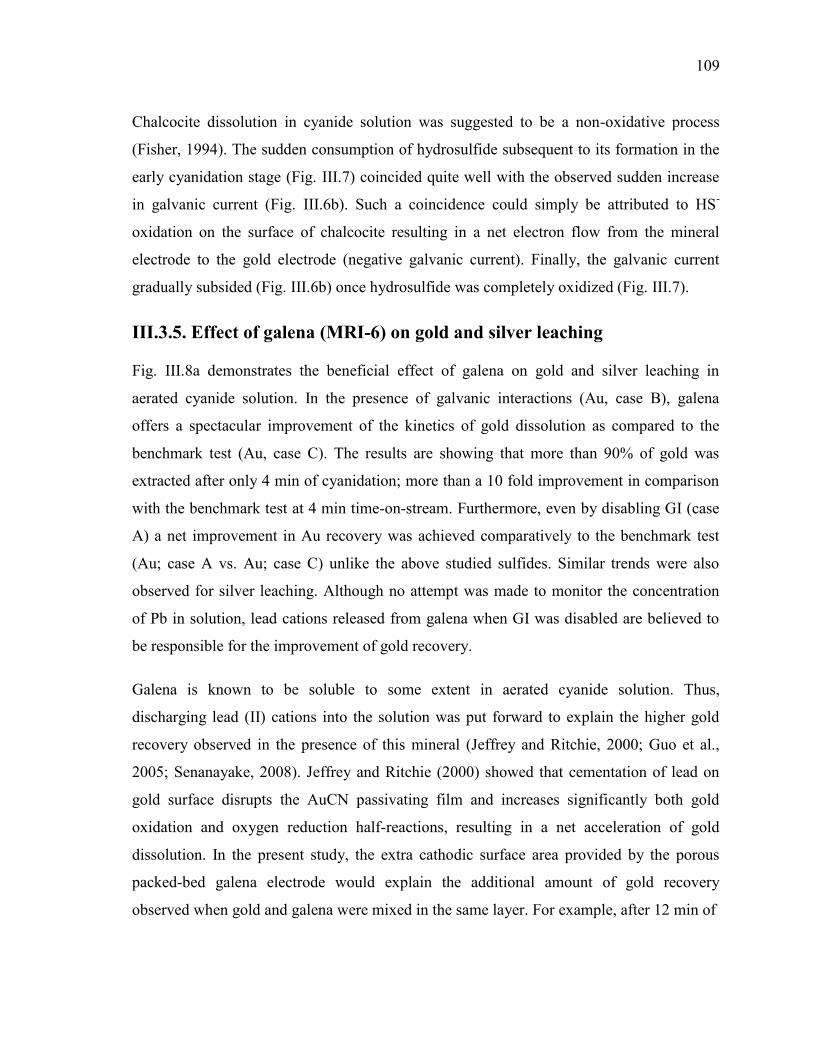
109
Chalcocite dissolution in cyanide solution was suggested to be a non-oxidative process
(Fisher, 1994). The sudden consumption of hydrosulfide subsequent to its formation in the
early cyanidation stage (Fig. III.7) coincided quite well with the observed sudden increase
in galvanic current (Fig. III.6b). Such a coincidence could simply be attributed to HS-
oxidation on the surface of chalcocite resulting in a net electron flow from the mineral
electrode to the gold electrode (negative galvanic current). Finally, the galvanic current
gradually subsided (Fig. III.6b) once hydrosulfide was completely oxidized (Fig. III.7).
III.3.5. Effect of galena (MRI-6) on gold and silver leaching
Fig. III.8a demonstrates the beneficial effect of galena on gold and silver leaching in
aerated cyanide solution. In the presence of galvanic interactions (Au, case B), galena
offers a spectacular improvement of the kinetics of gold dissolution as compared to the
benchmark test (Au, case C). The results are showing that more than 90% of gold was
extracted after only 4 min of cyanidation; more than a 10 fold improvement in comparison
with the benchmark test at 4 min time-on-stream. Furthermore, even by disabling GI (case
A) a net improvement in Au recovery was achieved comparatively to the benchmark test
(Au; case A vs. Au; case C) unlike the above studied sulfides. Similar trends were also
observed for silver leaching. Although no attempt was made to monitor the concentration
of Pb in solution, lead cations released from galena when GI was disabled are believed to
be responsible for the improvement of gold recovery.
Galena is known to be soluble to some extent in aerated cyanide solution. Thus,
discharging lead (II) cations into the solution was put forward to explain the higher gold
recovery observed in the presence of this mineral (Jeffrey and Ritchie, 2000; Guo et al.,
2005; Senanayake, 2008). Jeffrey and Ritchie (2000) showed that cementation of lead on
gold surface disrupts the AuCN passivating film and increases significantly both gold
oxidation and oxygen reduction half-reactions, resulting in a net acceleration of gold
dissolution. In the present study, the extra cathodic surface area provided by the porous
packed-bed galena electrode would explain the additional amount of gold recovery
observed when gold and galena were mixed in the same layer. For example, after 12 min of
110
0
10
20
30
40
50
60
70
80
90
100
0 2 4 6 8 10 12 14 16 18 20
% L
ea
ch
ed
meta
ls
Time-on-stream (min)
Ag; Case B
Au; Case B
Ag; Case A
Ag; Case C
Au; Case C
Au; Case A
(a)
1200
1300
1400
1500
1600
1700
-660
-640
-620
-600
-580
-560
0 20 40 60 80 100 120 140 160 180
I (m
A/m
2)
E (m
V)
vs.
Ag
/Ag
Cl
Time (min)
(b)
Figure III-8 Effect of galena (MRI-6) on: (a) gold and silver dissolution and (b) the
evolution of galvanic potential and galvanic current vs. time between Au and MRI-6.
Reaction conditions: CN- = 30 mM, DO2 = 0.25 mM, pH = 11.
111
cyanidation gold recovery soared from 18% in the benchmark test to 68% with the GI
disabled (case A) and then to over 90% with GI enabled (case B). It can be suggested that
galena has a double positive effect on gold leaching: i) activation of gold surface by
dissolved species improving by up to 40% gold recovery; ii) acceleration of gold leaching
rate by positive GI prompting a further 22% gain in gold recovery.
The galvanic corrosion current density and potential registered in aerated cyanide solution
for the gold (OCP = -600 mV vs. Ag/AgCl) and galena (OCP = -110 mV vs. Ag/AgCl) pair
are presented in Fig. III.8b. The galvanic current density rapidly plateaued at a relatively
high value (~1560 mA/m2) and remained constant for all the duration of the experiment.
Lower galvanic current and larger OCP difference between gold and galena contrasted with
those corresponding to the gold-pyrite galvanic couple (Figs. III.2b and III.8b). This is not
unlikely knowing that the surface area used for the galena packed bed electrode (about 480
cm2) is lower than that for pyrite (730 cm
2). Furthermore, Aghamirian and Yen (2005a)
also demonstrated that the reduction of oxygen occurs more easily on the surface of pyrite
than on the surface of galena. In other words, the magnitude of galvanic current is limited
by the extent of the half reaction of oxygen reduction.
Fig. III.8a shows that galena also had a remarkably promoting effect on the kinetics of
silver dissolution. Under combined GI and PP effects, the maximum recorded silver
recovery (90%) was attained after only 4 min of cyanidation. In the absence of GI, a 70%
Ag recovery was recorded after 14 min, in excess of that of the benchmark test (45%).
III.3.6. Effect of stibnite (MRI-7) on gold and silver leaching
Gold extraction profiles in the presence of Stibnite (MRI-7) are illustrated in Fig. III.9a.
The results show that in both the presence and absence of gold-stibnite GI, stibnite severely
hindered gold leaching kinetics. The dissolution of gold was marginally promoted by
enabling galvanic interactions (case B) in comparison to the case with disabled GI (case A),
though in both instances, gold recovery was much less than in the benchmark test (case C).
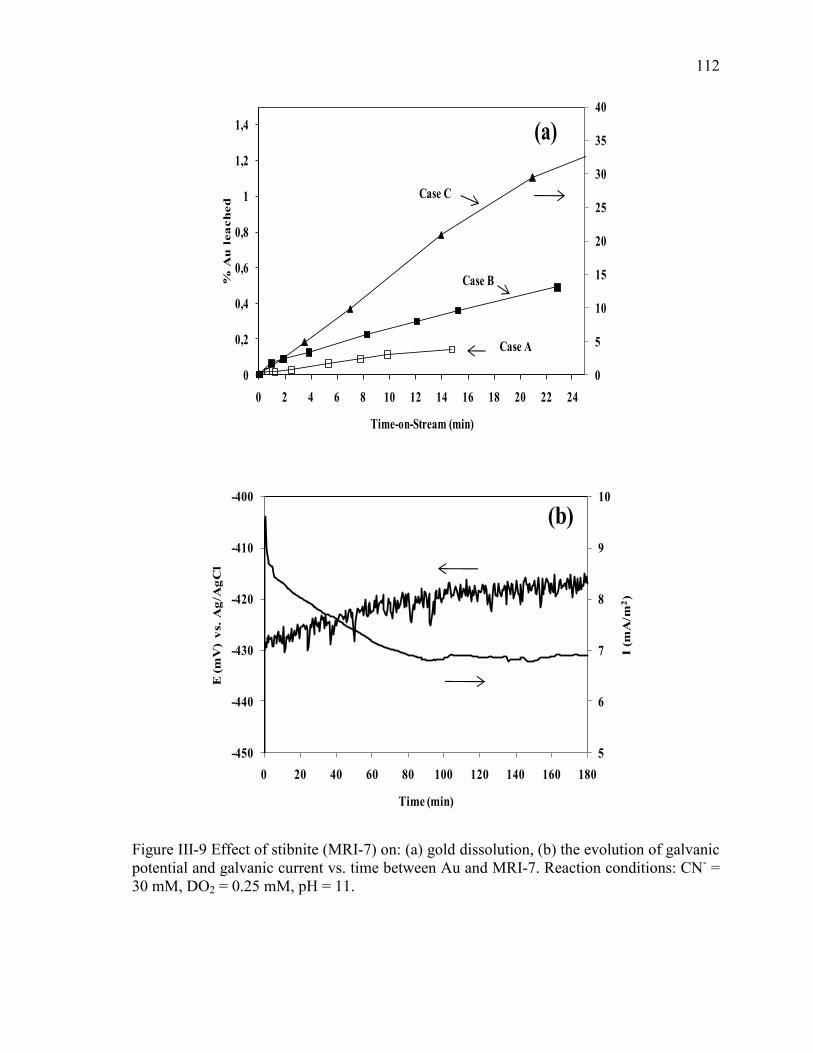
112
5
6
7
8
9
10
-450
-440
-430
-420
-410
-400
0 20 40 60 80 100 120 140 160 180
I (
mA
/m2)
E (m
V)
vs.
Ag
/Ag
Cl
Time (min)
(b)
Figure III-9 Effect of stibnite (MRI-7) on: (a) gold dissolution, (b) the evolution of galvanic
potential and galvanic current vs. time between Au and MRI-7. Reaction conditions: CN- =
30 mM, DO2 = 0.25 mM, pH = 11.
0
5
10
15
20
25
30
35
40
0
0,2
0,4
0,6
0,8
1
1,2
1,4
0 2 4 6 8 10 12 14 16 18 20 22 24
% A
u l
ea
ch
ed
Time-on-Stream (min)
Case C
Case B
Case A
(a)
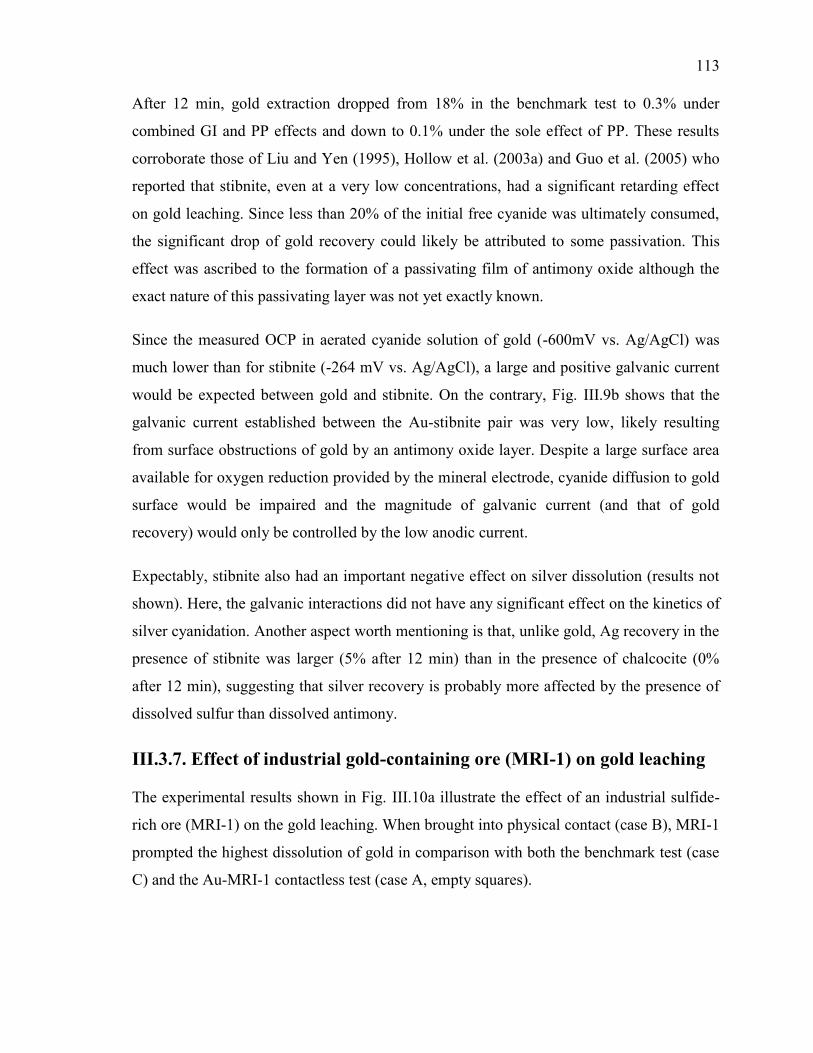
113
After 12 min, gold extraction dropped from 18% in the benchmark test to 0.3% under
combined GI and PP effects and down to 0.1% under the sole effect of PP. These results
corroborate those of Liu and Yen (1995), Hollow et al. (2003a) and Guo et al. (2005) who
reported that stibnite, even at a very low concentrations, had a significant retarding effect
on gold leaching. Since less than 20% of the initial free cyanide was ultimately consumed,
the significant drop of gold recovery could likely be attributed to some passivation. This
effect was ascribed to the formation of a passivating film of antimony oxide although the
exact nature of this passivating layer was not yet exactly known.
Since the measured OCP in aerated cyanide solution of gold (-600mV vs. Ag/AgCl) was
much lower than for stibnite (-264 mV vs. Ag/AgCl), a large and positive galvanic current
would be expected between gold and stibnite. On the contrary, Fig. III.9b shows that the
galvanic current established between the Au-stibnite pair was very low, likely resulting
from surface obstructions of gold by an antimony oxide layer. Despite a large surface area
available for oxygen reduction provided by the mineral electrode, cyanide diffusion to gold
surface would be impaired and the magnitude of galvanic current (and that of gold
recovery) would only be controlled by the low anodic current.
Expectably, stibnite also had an important negative effect on silver dissolution (results not
shown). Here, the galvanic interactions did not have any significant effect on the kinetics of
silver cyanidation. Another aspect worth mentioning is that, unlike gold, Ag recovery in the
presence of stibnite was larger (5% after 12 min) than in the presence of chalcocite (0%
after 12 min), suggesting that silver recovery is probably more affected by the presence of
dissolved sulfur than dissolved antimony.
III.3.7. Effect of industrial gold-containing ore (MRI-1) on gold leaching
The experimental results shown in Fig. III.10a illustrate the effect of an industrial sulfide-
rich ore (MRI-1) on the gold leaching. When brought into physical contact (case B), MRI-1
prompted the highest dissolution of gold in comparison with both the benchmark test (case
C) and the Au-MRI-1 contactless test (case A, empty squares).
114
0
10
20
30
40
50
60
70
0 2 4 6 8 10 12 14 16 18 20 22 24
% A
u l
ea
ch
ed
Time-on-stream (min)
Case B
Case C
Case A
(a)
100
200
300
400
500
600
700
-700
-660
-620
-580
-540
-500
0 20 40 60 80 100 120 140 160 180
I (m
A/m
2)
E (m
V)
vs.
Ag
/Ag
Cl
Time (min)
(b)
Figure III-10 Effect of the industrial gold ore (MRI-1) on: (a) gold dissolution and (b) the
evolution of galvanic potential and galvanic current vs. time between Au and MRI-1.
Reaction conditions: CN- = 30 mM, DO2 = 0.25 mM, pH = 11.
115
After 12 min of cyanidation, 44% of gold was extracted for case B combining both GI and
PP, whereas only 7% was extracted under the exclusive PP effect in case A. Since in this
latter case, plenty of free cyanide, ca. 70% was left unreacted at the end of the reaction, it is
reasonable to conclude that this ore was prone to passivation phenomena. Therefore, the
gain in gold recovery due to galvanic corrosion and gold losses due to PP were,
respectively, 37% and -11%. Galvanic corrosion measurements shown in Fig. III.10b also
confirmed the positive effect on the gold leaching rate of the micro-galvanic contacts
between Au and MRI-1 particles. Once the gold and mineral electrodes were electrically
connected, the galvanic current gradually increased with time to plateau near 635 mA/m2
after 180 min.
Comparative analysis of the results obtained with the industrial ore (MRI-1) and those
obtained with its major sulfide constituents (i.e., pyrite, chalcopyrite and sphalerite) has
been conducted. Under the combined effects of GI and PP, it was observed that sphalerite
brought an important reduction in gold leaching rate whereas chalcopyrite, industrial ore
and pyrite counterbalanced, more or less successfully, the negative effect of passivation and
significantly increased gold leaching. The following upward gradation takes place in terms
of gold dissolution: chalcopyrite > industrial ore > pyrite, as shown in Table III.4.
Moreover, the greatest improvement in gold leaching when gold is in mutual contact with
pyrite is coherent with the highest galvanic corrosion currents achieved (Figs. III.2b, III.3b,
and III.10b). Nevertheless, despite galvanic interactions between gold and industrial ore
were less important than those between gold and chalcopyrite (Figs. III.3b and III.10b),
MRI-1 led to better gold leaching when compared with chalcopyrite. Such ambiguous
results could be explained by a possible interdependence between galvanic interactions and
passivation phenomena in the PM-containing sulfide ores.
It is worth noting that the gradation of the gold recovery in the presence of sulfides as
obtained in the PBER configuration is not completely in agreement with the gradation
established in our previous study (Azizi et al., 2010; chapter II) where the leaching
experiments were carried out using a RDE Au/Ag disc immersed in a slurry reactor of the
same powdered sulfide minerals, see Table III.4 (Au/Ag disc in RDE/slurry vs. PM in
PBER).
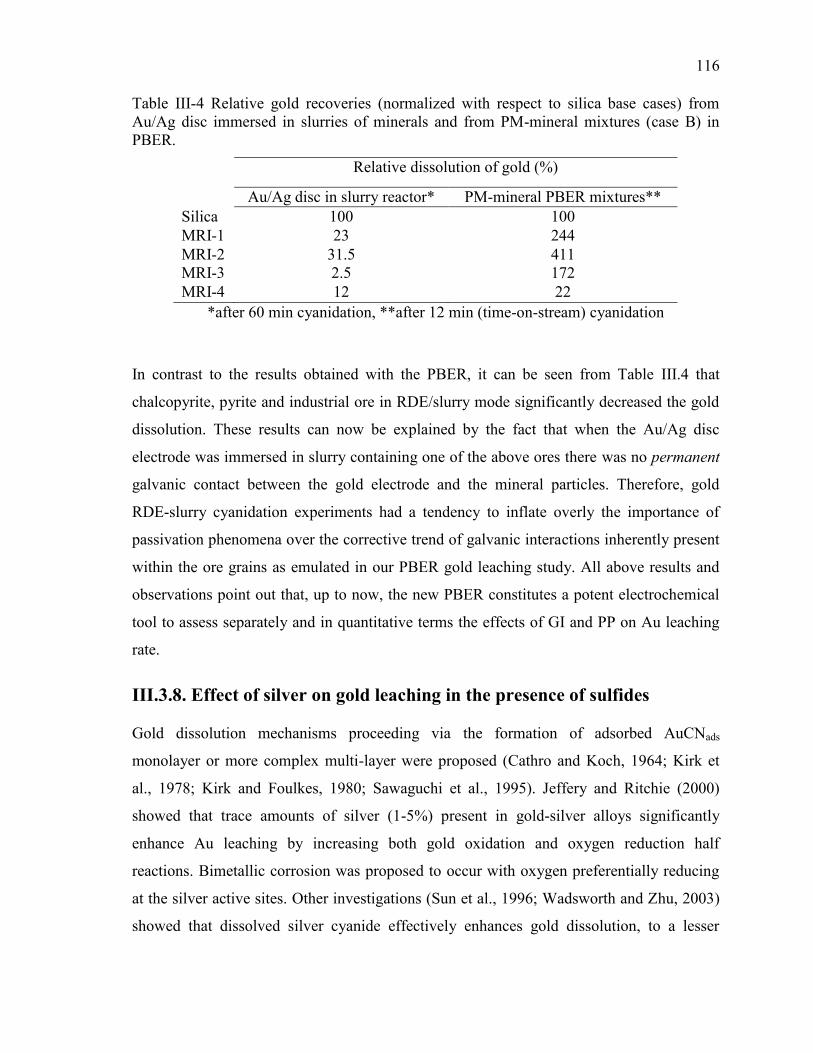
116
Table III-4 Relative gold recoveries (normalized with respect to silica base cases) from
Au/Ag disc immersed in slurries of minerals and from PM-mineral mixtures (case B) in
PBER.
Relative dissolution of gold (%)
Au/Ag disc in slurry reactor* PM-mineral PBER mixtures**
Silica 100 100
MRI-1 23 244
MRI-2 31.5 411
MRI-3 2.5 172
MRI-4 12 22
*after 60 min cyanidation, **after 12 min (time-on-stream) cyanidation
In contrast to the results obtained with the PBER, it can be seen from Table III.4 that
chalcopyrite, pyrite and industrial ore in RDE/slurry mode significantly decreased the gold
dissolution. These results can now be explained by the fact that when the Au/Ag disc
electrode was immersed in slurry containing one of the above ores there was no permanent
galvanic contact between the gold electrode and the mineral particles. Therefore, gold
RDE-slurry cyanidation experiments had a tendency to inflate overly the importance of
passivation phenomena over the corrective trend of galvanic interactions inherently present
within the ore grains as emulated in our PBER gold leaching study. All above results and
observations point out that, up to now, the new PBER constitutes a potent electrochemical
tool to assess separately and in quantitative terms the effects of GI and PP on Au leaching
rate.
III.3.8. Effect of silver on gold leaching in the presence of sulfides
Gold dissolution mechanisms proceeding via the formation of adsorbed AuCNads
monolayer or more complex multi-layer were proposed (Cathro and Koch, 1964; Kirk et
al., 1978; Kirk and Foulkes, 1980; Sawaguchi et al., 1995). Jeffery and Ritchie (2000)
showed that trace amounts of silver (1-5%) present in gold-silver alloys significantly
enhance Au leaching by increasing both gold oxidation and oxygen reduction half
reactions. Bimetallic corrosion was proposed to occur with oxygen preferentially reducing
at the silver active sites. Other investigations (Sun et al., 1996; Wadsworth and Zhu, 2003)
showed that dissolved silver cyanide effectively enhances gold dissolution, to a lesser
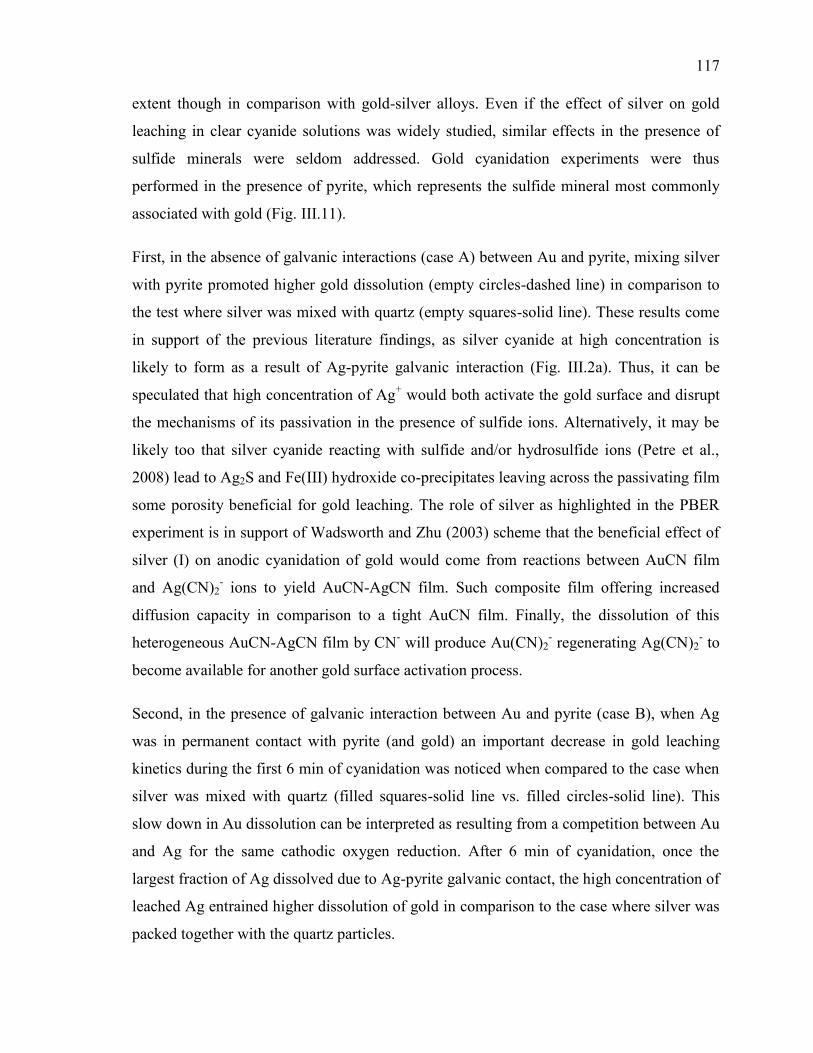
117
extent though in comparison with gold-silver alloys. Even if the effect of silver on gold
leaching in clear cyanide solutions was widely studied, similar effects in the presence of
sulfide minerals were seldom addressed. Gold cyanidation experiments were thus
performed in the presence of pyrite, which represents the sulfide mineral most commonly
associated with gold (Fig. III.11).
First, in the absence of galvanic interactions (case A) between Au and pyrite, mixing silver
with pyrite promoted higher gold dissolution (empty circles-dashed line) in comparison to
the test where silver was mixed with quartz (empty squares-solid line). These results come
in support of the previous literature findings, as silver cyanide at high concentration is
likely to form as a result of Ag-pyrite galvanic interaction (Fig. III.2a). Thus, it can be
speculated that high concentration of Ag+ would both activate the gold surface and disrupt
the mechanisms of its passivation in the presence of sulfide ions. Alternatively, it may be
likely too that silver cyanide reacting with sulfide and/or hydrosulfide ions (Petre et al.,
2008) lead to Ag2S and Fe(III) hydroxide co-precipitates leaving across the passivating film
some porosity beneficial for gold leaching. The role of silver as highlighted in the PBER
experiment is in support of Wadsworth and Zhu (2003) scheme that the beneficial effect of
silver (I) on anodic cyanidation of gold would come from reactions between AuCN film
and Ag(CN)2- ions to yield AuCN-AgCN film. Such composite film offering increased
diffusion capacity in comparison to a tight AuCN film. Finally, the dissolution of this
heterogeneous AuCN-AgCN film by CN- will produce Au(CN)2
- regenerating Ag(CN)2
- to
become available for another gold surface activation process.
Second, in the presence of galvanic interaction between Au and pyrite (case B), when Ag
was in permanent contact with pyrite (and gold) an important decrease in gold leaching
kinetics during the first 6 min of cyanidation was noticed when compared to the case when
silver was mixed with quartz (filled squares-solid line vs. filled circles-solid line). This
slow down in Au dissolution can be interpreted as resulting from a competition between Au
and Ag for the same cathodic oxygen reduction. After 6 min of cyanidation, once the
largest fraction of Ag dissolved due to Ag-pyrite galvanic contact, the high concentration of
leached Ag entrained higher dissolution of gold in comparison to the case where silver was
packed together with the quartz particles.
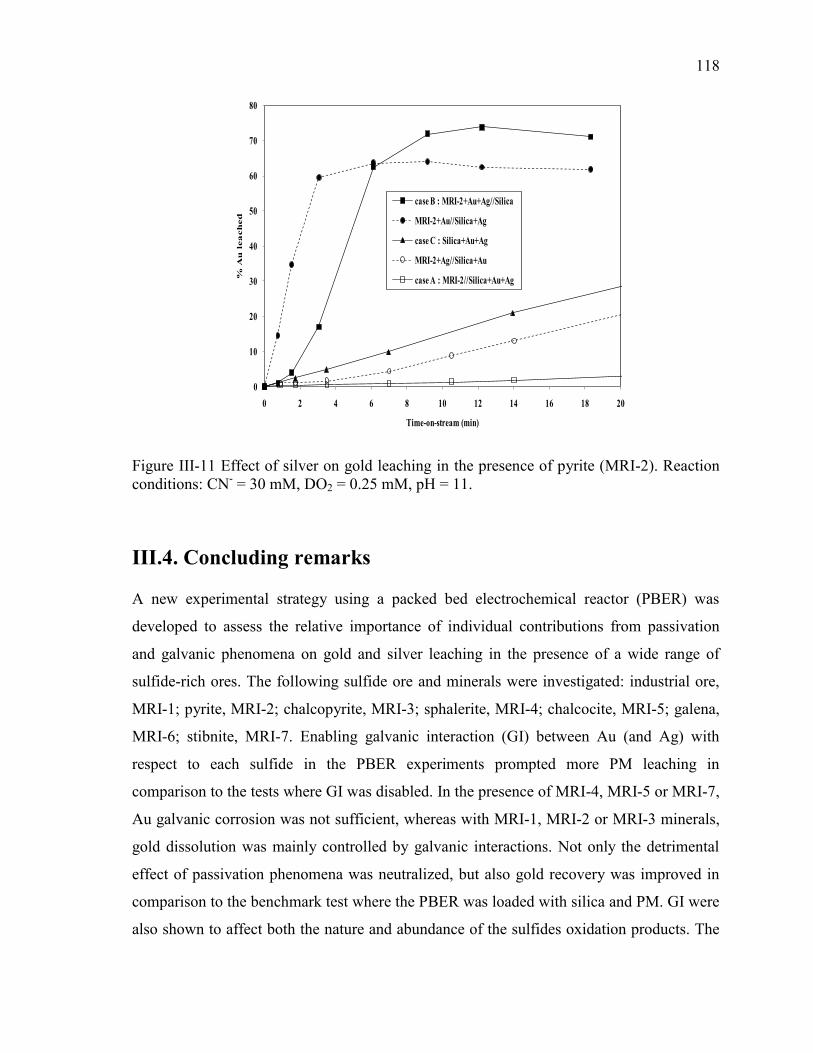
118
0
10
20
30
40
50
60
70
80
0 2 4 6 8 10 12 14 16 18 20
% A
u l
ea
ch
ed
Time-on-stream (min)
case B : MRI-2+Au+Ag//Silica
MRI-2+Au//Silica+Ag
case C : Silica+Au+Ag
MRI-2+Ag//Silica+Au
case A : MRI-2//Silica+Au+Ag
Figure III-11 Effect of silver on gold leaching in the presence of pyrite (MRI-2). Reaction
conditions: CN- = 30 mM, DO2 = 0.25 mM, pH = 11.
III.4. Concluding remarks
A new experimental strategy using a packed bed electrochemical reactor (PBER) was
developed to assess the relative importance of individual contributions from passivation
and galvanic phenomena on gold and silver leaching in the presence of a wide range of
sulfide-rich ores. The following sulfide ore and minerals were investigated: industrial ore,
MRI-1; pyrite, MRI-2; chalcopyrite, MRI-3; sphalerite, MRI-4; chalcocite, MRI-5; galena,
MRI-6; stibnite, MRI-7. Enabling galvanic interaction (GI) between Au (and Ag) with
respect to each sulfide in the PBER experiments prompted more PM leaching in
comparison to the tests where GI was disabled. In the presence of MRI-4, MRI-5 or MRI-7,
Au galvanic corrosion was not sufficient, whereas with MRI-1, MRI-2 or MRI-3 minerals,
gold dissolution was mainly controlled by galvanic interactions. Not only the detrimental
effect of passivation phenomena was neutralized, but also gold recovery was improved in
comparison to the benchmark test where the PBER was loaded with silica and PM. GI were
also shown to affect both the nature and abundance of the sulfides oxidation products. The
119
low negative galvanic current with chalcocite (MRI-5) was due to rapid oxidation of
hydrosulfides on the chalcocite surface. MRI-6 exhibited an odd behavior, as it was found
to doubly influence gold leaching through: (1) Activation of gold surface by dissolved
species (i.e., Pb(II)) and (2) Acceleration of gold leaching rate by positive effect of galvanic
corrosion.
III.5. References
Aghamirian, M.M., Yen, W.T., 2005a. Mechanism of galvanic interactions between gold
and sulfide minerals in cyanide solution. Minerals Engineering 18, 393-407.
Aghamirian, M.M., Yen, W.T., 2005b. A study of gold anodic behavior in the presence of
various ions and sulfide minerals in cyanide solution. Minerals Engineering 18, 89-102.
Azizi, A., Petre, C.F., Olsen, C., Larachi, F., 2010. Electrochemical behavior of gold
cyanidation in the presence of a sulfide-rich industrial ore versus its major constitutive
sulfide minerals. Hydrometallurgy 101, 108-119.
Blasco-Tamarit, E., Igual-Muñoz, A., García Antón, J., García-García, D.M., 2009.
Galvanic corrosion of titanium coupled to welded titanium in LiBr solutions at different
temperatures. Corrosion Science 51, 1095-1102.
Budruk-Abhijeet, S., Balasubramaniam, R., Gupta, M., 2008. Corrosion behaviour of Mg–
Cu and Mg–Mo composites in 3.5% NaCl. Corrosion Science 50, 2423-2428.
Cathro, K.J., Koch, D.F.A., 1964. The anodic dissolution of gold in cyanide solutions.
Journal of The Electrochemical Society 111, 1416-1420.
Dai, X., Jeffrey, M.I., 2006. The effect of sulfide minerals on the leaching of gold in
aerated cyanide solutions. Hydrometallurgy 82, 118-125.
Fisher, W.W., 1994. Comparison of chalcocite dissolution in the sulfate, perchlorate,
nitrate, chloride, ammonia, and cyanide systems. Minerals Engineering 7, 99-103.
Guo, H., Deschenes, G., Pratt, A., Fulton, M., Lastra, R., 2005. Leaching kinetics and
mechanisms of surface reactions during cyanidation of gold in the presence of pyrite and
stibnite. Minerals and Metallurgical Processing 22, 89-95.
Habashi, F., 1967. Kinetics and mechanism of gold and silver dissolution in cyanide
solution. Montana Bureau of Mines and Geology Bulletin 59, Montana Bureau of Mines
and Geology, Butte, Montana, USA.
Hollow, J., Deschenes G., Guo, H., Fulton, M., Hill, E., 2003a. Optimizing Cyanidation
Parameters for Processing of Blended Fort Knox and True North Ores at the Fort Knox
Mine. Hydrometallurgy, 2003: Proceedings of the 5th International Symposium Honoring
Professor Ian M. Ritchie. 1, 21-34.
120
Jeffrey, M.I., Breuer, P.L., 2000. The cyanide leaching of gold in solution containing
sulfide. Minerals Engineering 13, 1097-1106.
Jeffrey, M.I., Ritchie, I.M., 2000. The leaching of gold in cyanide solutions in the presence
of impurities II. The effect of silver. Journal of The Electrochemical Society 147, 3272-
3276.
Kirk D.W., Foulkes, F.R., Graydon, W.F., 1978. A study of anodic dissolution of gold in
aqueous alkaline cyanide. Journal of The Electrochemical Society 125, 1436-1443.
Kirk, D.W., Foulkes, F.R., 1980. Anodic dissolution of gold in aqueous alkaline cyanide
solutions at low overpotentials. Journal of The Electrochemical Society 127, 1993–1997.
Licht, S., 1988. Aqueous solubilities, solubility products and standard oxidation-reduction
potentials of the metal sulfides. Journal of The Electrochemical Society 135, 2971-2975.
Linge, H.G., 1995. Anodic oxidation of pyrrhotite in simulated CIP liquors. Minerals
Engineering 8, 795-806.
Liu, G.Q., Yen, W.T., 1995. Effects of sulphide minerals and dissolved oxygen on the gold
and silver dissolution in cyanide solution. Minerals Engineering 8, 111-123.
Lorenzen, L., van Deventer, J.S.J., 1992. Electrochemical interactions between gold and its
associated minerals during cyanidation. Hydrometallurgy 30, 177-194.
Luthy, R.G., Bruce, S.G., 1979. Kinetics of reaction of cyanide and reduced sulfur species
in aqueous solution. Environmental Science & Technology 13, 1481-1487.
Marsden, J.O., House, C.I., 1992. The Chemistry of Gold Extraction. Ellis Horwood,
London.
Marsden, J.O., House, C.I., 2006. The Chemistry of Gold Extraction. 2nd
Edition. Society
for Mining, Metallurgy and Exploration (SME), Littleton, Co, USA.
Mirnezami, M., Hashemi, M.S., Finch, J.A., 2003. Measurement of conductivity of
sulphide particles dispersed in water. Canadian Metallurgical Quarterly 42, 271-276.
Petre, C.F., Azizi, A., Olsen, C., Baçaoui, A., Larachi, F., 2008. Capillary electrophoretic
analysis of sulfur and cyanicides speciation during cyanidation of gold complex sulfidic
ores. Journal of Separation Science 31, 3902-3910.
Rand, D.J.A., 1977. Oxygen reduction on sulfide minerals. Part III. Comparison of
activities of various copper, iron, lead, and nickel mineral electrodes. Journal of
Electroanalytical Chemistry 83, 19-32.
Sawaguchi, T., Yamada, T., Okinaka, Y., Itaya, K., 1995. Electrochemical scanning
tunnelling microscopy and ultrahigh-vacuum investigation of gold cyanide adlayers on
Au(111) formed in aqueous solution. Journal of Physical Chemistry 99, 14149–14155.
Senanayake, G., 2008. A review of effects of silver, lead, sulfide and carbonaceous matter
on gold cyanidation and mechanistic interpretation. Hydrometallurgy 90, 46-73.
Sun, X., Guan, Y.C., Han, K.N, 1996. Electrochemical behaviour of the dissolution of
gold–silver alloys in cyanide solution. Metallurgical and Materials Transactions B. 27, 355-
361.
121
Wadsworth, M.E., Zhu, X., 2003. Kinetics of enhanced gold dissolution: activation by
dissolved silver. International Journal of Mineral Processing 72, 301-310.
Weichselbaum, J., Tumilty, J.A., Schmidt, C.G., 1989. The effect of sulphide and lead on
the rate of gold cyanidation. Proceedings Aus. I.M.M. Annual conference Perth/Kalgoorlie.
Australasian Institute of Mining and Metallurgy, Melbourne, pp. 221-224.
122
CHAPITRE IV.
CHAPITRE IV. The role of multi-sulfidic mineral binary
and ternary galvanic interactions in gold cyanidation in a
multi-layer packed-bed electrochemical reactor
Abdelaaziz Azizi,1,2
Catalin Florin Petre,1‡
Gnouyaro Palla Assima,1 Faïçal Larachi
1*
1-Department of Chemical Engineering, Laval University, Québec, Canada, G1V 0A6;
2-COREM Research Center, 1180 Rue de la Minéralogie, Québec, Canada, G1N 1X7;
Abstract/Résumé
A multi-layer packed-bed electrochemical reactor (PBER) approach was used for studying
the leaching behavior of associated and free (silica-trapped) gold from a series of synthetic
multi-mineral systems consisting of pyrite, silica, Au, and successively, X = chalcopyrite,
sphalerite and chalcocite. The PBER was filled with sieved powders of sulfidic minerals
(pyrite, X), gold and silica arranged as electrically-isolated three-layer pyrite//X//silica and
two-layer pyrite+X//silica systems. Introduction of gold successively in each layer of the
three- and two-layer PBER systems highlighted the role of Au-pyrite, Au-X and pyrite-X
binary, and Au-pyrite-X ternary galvanic interactions in the leaching of associated and free
gold. The highest Au recovery was achieved within the pyrite layer while the lowest was
within the silica layer. For the pyrite//chalcocite//silica system, depletion of free cyanide
and surface passivation inhibited strongly gold leaching. Cyanidation experiments
performed in the mixed sulfide//silica systems showed that the effect of Au-sulfide galvanic
interactions largely depend on the mineralogical association between phases. The presence
of galvanic effects between the associated minerals in the PBER was confirmed by a
conjunction of electrochemical and chemical speciation studies. Increasing the pyrite-Au
areal ratio increased gold leaching as a result of increased cathodic areas for oxygen
reduction. However, gold leaching from mixed multi-mineral systems where multi-factorial
123
galvanic contacts were enabled was controlled mostly by the relative area ratios between
the associated sulfide minerals.
L’approche du réacteur électrochimique à lit fixe (multicouches) a été utilisée pour l’étude
du comportement de dissolution de l’or associé et libre (piégé dans le quartz) à partir d’une
série de systèmes synthétiques multi-minéraux constitués de pyrite, d’Au, de quartz et
successivement X = chalcopyrite, sphalérite et chalcocite. Le réacteur a été chargé de
mélanges homogénéisés de sulfures (pyrite, X), de poudres d’or et de quartz arrangés sous
forme de systèmes en tri-couches Pyrite//X//quartz et en bi-couches pyrite+X//quartz,
électriquement-isolés. L’implantation de la poudre d’or, successivement, dans chacune des
couches des deux systèmes (en tri- et en bi-couches) a permis de mettre en évidence l’effet
des interactions galvaniques binaires (Au-pyrite, Au-X et pyrite-X) et ternaires (Au-pyrite-
X) sur la lixiviation de l’or libre et associé. La récupération de l’or la plus élevée a été
obtenue à partir de la couche de pyrite alors que celle à partir de la couche de quartz a été
très faible. Pour le système pyrite//chalcocite//quartz, l’effet conjugué de la consommation
de cyanure et de la passivation de surface inhibe fortement la dissolution de l’or. Les
expériences de cyanuration réalisées dans le cas de systèmes mixtes bisulfures-quartz ont
démontré que les effets des IG Au-sulfures dépendent largement des associations
minéralogiques entre les différentes phases. L’augmentation du rapport de surface pyrite-
Au entraine une augmentation de la vitesse de lixiviation de l’or en raison de
l’augmentation de la surface disponible pour la réduction de l’oxygène. Toutefois, la
lixiviation de l’or à partir de systèmes multi-minéraux mixtes, où les interactions
galvaniques multifactorielles sont établies, est principalement contrôlée par l’importance
relative des surfaces des différents sulfures associés.
IV.1. Introduction
Facing virtually depleted gold-bearing oxide deposits around the globe, the mining industry
has turned its attention to gold extraction from less friendly sulfide deposits sailing
cyanidation into uncharted territories. Unlike oxides, which divert marginal quantities of
cyanide and have generally minor impact on gold leaching, most metal sulfides display a
range of reactivities in alkaline gold leaching cyanidation (Marsden and House, 1992;
124
2006). Due to poor cyanide selectivity for gold over the enclosing sulfide mineral matrix,
such parasitic reactions inflict utility extra costs and profit losses resulting from high levels
of cyanide consumption, e.g., formation of thiocyanate, and dissolution of transition (Cu,
Fe, Zn, etc.) metals (Habashi, 1967). In addition, some side-reaction products can directly
inhibit cyanidation by passivating gold surface via insoluble coatings of various chemical
natures (Weichselbaum et al., 1989; Jeffrey and Breuer, 2000; Guo et al., 2005; Dai and
Jeffrey, 2006; Azizi et al., 2010, 2011). Hence, with the increasing occurrence of refractory
and complex sulfide-rich low-grade Au ores in current industrial operations, thorough
understanding of the mechanisms and kinetics of gold leaching from sulfide-rich ores has
become an R&D task of top priority.
Most sulfide minerals exhibit electric conductivity to allow charge transfer at their surfaces.
By virtue of gold-sulfide contacts, galvanic interactions were previously shown to influence
considerably the gold leaching behavior (Lorenzen and Van Deventer, 1992; Aghamirian
and Yen, 2005; Dai and Jeffrey, 2006; Azizi et al., 2010). Given that the factors affecting
gold leaching in aerated cyanide solutions are mostly of mineralogical nature, most of the
previous studies focused on the “one-to-one” effect of individual sulfide mineral phases
whether in contact or not with gold (Liu and Yen 1995; Deschenes et al., 2002; Aghamirian
and Yen, 2005; Guo et al., 2005; Dai and Jeffrey, 2006; Azizi et al., 2010). However,
sulfidic ore deposits are generally complex mixtures wherein gold coexists in association
with various minerals/phases. Attempts to make sense of the refractory behavior stemming
from such complex sulfide gold ores stress on comprehensive determinations of the host
rock mineralogy and gold deportment (gold distribution and associations) to identify
efficient processing routes (Goodall and Scales, 2007).
Representative sampling of low grade gold deposits is recognized to be virtually impossible
(Jones and Cheung, 1988) a consequence of which is that studies of Au-sulfides
associations and how they would influence gold extraction are venturous and very costly
(Goodall and Scales, 2007). Consequently, accurate mineralogical characterization of
complex gold ores is often not undertaken until the first processing problems appear.
Alternatively, diagnostic leaching techniques have been proven to be invaluable for
assessing ore refractoriness and for determining gold deportment (Lorenzen and Tumility,
125
1992; Lorenzen and van Deventer, 1992; 1993). In this technique the least stable mineral
phase in the sample matrix is leached off first acidically/oxidatively before a cyanide
leaching step is enabled to extract gold. The process is repeated successively with more
oxidative acid leaching until gold recovery is maximized. This ingenious diagnostic
leaching strategy was implemented by Lorenzen and van Deventer (1993) to determine the
amount of gold to be liberated from gold ores containing pyrite and pyrrhotite as the main
sulfides constituents. Destruction of sulfides via nitric and sulfuric acid oxidation resulted
in nearly 95% of gold extraction. The same approach was also used to investigate the effect
of various constituents of two complex sulfide ores on gold leaching using a gold disc
immersed in minerals slurries (Lorenzen and van Devanter, 1992). Comparing gold
recoveries before and after each leaching step led to quantify the effect of each eliminated
phase on Au recovery. Such “backward” diagnostics is prone to three weak points: i) it is
difficult to quantify the individual effect of each component due to lack in selectivity of
acid pretreatments, i.e., partial elimination of pyrite by H2SO4 and HNO3, of sphalerite by
H2SO4 and FeCl3 and of galena by HCl and FeCl3; ii) the oxidative acid pre-treatment may
irreversibly affect the surface representativeness of the minerals left over; iii) since
cyanidation is performed after elimination of the targeted sulfide mineral phases, Au-
sulfide and sulfide-sulfide galvanic interactions would have been erased which may give
rise to radically different cyanidation patterns.
Very recently, a packed-bed electrochemical reactor (PBER) technique was developed and
tested to decouple and quantify the individual contributions of passivation phenomena (PP)
and galvanic interactions (GI) on precious metals (gold and silver, PM) leaching rates
during cyanidation of sulfide-rich ores (see chapter 3; Azizi et al., 2011). The PBER was
filled with homogenized mixtures of several minerals (pyrite, chalcopyrite, sphalerite,
chalcocite, galena, stibnite and an industrial ore), PM and sulfide-silica powders arranged
as electrically-isolated segregated bilayer(s) with permanent particle-particle electrical
contacts among all constituents in each layer. Implantation of PM powders successively in
the silica layer and then in the sulfide layer, enabled passivation and binary galvanic
interactions to be singled out and quantified separately for each sulfide. The results showed
that GI ameliorated, to various degrees, the leaching of PM, particularly those due to pyrite,
126
chalcopyrite and the industrial ore were so positive that they largely outweighed the
negative impact of PM passivation.
Most sulfide minerals are known to develop dissimilar rest potentials in aerated cyanide
solutions. Therefore, GI could be initiated among the various ore constituents resulting in
substantially increased or decreased reactivity for some associated minerals. Azizi et al.
(2010) demonstrated that the behavior of an industrial sulfide-rich gold ore during
cyanidation cannot be inferred from the barycentric linear combination obtained from the
individual behavior of its different sulfide mineral constituents. In spite of this, the effect of
multi-factorial GI among sulfides on their reactivity and consequently on Au recovery by
cyanidation is very poorly addressed in the literature. Thus, extending the new PBER
experimental strategy (Azizi et al., 2011) to interrogate mineralogical characteristics in
multi-mineral systems is foreseen to further elucidate the higher-order galvanic interactions
involving contacts between two sulfidic minerals and precious metals. Therefore, this work
aims at the following targets:
1. To sort out, using the new PBER configuration during cyanidation, the effect of
gold distribution and mineral galvanic associations on both Au recovery and
reactivity of sulfide-rich ores.
2. To investigate, using the same PBER configuration, the effects of varying the
cathode-to-anode areal ratio on gold leaching from multi-mineral systems.
IV.2. Experimental
IV.2.1. Materials and Reagents
In this study four sulfide-rich ore samples received from Ward’s Natural Science were
used. These samples consisted of pyrite ( ), chalcopyrite ( ), sphalerite ( ) and chalcocite
( ) by virtue of the dominant proportion of the named sulfide mineral therein. Their
chemical and mineralogical characterizations are given elsewhere (see section II.2.1,
chapter III; Azizi et al., 2011).
127
The samples were sieved to remove particles coarser than 90 µm and finer than 45 µm.
Consequently, the same granulometric fraction was used for the different ores, providing a
uniform total area per unit-weight in all cyanidation experiments. Pure gold (P80 = 39 µm,
99.998%) powder was purchased from Alfa Aesar (USA).
Distilled water was used for all cyanidation experiments. The reagents used in this study,
sodium cyanide, NaCN (98%, Sigma-Aldrich Canada), sodium hydroxide, NaOH (Fisher
Scientific Canada) and boric acid, H3BO3 (99.5%, Sigma-Aldrich Canada) were all certified
analytical grade.
IV.2.2. Equipment and procedures
The influence on gold recovery of gold distribution within different mineral phases of a
synthetic ore was studied using the PBER. The aerated cyanide solution feed was
continuously recirculated in a closed loop through the fixed bed using a peristaltic pump.
The time on stream against which all the concentration profiles of this study were plotted
corresponded to the time the aerated cyanide solution sojourned inside the PBER excluding
the remainder of the transit time of flight in the external loop of the liquid circuit. See
chapter III for a thorough description of the setup.
Binary galvanic interactions between gold and each of the above minerals were assessed in
three-layer //X//silica configurations by seeding, one at a time, Au powder (50 mg) in the
pyrite, the other sulfide (X= , , or ) or the silica layers (Fig. IV.1a). First, 4 g of pyrite
(usually the most abundant mineral in Au sulfide deposits) was packed in the lower part of
the PBER working section. Then, 2 g of one of the other minerals (X= , , or ) was
packed on top of the pyrite layer. Finally, inert silica particles completed the remaining
upper part of the bed. The mineral phases were electrically disconnected by means of
sintered glass filter discs (VWR Intern., USA) used as inter-layer insulators depicted as “//”
in the //X//silica syntax. The following modalities were studied Au//X//silica,
//XAu//silica and //X//silicaAu where Au subscript stands for the seeded layer.
To investigate the effect of mineral associations on gold leaching, Au- -X ternary and -X
binary galvanic interactions were assessed in two-layer +X//silica configurations by
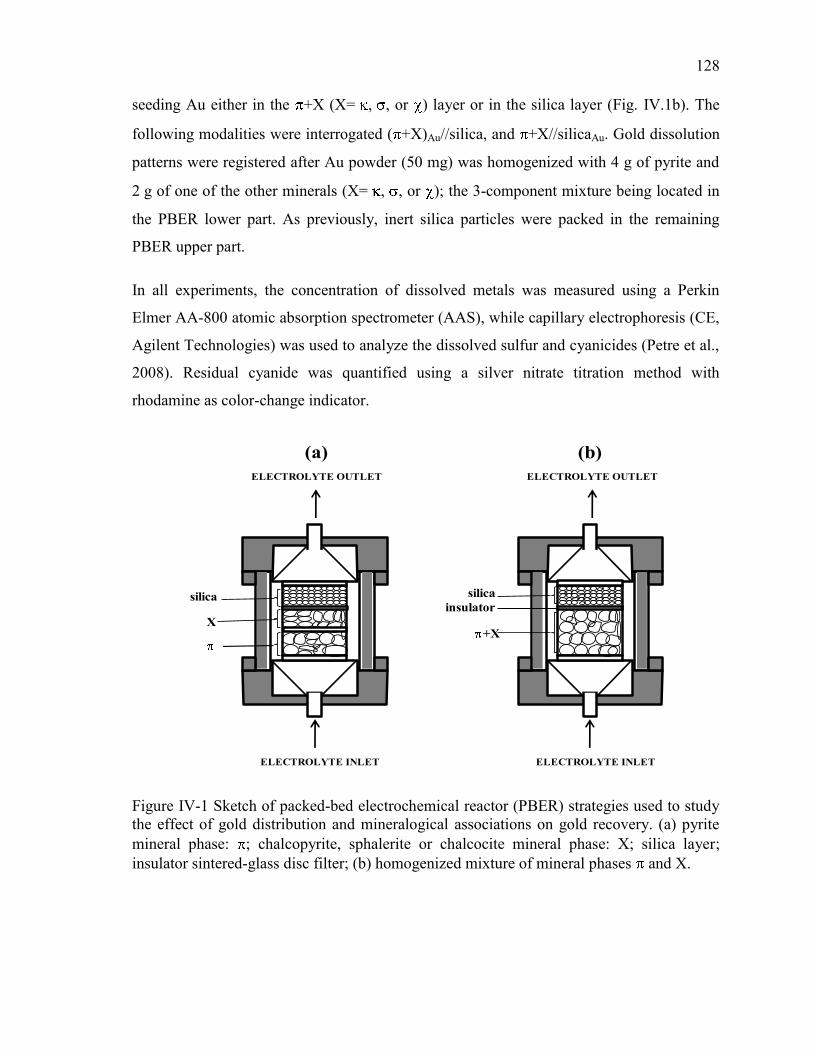
128
seeding Au either in the +X (X= , , or ) layer or in the silica layer (Fig. IV.1b). The
following modalities were interrogated ( +X)Au//silica, and +X//silicaAu. Gold dissolution
patterns were registered after Au powder (50 mg) was homogenized with 4 g of pyrite and
2 g of one of the other minerals (X= , , or ); the 3-component mixture being located in
the PBER lower part. As previously, inert silica particles were packed in the remaining
PBER upper part.
In all experiments, the concentration of dissolved metals was measured using a Perkin
Elmer AA-800 atomic absorption spectrometer (AAS), while capillary electrophoresis (CE,
Agilent Technologies) was used to analyze the dissolved sulfur and cyanicides (Petre et al.,
2008). Residual cyanide was quantified using a silver nitrate titration method with
rhodamine as color-change indicator.
(a) (b)
ELECTROLYTE OUTLET
ELECTROLYTE INLET
+X
insulator
silica
ELECTROLYTE OUTLET
ELECTROLYTE INLET
X
silica
Figure IV-1 Sketch of packed-bed electrochemical reactor (PBER) strategies used to study
the effect of gold distribution and mineralogical associations on gold recovery. (a) pyrite
mineral phase: ; chalcopyrite, sphalerite or chalcocite mineral phase: X; silica layer;
insulator sintered-glass disc filter; (b) homogenized mixture of mineral phases and X.
129
IV.2.3. Electrochemical campaign
The effect of galvanic interactions between and each of the , , or minerals on the
electrochemical behavior of these associated minerals was studied separately by means of
the PBER. For each experiment, two-layer packed-bed mineral electrodes were prepared
where a 4 g pyrite powder layer was topped successively by 4 g of one of the , , or
mineral layers. A platinum spring was inserted inside each mineral layer and linked to an
insulated platinum wire that was used to establish (via a carbon brush) electrical contact
between the mineral electrode and a potentiostat. As previously, the two mineral packed-
bed electrodes were separated by using an insulator sintered-glass disc filter to prevent any
direct electrical contact between them. The potentials were monitored using a silver/silver
chloride (Ag/AgCl in saturated AgCl-KCl solution) reference electrode (+197 mV vs.
standard hydrogen electrode). A Luggin capillary tube housing the reference electrode was
placed in a 250 mL magnetically-stirred glass reservoir containing 100 mL solution
prepared by adding NaCN to 0.01 M boric acid (background electrolyte) and adjusted to pH
11 (using NaOH). As described previously (see chapter III; Azizi et al., 2011), this
experimental arrangement enabled building a three-electrode electrochemical cell where the
electrodes were placed in the same medium by recirculating in a closed loop and upflow
manner the cyanide solution through the packed-bed reactor. The galvanic potentials and
corrosion currents established between the electrodes pair were obtained by using the zero
resistance ammeter (ZRA) technique. Since the lower part of the PBER containing the
layer was always used as the secondary working electrode, the current was negative when
the direction of electrons was from to the other mineral electrode (X), while the current
values were positive when the electrons flowed in opposite direction. Before starting the
ZRA experiments, the mineral electrodes were maintained in aerated cyanide solution for
ca. 30 min to allow stabilization of the open-circuit potential.
130
IV.3. Results and discussion
IV.3.1. Gold Cyanidation and the Pyrite-Chalcopyrite-Silica System
Au- and Au- binary galvanic interactions were assessed with gold distributed within
electrically-disconnected three-layer // //silica mineral phases in the PBER as shown in
Fig. IV.2a. The kinetics of gold leaching was compared with Au powder successively
contacted with (A), (B) and silica (C) minerals. A benchmark gold leaching test (D)
was obtained with Au powder added to an all-through silica layer deprived of sulfide
minerals. Embedding Au within inert silica mineral ((C), (D)) mimicked free (or non-
associated) gold. To determine the impact of multi-galvanic effects on gold dissolution
from complex mineral associations, mixed mineral systems were also prepared as shown in
Fig. IV.2b: ( + )Au mixed powder to prompt ternary Au-pyrite-chalcopyrite galvanic
interactions in two-layer ( + )Au//silica system (A’); two-layer + //silicaAu system to
assess the effect of binary - galvanic interactions on the leaching of free gold (B’) from
the silica powder layer.
Also plotted in Figs. IV.2a’ and IV.2b` is the evolution of gold leaching as a function of the
physical time for the same experimental results shown in Figs. IV.2a and IV.2b, see
Chapter III (see appendix C for more details).
Binary galvanic interactions between gold and mineral particles highlighted various gold
reactivity patterns (Fig. IV.2a). The Au- binary galvanic interactions led to the highest
gold recovery (A) followed by the -prompted binary galvanic interactions (B). Pyrite,
whose mass was twice chalcopyrite’s, brought greater galvanic currents, and thus more Au
dissolution (A), than chalcopyrite (B). The worst gold recovery occurred with free gold in
the presence of the synthetic ore of pyrite-contactless chalcopyrite (C) –galvanic contacts
amidst Au and sulfide minerals precluded– with pyrite and chalcopyrite dissolution
inducing species severely obstructing the Au surface (Azizi et al., 2010, 2011). This
resulted in even less Au leaching compared to the benchmark test (D). Also, Au- galvanic
association (B) was sufficient enough (case B vs. case D, Fig. IV.2a) to overcome gold
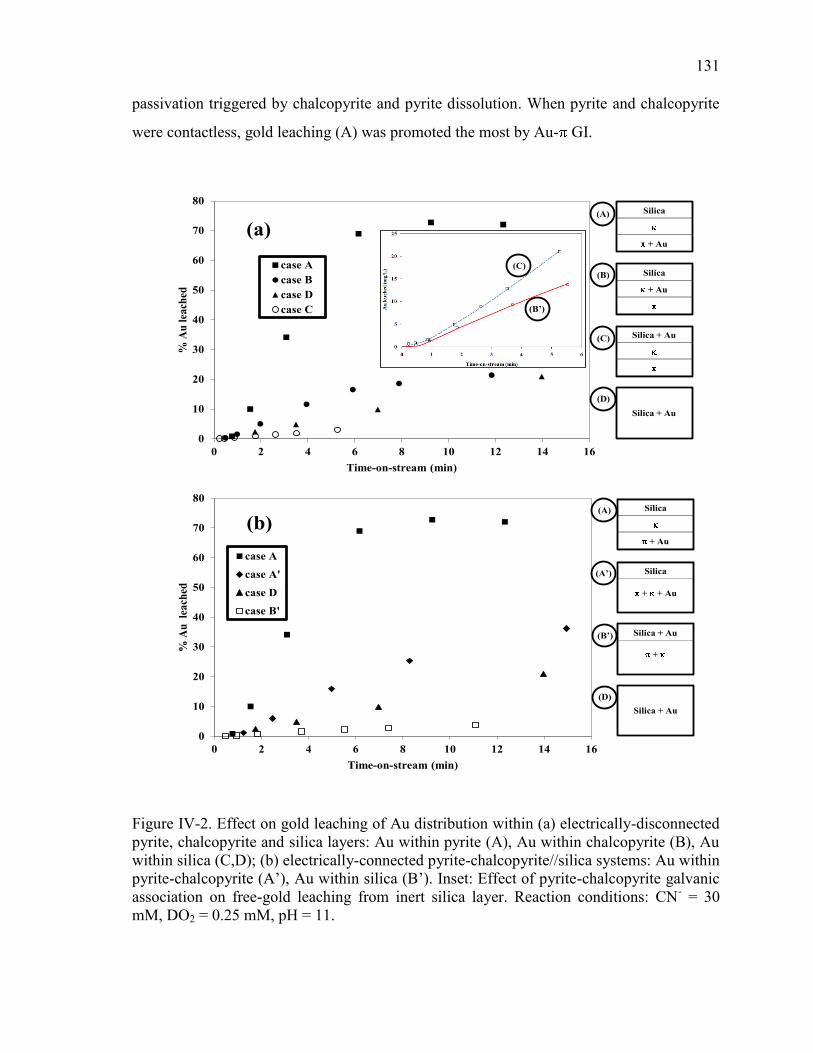
131
passivation triggered by chalcopyrite and pyrite dissolution. When pyrite and chalcopyrite
were contactless, gold leaching (A) was promoted the most by Au- GI.
0
10
20
30
40
50
60
70
80
0 2 4 6 8 10 12 14 16
% A
u
lea
ched
Time-on-stream (min)
case A : MRI-2+Au+Ag//MRI-3//Silica
case A' : MRI-2+MRI-3+Au+Ag//Silica
case D : Silica+Au+Ag
case B' : MRI-2+MRI-3//Silica+Au+Ag
0
10
20
30
40
50
60
70
80
0 2 4 6 8 10 12 14 16
% A
u l
each
ed
Time-on-stream (min)
case A : MRI-2+Au+Ag//MRI-3//Silica
case B : MRI-2//MRI-3+Au+Ag//Silica
case D : Silica+Au+Ag
case C : MRI-2//MRI-3//Silica+Au+Ag
(a)
(b)
Silica
+ Au
(B)
Silica + Au(C)
Silica + Au
(D)
Silica
+ Au
(A)
Silica
+ + Au
(A’)
Silica + Au(B’)
Silica + Au
(D)
Silica
+ Au
(A)
(C)
(B’)
+
Figure IV-2. Effect on gold leaching of Au distribution within (a) electrically-disconnected
pyrite, chalcopyrite and silica layers: Au within pyrite (A), Au within chalcopyrite (B), Au
within silica (C,D); (b) electrically-connected pyrite-chalcopyrite//silica systems: Au within
pyrite-chalcopyrite (A’), Au within silica (B’). Inset: Effect of pyrite-chalcopyrite galvanic
association on free-gold leaching from inert silica layer. Reaction conditions: CN- = 30
mM, DO2 = 0.25 mM, pH = 11.
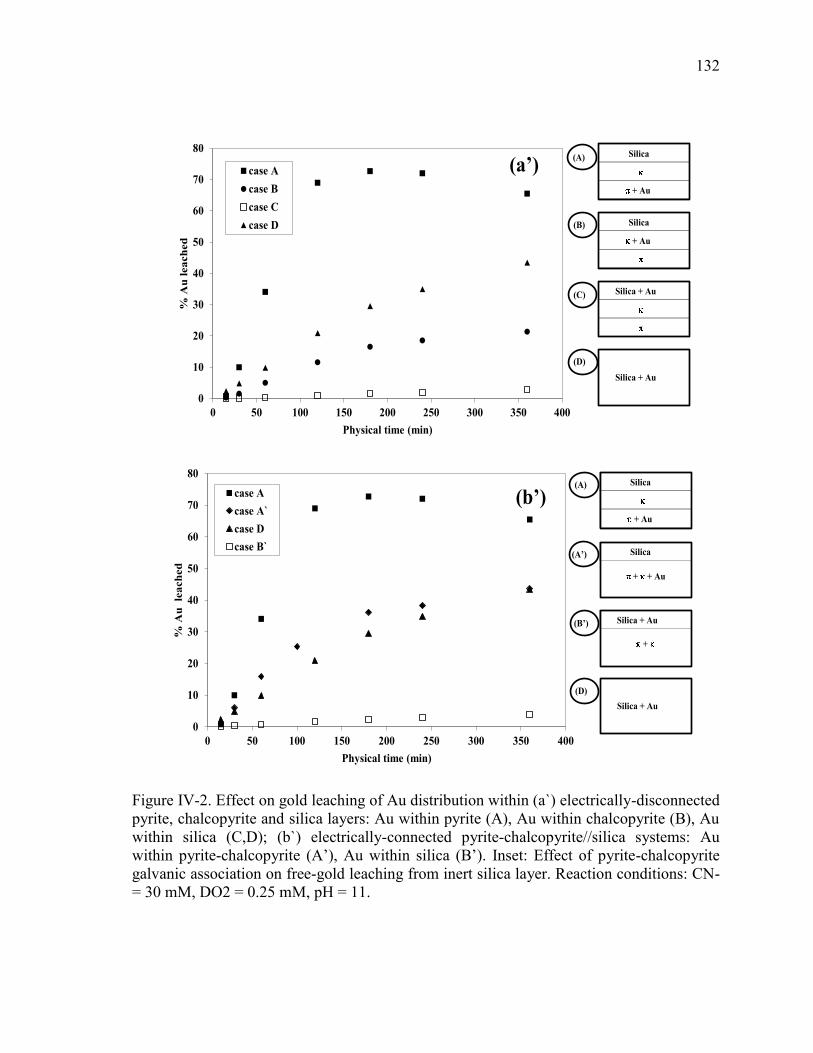
132
0
10
20
30
40
50
60
70
80
0 50 100 150 200 250 300 350 400
% A
u l
ea
ch
ed
Physical time (min)
case A
case B
case C
case D
0
10
20
30
40
50
60
70
80
0 50 100 150 200 250 300 350 400
% A
u
lea
ch
ed
Physical time (min)
case A
case A`
case D
case B`
(a’)
(b’)
Silica
+ Au
(B)
Silica + Au(C)
Silica + Au
(D)
Silica
+ Au
(A)
Silica
+ + Au
(A’)
Silica + Au(B’)
Silica + Au
(D)
Silica
+ Au
(A)
+
Figure IV-2. Effect on gold leaching of Au distribution within (a`) electrically-disconnected
pyrite, chalcopyrite and silica layers: Au within pyrite (A), Au within chalcopyrite (B), Au
within silica (C,D); (b`) electrically-connected pyrite-chalcopyrite//silica systems: Au
within pyrite-chalcopyrite (A’), Au within silica (B’). Inset: Effect of pyrite-chalcopyrite
galvanic association on free-gold leaching from inert silica layer. Reaction conditions: CN-
= 30 mM, DO2 = 0.25 mM, pH = 11.
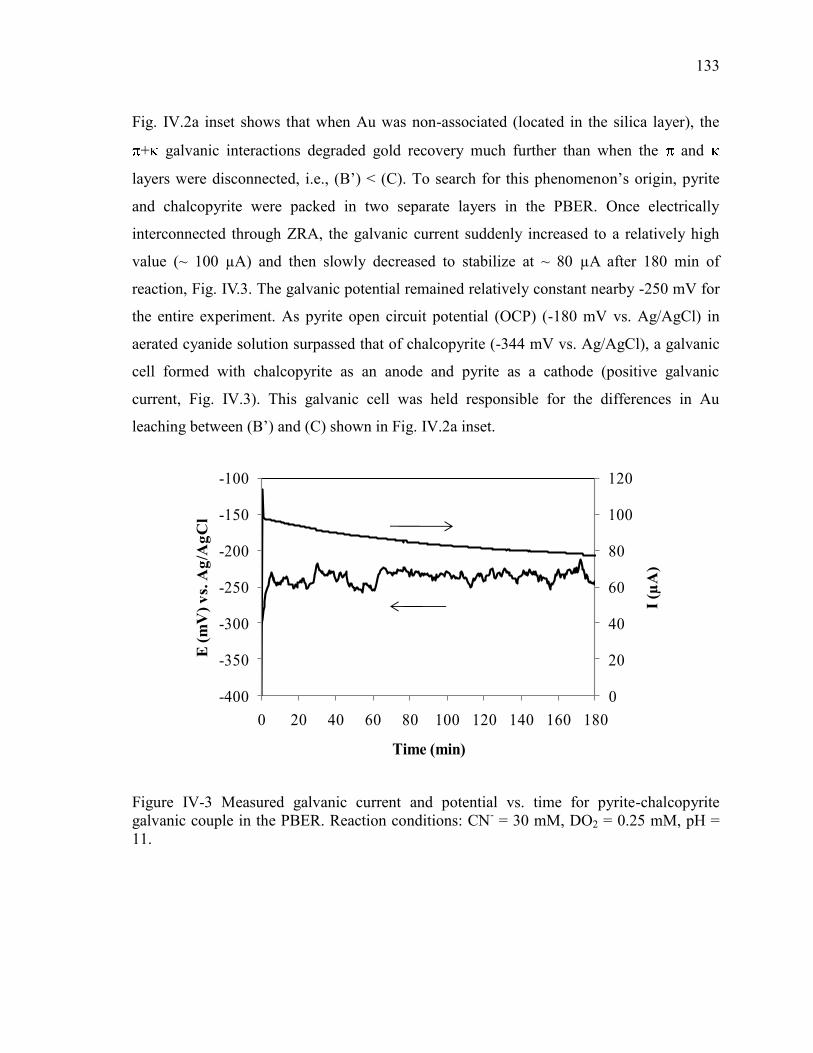
133
Fig. IV.2a inset shows that when Au was non-associated (located in the silica layer), the
+ galvanic interactions degraded gold recovery much further than when the and
layers were disconnected, i.e., (B’) < (C). To search for this phenomenon’s origin, pyrite
and chalcopyrite were packed in two separate layers in the PBER. Once electrically
interconnected through ZRA, the galvanic current suddenly increased to a relatively high
value (~ 100 µA) and then slowly decreased to stabilize at ~ 80 µA after 180 min of
reaction, Fig. IV.3. The galvanic potential remained relatively constant nearby -250 mV for
the entire experiment. As pyrite open circuit potential (OCP) (-180 mV vs. Ag/AgCl) in
aerated cyanide solution surpassed that of chalcopyrite (-344 mV vs. Ag/AgCl), a galvanic
cell formed with chalcopyrite as an anode and pyrite as a cathode (positive galvanic
current, Fig. IV.3). This galvanic cell was held responsible for the differences in Au
leaching between (B’) and (C) shown in Fig. IV.2a inset.
0
20
40
60
80
100
120
-400
-350
-300
-250
-200
-150
-100
0 20 40 60 80 100 120 140 160 180
I (µ
A)
E (
mV
) v
s. A
g/A
gC
l
Time (min)
Figure IV-3 Measured galvanic current and potential vs. time for pyrite-chalcopyrite
galvanic couple in the PBER. Reaction conditions: CN- = 30 mM, DO2 = 0.25 mM, pH =
11.
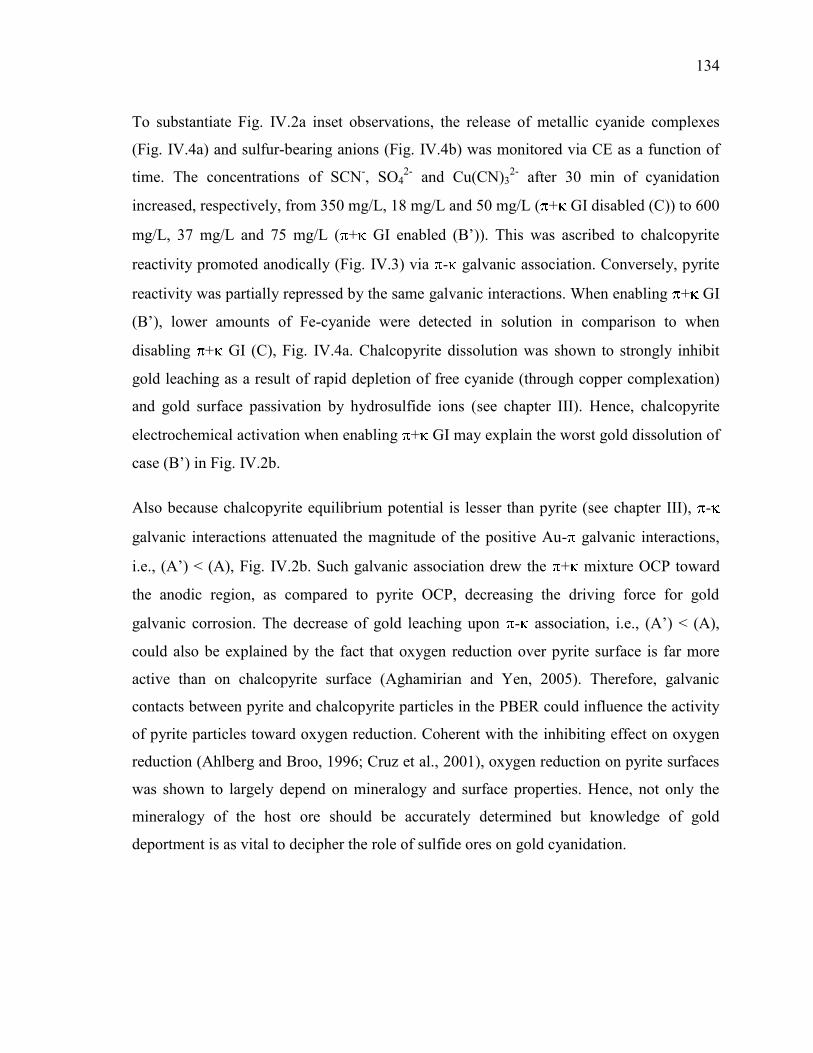
134
To substantiate Fig. IV.2a inset observations, the release of metallic cyanide complexes
(Fig. IV.4a) and sulfur-bearing anions (Fig. IV.4b) was monitored via CE as a function of
time. The concentrations of SCN-, SO4
2- and Cu(CN)3
2- after 30 min of cyanidation
increased, respectively, from 350 mg/L, 18 mg/L and 50 mg/L ( + GI disabled (C)) to 600
mg/L, 37 mg/L and 75 mg/L ( + GI enabled (B’)). This was ascribed to chalcopyrite
reactivity promoted anodically (Fig. IV.3) via - galvanic association. Conversely, pyrite
reactivity was partially repressed by the same galvanic interactions. When enabling + GI
(B’), lower amounts of Fe-cyanide were detected in solution in comparison to when
disabling + GI (C), Fig. IV.4a. Chalcopyrite dissolution was shown to strongly inhibit
gold leaching as a result of rapid depletion of free cyanide (through copper complexation)
and gold surface passivation by hydrosulfide ions (see chapter III). Hence, chalcopyrite
electrochemical activation when enabling + GI may explain the worst gold dissolution of
case (B’) in Fig. IV.2b.
Also because chalcopyrite equilibrium potential is lesser than pyrite (see chapter III), -
galvanic interactions attenuated the magnitude of the positive Au- galvanic interactions,
i.e., (A’) < (A), Fig. IV.2b. Such galvanic association drew the + mixture OCP toward
the anodic region, as compared to pyrite OCP, decreasing the driving force for gold
galvanic corrosion. The decrease of gold leaching upon - association, i.e., (A’) < (A),
could also be explained by the fact that oxygen reduction over pyrite surface is far more
active than on chalcopyrite surface (Aghamirian and Yen, 2005). Therefore, galvanic
contacts between pyrite and chalcopyrite particles in the PBER could influence the activity
of pyrite particles toward oxygen reduction. Coherent with the inhibiting effect on oxygen
reduction (Ahlberg and Broo, 1996; Cruz et al., 2001), oxygen reduction on pyrite surfaces
was shown to largely depend on mineralogy and surface properties. Hence, not only the
mineralogy of the host ore should be accurately determined but knowledge of gold
deportment is as vital to decipher the role of sulfide ores on gold cyanidation.
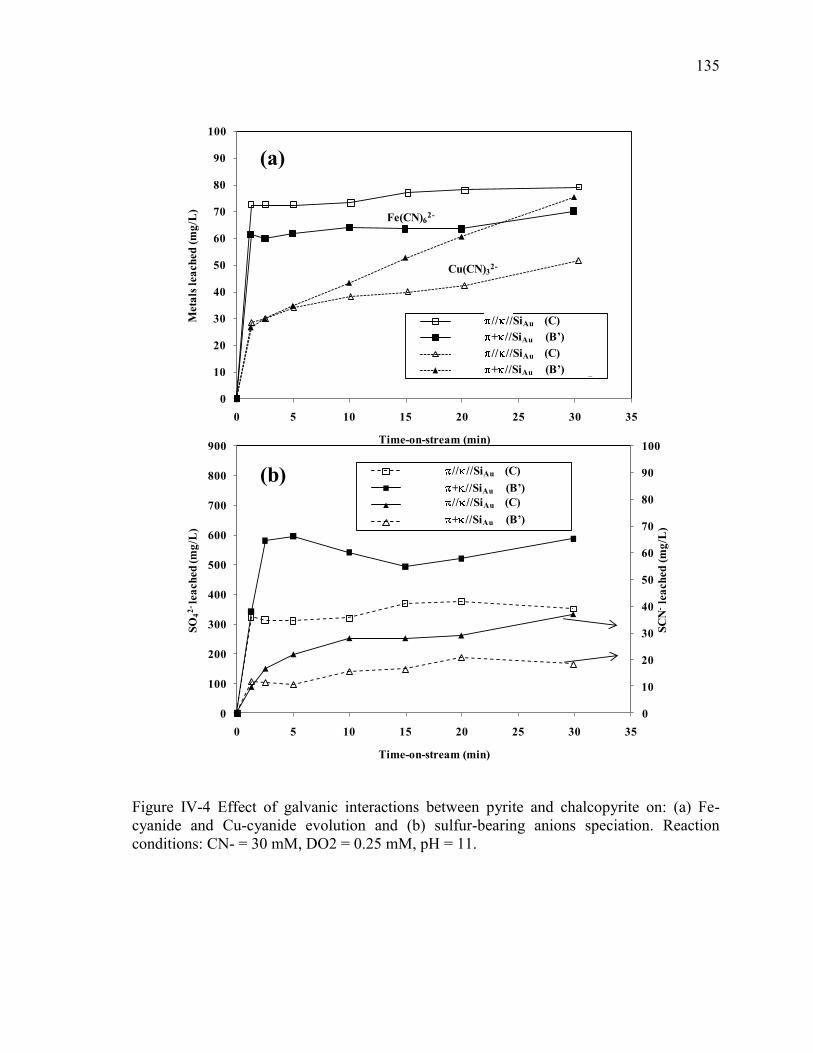
135
Cu(CN)32-
Fe(CN)62-
0
10
20
30
40
50
60
70
80
90
100
0 5 10 15 20 25 30 35
Meta
ls l
ea
ch
ed
(m
g/L
)
Time-on-stream (min)
MRI-2//MRI-3//Silica+Au+Ag
MRI-2+MRI-3//Silica+Au+Ag
MRI-2//MRI-3//Silica+Au+Ag
MRI-2+MRI-3//Silica+Au+Ag
(a)
0
10
20
30
40
50
60
70
80
90
100
0
100
200
300
400
500
600
700
800
900
0 5 10 15 20 25 30 35
SC
N-
lea
ch
ed
(mg
/L)
SO
42
-le
ach
ed
(mg
/L)
Time-on-stream (min)
MRI-2//MRI-3//Silica+Au+Ag
MRI-2+MRI-3//Silica+Au+Ag
MRI-2+MRI-3//Silica+Au+Ag
MRI-2//MRI-3//Silica+Au+Ag
(b)
// //SiAu (C)
+ //SiAu (B’)
// //SiAu (C)
+ //SiAu (B’)
// //SiAu (C)
+ //SiAu (B’)
// //SiAu (C)
+ //SiAu (B’)
Figure IV-4 Effect of galvanic interactions between pyrite and chalcopyrite on: (a) Fe-
cyanide and Cu-cyanide evolution and (b) sulfur-bearing anions speciation. Reaction
conditions: CN- = 30 mM, DO2 = 0.25 mM, pH = 11.
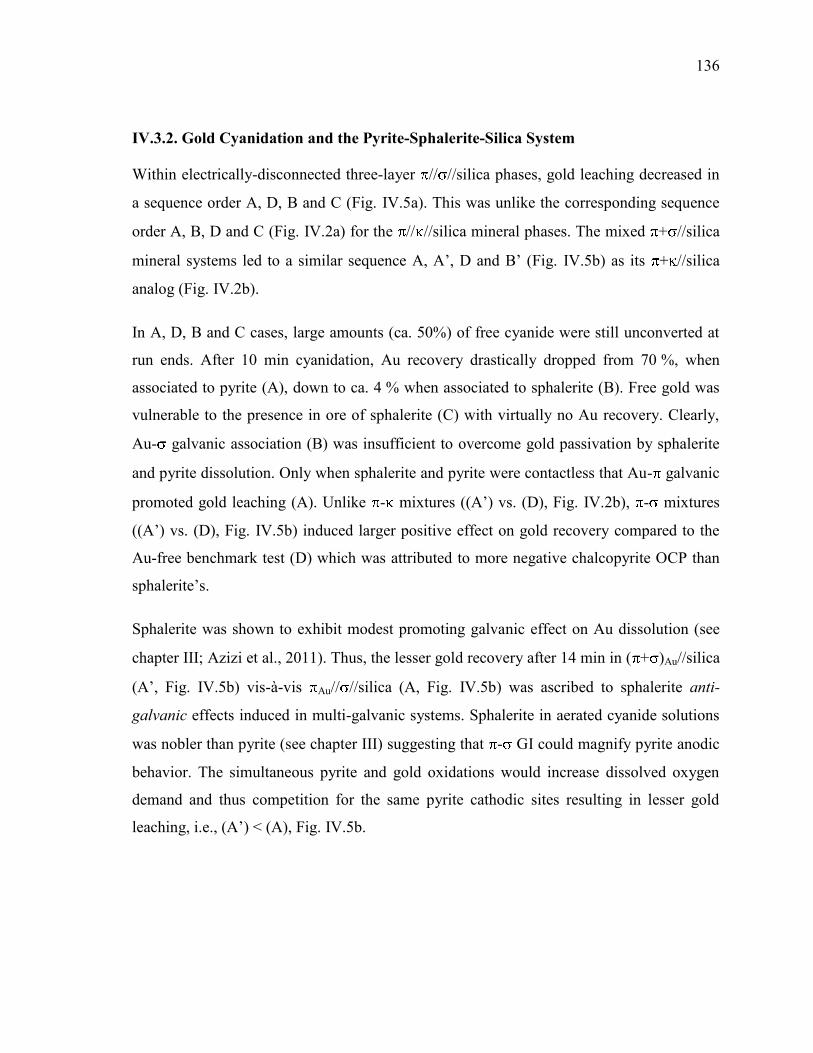
136
IV.3.2. Gold Cyanidation and the Pyrite-Sphalerite-Silica System
Within electrically-disconnected three-layer // //silica phases, gold leaching decreased in
a sequence order A, D, B and C (Fig. IV.5a). This was unlike the corresponding sequence
order A, B, D and C (Fig. IV.2a) for the // //silica mineral phases. The mixed + //silica
mineral systems led to a similar sequence A, A’, D and B’ (Fig. IV.5b) as its + //silica
analog (Fig. IV.2b).
In A, D, B and C cases, large amounts (ca. 50%) of free cyanide were still unconverted at
run ends. After 10 min cyanidation, Au recovery drastically dropped from 70 %, when
associated to pyrite (A), down to ca. 4 % when associated to sphalerite (B). Free gold was
vulnerable to the presence in ore of sphalerite (C) with virtually no Au recovery. Clearly,
Au- galvanic association (B) was insufficient to overcome gold passivation by sphalerite
and pyrite dissolution. Only when sphalerite and pyrite were contactless that Au- galvanic
promoted gold leaching (A). Unlike - mixtures ((A’) vs. (D), Fig. IV.2b), - mixtures
((A’) vs. (D), Fig. IV.5b) induced larger positive effect on gold recovery compared to the
Au-free benchmark test (D) which was attributed to more negative chalcopyrite OCP than
sphalerite’s.
Sphalerite was shown to exhibit modest promoting galvanic effect on Au dissolution (see
chapter III; Azizi et al., 2011). Thus, the lesser gold recovery after 14 min in ( + )Au//silica
(A’, Fig. IV.5b) vis-à-vis Au// //silica (A, Fig. IV.5b) was ascribed to sphalerite anti-
galvanic effects induced in multi-galvanic systems. Sphalerite in aerated cyanide solutions
was nobler than pyrite (see chapter III) suggesting that - GI could magnify pyrite anodic
behavior. The simultaneous pyrite and gold oxidations would increase dissolved oxygen
demand and thus competition for the same pyrite cathodic sites resulting in lesser gold
leaching, i.e., (A’) < (A), Fig. IV.5b.
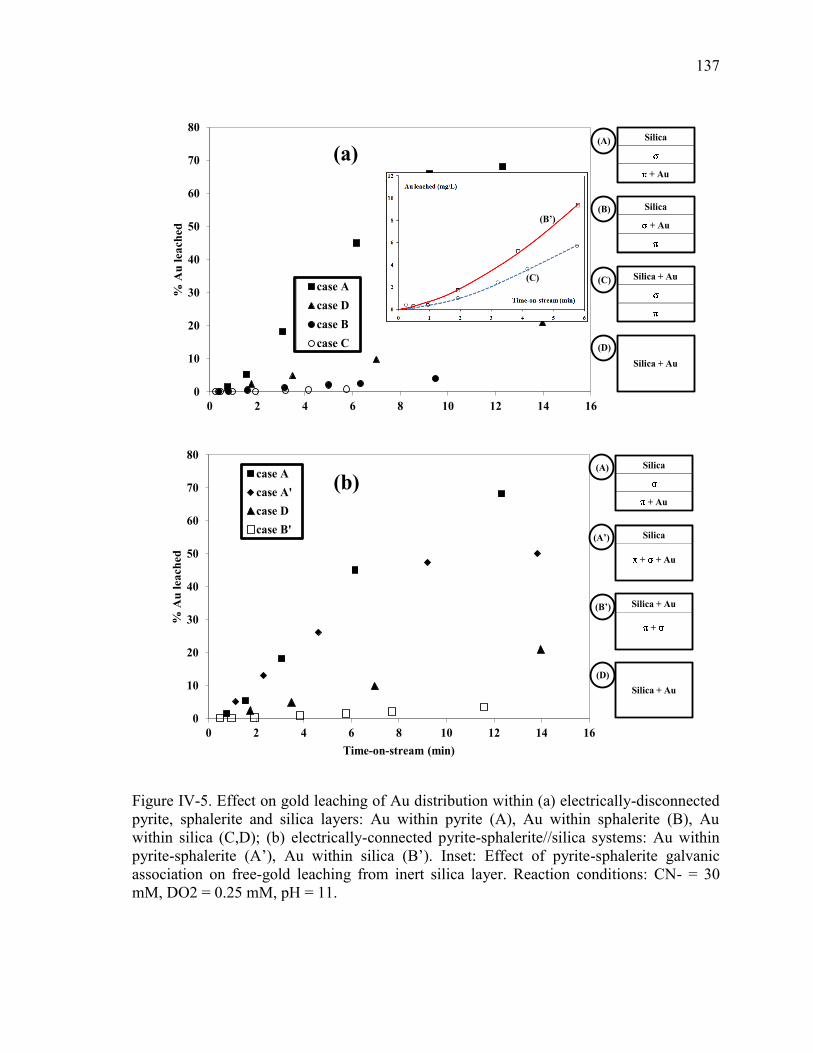
137
0
10
20
30
40
50
60
70
80
0 2 4 6 8 10 12 14 16
% A
u l
ea
ch
ed
Time-on-stream (min)
case A : MRI-2+Au+Ag//MRI-4//Silica
case D : Silica+Au+Ag
case B : MRI-2//MRI-4+Au+Ag//Silica
case C : MRI-2//MRI-4//Silica+Au+Ag
0
10
20
30
40
50
60
70
80
0 2 4 6 8 10 12 14 16
% A
u l
ea
ch
ed
Time-on-stream (min)
case A : MRI-2+Au+Ag//MRI-4//Silica
case A' : MRI-2+MRI-4+Au+Ag//Silica
case D : Silica+Au+Ag
case B' : MRI-2+MRI-4//Silica+Au+Ag
Silica
+ Au
(B)
Silica + Au(C)
Silica + Au
(D)
Silica
+ Au
(A)
Silica
+ + Au
(A’)
Silica + Au
(D)
Silica
+ Au
(A)
Silica + Au(B’)
+
(C)
(B’)
(a)
(b)
Figure IV-5. Effect on gold leaching of Au distribution within (a) electrically-disconnected
pyrite, sphalerite and silica layers: Au within pyrite (A), Au within sphalerite (B), Au
within silica (C,D); (b) electrically-connected pyrite-sphalerite//silica systems: Au within
pyrite-sphalerite (A’), Au within silica (B’). Inset: Effect of pyrite-sphalerite galvanic
association on free-gold leaching from inert silica layer. Reaction conditions: CN- = 30
mM, DO2 = 0.25 mM, pH = 11.
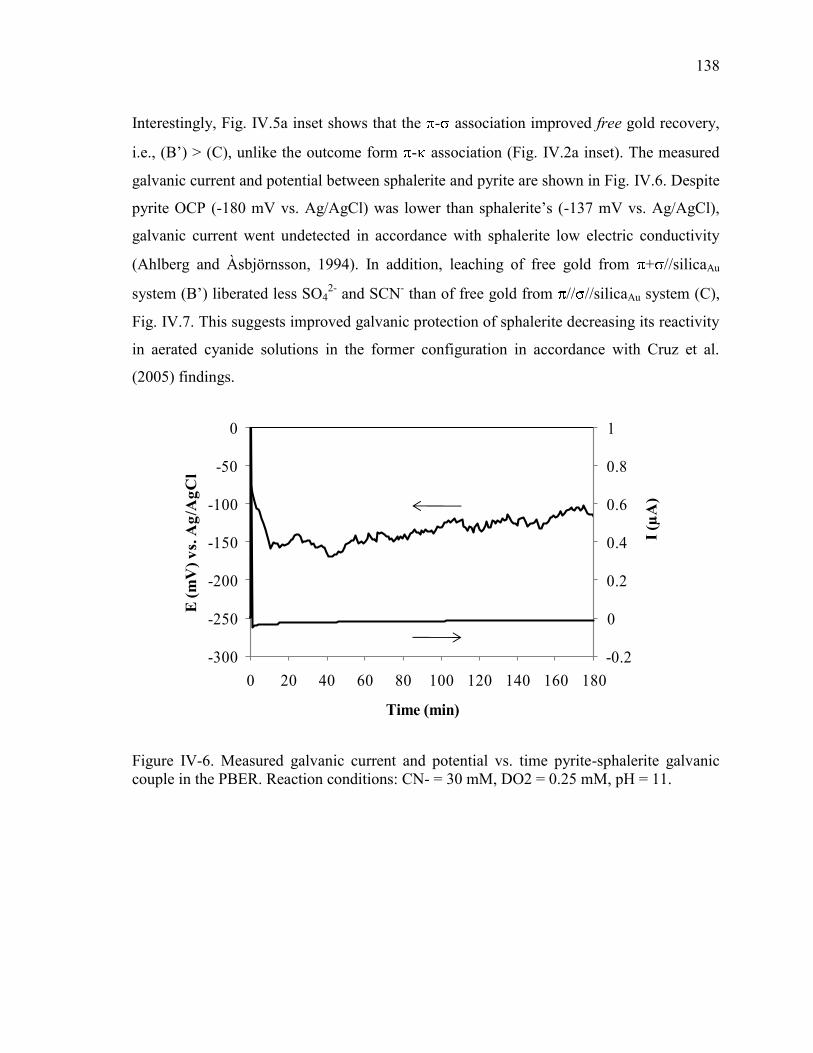
138
Interestingly, Fig. IV.5a inset shows that the - association improved free gold recovery,
i.e., (B’) > (C), unlike the outcome form - association (Fig. IV.2a inset). The measured
galvanic current and potential between sphalerite and pyrite are shown in Fig. IV.6. Despite
pyrite OCP (-180 mV vs. Ag/AgCl) was lower than sphalerite’s (-137 mV vs. Ag/AgCl),
galvanic current went undetected in accordance with sphalerite low electric conductivity
(Ahlberg and Àsbjörnsson, 1994). In addition, leaching of free gold from + //silicaAu
system (B’) liberated less SO42-
and SCN- than of free gold from // //silicaAu system (C),
Fig. IV.7. This suggests improved galvanic protection of sphalerite decreasing its reactivity
in aerated cyanide solutions in the former configuration in accordance with Cruz et al.
(2005) findings.
-0.2
0
0.2
0.4
0.6
0.8
1
-300
-250
-200
-150
-100
-50
0
0 20 40 60 80 100 120 140 160 180
I (µ
A)
E (
mV
) v
s. A
g/A
gC
l
Time (min)
Figure IV-6. Measured galvanic current and potential vs. time pyrite-sphalerite galvanic
couple in the PBER. Reaction conditions: CN- = 30 mM, DO2 = 0.25 mM, pH = 11.
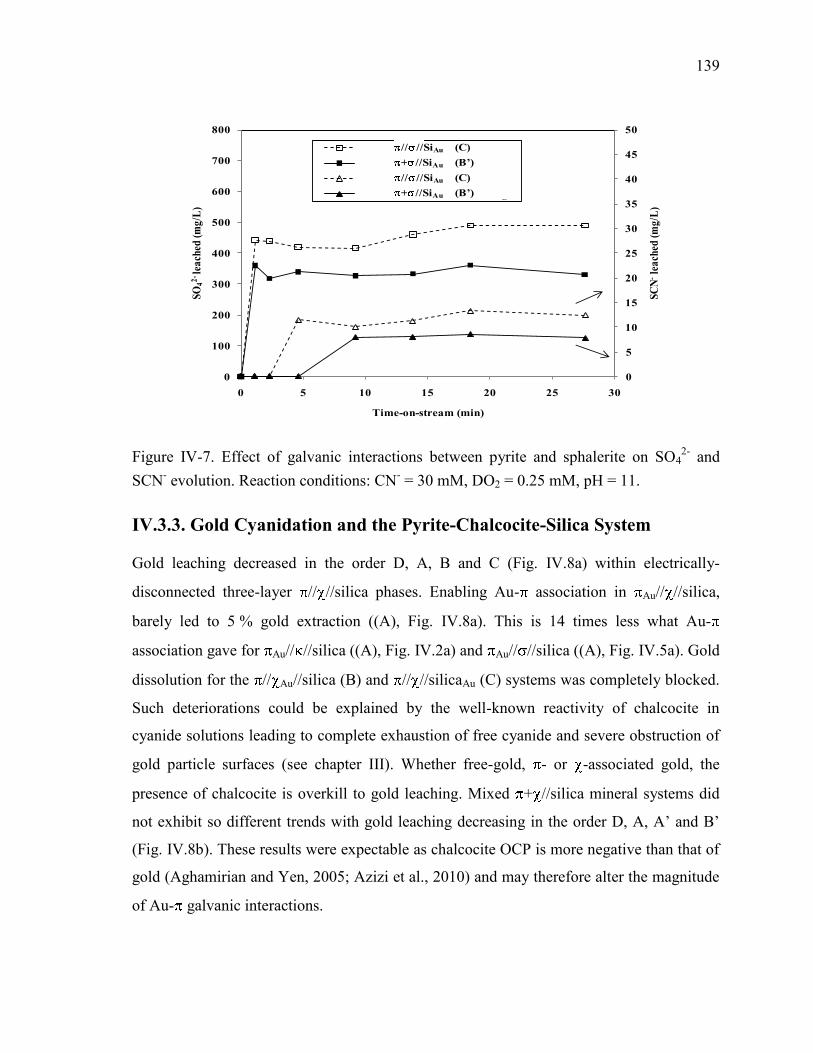
139
0
5
10
15
20
25
30
35
40
45
50
0
100
200
300
400
500
600
700
800
0 5 10 15 20 25 30
SC
N-
lea
ched
(mg
/L)
SO
42
-le
ach
ed(m
g/L
)
Time-on-stream (min)
MRI-2//MRI-4//Silica+Au+Ag
MRI-2+MRI-4//Silica+Au+Ag
MRI-2//MRI-4//Silica+Au+Ag
MRI-2+MRI-4//Silica+Au+Ag
// //SiAu (C)
+ //SiAu (B’)
// //SiAu (C)
+ //SiAu (B’)
Figure IV-7. Effect of galvanic interactions between pyrite and sphalerite on SO42-
and
SCN- evolution. Reaction conditions: CN
- = 30 mM, DO2 = 0.25 mM, pH = 11.
IV.3.3. Gold Cyanidation and the Pyrite-Chalcocite-Silica System
Gold leaching decreased in the order D, A, B and C (Fig. IV.8a) within electrically-
disconnected three-layer // //silica phases. Enabling Au- association in Au// //silica,
barely led to 5 % gold extraction ((A), Fig. IV.8a). This is 14 times less what Au-
association gave for Au// //silica ((A), Fig. IV.2a) and Au// //silica ((A), Fig. IV.5a). Gold
dissolution for the // Au//silica (B) and // //silicaAu (C) systems was completely blocked.
Such deteriorations could be explained by the well-known reactivity of chalcocite in
cyanide solutions leading to complete exhaustion of free cyanide and severe obstruction of
gold particle surfaces (see chapter III). Whether free-gold, - or -associated gold, the
presence of chalcocite is overkill to gold leaching. Mixed + //silica mineral systems did
not exhibit so different trends with gold leaching decreasing in the order D, A, A’ and B’
(Fig. IV.8b). These results were expectable as chalcocite OCP is more negative than that of
gold (Aghamirian and Yen, 2005; Azizi et al., 2010) and may therefore alter the magnitude
of Au- galvanic interactions.
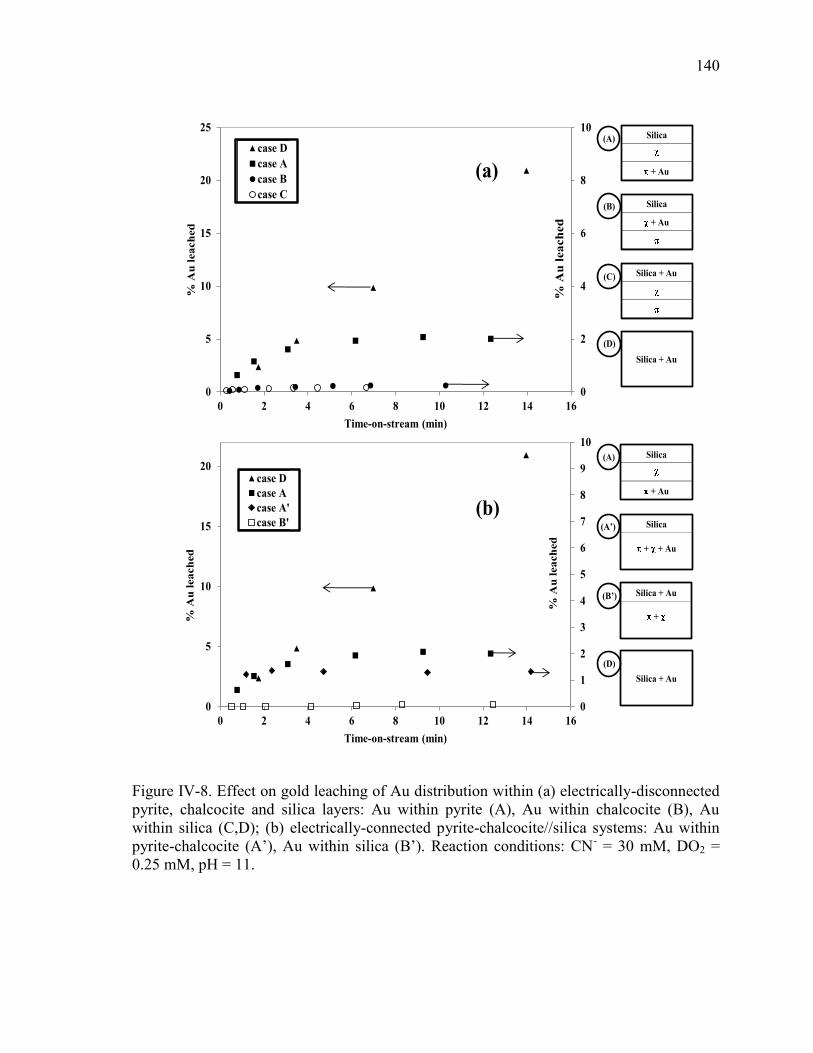
140
0
2
4
6
8
10
0
5
10
15
20
25
0 2 4 6 8 10 12 14 16
% A
u l
ea
ch
ed
Time-on-stream (min)
case D : Silica+Au+Ag
case A : MRI-2+Au+Ag//MRI-5//Silica
case B : MRI-2//MRI-5+Au+Ag//Silica
case C :MRI-2//MRI-5//Silica+Au+Ag
% A
u l
each
ed
0
1
2
3
4
5
6
7
8
9
10
0
5
10
15
20
0 2 4 6 8 10 12 14 16
% A
u l
ea
ch
ed
% A
u l
ea
ch
ed
Time-on-stream (min)
case D : Silica+Au+Ag
case A : MRI-2+Au+Ag//MRI-5//Silica
case A' : MRI-2+MRI-5+Au+Ag//Silica
case B' : MRI-2+MRI-5//Silica+Au+Ag
(a)
(b)
Silica
+ Au
(B)
Silica + Au(C)
Silica + Au
(D)
Silica
+ Au
(A)
Silica
+ + Au
(A’)
Silica + Au
(D)
Silica
+ Au
(A)
Silica + Au(B’)
+
Figure IV-8. Effect on gold leaching of Au distribution within (a) electrically-disconnected
pyrite, chalcocite and silica layers: Au within pyrite (A), Au within chalcocite (B), Au
within silica (C,D); (b) electrically-connected pyrite-chalcocite//silica systems: Au within
pyrite-chalcocite (A’), Au within silica (B’). Reaction conditions: CN- = 30 mM, DO2 =
0.25 mM, pH = 11.
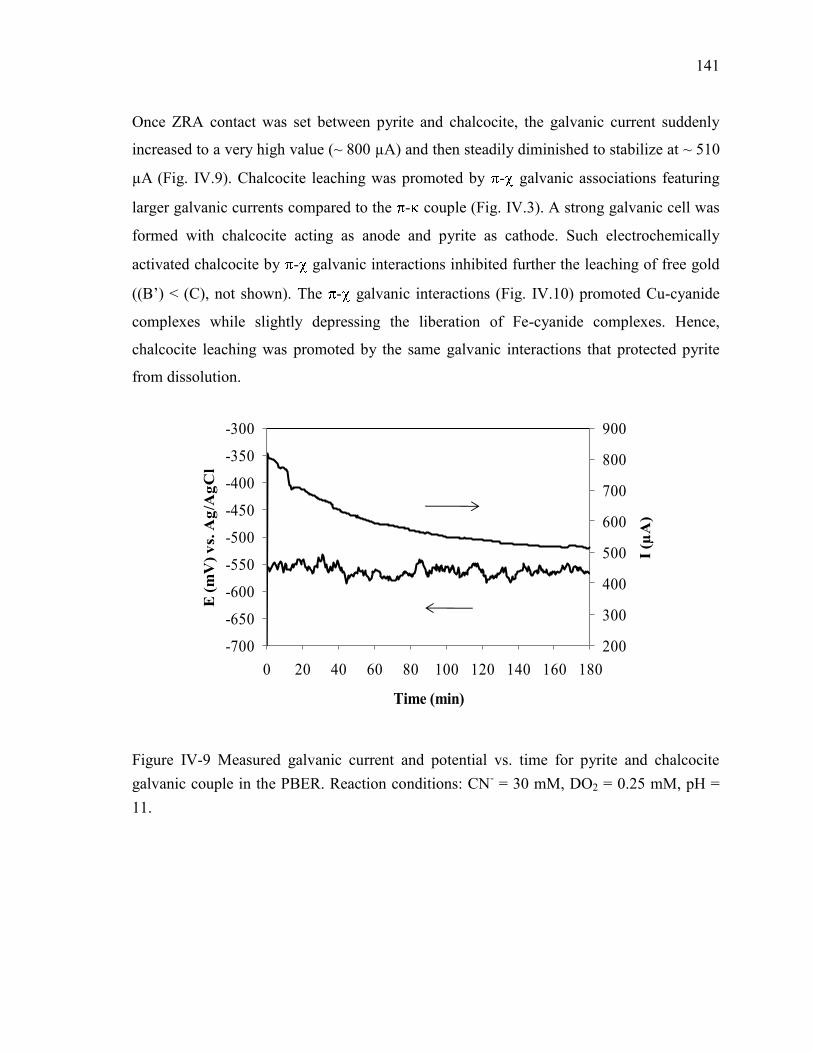
141
Once ZRA contact was set between pyrite and chalcocite, the galvanic current suddenly
increased to a very high value (~ 800 µA) and then steadily diminished to stabilize at ~ 510
µA (Fig. IV.9). Chalcocite leaching was promoted by - galvanic associations featuring
larger galvanic currents compared to the - couple (Fig. IV.3). A strong galvanic cell was
formed with chalcocite acting as anode and pyrite as cathode. Such electrochemically
activated chalcocite by - galvanic interactions inhibited further the leaching of free gold
((B’) < (C), not shown). The - galvanic interactions (Fig. IV.10) promoted Cu-cyanide
complexes while slightly depressing the liberation of Fe-cyanide complexes. Hence,
chalcocite leaching was promoted by the same galvanic interactions that protected pyrite
from dissolution.
200
300
400
500
600
700
800
900
-700
-650
-600
-550
-500
-450
-400
-350
-300
0 20 40 60 80 100 120 140 160 180
I (µ
A)
E (
mV
) v
s. A
g/A
gC
l
Time (min)
Figure IV-9 Measured galvanic current and potential vs. time for pyrite and chalcocite
galvanic couple in the PBER. Reaction conditions: CN- = 30 mM, DO2 = 0.25 mM, pH =
11.
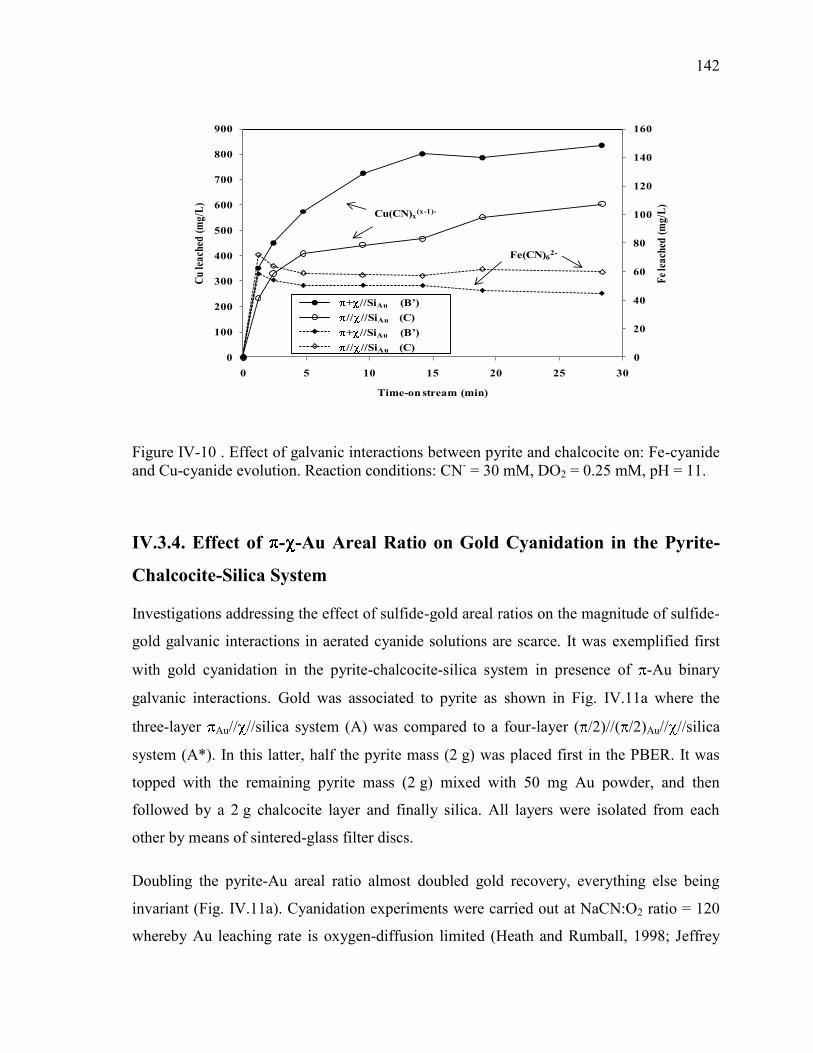
142
0
20
40
60
80
100
120
140
160
0
100
200
300
400
500
600
700
800
900
0 5 10 15 20 25 30
Fe
lea
ched
(m
g/L
)
Cu
lea
ched
(m
g/L
)
Time-on stream (min)
MRI-2+MRI-5//Silica
MRI-2//MRI-5//Silica
MRI-2+MRI-5//Silica
MRI-2//MRI-5//Silica
Cu(CN)x(x-1)-
Fe(CN)62-
+ //SiAu (B’)
// //SiAu (C)
+ //SiAu (B’)
// //SiAu (C)
Figure IV-10 . Effect of galvanic interactions between pyrite and chalcocite on: Fe-cyanide
and Cu-cyanide evolution. Reaction conditions: CN- = 30 mM, DO2 = 0.25 mM, pH = 11.
IV.3.4. Effect of - -Au Areal Ratio on Gold Cyanidation in the Pyrite-
Chalcocite-Silica System
Investigations addressing the effect of sulfide-gold areal ratios on the magnitude of sulfide-
gold galvanic interactions in aerated cyanide solutions are scarce. It was exemplified first
with gold cyanidation in the pyrite-chalcocite-silica system in presence of -Au binary
galvanic interactions. Gold was associated to pyrite as shown in Fig. IV.11a where the
three-layer Au// //silica system (A) was compared to a four-layer ( /2)//( /2)Au// //silica
system (A*). In this latter, half the pyrite mass (2 g) was placed first in the PBER. It was
topped with the remaining pyrite mass (2 g) mixed with 50 mg Au powder, and then
followed by a 2 g chalcocite layer and finally silica. All layers were isolated from each
other by means of sintered-glass filter discs.
Doubling the pyrite-Au areal ratio almost doubled gold recovery, everything else being
invariant (Fig. IV.11a). Cyanidation experiments were carried out at NaCN:O2 ratio = 120
whereby Au leaching rate is oxygen-diffusion limited (Heath and Rumball, 1998; Jeffrey
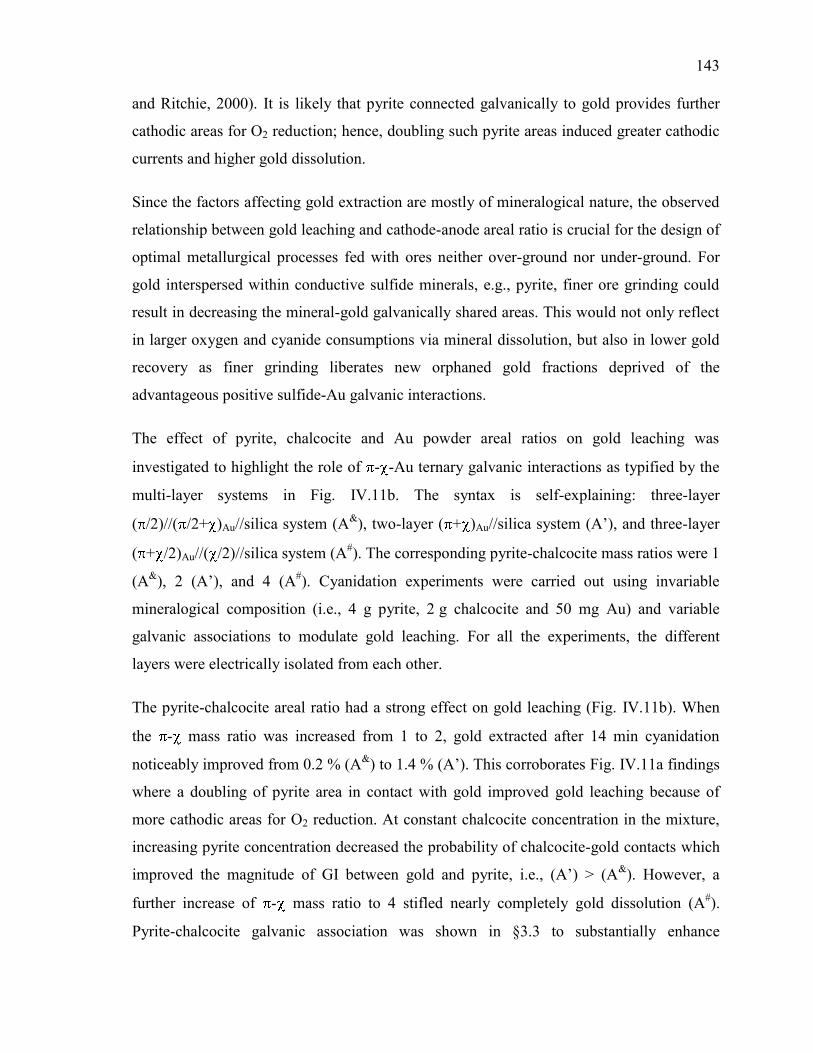
143
and Ritchie, 2000). It is likely that pyrite connected galvanically to gold provides further
cathodic areas for O2 reduction; hence, doubling such pyrite areas induced greater cathodic
currents and higher gold dissolution.
Since the factors affecting gold extraction are mostly of mineralogical nature, the observed
relationship between gold leaching and cathode-anode areal ratio is crucial for the design of
optimal metallurgical processes fed with ores neither over-ground nor under-ground. For
gold interspersed within conductive sulfide minerals, e.g., pyrite, finer ore grinding could
result in decreasing the mineral-gold galvanically shared areas. This would not only reflect
in larger oxygen and cyanide consumptions via mineral dissolution, but also in lower gold
recovery as finer grinding liberates new orphaned gold fractions deprived of the
advantageous positive sulfide-Au galvanic interactions.
The effect of pyrite, chalcocite and Au powder areal ratios on gold leaching was
investigated to highlight the role of - -Au ternary galvanic interactions as typified by the
multi-layer systems in Fig. IV.11b. The syntax is self-explaining: three-layer
( /2)//( /2+ )Au//silica system (A&
), two-layer ( + )Au//silica system (A’), and three-layer
( + /2)Au//( /2)//silica system (A#). The corresponding pyrite-chalcocite mass ratios were 1
(A&
), 2 (A’), and 4 (A#). Cyanidation experiments were carried out using invariable
mineralogical composition (i.e., 4 g pyrite, 2 g chalcocite and 50 mg Au) and variable
galvanic associations to modulate gold leaching. For all the experiments, the different
layers were electrically isolated from each other.
The pyrite-chalcocite areal ratio had a strong effect on gold leaching (Fig. IV.11b). When
the - mass ratio was increased from 1 to 2, gold extracted after 14 min cyanidation
noticeably improved from 0.2 % (A&
) to 1.4 % (A’). This corroborates Fig. IV.11a findings
where a doubling of pyrite area in contact with gold improved gold leaching because of
more cathodic areas for O2 reduction. At constant chalcocite concentration in the mixture,
increasing pyrite concentration decreased the probability of chalcocite-gold contacts which
improved the magnitude of GI between gold and pyrite, i.e., (A’) > (A&
). However, a
further increase of - mass ratio to 4 stifled nearly completely gold dissolution (A#).
Pyrite-chalcocite galvanic association was shown in §3.3 to substantially enhance
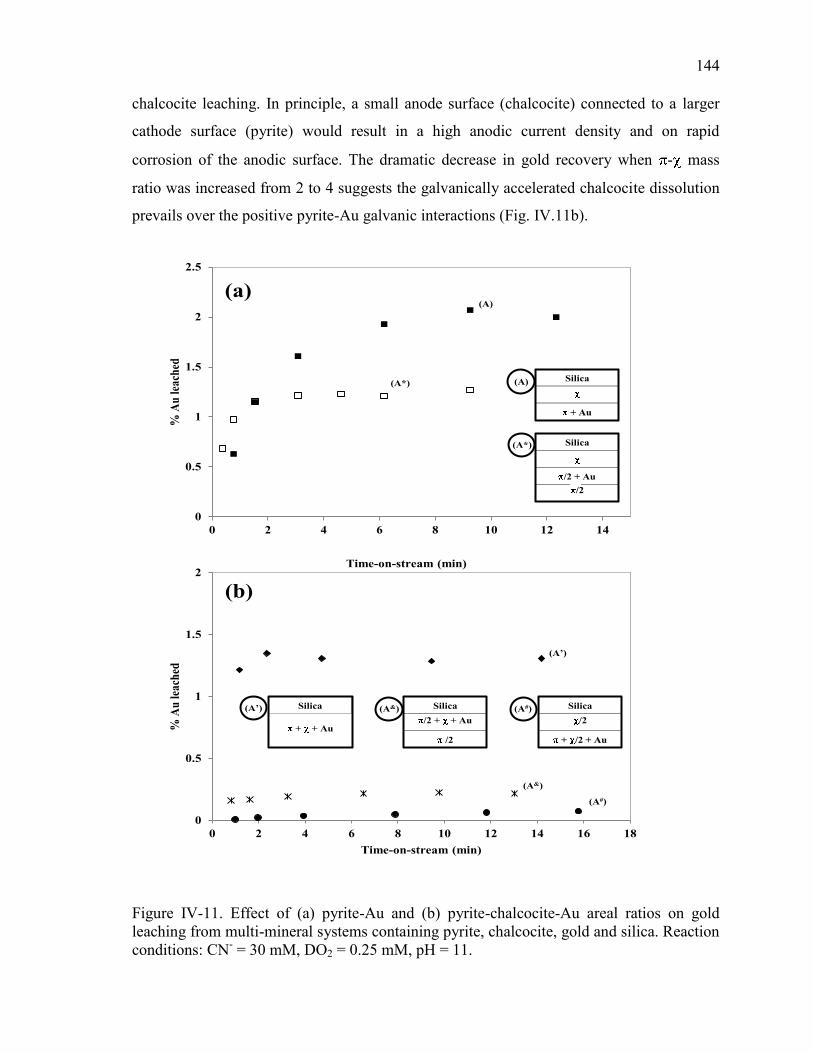
144
chalcocite leaching. In principle, a small anode surface (chalcocite) connected to a larger
cathode surface (pyrite) would result in a high anodic current density and on rapid
corrosion of the anodic surface. The dramatic decrease in gold recovery when - mass
ratio was increased from 2 to 4 suggests the galvanically accelerated chalcocite dissolution
prevails over the positive pyrite-Au galvanic interactions (Fig. IV.11b).
0
0.5
1
1.5
2
2.5
0 2 4 6 8 10 12 14
% A
u l
each
ed
Time-on-stream (min)
0
0.5
1
1.5
2
0 2 4 6 8 10 12 14 16 18
% A
u l
each
ed
Time-on-stream (min)
(a)
(b)
Silica
/2 + Au
(A*)
Silica
+ Au
(A)
/2
(A*)
(A)
Silica
+ + Au
(A’) Silica
/2 + + Au
/2
(A&) Silica
/2
+ /2 + Au
(A#)
(A#)
(A&)
(A’)
Figure IV-11. Effect of (a) pyrite-Au and (b) pyrite-chalcocite-Au areal ratios on gold
leaching from multi-mineral systems containing pyrite, chalcocite, gold and silica. Reaction
conditions: CN- = 30 mM, DO2 = 0.25 mM, pH = 11.
145
IV.4. Conclusions
Synthetic gold ores containing pyrite, silica, Au, and successively, X = chalcopyrite,
sphalerite and chalcocite were prepared to investigate galvanic interactions in gold
cyanidation of associated and free (silica-trapped) gold using a new packed-bed
electrochemical reactor (PBER). Au-pyrite and Au-X binary galvanic interactions were
assessed in three-layer electrically-disconnected pyrite//X//silica systems. Similarly, pyrite-
X and ternary Au-pyrite-X galvanic interactions were interrogated in two-layer pyrite +
X//silica systems.
The gold leaching pattern in the pyrite//chalcopyrite//silica and pyrite//sphalerite//silica
systems was determined by the gold-mineral galvanic interactions: the highest recovery
achieved with pyrite-associated Au and the lowest from free Au (silica-trapped). The Au-
pyrite positive galvanic interactions were downplayed by chalcocite irrespective of the
gold-bearing mineral layer. In the mixed sulfide pyrite + X//silica systems, the Au-pyrite
galvanic interactions were found to depend on the mineralogical association between pyrite
and the other sulfides. The pyrite-X galvanic association resulted in a significant decrease
of gold leaching as compared to the case where pyrite was the sole gold-bearing mineral.
Pyrite-chalcopyrite and pyrite-chalcocite had a negative effect on the leaching of free gold
(silica-trapped), while pyrite-sphalerite galvanic association boosted free gold leaching.
Chalcocite and chalcopyrite associated with pyrite led to high galvanic currents and anodic
oxidations of the less noble sulfide paired with pyrite as confirmed by the higher copper-
cyanide and lower gold concentrations measured in the solution with pyrite-X mixtures.
Despite electrochemical evidence of galvanic interactions was not possible for the pyrite-
sphalerite system, their presence was indirectly measured by the change in concentration of
the leached species which suggested possible galvanic protection of sphalerite by pyrite.
The effect of Au-sulfide areal ratios on gold leaching was investigated in the multi-mineral
system containing pyrite, chalcocite and silica. The increase of pyrite-Au areal ratio
promoted gold dissolution via increased cathodic areas for O2 reduction. This was unlike
the pyrite-X areal ratio which exhibited non-monotonic incidence on gold leaching.
146
IV.5. References
Aghamirian, M.M., Yen, W.T., 2005. Mechanism of galvanic interactions between gold
and sulfide minerals in cyanide solution. Minerals Engineering 18, 393-407.
Ahlberg, E., Àsbjörnsson, J., 1994. Carbon paste electrodes in mineral processing: an
electrochemical study of sphalerite. Hydrometallurgy 36, 19-37.
Ahlberg, E., Broo, A.E., 1996. Oxygen reduction at sulphide minerals. 3. The effect of
surface pre-treatment on the oxygen reduction at pyrite. International Journal of Mineral
Processing 47, 49-60.
Azizi, A., Petre, C.F., Olsen, C., Larachi, F., 2010. Electrochemical behavior of gold
cyanidation in the presence of a sulfide-rich industrial ore versus its major constitutive
sulfide minerals. Hydrometallurgy 101, 108-119.
Azizi, A., Petre, C.F., Olsen, C., Larachi, F., 2011. Untangling galvanic and passivation
phenomena induced by sulfide minerals on precious metal leaching using a new packed-
bed electrochemical cyanidation reactor. Hydrometallurgy 107, 101-111.
Cruz, R., Bertrand, V., Monroy, M., González, I., 2001. Effect of sulfide impurities on the
reactivity of pyrite and pyritic concentrates: a multi-tool approach. Applied Geochemistry
16, 803-819.
Cruz, R., Luna-Sánchez, R.M., Lapidus, G.T., González, I., Monroy, M., 2005. An
experimental strategy to determine galvanic interactions affecting the reactivity of sulfide
mineral concentrates. Hydrometallurgy 78, 198-208.
Dai, X., Jeffrey, M.I., 2006. The effect of sulfide minerals on the leaching of gold in
aerated cyanide solutions. Hydrometallurgy 82, 118-125.
Deschenes, G., Pratt, A., Riveros, P., Fulton, M., 2002. Reactions of gold and sulfide
minerals in cyanide media. Minerals and Metallurgical Processing 19, 169-177.
Goodall, W.R., Scales P.J., 2007. An overview of the advantages and disadvantages of the
determination of gold mineralogy by automated mineralogy. Minerals Engineering 20, 506-
517.
Guo, H., Deschenes, G., Pratt, A., Fulton, M., Lastra, R., 2005. Leaching kinetics and
mechanisms of surface reactions during cyanidation of gold in the presence of pyrite and
stibnite. Minerals and Metallurgical Processing 22, 89-95.
Habashi, F., 1967. Kinetics and mechanism of gold and silver dissolution in cyanide
solution. Montana Bureau of Mines and Geology Bulletin 59, Montana Bureau of Mines
and Geology, Butte, Montana, USA.
Heath, A.R., Rumball, J.A., 1998. Optimising cyanide:oxygen ratios in gold CIP/CIL
circuits. Minerals Engineering 11, 999-1010.
Jeffrey, M.I., Breuer, P.L., 2000. The cyanide leaching of gold in solution containing
sulfide. Minerals Engineering 13, 1097-1106.
147
Jeffrey, M.I., Ritchie, I.M., 2000. The leaching of gold in cyanide solutions in the presence
of impurities II. The effect of silver. Journal of The Electrochemical Society 147, 3272-
3276.
Jones, M.P., Cheung, T.S., 1988. Automatic method for finding gold grains in ores and mill
products. Asian Mining 88, 73-81.
Liu, G.Q., Yen, W.T., 1995. Effects of sulphide minerals and dissolved oxygen on the gold
and silver dissolution in cyanide solution. Minerals Engineering 8, 111-123.
Lorenzen, L., Tumilty, J.A., 1992. Diagnostic leaching as an analytical tool for evaluating
the effect of reagents on the performance of a gold plant. Minerals Engineering 5, 503-512.
Lorenzen, L., van Deventer, J.S.J., 1992. Electrochemical interactions between gold and its
associated minerals during cyanidation. Hydrometallurgy 30, 177-194.
Lorenzen, L., van Deventer, J. S. J., 1993. The identification of refractoriness in gold ores
by the selective destruction of minerals. Minerals Engineering 6, 1013-1023.
Marsden, J.O., House, C.I., 1992. The Chemistry of Gold Extraction. Ellis Horwood,
London.
Marsden, J.O., House, C.I., 2006. The Chemistry of Gold Extraction. 2nd
Edition. Society
for Mining, Metallurgy and Exploration (SME), Littleton, Co, USA.
Petre, C.F., Azizi, A., Olsen, C., Baçaoui, A., Larachi, F., 2008. Capillary electrophoretic
analysis of sulfur and cyanicides speciation during cyanidation of gold complex sulfidic
ores. Journal of Separation Science 31, 3902-3910.
Weichselbaum, J., Tumilty, J.A., Schmidt, C.G., 1989. The effect of sulphide and lead on
the rate of gold cyanidation. Proc. Austr. I.M.M. Annual conference Perth/Kalgoorlie.
Australasian Institute of Mining and Metallurgy, Melbourne, pp. 221-224.
148
CHAPITRE V. Leveraging strategies to increase gold
cyanidation in the presence of sulfide minerals - Packed-
bed electrochemical reactor approach
Abdelaaziz Azizi,1,2
Catalin Florin Petre,1‡
Faïçal Larachi1*
1-Department of Chemical Engineering, Laval University, Québec, Canada, G1V 0A6;
2-COREM Research Center, 1180 Rue de la Minéralogie, Québec, Canada, G1N 1X7;
Abstract/Résumé
Several leveraging strategies were explored to improve gold leaching during cyanidation in
the presence of pyrite, chalcopyrite, sphalerite and chalcocite. Galena, used a source of
lead, was found to largely neutralize the negative effect of sulfide minerals dissolution on
gold leaching, especially in the cases of pyrite, chalcopyrite and sphalerite. Pyrite-galena
galvanic interactions improved gold leaching while for chalcopyrite, sphalerite and
chalcocite active galvanic interactions with galena were found to be detrimental to gold
leaching. Pre-oxidation of metal sulfides prior to cyanidation significantly increased gold
leaching rate when gold-pyrite galvanic interactions were disabled, while their enablement
identified pyrite pre-oxidation as counter-productive. Pre-oxidation of mixed mineral
systems of pyrite-chalcopyrite and pyrite-sphalerite showed that enabling galvanic
interactions between the associated minerals during pre-oxidation controlled gold leaching
in the subsequent cyanidation process. For pyrite, lead nitrate addition during pre-oxidation
resulted in a significant increase of gold leaching, whereas its addition to subsequent
cyanidation cancelled the positive effects of pre-oxidation on gold dissolution.
Plusieurs mesures ont été menées pour améliorer la cinétique de lixiviation de l’or pendant
la cyanuration en présence de la pyrite, de la chalcopyrite, de la sphalérite et de la
chalcocite. La galène, utilisée comme source de plomb, neutralise largement l’effet négatif
149
de la dissolution des minéraux sulfureux sur la lixiviation de l’or, en particulier dans le cas
de la pyrite, de la chalcopyrite et de la sphalérite. Les interactions galvaniques (IG) entre la
galène et la pyrite entrainent une amélioration de la lixiviation de l’or par rapport au cas où
les mêmes IG sont absentes. Toutefois, lorsque la chalcopyrite, la sphalérite ou la
chalcocite a été connecté à la galène, les IG se sont révélées infructueuses pour la
lixiviation de l’or. La pré-oxydation des minéraux sulfureux ci-dessus a fait
significativement grimper la vitesse de dissolution de l’or, en absence des IG Au-pyrite.
Cependant, en présence des mêmes IG la pré-oxydation a été identifiée comme contre-
productive. La pré-oxydation de systèmes minéraux mixtes, contenant de la pyrite et de la
chalcopyrite ou bien de la pyrite et de la sphalérite, a montré que les IG sulfure-sulfure, se
produisant lors de l’étape de prétraitement, constituent le principal facteur contrôlant la
réactivité de l’or pendant la cyanuration. Dans le cas de la pyrite, Il a été constaté que
l’ajout du nitrate de plomb pendant l’étape de pré-oxydation améliore significativement la
vitesse de dissolution de l’or, contrairement à son utilisation au cours de la cyanuration qui
provoque une réduction considérable sur l’efficacité de la pré-oxydation.
V.1. Introduction
Due to the poor cyanide selectivity for gold over the carrier sulfide mineral matrix and to
the important electric conductivity of both gold and carrier matrix, gold cyanidation is
generally accepted as being complex due to a multitude of factors: (1) gold surface
passivation by some reaction products such as Fe(OH)3 (Guo et al., 2005) or sulfur
(Weichselbaum et al., 1989; Dai and Jeffrey, 2006); (2) galvanic interactions between gold
and sulfide minerals (Lorenzen and van Deventer, 1992; Dai and Jeffrey, 2006, Azizi et al.,
2011); (3) galvanic interactions between conducting sulfide mineral phases present in
multi-mineral systems (see chapter IV) and (4) excess cyanide and oxygen consumptions as
a result of transition metals (i.e., Cu, Fe , Zn) dissolution (Habashi, 1967).
To alleviate the harmful effects of sulfide minerals dissolution in terms of reagents
consumption (cyanide and oxygen) and gold surface passivation, atmospheric pre-oxidation
strategies and addition of lead nitrate to the slurry have been widely investigated in the
open literature (Guo et al., 2005; Dai and Jeffrey, 2006; Senanayake, 2008 and references
150
therein). Therefore, deep understanding of the mechanisms and reactions involved during
pre-oxidation and/or lead (II) addition represent important R&D challenges in today’s gold
processing. It was reported that the main role of lead (II) in the presence of sulfide minerals
is to precipitate dissolved sulfides as PbS, avoiding thus the formation of a sulfide film on
the gold surface (Hedley and Tabachnick, 1968; Deschenes et al., 2000; Breuer et al.,
2008). Deschenes et al. (2000) conducted a systematic study on the mechanisms via which
lead nitrate is affecting gold cyanidation in the presence of various sulfide minerals. Their
results demonstrated that lead (II) salts react with gold to form AuPb2, AuPb3 and some
metallic lead, which in turn activate the gold surface during cyanidation. Furthermore, the
ability of lead (II) to reduce the reactivity of some sulfide minerals as well as their affinity
for gold surface was found to be strongly affected by the nature of the sulfide mineral used.
For instance, X-ray photoelectron spectroscopy (XPS) analysis identified thin Pb layers on
the surface of gold in the presence of chalcopyrite, but no lead was found in the presence of
pyrite or pyrrhotite.
Addition of galena, which can occur naturally in sulfide gold ore deposits, as a source of
lead was also shown to have some beneficial effect on gold leaching kinetics (Deschenes,
2005). However, understanding of the mechanisms and reactions involved during gold
activation by galena is still fragmentary as the effect of this mineral on gold cyanidation in
the presence of sulfide minerals was poorly studied. This could be explained by the fact
that galena frequently occurs in direct association with other conducting mineralogical
phases within complex sulfide mineral systems. In these systems, galvanic interactions
could substantially increase or decrease the leaching of both galena and associated sulfide,
resulting in totally different effects on gold leaching.
Regarding pre-oxidation, investigations focused often on individual sulfide minerals.
Consequently, multi-factorial galvanic interactions resulting from the different
mineralogical phases present in the ore during pre-oxidation were not addressed with the
proper attention. Multi-factorial galvanic phenomena are suspected to give rise to
cyanidation responses unexpected from mono-sulfide studies. Further investigations using
multi-mineral systems are needed to provide reliable feedback for plant cyanidation circuit
where galvanic interactions between associated sulfides may play a significant role.
151
A new packed-bed electrochemical reactor (PBER) technique was developed and tested to
decouple and quantify the individual contributions of passivation phenomena and galvanic
interactions on precious metals (gold and silver, PM) leaching rates during the cyanidation
of sulfide-rich ores (Azizi et al., 2011). The PBER was filled with homogenized mixtures
of several minerals (pyrite, chalcopyrite, sphalerite, chalcocite, galena, stibnite and an
industrial ore), PM and sulfide-silica powders, which were arranged as electrically-isolated
segregated bilayer(s) with permanent particle-particle electrical contacts among all
constituents in each layer. Implantation of PM powders successively in the silica layer and
then in the sulfide layer, enabled passivation and galvanic interactions to be singled out and
quantified separately for each sulfide. The results showed that galvanic interactions
ameliorates, to various degrees, the leaching of PM, particularly those due to pyrite,
chalcopyrite and industrial ore were so positive that they largely outweighed the negative
impact of passivation.
In consideration of above interrogations, this work aims at several targets:
1. To investigate, using the new PBER, the effects of galena (free and/or associated with
sulfides) on gold cyanidation in the presence of several sulfide minerals;
2. To investigate the effects of pre-oxidation of galvanically associated sulfide-sulfide
systems and their individual components on gold leaching rate;
3. To highlight the effects on gold leaching of different strategies of lead addition in the
presence of sulfide minerals.
V.2. Experimental
V.2.1. Materials and Reagents
Five sulfide-rich ore samples received from Ward’s Natural Science were used. These
samples consisted of pyrite ( ), chalcopyrite ( ), sphalerite ( ), chalcocite ( ) and galena
( ) by virtue of the dominant proportion of the named sulfide mineral therein. Their
chemical and mineralogical characterizations are given elsewhere (see chapter III). The
samples were sieved to remove particles coarser than 90 µm and finer than 45 µm.
Consequently, the same granulometric fraction was used for the different ores, providing a
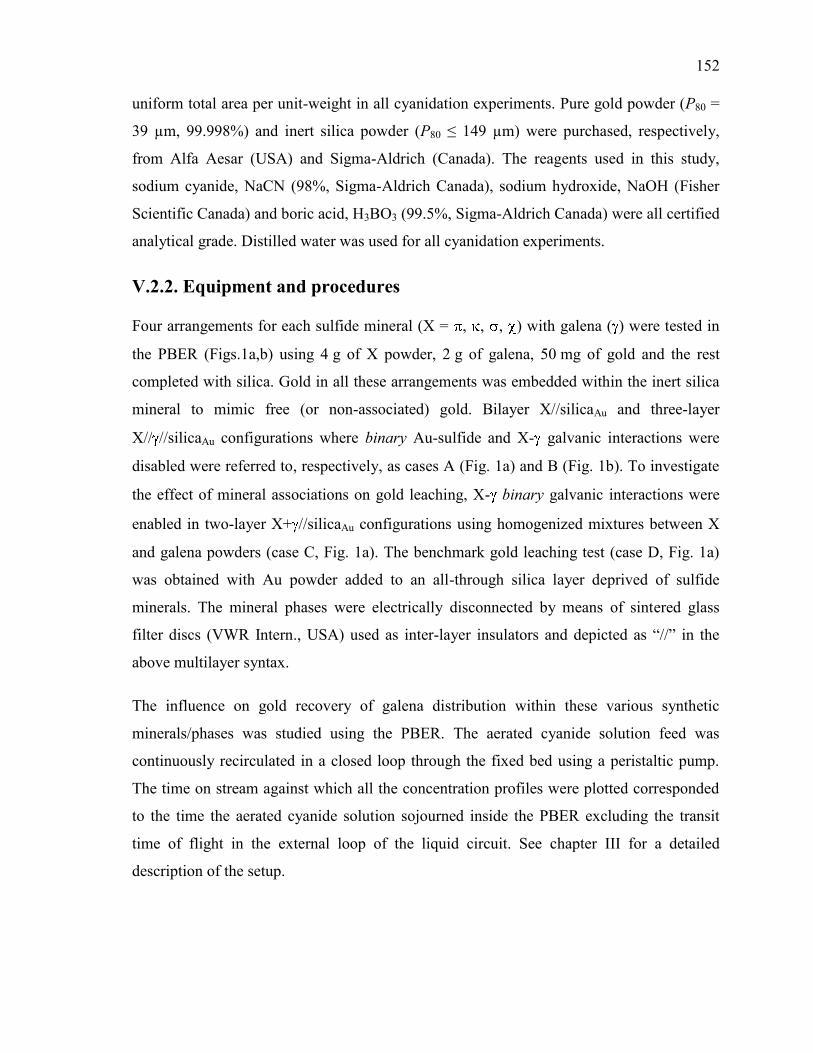
152
uniform total area per unit-weight in all cyanidation experiments. Pure gold powder (P80 =
39 µm, 99.998%) and inert silica powder (P80 ≤ 149 µm) were purchased, respectively,
from Alfa Aesar (USA) and Sigma-Aldrich (Canada). The reagents used in this study,
sodium cyanide, NaCN (98%, Sigma-Aldrich Canada), sodium hydroxide, NaOH (Fisher
Scientific Canada) and boric acid, H3BO3 (99.5%, Sigma-Aldrich Canada) were all certified
analytical grade. Distilled water was used for all cyanidation experiments.
V.2.2. Equipment and procedures
Four arrangements for each sulfide mineral (X = , , , ) with galena ( ) were tested in
the PBER (Figs.1a,b) using 4 g of X powder, 2 g of galena, 50 mg of gold and the rest
completed with silica. Gold in all these arrangements was embedded within the inert silica
mineral to mimic free (or non-associated) gold. Bilayer X//silicaAu and three-layer
X// //silicaAu configurations where binary Au-sulfide and X- galvanic interactions were
disabled were referred to, respectively, as cases A (Fig. 1a) and B (Fig. 1b). To investigate
the effect of mineral associations on gold leaching, X- binary galvanic interactions were
enabled in two-layer X+ //silicaAu configurations using homogenized mixtures between X
and galena powders (case C, Fig. 1a). The benchmark gold leaching test (case D, Fig. 1a)
was obtained with Au powder added to an all-through silica layer deprived of sulfide
minerals. The mineral phases were electrically disconnected by means of sintered glass
filter discs (VWR Intern., USA) used as inter-layer insulators and depicted as “//” in the
above multilayer syntax.
The influence on gold recovery of galena distribution within these various synthetic
minerals/phases was studied using the PBER. The aerated cyanide solution feed was
continuously recirculated in a closed loop through the fixed bed using a peristaltic pump.
The time on stream against which all the concentration profiles were plotted corresponded
to the time the aerated cyanide solution sojourned inside the PBER excluding the transit
time of flight in the external loop of the liquid circuit. See chapter III for a detailed
description of the setup.
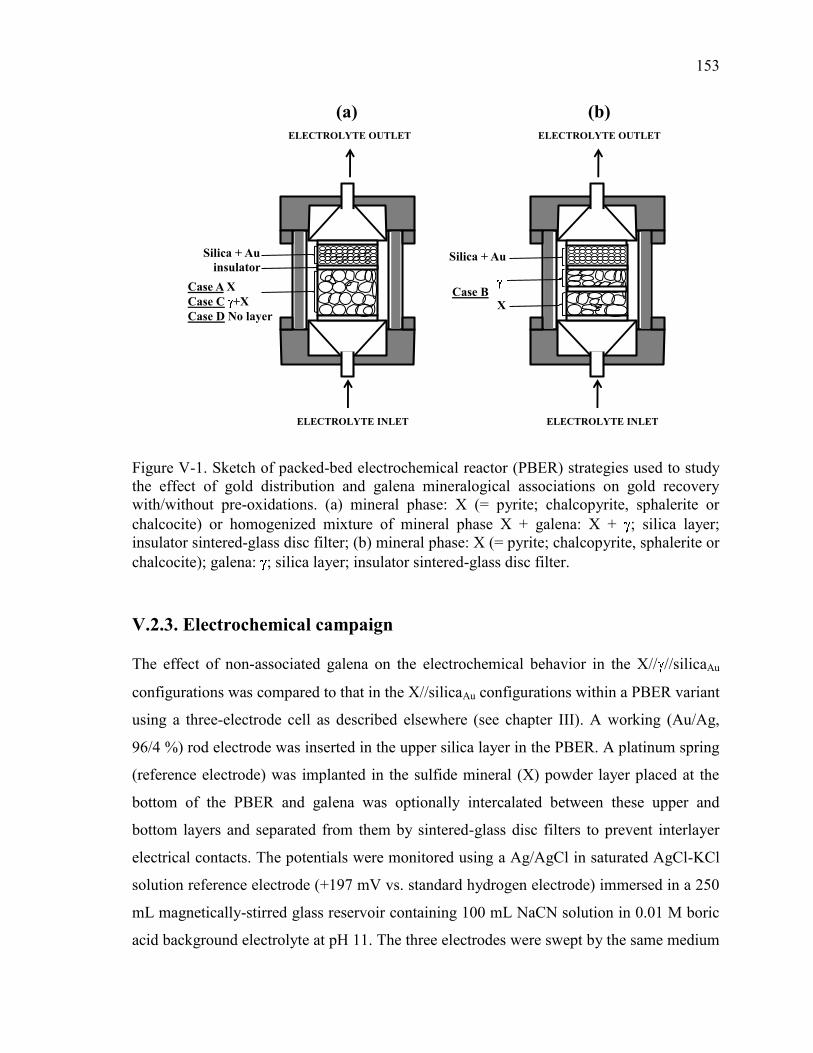
153
(b)(a)
ELECTROLYTE OUTLET
ELECTROLYTE INLET
Case A X
Case C +X
Case D No layer
insulator
Silica + Au
ELECTROLYTE OUTLET
ELECTROLYTE INLET
X
Silica + Au
Case B
Figure V-1. Sketch of packed-bed electrochemical reactor (PBER) strategies used to study
the effect of gold distribution and galena mineralogical associations on gold recovery
with/without pre-oxidations. (a) mineral phase: X (= pyrite; chalcopyrite, sphalerite or
chalcocite) or homogenized mixture of mineral phase X + galena: X + ; silica layer;
insulator sintered-glass disc filter; (b) mineral phase: X (= pyrite; chalcopyrite, sphalerite or
chalcocite); galena: ; silica layer; insulator sintered-glass disc filter.
V.2.3. Electrochemical campaign
The effect of non-associated galena on the electrochemical behavior in the X// //silicaAu
configurations was compared to that in the X//silicaAu configurations within a PBER variant
using a three-electrode cell as described elsewhere (see chapter III). A working (Au/Ag,
96/4 %) rod electrode was inserted in the upper silica layer in the PBER. A platinum spring
(reference electrode) was implanted in the sulfide mineral (X) powder layer placed at the
bottom of the PBER and galena was optionally intercalated between these upper and
bottom layers and separated from them by sintered-glass disc filters to prevent interlayer
electrical contacts. The potentials were monitored using a Ag/AgCl in saturated AgCl-KCl
solution reference electrode (+197 mV vs. standard hydrogen electrode) immersed in a 250
mL magnetically-stirred glass reservoir containing 100 mL NaCN solution in 0.01 M boric
acid background electrolyte at pH 11. The three electrodes were swept by the same medium
154
by recirculating in a closed loop and upflow manner the cyanide solution through the
packed-bed reactor, while the zero resistance ammeter (ZRA) technique was used to
monitor and register the galvanic data (see chapter III). The electrodes were systematically
polished before each experiment, as described elsewhere (chapter III). Before starting the
experiments, the Au/Ag and mineral electrodes were maintained in the aerated cyanide
solution for about 30 min to allow the open circuit potential (OCP) to stabilize. This value
was registered and later used when comparing the sulfide OCP values.
V.2.4. Alkaline pre-oxidation of sulfide ores in PBER
Since pyrite frequently occurs in sulfurous ore deposits associated with other sulfide
minerals, e.g., chalcopyrite or sphalerite, pre-oxidation tests were conducted for the single-
and mixed-mineral systems. Gold powder (50 mg) was interspersed within the upper silica
layer. This was electrically insulated from a lower PBER layer consisting of 1) 4 g mono-
sulfide , and powders, or 2) homogenized binary 4 g + 2 g or 4 g +
2 g mixtures. Oxidative pre-treatments were conducted at room temperature by
sparging pure oxygen through a 0.4 L magnetically-sintered glass reactor containing 100
mL of boric acid solution at pH 11.5. The oxygenated solution was continuously re-
circulated in a closed loop through the PBER with a peristaltic pump for 14 h. After pre-
oxidation, NaCN was added to the solution and gold leaching experiments were carried out
as previously.
In all experiments, the concentration of dissolved metals was measured using a Perkin
Elmer AA-800 atomic absorption spectrometer (AAS), while a capillary electrophoresis
instrument (CE, Agilent Technologies) was used to analyze the dissolved sulfur and
cyanicides (Petre et al., 2008). Residual cyanide was quantified using a silver nitrate
titration method with rhodamine as color-change indicator.
155
V.3. Results and Discussion
V.3.1. Effect of Galena on the Leaching of Free Gold in the Presence of
Pyrite
Figs. V.2a and V.2a` show the evolution of gold leaching as a function of time-on-stream
and of the actual (physical) time, respectively. The time on stream is expressed as multiples
of the PBER space time of the aerated cyanide solution for each circulation within the
overall loop, whereas the physical time represents the actual duration of the experiment (see
appendix C for more details).
Fig. V.2a emphasizes the impact of pyrite-galena interactions during the leaching of free
gold (interspersed in the inert silica layer) in the pyrite-containing PBER. Whether the -
galvanic interactions were enabled (C) or disabled (B), the presence of galena dramatically
counteracted the pyrite passivation effect resulting in net accelerations of gold leaching as
revealed in the bilayer //silicaAu (A) configuration. 58% of gold was dissolved in 10 min
when - galvanic interactions were enabled (C). It was followed by 46% Au recovery
when - galvanic interactions were disabled (B), then 18% in the benchmark test (D) and
2% in the absence of galena (A). Passivation, as shown by Azizi et al. (2011), is ascribed to
the dissolved species, liberated from the pyrite layer, which migrated downstream in the
bed to obstruct the surface of free gold particles mixed in the silica layer. Cyanide
consumption was comparable either in the presence (B and C) or absence (A) of galena.
Therefore, it can be stated that the presence of galena, as a source of lead, enhanced gold
dissolution by preventing passive films to form on the surface of gold grains. This is
supported by Deschenes et al. (2000) and Guo et al. (2005) XPS analysis of gold
conditioned in pyrite-containing slurries where S and Fe surface concentrations were
significantly reduced using pre-treatments with 100 ppm of lead nitrate.
Pyrite OCP (-180 mV vs. Ag/AgCl) in aerated cyanide solution is lower than galena’s (-110
mV vs. Ag/AgCl), suggesting a positive role of - galvanic interactions in promoting
further gold leaching, i.e., (C) > (B). With pyrite behaving anodically and galena acting as a
cathode, galvanic protection of the former by the latter helps mitigating the passivation
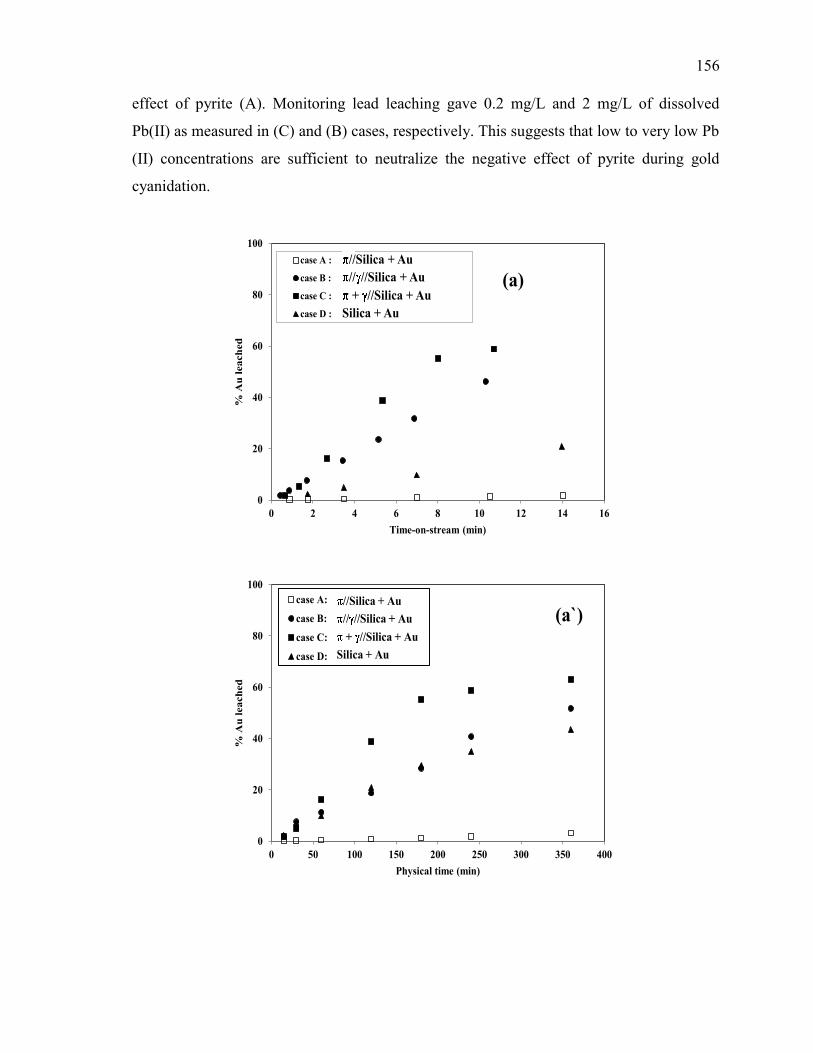
156
effect of pyrite (A). Monitoring lead leaching gave 0.2 mg/L and 2 mg/L of dissolved
Pb(II) as measured in (C) and (B) cases, respectively. This suggests that low to very low Pb
(II) concentrations are sufficient to neutralize the negative effect of pyrite during gold
cyanidation.
0
20
40
60
80
100
0 2 4 6 8 10 12 14 16
% A
u l
ea
ch
ed
Time-on-stream (min)
case A : MRI-2//Silica+Au+Ag
case B : MRI-2//MRI-6//Silica+Au+Ag
case C : MRI-2+MRI-6//Silica+Au+Ag
case D : Silica+Au+Ag
//Silica + Au
// //Silica + Au
+ //Silica + Au
Silica + Au
(a)
0
20
40
60
80
100
0 50 100 150 200 250 300 350 400
% A
u l
ea
ch
ed
Physical time (min)
case A:
case B:
case C:
case D:
//Silica + Au
// //Silica + Au
+ //Silica + Au
Silica + Au
(a`)
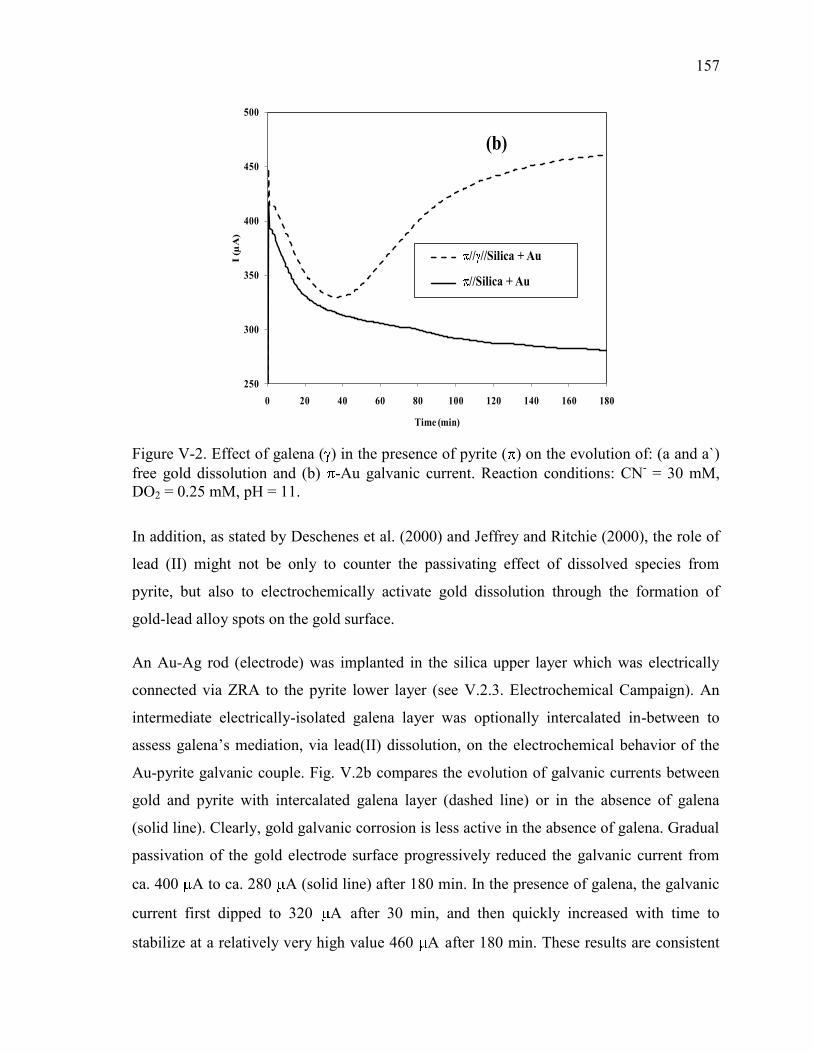
157
250
300
350
400
450
500
0 20 40 60 80 100 120 140 160 180
I (µ
A)
Time (min)
MRI-2//MRI-6//Silica-Au
MRI-2//Silica-Au//Silica + Au
// //Silica + Au
(b)
Figure V-2. Effect of galena ( ) in the presence of pyrite ( ) on the evolution of: (a and a`)
free gold dissolution and (b) -Au galvanic current. Reaction conditions: CN- = 30 mM,
DO2 = 0.25 mM, pH = 11.
In addition, as stated by Deschenes et al. (2000) and Jeffrey and Ritchie (2000), the role of
lead (II) might not be only to counter the passivating effect of dissolved species from
pyrite, but also to electrochemically activate gold dissolution through the formation of
gold-lead alloy spots on the gold surface.
An Au-Ag rod (electrode) was implanted in the silica upper layer which was electrically
connected via ZRA to the pyrite lower layer (see V.2.3. Electrochemical Campaign). An
intermediate electrically-isolated galena layer was optionally intercalated in-between to
assess galena’s mediation, via lead(II) dissolution, on the electrochemical behavior of the
Au-pyrite galvanic couple. Fig. V.2b compares the evolution of galvanic currents between
gold and pyrite with intercalated galena layer (dashed line) or in the absence of galena
(solid line). Clearly, gold galvanic corrosion is less active in the absence of galena. Gradual
passivation of the gold electrode surface progressively reduced the galvanic current from
ca. 400 A to ca. 280 A (solid line) after 180 min. In the presence of galena, the galvanic
current first dipped to 320 A after 30 min, and then quickly increased with time to
stabilize at a relatively very high value 460 A after 180 min. These results are consistent
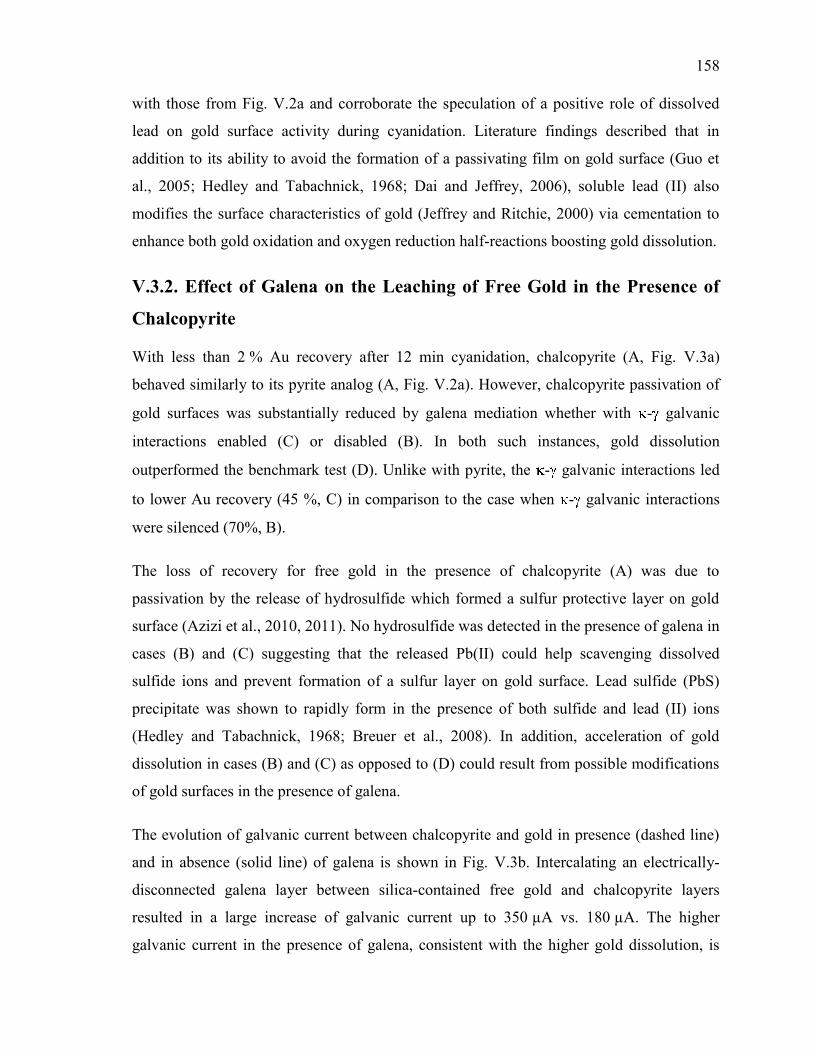
158
with those from Fig. V.2a and corroborate the speculation of a positive role of dissolved
lead on gold surface activity during cyanidation. Literature findings described that in
addition to its ability to avoid the formation of a passivating film on gold surface (Guo et
al., 2005; Hedley and Tabachnick, 1968; Dai and Jeffrey, 2006), soluble lead (II) also
modifies the surface characteristics of gold (Jeffrey and Ritchie, 2000) via cementation to
enhance both gold oxidation and oxygen reduction half-reactions boosting gold dissolution.
V.3.2. Effect of Galena on the Leaching of Free Gold in the Presence of
Chalcopyrite
With less than 2 % Au recovery after 12 min cyanidation, chalcopyrite (A, Fig. V.3a)
behaved similarly to its pyrite analog (A, Fig. V.2a). However, chalcopyrite passivation of
gold surfaces was substantially reduced by galena mediation whether with - galvanic
interactions enabled (C) or disabled (B). In both such instances, gold dissolution
outperformed the benchmark test (D). Unlike with pyrite, the - galvanic interactions led
to lower Au recovery (45 %, C) in comparison to the case when - galvanic interactions
were silenced (70%, B).
The loss of recovery for free gold in the presence of chalcopyrite (A) was due to
passivation by the release of hydrosulfide which formed a sulfur protective layer on gold
surface (Azizi et al., 2010, 2011). No hydrosulfide was detected in the presence of galena in
cases (B) and (C) suggesting that the released Pb(II) could help scavenging dissolved
sulfide ions and prevent formation of a sulfur layer on gold surface. Lead sulfide (PbS)
precipitate was shown to rapidly form in the presence of both sulfide and lead (II) ions
(Hedley and Tabachnick, 1968; Breuer et al., 2008). In addition, acceleration of gold
dissolution in cases (B) and (C) as opposed to (D) could result from possible modifications
of gold surfaces in the presence of galena.
The evolution of galvanic current between chalcopyrite and gold in presence (dashed line)
and in absence (solid line) of galena is shown in Fig. V.3b. Intercalating an electrically-
disconnected galena layer between silica-contained free gold and chalcopyrite layers
resulted in a large increase of galvanic current up to 350 µA vs. 180 µA. The higher
galvanic current in the presence of galena, consistent with the higher gold dissolution, is
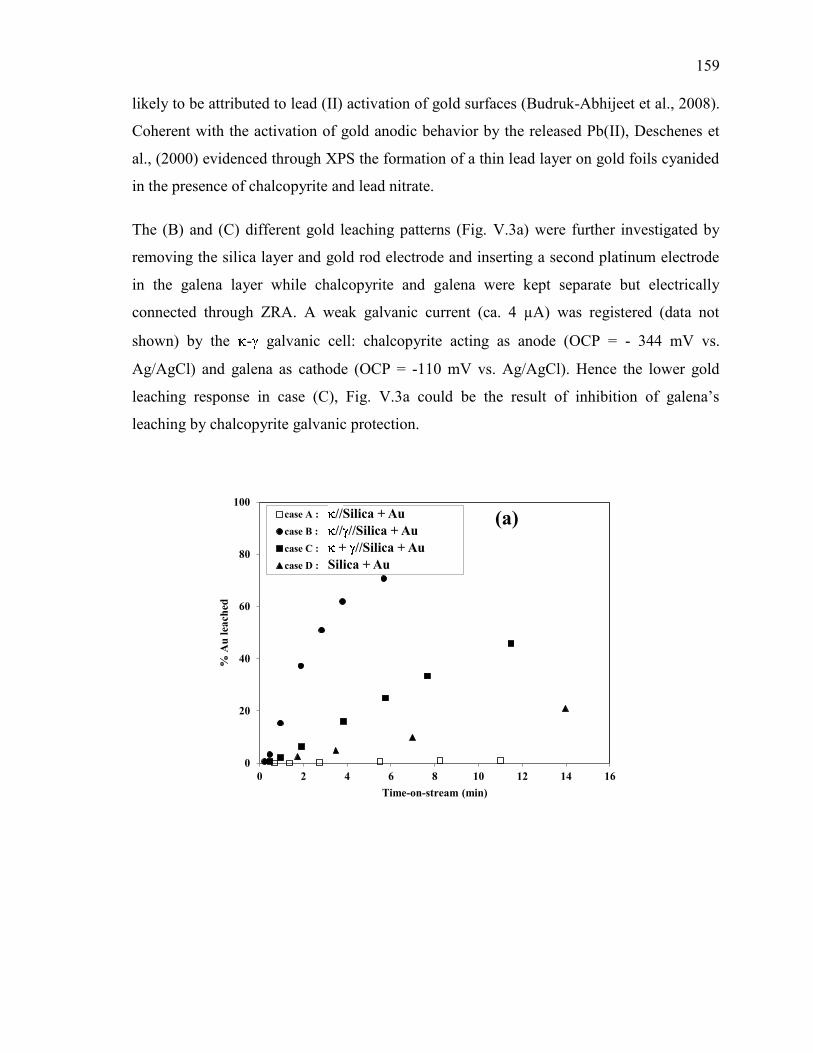
159
likely to be attributed to lead (II) activation of gold surfaces (Budruk-Abhijeet et al., 2008).
Coherent with the activation of gold anodic behavior by the released Pb(II), Deschenes et
al., (2000) evidenced through XPS the formation of a thin lead layer on gold foils cyanided
in the presence of chalcopyrite and lead nitrate.
The (B) and (C) different gold leaching patterns (Fig. V.3a) were further investigated by
removing the silica layer and gold rod electrode and inserting a second platinum electrode
in the galena layer while chalcopyrite and galena were kept separate but electrically
connected through ZRA. A weak galvanic current (ca. 4 µA) was registered (data not
shown) by the - galvanic cell: chalcopyrite acting as anode (OCP = - 344 mV vs.
Ag/AgCl) and galena as cathode (OCP = -110 mV vs. Ag/AgCl). Hence the lower gold
leaching response in case (C), Fig. V.3a could be the result of inhibition of galena’s
leaching by chalcopyrite galvanic protection.
0
20
40
60
80
100
0 2 4 6 8 10 12 14 16
% A
u l
ea
ch
ed
Time-on-stream (min)
case A : MRI-3//Silica+Au+Ag
case B : MRI-3//MRI-6//Silica+Au+Ag
case C : MRI-3+MRI-6//Silica+Au+Ag
case D : Silica+Au+Ag
//Silica + Au
// //Silica + Au
+ //Silica + Au
Silica + Au
(a)
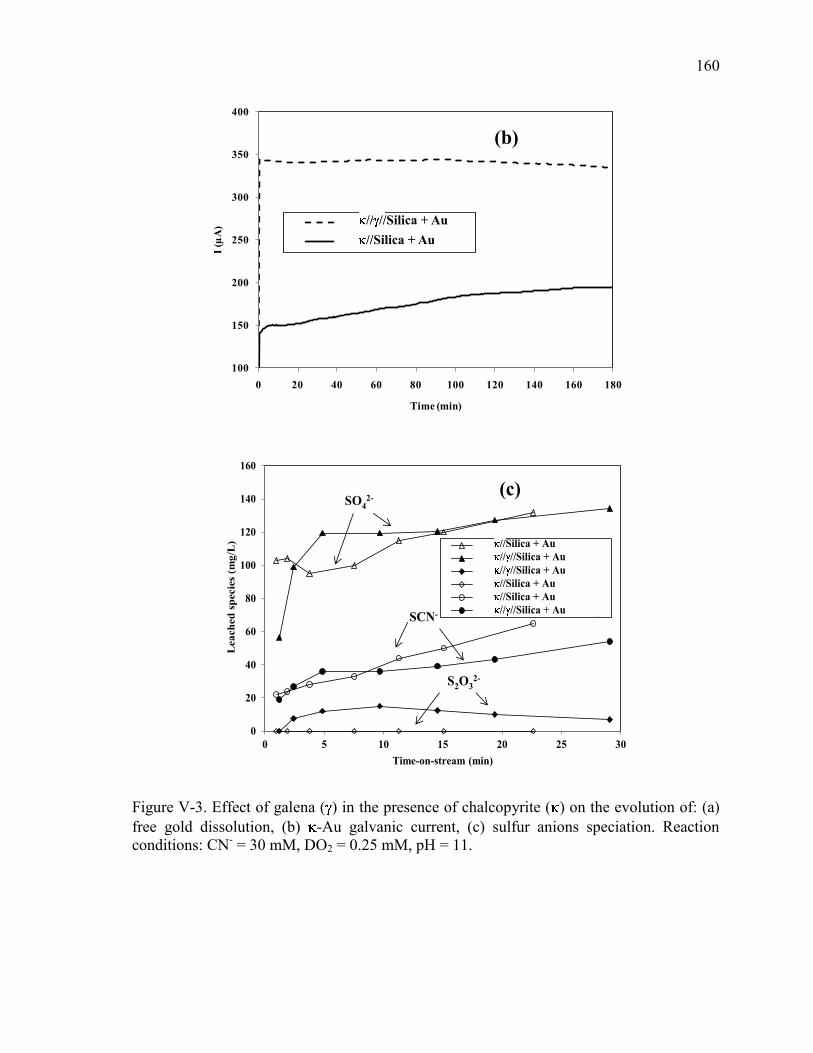
160
100
150
200
250
300
350
400
0 20 40 60 80 100 120 140 160 180
I (µ
A)
Time (min)
MRI-3//MRI-6//silica-Au
MRI-3//Silica-Au//Silica + Au
// //Silica + Au
(b)
0
20
40
60
80
100
120
140
160
0 5 10 15 20 25 30
Lea
ch
ed
sp
ecie
s (m
g/L
)
Time-on-stream (min)
MRI-3//Silica+Au+Ag
MRI-3//MRI-6//Silica+Au+Ag
MRI-3//MRI-6//Silica+Au+Ag
MRI-3//Silica+Au+Ag
MRI-3//Silica+Au+Ag
MRI-3//MRI-6//Silica+Au+Ag
SO42-
SCN-
S2O32-
//Silica + Au
// //Silica + Au
// //Silica + Au
//Silica + Au
//Silica + Au
// //Silica + Au
(c)
Figure V-3. Effect of galena ( ) in the presence of chalcopyrite ( ) on the evolution of: (a)
free gold dissolution, (b) -Au galvanic current, (c) sulfur anions speciation. Reaction
conditions: CN- = 30 mM, DO2 = 0.25 mM, pH = 11.
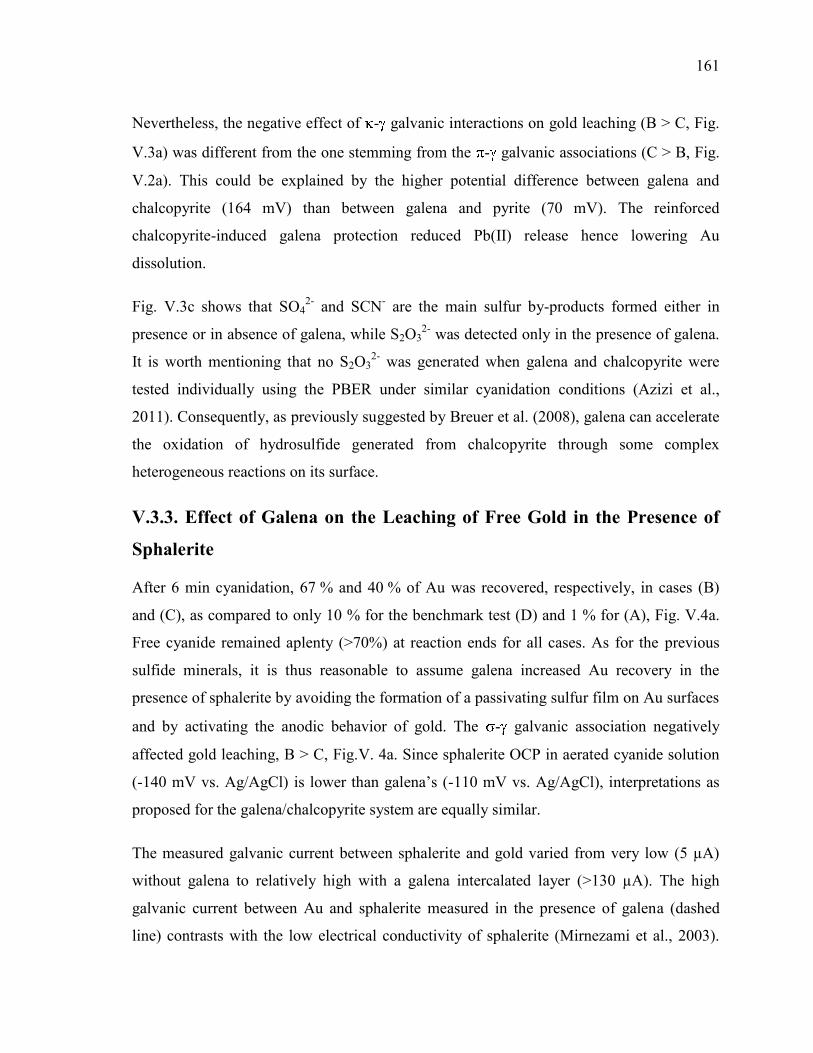
161
Nevertheless, the negative effect of - galvanic interactions on gold leaching (B > C, Fig.
V.3a) was different from the one stemming from the - galvanic associations (C > B, Fig.
V.2a). This could be explained by the higher potential difference between galena and
chalcopyrite (164 mV) than between galena and pyrite (70 mV). The reinforced
chalcopyrite-induced galena protection reduced Pb(II) release hence lowering Au
dissolution.
Fig. V.3c shows that SO42-
and SCN- are the main sulfur by-products formed either in
presence or in absence of galena, while S2O32-
was detected only in the presence of galena.
It is worth mentioning that no S2O32-
was generated when galena and chalcopyrite were
tested individually using the PBER under similar cyanidation conditions (Azizi et al.,
2011). Consequently, as previously suggested by Breuer et al. (2008), galena can accelerate
the oxidation of hydrosulfide generated from chalcopyrite through some complex
heterogeneous reactions on its surface.
V.3.3. Effect of Galena on the Leaching of Free Gold in the Presence of
Sphalerite
After 6 min cyanidation, 67 % and 40 % of Au was recovered, respectively, in cases (B)
and (C), as compared to only 10 % for the benchmark test (D) and 1 % for (A), Fig. V.4a.
Free cyanide remained aplenty (>70%) at reaction ends for all cases. As for the previous
sulfide minerals, it is thus reasonable to assume galena increased Au recovery in the
presence of sphalerite by avoiding the formation of a passivating sulfur film on Au surfaces
and by activating the anodic behavior of gold. The - galvanic association negatively
affected gold leaching, B > C, Fig.V. 4a. Since sphalerite OCP in aerated cyanide solution
(-140 mV vs. Ag/AgCl) is lower than galena’s (-110 mV vs. Ag/AgCl), interpretations as
proposed for the galena/chalcopyrite system are equally similar.
The measured galvanic current between sphalerite and gold varied from very low (5 µA)
without galena to relatively high with a galena intercalated layer (>130 µA). The high
galvanic current between Au and sphalerite measured in the presence of galena (dashed
line) contrasts with the low electrical conductivity of sphalerite (Mirnezami et al., 2003).
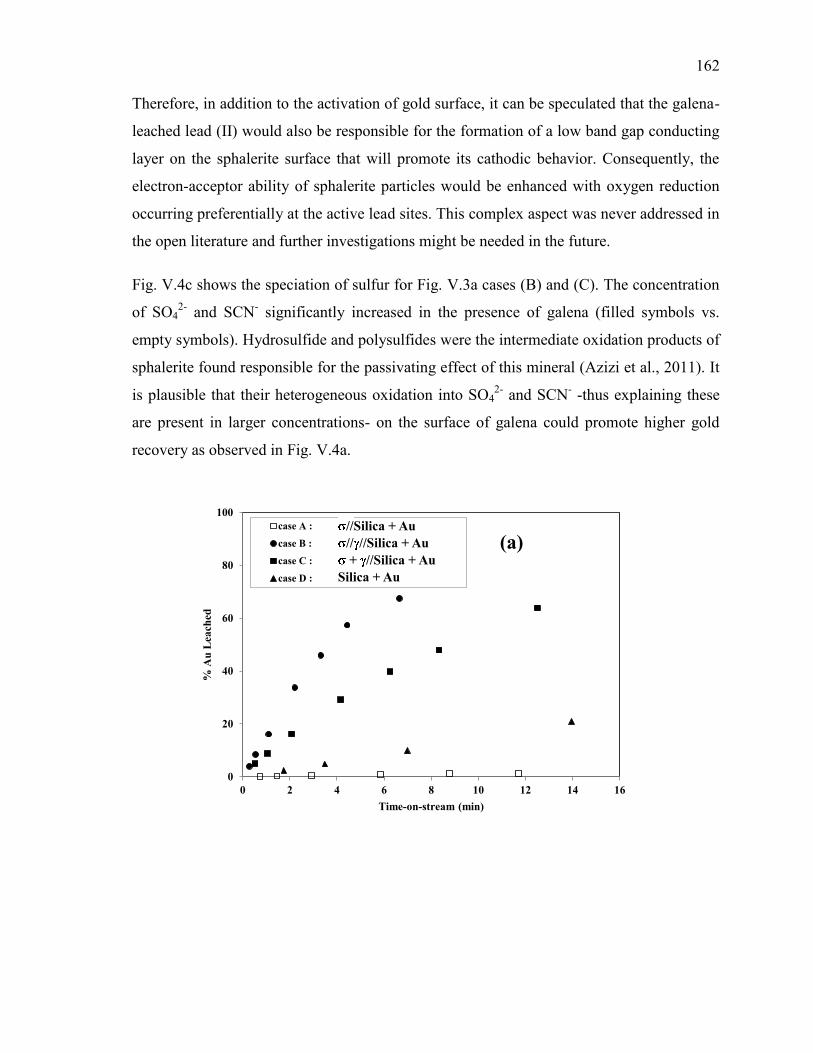
162
Therefore, in addition to the activation of gold surface, it can be speculated that the galena-
leached lead (II) would also be responsible for the formation of a low band gap conducting
layer on the sphalerite surface that will promote its cathodic behavior. Consequently, the
electron-acceptor ability of sphalerite particles would be enhanced with oxygen reduction
occurring preferentially at the active lead sites. This complex aspect was never addressed in
the open literature and further investigations might be needed in the future.
Fig. V.4c shows the speciation of sulfur for Fig. V.3a cases (B) and (C). The concentration
of SO42-
and SCN- significantly increased in the presence of galena (filled symbols vs.
empty symbols). Hydrosulfide and polysulfides were the intermediate oxidation products of
sphalerite found responsible for the passivating effect of this mineral (Azizi et al., 2011). It
is plausible that their heterogeneous oxidation into SO42-
and SCN- -thus explaining these
are present in larger concentrations- on the surface of galena could promote higher gold
recovery as observed in Fig. V.4a.
0
20
40
60
80
100
0 2 4 6 8 10 12 14 16
% A
u L
ea
ch
ed
Time-on-stream (min)
case A : MRI-4//Silica+Au+Ag
case B : MRI-4//MRI-6//Silica+Au+Ag
case C : MRI-4+MRI-6//Silica+Au+Ag
case D : Silica+Au+Ag
//Silica + Au
// //Silica + Au
+ //Silica + Au
Silica + Au
(a)
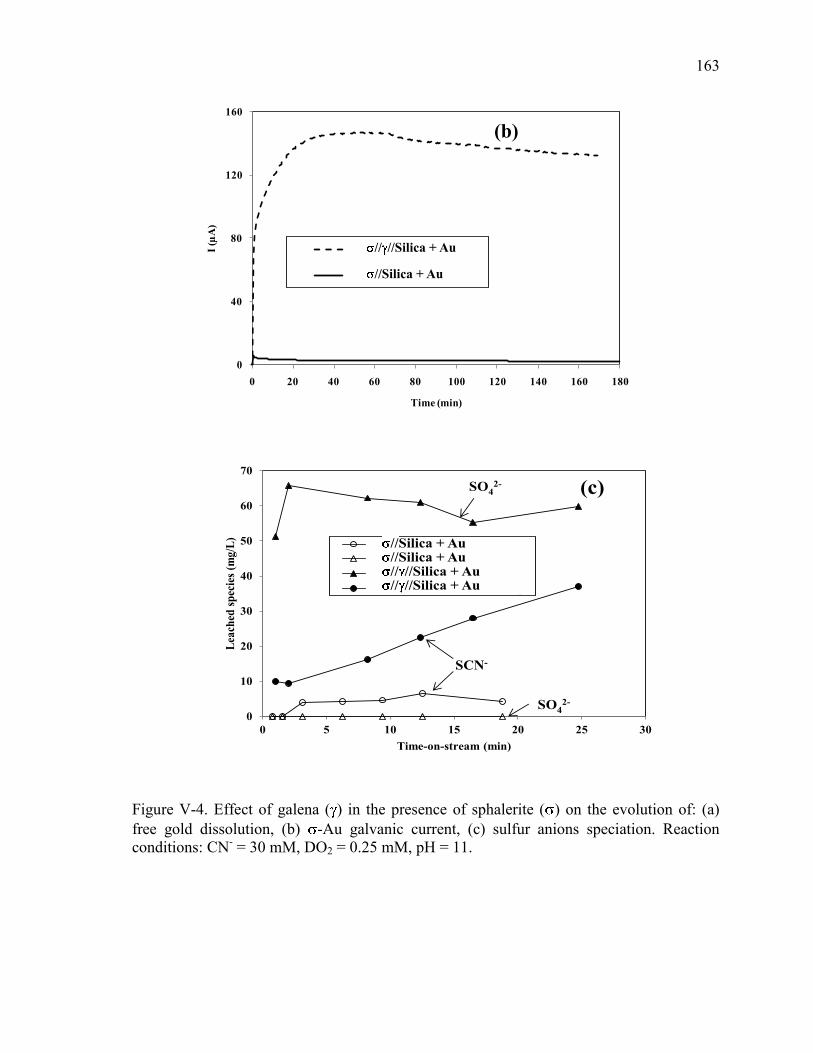
163
0
40
80
120
160
0 20 40 60 80 100 120 140 160 180
I (µ
A)
Time (min)
MRI-4//MRI-6//silica-Au
MRI-4//silica-Au//Silica + Au
// //Silica + Au
(b)
0
10
20
30
40
50
60
70
0 5 10 15 20 25 30
Lea
ched
sp
ecie
s (m
g/L
)
Time-on-stream (min)
MRI-4//Silica+Au+Ag
MRI-4//Silica+Au+Ag
MRI-4//MRI-6//Silica+Au+Ag
MRI-4//MRI-6//Silica+Au+Ag
SO42-
SCN-
SO42-
//Silica + Au//Silica + Au// //Silica + Au// //Silica + Au
(c)
Figure V-4. Effect of galena ( ) in the presence of sphalerite ( ) on the evolution of: (a)
free gold dissolution, (b) -Au galvanic current, (c) sulfur anions speciation. Reaction
conditions: CN- = 30 mM, DO2 = 0.25 mM, pH = 11.
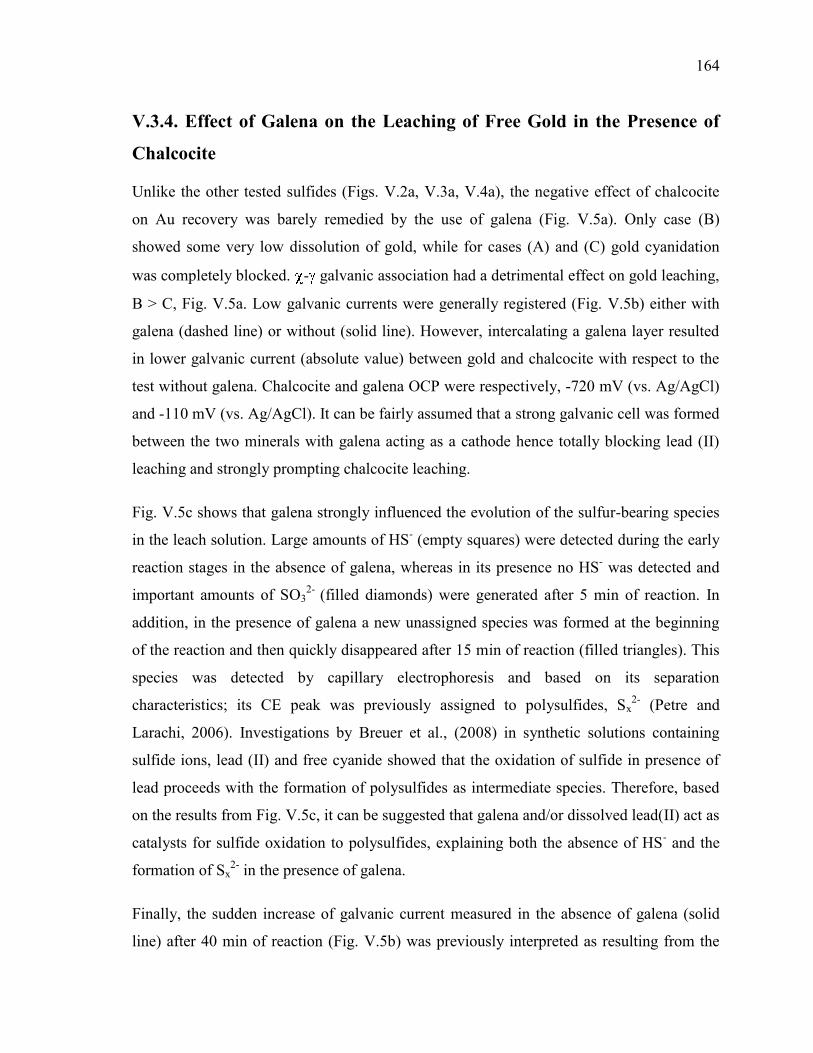
164
V.3.4. Effect of Galena on the Leaching of Free Gold in the Presence of
Chalcocite
Unlike the other tested sulfides (Figs. V.2a, V.3a, V.4a), the negative effect of chalcocite
on Au recovery was barely remedied by the use of galena (Fig. V.5a). Only case (B)
showed some very low dissolution of gold, while for cases (A) and (C) gold cyanidation
was completely blocked. - galvanic association had a detrimental effect on gold leaching,
B > C, Fig. V.5a. Low galvanic currents were generally registered (Fig. V.5b) either with
galena (dashed line) or without (solid line). However, intercalating a galena layer resulted
in lower galvanic current (absolute value) between gold and chalcocite with respect to the
test without galena. Chalcocite and galena OCP were respectively, -720 mV (vs. Ag/AgCl)
and -110 mV (vs. Ag/AgCl). It can be fairly assumed that a strong galvanic cell was formed
between the two minerals with galena acting as a cathode hence totally blocking lead (II)
leaching and strongly prompting chalcocite leaching.
Fig. V.5c shows that galena strongly influenced the evolution of the sulfur-bearing species
in the leach solution. Large amounts of HS- (empty squares) were detected during the early
reaction stages in the absence of galena, whereas in its presence no HS- was detected and
important amounts of SO32-
(filled diamonds) were generated after 5 min of reaction. In
addition, in the presence of galena a new unassigned species was formed at the beginning
of the reaction and then quickly disappeared after 15 min of reaction (filled triangles). This
species was detected by capillary electrophoresis and based on its separation
characteristics; its CE peak was previously assigned to polysulfides, Sx2-
(Petre and
Larachi, 2006). Investigations by Breuer et al., (2008) in synthetic solutions containing
sulfide ions, lead (II) and free cyanide showed that the oxidation of sulfide in presence of
lead proceeds with the formation of polysulfides as intermediate species. Therefore, based
on the results from Fig. V.5c, it can be suggested that galena and/or dissolved lead(II) act as
catalysts for sulfide oxidation to polysulfides, explaining both the absence of HS- and the
formation of Sx2-
in the presence of galena.
Finally, the sudden increase of galvanic current measured in the absence of galena (solid
line) after 40 min of reaction (Fig. V.5b) was previously interpreted as resulting from the
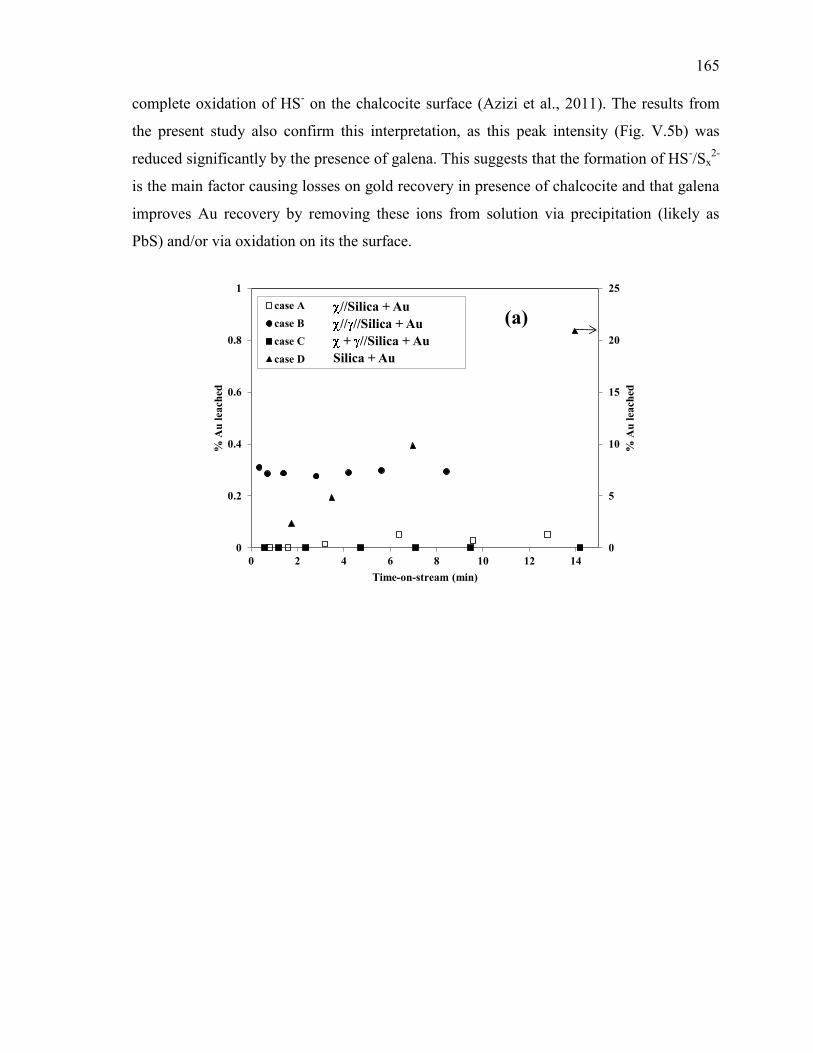
165
complete oxidation of HS- on the chalcocite surface (Azizi et al., 2011). The results from
the present study also confirm this interpretation, as this peak intensity (Fig. V.5b) was
reduced significantly by the presence of galena. This suggests that the formation of HS-/Sx
2-
is the main factor causing losses on gold recovery in presence of chalcocite and that galena
improves Au recovery by removing these ions from solution via precipitation (likely as
PbS) and/or via oxidation on its the surface.
0
5
10
15
20
25
0
0.2
0.4
0.6
0.8
1
0 2 4 6 8 10 12 14
% A
u l
ea
ched
% A
u l
ea
ched
Time-on-stream (min)
case A : MRI-5//Silica+Au+Ag
case B : MRI-5//MRI-6//Silica+Au+Ag
case C : MRI-5+MRI-6//Silica+Au+Ag
case D : Silica+Au+Ag
//Silica + Au
// //Silica + Au
+ //Silica + Au
Silica + Au
(a)
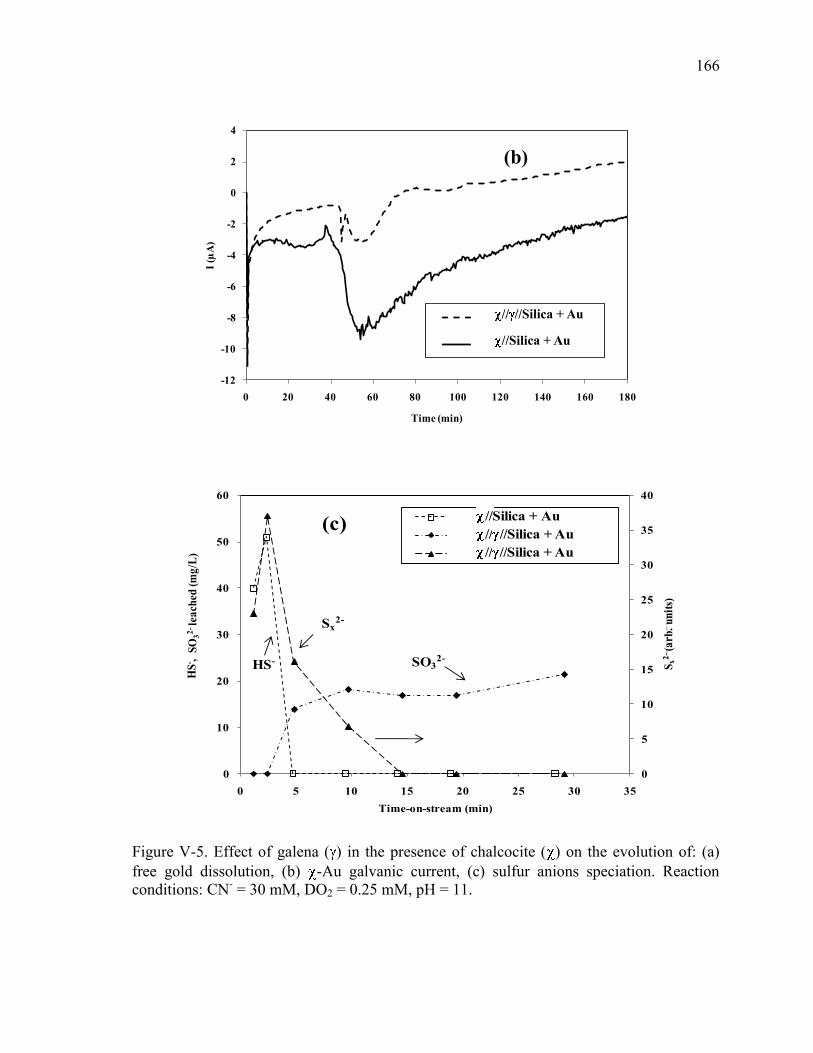
166
-12
-10
-8
-6
-4
-2
0
2
4
0 20 40 60 80 100 120 140 160 180
I (µ
A)
Time (min)
MRI-5//MRI-6//silica-Au
MRI-5//silica-Au//Silica + Au
// //Silica + Au
(b)
0
5
10
15
20
25
30
35
40
0
10
20
30
40
50
60
0 5 10 15 20 25 30 35
Pea
k a
rea
SO
32
-le
ach
ed (
mg
/L)
Time-on-stream (min)
MRI-5//Silica+Au+Ag
MRI-5//MRI-6//Silica+Au+Ag
MRI-5//MRI-6//Silica+Au+Ag
HS-
Sx2-
SO32-
//Silica + Au
// //Silica + Au
// //Silica + Au
(c)
HS
- ,
Sx
2-(a
rb.
un
its)
Figure V-5. Effect of galena ( ) in the presence of chalcocite ( ) on the evolution of: (a)
free gold dissolution, (b) -Au galvanic current, (c) sulfur anions speciation. Reaction
conditions: CN- = 30 mM, DO2 = 0.25 mM, pH = 11.
167
V.3.5. Effect of Alkaline pre-Oxidation of Pyrite, Chalcopyrite and
Sphalerite on Gold Leaching
As shown in Figs. V.6-8, the following pre-oxidation strategies were also tested with the
mono-sulfide X//silica PBER bilayer systems: XAu//silica; X//silicaAu; X(preOx)Au//silica;
(XAu//silica)(preOx); (X//silicaAu)(preOx). The syntax is self-explaining regarding the
location of gold powder and the Au-X galvanic interactions. The first two systems
exemplify, respectively, the sulfide-associated and free gold bilayer PBER without pre-
oxidation. In the third, the sulfide was pre-oxidized individually according to the above
described pre-oxidation (section V.2.4) and then subsequently homogenized with gold
powder (to enable galvanic interactions) before cyanidation. The fourth system corresponds
to an idle silica layer juxtaposed to pre-mixed sulfide-gold where galvanic interactions were
pre-existent to pre-oxidation. The last corresponds to a system with juxtaposed sulfide layer
and gold-silica homogenized mixture. This system featuring free gold leaching underwent
in-situ pre-oxidation before cyanidation in the absence of Au-X galvanic interactions.
The bilayer //silica system was the one that gave the best gold leaching response to pre-
oxidation (Figs. V.6-8). Fig. V.6 indicates that in absence of Au-pyrite galvanic
interactions, pre-oxidation of pyrite improved gold leaching (empty vs. filled triangles, Fig.
V.6). Conversely, galvanic interactions preexisting to pre-oxidation degraded gold
dissolution with respect to Au-pyrite galvanic interactions without pre-oxidation (empty vs.
filled squares, Fig. V.6). Blocking the pyrite surface by deposition of iron hydroxide
(FeOOH) during pre-oxidation (Zhu et al., 1993 and references therein) could explain the
negative effect of pre-oxidation on gold leaching for the Au- system (empty vs. filled
squares, Fig. V.6). Such Fe (III) hydroxide protective layers forming on the mineral
surfaces would impair the positive Au-pyrite galvanic interactions which are known to play
an important role in accelerating gold leaching kinetics (Azizi et al., 2011). To confirm this
contention, pyrite was pre-oxidized individually according to section V.2.4 pre-oxidation
procedure. After pre-treatment, pre-oxidized pyrite was removed from the PBER,
desiccated at 60oC overnight and used in a subsequent cyanidation experiment. The results
in Fig. V.6 (empty circles vs. filled squares) are consistent with FeOOH layer responsible
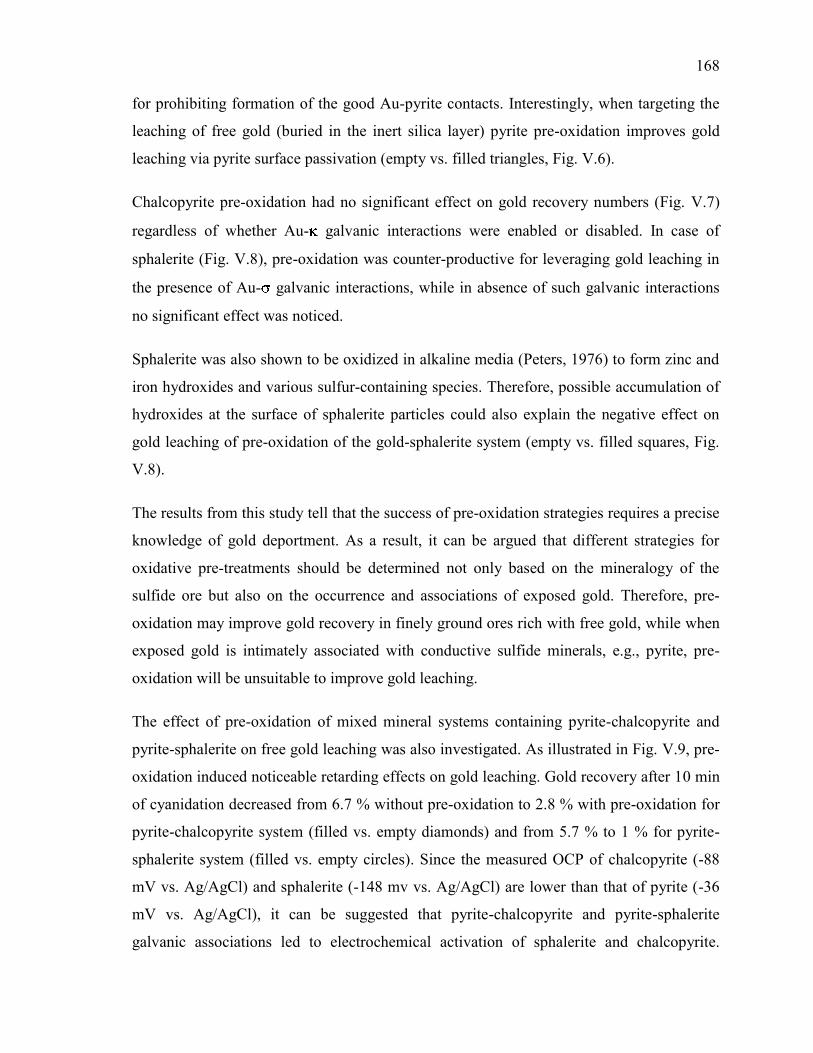
168
for prohibiting formation of the good Au-pyrite contacts. Interestingly, when targeting the
leaching of free gold (buried in the inert silica layer) pyrite pre-oxidation improves gold
leaching via pyrite surface passivation (empty vs. filled triangles, Fig. V.6).
Chalcopyrite pre-oxidation had no significant effect on gold recovery numbers (Fig. V.7)
regardless of whether Au- galvanic interactions were enabled or disabled. In case of
sphalerite (Fig. V.8), pre-oxidation was counter-productive for leveraging gold leaching in
the presence of Au- galvanic interactions, while in absence of such galvanic interactions
no significant effect was noticed.
Sphalerite was also shown to be oxidized in alkaline media (Peters, 1976) to form zinc and
iron hydroxides and various sulfur-containing species. Therefore, possible accumulation of
hydroxides at the surface of sphalerite particles could also explain the negative effect on
gold leaching of pre-oxidation of the gold-sphalerite system (empty vs. filled squares, Fig.
V.8).
The results from this study tell that the success of pre-oxidation strategies requires a precise
knowledge of gold deportment. As a result, it can be argued that different strategies for
oxidative pre-treatments should be determined not only based on the mineralogy of the
sulfide ore but also on the occurrence and associations of exposed gold. Therefore, pre-
oxidation may improve gold recovery in finely ground ores rich with free gold, while when
exposed gold is intimately associated with conductive sulfide minerals, e.g., pyrite, pre-
oxidation will be unsuitable to improve gold leaching.
The effect of pre-oxidation of mixed mineral systems containing pyrite-chalcopyrite and
pyrite-sphalerite on free gold leaching was also investigated. As illustrated in Fig. V.9, pre-
oxidation induced noticeable retarding effects on gold leaching. Gold recovery after 10 min
of cyanidation decreased from 6.7 % without pre-oxidation to 2.8 % with pre-oxidation for
pyrite-chalcopyrite system (filled vs. empty diamonds) and from 5.7 % to 1 % for pyrite-
sphalerite system (filled vs. empty circles). Since the measured OCP of chalcopyrite (-88
mV vs. Ag/AgCl) and sphalerite (-148 mv vs. Ag/AgCl) are lower than that of pyrite (-36
mV vs. Ag/AgCl), it can be suggested that pyrite-chalcopyrite and pyrite-sphalerite
galvanic associations led to electrochemical activation of sphalerite and chalcopyrite.
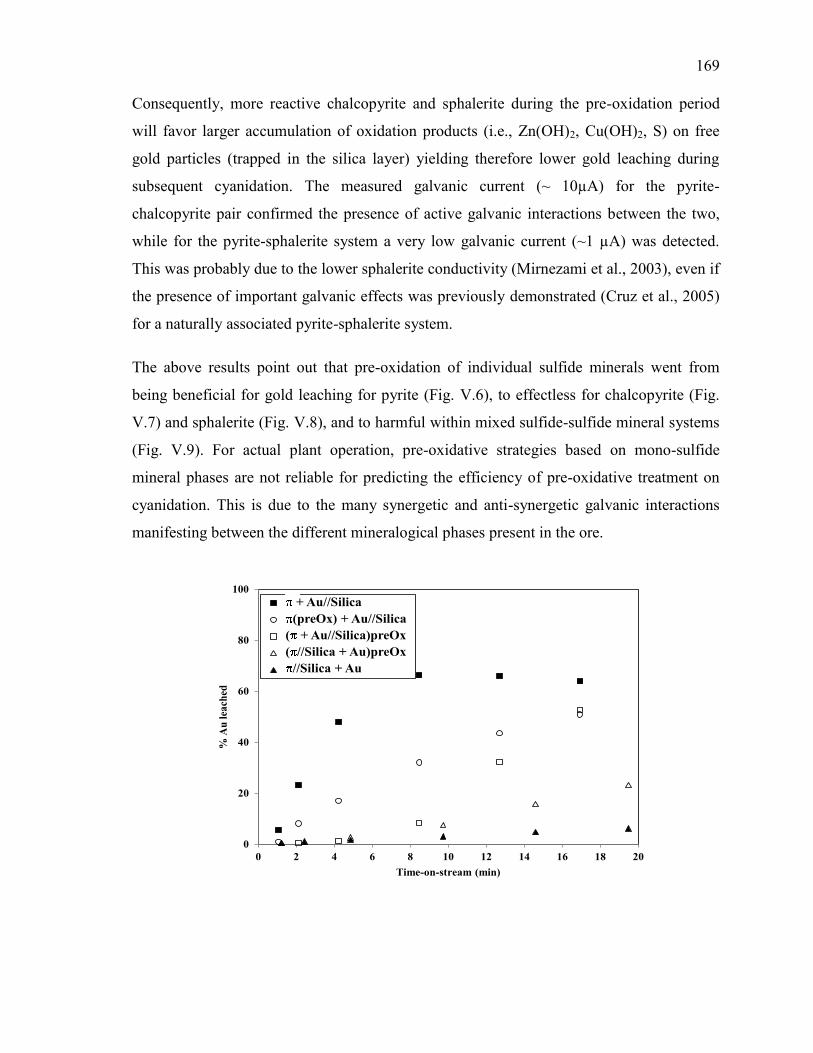
169
Consequently, more reactive chalcopyrite and sphalerite during the pre-oxidation period
will favor larger accumulation of oxidation products (i.e., Zn(OH)2, Cu(OH)2, S) on free
gold particles (trapped in the silica layer) yielding therefore lower gold leaching during
subsequent cyanidation. The measured galvanic current (~ 10µA) for the pyrite-
chalcopyrite pair confirmed the presence of active galvanic interactions between the two,
while for the pyrite-sphalerite system a very low galvanic current (~1 µA) was detected.
This was probably due to the lower sphalerite conductivity (Mirnezami et al., 2003), even if
the presence of important galvanic effects was previously demonstrated (Cruz et al., 2005)
for a naturally associated pyrite-sphalerite system.
The above results point out that pre-oxidation of individual sulfide minerals went from
being beneficial for gold leaching for pyrite (Fig. V.6), to effectless for chalcopyrite (Fig.
V.7) and sphalerite (Fig. V.8), and to harmful within mixed sulfide-sulfide mineral systems
(Fig. V.9). For actual plant operation, pre-oxidative strategies based on mono-sulfide
mineral phases are not reliable for predicting the efficiency of pre-oxidative treatment on
cyanidation. This is due to the many synergetic and anti-synergetic galvanic interactions
manifesting between the different mineralogical phases present in the ore.
0
20
40
60
80
100
0 2 4 6 8 10 12 14 16 18 20
% A
u l
each
ed
Time-on-stream (min)
MRI-2+Au+Ag//silica
(MRI-2;Ox)+Au+Ag//silica
MRI-2+Au+Ag//silica; Ox
MRI-2//silica+Au+Ag; Ox
MRI-2//silica+Au+Ag
+ Au//Silica
(preOx) + Au//Silica
( + Au//Silica)preOx
( //Silica + Au)preOx
//Silica + Au
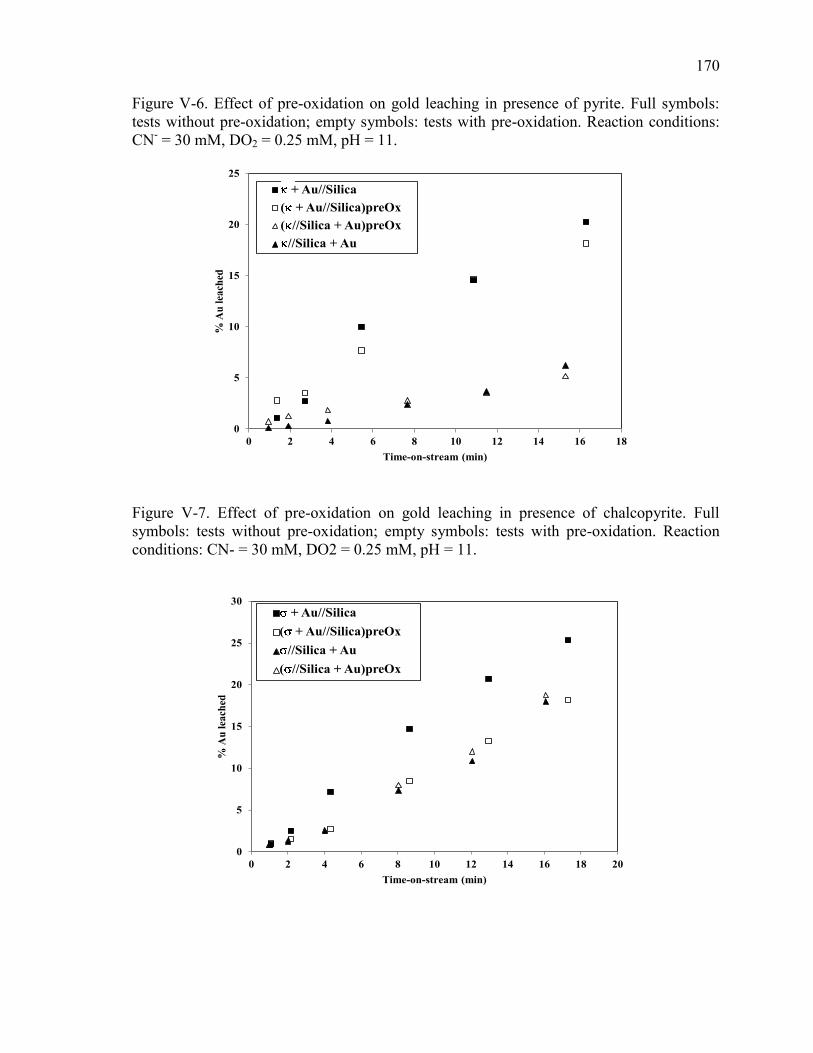
170
Figure V-6. Effect of pre-oxidation on gold leaching in presence of pyrite. Full symbols:
tests without pre-oxidation; empty symbols: tests with pre-oxidation. Reaction conditions:
CN- = 30 mM, DO2 = 0.25 mM, pH = 11.
0
5
10
15
20
25
0 2 4 6 8 10 12 14 16 18
% A
u l
each
ed
Time-on-stream (min)
MRI-3+Au+Ag//silica
MRI-3+Au+Ag//silica; Ox
MRI-3//slica+Au+Ag; Ox
MRI-3//silica+Au+Ag
+ Au//Silica
( + Au//Silica)preOx
( //Silica + Au)preOx
//Silica + Au
Figure V-7. Effect of pre-oxidation on gold leaching in presence of chalcopyrite. Full
symbols: tests without pre-oxidation; empty symbols: tests with pre-oxidation. Reaction
conditions: CN- = 30 mM, DO2 = 0.25 mM, pH = 11.
0
5
10
15
20
25
30
0 2 4 6 8 10 12 14 16 18 20
% A
u l
each
ed
Time-on-stream (min)
MRI-4+Au+Ag//silica
MRI-4+Au+Ag//silica; Ox
MRI-4//silica+Au+Ag
MRI-4//silica+Au+Ag; Ox
+ Au//Silica
( + Au//Silica)preOx
//Silica + Au
( //Silica + Au)preOx
171
Figure V-8. Effect of pre-oxidation on gold leaching in presence of sphalerite. Full
symbols: tests without pre-oxidation; empty symbols: tests with pre-oxidation. Reaction
conditions: CN- = 30 mM, DO2 = 0.25 mM, pH = 11.
0
1
2
3
4
5
6
7
0 2 4 6 8 10 12
% A
u l
each
ed
Time-on-stream (min)
MRI-2+MRI-3//silica+Au+Ag
MRI-2+MRI-4//silica+Au+Ag
MRI-2+MRI-3//silica+Au+Ag; Ox
MRI-2+MRI-4//Silica+Au+Ag; Ox
+ //Silica + Au
+ //Silica + Au
( + //Silica + Au) preOx
( + //Silica + Au)preOx
Figure V-9. Effect of pre-oxidation of mixed mineral systems containing pyrite and
chalcopyrite or pyrite and sphalerite on free gold leaching. Full symbols: tests without pre-
oxidation; empty symbols: tests with pre-oxidation. Reaction conditions: CN- = 30 mM,
DO2 = 0.25 mM, pH = 11.
V.3.6. Combined pre-Oxidation and Lead Nitrate Addition on Gold
Leaching in Presence of Pyrite
Fig. V.10a shows that when pre-oxidation is employed, adding lead nitrate during the
cyanidation step completely canceled the positive effects of pre-oxidation for gold
dissolution (filled triangles vs. filled squares). In addition, when lead nitrate is added during
cyanidation, using or not pre-oxidation had similar effects on gold recovery (Fig. V.10a,
filled squares vs. crosses). On the contrary, when lead nitrate was added during pre-
oxidation, a noticeable increase of gold leaching was observed when compared to the test
when pre-oxidation proceeded with no lead nitrate addition (filled circles vs. filled
triangles). The results also shows that choosing the optimum lead addition strategy is very
important, as after 19 min of cyanidation 4 times more Au was recovered when lead nitrate
was added during pre-oxidation as compared to the test when it was added during
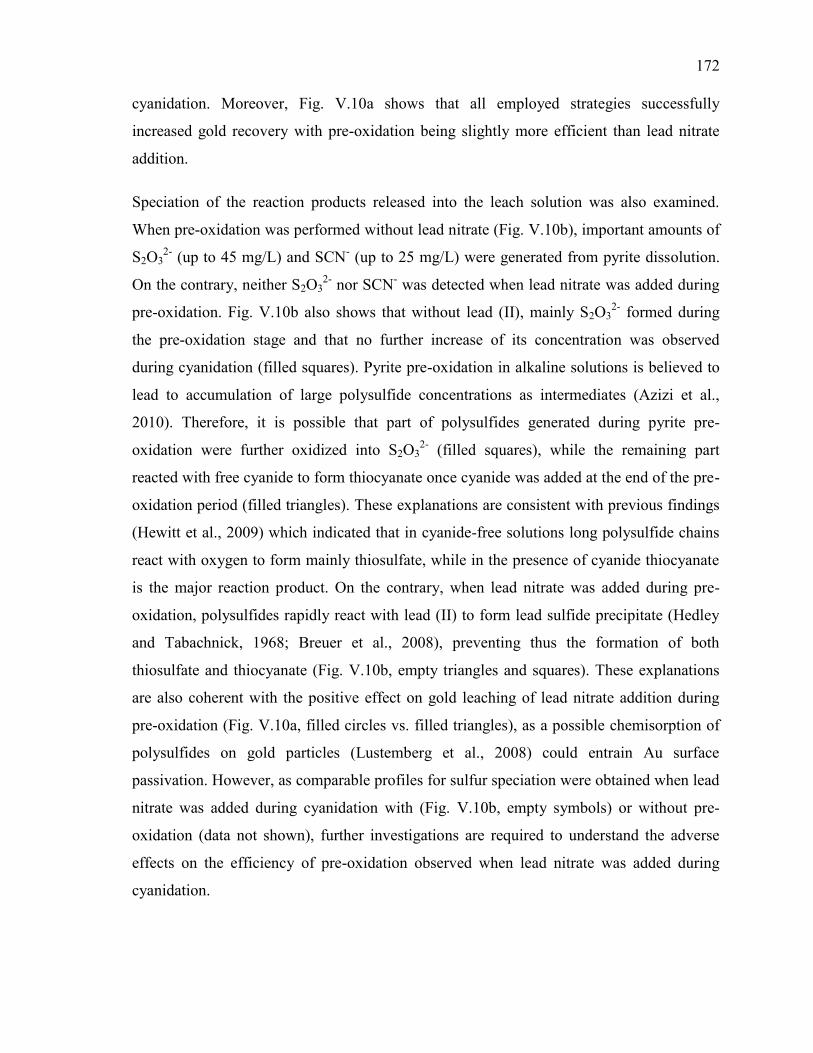
172
cyanidation. Moreover, Fig. V.10a shows that all employed strategies successfully
increased gold recovery with pre-oxidation being slightly more efficient than lead nitrate
addition.
Speciation of the reaction products released into the leach solution was also examined.
When pre-oxidation was performed without lead nitrate (Fig. V.10b), important amounts of
S2O32-
(up to 45 mg/L) and SCN- (up to 25 mg/L) were generated from pyrite dissolution.
On the contrary, neither S2O32-
nor SCN- was detected when lead nitrate was added during
pre-oxidation. Fig. V.10b also shows that without lead (II), mainly S2O32-
formed during
the pre-oxidation stage and that no further increase of its concentration was observed
during cyanidation (filled squares). Pyrite pre-oxidation in alkaline solutions is believed to
lead to accumulation of large polysulfide concentrations as intermediates (Azizi et al.,
2010). Therefore, it is possible that part of polysulfides generated during pyrite pre-
oxidation were further oxidized into S2O32-
(filled squares), while the remaining part
reacted with free cyanide to form thiocyanate once cyanide was added at the end of the pre-
oxidation period (filled triangles). These explanations are consistent with previous findings
(Hewitt et al., 2009) which indicated that in cyanide-free solutions long polysulfide chains
react with oxygen to form mainly thiosulfate, while in the presence of cyanide thiocyanate
is the major reaction product. On the contrary, when lead nitrate was added during pre-
oxidation, polysulfides rapidly react with lead (II) to form lead sulfide precipitate (Hedley
and Tabachnick, 1968; Breuer et al., 2008), preventing thus the formation of both
thiosulfate and thiocyanate (Fig. V.10b, empty triangles and squares). These explanations
are also coherent with the positive effect on gold leaching of lead nitrate addition during
pre-oxidation (Fig. V.10a, filled circles vs. filled triangles), as a possible chemisorption of
polysulfides on gold particles (Lustemberg et al., 2008) could entrain Au surface
passivation. However, as comparable profiles for sulfur speciation were obtained when lead
nitrate was added during cyanidation with (Fig. V.10b, empty symbols) or without pre-
oxidation (data not shown), further investigations are required to understand the adverse
effects on the efficiency of pre-oxidation observed when lead nitrate was added during
cyanidation.
173
0
5
10
15
20
25
30
0 2 4 6 8 10 12 14 16 18 20
% A
u l
ea
ch
ed
Time-on-stream (min)
Preoxidation+Pb followed by cyanidation
Preoxidation followed by cyanidation
Preoxidation followed by cyanidation+Pb
Direct cyanidation+Pb
Direct cyanidation
(a)
0
5
10
15
20
25
30
35
40
45
50
0 5 10 15 20
Lea
ch
ed
sp
ecie
s (m
g/L
)
Time-on-stream (min)
(S2O32-);Ox
(SCN-);Ox
(S2O32- and SCN-); Ox+Pb
(b)
Figure V-10 Effect of lead nitrate addition strategy in presence of pyrite, on: (a) gold
leaching and (b) pyrite oxidation products speciation. Reaction conditions: CN- = 30 mM,
DO2 = 0.25 mM, 5 mg/L Pb-Pb(NO3)2, pH = 11.
174
V.4. Concluding remarks
Investigations aiming at improving gold leaching during cyanidation in the presence of
various sulfide minerals were conducted. A conjunction of electrochemical and chemical
speciation studies using a PBER was employed to provide valuable information about the
mechanisms and reactions involved.
Addition of galena, as a source of lead, was shown to bring important positive effects on
gold recovery with pyrite, chalcopyrite and sphalerite. Not only the detrimental effect of
passivation was neutralized but also an important acceleration of Au dissolution rate was
prompted. The mechanisms involving galena are believed to be similar to those proposed in
the literature for lead nitrate. The effects of galena-other sulfide mineral galvanic
associations on gold leaching showed galena-pyrite galvanic interactions induced a positive
effect on gold leaching, whereas significant negative effects were observed when galena
was successively associated with chalcopyrite, sphalerite and chalcocite.
In absence of galvanic interactions between gold and sulfide minerals, pre-oxidation was an
effective tool to improve gold leaching in the presence of pyrite while, no beneficial effect
was observed in the case of chalcopyrite and sphalerite. However, when galvanic
interactions were enabled, the influence of pre-oxidation on gold dissolution went from
having no effect for chalcopyrite to being detrimental for pyrite. Furthermore, pre-oxidation
of mixed mineral systems of pyrite-chalcopyrite and pyrite-sphalerite showed that enabling
galvanic interactions between the associated minerals during pre-oxidation controlled gold
leaching in the subsequent cyanidation process.
When pre-oxidation was used in the presence of pyrite, lead nitrate addition during pre-
oxidation resulted in a significant increase of gold leaching, whereas its addition during
subsequent cyanidation step canceled the positive effects of pre-oxidation for gold
dissolution.
175
V.5. References
Azizi, A., Petre, C.F., Olsen, C., Larachi, F., 2010. Electrochemical behavior of gold
cyanidation in the presence of a sulfide-rich industrial ore versus its major constitutive
sulfide minerals. Hydrometallurgy 101, 108-119.
Azizi, A., Petre, C.F., Olsen, C., Larachi, F., 2011. Untangling galvanic and passivation
phenomena induced by sulfide minerals on precious metal leaching using a new packed-
bed electrochemical cyanidation reactor. Hydrometallurgy, 107, 101-111.
Breuer, P.L., Jeffrey, M.I., Hewitt, D.M., 2008. Mechanisms of sulfide ion oxidation during
cyanidation. Part I: The effect of lead (II) ions. Minerals Engineering 21, 579-586.
Budruk-Abhijeet, S., Balasubramaniam, R., Gupta, M., 2008. Corrosion behaviour of Mg–
Cu and Mg–Mo composites in 3.5% NaCl. Corrosion Science 50, 2423-2428.
Cruz, R., Luna-Sánchez, R.M., Lapidus, G.T., González, I., Monroy, M., 2005. An
experimental strategy to determine galvanic interactions affecting the reactivity of sulfide
mineral concentrates. Hydrometallurgy 78, 198-208.
Dai, X., Jeffrey, M.I., 2006. The effect of sulfide minerals on the leaching of gold in
aerated cyanide solutions. Hydrometallurgy 82, 118-125.
Deschenes, G., Lastra, R., Brown, J.R., Jin, S., May, O., Ghali, E., 2000. Effect of lead
nitrate on cyanidation of gold ores: progress on the study of the mechanisms. Minerals
Engineering 13, 1263-1279.
Deschenes, G., 2005. Advances in the cyanidation of gold. In: Adams, M.D. (Ed.),
Developments in mineral processing. Elsevier, Amsterdam 15, 479-499.
Guo, H., Deschenes, G., Pratt, A., Fulton, M., Lastra, R., 2005. Leaching kinetics and
mechanisms of surface reactions during cyanidation of gold in the presence of pyrite and
stibnite. Minerals and Metallurgical Processing 22, 89-95.
Habashi, F., 1967. Kinetics and mechanism of gold and silver dissolution in cyanide
solution. Montana Bureau of Mines and Geology Bulletin 59, Montana Bureau of Mines
and Geology, Butte, Montana, USA.
Hedley, N., Tabachnick, H., 1968. Mineral Dressing Notes No 23, Chemistry of
Cyanidation. American Cyanamid Company, New Jersey, USA.
Hewitt, D.M., P.L. Breuer, P.L., Jeffrey, M.I., F. Naim, F., 2009. Mechanisms of sulfide
ion oxidation during cyanidation. Part II: Surface catalysis by pyrite, Minerals Engineering
22, 1166-1172.
Jeffrey, M.I., Ritchie, I.M., 2000. The leaching of gold in cyanide solutions in the presence
of impurities II. The effect of silver. Journal of The Electrochemical Society 147, 3272-
3276.
Lorenzen, L., van Deventer, J.S.J., 1992. Electrochemical interactions between gold and its
associated minerals during cyanidation. Hydrometallurgy 30, 177-194.
Lustemberg, P.G., Vericat, C., Benitez, G.A., Vela, M.E., Tognalli, N., Fainstein, A.,
Martiarena, M.L., Salvarezza, R.C., 2008. Spontaneously formed sulfur adlayers on gold in
176
electrolyte solutions: Adsorbed sulfur or gold sulfide? The Journal of Physical Chemistry
C. 112, 11394-11402.
Mirnezami, M., Hashemi, M.S., Finch, J.A., 2003. Measurement of conductivity of
sulphide particles dispersed in water. Canadian Metallurgical Quarterly 42, 271-276.
Peters, E., 1976. Direct leaching of sulfides: Chemistry and applications. Metallurgical
Transactions B 7, 505-517.
Petre, C.F., Larachi, F., 2006. Capillary electrophoretic separation of inorganic sulfur –
Sulfide, polysulfides and sulfur-oxygen species. Journal of Separation Science, 29, 144-
152.
Petre, C.F., Azizi, A., Olsen, C., Baçaoui, A., Larachi, F., 2008. Capillary electrophoretic
analysis of sulfur and cyanicides speciation during cyanidation of gold complex sulfidic
ores. Journal of Separation Science 31, 3902-3910.
Senanayake, G., 2008. A review of effects of silver, lead, sulfide and carbonaceous matter
on gold cyanidation and mechanistic interpretation. Hydrometallurgy 90, 46-73.
Weichselbaum, J., Tumilty, J.A., Schmidt, C.G., 1989. The effect of sulphide and lead on
the rate of gold cyanidation. Proceedings Aus. I.M.M. Annual conference Perth/Kalgoorlie.
Australasian Institute of Mining and Metallurgy, Melbourne, pp. 221-224.
Zhu, X., Li, J., Wastworth, M.E., 1993. Kinetics of transpassive oxidation of pyrite. In:
Hager, J.P. (Ed.), EPD Congress. The Minerals, Metals & Materials Society 355-368.
177
CONCLUSION GENERALE
Une veille bibliographique détaillée nous a permis de conclure que le caractère réfractaire
de l’or exposé durant le traitement des minerais aurifères sulfureux par cyanuration serait
imputable, sans que les mécanismes ne soient clairement élucidés, aux phénomènes de
passivation (PP) de surface et d’interactions galvaniques (IG), qui impliqueraient, tout au
long de la cyanuration, un éventail de processus redox complexes empêchant une
dissolution poussée du métal visé. Par ailleurs, la forte réactivité des différents minéraux
sulfureux dans les solutions aérées de cyanure entrainent une surconsommation de cyanure
et d’oxygène en raison de la lixiviation inopportune de leurs métaux de base comme le
cuivre, le fer et le zinc...etc. Parallèlement à la lixiviation des métaux nuisibles, la
cogénération de sulfures est soupçonnée d’influencer directement la dissolution de l’or à
travers la formation d’une couche protectrice à la surface du métal.
Pour ce qui est de l’avancement de la partie expérimentale du présent projet, les faits
saillants suivant ont été mis en exergue :
Une étude visant à évaluer l’importance relative sur la dissolution de l’or des phénomènes
de passivation et d’interactions galvaniques a été réalisée. Pour se faire, des électrodes d’or
(en alliage Au/Ag) et minérales, préparées à partir d’un minerai industriel de ses sulfures
majoritaires, ont été utilisées, et les expériences de cyanuration ont été conduites sur un
montage électrochimique à une et à deux cellules. Les résultats de cette étude montrent que
les phénomènes de passivation réduisent l’oxycyanolixiviation de l’or alors que les
interactions galvaniques Au-sulfure présentent globalement un effet positif sur la
dissolution du métal d’intérêt.
Pour comprendre le comportement des minerais sulfureux dans les solutions de cyanure,
une étude systématique des effets du même minerai industriel et de ses sulfures métalliques
prédominants, scrutés individuellement, sur la cinétique de lixiviation de l’or a été réalisée
en mode RDE/slurry. Les résultats de cette étude montrent que tous les sulfures étudiés ont
un effet inhibiteur sur la vitesse de dissolution de l’or. L’analyse des lixiviats des tests de
cyanuration par électrophorèse capillaire nous a permis de nous rendre compte que la
178
chalcopyrite et la sphalérite, bien que minoritaires dans le minerai industriel testé,
majoritairement constituée de la pyrite, semblent influencer fortement sa réactivité et par
conséquent la vitesse de dissolution de l’or. Ceci a été confirmé quand les mêmes sulfures
ont fait l’objet de tests de pré-oxydation avant les expériences de cyanuration. Cette étude a
permis de montrer que la pré-oxydation améliore nettement la vitesse de dissolution de l’or
en présence du minerai industriel, cependant, elle n’a aucun effet en présence de ses
constituants, testé individuellement.
Pour une meilleure évaluation des phénomènes de passivation et d’interactions galvaniques
dans des conditions de contact simulant le minerai industriel ainsi que pour une
compréhension pratique des mécanismes de dissolution de systèmes multi-minéraux
complexes, où les différents sulfures constitutifs sont naturellement associés, nous étions
amenés à penser à une autre stratégie expérimentale. Cette stratégie consiste en une
disposition Au-sulfure et sulfure-sulfure en lit fixe dans un réacteur tubulaire. Une telle
disposition reflète de façon plus réaliste la topochimie de surface des minerais industriels
en termes de contacts galvaniques à l’échelle intra-particulaire. Ainsi, un réacteur
électrochimique à lit fixe (PBER) a été mis au point pour des tests de cyanuration
originaux.
Le PBER a été utilisé pour évaluer la contribution individuelle des phénomènes de
passivation et d’interactions galvaniques sur la dissolution de l’or et de l’argent (PM) en
présence d’une large gamme de sulfures métalliques (pyrite, chalcopyrite, sphalérite,
chalcocite, galène, stibine et un minerai industriel). Les résultats obtenus montrent que la
dissolution de l’or est plutôt contrôlée par les IG Au-sulfure. Ces dernières ne se contentent
pas seulement de neutraliser l’effet négatif de la passivation, mais entraînent une sur-
lixiviation de l’or par rapport aux tests témoins (en absence de sulfure), surtout en présence
de la pyrite, de la chalcopyrite et du minerai industriel. Les courants galvaniques mesurés
aux interfaces Au-sulfures confirment les résultats obtenus en termes de lixiviation de l’or.
Corollairement, l’effet des IG Au-sulfure s’illustre bel et bien également sur la réactivité de
certains minéraux sulfureux (i.e., pyrite, chalcopyrite et la galène), qui se retrouvent
cathodiquement protégés, en partie, par les poudres de métaux précieux (Au & Ag).
179
L’effet des associations galvaniques Au-sulfure et sulfure-sulfure sur la lixiviation de l’or à
partir de plusieurs systèmes multi-minéraux a été également investigué en utilisant le même
réacteur (PBER). L’étude de systèmes synthétiques de type pyrite-chalcopyrite-quartz puis
pyrite-sphalérite-quartz, électriquement-séparés, a montré que la vitesse de dissolution de
l’or est surtout contrôlée par les IG entre les particules d’or et celle de la phase minérale
que les renferme. Cependant, lorsque la chalcopyrite ou la sphalérite ont été substituées par
la chalcocite, la forte réactivité de cette dernière en présence du cyanure inflige une baisse
draconienne de la dissolution anodique de l’or. Des investigations faites sur des systèmes
mixtes de type pyrite/chalcopyrite, pyrite/sphalérite et pyrite/chalcocite,
galvaniquement/associés, ont montré que la réactivité de l’or est fortement influencée par
les IG multifactorielles entre les particules d’or et celles des différentes phases minérales du
mélange. Par ailleurs, les IG sulfure-sulfure se sont révélées infructueuses pour la
lixiviation de l’or libre (non associé aux sulfures conducteurs) dans le cas de mélanges
pyrite/chalcopyrite et pyrite/chalcocite, cependant, elles ont un effet bénéfique dans le cas
du mélange pyrite/sphalérite.
Afin de mettre en évidence l’effet des rapports de surface anode/cathode à l’échelle inter-
particulaire sur la dissolution de l’or, plusieurs rapports massiques ont été étudié dans le cas
du système mixte préparé à partir des poudres de métaux précieux (Au & Ag, PM) et
minérales (pyrite & chalcocite). Les résultats de cette étude ont montré que la dissolution
de l’or est contrôlée aussi bien par le rapport PM/pyrite que par celui pyrite/chalcocite.
Pour remédier à l’impact inhibiteur d’une série de sulfures métalliques sur la lixiviation de
l’or, plusieurs traitements ont été mis en œuvre sur le PBER :
Premièrement, l’utilisation de la galène, comme source de plomb, a permis de montrer que
cette dernière améliore nettement la vitesse de dissolution de l’or en présence, surtout, de la
pyrite, de la chalcopyrite et de la sphalérite. Les IG galène-sulfure ont un effet promoteur
sur la dissolution de l’or en présence de la pyrite, alors qu’en présence de la chalcopyrite,
de la sphalérite ou de la chalcocite elles se sont montrées défavorables.
Deuxièmement, des tests de pré-oxydation ont été réalisés en présence et en absence des IG
Au-sulfure et sulfure-sulfure. Cette étude a permis démontrer que l’efficacité de la pré-
180
oxydation dépend strictement du statut minéralogique des particules d’or et minérales
(pyrite, chalcopyrite, sphalérite). À titre d’exemple, la pré-oxydation a abouti à une baisse
de la dissolution de l’or en présence des IG Au-pyrite, alors qu’en absence de ces dernières
la corrosion du métal d’intérêt a été améliorée. Par ailleurs, la pré-oxydation de mélanges
homogénéisés de type pyrite/chalcopyrite et pyrite/sphalérite, galvaniquement associés, a
montré que le rôle des contacts galvaniques inter-particulaires entre les sulfures associés est
loin d’être simple. Ces derniers donnent lieu à des flux d’électrons par contact direct solide-
solide, durant la période de pré-oxydation, influençant l’importance des dépôts, résultants
de l’oxydation des sulfures, à la surface des particules d’or. De tels dépôts entravent l’accès
aux réactifs (CN- & O2) à la surface active des particules d’or pendant l’étape de
cyanuration et par conséquent, ralentissent leur dissolution.
Finalement, il a été également démontré dans cette étude que l’efficacité du nitrate de
plomb pour pallier aux phénomènes de passivation dépend étroitement des conditions de
son utilisation. En effet, lors de test de pré-oxydation de la pyrite, l’ajout du nitrate de
plomb pendant la période de pré-oxydation a été bénéfique pour la lixiviation de l’or,
contrairement à son ajout pendant la période de cyanuration qui a été révélé infructueux.
PERSPECTIVES
Les résultats trouvés au niveau de la partie portant sur l’effet de la pré-oxydation de
sulfures individuels, de leurs mélanges mixtes ainsi que du minerai industriel (mélange
natif des mêmes sulfures) sur la récupération de l’or, nous ont permis de démontrer que la
réactivité de ces derniers dans les solutions de cyanure est fortement influencée par les
contacts galvaniques permanents entre les différents sulfures. Par conséquent, il serait très
intéressant de tenir compte des rapports de surface sulfure/sulfure dans des conditions qui
seront les plus possible représentatives des abondances des différents sulfures dans le
minerai industriel. Ceci permettrait d’élaborer une stratégie de pré-oxydation tenant
compte des spécificités minéralogiques du minerai industriel en question.
Il serait également intéressant d’élaborer un modèle statistique descriptif en mesure
d’interpoler le comportement de minerais industriels multi-minéraux (lixiviation de l’or et
de cyanicides, consommation de cyanure, etc.). En effet, la mise en œuvre de tests de
181
lixiviation de l’or en présence de mélanges synthétiques de plusieurs sulfures
galvaniquement associés, au moyen du lit fixe, dans des rapports plus réalistes est très utile.
L’analyse des ions résultant de la dissolution des minerais, jumelée à l’information qui sera
obtenue de la caractérisation des dépôts sur la surface d’or, par microscopie électronique à
balayage (SEM) et par spectroscopie des photoélectrons (XPS), permettraient, nous
l’espérons, de contribuer à une interprétation plus élaborée des mécanismes de
développement de la couche de passivation à la surface de l’or en tenant compte des effets
des interactions possibles entre les minéraux sulfureux sur leurs réactivités respectives.
Ainsi on pourrait commencer à dégager des règles de représentativité du réacteur
électrochimique à lit fixe (PBER) à émuler un véritable minerai industriel.
Des essais menés durant les dernières semaines de cette thèse ont montré que l’utilisation
des complexes tricyanocupreux (Cu(CN)32-
) et teracyanozincates (Zn(CN)42-
) pour la
lixiviation de l’or pourraient faire baisser la lixiviation du cuivre et du zinc à partir des
minerais sulfureux tout en gardant des taux de récupération d’or acceptables. De ce fait, il
serait crucial de mener des études permettant de contribuer tant au plan de la
compréhension fondamentale des mécanismes de la cyanuration à partir des complexes
cyanométalliques qu’au plan de la mise au point de nouvelles stratégies de cyanuration
permettant d’améliorer les conditions de dissolution préférentielle de l’or au détriment des
métaux indésirables. Autrement dit, de telles stratégies seraient en mesure d’améliorer la
sélectivité de la cyanuration et de réduire la consommation de cyanure.
Vu la robustesse du protocole développé par électrophorèse capillaire, il serait également
intéressant d’élargir le champ d’application de la technique pour couvrir d’autre éléments
(i.e., Sx2-
, Zn, Co, Ni, As, Sb, CN-). Ceci permettrait d’aider pour une meilleure
compréhension des réactions des différents minéraux sulfureux, problématiques pendant
l’extraction de l’or par cyanuration.
182
APPENDIX A. Capillary electrophoretic analysis of
sulfur and cyanicides speciation during cyanidation of
gold complex sulfidic ores
183
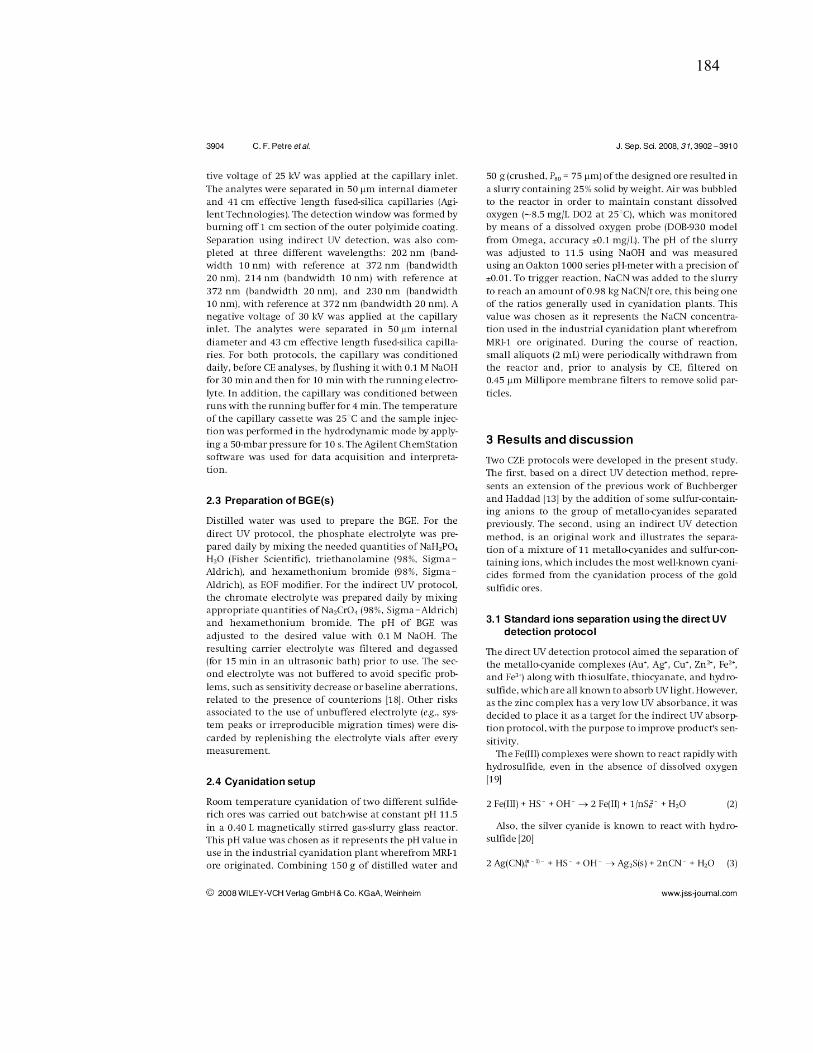
184
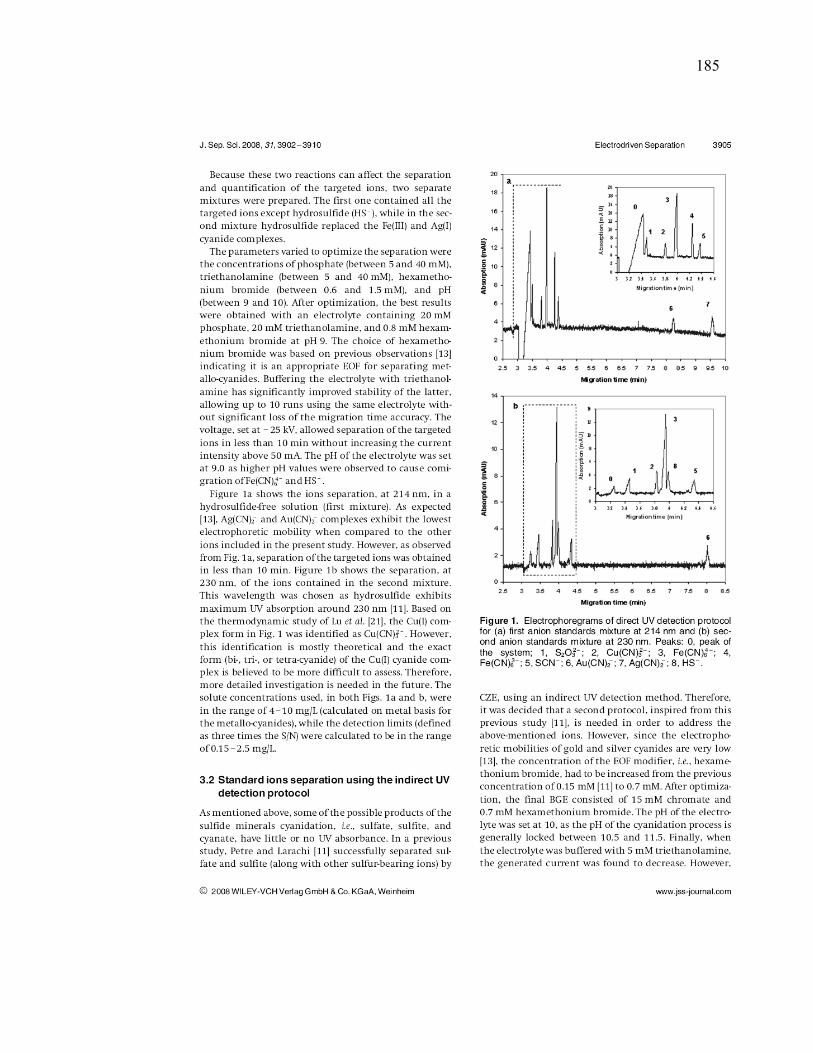
185
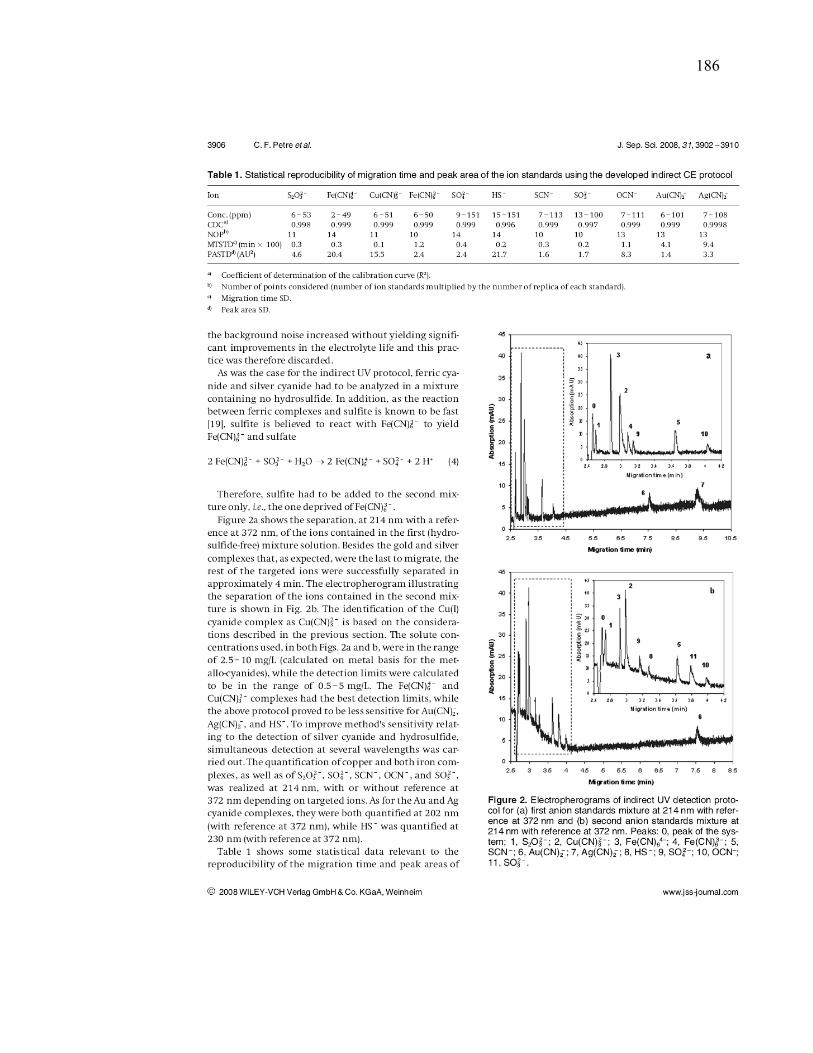
186
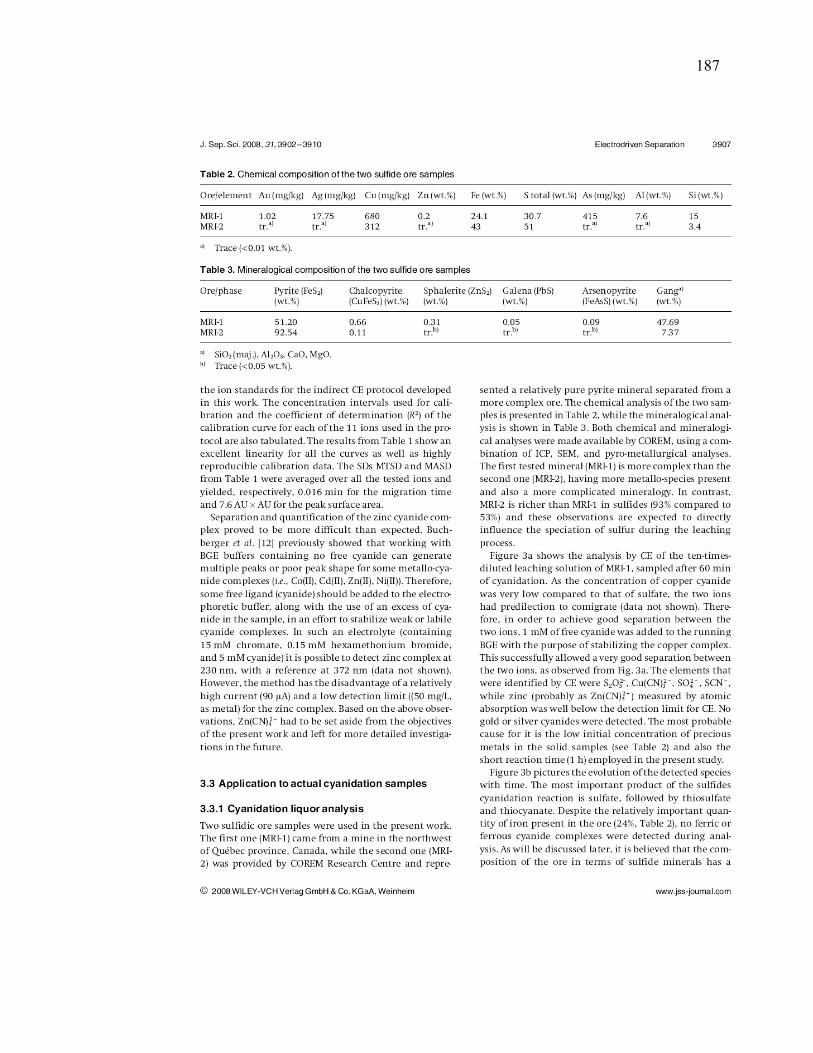
187
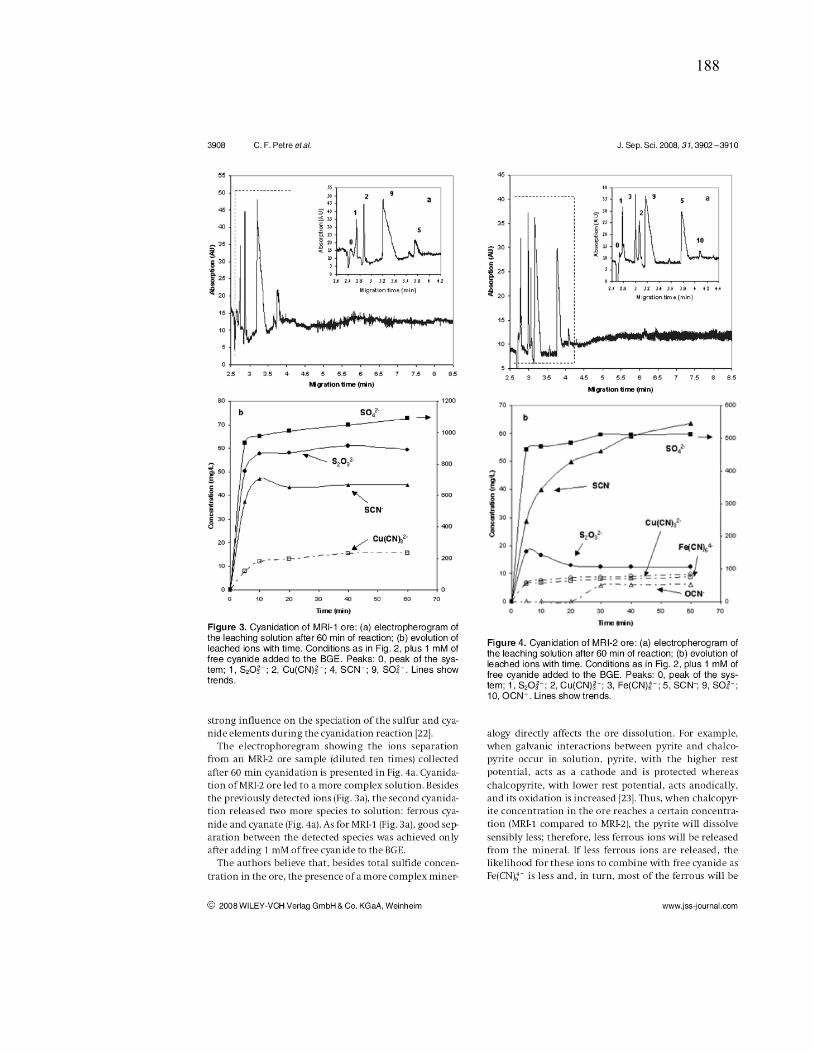
188
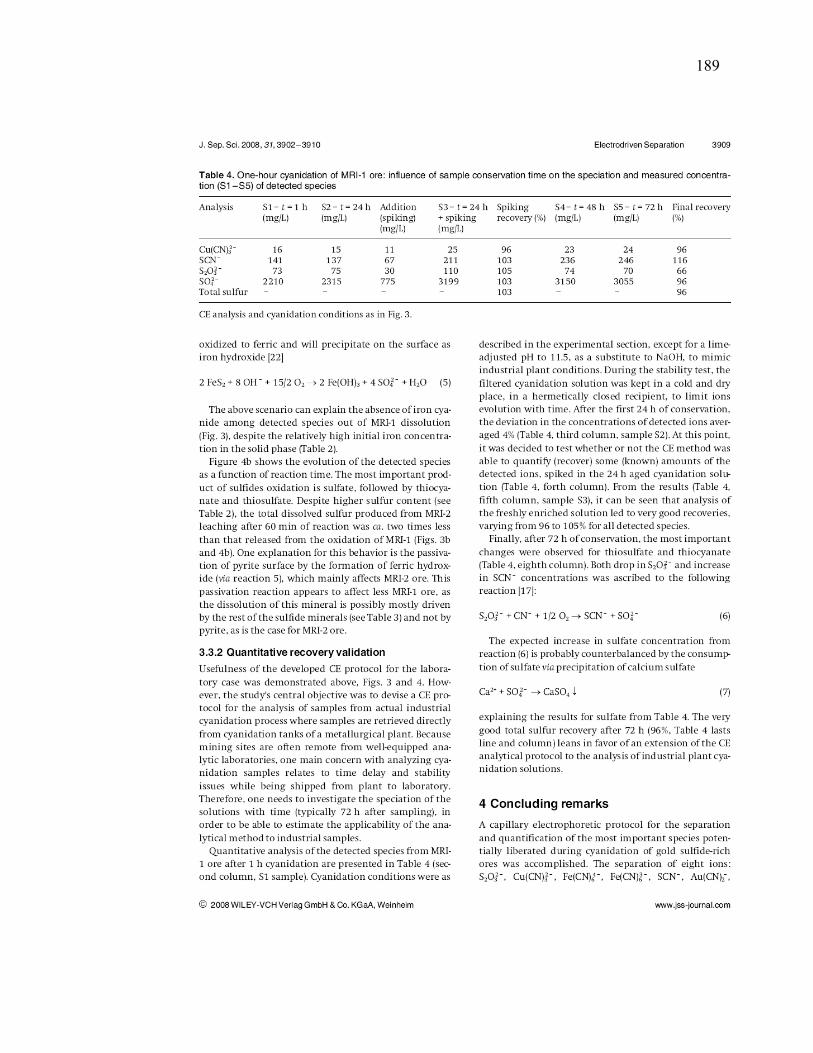
189
190
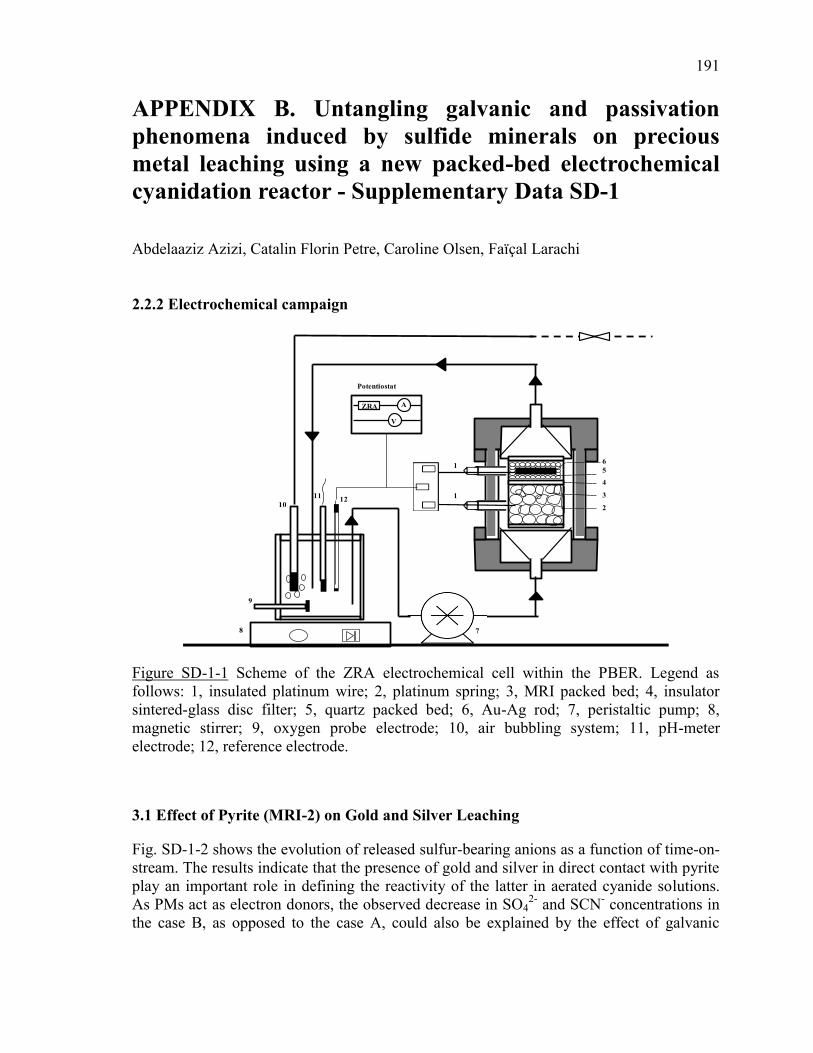
191
APPENDIX B. Untangling galvanic and passivation
phenomena induced by sulfide minerals on precious
metal leaching using a new packed-bed electrochemical
cyanidation reactor - Supplementary Data SD-1
Abdelaaziz Azizi, Catalin Florin Petre, Caroline Olsen, Faïçal Larachi
2.2.2 Electrochemical campaign
Potentiostat
ZRA
V
A
4
1
1
2
3
6
5
78
9
11
1012
Figure SD-1-1 Scheme of the ZRA electrochemical cell within the PBER. Legend as
follows: 1, insulated platinum wire; 2, platinum spring; 3, MRI packed bed; 4, insulator
sintered-glass disc filter; 5, quartz packed bed; 6, Au-Ag rod; 7, peristaltic pump; 8,
magnetic stirrer; 9, oxygen probe electrode; 10, air bubbling system; 11, pH-meter
electrode; 12, reference electrode.
3.1 Effect of Pyrite (MRI-2) on Gold and Silver Leaching
Fig. SD-1-2 shows the evolution of released sulfur-bearing anions as a function of time-on-
stream. The results indicate that the presence of gold and silver in direct contact with pyrite
play an important role in defining the reactivity of the latter in aerated cyanide solutions.
As PMs act as electron donors, the observed decrease in SO42-
and SCN- concentrations in
the case B, as opposed to the case A, could also be explained by the effect of galvanic
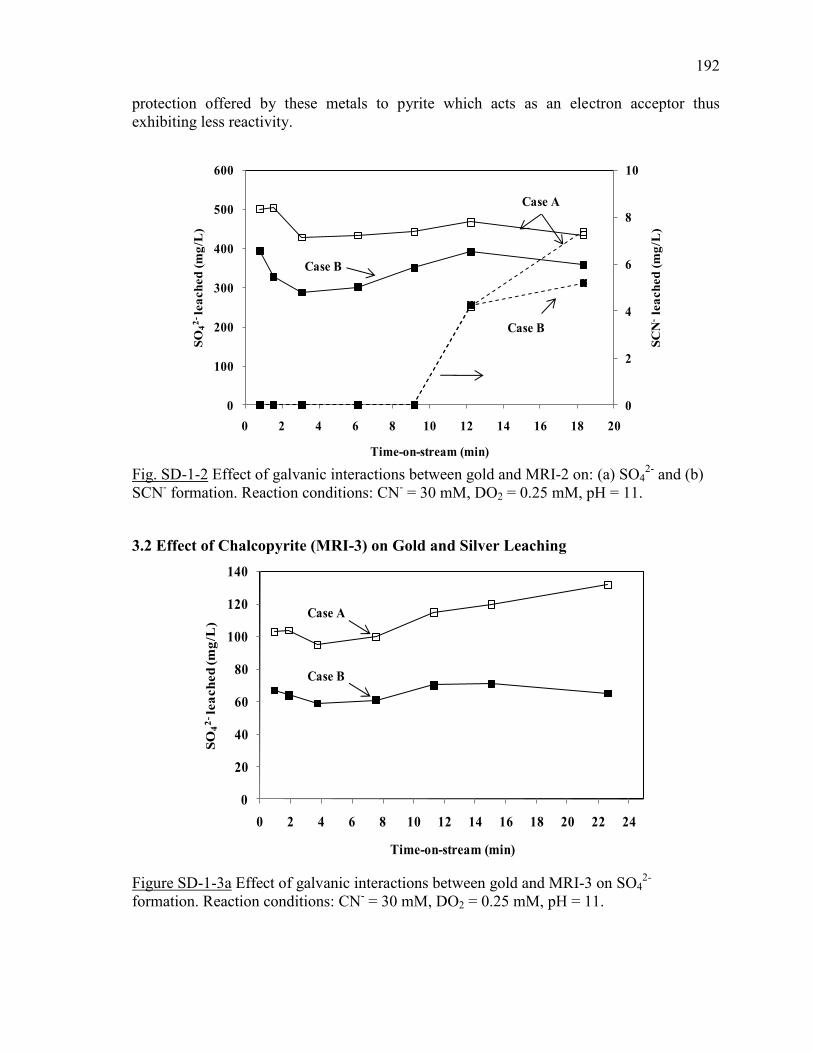
192
protection offered by these metals to pyrite which acts as an electron acceptor thus
exhibiting less reactivity.
0
2
4
6
8
10
0
100
200
300
400
500
600
0 2 4 6 8 10 12 14 16 18 20
SC
N-
lea
ch
ed
(m
g/L
)
SO
42
-le
ach
ed
(m
g/L
)
Time-on-stream (min)
Case B
Case A
Case B
Fig. SD-1-2 Effect of galvanic interactions between gold and MRI-2 on: (a) SO4
2- and (b)
SCN- formation. Reaction conditions: CN
- = 30 mM, DO2 = 0.25 mM, pH = 11.
3.2 Effect of Chalcopyrite (MRI-3) on Gold and Silver Leaching
0
20
40
60
80
100
120
140
0 2 4 6 8 10 12 14 16 18 20 22 24
SO
42
-le
ach
ed
(m
g/L
)
Time-on-stream (min)
Case A
Case B
Figure SD-1-3a Effect of galvanic interactions between gold and MRI-3 on SO4
2-
formation. Reaction conditions: CN- = 30 mM, DO2 = 0.25 mM, pH = 11.
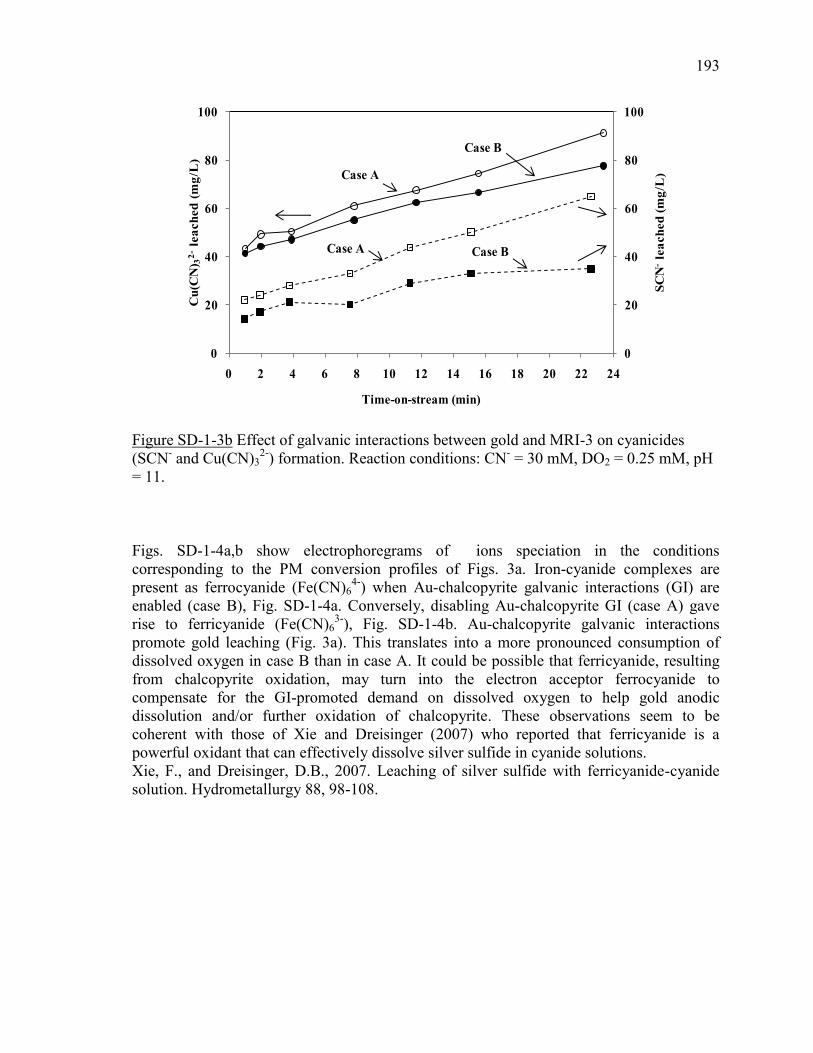
193
0
20
40
60
80
100
0
20
40
60
80
100
0 2 4 6 8 10 12 14 16 18 20 22 24
SC
N-
lea
ch
ed
(m
g/L
)
Cu
(CN
) 32
-le
ach
ed
(m
g/L
)
Time-on-stream (min)
Case A
Case B
Case A Case B
Figure SD-1-3b Effect of galvanic interactions between gold and MRI-3 on cyanicides
(SCN- and Cu(CN)3
2-) formation. Reaction conditions: CN
- = 30 mM, DO2 = 0.25 mM, pH
= 11.
Figs. SD-1-4a,b show electrophoregrams of ions speciation in the conditions
corresponding to the PM conversion profiles of Figs. 3a. Iron-cyanide complexes are
present as ferrocyanide (Fe(CN)64-
) when Au-chalcopyrite galvanic interactions (GI) are
enabled (case B), Fig. SD-1-4a. Conversely, disabling Au-chalcopyrite GI (case A) gave
rise to ferricyanide (Fe(CN)63-
), Fig. SD-1-4b. Au-chalcopyrite galvanic interactions
promote gold leaching (Fig. 3a). This translates into a more pronounced consumption of
dissolved oxygen in case B than in case A. It could be possible that ferricyanide, resulting
from chalcopyrite oxidation, may turn into the electron acceptor ferrocyanide to
compensate for the GI-promoted demand on dissolved oxygen to help gold anodic
dissolution and/or further oxidation of chalcopyrite. These observations seem to be
coherent with those of Xie and Dreisinger (2007) who reported that ferricyanide is a
powerful oxidant that can effectively dissolve silver sulfide in cyanide solutions.
Xie, F., and Dreisinger, D.B., 2007. Leaching of silver sulfide with ferricyanide-cyanide
solution. Hydrometallurgy 88, 98-108.
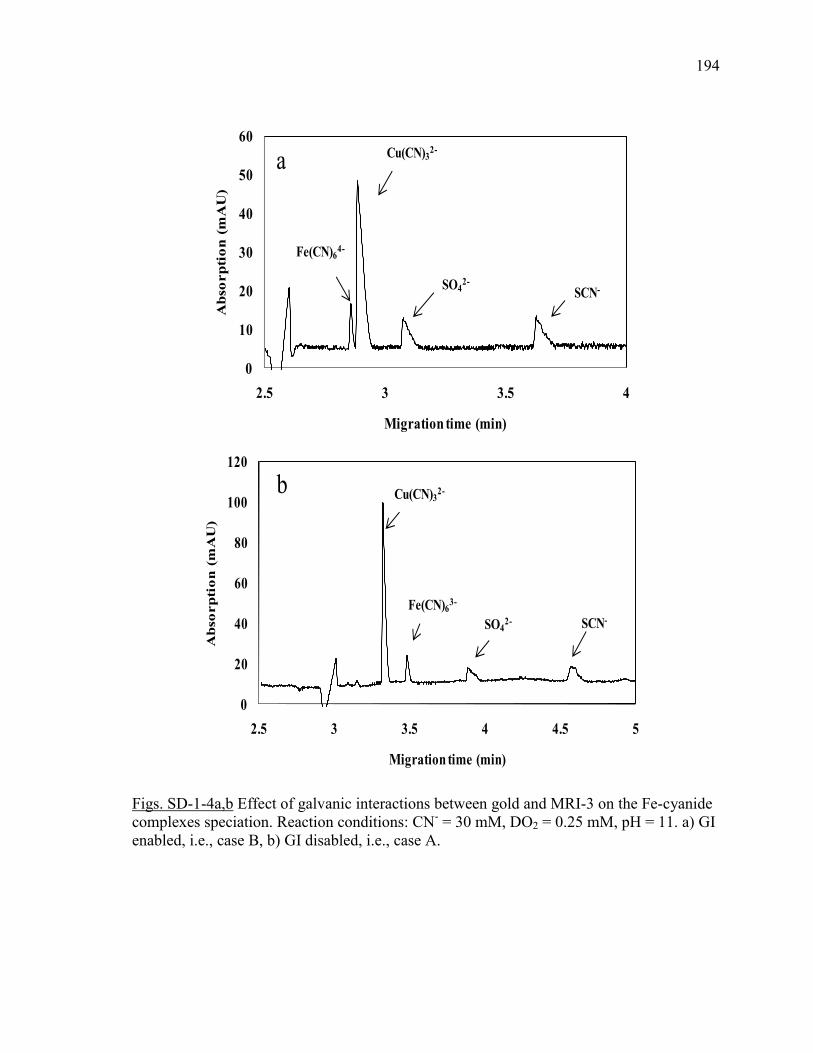
194
0
10
20
30
40
50
60
2.5 3 3.5 4
Ab
so
rp
tio
n (
mA
U)
Migration time (min)
Fe(CN)64-
SO42-
Cu(CN)32-
SCN-
a
0
20
40
60
80
100
120
2.5 3 3.5 4 4.5 5
Ab
so
rp
tio
n (
mA
U)
Migration time (min)
Fe(CN)63-
Cu(CN)32-
SO42- SCN-
b
Figs. SD-1-4a,b Effect of galvanic interactions between gold and MRI-3 on the Fe-cyanide
complexes speciation. Reaction conditions: CN- = 30 mM, DO2 = 0.25 mM, pH = 11. a) GI
enabled, i.e., case B, b) GI disabled, i.e., case A.
195
APPENDIX C. PBER: time-on-stream vs. physical time
For all the experiments carried out with the PBER, the aerated cyanide solution feed was
continuously recirculated in a closed loop through the fixed bed using a peristaltic pump.
At different time intervals, samples of the solution were taken from the magnetically-stirred
glass reactor and used to measure the concentration of dissolved metals, dissolved sulfur
and cyanicides. For each sampling time interval (physical time), the corresponding
residence time of the aerated cyanide solution in the gold containing layer (time on-
stream) was computed after the bed porosity was determined for every powder loading in
the PBER and the prevailing cyanide solution volumetric flow rate. This latter was kept
constant at 10.4 mL/min for all the experiments. Consequently, The time on stream against
which all the concentration profiles of this study (chapters III. IV and V) were plotted
corresponded to the time the aerated cyanide solution sojourned inside the PBER excluding
the remainder of the transit time of flight in the external loop of the liquid circuit.
The following formula was used to calculate the time-on-stream:
(1)
TOS(ST) = TOS/pass x N(ST) (2)
Where:
TOS/pass: time on-stream (per-pass residence time of the cyanide solution in the packed
bed)
V: PBER volume, mL
Q: volumetric flow rate (mL/min)
TOS(ST) : time on-stream at each sampling time interval
N(ST): solution’s turnover in the PBER at each sampling time interval
For the sake of clarity some figures from chapters III. IV and V were duplicated in the
present appendix (see below).
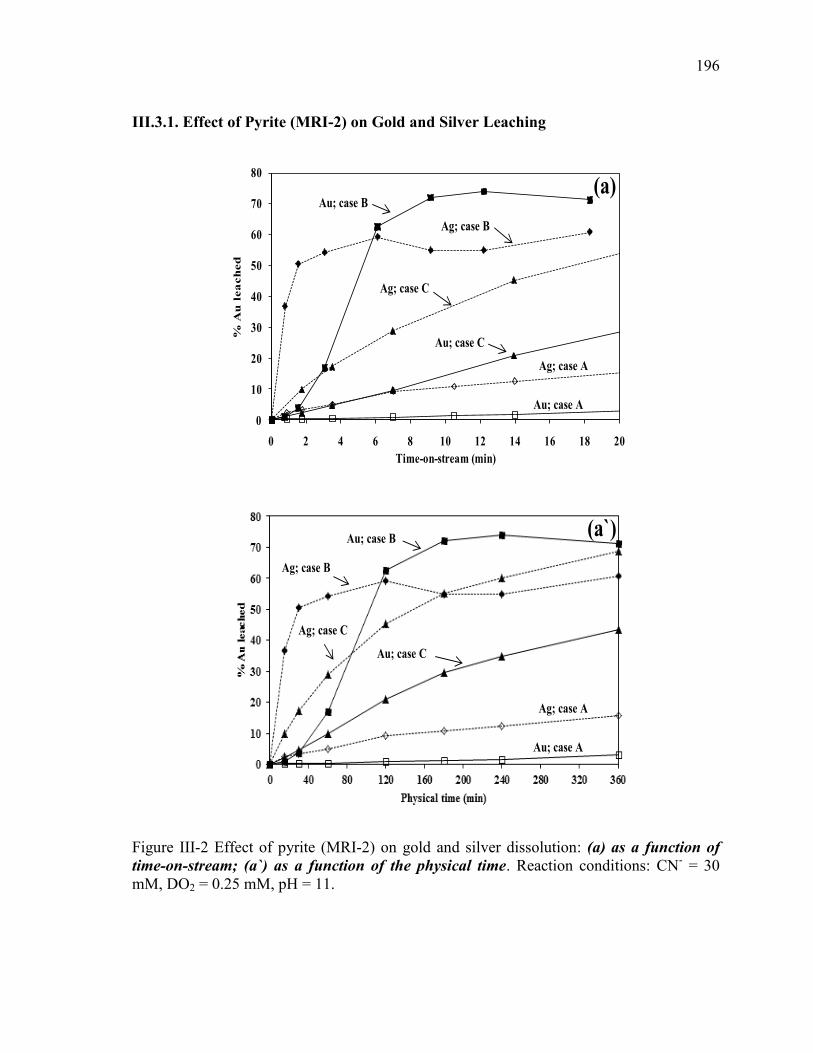
196
III.3.1. Effect of Pyrite (MRI-2) on Gold and Silver Leaching
0
10
20
30
40
50
60
70
80
0 2 4 6 8 10 12 14 16 18 20
% A
u l
ea
ch
ed
Time-on-stream (min)
Au; case B
Ag; case C
Au; case C
Ag; case A
Au; case A
Ag; case B
(a)
Au; case B
Ag; case C
Au; case C
Ag; case A
Au; case A
Ag; case B
(a`)
Figure III-2 Effect of pyrite (MRI-2) on gold and silver dissolution: (a) as a function of
time-on-stream; (a`) as a function of the physical time. Reaction conditions: CN- = 30
mM, DO2 = 0.25 mM, pH = 11.
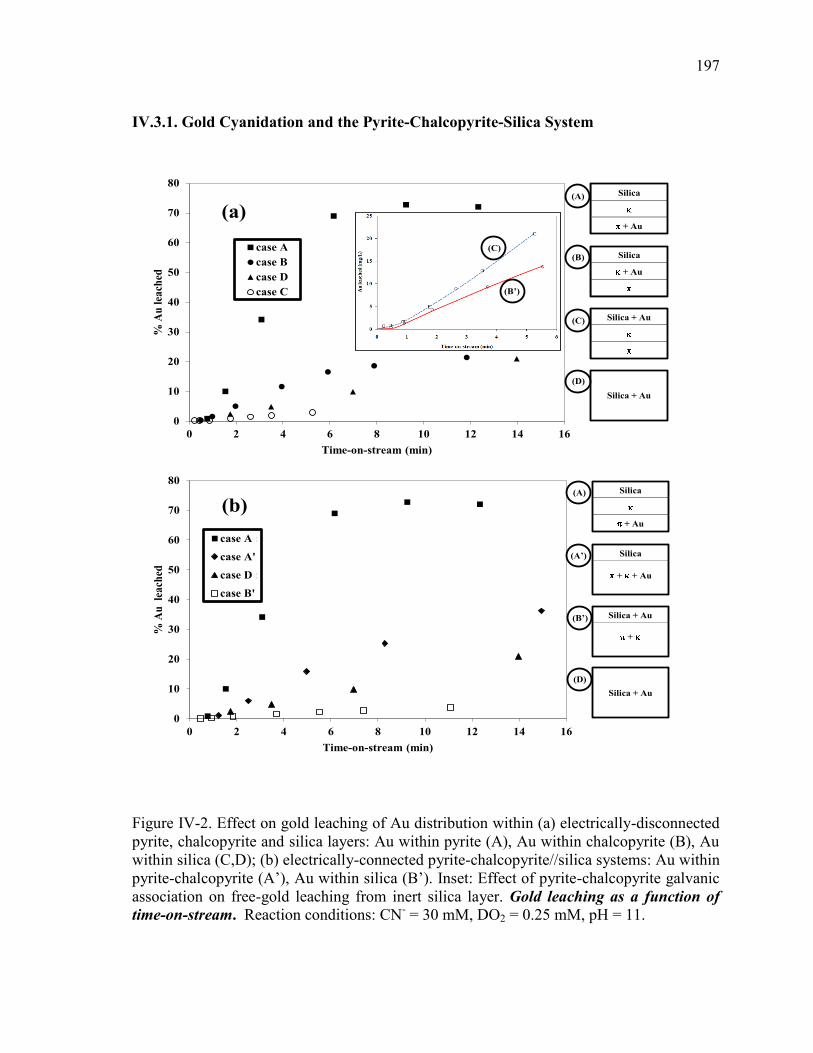
197
IV.3.1. Gold Cyanidation and the Pyrite-Chalcopyrite-Silica System
0
10
20
30
40
50
60
70
80
0 2 4 6 8 10 12 14 16
% A
u
lea
ched
Time-on-stream (min)
case A : MRI-2+Au+Ag//MRI-3//Silica
case A' : MRI-2+MRI-3+Au+Ag//Silica
case D : Silica+Au+Ag
case B' : MRI-2+MRI-3//Silica+Au+Ag
0
10
20
30
40
50
60
70
80
0 2 4 6 8 10 12 14 16
% A
u l
each
ed
Time-on-stream (min)
case A : MRI-2+Au+Ag//MRI-3//Silica
case B : MRI-2//MRI-3+Au+Ag//Silica
case D : Silica+Au+Ag
case C : MRI-2//MRI-3//Silica+Au+Ag
(a)
(b)
Silica
+ Au
(B)
Silica + Au(C)
Silica + Au
(D)
Silica
+ Au
(A)
Silica
+ + Au
(A’)
Silica + Au(B’)
Silica + Au
(D)
Silica
+ Au
(A)
(C)
(B’)
+
Figure IV-2. Effect on gold leaching of Au distribution within (a) electrically-disconnected
pyrite, chalcopyrite and silica layers: Au within pyrite (A), Au within chalcopyrite (B), Au
within silica (C,D); (b) electrically-connected pyrite-chalcopyrite//silica systems: Au within
pyrite-chalcopyrite (A’), Au within silica (B’). Inset: Effect of pyrite-chalcopyrite galvanic
association on free-gold leaching from inert silica layer. Gold leaching as a function of
time-on-stream. Reaction conditions: CN- = 30 mM, DO2 = 0.25 mM, pH = 11.
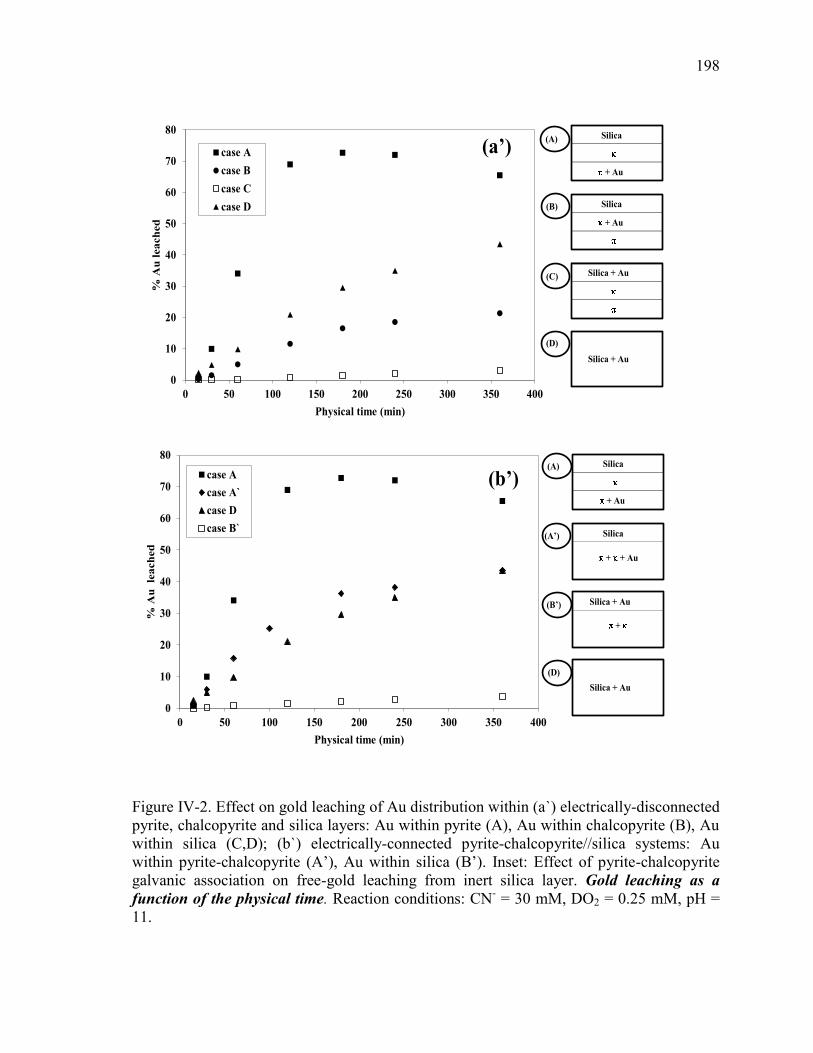
198
0
10
20
30
40
50
60
70
80
0 50 100 150 200 250 300 350 400
% A
u l
ea
ch
ed
Physical time (min)
case A
case B
case C
case D
0
10
20
30
40
50
60
70
80
0 50 100 150 200 250 300 350 400
% A
u
lea
ch
ed
Physical time (min)
case A
case A`
case D
case B`
(a’)
(b’)
Silica
+ Au
(B)
Silica + Au(C)
Silica + Au
(D)
Silica
+ Au
(A)
Silica
+ + Au
(A’)
Silica + Au(B’)
Silica + Au
(D)
Silica
+ Au
(A)
+
Figure IV-2. Effect on gold leaching of Au distribution within (a`) electrically-disconnected
pyrite, chalcopyrite and silica layers: Au within pyrite (A), Au within chalcopyrite (B), Au
within silica (C,D); (b`) electrically-connected pyrite-chalcopyrite//silica systems: Au
within pyrite-chalcopyrite (A’), Au within silica (B’). Inset: Effect of pyrite-chalcopyrite
galvanic association on free-gold leaching from inert silica layer. Gold leaching as a
function of the physical time. Reaction conditions: CN- = 30 mM, DO2 = 0.25 mM, pH =
11.
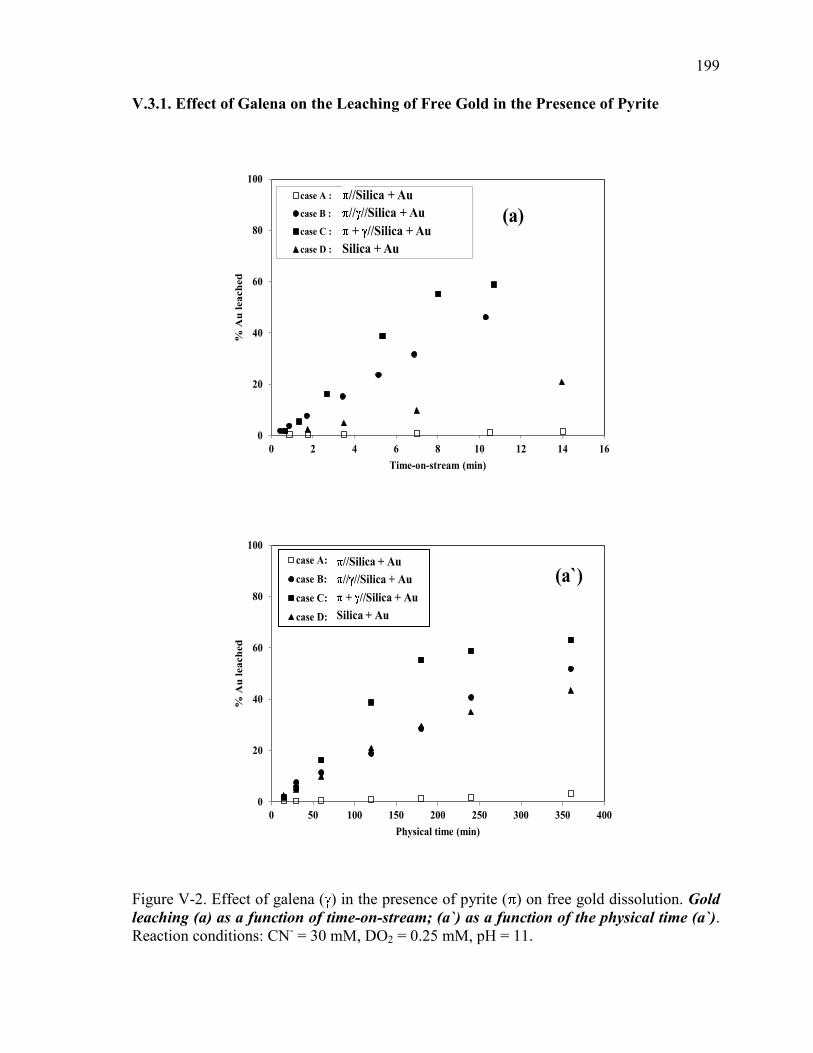
199
V.3.1. Effect of Galena on the Leaching of Free Gold in the Presence of Pyrite
0
20
40
60
80
100
0 2 4 6 8 10 12 14 16
% A
u l
ea
ch
ed
Time-on-stream (min)
case A : MRI-2//Silica+Au+Ag
case B : MRI-2//MRI-6//Silica+Au+Ag
case C : MRI-2+MRI-6//Silica+Au+Ag
case D : Silica+Au+Ag
//Silica + Au
// //Silica + Au
+ //Silica + Au
Silica + Au
(a)
0
20
40
60
80
100
0 50 100 150 200 250 300 350 400
% A
u l
ea
ch
ed
Physical time (min)
case A:
case B:
case C:
case D:
//Silica + Au
// //Silica + Au
+ //Silica + Au
Silica + Au
(a`)
Figure V-2. Effect of galena ( ) in the presence of pyrite ( ) on free gold dissolution. Gold
leaching (a) as a function of time-on-stream; (a`) as a function of the physical time (a`).
Reaction conditions: CN- = 30 mM, DO2 = 0.25 mM, pH = 11.


