Embed Size (px)
Citation preview
N a t i o n a l H um an D e v e l o p m e n t R e p o r t S l o v a k R e p ub l i c 2001-2002
S um m ar y1
Summary
The submitted National Human Development Report represents the sixth edition of the National Reporton Slovakia. Since 1995, the reports have attempted to provide an evaluation of the conditions thoughtto have key effects upon the quality of life in the country. The cross-sectoral character of the first threeeditions was gradually replaced by a monothematic focus on selected problems of human development inSlovakia. The reports of the past several years have focused on regional differences, gender equality,and poverty.
The present biannual edition of the Report deals with human health. There are several reasons forselecting this particular topic: health is one of the pillars of the human development concept, it is amongcrucial life values, and represents a prerequisite for leading a fulfilling life. The importance which peopleattribute to health is also evident from public opinion surveys; the health sector has been classified byrespondents as one of the most burning societal problems. Pronounced growth in dissatisfaction withhealth care provided by the public health system suggests an intensification of problems in the system.
Health care, however, represents one of many factors that affect the health condition of thepopulation. Although they need not be in direct connection with health care, preventive health measuresare not sufficiently encouraged in the Slovak Republic. The health condition of Slovakia’s population isnot satisfactory; this is partly due to the lifestyles people lead.
The aim of the present Report is to define, based on analysis of major health determinants and theireffects, measures that may be expected to contribute to an improved health condition of the population.The team of authors has attempted to present a balanced view of both preventive and therapeuticaspects of health care. The document does not present any specific suggestions for new therapeuticprocedures or dietary approaches. The goal of the Report has been to point out the positive aspects andshortcomings identified in the various sectors of human development that affect health; furthermore, theaim was to formulate, based on knowledge thus obtained, a framework of measures leading to gradualimprovement of health parameters. The authors of this document want to promote greater publicawareness of health issues and factors by means of education and discussion, therefore, leading thepublic to contemplate the importance of preventive and therapeutic measures. Last but not least, theauthors attempt to increase the awareness of individuals and the whole society of their responsibilitiesfor improving public health.
Chapter One presents the rationale of the Report’s focus. It summarizes the importance of health forhuman development and outlines the close links existing between health and other dimensions ofdevelopment. In addition, the chapter presents a concise overview of the main findings of the precedingNational Report.
The public considers health as a major life value; however, people tend to rely on the treatment ofdiseases rather than on preventive health measures by means of promoting healthy behavior. To a greatextent, this approach reflects the development of the society over the past decades. The mutualinteractions between health and human development are quite unambiguous; healthy individuals tend tohave better chances to enjoy full-fledged lives than persons with poor health. Populations are usuallyhealthier in societies with a higher degree of development.
The content of Chapter Two partially branches off from the main topics of the Report. The authorsdeal with the development of Slovakia’s society between 2000 and 2002. The Chapter presents shortoverviews of past developments in politics, economic development, labor market, and education.Important economic and social measures from this period are evaluated from the viewpoint of theirinfluence on the quality of life. The final sections include analyses that turn back to the main topics of theReport. Furthermore, the Chapter presents the traditional discussion about human development indices,with emphasis on public health.
During the past two years, domestic political developments were mainly influenced by the autumn2002 parliamentary elections, in which the outcome created preconditions for the continuation of stabledemocratic development. Economic discussions were still dominated by issues of high unemploymentrates and their negative impacts on the social situation of the population, by progress achieved inintegration processes, which helped make the country more attractive to foreign investors. Concerningthe quality of education, no major developments in the education sector were brought about; however,several promising legislative and institutional changes were launched. In the opinion of the professionalpublic, the most appreciated economic and social measures in 2000-2002 include Slovakia’s membershipto the OECD, adoption of the amendment to the Bankruptcy and Settlement Act and adoption of the FreeAccess to Information Act. International assessments of human development conditions brought nopronounced changes for Slovakia. Being ranked by the Human Development Index, Slovakia hasconfirmed its position among countries at a high level of development.
N a t i o n a l H um an D e v e l o p m e n t R e p o r t S l o v a k R e p ub l i c 2001-2002
S um m ar y 2
Chapter Three is the heart of the document. Using morbidity and mortality parameters, the authorsanalyzed the health condition of the population. They compared the development and the trends withother countries. An analysis of selected health determinants is presented, with an emphasis on lifestylesand health care. The section dealing with the health care sector includes a detailed analysis on thecurrent critical condition of the entire system. The Chapter elaborates on patient rights issues as clientsof health services.
The main features of demographic development include the complete slow-down of natural populationgrowth and the gradual aging of the population. Life expectancy has slightly increased; however, thehealth condition of mainly the male population remains pronouncedly behind that of most developedcountries. The major reasons for this include, apart from historical context, negative trends in key healthfactors, such as increasing tobacco consumption, unhealthy dietary habits, worsened social situation (inparticular concerning the poorly educated portions of the population with problems in the labor market),but also the crisis in the health sector. The Slovak health sector suffers from much needed reform whichwould address problems of health care accessibility, quality of services, financial sustainability of thesystem, and rampant corruption. In the current system, the patient seems to play no substantial role.
Chapter Four summarizes the main findings and presents a vision of the health “recovery”. TheChapter points to the need of a comprehensive approach to health issues. The authors define theprincipal framework of health sector and non-health sector related measures that may present thepotential of gradually improving health in Slovakia. The draft reform is based on the existing strategy inthe preparation of which the authors of the present National Report were participating.
Non-health sector related measures include, above all, primary prevention. More targeted preventivemeasures need improved monitoring of health risk factors. Of similar importance is improved publicaccess to health risks-related information. Preventive health measures are connected to behavioralchanges. The priorities include fighting smoking habits and changing dietary habits. Health care reformshould strengthen the relationship between what the citizens put into the system in the form ofcontributions and taxes and what they get out of it in the form of health services. As an important step inthe reform movement, an optimal mix of solidarity and personal involvement must be found. Bringingthe growing debt in the health sector to a halt will require systemic changes in health care financing andin organizational and institutional accountability. Reform will be oriented towards raising citizen’sresponsibility for one’s own health, which will require a system of targeted assistance to vulnerablegroups of the population.
Attached to the Report is the Statistical Annex, offering an overview of the basic indicators of humandevelopment in the Slovak Republic, ranking of selected economic and social measures taken within2000-2002, as well as international comparisons of countries by the Human Development Index andGender-related Development Index.
N a t i o n a l H um an D e v e l o p m e n t R e p o r t S l o v a k R e p ub l i c 2001-2002
H e a l t h – A P r e s s i n g P r i o r i t y3
1. Health – A Pressing Priority
In recent years, public opinion surveys focusing on pressing social issues have gained popularity. Suchsurveys represent a reflection of the development of the society and of the hierarchy of values of people.Their „strategic“ importance, however, resides in the public’s evaluation of the success or failure ofreforms. Consequently, surveys present a good compass to aim efforts towards improvement of thequality of life.
Areas that may be considered as the anchoring points of human life remain in the leading positionswhen it comes to the evaluation of acute problems. The following are considered to the acute problems:inadequate standard of living, high unemployment rates, extensive crime rates and corruption, criticalcondition of the health care system, insufficient quality of education, unsatisfactory housing that are thereasons for negative feelings of a large portion of the population. In the opinion of Slovakia’s population,the quality of life in this country is behind the times in some key areas (see Table 1.1).1
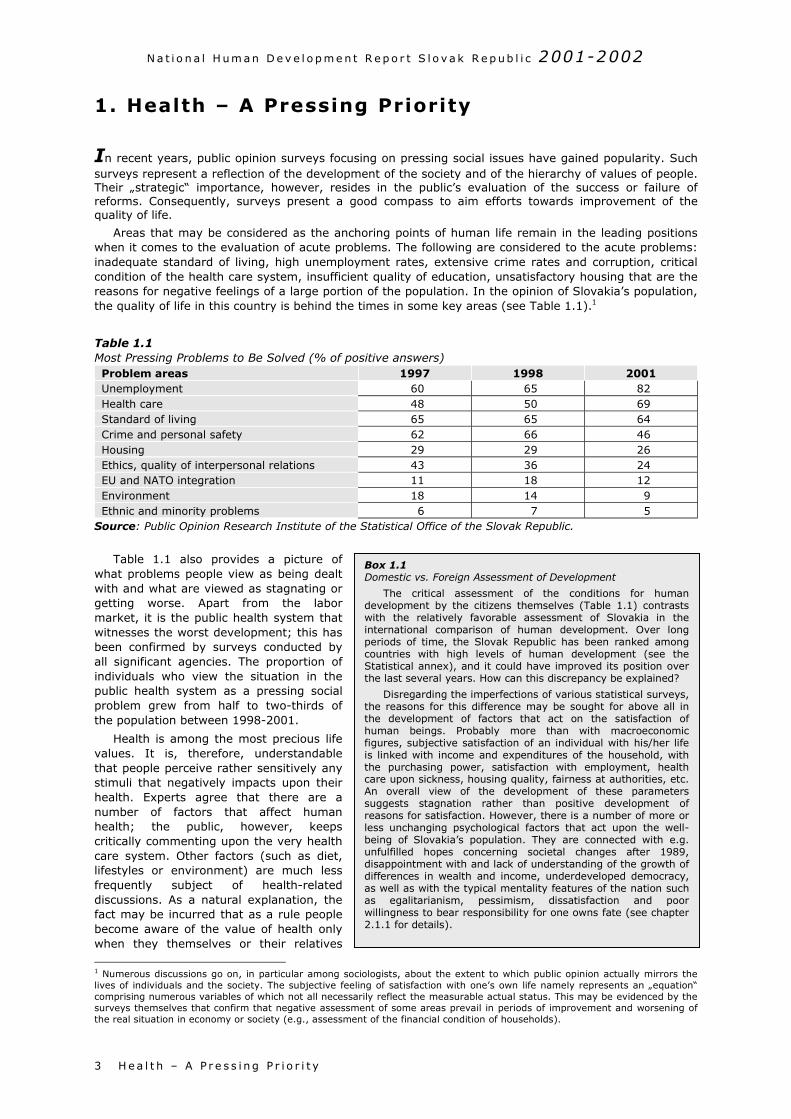
Table 1.1Most Pressing Problems to Be Solved (% of positive answers)Problem areas 1997 1998 2001Unemployment 60 65 82Health care 48 50 69Standard of living 65 65 64Crime and personal safety 62 66 46Housing 29 29 26Ethics, quality of interpersonal relations 43 36 24EU and NATO integration 11 18 12Environment 18 14 9Ethnic and minority problems 6 7 5
Source: Public Opinion Research Institute of the Statistical Office of the Slovak Republic.
Table 1.1 also provides a picture ofwhat problems people view as being dealtwith and what are viewed as stagnating orgetting worse. Apart from the labormarket, it is the public health system thatwitnesses the worst development; this hasbeen confirmed by surveys conducted byall significant agencies. The proportion ofindividuals who view the situation in thepublic health system as a pressing socialproblem grew from half to two-thirds ofthe population between 1998-2001.
Health is among the most precious lifevalues. It is, therefore, understandablethat people perceive rather sensitively anystimuli that negatively impacts upon theirhealth. Experts agree that there are anumber of factors that affect humanhealth; the public, however, keepscritically commenting upon the very healthcare system. Other factors (such as diet,lifestyles or environment) are much lessfrequently subject of health-relateddiscussions. As a natural explanation, thefact may be incurred that as a rule peoplebecome aware of the value of health onlywhen they themselves or their relatives
1 Numerous discussions go on, in particular among soclives of individuals and the society. The subjective feelcomprising numerous variables of which not all necessasurveys themselves that confirm that negative assessmthe real situation in economy or society (e.g., assessme
Box 1.1Domestic vs. Foreign Assessment of Development
The critical assessment of the conditions for humandevelopment by the citizens themselves (Table 1.1) contrastswith the relatively favorable assessment of Slovakia in theinternational comparison of human development. Over longperiods of time, the Slovak Republic has been ranked amongcountries with high levels of human development (see theStatistical annex), and it could have improved its position overthe last several years. How can this discrepancy be explained?
Disregarding the imperfections of various statistical surveys,the reasons for this difference may be sought for above all inthe development of factors that act on the satisfaction ofhuman beings. Probably more than with macroeconomicfigures, subjective satisfaction of an individual with his/her lifeis linked with income and expenditures of the household, withthe purchasing power, satisfaction with employment, healthcare upon sickness, housing quality, fairness at authorities, etc.An overall view of the development of these parameterssuggests stagnation rather than positive development ofreasons for satisfaction. However, there is a number of more orless unchanging psychological factors that act upon the well-being of Slovakia’s population. They are connected with e.g.unfulfilled hopes concerning societal changes after 1989,disappointment with and lack of understanding of the growth ofdifferences in wealth and income, underdeveloped democracy,as well as with the typical mentality features of the nation suchas egalitarianism, pessimism, dissatisfaction and poorwillingness to bear responsibility for one owns fate (see chapter2.1.1 for details).
iologists, about the extent to which public opinion actually mirrors theing of satisfaction with one’s own life namely represents an „equation“rily reflect the measurable actual status. This may be evidenced by theent of some areas prevail in periods of improvement and worsening ofnt of the financial condition of households).
N a t i o n a l H um an D e v e l o p m e n t R e p o r t S l o v a k R e p ub l i c 2001-2002
H e a l t h – A P r e s s i n g P r i o r i t y 4
need health care. It is but then that they quite logically make a connection between their healthcondition and health services. To a certain extent, this attitude is a heritage of the preceding socialsystem that failed to motivate people to be responsible for their own health. This, nevertheless, does notchange the fact that the health care system is in a real crisis. Slovakia has successfully coped with amajority of the transition steps leading towards a functioning market economy, while there still remaindistortions from the preceding period in the field of public health.
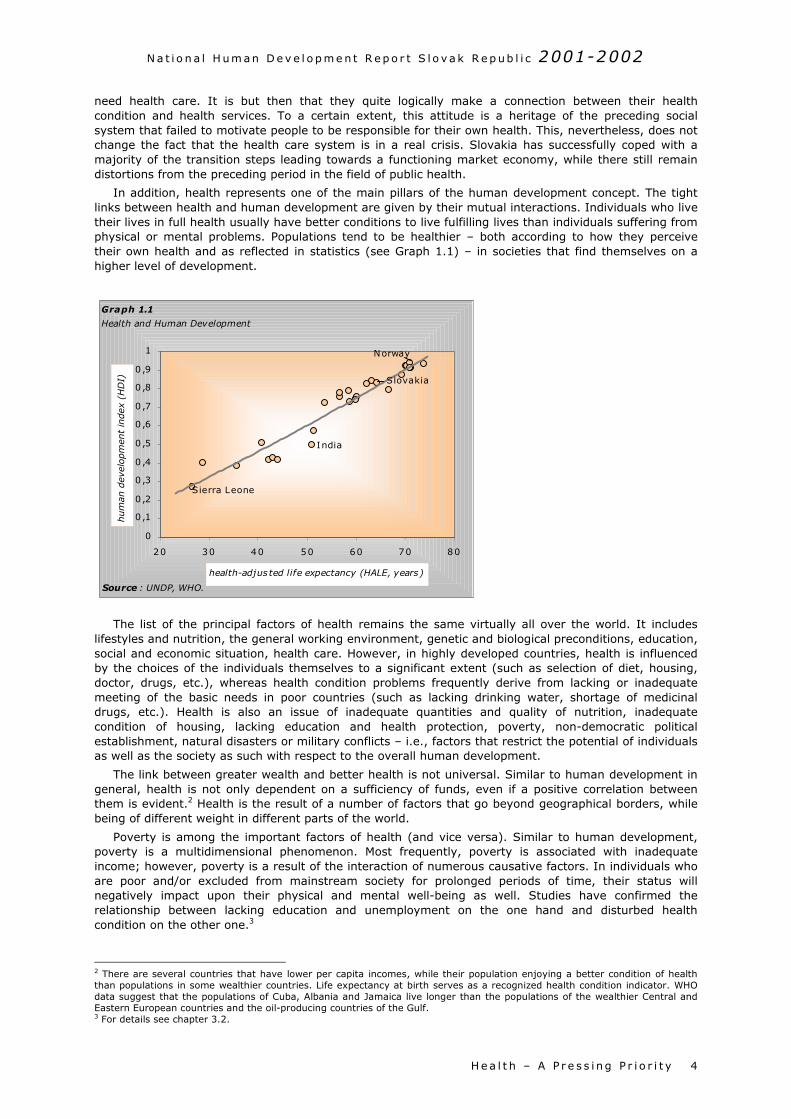
In addition, health represents one of the main pillars of the human development concept. The tightlinks between health and human development are given by their mutual interactions. Individuals who livetheir lives in full health usually have better conditions to live fulfilling lives than individuals suffering fromphysical or mental problems. Populations tend to be healthier – both according to how they perceivetheir own health and as reflected in statistics (see Graph 1.1) – in societies that find themselves on ahigher level of development.
The list of the principal factors of health remains the same virtually all over the world. It includeslifestyles and nutrition, the general working environment, genetic and biological preconditions, education,social and economic situation, health care. However, in highly developed countries, health is influencedby the choices of the individuals themselves to a significant extent (such as selection of diet, housing,doctor, drugs, etc.), whereas health condition problems frequently derive from lacking or inadequatemeeting of the basic needs in poor countries (such as lacking drinking water, shortage of medicinaldrugs, etc.). Health is also an issue of inadequate quantities and quality of nutrition, inadequatecondition of housing, lacking education and health protection, poverty, non-democratic politicalestablishment, natural disasters or military conflicts – i.e., factors that restrict the potential of individualsas well as the society as such with respect to the overall human development.
The link between greater wealth and better health is not universal. Similar to human development ingeneral, health is not only dependent on a sufficiency of funds, even if a positive correlation betweenthem is evident.2 Health is the result of a number of factors that go beyond geographical borders, whilebeing of different weight in different parts of the world.
Poverty is among the important factors of health (and vice versa). Similar to human development,poverty is a multidimensional phenomenon. Most frequently, poverty is associated with inadequateincome; however, poverty is a result of the interaction of numerous causative factors. In individuals whoare poor and/or excluded from mainstream society for prolonged periods of time, their status willnegatively impact upon their physical and mental well-being as well. Studies have confirmed therelationship between lacking education and unemployment on the one hand and disturbed healthcondition on the other one.3
2 There are several countries that have lower per capita incomes, while their population enjoying a better condition of healththan populations in some wealthier countries. Life expectancy at birth serves as a recognized health condition indicator. WHOdata suggest that the populations of Cuba, Albania and Jamaica live longer than the populations of the wealthier Central andEastern European countries and the oil-producing countries of the Gulf.3 For details see chapter 3.2.
Graph 1.1
Health and Human Development
0
0,1
0 ,2
0 ,3
0 ,4
0 ,5
0 ,6
0 ,7
0 ,8
0 ,9
1
20 30 40 50 60 70 80
health-adjus ted life expectancy (HALE, years)
hum
an d
evel
opm
ent
index
(H
DI)
Sierra Leone
Norway
Slovakia
India
Source : UNDP, WHO.
N a t i o n a l H um an D e v e l o p m e n t R e p o r t S l o v a k R e p ub l i c 2001-2002
H e a l t h – A P r e s s i n g P r i o r i t y5
Various shapes and consequences of poverty were the focus of the preceding Slovak HumanDevelopment Report. The authors concluded that:
Poverty means a condition when material, social or cultural resources of an individual get restrictedto the extent that he/she gets excluded from the minimally accepted standard of life. The officiallanguage in Slovakia does not include the term poverty and there is yet no integrated strategyaddressing poverty and social exclusion.
At present, exclusion from the labor market and low levels of education may be considered the mostimportant drivers of poverty. The groups at the highest risk include long-term unemployed who alsohave highest shares among recipients of social assistance benefits. The elderly, children, single-headed families and families with multiple children are among the groups traditionally at risk ofpoverty. Due to lower average earnings andpensions, women are more susceptible topoverty than men.
All the characteristics mentioned, above all,low level of education and the long-termunemployment peak with respect to theRoma population whose significant portionlive in extreme poverty. The culture ofpoverty is emerging in the most backwardRoma colonies. The parameters of humandevelopment identified for the isolatedRoma settlements are comparable to thosefor developing countries – bad healthcondition, short life expectancy, inadequatehousing and hygiene, illiteracy, and hunger.
There is no panacea to eliminate poverty.Dealing with poverty requires eliminatingthe reasons resulting in the rise and spreadof poverty, as well as a functional socialsafety net available to groups of populationat risk. Finding a solution to unemploymentand greater emphasis on education remainsa priority.
It may be stated that poverty is a consequencehuman development is based on equality irresppreceding National Report analyzed human developof life of both men and women is determined not onauthors stated:
The position of women and men in the famreflection of the development of mutual relaenvironment. The stereotypical perception of mfamily” and of woman as being the “mother andperception of the male and female roles crossin
In Slovakia, inequality is most strongly reflecteareas such as politics and in business. In view the participation of women in the executive and
The weaker position of women in the labor mpredominance of women in lower job positionsearn three quarters of what men earn, and thabout thirty percent. On the other hand, womhousehold. In this way, many women become f
Democratization of the family and education in other gender represent a precondition for a soothers as a standard arrangement of life, aelimination of all forms of discrimination – all and for strengthening the principles of a fair schurches, play important roles in this respect.
The gender dimension and the phenomenon ofReport dealt with the feminization of poverty as
Box 1.2What is Human Development?
Human development can be characterized as anenlargement and deepening of people’s opportunities tolive healthy, long and creative lives. Factors such asfavorable political climate, democracy, political freedom,adherence to and enforcement of rights, developedinformal rules, stable economy, a functioning and openeducation system, development of science and research,good quality health care services, a targeted socialsystem, environmental protection, tolerance, respect,etc. contribute to human development. Certainly, thesefacts alone do not guarantee satisfaction and well-beingto individuals. They nevertheless represent the basicand inevitable precondition for the creation of afavorable environment for people that will enable themto further develop these choices according to theirneeds. Human development thus means more thansimply being healthy, educated or adequately wealthy;it also includes the ability of people to take advantage ofthese opportunities in their daily lives, be it in thefamily, at the workplace or during their leisure time. Thefeeling of a meaningful and happy life thus arises as acombination of the favorable action of the externalenvironment on the development of human choices andof the ability of people to develop these choicesaccording to their needs and interests.
of inadequate human development. The concept ofective of gender, age, nationality, and race. Thement in Slovakia through gender equality. The qualityly by different biological but also social structure. The
ily, at the workplace, and in society represents ationships and their arrangements within the givenan as being the “breadwinner and protector of the the housewife” has been the result of the traditional
g almost all geographical and cultural borders.
d in lower participation of women in decision-makingof comparable levels of education and qualifications, legislative branches is low.
arket is evidenced by lower average earnings and a and less remunerated jobs. On the average, womeneir share on managerial and controlling positions isen have a significant share on unpaid work in the
inancially dependent on men.
the spirit of equality of genders and of respect to theciety that is fair in respect of genders. Tolerance ofccepting the rights to choose one’s own lifestyle,these are preconditions for equality of opportunitiesociety. The family and state, schools, the media and
poverty are interconnected. The preceding National a result of lower economic power of the female
N a t i o n a l H um an D e v e l o p m e n t R e p o r t S l o v a k R e p ub l i c 2001-2002
H e a l t h – A P r e s s i n g P r i o r i t y 6
population. Feminization of poverty is closely linked with feminization of old age and/or is a resultthereof. The demographic development namely heads towards growing shares of women on the olderpopulation. Higher mortality of middle age men causes Slovak women to live eight years more onaverage than men. Taking into account the aforementioned facts, smaller income of women, theirprevalence of unpaid work, as well as deep-rooted stereotypes, intensification of the feminization ofpoverty may be expected.
The different life expectancies of females and males are not only due to biological preconditions butalso to other health-related factors such as lifestyle, smoking, and nutrition. A comparison withdeveloped countries suggests that the health condition of Slovakia’s population, in particular of its maleportion, is inadequate. High death rates of cardiovascular and malignant diseases suggest that attentionpaid to the prevention of risk factors (such as high blood pressure, smoking, alcohol consumption andobesity) is insufficient. However, health is not only the result of the action of numerous phenomena, butalso the cause of their emergence. The population’s poor health increases the costs of health care, raisesopportunity costs, and lowers the potential and productivity of the economy.
The structure of this publication differs from the preceding editions of the National Report. The cross-sectoral character was replaced by a monothematic focus of the report, in which the authors deal indetail with one key area of human development. Human health is the central theme of this NationalReport, in particular of chapters 3 and 4. Chapter 2 outlines recent developments in the society, namelypolitics, the economy, and the labor market and education field, i.e., areas that have an importantimpact on the formation of human development conditions.
Chapter 3 analyzes the health status of the population, the links between health and otherdimensions of life, while special attention is devoted to different determinants of health, including healthcare services. Chapter 4 presents a vision of health for Slovakia; it includes proposals for measures thatshould strengthen health prevention, improve health care provision and eventually lead to improvementsin public health. The National Report aims to raise public awareness about the main drivers of health andcontribute to the discussion about prospects of improvements.
N a t i o n a l H um an D e v e l o p m e n t Re p o r t S l o v a k R ep ub l i c 2001-2002
P o l i t i c a l C o n t e x t o f H um an De v e l o p m e n t7
2. The State of Human Development
2 .1 POLITICAL CONTEXT OF HUMAN DEVELOPMENT
The last National Report concluded in its analysis of the political situation that “Slovakia needs a socialconsensus of the relevant political stakeholders with respect to reforms that are necessary”. Nosignificant step forward can be expected in the treatment of acute social problems or a successfulcatching up with what has been missed in the process of the Euro-Atlantic integration unless the relevantstakeholders agree upon the basic parameters of the foreign policy orientation, of the constitutionalframework and economic directions. Without such a consensus, it will be difficult to prevent furthermarginalization of the country and to generate resources for a development of the quality of life.4
Looking at the situation after a lapse of two years, it may be stated that the unavoidable consensuscould have been achieved during the second half of the existence of the broad ruling coalition, despite ademanding agenda and intricate methods of coalition negotiations.5 Since the very beginning, thecoalition had been burdened by problems of fragmentation both within and between political parties.Compared with the preceding term, a positive shift was achieved in foreign policy orientation. As a result,Slovakia successfully caught up with its Central European neighbors in the Euro-Atlantic integration.
2.1.1 Democratization and Its Attitude-related Dimension
Data on the social and political climate have confirmed something that the media started referring to(following the Czech model) as “dull moods.” According to surveys undertaken in 2001, a majority of thepublic (66 percent) evaluated the government as unsuccessful, considered successful by only 8 percent.6
A comparison of public opinions on the outcomes of the government policies points to a pronounceddiscrepancy between the achievements of the government and public perception. In addition, foreignobservers have repeatedly pointed out that the subjective perceptions of the country’s situation issubstantially more pessimistic than the real reasons that may justify them.
Principally, the balance of the government’s achievements is more positive than negative. Thestrengths include Slovakia’s membership to OECD; stabilization of the economy, ongoing restructuringand privatization of banks, improvement of investment rating, partial privatization of politically motivatedcases by the preceding government. Experts and the public agree on the country’s foreign policy outlook.The following have been stated as the most significant achievements: Slovakia has succeeded in catchingup with its neighbors in the number of chapters completed with respect to EU integration, and thecountry is among the leading candidates for further NATO enlargement. On the domestic scene,constitutional amendments also represent success since they were a precondition for progress inintegration processes. These amendments also introduced the institution of ombudsman; as a matter offact, implemented public administration reform also represents an important step towardsdecentralization of state power. Reforms that represent a precondition for a more efficient spending ofpublic funds could not be pushed through: in particular, reforms of the pension system, health care andeducation could not be launched.
Based on the surveys of attitudes and value orientation, it may be stated that “democratic politicalculture is slow in becoming anchored in the Slovak society, although a positive trend may be traced fromthe long-term prospective”.7 It is important to point out attitudes on issues that are at the center of theso-called new policies that characterize the post-modern stage of developed western countries indicate aprevalence of liberal orientation over the traditionally conservative one. This disturbs one of thestereotypes characterizing Slovakia as a conservative, Catholic country, while providing evidence for apronounced shift towards Europeanization.
According to the authors of a report on political opinions and values of people in Slovakia8,paternalism has been represented by 63 percent and egalitarianism by 55.8 percent in Slovakia. Thisdimension of attitudes may be assessed as being the toughest problem for Slovakia by comparing withother countries. For example, data on the proportions of the etatistic attitude, measured as a lowreadiness of individuals to assume responsibility for one’s own fate suggest that only 14 percent ofSlovakia’s population are willing to assume such responsibility, whereas the corresponding figures for the
4 Source: National Human Development Report Slovak Republic 2000, p. 16.5 Coalition formed by SDK, SDĽ, SMK, SOP (1998 – 2002). For abbreviations see p. iv.6 Survey conducted by MVK within 9-15 October 2001.7 Source: Gyarfášová – Krivý – Velšic (2001).8 Ditto.
N a t i o n a l H um an D e v e l o p m e n t Re p o r t S l o v a k R ep ub l i c 2001-2002
P o l i t i c a l C o n t e x t o f H um an De v e l o p m e n t 8
Czech Republic and Slovenia are 23 percent and 24 percent respectively; on the other hand, Hungaryand Croatia show even lower proportions (12 percent and 11 percent, respectively). The countriesmentioned show a similar distribution concerning negative assessment of preceding authoritarianestablishments; the highest figures were established for the Czech Republic (33 percent) and Poland (29percent), whereas they were only 13 percent for Slovakia, and even less for Hungary (10 percent). Inaddition, Slovakia shows the smallest support for “private ownership” (23 percent), the correspondingfigures for Slovenia, Hungary, Poland and the Czech Republic being 49 percent, 40 percent, 31 percent,and 38 percent, respectively (for comparison, these figures are as high as 74 percent and 61 percent forthe US and Germany, respectively). With respect to this attitude, it may be assumed that the historicalreasons for such weak support of private ownership in Slovakia have been strengthened by experienceswith the consequences of the privatization and the so-called “domestic layer of entrepreneurs”.
The distribution of democratic attitudes is as follows: those who prefer dictatorship over democracy,so-called “hard anti-democrats” have the strongest representation in Slovakia – 15 percent, and thelowest in Poland – 10 percent, with Hungary, the Czech Republic, Spain and Italy (1985 data) are inbetween with 12 percent, 13 percent, 10, and 13 percent respectively. “Convinced democrats” preferringdemocracy and believing in its ability to resolve problems of the country are represented by 46 percentin Slovakia, and by 47 percent, 47 percent, 48 percent, 74 percent in the Czech Republic and Hungary,Poland, and Austria, respectively. “Worried democrats” subscribe to democratic values but doubt aboutthe ability of democracy to resolve problems. Slovakia and the Czech Republic have the samerepresentations of this layer – 18 percent, there are represented in 14 percent and 25 percent in Polandand Hungary, respectively. It is interesting to compare the diffuse support of democracy in CEE regionwith that identified within a comparable period of time in other post-authoritarian countries. Data for theCzech Republic, Slovakia and Poland are similar to those identified for Spain in 1989. Comparing with thefragility of the support of democracy as a form of government in Russia or Brazil, the process ofdemocratic attitudes becoming anchored in the Visegrad 4 countries is considered remarkablyprogressive.9
Overall, it may be concluded with respect of the support of democratic establishment that despitesome differences, there are no more reasons to mark Slovakia as deviant within the eastern-centralEuropean group of countries in transition, as has been suggested by developments after the 1994elections. At present, Slovakia is at the same level as the Czech Republic, Hungary, and Poland as far asthe proportions of so-called „convinced democrats“ as well as „worried democrats“ are concerned.
One basic finding of empirical surveys of attitudes and values of Slovakia’s population suggests thatthe cultural and political splitting line is represented by “political liberalism versus authoritarianism”.Taken together with the identified ethnic splitting, this allows characterizing the Slovak society as ratherheterogeneous. According to sociological analyses, this manifests itself as a strong participation of the“anti-Communist liberals and conservatives” block (together 42 percent) and anti-liberal nationalists andcommunists (together 32 percent).10
2.1.2 What is the Real Impact of People’s Attitudes upon the Country’s Politics?
It is key to the politics of the country which of the segments of the society that principally shows anormal differentiation of attitudes, participates in the elections and partisans of which prefer to stayhome. The urban-rural split of cultural and political orientations and links to political parties createparameters for decision-making by political élites. In other words, it depends on which of the rivalingpolitical élites are able to more efficiently mobilize supporters. If the disgusted voters from large citiesremain home on election day, they would leave the decision on the further orientation of the country andthus on their own fate to those who rather naturally, by the time and the contents of their socializationstatistically belong to mostly the losers of the post-November 1989 change: the older generation,pensioners, people with lower education level, Roma, population of smaller villages?
Citizens taking up the role of voters are not at all powerless. Even to the contrary, at the time ofelections, they get the opportunity to decisively influence development in the country. It is up to themwhether the future coalition will be comprised of numerous small parties or based on the experience ofthe broad coalition (1998-2002); they will support parties that have a chance to win a larger share inparliament. The government coalition of 1998-2002 has been blamed for failures that resulted not onlyfrom its broad range but also from weak internal cohesion and insufficient crystallization of theirprograms.
Despite the important role to be played by the decision of the electorate, it may be assumed that itwill be negotiations of party leaders that will decide whether the political shift after the 2002 elections
9 Source: Fuchs – Klingemann (2000).10 Source: Gyarfášová – Krivý – Velšic (2001).
N a t i o n a l H um an D e v e l o p m e n t Re p o r t S l o v a k R ep ub l i c 2001-2002
P o l i t i c a l C o n t e x t o f H um an De v e l o p m e n t9
will mean a shift from cultural and political split typical of Slovakia in the 1990s (political liberalismversus authoritarianism borderline) towards a socio-economic left-right division..
2.1.3 From Broad Left-Right Coalition Towards a Coalition of Parties with SimilarPolicies
The political necessity to establish a broad left-right coalition that made a significant contributiontowards political and economic stabilization of Slovakia brought in at the same time also a rathercomplicated situation with respect to the need to regulate and to implement reforms of the public health,education and the whole social security system, in particular of the launching of the pension reform andpublic service reform. Without them, the systemic change in Slovakia cannot be considered ascompleted. It was in these issues that discrepancies between the parties of the right center – SDKÚ,SMK, KDH – and the leftist parties SDĽ and SOP came to the foreground. Especially, it was difficult toachieve a uniform approach at the parliamentary coalition level that not only jeopardized the fulfillmentof the Government Program but also stability of the government.
In connection with the need to implement the reforms mentioned, the requirement of the formationof a functional coalition of clearly reform-oriented parties therefore arises with a particular edge. One ofthe findings of a comparative survey of preconditions for democratic governance in CEEs was whetherparties that are close to each other from their policy aspect are able to create stable coalitions.11 Thequality of democratic governance, however, gets jeopardized if the parties – and in the case of Slovakiathis concerns the right centrist parties – lack this ability.
Despite the pre-election uncertainties and domestic and foreign political leaders calling the 2002elections as the most critical for the Slovak Republic, it was evident from the academic bird’s-eye view,even prior to the elections, that they will be about efficiency of democracy rather than about itssurvival.12 Today, it may be stated that these most recent free elections were no more critical in thesame sense than all the preceding ones. It currently (October 2002) may be stated with a much highercertainty than a year ago that the political conditions have been established for the “continuity ofchange” that, after the 1998 elections, meant bringing Slovakia back to the path of a stable democraticdevelopment. The outcome of the 2002 elections enabled a continuity of the rule of reform forces fromthe preceding wide coalition, marginalization and elimination of the extreme nationalist forces from theparliament, and thus arriving at a wide consensus of the relevant political élites.
When comparing the formulated hypotheses, assumptions or fears voiced towards the end of 2001with what actually happened, it may be stated that the leaders of the right-wing center had not failedand showed the potential to negotiate and to make compromises to arrive at a consensus. Theexperiences from the acting within a wide coalition led them to a consensual style of politics.
2.1.4 Outcome of the 2002 Parliamentary Elections and Their Consequences
Compared to the preceding elections, the elections that took place on September 20th and 21st, 2002were characterized by lower participation (70.1 percent) and a high drop of the vote (18.2 percent) thatbecame redistributed to the more successful parties. As compared to the neighboring countries, even thisparticipation that has been historically the lowest one in Slovakia, was still significantly higher than thatin the Czech Republic (58 percent), Poland (46 percent), and almost identical with that in Hungary. Atotal of twenty-five political entities took part in the elections, seven of them getting to the parliament:HZDS, SDKÚ, SMER, SMK, KDH, ANO and KSS. SDĽ, SOP, SNS and PSNS (that during the precedingterm had their independent caucuses), and DS, SZS and SDSS (whose representatives were electedmembers of the National Council of the Slovak Republic in 1998, on the list of candidates of SDK) losttheir representation in parliament. HZDS won the most votes; compared to the preceding election, thisparty witnessed a pronounced drop of its electorate, from the initial 1,148,625 votes in 1992 to 560,691in 2002. This confirms the expected trend of the gradual weakening of this originally large party.
The combination of the participation in the election and the high percentages of the flopped votemeans that as little as 56.6 percent of the total numbers of eligible voters became reflected in themandates.13 A comparison with the preceding four elections since 1990 suggests that, even if theparliamentary representation is at the lowest level, the fact that several small parties dropped outsignificantly reduces the considerable fragmentation of the party structure of the Slovak parliament, thuscreating more favorable conditions for the government coalition. And this even in the face of the fact thatthis new coalition of the four center right-wing parties (SDKÚ, SMK, KDH, ANO) only enjoys the support
11 Source: Kitchelt (1999).12 Source: Szomolányi (2002).13 Source: Krivý (2002).
N a t i o n a l H um an D e v e l o p m e n t Re p o r t S l o v a k R ep ub l i c 2001-2002
P o l i t i c a l C o n t e x t o f H um an De v e l o p m e n t 10
of 78 mandates, which corresponds to the support by 29.4 percent of the adult electors. The oppositionparties (HZDS, SMER and KSS) enjoy the overall support of 27.17 percent of the vote, which was enoughfor 72 mandates.
The coalition that was set up represents an even more programmatically homogenous and pro-reformoriented composition than assumed by the pre-election analyses. The fact that a majority governmentcould be established from as few as four parties of the center right wing without the programmaticallyamorphous SMER has been a result of the (hardly foreseeable) coincidence of several circumstances thatcould have been forecasted, such as the failure of the center left wing and national parties (SDĽ, SDA,SOP, SNS, PSNS), the shares of the lost votes however were difficult to forecast. It should at the sametime be stressed that the failure of the aforementioned parties is mainly the consequence of intra-partyrelationships that became the reason for splitting of the original parent parties.
The outcome of the elections has not indicated any pronounced shift of the population’s attitudes. Theinitially significant differences in the participation between rural areas and big cities was reduced. SDKÚis most pronouncedly an “urban” party; it won 7-8 percent of the vote in smaller municipalities, as manyas 33 percent in large cities. HZDS remains the strongest opposition party, with its strongest support stillcoming from municipalities with a population of up to 5,000 inhabitants.14 This shifts Slovakia from thepost-Communist formula of election behaviors of insufficiently modernized countries towards a standardsocio-economic model of election behavior and/or a model of political participation that assumes growingparticipation with growing education and income levels.
The KSS party’s success was unanticipated. The yield of 6.3 percent of the vote does not constituteany dramatic change in the attitudes of the population, in particular if taking into account the fact thatfor the first time it was the national parties that did not get to the parliament. KSS gained a portion ofthe votes of the original electorate of SDĽ, SOP and HZDS, especially in the Eastern Slovakian districtswith high unemployment rates. The correlation with high unemployment rates was also typical of thesuccess communists had in the Czech Republic. When leaving this most pressing socio-economic problemof Slovakia unresolved, KSS support may grow; this time not because of any nostalgia but as amanifestation of radicalism in the affected regions. Paradoxically, however, the success of KSS is part ofa more general shift at the level of the party contest from “national issues” towards socio-economictopics, which per se can be considered as a rather positive shift. It allows attention to be focused on thetreatment of structural problems in the society that represent a precondition for improvement in thequality of life.
The failure of the two national parties, the original SNS and the spin-off PSNS suggests that the“Hungarian card” no more appeals to the electorate. After four years of participation in the firstDzurinda’s government (1998-2002), SMK, a stable element of the coalition government, also acquiredelectors of Slovak nationality. This contributed to SMK’s success in these elections (11.16 percent), whichmeans that this party ranks second, after SDKÚ, as far as the strength of the government coalitionparties is concerned. The dominance of the ethnic principle in the case of the election-related decision-making by the Hungarian minority contributed to draining of a non-negligible portion of socio-economically frustrated electors from the expected subscription to what today are opposition parties.
2.1.5 Government, Parliament, and Relationship between Coalition and Opposition
The Program Declaration of the second Dzurinda coalition government (comprised of SDKÚ, SMK,KDH and ANO) suggests continuity of policy. The new government intends to aggressively pursuereforms for which there was no political will in the preceding coalition with the leftist entities SDĽ andSOP. Postponing reforms in the area of pension and social system, public health and education sectorwas the price paid for maintaining the stability of the previous coalition government. The most significanttasks faced by the second Dzurinda’s government include reduction of unemployment and corruption,improvement of law enforcement, improvement of conditions of life of the Roma. The EuropeanCommission critically pointed out these problems.
The course and the results of the first post-election session of the parliament indicate a significantshift from confrontation to consensual style. This is evidenced by the fact that parliament leaders werealso elected by a significant vote of opposition MPs. The opposition gained one position of the Vice-chairman (HZDS) in the parliament’s presidium (out of four). Proportionate distribution was consistentlyfollowed with respect to filling chair positions of various commissions (9:8 for the coalition vs.opposition).
During the first Dzurinda’s government, the coalition at the parliamentary level represented a muchless stable element despite the initial constitutional majority (93 MPs). The current parliamentarycoalition of 78 MPs, although quantitatively weaker, makes the functioning of the government coalition
14 Ditto.
N a t i o n a l H um an D e v e l o p m e n t Re p o r t S l o v a k R ep ub l i c 2001-2002
P o l i t i c a l C o n t e x t o f H um an De v e l o p m e n t11
likely since there are no election coalitions and various blocks of small parties in the parliament. A moreclear-cut program profile and the previous governing and cooperation experiences are a goodprerequisite for the stability of the caucuses of SDKÚ, SMK and KDH. ANO is a new party without anypreceding parliamentary experiences, and its stability will thus be proved by the parliament.
Whereas the government coalition is comprised of right-centrist parties with related programs, even ifwith different proportions of economic liberalism and social conservatism, the three opposition partiesrepresent a rather heterogeneous blend, from the extreme left of the KSS to the amorphous SMERintending to take the left-centrist position and the people’s party HZDS. The actual orientation of HZDSwill be suggested by the voting on laws that are necessary for the reforms pursued by the government.Statements by HZDS representatives have so far suggested HZDS has learnt lessons from the precedingperiod, and, therefore, will be a more constructive opposition.
2.1.6 The Risk of Great Expectations
In Slovakia, there is widespread belief that the government is responsible for the economic standardof individuals. The political culture changes slowly, but the ideas on what the government can beexpected to do can be changed to make them more realistic. This applies in the face of the growingproportions of people with personal experiences with the private sector. This would require less populistmedia that would point to the limits of government action as well as to the significance and roles ofadditional stakeholders with respect to the success of reforms. This specifically concerns a variety ofinterest groupings and clients. Experience from the preceding election term points to the risks of big andnon-realistic expectations. They may result in frustrations. It is the unmet expectations rather thanworsening economic conditions as such that usually represent the source of extremism, as suggested bythe history of many European countries. That is why it is both up to the government and the media toavoid excessive public expectations. Room still exists for experts to educate and cultivate the public.
The scheduled cuts in the budget, increased energy and transport prices, payments for hospital staysand medicine will non-negligibly impact upon the budgets of households. Consequently, theimplementation of necessary reforms may also prompt protests on the part of trade unionists whoprobably will seek support in the opposition. With its ambitions to represent the left wing, SMER willlikely replace the former ally of the Trade Unions, SDĽ. Hesitating with reforms, even if facing the risk ofsocial protest, might have even more severe implications for political stability.
In addition, the changing perception of Slovakia by foreign investors represents an importantindicator of ongoing political stabilization; as a result, the currency has become over-valued compared tothe real status of the economy. The Slovak currency is no more perceived as being connected withpolitical risk as it used to be during the time of the pre-election uncertainty.15
Trust in the Slovak currency will further rise due to the expected invitation to the NATO. Slovakia maybe invited at the November NATO Summit to join the Alliance, and to gain full-fledged membershipwithin several months. After joining the OECD, this will represent another foreign-political manifestationof significant strengthening of Slovakia’s political stability and also a precondition for EU accession.
2.1.7 Slovakia and the EU
Slovakia started negotiations with the EU two years later than its neighboring countries and hardlyanybody expected it to catch up with them after the switch of the governing elite. The completion of thelong-term process of approaching the EU at the December 2002 Copenhagen Summit was generallyperceived as a clear success for Slovak foreign policy.
The evaluation report by the European Commission from October 2002 states that Slovakia meets thepolitical and economic criteria of EU membership. The report also lists a number of shortcomings; itviews corruption as “seriously worrying”, points to the complex position of the Roma minority, andexpresses concern about the professional impartiality and political independence of the judicial system.These problems are also among the priorities of the presented government Program Declaration.
The Dzurinda’s first government managed to eliminate doubts about the political stability of Slovakia,and this resulted in rather specific technical issues of the accession process to replace the question of“whether and when” Slovakia will join the EU. The stated absence of a wide discussion on the EU at boththe level of the political élites and the public is a natural consequence of the previous problems thatSlovakia had first to manage. Slovakia’s population favors joining the EU much stronger (77.3 percent inOctober 2002) than is the case in the Czech Republic or Poland. Evidently, strong support reflects thedesirable target rather than thorough information on the specific implications of membership.
15 Source: Brondošová (2002).
N a t i o n a l H um an D e v e l o p m e n t Re p o r t S l o v a k R ep ub l i c 2001-2002
P o l i t i c a l C o n t e x t o f H um an De v e l o p m e n t 12
The outcome of the 2002 elections and the confirmation of the integration-related willingness openedup room for European integration, becoming the topics of the political and public discussions.
External pressure and requirements on the part of Brussels make Slovakia develop more expediently;during the first stage, however, this process of modernization intensifies the divergence between therelatively developed centers and less developed regions. This also appears to be the source of socio-political strains. EU accession however will offer growing opportunities of drawing sources from structuralfunds to develop historically marginalized regions. And that is why Slovakia has to speed up thecompletion of state and public administration reform as well as fiscal decentralization. Combined with thecapacities of the domestic stakeholders, the external pressure on efficient use of EU resources toeliminate inter-regional differences pushes the society in the direction of the civilization standard.
Slovakia faces a series of events within which the outcome of the first one will show how successfulthe country will be with respect to the subsequent events: 2002 parliamentary elections, the November2002 NATO Summit in Prague, EU enlargement. At the time of the 2002 parliamentary elections,Slovakia was a country different from that it was before the 1998 elections. The realistic view, however,suggests that the elections were similarly critical as were the previous ones. However, voters decided notabout the mere survival of democracy, rather about its efficiency, and about Slovakia’s integration intoEuro-Atlantic structures.
2.1.8 Political Context of Health Care
An unfavorable heritage of the former regime is a generally (especially with regards to the politicalparties) valid belief that the public sector is solely a political issue to be decided upon only based on thepolitical interests of the given party leaving out a serious economic analysis. This does not hold in reality.The public sector also has its economic laws and equations, including provision of health care services.
A straightforward preference of politics to economics is a dominant sign of all up to dategovernments’ approaches to the health care reform issue. It took more than five years for the idea of thedisproportion of the sources and required health care services to appear. This idea is still not respected.Expectations now lie with the functioning of the new cabinet.
It is impossible to make any progress without getting rid of the politicization of the reform, withoutrespecting basic economic rules and rules of health care economy as they are well known in thedeveloped world, without using methods of economic and social analysis, economics and management ofhealth care. In the area of health care services provision both market and state fail as there is significantsocial element incorporated. Consequently, there are no straightforward solutions. There is a dominantneed to react to the changing external and internal conditions.
Health care is expected to be at the same time effective, high quality, and generally accessible for all.These three objectives are not consistent; moreover, they become antagonistic from a certain phase.Therefore, all decisions on the economic aspects of health care are very demanding, and there are nooptimal solutions available.
Quality and consistency of all up to date reform materials and reform steps are a clear evidence ofthe fact that there is no real health/health care policy in the SR. Government program declarations maybe characterized as political proclamations (in their essence repeating themselves regardless theauthors), in many aspects unable to materialize.16
As a rule, preparation of reform documents is entrusted to a group solely or practically exclusivelyrepresented by doctors. However, it is generally known that successful health care reform is incontradiction with the short-term individual interests of doctors.17
The Health Care Minister is the least stable position in the Slovak government. The problem rests inthe fact that each new minister begins anew. This is a rather expensive and perspective lackingapproach.
The capacity of the Ministry in creating an effective and consistent health policy is a problem in and ofitself. Not even developed countries where the central sphere is better equipped intellectually andmaterially, delegate the creation of health care policy solely to the center. Participation of the opposition,interest groups, civic sector and academic population is a rule.
16 Source: Radičová – Woleková – Nemec (1999), Pažitný – Zajac (2001).17 This concerns particularly hospital doctors whose volunteerism must be according to insufficiency of resources (respected byeven the highly developed economies) regulated.
N a t i o n a l H um an D e v e l o p m e n t R e p o r t S l o v a k R e p ub l i c 2001-2002
E c o no m i c D e v e l o p m e n t a nd Th e L ab o r M a r k e t13
2 .2 ECONOMIC DEVELOPMENT AND THE LABOR MARKET
Since 2000 the development of Slovakia’s economy has been characterized by the efforts of thegovernment and the Central bank to stabilize macroeconomic factors in order to gradually bring about arecovery of the economic growth dynamics. As a positive stimulus and confirmation of progress achievedin this area, Slovakia was admitted to the Organisation for Economic Cooperation and Development(OECD) on December 14, 2000. At the end of 2001, based on favorable economic development, Moody'sInvestor Service and Standard & Poor's improved their rating outlook to positive and increased Slovakia’srating, returning it to investment level. However, Slovakia’s economic development still remains brandedby structural problems in foreign trade, public finance sectors, and labor market.
2.2.1 Performance of the Economy
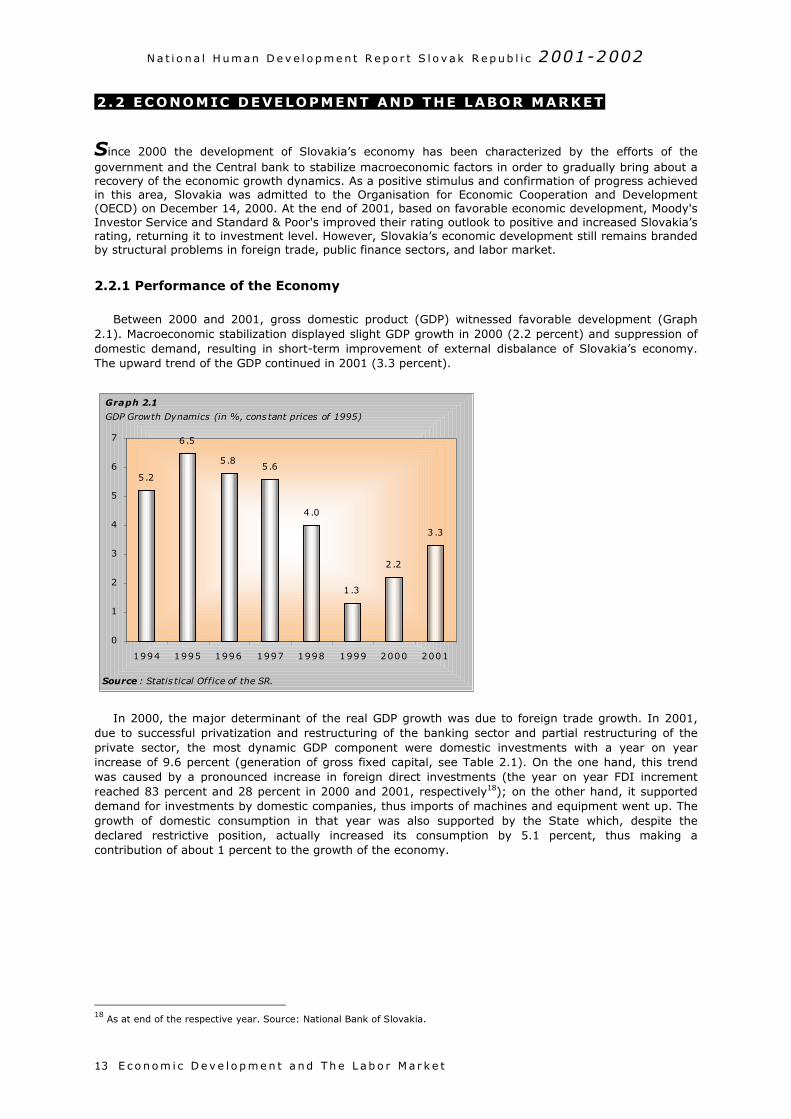
Between 2000 and 2001, gross domestic product (GDP) witnessed favorable development (Graph2.1). Macroeconomic stabilization displayed slight GDP growth in 2000 (2.2 percent) and suppression ofdomestic demand, resulting in short-term improvement of external disbalance of Slovakia’s economy.The upward trend of the GDP continued in 2001 (3.3 percent).
In 2000, the major determinant of the real GDP growth was due to foreign trade growth. In 2001,due to successful privatization and restructuring of the banking sector and partial restructuring of theprivate sector, the most dynamic GDP component were domestic investments with a year on yearincrease of 9.6 percent (generation of gross fixed capital, see Table 2.1). On the one hand, this trendwas caused by a pronounced increase in foreign direct investments (the year on year FDI incrementreached 83 percent and 28 percent in 2000 and 2001, respectively18); on the other hand, it supporteddemand for investments by domestic companies, thus imports of machines and equipment went up. Thegrowth of domestic consumption in that year was also supported by the State which, despite thedeclared restrictive position, actually increased its consumption by 5.1 percent, thus making acontribution of about 1 percent to the growth of the economy.
18 As at end of the respective year. Source: National Bank of Slovakia.
Graph 2.1
GDP Growth Dynamics (in %, cons tant prices of 1995)
3.3
2 .2
1 .3
5 .65 .8
6 .5
5 .2
4 .0
0
1
2
3
4
5
6
7
1994 1995 1996 1997 1998 1999 2000 2001
Source : Statis tical Office of the SR.
N a t i o n a l H um an D e v e l o p m e n t R e p o r t S l o v a k R e p ub l i c 2001-2002
E c o no m i c D e v e l o p m e n t a nd Th e L ab o r M a r k e t 14
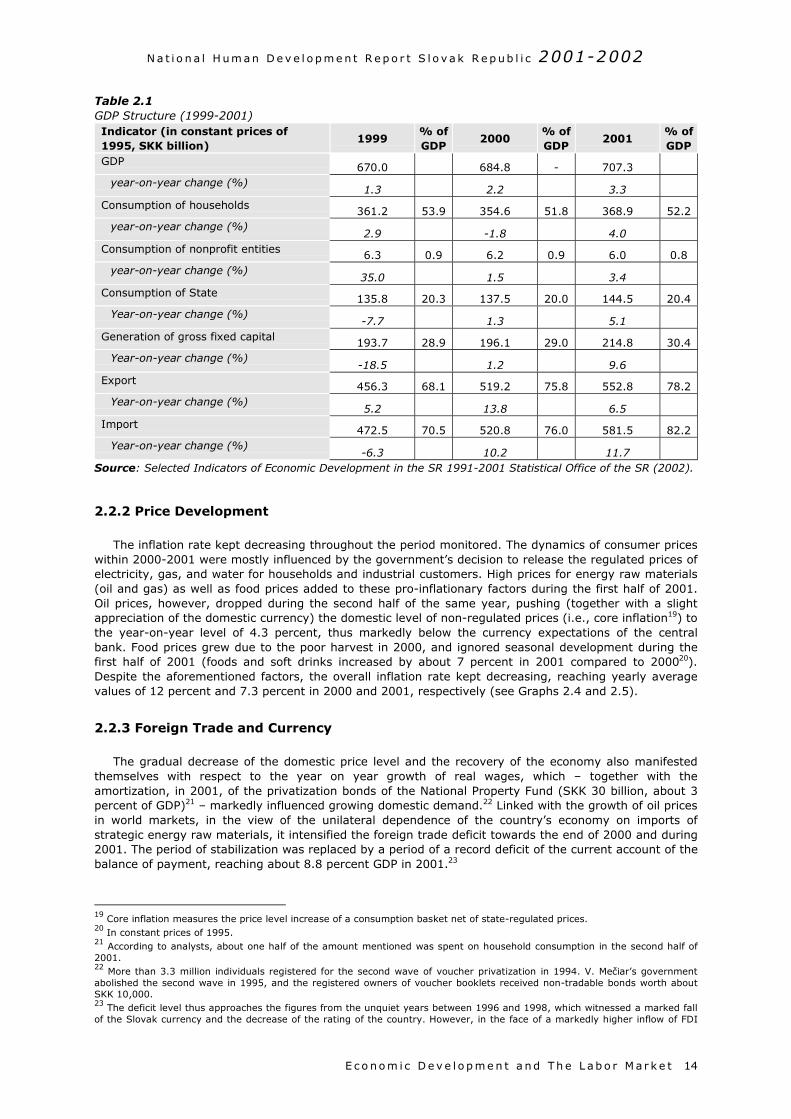
Table 2.1GDP Structure (1999-2001)Indicator (in constant prices of1995, SKK billion)
1999% ofGDP
2000% ofGDP
2001% ofGDP
GDP 670.0 684.8 - 707.3year-on-year change (%)
1.3 2.2 3.3Consumption of households 361.2 53.9 354.6 51.8 368.9 52.2
year-on-year change (%)2.9 -1.8 4.0
Consumption of nonprofit entities 6.3 0.9 6.2 0.9 6.0 0.8year-on-year change (%)
35.0 1.5 3.4Consumption of State 135.8 20.3 137.5 20.0 144.5 20.4
Year-on-year change (%)-7.7 1.3 5.1
Generation of gross fixed capital 193.7 28.9 196.1 29.0 214.8 30.4Year-on-year change (%)
-18.5 1.2 9.6Export 456.3 68.1 519.2 75.8 552.8 78.2
Year-on-year change (%)5.2 13.8 6.5
Import 472.5 70.5 520.8 76.0 581.5 82.2Year-on-year change (%)
-6.3 10.2 11.7Source: Selected Indicators of Economic Development in the SR 1991-2001 Statistical Office of the SR (2002).
2.2.2 Price Development
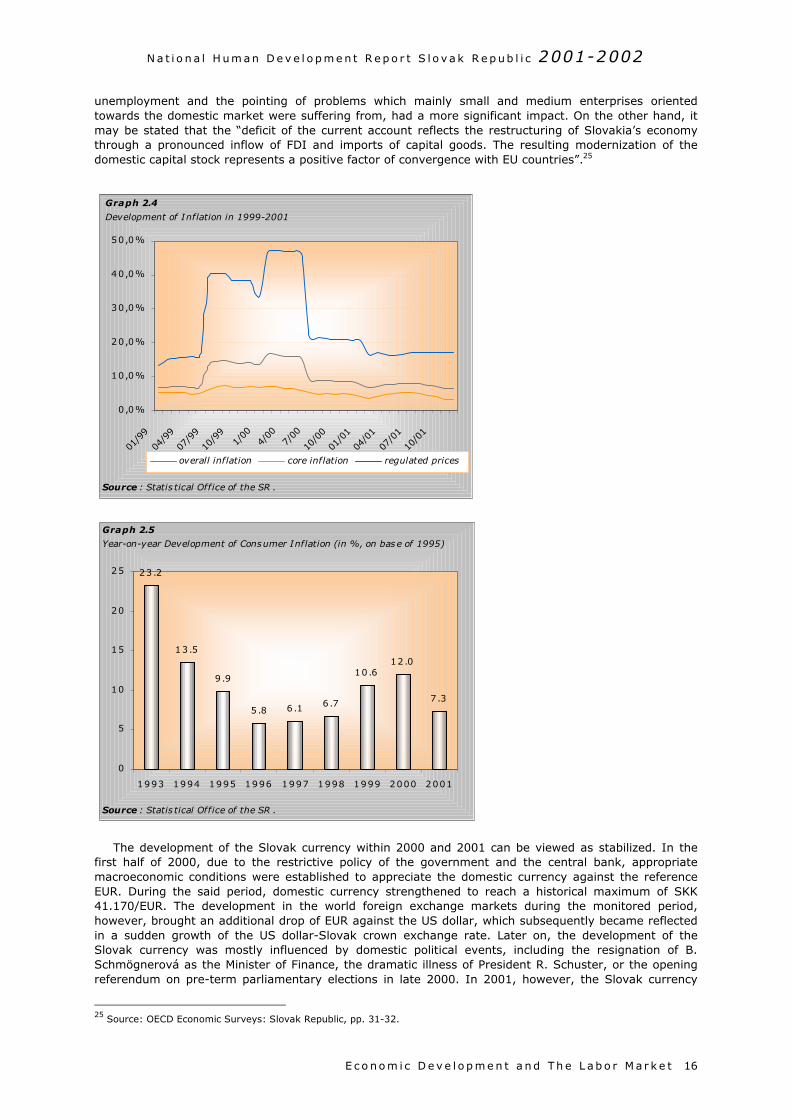
The inflation rate kept decreasing throughout the period monitored. The dynamics of consumer priceswithin 2000-2001 were mostly influenced by the government’s decision to release the regulated prices ofelectricity, gas, and water for households and industrial customers. High prices for energy raw materials(oil and gas) as well as food prices added to these pro-inflationary factors during the first half of 2001.Oil prices, however, dropped during the second half of the same year, pushing (together with a slightappreciation of the domestic currency) the domestic level of non-regulated prices (i.e., core inflation19) tothe year-on-year level of 4.3 percent, thus markedly below the currency expectations of the centralbank. Food prices grew due to the poor harvest in 2000, and ignored seasonal development during thefirst half of 2001 (foods and soft drinks increased by about 7 percent in 2001 compared to 200020).Despite the aforementioned factors, the overall inflation rate kept decreasing, reaching yearly averagevalues of 12 percent and 7.3 percent in 2000 and 2001, respectively (see Graphs 2.4 and 2.5).
2.2.3 Foreign Trade and Currency
The gradual decrease of the domestic price level and the recovery of the economy also manifestedthemselves with respect to the year on year growth of real wages, which – together with theamortization, in 2001, of the privatization bonds of the National Property Fund (SKK 30 billion, about 3percent of GDP)21 – markedly influenced growing domestic demand.22 Linked with the growth of oil pricesin world markets, in the view of the unilateral dependence of the country’s economy on imports ofstrategic energy raw materials, it intensified the foreign trade deficit towards the end of 2000 and during2001. The period of stabilization was replaced by a period of a record deficit of the current account of thebalance of payment, reaching about 8.8 percent GDP in 2001.23
19 Core inflation measures the price level increase of a consumption basket net of state-regulated prices.20 In constant prices of 1995.21 According to analysts, about one half of the amount mentioned was spent on household consumption in the second half of2001.22 More than 3.3 million individuals registered for the second wave of voucher privatization in 1994. V. Mečiar’s governmentabolished the second wave in 1995, and the registered owners of voucher booklets received non-tradable bonds worth aboutSKK 10,000.23 The deficit level thus approaches the figures from the unquiet years between 1996 and 1998, which witnessed a marked fallof the Slovak currency and the decrease of the rating of the country. However, in the face of a markedly higher inflow of FDI
N a t i o n a l H um an D e v e l o p m e n t R e p o r t S l o v a k R e p ub l i c 2001-2002
1
o
(f2
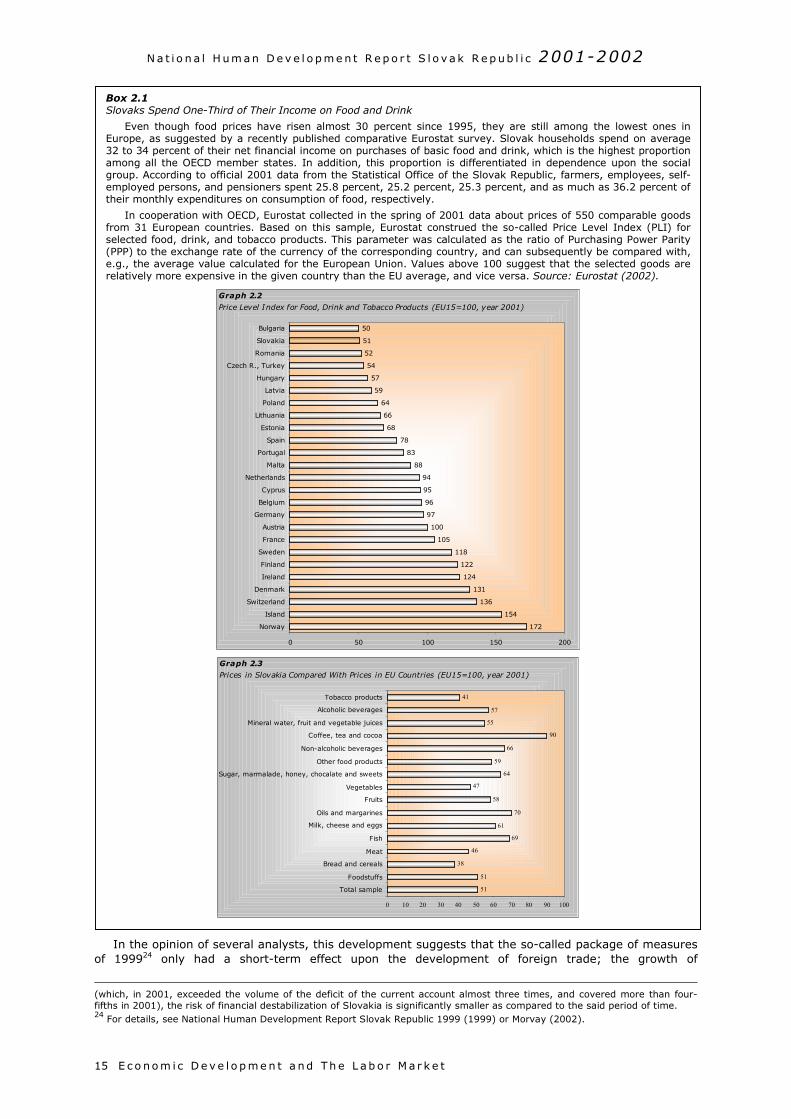
Box 2.1Slovaks Spend One-Third of Their Income on Food and Drink
Even though food prices have risen almost 30 percent since 1995, they are still among the lowest ones inEurope, as suggested by a recently published comparative Eurostat survey. Slovak households spend on average32 to 34 percent of their net financial income on purchases of basic food and drink, which is the highest proportionamong all the OECD member states. In addition, this proportion is differentiated in dependence upon the socialgroup. According to official 2001 data from the Statistical Office of the Slovak Republic, farmers, employees, self-employed persons, and pensioners spent 25.8 percent, 25.2 percent, 25.3 percent, and as much as 36.2 percent oftheir monthly expenditures on consumption of food, respectively.
In cooperation with OECD, Eurostat collected in the spring of 2001 data about prices of 550 comparable goodsfrom 31 European countries. Based on this sample, Eurostat construed the so-called Price Level Index (PLI) forselected food, drink, and tobacco products. This parameter was calculated as the ratio of Purchasing Power Parity(PPP) to the exchange rate of the currency of the corresponding country, and can subsequently be compared with,e.g., the average value calculated for the European Union. Values above 100 suggest that the selected goods arerelatively more expensive in the given country than the EU average, and vice versa. Source: Eurostat (2002).
Graph 2.2
E c o no m i c D e v e l o p m e n t a nd Th e L ab o r M a r k e t5
In the opinion of several analysts, this development suggests that the so-called package of measuresf 199924 only had a short-term effect upon the development of foreign trade; the growth of
which, in 2001, exceeded the volume of the deficit of the current account almost three times, and covered more than four-ifths in 2001), the risk of financial destabilization of Slovakia is significantly smaller as compared to the said period of time.4 For details, see National Human Development Report Slovak Republic 1999 (1999) or Morvay (2002).
172
154
136
131
124
122
118
105
100
97
96
95
94
88
83
78
68
66
64
59
57
54
52
51
50
0 50 100 150 200
Norway
Island
Switzerland
Denmark
Ireland
Finland
Sweden
France
Austria
Germany
Belgium
Cyprus
Netherlands
Malta
Portugal
Spain
Estonia
Lithuania
Poland
Latvia
Hungary
Czech R., Turkey
Romania
Slovakia
Bulgaria
Price Level Index for Food, Drink and Tobacco Products (EU15=100, year 2001)
51
51
38
46
69
61
70
58
47
64
59
66
90
55
57
41
0 10 20 30 40 50 60 70 80 90 100
Total sample
Foodstuffs
Bread and cereals
Meat
Fish
Milk, cheese and eggs
Oils and margarines
Fruits
Vegetables
Sugar, marmalade, honey, chocalate and sweets
Other food products
Non-alcoholic beverages
Coffee, tea and cocoa
Mineral water, fruit and vegetable juices
Alcoholic beverages
Tobacco products
Graph 2.3
Prices in Slovakia Compared With Prices in EU Countries (EU15=100, year 2001)
N a t i o n a l H um an D e v e l o p m e n t R e p o r t S l o v a k R e p ub l i c 2001-2002
E c o no m i c D e v e l o p m e n t a nd Th e L ab o r M a r k e t 16
unemployment and the pointing of problems which mainly small and medium enterprises orientedtowards the domestic market were suffering from, had a more significant impact. On the other hand, itmay be stated that the “deficit of the current account reflects the restructuring of Slovakia’s economythrough a pronounced inflow of FDI and imports of capital goods. The resulting modernization of thedomestic capital stock represents a positive factor of convergence with EU countries”.25
The development of the Slovak currency within 2000 and 2001 can be viewed as stabilized. In thefirst half of 2000, due to the restrictive policy of the government and the central bank, appropriatemacroeconomic conditions were established to appreciate the domestic currency against the referenceEUR. During the said period, domestic currency strengthened to reach a historical maximum of SKK41.170/EUR. The development in the world foreign exchange markets during the monitored period,however, brought an additional drop of EUR against the US dollar, which subsequently became reflectedin a sudden growth of the US dollar-Slovak crown exchange rate. Later on, the development of theSlovak currency was mostly influenced by domestic political events, including the resignation of B.Schmögnerová as the Minister of Finance, the dramatic illness of President R. Schuster, or the openingreferendum on pre-term parliamentary elections in late 2000. In 2001, however, the Slovak currency
25 Source: OECD Economic Surveys: Slovak Republic, pp. 31-32.
Graph 2.4
Development of Inflation in 1999-2001
0,0%
10,0%
20,0%
30,0%
40,0%
50,0%
01/9
9
04/9
9
07/9
9
10/9
91/
004/
007/
00
10/0
0
01/0
1
04/0
1
07/0
1
10/0
1
overall inflation core inflation regulated prices
Source : Statis tical Office of the SR .
7.3
10 .6
6 .76 .15 .8
9 .9
13 .5
23 .2
12 .0
0
5
10
15
20
25
1993 1994 1995 1996 1997 1998 1999 2000 2001
Source : Statis tical Office of the SR .
Graph 2.5
Year-on-year Development of Consumer Inflation (in %, on base of 1995)
N a t i o n a l H um an D e v e l o p m e n t R e p o r t S l o v a k R e p ub l i c 2001-2002
E c o no m i c D e v e l o p m e n t a nd Th e L ab o r M a r k e t17
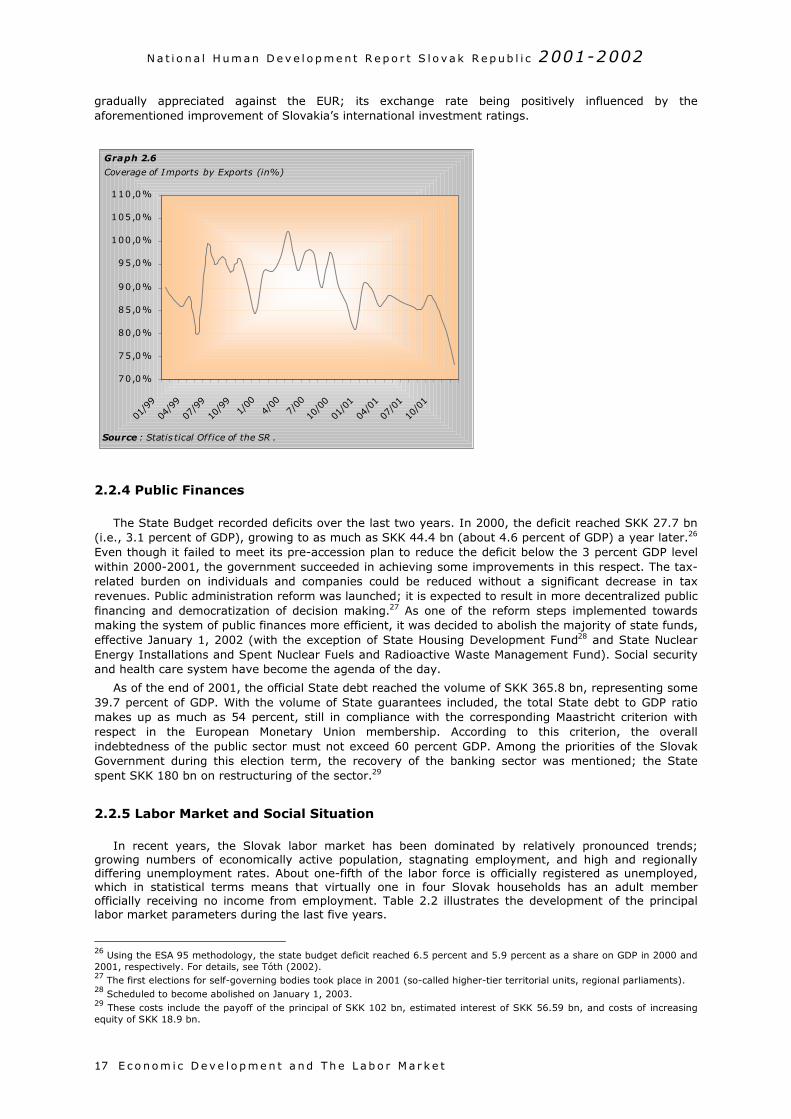
gradually appreciated against the EUR; its exchange rate being positively influenced by theaforementioned improvement of Slovakia’s international investment ratings.
2.2.4 Public Finances
The State Budget recorded deficits over the last two years. In 2000, the deficit reached SKK 27.7 bn(i.e., 3.1 percent of GDP), growing to as much as SKK 44.4 bn (about 4.6 percent of GDP) a year later.26
Even though it failed to meet its pre-accession plan to reduce the deficit below the 3 percent GDP levelwithin 2000-2001, the government succeeded in achieving some improvements in this respect. The tax-related burden on individuals and companies could be reduced without a significant decrease in taxrevenues. Public administration reform was launched; it is expected to result in more decentralized publicfinancing and democratization of decision making.27 As one of the reform steps implemented towardsmaking the system of public finances more efficient, it was decided to abolish the majority of state funds,effective January 1, 2002 (with the exception of State Housing Development Fund28 and State NuclearEnergy Installations and Spent Nuclear Fuels and Radioactive Waste Management Fund). Social securityand health care system have become the agenda of the day.
As of the end of 2001, the official State debt reached the volume of SKK 365.8 bn, representing some39.7 percent of GDP. With the volume of State guarantees included, the total State debt to GDP ratiomakes up as much as 54 percent, still in compliance with the corresponding Maastricht criterion withrespect in the European Monetary Union membership. According to this criterion, the overallindebtedness of the public sector must not exceed 60 percent GDP. Among the priorities of the SlovakGovernment during this election term, the recovery of the banking sector was mentioned; the Statespent SKK 180 bn on restructuring of the sector.29
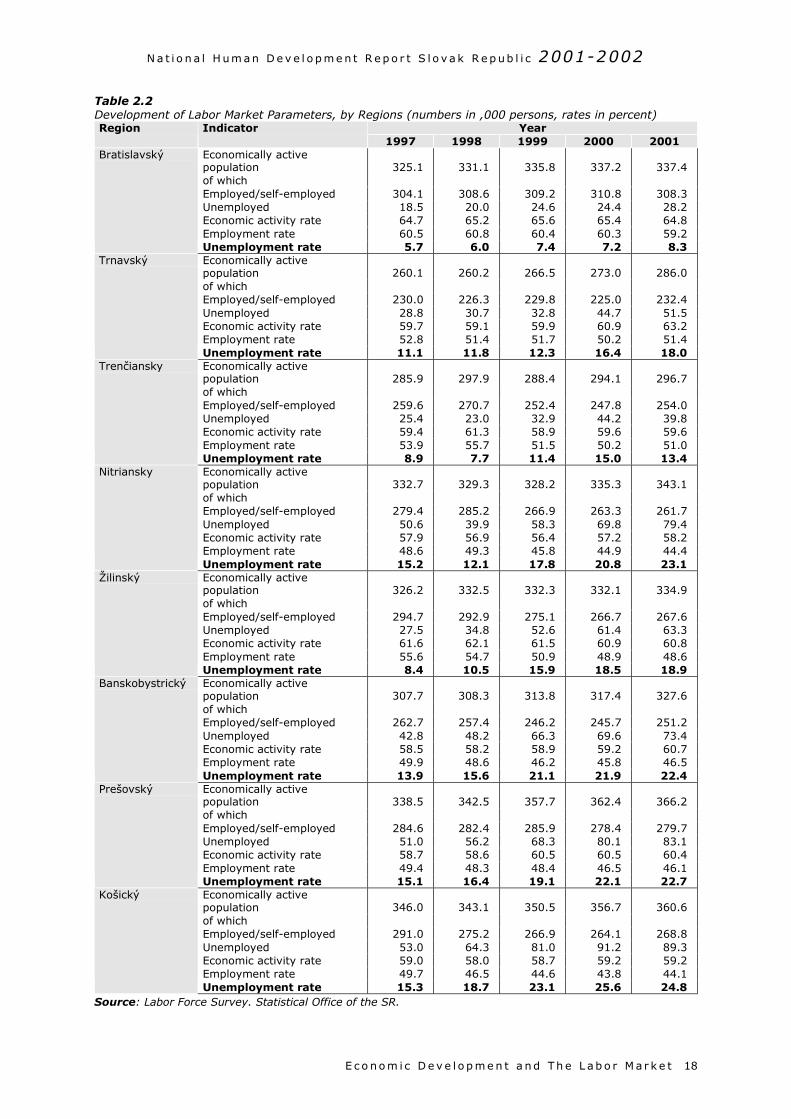
2.2.5 Labor Market and Social Situation
In recent years, the Slovak labor market has been dominated by relatively pronounced trends;growing numbers of economically active population, stagnating employment, and high and regionallydiffering unemployment rates. About one-fifth of the labor force is officially registered as unemployed,which in statistical terms means that virtually one in four Slovak households has an adult memberofficially receiving no income from employment. Table 2.2 illustrates the development of the principallabor market parameters during the last five years.
26 Using the ESA 95 methodology, the state budget deficit reached 6.5 percent and 5.9 percent as a share on GDP in 2000 and2001, respectively. For details, see Tóth (2002).27 The first elections for self-governing bodies took place in 2001 (so-called higher-tier territorial units, regional parliaments).28 Scheduled to become abolished on January 1, 2003.29 These costs include the payoff of the principal of SKK 102 bn, estimated interest of SKK 56.59 bn, and costs of increasingequity of SKK 18.9 bn.
Graph 2.6
Coverage of Imports by Exports (in%)
70,0%
75,0%
80,0%
85,0%
90,0%
95,0%
100,0%
105,0%
110,0%
01/9
9
04/9
9
07/9
9
10/9
91/
004/
007/
00
10/0
0
01/0
1
04/0
1
07/0
1
10/0
1
Source : Statis tical Office of the SR .
N a t i o n a l H um an D e v e l o p m e n t R e p o r t S l o v a k R e p ub l i c 2001-2002
E c o no m i c D e v e l o p m e n t a nd Th e L ab o r M a r k e t 18
Table 2.2Development of Labor Market Parameters, by Regions (numbers in ,000 persons, rates in percent)
YearRegion Indicator1997 1998 1999 2000 2001
Economically activepopulation 325.1 331.1 335.8 337.2 337.4of whichEmployed/self-employed 304.1 308.6 309.2 310.8 308.3Unemployed 18.5 20.0 24.6 24.4 28.2Economic activity rate 64.7 65.2 65.6 65.4 64.8Employment rate 60.5 60.8 60.4 60.3 59.2
Bratislavský
Unemployment rate 5.7 6.0 7.4 7.2 8.3Economically activepopulation 260.1 260.2 266.5 273.0 286.0of whichEmployed/self-employed 230.0 226.3 229.8 225.0 232.4Unemployed 28.8 30.7 32.8 44.7 51.5Economic activity rate 59.7 59.1 59.9 60.9 63.2Employment rate 52.8 51.4 51.7 50.2 51.4
Trnavský
Unemployment rate 11.1 11.8 12.3 16.4 18.0Economically activepopulation 285.9 297.9 288.4 294.1 296.7of whichEmployed/self-employed 259.6 270.7 252.4 247.8 254.0Unemployed 25.4 23.0 32.9 44.2 39.8Economic activity rate 59.4 61.3 58.9 59.6 59.6Employment rate 53.9 55.7 51.5 50.2 51.0
Trenčiansky
Unemployment rate 8.9 7.7 11.4 15.0 13.4Economically activepopulation 332.7 329.3 328.2 335.3 343.1of whichEmployed/self-employed 279.4 285.2 266.9 263.3 261.7Unemployed 50.6 39.9 58.3 69.8 79.4Economic activity rate 57.9 56.9 56.4 57.2 58.2Employment rate 48.6 49.3 45.8 44.9 44.4
Nitriansky
Unemployment rate 15.2 12.1 17.8 20.8 23.1Economically activepopulation 326.2 332.5 332.3 332.1 334.9of whichEmployed/self-employed 294.7 292.9 275.1 266.7 267.6Unemployed 27.5 34.8 52.6 61.4 63.3Economic activity rate 61.6 62.1 61.5 60.9 60.8Employment rate 55.6 54.7 50.9 48.9 48.6
Žilinský
Unemployment rate 8.4 10.5 15.9 18.5 18.9Economically activepopulation 307.7 308.3 313.8 317.4 327.6of whichEmployed/self-employed 262.7 257.4 246.2 245.7 251.2Unemployed 42.8 48.2 66.3 69.6 73.4Economic activity rate 58.5 58.2 58.9 59.2 60.7Employment rate 49.9 48.6 46.2 45.8 46.5
Banskobystrický
Unemployment rate 13.9 15.6 21.1 21.9 22.4Economically activepopulation 338.5 342.5 357.7 362.4 366.2of whichEmployed/self-employed 284.6 282.4 285.9 278.4 279.7Unemployed 51.0 56.2 68.3 80.1 83.1Economic activity rate 58.7 58.6 60.5 60.5 60.4Employment rate 49.4 48.3 48.4 46.5 46.1
Prešovský
Unemployment rate 15.1 16.4 19.1 22.1 22.7Economically activepopulation 346.0 343.1 350.5 356.7 360.6of whichEmployed/self-employed 291.0 275.2 266.9 264.1 268.8Unemployed 53.0 64.3 81.0 91.2 89.3Economic activity rate 59.0 58.0 58.7 59.2 59.2Employment rate 49.7 46.5 44.6 43.8 44.1
Košický
Unemployment rate 15.3 18.7 23.1 25.6 24.8Source: Labor Force Survey. Statistical Office of the SR.
N a t i o n a l H um an D e v e l o p m e n t R e p o r t S l o v a k R e p ub l i c 2001-2002
E c o no m i c D e v e l o p m e n t a nd Th e L ab o r M a r k e t19
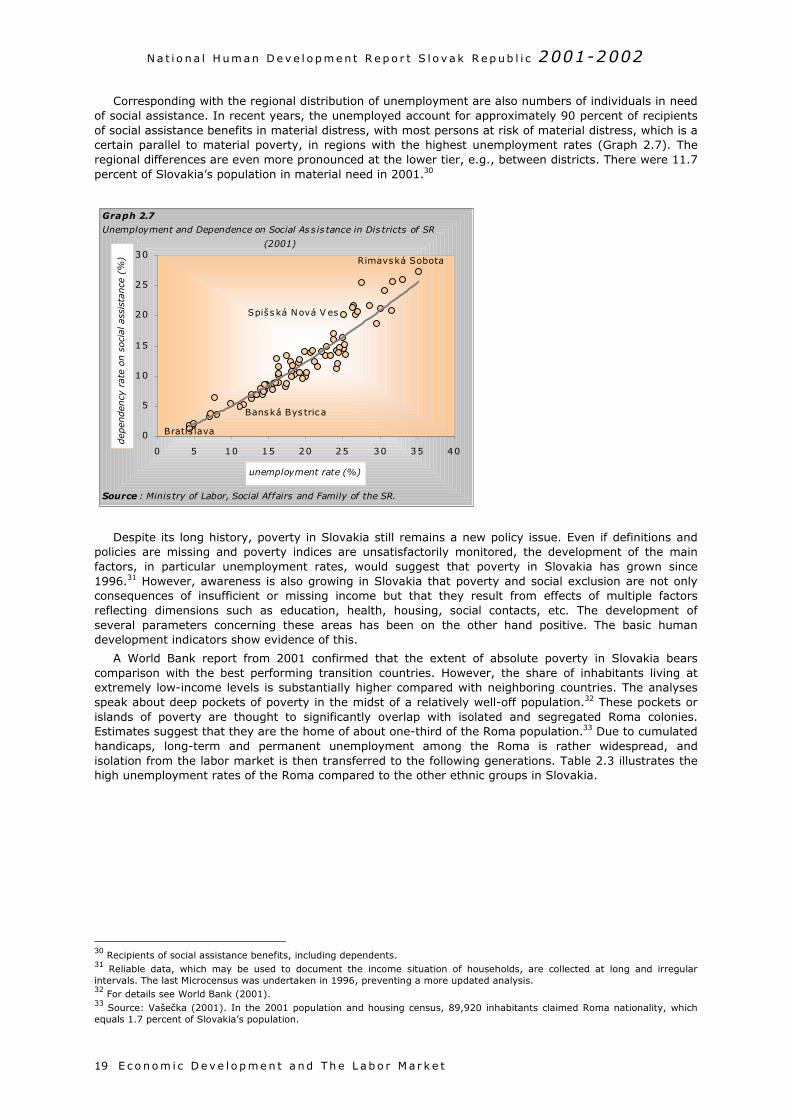
Corresponding with the regional distribution of unemployment are also numbers of individuals in needof social assistance. In recent years, the unemployed account for approximately 90 percent of recipientsof social assistance benefits in material distress, with most persons at risk of material distress, which is acertain parallel to material poverty, in regions with the highest unemployment rates (Graph 2.7). Theregional differences are even more pronounced at the lower tier, e.g., between districts. There were 11.7percent of Slovakia’s population in material need in 2001.30
Despite its long history, poverty in Slovakia still remains a new policy issue. Even if definitions andpolicies are missing and poverty indices are unsatisfactorily monitored, the development of the mainfactors, in particular unemployment rates, would suggest that poverty in Slovakia has grown since1996.31 However, awareness is also growing in Slovakia that poverty and social exclusion are not onlyconsequences of insufficient or missing income but that they result from effects of multiple factorsreflecting dimensions such as education, health, housing, social contacts, etc. The development ofseveral parameters concerning these areas has been on the other hand positive. The basic humandevelopment indicators show evidence of this.
A World Bank report from 2001 confirmed that the extent of absolute poverty in Slovakia bearscomparison with the best performing transition countries. However, the share of inhabitants living atextremely low-income levels is substantially higher compared with neighboring countries. The analysesspeak about deep pockets of poverty in the midst of a relatively well-off population.32 These pockets orislands of poverty are thought to significantly overlap with isolated and segregated Roma colonies.Estimates suggest that they are the home of about one-third of the Roma population.33 Due to cumulatedhandicaps, long-term and permanent unemployment among the Roma is rather widespread, andisolation from the labor market is then transferred to the following generations. Table 2.3 illustrates thehigh unemployment rates of the Roma compared to the other ethnic groups in Slovakia.
30 Recipients of social assistance benefits, including dependents.31 Reliable data, which may be used to document the income situation of households, are collected at long and irregularintervals. The last Microcensus was undertaken in 1996, preventing a more updated analysis.32 For details see World Bank (2001).33 Source: Vašečka (2001). In the 2001 population and housing census, 89,920 inhabitants claimed Roma nationality, whichequals 1.7 percent of Slovakia’s population.
0
5
10
15
20
25
30
0 5 10 15 20 25 30 35 40
unemployment rate (%)
dep
enden
cy r
ate
on s
oci
al a
ssis
tance
(%
)
Graph 2.7
Unemployment and Dependence on Social As s is tance in Dis tricts of SR
(2001)
Source : Minis try of Labor, Social Affairs and Family of the SR.
Rimavská Sobota
Bratis lava
Spišská Nová V es
Banská Bys tric a
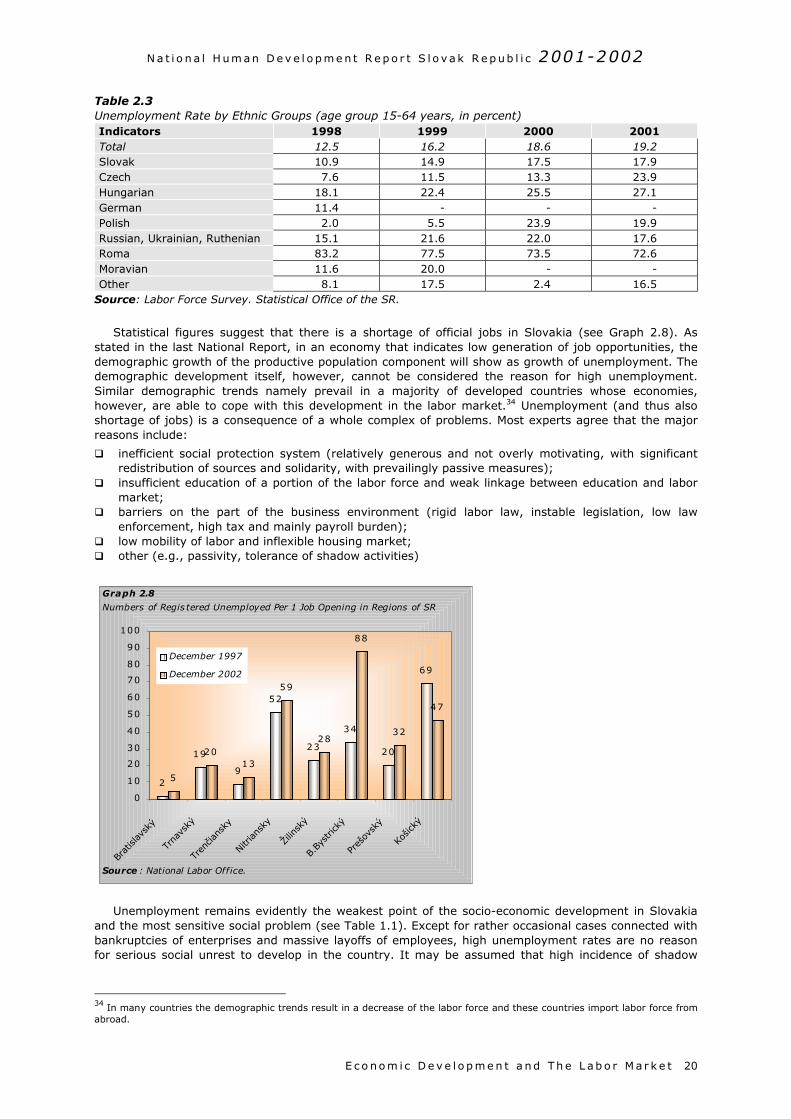
N a t i o n a l H um an D e v e l o p m e n t R e p o r t S l o v a k R e p ub l i c 2001-2002
E c o no m i c D e v e l o p m e n t a nd Th e L ab o r M a r k e t 20
Table 2.3Unemployment Rate by Ethnic Groups (age group 15-64 years, in percent)Indicators 1998 1999 2000 2001Total 12.5 16.2 18.6 19.2Slovak 10.9 14.9 17.5 17.9Czech 7.6 11.5 13.3 23.9Hungarian 18.1 22.4 25.5 27.1German 11.4 - - -Polish 2.0 5.5 23.9 19.9Russian, Ukrainian, Ruthenian 15.1 21.6 22.0 17.6Roma 83.2 77.5 73.5 72.6Moravian 11.6 20.0 - -Other 8.1 17.5 2.4 16.5
Source: Labor Force Survey. Statistical Office of the SR.
Statistical figures suggest that there is a shortage of official jobs in Slovakia (see Graph 2.8). Asstated in the last National Report, in an economy that indicates low generation of job opportunities, thedemographic growth of the productive population component will show as growth of unemployment. Thedemographic development itself, however, cannot be considered the reason for high unemployment.Similar demographic trends namely prevail in a majority of developed countries whose economies,however, are able to cope with this development in the labor market.34 Unemployment (and thus alsoshortage of jobs) is a consequence of a whole complex of problems. Most experts agree that the majorreasons include:
inefficient social protection system (relatively generous and not overly motivating, with significantredistribution of sources and solidarity, with prevailingly passive measures);
insufficient education of a portion of the labor force and weak linkage between education and labormarket;
barriers on the part of the business environment (rigid labor law, instable legislation, low lawenforcement, high tax and mainly payroll burden);
low mobility of labor and inflexible housing market; other (e.g., passivity, tolerance of shadow activities)
Unemployment remains evidently the weakest point of the socio-economic development in Slovakiaand the most sensitive social problem (see Table 1.1). Except for rather occasional cases connected withbankruptcies of enterprises and massive layoffs of employees, high unemployment rates are no reasonfor serious social unrest to develop in the country. It may be assumed that high incidence of shadow
34 In many countries the demographic trends result in a decrease of the labor force and these countries import labor force fromabroad.
2
19
9
52
23
34
20
69
5
2013
59
28
88
32
47
0
10
20
30
40
50
60
70
80
90
100
Bratisl
avsk
ý
Trna
vský
Trenčia
nsky
Nitri
ansk
y
Žilin
ský
B.By
stric
ký
Preš
ovsk
ý
Košic
ký
December 1997
December 2002
Graph 2.8
Numbers of Regis tered Unemployed Per 1 Job Opening in Regions of SR
Source : National Labor Office.
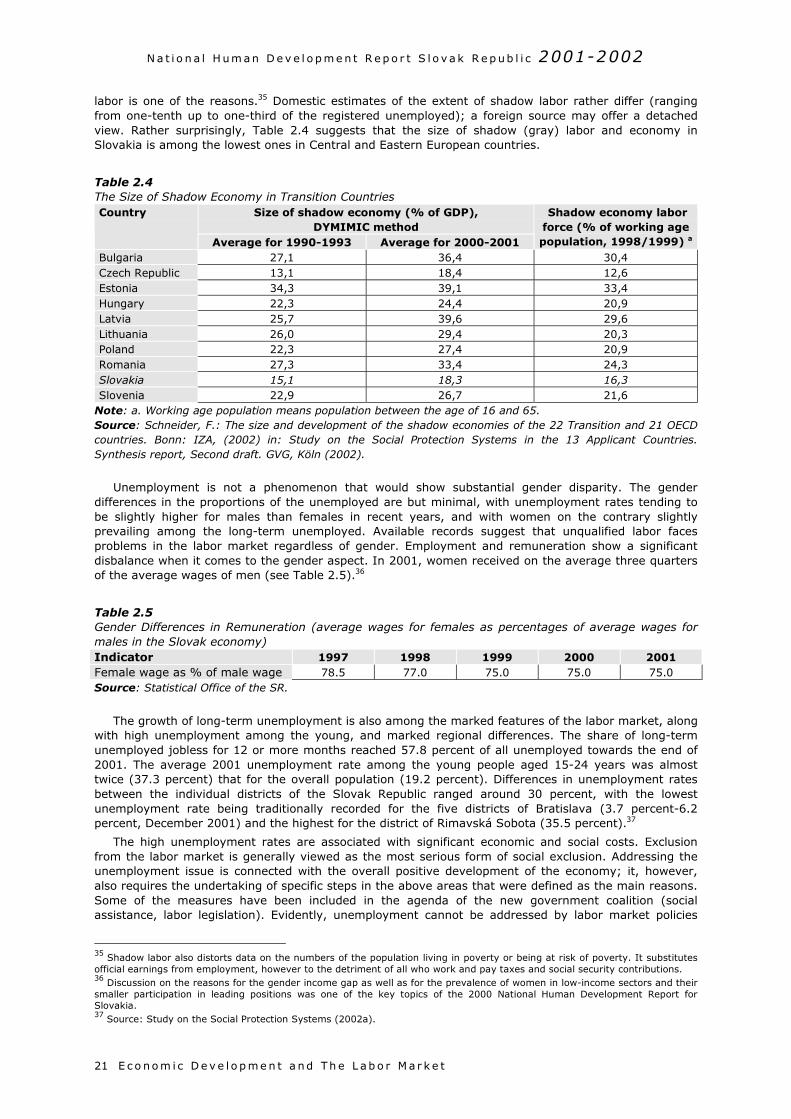
N a t i o n a l H um an D e v e l o p m e n t R e p o r t S l o v a k R e p ub l i c 2001-2002
E c o no m i c D e v e l o p m e n t a nd Th e L ab o r M a r k e t21
labor is one of the reasons.35 Domestic estimates of the extent of shadow labor rather differ (rangingfrom one-tenth up to one-third of the registered unemployed); a foreign source may offer a detachedview. Rather surprisingly, Table 2.4 suggests that the size of shadow (gray) labor and economy inSlovakia is among the lowest ones in Central and Eastern European countries.
Table 2.4The Size of Shadow Economy in Transition Countries
Size of shadow economy (% of GDP),DYMIMIC method
Country
Average for 1990-1993 Average for 2000-2001
Shadow economy laborforce (% of working agepopulation, 1998/1999) a
Bulgaria 27,1 36,4 30,4Czech Republic 13,1 18,4 12,6Estonia 34,3 39,1 33,4Hungary 22,3 24,4 20,9Latvia 25,7 39,6 29,6Lithuania 26,0 29,4 20,3Poland 22,3 27,4 20,9Romania 27,3 33,4 24,3Slovakia 15,1 18,3 16,3Slovenia 22,9 26,7 21,6
Note: a. Working age population means population between the age of 16 and 65.Source: Schneider, F.: The size and development of the shadow economies of the 22 Transition and 21 OECDcountries. Bonn: IZA, (2002) in: Study on the Social Protection Systems in the 13 Applicant Countries.Synthesis report, Second draft. GVG, Köln (2002).
Unemployment is not a phenomenon that would show substantial gender disparity. The genderdifferences in the proportions of the unemployed are but minimal, with unemployment rates tending tobe slightly higher for males than females in recent years, and with women on the contrary slightlyprevailing among the long-term unemployed. Available records suggest that unqualified labor facesproblems in the labor market regardless of gender. Employment and remuneration show a significantdisbalance when it comes to the gender aspect. In 2001, women received on the average three quartersof the average wages of men (see Table 2.5).36
Table 2.5Gender Differences in Remuneration (average wages for females as percentages of average wages formales in the Slovak economy)Indicator 1997 1998 1999 2000 2001Female wage as % of male wage 78.5 77.0 75.0 75.0 75.0Source: Statistical Office of the SR.
The growth of long-term unemployment is also among the marked features of the labor market, alongwith high unemployment among the young, and marked regional differences. The share of long-termunemployed jobless for 12 or more months reached 57.8 percent of all unemployed towards the end of2001. The average 2001 unemployment rate among the young people aged 15-24 years was almosttwice (37.3 percent) that for the overall population (19.2 percent). Differences in unemployment ratesbetween the individual districts of the Slovak Republic ranged around 30 percent, with the lowestunemployment rate being traditionally recorded for the five districts of Bratislava (3.7 percent-6.2percent, December 2001) and the highest for the district of Rimavská Sobota (35.5 percent).37
The high unemployment rates are associated with significant economic and social costs. Exclusionfrom the labor market is generally viewed as the most serious form of social exclusion. Addressing theunemployment issue is connected with the overall positive development of the economy; it, however,also requires the undertaking of specific steps in the above areas that were defined as the main reasons.Some of the measures have been included in the agenda of the new government coalition (socialassistance, labor legislation). Evidently, unemployment cannot be addressed by labor market policies
35 Shadow labor also distorts data on the numbers of the population living in poverty or being at risk of poverty. It substitutesofficial earnings from employment, however to the detriment of all who work and pay taxes and social security contributions.36 Discussion on the reasons for the gender income gap as well as for the prevalence of women in low-income sectors and theirsmaller participation in leading positions was one of the key topics of the 2000 National Human Development Report forSlovakia.37 Source: Study on the Social Protection Systems (2002a).
N a t i o n a l H um an D e v e l o p m e n t R e p o r t S l o v a k R e p ub l i c 2001-2002
E c o no m i c D e v e l o p m e n t a nd Th e L ab o r M a r k e t 22
only. Job positions are – and should be – created above all within the private sector, which is the biggestgenerator of resources. Consequently, key measures are those which will improve the businessenvironment. In addition, significant will be stimuli in the area of education that should not remainwithout closer contacts with what is happening in the labor market. The biggest challenge will probablybe the reorganization of the social protection system, which will have to respect the economic, social anddemographic reality. The social system thus needs a tighter link between what is being contributed to thesystem and what is being retrieved from it. This does not mean necessarily weakening of socialsolidarity, but it does certainly mean strengthening of the targeted nature of it, to become aimed atthose who objectively need it. The reform of the social system therefore must bring about astrengthening of the motivation of individuals to actively deal with their situation in the labor market. Inthis respect, also the gradual devolution of the responsibility and competencies to regions can beexpected to become a supporting factor. Solution to the problem of unemployment is key to the solutionto the associated problems of human development, above all of poverty and social exclusion, buteventually also to improvements in public health.
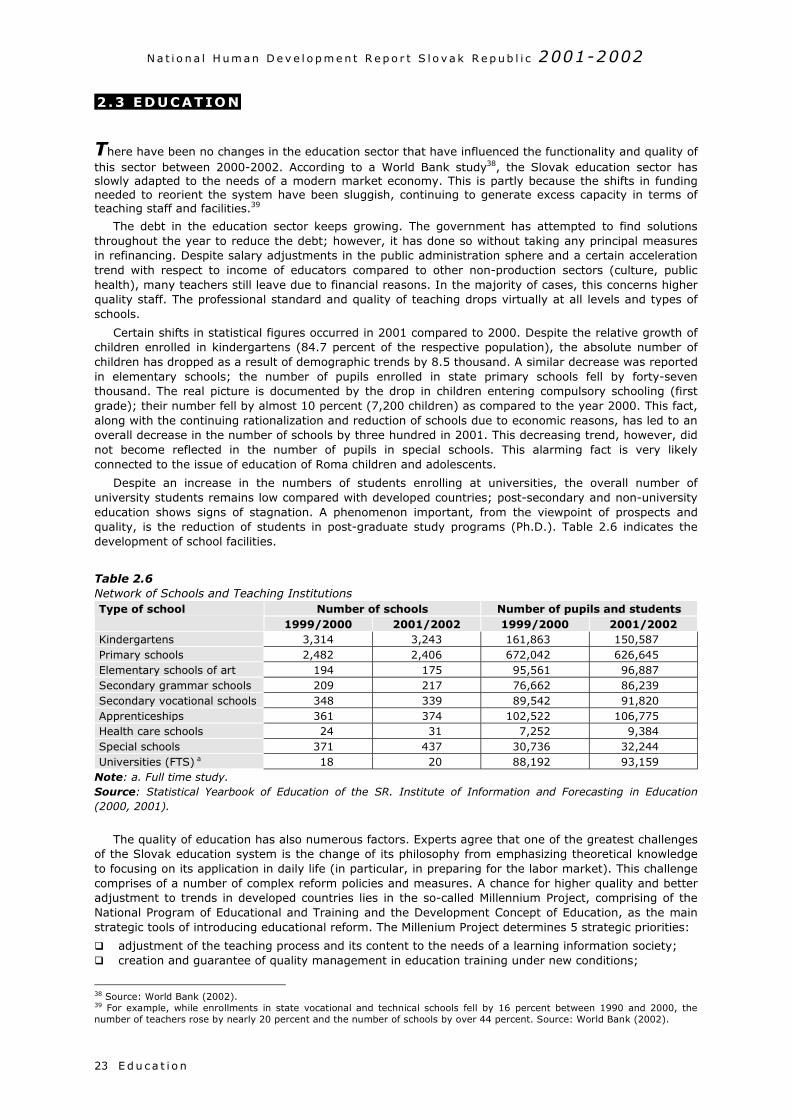
N a t i o n a l H um an D e v e l o p m e n t R e p o r t S l o v a k R e p ub l i c 2001-2002
E d u c a t i o n23
2 .3 EDUCATION
There have been no changes in the education sector that have influenced the functionality and quality ofthis sector between 2000-2002. According to a World Bank study38, the Slovak education sector hasslowly adapted to the needs of a modern market economy. This is partly because the shifts in fundingneeded to reorient the system have been sluggish, continuing to generate excess capacity in terms ofteaching staff and facilities.39
The debt in the education sector keeps growing. The government has attempted to find solutionsthroughout the year to reduce the debt; however, it has done so without taking any principal measuresin refinancing. Despite salary adjustments in the public administration sphere and a certain accelerationtrend with respect to income of educators compared to other non-production sectors (culture, publichealth), many teachers still leave due to financial reasons. In the majority of cases, this concerns higherquality staff. The professional standard and quality of teaching drops virtually at all levels and types ofschools.
Certain shifts in statistical figures occurred in 2001 compared to 2000. Despite the relative growth ofchildren enrolled in kindergartens (84.7 percent of the respective population), the absolute number ofchildren has dropped as a result of demographic trends by 8.5 thousand. A similar decrease was reportedin elementary schools; the number of pupils enrolled in state primary schools fell by forty-seventhousand. The real picture is documented by the drop in children entering compulsory schooling (firstgrade); their number fell by almost 10 percent (7,200 children) as compared to the year 2000. This fact,along with the continuing rationalization and reduction of schools due to economic reasons, has led to anoverall decrease in the number of schools by three hundred in 2001. This decreasing trend, however, didnot become reflected in the number of pupils in special schools. This alarming fact is very likelyconnected to the issue of education of Roma children and adolescents.
Despite an increase in the numbers of students enrolling at universities, the overall number ofuniversity students remains low compared with developed countries; post-secondary and non-universityeducation shows signs of stagnation. A phenomenon important, from the viewpoint of prospects andquality, is the reduction of students in post-graduate study programs (Ph.D.). Table 2.6 indicates thedevelopment of school facilities.
Table 2.6Network of Schools and Teaching Institutions
Number of schools Number of pupils and studentsType of school1999/2000 2001/2002 1999/2000 2001/2002
Kindergartens 3,314 3,243 161,863 150,587Primary schools 2,482 2,406 672,042 626,645Elementary schools of art 194 175 95,561 96,887Secondary grammar schools 209 217 76,662 86,239Secondary vocational schools 348 339 89,542 91,820Apprenticeships 361 374 102,522 106,775Health care schools 24 31 7,252 9,384Special schools 371 437 30,736 32,244Universities (FTS) a 18 20 88,192 93,159
Note: a. Full time study.Source: Statistical Yearbook of Education of the SR. Institute of Information and Forecasting in Education(2000, 2001).
The quality of education has also numerous factors. Experts agree that one of the greatest challengesof the Slovak education system is the change of its philosophy from emphasizing theoretical knowledgeto focusing on its application in daily life (in particular, in preparing for the labor market). This challengecomprises of a number of complex reform policies and measures. A chance for higher quality and betteradjustment to trends in developed countries lies in the so-called Millennium Project, comprising of theNational Program of Educational and Training and the Development Concept of Education, as the mainstrategic tools of introducing educational reform. The Millenium Project determines 5 strategic priorities:
adjustment of the teaching process and its content to the needs of a learning information society; creation and guarantee of quality management in education training under new conditions;
38 Source: World Bank (2002).39 For example, while enrollments in state vocational and technical schools fell by 16 percent between 1990 and 2000, thenumber of teachers rose by nearly 20 percent and the number of schools by over 44 percent. Source: World Bank (2002).
N a t i o n a l H um an D e v e l o p m e n t R e p o r t S l o v a k R e p ub l i c 2001-2002
E d u c a t i o n 24
quality assessment and evaluation of effectiveness of education; improvement in quality, status, and recruitment of teachers; purposive support linking education and the labor market.40
According to the World Bank41, the system needs to be refocused in order to provide more general,higher-level skills that the economy needs (and students demand) by reorienting secondary educationand by expanding access to tertiary education. This can be achieved by keeping public spending oneducation at its current level of under four percent of GDP, by taking advantage of the sharp drop in theschool age population, by making efficiency gains in the present system, by increasing the role of privateproviders, and by generating additional resources from tertiary level tuition fees. This is conditioned by
the adoption of changes in financing education, which had been slowly and insufficiently introduced. Thechallenge of decentralization also suggests the need for new, more transparent mechanisms for fundingand accountability. The measures to reorient the education system will include:
consolidation of schools and teachers with the use of a new financing mechanism based on thecapitation principle;
reorientation of secondary education toward the requirements of labor markets by increasing thegeneral academic content at all levels and expanding the number of students prepared for tertiaryeducation;
reallocation of savings from consolidation to raise quality of education at all levels and to graduallyexpand tertiary education (by means of introducing tuition);
strengthening of accountability mechanisms, including establishing a system of national studentassessments and accreditation processes of universities;
ensuring equal opportunities and access to education, especially for Roma children at primary andsecondary levels and for all students at the tertiary level.42
2.3.1 Health-Related Activities within the Education Sector
School catering makes up a separate closed system within the education sector. Its role is to offerhealthy, affordable food and beverages. Out of the total number of students (1,207,578) atkindergartens, elementary and secondary schools, forty-three percent had meals at school cafeteriasduring the 2000/2001 school years. This represents a strong social group that concerns almost one inevery two families.
40 See also Chapter 2.4.3 Measures in the education sector.41 Source: World Bank (2002).42 Source: Ditto.
Box 2.2Important Legislative Changes in Education
The new Act on Training and Education was supposed to be one of the first steps in the transformation of theschool system. This legal norm, falling under so-called euro-legislation, was however not discussed in thegovernment. The Act on Financing Primary and Secondary Schools is effective from January 2002. Theimplementing provisions attempt to set cost- and output-related coefficients and hence to introduce greatertransparency of financial flows. The act also regulates the entitlement of private and church schools forcontributions from the State Budget, introducing equal conditions compared with state schools. The act, however,fails to create pressure on the rationalization and reduction of the school network and its adaptation todemographic trends.
The adoption of the Concept of Development of Universities and Colleges brought an increment in the fundingof universities by 0.1 percent in GDP terms. After long-lasting discussions in the academic community as well as inpolitical circles, the Act on universities and colleges was passed in 2002. The main changes include:
transformation of state universities to public service organizations, which can own property;
enlargement of possibilities for multi-source financing;
programming and institutional diversification of tertiary education;
change in the status of university teachers, introduction of functional positions for professors and associateprofessors assigned based on tenders;
specification of the accreditation system;
introduction of a new system of state support for students.
The aim of public administration reform in the area of education, similar to other areas, is a purposeful transferof competencies and responsibilities from local state administration to local self-governments. The Act No.416/2001 Coll. regulates the legal shape of reform. The most important change concerns the transfer of schoolfounding competencies from district and regional offices to municipalities and self-governing regions.
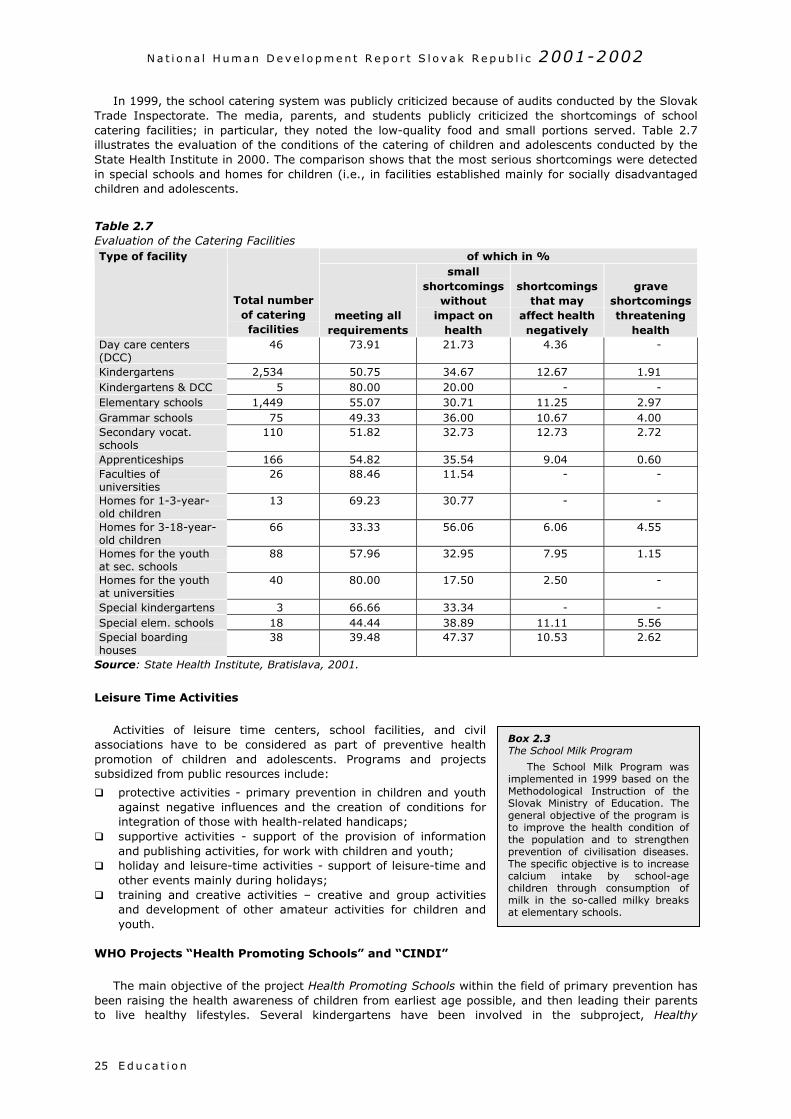
N a t i o n a l H um an D e v e l o p m e n t R e p o r t S l o v a k R e p ub l i c 2001-2002
E d u c a t i o n25
In 1999, the school catering system was publicly criticized because of audits conducted by the SlovakTrade Inspectorate. The media, parents, and students publicly criticized the shortcomings of schoolcatering facilities; in particular, they noted the low-quality food and small portions served. Table 2.7illustrates the evaluation of the conditions of the catering of children and adolescents conducted by theState Health Institute in 2000. The comparison shows that the most serious shortcomings were detectedin special schools and homes for children (i.e., in facilities established mainly for socially disadvantagedchildren and adolescents.
Table 2.7Evaluation of the Catering Facilities
of which in %Type of facility
Total numberof cateringfacilities
meeting allrequirements
smallshortcomings
withoutimpact on
health
shortcomingsthat may
affect healthnegatively
graveshortcomingsthreatening
healthDay care centers(DCC)
46 73.91 21.73 4.36 -
Kindergartens 2,534 50.75 34.67 12.67 1.91Kindergartens & DCC 5 80.00 20.00 - -Elementary schools 1,449 55.07 30.71 11.25 2.97Grammar schools 75 49.33 36.00 10.67 4.00Secondary vocat.schools
110 51.82 32.73 12.73 2.72
Apprenticeships 166 54.82 35.54 9.04 0.60Faculties ofuniversities
26 88.46 11.54 - -
Homes for 1-3-year-old children
13 69.23 30.77 - -
Homes for 3-18-year-old children
66 33.33 56.06 6.06 4.55
Homes for the youthat sec. schools
88 57.96 32.95 7.95 1.15
Homes for the youthat universities
40 80.00 17.50 2.50 -
Special kindergartens 3 66.66 33.34 - -Special elem. schools 18 44.44 38.89 11.11 5.56Special boardinghouses
38 39.48 47.37 10.53 2.62
Source: State Health Institute, Bratislava, 2001.
Leisure Time Activities
Activities of leisure time centers, school facilities, and civilassociations have to be considered as part of preventive healthpromotion of children and adolescents. Programs and projectssubsidized from public resources include:
protective activities - primary prevention in children and youthagainst negative influences and the creation of conditions forintegration of those with health-related handicaps;
supportive activities - support of the provision of informationand publishing activities, for work with children and youth;
holiday and leisure-time activities - support of leisure-time andother events mainly during holidays;
training and creative activities – creative and group activitiesand development of other amateur activities for children andyouth.
WHO Projects “Health Promoting Schools” and “CINDI”
The main objective of the project Health Promoting Schools within tbeen raising the health awareness of children from earliest age possibto live healthy lifestyles. Several kindergartens have been invol
Box 2.3The School Milk Program
The School Milk Program wasimplemented in 1999 based on theMethodological Instruction of theSlovak Ministry of Education. Thegeneral objective of the program isto improve the health condition ofthe population and to strengthenprevention of civilisation diseases.The specific objective is to increasecalcium intake by school-agechildren through consumption ofmilk in the so-called milky breaksat elementary schools.
he field of primary prevention hasle, and then leading their parentsved in the subproject, Healthy
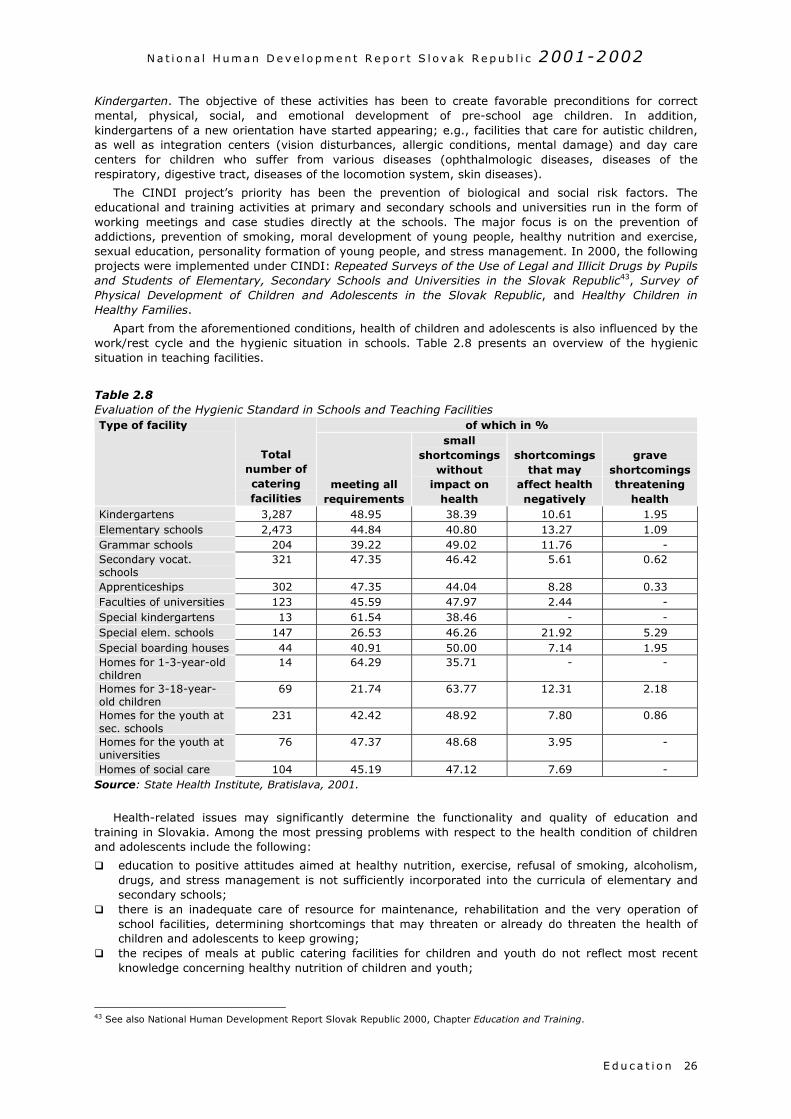
N a t i o n a l H um an D e v e l o p m e n t R e p o r t S l o v a k R e p ub l i c 2001-2002
E d u c a t i o n 26
Kindergarten. The objective of these activities has been to create favorable preconditions for correctmental, physical, social, and emotional development of pre-school age children. In addition,kindergartens of a new orientation have started appearing; e.g., facilities that care for autistic children,as well as integration centers (vision disturbances, allergic conditions, mental damage) and day carecenters for children who suffer from various diseases (ophthalmologic diseases, diseases of therespiratory, digestive tract, diseases of the locomotion system, skin diseases).
The CINDI project’s priority has been the prevention of biological and social risk factors. Theeducational and training activities at primary and secondary schools and universities run in the form ofworking meetings and case studies directly at the schools. The major focus is on the prevention ofaddictions, prevention of smoking, moral development of young people, healthy nutrition and exercise,sexual education, personality formation of young people, and stress management. In 2000, the followingprojects were implemented under CINDI: Repeated Surveys of the Use of Legal and Illicit Drugs by Pupilsand Students of Elementary, Secondary Schools and Universities in the Slovak Republic43, Survey ofPhysical Development of Children and Adolescents in the Slovak Republic, and Healthy Children inHealthy Families.
Apart from the aforementioned conditions, health of children and adolescents is also influenced by thework/rest cycle and the hygienic situation in schools. Table 2.8 presents an overview of the hygienicsituation in teaching facilities.
Table 2.8Evaluation of the Hygienic Standard in Schools and Teaching Facilities
of which in %Type of facility
Totalnumber ofcateringfacilities
meeting allrequirements
smallshortcomings
withoutimpact on
health
shortcomingsthat may
affect healthnegatively
graveshortcomingsthreatening
healthKindergartens 3,287 48.95 38.39 10.61 1.95Elementary schools 2,473 44.84 40.80 13.27 1.09Grammar schools 204 39.22 49.02 11.76 -Secondary vocat.schools
321 47.35 46.42 5.61 0.62
Apprenticeships 302 47.35 44.04 8.28 0.33Faculties of universities 123 45.59 47.97 2.44 -Special kindergartens 13 61.54 38.46 - -Special elem. schools 147 26.53 46.26 21.92 5.29Special boarding houses 44 40.91 50.00 7.14 1.95Homes for 1-3-year-oldchildren
14 64.29 35.71 - -
Homes for 3-18-year-old children
69 21.74 63.77 12.31 2.18
Homes for the youth atsec. schools
231 42.42 48.92 7.80 0.86
Homes for the youth atuniversities
76 47.37 48.68 3.95 -
Homes of social care 104 45.19 47.12 7.69 -Source: State Health Institute, Bratislava, 2001.
Health-related issues may significantly determine the functionality and quality of education andtraining in Slovakia. Among the most pressing problems with respect to the health condition of childrenand adolescents include the following:
education to positive attitudes aimed at healthy nutrition, exercise, refusal of smoking, alcoholism,drugs, and stress management is not sufficiently incorporated into the curricula of elementary andsecondary schools;
there is an inadequate care of resource for maintenance, rehabilitation and the very operation ofschool facilities, determining shortcomings that may threaten or already do threaten the health ofchildren and adolescents to keep growing;
the recipes of meals at public catering facilities for children and youth do not reflect most recentknowledge concerning healthy nutrition of children and youth;
43 See also National Human Development Report Slovak Republic 2000, Chapter Education and Training.
N a t i o n a l H um an D e v e l o p m e n t R e p o r t S l o v a k R e p ub l i c 2001-2002
E d u c a t i o n27
children and youth from socially needy families, in particular Roma families, have less access tocatering facilities;
health professionals do not visit families with poor hygienic habits, in particular Roma families; the curricula of physical education at all types and levels of schools are more orientated toward
sporting performances than toward general physical fitness; preventive influence has a low share, though prevention (clinical, hygienic as well as prevention
based on the principle of health education) not only is able to maintain the health condition of thesociety at an optimal level but also represents the most efficient investments in also economicalterms.
Based on the above, the following recommendations for adequate measures can be made:
support for raising health awareness orientated toward the individual’s own responsibility for his/herhealth and of parents for the protection of their children’s health;
provision for continuous preventive care within the whole population of children and adolescents, formedical supervision at school institutions, regular inspections at catering facilities;
making the process of comprehensive health education orientated toward daily exercise, personalhygiene, fight against alcohol consumption, smoking and other addictions, toward a healthy lifestyle,more efficient;
reinforce the share of preventive influence within the structure of care for children and adolescents; extension of primary health care of children and adolescents in their home environment (also
through the existing network of home nursing agencies), thus enabling early identification of abusedand neglected children.
N a t i o n a l H um an D e v e l o p m e n t R e p o r t S l o v a k R e p ub l i c 2001-2002
E d u c a t i o n 28
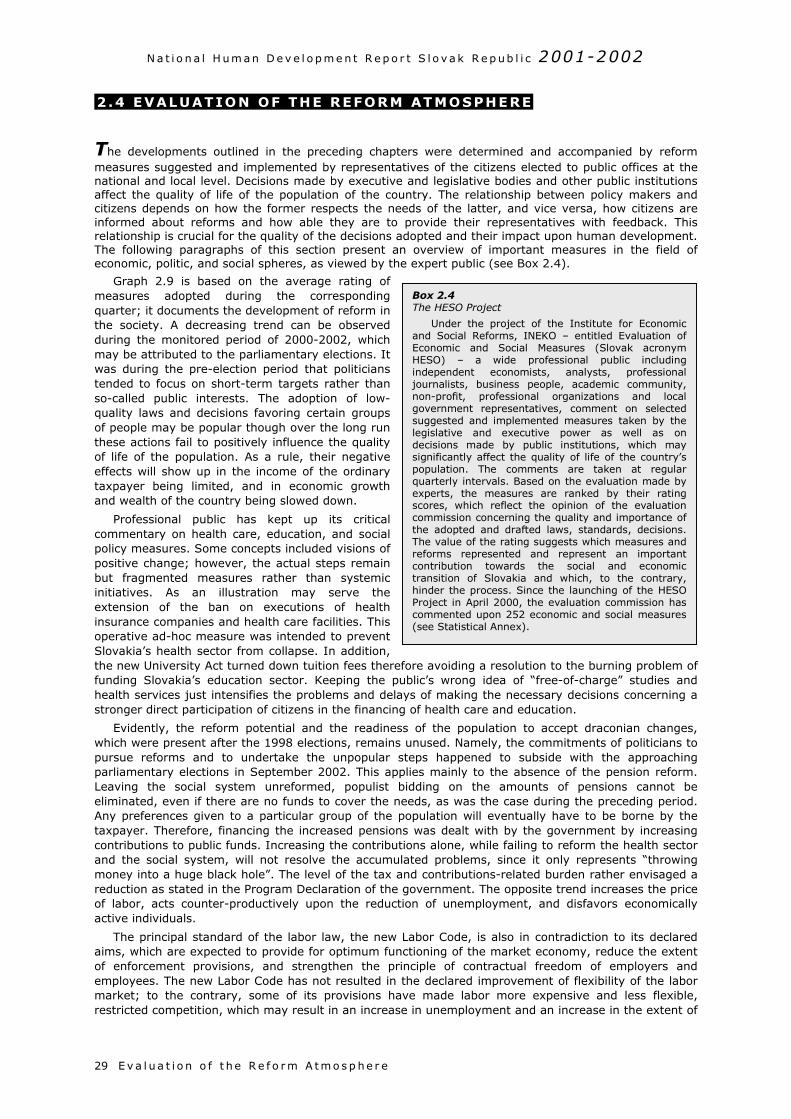
N a t i o n a l H um an D e v e l o p m e n t R e p o r t S l o v a k R e p ub l i c 2001-2002
E v a l u a t i o n o f t h e R e f o r m A tm o s p he r e29
2 .4 EVALUATION OF THE REFORM ATMOSPHERE
The developments outlined in the preceding chapters were determined and accompanied by reformmeasures suggested and implemented by representatives of the citizens elected to public offices at thenational and local level. Decisions made by executive and legislative bodies and other public institutionsaffect the quality of life of the population of the country. The relationship between policy makers andcitizens depends on how the former respects the needs of the latter, and vice versa, how citizens areinformed about reforms and how able they are to provide their representatives with feedback. Thisrelationship is crucial for the quality of the decisions adopted and their impact upon human development.The following paragraphs of this section present an overview of important measures in the field ofeconomic, politic, and social spheres, as viewed by the expert public (see Box 2.4).
Graph 2.9 is based on the average rating ofmeasures adopted during the correspondingquarter; it documents the development of reform inthe society. A decreasing trend can be observedduring the monitored period of 2000-2002, whichmay be attributed to the parliamentary elections. Itwas during the pre-election period that politicianstended to focus on short-term targets rather thanso-called public interests. The adoption of low-quality laws and decisions favoring certain groupsof people may be popular though over the long runthese actions fail to positively influence the qualityof life of the population. As a rule, their negativeeffects will show up in the income of the ordinarytaxpayer being limited, and in economic growthand wealth of the country being slowed down.
Professional public has kept up its criticalcommentary on health care, education, and socialpolicy measures. Some concepts included visions ofpositive change; however, the actual steps remainbut fragmented measures rather than systemicinitiatives. As an illustration may serve theextension of the ban on executions of healthinsurance companies and health care facilities. Thisoperative ad-hoc measure was intended to preventSlovakia’s health sector from collapse. In addition,the new University Act turned down tuition fees therefore avoiding a resolution to the burning problem offunding Slovakia’s education sector. Keeping the public’s wrong idea of “free-of-charge” studies andhealth services just intensifies the problems and delays of making the necessary decisions concerning astronger direct participation of citizens in the financing of health care and education.
Evidently, the reform potential and the readiness of the population to accept draconian changes,which were present after the 1998 elections, remains unused. Namely, the commitments of politicians topursue reforms and to undertake the unpopular steps happened to subside with the approachingparliamentary elections in September 2002. This applies mainly to the absence of the pension reform.Leaving the social system unreformed, populist bidding on the amounts of pensions cannot beeliminated, even if there are no funds to cover the needs, as was the case during the preceding period.Any preferences given to a particular group of the population will eventually have to be borne by thetaxpayer. Therefore, financing the increased pensions was dealt with by the government by increasingcontributions to public funds. Increasing the contributions alone, while failing to reform the health sectorand the social system, will not resolve the accumulated problems, since it only represents “throwingmoney into a huge black hole”. The level of the tax and contributions-related burden rather envisaged areduction as stated in the Program Declaration of the government. The opposite trend increases the priceof labor, acts counter-productively upon the reduction of unemployment, and disfavors economicallyactive individuals.
The principal standard of the labor law, the new Labor Code, is also in contradiction to its declaredaims, which are expected to provide for optimum functioning of the market economy, reduce the extentof enforcement provisions, and strengthen the principle of contractual freedom of employers andemployees. The new Labor Code has not resulted in the declared improvement of flexibility of the labormarket; to the contrary, some of its provisions have made labor more expensive and less flexible,restricted competition, which may result in an increase in unemployment and an increase in the extent of
Box 2.4The HESO Project
Under the project of the Institute for Economicand Social Reforms, INEKO – entitled Evaluation ofEconomic and Social Measures (Slovak acronymHESO) – a wide professional public includingindependent economists, analysts, professionaljournalists, business people, academic community,non-profit, professional organizations and localgovernment representatives, comment on selectedsuggested and implemented measures taken by thelegislative and executive power as well as ondecisions made by public institutions, which maysignificantly affect the quality of life of the country’spopulation. The comments are taken at regularquarterly intervals. Based on the evaluation made byexperts, the measures are ranked by their ratingscores, which reflect the opinion of the evaluationcommission concerning the quality and importance ofthe adopted and drafted laws, standards, decisions.The value of the rating suggests which measures andreforms represented and represent an importantcontribution towards the social and economictransition of Slovakia and which, to the contrary,hinder the process. Since the launching of the HESOProject in April 2000, the evaluation commission hascommented upon 252 economic and social measures(see Statistical Annex).
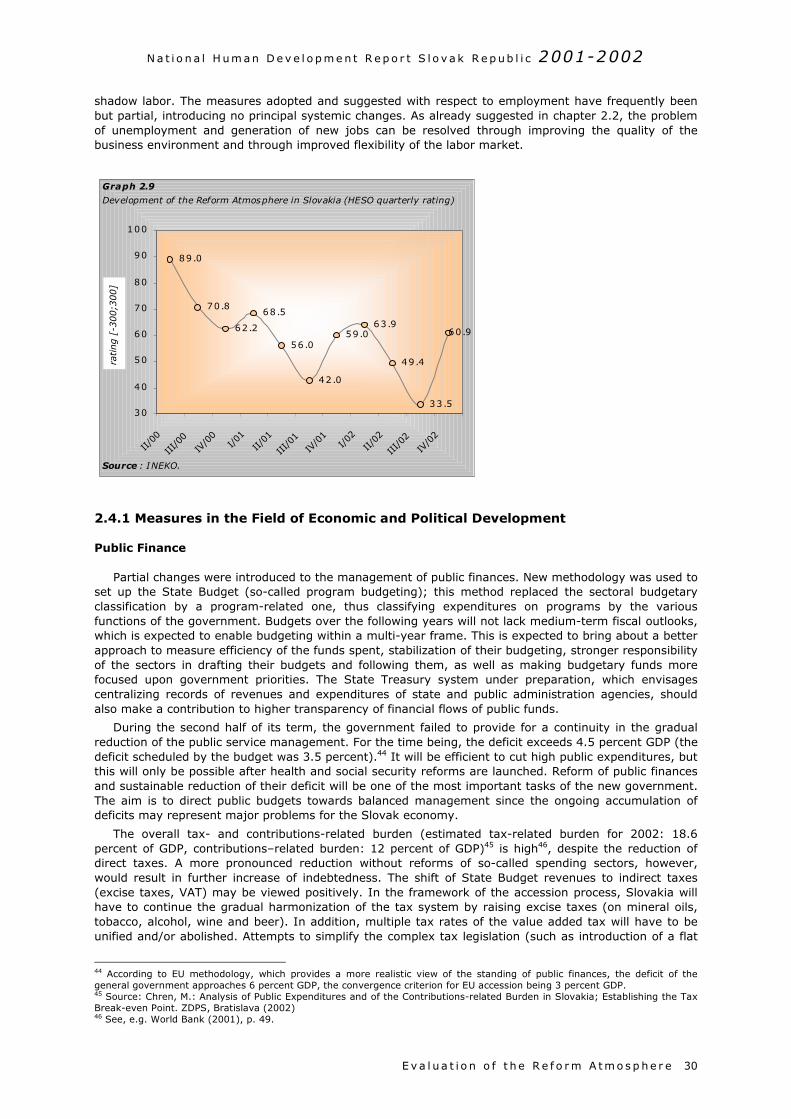
N a t i o n a l H um an D e v e l o p m e n t R e p o r t S l o v a k R e p ub l i c 2001-2002
E v a l u a t i o n o f t h e R e f o r m A tm o s p he r e 30
shadow labor. The measures adopted and suggested with respect to employment have frequently beenbut partial, introducing no principal systemic changes. As already suggested in chapter 2.2, the problemof unemployment and generation of new jobs can be resolved through improving the quality of thebusiness environment and through improved flexibility of the labor market.
2.4.1 Measures in the Field of Economic and Political Development
Public Finance
Partial changes were introduced to the management of public finances. New methodology was used toset up the State Budget (so-called program budgeting); this method replaced the sectoral budgetaryclassification by a program-related one, thus classifying expenditures on programs by the variousfunctions of the government. Budgets over the following years will not lack medium-term fiscal outlooks,which is expected to enable budgeting within a multi-year frame. This is expected to bring about a betterapproach to measure efficiency of the funds spent, stabilization of their budgeting, stronger responsibilityof the sectors in drafting their budgets and following them, as well as making budgetary funds morefocused upon government priorities. The State Treasury system under preparation, which envisagescentralizing records of revenues and expenditures of state and public administration agencies, shouldalso make a contribution to higher transparency of financial flows of public funds.
During the second half of its term, the government failed to provide for a continuity in the gradualreduction of the public service management. For the time being, the deficit exceeds 4.5 percent GDP (thedeficit scheduled by the budget was 3.5 percent).44 It will be efficient to cut high public expenditures, butthis will only be possible after health and social security reforms are launched. Reform of public financesand sustainable reduction of their deficit will be one of the most important tasks of the new government.The aim is to direct public budgets towards balanced management since the ongoing accumulation ofdeficits may represent major problems for the Slovak economy.
The overall tax- and contributions-related burden (estimated tax-related burden for 2002: 18.6percent of GDP, contributions–related burden: 12 percent of GDP)45 is high46, despite the reduction ofdirect taxes. A more pronounced reduction without reforms of so-called spending sectors, however,would result in further increase of indebtedness. The shift of State Budget revenues to indirect taxes(excise taxes, VAT) may be viewed positively. In the framework of the accession process, Slovakia willhave to continue the gradual harmonization of the tax system by raising excise taxes (on mineral oils,tobacco, alcohol, wine and beer). In addition, multiple tax rates of the value added tax will have to beunified and/or abolished. Attempts to simplify the complex tax legislation (such as introduction of a flat
44 According to EU methodology, which provides a more realistic view of the standing of public finances, the deficit of thegeneral government approaches 6 percent GDP, the convergence criterion for EU accession being 3 percent GDP.45 Source: Chren, M.: Analysis of Public Expenditures and of the Contributions-related Burden in Slovakia; Establishing the TaxBreak-even Point. ZDPS, Bratislava (2002)46 See, e.g. World Bank (2001), p. 49.
60 .9
33 .5
49 .4
63 .959 .0
42 .0
56 .0
68 .5
62 .2
70 .8
89 .0
30
40
50
60
70
80
90
100
II/00
III/0
0IV
/00
I/01
II/01
III/0
1IV
/01
I/02
II/02
III/0
2IV
/02
rating [
-300;3
00]
Graph 2.9
Development of the Reform Atmosphere in Slovakia (HESO quarterly rating)
Source : INEKO.
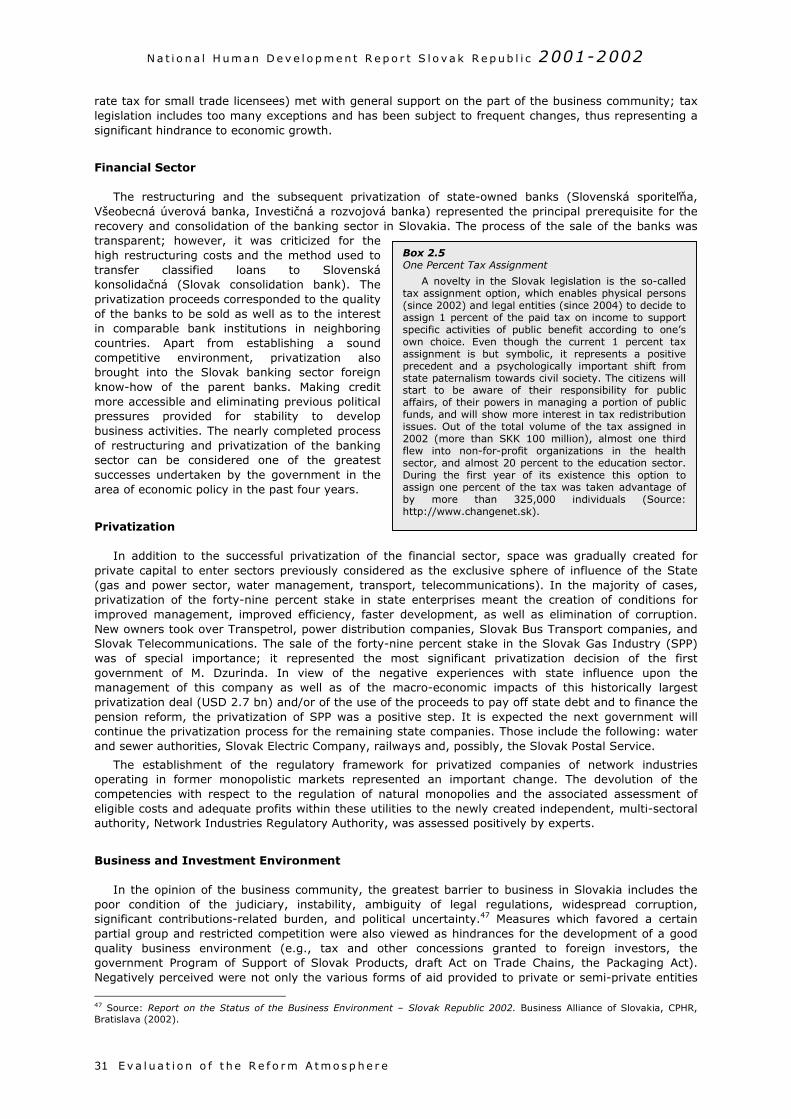
N a t i o n a l H um an D e v e l o p m e n t R e p o r t S l o v a k R e p ub l i c 2001-2002
E v a l u a t i o n o f t h e R e f o r m A tm o s p he r e31
rate tax for small trade licensees) met with general support on the part of the business community; taxlegislation includes too many exceptions and has been subject to frequent changes, thus representing asignificant hindrance to economic growth.
Financial Sector
The restructuring and the subsequent privatization of state-owned banks (Slovenská sporiteľňa,Všeobecná úverová banka, Investičná a rozvojová banka) represented the principal prerequisite for therecovery and consolidation of the banking sector in Slovakia. The process of the sale of the banks wastransparent; however, it was criticized for thehigh restructuring costs and the method used totransfer classified loans to Slovenskákonsolidačná (Slovak consolidation bank). Theprivatization proceeds corresponded to the qualityof the banks to be sold as well as to the interestin comparable bank institutions in neighboringcountries. Apart from establishing a soundcompetitive environment, privatization alsobrought into the Slovak banking sector foreignknow-how of the parent banks. Making creditmore accessible and eliminating previous politicalpressures provided for stability to developbusiness activities. The nearly completed processof restructuring and privatization of the bankingsector can be considered one of the greatestsuccesses undertaken by the government in thearea of economic policy in the past four years.
Privatization
In addition to the successful privatization of the financial sector, space was gradually created forprivate capital to enter sectors previously considered as the exclusive sphere of influence of the State(gas and power sector, water management, transport, telecommunications). In the majority of cases,privatization of the forty-nine percent stake in state enterprises meant the creation of conditions forimproved management, improved efficiency, faster development, as well as elimination of corruption.New owners took over Transpetrol, power distribution companies, Slovak Bus Transport companies, andSlovak Telecommunications. The sale of the forty-nine percent stake in the Slovak Gas Industry (SPP)was of special importance; it represented the most significant privatization decision of the firstgovernment of M. Dzurinda. In view of the negative experiences with state influence upon themanagement of this company as well as of the macro-economic impacts of this historically largestprivatization deal (USD 2.7 bn) and/or of the use of the proceeds to pay off state debt and to finance thepension reform, the privatization of SPP was a positive step. It is expected the next government willcontinue the privatization process for the remaining state companies. Those include the following: waterand sewer authorities, Slovak Electric Company, railways and, possibly, the Slovak Postal Service.
The establishment of the regulatory framework for privatized companies of network industriesoperating in former monopolistic markets represented an important change. The devolution of thecompetencies with respect to the regulation of natural monopolies and the associated assessment ofeligible costs and adequate profits within these utilities to the newly created independent, multi-sectoralauthority, Network Industries Regulatory Authority, was assessed positively by experts.
Business and Investment Environment
In the opinion of the business community, the greatest barrier to business in Slovakia includes thepoor condition of the judiciary, instability, ambiguity of legal regulations, widespread corruption,significant contributions-related burden, and political uncertainty.47 Measures which favored a certainpartial group and restricted competition were also viewed as hindrances for the development of a goodquality business environment (e.g., tax and other concessions granted to foreign investors, thegovernment Program of Support of Slovak Products, draft Act on Trade Chains, the Packaging Act).Negatively perceived were not only the various forms of aid provided to private or semi-private entities
47 Source: Report on the Status of the Business Environment – Slovak Republic 2002. Business Alliance of Slovakia, CPHR,Bratislava (2002).
Box 2.5One Percent Tax Assignment
A novelty in the Slovak legislation is the so-calledtax assignment option, which enables physical persons(since 2002) and legal entities (since 2004) to decide toassign 1 percent of the paid tax on income to supportspecific activities of public benefit according to one’sown choice. Even though the current 1 percent taxassignment is but symbolic, it represents a positiveprecedent and a psychologically important shift fromstate paternalism towards civil society. The citizens willstart to be aware of their responsibility for publicaffairs, of their powers in managing a portion of publicfunds, and will show more interest in tax redistributionissues. Out of the total volume of the tax assigned in2002 (more than SKK 100 million), almost one thirdflew into non-for-profit organizations in the healthsector, and almost 20 percent to the education sector.During the first year of its existence this option toassign one percent of the tax was taken advantage ofby more than 325,000 individuals (Source:http://www.changenet.sk).
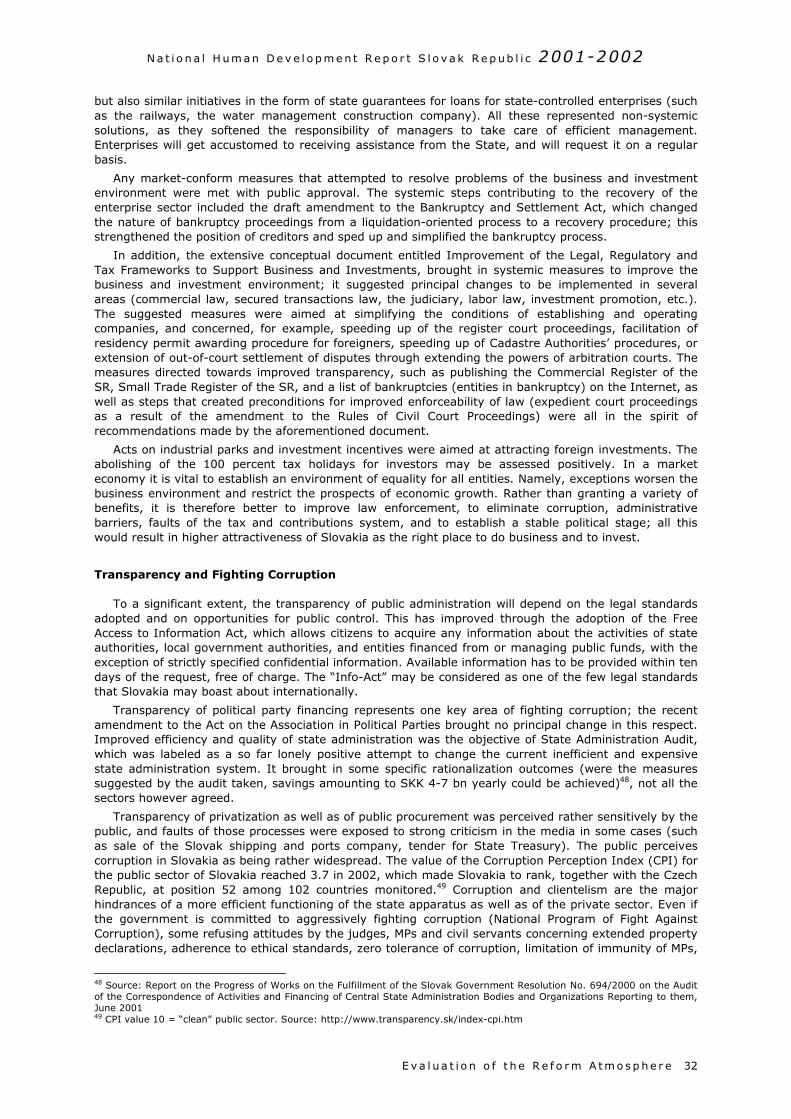
N a t i o n a l H um an D e v e l o p m e n t R e p o r t S l o v a k R e p ub l i c 2001-2002
E v a l u a t i o n o f t h e R e f o r m A tm o s p he r e 32
but also similar initiatives in the form of state guarantees for loans for state-controlled enterprises (suchas the railways, the water management construction company). All these represented non-systemicsolutions, as they softened the responsibility of managers to take care of efficient management.Enterprises will get accustomed to receiving assistance from the State, and will request it on a regularbasis.
Any market-conform measures that attempted to resolve problems of the business and investmentenvironment were met with public approval. The systemic steps contributing to the recovery of theenterprise sector included the draft amendment to the Bankruptcy and Settlement Act, which changedthe nature of bankruptcy proceedings from a liquidation-oriented process to a recovery procedure; thisstrengthened the position of creditors and sped up and simplified the bankruptcy process.
In addition, the extensive conceptual document entitled Improvement of the Legal, Regulatory andTax Frameworks to Support Business and Investments, brought in systemic measures to improve thebusiness and investment environment; it suggested principal changes to be implemented in severalareas (commercial law, secured transactions law, the judiciary, labor law, investment promotion, etc.).The suggested measures were aimed at simplifying the conditions of establishing and operatingcompanies, and concerned, for example, speeding up of the register court proceedings, facilitation ofresidency permit awarding procedure for foreigners, speeding up of Cadastre Authorities’ procedures, orextension of out-of-court settlement of disputes through extending the powers of arbitration courts. Themeasures directed towards improved transparency, such as publishing the Commercial Register of theSR, Small Trade Register of the SR, and a list of bankruptcies (entities in bankruptcy) on the Internet, aswell as steps that created preconditions for improved enforceability of law (expedient court proceedingsas a result of the amendment to the Rules of Civil Court Proceedings) were all in the spirit ofrecommendations made by the aforementioned document.
Acts on industrial parks and investment incentives were aimed at attracting foreign investments. Theabolishing of the 100 percent tax holidays for investors may be assessed positively. In a marketeconomy it is vital to establish an environment of equality for all entities. Namely, exceptions worsen thebusiness environment and restrict the prospects of economic growth. Rather than granting a variety ofbenefits, it is therefore better to improve law enforcement, to eliminate corruption, administrativebarriers, faults of the tax and contributions system, and to establish a stable political stage; all thiswould result in higher attractiveness of Slovakia as the right place to do business and to invest.
Transparency and Fighting Corruption
To a significant extent, the transparency of public administration will depend on the legal standardsadopted and on opportunities for public control. This has improved through the adoption of the FreeAccess to Information Act, which allows citizens to acquire any information about the activities of stateauthorities, local government authorities, and entities financed from or managing public funds, with theexception of strictly specified confidential information. Available information has to be provided within tendays of the request, free of charge. The “Info-Act” may be considered as one of the few legal standardsthat Slovakia may boast about internationally.
Transparency of political party financing represents one key area of fighting corruption; the recentamendment to the Act on the Association in Political Parties brought no principal change in this respect.Improved efficiency and quality of state administration was the objective of State Administration Audit,which was labeled as a so far lonely positive attempt to change the current inefficient and expensivestate administration system. It brought in some specific rationalization outcomes (were the measuressuggested by the audit taken, savings amounting to SKK 4-7 bn yearly could be achieved)48, not all thesectors however agreed.
Transparency of privatization as well as of public procurement was perceived rather sensitively by thepublic, and faults of those processes were exposed to strong criticism in the media in some cases (suchas sale of the Slovak shipping and ports company, tender for State Treasury). The public perceivescorruption in Slovakia as being rather widespread. The value of the Corruption Perception Index (CPI) forthe public sector of Slovakia reached 3.7 in 2002, which made Slovakia to rank, together with the CzechRepublic, at position 52 among 102 countries monitored.49 Corruption and clientelism are the majorhindrances of a more efficient functioning of the state apparatus as well as of the private sector. Even ifthe government is committed to aggressively fighting corruption (National Program of Fight AgainstCorruption), some refusing attitudes by the judges, MPs and civil servants concerning extended propertydeclarations, adherence to ethical standards, zero tolerance of corruption, limitation of immunity of MPs,
48 Source: Report on the Progress of Works on the Fulfillment of the Slovak Government Resolution No. 694/2000 on the Auditof the Correspondence of Activities and Financing of Central State Administration Bodies and Organizations Reporting to them,June 200149 CPI value 10 = “clean” public sector. Source: http://www.transparency.sk/index-cpi.htm
N a t i o n a l H um an D e v e l o p m e n t R e p o r t S l o v a k R e p ub l i c 2001-2002
E v a l u a t i o n o f t h e R e f o r m A tm o s p he r e33
or refusal to adopt the Conflict of Interest Act suggested a strong resistance within the public sectordirected against such efforts.
The introduction of the institution of the Ombudsman into the Slovak legal system may be consideredas standardization of democratic institutions in the country. It will contribute towards better protection ofcitizen rights and business entities from being violated by public service bodies.
Public Administration Reform
One of the top priorities of the government has also been public administration reform. Its aim was todecentralize the competencies and finances from state administration to local self-governments, to cutexpenditures, and to establish a new organization of the public administration through establishing thesecond tier of territorial self-government, represented by 12 new higher-tier self-governments (regionalself-governments, VÚC). The later political disagreement concerning the structure of Slovakia’s self-governments caused public administration reform to become delayed; this was considered as one of thegreatest losses of the previous government coalition. The corresponding legislation for the reform waseventually adopted (VÚC Act and Act on the Devolution of Some Competencies from State AdministrationBodies to Regional Self-governments, so-called Small Competency Act), whose content howeversubstantially differed from the initially adopted concept. The number of the administrative territorial unitsremained unchanged; eight VÚCs were created. On the plus side, there was the fact that the long-postponed reform of the public administration was launched at all, even if incomplete devolution ofcompetencies to self-governments, incomplete fiscal decentralization, as well as the lack of will todissolve district offices evoked justified doubts concerning one of the key objectives of the reform,making public administration activities cheaper and more rationalized.
Integration
The integration-related ambitions of the SR could be partly fulfilled by joining OECD. Membership inthe Organization for Economic Cooperation and Development contributed to an improved credibility andreduced risk of Slovakia in the eyes of foreign investors. This had a real positive economic impact uponthe price of foreign loans and the growth of foreign investments. The membership was a matter ofprestige, but the requirements on the part of the OECD, also forced Slovakia to speed up theimplementation of the liberalization measures that moved the country closer to a fully operational marketeconomy. Military reform represents one precondition of Slovakia’s membership in NATO. The Ministry ofDefense developed a concept of building up the armed forces of the SR, which is based on collectivedefense by NATO. It envisages the abolishment of mandatory military service, troop reduction, and asmaller volume of military technologies which will account for the economic potential of the country.Experts claim that the concept of military reform represented one of the very few strategic visions, whichSlovakia needs in also other areas (including, e.g., the health sector, education, social sector, thejudiciary, state administration management). Concerning the European Union accession process, MikulášDzurinda’s government succeeded in catching up with what Mečiar’s government failed to achieve;Dzurinda’s government overtook other countries which had started negotiations with the EU muchearlier.
2.4.2 Measures in Social Policy
Social Security
Long-term demographic development, mainly the aging of the population and the associatedunsustainability of the pay-as-you-go (PAYG) financing of pensions, suggests the need for principalreform of the whole system of social security, in particular pension insurance.
In August 2000, the government adopted the Concept of the Social Insurance System Reform in theSlovak Republic. The aim of the reform was to set up a system of participation in the financing of socialinsurance, based on a combination of the PAYG and capitalization approach to the financing, and acombination of an obligatory with a voluntary system of contributions to the insurance funds. The firstpillar should consist of the previously practiced PAYG financing of the basic obligatory insurance, with thecontributions in the target scheme accounting for two-thirds of the current contributions towards pensioninsurance. The second pillar should consist of capitalized basic obligatory insurance, with one-third of thecurrent insurance premium deposited to personal accounts of the citizen providing for as many as fiftypercent of the pensions in the target scheme in about twenty years. The third pillar should consist ofvoluntary supplementary pension insurance, subject to tax concessions, where employers and employeeswould pay contributions to personal accounts of employees kept with supplementary insurance fund,
N a t i o n a l H um an D e v e l o p m e n t R e p o r t S l o v a k R e p ub l i c 2001-2002
E v a l u a t i o n o f t h e R e f o r m A tm o s p he r e 34
based on mutual agreements. In addition to the aforementioned system, voluntary individualsupplementary insurance scheme with a commercial insurance fund was also envisaged. The new systemwas expected to enhance the personal involvement of every insured over the long-range concerning theamount of the pension, to minimize numbers of citizens who will be dependent on social assistance orcomponents of state social support.
The concept of social insurance reform also accounted for the elimination of the difference in theretirement age of males and females through 2027. In Slovakia, the retirement age is lower comparedwith EU Member States and with candidate countries. Currently, the retirement age is 60 and between54 and 57 (in dependence on the number of children raised) for men and women, respectively. Thegovernment justified the need to raise the retirement age for women by the principle of equality of menand women, by the unfavorable demographic development of the Slovak population (reducing natalitycombined with the increasing average life expectancy, with higher values for women than men), and bythe unsustainability of the current pension system, in which contributions paid by increasingly smallergroup of those who work will not be sufficient to cover the benefits paid to increasingly larger mass ofpensioners in the future.
In May 2002, the Parliament adopted the long awaited Social Insurance Act. The Act is intended toenable gradual transition from the social security system to social insurance system. This is expected tostrengthen the application of the merits-based principle, with the obligatory contributions and the parallelsocial solidarity principle being maintained. According to the new method, the amount of the old-agepension shall be determined by accounting for the life-long income of the contribution payer. This Act,however, fails to establish conditions for a transition to a multi-pillar social insurance financing system asit does not address the issue of the second pillar – capitalization of sources through establishing personalaccounts for every insured person. The new Act only defines the first pillar of the pension insurance,keeping the PAYG system of financing. In the opinion of critics, the degree of social solidarity withrespect to the redistribution of the funds collected remains at a high level. One of the most seriouscomments on the draft law concerned the absence of universality of the social insurance system for allemployees as some so-called power sectors (e.g., police corps and military) will have their owninsurance schemes, and this raises the question of equality before law and transferability of insuranceschemes upon employees going over to work from the public into the private sector or vice versa.
The Ministry of Labor did not meet the time schedule of the preparation of the social insurancereform, and it will therefore be the second government of Mikuláš Dzurinda that will have to launch thepension insurance reform. The leaving cabinet managed to review, in August 2002, the legislativeintention concerning draft law on the capitalization pillar of the pension insurance; eventually, the draftwas adopted with two mutually contradictory alternatives of the implementation of the reform concerningthe institutional arrangement of the administration of assets within the capitalization pillar. Thesuggestion presented by the Ministry of Labor, Social Affairs and Family (a similar system is operationalin Sweden and Canada) envisaged selection of asset administrators, private administration companies,by a public authority established to that effect (Investment Board). In the opinion of the drafters, such avariant would guarantee the safety of investment of citizens’ funds entrusted. On the other hand, itwould establish a corruptive environment and space for political and other types of interference with theinvestment process. Contrary to that, the model suggested by the Ministry of Economy (as practiced inChile, and applied in a certain modification in also Hungary and Poland), aimed at decentralizing theadministration of the capitalization pillar, providing the citizen with free choice as to the selection of theadministrator of the assets. Private pension funds would be responsible for the administration andinvestments of the pension fund assets, and competition would force the funds to achieve the bestappreciation of the pension savings of their insurers possible.
The new government, however, has already expressed the intention to postpone the date it becomeseffective to January 1st, 2004.
State Social Support and Social Assistance
Among the aims of the November 2000 amendment to the Act on Social Assistance was to save SKK1 bn on budgetary expenditures into the social sector, and to reform the payments of social benefits. Foran individual in material distress (e.g., with an income not reaching the minimum subsistence leveland/or a set amount) to be eligible to receive social benefits from objective reasons, he/she must havepaid unemployment insurance premiums for at least three consecutive months. Individuals meeting thecriteria of objective material need are eligible to receive full amounts of social benefits. On the contrary,individuals who get into the condition of material distress for subjective reasons, thus because ofspending inadequate efforts to find a job, will only receive half of that amount. The aim of the measurewas to restrict abuse of the social system and to motivate people to find jobs for longer periods of time.Pursuant to the previously applicable legal regulation namely, it was enough to have but formalemployment, for a very short period of time, and this was deemed a condition for being recognized as
N a t i o n a l H um an D e v e l o p m e n t R e p o r t S l o v a k R e p ub l i c 2001-2002
E v a l u a t i o n o f t h e R e f o r m A tm o s p he r e35
being in material distress for objective reasons. The restriction of the exercise of personal assistance byrelatives and the cut of compensation paid by the State to individuals with health handicaps met withcriticism. The new government set the objective to make social aid more targeted and to strengthenactive incentives of the social system.
In May 2002, the Parliament adopted the amendment to the Child Allowances and Supplement toChild Allowances Act, introducing flat payments of child allowances since June 2002, i.e., without testingfamily income.
The essence of the Substitute Alimonies Act from April 2002 was the establishment of SubstituteAlimonies Fund (so-called Alimonies Fund), used to pay parents taking care of children alimoniesdetermined by courts instead of payments by the parent who fails to meet his/her duty to support. In theopinion of many experts, this provision already exceeds any reasonable measure of state paternalism. Asa matter of fact, substitute alimonies represent so-called soft budgetary restriction for parents failing topay alimonies. Misuse of the institution of state-paid alimonies cannot be ruled out. The new governmentenvisages a prompt repeal of the Substitute Alimonies Act.
Employment Policy
As stated in the chapter on economic development and the labor market, unemployment rates rangedtightly under the twenty percent level in 2000-2002. More than forty percent of the unemployed had nojob for periods exceeding two years.
The government-presented amendment to the Employment Act enabled towns, municipalities, civilassociations, foundations, health care facilities, churches, but also budgetary and contributoryorganizations, to establish, after 1 August 2000, job positions of public benefit to be filled by the long-term unemployed. Public beneficiary works were financed from the State Budget (SKK 1.3 bn in 2000),using funds initially allocated for social benefits. The unemployed, who refused to participate in publicworks, were deregistered by the labor offices, thus losing eligibility for receiving the full amount of socialassistance. The positive aspects of the measure included the fact that long-term unemployed started toget accustomed to working habits again, and that shadow labor could be easier disclosed. The critics, onthe other hand, stressed that the artificial creation of temporary jobs is a non-systemic step to reduceunemployment, making some of the concerned misuse it just to re-gain eligibility for full amount of socialbenefits.
Amendments to the Employment Act presented by the MPs in November 2001 also attempted toresolve the problem of long-term unemployment in Slovakia, through introducing concessions for thosewho employ long-term unemployed (such as compensation of travel costs, so-called agreed job positionsfor graduates). Those measures could, for a transitory period of time, increase labor mobility and givethe long-term unemployment a chance to find a job. At the same time, however, they represent butpartial and selective attempts to reduce unemployment in Slovakia.
The new Labor Code (of July 2001) represented the second stage of the labor law reform, intended toprovide for an optimum functioning of the market economy. This goal, however, failed. To the contrary,the new Labor Code made the business environment and the labor market even less flexible as it broughtin excessive legal regulation, leaving but minimum space for arrangements of the relationships by theparties of the labor relationship. The rigid nature of the law shows above all in the provisions regulatingthe establishment and termination of the employment relationship, working time and collective relations.The negative impacts of the new Labor Code could become manifested in increases of the overallproduction costs of enterprises, in a worsening of their competitiveness, unwillingness of employers tosign new employment contracts, spreading of shadow labor and unemployment, as well as in asubsequent reduction of the quality of life in Slovakia. Some few faults of the new code could betemporarily resolved by small amendment to the Labor Code adopted by MPs in March 2002.
The new Civil Service Act (of July 2001), which became part of an extensive reform of the labor law,determined that clerks would not be assigned to civil service automatically; rather, they would need topass qualification exams after attending training courses. The performance of civil servants will beappraised at regular yearly intervals. The appraisal will be the basis for further career development. Ableand gifted officers will have opportunities to speed up their salary promotion and careers. Many expertsagreed that the government-presented Civil Service Act did not achieve its goal to make civil servicemore flexible and efficient. Some provisions overly “reinforced” some job positions in civil service again,as they made impossible to lay off low quality staff quickly and cheaply. The new government showedcommitment to amend the Civil Service Act.
N a t i o n a l H um an D e v e l o p m e n t R e p o r t S l o v a k R e p ub l i c 2001-2002
E v a l u a t i o n o f t h e R e f o r m A tm o s p he r e 36
N a t i o n a l H um an D e v e l o p m e n t R e p o r t S l o v a k R e p ub l i c 2001-2002
E v a l u a t i o n o f t h e R e f o r m A tm o s p he r e37
2.4.3 Measures in the Education Sector
In 2002, Slovakia’s education and science sector will have approximately SKK 40 bn available. Theoverall public expenditures on education represented SKK 38.27 bn in 2000, i.e., 4.31 percent of GDP.Just for the sake of comparison, their volume was SKK 14.15 bn in 1990, i.e., 5.49 percent of GDP. Inrecent years, some SKK 3.5 bn become usually allocated in the National Budget annually to financescience and technology in Slovakia, representing about 0.35 percent of GDP in 2001 (the totalexpenditures on research and development expressed in terms of GDP within 1996-2000 were: SlovakRepublic 0.8 percent, Czech Republic 1.2 percent, EU 15 average 1.8 percent, USA 2.7 percent, Japan3.1 percent, Sweden 3.8 percent). Universities were allocated SKK 7.4 bn for their activities under the2002 State Budget, being SKK 1.2 bn more than the year before. In this way, the level of 0.71 percent ofGDP was reached (1999 – SKK 5.45 bn, i.e. 0.7 percent on GDP; 1992 – SKK 3.25 bn, i.e., 0.98 percenton GDP).50
The majority of the measures concerning universities and colleges (U&C) is expected to be based onthe Concept of the Development of Tertiary Education for the 21st Century, approved by the governmentin September 2000 (see also chapter 2.3). The conceptual document defined the objective of the reformof the Slovak tertiary education sector as establishing of conditions enabling the universities in Slovakiato face international competition. Every year, volumes of funds should be allocated under the StateBudget to achieve, within three years, an increase of the GDP proportion from approximately 0.6-0.7percent in 2000 to 1 percent in 2003, thus pushing the SR closer to the average of the OECD MemberStates – 1.33 percent of GDP. The concept suggested that the numbers of students be increased, adifferentiated system of remuneration of university teachers to be introduced, and the universities tobecome transformed from budgetary organizations to so-called public schools financed from multiplesources rather than from the State Budget alone; as a consequence, administrators of state propertywould become the owners. The authors of the concept also presented two variants of tuition fees; noneof them was however accepted. The issue of tuition fees at universities has remained open.
In November 2001, the government decided to approve the suggestion to pay tuition fees fordistance studies at universities. The intention was to legalize and legally regulate the status quo;universities collect fees through a variety of firms and foundations, receiving but a small portion of thefunds the students pay. Tuition fees should range between ten percent and seventy percent of thecurrent costs per student spent during the preceding year, representing SKK 5,500-38,500.
The new Universities Act adopted by the National Council of the Slovak Republic in February 2002 wasdrafted to, a.o., confirm the form of the payment of tuition fees for distance university studies or to leavethem “free of charge”. Eventually, the MPs turned down (by the majority of one vote) the suggestion tointroduce payments of tuition fees for distance studies as suggested by the government. Thus, studentswill pay fees only for exceeding the scheduled regular duration of studies. Many universities considereddiscontinuing their distance programs, which threatened to concern about 30,000 students. Theprevailing opinion voiced by the professional public was that a certain form of payments for universitystudies should have been adopted, not only to raise the necessary additional resources for the tertiaryeducation sector, but also to underline the aspect of education as being a form of investment. The fact isto be considered as socially unjust that the current model of financing tertiary education in Slovakia,which only benefits a narrow group of people, burdens all the taxpayers. Slovakia’s universities needcompetition among the schools to be introduced, to become directed towards provision of marketservices, which in the future will require direct involvement on the part of students who will have to payfor being trained and educated. Many experts stated that the reform of Slovakia’s tertiary educationsector has stopped halfway.
Pursuant to the Act, U&C will no longer be state-run entities, turning into public law institutions (so-called public U&C). Instead of administering state property, they will now become owners of it and willstart to manage themselves independently. The new law envisages several methods of how to audit theuse of funds; this will be done through the Ministry of Education, academic senate of the university andfaculty, as well as through a newly established body, the U&C Administrative Board. The establishment ofthis new institution has been met with criticism since it was given the right of veto concerning issues ofmanagement property received from State, and because some of its members should be appointed byMinister of Education, i.e., a representative of political power.
The new U&C Act restricted the autonomy of faculties and transferred some competencies taken fromthem to the rector and the university, which was negatively perceived by a significant portion of theacademic community. Objections were also voiced against the year on year increase of the numbers ofstudents restricted by the State (because of contributing funds to U&C), against the overall system of
50 Source: National Report on Education Policy. SGI, INEKO, Bratislava 2001; National Report on Science and Technology Policy.SGI, Bratislava 2002; Dado, M.: Wanting to Become a Partner to Economically Developed Countries. SME 31 Oct. 2001;„Education: More Funds, Reform Changes, and Higher Salaries in 2002, SITA, 3 January 2002
N a t i o n a l H um an D e v e l o p m e n t R e p o r t S l o v a k R e p ub l i c 2001-2002
E v a l u a t i o n o f t h e R e f o r m A tm o s p he r e 38
checking the management of universities by self-governing bodies on the part of Ministry of Education,against awarding university rights to institutions of non-university nature. In addition, the absence of alink between Slovakia’s tertiary education sector and the labor market and between science and researchhas been criticized; this absence is certainly not to the benefit of the competitiveness of the economy.
For years, interest in university studies has exceeded capacity and the financial potential of theschools (the numbers of students enrolling at universities have almost doubled between 1990-2000:there were 63,784 and 124,336 students in 1990 and 2000, respectively). Consequently, thegovernment decided to allocate sufficient funds for 2000 to allow a ten percent increase in the number ofuniversity students, envisaged to bring the Slovak Republic closer to the European average number ofstudents and university graduates. In Slovakia, about eighteen percent of the population aged 18-24years is enrolled at universities; the corresponding ratio for the EU is approximately 23 percent. Theprincipal problem of the current tertiary education sector in Slovakia, however, is it low quality ratherthan a lack of students.
To raise the attractiveness of the teacher’s profession and thus to restrict the drain of good qualityteachers, salaries were raised in the education sector. The tariff salaries of teachers were increased bythirty percent since April 2002; at the same time, the variable portion of remuneration (based onpersonal performance appraisal) was reduced from nine percent to six percent of the overall volume ofwages. Reduction of the variable portion of the salary preserves the system of compensations in theeducation system without incentives, thus creating ample space for corruption.
The reform steps in the primary and secondary education sector should be based on the Concept ofthe Development of Education and Training and the National Education and Training Program for theNext 20 Years, so-called Millennium Project (December 2001). The document deals with changes to beintroduced into the various elements of life-long learning (from maternity schools up to tertiary and post-graduate education). The Ministry of Education presented in October 2001 draft of an extensive new lawfor public discussion regulating education and training at schools and school establishments, so-calledEducation Act, which is intended to regulate the conditions and the contents of the learning process,rights and responsibilities of the stakeholders and institutions, as well as the mechanisms and tools to beused to shape them.
In 1999, Project Infovek (Info-age) was launched to improve the level of informatization of teachinginstitutions. Its principal aim is to set up, within the time frame of four to five years, informationclassrooms at all elementary and secondary schools, equipped with ten computers on average, withInternet connectivity, which would be used in the education process.
The amendment to the Act on the Financing of Elementary and Secondary Schools enabled (since2002) church and private schools to receive one hundred percent state grants paid to state schools forregular operations; this created conditions to make various types of schools partly equal. Free choice ofschools will have a positive effect on the competition among the schools, enabling an improvement oftheir quality and development of alternative education. Any church or private school, however, collectingregular tuition fees will receive grants reduced by thirty percent, and additional ten percent will be cut ifcurricula and study plans comparable with those applicable at state schools are not applied. This aspectbecame subject of criticism. As before, non-state schools will not be eligible to receive capitalinvestments covered; however, the State will lease to them textbooks, computers and other movableassets free of charge.
2.4.4 Measures in the Health Care Sector
According to the data provided by Ministry of Health (MH SR), the total expenditures on the healthcare system of the SR represented SKK 59.3 bn in 2000 (net of privatization proceeds worth SKK 3.5bn), corresponding to 6.7 percent of GDP. The Slovak health sector had SKK 65.6 bn available in 2001(apart from privatization proceeds amounting to about SKK 6 bn), representing more than 6.8 percent ofGDP. Slovakia spends a similar percentage of GDP on health care, as do several developed Europeancountries; however, if expressed in terms of purchasing power parity, the overall expenditures fallbehind. Health sector debt reached SKK 15 bn in 2000; some experts, however, claimed it to besubstantially higher, in excess of SKK 20 bn, continuously increasing SKK 700 million a month. Thecurrent external debt (vis-à-vis external creditors) reaches almost SKK 30 bn, whereas the internal debt(moral wear of the equipment) exceeds SKK 50 bn. The public perceives the health sector as onecharacterized by the highest extent of corruption in the society (the volume of informal payments has
N a t i o n a l H um an D e v e l o p m e n t R e p o r t S l o v a k R e p ub l i c 2001-2002
E v a l u a t i o n o f t h e R e f o r m A tm o s p he r e39
been estimated at SKK 12 bn). The professional public continues to point out the huge reserves in themanagement of the sector and the need to undertake a principal reform. 51
After the scandalous treatment of the President of the SR in the summer of 2000, the Minister ofHealth was replaced. The new Minister intended to speed up the transformation of the health caresystem. This required to complete the rationalization (reduction) of the network of health-serviceinstitutions and to change the method of their management. Hospitals were envisaged to bedenationalized and transformed into non-profit public benefit institutions. The central method of controlwas bound to be changed into a self-governed system, with competencies devolved to healthprofessionals. Development of multi-source financing of health care was envisaged, requiring theadoption of new laws on health insurance and supplementary health insurance. These steps also requiredsome unpopular cuts in the consumption of medicines, health-service institutions and headcount in thehealth sector.
One outcome of the protest events undertaken by health professionals, who requested the adoptionof a realistic concept of transformation of the health sector by the end of 2000, was the drafting of acomprehensive document entitled Analysis of the Management within the Health Care System andsuggestions for measures to improve the management and the financial standing of the health caresystem. The documents were drafted by the Ministry of Health. Apart from an analysis of the status quo,the document also contained the principal objectives of the reform, measures and conditions of theirimplementation. Among the principal objectives of the health sector’s reform, the concept includedbalanced management of the system, increase in public funds (in 2001, public funds accounted for 92.3percent in Slovakia, those within the EU for 75%t-80% percent of the cost coverage), raising the activeeconomic participation of citizens on health care (HC), increasing the share of private resources onexpenditures (the document however failed to suggest a specific figure, and this prevents the defining ofthe specific scope of services of basic HC financed under the principal obligatory health insurancescheme, which is an issue of principal significance for the reform), reduction of the scope of health careprovided under the obligatory health insurance scheme (covering almost the whole range of HCinterventions), and rationalization measures. Health insurance was intended to be split into basicobligatory insurance covering the basic HC standard, voluntary supplementary insurance covering HC notcovered under the basic insurance scheme, and supplementary insurance to cover above-standardservices (such as the standard of the hospital room). As of 2002, there should have been a state benefitto cover uninsurable risks (organ transplantation, oncological diseases, emergency aid); the calculationbase for the insurance premium should have been increased (the base according to which State payshealth insurance premium from State Budget for economically inactive individuals). It was furtherenvisaged to reduce the mandatory rate for state payments from fourteen percent to ten percent, thus tothe same level as employers pay. The system was expected to become rationalized through the provisionof HC in the form of daily diagnosis and therapy, which was expected to shorten the average time ofattendance; through reducing the numbers of acute care beds in stationary health-service institutions tothe European average (5 per 1,000 individuals; in the SR there are 6 acute care beds per 1,000,Bratislava has even 11.2); devolution of competencies in the area of health services and goods priceregulation to MH SR; reduction of consumption of medicines through guiding doctors to make moreefficient decisions on drug expenditures.
Although welcoming the draft concept of health sector reform, experts kept stressing that all previousgovernments had declared the intention of reforming the health sector but did not start acting byadopting specific steps leading to recovery. As also evidenced by the developments during the last fouryears, transformation of the health sector remains an intention that cannot be achieved unless there isreal political will to pursue this agenda. Partial non-systemic measures were adopted instead of reforms,which were expected to mitigate problems in the health sector temporarily, but postponing the realsolution to them. Consequences rather than reasons for the bad condition of the health sector wereaddressed. Such attitudes intensified the indebtedness of the sector or simply shifted the burden to otherhealth care providers. As examples may be mentioned the inadequate payment by State on behalf of itsinsured, inadequate coverage of price measures concerning maximum and minimum prices for health-service institutions, ban on execution of health insurance funds, as well as inadequate coverage of salaryraises of health professionals.
Minister of Health suggested that there be a sole, state determined health insurance company (HIC)to collect basic obligatory insurance premium as soon as the current health insurance system is changed;when it comes to additional insurance covering some higher standard, the insured would pay to a non-state HIC at their own choice. Minister claims that the registration of the insured with a single HIC wouldenable more efficient management of expenditures, and provision of all information needed for analyticaland control processes. Experts viewed the suggestion to monopolize basic health insurance as a measure
51 Source: Ministry of Health of the SR; WHO; Pažitný, P. - Zajac, R.: Strategy of the Health Sector Reform – a Real Reform forthe Citizen, M.E.S.A. 10, Bratislava 2001; Zajac, R. - Pažitný, P.: The Health Sector, in: Slovakia 2001 – Summary Report onthe Status of the Society, IVO, Bratislava 2001; Pažitný, P.: Health Sector Reform for the Citizen, SME 11 Oct. 2002
N a t i o n a l H um an D e v e l o p m e n t R e p o r t S l o v a k R e p ub l i c 2001-2002
E v a l u a t i o n o f t h e R e f o r m A tm o s p he r e 40
that will not help resolve problems of the health care system. By abolishing plurality, stability of thehealth insurance system could be undermined. What is needed is to eliminate State as monopolisticpurchaser that dictates the scope of health care services and the prices it pays as this – under thecurrent conditions – causes a permanent growth of the HC system deficit. Health insurance companiesshould be instead transformed from mere redistributors of state funds into business entities providingstandard coverage of health risks to the population. The system of the single HIF to organize basicinsurance was envisaged to start towards the end of 2001, but did not occur and was rejected.
The price decree for the health sector of December 2001 prompted dissatisfaction of private doctorswho requested an improved compensation of their work; the decree enabled per capita payments(regular payments per every patient recorded) could be both increased and decreased (because of non-rational prescription of medicines). In the opinion of the observers, the price measure suggested thedesirable direction towards performance-based compensation of health professionals, being however buta cosmetic ad hoc regulation.
Another measure that aimed at transiently stop the outflow of funds intended for regular operation ofhealth-service institutions was ban on execution of health insurance companies and health care facilities.The measures eliminated consequences while not attempting to resolve the reasons for the bad conditionof Slovakia’s health system. The aim of the first amendment to the Rules of Execution of July 2001 wasto exclude, for a period of six months, assets of health-service institutions and health insurancecompanies from execution, thus gain time to raise SKK 9.5 bn from privatization for the health sector.Another amendment followed in December, 2001 which extended the ban on execution in the healthsector through the end of 2002, thus preventing creditors of health insurance companies and health careproviders to collect their receivables through court executors. The amendment to the Executors Act wasborn mainly because of the state-owned Všeobecná zdravotná poisťovňa (General Health InsuranceCompany, VšZP), which owed pharmacies in excess of SKK 6 bn for medicines, and the volume of itsliabilities vis-à-vis doctors and hospitals exceeded SKK 1 billion. The measure disfavored one group ofcreditors, thus establishing inequality of contracting parties. The inability of creditors to collect theirreceivables represents a distortion of the economic environment and does not provide any incentives todebtors to manage rationally and efficiently (so-called moral hazard). Extension of the ban on executionof health insurance funds will result in intensified corruption.
A new price measure issued by Ministry of Health introduced a new system of payments for healthcare provided, effective April 2002; payments will be based on interventions contracted between healthinsurance companies and hospitals. Health insurance companies will be ordering with hospitalsinterventions for a period of three months in advance, which the funds are able and willing to finance inthe given health-service institution. If the hospital exceeds the contracted limits for specific services, itwill receive no payment for them from the health insurance fund. In the opinion of experts, the problemof contracts resides in the fact that such contracts arose virtually without any economic calculations andcontractual freedom, as the majority of the hospitals still remain in state hands and their existence isdirectly dependent on financial transfers of the largest health insurance company, Všeobecná zdravotnápoisťovňa (VšZP), whose solvency is being guaranteed by State. Hospital expenditures should rather becontrolled by private insurance funds operating in a competitive environment. The change of thepayment mechanism was just a way out of troubles of Slovakia’s health sector, which lives beyond itsmeans, failing to account for the current performance of the economy. As a result, only numbers ofpatients should be attended, which can be covered by public resources; this is expected to exertpressure upon hospitals to make their activities more efficient. The measure can be perceived as asuggestion to resolve problems of Slovakia’s health sector, but it still remains an isolated attempt to cutthe costs of health care. Partial steps will not resolve the essence of the problem, which is the so-calledfree-of-charge health system; they merely delay the bankruptcy of the system.
One method how to contribute to a more significant elimination of State’s influence on the healthsector is to privatize health-service institutions. This is one of the prerequisites for an actualtransformation of the health sector. Medical centers and outpatient departments now have real ownerswho will be responsible to manage their resources and their own property. As a disadvantage of theprocess, everything was running in a non-functional and non-reformed environment. Overall, 169 health-service institutions had to be released from state hands. Another form of denationalization of health-service institutions was their free-of-charge transfer to towns and villages. According to the initial idea,State should have transferred health-service institutions to local governments free of debt, thegovernment however subsequently decided that they are to be transferred together with their liabilities.Under the public service decentralization program, some independent offices, nursing homes for thechronically ill, hospices, psychiatric institutions, outpatient departments and stationary establishments,type I and II hospitals should go over under the administration of local municipalities and higher-tierterritorial units (VÚCs) as of January 2003. Ministry of Health reserves the right to audit thedenationalized health-service institutions. Probably, it is the new government that will complete theprivatization in the health sector.
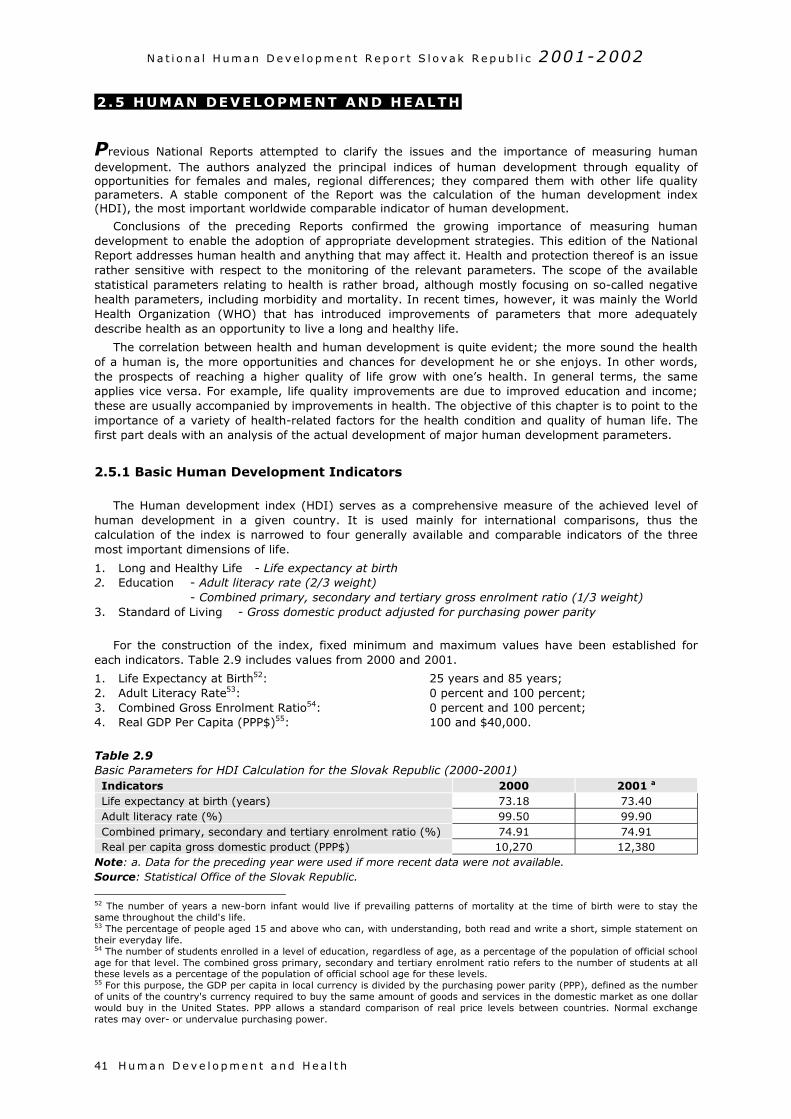
N a t i o n a l H um an D e v e l o p m e n t R e p o r t S l o v a k R e p ub l i c 2001-2002
H u m a n D e v e l o p m e n t a nd He a l t h41
2 .5 HUMAN DEVELOPMENT AND HEALTH
Previous National Reports attempted to clarify the issues and the importance of measuring humandevelopment. The authors analyzed the principal indices of human development through equality ofopportunities for females and males, regional differences; they compared them with other life qualityparameters. A stable component of the Report was the calculation of the human development index(HDI), the most important worldwide comparable indicator of human development.
Conclusions of the preceding Reports confirmed the growing importance of measuring humandevelopment to enable the adoption of appropriate development strategies. This edition of the NationalReport addresses human health and anything that may affect it. Health and protection thereof is an issuerather sensitive with respect to the monitoring of the relevant parameters. The scope of the availablestatistical parameters relating to health is rather broad, although mostly focusing on so-called negativehealth parameters, including morbidity and mortality. In recent times, however, it was mainly the WorldHealth Organization (WHO) that has introduced improvements of parameters that more adequatelydescribe health as an opportunity to live a long and healthy life.
The correlation between health and human development is quite evident; the more sound the healthof a human is, the more opportunities and chances for development he or she enjoys. In other words,the prospects of reaching a higher quality of life grow with one’s health. In general terms, the sameapplies vice versa. For example, life quality improvements are due to improved education and income;these are usually accompanied by improvements in health. The objective of this chapter is to point to theimportance of a variety of health-related factors for the health condition and quality of human life. Thefirst part deals with an analysis of the actual development of major human development parameters.
2.5.1 Basic Human Development Indicators
The Human development index (HDI) serves as a comprehensive measure of the achieved level ofhuman development in a given country. It is used mainly for international comparisons, thus thecalculation of the index is narrowed to four generally available and comparable indicators of the threemost important dimensions of life.
1. Long and Healthy Life - Life expectancy at birth2. Education - Adult literacy rate (2/3 weight)
- Combined primary, secondary and tertiary gross enrolment ratio (1/3 weight)3. Standard of Living - Gross domestic product adjusted for purchasing power parity
For the construction of the index, fixed minimum and maximum values have been established foreach indicators. Table 2.9 includes values from 2000 and 2001.
1. Life Expectancy at Birth52: 25 years and 85 years;2. Adult Literacy Rate53: 0 percent and 100 percent;3. Combined Gross Enrolment Ratio54: 0 percent and 100 percent;4. Real GDP Per Capita (PPP$)55: 100 and $40,000.
Table 2.9Basic Parameters for HDI Calculation for the Slovak Republic (2000-2001)Indicators 2000 2001 a
Life expectancy at birth (years) 73.18 73.40Adult literacy rate (%) 99.50 99.90Combined primary, secondary and tertiary enrolment ratio (%) 74.91 74.91Real per capita gross domestic product (PPP$) 10,270 12,380
Note: a. Data for the preceding year were used if more recent data were not available.Source: Statistical Office of the Slovak Republic.
52 The number of years a new-born infant would live if prevailing patterns of mortality at the time of birth were to stay thesame throughout the child's life.53 The percentage of people aged 15 and above who can, with understanding, both read and write a short, simple statement ontheir everyday life.54 The number of students enrolled in a level of education, regardless of age, as a percentage of the population of official schoolage for that level. The combined gross primary, secondary and tertiary enrolment ratio refers to the number of students at allthese levels as a percentage of the population of official school age for these levels.55 For this purpose, the GDP per capita in local currency is divided by the purchasing power parity (PPP), defined as the numberof units of the country's currency required to buy the same amount of goods and services in the domestic market as one dollarwould buy in the United States. PPP allows a standard comparison of real price levels between countries. Normal exchangerates may over- or undervalue purchasing power.
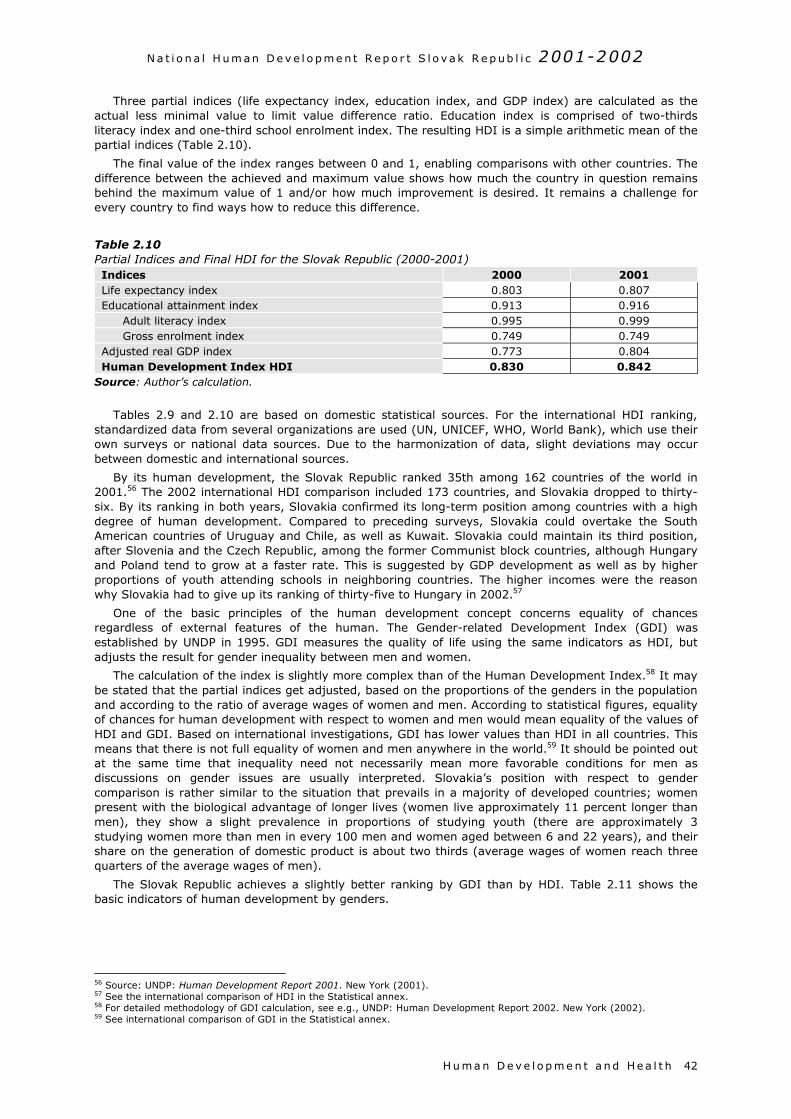
N a t i o n a l H um an D e v e l o p m e n t R e p o r t S l o v a k R e p ub l i c 2001-2002
H u m a n D e v e l o p m e n t a nd He a l t h 42
Three partial indices (life expectancy index, education index, and GDP index) are calculated as theactual less minimal value to limit value difference ratio. Education index is comprised of two-thirdsliteracy index and one-third school enrolment index. The resulting HDI is a simple arithmetic mean of thepartial indices (Table 2.10).
The final value of the index ranges between 0 and 1, enabling comparisons with other countries. Thedifference between the achieved and maximum value shows how much the country in question remainsbehind the maximum value of 1 and/or how much improvement is desired. It remains a challenge forevery country to find ways how to reduce this difference.
Table 2.10Partial Indices and Final HDI for the Slovak Republic (2000-2001)Indices 2000 2001Life expectancy index 0.803 0.807Educational attainment index 0.913 0.916
Adult literacy index 0.995 0.999Gross enrolment index 0.749 0.749
Adjusted real GDP index 0.773 0.804Human Development Index HDI 0.830 0.842
Source: Author’s calculation.
Tables 2.9 and 2.10 are based on domestic statistical sources. For the international HDI ranking,standardized data from several organizations are used (UN, UNICEF, WHO, World Bank), which use theirown surveys or national data sources. Due to the harmonization of data, slight deviations may occurbetween domestic and international sources.
By its human development, the Slovak Republic ranked 35th among 162 countries of the world in2001.56 The 2002 international HDI comparison included 173 countries, and Slovakia dropped to thirty-six. By its ranking in both years, Slovakia confirmed its long-term position among countries with a highdegree of human development. Compared to preceding surveys, Slovakia could overtake the SouthAmerican countries of Uruguay and Chile, as well as Kuwait. Slovakia could maintain its third position,after Slovenia and the Czech Republic, among the former Communist block countries, although Hungaryand Poland tend to grow at a faster rate. This is suggested by GDP development as well as by higherproportions of youth attending schools in neighboring countries. The higher incomes were the reasonwhy Slovakia had to give up its ranking of thirty-five to Hungary in 2002.57
One of the basic principles of the human development concept concerns equality of chancesregardless of external features of the human. The Gender-related Development Index (GDI) wasestablished by UNDP in 1995. GDI measures the quality of life using the same indicators as HDI, butadjusts the result for gender inequality between men and women.
The calculation of the index is slightly more complex than of the Human Development Index.58 It maybe stated that the partial indices get adjusted, based on the proportions of the genders in the populationand according to the ratio of average wages of women and men. According to statistical figures, equalityof chances for human development with respect to women and men would mean equality of the values ofHDI and GDI. Based on international investigations, GDI has lower values than HDI in all countries. Thismeans that there is not full equality of women and men anywhere in the world.59 It should be pointed outat the same time that inequality need not necessarily mean more favorable conditions for men asdiscussions on gender issues are usually interpreted. Slovakia’s position with respect to gendercomparison is rather similar to the situation that prevails in a majority of developed countries; womenpresent with the biological advantage of longer lives (women live approximately 11 percent longer thanmen), they show a slight prevalence in proportions of studying youth (there are approximately 3studying women more than men in every 100 men and women aged between 6 and 22 years), and theirshare on the generation of domestic product is about two thirds (average wages of women reach threequarters of the average wages of men).
The Slovak Republic achieves a slightly better ranking by GDI than by HDI. Table 2.11 shows thebasic indicators of human development by genders.
56 Source: UNDP: Human Development Report 2001. New York (2001).57 See the international comparison of HDI in the Statistical annex.58 For detailed methodology of GDI calculation, see e.g., UNDP: Human Development Report 2002. New York (2002).59 See international comparison of GDI in the Statistical annex.
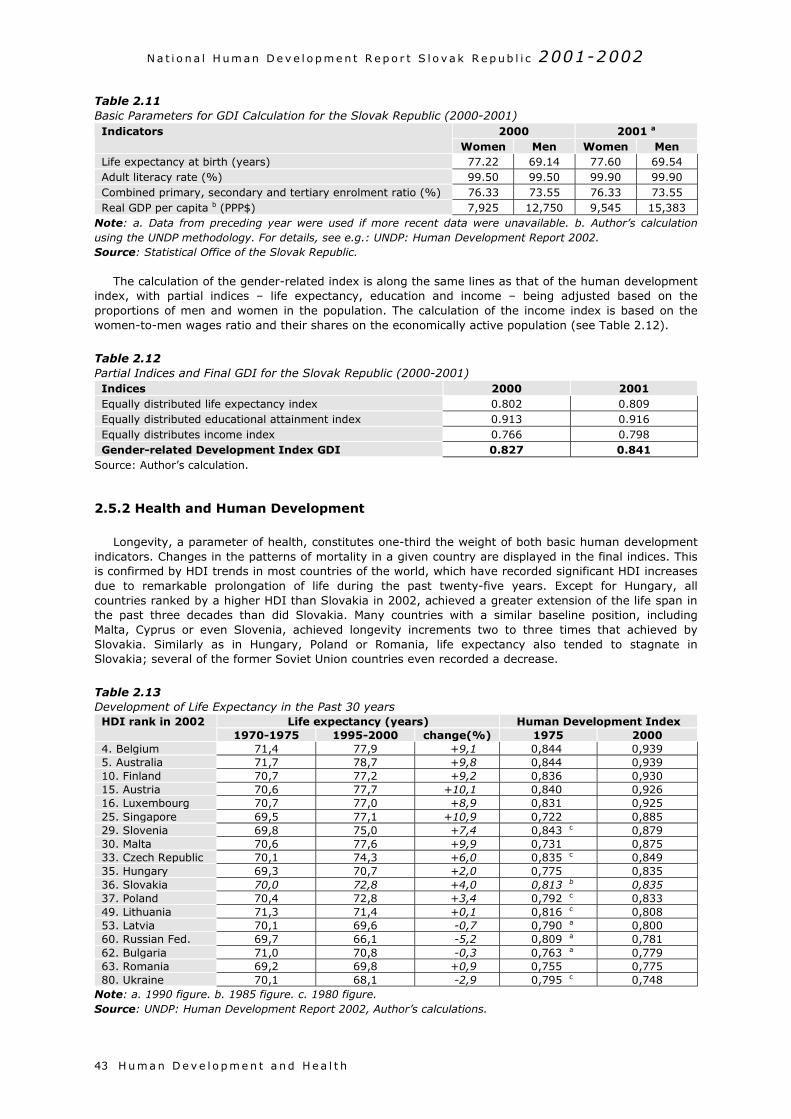
N a t i o n a l H um an D e v e l o p m e n t R e p o r t S l o v a k R e p ub l i c 2001-2002
H u m a n D e v e l o p m e n t a nd He a l t h43
Table 2.11Basic Parameters for GDI Calculation for the Slovak Republic (2000-2001)
2000 2001 aIndicatorsWomen Men Women Men
Life expectancy at birth (years) 77.22 69.14 77.60 69.54Adult literacy rate (%) 99.50 99.50 99.90 99.90Combined primary, secondary and tertiary enrolment ratio (%) 76.33 73.55 76.33 73.55Real GDP per capita b (PPP$) 7,925 12,750 9,545 15,383
Note: a. Data from preceding year were used if more recent data were unavailable. b. Author’s calculationusing the UNDP methodology. For details, see e.g.: UNDP: Human Development Report 2002.Source: Statistical Office of the Slovak Republic.
The calculation of the gender-related index is along the same lines as that of the human developmentindex, with partial indices – life expectancy, education and income – being adjusted based on theproportions of men and women in the population. The calculation of the income index is based on thewomen-to-men wages ratio and their shares on the economically active population (see Table 2.12).
Table 2.12Partial Indices and Final GDI for the Slovak Republic (2000-2001)Indices 2000 2001Equally distributed life expectancy index 0.802 0.809Equally distributed educational attainment index 0.913 0.916Equally distributes income index 0.766 0.798Gender-related Development Index GDI 0.827 0.841
Source: Author’s calculation.
2.5.2 Health and Human Development
Longevity, a parameter of health, constitutes one-third the weight of both basic human developmentindicators. Changes in the patterns of mortality in a given country are displayed in the final indices. Thisis confirmed by HDI trends in most countries of the world, which have recorded significant HDI increasesdue to remarkable prolongation of life during the past twenty-five years. Except for Hungary, allcountries ranked by a higher HDI than Slovakia in 2002, achieved a greater extension of the life span inthe past three decades than did Slovakia. Many countries with a similar baseline position, includingMalta, Cyprus or even Slovenia, achieved longevity increments two to three times that achieved bySlovakia. Similarly as in Hungary, Poland or Romania, life expectancy also tended to stagnate inSlovakia; several of the former Soviet Union countries even recorded a decrease.
Table 2.13Development of Life Expectancy in the Past 30 years
Life expectancy (years) Human Development IndexHDI rank in 20021970-1975 1995-2000 change(%) 1975 2000
4. Belgium 71,4 77,9 +9,1 0,844 0,9395. Australia 71,7 78,7 +9,8 0,844 0,93910. Finland 70,7 77,2 +9,2 0,836 0,93015. Austria 70,6 77,7 +10,1 0,840 0,92616. Luxembourg 70,7 77,0 +8,9 0,831 0,92525. Singapore 69,5 77,1 +10,9 0,722 0,88529. Slovenia 69,8 75,0 +7,4 0,843 c 0,87930. Malta 70,6 77,6 +9,9 0,731 0,87533. Czech Republic 70,1 74,3 +6,0 0,835 c 0,84935. Hungary 69,3 70,7 +2,0 0,775 0,83536. Slovakia 70,0 72,8 +4,0 0,813 b 0,83537. Poland 70,4 72,8 +3,4 0,792 c 0,83349. Lithuania 71,3 71,4 +0,1 0,816 c 0,80853. Latvia 70,1 69,6 -0,7 0,790 a 0,80060. Russian Fed. 69,7 66,1 -5,2 0,809 a 0,78162. Bulgaria 71,0 70,8 -0,3 0,763 a 0,77963. Romania 69,2 69,8 +0,9 0,755 0,77580. Ukraine 70,1 68,1 -2,9 0,795 c 0,748
Note: a. 1990 figure. b. 1985 figure. c. 1980 figure.Source: UNDP: Human Development Report 2002, Author’s calculations.
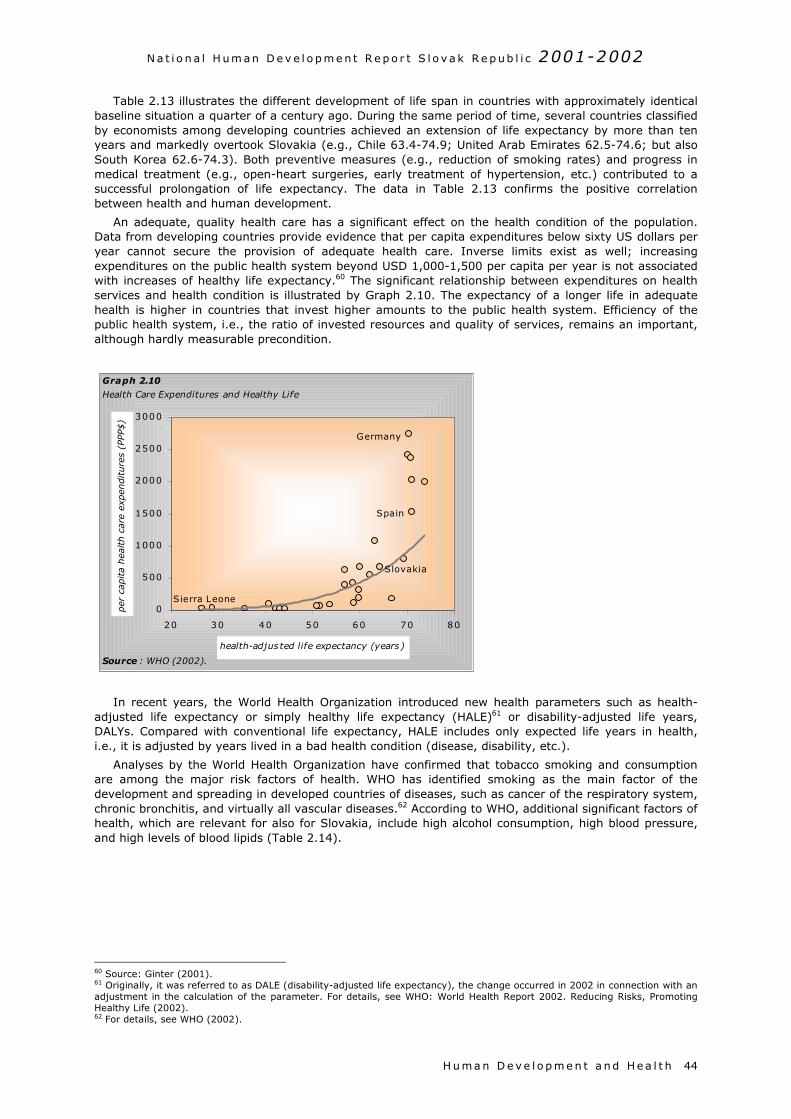
N a t i o n a l H um an D e v e l o p m e n t R e p o r t S l o v a k R e p ub l i c 2001-2002
H u m a n D e v e l o p m e n t a nd He a l t h 44
Table 2.13 illustrates the different development of life span in countries with approximately identicalbaseline situation a quarter of a century ago. During the same period of time, several countries classifiedby economists among developing countries achieved an extension of life expectancy by more than tenyears and markedly overtook Slovakia (e.g., Chile 63.4-74.9; United Arab Emirates 62.5-74.6; but alsoSouth Korea 62.6-74.3). Both preventive measures (e.g., reduction of smoking rates) and progress inmedical treatment (e.g., open-heart surgeries, early treatment of hypertension, etc.) contributed to asuccessful prolongation of life expectancy. The data in Table 2.13 confirms the positive correlationbetween health and human development.
An adequate, quality health care has a significant effect on the health condition of the population.Data from developing countries provide evidence that per capita expenditures below sixty US dollars peryear cannot secure the provision of adequate health care. Inverse limits exist as well; increasingexpenditures on the public health system beyond USD 1,000-1,500 per capita per year is not associatedwith increases of healthy life expectancy.60 The significant relationship between expenditures on healthservices and health condition is illustrated by Graph 2.10. The expectancy of a longer life in adequatehealth is higher in countries that invest higher amounts to the public health system. Efficiency of thepublic health system, i.e., the ratio of invested resources and quality of services, remains an important,although hardly measurable precondition.
In recent years, the World Health Organization introduced new health parameters such as health-adjusted life expectancy or simply healthy life expectancy (HALE)61 or disability-adjusted life years,DALYs. Compared with conventional life expectancy, HALE includes only expected life years in health,i.e., it is adjusted by years lived in a bad health condition (disease, disability, etc.).
Analyses by the World Health Organization have confirmed that tobacco smoking and consumptionare among the major risk factors of health. WHO has identified smoking as the main factor of thedevelopment and spreading in developed countries of diseases, such as cancer of the respiratory system,chronic bronchitis, and virtually all vascular diseases.62 According to WHO, additional significant factors ofhealth, which are relevant for also for Slovakia, include high alcohol consumption, high blood pressure,and high levels of blood lipids (Table 2.14).
60 Source: Ginter (2001).61 Originally, it was referred to as DALE (disability-adjusted life expectancy), the change occurred in 2002 in connection with anadjustment in the calculation of the parameter. For details, see WHO: World Health Report 2002. Reducing Risks, PromotingHealthy Life (2002).62 For details, see WHO (2002).
0
500
1000
1500
2000
2500
3000
20 30 40 50 60 70 80
health-adjus ted life expectancy (years)
per
cap
ita
hea
lth c
are
expen
diture
s (P
PP$)
Sierra Leone
Germany
Slovakia
Spain
Source : WHO (2002).
Graph 2.10
Health Care Expenditures and Healthy Life
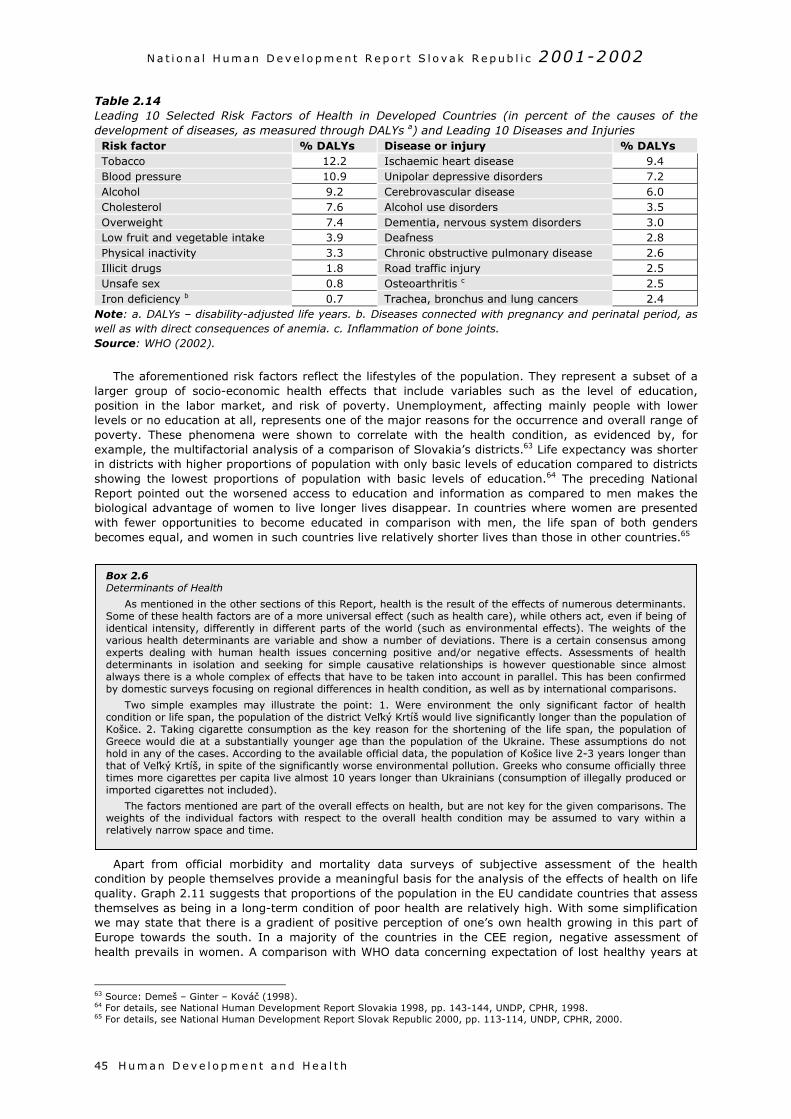
N a t i o n a l H um an D e v e l o p m e n t R e p o r t S l o v a k R e p ub l i c 2001-2002
H u m a n D e v e l o p m e n t a nd He a l t h45
Table 2.14Leading 10 Selected Risk Factors of Health in Developed Countries (in percent of the causes of thedevelopment of diseases, as measured through DALYs a) and Leading 10 Diseases and InjuriesRisk factor % DALYs Disease or injury % DALYsTobacco 12.2 Ischaemic heart disease 9.4Blood pressure 10.9 Unipolar depressive disorders 7.2Alcohol 9.2 Cerebrovascular disease 6.0Cholesterol 7.6 Alcohol use disorders 3.5Overweight 7.4 Dementia, nervous system disorders 3.0Low fruit and vegetable intake 3.9 Deafness 2.8Physical inactivity 3.3 Chronic obstructive pulmonary disease 2.6Illicit drugs 1.8 Road traffic injury 2.5Unsafe sex 0.8 Osteoarthritis c 2.5Iron deficiency b 0.7 Trachea, bronchus and lung cancers 2.4
Note: a. DALYs – disability-adjusted life years. b. Diseases connected with pregnancy and perinatal period, aswell as with direct consequences of anemia. c. Inflammation of bone joints.Source: WHO (2002).
The aforementioned risk factors reflect the lifestyles of the population. They represent a subset of alarger group of socio-economic health effects that include variables such as the level of education,position in the labor market, and risk of poverty. Unemployment, affecting mainly people with lowerlevels or no education at all, represents one of the major reasons for the occurrence and overall range ofpoverty. These phenomena were shown to correlate with the health condition, as evidenced by, forexample, the multifactorial analysis of a comparison of Slovakia’s districts.63 Life expectancy was shorterin districts with higher proportions of population with only basic levels of education compared to districtsshowing the lowest proportions of population with basic levels of education.64 The preceding NationalReport pointed out the worsened access to education and information as compared to men makes thebiological advantage of women to live longer lives disappear. In countries where women are presentedwith fewer opportunities to become educated in comparison with men, the life span of both gendersbecomes equal, and women in such countries live relatively shorter lives than those in other countries.65
Apart from official morbidity and mortality data surveys of subjective assessment of the healthcondition by people themselves provide a meaningful basis for the analysis of the effects of health on lifequality. Graph 2.11 suggests that proportions of the population in the EU candidate countries that assessthemselves as being in a long-term condition of poor health are relatively high. With some simplificationwe may state that there is a gradient of positive perception of one’s own health growing in this part ofEurope towards the south. In a majority of the countries in the CEE region, negative assessment ofhealth prevails in women. A comparison with WHO data concerning expectation of lost healthy years at
63 Source: Demeš – Ginter – Kováč (1998).64 For details, see National Human Development Report Slovakia 1998, pp. 143-144, UNDP, CPHR, 1998.65 For details, see National Human Development Report Slovak Republic 2000, pp. 113-114, UNDP, CPHR, 2000.
Box 2.6Determinants of Health
As mentioned in the other sections of this Report, health is the result of the effects of numerous determinants.Some of these health factors are of a more universal effect (such as health care), while others act, even if being ofidentical intensity, differently in different parts of the world (such as environmental effects). The weights of thevarious health determinants are variable and show a number of deviations. There is a certain consensus amongexperts dealing with human health issues concerning positive and/or negative effects. Assessments of healthdeterminants in isolation and seeking for simple causative relationships is however questionable since almostalways there is a whole complex of effects that have to be taken into account in parallel. This has been confirmedby domestic surveys focusing on regional differences in health condition, as well as by international comparisons.
Two simple examples may illustrate the point: 1. Were environment the only significant factor of healthcondition or life span, the population of the district Veľký Krtíš would live significantly longer than the population ofKošice. 2. Taking cigarette consumption as the key reason for the shortening of the life span, the population ofGreece would die at a substantially younger age than the population of the Ukraine. These assumptions do nothold in any of the cases. According to the available official data, the population of Košice live 2-3 years longer thanthat of Veľký Krtíš, in spite of the significantly worse environmental pollution. Greeks who consume officially threetimes more cigarettes per capita live almost 10 years longer than Ukrainians (consumption of illegally produced orimported cigarettes not included).
The factors mentioned are part of the overall effects on health, but are not key for the given comparisons. Theweights of the individual factors with respect to the overall health condition may be assumed to vary within arelatively narrow space and time.
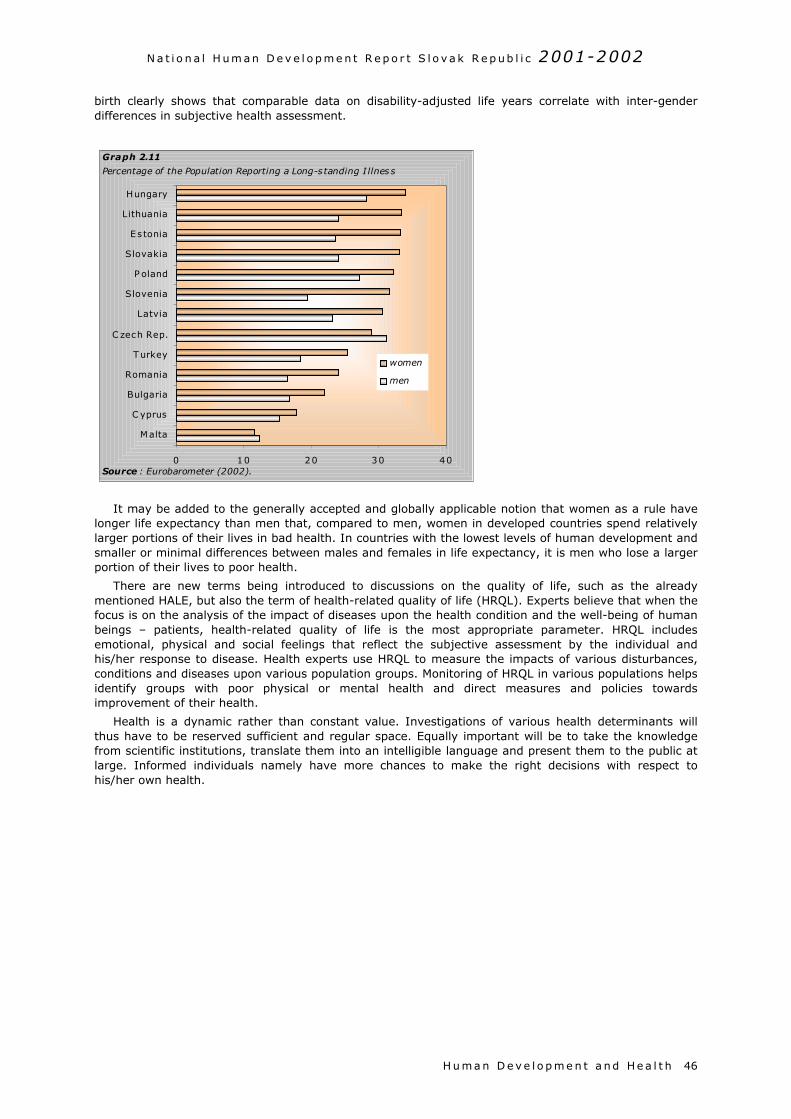
N a t i o n a l H um an D e v e l o p m e n t R e p o r t S l o v a k R e p ub l i c 2001-2002
H u m a n D e v e l o p m e n t a nd He a l t h 46
birth clearly shows that comparable data on disability-adjusted life years correlate with inter-genderdifferences in subjective health assessment.
It may be added to the generally accepted and globally applicable notion that women as a rule havelonger life expectancy than men that, compared to men, women in developed countries spend relativelylarger portions of their lives in bad health. In countries with the lowest levels of human development andsmaller or minimal differences between males and females in life expectancy, it is men who lose a largerportion of their lives to poor health.
There are new terms being introduced to discussions on the quality of life, such as the alreadymentioned HALE, but also the term of health-related quality of life (HRQL). Experts believe that when thefocus is on the analysis of the impact of diseases upon the health condition and the well-being of humanbeings – patients, health-related quality of life is the most appropriate parameter. HRQL includesemotional, physical and social feelings that reflect the subjective assessment by the individual andhis/her response to disease. Health experts use HRQL to measure the impacts of various disturbances,conditions and diseases upon various population groups. Monitoring of HRQL in various populations helpsidentify groups with poor physical or mental health and direct measures and policies towardsimprovement of their health.
Health is a dynamic rather than constant value. Investigations of various health determinants willthus have to be reserved sufficient and regular space. Equally important will be to take the knowledgefrom scientific institutions, translate them into an intelligible language and present them to the public atlarge. Informed individuals namely have more chances to make the right decisions with respect tohis/her own health.
0 10 20 30 40
Malta
C yprus
Bulgaria
Romania
Turkey
C zech Rep.
Latvia
Slovenia
P oland
Slovakia
Estonia
Lithuania
Hungary
women
men
Graph 2.11
Percentage of the Population Reporting a Long-s tanding I llnes s
Source : Eurobarometer (2002).
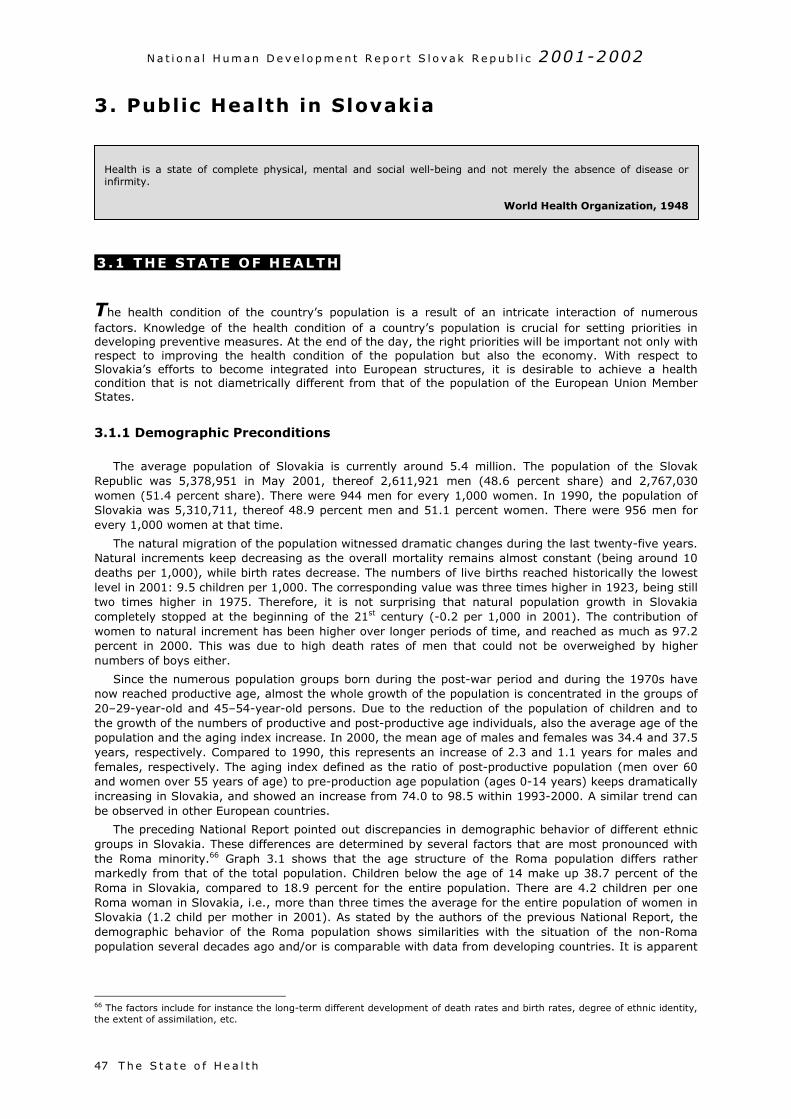
N a t i o n a l H um an D e v e l o p m e n t R e p o r t S l o v a k R e p ub l i c 2001-2002
T he S t a t e o f He a l t h47
3. Public Health in Slovakia
3 .1 THE STATE OF HEALTH
The health condition of the country’s population is a result of an intricate interaction of numerousfactors. Knowledge of the health condition of a country’s population is crucial for setting priorities indeveloping preventive measures. At the end of the day, the right priorities will be important not only withrespect to improving the health condition of the population but also the economy. With respect toSlovakia’s efforts to become integrated into European structures, it is desirable to achieve a healthcondition that is not diametrically different from that of the population of the European Union MemberStates.
3.1.1 Demographic Preconditions
The average population of Slovakia is currently around 5.4 million. The population of the SlovakRepublic was 5,378,951 in May 2001, thereof 2,611,921 men (48.6 percent share) and 2,767,030women (51.4 percent share). There were 944 men for every 1,000 women. In 1990, the population ofSlovakia was 5,310,711, thereof 48.9 percent men and 51.1 percent women. There were 956 men forevery 1,000 women at that time.
The natural migration of the population witnessed dramatic changes during the last twenty-five years.Natural increments keep decreasing as the overall mortality remains almost constant (being around 10deaths per 1,000), while birth rates decrease. The numbers of live births reached historically the lowestlevel in 2001: 9.5 children per 1,000. The corresponding value was three times higher in 1923, being stilltwo times higher in 1975. Therefore, it is not surprising that natural population growth in Slovakiacompletely stopped at the beginning of the 21st century (-0.2 per 1,000 in 2001). The contribution ofwomen to natural increment has been higher over longer periods of time, and reached as much as 97.2percent in 2000. This was due to high death rates of men that could not be overweighed by highernumbers of boys either.
Since the numerous population groups born during the post-war period and during the 1970s havenow reached productive age, almost the whole growth of the population is concentrated in the groups of20–29-year-old and 45–54-year-old persons. Due to the reduction of the population of children and tothe growth of the numbers of productive and post-productive age individuals, also the average age of thepopulation and the aging index increase. In 2000, the mean age of males and females was 34.4 and 37.5years, respectively. Compared to 1990, this represents an increase of 2.3 and 1.1 years for males andfemales, respectively. The aging index defined as the ratio of post-productive population (men over 60and women over 55 years of age) to pre-production age population (ages 0-14 years) keeps dramaticallyincreasing in Slovakia, and showed an increase from 74.0 to 98.5 within 1993-2000. A similar trend canbe observed in other European countries.
The preceding National Report pointed out discrepancies in demographic behavior of different ethnicgroups in Slovakia. These differences are determined by several factors that are most pronounced withthe Roma minority.66 Graph 3.1 shows that the age structure of the Roma population differs rathermarkedly from that of the total population. Children below the age of 14 make up 38.7 percent of theRoma in Slovakia, compared to 18.9 percent for the entire population. There are 4.2 children per oneRoma woman in Slovakia, i.e., more than three times the average for the entire population of women inSlovakia (1.2 child per mother in 2001). As stated by the authors of the previous National Report, thedemographic behavior of the Roma population shows similarities with the situation of the non-Romapopulation several decades ago and/or is comparable with data from developing countries. It is apparent
66 The factors include for instance the long-term different development of death rates and birth rates, degree of ethnic identity,the extent of assimilation, etc.
Health is a state of complete physical, mental and social well-being and not merely the absence of disease orinfirmity.
World Health Organization, 1948
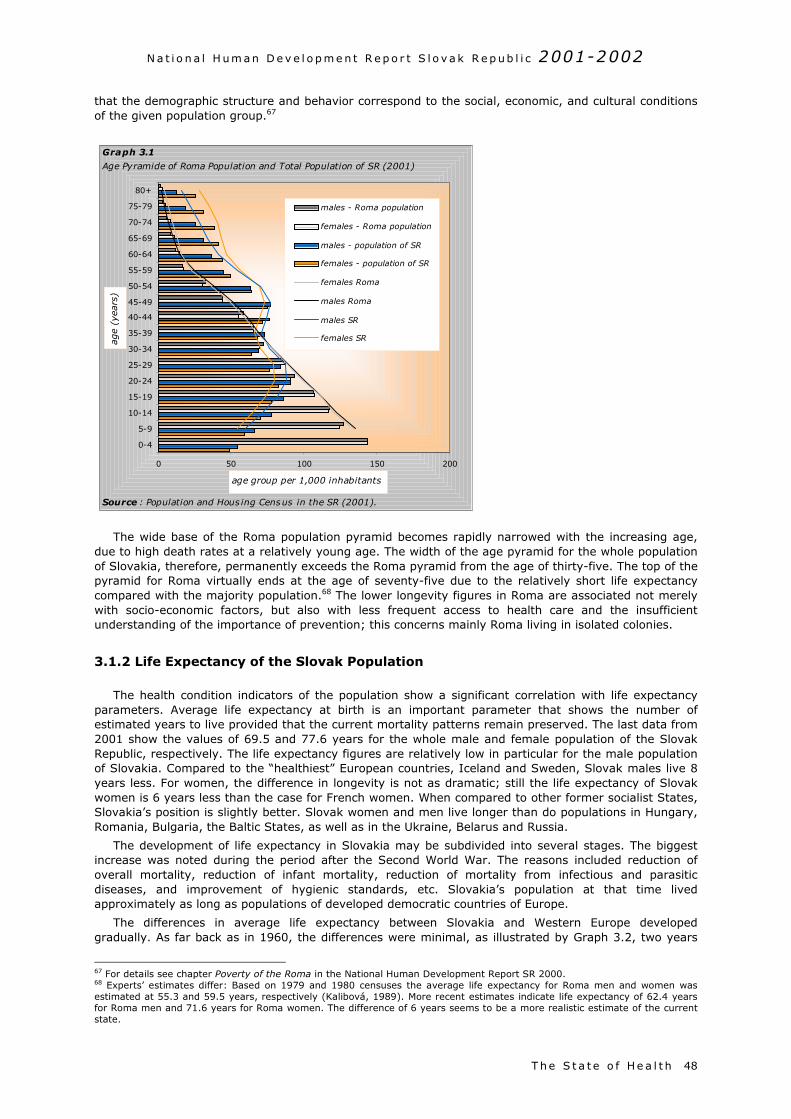
N a t i o n a l H um an D e v e l o p m e n t R e p o r t S l o v a k R e p ub l i c 2001-2002
T he S t a t e o f He a l t h 48
that the demographic structure and behavior correspond to the social, economic, and cultural conditionsof the given population group.67
The wide base of the Roma population pyramid becomes rapidly narrowed with the increasing age,due to high death rates at a relatively young age. The width of the age pyramid for the whole populationof Slovakia, therefore, permanently exceeds the Roma pyramid from the age of thirty-five. The top of thepyramid for Roma virtually ends at the age of seventy-five due to the relatively short life expectancycompared with the majority population.68 The lower longevity figures in Roma are associated not merelywith socio-economic factors, but also with less frequent access to health care and the insufficientunderstanding of the importance of prevention; this concerns mainly Roma living in isolated colonies.
3.1.2 Life Expectancy of the Slovak Population
The health condition indicators of the population show a significant correlation with life expectancyparameters. Average life expectancy at birth is an important parameter that shows the number ofestimated years to live provided that the current mortality patterns remain preserved. The last data from2001 show the values of 69.5 and 77.6 years for the whole male and female population of the SlovakRepublic, respectively. The life expectancy figures are relatively low in particular for the male populationof Slovakia. Compared to the “healthiest” European countries, Iceland and Sweden, Slovak males live 8years less. For women, the difference in longevity is not as dramatic; still the life expectancy of Slovakwomen is 6 years less than the case for French women. When compared to other former socialist States,Slovakia’s position is slightly better. Slovak women and men live longer than do populations in Hungary,Romania, Bulgaria, the Baltic States, as well as in the Ukraine, Belarus and Russia.
The development of life expectancy in Slovakia may be subdivided into several stages. The biggestincrease was noted during the period after the Second World War. The reasons included reduction ofoverall mortality, reduction of infant mortality, reduction of mortality from infectious and parasiticdiseases, and improvement of hygienic standards, etc. Slovakia’s population at that time livedapproximately as long as populations of developed democratic countries of Europe.
The differences in average life expectancy between Slovakia and Western Europe developedgradually. As far back as in 1960, the differences were minimal, as illustrated by Graph 3.2, two years
67 For details see chapter Poverty of the Roma in the National Human Development Report SR 2000.68 Experts’ estimates differ: Based on 1979 and 1980 censuses the average life expectancy for Roma men and women wasestimated at 55.3 and 59.5 years, respectively (Kalibová, 1989). More recent estimates indicate life expectancy of 62.4 yearsfor Roma men and 71.6 years for Roma women. The difference of 6 years seems to be a more realistic estimate of the currentstate.
0 50 100 150 200
0-4
5-9
10-14
15-19
20-24
25-29
30-34
35-39
40-44
45-49
50-54
55-59
60-64
65-69
70-74
75-79
80+
age
(yea
rs)
age group per 1,000 inhabitants
males - Roma population
females - Roma population
males - population of SR
females - population of SR
females Roma
males Roma
males SR
females SR
Graph 3.1
Age Pyramide of Roma Population and Total Population of SR (2001)
Source : Population and Hous ing Census in the SR (2001).
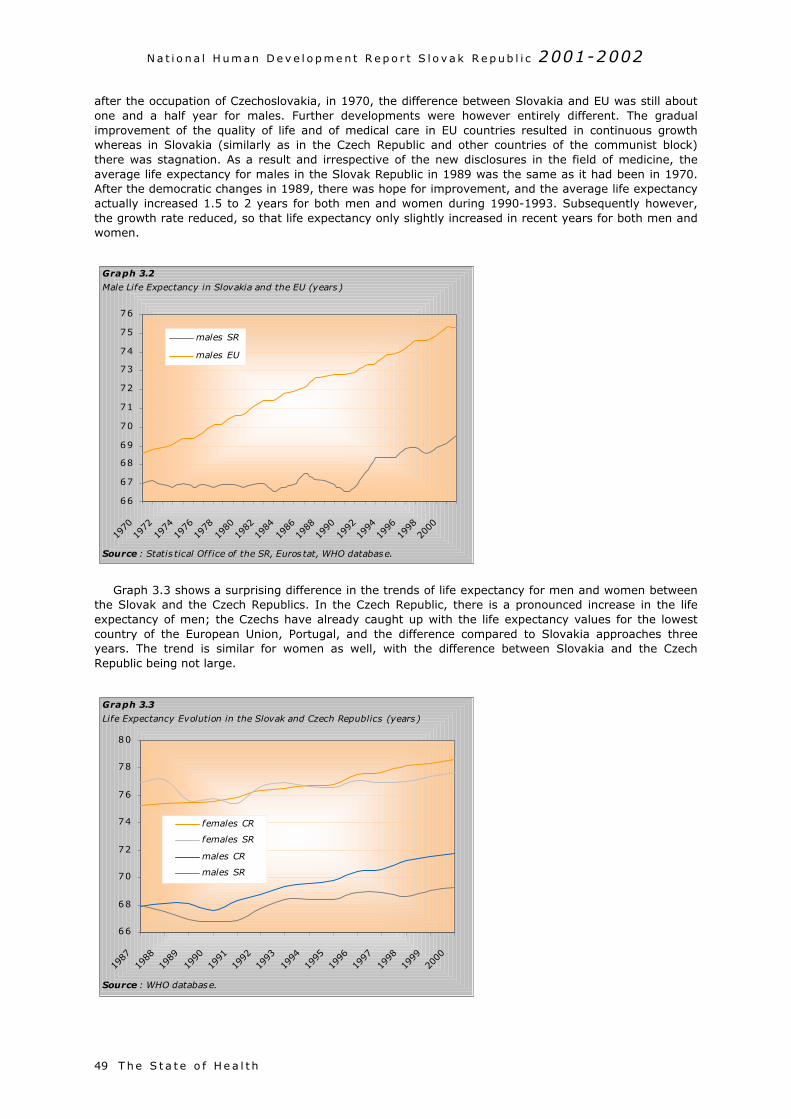
N a t i o n a l H um an D e v e l o p m e n t R e p o r t S l o v a k R e p ub l i c 2001-2002
T he S t a t e o f He a l t h49
after the occupation of Czechoslovakia, in 1970, the difference between Slovakia and EU was still aboutone and a half year for males. Further developments were however entirely different. The gradualimprovement of the quality of life and of medical care in EU countries resulted in continuous growthwhereas in Slovakia (similarly as in the Czech Republic and other countries of the communist block)there was stagnation. As a result and irrespective of the new disclosures in the field of medicine, theaverage life expectancy for males in the Slovak Republic in 1989 was the same as it had been in 1970.After the democratic changes in 1989, there was hope for improvement, and the average life expectancyactually increased 1.5 to 2 years for both men and women during 1990-1993. Subsequently however,the growth rate reduced, so that life expectancy only slightly increased in recent years for both men andwomen.
Graph 3.3 shows a surprising difference in the trends of life expectancy for men and women betweenthe Slovak and the Czech Republics. In the Czech Republic, there is a pronounced increase in the lifeexpectancy of men; the Czechs have already caught up with the life expectancy values for the lowestcountry of the European Union, Portugal, and the difference compared to Slovakia approaches threeyears. The trend is similar for women as well, with the difference between Slovakia and the CzechRepublic being not large.
66
67
68
69
70
71
72
73
74
75
76
1970
1972
1974
1976
1978
1980
1982
1984
1986
1988
1990
1992
1994
1996
1998
2000
males SR
males EU
Graph 3.2
Male Life Expectancy in Slovakia and the EU (years )
Source : Statis tical Office of the SR, Euros tat, WHO database.
66
68
70
72
74
76
78
80
1987
1988
1989
1990
1991
1992
1993
1994
1995
1996
1997
1998
1999
2000
females CR
females SR
males CR
males SR
Graph 3.3
Life Expectancy Evolution in the Slovak and Czech Republics (years)
Source : WHO database.
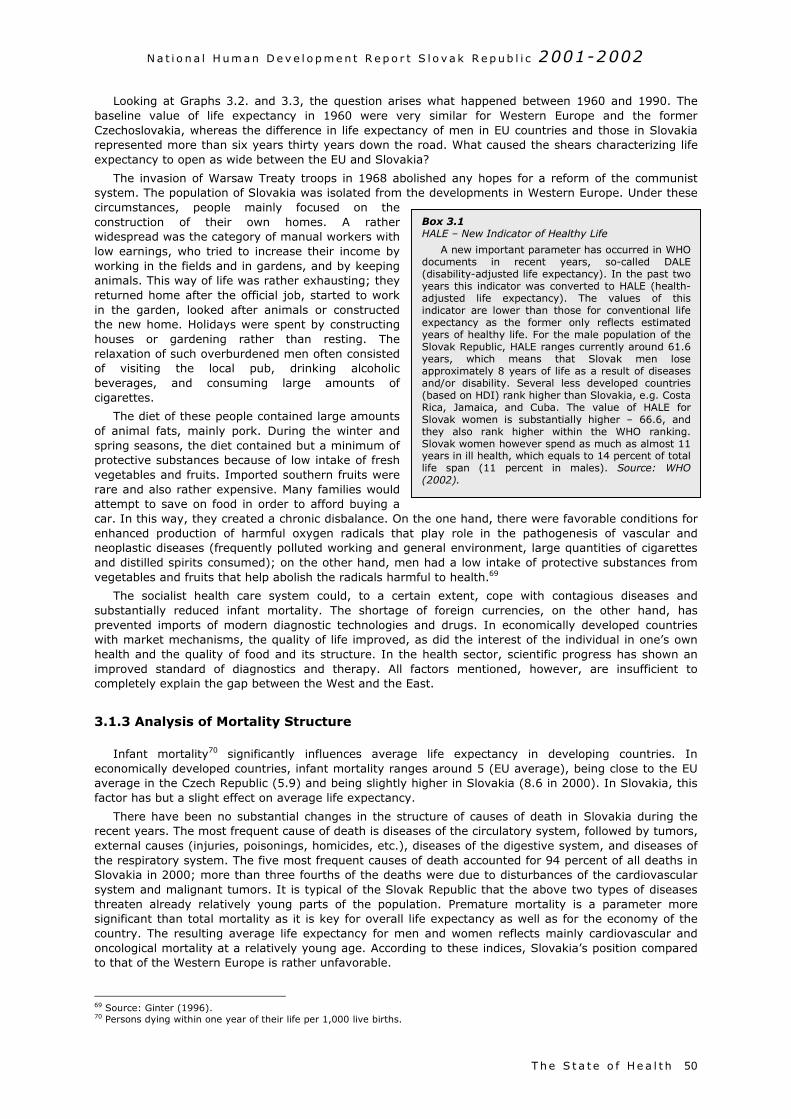
N a t i o n a l H um an D e v e l o p m e n t R e p o r t S l o v a k R e p ub l i c 2001-2002
T he S t a t e o f He a l t h 50
Box 3.1HALE – New Indicator of Healthy Life
A new important parameter has occurred in WHOdocuments in recent years, so-called DALE(disability-adjusted life expectancy). In the past twoyears this indicator was converted to HALE (health-adjusted life expectancy). The values of thisindicator are lower than those for conventional lifeexpectancy as the former only reflects estimatedyears of healthy life. For the male population of theSlovak Republic, HALE ranges currently around 61.6years, which means that Slovak men loseapproximately 8 years of life as a result of diseasesand/or disability. Several less developed countries(based on HDI) rank higher than Slovakia, e.g. CostaRica, Jamaica, and Cuba. The value of HALE forSlovak women is substantially higher – 66.6, andthey also rank higher within the WHO ranking.Slovak women however spend as much as almost 11years in ill health, which equals to 14 percent of totallife span (11 percent in males). Source: WHO(2002).
Looking at Graphs 3.2. and 3.3, the question arises what happened between 1960 and 1990. Thebaseline value of life expectancy in 1960 were very similar for Western Europe and the formerCzechoslovakia, whereas the difference in life expectancy of men in EU countries and those in Slovakiarepresented more than six years thirty years down the road. What caused the shears characterizing lifeexpectancy to open as wide between the EU and Slovakia?
The invasion of Warsaw Treaty troops in 1968 abolished any hopes for a reform of the communistsystem. The population of Slovakia was isolated from the developments in Western Europe. Under thesecircumstances, people mainly focused on theconstruction of their own homes. A ratherwidespread was the category of manual workers withlow earnings, who tried to increase their income byworking in the fields and in gardens, and by keepinganimals. This way of life was rather exhausting; theyreturned home after the official job, started to workin the garden, looked after animals or constructedthe new home. Holidays were spent by constructinghouses or gardening rather than resting. Therelaxation of such overburdened men often consistedof visiting the local pub, drinking alcoholicbeverages, and consuming large amounts ofcigarettes.
The diet of these people contained large amountsof animal fats, mainly pork. During the winter andspring seasons, the diet contained but a minimum ofprotective substances because of low intake of freshvegetables and fruits. Imported southern fruits wererare and also rather expensive. Many families wouldattempt to save on food in order to afford buying acar. In this way, they created a chronic disbalance. On the one hand, there were favorable conditions forenhanced production of harmful oxygen radicals that play role in the pathogenesis of vascular andneoplastic diseases (frequently polluted working and general environment, large quantities of cigarettesand distilled spirits consumed); on the other hand, men had a low intake of protective substances fromvegetables and fruits that help abolish the radicals harmful to health.69
The socialist health care system could, to a certain extent, cope with contagious diseases andsubstantially reduced infant mortality. The shortage of foreign currencies, on the other hand, hasprevented imports of modern diagnostic technologies and drugs. In economically developed countrieswith market mechanisms, the quality of life improved, as did the interest of the individual in one’s ownhealth and the quality of food and its structure. In the health sector, scientific progress has shown animproved standard of diagnostics and therapy. All factors mentioned, however, are insufficient tocompletely explain the gap between the West and the East.
3.1.3 Analysis of Mortality Structure
Infant mortality70 significantly influences average life expectancy in developing countries. Ineconomically developed countries, infant mortality ranges around 5 (EU average), being close to the EUaverage in the Czech Republic (5.9) and being slightly higher in Slovakia (8.6 in 2000). In Slovakia, thisfactor has but a slight effect on average life expectancy.
There have been no substantial changes in the structure of causes of death in Slovakia during therecent years. The most frequent cause of death is diseases of the circulatory system, followed by tumors,external causes (injuries, poisonings, homicides, etc.), diseases of the digestive system, and diseases ofthe respiratory system. The five most frequent causes of death accounted for 94 percent of all deaths inSlovakia in 2000; more than three fourths of the deaths were due to disturbances of the cardiovascularsystem and malignant tumors. It is typical of the Slovak Republic that the above two types of diseasesthreaten already relatively young parts of the population. Premature mortality is a parameter moresignificant than total mortality as it is key for overall life expectancy as well as for the economy of thecountry. The resulting average life expectancy for men and women reflects mainly cardiovascular andoncological mortality at a relatively young age. According to these indices, Slovakia’s position comparedto that of the Western Europe is rather unfavorable.
69 Source: Ginter (1996).70 Persons dying within one year of their life per 1,000 live births.
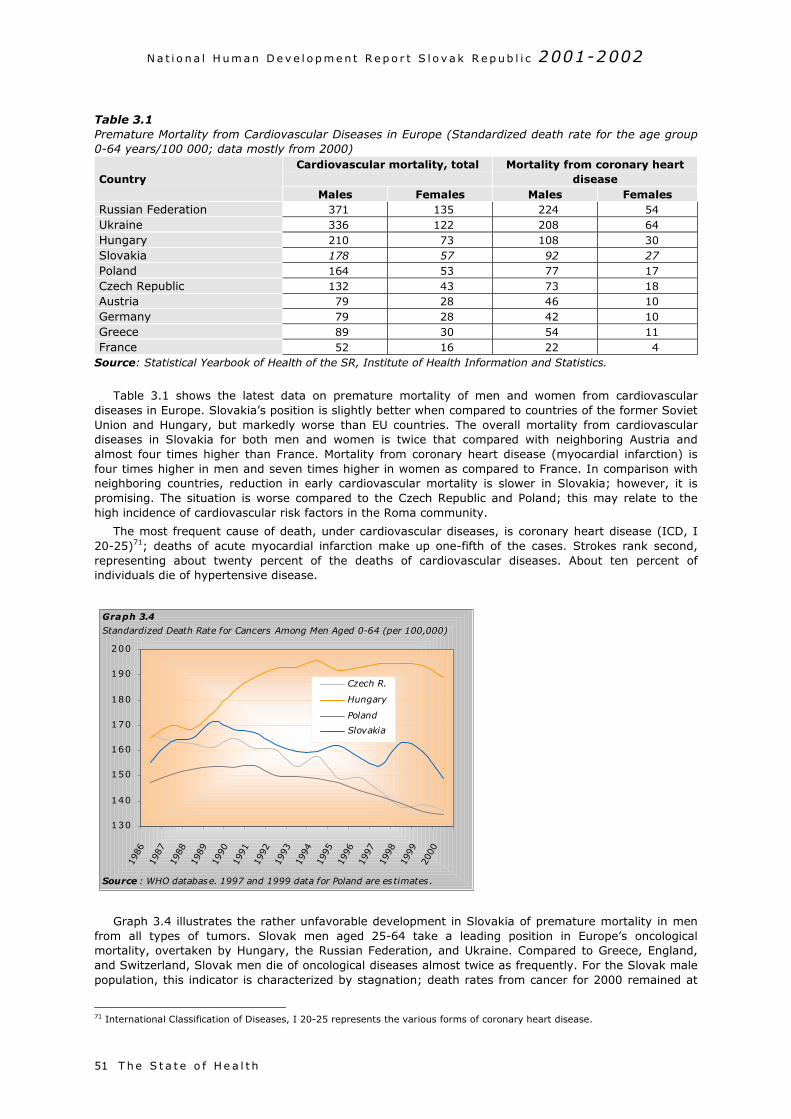
N a t i o n a l H um an D e v e l o p m e n t R e p o r t S l o v a k R e p ub l i c 2001-2002
T he S t a t e o f He a l t h51
Table 3.1Premature Mortality from Cardiovascular Diseases in Europe (Standardized death rate for the age group0-64 years/100 000; data mostly from 2000)
Cardiovascular mortality, total Mortality from coronary heartdiseaseCountry
Males Females Males FemalesRussian Federation 371 135 224 54Ukraine 336 122 208 64Hungary 210 73 108 30Slovakia 178 57 92 27Poland 164 53 77 17Czech Republic 132 43 73 18Austria 79 28 46 10Germany 79 28 42 10Greece 89 30 54 11France 52 16 22 4
Source: Statistical Yearbook of Health of the SR, Institute of Health Information and Statistics.
Table 3.1 shows the latest data on premature mortality of men and women from cardiovasculardiseases in Europe. Slovakia’s position is slightly better when compared to countries of the former SovietUnion and Hungary, but markedly worse than EU countries. The overall mortality from cardiovasculardiseases in Slovakia for both men and women is twice that compared with neighboring Austria andalmost four times higher than France. Mortality from coronary heart disease (myocardial infarction) isfour times higher in men and seven times higher in women as compared to France. In comparison withneighboring countries, reduction in early cardiovascular mortality is slower in Slovakia; however, it ispromising. The situation is worse compared to the Czech Republic and Poland; this may relate to thehigh incidence of cardiovascular risk factors in the Roma community.
The most frequent cause of death, under cardiovascular diseases, is coronary heart disease (ICD, I20-25)71; deaths of acute myocardial infarction make up one-fifth of the cases. Strokes rank second,representing about twenty percent of the deaths of cardiovascular diseases. About ten percent ofindividuals die of hypertensive disease.
Graph 3.4 illustrates the rather unfavorable development in Slovakia of premature mortality in menfrom all types of tumors. Slovak men aged 25-64 take a leading position in Europe’s oncologicalmortality, overtaken by Hungary, the Russian Federation, and Ukraine. Compared to Greece, England,and Switzerland, Slovak men die of oncological diseases almost twice as frequently. For the Slovak malepopulation, this indicator is characterized by stagnation; death rates from cancer for 2000 remained at
71 International Classification of Diseases, I 20-25 represents the various forms of coronary heart disease.
130
140
150
160
170
180
190
200
1986
1987
1988
1989
1990
1991
1992
1993
1994
1995
1996
1997
1998
1999
2000
Czech R.
Hungary
Poland
Slovakia
Graph 3.4
Standardized Death Rate for Cancers Among Men Aged 0-64 (per 100,000)
Source : WHO database. 1997 and 1999 data for Poland are es timates .
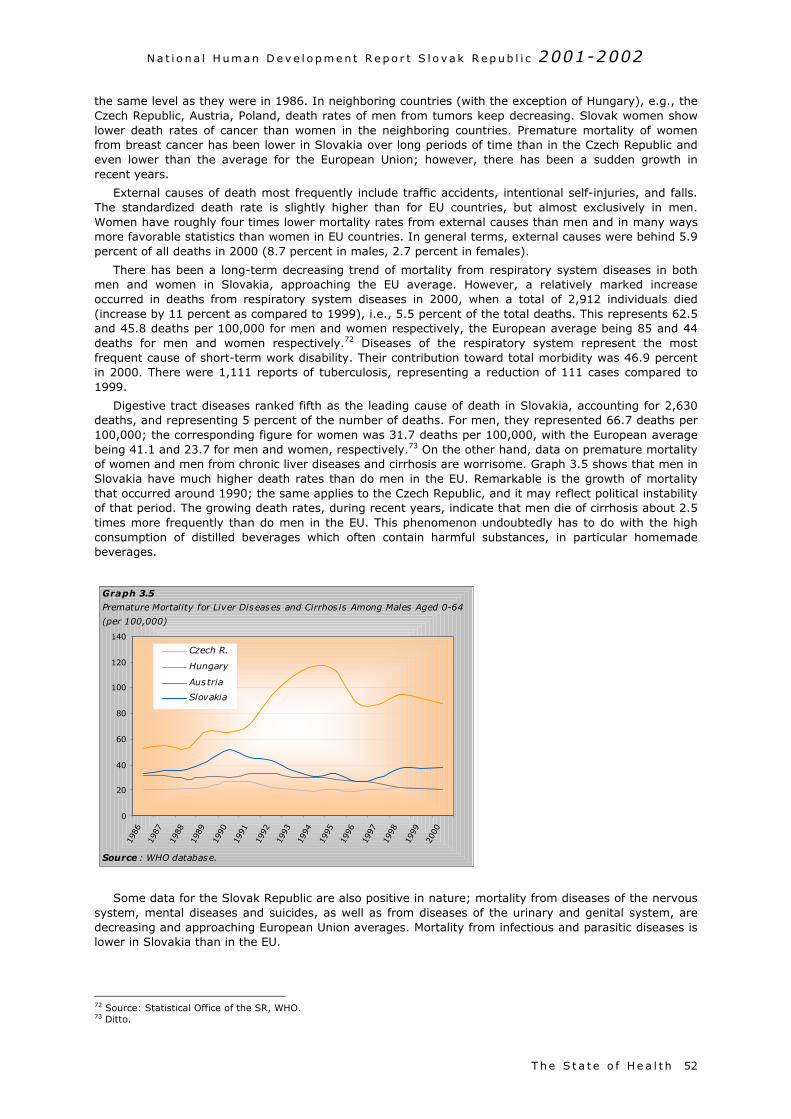
N a t i o n a l H um an D e v e l o p m e n t R e p o r t S l o v a k R e p ub l i c 2001-2002
T he S t a t e o f He a l t h 52
the same level as they were in 1986. In neighboring countries (with the exception of Hungary), e.g., theCzech Republic, Austria, Poland, death rates of men from tumors keep decreasing. Slovak women showlower death rates of cancer than women in the neighboring countries. Premature mortality of womenfrom breast cancer has been lower in Slovakia over long periods of time than in the Czech Republic andeven lower than the average for the European Union; however, there has been a sudden growth inrecent years.
External causes of death most frequently include traffic accidents, intentional self-injuries, and falls.The standardized death rate is slightly higher than for EU countries, but almost exclusively in men.Women have roughly four times lower mortality rates from external causes than men and in many waysmore favorable statistics than women in EU countries. In general terms, external causes were behind 5.9percent of all deaths in 2000 (8.7 percent in males, 2.7 percent in females).
There has been a long-term decreasing trend of mortality from respiratory system diseases in bothmen and women in Slovakia, approaching the EU average. However, a relatively marked increaseoccurred in deaths from respiratory system diseases in 2000, when a total of 2,912 individuals died(increase by 11 percent as compared to 1999), i.e., 5.5 percent of the total deaths. This represents 62.5and 45.8 deaths per 100,000 for men and women respectively, the European average being 85 and 44deaths for men and women respectively.72 Diseases of the respiratory system represent the mostfrequent cause of short-term work disability. Their contribution toward total morbidity was 46.9 percentin 2000. There were 1,111 reports of tuberculosis, representing a reduction of 111 cases compared to1999.
Digestive tract diseases ranked fifth as the leading cause of death in Slovakia, accounting for 2,630deaths, and representing 5 percent of the number of deaths. For men, they represented 66.7 deaths per100,000; the corresponding figure for women was 31.7 deaths per 100,000, with the European averagebeing 41.1 and 23.7 for men and women, respectively.73 On the other hand, data on premature mortalityof women and men from chronic liver diseases and cirrhosis are worrisome. Graph 3.5 shows that men inSlovakia have much higher death rates than do men in the EU. Remarkable is the growth of mortalitythat occurred around 1990; the same applies to the Czech Republic, and it may reflect political instabilityof that period. The growing death rates, during recent years, indicate that men die of cirrhosis about 2.5times more frequently than do men in the EU. This phenomenon undoubtedly has to do with the highconsumption of distilled beverages which often contain harmful substances, in particular homemadebeverages.
Some data for the Slovak Republic are also positive in nature; mortality from diseases of the nervoussystem, mental diseases and suicides, as well as from diseases of the urinary and genital system, aredecreasing and approaching European Union averages. Mortality from infectious and parasitic diseases islower in Slovakia than in the EU.
72 Source: Statistical Office of the SR, WHO.73 Ditto.
0
20
40
60
80
100
120
140
1986
1987
1988
1989
1990
1991
1992
1993
1994
1995
1996
1997
1998
1999
2000
Czech R.
Hungary
Austria
Slovakia
Graph 3.5
Premature Mortality for Liver Diseases and Cirrhos is Among Males Aged 0-64
(per 100,000)
Source : WHO database.
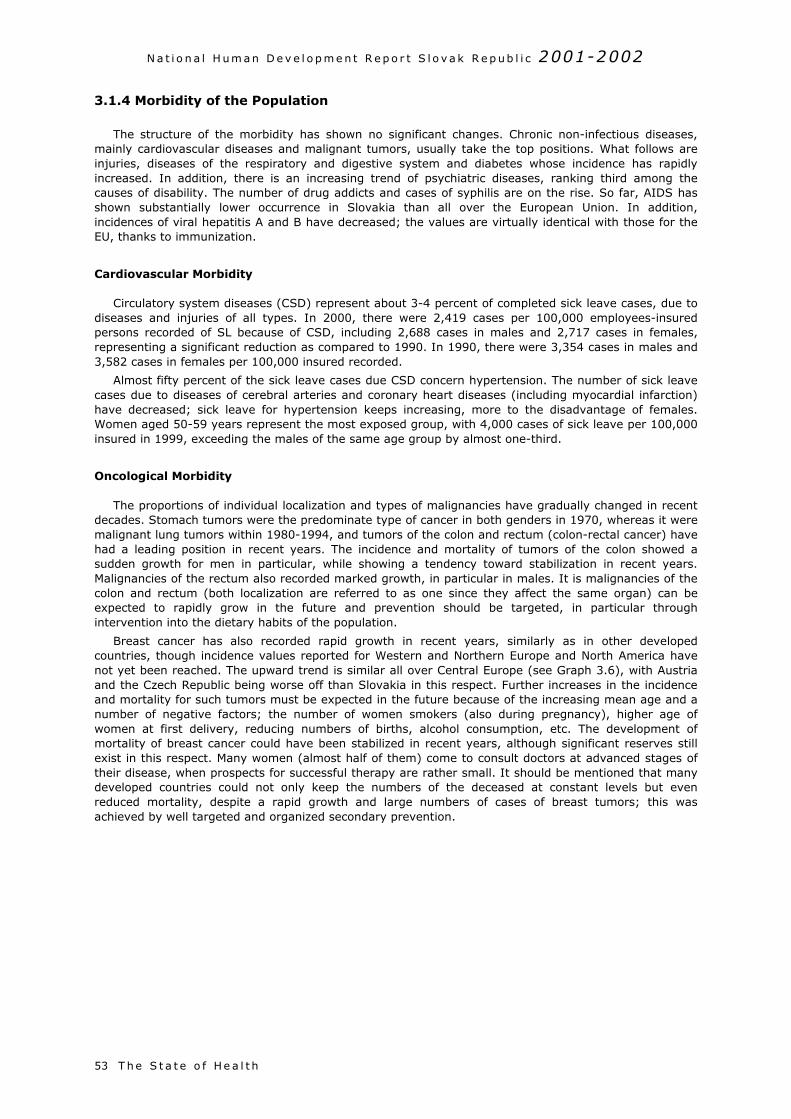
N a t i o n a l H um an D e v e l o p m e n t R e p o r t S l o v a k R e p ub l i c 2001-2002
T he S t a t e o f He a l t h53
3.1.4 Morbidity of the Population
The structure of the morbidity has shown no significant changes. Chronic non-infectious diseases,mainly cardiovascular diseases and malignant tumors, usually take the top positions. What follows areinjuries, diseases of the respiratory and digestive system and diabetes whose incidence has rapidlyincreased. In addition, there is an increasing trend of psychiatric diseases, ranking third among thecauses of disability. The number of drug addicts and cases of syphilis are on the rise. So far, AIDS hasshown substantially lower occurrence in Slovakia than all over the European Union. In addition,incidences of viral hepatitis A and B have decreased; the values are virtually identical with those for theEU, thanks to immunization.
Cardiovascular Morbidity
Circulatory system diseases (CSD) represent about 3-4 percent of completed sick leave cases, due todiseases and injuries of all types. In 2000, there were 2,419 cases per 100,000 employees-insuredpersons recorded of SL because of CSD, including 2,688 cases in males and 2,717 cases in females,representing a significant reduction as compared to 1990. In 1990, there were 3,354 cases in males and3,582 cases in females per 100,000 insured recorded.
Almost fifty percent of the sick leave cases due CSD concern hypertension. The number of sick leavecases due to diseases of cerebral arteries and coronary heart diseases (including myocardial infarction)have decreased; sick leave for hypertension keeps increasing, more to the disadvantage of females.Women aged 50-59 years represent the most exposed group, with 4,000 cases of sick leave per 100,000insured in 1999, exceeding the males of the same age group by almost one-third.
Oncological Morbidity
The proportions of individual localization and types of malignancies have gradually changed in recentdecades. Stomach tumors were the predominate type of cancer in both genders in 1970, whereas it weremalignant lung tumors within 1980-1994, and tumors of the colon and rectum (colon-rectal cancer) havehad a leading position in recent years. The incidence and mortality of tumors of the colon showed asudden growth for men in particular, while showing a tendency toward stabilization in recent years.Malignancies of the rectum also recorded marked growth, in particular in males. It is malignancies of thecolon and rectum (both localization are referred to as one since they affect the same organ) can beexpected to rapidly grow in the future and prevention should be targeted, in particular throughintervention into the dietary habits of the population.
Breast cancer has also recorded rapid growth in recent years, similarly as in other developedcountries, though incidence values reported for Western and Northern Europe and North America havenot yet been reached. The upward trend is similar all over Central Europe (see Graph 3.6), with Austriaand the Czech Republic being worse off than Slovakia in this respect. Further increases in the incidenceand mortality for such tumors must be expected in the future because of the increasing mean age and anumber of negative factors; the number of women smokers (also during pregnancy), higher age ofwomen at first delivery, reducing numbers of births, alcohol consumption, etc. The development ofmortality of breast cancer could have been stabilized in recent years, although significant reserves stillexist in this respect. Many women (almost half of them) come to consult doctors at advanced stages oftheir disease, when prospects for successful therapy are rather small. It should be mentioned that manydeveloped countries could not only keep the numbers of the deceased at constant levels but evenreduced mortality, despite a rapid growth and large numbers of cases of breast tumors; this wasachieved by well targeted and organized secondary prevention.
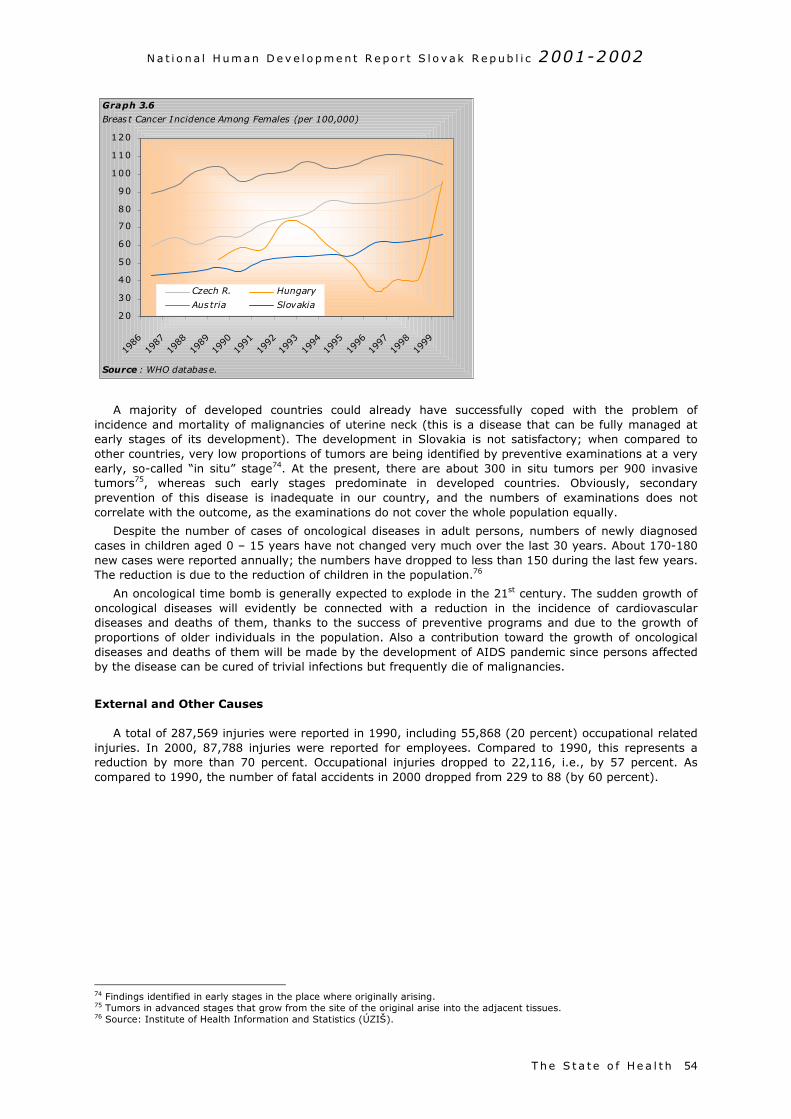
N a t i o n a l H um an D e v e l o p m e n t R e p o r t S l o v a k R e p ub l i c 2001-2002
T he S t a t e o f He a l t h 54
A majority of developed countries could already have successfully coped with the problem ofincidence and mortality of malignancies of uterine neck (this is a disease that can be fully managed atearly stages of its development). The development in Slovakia is not satisfactory; when compared toother countries, very low proportions of tumors are being identified by preventive examinations at a veryearly, so-called “in situ” stage74. At the present, there are about 300 in situ tumors per 900 invasivetumors75, whereas such early stages predominate in developed countries. Obviously, secondaryprevention of this disease is inadequate in our country, and the numbers of examinations does notcorrelate with the outcome, as the examinations do not cover the whole population equally.
Despite the number of cases of oncological diseases in adult persons, numbers of newly diagnosedcases in children aged 0 – 15 years have not changed very much over the last 30 years. About 170-180new cases were reported annually; the numbers have dropped to less than 150 during the last few years.The reduction is due to the reduction of children in the population.76
An oncological time bomb is generally expected to explode in the 21st century. The sudden growth ofoncological diseases will evidently be connected with a reduction in the incidence of cardiovasculardiseases and deaths of them, thanks to the success of preventive programs and due to the growth ofproportions of older individuals in the population. Also a contribution toward the growth of oncologicaldiseases and deaths of them will be made by the development of AIDS pandemic since persons affectedby the disease can be cured of trivial infections but frequently die of malignancies.
External and Other Causes
A total of 287,569 injuries were reported in 1990, including 55,868 (20 percent) occupational relatedinjuries. In 2000, 87,788 injuries were reported for employees. Compared to 1990, this represents areduction by more than 70 percent. Occupational injuries dropped to 22,116, i.e., by 57 percent. Ascompared to 1990, the number of fatal accidents in 2000 dropped from 229 to 88 (by 60 percent).
74 Findings identified in early stages in the place where originally arising.75 Tumors in advanced stages that grow from the site of the original arise into the adjacent tissues.76 Source: Institute of Health Information and Statistics (ÚZIŠ).
20
30
40
50
60
70
80
90
100
110
120
1986
1987
1988
1989
1990
1991
1992
1993
1994
1995
1996
1997
1998
1999
Czech R. Hungary
Austria Slovakia
Graph 3.6
Breast Cancer Incidence Among Females (per 100,000)
Source : WHO database.
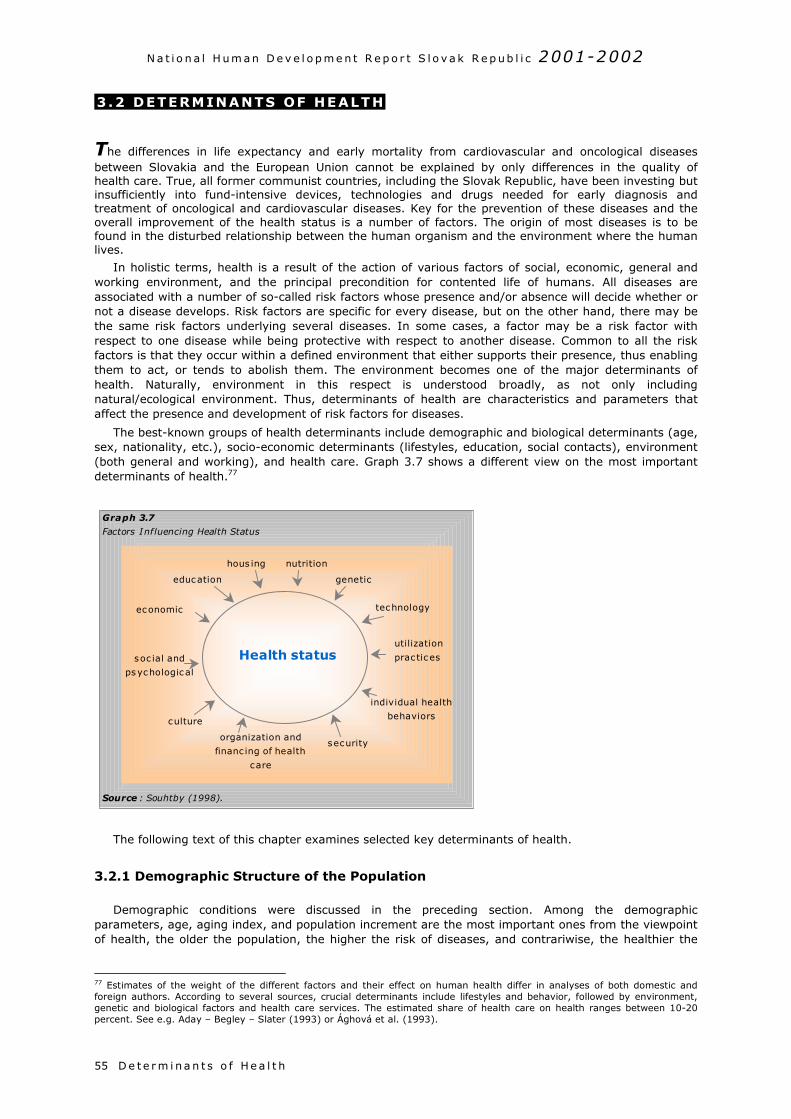
N a t i o n a l H um an D e v e l o p m e n t R e p o r t S l o v a k R e p ub l i c 2001-2002
D e t e r m i na n t s o f He a l t h55
3 .2 DETERMINANTS OF HEALTH
The differences in life expectancy and early mortality from cardiovascular and oncological diseasesbetween Slovakia and the European Union cannot be explained by only differences in the quality ofhealth care. True, all former communist countries, including the Slovak Republic, have been investing butinsufficiently into fund-intensive devices, technologies and drugs needed for early diagnosis andtreatment of oncological and cardiovascular diseases. Key for the prevention of these diseases and theoverall improvement of the health status is a number of factors. The origin of most diseases is to befound in the disturbed relationship between the human organism and the environment where the humanlives.
In holistic terms, health is a result of the action of various factors of social, economic, general andworking environment, and the principal precondition for contented life of humans. All diseases areassociated with a number of so-called risk factors whose presence and/or absence will decide whether ornot a disease develops. Risk factors are specific for every disease, but on the other hand, there may bethe same risk factors underlying several diseases. In some cases, a factor may be a risk factor withrespect to one disease while being protective with respect to another disease. Common to all the riskfactors is that they occur within a defined environment that either supports their presence, thus enablingthem to act, or tends to abolish them. The environment becomes one of the major determinants ofhealth. Naturally, environment in this respect is understood broadly, as not only includingnatural/ecological environment. Thus, determinants of health are characteristics and parameters thataffect the presence and development of risk factors for diseases.
The best-known groups of health determinants include demographic and biological determinants (age,sex, nationality, etc.), socio-economic determinants (lifestyles, education, social contacts), environment(both general and working), and health care. Graph 3.7 shows a different view on the most importantdeterminants of health.77
The following text of this chapter examines selected key determinants of health.
3.2.1 Demographic Structure of the Population
Demographic conditions were discussed in the preceding section. Among the demographicparameters, age, aging index, and population increment are the most important ones from the viewpointof health, the older the population, the higher the risk of diseases, and contrariwise, the healthier the
77 Estimates of the weight of the different factors and their effect on human health differ in analyses of both domestic andforeign authors. According to several sources, crucial determinants include lifestyles and behavior, followed by environment,genetic and biological factors and health care services. The estimated share of health care on health ranges between 10-20percent. See e.g. Aday – Begley – Slater (1993) or Ághová et al. (1993).
Health status
hous ing nutrition
genetic
technology
utilization
prac tic es
education
economic
soc ial and
psychological
culture
organization and
financ ing of health
care
security
individual health
behaviors
Graph 3.7
Factors Influencing Health Status
Source : Souhtby (1998).
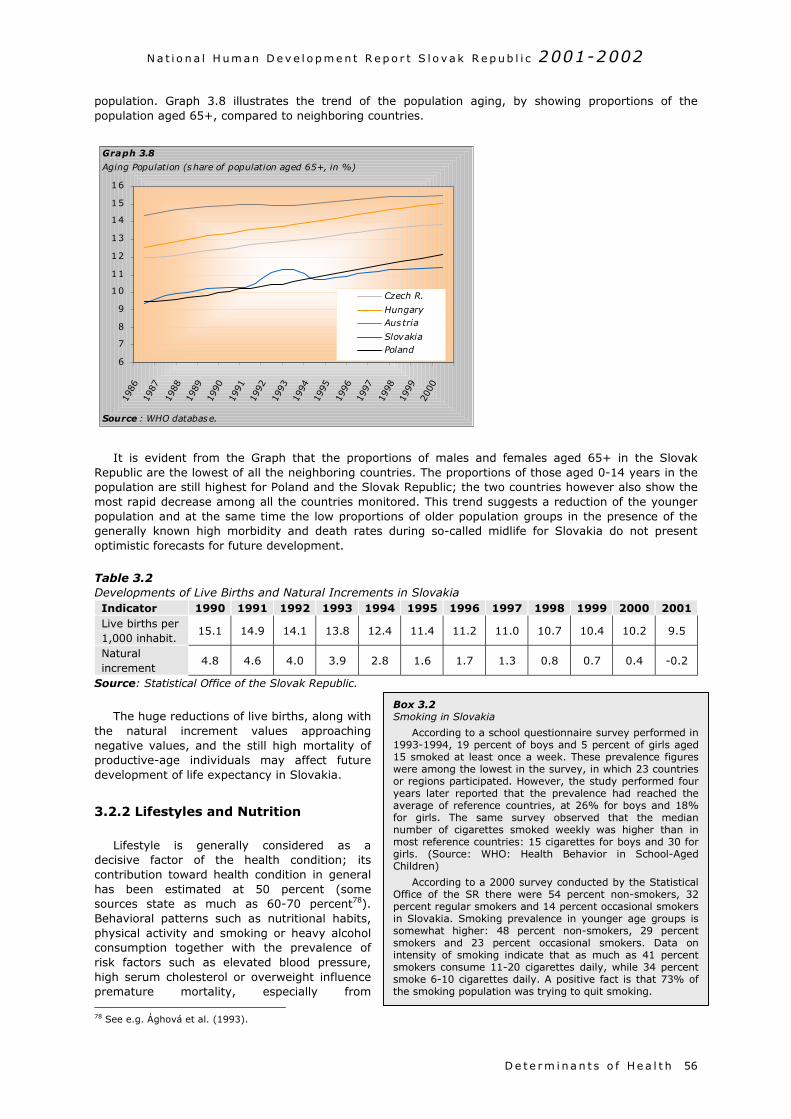
N a t i o n a l H um an D e v e l o p m e n t R e p o r t S l o v a k R e p ub l i c 2001-2002
population. Graph 3.8 illustrates the trend of the population aging, by showing proportions of thepopulation aged 65+, compared to neighboring countries.
It is evident from the Graph that the proportions of males and females aged 65+ in the SlovakRepublic are the lowest of all the neighboring countries. The proportions of those aged 0-14 years in thepopulation are still highest for Poland and the Slovak Republic; the two countries however also show themost rapid decrease among all the countries monitored. This trend suggests a reduction of the youngerpopulation and at the same time the low proportions of older population groups in the presence of thegenerally known high morbidity and death rates during so-called midlife for Slovakia do not presentoptimistic forecasts for future development.
Table 3.2Developments of Live Births and Natural Increments in SlovakiaIndicator 1990 1991 1992 1993 1994 1995 1996 1997 1998 1999 2000 2001Live births per1,000 inhabit.
15.1 14.9 14.1 13.8 12.4 11.4 11.2 11.0 10.7 10.4 10.2 9.5
Naturalincrement
4.8 4.6 4.0 3.9 2.8 1.6 1.7 1.3 0.8 0.7 0.4 -0.2
Source: Statistical Office of the Slovak Republic.
The huge reductions of live births, along withthe natural increment values approachingnegative values, and the still high mortality ofproductive-age individuals may affect futuredevelopment of life expectancy in Slovakia.
3.2.2 Lifestyles and Nutrition
Lifestyle is generally considered as adecisive factor of the health condition; itscontribution toward health condition in generalhas been estimated at 50 percent (somesources state as much as 60-70 percent78).Behavioral patterns such as nutritional habits,physical activity and smoking or heavy alcoholconsumption together with the prevalence ofrisk factors such as elevated blood pressure,high serum cholesterol or overweight influencepremature mortality, especially from 78 See e.g. Ághová et al. (1993).
6
7
8
9
10
11
12
13
14
15
16
1986
1987
1988
1989
1990
1991
1992
1993
1994
1995
1996
1997
1998
1999
2000
Czech R.
HungaryAustria
SlovakiaPoland
Graph 3.8
Aging Population (share of population aged 65+, in %)
Source : WHO database.
Box 3.2Smoking in Slovakia
According to a school questionnaire survey performed in1993-1994, 19 percent of boys and 5 percent of girls aged15 smoked at least once a week. These prevalence figureswere among the lowest in the survey, in which 23 countriesor regions participated. However, the study performed fouryears later reported that the prevalence had reached theaverage of reference countries, at 26% for boys and 18%for girls. The same survey observed that the mediannumber of cigarettes smoked weekly was higher than inmost reference countries: 15 cigarettes for boys and 30 forgirls. (Source: WHO: Health Behavior in School-AgedChildren)
According to a 2000 survey conducted by the StatisticalOffice of the SR there were 54 percent non-smokers, 32percent regular smokers and 14 percent occasional smokersin Slovakia. Smoking prevalence in younger age groups issomewhat higher: 48 percent non-smokers, 29 percentsmokers and 23 percent occasional smokers. Data onintensity of smoking indicate that as much as 41 percentsmokers consume 11-20 cigarettes daily, while 34 percentsmoke 6-10 cigarettes daily. A positive fact is that 73% ofthe smoking population was trying to quit smoking.
D e t e r m i na n t s o f He a l t h 56
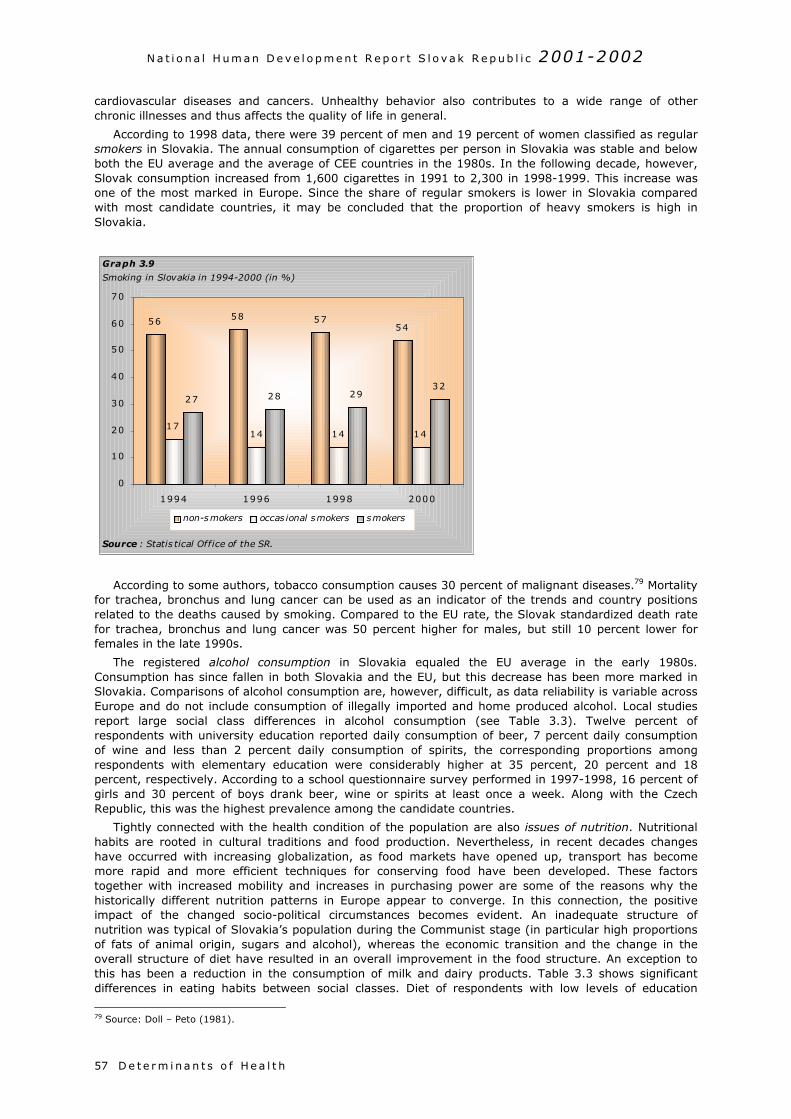
N a t i o n a l H um an D e v e l o p m e n t R e p o r t S l o v a k R e p ub l i c 2001-2002
D e t e r m i na n t s o f He a l t h57
cardiovascular diseases and cancers. Unhealthy behavior also contributes to a wide range of otherchronic illnesses and thus affects the quality of life in general.
According to 1998 data, there were 39 percent of men and 19 percent of women classified as regularsmokers in Slovakia. The annual consumption of cigarettes per person in Slovakia was stable and belowboth the EU average and the average of CEE countries in the 1980s. In the following decade, however,Slovak consumption increased from 1,600 cigarettes in 1991 to 2,300 in 1998-1999. This increase wasone of the most marked in Europe. Since the share of regular smokers is lower in Slovakia comparedwith most candidate countries, it may be concluded that the proportion of heavy smokers is high inSlovakia.
According to some authors, tobacco consumption causes 30 percent of malignant diseases.79 Mortalityfor trachea, bronchus and lung cancer can be used as an indicator of the trends and country positionsrelated to the deaths caused by smoking. Compared to the EU rate, the Slovak standardized death ratefor trachea, bronchus and lung cancer was 50 percent higher for males, but still 10 percent lower forfemales in the late 1990s.
The registered alcohol consumption in Slovakia equaled the EU average in the early 1980s.Consumption has since fallen in both Slovakia and the EU, but this decrease has been more marked inSlovakia. Comparisons of alcohol consumption are, however, difficult, as data reliability is variable acrossEurope and do not include consumption of illegally imported and home produced alcohol. Local studiesreport large social class differences in alcohol consumption (see Table 3.3). Twelve percent ofrespondents with university education reported daily consumption of beer, 7 percent daily consumptionof wine and less than 2 percent daily consumption of spirits, the corresponding proportions amongrespondents with elementary education were considerably higher at 35 percent, 20 percent and 18percent, respectively. According to a school questionnaire survey performed in 1997-1998, 16 percent ofgirls and 30 percent of boys drank beer, wine or spirits at least once a week. Along with the CzechRepublic, this was the highest prevalence among the candidate countries.
Tightly connected with the health condition of the population are also issues of nutrition. Nutritionalhabits are rooted in cultural traditions and food production. Nevertheless, in recent decades changeshave occurred with increasing globalization, as food markets have opened up, transport has becomemore rapid and more efficient techniques for conserving food have been developed. These factorstogether with increased mobility and increases in purchasing power are some of the reasons why thehistorically different nutrition patterns in Europe appear to converge. In this connection, the positiveimpact of the changed socio-political circumstances becomes evident. An inadequate structure ofnutrition was typical of Slovakia’s population during the Communist stage (in particular high proportionsof fats of animal origin, sugars and alcohol), whereas the economic transition and the change in theoverall structure of diet have resulted in an overall improvement in the food structure. An exception tothis has been a reduction in the consumption of milk and dairy products. Table 3.3 shows significantdifferences in eating habits between social classes. Diet of respondents with low levels of education
79 Source: Doll – Peto (1981).
56 58 5754
1714 14 14
27 28 2932
0
10
20
30
40
50
60
70
1994 1996 1998 2000
non-smokers occas ional smokers smokers
Graph 3.9
Smoking in Slovakia in 1994-2000 (in %)
Source : Statis tical Office of the SR.
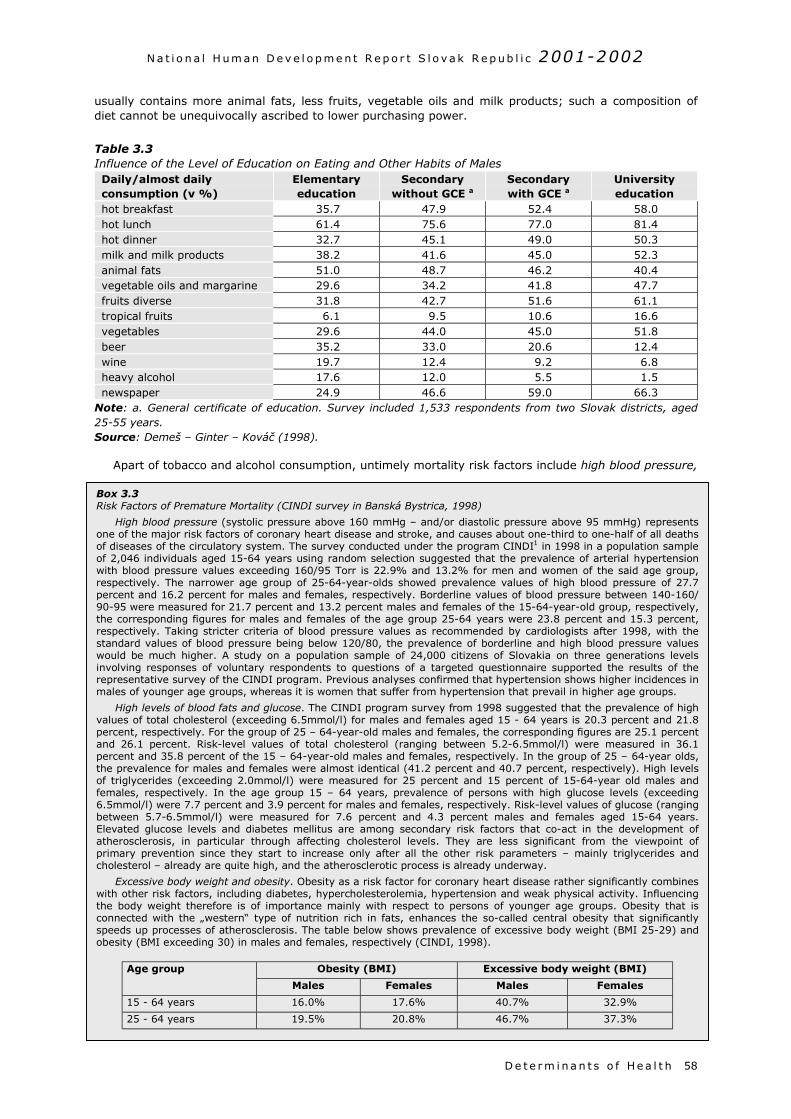
N a t i o n a l H um an D e v e l o p m e n t R e p o r t S l o v a k R e p ub l i c 2001-2002
usually contains more animal fats, less fruits, vegetable oils and milk products; such a composition ofdiet cannot be unequivocally ascribed to lower purchasing power.
Table 3.3Influence of the Level of Education on Eating and Other Habits of MalesDaily/almost dailyconsumption (v %)
Elementaryeducation
Secondarywithout GCE a
Secondarywith GCE a
Universityeducation
hot breakfast 35.7 47.9 52.4 58.0hot lunch 61.4 75.6 77.0 81.4hot dinner 32.7 45.1 49.0 50.3milk and milk products 38.2 41.6 45.0 52.3animal fats 51.0 48.7 46.2 40.4vegetable oils and margarine 29.6 34.2 41.8 47.7fruits diverse 31.8 42.7 51.6 61.1tropical fruits 6.1 9.5 10.6 16.6vegetables 29.6 44.0 45.0 51.8beer 35.2 33.0 20.6 12.4wine 19.7 12.4 9.2 6.8heavy alcohol 17.6 12.0 5.5 1.5newspaper 24.9 46.6 59.0 66.3
Note: a. General certificate of education. Survey included 1,533 respondents from two Slovak districts, aged25-55 years.Source: Demeš – Ginter – Kováč (1998).
Apart of tobacco and alcohol consumption, untimely mortality risk factors include high blood pressure,
Box 3.3Risk Factors of Premature Mortality (CINDI survey in Banská Bystrica, 1998)
High blood pressure (systolic pressure above 160 mmHg – and/or diastolic pressure above 95 mmHg) representsone of the major risk factors of coronary heart disease and stroke, and causes about one-third to one-half of all deathsof diseases of the circulatory system. The survey conducted under the program CINDI1 in 1998 in a population sampleof 2,046 individuals aged 15-64 years using random selection suggested that the prevalence of arterial hypertensionwith blood pressure values exceeding 160/95 Torr is 22.9% and 13.2% for men and women of the said age group,respectively. The narrower age group of 25-64-year-olds showed prevalence values of high blood pressure of 27.7percent and 16.2 percent for males and females, respectively. Borderline values of blood pressure between 140-160/90-95 were measured for 21.7 percent and 13.2 percent males and females of the 15-64-year-old group, respectively,the corresponding figures for males and females of the age group 25-64 years were 23.8 percent and 15.3 percent,respectively. Taking stricter criteria of blood pressure values as recommended by cardiologists after 1998, with thestandard values of blood pressure being below 120/80, the prevalence of borderline and high blood pressure valueswould be much higher. A study on a population sample of 24,000 citizens of Slovakia on three generations levelsinvolving responses of voluntary respondents to questions of a targeted questionnaire supported the results of therepresentative survey of the CINDI program. Previous analyses confirmed that hypertension shows higher incidences inmales of younger age groups, whereas it is women that suffer from hypertension that prevail in higher age groups.
High levels of blood fats and glucose. The CINDI program survey from 1998 suggested that the prevalence of highvalues of total cholesterol (exceeding 6.5mmol/l) for males and females aged 15 - 64 years is 20.3 percent and 21.8percent, respectively. For the group of 25 – 64-year-old males and females, the corresponding figures are 25.1 percentand 26.1 percent. Risk-level values of total cholesterol (ranging between 5.2-6.5mmol/l) were measured in 36.1percent and 35.8 percent of the 15 – 64-year-old males and females, respectively. In the group of 25 – 64-year olds,the prevalence for males and females were almost identical (41.2 percent and 40.7 percent, respectively). High levelsof triglycerides (exceeding 2.0mmol/l) were measured for 25 percent and 15 percent of 15-64-year old males andfemales, respectively. In the age group 15 – 64 years, prevalence of persons with high glucose levels (exceeding6.5mmol/l) were 7.7 percent and 3.9 percent for males and females, respectively. Risk-level values of glucose (rangingbetween 5.7-6.5mmol/l) were measured for 7.6 percent and 4.3 percent males and females aged 15-64 years.Elevated glucose levels and diabetes mellitus are among secondary risk factors that co-act in the development ofatherosclerosis, in particular through affecting cholesterol levels. They are less significant from the viewpoint ofprimary prevention since they start to increase only after all the other risk parameters – mainly triglycerides andcholesterol – already are quite high, and the atherosclerotic process is already underway.
Excessive body weight and obesity. Obesity as a risk factor for coronary heart disease rather significantly combineswith other risk factors, including diabetes, hypercholesterolemia, hypertension and weak physical activity. Influencingthe body weight therefore is of importance mainly with respect to persons of younger age groups. Obesity that isconnected with the „western“ type of nutrition rich in fats, enhances the so-called central obesity that significantlyspeeds up processes of atherosclerosis. The table below shows prevalence of excessive body weight (BMI 25-29) andobesity (BMI exceeding 30) in males and females, respectively (CINDI, 1998).
Obesity (BMI) Excessive body weight (BMI)Age group
Males Females Males Females
15 - 64 years 16.0% 17.6% 40.7% 32.9%
25 - 64 years 19.5% 20.8% 46.7% 37.3%
D e t e r m i na n t s o f He a l t h 58
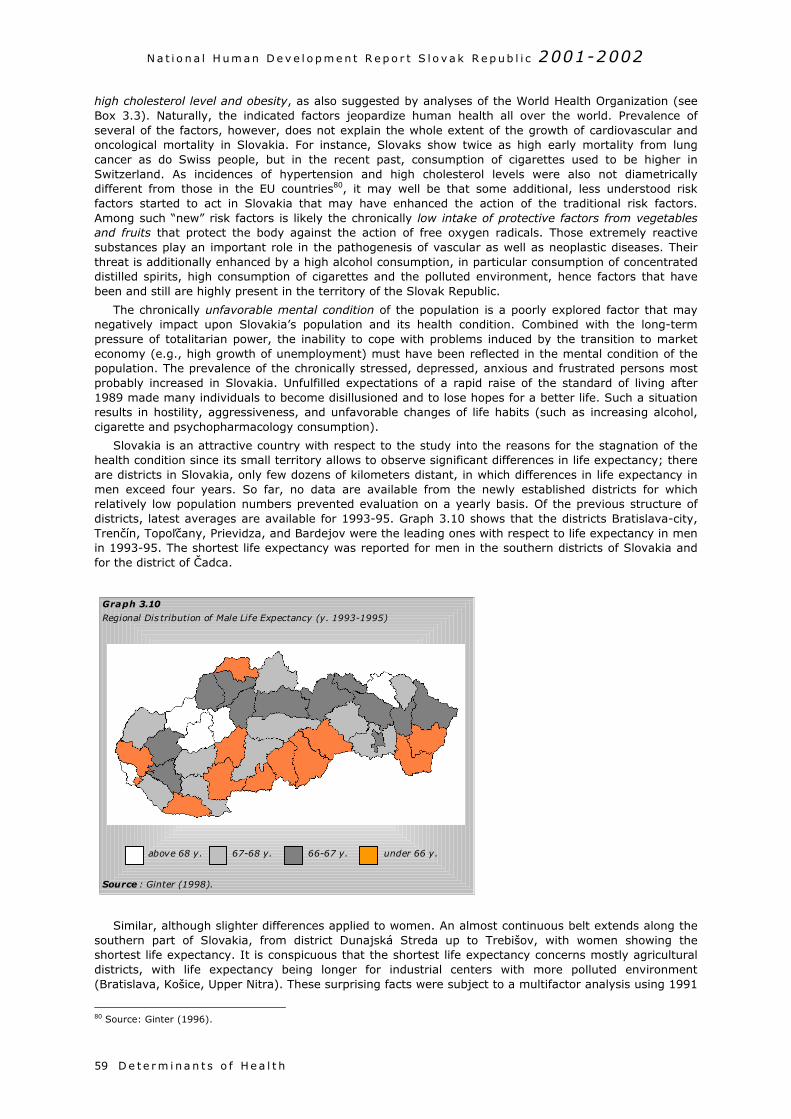
N a t i o n a l H um an D e v e l o p m e n t R e p o r t S l o v a k R e p ub l i c 2001-2002
D e t e r m i na n t s o f He a l t h59
high cholesterol level and obesity, as also suggested by analyses of the World Health Organization (seeBox 3.3). Naturally, the indicated factors jeopardize human health all over the world. Prevalence ofseveral of the factors, however, does not explain the whole extent of the growth of cardiovascular andoncological mortality in Slovakia. For instance, Slovaks show twice as high early mortality from lungcancer as do Swiss people, but in the recent past, consumption of cigarettes used to be higher inSwitzerland. As incidences of hypertension and high cholesterol levels were also not diametricallydifferent from those in the EU countries80, it may well be that some additional, less understood riskfactors started to act in Slovakia that may have enhanced the action of the traditional risk factors.Among such “new” risk factors is likely the chronically low intake of protective factors from vegetablesand fruits that protect the body against the action of free oxygen radicals. Those extremely reactivesubstances play an important role in the pathogenesis of vascular as well as neoplastic diseases. Theirthreat is additionally enhanced by a high alcohol consumption, in particular consumption of concentrateddistilled spirits, high consumption of cigarettes and the polluted environment, hence factors that havebeen and still are highly present in the territory of the Slovak Republic.
The chronically unfavorable mental condition of the population is a poorly explored factor that maynegatively impact upon Slovakia’s population and its health condition. Combined with the long-termpressure of totalitarian power, the inability to cope with problems induced by the transition to marketeconomy (e.g., high growth of unemployment) must have been reflected in the mental condition of thepopulation. The prevalence of the chronically stressed, depressed, anxious and frustrated persons mostprobably increased in Slovakia. Unfulfilled expectations of a rapid raise of the standard of living after1989 made many individuals to become disillusioned and to lose hopes for a better life. Such a situationresults in hostility, aggressiveness, and unfavorable changes of life habits (such as increasing alcohol,cigarette and psychopharmacology consumption).
Slovakia is an attractive country with respect to the study into the reasons for the stagnation of thehealth condition since its small territory allows to observe significant differences in life expectancy; thereare districts in Slovakia, only few dozens of kilometers distant, in which differences in life expectancy inmen exceed four years. So far, no data are available from the newly established districts for whichrelatively low population numbers prevented evaluation on a yearly basis. Of the previous structure ofdistricts, latest averages are available for 1993-95. Graph 3.10 shows that the districts Bratislava-city,Trenčín, Topoľčany, Prievidza, and Bardejov were the leading ones with respect to life expectancy in menin 1993-95. The shortest life expectancy was reported for men in the southern districts of Slovakia andfor the district of Čadca.
Similar, although slighter differences applied to women. An almost continuous belt extends along thesouthern part of Slovakia, from district Dunajská Streda up to Trebišov, with women showing theshortest life expectancy. It is conspicuous that the shortest life expectancy concerns mostly agriculturaldistricts, with life expectancy being longer for industrial centers with more polluted environment(Bratislava, Košice, Upper Nitra). These surprising facts were subject to a multifactor analysis using 1991
80 Source: Ginter (1996).
Graph 3.10
Regional Dis tribution of Male Life Expectancy (y. 1993-1995)
Source : Ginter (1998).
above 68 y. 67-68 y. 66-67 y. under 66 y.
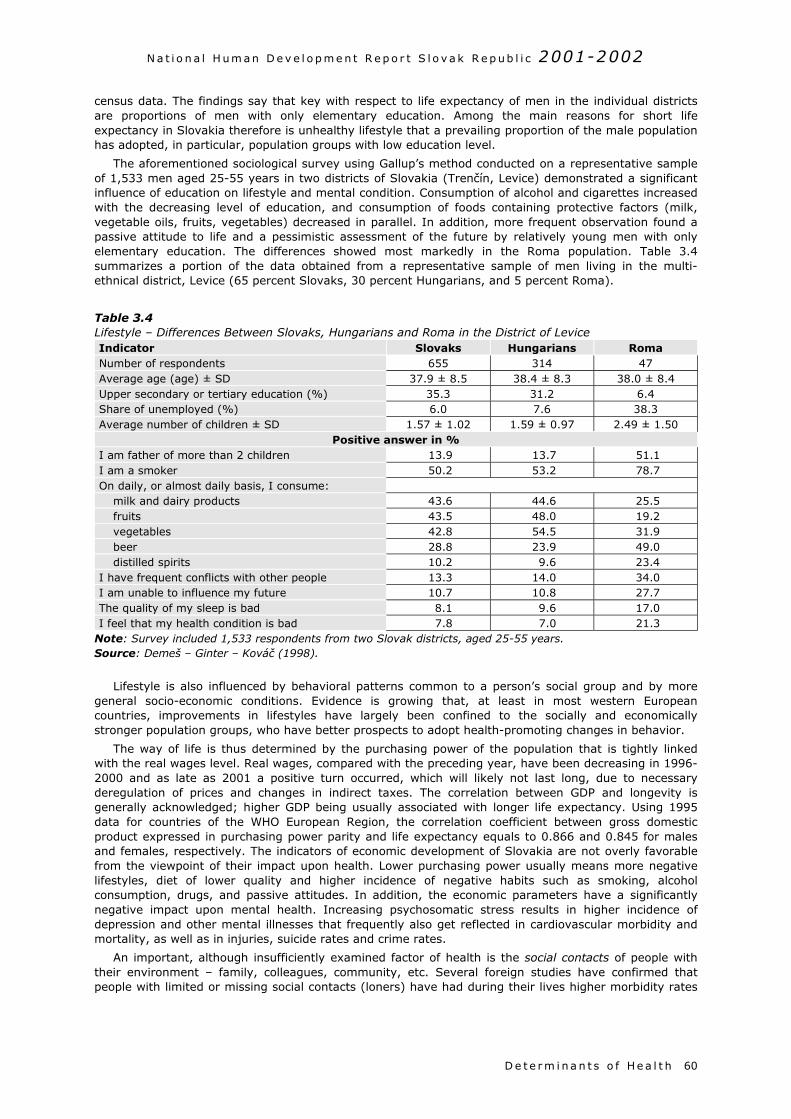
N a t i o n a l H um an D e v e l o p m e n t R e p o r t S l o v a k R e p ub l i c 2001-2002
D e t e r m i na n t s o f He a l t h 60
census data. The findings say that key with respect to life expectancy of men in the individual districtsare proportions of men with only elementary education. Among the main reasons for short lifeexpectancy in Slovakia therefore is unhealthy lifestyle that a prevailing proportion of the male populationhas adopted, in particular, population groups with low education level.
The aforementioned sociological survey using Gallup’s method conducted on a representative sampleof 1,533 men aged 25-55 years in two districts of Slovakia (Trenčín, Levice) demonstrated a significantinfluence of education on lifestyle and mental condition. Consumption of alcohol and cigarettes increasedwith the decreasing level of education, and consumption of foods containing protective factors (milk,vegetable oils, fruits, vegetables) decreased in parallel. In addition, more frequent observation found apassive attitude to life and a pessimistic assessment of the future by relatively young men with onlyelementary education. The differences showed most markedly in the Roma population. Table 3.4summarizes a portion of the data obtained from a representative sample of men living in the multi-ethnical district, Levice (65 percent Slovaks, 30 percent Hungarians, and 5 percent Roma).
Table 3.4Lifestyle – Differences Between Slovaks, Hungarians and Roma in the District of LeviceIndicator Slovaks Hungarians RomaNumber of respondents 655 314 47Average age (age) ± SD 37.9 ± 8.5 38.4 ± 8.3 38.0 ± 8.4Upper secondary or tertiary education (%) 35.3 31.2 6.4Share of unemployed (%) 6.0 7.6 38.3Average number of children ± SD 1.57 ± 1.02 1.59 ± 0.97 2.49 ± 1.50
Positive answer in %I am father of more than 2 children 13.9 13.7 51.1I am a smoker 50.2 53.2 78.7On daily, or almost daily basis, I consume:
milk and dairy products 43.6 44.6 25.5fruits 43.5 48.0 19.2vegetables 42.8 54.5 31.9beer 28.8 23.9 49.0distilled spirits 10.2 9.6 23.4
I have frequent conflicts with other people 13.3 14.0 34.0I am unable to influence my future 10.7 10.8 27.7The quality of my sleep is bad 8.1 9.6 17.0I feel that my health condition is bad 7.8 7.0 21.3
Note: Survey included 1,533 respondents from two Slovak districts, aged 25-55 years.Source: Demeš – Ginter – Kováč (1998).
Lifestyle is also influenced by behavioral patterns common to a person’s social group and by moregeneral socio-economic conditions. Evidence is growing that, at least in most western Europeancountries, improvements in lifestyles have largely been confined to the socially and economicallystronger population groups, who have better prospects to adopt health-promoting changes in behavior.
The way of life is thus determined by the purchasing power of the population that is tightly linkedwith the real wages level. Real wages, compared with the preceding year, have been decreasing in 1996-2000 and as late as 2001 a positive turn occurred, which will likely not last long, due to necessaryderegulation of prices and changes in indirect taxes. The correlation between GDP and longevity isgenerally acknowledged; higher GDP being usually associated with longer life expectancy. Using 1995data for countries of the WHO European Region, the correlation coefficient between gross domesticproduct expressed in purchasing power parity and life expectancy equals to 0.866 and 0.845 for malesand females, respectively. The indicators of economic development of Slovakia are not overly favorablefrom the viewpoint of their impact upon health. Lower purchasing power usually means more negativelifestyles, diet of lower quality and higher incidence of negative habits such as smoking, alcoholconsumption, drugs, and passive attitudes. In addition, the economic parameters have a significantlynegative impact upon mental health. Increasing psychosomatic stress results in higher incidence ofdepression and other mental illnesses that frequently also get reflected in cardiovascular morbidity andmortality, as well as in injuries, suicide rates and crime rates.
An important, although insufficiently examined factor of health is the social contacts of people withtheir environment – family, colleagues, community, etc. Several foreign studies have confirmed thatpeople with limited or missing social contacts (loners) have had during their lives higher morbidity rates
N a t i o n a l H um an D e v e l o p m e n t R e p o r t S l o v a k R e p ub l i c 2001-2002
D e t e r m i na n t s o f He a l t h61
Box 3.4Disparagement of Mental Health
Prevalence of mental health illness in Slovakia iscomparable with that found in EU countries, however,the developments both in treatment of mentally ill andthe organization of mental health services is fallingbehind. This is largely due to the historical legacy ofsocialism where mental health was not considered tobe a priority in terms of funding and organization ofthe system. The care of mentally ill had a custodialrather than therapeutic character (large psychiatrichospitals and asylums, pharmacological interventions)and was isolated from both domestic and foreigndevelopments. In several socialist countries violationand abuse of human rights in mental institutions hastaken place. There is a lack of epidemiological studiesthat would assess the service needs based on actuallevels of disease and also a lack of mental healthreform strategies. Mental disorders are still subject todisparagement and often lead to social isolation andexclusion. (Source: Study on the Social ProtectionSystems, 2002)
than people enjoying close and frequent social tieswith their surrounding.81 Other representativesurveys from the US found two to three timeshigher mortality rates and life expectancydifferences of nine years between individuals withthe fewest close friends, relatives and socialconnections and those with high levels of socialconnectedness.82 It is believed that people withpoor social connections more often suffer from anaccumulation of negative social factors such asunemployment, family problems, exclusion fromfriends’ circles, problems with the law, etc. Thementioned studies have pointed out the fact thatfeeling connected with other people is extremelyimportant for physical and mental health. Suicide,alcoholism and mental illness rates are muchhigher among people living alone.
A present-day form of weakening socialcontacts is the constantly widening “voluntarysolitariness” of a growing number of mainly youngpeople who decide for a life without a partner
and/or descendants. Such a choice is often associated with the notion of better economic backgroundand a more carefree life. As long as the lack of immediate family contacts is not balanced with ties toother social groups (friends, workfellows, clubs, etc.), it may be assumed that such an isolationnegatively impacts upon the health status of the individual. There is a marked long-term trend ofgrowing numbers of single’s households in Slovakia (see Table 3.5). This trend is apparently connectedwith changes in lifestyles, but also with improving housing conditions and lastly also with demographicchanges, mainly the growing numbers of widowed women in old age.
Table 3.5Households of Singles as Percentage of Total Number of HouseholdsYear 1950 1970 1980 1991 2001
Monomial households 5.8 11.9 19.8 21.8 30.0
Source: Population and housing census. Statistical Office of the SR.
3.2.3 Education
Education is among the most significant determinants of health. Investments into education are alsoinvestments into health. It may be thus assumed that a the drop in expenditures on education andtraining will prompt, in turn, pressure upon increasing expenditures on health care.
The most important impact upon health is probably given by the borderline between elementary andsecondary education. The more learners continue their training in secondary schools, the better thechances for a healthy population. In an epidemiological case study analyzing the relationship betweenpsychosocial risk factors and cardiovascular diseases, experts explored a significantly higher risk ofcardiovascular diseases incidence in individuals with elementary education compared to those withsecondary and university education.83 From this aspect, it might be of interest to look at the numbers oflearners during the recent years who did not continue their studies after completing elementary school.In 1990, they comprised 2.4 percent of all learners finishing elementary school studies, whereas theyrepresented as many as 10 percent in 1999. This negative development is underlined also by data onearly school leavers not continuing in education and training after finishing primary education (see Table3.6).
81 An example is the study of 972 Johns Hopkins medical students who were classified in personality tests into one of five types.Thirty years later when checking their health status, it was found that students classified as loners had sixteen times morecancer than people who vented their emotions to friends.82 Source: Social Ties and Good Health. http://www.attitudefactor.com/socialties.htm83 Source: Štefanovič – Egnerová et al. (1998).
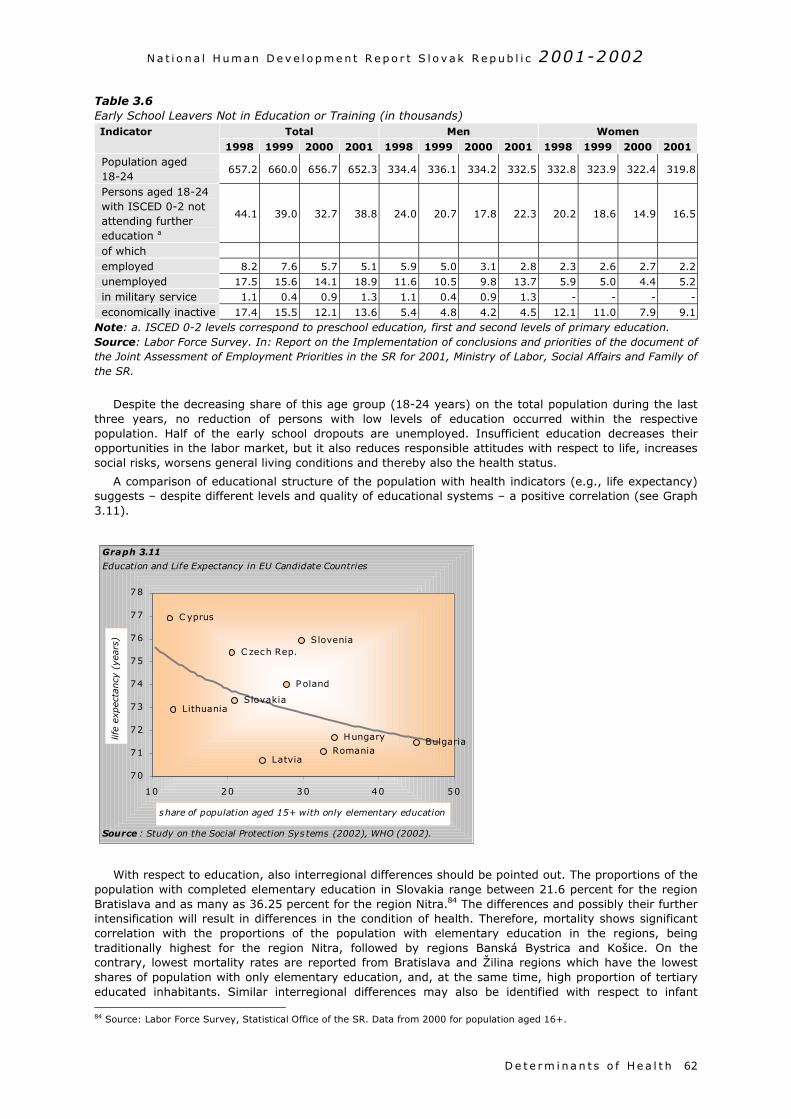
N a t i o n a l H um an D e v e l o p m e n t R e p o r t S l o v a k R e p ub l i c 2001-2002
D e t e r m i na n t s o f He a l t h 62
Table 3.6Early School Leavers Not in Education or Training (in thousands)
Total Men WomenIndicator
1998 1999 2000 2001 1998 1999 2000 2001 1998 1999 2000 2001Population aged18-24
657.2 660.0 656.7 652.3 334.4 336.1 334.2 332.5 332.8 323.9 322.4 319.8
Persons aged 18-24with ISCED 0-2 notattending furthereducation a
44.1 39.0 32.7 38.8 24.0 20.7 17.8 22.3 20.2 18.6 14.9 16.5
of whichemployed 8.2 7.6 5.7 5.1 5.9 5.0 3.1 2.8 2.3 2.6 2.7 2.2unemployed 17.5 15.6 14.1 18.9 11.6 10.5 9.8 13.7 5.9 5.0 4.4 5.2
in military service 1.1 0.4 0.9 1.3 1.1 0.4 0.9 1.3 - - - -
economically inactive 17.4 15.5 12.1 13.6 5.4 4.8 4.2 4.5 12.1 11.0 7.9 9.1Note: a. ISCED 0-2 levels correspond to preschool education, first and second levels of primary education.Source: Labor Force Survey. In: Report on the Implementation of conclusions and priorities of the document ofthe Joint Assessment of Employment Priorities in the SR for 2001, Ministry of Labor, Social Affairs and Family ofthe SR.
Despite the decreasing share of this age group (18-24 years) on the total population during the lastthree years, no reduction of persons with low levels of education occurred within the respectivepopulation. Half of the early school dropouts are unemployed. Insufficient education decreases theiropportunities in the labor market, but it also reduces responsible attitudes with respect to life, increasessocial risks, worsens general living conditions and thereby also the health status.
A comparison of educational structure of the population with health indicators (e.g., life expectancy)suggests – despite different levels and quality of educational systems – a positive correlation (see Graph3.11).
With respect to education, also interregional differences should be pointed out. The proportions of thepopulation with completed elementary education in Slovakia range between 21.6 percent for the regionBratislava and as many as 36.25 percent for the region Nitra.84 The differences and possibly their furtherintensification will result in differences in the condition of health. Therefore, mortality shows significantcorrelation with the proportions of the population with elementary education in the regions, beingtraditionally highest for the region Nitra, followed by regions Banská Bystrica and Košice. On thecontrary, lowest mortality rates are reported from Bratislava and Žilina regions which have the lowestshares of population with only elementary education, and, at the same time, high proportion of tertiaryeducated inhabitants. Similar interregional differences may also be identified with respect to infant 84 Source: Labor Force Survey, Statistical Office of the SR. Data from 2000 for population aged 16+.
BulgariaHungary
RomaniaLatvia
LithuaniaSlovakia
P oland
SloveniaC zech Rep.
C yprus
70
71
72
73
74
75
76
77
78
10 20 30 40 50
share of population aged 15+ with only elementary education
life
expec
tancy
(ye
ars)
Graph 3.11
Education and Life Expectancy in EU Candidate Countries
Source : Study on the Social Protection Sys tems (2002), WHO (2002).
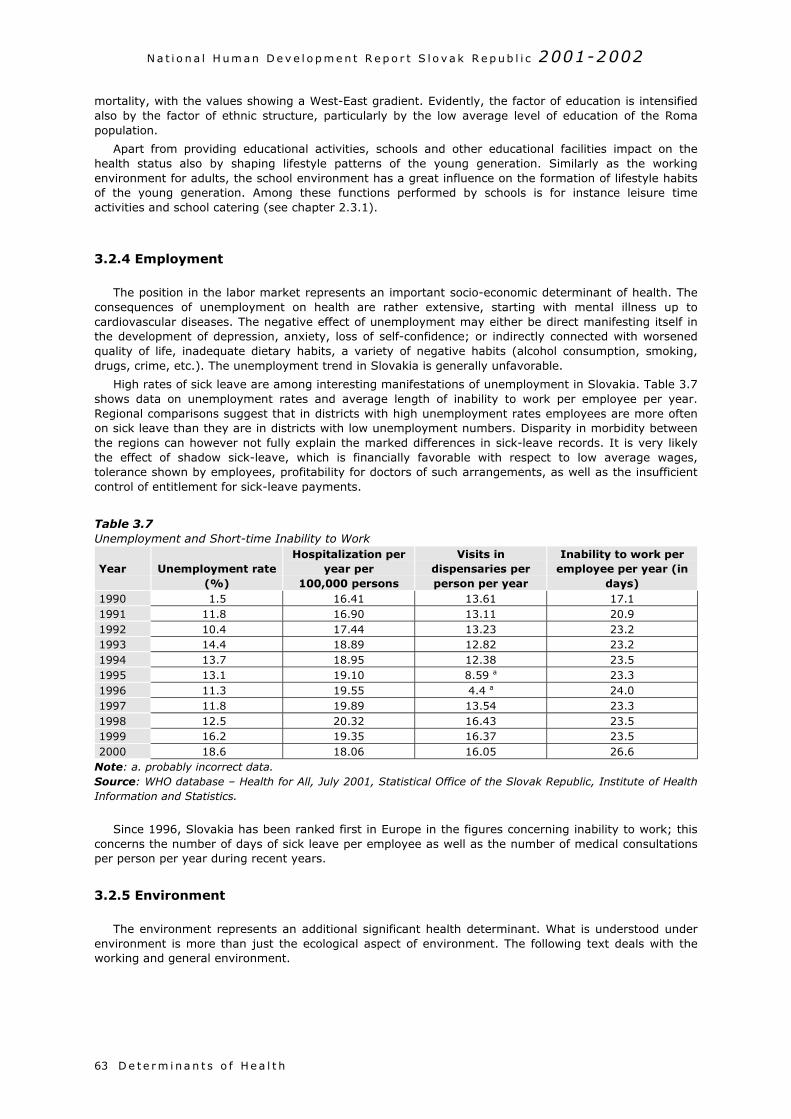
N a t i o n a l H um an D e v e l o p m e n t R e p o r t S l o v a k R e p ub l i c 2001-2002
D e t e r m i na n t s o f He a l t h63
mortality, with the values showing a West-East gradient. Evidently, the factor of education is intensifiedalso by the factor of ethnic structure, particularly by the low average level of education of the Romapopulation.
Apart from providing educational activities, schools and other educational facilities impact on thehealth status also by shaping lifestyle patterns of the young generation. Similarly as the workingenvironment for adults, the school environment has a great influence on the formation of lifestyle habitsof the young generation. Among these functions performed by schools is for instance leisure timeactivities and school catering (see chapter 2.3.1).
3.2.4 Employment
The position in the labor market represents an important socio-economic determinant of health. Theconsequences of unemployment on health are rather extensive, starting with mental illness up tocardiovascular diseases. The negative effect of unemployment may either be direct manifesting itself inthe development of depression, anxiety, loss of self-confidence; or indirectly connected with worsenedquality of life, inadequate dietary habits, a variety of negative habits (alcohol consumption, smoking,drugs, crime, etc.). The unemployment trend in Slovakia is generally unfavorable.
High rates of sick leave are among interesting manifestations of unemployment in Slovakia. Table 3.7shows data on unemployment rates and average length of inability to work per employee per year.Regional comparisons suggest that in districts with high unemployment rates employees are more oftenon sick leave than they are in districts with low unemployment numbers. Disparity in morbidity betweenthe regions can however not fully explain the marked differences in sick-leave records. It is very likelythe effect of shadow sick-leave, which is financially favorable with respect to low average wages,tolerance shown by employees, profitability for doctors of such arrangements, as well as the insufficientcontrol of entitlement for sick-leave payments.
Table 3.7Unemployment and Short-time Inability to Work
Year Unemployment rate(%)
Hospitalization peryear per
100,000 persons
Visits indispensaries perperson per year
Inability to work peremployee per year (in
days)1990 1.5 16.41 13.61 17.11991 11.8 16.90 13.11 20.91992 10.4 17.44 13.23 23.21993 14.4 18.89 12.82 23.21994 13.7 18.95 12.38 23.51995 13.1 19.10 8.59 a 23.31996 11.3 19.55 4.4 a 24.01997 11.8 19.89 13.54 23.31998 12.5 20.32 16.43 23.51999 16.2 19.35 16.37 23.52000 18.6 18.06 16.05 26.6
Note: a. probably incorrect data.Source: WHO database – Health for All, July 2001, Statistical Office of the Slovak Republic, Institute of HealthInformation and Statistics.
Since 1996, Slovakia has been ranked first in Europe in the figures concerning inability to work; thisconcerns the number of days of sick leave per employee as well as the number of medical consultationsper person per year during recent years.
3.2.5 Environment
The environment represents an additional significant health determinant. What is understood underenvironment is more than just the ecological aspect of environment. The following text deals with theworking and general environment.
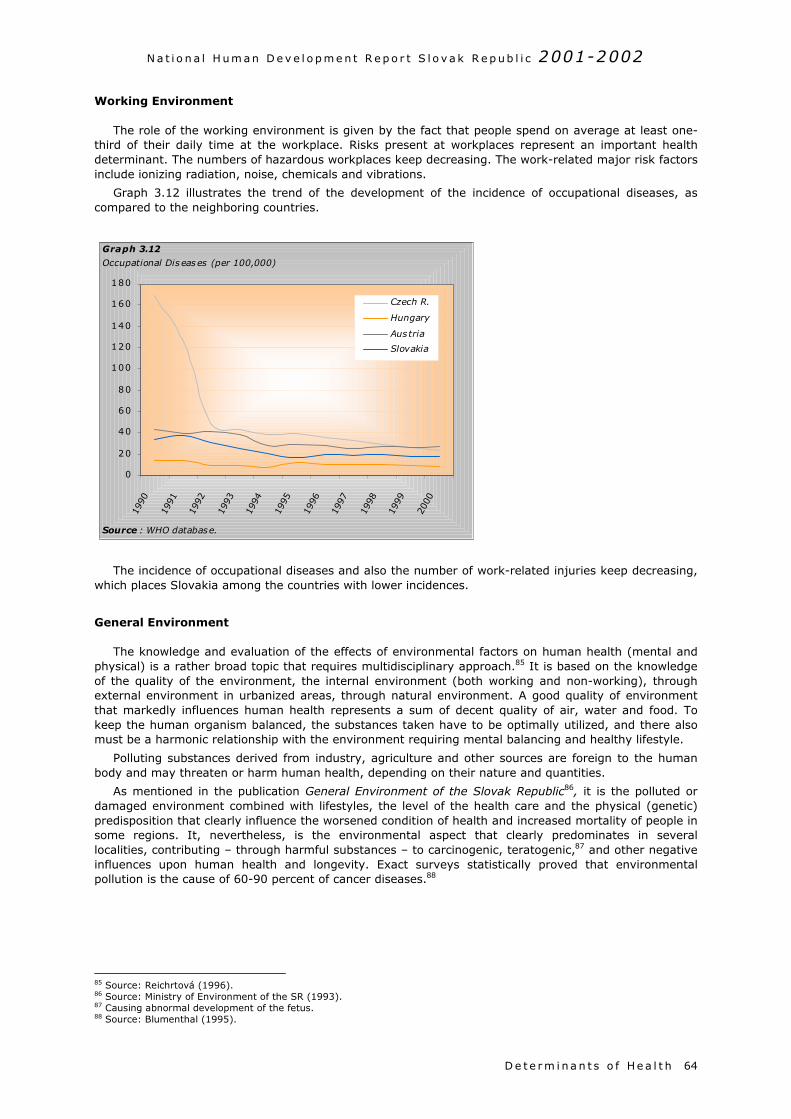
N a t i o n a l H um an D e v e l o p m e n t R e p o r t S l o v a k R e p ub l i c 2001-2002
D e t e r m i na n t s o f He a l t h 64
Working Environment
The role of the working environment is given by the fact that people spend on average at least one-third of their daily time at the workplace. Risks present at workplaces represent an important healthdeterminant. The numbers of hazardous workplaces keep decreasing. The work-related major risk factorsinclude ionizing radiation, noise, chemicals and vibrations.
Graph 3.12 illustrates the trend of the development of the incidence of occupational diseases, ascompared to the neighboring countries.
The incidence of occupational diseases and also the number of work-related injuries keep decreasing,which places Slovakia among the countries with lower incidences.
General Environment
The knowledge and evaluation of the effects of environmental factors on human health (mental andphysical) is a rather broad topic that requires multidisciplinary approach.85 It is based on the knowledgeof the quality of the environment, the internal environment (both working and non-working), throughexternal environment in urbanized areas, through natural environment. A good quality of environmentthat markedly influences human health represents a sum of decent quality of air, water and food. Tokeep the human organism balanced, the substances taken have to be optimally utilized, and there alsomust be a harmonic relationship with the environment requiring mental balancing and healthy lifestyle.
Polluting substances derived from industry, agriculture and other sources are foreign to the humanbody and may threaten or harm human health, depending on their nature and quantities.
As mentioned in the publication General Environment of the Slovak Republic86, it is the polluted ordamaged environment combined with lifestyles, the level of the health care and the physical (genetic)predisposition that clearly influence the worsened condition of health and increased mortality of people insome regions. It, nevertheless, is the environmental aspect that clearly predominates in severallocalities, contributing – through harmful substances – to carcinogenic, teratogenic,87 and other negativeinfluences upon human health and longevity. Exact surveys statistically proved that environmentalpollution is the cause of 60-90 percent of cancer diseases.88
85 Source: Reichrtová (1996).86 Source: Ministry of Environment of the SR (1993).87 Causing abnormal development of the fetus.88 Source: Blumenthal (1995).
0
20
40
60
80
100
120
140
160
180
1990
1991
1992
1993
1994
1995
1996
1997
1998
1999
2000
Czech R.
Hungary
Austria
Slovakia
Graph 3.12
Occupational Diseases (per 100,000)
Source : WHO database.
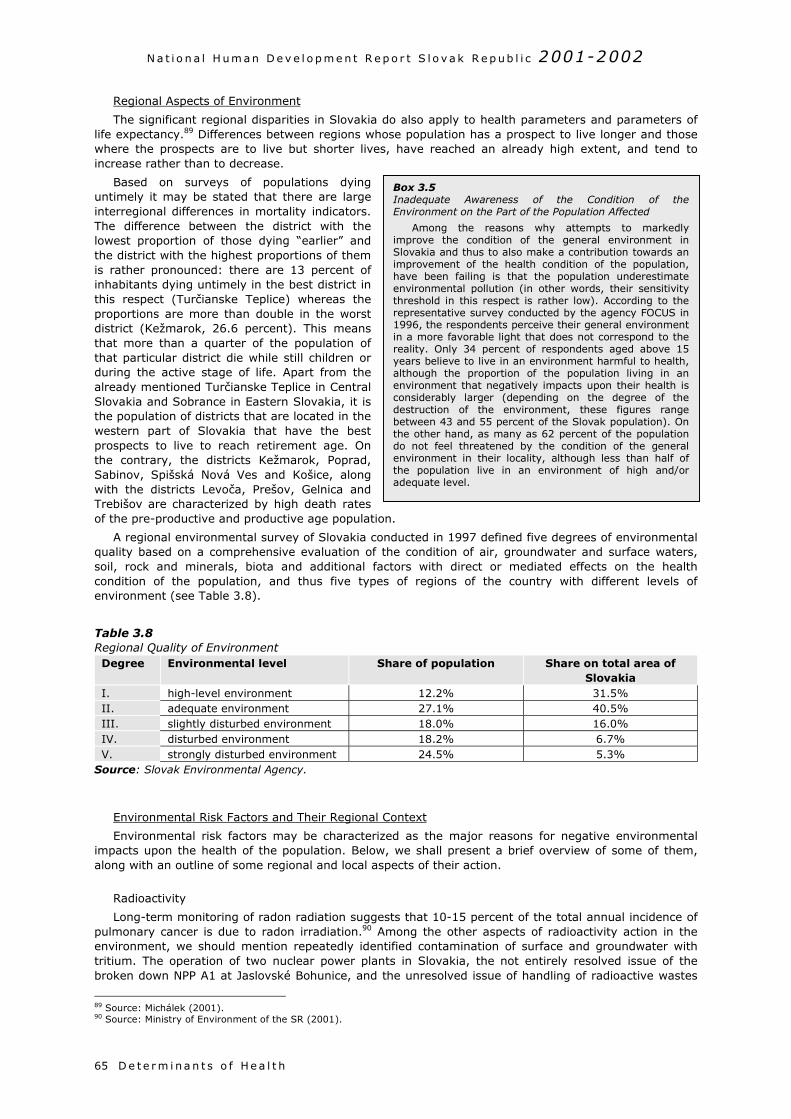
N a t i o n a l H um an D e v e l o p m e n t R e p o r t S l o v a k R e p ub l i c 2001-2002
D e t e r m i na n t s o f He a l t h65
Regional Aspects of Environment
The significant regional disparities in Slovakia do also apply to health parameters and parameters oflife expectancy.89 Differences between regions whose population has a prospect to live longer and thosewhere the prospects are to live but shorter lives, have reached an already high extent, and tend toincrease rather than to decrease.
Based on surveys of populations dyinguntimely it may be stated that there are largeinterregional differences in mortality indicators.The difference between the district with thelowest proportion of those dying “earlier” andthe district with the highest proportions of themis rather pronounced: there are 13 percent ofinhabitants dying untimely in the best district inthis respect (Turčianske Teplice) whereas theproportions are more than double in the worstdistrict (Kežmarok, 26.6 percent). This meansthat more than a quarter of the population ofthat particular district die while still children orduring the active stage of life. Apart from thealready mentioned Turčianske Teplice in CentralSlovakia and Sobrance in Eastern Slovakia, it isthe population of districts that are located in thewestern part of Slovakia that have the bestprospects to live to reach retirement age. Onthe contrary, the districts Kežmarok, Poprad,Sabinov, Spišská Nová Ves and Košice, alongwith the districts Levoča, Prešov, Gelnica andTrebišov are characterized by high death ratesof the pre-productive and productive age populatio
A regional environmental survey of Slovakia conquality based on a comprehensive evaluation of tsoil, rock and minerals, biota and additional faccondition of the population, and thus five typesenvironment (see Table 3.8).
Table 3.8Regional Quality of EnvironmentDegree Environmental level S
I. high-level environmentII. adequate environmentIII. slightly disturbed environmentIV. disturbed environmentV. strongly disturbed environment
Source: Slovak Environmental Agency.
Environmental Risk Factors and Their Regional C
Environmental risk factors may be characterizimpacts upon the health of the population. Belowalong with an outline of some regional and local asp
Radioactivity
Long-term monitoring of radon radiation suggespulmonary cancer is due to radon irradiation.90 Aenvironment, we should mention repeatedly identtritium. The operation of two nuclear power planbroken down NPP A1 at Jaslovské Bohunice, and t
89 Source: Michálek (2001).90 Source: Ministry of Environment of the SR (2001).
Box 3.5Inadequate Awareness of the Condition of theEnvironment on the Part of the Population Affected
Among the reasons why attempts to markedlyimprove the condition of the general environment inSlovakia and thus to also make a contribution towards animprovement of the health condition of the population,have been failing is that the population underestimateenvironmental pollution (in other words, their sensitivitythreshold in this respect is rather low). According to therepresentative survey conducted by the agency FOCUS in1996, the respondents perceive their general environmentin a more favorable light that does not correspond to thereality. Only 34 percent of respondents aged above 15years believe to live in an environment harmful to health,although the proportion of the population living in anenvironment that negatively impacts upon their health isconsiderably larger (depending on the degree of thedestruction of the environment, these figures rangebetween 43 and 55 percent of the Slovak population). Onthe other hand, as many as 62 percent of the populationdo not feel threatened by the condition of the generalenvironment in their locality, although less than half ofthe population live in an environment of high and/oradequate level.
n.
ducted in 1997 defined five degrees of environmentalhe condition of air, groundwater and surface waters,tors with direct or mediated effects on the health of regions of the country with different levels of
hare of population Share on total area ofSlovakia
12.2% 31.5%27.1% 40.5%18.0% 16.0%18.2% 6.7%24.5% 5.3%
ontext
ed as the major reasons for negative environmental, we shall present a brief overview of some of them,ects of their action.
ts that 10-15 percent of the total annual incidence ofmong the other aspects of radioactivity action in theified contamination of surface and groundwater withts in Slovakia, the not entirely resolved issue of thehe unresolved issue of handling of radioactive wastes
N a t i o n a l H um an D e v e l o p m e n t R e p o r t S l o v a k R e p ub l i c 2001-2002
and the entire so-called rear fuel cycle all represent a risk of elevated doses of radioactive radiation inSlovakia’s territory.
Noise
Measurements performed by State Health Institute of the Slovak Republic suggested thatapproximately 43 percent of Slovakia’s population were exposed to excessive noise [exceeding 55 dB(A)]from road and railway transport in 1999, thereof 9.5 percent were exposed to noise exceeding 65 dB(A)stemming from the above sources, that level being officially recognized as noise levels negativelyimpacting upon the vegetative nervous system.
Chemical Substances
Point sources of arsenic release into the air and waters are mostly linked with the production andprocessing of minerals for energy generation and other purposes (Upper Nitra, Žiar nad Hronom, Jelšava– Lubeník, Central Zips, Košice, cement factories, magnesite factories) as well as with some significantindustrial plants with chemical production.
Point sources of the release into the air and waters of cyanides and other chemical substancesdamaging reproduction, in the form of wastes are connected with mainly large residential and industrialagglomerations (Banská Bystrica – Zvolen, Košice, Central Váh river region, Upper Nitra, Žiar nadHronom, Central Zips, Žilina, Ružomberok, Trnava, Senica). Point sources of the release into the air andwaters of chemical substances in the form of wastes classified as “Chemical substances with carcinogenicpotential for humans” are most frequent in the districts of Trenčín, Trnava, Nitra, Banská Bystrica aŽilina.
Foreign Substances in the Food Chain
So-called coordinated targeted monitoring whose objective is to identify, under real conditions ofagricultural production and consumptionof this production in selected localitiesthe interrelationship between the degreeof contamination of agricultural land,feeding waters, plant and animalproduction showed 205 out of 2,820samples analyzed (i.e., 7.2 percent) tohave exceeded the set limits for at leastone of the contaminants monitored.Samples contained higher than allowedlevels of nitrites (5.3 percent), nitrates(3.2 percent), mercury (5.9 percent),cadmium (1.8 percent), chrome (0.1percent) and nickel (1.3 percent). Mostsamples with cadmium levels exceedingadmissible ones came from the districtsŽiar nad Hronom, Žarnovica andKežmarok, those with higher thanadmissible levels of mercury were fromthe districts Spišská Nová Ves, with leadfrom the districts Žiar nad Hronom andŽarnovica.
Threat to the Ozone Layer
Measurements performed by theSlovak Hydrometeorological Institute in1999 showed average annual values oftotal atmospheric ozone 2.3 percentabove the long-term average. From theviewpoint of biosphere effects, mostsignificant was the largest negativedeviation (-7.4 percent) measured inJune when the Sun stays on the sky overlongest periods of time and the path ofthe sunrays across the ozone layer is theshortest.
Box 3.6Regional Disparities: Examples of Environmental Impacts on theHealth Condition of Children
The relationship between the condition of the generalenvironment and the condition of health, in this case of thepopulation of children, has also been confirmed by the results of atargeted survey of the health condition of children as the mostsensitive age-group of the population. The health condition ofchildren living permanently in the worst polluted localities ofSlovakia – as compared with children from less polluted region(surroundings of Nitra) suggested a clear disadvantage forchildren from exposed regions. Selected groups of 7-10-year-oldchildren living for at least 5 years in regions Bratislava, Žiar nadHronom, Lower Orava, Upper Nitra, Jelšava-Lubeník, Rudňany andKošice were monitored by the hygienic service and pediatricianssince 1983, and children from Ružomberok, Strážske and Sereď-Šaľa since 1987. Altogether, approximately 10,000 pupils weremonitored.
The highest incidences were recorded for allergies anddiseases of the respiratory tract, with the situation with respect tothe above diseases being worse in environmentally disturbedregions than in the control region, and the difference persistedover long periods of time. Also, the diseases required longertreatment times. The incidences in pupils were almost three timeshigher for Rudňany and Strážske than for the reference region.
Similarly, diseases of the digestive system had clearly higherincidences for industrial areas as compared to the reference one(except Sereď and Šaľa). Also, higher incidences were recordedfor diseases of the nervous system and sensory organs, with theworst situation concerning Bratislava, Lubeník, Upper Nitra andRudňany. Ranking fourth were diseases of the skin andsubcutaneous tissue, being in Bratislava as high as 5 times theincidence in the reference region in mid-90s.
Overall, morbidity of children from polluted regions is higher.Moreover, the time needed to treat such diseases is longer inthese regions, and there are more recurrences. At the same time,unfavorable alterations have been identified in unspecific immunedefense as well as alterations in blood hemoglobin.
D e t e r m i na n t s o f He a l t h 66
N a t i o n a l H um an D e v e l o p m e n t R e p o r t S l o v a k R e p ub l i c 2001-2002
D e t e r m i na n t s o f He a l t h67
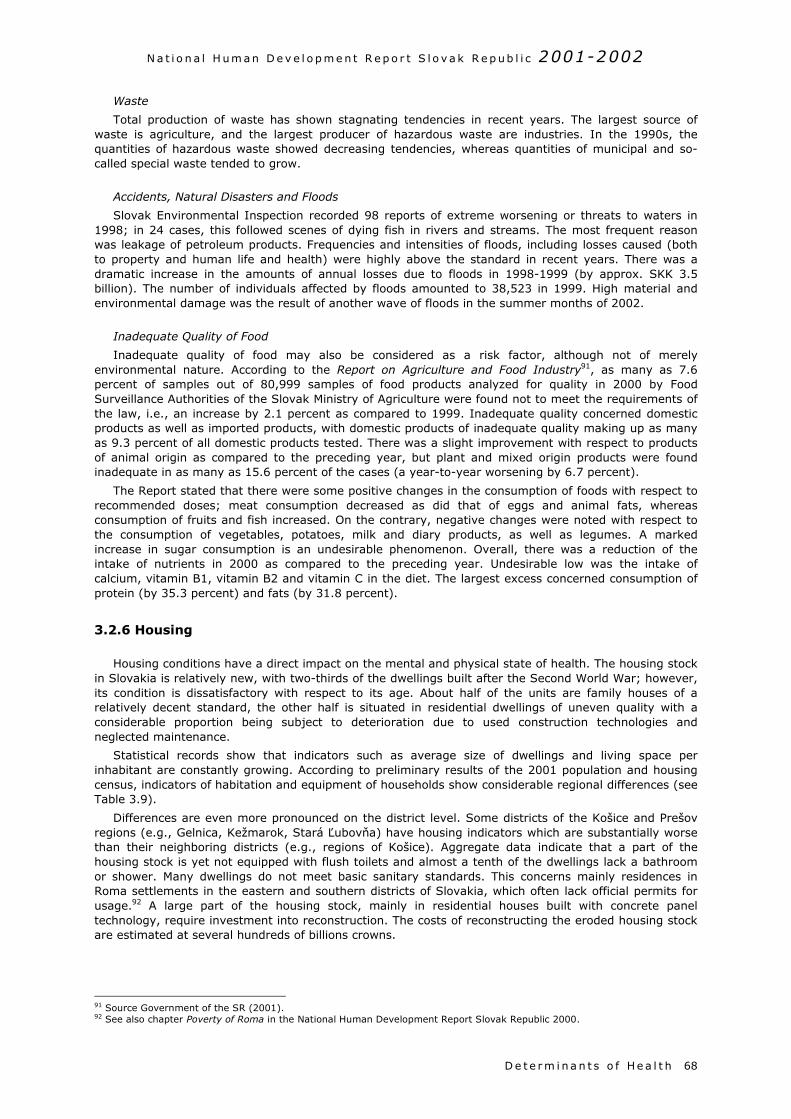
N a t i o n a l H um an D e v e l o p m e n t R e p o r t S l o v a k R e p ub l i c 2001-2002
D e t e r m i na n t s o f He a l t h 68
Waste
Total production of waste has shown stagnating tendencies in recent years. The largest source ofwaste is agriculture, and the largest producer of hazardous waste are industries. In the 1990s, thequantities of hazardous waste showed decreasing tendencies, whereas quantities of municipal and so-called special waste tended to grow.
Accidents, Natural Disasters and Floods
Slovak Environmental Inspection recorded 98 reports of extreme worsening or threats to waters in1998; in 24 cases, this followed scenes of dying fish in rivers and streams. The most frequent reasonwas leakage of petroleum products. Frequencies and intensities of floods, including losses caused (bothto property and human life and health) were highly above the standard in recent years. There was adramatic increase in the amounts of annual losses due to floods in 1998-1999 (by approx. SKK 3.5billion). The number of individuals affected by floods amounted to 38,523 in 1999. High material andenvironmental damage was the result of another wave of floods in the summer months of 2002.
Inadequate Quality of Food
Inadequate quality of food may also be considered as a risk factor, although not of merelyenvironmental nature. According to the Report on Agriculture and Food Industry91, as many as 7.6percent of samples out of 80,999 samples of food products analyzed for quality in 2000 by FoodSurveillance Authorities of the Slovak Ministry of Agriculture were found not to meet the requirements ofthe law, i.e., an increase by 2.1 percent as compared to 1999. Inadequate quality concerned domesticproducts as well as imported products, with domestic products of inadequate quality making up as manyas 9.3 percent of all domestic products tested. There was a slight improvement with respect to productsof animal origin as compared to the preceding year, but plant and mixed origin products were foundinadequate in as many as 15.6 percent of the cases (a year-to-year worsening by 6.7 percent).
The Report stated that there were some positive changes in the consumption of foods with respect torecommended doses; meat consumption decreased as did that of eggs and animal fats, whereasconsumption of fruits and fish increased. On the contrary, negative changes were noted with respect tothe consumption of vegetables, potatoes, milk and diary products, as well as legumes. A markedincrease in sugar consumption is an undesirable phenomenon. Overall, there was a reduction of theintake of nutrients in 2000 as compared to the preceding year. Undesirable low was the intake ofcalcium, vitamin B1, vitamin B2 and vitamin C in the diet. The largest excess concerned consumption ofprotein (by 35.3 percent) and fats (by 31.8 percent).
3.2.6 Housing
Housing conditions have a direct impact on the mental and physical state of health. The housing stockin Slovakia is relatively new, with two-thirds of the dwellings built after the Second World War; however,its condition is dissatisfactory with respect to its age. About half of the units are family houses of arelatively decent standard, the other half is situated in residential dwellings of uneven quality with aconsiderable proportion being subject to deterioration due to used construction technologies andneglected maintenance.
Statistical records show that indicators such as average size of dwellings and living space perinhabitant are constantly growing. According to preliminary results of the 2001 population and housingcensus, indicators of habitation and equipment of households show considerable regional differences (seeTable 3.9).
Differences are even more pronounced on the district level. Some districts of the Košice and Prešovregions (e.g., Gelnica, Kežmarok, Stará Ľubovňa) have housing indicators which are substantially worsethan their neighboring districts (e.g., regions of Košice). Aggregate data indicate that a part of thehousing stock is yet not equipped with flush toilets and almost a tenth of the dwellings lack a bathroomor shower. Many dwellings do not meet basic sanitary standards. This concerns mainly residences inRoma settlements in the eastern and southern districts of Slovakia, which often lack official permits forusage.92 A large part of the housing stock, mainly in residential houses built with concrete paneltechnology, require investment into reconstruction. The costs of reconstructing the eroded housing stockare estimated at several hundreds of billions crowns.
91 Source Government of the SR (2001).92 See also chapter Poverty of Roma in the National Human Development Report Slovak Republic 2000.
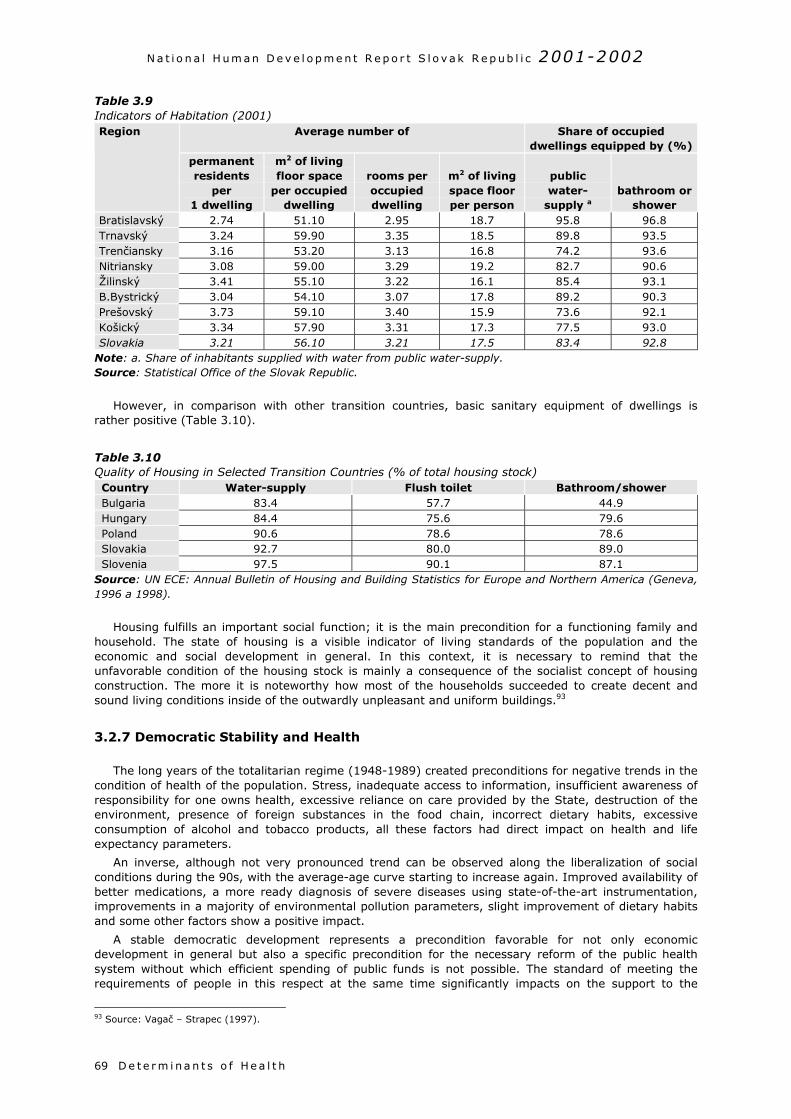
N a t i o n a l H um an D e v e l o p m e n t R e p o r t S l o v a k R e p ub l i c 2001-2002
D e t e r m i na n t s o f He a l t h69
Table 3.9Indicators of Habitation (2001)
Average number of Share of occupieddwellings equipped by (%)
Region
permanentresidents
per1 dwelling
m2 of livingfloor space
per occupieddwelling
rooms peroccupieddwelling
m2 of livingspace floorper person
publicwater-
supply abathroom or
showerBratislavský 2.74 51.10 2.95 18.7 95.8 96.8Trnavský 3.24 59.90 3.35 18.5 89.8 93.5Trenčiansky 3.16 53.20 3.13 16.8 74.2 93.6Nitriansky 3.08 59.00 3.29 19.2 82.7 90.6Žilinský 3.41 55.10 3.22 16.1 85.4 93.1B.Bystrický 3.04 54.10 3.07 17.8 89.2 90.3Prešovský 3.73 59.10 3.40 15.9 73.6 92.1Košický 3.34 57.90 3.31 17.3 77.5 93.0Slovakia 3.21 56.10 3.21 17.5 83.4 92.8
Note: a. Share of inhabitants supplied with water from public water-supply.Source: Statistical Office of the Slovak Republic.
However, in comparison with other transition countries, basic sanitary equipment of dwellings israther positive (Table 3.10).
Table 3.10Quality of Housing in Selected Transition Countries (% of total housing stock)Country Water-supply Flush toilet Bathroom/showerBulgaria 83.4 57.7 44.9Hungary 84.4 75.6 79.6Poland 90.6 78.6 78.6Slovakia 92.7 80.0 89.0Slovenia 97.5 90.1 87.1
Source: UN ECE: Annual Bulletin of Housing and Building Statistics for Europe and Northern America (Geneva,1996 a 1998).
Housing fulfills an important social function; it is the main precondition for a functioning family andhousehold. The state of housing is a visible indicator of living standards of the population and theeconomic and social development in general. In this context, it is necessary to remind that theunfavorable condition of the housing stock is mainly a consequence of the socialist concept of housingconstruction. The more it is noteworthy how most of the households succeeded to create decent andsound living conditions inside of the outwardly unpleasant and uniform buildings.93
3.2.7 Democratic Stability and Health
The long years of the totalitarian regime (1948-1989) created preconditions for negative trends in thecondition of health of the population. Stress, inadequate access to information, insufficient awareness ofresponsibility for one owns health, excessive reliance on care provided by the State, destruction of theenvironment, presence of foreign substances in the food chain, incorrect dietary habits, excessiveconsumption of alcohol and tobacco products, all these factors had direct impact on health and lifeexpectancy parameters.
An inverse, although not very pronounced trend can be observed along the liberalization of socialconditions during the 90s, with the average-age curve starting to increase again. Improved availability ofbetter medications, a more ready diagnosis of severe diseases using state-of-the-art instrumentation,improvements in a majority of environmental pollution parameters, slight improvement of dietary habitsand some other factors show a positive impact.
A stable democratic development represents a precondition favorable for not only economicdevelopment in general but also a specific precondition for the necessary reform of the public healthsystem without which efficient spending of public funds is not possible. The standard of meeting therequirements of people in this respect at the same time significantly impacts on the support to the
93 Source: Vagač – Strapec (1997).
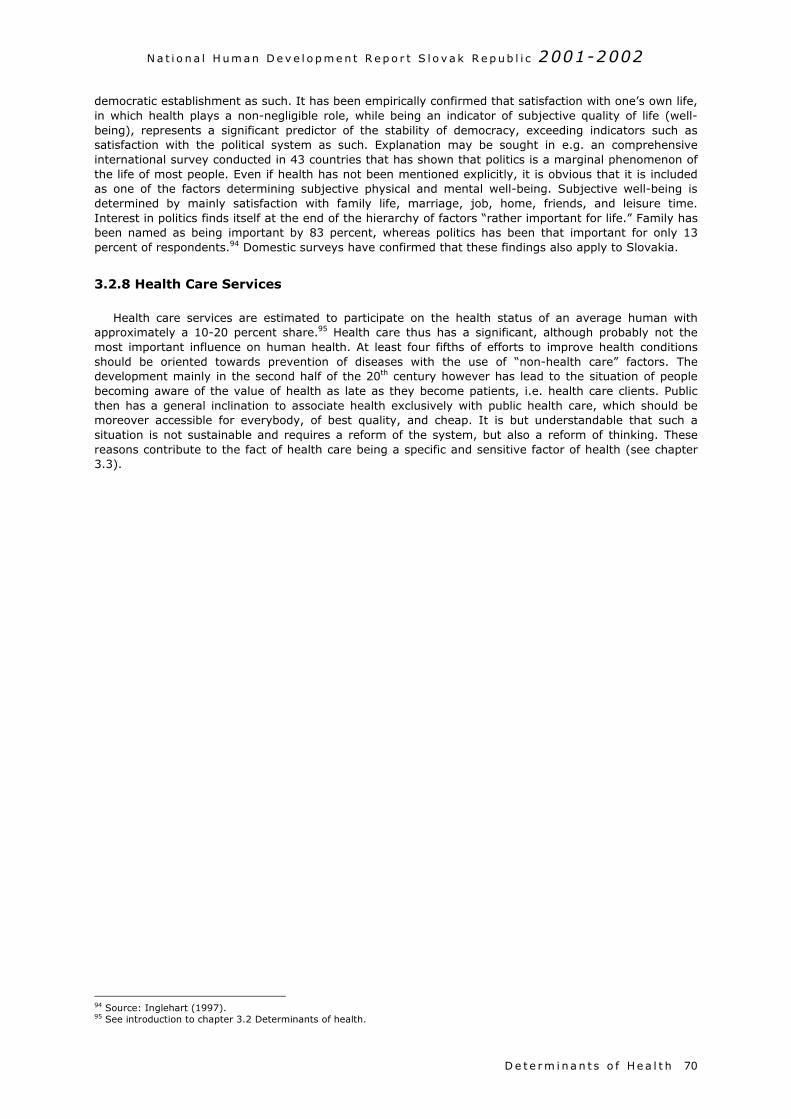
N a t i o n a l H um an D e v e l o p m e n t R e p o r t S l o v a k R e p ub l i c 2001-2002
D e t e r m i na n t s o f He a l t h 70
democratic establishment as such. It has been empirically confirmed that satisfaction with one’s own life,in which health plays a non-negligible role, while being an indicator of subjective quality of life (well-being), represents a significant predictor of the stability of democracy, exceeding indicators such assatisfaction with the political system as such. Explanation may be sought in e.g. an comprehensiveinternational survey conducted in 43 countries that has shown that politics is a marginal phenomenon ofthe life of most people. Even if health has not been mentioned explicitly, it is obvious that it is includedas one of the factors determining subjective physical and mental well-being. Subjective well-being isdetermined by mainly satisfaction with family life, marriage, job, home, friends, and leisure time.Interest in politics finds itself at the end of the hierarchy of factors “rather important for life.” Family hasbeen named as being important by 83 percent, whereas politics has been that important for only 13percent of respondents.94 Domestic surveys have confirmed that these findings also apply to Slovakia.
3.2.8 Health Care Services
Health care services are estimated to participate on the health status of an average human withapproximately a 10-20 percent share.95 Health care thus has a significant, although probably not themost important influence on human health. At least four fifths of efforts to improve health conditionsshould be oriented towards prevention of diseases with the use of “non-health care” factors. Thedevelopment mainly in the second half of the 20th century however has lead to the situation of peoplebecoming aware of the value of health as late as they become patients, i.e. health care clients. Publicthen has a general inclination to associate health exclusively with public health care, which should bemoreover accessible for everybody, of best quality, and cheap. It is but understandable that such asituation is not sustainable and requires a reform of the system, but also a reform of thinking. Thesereasons contribute to the fact of health care being a specific and sensitive factor of health (see chapter3.3).
94 Source: Inglehart (1997).95 See introduction to chapter 3.2 Determinants of health.
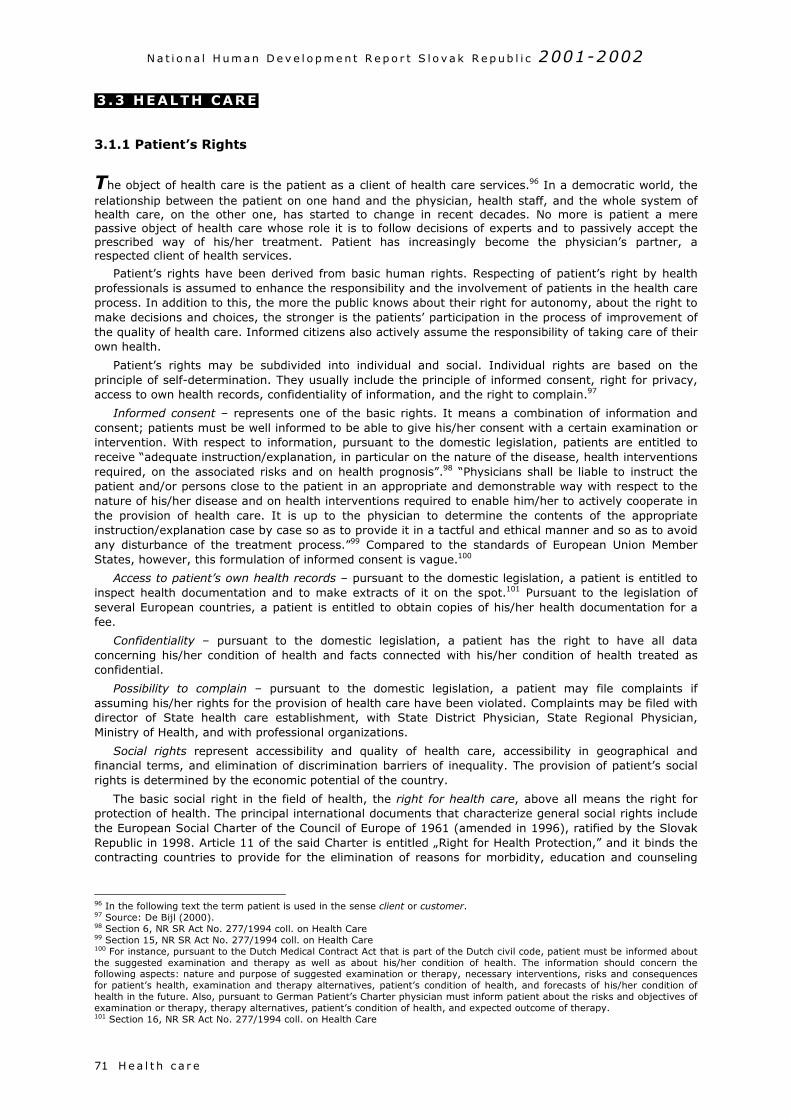
N a t i o n a l H um an D e v e l o p m e n t R e p o r t S l o v a k R e p ub l i c 2001-2002
H e a l t h c a r e71
3 .3 HEALTH CARE
3.1.1 Patient’s Rights
The object of health care is the patient as a client of health care services.96 In a democratic world, therelationship between the patient on one hand and the physician, health staff, and the whole system ofhealth care, on the other one, has started to change in recent decades. No more is patient a merepassive object of health care whose role it is to follow decisions of experts and to passively accept theprescribed way of his/her treatment. Patient has increasingly become the physician’s partner, arespected client of health services.
Patient’s rights have been derived from basic human rights. Respecting of patient’s right by healthprofessionals is assumed to enhance the responsibility and the involvement of patients in the health careprocess. In addition to this, the more the public knows about their right for autonomy, about the right tomake decisions and choices, the stronger is the patients’ participation in the process of improvement ofthe quality of health care. Informed citizens also actively assume the responsibility of taking care of theirown health.
Patient’s rights may be subdivided into individual and social. Individual rights are based on theprinciple of self-determination. They usually include the principle of informed consent, right for privacy,access to own health records, confidentiality of information, and the right to complain.97
Informed consent – represents one of the basic rights. It means a combination of information andconsent; patients must be well informed to be able to give his/her consent with a certain examination orintervention. With respect to information, pursuant to the domestic legislation, patients are entitled toreceive “adequate instruction/explanation, in particular on the nature of the disease, health interventionsrequired, on the associated risks and on health prognosis”.98 “Physicians shall be liable to instruct thepatient and/or persons close to the patient in an appropriate and demonstrable way with respect to thenature of his/her disease and on health interventions required to enable him/her to actively cooperate inthe provision of health care. It is up to the physician to determine the contents of the appropriateinstruction/explanation case by case so as to provide it in a tactful and ethical manner and so as to avoidany disturbance of the treatment process.”99 Compared to the standards of European Union MemberStates, however, this formulation of informed consent is vague.100
Access to patient’s own health records – pursuant to the domestic legislation, a patient is entitled toinspect health documentation and to make extracts of it on the spot.101 Pursuant to the legislation ofseveral European countries, a patient is entitled to obtain copies of his/her health documentation for afee.
Confidentiality – pursuant to the domestic legislation, a patient has the right to have all dataconcerning his/her condition of health and facts connected with his/her condition of health treated asconfidential.
Possibility to complain – pursuant to the domestic legislation, a patient may file complaints ifassuming his/her rights for the provision of health care have been violated. Complaints may be filed withdirector of State health care establishment, with State District Physician, State Regional Physician,Ministry of Health, and with professional organizations.
Social rights represent accessibility and quality of health care, accessibility in geographical andfinancial terms, and elimination of discrimination barriers of inequality. The provision of patient’s socialrights is determined by the economic potential of the country.
The basic social right in the field of health, the right for health care, above all means the right forprotection of health. The principal international documents that characterize general social rights includethe European Social Charter of the Council of Europe of 1961 (amended in 1996), ratified by the SlovakRepublic in 1998. Article 11 of the said Charter is entitled „Right for Health Protection,” and it binds thecontracting countries to provide for the elimination of reasons for morbidity, education and counseling
96 In the following text the term patient is used in the sense client or customer.97 Source: De Bijl (2000).98 Section 6, NR SR Act No. 277/1994 coll. on Health Care99 Section 15, NR SR Act No. 277/1994 coll. on Health Care100 For instance, pursuant to the Dutch Medical Contract Act that is part of the Dutch civil code, patient must be informed aboutthe suggested examination and therapy as well as about his/her condition of health. The information should concern thefollowing aspects: nature and purpose of suggested examination or therapy, necessary interventions, risks and consequencesfor patient’s health, examination and therapy alternatives, patient’s condition of health, and forecasts of his/her condition ofhealth in the future. Also, pursuant to German Patient’s Charter physician must inform patient about the risks and objectives ofexamination or therapy, therapy alternatives, patient’s condition of health, and expected outcome of therapy.101 Section 16, NR SR Act No. 277/1994 coll. on Health Care
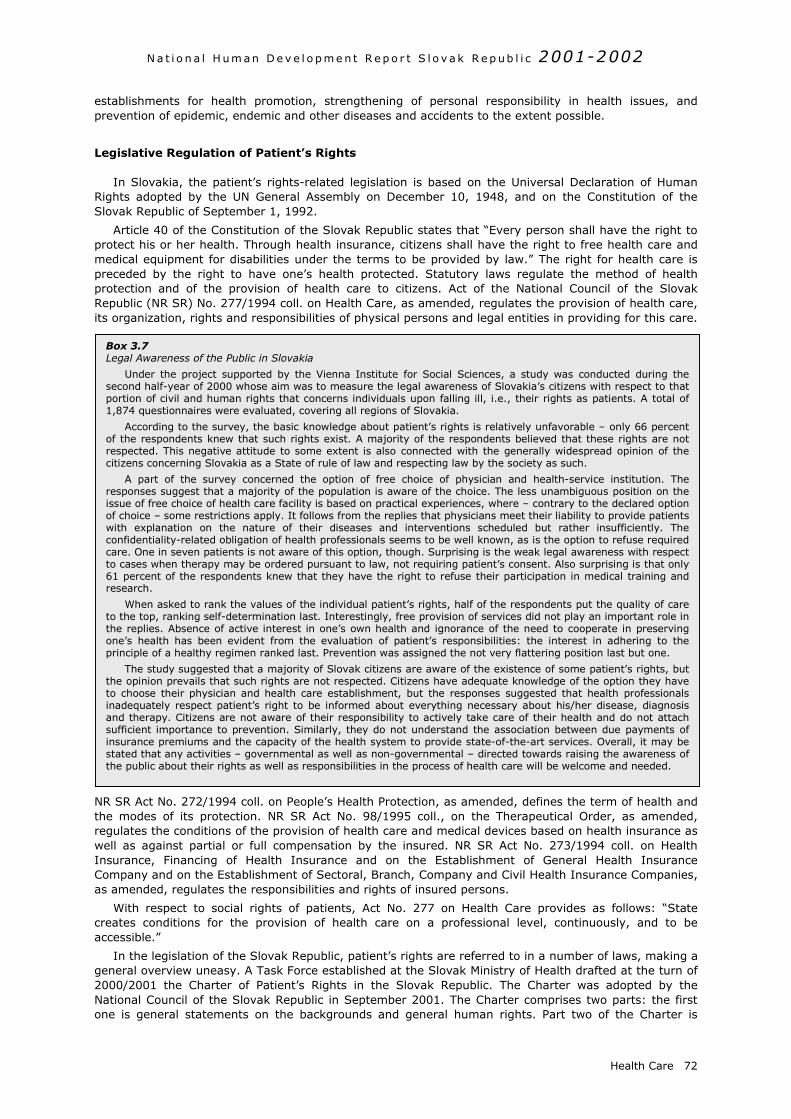
N a t i o n a l H um an D e v e l o p m e n t R e p o r t S l o v a k R e p ub l i c 2001-2002
establishments for health promotion, strengthening of personal responsibility in health issues, andprevention of epidemic, endemic and other diseases and accidents to the extent possible.
Legislative Regulation of Patient’s Rights
In Slovakia, the patient’s rights-related legislation is based on the Universal Declaration of HumanRights adopted by the UN General Assembly on December 10, 1948, and on the Constitution of theSlovak Republic of September 1, 1992.
Article 40 of the Constitution of the Slovak Republic states that “Every person shall have the right toprotect his or her health. Through health insurance, citizens shall have the right to free health care andmedical equipment for disabilities under the terms to be provided by law.” The right for health care ispreceded by the right to have one’s health protected. Statutory laws regulate the method of healthprotection and of the provision of health care to citizens. Act of the National Council of the SlovakRepublic (NR SR) No. 277/1994 coll. on Health Care, as amended, regulates the provision of health care,its organization, rights and responsibilities of physical persons and legal entities in providing for this care.
NtrwICa
ca
g2No
Box 3.7Legal Awareness of the Public in Slovakia
Under the project supported by the Vienna Institute for Social Sciences, a study was conducted during thesecond half-year of 2000 whose aim was to measure the legal awareness of Slovakia’s citizens with respect to thatportion of civil and human rights that concerns individuals upon falling ill, i.e., their rights as patients. A total of1,874 questionnaires were evaluated, covering all regions of Slovakia.
According to the survey, the basic knowledge about patient’s rights is relatively unfavorable – only 66 percentof the respondents knew that such rights exist. A majority of the respondents believed that these rights are notrespected. This negative attitude to some extent is also connected with the generally widespread opinion of thecitizens concerning Slovakia as a State of rule of law and respecting law by the society as such.
A part of the survey concerned the option of free choice of physician and health-service institution. Theresponses suggest that a majority of the population is aware of the choice. The less unambiguous position on theissue of free choice of health care facility is based on practical experiences, where – contrary to the declared optionof choice – some restrictions apply. It follows from the replies that physicians meet their liability to provide patientswith explanation on the nature of their diseases and interventions scheduled but rather insufficiently. Theconfidentiality-related obligation of health professionals seems to be well known, as is the option to refuse requiredcare. One in seven patients is not aware of this option, though. Surprising is the weak legal awareness with respectto cases when therapy may be ordered pursuant to law, not requiring patient’s consent. Also surprising is that only61 percent of the respondents knew that they have the right to refuse their participation in medical training andresearch.
When asked to rank the values of the individual patient’s rights, half of the respondents put the quality of careto the top, ranking self-determination last. Interestingly, free provision of services did not play an important role inthe replies. Absence of active interest in one’s own health and ignorance of the need to cooperate in preservingone’s health has been evident from the evaluation of patient’s responsibilities: the interest in adhering to theprinciple of a healthy regimen ranked last. Prevention was assigned the not very flattering position last but one.
The study suggested that a majority of Slovak citizens are aware of the existence of some patient’s rights, butthe opinion prevails that such rights are not respected. Citizens have adequate knowledge of the option they haveto choose their physician and health care establishment, but the responses suggested that health professionalsinadequately respect patient’s right to be informed about everything necessary about his/her disease, diagnosisand therapy. Citizens are not aware of their responsibility to actively take care of their health and do not attachsufficient importance to prevention. Similarly, they do not understand the association between due payments ofinsurance premiums and the capacity of the health system to provide state-of-the-art services. Overall, it may bestated that any activities – governmental as well as non-governmental – directed towards raising the awareness ofthe public about their rights as well as responsibilities in the process of health care will be welcome and needed.
Health Care 72
R SR Act No. 272/1994 coll. on People’s Health Protection, as amended, defines the term of health andhe modes of its protection. NR SR Act No. 98/1995 coll., on the Therapeutical Order, as amended,egulates the conditions of the provision of health care and medical devices based on health insurance asell as against partial or full compensation by the insured. NR SR Act No. 273/1994 coll. on Health
nsurance, Financing of Health Insurance and on the Establishment of General Health Insuranceompany and on the Establishment of Sectoral, Branch, Company and Civil Health Insurance Companies,s amended, regulates the responsibilities and rights of insured persons.
With respect to social rights of patients, Act No. 277 on Health Care provides as follows: “Statereates conditions for the provision of health care on a professional level, continuously, and to beccessible.”
In the legislation of the Slovak Republic, patient’s rights are referred to in a number of laws, making aeneral overview uneasy. A Task Force established at the Slovak Ministry of Health drafted at the turn of000/2001 the Charter of Patient’s Rights in the Slovak Republic. The Charter was adopted by theational Council of the Slovak Republic in September 2001. The Charter comprises two parts: the firstne is general statements on the backgrounds and general human rights. Part two of the Charter is
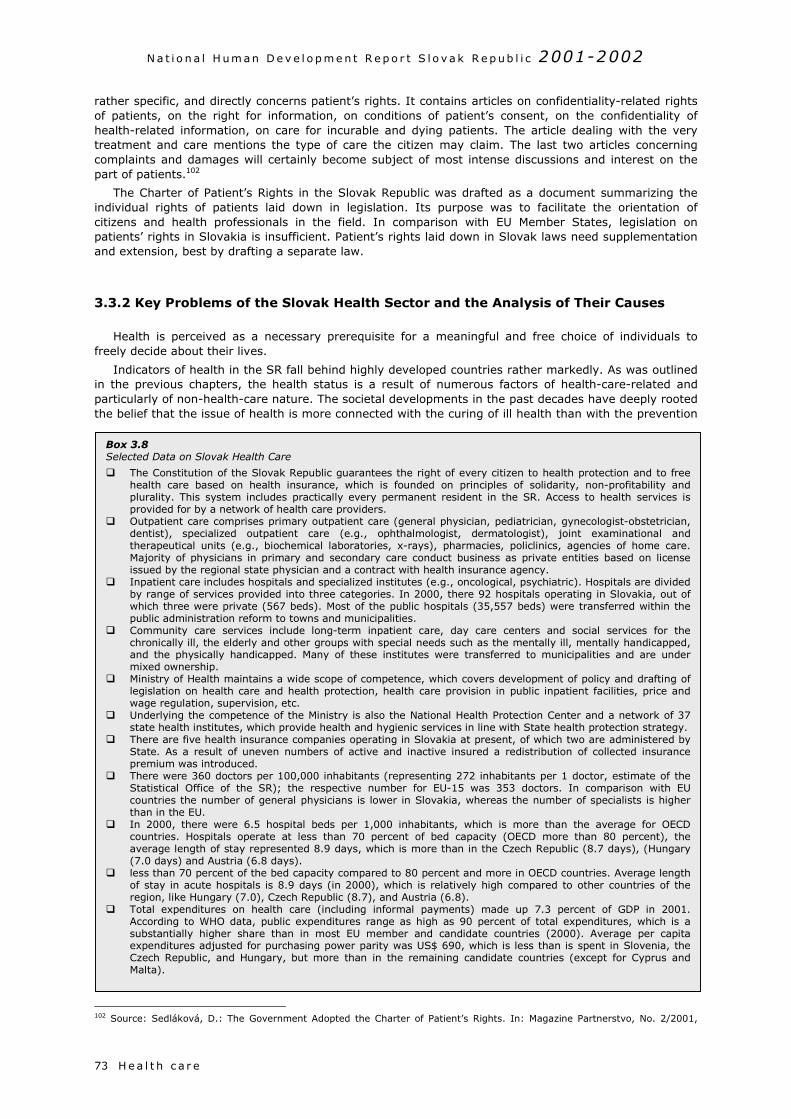
N a t i o n a l H um an D e v e l o p m e n t R e p o r t S l o v a k R e p ub l i c 2001-2002
7
rather specific, and directly concerns patient’s rights. It contains articles on confidentiality-related rightsof patients, on the right for information, on conditions of patient’s consent, on the confidentiality ofhealth-related information, on care for incurable and dying patients. The article dealing with the verytreatment and care mentions the type of care the citizen may claim. The last two articles concerningcomplaints and damages will certainly become subject of most intense discussions and interest on thepart of patients.102
The Charter of Patient’s Rights in the Slovak Republic was drafted as a document summarizing theindividual rights of patients laid down in legislation. Its purpose was to facilitate the orientation ofcitizens and health professionals in the field. In comparison with EU Member States, legislation onpatients’ rights in Slovakia is insufficient. Patient’s rights laid down in Slovak laws need supplementationand extension, best by drafting a separate law.
3.3.2 Key Problems of the Slovak Health Sector and the Analysis of Their Causes
Health is perceived as a necessary prerequisite for a meaningful and free choice of individuals tofreely decide about their lives.
Indicators of health in the SR fall behind highly developed countries rather markedly. As was outlinedin the previous chapters, the health status is a result of numerous factors of health-care-related andparticularly of non-health-care nature. The societal developments in the past decades have deeply rootedthe belief that the issue of health is more connected with the curing of ill health than with the prevention
1
Box 3.8Selected Data on Slovak Health Care
The Constitution of the Slovak Republic guarantees the right of every citizen to health protection and to freehealth care based on health insurance, which is founded on principles of solidarity, non-profitability andplurality. This system includes practically every permanent resident in the SR. Access to health services isprovided for by a network of health care providers.
Outpatient care comprises primary outpatient care (general physician, pediatrician, gynecologist-obstetrician,dentist), specialized outpatient care (e.g., ophthalmologist, dermatologist), joint examinational andtherapeutical units (e.g., biochemical laboratories, x-rays), pharmacies, policlinics, agencies of home care.Majority of physicians in primary and secondary care conduct business as private entities based on licenseissued by the regional state physician and a contract with health insurance agency.
Inpatient care includes hospitals and specialized institutes (e.g., oncological, psychiatric). Hospitals are dividedby range of services provided into three categories. In 2000, there 92 hospitals operating in Slovakia, out ofwhich three were private (567 beds). Most of the public hospitals (35,557 beds) were transferred within thepublic administration reform to towns and municipalities.
Community care services include long-term inpatient care, day care centers and social services for thechronically ill, the elderly and other groups with special needs such as the mentally ill, mentally handicapped,and the physically handicapped. Many of these institutes were transferred to municipalities and are undermixed ownership.
Ministry of Health maintains a wide scope of competence, which covers development of policy and drafting oflegislation on health care and health protection, health care provision in public inpatient facilities, price andwage regulation, supervision, etc.
Underlying the competence of the Ministry is also the National Health Protection Center and a network of 37state health institutes, which provide health and hygienic services in line with State health protection strategy.
There are five health insurance companies operating in Slovakia at present, of which two are administered byState. As a result of uneven numbers of active and inactive insured a redistribution of collected insurancepremium was introduced.
There were 360 doctors per 100,000 inhabitants (representing 272 inhabitants per 1 doctor, estimate of theStatistical Office of the SR); the respective number for EU-15 was 353 doctors. In comparison with EUcountries the number of general physicians is lower in Slovakia, whereas the number of specialists is higherthan in the EU.
In 2000, there were 6.5 hospital beds per 1,000 inhabitants, which is more than the average for OECDcountries. Hospitals operate at less than 70 percent of bed capacity (OECD more than 80 percent), theaverage length of stay represented 8.9 days, which is more than in the Czech Republic (8.7 days), (Hungary(7.0 days) and Austria (6.8 days).
less than 70 percent of the bed capacity compared to 80 percent and more in OECD countries. Average lengthof stay in acute hospitals is 8.9 days (in 2000), which is relatively high compared to other countries of theregion, like Hungary (7.0), Czech Republic (8.7), and Austria (6.8).
Total expenditures on health care (including informal payments) made up 7.3 percent of GDP in 2001.According to WHO data, public expenditures range as high as 90 percent of total expenditures, which is asubstantially higher share than in most EU member and candidate countries (2000). Average per capitaexpenditures adjusted for purchasing power parity was US$ 690, which is less than is spent in Slovenia, theCzech Republic, and Hungary, but more than in the remaining candidate countries (except for Cyprus andMalta).
H e a l t h c a r e3
02 Source: Sedláková, D.: The Government Adopted the Charter of Patient’s Rights. In: Magazine Partnerstvo, No. 2/2001,
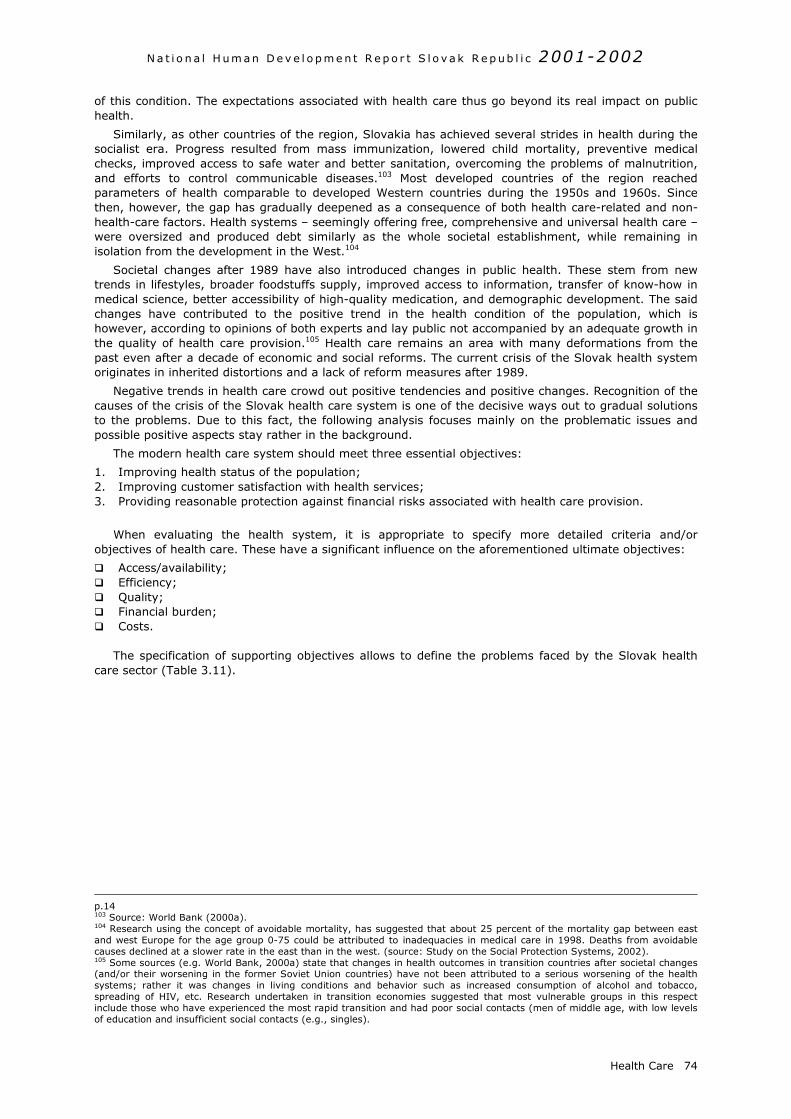
N a t i o n a l H um an D e v e l o p m e n t R e p o r t S l o v a k R e p ub l i c 2001-2002
Health Care 74
of this condition. The expectations associated with health care thus go beyond its real impact on publichealth.
Similarly, as other countries of the region, Slovakia has achieved several strides in health during thesocialist era. Progress resulted from mass immunization, lowered child mortality, preventive medicalchecks, improved access to safe water and better sanitation, overcoming the problems of malnutrition,and efforts to control communicable diseases.103 Most developed countries of the region reachedparameters of health comparable to developed Western countries during the 1950s and 1960s. Sincethen, however, the gap has gradually deepened as a consequence of both health care-related and non-health-care factors. Health systems – seemingly offering free, comprehensive and universal health care –were oversized and produced debt similarly as the whole societal establishment, while remaining inisolation from the development in the West.104
Societal changes after 1989 have also introduced changes in public health. These stem from newtrends in lifestyles, broader foodstuffs supply, improved access to information, transfer of know-how inmedical science, better accessibility of high-quality medication, and demographic development. The saidchanges have contributed to the positive trend in the health condition of the population, which ishowever, according to opinions of both experts and lay public not accompanied by an adequate growth inthe quality of health care provision.105 Health care remains an area with many deformations from thepast even after a decade of economic and social reforms. The current crisis of the Slovak health systemoriginates in inherited distortions and a lack of reform measures after 1989.
Negative trends in health care crowd out positive tendencies and positive changes. Recognition of thecauses of the crisis of the Slovak health care system is one of the decisive ways out to gradual solutionsto the problems. Due to this fact, the following analysis focuses mainly on the problematic issues andpossible positive aspects stay rather in the background.
The modern health care system should meet three essential objectives:
1. Improving health status of the population;2. Improving customer satisfaction with health services;3. Providing reasonable protection against financial risks associated with health care provision.
When evaluating the health system, it is appropriate to specify more detailed criteria and/orobjectives of health care. These have a significant influence on the aforementioned ultimate objectives:
Access/availability; Efficiency; Quality; Financial burden; Costs.
The specification of supporting objectives allows to define the problems faced by the Slovak healthcare sector (Table 3.11).
p.14103 Source: World Bank (2000a).104 Research using the concept of avoidable mortality, has suggested that about 25 percent of the mortality gap between eastand west Europe for the age group 0-75 could be attributed to inadequacies in medical care in 1998. Deaths from avoidablecauses declined at a slower rate in the east than in the west. (source: Study on the Social Protection Systems, 2002).105 Some sources (e.g. World Bank, 2000a) state that changes in health outcomes in transition countries after societal changes(and/or their worsening in the former Soviet Union countries) have not been attributed to a serious worsening of the healthsystems; rather it was changes in living conditions and behavior such as increased consumption of alcohol and tobacco,spreading of HIV, etc. Research undertaken in transition economies suggested that most vulnerable groups in this respectinclude those who have experienced the most rapid transition and had poor social contacts (men of middle age, with low levelsof education and insufficient social contacts (e.g., singles).
N a t i o n a l H um an D e v e l o p m e n t R e p o r t S l o v a k R e p ub l i c 2001-2002
H e a l t h c a r e75
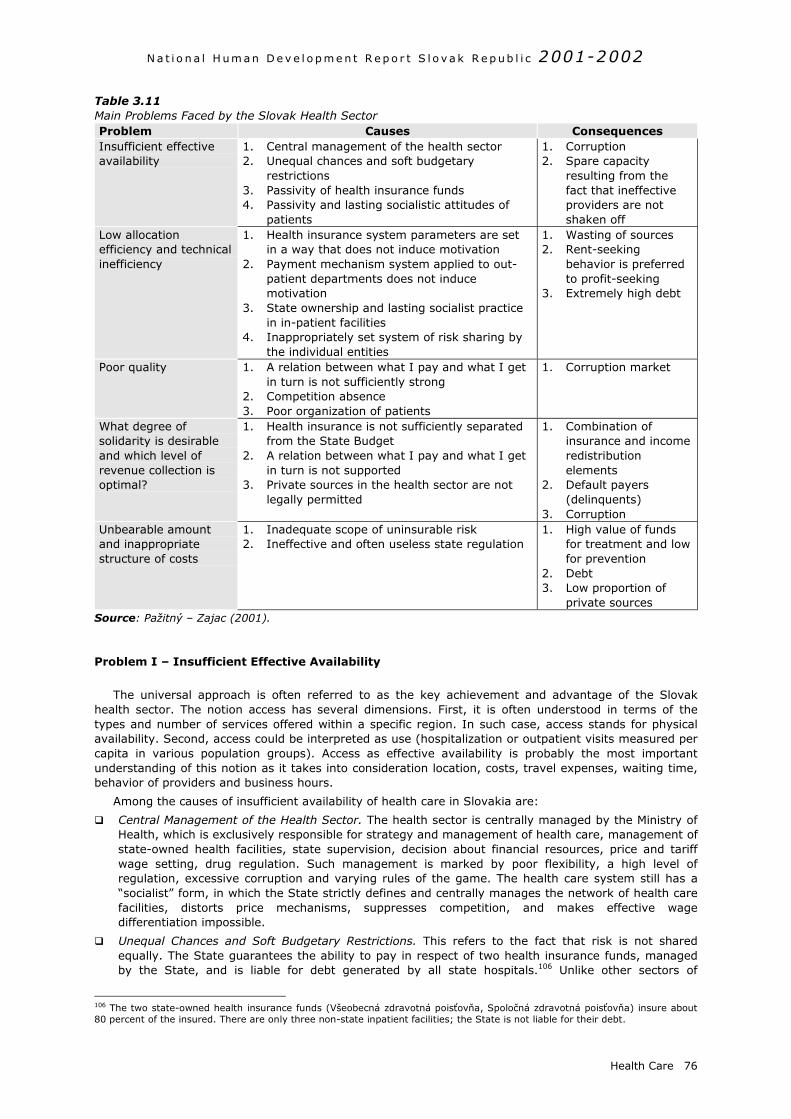
N a t i o n a l H um an D e v e l o p m e n t R e p o r t S l o v a k R e p ub l i c 2001-2002
Health Care 76
Table 3.11Main Problems Faced by the Slovak Health SectorProblem Causes ConsequencesInsufficient effectiveavailability
1. Central management of the health sector2. Unequal chances and soft budgetary
restrictions3. Passivity of health insurance funds4. Passivity and lasting socialistic attitudes of
patients
1. Corruption2. Spare capacity
resulting from thefact that ineffectiveproviders are notshaken off
Low allocationefficiency and technicalinefficiency
1. Health insurance system parameters are setin a way that does not induce motivation
2. Payment mechanism system applied to out-patient departments does not inducemotivation
3. State ownership and lasting socialist practicein in-patient facilities
4. Inappropriately set system of risk sharing bythe individual entities
1. Wasting of sources2. Rent-seeking
behavior is preferredto profit-seeking
3. Extremely high debt
Poor quality 1. A relation between what I pay and what I getin turn is not sufficiently strong
2. Competition absence3. Poor organization of patients
1. Corruption market
What degree ofsolidarity is desirableand which level ofrevenue collection isoptimal?
1. Health insurance is not sufficiently separatedfrom the State Budget
2. A relation between what I pay and what I getin turn is not supported
3. Private sources in the health sector are notlegally permitted
1. Combination ofinsurance and incomeredistributionelements
2. Default payers(delinquents)
3. CorruptionUnbearable amountand inappropriatestructure of costs
1. Inadequate scope of uninsurable risk2. Ineffective and often useless state regulation
1. High value of fundsfor treatment and lowfor prevention
2. Debt3. Low proportion of
private sourcesSource: Pažitný – Zajac (2001).
Problem I – Insufficient Effective Availability
The universal approach is often referred to as the key achievement and advantage of the Slovakhealth sector. The notion access has several dimensions. First, it is often understood in terms of thetypes and number of services offered within a specific region. In such case, access stands for physicalavailability. Second, access could be interpreted as use (hospitalization or outpatient visits measured percapita in various population groups). Access as effective availability is probably the most importantunderstanding of this notion as it takes into consideration location, costs, travel expenses, waiting time,behavior of providers and business hours.
Among the causes of insufficient availability of health care in Slovakia are:
Central Management of the Health Sector. The health sector is centrally managed by the Ministry ofHealth, which is exclusively responsible for strategy and management of health care, management ofstate-owned health facilities, state supervision, decision about financial resources, price and tariffwage setting, drug regulation. Such management is marked by poor flexibility, a high level ofregulation, excessive corruption and varying rules of the game. The health care system still has a“socialist” form, in which the State strictly defines and centrally manages the network of health carefacilities, distorts price mechanisms, suppresses competition, and makes effective wagedifferentiation impossible.
Unequal Chances and Soft Budgetary Restrictions. This refers to the fact that risk is not sharedequally. The State guarantees the ability to pay in respect of two health insurance funds, managedby the State, and is liable for debt generated by all state hospitals.106 Unlike other sectors of
106 The two state-owned health insurance funds (Všeobecná zdravotná poisťovňa, Spoločná zdravotná poisťovňa) insure about80 percent of the insured. There are only three non-state inpatient facilities; the State is not liable for their debt.
N a t i o n a l H um an D e v e l o p m e n t R e p o r t S l o v a k R e p ub l i c 2001-2002
H e a l t h c a r e77
economy, the health sector is subject to soft budgetary restrictions, which is marked by grantingexceptions by the State (e.g., exceptions from distraint and bankruptcy proceedings, regular relief ofdebts produced by hospitals and health insurance funds, etc.).
Passivity of Health Insurance Companies. Besides bearing financial risks of health insurance funds,the State guarantees the funds, an administration fund amounting to 4 percent of premiumcollected. Missing responsibility results in health insurance companies not performing theirfundamental role, which is to actively buy effective health services. As the funds are reluctant abouttheir financial performance (profit/loss), they are not motivated to place sufficient pressure onproviders to perform more cost effectively, which would then have a positive effect on the structureof providers corresponding to the real needs of customers. Health insurance companies only have aredistribution function, which means that they allocate funds in line with the terms and conditions setby the Ministry.
Passivity and Lasting Socialist Attitude of the Patient. Free medical care for all citizens guaranteed bythe State directly distorts their behavior. There is no link between the incurred costs of medicalservices provided and the financial burden. This results in unlimited consumption and emphasis puton treatment and not on prevention. Corruption is an accompanying phenomenon, through whichpatients get access to “free services”.
Problem Two – Poor Technical and Allocation Efficiency
Efficiency expresses the relation between costs and desirable outputs. If a health care system is notefficient in technical and allocation terms107, it does not attain the desirable objectives. An inefficientsystem means that spare sources are wasted. The main causes of low efficiency of the Slovak healthsector include:
Existing Health Care System Parameters Do Not Induce Motivation. The financing of the Slovakhealth care sector is based on an insurance scheme. The existing insurance system is distorted inseveral ways:
1. Despite significant differences in the amounts of health insurance contributions, the systemprovides every citizen with the same level of health care. The disadvantage of this understandingof solidarity is the fact that it is often misused.
2. The five health funds finance the same level of health care to all the insured registered withthem, which turns the plurality of health insurance into an empty word.
3. The health insurance funds do not bear any financial risk and a 4 percent administration fund foreach of them is guaranteed.
4. The system inadequately combines the redistribution of funds (the State’s payments for inactiveinsured) and the elements of social security insurance (contributions by economically active).
5. Funds collected are distributed to the health insurance funds via a special redistribution account.This arrangement was introduced in 1995 as a result of different structures of active and inactiveinsured and it has been subject to many arguments and discussion. A gradual increase in theamount of re-allocated funds to 100 percent of insurance premium collected resulted in asituation where health funds with disadvantageous portfolios benefit from this subsidymechanism.108 Rules of redistribution substantially changed over the past 7 years, and thestability of the system has not been ensured.109
6. Health insurance companies lack motivation because poor legislation does not force them tooperate and manage funds in a better way. There is also a lack of real finances in thecompetitive environment of providers that would decrease the prices of services. The healthinsurance funds are not dependent on profit generation and do not bear any business risk; theiroperation is reduced to a mere collection of premiums and ensuing complicated redistribution.This often-changing system of health insurance funds lacking any motivation has resulted in theindebtedness of the whole health sector.
107 Technical efficiency stands for maximization of outputs under a given level of inputs, and/or reaching a given level ofoutputs while decreasing inputs. Allocative efficiency relates to the decision about a set of services, which will bring highestbenefits for the health condition. The notion is prevailing in the Slovak health system that increasing efficiency is an issue ofraising inputs while retaining or decreasing outputs.108 The redistribution mechanism is based on the redistribution of premium collected from the health insurance companies witha high proportion of active population (which has a low risk index) to insurance funds with inappropriate portfolios (includingmainly children up to the age of 3 and elderly people above the age of 60, who have high risk indices and high costs of medicaltreatment). The introduction of this cross-subsidy system triggered the emergence of “double souls” who are subject ofredistribution. Over the period of 1997 to 1999, the number of the insured was by 250,000 (approximately 4.4 percent) higherthan the country’s population.109 The redistribution ratio represented 85 percent of insurance premium collected as of December 2002. In spite ofdisagreement of a part of the health insurance companies, the Ministry of Health is considering to increase the ratio to 100percent.
N a t i o n a l H um an D e v e l o p m e n t R e p o r t S l o v a k R e p ub l i c 2001-2002
Health Care 78
Outpatient Care Payment Mechanisms Lack Motivation. Primary care doctors in outpatientdepartments (e.g., pediatricians) are paid on a per capita basis. This means that a doctor receives aflat sum from the relevant health insurance fund for each contractually registered patient,irrespectively of actual performance/service delivered. Thus, the doctor is paid for “readiness” toprovide health services, which also has weaknesses:1. Doctors are not motivated to provide health services. Despite being physically available, they
often reduce the real availability of care to patients (for instance by low working hours, etc.).2. The quality of services provided has been falling.3. The efficiency of services provided has been falling as patients receive fewer outputs (doctors
treat less) for the same volume of inputs (funds received by doctors on a per capita basis).4. Costs are shifted to other health care providers, for instance to hospitals.5. The per capita remuneration system (or simply the capitation) is regulated by the Ministry of
Health, which specifies the capitation rate. From the point of view of doctors, the capitation isthe best remuneration system (it is not dependent on performance/services delivered). Whatthey mind is the fact that the level of capitation payments is not sufficiently indexed.
Non-state specialists working in outpatient departments (e.g., plastic surgeon) are paid on a fee-for-service basis, whereas each service unit performed is priced by an appropriate number of points.Due to demand induced by doctors and a limited budget of the health insurance funds, an upper limit(cap) of pre-paid points is specified for specialists.110 Although the capped fee-for-service paymentsystem is a modern payment mechanism, it has some weaknesses and specific consequences forevery player in the health sector.1. In line with trying to hold on costs, the Ministry of Health is not motivated to increase the value
of point price. At the same time, the Ministry is aware that non-state doctors are exposed to allfinancial risks and will have to manage their revenues efficiently, which means that they willhave to economize. It is a paradox that the Ministry of Health is not requiring the same fromstate-owned hospitals.
2. Being bound by the Price Regulation of the Ministry of Finance (issued by the Finance Ministry onthe basis of recommendations of the Ministry of Health), health insurance funds specify so-calledupper limits for the individual non-state providers. Such upper limits are designed to minimizeinduced demand and prevent costs increases in this group of providers. At the same time, theyshow their weakest link – their lack of interest in an efficient allocation of funds.
3. For health care providers – specialists, this system means that they have either to work for freefor the some proportion of month or to reduce the number of patients treated in order to be inline with the “number of points ordered.” Any points exceeding the upper limit are not acceptedby the health insurance funds, which unilaterally violate the right to own claims.
In Slovakia, state doctors receive salaries specified by the Ministry of Health in one of its decrees.This decree is binding upon every state-owned facility manager. And thus the management of astate-owned facility can hardly influence this key cost group – the labor costs. The only, limitedroom for maneuvering left is personal bonuses. Poorly paid doctors offset their low salaries by rentseeking taking the format of bribery and corruption.
State Ownership and Lasting Socialist Practices in Inpatient Facilities. The Slovak health sectorsuffers from distortions from the past, which are most visible in the operation of in-patient facilities.The inappropriate structure of in-patient facilities entails an excess of acute beds and a lack ofchronic beds, an inappropriate territorial distribution of hospitals with acute beds, an excess ofdoctors, nurses and other medical staff – notably in bigger cities (i.e., Bratislava, Košice, BanskáBystrica). The financing of hospitals and of hospital employees is non-motivating, since it follows aflat allocation of sources and/or salary tables taking into consideration age and education, but notperformance.
This arrangement has ultimately resulted in a paradox situation in the Slovak health sector with anexcess supply and excess demand.
Problem Three – Poor Quality
Quality of health care may be perceived in different ways. Quality is often rendered as quantity (“themore medical examinations the better quality”). Health care professionals perceive mainly the clinicalaspect of quality (e.g., correct diagnosing). Patients frequently assess the quality of services by thecomfort, quality of accommodation and diet, respect for them, etc. Quality is thus a multidimensionalfactor. The causes of insufficient quality of health care include:
110 The price per point at SKK 0.30, set by the Ministry of Health in 1996, has not changed. However, some health insurancefunds have slightly increased this rate for specialists (for instance, to SKK 0.31 – 0.34) taking into consideration “competition”.
N a t i o n a l H um an D e v e l o p m e n t R e p o r t S l o v a k R e p ub l i c 2001-2002
H e a l t h c a r e79
Insufficient Link Between What the Citizen Pays and What He/She Gets in Turn. The current setup ofcontributions is virtually a scheme of compulsory taxes imposed on employees, employers and self-employed. In principle, no payments for health services111 or voluntary health insurance exist. Alarge part of the public does not realize that health care is paid for and they think that it is free ofcharge. The awareness that quality of services depends on invested resources is insufficient. It isnecessary to realize that quality is a function of resources. In principle, no marginal costs orvoluntary health insurance exist. The quality of health services in Slovakia is reduced as a directresult of a broadly conceived scope of uninsurable risk (the currently applicable legislation forcesproviders to provide everything and such arrangement is detrimental to quality) and of poorefficiency of the system (limited resources are used to subsidize ineffective providers and not tosupport quality performance).
Absence of Competition. Quality largely depends on the degree of competition in the sector. Theabsence of competition between health service providers is a result of inflexible prices (paymentmechanisms) and inflexible supply (number) of providers. This is caused by the fact that theprovider network is fixed by the Ministry of Health (see Table 3.12).
Table 3.12Provider Market Distortion
Inflexible prices Inflexible supply1. A well-performing doctor/hospital is not
adequately paid. There is rather a tendency to"equalize" all providers.
2. There is not price competition because theMinistry of Health centrally sets prices.
3. There is no equality of chances between state-owned and private providers.
1. Monopolistic nature of primary ambulatory andspecialist ambulatory doctors.
2. State ownership with no effort to restructurethe network.
3. Excess supply of physical capacity: doctors,beds.
Source: Pažitný – Zajac (2001).
Poor Organization of Patients. Poorly organized patients directly influence poor quality, amongothers. This is a result of a poor legal awareness of citizens and the impossibility to compare theexisting system with another alternative system. At the same time, it should be noted that there isstill a lack of collective responsibility prevailing in the Slovak health sector and poor law enforcementresulting from a poor institutional framework.
Problem Four – Degree of Solidarity Optimal Revenue Collection
An important aspect of assessing the financial burden is the fact that a person (or institution) payingcontributions directly into the system may eventually not be the one who bears also the financial burden.An example is the position of the State as payer and that of the taxpayer as the bearer of the financialburden related to State’s payments on behalf of the economically inactive insured. With respect to theallocation of the financial burden, the key issues are:
Health Insurance Is Not Sufficiently Separated from the State Budget. The existing link is obvious inthree areas.1. The State (parliament) sets requirements for the operation of health insurance funds and
unilaterally specifies the amount of insurance base for “its” insured irrespectively of the realcosts incurred in respect of their treatment.
2. The health insurance funds receive approximately one-fourth of their revenues via the Ministryof Health (from the State Budget).
3. The health insurance companies receive other funds via several channels from the State Budget,for instance from other ministries or directly by means of financial aid from the general treasury.
The above-specified arrangement results in a complicated and non-transparent system of cashflows, which is a mix of tax revenues and an insurance system. However, the core of criticism is thefact that the parliament too often changes the conditions of health system financing and thusrestricts its operation.
The Relation Between What the Citizen Pays and What He/She Gets in Turn is Not Strengthened. InEurope, the financing of health systems is based on solidarity, notably the solidarity of economicallyactive population with that proportion of the population that does not produce assets yet and aproportion of population that does not produce assets any longer. Furthermore, economically active
111 The introduction of payments (fees and charges) is important not that much from the point of view of funds acquisition, butmainly as a tool to attenuate demand. The amount of marginal costs cannot by far cover the actual costs for the health serviceprovided, but its symbolic value can have a significant psychological effect on the citizens-patients in terms of reducing thedemand and the awareness that health care is not free of charge.
N a t i o n a l H um an D e v e l o p m e n t R e p o r t S l o v a k R e p ub l i c 2001-2002
Health Care 80
population must also show solidarity with their unemployed peers. The setup of the system is alsoone of the causes why the group of “paying” economically active is further reduced by those whoevade paying taxes and contributions. In Slovakia, the State contributes 25 percent of the totalhealth funds revenues, but for almost 60 percent of the population (Table 3.13).112
Table 3.13Development of the Number of Insured (in thousands of persons, as of December 31 of therespective year)
Indicator 1996 1997 1998 1999 2000 2001Total number of insured 5,372 5,638 5,613 5,563 5,546 5,526of which:
employed (earners) 2,093 2,216 2,321 2,211 2,265 2,286registered unemployed a 80 105 128 147 142 152State insured b 3,200 3,278 3,131 3,195 3,130 3,079
Note: a. National Labor Office pays contributions on behalf of registered unemployed who receiveunemployment benefits. b. State pays insurance premium on behalf of children, pensioners, unemployedrecipients of social assistance benefits due material distress, persons taking care of children and disabled,soldiers in compulsory military service, prisoners, refugees, and other economically inactive persons.Source: Statistical Office of the SR.
The Slovak health insurance system is designed to allow all Slovak citizens to benefit from it bymeans of health care irrespectively of the fact whether they share any financial burden related to thedelivery of such care or not. Article 40 of the Slovak Constitution clearly refers to “the right to freehealth care”. However, free health care is only an illusion because all resources of financing comefrom citizens.113
The Contribution of Private Resources to the Health System Is Impossible. An economically unstableand non-transparent financial system of the public health care is unable to attract privateresources.114 Another reason explaining the absence of private resources is insufficient legislationgoverning the establishment and operation of private insurance companies in the health sector,notably in respect of voluntary insurance schemes.
Problem Five – Unbearable Amount and Inappropriate Structure of Costs
In a condition of limited sources, health care costs should be viewed as opportunity costs, which couldbe spent on other values instead of health. The decisive criteria then is whether the benefit of utilizingincreased sources in health care exceeds the potential benefit of utilizing these sources in another sector.
Health care costs may also be assessed through the adequacy of expenditures spent. The sum ofhealth sector costs includes all governmental expenditures, health insurance funds (public as well asprivate) expenditures, household expenditures (formal and informal) and corporate expenditures.However, these expenditures also include opportunity costs related to the search for an optimum ratiobetween public and private sector expenditures, which would be most beneficial to the whole structureand amount of health sector expenditures. The causes of the current state being far from optimalinclude:
Inadequate Scope of Uninsurable Risk. Uninsurable risk means the essential package of services,which is granted by law to each citizen regardless of premium paid. This package is currentlyspecified by two pieces of legislation – the Constitution and the Act on the Rules of MedicalTreatment.
Article 40 of the Constitution guarantees the right to health protection and free health care.However, a wrong interpretation of the Constitution resulted in a virtually non-existent financialparticipation of the patient in the delivery of health services and the existence of moral hazard.
The Act on the Rules of Medical Treatment belongs to the key laws as it specifies the scope offree health care. No government so far has been able, probably due to political reasons, to reducethe broad scope of the Rules of Medical Treatment.
Inefficient and Often Useless State Regulation. State regulation comprises mainly the regulation ofproviders (by specifying the health facility network), control of the market in medicines through the
112 Payments by the State on behalf of an inactive person represented SKK 378 in 2002. In 2003, the payment should amountSKK 405 per inactive individual. On the other hand, an employee receiving average wage pays jointly with his/her employerabout SKK 1,800 monthly for health insurance.113 Economically active population contributes by health insurance payments to health funds. State budget income comes fromdirect taxes (income tax and profit tax) and indirect taxes (VAT, concise taxes, customs duties, etc.) as well as various propertytaxes.114 According to WHO data, private expenditures made up 10.4 percent of total expenditures on health care in Slovakia (2000).
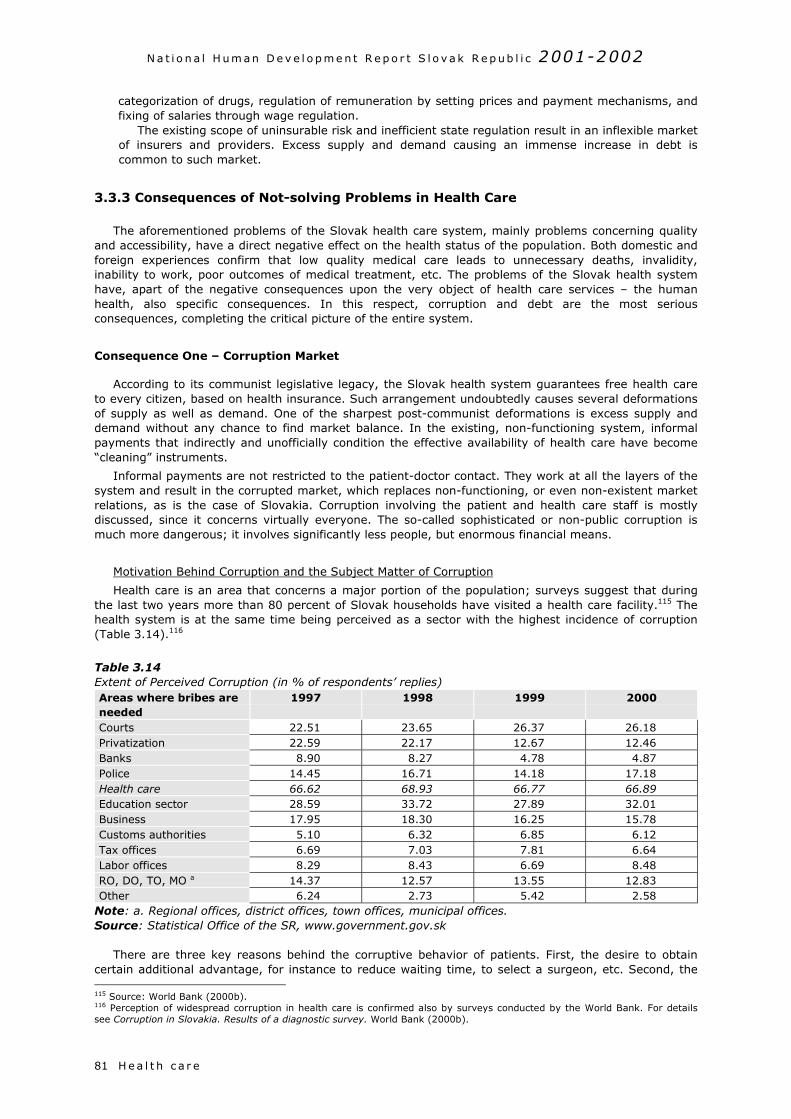
N a t i o n a l H um an D e v e l o p m e n t R e p o r t S l o v a k R e p ub l i c 2001-2002
H e a l t h c a r e81
categorization of drugs, regulation of remuneration by setting prices and payment mechanisms, andfixing of salaries through wage regulation.
The existing scope of uninsurable risk and inefficient state regulation result in an inflexible marketof insurers and providers. Excess supply and demand causing an immense increase in debt iscommon to such market.
3.3.3 Consequences of Not-solving Problems in Health Care
The aforementioned problems of the Slovak health care system, mainly problems concerning qualityand accessibility, have a direct negative effect on the health status of the population. Both domestic andforeign experiences confirm that low quality medical care leads to unnecessary deaths, invalidity,inability to work, poor outcomes of medical treatment, etc. The problems of the Slovak health systemhave, apart of the negative consequences upon the very object of health care services – the humanhealth, also specific consequences. In this respect, corruption and debt are the most seriousconsequences, completing the critical picture of the entire system.
Consequence One – Corruption Market
According to its communist legislative legacy, the Slovak health system guarantees free health careto every citizen, based on health insurance. Such arrangement undoubtedly causes several deformationsof supply as well as demand. One of the sharpest post-communist deformations is excess supply anddemand without any chance to find market balance. In the existing, non-functioning system, informalpayments that indirectly and unofficially condition the effective availability of health care have become“cleaning” instruments.
Informal payments are not restricted to the patient-doctor contact. They work at all the layers of thesystem and result in the corrupted market, which replaces non-functioning, or even non-existent marketrelations, as is the case of Slovakia. Corruption involving the patient and health care staff is mostlydiscussed, since it concerns virtually everyone. The so-called sophisticated or non-public corruption ismuch more dangerous; it involves significantly less people, but enormous financial means.
Motivation Behind Corruption and the Subject Matter of Corruption
Health care is an area that concerns a major portion of the population; surveys suggest that duringthe last two years more than 80 percent of Slovak households have visited a health care facility.115 Thehealth system is at the same time being perceived as a sector with the highest incidence of corruption(Table 3.14).116
Table 3.14Extent of Perceived Corruption (in % of respondents’ replies)Areas where bribes areneeded
1997 1998 1999 2000
Courts 22.51 23.65 26.37 26.18Privatization 22.59 22.17 12.67 12.46Banks 8.90 8.27 4.78 4.87Police 14.45 16.71 14.18 17.18Health care 66.62 68.93 66.77 66.89Education sector 28.59 33.72 27.89 32.01Business 17.95 18.30 16.25 15.78Customs authorities 5.10 6.32 6.85 6.12Tax offices 6.69 7.03 7.81 6.64Labor offices 8.29 8.43 6.69 8.48RO, DO, TO, MO a 14.37 12.57 13.55 12.83Other 6.24 2.73 5.42 2.58
Note: a. Regional offices, district offices, town offices, municipal offices.Source: Statistical Office of the SR, www.government.gov.sk
There are three key reasons behind the corruptive behavior of patients. First, the desire to obtaincertain additional advantage, for instance to reduce waiting time, to select a surgeon, etc. Second, the 115 Source: World Bank (2000b).116 Perception of widespread corruption in health care is confirmed also by surveys conducted by the World Bank. For detailssee Corruption in Slovakia. Results of a diagnostic survey. World Bank (2000b).
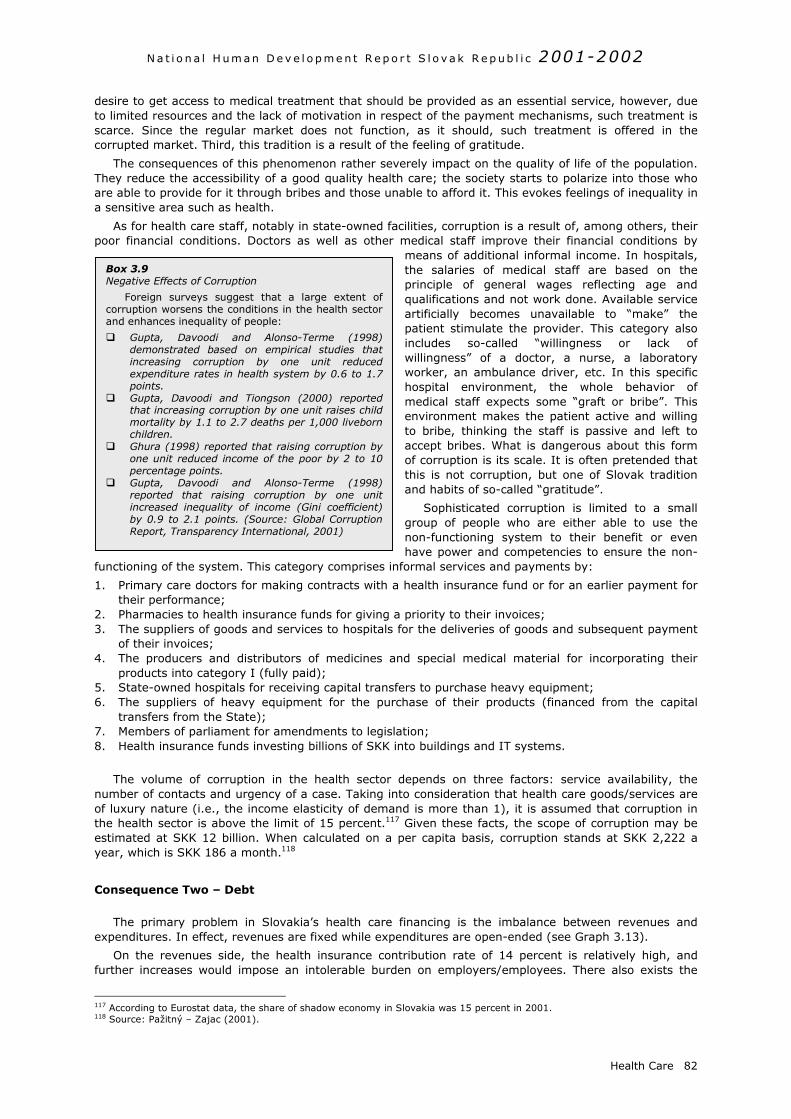
N a t i o n a l H um an D e v e l o p m e n t R e p o r t S l o v a k R e p ub l i c 2001-2002
desire to get access to medical treatment that should be provided as an essential service, however, dueto limited resources and the lack of motivation in respect of the payment mechanisms, such treatment isscarce. Since the regular market does not function, as it should, such treatment is offered in thecorrupted market. Third, this tradition is a result of the feeling of gratitude.
The consequences of this phenomenon rather severely impact on the quality of life of the population.They reduce the accessibility of a good quality health care; the society starts to polarize into those whoare able to provide for it through bribes and those unable to afford it. This evokes feelings of inequality ina sensitive area such as health.
As for health care staff, notably in state-owned facilities, corruption is a result of, among others, theirpoor financial conditions. Doctors as well as other medical staff improve their financial conditions by
means of additional informal income. In hospitals,the salaries of medical staff are based on theprinciple of general wages reflecting age andqualifications and not work done. Available serviceartificially becomes unavailable to “make” thepatient stimulate the provider. This category alsoincludes so-called “willingness or lack ofwillingness” of a doctor, a nurse, a laboratoryworker, an ambulance driver, etc. In this specifichospital environment, the whole behavior ofmedical staff expects some “graft or bribe”. Thisenvironment makes the patient active and willingto bribe, thinking the staff is passive and left toaccept bribes. What is dangerous about this formof corruption is its scale. It is often pretended thatthis is not corruption, but one of Slovak traditionand habits of so-called “gratitude”.
Sophisticated corruption is limited to a smallgroup of people who are either able to use thenon-functioning system to their benefit or even
f
1
23
4
56
78
notey
C
e
f
1
1
Box 3.9Negative Effects of Corruption
Foreign surveys suggest that a large extent ofcorruption worsens the conditions in the health sectorand enhances inequality of people:
Gupta, Davoodi and Alonso-Terme (1998)demonstrated based on empirical studies thatincreasing corruption by one unit reducedexpenditure rates in health system by 0.6 to 1.7points.
Gupta, Davoodi and Tiongson (2000) reportedthat increasing corruption by one unit raises childmortality by 1.1 to 2.7 deaths per 1,000 livebornchildren.
Ghura (1998) reported that raising corruption byone unit reduced income of the poor by 2 to 10percentage points.
Gupta, Davoodi and Alonso-Terme (1998)reported that raising corruption by one unitincreased inequality of income (Gini coefficient)by 0.9 to 2.1 points. (Source: Global CorruptionReport, Transparency International, 2001)
Health Care 82
have power and competencies to ensure the non-unctioning of the system. This category comprises informal services and payments by:
. Primary care doctors for making contracts with a health insurance fund or for an earlier payment fortheir performance;
. Pharmacies to health insurance funds for giving a priority to their invoices;
. The suppliers of goods and services to hospitals for the deliveries of goods and subsequent paymentof their invoices;
. The producers and distributors of medicines and special medical material for incorporating theirproducts into category I (fully paid);
. State-owned hospitals for receiving capital transfers to purchase heavy equipment;
. The suppliers of heavy equipment for the purchase of their products (financed from the capitaltransfers from the State);
. Members of parliament for amendments to legislation;
. Health insurance funds investing billions of SKK into buildings and IT systems.
The volume of corruption in the health sector depends on three factors: service availability, theumber of contacts and urgency of a case. Taking into consideration that health care goods/services aref luxury nature (i.e., the income elasticity of demand is more than 1), it is assumed that corruption inhe health sector is above the limit of 15 percent.117 Given these facts, the scope of corruption may bestimated at SKK 12 billion. When calculated on a per capita basis, corruption stands at SKK 2,222 aear, which is SKK 186 a month.118
onsequence Two – Debt
The primary problem in Slovakia’s health care financing is the imbalance between revenues andxpenditures. In effect, revenues are fixed while expenditures are open-ended (see Graph 3.13).
On the revenues side, the health insurance contribution rate of 14 percent is relatively high, andurther increases would impose an intolerable burden on employers/employees. There also exists the
17 According to Eurostat data, the share of shadow economy in Slovakia was 15 percent in 2001.18 Source: Pažitný – Zajac (2001).
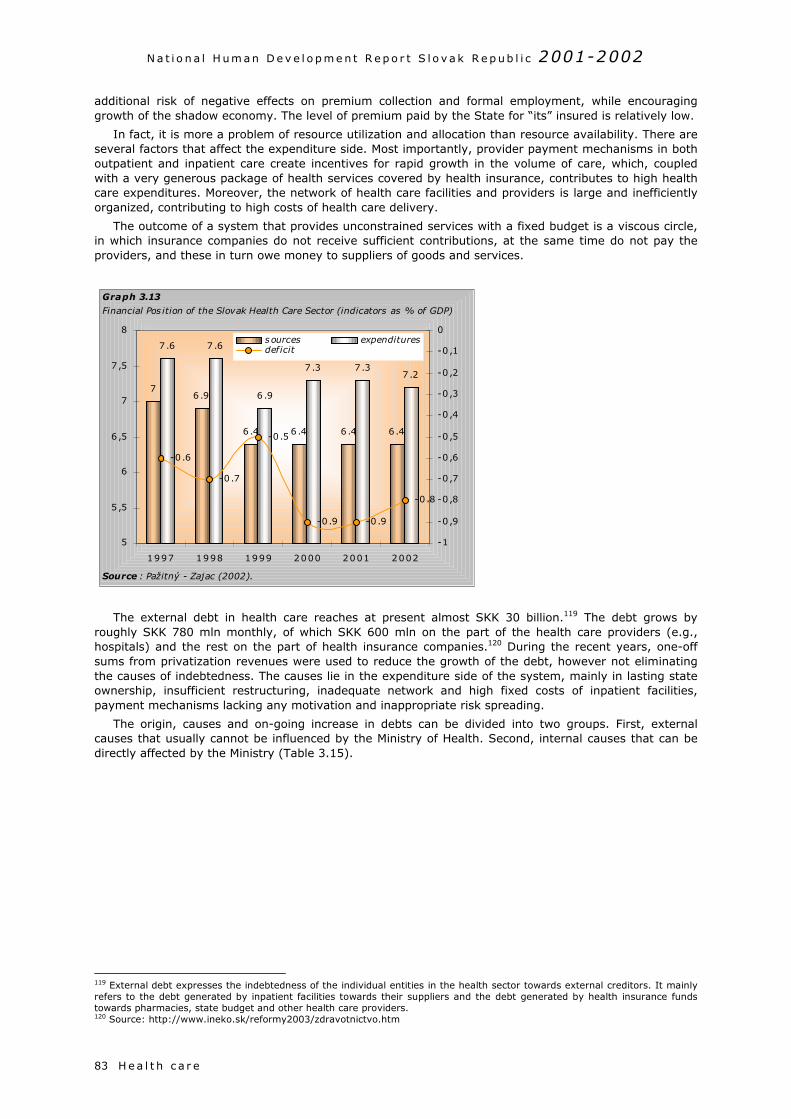
N a t i o n a l H um an D e v e l o p m e n t R e p o r t S l o v a k R e p ub l i c 2001-2002
H e a l t h c a r e83
additional risk of negative effects on premium collection and formal employment, while encouraginggrowth of the shadow economy. The level of premium paid by the State for “its” insured is relatively low.
In fact, it is more a problem of resource utilization and allocation than resource availability. There areseveral factors that affect the expenditure side. Most importantly, provider payment mechanisms in bothoutpatient and inpatient care create incentives for rapid growth in the volume of care, which, coupledwith a very generous package of health services covered by health insurance, contributes to high healthcare expenditures. Moreover, the network of health care facilities and providers is large and inefficientlyorganized, contributing to high costs of health care delivery.
The outcome of a system that provides unconstrained services with a fixed budget is a viscous circle,in which insurance companies do not receive sufficient contributions, at the same time do not pay theproviders, and these in turn owe money to suppliers of goods and services.
The external debt in health care reaches at present almost SKK 30 billion.119 The debt grows byroughly SKK 780 mln monthly, of which SKK 600 mln on the part of the health care providers (e.g.,hospitals) and the rest on the part of health insurance companies.120 During the recent years, one-offsums from privatization revenues were used to reduce the growth of the debt, however not eliminatingthe causes of indebtedness. The causes lie in the expenditure side of the system, mainly in lasting stateownership, insufficient restructuring, inadequate network and high fixed costs of inpatient facilities,payment mechanisms lacking any motivation and inappropriate risk spreading.
The origin, causes and on-going increase in debts can be divided into two groups. First, externalcauses that usually cannot be influenced by the Ministry of Health. Second, internal causes that can bedirectly affected by the Ministry (Table 3.15).
119 External debt expresses the indebtedness of the individual entities in the health sector towards external creditors. It mainlyrefers to the debt generated by inpatient facilities towards their suppliers and the debt generated by health insurance fundstowards pharmacies, state budget and other health care providers.120 Source: http://www.ineko.sk/reformy2003/zdravotnictvo.htm
7
6.4 6 .4 6 .46 .4
6 .9
7 .27 .37 .3
6 .9
7 .67 .6
-0 .8
-0 .9-0 .9
-0 .6
-0 .7
-0 .5
5
5 ,5
6
6 ,5
7
7 ,5
8
1997 1998 1999 2000 2001 2002
-1
-0 ,9
-0 ,8
-0 ,7
-0 ,6
-0 ,5
-0 ,4
-0 ,3
-0 ,2
-0 ,1
0sources expendituresdeficit
Graph 3.13
Financial Pos ition of the Slovak Health Care Sector (indicators as % of GDP)
Source : Pažitný - Zajac (2002).

N a t i o n a l H um an D e v e l o p m e n t R e p o r t S l o v a k R e p ub l i c 2001-2002
Health Care 84
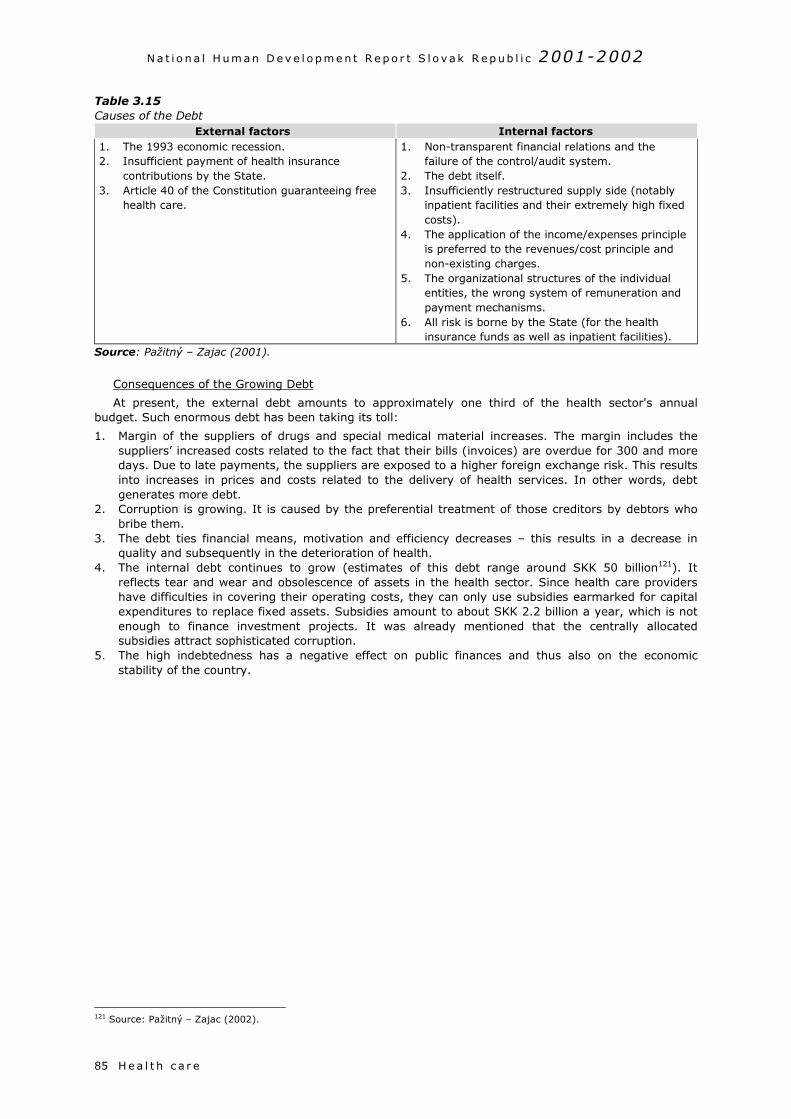
N a t i o n a l H um an D e v e l o p m e n t R e p o r t S l o v a k R e p ub l i c 2001-2002
H e a l t h c a r e85
Table 3.15Causes of the Debt
External factors Internal factors1. The 1993 economic recession.2. Insufficient payment of health insurance
contributions by the State.3. Article 40 of the Constitution guaranteeing free
health care.
1. Non-transparent financial relations and thefailure of the control/audit system.
2. The debt itself.3. Insufficiently restructured supply side (notably
inpatient facilities and their extremely high fixedcosts).
4. The application of the income/expenses principleis preferred to the revenues/cost principle andnon-existing charges.
5. The organizational structures of the individualentities, the wrong system of remuneration andpayment mechanisms.
6. All risk is borne by the State (for the healthinsurance funds as well as inpatient facilities).
Source: Pažitný – Zajac (2001).
Consequences of the Growing Debt
At present, the external debt amounts to approximately one third of the health sector's annualbudget. Such enormous debt has been taking its toll:
1. Margin of the suppliers of drugs and special medical material increases. The margin includes thesuppliers’ increased costs related to the fact that their bills (invoices) are overdue for 300 and moredays. Due to late payments, the suppliers are exposed to a higher foreign exchange risk. This resultsinto increases in prices and costs related to the delivery of health services. In other words, debtgenerates more debt.
2. Corruption is growing. It is caused by the preferential treatment of those creditors by debtors whobribe them.
3. The debt ties financial means, motivation and efficiency decreases – this results in a decrease inquality and subsequently in the deterioration of health.
4. The internal debt continues to grow (estimates of this debt range around SKK 50 billion121). Itreflects tear and wear and obsolescence of assets in the health sector. Since health care providershave difficulties in covering their operating costs, they can only use subsidies earmarked for capitalexpenditures to replace fixed assets. Subsidies amount to about SKK 2.2 billion a year, which is notenough to finance investment projects. It was already mentioned that the centrally allocatedsubsidies attract sophisticated corruption.
5. The high indebtedness has a negative effect on public finances and thus also on the economicstability of the country.
121 Source: Pažitný – Zajac (2002).
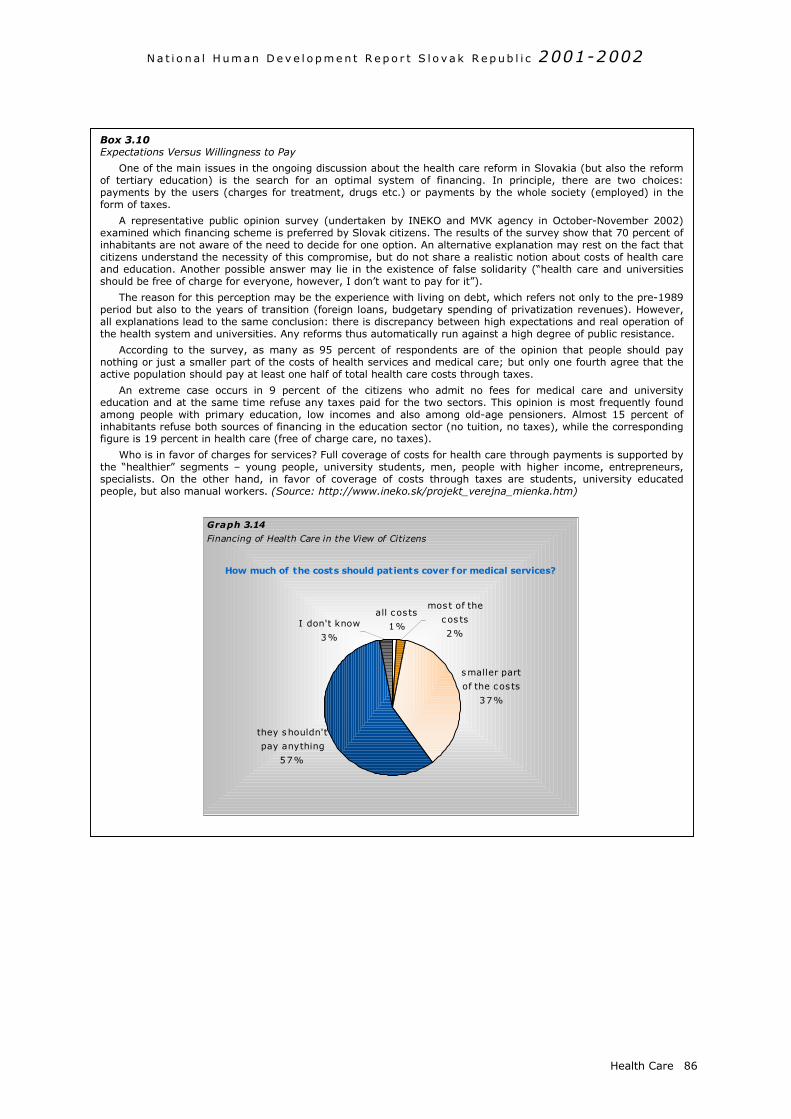
N a t i o n a l H um an D e v e l o p m e n t R e p o r t S l o v a k R e p ub l i c 2001-2002
Health Care 86
Box 3.10Expectations Versus Willingness to Pay
One of the main issues in the ongoing discussion about the health care reform in Slovakia (but also the reformof tertiary education) is the search for an optimal system of financing. In principle, there are two choices:payments by the users (charges for treatment, drugs etc.) or payments by the whole society (employed) in theform of taxes.
A representative public opinion survey (undertaken by INEKO and MVK agency in October-November 2002)examined which financing scheme is preferred by Slovak citizens. The results of the survey show that 70 percent ofinhabitants are not aware of the need to decide for one option. An alternative explanation may rest on the fact thatcitizens understand the necessity of this compromise, but do not share a realistic notion about costs of health careand education. Another possible answer may lie in the existence of false solidarity (“health care and universitiesshould be free of charge for everyone, however, I don’t want to pay for it”).
The reason for this perception may be the experience with living on debt, which refers not only to the pre-1989period but also to the years of transition (foreign loans, budgetary spending of privatization revenues). However,all explanations lead to the same conclusion: there is discrepancy between high expectations and real operation ofthe health system and universities. Any reforms thus automatically run against a high degree of public resistance.
According to the survey, as many as 95 percent of respondents are of the opinion that people should paynothing or just a smaller part of the costs of health services and medical care; but only one fourth agree that theactive population should pay at least one half of total health care costs through taxes.
An extreme case occurs in 9 percent of the citizens who admit no fees for medical care and universityeducation and at the same time refuse any taxes paid for the two sectors. This opinion is most frequently foundamong people with primary education, low incomes and also among old-age pensioners. Almost 15 percent ofinhabitants refuse both sources of financing in the education sector (no tuition, no taxes), while the correspondingfigure is 19 percent in health care (free of charge care, no taxes).
Who is in favor of charges for services? Full coverage of costs for health care through payments is supported bythe “healthier” segments – young people, university students, men, people with higher income, entrepreneurs,specialists. On the other hand, in favor of coverage of costs through taxes are students, university educatedpeople, but also manual workers. (Source: http://www.ineko.sk/projekt_verejna_mienka.htm)
all cos ts
1%
smaller part
of the cos ts
37%
I don't know
3%
most of the
cos ts
2%
they shouldn't
pay anything
57%
Graph 3.14
Financing of Health Care in the View of Citizens
How much of the costs should patients cover for medical services?
N a t i o n a l H um an D e v e l o p m e n t R e p o r t S l o v a k R e p u b l i c 2001-2002
C o nc l u s i o n s87
4. A Vision of Health for Slovakia
4 .1 CONCLUSIONS
Health is generally perceived as the essential value of human development and human life. The healthstatus of an individual is formed by factors of social, economic, and general environment. The healthdeterminants discussed in the previous chapters allow for a better understanding of the current conditionand also for a brief outline of further development of public health in Slovakia.
The development of the health condition of Slovakia’s population over the last 50 years has beenaffected by dramatic historical events that resulted in sudden changes of economic, demographic, andpsychosocial factors. The long-lasting totalitarian system created a specific situation in which risk factorscame to the foreground that were not prevalent in democratic societies. The unfavorable effects on thehealth of the population has been the result of a number of psycho-social factors, such as chronic stress,mental tensions, frustration, depression, hopelessness, and apathy that induce the emergence ofcardiovascular and neoplastic diseases and further weaken the performance of the immune system. Animportant role in increasing cardiovascular and oncological mortality may stem from oxidation stress dueto overproduction of free oxygen radicals in the population that lived in a degraded working and generalenvironment, with high consumption of cigarettes and distilled spirits, and low intake of substances withantioxidant activity from a diet deficient in fruits and vegetables.
Political turbulence has been unusually intensive since the political changes of 1989. The lesseducated portion of Slovakia’s society has more problems adjusting to the conditions of a marketeconomy. Because of emergence of new phenomena such as high unemployment rates, incomeinequality and political instability, the number of frustrated, hopeless, and hostile individuals in Slovakiahave grown. Educated and democratically oriented citizens have better preconditions to understandopportunities to influence their health condition by their own actions. On the other hand, poorly educatedcitizens succumb more easily to the pressure of totalitarian power and become passive even with respectto their own health.
The situation in education is contradictory. The number of university students is increasing, whichshould be considered positive from the viewpoint of health; however, there is also a marked growth ofthose who finish their studies after having completed elementary school. Education on one’s own health,including healthy nutrition, exercise, refusal of smoking, alcoholism, drugs, coping with stress, etc., isnot sufficiently incorporated into the curricula of schools.
A high number of individuals with elementary education are also of concern due to unemploymentrates. It is generally acknowledged that most unemployed are among individuals with only elementaryeducation. The negative impact of unemployment upon health is apparent; Slovakia’s top position inunemployment ranking of transition countries can certainly not be regarded as satisfactory from theviewpoint of employment or health impact. Inevitable restrictive measures in the economy will affect thepurchasing power of the population; hence, in terms of socio-economic determinants, no excess ofpositive impulses should be expected.
The level of education and training co-determines lifestyle patterns. International comparisons revealrelatively high consumption of concentrated alcoholic beverages and cigarettes in Slovakia, notablyamong individuals with lower levels of education. Changes in the price structure of foods improved thestructure of the population’s diet, with the exception of a drop in milk consumption; consumption ofbutter has dropped and consumption of vegetable oils with high vitamin E contents, of vegetables, fruitsand mainly southern fruits have increased.
The environment, considered as the most negatively impacting health determinant in the early 1990s,is gradually becoming one of the determinants showing a positive trend. The availability of safe drinkingwater and the quality of air keeps increasing. The most important problem concerns insufficientproportions of wastewater treatment and growing levels of noise due to traffic. Indicators of the workingenvironment are mostly positive. It is difficult to estimate to what extent this may be due to highunemployment rates and the disappearance of several, high-risk workplaces.
The demographic determinants are dominated by rapidly decreasing natural increments, moderatelygrowing life expectancy, and gradual population aging. It is highly probable that such development willimply higher health care costs.
The Slovak health care system is in a crisis that has several dimensions (financing, quality,management, human resources). The system cumulates debt and financial injections using privatizationrevenues, which is not the solution to its financial problems. The generated debt and its monthly growing
N a t i o n a l H um an D e v e l o p m e n t R e p o r t S l o v a k R e p ub l i c 2001-2002
C o nc l u s i o n s 88
value could result in the collapse of the whole system; the patient does not play a substantial role in thesystem. The system is a burden because it provides unbearable financial protection to participants of thesystem. This applies to health insurance funds, state-owned inpatient facilities, and patients. However,money for such financial protection is not available.
The fully reinsured patient does not even receive services, for which funds are available, becausesuch funds are allocated in an inefficient way. The extensive Rules of Medical Procedures and missingfinancial participation by the patient often result in abuse of the system by patients and health careproviders. Although there is an excess of supply, demand is still growing, which is an economic paradox.The existing arrangement nurtures daily mass-scale corruption as well as very dangerous “sophisticatedcorruption,” which involves relatively few people.
Preventive influence has a low share, although prevention represents the most efficient investmentinto health in economical terms. Health is perceived as a key component of life, however, people’sapproach to their own health does not always respond to this fact.
Improvements in the health condition of the population will not only be dependent on positivechanges in the organization of health care provision, but also on the overall development of the society,which shall give citizens the hope of gradual improvement of their social and economic situation.
N a t i o n a l H um an D e v e l o p m e n t R e p o r t S l o v a k R e p ub l i c 2001-2002
V i s i o n o f He a l t h89
4 .2 VISION OF HEALTH
The basic idea of the human development concept refers to broadening of opportunities and chances tolive a long and healthy life, to become educated, and to enjoy a decent standard of material assets.Health condition improvement as a prerequisite of a longer and fulfilled life thus represents an ultimategoal of the concept. It is based on the interaction between health and other dimensions of life, such aseducation and standard of living.
What can be done in favor of this goal in a country at a developmental stage such as Slovakia hasachieved? It was emphasized in the preceding chapters that health is not a constant value – it is a valuethat changes over time and space. In countries at a lower level of development health is mainly an issueof inadequate or non-existing choice, whereas in developed countries it is rather an issue of correct ofincorrect choice. Despite a number of deficiencies, Slovakia belongs to countries at a level of humandevelopment where health is determined by choice rather than by its absence.122
There are relatively marked regional differences in health condition. The existence of such disparitiesconfirms that health is the end result of a number of determinants rather than solely a result of publichealth care, which is virtually the same for all. In addition, other factors are part of the “game,” and theymay most likely be of more significance than the medical services. This awareness is still absent inSlovakia and/or it is not being sufficiently emphasized. Reliance on public institutions and the weakwillingness to assume responsibility for one’s own health are deep-rooted features among Slovakia’spopulation.123 As a matter of fact, it is more costly, overall, to treat diseases than to prevent them byhealth-promoting behaviors. One of the greatest challenges with respect to the improvement of publichealth in Slovakia is to become aware of this relationship.
The formulation of steps that have potentially positive effects on health improvement is based on theknowledge of the status quo and of the effects of various determinants and risk factors. There are nosimple guides; on the contrary, the comprehensive nature of the measures comes as the basicprerequisite of any positive change. Any successful change requires an optimal mix of changes in thebehaviors of individuals, mechanisms, and institutions. The following recommendations suggest thecomplexity of the issue and the principal components that a change has to combine in itself. Certainly,this is not an exhaustive or unique list, but it offers space for further discussions concerning the wideningof opportunities for a healthy and fulfilling life.124
4.2.1 “Non-Health Care” Measures
Identification of Risk Factors. The main causes of morbidity and mortality are generally known. Muchmore attention has to be focused on the study of risk factors that prompt the development ofdiseases. Identification of key factors requires a flexible utilization of the morbidity and mortalitydata, which enables a better assessment of the mutual relationships between health determinants,risk factors, and the health condition. Results of sophisticated epidemiological studies will beunavoidable for the formulation of priorities, to acquire information about lifestyles, diets, and healthparameters of the various social groups of the population. To be able to assess the relationships inmore detail, it would be useful to broaden the analyses to include also the regional level, tointroduce and regularly monitor both the existing and the new parameters (e.g., concerningeducation, lifestyles). Since spontaneous demand for such activities and their outcomes cannot beexpected on the part of the private sector, the initial initiative directed towards the identification,research and monitoring of influences harmful to health should come from public and non-governmental institutions.
Setting Priorities. The economic reality determines the potential of the government, as well as that ofthe non-governmental and private sector, to focus their activities on the various opportunities andmethods of health protection. Identification of risks with the strongest effects on human health mayrepresent a good starting point for effective orientation on the measures. Discussions concerning thedirection of the public health protection should be preceded by a consensus on the extent to whichhealth promotion and protection are a societal priority, also with the account being taken of the useof public funds. One of the principles of the human development concept is based on the fact thatwhenever limited public resources are used (it should be understood that there will never be enough
122 Naturally, the basic determinants also include those which cannot be directly influenced by choice (e.g., genetic conditions).123 See chapter 2.1.1.124 The reason why suggestions were split into those connected with health in a broader context and such which have directconnection with changes in the health care sector was above all promotion of health perception through not only healthservices. This does not mean that the issues of health are understood separately; on the contrary, integrated approach ratherthan partial measures represents a precondition for positive changes.
N a t i o n a l H um an D e v e l o p m e n t R e p o r t S l o v a k R e p ub l i c 2001-2002
of them) areas should be considered where investments are able to bring benefits to the largestnumber of people possible. Naturally, in many cases, individual health factors concern but a specificpopulation group (such as tobacco and smokers), measures directed towards such a group maynevertheless have a significant effect upon the whole population – in particular when combined withother measures (such as nicotine-containingchewing gums and ban on smoking in publicspaces). The World Health Organizationrecommends comparing costs and effects ofinterventions to identify priorities (see also box4.1).
Prevention of Risk Factors. Prevention ofharmful effects to health is associated withchanges in attitudes and habits, i.e., inbehaviors in the broadest sense. According todomestic and international analyses, the fightagainst smoking and changes in dietary habitsremain among the primary preventionpriorities. Independent experts agree thatinadequate quantities of fresh fruits andvegetables, diary products, fish are consumedby Slovakia’s population as part of thestructure of their diet, whereas excessiveamounts of animal fats, sugar and alcoholicproducts are consumed.125 Opportunities toinfluence changes in dietary habits reside in a advertisement, as well as restrictive measures, sufoods. Smoking and tobacco consumption is not owith a strong industrial sector and interest grourestrict or prohibit smoking in public spaces andabove all high excise taxes on tobacco productscountries have completely banned advertising prevention, the function of education and enlighteunsatisfactory. Healthy regimens include additionconsumption, drug addiction, and other dependeactivities, protection against excessive sun radiatibehave in ways that result in health distortions, ttolerated by the society, will have to be enhancedthe major reason for the pandemic of AIDS, shouldrates of the infection in the country may not be free movement of persons within the enlarged Euexplosion of HIV/AIDS in the Ukraine and Russia.
Preventive measures may build on numeroushealth protection (such as the WHO projects HeWorkplaces, CINDI, MONICA, Global AIDS Prevent
Increased Availability of Information to the Puunderstanding of the effects of risk factors. Peoplepros and cons of behaviors that have direct impacinformation should reflect recent knowledge of ssuccessful and failed measures – and should begroups. Information includes a wide range of acommunity programs, research projects, advertise
Development of Health Determinants. This codeterminants.126 The explicit objective of a mnevertheless account for a significant portion oInvestments into health which the determinantsrepresent in turn a stimulus for the developmentpopulation has a positive effect upon, e.g., econoas economic development, education, labor marinclusion, environment, housing, genetics, the pub
125 The ambition of this publication is not to defend a certain methe diet shown frequently appear in professional discussions on die126 See also chapter 3.2 Determinants of health.
Box 4.1Recommendations of the World Health Organization
The authors of the World Health Report (WHO,2002) state that focusing on prevention meansfocusing on risk factors of health. WHO invites to laystronger emphasis on identification of problems,formulation of priorities and improved access toinformation about health risks. Connected to this isstrengthening of the research of risk factors, definingkey risks, formulation of strategies and measures toprevent such risks, with account being taken of theircost-efficiency. The management and reduction of themajor risk factors – tobacco, alcohol, high cholesterollevels, high blood pressure and obesity – and thus alsoof diseases they cause, will have a positive effect uponreduction of premature mortality and extension ofhealthy life expectancy. Such measures haveundoubtedly effects on the economy of the countryand equality of chances, and support sustainabledevelopment. (Source: World Health Report 2002.Reducing Risks, Promoting Healthy Life. WHO, 2002)
V i s i o n o f He a l t h 90
combination of health education, enlightenment,ch as raising the excise taxes on selected types ofnly associated with deep-rooted traditions but alsops. In many countries, legislative measures that buildings, so-called negative advertisement, and have proven as successful interventions. Someof tobacco products. With respect to smokingnment (family, school, media, etc.) appears to beal interventions such as fighting excessive alcoholncies, improvement of personal hygiene, physicalon, etc. The financial responsibilities of those whohus increasing the costs of health care, but being. The risk of unprotected sex, which still remains not be underestimated as well. The presently low
sustainable, in particular because of the expectedropean Union, as well as in the view of the recent
existing programs and projects directed towardsalth Promoting Schools, Healthy Towns, Healthy
ion Program).
blic. Tightly connected with prevention is the need more intelligible information concerning thet upon their health, morbidity, and mortality. Suchcience and research, as well as experiences from adequately communicated to all age and socialctivities, including health education, counseling,ment and promotion, etc.
ncerns a package of measures termed healthajority of them is not improved health; theyf the resulting health condition of an individual. bring in – be it a direct or indirect effects – of these areas (improved health condition of themic growth and reduction of poverty). Areas suchket, social system, poverty reduction and sociallic health system are all among the priorities with
thod or content of nutrition. The opinions on the structure oftary habits.
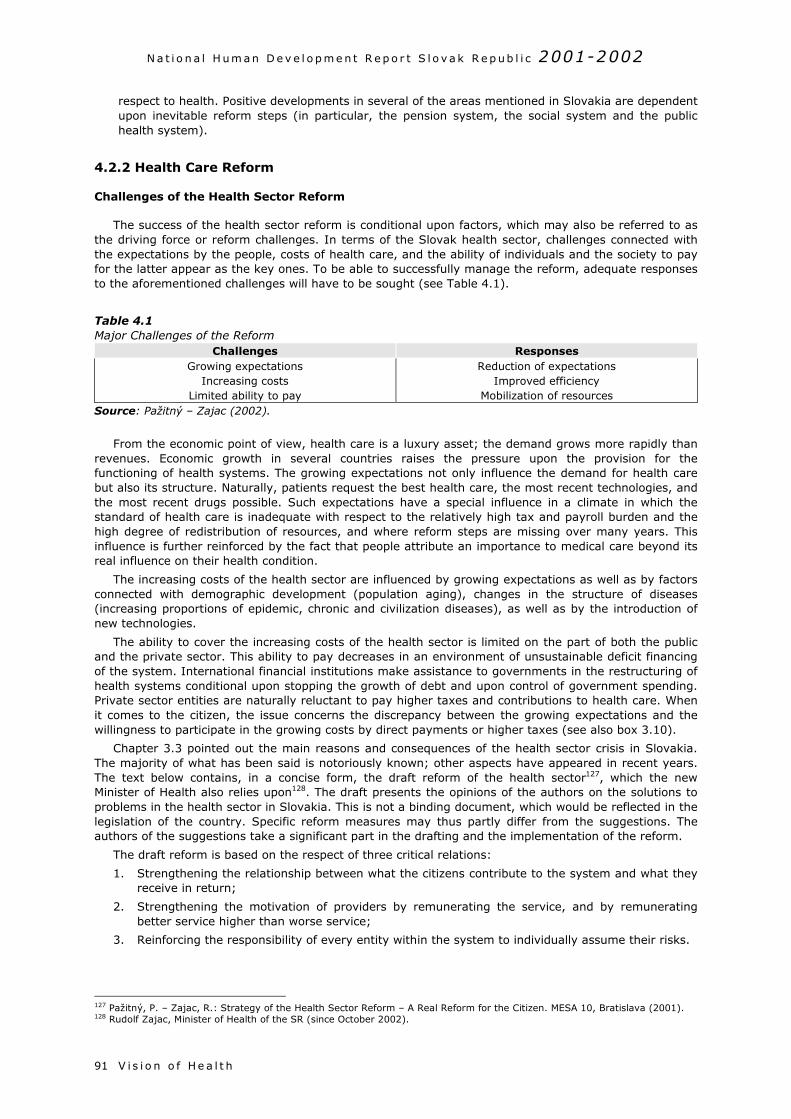
N a t i o n a l H um an D e v e l o p m e n t R e p o r t S l o v a k R e p ub l i c 2001-2002
V i s i o n o f He a l t h91
respect to health. Positive developments in several of the areas mentioned in Slovakia are dependentupon inevitable reform steps (in particular, the pension system, the social system and the publichealth system).
4.2.2 Health Care Reform
Challenges of the Health Sector Reform
The success of the health sector reform is conditional upon factors, which may also be referred to asthe driving force or reform challenges. In terms of the Slovak health sector, challenges connected withthe expectations by the people, costs of health care, and the ability of individuals and the society to payfor the latter appear as the key ones. To be able to successfully manage the reform, adequate responsesto the aforementioned challenges will have to be sought (see Table 4.1).
Table 4.1Major Challenges of the Reform
Challenges ResponsesGrowing expectations
Increasing costsLimited ability to pay
Reduction of expectationsImproved efficiency
Mobilization of resourcesSource: Pažitný – Zajac (2002).
From the economic point of view, health care is a luxury asset; the demand grows more rapidly thanrevenues. Economic growth in several countries raises the pressure upon the provision for thefunctioning of health systems. The growing expectations not only influence the demand for health carebut also its structure. Naturally, patients request the best health care, the most recent technologies, andthe most recent drugs possible. Such expectations have a special influence in a climate in which thestandard of health care is inadequate with respect to the relatively high tax and payroll burden and thehigh degree of redistribution of resources, and where reform steps are missing over many years. Thisinfluence is further reinforced by the fact that people attribute an importance to medical care beyond itsreal influence on their health condition.
The increasing costs of the health sector are influenced by growing expectations as well as by factorsconnected with demographic development (population aging), changes in the structure of diseases(increasing proportions of epidemic, chronic and civilization diseases), as well as by the introduction ofnew technologies.
The ability to cover the increasing costs of the health sector is limited on the part of both the publicand the private sector. This ability to pay decreases in an environment of unsustainable deficit financingof the system. International financial institutions make assistance to governments in the restructuring ofhealth systems conditional upon stopping the growth of debt and upon control of government spending.Private sector entities are naturally reluctant to pay higher taxes and contributions to health care. Whenit comes to the citizen, the issue concerns the discrepancy between the growing expectations and thewillingness to participate in the growing costs by direct payments or higher taxes (see also box 3.10).
Chapter 3.3 pointed out the main reasons and consequences of the health sector crisis in Slovakia.The majority of what has been said is notoriously known; other aspects have appeared in recent years.The text below contains, in a concise form, the draft reform of the health sector127, which the newMinister of Health also relies upon128. The draft presents the opinions of the authors on the solutions toproblems in the health sector in Slovakia. This is not a binding document, which would be reflected in thelegislation of the country. Specific reform measures may thus partly differ from the suggestions. Theauthors of the suggestions take a significant part in the drafting and the implementation of the reform.
The draft reform is based on the respect of three critical relations:
1. Strengthening the relationship between what the citizens contribute to the system and what theyreceive in return;
2. Strengthening the motivation of providers by remunerating the service, and by remuneratingbetter service higher than worse service;
3. Reinforcing the responsibility of every entity within the system to individually assume their risks.
127 Pažitný, P. – Zajac, R.: Strategy of the Health Sector Reform – A Real Reform for the Citizen. MESA 10, Bratislava (2001).128 Rudolf Zajac, Minister of Health of the SR (since October 2002).
N a t i o n a l H um an D e v e l o p m e n t R e p o r t S l o v a k R e p ub l i c 2001-2002
V i s i o n o f He a l t h 92
N a t i o n a l H um an D e v e l o p m e n t R e p o r t S l o v a k R e p ub l i c 2001-2002
V i s i o n o f He a l t h93
Defining the Statutory Entitlement to a Defined Standard
The critical element of health care system reform is a clear definition of the scope of uninsurablerisks. The uninsurable risks mean the basic benefit package (BBP), to which each citizen of the SR shallbe entitled and which shall be covered from public funds, according to the solidarity principle. The restwill be other services, which shall be subject to fees, additional charges, and voluntary insurance.
Change in the Rules of Medical Treatment. The Rules of Medical Treatment are the most discussedcause of the crisis in health care. The reform envisages the division of the Rules of MedicalTreatment into services within the basic benefit package (also referred to as the so-calleduninsurable risk) and services within various packages of voluntary services. The basic package shallinclude those diagnoses and the related preventive, diagnostic and treatment activities, which shallbe fully covered for the patient from statutory insurance. The package shall include:1. All preventive activities, such as vaccinations, mandatory preventive examinations and screening
methods leading to prevention or early diagnostics of serious illnesses;2. All diagnostic activities leading to a proper diagnostics of illnesses listed in the BBP category;3. All treatment for the set diagnoses.
The voluntary services package shall include expediting of planned surgery, additional fee for amore expensive drug than the one included in the basic package, additional fee for higher qualityboard and accommodation and services at sick-bed, cosmetic surgery, contraceptives and abortions,voluntary prevention, and other.
It is assumed that the regions shall have the right to modify its legislation with some stipulationsof the Rules of Medical Treatment, mainly through “betterment” for their citizens or in such caseswhere the local situation shows the need of a more flexible approach to the national legal standard.
Prevention. This is an important part of funding services, while the thesis “prevention is alwayscheaper than cure” applies to its maximum extent. The method of funding prevention has to beredesigned and it needs to be defined, which part and what scope of prevention shall be included inthe basic package. In general, we can divide prevention into three components:1. Primary prevention – the effort to prevent the occurrence of a disease;2. Secondary prevention – the effort to early detect the occurring disease;3. Tertiary prevention – treatment and rehabilitation, reducing the suffering.
Primary prevention has long been identified with vaccination. In fact, it should contain at leastvaccination, state health supervision, and promotion of health. A list of mandatory andrecommended vaccinations shall be drafted, and the vaccination provided by the primary ambulatorycare on the basis of inviting clients. Mandatory vaccinations shall be covered within the basic benefitpackage. The current scheme of state health institutes should be transformed to a new system ofpublic health institutes, supplemented by a Health Promotion Fund, which would cover activities ofstate health care policy and the National Health Promotion Program. This systemic change isexpected to introduce higher flexibility, transparency, and competitiveness into state participation inpreventive measures.
Secondary prevention is already a full component of the treatment-prevention process. Its mostimportant component should be screening. A list of screening examinations according to age and sexwill be a part of the basic package, and these examinations shall be fully covered by the purchasers(e.g., health insurance companies).
Urgent Medical Service (UMS). In case of need of urgent medical service, such as accidents, injuries,sudden life threatening conditions, urgent medical service has to be ensured within the provision ofhealth services. In general, it can be concluded that this service is actually a function of time andquality of the service provided. It is necessary to get the patient as soon as possible and provide thebest quality of service. This is a typical uninsurable risk, which is fully covered within the basicbenefit package. The organization and funding of UMS has to take account of particularities such asdiverse organization of providers on the Slovak territory, diverse structure of the terrain, priority oftime over regional set-up (as the patient has to be transported as fast as possible and as close aspossible), and cooperation with other branches, such as fire department, police, mountain rescue,water rescue has to be ensured. The service must operate on a “stand by” principle. It should beorganized as an independent provider, who will be financed centrally from a special fund, withrespect to the said particularities.
Financing of Health Care
Financing corresponds with all processes and institutions by which the funds to cover all activitiesrelated to the provision of health care are ensured. This includes taxes, contributions into healthinsurance funds, commercial insurance or direct payments and fees from patients.
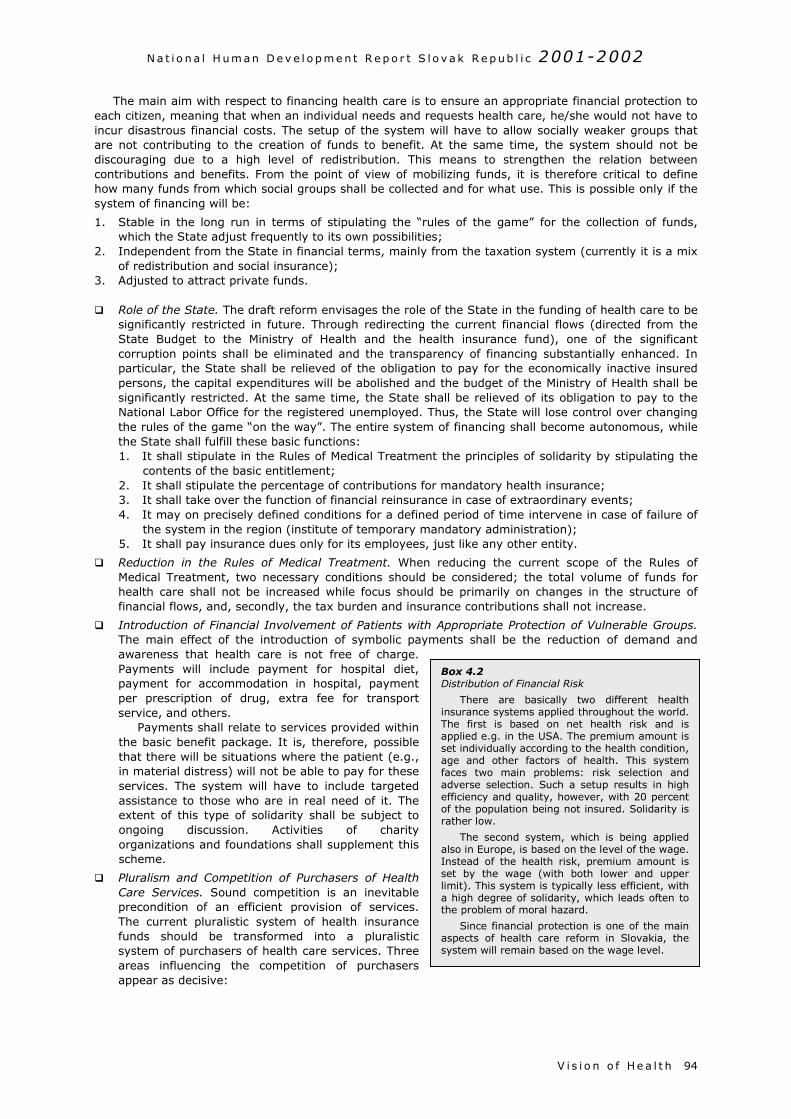
N a t i o n a l H um an D e v e l o p m e n t R e p o r t S l o v a k R e p ub l i c 2001-2002
V i s i o n o f He a l t h 94
The main aim with respect to financing health care is to ensure an appropriate financial protection toeach citizen, meaning that when an individual needs and requests health care, he/she would not have toincur disastrous financial costs. The setup of the system will have to allow socially weaker groups thatare not contributing to the creation of funds to benefit. At the same time, the system should not bediscouraging due to a high level of redistribution. This means to strengthen the relation betweencontributions and benefits. From the point of view of mobilizing funds, it is therefore critical to definehow many funds from which social groups shall be collected and for what use. This is possible only if thesystem of financing will be:
1. Stable in the long run in terms of stipulating the “rules of the game” for the collection of funds,which the State adjust frequently to its own possibilities;
2. Independent from the State in financial terms, mainly from the taxation system (currently it is a mixof redistribution and social insurance);
3. Adjusted to attract private funds.
Role of the State. The draft reform envisages the role of the State in the funding of health care to besignificantly restricted in future. Through redirecting the current financial flows (directed from theState Budget to the Ministry of Health and the health insurance fund), one of the significantcorruption points shall be eliminated and the transparency of financing substantially enhanced. Inparticular, the State shall be relieved of the obligation to pay for the economically inactive insuredpersons, the capital expenditures will be abolished and the budget of the Ministry of Health shall besignificantly restricted. At the same time, the State shall be relieved of its obligation to pay to theNational Labor Office for the registered unemployed. Thus, the State will lose control over changingthe rules of the game “on the way”. The entire system of financing shall become autonomous, whilethe State shall fulfill these basic functions:1. It shall stipulate in the Rules of Medical Treatment the principles of solidarity by stipulating the
contents of the basic entitlement;2. It shall stipulate the percentage of contributions for mandatory health insurance;3. It shall take over the function of financial reinsurance in case of extraordinary events;4. It may on precisely defined conditions for a defined period of time intervene in case of failure of
the system in the region (institute of temporary mandatory administration);5. It shall pay insurance dues only for its employees, just like any other entity.
Reduction in the Rules of Medical Treatment. When reducing the current scope of the Rules ofMedical Treatment, two necessary conditions should be considered; the total volume of funds forhealth care shall not be increased while focus should be primarily on changes in the structure offinancial flows, and, secondly, the tax burden and insurance contributions shall not increase.
Introduction of Financial Involvement of Patients with Appropriate Protection of Vulnerable Groups.The main effect of the introduction of symbolic payments shall be the reduction of demand andawareness that health care is not free of charge.Payments will include payment for hospital diet,payment for accommodation in hospital, paymentper prescription of drug, extra fee for transportservice, and others.
Payments shall relate to services provided withinthe basic benefit package. It is, therefore, possiblethat there will be situations where the patient (e.g.,in material distress) will not be able to pay for theseservices. The system will have to include targetedassistance to those who are in real need of it. Theextent of this type of solidarity shall be subject toongoing discussion. Activities of charityorganizations and foundations shall supplement thisscheme.
Pluralism and Competition of Purchasers of HealthCare Services. Sound competition is an inevitableprecondition of an efficient provision of services.The current pluralistic system of health insurancefunds should be transformed into a pluralisticsystem of purchasers of health care services. Threeareas influencing the competition of purchasersappear as decisive:
Box 4.2Distribution of Financial Risk
There are basically two different healthinsurance systems applied throughout the world.The first is based on net health risk and isapplied e.g. in the USA. The premium amount isset individually according to the health condition,age and other factors of health. This systemfaces two main problems: risk selection andadverse selection. Such a setup results in highefficiency and quality, however, with 20 percentof the population being not insured. Solidarity israther low.
The second system, which is being appliedalso in Europe, is based on the level of the wage.Instead of the health risk, premium amount isset by the wage (with both lower and upperlimit). This system is typically less efficient, witha high degree of solidarity, which leads often tothe problem of moral hazard.
Since financial protection is one of the mainaspects of health care reform in Slovakia, thesystem will remain based on the wage level.
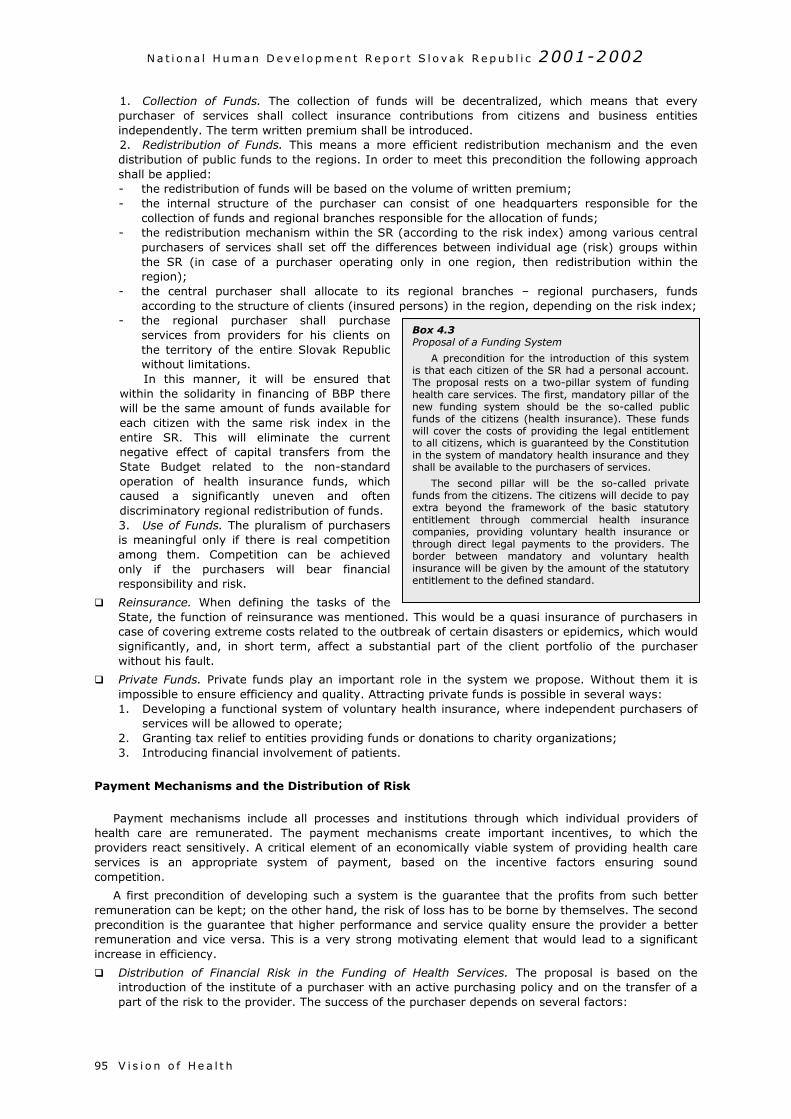
N a t i o n a l H um an D e v e l o p m e n t R e p o r t S l o v a k R e p ub l i c 2001-2002
V i s i o n o f He a l t h95
1. Collection of Funds. The collection of funds will be decentralized, which means that everypurchaser of services shall collect insurance contributions from citizens and business entitiesindependently. The term written premium shall be introduced.2. Redistribution of Funds. This means a more efficient redistribution mechanism and the evendistribution of public funds to the regions. In order to meet this precondition the following approachshall be applied:- the redistribution of funds will be based on the volume of written premium;- the internal structure of the purchaser can consist of one headquarters responsible for the
collection of funds and regional branches responsible for the allocation of funds;- the redistribution mechanism within the SR (according to the risk index) among various central
purchasers of services shall set off the differences between individual age (risk) groups withinthe SR (in case of a purchaser operating only in one region, then redistribution within theregion);
- the central purchaser shall allocate to its regional branches – regional purchasers, fundsaccording to the structure of clients (insured persons) in the region, depending on the risk index;
- the regional purchaser shall purchaseservices from providers for his clients onthe territory of the entire Slovak Republicwithout limitations.In this manner, it will be ensured that
within the solidarity in financing of BBP therewill be the same amount of funds available foreach citizen with the same risk index in theentire SR. This will eliminate the currentnegative effect of capital transfers from theState Budget related to the non-standardoperation of health insurance funds, whichcaused a significantly uneven and oftendiscriminatory regional redistribution of funds.3. Use of Funds. The pluralism of purchasersis meaningful only if there is real competitionamong them. Competition can be achievedonly if the purchasers will bear financialresponsibility and risk.
Reinsurance. When defining the tasks of theState, the function of reinsurance was mentionedcase of covering extreme costs related to the outbsignificantly, and, in short term, affect a substawithout his fault.
Private Funds. Private funds play an important rimpossible to ensure efficiency and quality. Attract1. Developing a functional system of voluntary h
services will be allowed to operate;2. Granting tax relief to entities providing funds o3. Introducing financial involvement of patients.
Payment Mechanisms and the Distribution of Risk
Payment mechanisms include all processes and health care are remunerated. The payment mechanproviders react sensitively. A critical element of an ecservices is an appropriate system of payment, bcompetition.
A first precondition of developing such a system iremuneration can be kept; on the other hand, the riskprecondition is the guarantee that higher performancremuneration and vice versa. This is a very strong mincrease in efficiency.
Distribution of Financial Risk in the Funding ofintroduction of the institute of a purchaser with anpart of the risk to the provider. The success of the
Box 4.3Proposal of a Funding System
A precondition for the introduction of this systemis that each citizen of the SR had a personal account.The proposal rests on a two-pillar system of fundinghealth care services. The first, mandatory pillar of thenew funding system should be the so-called publicfunds of the citizens (health insurance). These fundswill cover the costs of providing the legal entitlementto all citizens, which is guaranteed by the Constitutionin the system of mandatory health insurance and theyshall be available to the purchasers of services.
The second pillar will be the so-called privatefunds from the citizens. The citizens will decide to payextra beyond the framework of the basic statutoryentitlement through commercial health insurancecompanies, providing voluntary health insurance orthrough direct legal payments to the providers. Theborder between mandatory and voluntary healthinsurance will be given by the amount of the statutoryentitlement to the defined standard.
. This would be a quasi insurance of purchasers inreak of certain disasters or epidemics, which wouldntial part of the client portfolio of the purchaser
ole in the system we propose. Without them it ising private funds is possible in several ways:ealth insurance, where independent purchasers of
r donations to charity organizations;
institutions through which individual providers ofisms create important incentives, to which theonomically viable system of providing health careased on the incentive factors ensuring sound
s the guarantee that the profits from such better of loss has to be borne by themselves. The seconde and service quality ensure the provider a betterotivating element that would lead to a significant
Health Services. The proposal is based on the active purchasing policy and on the transfer of a
purchaser depends on several factors:
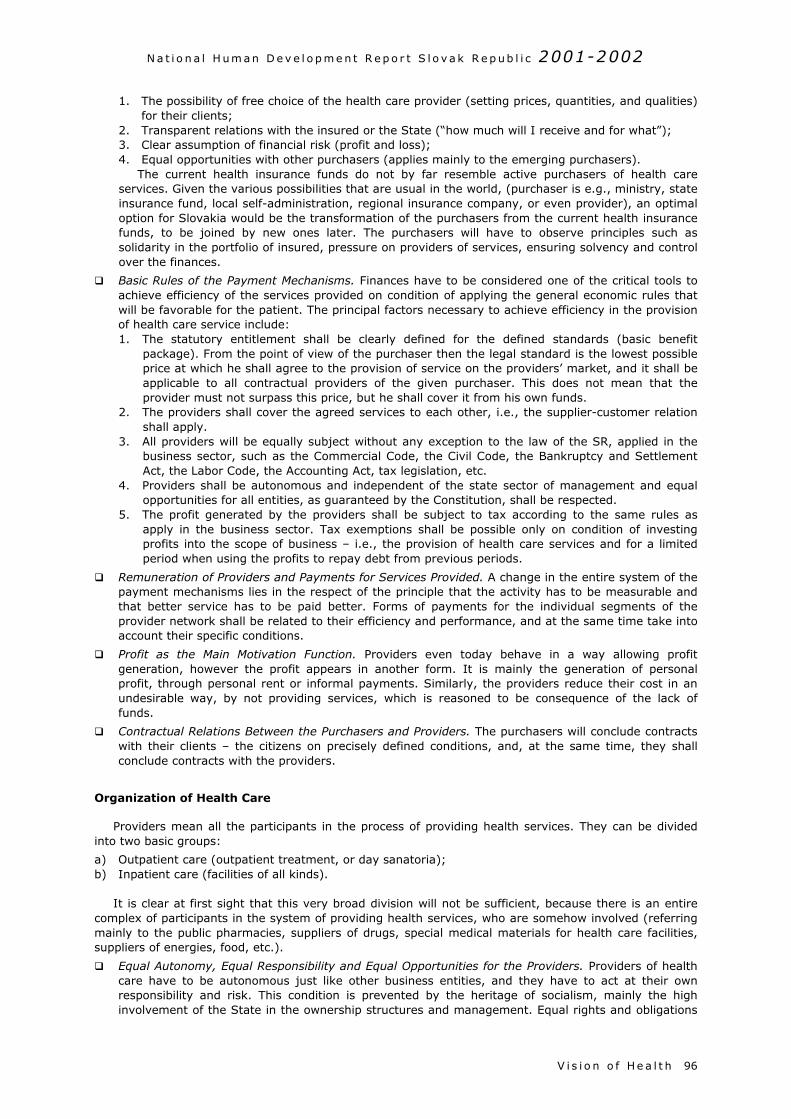
N a t i o n a l H um an D e v e l o p m e n t R e p o r t S l o v a k R e p ub l i c 2001-2002
V i s i o n o f He a l t h 96
1. The possibility of free choice of the health care provider (setting prices, quantities, and qualities)for their clients;
2. Transparent relations with the insured or the State (“how much will I receive and for what”);3. Clear assumption of financial risk (profit and loss);4. Equal opportunities with other purchasers (applies mainly to the emerging purchasers).
The current health insurance funds do not by far resemble active purchasers of health careservices. Given the various possibilities that are usual in the world, (purchaser is e.g., ministry, stateinsurance fund, local self-administration, regional insurance company, or even provider), an optimaloption for Slovakia would be the transformation of the purchasers from the current health insurancefunds, to be joined by new ones later. The purchasers will have to observe principles such assolidarity in the portfolio of insured, pressure on providers of services, ensuring solvency and controlover the finances.
Basic Rules of the Payment Mechanisms. Finances have to be considered one of the critical tools toachieve efficiency of the services provided on condition of applying the general economic rules thatwill be favorable for the patient. The principal factors necessary to achieve efficiency in the provisionof health care service include:1. The statutory entitlement shall be clearly defined for the defined standards (basic benefit
package). From the point of view of the purchaser then the legal standard is the lowest possibleprice at which he shall agree to the provision of service on the providers’ market, and it shall beapplicable to all contractual providers of the given purchaser. This does not mean that theprovider must not surpass this price, but he shall cover it from his own funds.
2. The providers shall cover the agreed services to each other, i.e., the supplier-customer relationshall apply.
3. All providers will be equally subject without any exception to the law of the SR, applied in thebusiness sector, such as the Commercial Code, the Civil Code, the Bankruptcy and SettlementAct, the Labor Code, the Accounting Act, tax legislation, etc.
4. Providers shall be autonomous and independent of the state sector of management and equalopportunities for all entities, as guaranteed by the Constitution, shall be respected.
5. The profit generated by the providers shall be subject to tax according to the same rules asapply in the business sector. Tax exemptions shall be possible only on condition of investingprofits into the scope of business – i.e., the provision of health care services and for a limitedperiod when using the profits to repay debt from previous periods.
Remuneration of Providers and Payments for Services Provided. A change in the entire system of thepayment mechanisms lies in the respect of the principle that the activity has to be measurable andthat better service has to be paid better. Forms of payments for the individual segments of theprovider network shall be related to their efficiency and performance, and at the same time take intoaccount their specific conditions.
Profit as the Main Motivation Function. Providers even today behave in a way allowing profitgeneration, however the profit appears in another form. It is mainly the generation of personalprofit, through personal rent or informal payments. Similarly, the providers reduce their cost in anundesirable way, by not providing services, which is reasoned to be consequence of the lack offunds.
Contractual Relations Between the Purchasers and Providers. The purchasers will conclude contractswith their clients – the citizens on precisely defined conditions, and, at the same time, they shallconclude contracts with the providers.
Organization of Health Care
Providers mean all the participants in the process of providing health services. They can be dividedinto two basic groups:
a) Outpatient care (outpatient treatment, or day sanatoria);b) Inpatient care (facilities of all kinds).
It is clear at first sight that this very broad division will not be sufficient, because there is an entirecomplex of participants in the system of providing health services, who are somehow involved (referringmainly to the public pharmacies, suppliers of drugs, special medical materials for health care facilities,suppliers of energies, food, etc.).
Equal Autonomy, Equal Responsibility and Equal Opportunities for the Providers. Providers of healthcare have to be autonomous just like other business entities, and they have to act at their ownresponsibility and risk. This condition is prevented by the heritage of socialism, mainly the highinvolvement of the State in the ownership structures and management. Equal rights and obligations
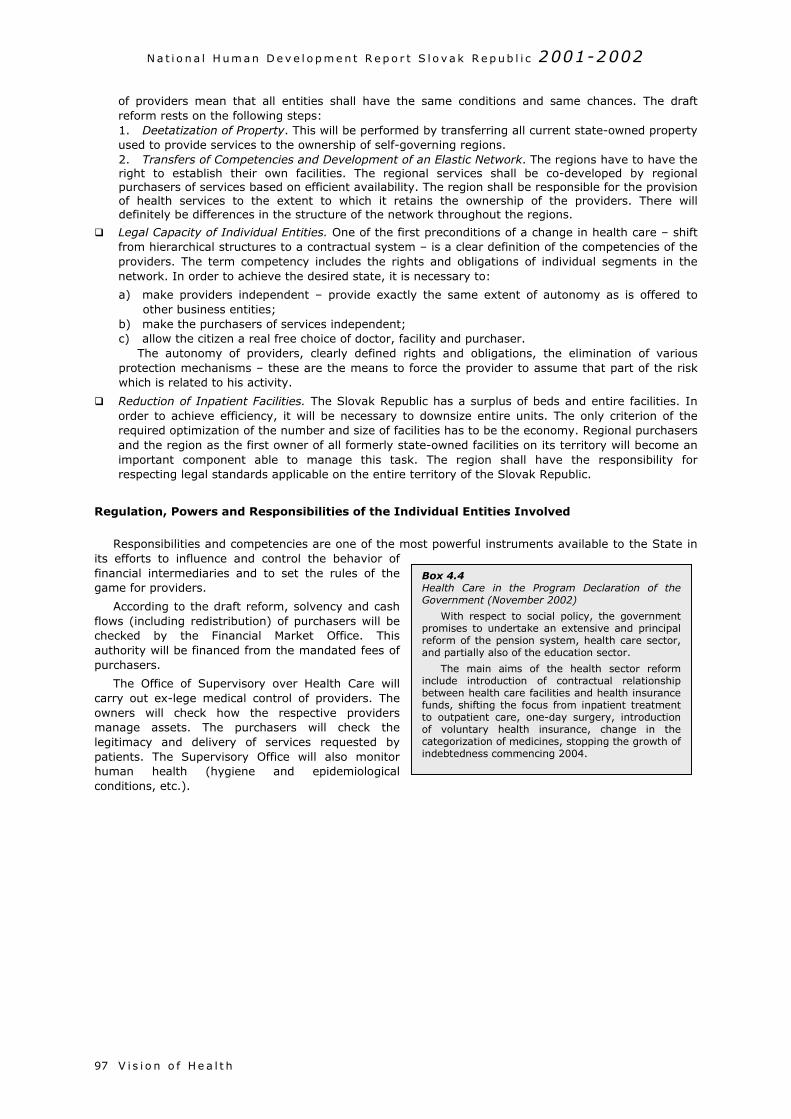
N a t i o n a l H um an D e v e l o p m e n t R e p o r t S l o v a k R e p ub l i c 2001-2002
V i s i o n o f He a l t h97
of providers mean that all entities shall have the same conditions and same chances. The draftreform rests on the following steps:1. Deetatization of Property. This will be performed by transferring all current state-owned propertyused to provide services to the ownership of self-governing regions.2. Transfers of Competencies and Development of an Elastic Network. The regions have to have theright to establish their own facilities. The regional services shall be co-developed by regionalpurchasers of services based on efficient availability. The region shall be responsible for the provisionof health services to the extent to which it retains the ownership of the providers. There willdefinitely be differences in the structure of the network throughout the regions.
Legal Capacity of Individual Entities. One of the first preconditions of a change in health care – shiftfrom hierarchical structures to a contractual system – is a clear definition of the competencies of theproviders. The term competency includes the rights and obligations of individual segments in thenetwork. In order to achieve the desired state, it is necessary to:
a) make providers independent – provide exactly the same extent of autonomy as is offered toother business entities;
b) make the purchasers of services independent;c) allow the citizen a real free choice of doctor, facility and purchaser.
The autonomy of providers, clearly defined rights and obligations, the elimination of variousprotection mechanisms – these are the means to force the provider to assume that part of the riskwhich is related to his activity.
Reduction of Inpatient Facilities. The Slovak Republic has a surplus of beds and entire facilities. Inorder to achieve efficiency, it will be necessary to downsize entire units. The only criterion of therequired optimization of the number and size of facilities has to be the economy. Regional purchasersand the region as the first owner of all formerly state-owned facilities on its territory will become animportant component able to manage this task. The region shall have the responsibility forrespecting legal standards applicable on the entire territory of the Slovak Republic.
Regulation, Powers and Responsibilities of the Individual Entities Involved
Responsibilities and competencies are one of the most powerful instruments available to the State inits efforts to influence and control the behavior offinancial intermediaries and to set the rules of thegame for providers.
According to the draft reform, solvency and cashflows (including redistribution) of purchasers will bechecked by the Financial Market Office. Thisauthority will be financed from the mandated fees ofpurchasers.
The Office of Supervisory over Health Care willcarry out ex-lege medical control of providers. Theowners will check how the respective providersmanage assets. The purchasers will check thelegitimacy and delivery of services requested bypatients. The Supervisory Office will also monitorhuman health (hygiene and epidemiologicalconditions, etc.).
Box 4.4Health Care in the Program Declaration of theGovernment (November 2002)
With respect to social policy, the governmentpromises to undertake an extensive and principalreform of the pension system, health care sector,and partially also of the education sector.
The main aims of the health sector reforminclude introduction of contractual relationshipbetween health care facilities and health insurancefunds, shifting the focus from inpatient treatmentto outpatient care, one-day surgery, introductionof voluntary health insurance, change in thecategorization of medicines, stopping the growth ofindebtedness commencing 2004.
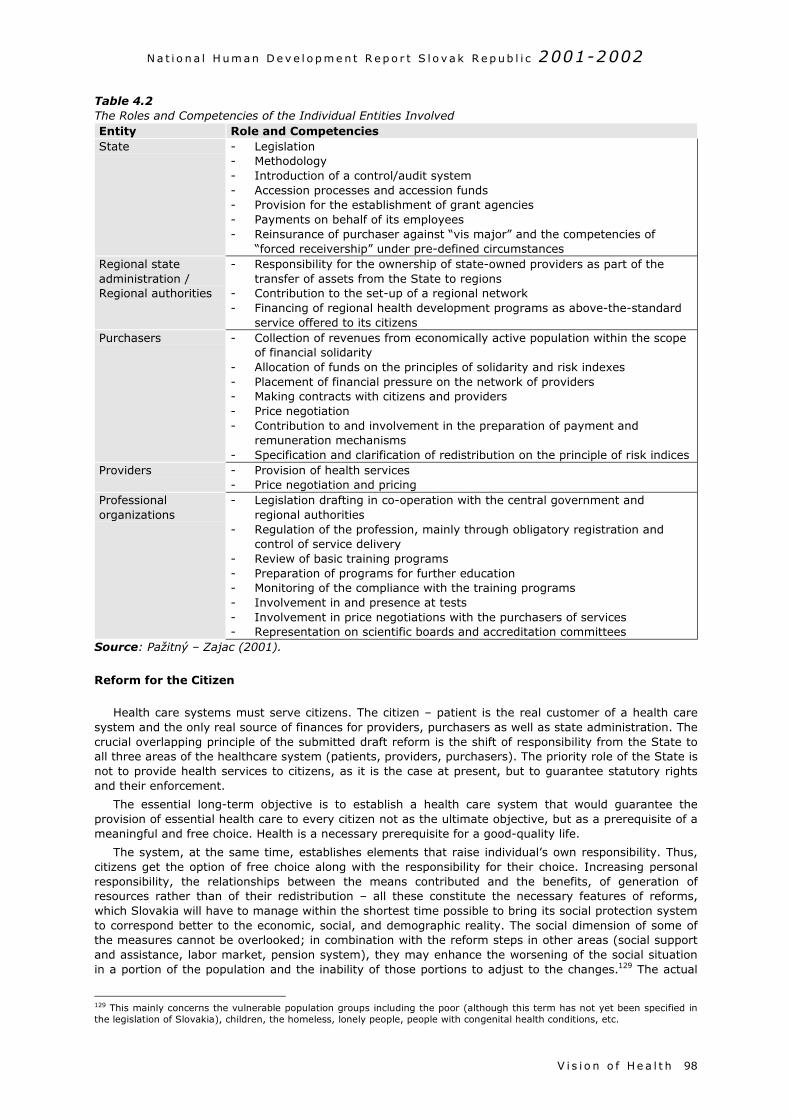
N a t i o n a l H um an D e v e l o p m e n t R e p o r t S l o v a k R e p ub l i c 2001-2002
V i s i o n o f He a l t h 98
Table 4.2The Roles and Competencies of the Individual Entities InvolvedEntity Role and CompetenciesState - Legislation
- Methodology- Introduction of a control/audit system- Accession processes and accession funds- Provision for the establishment of grant agencies- Payments on behalf of its employees- Reinsurance of purchaser against “vis major” and the competencies of
“forced receivership” under pre-defined circumstancesRegional stateadministration /Regional authorities
- Responsibility for the ownership of state-owned providers as part of thetransfer of assets from the State to regions
- Contribution to the set-up of a regional network- Financing of regional health development programs as above-the-standard
service offered to its citizensPurchasers - Collection of revenues from economically active population within the scope
of financial solidarity- Allocation of funds on the principles of solidarity and risk indexes- Placement of financial pressure on the network of providers- Making contracts with citizens and providers- Price negotiation- Contribution to and involvement in the preparation of payment and
remuneration mechanisms- Specification and clarification of redistribution on the principle of risk indices
Providers - Provision of health services- Price negotiation and pricing
Professionalorganizations
- Legislation drafting in co-operation with the central government andregional authorities
- Regulation of the profession, mainly through obligatory registration andcontrol of service delivery
- Review of basic training programs- Preparation of programs for further education- Monitoring of the compliance with the training programs- Involvement in and presence at tests- Involvement in price negotiations with the purchasers of services- Representation on scientific boards and accreditation committees
Source: Pažitný – Zajac (2001).
Reform for the Citizen
Health care systems must serve citizens. The citizen – patient is the real customer of a health caresystem and the only real source of finances for providers, purchasers as well as state administration. Thecrucial overlapping principle of the submitted draft reform is the shift of responsibility from the State toall three areas of the healthcare system (patients, providers, purchasers). The priority role of the State isnot to provide health services to citizens, as it is the case at present, but to guarantee statutory rightsand their enforcement.
The essential long-term objective is to establish a health care system that would guarantee theprovision of essential health care to every citizen not as the ultimate objective, but as a prerequisite of ameaningful and free choice. Health is a necessary prerequisite for a good-quality life.
The system, at the same time, establishes elements that raise individual’s own responsibility. Thus,citizens get the option of free choice along with the responsibility for their choice. Increasing personalresponsibility, the relationships between the means contributed and the benefits, of generation ofresources rather than of their redistribution – all these constitute the necessary features of reforms,which Slovakia will have to manage within the shortest time possible to bring its social protection systemto correspond better to the economic, social, and demographic reality. The social dimension of some ofthe measures cannot be overlooked; in combination with the reform steps in other areas (social supportand assistance, labor market, pension system), they may enhance the worsening of the social situationin a portion of the population and the inability of those portions to adjust to the changes.129 The actual
129 This mainly concerns the vulnerable population groups including the poor (although this term has not yet been specified inthe legislation of Slovakia), children, the homeless, lonely people, people with congenital health conditions, etc.
N a t i o n a l H um an D e v e l o p m e n t R e p o r t S l o v a k R e p ub l i c 2001-2002
V i s i o n o f He a l t h99
form of solidarity with those who will be dependent on some kind of assistance from the public or non-governmental sector has not yet been clearly defined. Several suggested measures may requirecorrections and adjustments to external conditions during their implementation (in particular to economicand social, less political conditions). The ongoing discussions on health care sector reform must notignore this aspect. Vulnerable groups of the population are more likely to suffer from health disturbancesand experience poor access to health services.
N a t i o n a l H um an D e v e l o p m e n t R e p o r t S l o v a k R e p ub l i c 2001-2002
V i s i o n o f He a l t h 100
N a t i o n a l h um an d e v e l o p m e n t r e p o r t S l o v a k R e p ub l i c 2001-2002
B i b l i o g r a p hy101
Bibliography
Aday, L.A. – Begley, Ch.R. – Lairson, D.R. – Slater, C.H.: Evaluating Health Care Systems. HealthAdministration Press, Michigan (1993)
Ághová, Ľ. et al.: Hygiene. (Hygiena) Osveta, Martin (1993)
Balík, S.: Czech post-election situation. (Česká povolební situace) In: Listy SFPA, Vol. 4, September-October2002, p. 8-9.
Blumenthal, D.S.: Introduction to Environmental Health. Springer, New York (1995)
Brondošová, J.: Crown reached a new record. (Koruna má nový rekord) In: SME, 5. 11. 2002
Business Alliance of Slovakia: Report on the state of the business environment. (Správa o stavepodnikateľského prostredia) PAS-CPHR, Bratislava (2002)
Bútorová, Z. (ed.): She and he in Slovakia. Female destiny in the view of public opinion. (Ona a on naSlovensku. Ženský údel očami verejnej mienky) FOCUS, Bratislava (1996)
De Bijl, N.: Patient’s Rights in Germany, the Netherlands, Sweden and the United Kingdom. Seminar onpatient’s rights, October 9, 2000, Bratislava
Demeš, M. – Ginter, E. – Kováč, E.: Health care. (Zdravotníctvo) In: Bútora, M. – Ivantyšyn, M. (eds): Slovakia1997. A global report on the state of society and trends for 1998. (Slovensko 1997. Súhrnná správa o stavespoločnosti a trendoch na rok 1998) IVO, Bratislava (1998)
Doll, R. – Peto, R.: The Causes of Cancer. Oxford University Press (1981)
Dzúrik, R. – Trnovec, T. et al.: Standard therapeutic orders. (Štandardné terapeutické postupy) Osveta, Martin(1997)
Eurostat: Eating, drinking, smoking - comparative price levels in EU, EFTA and Candidate Countries for 2001.Statistics in Focus, Economy and Finance, Theme 2 - 42/2002, European Communities. (2002)
Everson, S.A. – Goldberg, D.E. – Kaplan, G.A. et al.: Hopelessness and risk of mortality and incidence ofmyocardial infarction and cancer. Psychosom Med 1996, 58: 113-121.
Folland, S. – Goodman, A.C. – Stano, M.: The Economics of Health Care. Prentice Hall (1997)
Fuchs, D. – Klingemann, H.D.: Eastward Enlargement of the European Union and the Identity of Europe.Diskussionspapier FS III 00-206, Wissenschaftszentrum Berlin für Sozialforschung, Berlin (2000)
Ginter, E.: Cardiovascular risk factors in the former communist countries. Analysis of 40 European MONICApopulations. Eur J Epidem 1995, 11: 199-205 (1995)
Ginter, E.: Health status of the inhabitants of Slovakia. (Zdravotný stav obyvateľov Slovenska) In: Huba, M.(ed.): Post-November Slovakia in relation to environment and sustainable living. (Ponovembrové Slovenskovo vzťahu k životnému prostrediu a trvalo udržateľnému životu) EuroUniPress and STUŽ/SR, Bratislava, p. 38-53 (1995)
Ginter, E.: High cardiovascular mortality in postcommunist countries: participation of oxidative stress? Intern JVit Nutr Res 1996, 66: 183-189 (1996)
Ginter, E.: Health status of inhabitants at end of the 20th century. (Zdravotný stav obyvateľov na konci 20.storočia). In: Ira, V. et al.: National strategy of sustainable living. (Národná stratégia trvalo udržateľnéhorozvoja) Draft, Part II.2. Human resources, REC Slovensko, Bratislava, p. 42-53 (2000)
Ginter, E.: World Health Report 2000: the position of Slovak Republic. Bratislavské lekárske listy 2000, 101:477-483 (2000)
Ginter, E.: Is our health care in a worse condition than in Albania? (Je naše zdravotníctvo skutočne v horšomstave ako v Albánsku?) Medicínsky monitor, 2/2001, Bratislava (2001)
Government of the SR: National strategy of sustainable development. (Národná stratégia trvalo udržateľnéhorozvoja) Bratislava (2001)
Government of the SR: Report on agriculture and food industry in the SR 2001. (Správa o poľnohospodárstve apotravinárstve v Slovenskej republike 2001), Bratislava (2001)
Gyarfášová, O. – Velšic, M.: Public opinion. (Verejná mienka) In: Slovakia 2001. A global report on the state ofsociety. (Slovensko 2001. Súhrnná správa o stave spoločnosti) IVO, Bratislava (2001)
N a t i o n a l h um an d e v e l o p m e n t r e p o r t S l o v a k R e p ub l i c 2001-2002
B i b l i o g r a p hy 102
Gyarfášová, O. – Krivý, V. – Velšic, M. et al.: Country in motion. Report on political opinions and values ofpeople in Slovakia. (Krajina v pohybe. Správa o politických názoroch a hodnotách ľudí na Slovensku) IVO,Bratislava (2001)
Haulíková, L.: Corruption in health care. (Korupcia v zdravotníctve) In: Sičáková E. et al..: Faces of corruptionin Slovakia. (Podoby korupcie na Slovensku) CPHR – Transparency International Slovakia, Bratislava (1999)
Hegyi, L. – Bražinová, A. – Tóth, K. – Weber, J.: Patients’ rights in the Slovak Republic. (Práva pacientov vSlovenskej republike) p. 6, Bratislava (2000)
Inglehart, R.: Modernization and Postmodernization. Cultural, Economic, and Political Change in 43 Societies.Princeton University Press, p. 209 (1997)
Institute of information and forecasts in education: Separates of the statistical yearbook. Education of the SR in2000/2001. (Separáty štatistickej ročenky. Školstvo SR 2000/2001) ÚZIŠ, Bratislava (2000)
Institute of information and forecasts in education: Statistical yearbook of education of the SR. (Štatistickáročenka školstva SR) ÚZIŠ, Bratislava (2000, 2001)
Kalibová, K.: Characteristics of mortality patterns of the Roma population in CSSR. (Charakteristikaúmrtnostních poměrů romské populace v ČSSR) Demografie 1989, 31: p. 239-250 (1989)
Kitchelt, H. et al.: Post-Communist Party System: Competition, Representation, and Inter-party Cooperation.Cambridge: Cambridge University Press (1999)
Klinda, J. et al: Environment in the Slovak Republic in 1992-1993. (Životné prostredie Slovenskej republiky vrokoch 1992 –1993. Ministry of Environment of the SR, Bratislava (1994)
Klinda, J. – Lieskovská, Z. et al: Report on the state of environment in the Slovak Republic 1999. (Správa ostave životného prostredia v Slovenskej republike 1999) Ministry of Environment of the SR, Bratislava (2000)
Kristenson, M. – Zieden, B. – Kucinskiene, Z. – Elinder, L.S. et al.: Antioxidant state and mortality fromcoronary heart disease in Lithuanian and Swedish men: concomitant cross sectional study of men aged 50.BMJ 1997, 314: 629-633 (1997)
Krivý, V.: Results of 2002 parliamentary elections. (Výsledky parlamentných volieb 2002) In: Kollár, M. –Mesežnikov, G. (eds): Slovakia 2002. A global report on the state of society. (Slovensko 2002. Súhrnnáspráva o stave spoločnosti) IVO, Bratislava (2002)
Kuvíková, H. – Murgaš, M. – Nemec, J.: Economics of health care. (Ekonómia zdravotníctva) Phoenix (1995)
Kuvíková, H. – Murgaš, M. – Nemec, J.: Health care management. (Manažment zdravotníctva) Trian, BanskáBystrica (1998)
Michálek, A.: Regional aspects of life expectancy in Slovakia. (Regionálne aspekty dĺžky života na Slovensku)Manuscript, Geographical Institute of the Slovak Academy of Sciences, Bratislava (2001)
Ministry of Environment of the SR: Agenda 21 and indicators of sustainable living. (Agenda 21 a ukazovateletrvalo udržateľného rozvoja) MŽP SR, Bratislava (1996)
Ministry of Environment of the SR: Environment of the Slovak Republic. MŽP SR, Bratislava (2001)
Ministry of Environment of the SR: Rio + 10 Report. The National Report of the Slovak Republic on SustainableDevelopment. MŽP SR, Bratislava (2002)
Ministry of Labor, Social Affairs and Family of the SR: Report on the social situation of the population of the SR.(Správa o sociálnej situácii obyvateľstva SR) Volumes 2000, 2001, MPSVR, Bratislava
Ministry of Labor, Social Affairs and Family of the SR: Report on the Implementation of conclusions andpriorities of the document of the Joint Assessment of Employment Priorities in the SR for 2001. MPSVR,Bratislava (2002)
Morvay, K.: Macroeconomic development. (Makroekonomický vývoj) In: Marcinčin, A.: Economic policy inSlovakia 2000-2001. (Hospodárska politika na Slovensku 2000-2001) SFPA, Prešov (2002)
Musselman, D.L. – Evans, D.L. – Nemeroff, C.B.: The relationship of depression to cardiovascular disease.Archives of General Psychiatry 1998,55: 580-592 (1998)
OECD: Economic Surveys: Slovak Republic. Organization for Economic Cooperation and Development, Paris(2002)
Pažitný, P. – Zajac, R.: Health care. (Zdravotníctvo) In: Kollár, M. – Mesežnikov, G. (eds.): Slovakia 2000. Aglobal report on the state of society. (Slovensko 2000. Súhrnná správa o stave spoločnosti) IVO, Bratislava(2000)
N a t i o n a l h um an d e v e l o p m e n t r e p o r t S l o v a k R e p ub l i c 2001-2002
B i b l i o g r a p hy103
Pažitný, P. – Zajac, R.: Strategy of health care reform – real reform for the citizen. (stratégia reformyzdravotníctva – reálnej reformy pre občana) M.E.S.A. 10, Bratislava (2001)
Pažitný, P. – Zajac, R.: Health care. (Zdravotníctvo) In: Marcinčin, A. (ed.): Economic policy in Slovakia 2000-2001. (Hospodárska politika na Slovensku 2000-2001) SFPA, Prešov (2002)
Permanent Mission of the SR to the UN: WSSD – Evaluation report on the results of the World Summit onSustainable Development. (Hodnotiaca správa o výsledkoch Svetového summitu o trvalo udržateľnom rozvoji)Manuscript, New York (2002)
Radičová, I. – Woleková, H. – Nemec, J.: Health, work, pension. (Zdravie, práca, dôchodok) SPACE, Bratislava(1999)
Reichrtová, E.: Environment and health. (Životné prostredie a zdravie) Životné prostredie – revue pre teóriu atvorbu životného prostredia. Vol. 30, No. 5. (1996)
Roháč, D. – Vašák, J. – Zachar, D.: Evaluation of economic and social measures HESO. (Hodnotenieekonomických a sociálnych opatrení HESO) INEKO, Bratislava (2002)
Rybár, K.: Protection and promotion of human health. (Ochrana a podpora ľudského zdravia) In: Ira, V. et al.:National strategy of sustainable living. (Národná stratégia trvalo udržateľného rozvoja) Draft, Part II.2.Human resources, REC Slovensko, Bratislava, p. 54-64 (2000)
Rybář, M.: Instability of the system of political parties and 2002 elections. (Nestabilnosť straníckeho systému avoľby 2002) In: Listy SFPA, Vol. 4, July – August 2002
Sedláková, D.: The government approved the Charter of Patient‘s Rights. (Vláda schválila Chartu práv pacienta)Partnerstvo – časopis VšZP a jej klientov, 2/ 2001, p. 14 (2001)
Slovak Governance Institute: National report on education policy. SGI, Bratislava (2001)
Southby, R.F.: Why Study Other Health Care Systems? Manuscript. George Washington University, WashingtonD.C. (1998)
Study on the Social Protection Systems in the 13 Applicant Countries. Synthesis report, Second draft. GVG,Köln (2002).
Study on the Social Protection Systems in the 13 Applicant Countries. Slovak Republic. Country study, seconddraft. CPHR, Bratislava (2002a).
Szomolányi, S.: Elections will be about efficiency of democracy rather than about its survival. (Voľby budú oefektivite, nie o prežití demokracie) In: Listy SFPA, Vol. 4, July - August 2002
Statistical Office of the SR: Population and housing census. Basic data. (Sčítanie ľudí, domov a bytov. Základnéúdaje) ŠÚ SR, Bratislava (2001)
Statistical Office of the SR: Statistical yearbook of regions of the SR 1996-2000. (Štatistická ročenka regiónovSR 1996-2000) ŠÚ SR, Bratislava (2002)
Statistical Office of the SR: Statistical yearbook of the SR. (Štatistická ročenka SR) Editions 2000, 2001, ŠÚ SR,Veda, Bratislava
Statistical Office of the SR: Selected indicators of economic development in the SR in 1991-2001. (Vybranéukazovatele ekonomického vývoja SR v rokoch 1991-2001) ŠÚ SR, Bratislava (2002)
Štefanovič, R. – Egnerová, A. a kol.: Psychosocial risk factors of cardiovascular diseases. (Psychosociálnerizikové faktory kardiovaskulárnych ochorení) Project of the National program on health promotion (1998)
Tirpák, M. – Katerinková, M. – Hečko, I.: Population of the SR in 1999 in the light of statistical data.(Obyvateľstvo SR v roku 1999 v zrkadle štatistických údajov) Slovenská štatistika a demografia 10, p. 4-45(2000)
Tóth, J.: Fiscal policy. (Fiskálna politika) In: Marcinčin, A.: .): Economic policy in Slovakia 2000-2001.(Hospodárska politika na Slovensku 2000-2001) SFPA, Prešov (2002)
UNDP: Human Development Report. Editions 1997-2002, New York, Oxford
UNDP: National human development report Slovakia 1998. UNDP, CPHR, Bratislava (1998)
UNDP: National human development report Slovak Republic 1999. UNDP, CPHR, Bratislava (1999)
UNDP: National human development report Slovak Republic 2000. UNDP, CPHR, Bratislava (2000)
Vagač, L. – Strapec, M.: Housing support in Slovakia. (Podpora bytovej výstavby na Slovensku) CPHR,Bratislava (1997)
N a t i o n a l h um an d e v e l o p m e n t r e p o r t S l o v a k R e p ub l i c 2001-2002
B i b l i o g r a p hy 104
Vašečka, M.: Roma. (Rómovia) In: In: Mesežnikov, G. – Kollár, M. (eds): Slovakia 2001. A global report on thestate of society. (Slovensko 2001. Súhrnná správa o stave spoločnosti) IVO, Bratislava (2001)
Wilkinson, R.G.: Income Distribution and Life Expectancy. British Medical Journal 304 (1992)
WHO: European Health for All Database. WHO Regional Office for Europe, Copenhagen
WHO: Supporting Patients’ Rights and Empowering Citizens: Emerging Systems in Europe, in print, Copenhagen(2001)
WHO: World Health Report. Editions 2000-2002, Geneva
World Bank: Making transition work for everyone. Poverty and inequality in Europe and Central Asia.Washington, D.C. (2000a)
World Bank: Corruption in Slovakia. Results of a diagnostic survey. (Korupcia na Slovensku. Výsledkydiagnostického prieskumu) WB, Bratislava (2000b)
World Bank: Slovak Republic – Living Standards, Employment and Labor Market Study. Report No. 22351-SK(2001)
World Bank: Slovak Republic. Development Policy Review. Executive summary, WB, Bratislava (2002)
http://www.europa.sk
http://www.nbs.sk
http://www.nup.org
http://www.statistics.sk
http://www.undp.org
http://www.who.dk
http://www.who.org
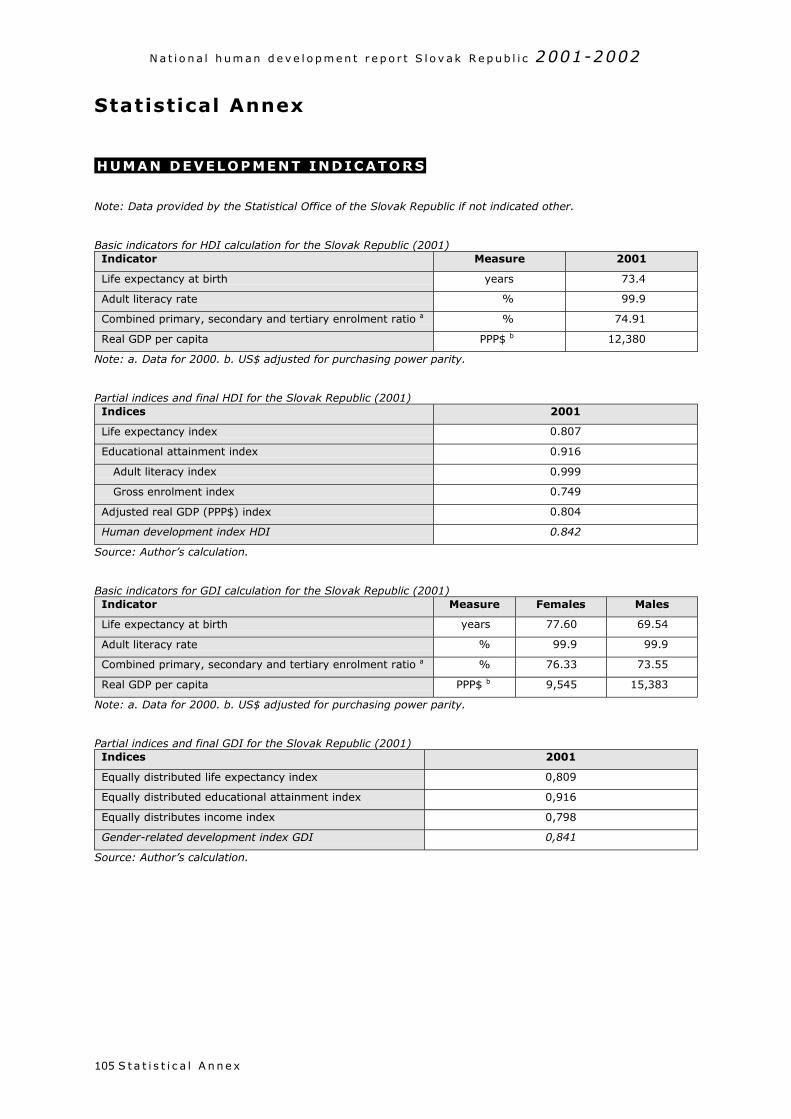
N a t i o n a l h um an d e v e l o p m e n t r e p o r t S l o v a k R e p ub l i c 2001-2002
S t a t i s t i c a l A n ne x105
Statistical Annex
HUMAN DEVELOPMENT INDICATORS
Note: Data provided by the Statistical Office of the Slovak Republic if not indicated other.
Basic indicators for HDI calculation for the Slovak Republic (2001)Indicator Measure 2001
Life expectancy at birth years 73.4
Adult literacy rate % 99.9
Combined primary, secondary and tertiary enrolment ratio a % 74.91
Real GDP per capita PPP$ b 12,380
Note: a. Data for 2000. b. US$ adjusted for purchasing power parity.
Partial indices and final HDI for the Slovak Republic (2001)Indices 2001
Life expectancy index 0.807
Educational attainment index 0.916
Adult literacy index 0.999
Gross enrolment index 0.749
Adjusted real GDP (PPP$) index 0.804
Human development index HDI 0.842
Source: Author’s calculation.
Basic indicators for GDI calculation for the Slovak Republic (2001)Indicator Measure Females Males
Life expectancy at birth years 77.60 69.54
Adult literacy rate % 99.9 99.9
Combined primary, secondary and tertiary enrolment ratio a % 76.33 73.55
Real GDP per capita PPP$ b 9,545 15,383
Note: a. Data for 2000. b. US$ adjusted for purchasing power parity.
Partial indices and final GDI for the Slovak Republic (2001)Indices 2001
Equally distributed life expectancy index 0,809
Equally distributed educational attainment index 0,916
Equally distributes income index 0,798
Gender-related development index GDI 0,841
Source: Author’s calculation.
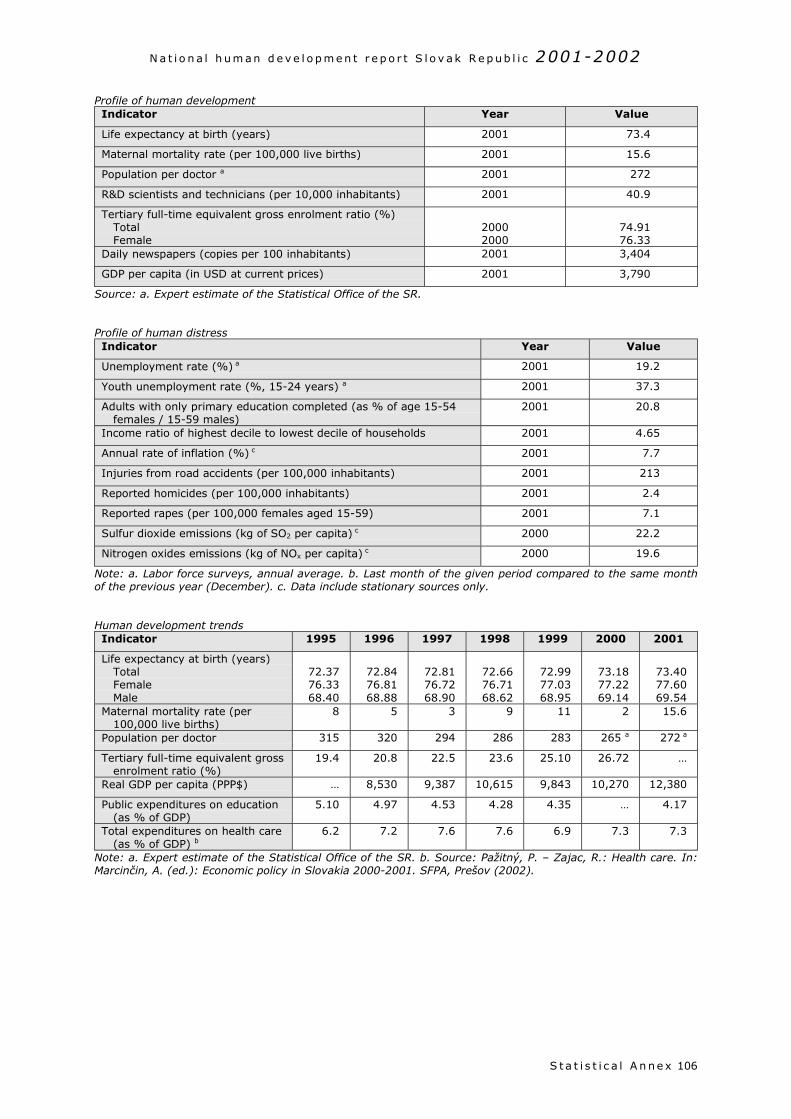
N a t i o n a l h um an d e v e l o p m e n t r e p o r t S l o v a k R e p ub l i c 2001-2002
S t a t i s t i c a l A n ne x 106
Profile of human developmentIndicator Year Value
Life expectancy at birth (years) 2001 73.4
Maternal mortality rate (per 100,000 live births) 2001 15.6
Population per doctor a 2001 272
R&D scientists and technicians (per 10,000 inhabitants) 2001 40.9
Tertiary full-time equivalent gross enrolment ratio (%)TotalFemale
20002000
74.9176.33
Daily newspapers (copies per 100 inhabitants) 2001 3,404
GDP per capita (in USD at current prices) 2001 3,790
Source: a. Expert estimate of the Statistical Office of the SR.
Profile of human distressIndicator Year Value
Unemployment rate (%) a 2001 19.2
Youth unemployment rate (%, 15-24 years) a 2001 37.3
Adults with only primary education completed (as % of age 15-54females / 15-59 males)
2001 20.8
Income ratio of highest decile to lowest decile of households 2001 4.65
Annual rate of inflation (%) c 2001 7.7
Injuries from road accidents (per 100,000 inhabitants) 2001 213
Reported homicides (per 100,000 inhabitants) 2001 2.4
Reported rapes (per 100,000 females aged 15-59) 2001 7.1
Sulfur dioxide emissions (kg of SO2 per capita) c 2000 22.2
Nitrogen oxides emissions (kg of NOx per capita) c 2000 19.6
Note: a. Labor force surveys, annual average. b. Last month of the given period compared to the same monthof the previous year (December). c. Data include stationary sources only.
Human development trendsIndicator 1995 1996 1997 1998 1999 2000 2001
Life expectancy at birth (years)TotalFemaleMale
72.3776.3368.40
72.8476.8168.88
72.8176.7268.90
72.6676.7168.62
72.9977.0368.95
73.1877.2269.14
73.4077.6069.54
Maternal mortality rate (per100,000 live births)
8 5 3 9 11 2 15.6
Population per doctor 315 320 294 286 283 265 a 272 a
Tertiary full-time equivalent grossenrolment ratio (%)
19.4 20.8 22.5 23.6 25.10 26.72 …
Real GDP per capita (PPP$) … 8,530 9,387 10,615 9,843 10,270 12,380
Public expenditures on education(as % of GDP)
5.10 4.97 4.53 4.28 4.35 … 4.17
Total expenditures on health care(as % of GDP) b
6.2 7.2 7.6 7.6 6.9 7.3 7.3
Note: a. Expert estimate of the Statistical Office of the SR. b. Source: Pažitný, P. – Zajac, R.: Health care. In:Marcinčin, A. (ed.): Economic policy in Slovakia 2000-2001. SFPA, Prešov (2002).
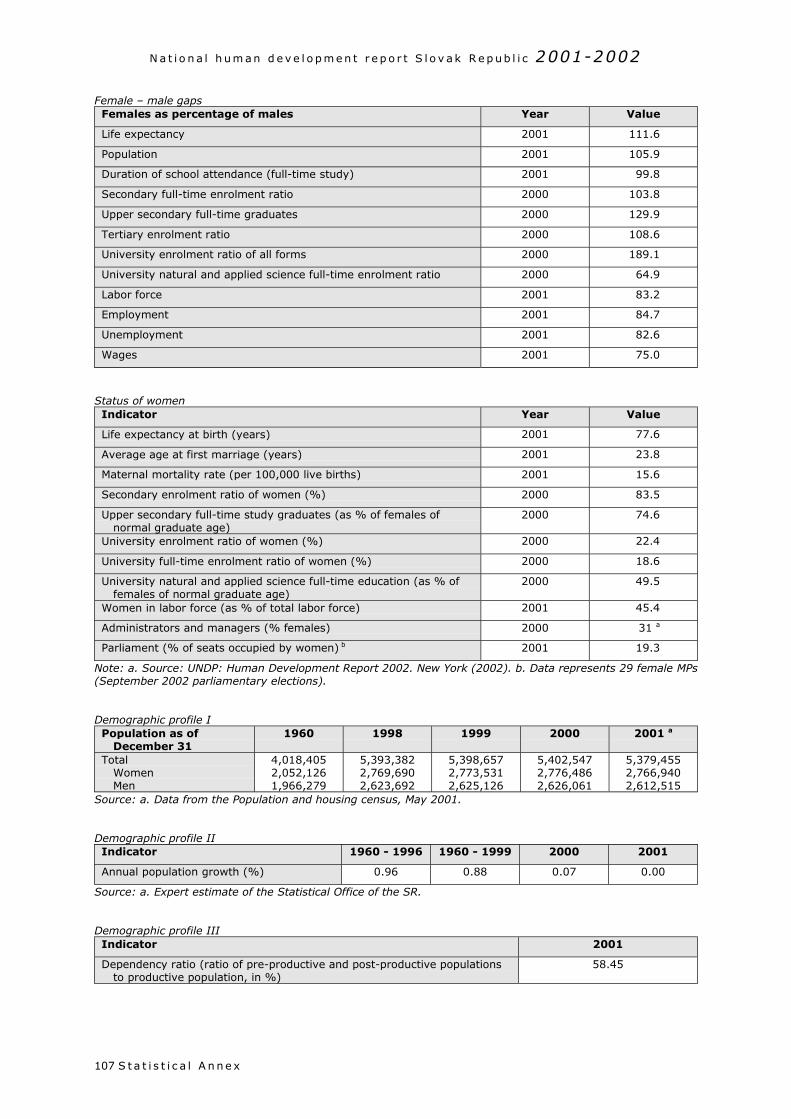
N a t i o n a l h um an d e v e l o p m e n t r e p o r t S l o v a k R e p ub l i c 2001-2002
S t a t i s t i c a l A n ne x107
Female – male gapsFemales as percentage of males Year Value
Life expectancy 2001 111.6
Population 2001 105.9
Duration of school attendance (full-time study) 2001 99.8
Secondary full-time enrolment ratio 2000 103.8
Upper secondary full-time graduates 2000 129.9
Tertiary enrolment ratio 2000 108.6
University enrolment ratio of all forms 2000 189.1
University natural and applied science full-time enrolment ratio 2000 64.9
Labor force 2001 83.2
Employment 2001 84.7
Unemployment 2001 82.6
Wages 2001 75.0
Status of womenIndicator Year Value
Life expectancy at birth (years) 2001 77.6
Average age at first marriage (years) 2001 23.8
Maternal mortality rate (per 100,000 live births) 2001 15.6
Secondary enrolment ratio of women (%) 2000 83.5
Upper secondary full-time study graduates (as % of females ofnormal graduate age)
2000 74.6
University enrolment ratio of women (%) 2000 22.4
University full-time enrolment ratio of women (%) 2000 18.6
University natural and applied science full-time education (as % offemales of normal graduate age)
2000 49.5
Women in labor force (as % of total labor force) 2001 45.4
Administrators and managers (% females) 2000 31 a
Parliament (% of seats occupied by women) b 2001 19.3
Note: a. Source: UNDP: Human Development Report 2002. New York (2002). b. Data represents 29 female MPs(September 2002 parliamentary elections).
Demographic profile IPopulation as of
December 311960 1998 1999 2000 2001 a
TotalWomenMen
4,018,4052,052,1261,966,279
5,393,3822,769,6902,623,692
5,398,6572,773,5312,625,126
5,402,5472,776,4862,626,061
5,379,4552,766,9402,612,515
Source: a. Data from the Population and housing census, May 2001.
Demographic profile IIIndicator 1960 - 1996 1960 - 1999 2000 2001
Annual population growth (%) 0.96 0.88 0.07 0.00
Source: a. Expert estimate of the Statistical Office of the SR.
Demographic profile IIIIndicator 2001
Dependency ratio (ratio of pre-productive and post-productive populationsto productive population, in %)
58.45
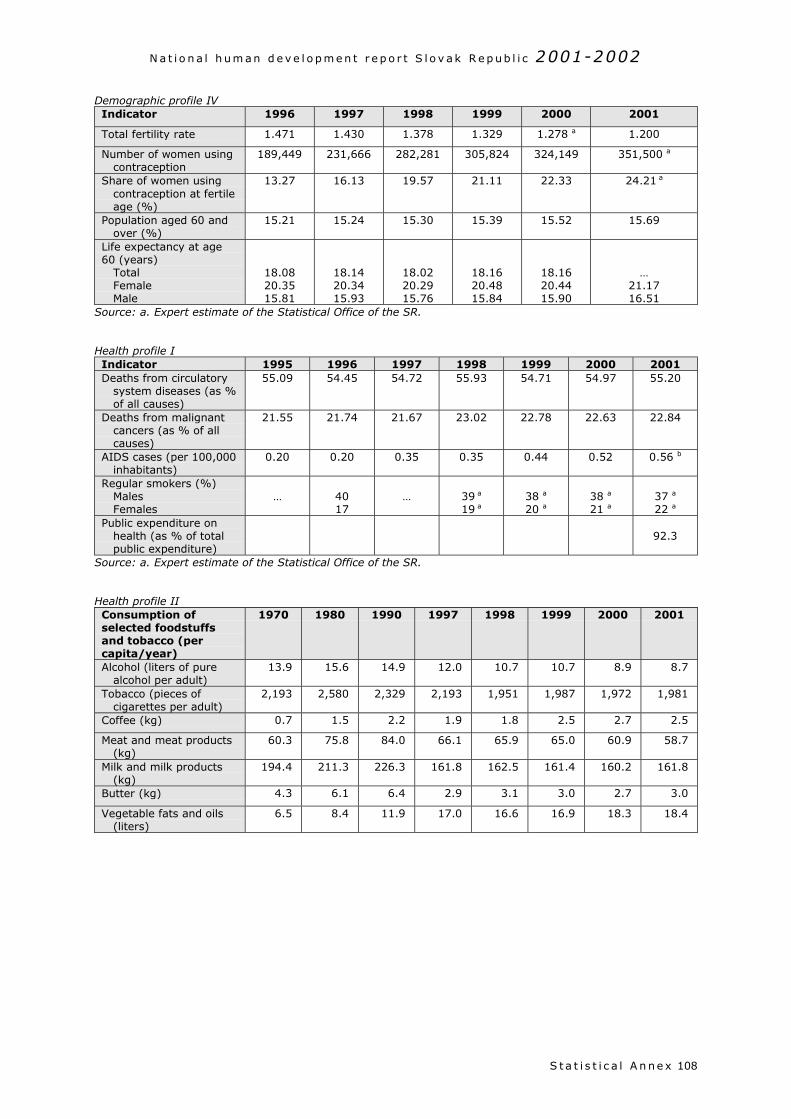
N a t i o n a l h um an d e v e l o p m e n t r e p o r t S l o v a k R e p ub l i c 2001-2002
S t a t i s t i c a l A n ne x 108
Demographic profile IVIndicator 1996 1997 1998 1999 2000 2001
Total fertility rate 1.471 1.430 1.378 1.329 1.278 a 1.200
Number of women usingcontraception
189,449 231,666 282,281 305,824 324,149 351,500 a
Share of women usingcontraception at fertileage (%)
13.27 16.13 19.57 21.11 22.33 24.21 a
Population aged 60 andover (%)
15.21 15.24 15.30 15.39 15.52 15.69
Life expectancy at age60 (years)
TotalFemaleMale
18.0820.3515.81
18.1420.3415.93
18.0220.2915.76
18.1620.4815.84
18.1620.4415.90
…21.1716.51
Source: a. Expert estimate of the Statistical Office of the SR.
Health profile IIndicator 1995 1996 1997 1998 1999 2000 2001Deaths from circulatory
system diseases (as %of all causes)
55.09 54.45 54.72 55.93 54.71 54.97 55.20
Deaths from malignantcancers (as % of allcauses)
21.55 21.74 21.67 23.02 22.78 22.63 22.84
AIDS cases (per 100,000inhabitants)
0.20 0.20 0.35 0.35 0.44 0.52 0.56 b
Regular smokers (%)MalesFemales
… 4017
… 39 a
19 a38 a
20 a38 a
21 a37 a
22 a
Public expenditure onhealth (as % of totalpublic expenditure)
92.3
Source: a. Expert estimate of the Statistical Office of the SR.
Health profile IIConsumption ofselected foodstuffsand tobacco (percapita/year)
1970 1980 1990 1997 1998 1999 2000 2001
Alcohol (liters of purealcohol per adult)
13.9 15.6 14.9 12.0 10.7 10.7 8.9 8.7
Tobacco (pieces ofcigarettes per adult)
2,193 2,580 2,329 2,193 1,951 1,987 1,972 1,981
Coffee (kg) 0.7 1.5 2.2 1.9 1.8 2.5 2.7 2.5
Meat and meat products(kg)
60.3 75.8 84.0 66.1 65.9 65.0 60.9 58.7
Milk and milk products(kg)
194.4 211.3 226.3 161.8 162.5 161.4 160.2 161.8
Butter (kg) 4.3 6.1 6.4 2.9 3.1 3.0 2.7 3.0
Vegetable fats and oils(liters)
6.5 8.4 11.9 17.0 16.6 16.9 18.3 18.4
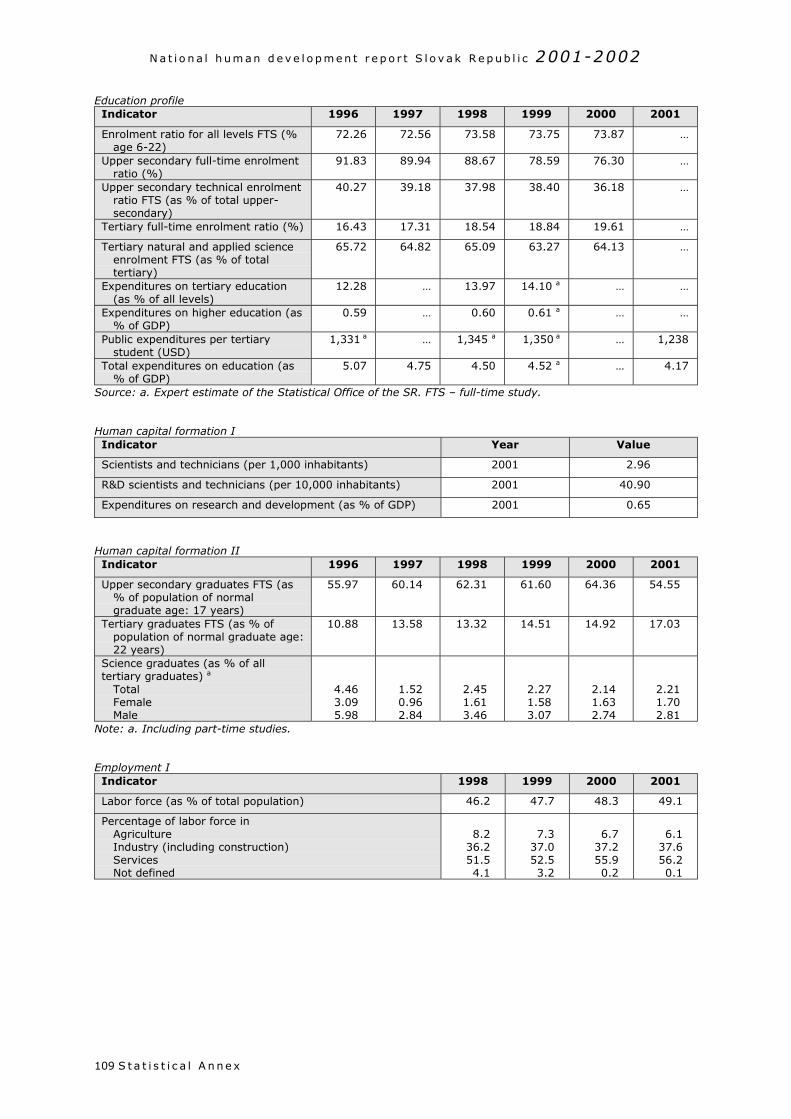
N a t i o n a l h um an d e v e l o p m e n t r e p o r t S l o v a k R e p ub l i c 2001-2002
S t a t i s t i c a l A n ne x109
Education profileIndicator 1996 1997 1998 1999 2000 2001
Enrolment ratio for all levels FTS (%age 6-22)
72.26 72.56 73.58 73.75 73.87 …
Upper secondary full-time enrolmentratio (%)
91.83 89.94 88.67 78.59 76.30 …
Upper secondary technical enrolmentratio FTS (as % of total upper-secondary)
40.27 39.18 37.98 38.40 36.18 …
Tertiary full-time enrolment ratio (%) 16.43 17.31 18.54 18.84 19.61 …
Tertiary natural and applied scienceenrolment FTS (as % of totaltertiary)
65.72 64.82 65.09 63.27 64.13 …
Expenditures on tertiary education(as % of all levels)
12.28 … 13.97 14.10 a … …
Expenditures on higher education (as% of GDP)
0.59 … 0.60 0.61 a … …
Public expenditures per tertiarystudent (USD)
1,331 a … 1,345 a 1,350 a … 1,238
Total expenditures on education (as% of GDP)
5.07 4.75 4.50 4.52 a … 4.17
Source: a. Expert estimate of the Statistical Office of the SR. FTS – full-time study.
Human capital formation IIndicator Year Value
Scientists and technicians (per 1,000 inhabitants) 2001 2.96
R&D scientists and technicians (per 10,000 inhabitants) 2001 40.90
Expenditures on research and development (as % of GDP) 2001 0.65
Human capital formation IIIndicator 1996 1997 1998 1999 2000 2001
Upper secondary graduates FTS (as% of population of normalgraduate age: 17 years)
55.97 60.14 62.31 61.60 64.36 54.55
Tertiary graduates FTS (as % ofpopulation of normal graduate age:22 years)
10.88 13.58 13.32 14.51 14.92 17.03
Science graduates (as % of alltertiary graduates) a
TotalFemaleMale
4.463.095.98
1.520.962.84
2.451.613.46
2.271.583.07
2.141.632.74
2.211.702.81
Note: a. Including part-time studies.
Employment IIndicator 1998 1999 2000 2001
Labor force (as % of total population) 46.2 47.7 48.3 49.1
Percentage of labor force inAgricultureIndustry (including construction)ServicesNot defined
8.236.251.54.1
7.337.052.53.2
6.737.255.90.2
6.137.656.20.1
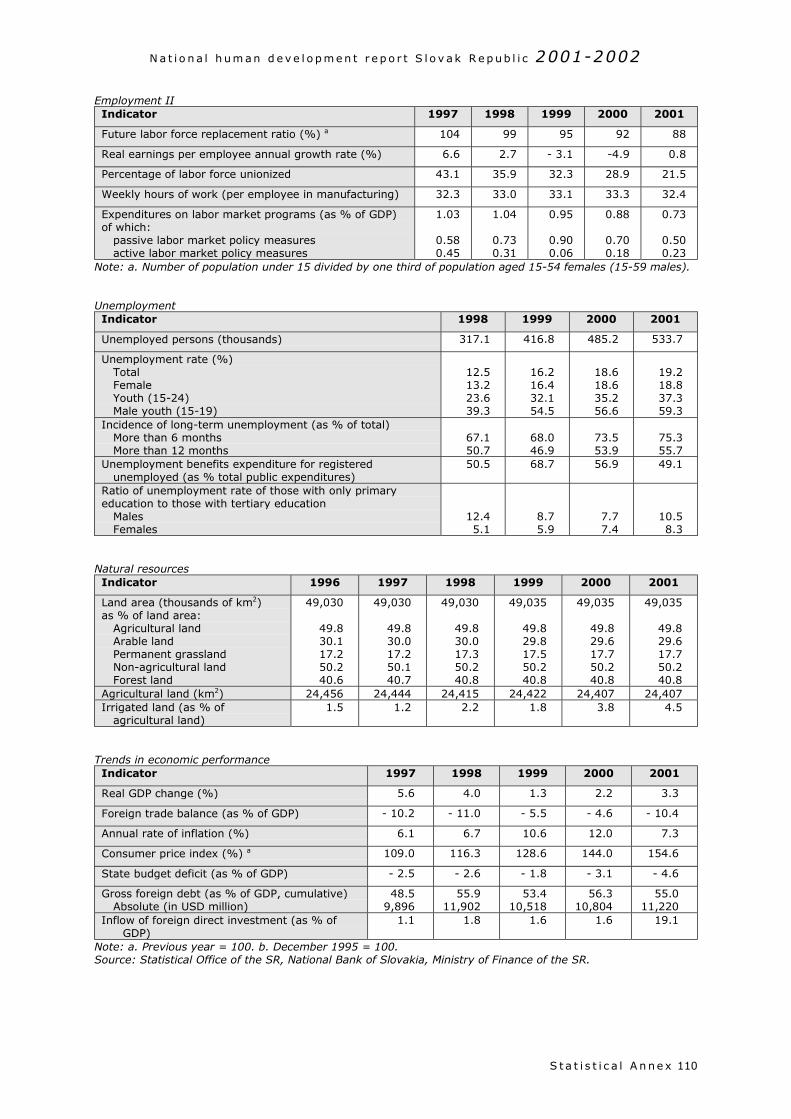
N a t i o n a l h um an d e v e l o p m e n t r e p o r t S l o v a k R e p ub l i c 2001-2002
S t a t i s t i c a l A n ne x 110
Employment IIIndicator 1997 1998 1999 2000 2001
Future labor force replacement ratio (%) a 104 99 95 92 88
Real earnings per employee annual growth rate (%) 6.6 2.7 - 3.1 -4.9 0.8
Percentage of labor force unionized 43.1 35.9 32.3 28.9 21.5
Weekly hours of work (per employee in manufacturing) 32.3 33.0 33.1 33.3 32.4
Expenditures on labor market programs (as % of GDP)of which:
passive labor market policy measuresactive labor market policy measures
1.03
0.580.45
1.04
0.730.31
0.95
0.900.06
0.88
0.700.18
0.73
0.500.23
Note: a. Number of population under 15 divided by one third of population aged 15-54 females (15-59 males).
UnemploymentIndicator 1998 1999 2000 2001
Unemployed persons (thousands) 317.1 416.8 485.2 533.7
Unemployment rate (%)TotalFemaleYouth (15-24)Male youth (15-19)
12.513.223.639.3
16.216.432.154.5
18.618.635.256.6
19.218.837.359.3
Incidence of long-term unemployment (as % of total)More than 6 monthsMore than 12 months
67.150.7
68.046.9
73.553.9
75.355.7
Unemployment benefits expenditure for registeredunemployed (as % total public expenditures)
50.5 68.7 56.9 49.1
Ratio of unemployment rate of those with only primaryeducation to those with tertiary education
MalesFemales
12.45.1
8.75.9
7.77.4
10.58.3
Natural resourcesIndicator 1996 1997 1998 1999 2000 2001
Land area (thousands of km2)as % of land area:
Agricultural landArable landPermanent grasslandNon-agricultural landForest land
49,030
49.830.117.250.240.6
49,030
49.830.017.250.140.7
49,030
49.830.017.350.240.8
49,035
49.829.817.550.240.8
49,035
49.829.617.750.240.8
49,035
49.829.617.750.240.8
Agricultural land (km2) 24,456 24,444 24,415 24,422 24,407 24,407Irrigated land (as % of
agricultural land)1.5 1.2 2.2 1.8 3.8 4.5
Trends in economic performanceIndicator 1997 1998 1999 2000 2001
Real GDP change (%) 5.6 4.0 1.3 2.2 3.3
Foreign trade balance (as % of GDP) - 10.2 - 11.0 - 5.5 - 4.6 - 10.4
Annual rate of inflation (%) 6.1 6.7 10.6 12.0 7.3
Consumer price index (%) a 109.0 116.3 128.6 144.0 154.6
State budget deficit (as % of GDP) - 2.5 - 2.6 - 1.8 - 3.1 - 4.6
Gross foreign debt (as % of GDP, cumulative)Absolute (in USD million)
48.59,896
55.911,902
53.410,518
56.310,804
55.011,220
Inflow of foreign direct investment (as % ofGDP)
1.1 1.8 1.6 1.6 19.1
Note: a. Previous year = 100. b. December 1995 = 100.Source: Statistical Office of the SR, National Bank of Slovakia, Ministry of Finance of the SR.
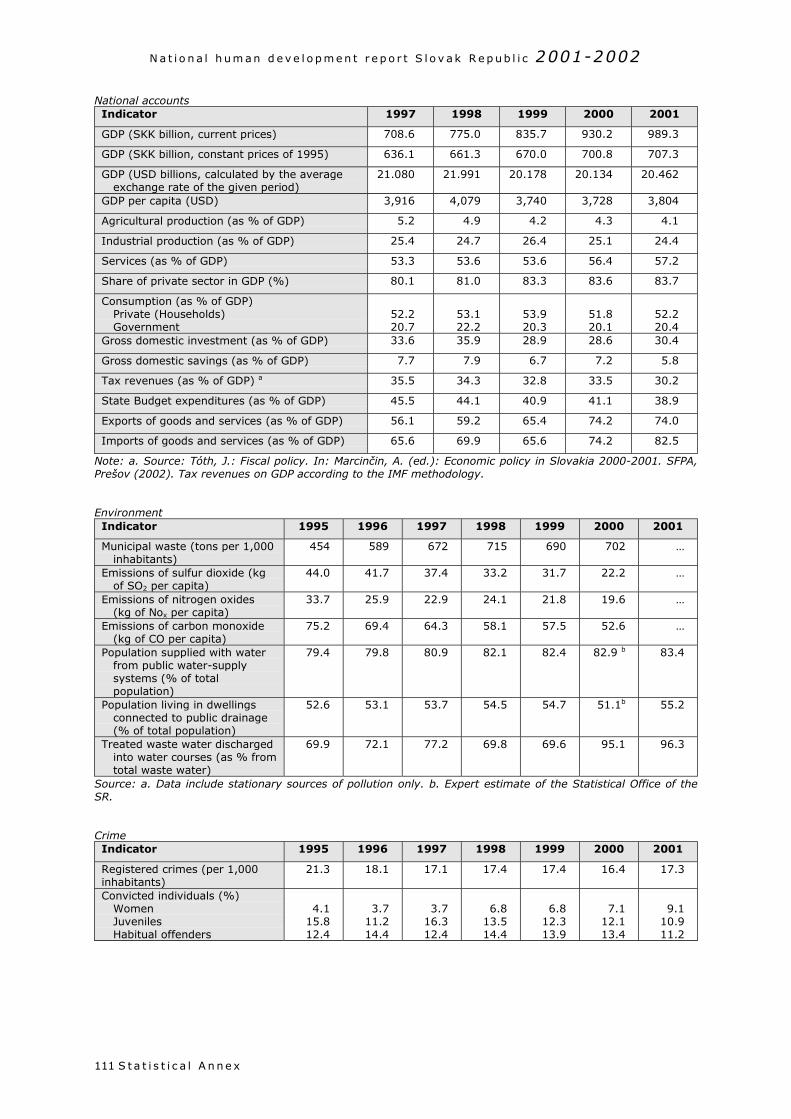
N a t i o n a l h um an d e v e l o p m e n t r e p o r t S l o v a k R e p ub l i c 2001-2002
S t a t i s t i c a l A n ne x111
National accountsIndicator 1997 1998 1999 2000 2001
GDP (SKK billion, current prices) 708.6 775.0 835.7 930.2 989.3
GDP (SKK billion, constant prices of 1995) 636.1 661.3 670.0 700.8 707.3
GDP (USD billions, calculated by the averageexchange rate of the given period)
21.080 21.991 20.178 20.134 20.462
GDP per capita (USD) 3,916 4,079 3,740 3,728 3,804
Agricultural production (as % of GDP) 5.2 4.9 4.2 4.3 4.1
Industrial production (as % of GDP) 25.4 24.7 26.4 25.1 24.4
Services (as % of GDP) 53.3 53.6 53.6 56.4 57.2
Share of private sector in GDP (%) 80.1 81.0 83.3 83.6 83.7
Consumption (as % of GDP)Private (Households)Government
52.220.7
53.122.2
53.920.3
51.820.1
52.220.4
Gross domestic investment (as % of GDP) 33.6 35.9 28.9 28.6 30.4
Gross domestic savings (as % of GDP) 7.7 7.9 6.7 7.2 5.8
Tax revenues (as % of GDP) a 35.5 34.3 32.8 33.5 30.2
State Budget expenditures (as % of GDP) 45.5 44.1 40.9 41.1 38.9
Exports of goods and services (as % of GDP) 56.1 59.2 65.4 74.2 74.0
Imports of goods and services (as % of GDP) 65.6 69.9 65.6 74.2 82.5
Note: a. Source: Tóth, J.: Fiscal policy. In: Marcinčin, A. (ed.): Economic policy in Slovakia 2000-2001. SFPA,Prešov (2002). Tax revenues on GDP according to the IMF methodology.
EnvironmentIndicator 1995 1996 1997 1998 1999 2000 2001
Municipal waste (tons per 1,000inhabitants)
454 589 672 715 690 702 …
Emissions of sulfur dioxide (kgof SO2 per capita)
44.0 41.7 37.4 33.2 31.7 22.2 …
Emissions of nitrogen oxides(kg of Nox per capita)
33.7 25.9 22.9 24.1 21.8 19.6 …
Emissions of carbon monoxide(kg of CO per capita)
75.2 69.4 64.3 58.1 57.5 52.6 …
Population supplied with waterfrom public water-supplysystems (% of totalpopulation)
79.4 79.8 80.9 82.1 82.4 82.9 b 83.4
Population living in dwellingsconnected to public drainage(% of total population)
52.6 53.1 53.7 54.5 54.7 51.1b 55.2
Treated waste water dischargedinto water courses (as % fromtotal waste water)
69.9 72.1 77.2 69.8 69.6 95.1 96.3
Source: a. Data include stationary sources of pollution only. b. Expert estimate of the Statistical Office of theSR.
CrimeIndicator 1995 1996 1997 1998 1999 2000 2001
Registered crimes (per 1,000inhabitants)
21.3 18.1 17.1 17.4 17.4 16.4 17.3
Convicted individuals (%)WomenJuvenilesHabitual offenders
4.115.812.4
3.711.214.4
3.716.312.4
6.813.514.4
6.812.313.9
7.112.113.4
9.110.911.2
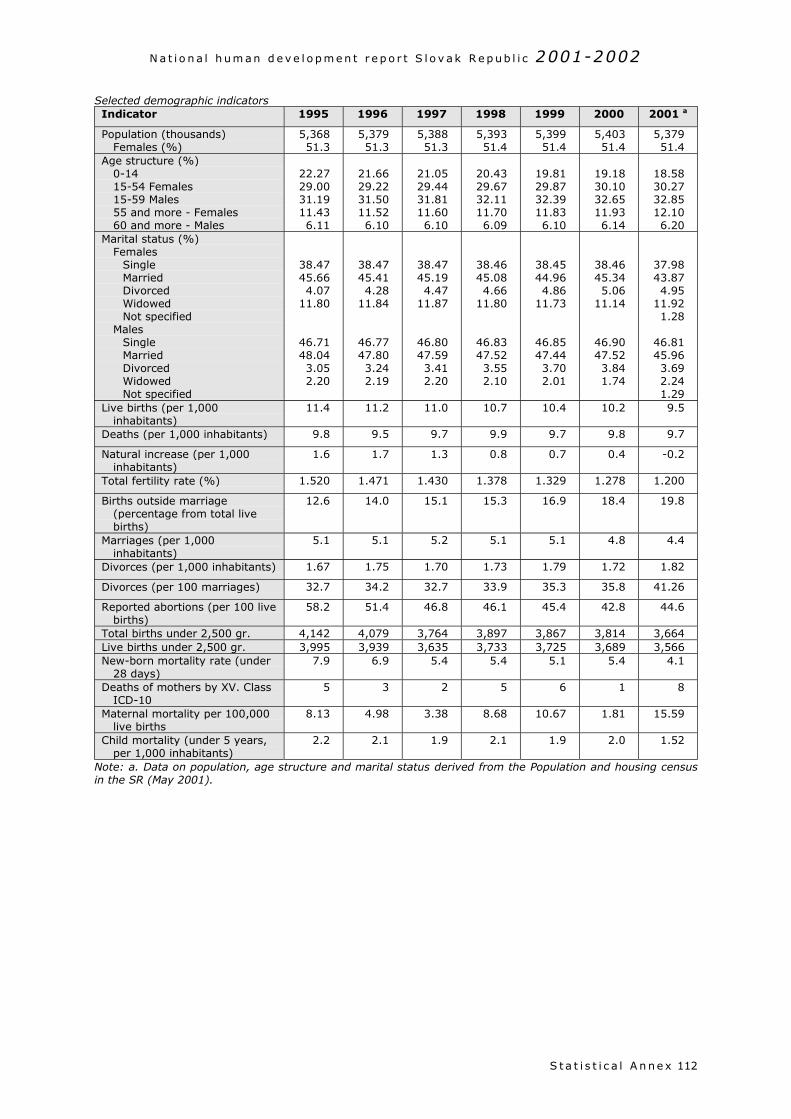
N a t i o n a l h um an d e v e l o p m e n t r e p o r t S l o v a k R e p ub l i c 2001-2002
S t a t i s t i c a l A n ne x 112
Selected demographic indicatorsIndicator 1995 1996 1997 1998 1999 2000 2001 a
Population (thousands)Females (%)
5,36851.3
5,37951.3
5,38851.3
5,39351.4
5,39951.4
5,40351.4
5,37951.4
Age structure (%)0-1415-54 Females15-59 Males55 and more - Females60 and more - Males
22.2729.0031.1911.436.11
21.6629.2231.5011.526.10
21.0529.4431.8111.606.10
20.4329.6732.1111.706.09
19.8129.8732.3911.836.10
19.1830.1032.6511.936.14
18.5830.2732.8512.106.20
Marital status (%)Females
SingleMarriedDivorcedWidowedNot specified
MalesSingleMarriedDivorcedWidowedNot specified
38.4745.664.07
11.80
46.7148.043.052.20
38.4745.414.28
11.84
46.7747.803.242.19
38.4745.194.47
11.87
46.8047.593.412.20
38.4645.084.66
11.80
46.8347.523.552.10
38.4544.964.86
11.73
46.8547.443.702.01
38.4645.345.06
11.14
46.9047.523.841.74
37.9843.874.95
11.921.28
46.8145.963.692.241.29
Live births (per 1,000inhabitants)
11.4 11.2 11.0 10.7 10.4 10.2 9.5
Deaths (per 1,000 inhabitants) 9.8 9.5 9.7 9.9 9.7 9.8 9.7
Natural increase (per 1,000inhabitants)
1.6 1.7 1.3 0.8 0.7 0.4 -0.2
Total fertility rate (%) 1.520 1.471 1.430 1.378 1.329 1.278 1.200
Births outside marriage(percentage from total livebirths)
12.6 14.0 15.1 15.3 16.9 18.4 19.8
Marriages (per 1,000inhabitants)
5.1 5.1 5.2 5.1 5.1 4.8 4.4
Divorces (per 1,000 inhabitants) 1.67 1.75 1.70 1.73 1.79 1.72 1.82
Divorces (per 100 marriages) 32.7 34.2 32.7 33.9 35.3 35.8 41.26
Reported abortions (per 100 livebirths)
58.2 51.4 46.8 46.1 45.4 42.8 44.6
Total births under 2,500 gr. 4,142 4,079 3,764 3,897 3,867 3,814 3,664Live births under 2,500 gr. 3,995 3,939 3,635 3,733 3,725 3,689 3,566New-born mortality rate (under
28 days)7.9 6.9 5.4 5.4 5.1 5.4 4.1
Deaths of mothers by XV. ClassICD-10
5 3 2 5 6 1 8
Maternal mortality per 100,000live births
8.13 4.98 3.38 8.68 10.67 1.81 15.59
Child mortality (under 5 years,per 1,000 inhabitants)
2.2 2.1 1.9 2.1 1.9 2.0 1.52
Note: a. Data on population, age structure and marital status derived from the Population and housing censusin the SR (May 2001).
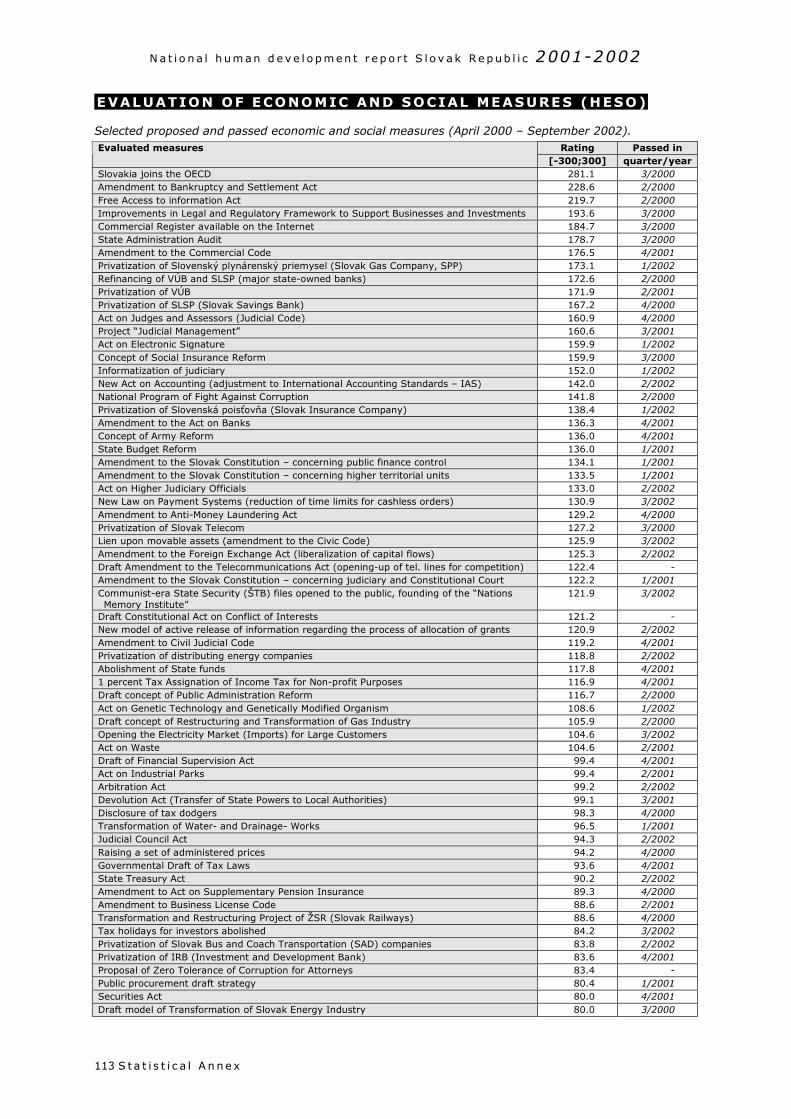
N a t i o n a l h um an d e v e l o p m e n t r e p o r t S l o v a k R e p ub l i c 2001-2002
S t a t i s t i c a l A n ne x113
EVALUATION OF ECONOMIC AND SOCIAL MEASURES (HESO)
Selected proposed and passed economic and social measures (April 2000 – September 2002).Rating Passed inEvaluated measures
[-300;300] quarter/yearSlovakia joins the OECD 281.1 3/2000Amendment to Bankruptcy and Settlement Act 228.6 2/2000Free Access to information Act 219.7 2/2000Improvements in Legal and Regulatory Framework to Support Businesses and Investments 193.6 3/2000Commercial Register available on the Internet 184.7 3/2000State Administration Audit 178.7 3/2000Amendment to the Commercial Code 176.5 4/2001Privatization of Slovenský plynárenský priemysel (Slovak Gas Company, SPP) 173.1 1/2002Refinancing of VÚB and SLSP (major state-owned banks) 172.6 2/2000Privatization of VÚB 171.9 2/2001Privatization of SLSP (Slovak Savings Bank) 167.2 4/2000Act on Judges and Assessors (Judicial Code) 160.9 4/2000Project “Judicial Management” 160.6 3/2001Act on Electronic Signature 159.9 1/2002Concept of Social Insurance Reform 159.9 3/2000Informatization of judiciary 152.0 1/2002New Act on Accounting (adjustment to International Accounting Standards – IAS) 142.0 2/2002National Program of Fight Against Corruption 141.8 2/2000Privatization of Slovenská poisťovňa (Slovak Insurance Company) 138.4 1/2002Amendment to the Act on Banks 136.3 4/2001Concept of Army Reform 136.0 4/2001State Budget Reform 136.0 1/2001Amendment to the Slovak Constitution – concerning public finance control 134.1 1/2001Amendment to the Slovak Constitution – concerning higher territorial units 133.5 1/2001Act on Higher Judiciary Officials 133.0 2/2002New Law on Payment Systems (reduction of time limits for cashless orders) 130.9 3/2002Amendment to Anti-Money Laundering Act 129.2 4/2000Privatization of Slovak Telecom 127.2 3/2000Lien upon movable assets (amendment to the Civic Code) 125.9 3/2002Amendment to the Foreign Exchange Act (liberalization of capital flows) 125.3 2/2002Draft Amendment to the Telecommunications Act (opening-up of tel. lines for competition) 122.4 -Amendment to the Slovak Constitution – concerning judiciary and Constitutional Court 122.2 1/2001Communist-era State Security (ŠTB) files opened to the public, founding of the “NationsMemory Institute”
121.9 3/2002
Draft Constitutional Act on Conflict of Interests 121.2 -New model of active release of information regarding the process of allocation of grants 120.9 2/2002Amendment to Civil Judicial Code 119.2 4/2001Privatization of distributing energy companies 118.8 2/2002Abolishment of State funds 117.8 4/20011 percent Tax Assignation of Income Tax for Non-profit Purposes 116.9 4/2001Draft concept of Public Administration Reform 116.7 2/2000Act on Genetic Technology and Genetically Modified Organism 108.6 1/2002Draft concept of Restructuring and Transformation of Gas Industry 105.9 2/2000Opening the Electricity Market (Imports) for Large Customers 104.6 3/2002Act on Waste 104.6 2/2001Draft of Financial Supervision Act 99.4 4/2001Act on Industrial Parks 99.4 2/2001Arbitration Act 99.2 2/2002Devolution Act (Transfer of State Powers to Local Authorities) 99.1 3/2001Disclosure of tax dodgers 98.3 4/2000Transformation of Water- and Drainage- Works 96.5 1/2001Judicial Council Act 94.3 2/2002Raising a set of administered prices 94.2 4/2000Governmental Draft of Tax Laws 93.6 4/2001State Treasury Act 90.2 2/2002Amendment to Act on Supplementary Pension Insurance 89.3 4/2000Amendment to Business License Code 88.6 2/2001Transformation and Restructuring Project of ŽSR (Slovak Railways) 88.6 4/2000Tax holidays for investors abolished 84.2 3/2002Privatization of Slovak Bus and Coach Transportation (SAD) companies 83.8 2/2002Privatization of IRB (Investment and Development Bank) 83.6 4/2001Proposal of Zero Tolerance of Corruption for Attorneys 83.4 -Public procurement draft strategy 80.4 1/2001Securities Act 80.0 4/2001Draft model of Transformation of Slovak Energy Industry 80.0 3/2000
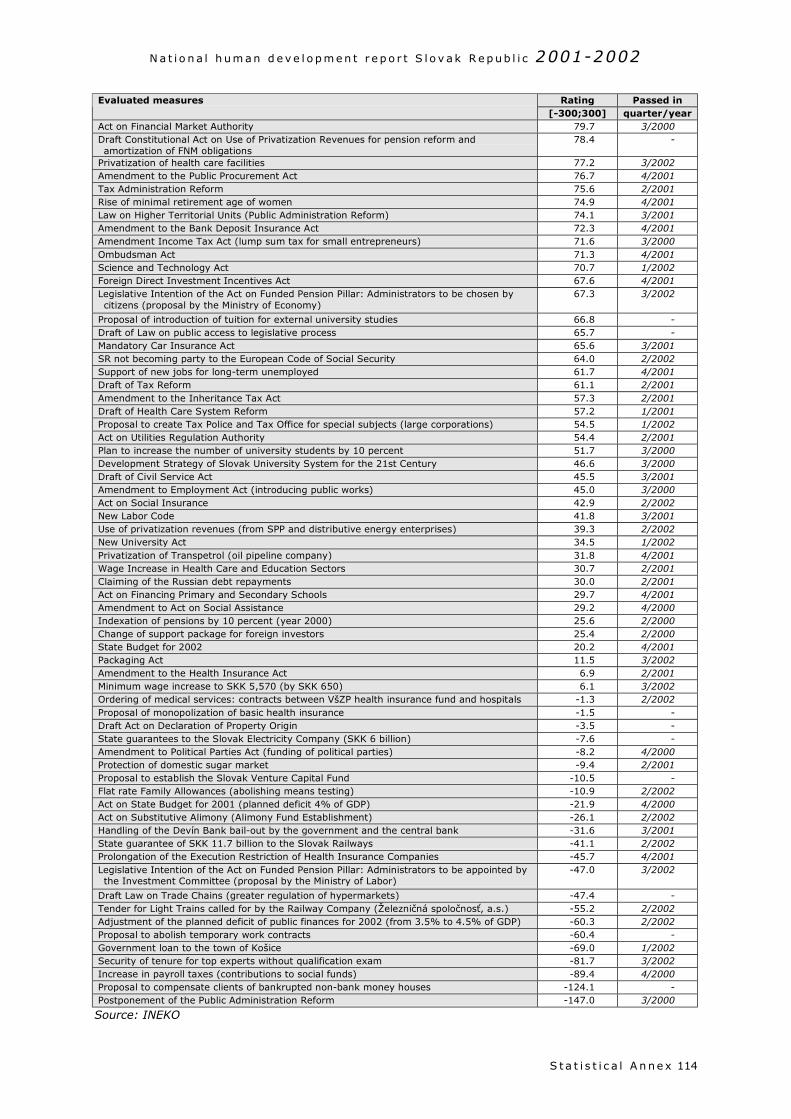
N a t i o n a l h um an d e v e l o p m e n t r e p o r t S l o v a k R e p ub l i c 2001-2002
S t a t i s t i c a l A n ne x 114
Rating Passed inEvaluated measures[-300;300] quarter/year
Act on Financial Market Authority 79.7 3/2000Draft Constitutional Act on Use of Privatization Revenues for pension reform andamortization of FNM obligations
78.4 -
Privatization of health care facilities 77.2 3/2002Amendment to the Public Procurement Act 76.7 4/2001Tax Administration Reform 75.6 2/2001Rise of minimal retirement age of women 74.9 4/2001Law on Higher Territorial Units (Public Administration Reform) 74.1 3/2001Amendment to the Bank Deposit Insurance Act 72.3 4/2001Amendment Income Tax Act (lump sum tax for small entrepreneurs) 71.6 3/2000Ombudsman Act 71.3 4/2001Science and Technology Act 70.7 1/2002Foreign Direct Investment Incentives Act 67.6 4/2001Legislative Intention of the Act on Funded Pension Pillar: Administrators to be chosen bycitizens (proposal by the Ministry of Economy)
67.3 3/2002
Proposal of introduction of tuition for external university studies 66.8 -Draft of Law on public access to legislative process 65.7 -Mandatory Car Insurance Act 65.6 3/2001SR not becoming party to the European Code of Social Security 64.0 2/2002Support of new jobs for long-term unemployed 61.7 4/2001Draft of Tax Reform 61.1 2/2001Amendment to the Inheritance Tax Act 57.3 2/2001Draft of Health Care System Reform 57.2 1/2001Proposal to create Tax Police and Tax Office for special subjects (large corporations) 54.5 1/2002Act on Utilities Regulation Authority 54.4 2/2001Plan to increase the number of university students by 10 percent 51.7 3/2000Development Strategy of Slovak University System for the 21st Century 46.6 3/2000Draft of Civil Service Act 45.5 3/2001Amendment to Employment Act (introducing public works) 45.0 3/2000Act on Social Insurance 42.9 2/2002New Labor Code 41.8 3/2001Use of privatization revenues (from SPP and distributive energy enterprises) 39.3 2/2002New University Act 34.5 1/2002Privatization of Transpetrol (oil pipeline company) 31.8 4/2001Wage Increase in Health Care and Education Sectors 30.7 2/2001Claiming of the Russian debt repayments 30.0 2/2001Act on Financing Primary and Secondary Schools 29.7 4/2001Amendment to Act on Social Assistance 29.2 4/2000Indexation of pensions by 10 percent (year 2000) 25.6 2/2000Change of support package for foreign investors 25.4 2/2000State Budget for 2002 20.2 4/2001Packaging Act 11.5 3/2002Amendment to the Health Insurance Act 6.9 2/2001Minimum wage increase to SKK 5,570 (by SKK 650) 6.1 3/2002Ordering of medical services: contracts between VšZP health insurance fund and hospitals -1.3 2/2002Proposal of monopolization of basic health insurance -1.5 -Draft Act on Declaration of Property Origin -3.5 -State guarantees to the Slovak Electricity Company (SKK 6 billion) -7.6 -Amendment to Political Parties Act (funding of political parties) -8.2 4/2000Protection of domestic sugar market -9.4 2/2001Proposal to establish the Slovak Venture Capital Fund -10.5 -Flat rate Family Allowances (abolishing means testing) -10.9 2/2002Act on State Budget for 2001 (planned deficit 4% of GDP) -21.9 4/2000Act on Substitutive Alimony (Alimony Fund Establishment) -26.1 2/2002Handling of the Devín Bank bail-out by the government and the central bank -31.6 3/2001State guarantee of SKK 11.7 billion to the Slovak Railways -41.1 2/2002Prolongation of the Execution Restriction of Health Insurance Companies -45.7 4/2001Legislative Intention of the Act on Funded Pension Pillar: Administrators to be appointed bythe Investment Committee (proposal by the Ministry of Labor)
-47.0 3/2002
Draft Law on Trade Chains (greater regulation of hypermarkets) -47.4 -Tender for Light Trains called for by the Railway Company (Železničná spoločnosť, a.s.) -55.2 2/2002Adjustment of the planned deficit of public finances for 2002 (from 3.5% to 4.5% of GDP) -60.3 2/2002Proposal to abolish temporary work contracts -60.4 -Government loan to the town of Košice -69.0 1/2002Security of tenure for top experts without qualification exam -81.7 3/2002Increase in payroll taxes (contributions to social funds) -89.4 4/2000Proposal to compensate clients of bankrupted non-bank money houses -124.1 -Postponement of the Public Administration Reform -147.0 3/2000
Source: INEKO
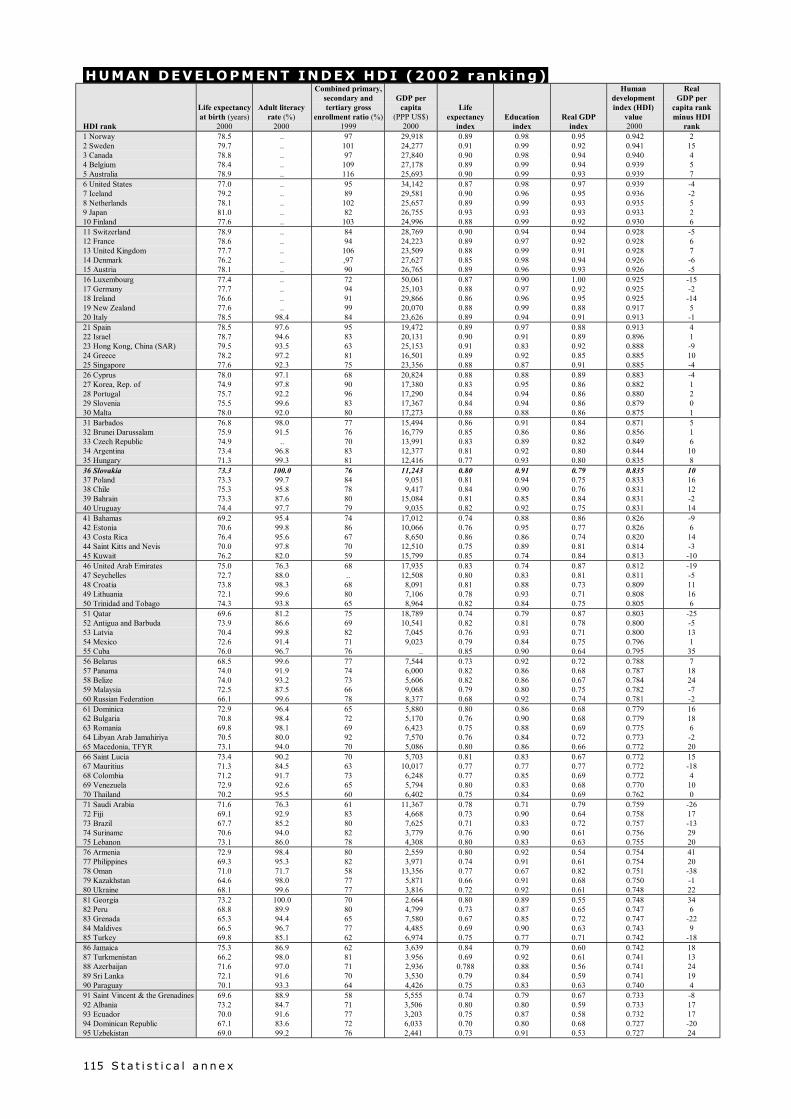
S t a t i s t i c a l a n n e x115
HUMAN DEVELOPMENT INDEX HDI (2002 rank ing)
HDI rank
Life expectancyat birth (years)
2000
Adult literacyrate (%)
2000
Combined primary,secondary andtertiary gross
enrollment ratio (%)1999
GDP percapita
(PPP US$)2000
Lifeexpectancy
indexEducation
indexReal GDP
index
Humandevelopmentindex (HDI)
value 2000
RealGDP per
capita rankminus HDI
rank1 Norway 78.5 .. 97 29,918 0.89 0.98 0.95 0.942 22 Sweden 79.7 .. 101 24,277 0.91 0.99 0.92 0.941 153 Canada 78.8 .. 97 27,840 0.90 0.98 0.94 0.940 44 Belgium 78.4 .. 109 27,178 0.89 0.99 0.94 0.939 55 Australia 78.9 .. 116 25,693 0.90 0.99 0.93 0.939 76 United States 77.0 .. 95 34,142 0.87 0.98 0.97 0.939 -47 Iceland 79.2 .. 89 29,581 0.90 0.96 0.95 0.936 -28 Netherlands 78.1 .. 102 25,657 0.89 0.99 0.93 0.935 59 Japan 81.0 .. 82 26,755 0.93 0.93 0.93 0.933 210 Finland 77.6 .. 103 24,996 0.88 0.99 0.92 0.930 611 Switzerland 78.9 .. 84 28,769 0.90 0.94 0.94 0.928 -512 France 78.6 .. 94 24,223 0.89 0.97 0.92 0.928 613 United Kingdom 77.7 .. 106 23,509 0.88 0.99 0.91 0.928 714 Denmark 76.2 .. ,97 27,627 0.85 0.98 0.94 0.926 -615 Austria 78.1 .. 90 26,765 0.89 0.96 0.93 0.926 -516 Luxembourg 77.4 .. 72 50,061 0.87 0.90 1.00 0.925 -1517 Germany 77.7 .. 94 25,103 0.88 0.97 0.92 0.925 -218 Ireland 76.6 .. 91 29,866 0.86 0.96 0.95 0.925 -1419 New Zealand 77.6 .. 99 20,070 0.88 0.99 0.88 0.917 520 Italy 78.5 98.4 84 23,626 0.89 0.94 0.91 0.913 -121 Spain 78.5 97.6 95 19,472 0.89 0.97 0.88 0.913 422 Israel 78.7 94.6 83 20,131 0.90 0.91 0.89 0.896 123 Hong Kong, China (SAR) 79.5 93.5 63 25,153 0.91 0.83 0.92 0.888 -924 Greece 78.2 97.2 81 16,501 0.89 0.92 0.85 0.885 1025 Singapore 77.6 92.3 75 23,356 0.88 0.87 0.91 0.885 -426 Cyprus 78.0 97.1 68 20,824 0.88 0.88 0.89 0.883 -427 Korea, Rep. of 74.9 97.8 90 17,380 0.83 0.95 0.86 0.882 128 Portugal 75.7 92.2 96 17,290 0.84 0.94 0.86 0.880 229 Slovenia 75.5 99.6 83 17,367 0.84 0.94 0.86 0.879 030 Malta 78.0 92.0 80 17,273 0.88 0.88 0.86 0.875 131 Barbados 76.8 98.0 77 15,494 0.86 0.91 0.84 0.871 532 Brunei Darussalam 75.9 91.5 76 16,779 0.85 0.86 0.86 0.856 133 Czech Republic 74.9 .. 70 13,991 0.83 0.89 0.82 0.849 634 Argentina 73.4 96.8 83 12,377 0.81 0.92 0.80 0.844 1035 Hungary 71.3 99.3 81 12,416 0.77 0.93 0.80 0.835 836 Slovakia 73.3 100.0 76 11,243 0.80 0.91 0.79 0.835 1037 Poland 73.3 99.7 84 9,051 0.81 0.94 0.75 0.833 1638 Chile 75.3 95.8 78 9,417 0.84 0.90 0.76 0.831 1239 Bahrain 73.3 87.6 80 15,084 0.81 0.85 0.84 0.831 -240 Uruguay 74.4 97.7 79 9,035 0.82 0.92 0.75 0.831 1441 Bahamas 69.2 95.4 74 17,012 0.74 0.88 0.86 0.826 -942 Estonia 70.6 99.8 86 10,066 0.76 0.95 0.77 0.826 643 Costa Rica 76.4 95.6 67 8,650 0.86 0.86 0.74 0.820 1444 Saint Kitts and Nevis 70.0 97.8 70 12,510 0.75 0.89 0.81 0.814 -345 Kuwait 76.2 82.0 59 15,799 0.85 0.74 0.84 0.813 -1046 United Arab Emirates 75.0 76.3 68 17,935 0.83 0.74 0.87 0.812 -1947 Seychelles 72.7 88.0 .. 12,508 0.80 0.83 0.81 0.811 -548 Croatia 73.8 98.3 68 8,091 0.81 0.88 0.73 0.809 1149 Lithuania 72.1 99.6 80 7,106 0.78 0.93 0.71 0.808 1650 Trinidad and Tobago 74.3 93.8 65 8,964 0.82 0.84 0.75 0.805 651 Qatar 69.6 81.2 75 18,789 0.74 0.79 0.87 0.803 -2552 Antigua and Barbuda 73.9 86.6 69 10,541 0.82 0.81 0.78 0.800 -553 Latvia 70.4 99.8 82 7,045 0.76 0.93 0.71 0.800 1354 Mexico 72.6 91.4 71 9,023 0.79 0.84 0.75 0.796 155 Cuba 76.0 96.7 76 .. 0.85 0.90 0.64 0.795 3556 Belarus 68.5 99.6 77 7,544 0.73 0.92 0.72 0.788 757 Panama 74.0 91.9 74 6,000 0.82 0.86 0.68 0.787 1858 Belize 74.0 93.2 73 5,606 0.82 0.86 0.67 0.784 2459 Malaysia 72.5 87.5 66 9,068 0.79 0.80 0.75 0.782 -760 Russian Federation 66.1 99.6 78 8,377 0.68 0.92 0.74 0.781 -261 Dominica 72.9 96.4 65 5,880 0.80 0.86 0.68 0.779 1662 Bulgaria 70.8 98.4 72 5,170 0.76 0.90 0.68 0.779 1863 Romania 69.8 98.1 69 6,423 0.75 0.88 0.69 0.775 664 Libyan Arab Jamahiriya 70.5 80.0 92 7,570 0.76 0.84 0.72 0.773 -265 Macedonia, TFYR 73.1 94.0 70 5,086 0.80 0.86 0.66 0.772 2066 Saint Lucia 73.4 90.2 70 5,703 0.81 0.83 0.67 0.772 1567 Mauritius 71.3 84.5 63 10,017 0.77 0.77 0.77 0.772 -1868 Colombia 71.2 91.7 73 6,248 0.77 0.85 0.69 0.772 469 Venezuela 72.9 92.6 65 5,794 0.80 0.83 0.68 0.770 1070 Thailand 70.2 95.5 60 6,402 0.75 0.84 0.69 0.762 071 Saudi Arabia 71.6 76.3 61 11,367 0.78 0.71 0.79 0.759 -2672 Fiji 69.1 92.9 83 4,668 0.73 0.90 0.64 0.758 1773 Brazil 67.7 85.2 80 7,625 0.71 0.83 0.72 0.757 -1374 Suriname 70.6 94.0 82 3,779 0.76 0.90 0.61 0.756 2975 Lebanon 73.1 86.0 78 4,308 0.80 0.83 0.63 0.755 2076 Armenia 72.9 98.4 80 2,559 0.80 0.92 0.54 0.754 4177 Philippines 69.3 95.3 82 3,971 0.74 0.91 0.61 0.754 2078 Oman 71.0 71.7 58 13,356 0.77 0.67 0.82 0.751 -3879 Kazakhstan 64.6 98.0 77 5,871 0.66 0.91 0.68 0.750 -180 Ukraine 68.1 99.6 77 3,816 0.72 0.92 0.61 0.748 2281 Georgia 73.2 100.0 70 2.664 0.80 0.89 0.55 0.748 3482 Peru 68.8 89.9 80 4,799 0.73 0.87 0.65 0.747 683 Grenada 65.3 94.4 65 7,580 0.67 0.85 0.72 0.747 -2284 Maldives 66.5 96.7 77 4,485 0.69 0.90 0.63 0.743 985 Turkey 69.8 85.1 62 6,974 0.75 0.77 0.71 0.742 -1886 Jamaica 75.3 86.9 62 3,639 0.84 0.79 0.60 0.742 1887 Turkmenistan 66.2 98.0 81 3.956 0.69 0.92 0.61 0.741 1388 Azerbaijan 71.6 97.0 71 2,936 0.788 0.88 0.56 0.741 2489 Sri Lanka 72.1 91.6 70 3,530 0.79 0.84 0.59 0.741 1990 Paraguay 70.1 93.3 64 4,426 0.75 0.83 0.63 0.740 491 Saint Vincent & the Grenadines 69.6 88.9 58 5,555 0.74 0.79 0.67 0.733 -892 Albania 73.2 84.7 71 3,506 0.80 0.80 0.59 0.733 1793 Ecuador 70.0 91.6 77 3,203 0.75 0.87 0.58 0.732 1794 Dominican Republic 67.1 83.6 72 6,033 0.70 0.80 0.68 0.727 -2095 Uzbekistan 69.0 99.2 76 2,441 0.73 0.91 0.53 0.727 24
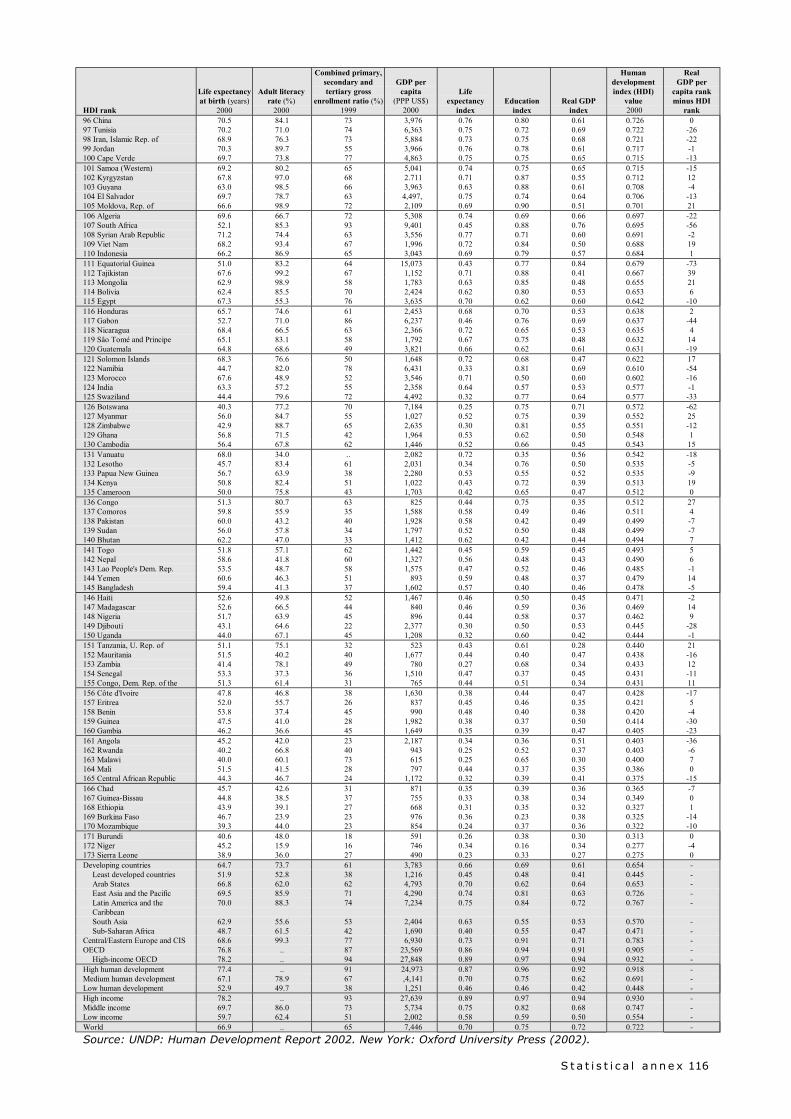
S t a t i s t i c a l a n n e x 116
HDI rank
Life expectancyat birth (years)
2000
Adult literacyrate (%)
2000
Combined primary,secondary andtertiary gross
enrollment ratio (%)1999
GDP percapita
(PPP US$)2000
Lifeexpectancy
indexEducation
indexReal GDP
index
Humandevelopmentindex (HDI)
value 2000
RealGDP per
capita rankminus HDI
rank96 China 70.5 84.1 73 3,976 0.76 0.80 0.61 0.726 097 Tunisia 70.2 71.0 74 6,363 0.75 0.72 0.69 0.722 -2698 Iran, Islamic Rep. of 68.9 76.3 73 5,884 0.73 0.75 0.68 0.721 -2299 Jordan 70.3 89.7 55 3,966 0.76 0.78 0.61 0.717 -1100 Cape Verde 69.7 73.8 77 4,863 0.75 0.75 0.65 0.715 -13101 Samoa (Western) 69.2 80.2 65 5,041 0.74 0.75 0.65 0.715 -15102 Kyrgyzstan 67.8 97.0 68 2.711 0.71 0.87 0.55 0.712 12103 Guyana 63.0 98.5 66 3,963 0.63 0.88 0.61 0.708 -4104 El Salvador 69.7 78.7 63 4,497, 0.75 0.74 0.64 0.706 -13105 Moldova, Rep. of 66.6 98.9 72 2,109 0.69 0.90 0.51 0.701 21106 Algeria 69.6 66.7 72 5,308 0.74 0.69 0.66 0.697 -22107 South Africa 52.1 85.3 93 9,401 0.45 0.88 0.76 0.695 -56108 Syrian Arab Republic 71.2 74.4 63 3,556 0.77 0.71 0.60 0.691 -2109 Viet Nam 68.2 93.4 67 1,996 0.72 0.84 0.50 0.688 19110 Indonesia 66.2 86.9 65 3,043 0.69 0.79 0.57 0.684 1111 Equatorial Guinea 51.0 83.2 64 15,073 0.43 0.77 0.84 0.679 -73112 Tajikistan 67.6 99.2 67 1,152 0.71 0.88 0.41 0.667 39113 Mongolia 62.9 98.9 58 1,783 0.63 0.85 0.48 0.655 21114 Bolivia 62.4 85.5 70 2,424 0.62 0.80 0.53 0.653 6115 Egypt 67.3 55.3 76 3,635 0.70 0.62 0.60 0.642 -10116 Honduras 65.7 74.6 61 2,453 0.68 0.70 0.53 0.638 2117 Gabon 52.7 71.0 86 6,237 0.46 0.76 0.69 0.637 -44118 Nicaragua 68.4 66.5 63 2,366 0.72 0.65 0.53 0.635 4119 Sâo Tomé and Principe 65.1 83.1 58 1,792 0.67 0.75 0.48 0.632 14120 Guatemala 64.8 68.6 49 3,821 0.66 0.62 0.61 0.631 -19121 Solomon Islands 68.3 76.6 50 1,648 0.72 0.68 0.47 0.622 17122 Namibia 44.7 82.0 78 6,431 0.33 0.81 0.69 0.610 -54123 Morocco 67.6 48.9 52 3,546 0.71 0.50 0.60 0.602 -16124 India 63.3 57.2 55 2,358 0.64 0.57 0.53 0.577 -1125 Swaziland 44.4 79.6 72 4,492 0.32 0.77 0.64 0.577 -33126 Botswana 40.3 77.2 70 7,184 0.25 0.75 0.71 0.572 -62127 Myanmar 56.0 84.7 55 1,027 0.52 0.75 0.39 0.552 25128 Zimbabwe 42.9 88.7 65 2,635 0.30 0.81 0.55 0.551 -12129 Ghana 56.8 71.5 42 1,964 0.53 0.62 0.50 0.548 1130 Cambodia 56.4 67.8 62 1,446 0.52 0.66 0.45 0.543 15131 Vanuatu 68.0 34.0 .. 2,082 0.72 0.35 0.56 0.542 -18132 Lesotho 45.7 83.4 61 2,031 0.34 0.76 0.50 0.535 -5133 Papua New Guinea 56.7 63.9 38 2,280 0.53 0.55 0.52 0.535 -9134 Kenya 50.8 82.4 51 1,022 0.43 0.72 0.39 0.513 19135 Cameroon 50.0 75.8 43 1,703 0.42 0.65 0.47 0.512 0136 Congo 51.3 80.7 63 825 0.44 0.75 0.35 0.512 27137 Comoros 59.8 55.9 35 1,588 0.58 0.49 0.46 0.511 4138 Pakistan 60.0 43.2 40 1,928 0.58 0.42 0.49 0.499 -7139 Sudan 56.0 57.8 34 1,797 0.52 0.50 0.48 0.499 -7140 Bhutan 62.2 47.0 33 1,412 0.62 0.42 0.44 0.494 7141 Togo 51.8 57.1 62 1,442 0.45 0.59 0.45 0.493 5142 Nepal 58.6 41.8 60 1,327 0.56 0.48 0.43 0.490 6143 Lao People's Dem. Rep. 53.5 48.7 58 1,575 0.47 0.52 0.46 0.485 -1144 Yemen 60.6 46.3 51 893 0.59 0.48 0.37 0.479 14145 Bangladesh 59.4 41.3 37 1,602 0.57 0.40 0.46 0.478 -5146 Haiti 52.6 49.8 52 1,467 0.46 0.50 0.45 0.471 -2147 Madagascar 52.6 66.5 44 840 0.46 0.59 0.36 0.469 14148 Nigeria 51.7 63.9 45 896 0.44 0.58 0.37 0.462 9149 Djibouti 43.1 64.6 22 2,377 0.30 0.50 0.53 0.445 -28150 Uganda 44.0 67.1 45 1,208 0.32 0.60 0.42 0.444 -1151 Tanzania, U. Rep. of 51.1 75.1 32 523 0.43 0.61 0.28 0.440 21152 Mauritania 51.5 40.2 40 1,677 0.44 0.40 0.47 0.438 -16153 Zambia 41.4 78.1 49 780 0.27 0.68 0.34 0.433 12154 Senegal 53.3 37.3 36 1,510 0.47 0.37 0.45 0.431 -11155 Congo, Dem. Rep. of the 51.3 61.4 31 765 0.44 0.51 0.34 0.431 11156 Côte d'Ivoire 47.8 46.8 38 1,630 0.38 0.44 0.47 0.428 -17157 Eritrea 52.0 55.7 26 837 0.45 0.46 0.35 0.421 5158 Benin 53.8 37.4 45 990 0.48 0.40 0.38 0.420 -4159 Guinea 47.5 41.0 28 1,982 0.38 0.37 0.50 0.414 -30160 Gambia 46.2 36.6 45 1,649 0.35 0.39 0.47 0.405 -23161 Angola 45.2 42.0 23 2,187 0.34 0.36 0.51 0.403 -36162 Rwanda 40.2 66.8 40 943 0.25 0.52 0.37 0.403 -6163 Malawi 40.0 60.1 73 615 0.25 0.65 0.30 0.400 7164 Mali 51.5 41.5 28 797 0.44 0.37 0.35 0.386 0165 Central African Republic 44.3 46.7 24 1,172 0.32 0.39 0.41 0.375 -15166 Chad 45.7 42.6 31 871 0.35 0.39 0.36 0.365 -7167 Guinea-Bissau 44.8 38.5 37 755 0.33 0.38 0.34 0.349 0168 Ethiopia 43.9 39.1 27 668 0.31 0.35 0.32 0.327 1169 Burkina Faso 46.7 23.9 23 976 0.36 0.23 0.38 0.325 -14170 Mozambique 39.3 44.0 23 854 0.24 0.37 0.36 0.322 -10171 Burundi 40.6 48.0 18 591 0.26 0.38 0.30 0.313 0172 Niger 45.2 15.9 16 746 0.34 0.16 0.34 0.277 -4173 Sierra Leone 38.9 36.0 27 490 0.23 0.33 0.27 0.275 0Developing countries 64.7 73.7 61 3,783 0.66 0.69 0.61 0.654 -
Least developed countries 51.9 52.8 38 1,216 0.45 0.48 0.41 0.445 -Arab States 66.8 62.0 62 4,793 0.70 0.62 0.64 0.653 -East Asia and the Pacific 69.5 85.9 71 4,290 0.74 0.81 0.63 0.726 -Latin America and theCaribbean
70.0 88.3 74 7,234 0.75 0.84 0.72 0.767 -
South Asia 62.9 55.6 53 2,404 0.63 0.55 0.53 0.570 -Sub-Saharan Africa 48.7 61.5 42 1,690 0.40 0.55 0.47 0.471 -
Central/Eastern Europe and CIS 68.6 99.3 77 6,930 0.73 0.91 0.71 0.783 -OECD 76.8 .. 87 23,569 0.86 0.94 0.91 0.905 -
High-income OECD 78.2 .. 94 27,848 0.89 0.97 0.94 0.932 -High human development 77.4 .. 91 24,973 0.87 0.96 0.92 0.918 -Medium human development 67.1 78.9 67 ,4,141 0.70 0.75 0.62 0.691 -Low human development 52.9 49.7 38 1,251 0.46 0.46 0.42 0.448 -High income 78.2 .. 93 27,639 0.89 0.97 0.94 0.930 -Middle income 69.7 86.0 73 5,734 0.75 0.82 0.68 0.747 -Low income 59.7 62.4 51 2,002 0.58 0.59 0.50 0.554 -World 66.9 .. 65 7,446 0.70 0.75 0.72 0.722 -
Source: UNDP: Human Development Report 2002. New York: Oxford University Press (2002).
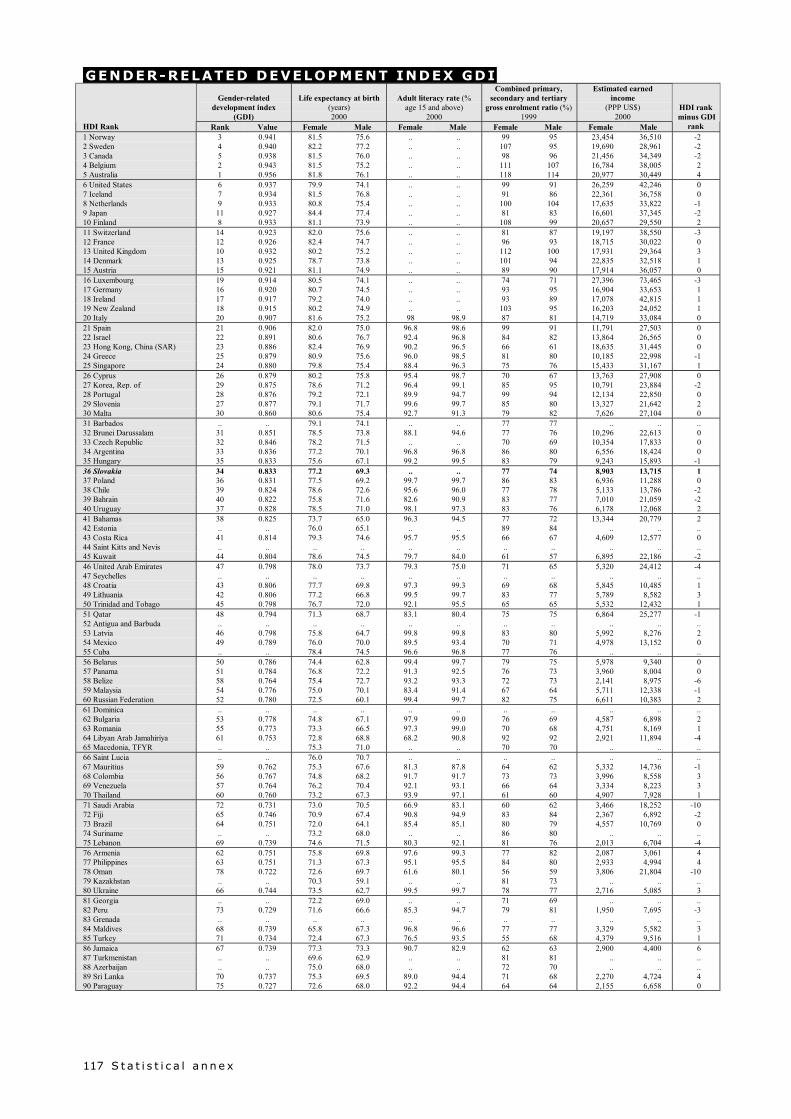
S t a t i s t i c a l a n n e x117
GENDER-RELATED DEVELOPMENT INDEX GDI
Gender-relateddevelopment index
(GDI)
Life expectancy at birth(years)2000
Adult literacy rate (%age 15 and above)
2000
Combined primary,secondary and tertiary
gross enrolment ratio (%)1999
Estimated earnedincome
(PPP US$)2000
HDI Rank Rank Value Female Male Female Male Female Male Female Male
HDI rank minus GDI
rank1 Norway 3 0.941 81.5 75.6 .. .. 99 95 23,454 36,510 -22 Sweden 4 0.940 82.2 77.2 .. .. 107 95 19,690 28,961 -23 Canada 5 0.938 81.5 76.0 .. .. 98 96 21,456 34,349 -24 Belgium 2 0.943 81.5 75.2 .. .. 111 107 16,784 38,005 25 Australia 1 0.956 81.8 76.1 .. .. 118 114 20,977 30,449 46 United States 6 0.937 79.9 74.1 .. .. 99 91 26,259 42,246 07 Iceland 7 0.934 81.5 76.8 .. .. 91 86 22,361 36,758 08 Netherlands 9 0.933 80.8 75.4 .. .. 100 104 17,635 33,822 -19 Japan 11 0.927 84.4 77.4 .. .. 81 83 16,601 37,345 -210 Finland 8 0.933 81.1 73.9 .. .. 108 99 20,657 29,550 211 Switzerland 14 0.923 82.0 75.6 .. .. 81 87 19,197 38,550 -312 France 12 0.926 82.4 74.7 .. .. 96 93 18,715 30,022 013 United Kingdom 10 0.932 80.2 75.2 .. .. 112 100 17,931 29,364 314 Denmark 13 0.925 78.7 73.8 .. .. 101 94 22,835 32,518 115 Austria 15 0.921 81.1 74.9 .. .. 89 90 17,914 36,057 016 Luxembourg 19 0.914 80.5 74.1 .. .. 74 71 27,396 73,465 -317 Germany 16 0.920 80.7 74.5 .. .. 93 95 16,904 33,653 118 Ireland 17 0.917 79.2 74.0 .. .. 93 89 17,078 42,815 119 New Zealand 18 0.915 80.2 74.9 .. .. 103 95 16,203 24,052 120 Italy 20 0.907 81.6 75.2 98 98.9 87 81 14,719 33,084 021 Spain 21 0.906 82.0 75.0 96.8 98.6 99 91 11,791 27,503 022 Israel 22 0.891 80.6 76.7 92.4 96.8 84 82 13,864 26,565 023 Hong Kong, China (SAR) 23 0.886 82.4 76.9 90.2 96.5 66 61 18,635 31,445 024 Greece 25 0.879 80.9 75.6 96.0 98.5 81 80 10,185 22,998 -125 Singapore 24 0.880 79.8 75.4 88.4 96.3 75 76 15,433 31,167 126 Cyprus 26 0.879 80.2 75.8 95.4 98.7 70 67 13,763 27,908 027 Korea, Rep. of 29 0.875 78.6 71.2 96.4 99.1 85 95 10,791 23,884 -228 Portugal 28 0.876 79.2 72.1 89.9 94.7 99 94 12,134 22,850 029 Slovenia 27 0.877 79.1 71.7 99.6 99.7 85 80 13,327 21,642 230 Malta 30 0.860 80.6 75.4 92.7 91.3 79 82 7,626 27,104 031 Barbados .. .. 79.1 74.1 .. .. 77 77 .. .. ..32 Brunei Darussalam 31 0.851 78.5 73.8 88.1 94.6 77 76 10,296 22,613 033 Czech Republic 32 0.846 78.2 71.5 .. .. 70 69 10,354 17,833 034 Argentina 33 0.836 77.2 70.1 96.8 96.8 86 80 6,556 18,424 035 Hungary 35 0.833 75.6 67.1 99.2 99.5 83 79 9,243 15,893 -136 Slovakia 34 0.833 77.2 69.3 .. .. 77 74 8,903 13,715 137 Poland 36 0.831 77.5 69.2 99.7 99.7 86 83 6,936 11,288 038 Chile 39 0.824 78.6 72.6 95.6 96.0 77 78 5,133 13,786 -239 Bahrain 40 0.822 75.8 71.6 82.6 90.9 83 77 7,010 21,059 -240 Uruguay 37 0.828 78.5 71.0 98.1 97.3 83 76 6,178 12,068 241 Bahamas 38 0.825 73.7 65.0 96.3 94.5 77 72 13,344 20,779 242 Estonia .. .. 76.0 65.1 .. .. 89 84 .. .. ..43 Costa Rica 41 0.814 79.3 74.6 95.7 95.5 66 67 4,609 12,577 044 Saint Kitts and Nevis .. .. .. .. .. .. .. .. .. .. ..45 Kuwait 44 0.804 78.6 74.5 79.7 84.0 61 57 6,895 22,186 -246 United Arab Emirates 47 0.798 78.0 73.7 79.3 75.0 71 65 5,320 24,412 -447 Seychelles .. .. .. .. .. .. .. .. .. .. ..48 Croatia 43 0.806 77.7 69.8 97.3 99.3 69 68 5,845 10,485 149 Lithuania 42 0.806 77.2 66.8 99.5 99.7 83 77 5,789 8,582 350 Trinidad and Tobago 45 0.798 76.7 72.0 92.1 95.5 65 65 5,532 12,432 151 Qatar 48 0.794 71.3 68.7 83.1 80.4 75 75 6,864 25,277 -152 Antigua and Barbuda .. .. .. .. .. .. .. .. .. .. ..53 Latvia 46 0.798 75.8 64.7 99.8 99.8 83 80 5,992 8,276 254 Mexico 49 0.789 76.0 70.0 89.5 93.4 70 71 4,978 13,152 055 Cuba .. .. 78.4 74.5 96.6 96.8 77 76 .. .. ..56 Belarus 50 0.786 74.4 62.8 99.4 99.7 79 75 5,978 9,340 057 Panama 51 0.784 76.8 72.2 91.3 92.5 76 73 3,960 8,004 058 Belize 58 0.764 75.4 72.7 93.2 93.3 72 73 2,141 8,975 -659 Malaysia 54 0.776 75.0 70.1 83.4 91.4 67 64 5,711 12,338 -160 Russian Federation 52 0.780 72.5 60.1 99.4 99.7 82 75 6,611 10,383 261 Dominica .. .. .. .. .. .. .. .. .. .. ..62 Bulgaria 53 0.778 74.8 67.1 97.9 99.0 76 69 4,587 6,898 263 Romania 55 0.773 73.3 66.5 97.3 99.0 70 68 4,751 8,169 164 Libyan Arab Jamahiriya 61 0.753 72.8 68.8 68.2 90.8 92 92 2,921 11,894 -465 Macedonia, TFYR .. .. 75.3 71.0 .. .. 70 70 .. .. ..66 Saint Lucia .. .. 76.0 70.7 .. .. .. .. .. .. ..67 Mauritius 59 0.762 75.3 67.6 81.3 87.8 64 62 5,332 14,736 -168 Colombia 56 0.767 74.8 68.2 91.7 91.7 73 73 3,996 8,558 369 Venezuela 57 0.764 76.2 70.4 92.1 93.1 66 64 3,334 8,223 370 Thailand 60 0.760 73.2 67.3 93.9 97.1 61 60 4,907 7,928 171 Saudi Arabia 72 0.731 73.0 70.5 66.9 83.1 60 62 3,466 18,252 -1072 Fiji 65 0.746 70.9 67.4 90.8 94.9 83 84 2,367 6,892 -273 Brazil 64 0.751 72.0 64.1 85.4 85.1 80 79 4,557 10,769 074 Suriname .. .. 73.2 68.0 .. .. 86 80 .. .. ..75 Lebanon 69 0.739 74.6 71.5 80.3 92.1 81 76 2,013 6,704 -476 Armenia 62 0.751 75.8 69.8 97.6 99.3 77 82 2,087 3,061 477 Philippines 63 0.751 71.3 67.3 95.1 95.5 84 80 2,933 4,994 478 Oman 78 0.722 72.6 69.7 61.6 80.1 56 59 3,806 21,804 -1079 Kazakhstan .. .. 70.3 59.1 .. .. 81 73 .. .. ..80 Ukraine 66 0.744 73.5 62.7 99.5 99.7 78 77 2,716 5,085 381 Georgia .. .. 72.2 69.0 .. .. 71 69 .. .. ..82 Peru 73 0.729 71.6 66.6 85.3 94.7 79 81 1,950 7,695 -383 Grenada .. .. .. .. .. .. .. .. .. .. ..84 Maldives 68 0.739 65.8 67.3 96.8 96.6 77 77 3,329 5,582 385 Turkey 71 0.734 72.4 67.3 76.5 93.5 55 68 4,379 9,516 186 Jamaica 67 0.739 77.3 73.3 90.7 82.9 62 63 2,900 4,400 687 Turkmenistan .. .. 69.6 62.9 .. .. 81 81 .. .. ..88 Azerbaijan .. .. 75.0 68.0 .. .. 72 70 .. .. ..89 Sri Lanka 70 0.737 75.3 69.5 89.0 94.4 71 68 2,270 4,724 490 Paraguay 75 0.727 72.6 68.0 92.2 94.4 64 64 2,155 6,658 0
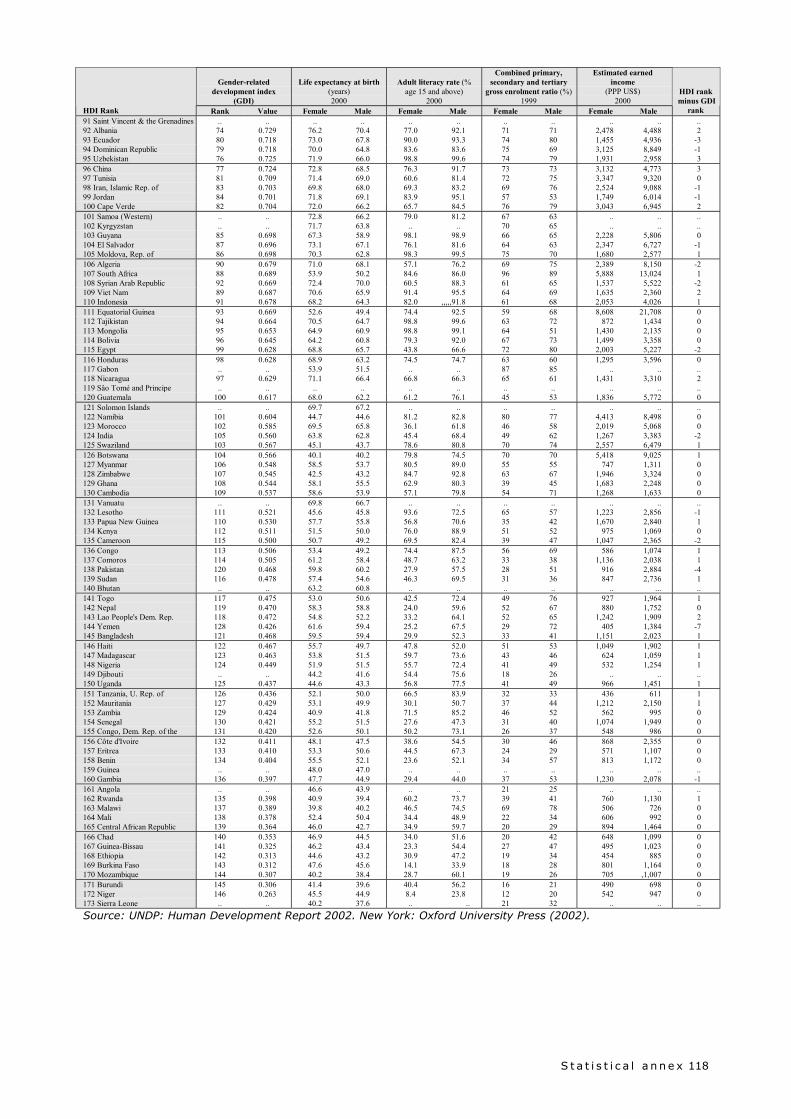
S t a t i s t i c a l a n n e x 118
Gender-relateddevelopment index
(GDI)
Life expectancy at birth(years)2000
Adult literacy rate (%age 15 and above)
2000
Combined primary,secondary and tertiary
gross enrolment ratio (%)1999
Estimated earnedincome
(PPP US$)2000
HDI Rank Rank Value Female Male Female Male Female Male Female Male
HDI rank minus GDI
rank91 Saint Vincent & the Grenadines .. .. .. .. .. .. .. .. .. .. ..92 Albania 74 0.729 76.2 70.4 77.0 92.1 71 71 2,478 4,488 293 Ecuador 80 0.718 73.0 67.8 90.0 93.3 74 80 1,455 4,936 -394 Dominican Republic 79 0.718 70.0 64.8 83.6 83.6 75 69 3,125 8,849 -195 Uzbekistan 76 0.725 71.9 66.0 98.8 99.6 74 79 1,931 2,958 396 China 77 0.724 72.8 68.5 76.3 91.7 73 73 3,132 4,773 397 Tunisia 81 0.709 71.4 69.0 60.6 81.4 72 75 3,347 9,320 098 Iran, Islamic Rep. of 83 0.703 69.8 68.0 69.3 83.2 69 76 2,524 9,088 -199 Jordan 84 0.701 71.8 69.1 83.9 95.1 57 53 1,749 6,014 -1100 Cape Verde 82 0.704 72.0 66.2 65.7 84.5 76 79 3,043 6,945 2101 Samoa (Western) .. .. 72.8 66.2 79.0 81.2 67 63 .. .. ..102 Kyrgyzstan .. .. 71.7 63.8 .. .. 70 65 .. .. ..103 Guyana 85 0.698 67.3 58.9 98.1 98.9 66 65 2,228 5,806 0104 El Salvador 87 0.696 73.1 67.1 76.1 81.6 64 63 2,347 6,727 -1105 Moldova, Rep. of 86 0.698 70.3 62.8 98.3 99.5 75 70 1,680 2,577 1106 Algeria 90 0.679 71.0 68.1 57.1 76.2 69 75 2,389 8,150 -2107 South Africa 88 0.689 53.9 50.2 84.6 86.0 96 89 5,888 13,024 1108 Syrian Arab Republic 92 0.669 72.4 70.0 60.5 88.3 61 65 1,537 5,522 -2109 Viet Nam 89 0.687 70.6 65.9 91.4 95.5 64 69 1,635 2,360 2110 Indonesia 91 0.678 68.2 64.3 82.0 ,,,,,91.8 61 68 2,053 4,026 1111 Equatorial Guinea 93 0.669 52.6 49.4 74.4 92.5 59 68 8,608 21,708 0112 Tajikistan 94 0.664 70.5 64.7 98.8 99.6 63 72 872 1,434 0113 Mongolia 95 0.653 64.9 60.9 98.8 99.1 64 51 1,430 2,135 0114 Bolivia 96 0.645 64.2 60.8 79.3 92.0 67 73 1,499 3,358 0115 Egypt 99 0.628 68.8 65.7 43.8 66.6 72 80 2,003 5,227 -2116 Honduras 98 0.628 68.9 63.2 74.5 74.7 63 60 1,295 3,596 0117 Gabon .. .. 53.9 51.5 .. .. 87 85 .. .. ..118 Nicaragua 97 0.629 71.1 66.4 66.8 66.3 65 61 1,431 3,310 2119 Sâo Tomé and Principe .. .. .. .. .. .. .. .. .. .. ..120 Guatemala 100 0.617 68.0 62.2 61.2 76.1 45 53 1,836 5,772 0121 Solomon Islands .. .. 69.7 67.2 .. .. .. .. .. .. ..122 Namibia 101 0.604 44.7 44.6 81.2 82.8 80 77 4,413 8,498 0123 Morocco 102 0.585 69.5 65.8 36.1 61.8 46 58 2,019 5,068 0124 India 105 0.560 63.8 62.8 45.4 68.4 49 62 1,267 3,383 -2125 Swaziland 103 0.567 45.1 43.7 78.6 80.8 70 74 2,557 6,479 1126 Botswana 104 0.566 40.1 40.2 79.8 74.5 70 70 5,418 9,025 1127 Myanmar 106 0.548 58.5 53.7 80.5 89.0 55 55 747 1,311 0128 Zimbabwe 107 0.545 42.5 43.2 84.7 92.8 63 67 1,946 3,324 0129 Ghana 108 0.544 58.1 55.5 62.9 80.3 39 45 1,683 2,248 0130 Cambodia 109 0.537 58.6 53.9 57.1 79.8 54 71 1,268 1,633 0131 Vanuatu .. .. 69.8 66.7 .. .. .. .. .. .. ..132 Lesotho 111 0.521 45.6 45.8 93.6 72.5 65 57 1,223 2,856 -1133 Papua New Guinea 110 0.530 57.7 55.8 56.8 70.6 35 42 1,670 2,840 1134 Kenya 112 0.511 51.5 50.0 76.0 88.9 51 52 975 1,069 0135 Cameroon 115 0.500 50.7 49.2 69.5 82.4 39 47 1,047 2,365 -2136 Congo 113 0.506 53.4 49.2 74.4 87.5 56 69 586 1,074 1137 Comoros 114 0.505 61.2 58.4 48.7 63.2 33 38 1,136 2,038 1138 Pakistan 120 0.468 59.8 60.2 27.9 57.5 28 51 916 2,884 -4139 Sudan 116 0.478 57.4 54.6 46.3 69.5 31 36 847 2,736 1140 Bhutan .. .. 63.2 60.8 .. .. .. .. .. ... ..141 Togo 117 0.475 53.0 50.6 42.5 72.4 49 76 927 1,964 1142 Nepal 119 0.470 58.3 58.8 24.0 59.6 52 67 880 1,752 0143 Lao People's Dem. Rep. 118 0.472 54.8 52.2 33.2 64.1 52 65 1,242 1,909 2144 Yemen 128 0.426 61.6 59.4 25.2 67.5 29 72 405 1,384 -7145 Bangladesh 121 0.468 59.5 59.4 29.9 52.3 33 41 1,151 2,023 1146 Haiti 122 0.467 55.7 49.7 47.8 52.0 51 53 1,049 1,902 1147 Madagascar 123 0.463 53.8 51.5 59.7 73.6 43 46 624 1,059 1148 Nigeria 124 0.449 51.9 51.5 55.7 72.4 41 49 532 1,254 1149 Djibouti .. .. 44.2 41.6 54.4 75.6 18 26 .. .. ..150 Uganda 125 0.437 44.6 43.3 56.8 77.5 41 49 966 1,451 1151 Tanzania, U. Rep. of 126 0.436 52.1 50.0 66.5 83.9 32 33 436 611 1152 Mauritania 127 0.429 53.1 49.9 30.1 50.7 37 44 1,212 2,150 1153 Zambia 129 0.424 40.9 41.8 71.5 85.2 46 52 562 995 0154 Senegal 130 0.421 55.2 51.5 27.6 47.3 31 40 1,074 1,949 0155 Congo, Dem. Rep. of the 131 0.420 52.6 50.1 50.2 73.1 26 37 548 986 0156 Côte d'Ivoire 132 0.411 48.1 47.5 38.6 54.5 30 46 868 2,355 0157 Eritrea 133 0.410 53.3 50.6 44.5 67.3 24 29 571 1,107 0158 Benin 134 0.404 55.5 52.1 23.6 52.1 34 57 813 1,172 0159 Guinea .. .. 48.0 47.0 .. .. .. .. .. .. ..160 Gambia 136 0.397 47.7 44.9 29.4 44.0 37 53 1,230 2,078 -1161 Angola .. .. 46.6 43.9 .. .. 21 25 .. .. ..162 Rwanda 135 0.398 40.9 39.4 60.2 73.7 39 41 760 1,130 1163 Malawi 137 0.389 39.8 40.2 46.5 74.5 69 78 506 726 0164 Mali 138 0.378 52.4 50.4 34.4 48.9 22 34 606 992 0165 Central African Republic 139 0.364 46.0 42.7 34.9 59.7 20 29 894 1,464 0166 Chad 140 0.353 46.9 44.5 34.0 51.6 20 42 648 1,099 0167 Guinea-Bissau 141 0.325 46.2 43.4 23.3 54.4 27 47 495 1,023 0168 Ethiopia 142 0.313 44.6 43.2 30.9 47.2 19 34 454 885 0169 Burkina Faso 143 0.312 47.6 45.6 14.1 33.9 18 28 801 1,164 0170 Mozambique 144 0.307 40.2 38.4 28.7 60.1 19 26 705 ,1,007 0171 Burundi 145 0.306 41.4 39.6 40.4 56.2 16 21 490 698 0172 Niger 146 0.263 45.5 44.9 8.4 23.8 12 20 542 947 0173 Sierra Leone .. .. 40.2 37.6 .. .. 21 32 .. .. ..
Source: UNDP: Human Development Report 2002. New York: Oxford University Press (2002).


