Embed Size (px)
Citation preview

Dynamic Article LinksC<Soft Matter
Cite this: DOI: 10.1039/c1sm06518a
www.rsc.org/softmatter PAPER
Dow
nloa
ded
by U
NIL
EV
ER
RE
SEA
RC
H L
AB
OR
AT
OR
Y o
n 22
Dec
embe
r 20
11Pu
blis
hed
on 2
2 D
ecem
ber
2011
on
http
://pu
bs.r
sc.o
rg |
doi:1
0.10
39/C
1SM
0651
8AView Online / Journal Homepage
Super stable foams stabilized by colloidal ethyl cellulose particles
Huajin Jin,a Weizheng Zhou,a Jian Cao,*a Simeon D. Stoyanov,*b Theodorus B. J. Blijdenstein,b
Peter W. N. de Groot,b Luben N. Arnaudovb and Edward G. Pelanb
Received 8th August 2011, Accepted 8th November 2011
DOI: 10.1039/c1sm06518a
Here we report the preparation of super stable liquid foams with various bubble sizes stabilized by
colloidal ethyl cellulose (EC) particles. What is novel and different in this particle stabilized foam is that
both the initial material (EC) and processes used are in principle food grade, thus it may offer scope in
food applications. The particles were prepared using a conventional anti-solvent precipitation method,
involving the dissolution of EC polymer into acetone, followed by fast mixing with water (anti-solvent),
leading to the precipitation of EC particles, then followed by the rotary evaporation of acetone. The
interfacial tension of the resulting dispersion is 36 mNm�1, indicating that particles co-exist with surface
active and water soluble components, which is most likely a low molecular weight EC fraction. The
average particle diameter is 0.13 mmand their zeta potential is�50mV at pH¼ 6, increasing to�5mV at
pH¼ 3. This negative surface potential is attributed to adsorption of hydroxyl ions, known to occur on
many hydrophobic surfaces, including oil–water, air–water and hydrophobic particle–water. As a result,
there is strong electrostatic repulsion between EC particles at neutral and low ionic strength, which
stabilizes EC dispersion and also significantly increases the adsorption barrier of EC particle at the air–
water interface. Due to their similar origin, both inter-particle repulsion and adsorption barrier can be
controlled by pH and/or ionic strength, which leads to dispersion destabilization and at the same time
good foamability and extreme foam stability at acidic conditions (pH< 4) and/ormoderate or high ionic
strengths (I > 20 mM). Foam coarsening shows an initial stage with coarsening time of approximately 1
week, followedby aplateau,where the coarsening has been arrested for a period ofmonths. Byusing cryo
scanning electronmicroscopy, we reveal that these EC foams are Pickering stabilized, where ECparticles
are closely packed at the air–water interface forming a single or multi-layers. We also show that super
stable EC foams can be prepared using various aeration techniques, allowing us to vary the bubble
diameter from a few microns to hundreds of microns.
1 Introduction
Liquid foams are foams where the continuous phase is not
solidified, gelled or cross linked. When the liquid is water, they
are also called aqueous foams. Aqueous foams occur as inter-
mediate and/or end products in a wide range of areas and
industries like food, home and personal care, medical and
pharmaceutical, construction, automotive, petrochemical and
mining.1 In addition, liquid foams have been also used as
a template to synthesize novel materials etc.2–4 Since wet foams
are thermodynamically unstable dispersed systems, which drain,
coarsen and coalesce,5 for their successful application it is
important to prolong and control their lifetime. The standard
strategy of controlling foam stability is to use conventional
surface active ingredients like synthetic or natural surfactants
aUnilever R&D Shanghai, 5/F, 66 Linxin Road, Shanghai, 200335, P. R.China. E-mail: [email protected] R&D Vlaardingen, Olivier van Noortlaan 120, 3133 ATVlaardingen, the Netherlands. E-mail: [email protected]
This journal is ª The Royal Society of Chemistry 2011
(emulsifiers), lipids, block co-polymers or proteins, which are
able to cover the bubble surfaces and thus to slow down the foam
collapse. Nevertheless, such foams typically survive only for few
hours due to processes of coalescence and disproportionation.6
In addition to foam stability issues, bubble size plays an
important role in many industrial foam applications. For
example, it is well known that small bubbles provide creamier
and smoother textures in ice and whipped cream.7 In applications
like ultrasonic imaging and targeted drug delivery, for both
safety and application reasons it is critical to be able to produce
small mono disperse bubbles, with diameter less than 10 mm.8–10
In this context, the challenge is even higher since smaller bubbles
have higher internal pressure, Pb¼ Pl + 2g/r (here g is the surface
tension and, Pl and Pb are the pressures in the foam liquid and in
the bubble with radius r respectively), which by using the ideal
gas law, translates into higher concentration of the gas inside
them. This coupled with the fact that the gas has finite solubility
in the continuous phase, and that in real foams small bubbles do
co-exist with bigger bubbles and with atmosphere, leads to faster
foam coarsening, where small bubbles shrink and large ones
Soft Matter

Dow
nloa
ded
by U
NIL
EV
ER
RE
SEA
RC
H L
AB
OR
AT
OR
Y o
n 22
Dec
embe
r 20
11Pu
blis
hed
on 2
2 D
ecem
ber
2011
on
http
://pu
bs.r
sc.o
rg |
doi:1
0.10
39/C
1SM
0651
8A
View Online
grow.11 One strategy to stop or slow down this process is to use
low water soluble (or insoluble) surfactants, block copolymers
and/or proteins that are irreversibly attached to the air–water
interface for the time scales of the disproportionation process,
which could range from hours to days, months or years.
However, in this case the challenge shifts, since one needs to find
ways to deliver such types of surfactants at the interface, to
counterbalance their natural anti-foaming action. In some cases
this is possible, for example, Dressaire et al. have shown that it is
possible to prepare sub-micron micro-bubbles by covering them
with a layer of insoluble self assembled surfactant and demon-
strated that such bubbles can survive more than one year.11
An alternative approach that overcomes some of the above
mentioned difficulties is to use colloidal particle dispersions,
composed of particles with the right surface activity, size and
shape. This is also known as the Pickering stabilization mech-
anism and recently has drawn a lot of scientific and industrial
interest.3,4,12–27 The source of the Pickering stability is related to
the very high energy of colloidal particle attachment at the
air–water interface, which for spherical particles is E ¼ p r2 g
(1 � |cosq|)2, where q is the contact angle between the air–water
interface and the particle surface and r is the particle radii.
Even for nanosized particles, this energy could be of the order
of hundreds or thousands thermal energy units, thus exceeding
typical surfactant adsorption energies by orders of magnitude.13
However, what is seldom discussed in the literature is that in
order to adsorb such particles onto the air–water interface,
often it is necessary to overcome a large adsorption barrier of
the particle to the interface which could be of the order of the
particle attachment energy. The origin of such a barrier can be
of electrostatic or steric nature and sometimes the conventional
aeration processes are not able to provide sufficient energy to
overcome it, unless measures have been taken to lower it.
Therefore in order to obtain bubbles and liquid foams stable
for months, it is vital to control both the wettability of particles
and particle-interface interactions.
As discussed earlier, bubble size is another important aspect
for foam applications. This is especially true for the case of
spherical particle stabilized foams, where reported average
bubble size is of the order of tens and hundreds particle diameters
and normally lies in between hundreds of microns and few mil-
limetres, which typically is too large for many applications. To
our knowledge, there are limited number of papers in the liter-
ature, that describe particle stabilized foams with bubbles in the
range below 50–100mm.4,9,20,25
For the industrial application of Pickering stabilized foams in
foods there are additional challenges, since all the materials,
processes of making particles and the way they are applied
should be food grade and prepared using scalable and cost
effective industrial processes.27 In particular, most of the
colloidal particles that are capable of producing Pickering
stabilized foams are either made from non food grade materials
and/or processes or their surfaces have been modified using non
edible materials or a process that involves a chemical modifica-
tion.12,14–21,23,25 Currently, only a few kinds of food grade parti-
cles and rods were developed to stabilize air bubbles. For
example, Campbell et al. prepared anisotropic food-grade ethyl
cellulose (EC) micro-rods via a liquid–liquid dispersion method,
and the resultant rods showed potential application for enhanced
Soft Matter
stability of food foams.22,24 Zhou et al. modified micro-scale
CaCO3 rods and particles with fatty acids and obtained CaCO3
rods with suitable wettability. Stable CaCO3 foamwith a life time
of more than several months can be obtained by simply shaking
a dispersion of modified CaCO3.26 However, the bubble size of
these foams can only be tuned at a limited range, and micro-
bubbles in the order of 10 mm diameter cannot be achieved
because of the size and surface properties of the particles.
In this paper, we have decided to further investigate the
possibility of preparation of colloidal particles made from ethyl
cellulose (EC) and the usage of them as efficient stabilizers of
foams made with small bubbles. The reason we choose EC is that
it is accepted as a food additive in several markets (FDA GRAS
status28 and an E-number in the EU29). Ethyl cellulose is
a hydrophobic, non water soluble cellulose ether polymer,
comprising of an anhydroglucose (cellulose) repeating backbone,
where a high degree of hydroxy-groups on the anhydroglucose
are etherified with ethyl-groups.30 The main sources of cellulose
used in EC are cotton and wood and thus could be considered as
stainable sources. However the processes of cellulose extraction
and modification used to produce EC on industrial scale are
relatively harsh and solvents used are difficult to fully recover. As
a result, EC is one of the most expensive cellulose derivatives
available on the market today.
We report a simple and versatile approach to prepare EC
particles and describe their functionality to stabilize foams.
There are four main points we want to highlight as being novel
and interesting: (1) colloidal particles are derived from ethyl
cellulose using simple physical post-processing procedure; (2) EC
particle–particle and particle–air–water interface interactions
can be fine-tuned by using electrolytes or acids; (3) stable foams
with a life time of several months are formed by aerating EC
dispersion at the appropriate conditions; and (4) by using range
of different aeration methods, we demonstrate that bubbles with
different sizes (1–1000mm) are obtained.
The paper is organized as follows: firstly, the EC dispersion is
characterized towards particle size and z-potential, foamability
and foam stability. Secondly, morphology of the resulting
bubbles is investigated using optical and electron microscopy.
Subsequently, the application of different aeration methods
towards bubble size variation is discussed. Finally, the specific
disproportionation stability of EC particle stabilized foams is
investigated using turbidimetry.
2 Materials and methods
2.1 Materials
Ethyl cellulose, with an ethoxyl content of 48%, was purchased
from Sigma-Aldrich (247499-100G, batch: 08521KH). Rather
than giving the exact molecular weight, the supplier gives the
viscosity of 5.0 wt% ethyl cellulose in 80/20(v/v) toluene/ethanol
to be 100cps. Xanthan (Keltrol RD) was purchased from CP
Kelco (Beringen, Belgium). HCl, H2SO4, HAc, NaOH, NaCl,
and KCl were bought from Sinopharm Chemical Reagent Co.,
Ltd (China), and CaCl2 and MgCl2 were purchased from Sigma-
Aldrich. All the chemicals are used as received, unless otherwise
noted.
This journal is ª The Royal Society of Chemistry 2011
Dow
nloa
ded
by U
NIL
EV
ER
RE
SEA
RC
H L
AB
OR
AT
OR
Y o
n 22
Dec
embe
r 20
11Pu
blis
hed
on 2
2 D
ecem
ber
2011
on
http
://pu
bs.r
sc.o
rg |
doi:1
0.10
39/C
1SM
0651
8A
View Online
2.2 Preparation of EC dispersion
The desired amount of ethyl cellulose powder was dissolved in
acetone, using a magnetic stirrer (IKA ETS-D5) at 30 �C for 30
min to obtain a clear 1.0 wt% EC solution. After complete
dissolution, the same volume of deionised water (anti-solvent)
was quickly poured into this solution under stirring. This abrupt
change of solvent quality resulted in a system that was super-
saturated with respect of EC, leading to the formation of EC
colloidal particles via a nucleation and growth mechanism. The
resulting turbid dispersion was then put in a rotary evaporator
(Buchi R-200, Heidolph), where all the acetone and part of the
water were removed to get 1.0 wt% or 2.0 wt% EC dispersion in
water. By using head space gas chromatography with a flame
ionized detector, we had measured that the residual level of
acetone in 1, 2 and 4 wt% EC dispersions was around 0.4 mg ml�1
irrespective of EC concentration. We also made EC particle
stabilized foams at low pH, left it to drain and collected the froth,
which was dissolved in ethanol and then the concentration of
acetone in the EC ethanol solution was measured. The residual
amount of acetone turned out to be below 0.01 mg ml�1 inde-
pendent of the EC concentration, indicating that there is hardly
any residual acetone trapped in the EC particles. The obtained
EC dispersions were stored in a fridge at a temperature of 4 �Cand brought to ambient temperature shortly before used.
2.3 The morphology of EC particles
The morphology of EC particles was investigated by trans-
mission electron microscopy (TEM) (JEM-1200EX). A drop of
EC dispersion (0.1 wt%) was dropped onto Cu grid, followed by
drying it at room temperature for TEM measurement.
2.4 Measurement of size and z-potential of EC particles
Diluted EC particle dispersion (ca. 0.1 wt%) was used to measure
the particle size by using a Malvern Zetasizer Nano ZEN 3600,
which combined dynamic light scattering (DLS) and electro-
phoretic mobility. The viscosity of water was assumed in all cases
and a refractive index of 1.59 was used in the analysis. In order
to obtain the pH dependence of z-potential and particle size,
0.1 wt% EC particle dispersion was titrated by adding 0.1 MHCl
aqueous solution or 0.1 M NaOH aqueous solution to tune the
pH from 9 to 2.
2.5 Surface tension
Surface tension of 1.0 and 2.0 wt% EC dispersion were measured
by a surface tensiometer (Kr€uss GmbH, Hamburg Germany)
based on the Wilhelmy plate method. Surface tension has been
measured for period of 1 h, which is sufficient to achieve the
equilibrium value for the system (surface tension flats off after
first 200–400 s).
2.6 Foam generation
EC foams were produced by various foaming techniques such as
hand-shaking or using various mechanical mixers. EC dispersion
(10 ml, 2.0 wt%) was put into a 25 ml measuring cylinder, and
some electrolytes and/or acids were added, followed by sealing it
with Para Film. The resultant EC dispersion was shaken by hand
This journal is ª The Royal Society of Chemistry 2011
for 2 min. Unless told otherwise, EC foams were produced by
shearing 2.0 wt% EC dispersion for 3 min by four types of low
and high shear mixers. The low shear mixers included Aerolatte
(Shanghai Dixi Electronic Company) and a semi-professional
kitchen mixer (Kenwood KM 800). High shear mixers included
a Silverson mixer (L5T, Silverson machine LTD) with an
Emulsor Screens head andUltra-Turrax homogenizer (IKA T25)
with an 18 mm diameter dispersion head. For the latter two
cases, foams were generated by having the mixing head centered
and placed well below the surface of the liquid and at least 1 cm
above the bottom of the vessel. The mixing was started at the
lowest rotation speed of the mixer, which had been gradually
increased to the desired level in order to avoid mechanical
entrapment of large bubbles via the hydrodynamic perturbation
of the upper surface in the stirring vessel. Following this process
we form hardly any foam at low rotational speeds and foams
with around 20–40% vol fraction of air at high rotational speeds.
Depending on the mixer and mixing head it seems that the
threshold value of foam formation seems to be around the point
where high velocity fluid exiting the mixing head reaches cavi-
tating conditions. The latter is registered by occurrence of
a typical cavitation sound and increased turbidity of the solution
due to the formation of cavitating bubbles (when solution is
sufficiently transparent) and by volume increase of the solution
in the beaker. This hypothesis will be further explored in
a follow-up work, where similar type of micro-bubbles foams is
made by using cavitating nozzles.31
2.7 Foamability and foam stability of EC dispersion
The foamability was estimated by measuring the ratio of the
foam volume immediately after preparation to the initial liquid
volume. The foam stability was assessed by monitoring foam
volume (total volume minus the volume of drained liquid) and
bubble size over time at ambient temperature.
2.8 Optical observation of EC bubbles
A drop of deionised water was placed on the top of a slide glass,
and a small amount of EC foam was gently put on top of the
water droplet, without covering with a cover glass. Then the
microscopy images of foam were obtained by using an optical
microscope fitted with a digital camera. (DM LB 2, Leica
Microsystems Ltd, Germany).
2.9 Cryo SEM of bubble surfaces
The microstructure of wet EC bubbles was investigated by cryo-
SEM. Namely a tiny piece of the foam was dropped on top of
a rivet, plunge-frozen in melting ethane. This cryo-fixed sample
was stored in liquid nitrogen until further processing. Then the
sample was freeze-fractured in an Oxford CT 1500 HF cryo-
system, to obtain a freshly prepared cross-section through the
foam. The sample was freeze-etched at �90 �C for a short time
(at max 3 min) to reveal the ultrastructure of the liquid phase.
After freeze-etching the sample was sputter coated with gold–
palladium for better SEM contrast. Then the sample was trans-
ferred into the SEM (Jeol 6340 Semi-inlens or gatan 2500, SEM
JEOL 630) and investigated at �125 �C with an accelerating
Soft Matter

Dow
nloa
ded
by U
NIL
EV
ER
RE
SEA
RC
H L
AB
OR
AT
OR
Y o
n 22
Dec
embe
r 20
11Pu
blis
hed
on 2
2 D
ecem
ber
2011
on
http
://pu
bs.r
sc.o
rg |
doi:1
0.10
39/C
1SM
0651
8A
View Online
voltage of 3 kV and a working distance of about 6 mm. Imaging
was performed using the in-lens secondary electron detector.
2.10 Disproportionation rate
A detailed description of the method, which has been developed
to decouple disproportionation from coalescence, is given else-
where.32 Briefly, EC dispersion was aerated to relatively dry foam
(air phase volume app. 0.75). Separately, 0.5 wt% xanthan
solution was prepared in a similar way, which was freed from air
bubbles formed during the dissolution process, by using a bench
top desiccator. Directly after preparation, the relatively dry foam
was gently mixed with xanthan gum solution to adjust the air
phase volume to 0.5. At this phase volume fraction, the bubble
volume is below close packing, minimizing the chance of coa-
lescence. Finally, the bulk yield stress invoked by xanthan
prevents creaming of air bubbles over time. By inhibiting the
creaming and coalescence, the rate of disproportionation can be
measured using turbidity measurements. To this end, sample
volumes of 20 ml of the thickened foams were studied in time
using a Turbiscan Lab Expert (Formulaction, Toulouse,
France). We extract the bubble size evolution d(t)/d(0) from the
average backscattering along the height of the foam sample. A
coarsening time, tcoarse, is determined using the model
d2ðtÞd2ð0Þ ¼ 1þ t
tcoarse(1)
3 Results and discussions
3.1 Preparation and properties of EC particles
Anti-solvent precipitation (also called the ‘‘drowning-out’’
method) is commonly applied to prepare colloidal particles,
especially for insoluble polymer materials.33 In our case, acetone
is used to dissolve EC, and water is used as the anti-solvent since
EC (ethoxyl content 48%) can hardly be dissolved in water. EC
particles are formed by the procedure described in the experi-
mental section. This process results in a stable and turbid
dispersion with no signs of sedimentation or phase separation.
Fig. 1A is a typical transmission electron microscopy (TEM)
image of ethyl cellulose particles. It can be found that in our
conditions the dispersion consist of individual EC particles with
sizes in the range of 100–200nm. It is important to note that EC
Fig. 1 (A) TEM image of ethyl cellulose particles. EC particles were
formed by adding 10 ml deionised water to 10 ml 1% EC solution in
acetone (and evaporating the remaining acetone). (B) Typical volume
based particle size distribution of a diluted EC dispersion from dynamic
light scattering.
Soft Matter
particles size strongly depends on polymer concentration in the
solvent, that is, a higher concentration leads to a bigger particles
size, in line with the findings of Plasari et al.33 The latter is easily
understood by the fact that the initial polymer concentration
determines the degree of supersaturation immediately after
acetone and water are mixed, which together with the total
number of nuclei determines the final particle concentration.
The faint connections between individual EC particles,
observed in the TEM image (Fig. 1A) are most likely artifacts
originating from the TEM-preparation procedure and/or the fact
that EC particles can melt upon local heating induced by the
electron beam. We performed dynamic light scattering (DLS) in
parallel and Fig. 1B shows a typical volume based particle size
distribution. DLS measurements show a single relatively narrow
peak, indicating a stable dispersion with no signs of particle
aggregation. The Z-average diameter of the distribution is about
130 nm, which is well in line with the sizes observed by TEM. The
observed state of the EC dispersion indicates that there is strong,
long range repulsion between the hydrophobic EC particles,
which is most likely to be of electrostatic origin.
The latter is confirmed by the z-potential of original EC-
dispersion, which turns out to be around �50 mV, indicating the
presence of a strong negative charge on the EC particle surface.
There are two possibilities to explain origin of this charge: it is
either real, i.e. EC particles have native negative charge, or
apparent, i.e. induced by the solvent. Looking at the molecular
structure of EC, it is difficult to foresee the origin of a native
negative charge.30 Thus, it can be concluded that the negative z-
potential is due to an apparent negative charge, induced by the
water molecules. One possible explanation for this could be the
adsorption of OH� ions, which is known to occur on many
hydrophobic surfaces like the surface of hydrophobic latex
particles in water, or the surface of oil droplets stabilized with
a non-ionic surfactant or no surfactant at all.34 Measurements of
the electrophoretic mobility of air bubbles in water has also
demonstrated that the air–water interface has an electrical
potential similar in sign and magnitude, thus it has been
hypothesized that adsorption of OH� ions occurs on the air–
water interface as well.35 This has led to the speculation that such
a phenomenon can be quite generic and can occur on almost any
hydrophobic surface in contact with water. It has also been
shown that adsorption of non-ionic surfactants on such surfaces
can significantly reduce this charge, as they can compete with the
adsorption to the interface with hydroxyl ions and/or to disrupt
the structure of the sub-surface water layer. The latter has lead to
an alternative speculation that the origin of this apparent charge
is due to a long range arrangement and orientation of water
dipoles near a solid surface. However experiments where strong
chaotropic agents like urea (known to break the molecular
network of water) are added to these systems, has shown that the
measured z-potential is insensitive of it, which seems to disprove
the long range order hypothesis. It has also been shown in Iva-
nov’s work34 that the measured z-potential of a xylene droplet
increased with the decrease of pH, from around �60 mV at pH 5
to around �10 mV at pH 3, thus supporting the hypothesis of
OH� ion adsorption.
In the case of EC dispersion we observed very similar trends
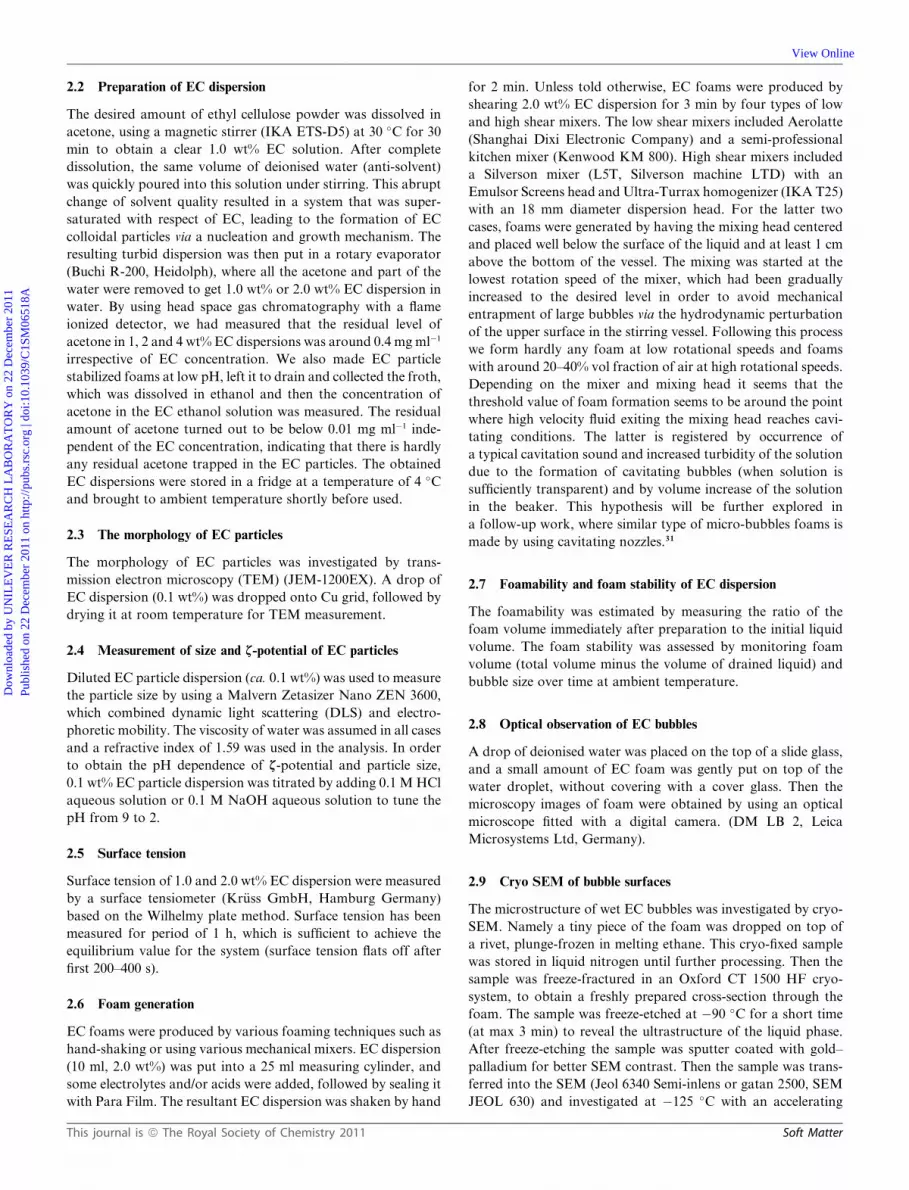
and behavior as shown in Fig. 2. When the pH of EC dispersion
decreases from 6.0 to 3.0, the z-potential of EC particles changes
This journal is ª The Royal Society of Chemistry 2011
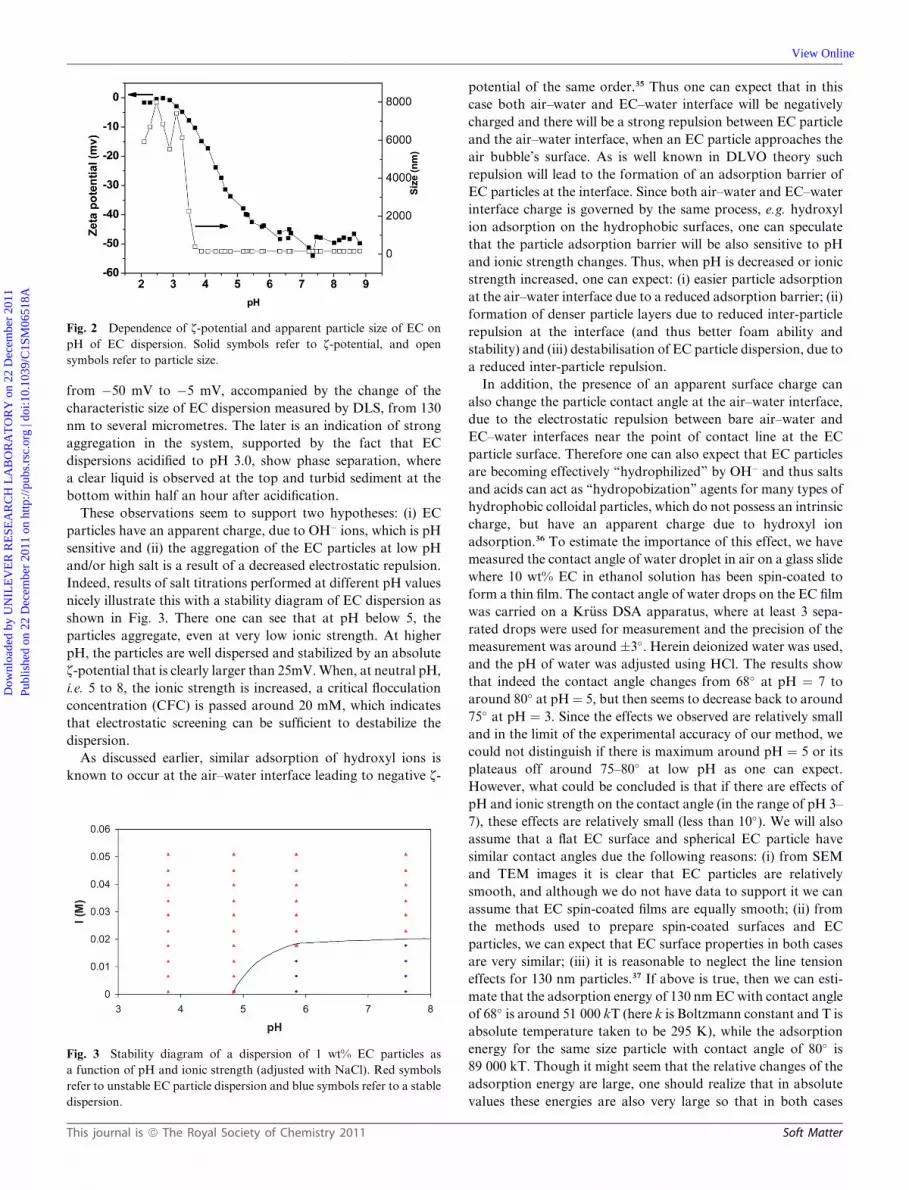
Fig. 2 Dependence of z-potential and apparent particle size of EC on
pH of EC dispersion. Solid symbols refer to z-potential, and open
symbols refer to particle size.
Dow
nloa
ded
by U
NIL
EV
ER
RE
SEA
RC
H L
AB
OR
AT
OR
Y o
n 22
Dec
embe
r 20
11Pu
blis
hed
on 2
2 D
ecem
ber
2011
on
http
://pu
bs.r
sc.o
rg |
doi:1
0.10
39/C
1SM
0651
8A
View Online
from �50 mV to �5 mV, accompanied by the change of the
characteristic size of EC dispersion measured by DLS, from 130
nm to several micrometres. The later is an indication of strong
aggregation in the system, supported by the fact that EC
dispersions acidified to pH 3.0, show phase separation, where
a clear liquid is observed at the top and turbid sediment at the
bottom within half an hour after acidification.
These observations seem to support two hypotheses: (i) EC
particles have an apparent charge, due to OH� ions, which is pH
sensitive and (ii) the aggregation of the EC particles at low pH
and/or high salt is a result of a decreased electrostatic repulsion.
Indeed, results of salt titrations performed at different pH values
nicely illustrate this with a stability diagram of EC dispersion as
shown in Fig. 3. There one can see that at pH below 5, the
particles aggregate, even at very low ionic strength. At higher
pH, the particles are well dispersed and stabilized by an absolute
z-potential that is clearly larger than 25mV.When, at neutral pH,
i.e. 5 to 8, the ionic strength is increased, a critical flocculation
concentration (CFC) is passed around 20 mM, which indicates
that electrostatic screening can be sufficient to destabilize the
dispersion.
As discussed earlier, similar adsorption of hydroxyl ions is
known to occur at the air–water interface leading to negative z-
Fig. 3 Stability diagram of a dispersion of 1 wt% EC particles as
a function of pH and ionic strength (adjusted with NaCl). Red symbols
refer to unstable EC particle dispersion and blue symbols refer to a stable
dispersion.
This journal is ª The Royal Society of Chemistry 2011
potential of the same order.35 Thus one can expect that in this
case both air–water and EC–water interface will be negatively
charged and there will be a strong repulsion between EC particle
and the air–water interface, when an EC particle approaches the
air bubble’s surface. As is well known in DLVO theory such
repulsion will lead to the formation of an adsorption barrier of
EC particles at the interface. Since both air–water and EC–water
interface charge is governed by the same process, e.g. hydroxyl
ion adsorption on the hydrophobic surfaces, one can speculate
that the particle adsorption barrier will be also sensitive to pH
and ionic strength changes. Thus, when pH is decreased or ionic
strength increased, one can expect: (i) easier particle adsorption
at the air–water interface due to a reduced adsorption barrier; (ii)
formation of denser particle layers due to reduced inter-particle
repulsion at the interface (and thus better foam ability and
stability) and (iii) destabilisation of EC particle dispersion, due to
a reduced inter-particle repulsion.
In addition, the presence of an apparent surface charge can
also change the particle contact angle at the air–water interface,
due to the electrostatic repulsion between bare air–water and
EC–water interfaces near the point of contact line at the EC
particle surface. Therefore one can also expect that EC particles
are becoming effectively ‘‘hydrophilized’’ by OH� and thus salts
and acids can act as ‘‘hydropobization’’ agents for many types of
hydrophobic colloidal particles, which do not possess an intrinsic
charge, but have an apparent charge due to hydroxyl ion
adsorption.36 To estimate the importance of this effect, we have
measured the contact angle of water droplet in air on a glass slide
where 10 wt% EC in ethanol solution has been spin-coated to
form a thin film. The contact angle of water drops on the EC film
was carried on a Kr€uss DSA apparatus, where at least 3 sepa-
rated drops were used for measurement and the precision of the
measurement was around �3�. Herein deionized water was used,
and the pH of water was adjusted using HCl. The results show
that indeed the contact angle changes from 68� at pH ¼ 7 to
around 80� at pH¼ 5, but then seems to decrease back to around
75� at pH ¼ 3. Since the effects we observed are relatively small
and in the limit of the experimental accuracy of our method, we
could not distinguish if there is maximum around pH ¼ 5 or its
plateaus off around 75–80� at low pH as one can expect.
However, what could be concluded is that if there are effects of
pH and ionic strength on the contact angle (in the range of pH 3–
7), these effects are relatively small (less than 10�). We will also
assume that a flat EC surface and spherical EC particle have
similar contact angles due the following reasons: (i) from SEM
and TEM images it is clear that EC particles are relatively
smooth, and although we do not have data to support it we can
assume that EC spin-coated films are equally smooth; (ii) from
the methods used to prepare spin-coated surfaces and EC
particles, we can expect that EC surface properties in both cases
are very similar; (iii) it is reasonable to neglect the line tension
effects for 130 nm particles.37 If above is true, then we can esti-
mate that the adsorption energy of 130 nm EC with contact angle
of 68� is around 51 000 kT (here k is Boltzmann constant and T is
absolute temperature taken to be 295 K), while the adsorption
energy for the same size particle with contact angle of 80� is
89 000 kT. Though it might seem that the relative changes of the
adsorption energy are large, one should realize that in absolute
values these energies are also very large so that in both cases
Soft Matter

Dow
nloa
ded
by U
NIL
EV
ER
RE
SEA
RC
H L
AB
OR
AT
OR
Y o
n 22
Dec
embe
r 20
11Pu
blis
hed
on 2
2 D
ecem
ber
2011
on
http
://pu
bs.r
sc.o
rg |
doi:1
0.10
39/C
1SM
0651
8A
View Online
particles should be irreversibly attached at the air–water interface
and stable foams should be produced. As it will be shown in the
next section, the main reasons for poor foam ability and stability
at high pH of the system is not due to changes of the surface
wettability of the particles, but due to the presence of a strong
adsorption barrier of electrostatic origin, which could not be
overcome by the typical forces applied during the aeration
process. At low pH and/or high salt, the particle attachment
barrier is lower and therefore EC particles become an effective
Pickering stabilizer. At those conditions one also expects that EC
dispersions become unstable, as well.
Fig. 5 Foam volume of EC foam (produced by hand shaking) without
acid and with acid at different times. The inset figure is the curve for the
first two hours.
3.2 Foamability and foam stability of EC dispersion at neutral
and acidic pH
The foamability and foam stability of 2.0 wt% EC dispersion
with or without acid are investigated and compared as shown in
Fig. 4 and Fig. 5. Bubble morphologies as probed by light
microscopy and cryo-SEM are presented in Fig. 6 and 7,
respectively.
At neutral pH, EC dispersions show reasonable foamability
and foam stability around few hours, which is quite similar to
common surfactants (Fig. 4 and 5). In addition, the liquid which
drains from the foam upon storage is a turbid and stable EC
dispersion. This is an indication that most of the particles are not
able to attach/adsorb at the air–water interface and thus to
stabilize the foam. To explain the reasonable foam ability and
poor stability, we presume that it is due to the presence of a water
soluble surface active component in the EC dispersion. This is
supported by the fact that when EC dispersion is dialyzed and
this component is removed, the foam-stability of EC dispersions
at low pH remains unchanged, while foamability is slightly
decreased, however at natural pH dialyzed EC dispersions do not
show any significant foamability. We speculate that this surface
active component, which decreases the interfacial tension of
native EC dispersion to 36 mN m�1, is most likely a low molec-
ular weight fraction of EC polymer, but have not confirmed this
conclusively.
Light microscopy shows that the morphology of the bubbles is
spherical (Fig. 6A) with an average size much larger than 100 mm.
Fig. 7 depicts representative cryo-SEM images of EC foam
produced by hand shaking at neutral and acidic conditions.
Panels A to C represent foams made at neutral pH and these
show large bubbles ([10 mm). When zoomed in, loose struc-
tures can be observed, which must resemble EC particles clus-
tered together by ice crystallization, an artifact from the
Fig. 4 Typical procedure of ethyl cellulose foam produced by hand-shaking w
EC dispersion, and the second step is to shear EC dispersion for foaming. N
Soft Matter
preparation procedure. One can see from these SEM images that
large part of EC particles seen on the picture are in the bulk,
rather than accumulated at the interface. In the view from the
bubble interior (Panel C) a loose structure of EC-particles can
also be observed and no indications of a strong surface layer are
present. The poor stability of the foam, the absence of any non
trivial bubble morphology and low representation of particles at
the bubble surface confirm that EC particles at neutral pH and
without salt are not very effective as Pickering stabilizers. This is
in line with the expectation that EC particles could not adsorb at
the interface due to the presence of a strong electrostatic barrier
(repulsion) between the bare air–water and EC–water interfaces
at normal pH and low ionic strengths, and that the foamability in
this case is due to the presence of soluble surface active compo-
nent, co-existing with EC particles.
At pH 3.0, the foam can reach an air phase volume fraction of
0.5 in the first seconds of shaking (Fig. 4). After shaking, the
bubbles are creaming under the influence of gravity and as
a result the foam volume will decrease in the first several hours
(Fig. 5). It is noteworthy that the subnatant is clear, opposite to
the pH-neutral case (Fig. 4). Nevertheless, the foam volume will
keep constant for more than one month after a creaming balance
has been reached (Fig. 5). In addition, there is no obvious bubble
size growths after 2 days. Fig. 6B shows a typical optical
microscopy image of EC bubbles produced by hand-shaking.
The bubbles are polydisperse, ranging from 10 mm to 100 mm.
ithout (A) and with acid (B, pH 3.0). The first step is to tune the pH of the
ote: foam can be sheared and formed immediately once acid is added.
This journal is ª The Royal Society of Chemistry 2011

Fig. 6 Optical microscopy of EC bubbles prepared from neutral disper-
sion (panel A) and acidified dispersion (panel B). EC bubbles were
produced byhand shaking 2%ECdispersion for 2min. Scale bar¼ 100mm.
Fig. 7 Cryo-SEM images of EC bubbles. A–C, foam prepared at neutral
pH, D–F, bubbles prepared at pH3. EC bubbles were formed by hand
shaking 2.0 wt% EC dispersion for 2 min. Images A, D, are images of
a cut face of a frozen aqueous foam; images B and E are the magnified
picture of images A and D; images C and F show the bubble surface seen
from the bubble interior. Image G is the Cryo-SEM image of EC particles
stabilized foam, diluted in 0.25 wt% xanthan solution, kept at pH 3. Here
a cross-sectional view on the bubble surface is shown, with the etched
liquid phase on the left and the air bubble to the right.
Dow
nloa
ded
by U
NIL
EV
ER
RE
SEA
RC
H L
AB
OR
AT
OR
Y o
n 22
Dec
embe
r 20
11Pu
blis
hed
on 2
2 D
ecem
ber
2011
on
http
://pu
bs.r
sc.o
rg |
doi:1
0.10
39/C
1SM
0651
8A
View Online
Some bubbles are non-spherical and have a wrinkled surface,
which is a typical characteristic for particle stabilized bubbles,
and are often denoted as ‘‘armoured bubbles’’.17
This journal is ª The Royal Society of Chemistry 2011
From the findings above, it can be hypothesized that these
bubbles are stabilized by EC particles which is further proved by
cryo-SEM. Here, individual polydisperse bubbles with a diam-
eter of few tens of micrometres were cut and observed (Fig. 7D–
F). Fig. 7E shows the cross section of few cracked bubbles under
cryo-SEM, indicating that EC particles form a multilayer around
air bubbles (further magnification can be seen on Fig. 7G). It is
also clear from these images that the amount of EC particles
which don’t attach on the bubbles surface is quite low. At the
same time in Fig. 7F, which is a zoomed in internal image of
a cracked bubble, shows EC particles close packed at the bubble
surface, holes and traces of cracking lines, which is indicative of
the attraction between the particles in the packed layer, just as
the particles in the bulk.38 These experimental results are in line
with the modeling of packing of adsorbed mono- and poly-
disperse sticky, elastic particles in 2D done by Groot et al.38,39
Next we want to estimate what is the maximum overrun
(OVmax[%] ¼ 100f/(1 � f), where f, is the gas volume fraction),
that is possible to achieve for a given particle concentration, by
assuming that all EC particles are adsorbed at the air–water
interface of the foam in a close packed mono-layer in a hexagonal
lattice. This could be done by making a simple calculation of the
total surface area per unit volume of foam for a given bubble size
and overrun (OV), followed by counting the number of particles
needed to adsorb on this surface in close packed lattice and then
converting this amount into weight fraction of particles in the
initial solution. Since this is a linear expression, by solving with
respect to the OV we get:
OVmax½%� ¼ wtEC ½%� sinðwÞ2
a
rl
rEC
Rbubble3;2
REC3;2
(2)
where, wtEC ¼ 2 wt% is the weighted fraction of EC particles in
the initial dispersion, rl� 1 kg l�1 is the density of the non aerated
dispersion, rEC¼ 1.3 kg l�1 is the density of EC particles assumed
to be equal to the density of EC material, Rbubble3,2 � 50 mm is the
volume to surface averaged (Sauter mean) bubble radius andREC3,2
� 65 nm is the volume to surface averaged radius of EC particles,
while a is the surface coverage fraction, which for hexagonally
packed mono-disperse spheres is �0.91.
If the experimentally measured OV is smaller than the pre-
dicted value, it means that not all particles are adsorbed on the
interface. If most of EC particles are not in the bulk, then the
ratio between predicted vs. measured OV can be used as indica-
tion of the number of EC layers formed around a single foam
bubble. Calculation using eqn (2) shows that the maximum
possible OV in this case should be around 325%. While from
Fig. 4B it is clear that after shaking 10 ml of 2 wt% EC dispersion
has produced around 25 ml of foam, thus OV ¼ 100 � (25 � 10)/
10 ¼ 150%. From this calculation, it is clear that particles are in
excess in this case and that a large part of them should be in the
bulk, trapped within the Gibbs–Plateau borders, or present in the
drained liquid, or forming multi-layers around the bubble
surfaces. The fact that after creaming the serum is transparent,
indicating that EC particle concentration in the drained liquid is
very low. Indeed from the cryo-SEM depicted in Fig. 7G, we can
see that only very few free particles are observed in the bulk while
the majority of the particles are adsorbed/attached to the bubble
surface and forming multiple layers around it. This is well inline
Soft Matter

Dow
nloa
ded
by U
NIL
EV
ER
RE
SEA
RC
H L
AB
OR
AT
OR
Y o
n 22
Dec
embe
r 20
11Pu
blis
hed
on 2
2 D
ecem
ber
2011
on
http
://pu
bs.r
sc.o
rg |
doi:1
0.10
39/C
1SM
0651
8A
View Online
with the estimation, which is also quite sensitive to the bubble
diameter as well. However, it is worth noting that the average
number of layers around the bubbles can vary from a single layer
as in the case observed in polystyrene particles stabilized
bubbles,40 to multi-layers, depending on the type of the aeration
procedure used, EC particle concentration, pH and ionic
strength. In summary, it can be concluded that the stability of EC
bubbles in the hand shaken foams can be mainly attributed to the
EC particle (multi) layer, which provides a steric hindrance
against bubble coalescence. In addition, cryo-SEM images show
that only a few EC particles are present in the continuous phase,
and most EC particles are used to stabilize bubbles. Together
with the high foam stability and the non-spherical ‘‘armored’’
bubble morphology, cryo-SEM confirms that EC particles are an
effective Pickering stabilizer for foams.
In order to further confirm how pH affects foamability and
foam stability, the pH of the EC dispersion was tuned by adding
desired amounts of aqueous HCl solution, followed by standing
for half an hour. The resulting suspension was shaken for 2 min
by hand. From the pictures shown in Fig. 4, it can be found that
initially stable EC dispersion tends to aggregate after changing
the pH from 6.8 to 3.0 by adding HCl. However after shaking,
these particle aggregates are easily broken, and can contribute to
foam stabilization. Fig. 8 shows digital pictures of EC foam with
different pH produced by hand-shaking. The results in Fig. 8 can
be divided into 3 regions: pH < 4.0; 4.0 < pH < 12.0; pH > 12.0.
When the pH of the EC dispersion is between 4.0 to 12.0, only
a few visible bubbles can be found, and they disappear after
several hours. The liquid phase separated from the foam due to
creaming is highly turbid, which indicates that a large part of the
EC particles are not adsorbed at the air–water interface and thus
do not contribute to the foam stabilization. Once the pH value
reaches 4.0, foamability increases significantly and a little
amount of translucent water solution drains from the foam. The
translucent water indicates that it is a diluted dispersion of EC
particles and the majority of the particles have been adsorbed to
the air–water interface. However, at lower pH (normally less
than 3.7) or higher pH (normally higher than 13.0), stable foam is
formed and the water separated from the foam is clear. For low
pH, this phenomenon can be explained by the pH dependence of
z-potential and size of EC particles, shown in Fig. 2. For
extremely high pH, the surface charge is still expected to be
highly negative, but the overall ionic strength (approx. 100 mM
at pH 13.0), could induce a screening of the charge, leading to
Fig. 8 Pictures of EC foam produced by hand-shaking for 2 min at
different pH. The pictures were taken 30 min after the foams were
formed. The pH values of the EC dispersions are 1.0, 2.9, 4.0, 6.5, 12.0,
13.5 respectively from A to F.
Soft Matter
reduced repulsion barrier between particles and the air–water
interface.
3.3 Effect of the electrolyte concentration on the foamability
Similar to acid and base, electrolytes such as NaCl can screen the
surface charge of particles efficiently, and decrease both the EC
particle adsorption barrier at air–water interface and the inter-
particle repulsion. Thus it is therefore expected that NaCl can
enhance the foamability and the foam stability of EC dispersions,
but will also destabilize the dispersions as shown and discussed
before. Fig. 9 shows the digital pictures of EC foams with
different concentrations of NaCl produced by hand-shaking.
Again, without salt, the EC dispersion can only produce some
visible bubbles which disappear in several hours. The foamability
and foam stability of the EC dispersion can be improved by
adding a small amount of NaCl. Finer bubbles could be formed
when 0.01 M NaCl was added into the EC dispersion. However,
we observed a slightly bluish appearance in the water separated
from the foam, indicating that a portion of the EC particles did
not stabilize the bubbles at this condition. With increasing salt
concentration, EC dispersions show improved foamability and
foam stability. In summary as the concentration of salt increases,
the absolute value of the z-potential decreases and the EC
particles aggregate, while these dispersions can produce stable
foams.
Finally, various electrolytes, acids, and bases, including HCl,
H2SO4, HAc, citric acid, NaOH, NaCl, CaCl2 and KCl were
added into the EC dispersion. Results confirm that all these
electrolytes can enhance the foamability and foam stability of EC
dispersion, in line with the analysis in the previous section. It is
worthwhile noting that EC particles show similar foaming
behaviors to that of polystyrene particles12 and silica particles.20
3.4 Effect of the foaming method on the bubbles’ size and foam
stability
From practical point of view, it is very important to control the
bubble size and size distribution, which can for example affect
the texture and appearance of food products. Traditionally,
foams can be produced by agitation (shaking) or mechanical
whipping of the colloidal systems. To represent this variability of
different methods and to obtain bubbles with different sizes, we
Fig. 9 Digital pictures of EC foam produced by hand-shaking for 2 min
at different concentration of NaCl. The NaCl concentration of EC
dispersions are 0 M, 0.01 M, 0.05M, 0.1 M, respectively from A to D, the
pH of all samples being neutral.
This journal is ª The Royal Society of Chemistry 2011

Dow
nloa
ded
by U
NIL
EV
ER
RE
SEA
RC
H L
AB
OR
AT
OR
Y o
n 22
Dec
embe
r 20
11Pu
blis
hed
on 2
2 D
ecem
ber
2011
on
http
://pu
bs.r
sc.o
rg |
doi:1
0.10
39/C
1SM
0651
8A
View Online
produced EC foams by using: hand-shaking, Kenwood Kitchen
mixer or hand-held cappuccino/frappe mixer (Aerolatte), all of
which were expected to produce relatively large bubbles. In order
to obtain small EC bubbles, two high shear mixers, an Ultra
Turrax and Silverson, were used as well. The resulting foam
microstructures are shown in Fig. 10.
For 1.0 wt% EC dispersion (pH¼ 3.0), aerated using Aerolatte
and Kenwood mechanical mixers, we observed that the final
foam volume can be from 2 up to 11 times larger than the volume
of initial solution, depending on the time of whipping. This
indicates that the maximum overrun that can be achieved using
these methods is around 1000%. The latter is confirmed by the
fact that the same overrun has been achieved at two different
mixing speeds with the Kenwood (mid and high), given that
sufficient time is given in the case of lower speed. What changes
in these cases is the time needed for the system to achieve the
same plateau value of the overrun. The maximum overrun is also
independent of the initial volume of the solution in the range
150–250 ml. At larger liquid volumes the maximum foam volume
is limited by the volume of the mixing bowl and the fact that
whipping conditions change when the whisks get completely
immersed in the foam.
Resulting foams prepared by Kenwood are composed from
relatively large air bubbles with sizes ranging from 100 mm to
millimetre scale (picture not shown). Using eqn (2) for the
maximum overrun and taking values for the volume to surface
averaged bubble radius R3,2 ¼ 300 microns, EC concentration is
1.0 wt%, we estimate that maximum theoretically predicted
overrun for this system is around 10 00%. As one can see both
experimentally and theoretically predicted OV are close, indi-
cating that for the case of larger OV, almost all particles are used
to stabilize the bubbles, forming most likely monolayer. The
decrease of the number of adsorbed particle layers in mechan-
ically whipped foams, when compared to hand shaking ones, is
expected. Indeed, the mechanical devices can provide sufficient
mechanical energy density, allowing incorporating much larger
Fig. 10 Optical images of bubbles from different aeration methods.
Foam was produced from 1% EC dispersion (pH ¼ 3.4): A, by hand-
shaking for 2 min or B, by using Silverson (9500 rpm) or C, by Ultra-
Turrax(13 500 rpm) or D, by Ultra-Turrax(21 500 rpm). A, C, D, scale
bar ¼ 200 mm; B, scale bar ¼ 50 mm.
This journal is ª The Royal Society of Chemistry 2011
amount of gas, with bigger total surface area, which in turn
requires a larger amount of particles to fully cover. In this case
the maximumOV is mainly limited by the particle concentration,
given that energy density, whipping time and bowl volume is
sufficient. While in the case of manual shaking, energy density is
low and a much lower amount of gas can be trapped, thus the
total surface area of the foam is smaller and the excess particles
can formmulti-layers at the interface and theOV is limited by the
mechanical energy input that can be supplied by shaking as well
the volume of the cylinder and its geometry (determining energy
dissipations).
Interestingly when even higher shear devices such as the Sil-
verson are used, the bubbles’ size in the foam turns out to be
much smaller than with other methods, i.e. in the order of 10 mm.
At first it might seem that this confirms the well known principle
that higher energy input or higher shear stress would lead to
smaller bubbles, due to the higher energy input allowing
breaking initially big bubbles into small ones.41–44 However, the
step-change in bubble size could also suggest a different mech-
anism of bubble formation is in place for this device. In hand
shaking and in other ‘‘lower’’ shear devices such as the Kenwood
kitchen mixer, gas is mechanically entrapped and large pockets/
bubbles are consequently broken down into smaller bubbles. In
high shear devices, fluid velocity in the narrow gaps, can reach
much higher values. So the hydrodynamic cavitation can occur
due to hydrodynamic pressure drop. This will lead to nucleation
and growth of bubbles at high velocity zone, which normally will
collapse when the fluid exits the high shear zone and the velocity
drops, thus hydrodynamic pressure increases. In the absence of
surfactants, the cavitated bubbles will collapse, leading to the
typical cavitation sound and also to high stresses in the zone of
collapse, which can lead to significant wear and damage of all the
materials and surfaces in contact. However in the presence of
particles, one can speculate that expanding bubbles, in a low
shear zone can sweep particles. Due to their high attachment
energy these particles remain on the surface when bubbles enter
the high pressure zone and start to collapse, which in turn can
prevent the complete bubble collapse. Upon re-circulation in the
system, these bubbles will continuously expand and shrink,
which will lead to accumulation of the particle at their surface,
and compactification of the layer.
This hypothesis is confirmed by visual and audio observations:
at low shear rates of the mixer bubbles are not formed and the
foam formation starts only when certain critical velocity is
reached and the typical cavitation noise is heard, at the same time
the solution becomes more turbid and its volume starts to rise.
We also observed that the maximum OV in this system is limited
to about 40%, unless the mixing head is raised near the solution
surface or RPM increased, which in both cases leads to pertur-
bation of the upper solution surface and incorporation of air in
the form of larger bubbles. Indeed in the latter we observe two
populations of bubbles, small ones with size around 5 microns
which are likely formed due to cavitation and larger ones of order
of hundreds of microns. When, however, additional air is not
incorporated (and thus system is limited to about 40%OV) and
only small bubbles are observed.
Again a simple estimation of the maximumOV shows that, for
1wt% dispersion and bubbles with radius of 5 mm, the expected
maximum OV should be around 50% indicating that in this case
Soft Matter

Fig. 12 10 cm tall snow man made from EC foam, which was stable for
a period of more than 1 year long after the foam has been dried
completely, indicating that EC particles form a self-supporting structure
that can be further templated for various applications.
Dow
nloa
ded
by U
NIL
EV
ER
RE
SEA
RC
H L
AB
OR
AT
OR
Y o
n 22
Dec
embe
r 20
11Pu
blis
hed
on 2
2 D
ecem
ber
2011
on
http
://pu
bs.r
sc.o
rg |
doi:1
0.10
39/C
1SM
0651
8A
View Online
almost all of the particles are used to form bubbles. However
when the particle concentration is increased to 2 wt% (shown in
Fig. 11), while keeping the same RPM in the mixer, the
maximum OV remains almost the same (again unless external air
is trapped form the upper surface of the solution), while bubble
size is reduced by a factor of 2. If the gas supply was not the
limiting factor, one would expect that an increase of the
concentration at a fixed energy input could lead to the formation
of foams with the same bubble sizes (determined by the energy
density in the system) and twice as large OV. The latter seems to
be an indication that either the gas supply is limited in this case or
that insufficient aeration time has been applied at least for the
case of low concentration. However when we varied the foam
formation time, we observe that the maximum foam volume and
the final bubble size are achieved in the first few minutes and then
they level off. The last observation confirms that in this case the
maximum OV is likely to be determined by the limited supply of
gas available for production of stable cavitating microbubbles,
i.e. linked most likely with the equilibrium amount of dissolved
gas (nitrogen) in the solution. In addition, the increase of the
particle concentration from 1.0 to 2.0 wt%, increases slightly the
viscosity of the solution at low pH or high salt concentrations,
which also facilitates a smaller bubble formation, but we think
that this is a secondary effect in this case.
It is observed that the Silverson and Ultra-Turrax show similar
trends and the obtained foams were composed of small bubbles
and were super stable as well, similar to the foams formed by low
shear mixers and hand shaking, which led to larger bubbles.
What is also interesting is that these two types of foams can be
mixed and remain stable nevertheless they are composed of very
small and big bubbles at the same time.
Fig. 12 shows an image of a ‘‘never-melting’’ snowman made
of creamed EC foam obtained using the Kenwood mixer. The
fresh foam was left to drain for 3 days to drain and then the
relatively dry EC foam on top was taken out for shaping. The
picture of this never-melting snow man has been taken 5 months
after it has been made and it is very stable and standing for more
than a year in the open atmosphere.
To our knowledge, this is the first time to prepare so small
bubbles stabilized by particles. From the observation of the EC
foam, shown in Fig. 11, EC foam produced using Ultra-Turrax
Fig. 11 Optical microscopy of EC bubbles. EC bubbles were produced
by homogenizing 20 ml 2% EC dispersion (pH ¼ 3) at 21 500rpm for 2
min by Ultra-Turrax, scale bar ¼ 20 mm.
Soft Matter
homogenizer appears very fine and creamy, indicating that even
by visual observations, these foams are made of extremely small
bubbles.
3.5 Disproportionation stability of foams prepared from EC
dispersion
Apart from the foam stability probed in pure water, which
comprises a combination of drainage, coalescence, and dispro-
portionation processes, we measured the evolution of the average
bubble size in thickened foams using turbidimetry. The advan-
tage of this method is that we can study disproportionation only
and make an attempt to quantify the coarsening time.
When mixing foams obtained by the EC dispersion from
various pH values, we found that the foam formed at neutral pH
without salt yielded foam with bubbles too large to be mixed
properly into the xanthan gum aqueous solution, which provides
yield stress sufficient to keep bubbles suspended. Foams formed
using a Kenwood kitchen mixer or Silverson high shear mixer at
acidic conditions or in the presence of 20 mM MgCl2 formed
homogeneous foams in xanthan and were analyzed further.
Fig. 13 shows the time evolution of the squared bubble size
diameter. The curves can be reasonably fitted with the linear
model over the range of approximately 3 days (see inset). This
provides an estimate of the coarsening times of EC-foams, which
are approximately 7 and 9 days for salt and acid respectively.
Such a coarsening time is already about two orders of magnitude
higher than coarsening times found for some reference materials
such as milk proteins.32 This result indicates that the surface layer
formed under these conditions by EC particles provides
substantial resistance against shrinkage and/or growth of
bubbles in foam. It is also worthy to note that foams formed
under high salt conditions coarsen slightly faster than the foams
formed under acidic conditions, indicating that either the particle
This journal is ª The Royal Society of Chemistry 2011

Fig. 13 Relative squared bubble diameter d2(t)/d2(0) of 50 vol% air foams
in a xanthan solution. The foams were generated from aqueous solutions
containing 2 wt%ECusing aKenwoodmixer (A) or Silversonmixer, (:)
and the resulting foams were transferred into 0.5 wt% xanthan solution.
Solid symbols refer to acid induced foams, open symbols to salt induced
foam. The inset shows the same data set in detail over the first 3 days.
Dow
nloa
ded
by U
NIL
EV
ER
RE
SEA
RC
H L
AB
OR
AT
OR
Y o
n 22
Dec
embe
r 20
11Pu
blis
hed
on 2
2 D
ecem
ber
2011
on
http
://pu
bs.r
sc.o
rg |
doi:1
0.10
39/C
1SM
0651
8A
View Online
detachment energy or the layer strength is slightly higher for the
acid-induced case. This can be understood from the fact that
acidification leads to a reduction of the surface charge, whereas
salt only screens the charge at the surface.45
The foam prepared by the Silverson mixer, consists of bubbles
in the range of 5–10 mm and shows a similar size evolution to the
foams prepared in the Kenwood mixer (initial bubble size �150
mm) over the first few days. However, after that, the foam
prepared in the Kenwood mixer drains faster, since the yield
stress of the xanthan solution is not sufficient to suspend such big
bubbles. For this reason we had stopped further monitoring the
sample bubble size distribution. Nevertheless the stability of the
snow-man shown in Fig. 12 is an indication that these foams are
ultra stable as well and can remain for a period of months as well;
even when they are completely dry.
The foams prepared in the Silverson mixer did not show much
creaming, apart from a few visible bubbles. When we analyzed
the foam over prolonged time, we observed an apparent decrease
of the average bubble diameter, suggesting that in the majority of
the foam, large bubbles disappeared and small ones remained.
This observation confirms the bubble stability over months and
indicates that the initial coarsening times represent a limited
stage of initial coarsening. During this stage two things happen:
(1) small bubbles will reinforce because of further consolidation
of the EC particle layer and (2) large bubbles grow and, given the
cracks in the particle layers observed by SEM (Fig. 7F), the EC-
layer may rupture. As a result of this uncovered areas on the
bubble surface appear and bubbles may coalesce and eventually
cream or even escape to the headspace, as suggested from a 20%
loss of air after two months. Hence, the coarsening time
measured over the first three days is an underestimate of the
coarsening time of the small bubbles, which have a lifetime of
more than 2–3 months.
4 Conclusions
We have shown that aqueous foams with long term stability can
be formed using particles derived from ethyl cellulose using
a simple anti-solvent precipitation method. The foamability and
This journal is ª The Royal Society of Chemistry 2011
foam stability of EC dispersions is found to depend greatly on
the surface charge of the EC particles, which can be tuned by
adding some electrolytes, such as acid, base or salt. When the
absolute value of the z-potential of EC particles is well below
25 mV, i.e. at pH 4 or ionic strength >20 mM, EC particles
aggregate and foam prepared from these aggregated particles can
be stable for months. We explained this behavior to be due to the
adsorption of hydroxyl ions at hydrophobic surfaces—EC–water
and air–water in this case. This leads to the formation of an
apparent negative charge on these surfaces, which in turn leads to
a strong electrostatic repulsion between the particles and particle
and air–water surface. Due to their electrostatic origin these
repulsions can be suppressed by a decrease of pHwhich decreases
the concentration of OH- ions and thus the surface charge at
both air–water and EC–water surfaces and/or via addition of
electrolyte which screens it. We believe that this could be
a universal phenomenon occurring in many particle-stabilized
systems like hydrophobic latex or modified silica particles, which
do or do not have native charge on their surface. In this case the
dispersion destabilization is indicative of good foam stability, but
is not the cause of it. There could also be changes of the particle
contact angle caused by changes of pH or ionic strength, thus
making the particles more hydrophobic. However at least for the
case of EC, we have shown that this is the secondary order effect,
when compared to changes of particle adsorption barrier, which
governs whether particles can be adsorbed at the air–water
interface during the foaming processes.
In the conditions where we obtain super stable foams (low pH
and/or high or moderate ionic strengths), cryo-SEM images of
the foam reveal that EC stabilized foams are covered by a closely
packed mono or multi layer of EC particles, which provides
a steric hindrance against bubbles coalescence and a mechanical
resistance against bubble shrinkage. Bubbles with various kinds
of size, from several microns to hundreds of microns, are
obtained by changing the dispersion method or the shear rate.
Even small bubbles (d < 10 mm) also show exceptional stability
against disproportionation. To monitor the bubble size evolution
of these foams, we mix them with aqueous xanthan solution,
which provides a weak yield stress sufficient to keep bubbles
suspended and thus slowing the liquid drainage. We observe that
the bubble size evolution with time follows a two-step process
with an initial stage having a coarsening time of approximately 1
week, followed by a plateau, where the coarsening has been
arrested for a period of months. In the first stage, small bubbles
consolidate and large bubbles grow, becoming vulnerable to
creaming and coalescence. In the second stage, consolidated
small bubbles remain and no changes occur for at least 2–3
months. Because of its tunable bubble size and exceptional
stability, foam stabilized by EC particles can find many practical
applications. EC particle stabilized foams differ from most other
particle stabilized foams in that the initial EC material has food
grade status for specific applications in several markets and thus
may offer scope for the stabilization of food foams.
Acknowledgements
We would like to thank Mr. Mark Kirkland and Dr Jaap Nijsse
for Cryo-SEMmeasurement and Dr Rob Groot and Dr Andrew
Cox for the stimulating discussions. MK and AC are from
Soft Matter

Dow
nloa
ded
by U
NIL
EV
ER
RE
SEA
RC
H L
AB
OR
AT
OR
Y o
n 22
Dec
embe
r 20
11Pu
blis
hed
on 2
2 D
ecem
ber
2011
on
http
://pu
bs.r
sc.o
rg |
doi:1
0.10
39/C
1SM
0651
8A
View Online
Unilever R&D, Colworth in UK, JN and RG are from Unilever
R&D, Vlaardingen in The Netherlands. We also would like to
thank to the referees of this paper for their critical and
constructive comments, which helped to improve the quality of
the manuscript significantly.
References
1 D. Myers, Surfaces, Interfaces, and Colloids: Principles andApplications, Second Edition, Wiley-VCH, New York, 1999.
2 S. S. Shankar, U. S. Patil, B. L. V. Prasad and M. Sastry, Langmuir,2004, 20, 8853–8857.
3 A. R. Studart, U. T. Gonzenbach, E. Tervoort and L. J. Gauckler, J.Am. Ceram. Soc., 2006, 89, 1771–1789.
4 U. T. Gonzenbach, A. R. Studart, E. Tervoort and L. J. Gauckler,Angew. Chem., Int. Ed., 2006, 45, 3526–3530.
5 T. N. Hunter, R. J. Pugh, G. V. Franks and G. J. Jameson, Adv.Colloid Interface Sci., 2008, 137, 57–81.
6 P. Walstra, Physical Chemistry of Foods, Marcel Dekker, New York,2006.
7 H. Wildmoser, J. Scheiwiller and E. J. Windhab, LWT–Food Sci.Technol., 2004, 37, 881–891.
8 J. R. Lindner, Nat. Rev. Drug Discovery, 2004, 3, 527–532.9 W. Drenckhan, Angew. Chem., Int. Ed., 2009, 48, 5245–5247.10 J. I. Park, E. Tumarkin and E. Kumacheva, Macromol. Rapid
Commun., 2010, 31, 222–227.11 E. Dressaire, R. Bee, D. C. Bell, A. Lips and H. A. Stone, Science,
2008, 320, 1198–1201.12 J. C. Wilson, PhD Thesis, University of Bristol, UK, 1980.13 B. P. Binks, Curr. Opin. Colloid Interface Sci., 2002, 7, 21–41.14 Z. Du, M. P. Bilbao-Montoya, B. P. Binks, E. Dickinson, R. Ettelaie
and B. S. Murray, Langmuir, 2003, 19, 3106–3108.15 R. G. Alargova, D. S. Warhadpande, V. N. Paunov and O. D. Velev,
Langmuir, 2004, 20, 10371–10374.16 B. P. Binks and T. S. Horozov, Angew. Chem., Int. Ed., 2005, 44,
3722–3725.17 A. B. Subramaniam, M. Abkarian, L. Mahadevan and H. A. Stone,
Nature, 2005, 438, 930.18 S. Fujii, P. D. Iddon, A. J. Ryan and S. P. Armes, Langmuir, 2006, 22,
7512–7520.19 U. T. Gonzenbach, A. R. Studart, E. Tervoort and L. J. Gauckler,
Langmuir, 2006, 22, 10983–10988.20 B. P. Binks, B. Duncumb and R. Murakami, Langmuir, 2007, 23,
9143–9146.
Soft Matter
21 A. Cervantes Martinez, E. Rio, G. Delon, A. Saint-Jalmes,D. Langevin and B. P. Binks, Soft Matter, 2008, 4, 1531–1535.
22 A. L. Campbell, B. L. Holt, S. D. Stoyanov and V. N. Paunov, J.Mater. Chem., 2008, 18, 4074–4078.
23 B. P. Binks, M. Kirkland and J. A. Rodrigues, Soft Matter, 2008, 4,2373–2382.
24 A. L. Campbell, S. D. Stoyanov and V. N. Paunov, Soft Matter, 2009,5, 1019–1023.
25 J. I. Park, Z. Nie, A. Kumachev, A. I. Abdelrahman, B. P. Binks,H. A. Stone and E. Kumacheva, Angew. Chem., Int. Ed., 2009, 48,5300–5304.
26 W. Zhou, J. Cao, W. Liu and S. Stoyanov, Angew. Chem., Int. Ed.,2009, 48, 378–381.
27 E. Dickinson, Curr. Opin. Colloid Interface Sci., 2010, 15, 40–49.28 21 CFR172.868, U.S. Food and Drug Administration, 2010.29 Eur. Food Standards Agency J., 2004, p. 1.30 E. Mathiowitz, Non-degradable polymers for drug delivery in:
Encyclopedia of controlled drug delivery, 2 Volume Set, Wiley,1999.
31 J. Raut, S. D. Stoyanov, C. Duggal, E. G. Pelan and L. N. Arnaudov,Hydrodynamic Cavitation: A Bottom-Up Approach to LiquidAeration, Soft Matter, 2011, submitted.
32 T. B. J. Blijdenstein, P. W. N. de Groot and S. D. Stoyanov, SoftMatter, 2010, 6, 1799–1808.
33 E. Plasari, P. Grisoni and J. Villermaux, Chem. Eng. Res. Des., 1997,75, 237–244.
34 K. G. Marinova, R. G. Alargova, N. D. Denkov, O. D. Velev,D. N. Petsev, I. B. Ivanov and R. P. Borwankar, Langmuir, 1996,12, 2045–2051.
35 A. Graciaa, G. Morel, P. Saulnier, J. Lachaise and R. S. Schechter, J.Colloid Interface Sci., 1995, 172, 131–136.
36 L. G. J. Fokkink and J. Ralston, Colloids Surf., 1989, 36, 69–76.37 L. N. Arnaudov, O. J. Cayre, M. A. S. Cohen, S. D. Stoyanov and
V. N. Paunov, Phys. Chem. Chem. Phys., 2010, 12, 328–331.38 R. D. Groot and S. D. Stoyanov, Soft Matter, 2010, 6, 1682–
1692.39 R. D. Groot and S. D. Stoyanov, Soft Matter, 2011, 7, 4750–4761.40 D. Dupin, J. R. Howse, S. P. Armes and D. P. Randall, J. Mater.
Chem., 2008, 18, 545–552.41 G. I. Taylor, Proc. R. Soc. London, Ser. A, 1932, 138, 41–48.42 H. P. Grace, Chem. Eng. Commun., 1982, 14, 225–277.43 J. M. H. Janssen and H. E. H. Meijer, J. Rheol., 1993, 37, 597–608.44 U. T. Gonzenbach, A. R. Studart, E. Tervoort and L. J. Gauckler,
Langmuir, 2007, 23, 1025–1032.45 R. J. Hunter, Foundations of colloid Science, Volume I, Clarendon
Press, Oxford, 1987.
This journal is ª The Royal Society of Chemistry 2011