Embed Size (px)
Citation preview
i
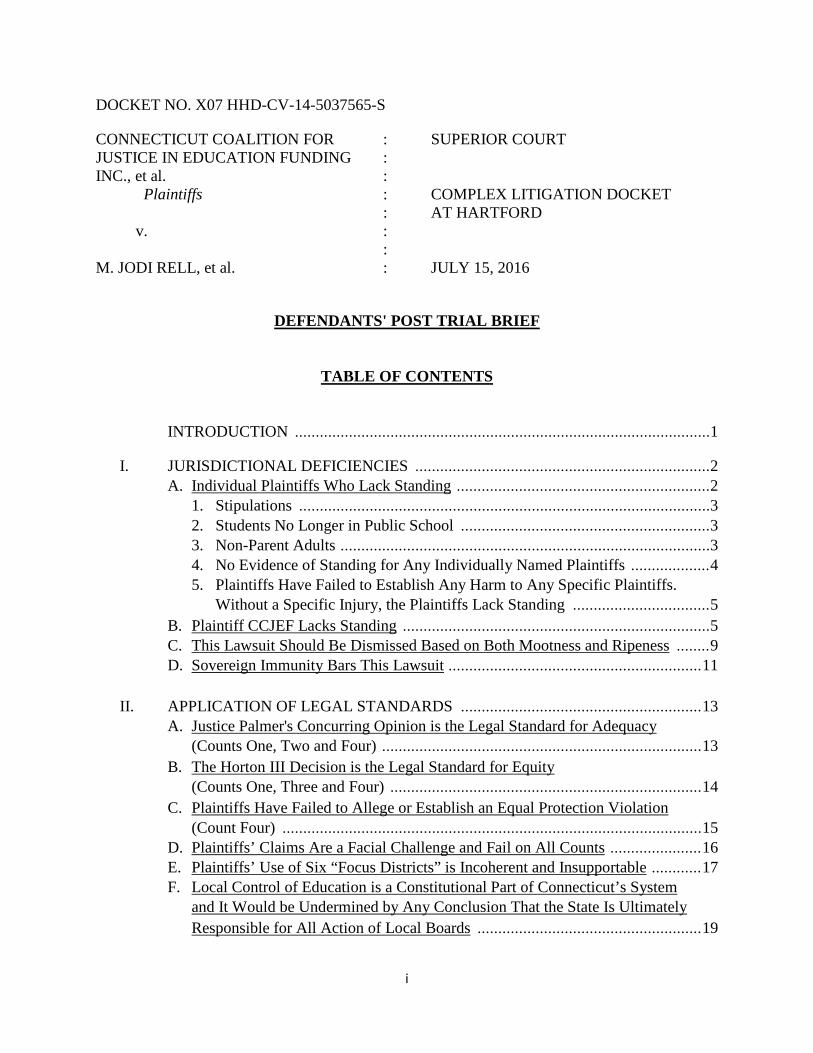
DOCKET NO. X07 HHD-CV-14-5037565-S
CONNECTICUT COALITION FOR : SUPERIOR COURT JUSTICE IN EDUCATION FUNDING : INC., et al. : Plaintiffs : COMPLEX LITIGATION DOCKET : AT HARTFORD v. : : M. JODI RELL, et al. : JULY 15, 2016
DEFENDANTS' POST TRIAL BRIEF
TABLE OF CONTENTS
INTRODUCTION .................................................................................................... 1
I. JURISDICTIONAL DEFICIENCIES ....................................................................... 2 A. Individual Plaintiffs Who Lack Standing ............................................................. 2
1. Stipulations ................................................................................................... 3 2. Students No Longer in Public School ............................................................ 3 3. Non-Parent Adults ......................................................................................... 3 4. No Evidence of Standing for Any Individually Named Plaintiffs ................... 4 5. Plaintiffs Have Failed to Establish Any Harm to Any Specific Plaintiffs.
Without a Specific Injury, the Plaintiffs Lack Standing ................................. 5 B. Plaintiff CCJEF Lacks Standing .......................................................................... 5 C. This Lawsuit Should Be Dismissed Based on Both Mootness and Ripeness ........ 9 D. Sovereign Immunity Bars This Lawsuit ............................................................. 11
II. APPLICATION OF LEGAL STANDARDS .......................................................... 13
A. Justice Palmer's Concurring Opinion is the Legal Standard for Adequacy (Counts One, Two and Four) ............................................................................. 13
B. The Horton III Decision is the Legal Standard for Equity (Counts One, Three and Four) ........................................................................... 14
C. Plaintiffs Have Failed to Allege or Establish an Equal Protection Violation (Count Four) ..................................................................................................... 15
D. Plaintiffs’ Claims Are a Facial Challenge and Fail on All Counts ...................... 16 E. Plaintiffs’ Use of Six “Focus Districts” is Incoherent and Insupportable ............ 17 F. Local Control of Education is a Constitutional Part of Connecticut’s System
and It Would be Undermined by Any Conclusion That the State Is Ultimately Responsible for All Action of Local Boards ...................................................... 19
ii
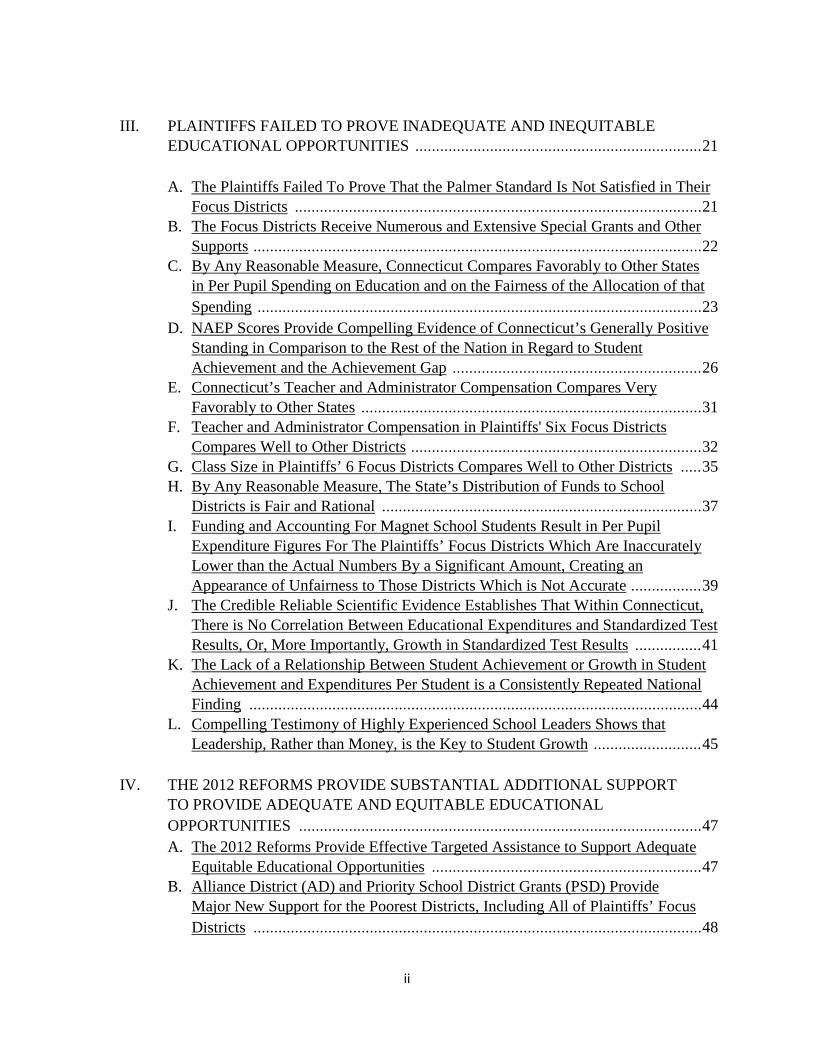
III. PLAINTIFFS FAILED TO PROVE INADEQUATE AND INEQUITABLE
EDUCATIONAL OPPORTUNITIES ..................................................................... 21
A. The Plaintiffs Failed To Prove That the Palmer Standard Is Not Satisfied in Their Focus Districts .................................................................................................. 21
B. The Focus Districts Receive Numerous and Extensive Special Grants and Other Supports ............................................................................................................ 22
C. By Any Reasonable Measure, Connecticut Compares Favorably to Other States in Per Pupil Spending on Education and on the Fairness of the Allocation of that Spending ........................................................................................................... 23
D. NAEP Scores Provide Compelling Evidence of Connecticut’s Generally Positive Standing in Comparison to the Rest of the Nation in Regard to Student Achievement and the Achievement Gap ............................................................ 26
E. Connecticut’s Teacher and Administrator Compensation Compares Very Favorably to Other States .................................................................................. 31
F. Teacher and Administrator Compensation in Plaintiffs' Six Focus Districts Compares Well to Other Districts ...................................................................... 32
G. Class Size in Plaintiffs’ 6 Focus Districts Compares Well to Other Districts ..... 35 H. By Any Reasonable Measure, The State’s Distribution of Funds to School
Districts is Fair and Rational ............................................................................. 37 I. Funding and Accounting For Magnet School Students Result in Per Pupil
Expenditure Figures For The Plaintiffs’ Focus Districts Which Are Inaccurately Lower than the Actual Numbers By a Significant Amount, Creating an Appearance of Unfairness to Those Districts Which is Not Accurate ................. 39
J. The Credible Reliable Scientific Evidence Establishes That Within Connecticut, There is No Correlation Between Educational Expenditures and Standardized Test Results, Or, More Importantly, Growth in Standardized Test Results ................ 41
K. The Lack of a Relationship Between Student Achievement or Growth in Student Achievement and Expenditures Per Student is a Consistently Repeated National Finding ............................................................................................................. 44
L. Compelling Testimony of Highly Experienced School Leaders Shows that Leadership, Rather than Money, is the Key to Student Growth .......................... 45
IV. THE 2012 REFORMS PROVIDE SUBSTANTIAL ADDITIONAL SUPPORT TO PROVIDE ADEQUATE AND EQUITABLE EDUCATIONAL OPPORTUNITIES ................................................................................................. 47 A. The 2012 Reforms Provide Effective Targeted Assistance to Support Adequate
Equitable Educational Opportunities ................................................................. 47 B. Alliance District (AD) and Priority School District Grants (PSD) Provide
Major New Support for the Poorest Districts, Including All of Plaintiffs’ Focus Districts ............................................................................................................ 48
iii
C. Commissioner’s Network Grants (CN) Provide More Targeted Support ............ 51 D. School Improvement Grants (SIG) Provide More Targeted Support .................. 52 E. The Next Generation Accountability System is Well-Designed to Support and
Increase Accountability of Leaders, Schools and Districts ................................. 52 F. Connecticut Has Created and Implemented More Objective and Uniform
Teacher Performance Measures As Evidenced by PEAC, SEED, and CT Core Rubrics, That Are Rationally Related to the Education of Students...... 56
G. Connecticut Uses a Multitude of Effective Incentives and Opportunities to Resolve Teacher Shortage Areas ....................................................................... 62
H. SDE and Its Partners Offer Free Professional Development to All Types of Educators on a Multitude of Topics ................................................................... 63
I. Connecticut Provides Adequate and Equitable Opportunities to English Learners ............................................................................................... 65
J. Connecticut Provides Adequate and Equitable Opportunities to Special Education Students ............................................................................................................ 69
K. There is Adequate and Equitable Funding for Appropriate Special Education Services ............................................................................................................ 74
L. Although There is No Constitutional Right to Preschool Education, Connecticut Provides Broad and Effective Preschool Opportunities – More and Better Than Almost Any Other State .................................................................................... 76
M. Connecticut Provides Excellent Kindergarten Opportunities .............................. 81 N. Lead Connecticut Develops and Teaches Critical School Leadership Skills ....... 82 O. Connecticut Provides Broad Wraparound Services (Student Supports) .............. 84 P. Connecticut Provides Additional Funds for Technology and Other Additional
Financial Assistance to Low Performing Districts ............................................. 85 Q. The State Provided Effective Special Master Assistance to Windham and New
London ............................................................................................................. 87 R. The State Provides Adequate and Equitable Funding For School Facilities ........ 91
V. THE TESTIMONY AND REPORTS OF DR. ROBERT PALAICH SHOULD BE
STRICKEN FROM THE RECORD BECAUSE THEY ARE NOT SCIENTIFIC AND LACK VIRTUALLY ALL BASIC INDICIA OF RELIABILITY ................. 93
VI. IF THE COURT RULES IN FAVOR OF PLAINTIFFS, RELIEF IS LIMITED TO DEFERRAL TO LEGISLATIVE ACTION ............................................................ 96
A. The Connecticut Supreme Court Dictates Deferral to the Legislature to Determine Competing Constitutional Priorities………………………………………………... 96
B. Any Injunctive Relief Must Be Limited to the Complaint, the Prayer for Relief, and Proper Parties Before the Court ............................................................................... 98
iv
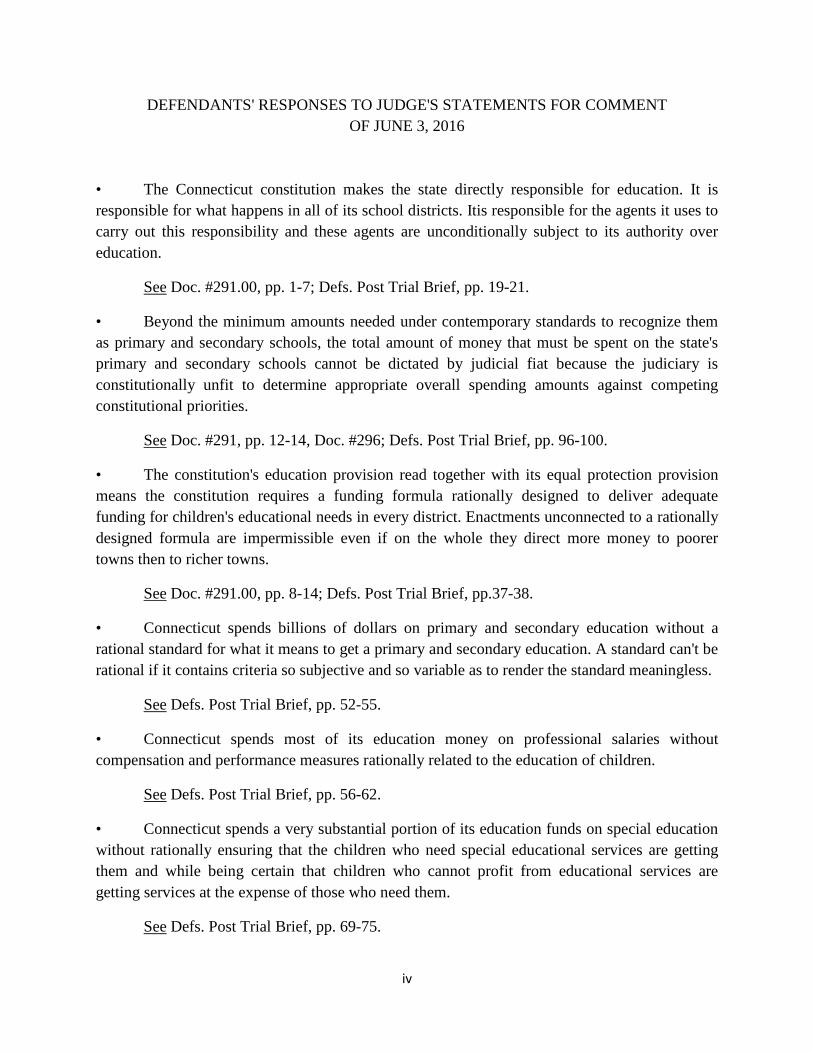
DEFENDANTS' RESPONSES TO JUDGE'S STATEMENTS FOR COMMENT OF JUNE 3, 2016
• The Connecticut constitution makes the state directly responsible for education. It is responsible for what happens in all of its school districts. Itis responsible for the agents it uses to carry out this responsibility and these agents are unconditionally subject to its authority over education.
See Doc. #291.00, pp. 1-7; Defs. Post Trial Brief, pp. 19-21.
• Beyond the minimum amounts needed under contemporary standards to recognize them as primary and secondary schools, the total amount of money that must be spent on the state's primary and secondary schools cannot be dictated by judicial fiat because the judiciary is constitutionally unfit to determine appropriate overall spending amounts against competing constitutional priorities.
See Doc. #291, pp. 12-14, Doc. #296; Defs. Post Trial Brief, pp. 96-100.
• The constitution's education provision read together with its equal protection provision means the constitution requires a funding formula rationally designed to deliver adequate funding for children's educational needs in every district. Enactments unconnected to a rationally designed formula are impermissible even if on the whole they direct more money to poorer towns then to richer towns.
See Doc. #291.00, pp. 8-14; Defs. Post Trial Brief, pp.37-38.
• Connecticut spends billions of dollars on primary and secondary education without a rational standard for what it means to get a primary and secondary education. A standard can't be rational if it contains criteria so subjective and so variable as to render the standard meaningless.
See Defs. Post Trial Brief, pp. 52-55.
• Connecticut spends most of its education money on professional salaries without compensation and performance measures rationally related to the education of children.
See Defs. Post Trial Brief, pp. 56-62.
• Connecticut spends a very substantial portion of its education funds on special education without rationally ensuring that the children who need special educational services are getting them and while being certain that children who cannot profit from educational services are getting services at the expense of those who need them.
See Defs. Post Trial Brief, pp. 69-75.
1
INTRODUCTION
The State of Connecticut funds public education generously and fairly, easily exceeding
its obligations under the state constitution. In Fiscal Year 2015, the state alone spent about
$4.538 billion on public school education (pre-k to 12). DTX 6318; see also DTX 5681, 5682
(total ECS and Alliance grants); DTX 4716; DTX 6461, DTX 3814 (Pension Funding). The
federal government spent another $427 million, for a total of nearly $5 billion for education in
Connecticut in FY 2015. Id. These funds are in addition to the funds raised on the local level
through property taxes and spent on education. Equally important, beginning in 2012 the State
has increased funding, support and oversight to the neediest Connecticut school districts,
including spending an additional $548 million on the worst 30 performing school districts as
measured by standardized test scores.1 http://www.sde.ct.gov/sde/lib/sde/PDF/dgm/report1/ ecs-
alliance-nonalliance.pdf, DTX 6488, DTX 5682. See infra Sections III.H and IV.B (Alliance
District and Commissioner's Network programs).
While public education spending in Connecticut has steadily increased over the years,
virtually all other aspects of Connecticut government have been or are about to be significantly
reduced. Most of state government's core governmental functions, other than support for
education, have been affected much more heavily by these cuts.2
1 The total Alliance District allotments from 2012-13 to 2016-17 for the plaintiffs' six "focus" districts are as follows: Bridgeport, $63,839,349; East Hartford, $28,625,403; Danbury, $29,359,660; New Britain, $46,097,611; New London, $11,532,221; Windham, $10,234,401. http://www.sde.ct.gov/sde/lib/sde/PDF/dgm/report1/ecs-alliance-nonalliance.pdf, DTX 6488, DTX 5682. 2 For the 2016-17 school year, the Education Cost Sharing (ECS) allotment is over $2 billion, and is expected to decrease by approximately $30 million, or about 1.5%, from the previous year. See DTX 6488. The plaintiffs' six "focus districts," however, will receive the following ECS allotments: Bridgeport, $181,355,390; Danbury, $31,540,480; East Hartford, $49,315,667; New Britain, $86,445,269; New London, $25,928,509; Windham, $26,681,944. DTX 6488. Five of the six focus districts received a decrease from the previous year of 0.5% or less, while Danbury received an increase of 2.74%. DTX 6488. In comparison, the so-called "wealthy"
2
I. JURISDICTIONAL DEFICIENCIES
A. Individual Plaintiffs Who Lack Standing
The right to sue to enforce the state constitution's educational provisions belongs to the
students. See Sheff v. O'Neill, 238 Conn. 1, 25 (1996) citing Horton v. Meskill, 172 Conn. 615,
648-49 (1977) (Horton I). However, a minor may bring suit only through a guardian or next
friend and parents commonly serve as next friend. Collins v. York, 159 Conn. 150, 153 (1970);
Shockley v. Okeke, 92 Conn. App. 76, 81 (2005). Parents whose interests are not adverse to
their child’s have standing as “next friend.” Carrubba v. Moskowitz, 274 Conn. 533, 550-2
(2005). Where a plaintiff lacks standing to sue, the court is without subject matter jurisdiction to
determine the cause. Id. Defendants hereby renew their requests to dismiss individually named
plaintiffs who lack standing as explained in more detail below.
1. Stipulations
Both parties agreed at the end of the plaintiffs' case in chief that certain plaintiffs should
be dismissed from the case. See Doc. # 308.00, dated 4/12/16; Trial Tr., 3/30/16, p. 2. These
plaintiffs include: Merrill Gay, Gregory Gay aka Gregory Rose; Hernan and Stephanie
Illingworth; Donna Johnston aka Donna Finnemore and Brian Wisniewski; Zenitra Wolfe and
Brandon Wolfe; Jacob Hall; Dharan Velasquez; and Jennifer Lemus. Jennifer Lemus is the same
districts referenced by plaintiffs throughout the trial received the brunt of these cuts. See DTX 6488 (Westport: -54%; Weston: -55%; Greenwich: -52%; Ridgefield: -60%; Wilton: -54%; New Canaan: -44%; Redding: -62%; Easton: -59%; Darien: -43%; Waterford: -67%; Fairfield: -54%). This newest budget is further evidence of the fact that Connecticut's funding system for public education is rational and constitutional because the poorest districts receive by far the most and the largest proportion of state aid. See infra. Moreover, total state aid to municipalities (including education) actually increased for each of the focus districts from FY 16 to FY 17: Bridgeport (increase of $17.7M); Danbury (increase of $3.4M); East Hartford (increase of $5.6M); New Britain (increase of $9.4M); New London (increase of $2.5M); and Windham (increase of $2.2M). http://www.ct.gov/opm/lib/opm/igp/estimat/71_section_e.pdf.
.
3
person as Jennifer Rodriguez, as plaintiffs stated in their stipulation. She was withdrawn as a
plaintiff by Doc. # 271.00, dated 1/13/16, but the docket still shows her as Jennifer Rodriguez
(Pl-36). All claims of these plaintiffs must be dismissed.
2. Students No Longer in Public School
Students who are no longer in Connecticut public schools have no standing as their
claims are moot. Plaintiffs stipulated to the dismissal of several plaintiffs who are no longer CT
public school students because they have graduated from high school, but apparently overlooked
the fact that Emily Black (Pl-29) graduated in 2014 and went on to attend UCONN. See
Appendix 4, Pls.' Amended Responses to Defs.' Interrogatories dated 1/9/15, # 8. Accordingly,
she must be dismissed from the case.
3. Non-Parent Adults
Richard Molinaro (Pl-07) is listed in the complaint as "on his own behalf and as next
friend of his minor granddaughter" Jada Mourning. CTAC, ¶ 8. Jada Mourning lives with her
mother. CTAC, ¶ 9. Mr. Molinaro clearly has no standing in his own right and his derivative
claim based on his granddaughter fails as there has been no evidence as to whether his interests
are aligned or adverse with the minor child. There has also been no evidence establishing any
significant relationship between the grandfather and the child or exceptional circumstances as to
why he should act as "next friend;" nor any evidence as to why the parents have not come
forward as next friend. See Whitmore v. Arkansas, 495 U.S. 149, 163-4 (1990).3 Since the
minor cannot bring suit on her own, both plaintiffs should be dismissed.
Similarly, Hector Tirado (Pl-46) claims standing not as "next friend," but "on his own
behalf and on behalf of his step-children" Yasiel (Pl-48) and Alanis Flores (Pl-47) CTAC, ¶ 32.
3 While parents, spouses and siblings might qualify as next friend, first cousins have not. Davis v. Austin, N.D. GA., 492 F. Supp. 273, 275 (1980).
4
He clearly has no standing on his own and his derivative claim similarly fails. Even if a "next
friend" allegation had been made, there is no evidence establishing a significant relationship and
interests aligned with the children. There is also no evidence establishing why a parent has not
brought suit as next friend. These three named plaintiffs should be dismissed for the same
reasons as stated in the prior paragraph.
4. No Evidence of Standing for Any Individually Named Plaintiffs.
It is plaintiffs' burden to establish standing. Emerick v. Town of Glastonbury, 145 Conn.
App. 122, 128 (2013). Plaintiffs have failed to put on any evidence at trial to establish standing
as to any of the individually named plaintiffs. Defendants have objected to the plaintiffs' use of
undisputed Requests for Admissions (RFAs) ## 20-80 as a means of satisfying their burden to
establish standing on behalf of the students. See Doc. # 253.00. The use of RFAs was a court-
mandated process, not a discovery tool invoked by either party. The defendants objected to its
use specifically because it had the effect of shifting the burden of proof away from the plaintiffs
to establish standing for the individually named plaintiffs by deriving a forced admission from
the defendants. Id. Defendants further objected to these RFAs as an attempt to circumvent the
necessity of presenting testimony by witnesses who were never on the witness list and, therefore,
not subjected to deposition, as they would have been if they had been so listed. See Defs.'
Motion to Preclude Doc. # 253.00, denied Doc. # 253.86.
5. Plaintiffs Have Failed to Establish Any Harm to Any Specific Plaintiffs. Without a Specific Injury, the Plaintiffs Lack Standing.
Thus, to have standing to bring this action, the plaintiffs necessarily must establish that they are classically aggrieved. In other words, they must demonstrate a specific, personal and legal interest in the subject matter of the controversy and that the defendants' conduct has specially and injuriously affected that specific personal or legal interest.
5
Andross v. Town of W. Hartford, 285 Conn. 309, 324 (2008). Individual plaintiffs have put on
no evidence, as the law requires, that any of them has been specially and injuriously affected in
any way. "The determination of aggrievement presents a question of fact for the trial court and a
plaintiff has the burden of proving that fact." Id. at 340 [citations omitted.] Because there is no
evidence establishing standing for the individual plaintiffs, their claims must be dismissed. Id.
citing Warth v. Seldin, 422 U.S. 490, 501-02 (1975). Plaintiffs' claims are akin to those of a
personal injury claimant who asserts standing because he drove on a dangerous highway, but
fails to show that he suffered any specific personal injury.
Similarly, with regard to plaintiff CCJEF's claim of associational standing, there is no
evidence that any CCJEF member students in Connecticut public schools or parents of those
students – who are the only members able to provide standing to CCJEF – have been specially
and injuriously affected. Thus, CCJEF lacks standing on this basis as well.
B. Plaintiff CCJEF Lacks Standing.
Plaintiff CCJEF lacks associational standing for all of the reasons articulated in
defendants' previous motion and accompanying briefs. See Docket No. HHD-CV05-4050526-S,
## 103.00, 106.00, 164.00 (motion to dismiss), 165.00 (memorandum in support of motion to
dismiss), 180.00 (reply) denied in part # 206.00;4 see also Docket No. HHD-CV14-5037565-S,
Doc. # 265.00. Regarding the Hunt/Worrell three part test discussed in those documents, a few
points bear further elaboration.
First, at the time of the original (or January 2006 amended) complaints, plaintiff CCJEF
did not have parent members and did not plead that it had student members. See Docket No.
4 Judge Dubay previously denied defendants' motion to dismiss CCJEF on associational standing grounds. However, that decision was made on the basis of the complaint and did not affect plaintiffs' burden of proving standing at trial.
6
HHD-CV05-4050526-S, Complaint of November 21, 2005, ¶ 29; Amended Complaint dated
January 20, 2006 ¶ 31; # 107.00 (Affidavit of Robert Solomon). No later amendment can cure
those defects. See Docket No. HHD-CV05-4050526-S, # 165.00 at 42-43.
Second, under CCJEF's Articles of Incorporation and by-laws, the only "members" of
CCJEF who could have standing in this case (parents and students) lack voting rights in CCJEF.
See DTX6026; see also Docket No. HHD-CV05-4050526-S, Doc. # 180.00 at 22. Because these
members lack the ability to control CCJEF or direct CCJEF's litigation supposedly brought on
their behalf, they are not "members" in any legally cognizable sense. For example, if all parents
wished to discuss individual settlement of CCJEF's claims supposedly brought on their behalf, or
if every single parent wanted to block a settlement approved by CCJEF's voting members, they
would be powerless to do either.
Third, this court should follow Judge Stevens's carefully considered decision in Fairfield
Co. Medical Assn. and what he referred to as the "majority position" of other jurisdictions that
have held that an association must satisfy a "lack of conflict" requirement as part of either the
second or third prong of the Hunt/Worrell test. Fairfield Co. Medical Assn. v. CIGNA Corp., 45
Conn. L. Rptr 200 (August 8, 2008)(Stevens, J.). This "lack of conflict" requirement does not
require the court to police or parse the inner workings and decisions of an organization. It
simply precludes associational standing for an association such as CCJEF that is made up of and
controlled by various interest groups, see DTX 6460, with overwhelming inherent conflicts. It is
self-evident that teachers' and administrators' unions, local school boards, and local
municipalities each have obvious important interests on which they are structurally at odds.
Further, the court heard evidence of a few examples of those conflicts.
7
For example, Danbury Superintendent Pascarella testified that the Connecticut
Association of Public School Superintendents -- a dues paying member of CCJEF – is opposed
to Connecticut's laws on binding arbitration regarding teacher pay. DTX 6026; Pascarella Tr.,
2/2/16, p. 199. The Connecticut Education Association ("CEA") and the American Federation of
Teachers ("AFT") are both dues paying members of CCJEF and this position is squarely at odds
with the interests of their dues paying members. DTX 6026. Similarly, Superintendent
Rabinowitz of CCJEF member Bridgeport testified that she would change teacher termination
laws and due process requirements to make it easier to terminate ineffective leaders or teachers.
Rabinowitz Tr., 6/2/16, pp. 47-50. She would terminate "many more" if the process was easier;
it is incredibly complicated and takes a great deal of time, effort and money. Id. She would also
change the certification process, which is "too stringent." Id., p. 63. Again, these positions are
contrary to those of the CEA and AFT. Rabinowitz also testified that she has pushed for union
concessions on teacher salary increases but that the unions refuse to consider it, despite that she
believes teachers would not leave Bridgeport if they did not receive annual pay increases. Id.,
pp. 115-20.
Fourth, even if CCJEF's parent and child members were "real" members of that
organization, the organization alone would not have standing to make the claims it seeks to make
in this case. This is because CCJEF cannot satisfy the third prong of the Hunt/Worrell test (that
"neither the claim asserted nor the relief requested requires the participation of individual
members in the lawsuit."). Connecticut Ass'n of Health Care Facilities, Inc. v. Worrell, 199
Conn. 609, 617 (1986).
Subsequent to the trial court's pretrial decision with respect to CCJEF's associational
standing in this case (Docket No. HHD-CV05-4050526-S, Doc. # 206.00), another trial court
8
directly and accurately analyzed whether the individual participation of association members in a
constitutional challenge of a similar nature is required under the part Hunt/Worrell test for
associational standing. See Disabled Americans for Firearm Rights, LLC v. Malloy, No.
CV136016992, 2014 WL 1012285 at *5 (February 6, 2014)(explaining that the association's
challenge to state law based on the state constitutional right to bear arms "would clearly require
the participation of individual members of [the association]. In their complaint, the plaintiffs
allege that disabled persons, including members of [the association], require certain features [of
firearms] prohibited by Public Act 13–3 in order to exercise their rights. A determination of this
allegation would require evidence of the specific physical disabilities of each individual.")
(hereafter "DAFR"). DAFR, like this case, involved an association seeking to challenge state
law on the basis of the Connecticut Constitution. And, as in DAFR, this court cannot determine
whether the pertinent members of CCJEF have been denied their constitutional right to a
substantially equal and minimally adequate public education without considering specific
evidence as to those individuals. Every student's education and educational experiences are
obviously different, and this court has no evidence at all about those individual personal
experiences for even a single CCJEF member. Accordingly, CCJEF fails to meet the third
prong of the Hunt/Worrell test.
Finally, while CCJEF's actual voting membership includes local boards of education and
municipalities, it is beyond dispute that those entities do not have standing to sue the defendants
in this case. See Docket No. HHD-CV05-4050526-S, Doc. # 163.00 at 15-16, ¶ 47. The local
board of education, in providing educational services, is actually an arm of the state – the
defendants in this case. See Pereira v. State Bd. of Educ., 304 Conn. 1, 33, 44-45; R.A. Civitello
Co. v. New Haven, 6 Conn. App. 212, 218 (1986). With respect to municipalities, the
9
Connecticut Supreme Court has long held that "[t]owns ... are creatures of the state, and though
they may question the interpretation, they cannot challenge the legality of legislation enacted by
their creator." Conn. Ass'n of Bds. of Educ. v. Shedd, 197 Conn. 554, 558-59 (1985). And, of
course, municipalities and boards of education enjoy no constitutional rights under Article
Eighth, § 1. Horton v. Meskill, 187 Conn. 187, 195-96 (1982) (Horton II). Plaintiffs make no
claim that their union and other organizational members have standing to raise claims regarding
the rights of students. See Sheff, 238 Conn. at 25; Carrubba v. Moskowitz, 274 Conn. 533, 550-
2 (2005); Horton II, 187 Conn. at 195-96. Accordingly, plaintiff CCJEF should be dismissed
from this case for lack of standing.
C. This Lawsuit Should Be Dismissed Based on Both Mootness and Ripeness. The defendants hereby incorporate their arguments made in Defendants' Memorandum in
Support of Motion to Dismiss: Docket No. HHD-CV05-4050526-S, Doc. ## 164.00 (motion to
dismiss), 165.00 at 8-38 (memorandum in support of motion to dismiss), 180.00 (reply) denied in
part #206.00. That Motion to Dismiss was filed on January 9, 2013, when the 2012 targeted
reform efforts had just begun. Since then, reforms have brought about promising gains. See
Focus Districts FOF, 7/15/16, pp. 1-38 (attached hereto as Appendix 1). For example, the
CK3LI program was first piloted in 2012 in a few districts, and has now expanded in Windham,
East Hartford and several other districts, with plans to continue further expansion in those and
other districts, including Bridgeport. DTX 6474 (K-3 literacy gains in Windham using CK3LI);
Quesnel Tr., 6/1/16, p. 104; Rabinowitz Tr., 6/2/16, p. 72. All schools that have used the CK3LI
model have made gains in K-3 literacy. Cohn Testimony, 5/24/16, p. 94. Because the evidence
shows that the 2012 reforms were well thought out, serious, substantial and substantially funded,
the court must give them time to demonstrate their full potential, as virtually all witnesses
10
recognized that the effects of many reforms take several years to show meaningful results. E.g.,
Hakuta Tr., 2/9/16, pp. 40:15-42:23 (ELs may take 3-8 years to acquire proficiency in English);
Levin Tr., 2/19/16, p. 83:6-9 (it generally takes a while for educational reforms to produce
results); Rice Tr., 3/3/16, p. 125:5-7 (educational reforms take time to germinate); Garcia Tr.,
3/4/16, p. 80:19-22 (aside from some immediate gains already seen, it can take 5-10 years to see
results after a structural change occurs in a school district); Rabinowitz Tr., 6/2/16, p. 178:15-22
(don't expect to bring everyone up to grade level in one or two years, but we see solid growth
towards those goals); Quesnel Tr., 1/15/16, pp. 125:11-26 (in the long term, these CN strategies
can turn schools around; 3 years not enough); Thompson Tr., 2/18/16, pp. 29:20-32:3
(transformational change will take time, but with continued support NLHS expects to see growth
each year moving forward); see also Gopalakrishnan Tr., 5/18/16, pp. 92-3 (cannot yet measure
growth on SBAC because only one year of data available). See Focus Districts FOFs, 7/15/16,
for more evidence of beneficial educational reforms.6 See also Defs.' Demonstrative Exhibit 7
indicating a positive increase in statewide adjusted cohort graduation rates from 2010 through
2014.
D. Sovereign Immunity Bars this Lawsuit.
“Sovereign immunity relates to a court's subject matter jurisdiction over a case.” Columbia Air
Servs. v. DOT, 293 Conn. 342, 349 (2009). “[T]he sovereign immunity enjoyed by the state is
not absolute." While "there are [three] exceptions," only the second – "when an action seeks
declaratory or injunctive relief on the basis of a substantial claim that the state or one of its
6 For more specifics as to the AD/ PSD, and CN grants, see Cohn Tr., 5/25/16 pp. 86-139, 140-147 respectively for Bridgeport; pp. 147-153, 154-169 for EH; pp. 169-173, 173-175, respectively for Windham; pp. 181-185 for New Britain AD's; Cohn Tr., 5-26-16, pp. 4-9, 9-12, and 12-13 (SIG), respectively for New Britain; pp. 13-26, 34, respectively for New London; pp. 35-38, 38, respectively for Danbury.
11
officers has violated the plaintiff's constitutional rights" -- Id. (internal citations omitted) is even
arguably relevant. In the absence of a statutory waiver of sovereign immunity, a plaintiff may
not bring a monetary action against the state without authorization from the claims commissioner
to do so. Miller v. Egan, 265 Conn. 301, 317 (2003). With respect to this second exception, our
supreme court has ruled that in determining the nature of relief sought, i.e., whether the relief
sought is actually declaratory or injunctive, a court must look beyond the manner in which the
plaintiffs have worded the complaint. See DaimlerChrysler Corp. v. Law, 284 Conn. 701, 723
(2007) (“The plaintiff’s request for relief – an order that the defendant refund all sales taxes for
which the plaintiff had submitted a claim for refund – must be characterized as a claim for
damages.”)
The plaintiffs here request that this court, inter alia, “declare that the existing school
funding system is unconstitutional, void and without effect…” and “order defendants to create
and maintain a public education system that will provide suitable and substantially equal
educational opportunities to plaintiffs.” Docket No. HHD-CV05-4050526-S, #163.00 at 46.
While these prayers for relief seem to sound in equity and do not explicitly request the court
increase state education funding, a thorough and fair reading of the entire complaint makes clear
that plaintiffs really seek an increase in state funding of education. See id. at 3 ¶ 4 (“The level
of resources provided by the State's education funding scheme is arbitrary and not related to the
actual costs of providing a suitable education.”); 37 ¶ 125 (“The unsuitability and inequality of
the plaintiff's educational opportunities, as well as the subsequent harm suffered, is caused by a
flawed educational funding system.”); 38 ¶ 120 (complaining that the state funded 39% of
education statewide in 2003 and asserting that number should have been 50%; such an increase
would require an increase in state funding); 38 ¶ 134 (“The municipalities in which plaintiffs

12
reside do not have the ability to raise the funds needed to compensate for the monetary shortfalls
that result from the State's arbitrary and inadequate funding system.”); 39 ¶ 144 (complaining
that in October of 2003 the "foundation" amount of the ECS formula should have been $2,009
more than the current "foundation" amount). Plaintiffs also argued explicitly that “[t]he
irrational, underfunded ECS formula ... is at the core of the Plaintiffs' case.” Doc. #HHD-CV05-
4050526-S, #174.00 at 12. Put another way, plaintiffs seek no structural changes to the public
educational system other than an increase in state funding to certain (or all) school districts.
The evidence at trial confirms that just as the plaintiffs in DaimlerChrysler really sought
refunds, the plaintiffs here really seek more state monies directed to municipalities. The record
is clear that plaintiffs are solely seeking more state money for education and not a court order
requiring that the defendants "create and maintain a public education system" by restructuring
non-financial aspects of the state's educational system. No witness or other evidence from
plaintiffs claimed or sought anything else. The bylaws of plaintiff CCJEF, describing the nature
of CCJEF's activities, also make this monetary goal clear:
(a) engage in activities that promote the adequate funding of education in the State of Connecticut;
(b) engage in activities that relieve the burdens of Connecticut municipalities in funding education;
. . .
DTX 6026 (emphasis added). In fact, the second goal of CCJEF – to "relieve the burdens of
Connecticut municipalities in funding education" – bears no connection whatsoever to
"creat[ing] and maintain[ing] a [constitutional] public education system." This goal relates to
property tax "relief" for the municipal members of CCJEF and by extension municipal taxpayers,
which is akin to the relief actually sought in DaimlerChrysler. In fact, witnesses testified to the
obvious: the source of funds for a child's education is irrelevant to the child's education. A dollar
13
is a dollar. See, e.g., Pascarella Tr., 2/2/16 pp. 156-57. Additionally, various witnesses said they
were testifying in this case in order to secure more state money for the district that employed
them. For example, Superintendent Pascarella said he was testifying in order to get "more
resources for all of the youngsters." Pascarella Tr., 2/2/16, p. 157.
Put simply, the plaintiffs are seeking more money in this lawsuit and no other changes to
the state's system of public education. Accordingly, sovereign immunity bars their claims.
II. APPLICATION OF LEGAL STANDARDS
A. Justice Palmer's Concurring Opinion is the Legal Standard for Adequacy (Counts One, Two and Four)
Counts one, two and four of the Corrected Third Amended Complaint contain, inter alia,
"adequacy" claims.8 As the defendants have consistently argued, Justice Palmer's concurring
opinion regarding the definition of a "minimally adequate education" and his view of the
deference owed to the political branches of government constitute the ruling of the Connecticut
Supreme Court as to the scope of the constitutional right guaranteed by article eighth, §
1. CCJEF v. Rell, 295 Conn. 240, 320-47 (Palmer, J., concurring); see also Doc. #265.00 at 10-
12; Docket No. HHD-CV05-4050526-S, ## 144.00 and 153.00. Whether the state has met its
constitutional obligations must be judged by the educational opportunities provided to the
plaintiffs, rather than by the plaintiffs' educational outcomes. 9 See Doc. #265.00 at 18-
19. Those arguments are incorporated here by reference.
8 These counts were stricken by the trial court and later reinstated by our supreme court. CCJEF v. Rell, 295 Conn. 240, 251 (2010)(plurality). Count three was never stricken and was therefore not before the supreme court. Id. 9 Even the plurality took this view. See CCJEF v. Rell, 295 Conn. 240, 318-20 (plurality) ("We note that the failure of students to achieve the goals of a constitutionally mandated education may be the result of specific deficient educational inputs, or potentially, be caused by factors not attributable to, or capable of remediation by, state action or omission, a complicated question that is at this point beyond the procedural posture of this case. . . . [A]ny appropriate standard by
14
B. The Horton III Decision is the Legal Standard for Equity (Counts One, Three and Four)
Counts one, three and four of the Corrected Third Amended Complaint contain, inter alia
"equity" claims. Such claims are made pursuant to the equal protection clause of the Connecticut
Constitution, article first, §§ 1 and 20, and Horton v. Meskill, 172 Conn. 615 (1977). See
CCJEF, 295 Conn. at 251 n.14 (plurality).
The court previously directed the parties to brief several issues, including the legal
standard to be applied to plaintiffs' equal protection claims. Doc. #270.00. Defendants hereby
incorporate those arguments here. See Doc. #291.00 at 8-14; see also Benjamin v. Bailey, 234
Conn. 455, 462, 465-6, 472, 477-8 (1995) ; Campbell v. Bd. Of Ed., 193 Conn. 93 (1984) (same).
Simply put, the elected branches' decision to provide the most state aid for public
education to districts that are less wealthy or lower performing is entirely rational and consistent
with the mandate of Horton. "Rational" does not mean perfect or strictly mathematical. Circuit-
Wise Inc. v. Comm'r of Revenue Servs., 215 Conn. 292, 301-02 (1990).
C. Plaintiffs Have Failed to Allege or Establish an Equal Protection Violation (Count Four)
Plaintiffs allege in their fourth count: "The State's failure to maintain a public school
system that provides plaintiffs with suitable and substantially equal educational opportunities has
disproportionately impacted African-American, Latino, and other minority students, in violation
of Article Eighth, § 1 and Article First, §§ 1 and 20 of the State Constitution, and 42 U.S.C. §
1983."
which to measure the state's assumed obligation to provide a minimally adequate education must be based generally, not on what level of achievement students reach, but on what the state reasonably attempts to make available to them, taking into account any special needs of a particular local school system") (internal citations omitted; emphasis added).
15
“It is well settled that, as a general matter, this state's constitutional equal protection
jurisprudence follows that of the federal constitution.” Abdullah v. Comm'r of Corr., 123 Conn.
App. 197, 202 (2010) cert. denied, 298 Conn. 930 (2010); see also Kerrigan v. Commissioner of
Public Health, 289 Conn. 135, 149 n. 13 (2008). An equal protection challenge must establish
intentional or purposeful discrimination to succeed. Reynolds v. Barrett, 685 F. 3d 193, 201-02
(2d Cir. 2012) (plaintiffs cannot proceed under a disparate impact theory of liability under an
equal protection claim) citing, among others, City of Cuyahoga Falls v. Buckeye Cmty. Hope
Found., 538 U.S. 188, 194 (2003); Accord, Golab v. New Britain, 205 Conn. 17, 26 (1987). The
court in Abdullah followed the court’s holding in Wendt v. Wendt, 59 Conn. App. 656, 685–86
(2000), cert. denied, 255 Conn. 918 (2000),10 and confirmed that Sheff v. O’Neill, 238 Conn. 1
(1996) (en banc) “did not intend to allow state constitutional challenges on the basis of disparate
impact,” explaining that the holding in Sheff was premised, not on the equal protection clause,
but on the segregation clause in article first, § 20, that declares that Connecticut citizens shall not
be subjected to segregation Abdullah, 123 Conn. App. at 202. Plaintiffs have alleged no such
claim of segregation in this case. Accordingly, the court should dismiss Count Four.
Also with respect to Count Four, plaintiffs' invocation of 42 U.S.C. § 1983 is
unavailing. That is because “[i]t is well settled that § 1983 does not create any new substantive
rights, but merely provides a federal cause of action for violations of certain federal
rights.” Mrs. W. v. Tirozzi, 832 F.2d 748, 754 (2d Cir. 1987)(emphasis added). Plaintiffs'
10 "Even assuming, arguendo, that the plaintiff could prove that a disparate impact exists, an equal protection challenge cannot be supported on that basis alone. Intentional or purposeful discrimination must be shown to make a successful equal protection challenge." Wendt, 59 Conn. App. at 685-86 (citation omitted). The Wendt court also made clear that "[d]ecisions subsequent to Sheff reveal that the Supreme Court did not open the door to disparate impact challenges." Id. at 686 (citing cases).
16
claims here are entirely premised on state constitutional and statutory law. Accordingly, § 1983
is inapplicable.
D. Plaintiffs' Claims Are a Facial Challenge and Fail on All Counts
As defendants have previously argued, because plaintiffs seek to invalidate entire
portions of state law affecting all Connecticut public school students (the vast majority of whom
are not parties to this case), their claims must be viewed as a facial challenge. See Doc. #265.00
at 12-15.
The evidence presented at trial fails to meet plaintiffs' heavy burden of proof beyond a
reasonable doubt in making such a facial challenge on the basis of adequacy claims.11 State v.
Breton, 212 Conn. 258, 269 (1989). First of all, despite seeking statewide relief, plaintiffs chose
to make their claims at trial using select evidence from six "focus districts." Even assuming that
the "focus district" approach is acceptable, evidence at trial demonstrated that at least some
students in the focus districts were receiving an adequate education and went on to college and
careers. See, e.g., Quesnel Testimony, 1/15/16, pp. 171-72 (East Hartford); Pascarella
Testimony, 2/2/16, pp. 157-59 (Danbury). Indeed, no witness for the plaintiffs testified that all
students in their district were not receiving a constitutionally adequate educational
opportunity. This state of the evidence obviously falls far short of the requirement that a facial
challenge can succeed only when there are no facts or circumstances where the law could be
constitutional. State v. Long, 268 Conn. 508, 522 n.21 (2004).
Regarding plaintiffs' equity claims, plaintiffs presented statistical and anecdotal evidence
about some "wealthy" districts located in Fairfield County. Plaintiffs apparently assert that this
11 To the extent plaintiffs' claims are construed as an "as applied" constitutional challenge, they must also fail. See Doc. # 265.00 at pp. 12-15; see also Moore v. Ganim, 233 Conn. 557, 570 (1995).
17
evidence supports their claim of inequitable educational opportunities in comparison to the six
focus districts. As previously argued by the defendants, plaintiffs' evidence is insufficient to
meet the three part test for educational equity claims made under the Connecticut
Constitution. See Doc. # 291.00 at 8-14; see also Horton v. Meskill, 195 Conn. 24 (1985)
(Horton III).
At the court's request, the defendants have already briefed other issues relating to the
legal standard, including why the plaintiffs' "equity" claims must fail. See Doc. # 291.00 at 8-
14. The evidence at trial overwhelmingly demonstrated that the poorer a district and its school
population, the more state aid it receives. See, e.g., DTX 6488. Additionally, the 2012 Reforms
have directed $548 million in additional funding and special support solely to the 30 state school
districts most in need of help. http://www.sde.ct.gov/sde/lib/sde/PDF/dgm/report1/ecs-alliance-
nonalliance.pdf; DTX 6488; DTX 5682.
E. Plaintiffs' Use of Six "Focus Districts" is Incoherent and Insupportable
This action was originally filed as a limited class action 12 on December 12, 2005
(amended January 20, 2006) by public school students from various Connecticut cities and
towns, suing by and through their parents as "next friends," and CCJEF. Following remand from
the Connecticut Supreme Court, on November 19, 2010, the plaintiffs filed a Second Amended
Complaint. Docket No. HHD-CV05-4050526-S, Doc. # 135.00, which dropped the class action
allegation. Although plaintiffs sought declaratory and injunctive relief as to "the plaintiffs," they
also sought broader relief. Specifically, plaintiffs asked the court to declare the entire state 12 Paragraph 37 of the original complaint (and ¶ 39 of the January 2006 amended complaint) defined the class:
This complaint is brought on behalf of all children from ages three to eighteen who are not receiving suitable and substantially equal educational opportunities in the following school districts: Bloomfield, Bridgeport, Danbury, East Hartford, Hamden, Hartford, Manchester, Middletown, New Britain, New Haven, New London, Norwalk, Plainfield, Putnam, Stamford, and Windham.
18
education funding system "unconstitutional, void and without effect." Id. at ¶ 169(iii). They
also sought to "enjoin defendants from operating the current public education system…." Id. at ¶
169(iv). Notably, however, plaintiffs sought an order that defendants "create and maintain a
public education system that will provide suitable and substantially equal educational
opportunities" only as "to plaintiffs." Id. at ¶ 169(v).
Plaintiffs ultimately filed a Corrected Third Amended Complaint, which is the operative
complaint here. This complaint also does not contain class allegations and makes the same
requests for relief as the Second Amended Complaint. See Docket No. HHD-CV05-4050526-S,
# 163.00 ¶ 180. It was not until the first day of trial when plaintiffs made their opening
statement that defendants learned of plaintiffs' plan to use six "focus districts" as the core of their
case. Tr., 1/12/16, p. 10. The plaintiffs have failed to provide a legal explanation as to the
significance of these "focus districts" and how they impact the broad relief sought by plaintiffs.
Plaintiffs have also provided no evidence that these districts are typical of all or even any other
districts in the state.
The evidence presented by plaintiffs indicated that each of the six districts has had some
successes and some schools that are doing well or improving and some schools that may not be.
See Focus Districts FOF, 7/15/16, pp. 1-41. The evidence did not demonstrate that any of the six
districts was failing to provide at least some students with minimally adequate educational
opportunities. Plaintiffs have failed to explain how such evidence can be the basis for judicially
imposed statewide declaratory and injunctive relief, and common sense dictates that it cannot.
Statewide injunctive relief cannot possibly be granted on the basis of scattered evidence as to six
school districts chosen by plaintiffs without any explanation in the evidence of how or why they
were selected. Was it because they are the worst districts by some measure? Was it because all
19
of them pay dues to CCJEF? Are they claimed to be representative of all Connecticut districts?
If so, on what basis? It is also important to note that thousands of students (both in and out of the
six focus districts) not a part of this case and not represented by plaintiffs' counsel have a
constitutional right to minimally adequate and equitable educational opportunities. Any orders
reaching beyond evidence about constitutional harm to individual plaintiffs would
unconstitutionally impact the rights of those countless parties not before the court.
F. Local Control of Education is a Constitutional Part of Connecticut's System, and It Would be Undermined by Any Conclusion That the State is Ultimately Responsible for All Actions of Local Boards.
On June 3, 2016, the court directed the parties to address six statements, the first of which
reads:
The Connecticut constitution makes the state directly responsible for education. It is responsible for what happens in all of its school districts. It is responsible for the agents it uses to carry out this responsibility and these agents are unconditionally subject to its authority over education.
The court previously asked the parties to brief the issue of the relationship between state and
local governments with respect to education. Doc. # 270.00. Defendants' brief addressed this
issue and in the course of that brief discussed the role of local control over education in
Connecticut. See Doc. # 291.00 at 1-7. Those arguments are hereby incorporated by reference.
As our Supreme Court recently noted, there is a "long-standing policy in Connecticut of
local, rather than state, control over schools and school districts." Pereira v. State Bd. of Educ.,
304 Conn. 1, 30 (2012). The overall import of local control to the claims raised here by
plaintiffs is simply that local school districts are both tasked with "maintain[ing] good public
elementary and secondary schools" and "implement[ing] the educational interests of the state."
20
Conn. Gen. Stat. § 10-220(a). Several other statutes13 make clear the leading role that school
districts take in Connecticut with respect to public education.14
Pereira also illustrates that the State Board of Education's powers with respect to local
school districts are not plenary. The SBE does not, absent specific statutory authority, have the
inherent power to reconstitute or take over control of a local school district. Pereira, 304 Conn at
35 ("the reconstitution authority … is an exception to the general rule that local educational
matters are managed by local boards of education comprised of locally elected members").
Rather, the SBE has "broad and general power" whereas the local and regional boards of
education "provide and administer" public education. Id. at 33 (internal citations omitted). Any
judicial conclusion that the state bears essentially all responsibility for the decisions and actions
of local boards would be contrary to the state's policy, clearly approved by our Supreme Court,
of local control.
III. Plaintiffs Failed to Prove Their Case Re Inadequate Educational Opportunities
A. Plaintiffs Failed to Prove that the Palmer Standard is not Satisfied in Their "Focus Districts."
13 The legislature is explicitly tasked with implementing the right to a public education in Connecticut. Conn. Const. art. Eighth § 1. 14 For example, the following sections of the Connecticut General Statutes: §§ 10-240 (town to control schools through board of education), 10-220 (board duties), 10-221, 10-222 (local board budget process; funds appropriated by municipality “shall be expended by and in the discretion of the board of education”), 10-51 (regional school district budget process), 10-221a (graduation requirements; subsection (f) provides that eligible credits in the discretion of the local board; subsection (j) requires local boards to create student success plans), 10-233c (local discretion regarding suspensions), 10-233d (local discretion regarding expulsions), 10-221t (Common Core alignment), 10-223a (local board policies on promotion from grade to grade; basic skills necessary for graduation), 10-241 (powers of school districts), 10-16b (public schools to offer instruction in specified areas and to attest to the SBE that they are doing so), 10-17f (local board to provide bilingual education program for eligible students), 10-18 (graduation eligibility contingent on familiarity with specified subjects), 10-18a (local board to select textbooks with certain content required), 10-186 (local boards to furnish school accommodations).
21
Plaintiffs have failed in their burden to establish inadequate opportunities in plaintiffs' six
focus districts under the applicable Palmer standard. See supra Section II.A. Plaintiffs have not
proven that the six focus districts do not have “minimally adequate physical facilities and
classrooms which provide enough light, space, heat, and air to permit children to learn." See
Palmer Standard FOFs, 7/15/16. Plaintiffs have also not proven that the six focus districts do
not have “minimally adequate instrumentalities of learning such as desks, chairs, pencils, and
reasonably current textbooks" or that learning was impeded by any such shortfalls. See
id. Moreover, the use of technology in classrooms has become increasingly important, and
accordingly the state has made significant financial investments to upgrade facilities and
technological infrastructure as well as to provide Chromebooks, iPads, laptops, carts, SMART
Boards and other devices in schools across Connecticut, particularly in low-performing schools
including the six focus districts. See infra Section IV.P; Focus Districts FOFs, 7/15/16.
Plaintiffs have also not proven that the six focus districts do not have “minimally
adequate teaching of reasonably up-to-date basic curricula such as reading, writing, mathematics,
science, and social studies." See Palmer Standard FOFs, 7/15/16. In fact, superintendents and
other witnesses from each of the six districts testified that, at a minimum, their core curricula are
aligned to the Common Core State Standards (CCSS) adopted in 2010. Finally, plaintiffs have
not proven that the six focus districts do not have “sufficient personnel adequately trained to
teach those subject areas.” See id. Witnesses for each of the six focus districts testified that
teachers and administrators received extensive free trainings from the state, local RESCs and
consultants in such areas as CCSS, CELP standards for EL students, SBAC, SAT and benchmark
assessments testing, and SRBI and PBIS interventions. See Section IV.H. Furthermore,
plaintiffs failed to demonstrate that the classrooms in the six focus districts are inadequately
22
staffed with qualified teachers. In fact, teacher hiring and retention in the focus districts, as well
as average class sizes, compare favorably to other districts in the state. See infra Sections III.F
and G.
Even under the more expansive plurality standard, plaintiffs failed to prove broad and
pervasive failings across the six focus districts. See supra Sections III.C-L; Focus Districts
FOFs, 7/15/16.
B. The Focus Districts Receive Numerous and Extensive Special Grants and Other Supports.
Plaintiffs have failed in their burden to establish inequitable funding in the plaintiffs' six
focus districts. Not only does the state distribute substantially more ECS funding to these
districts than to most other districts, with the effect of equalizing total per pupil spending across
all districts; see Section III.H.; but all of the six focus districts are both Alliance Districts and
Priority School Districts, and are accordingly allocated substantial additional funding, targeted
support and free trainings from the state. See supra Section IV.B. Further, as of the close of trial
in June 2016, the focus districts have seven Commissioner's Network schools among them, with
applications for additional schools currently pending, with additional state funding and targeted
support. DTX 6226, pp. 6-7; Rabinowitz Tr., 6/2/16, p. 97 (Columbus School); Cohn Tr.,
5/26/16, p. 11 (New Britain High School). The Alliance District and Commissioner's Network
plans are specifically tailored to the needs of each district and reflect the priorities of the district
and school leadership. See, e.g., Reforms FOFs, 7/15/16; Rabinowitz Tr., 1/22/16, p. 113
(Alliance District funding is used for what the individual district determines are its highest
priority needs); Quesnel Tr., 1/19/16, pp. 33-4 (Commissioner's Network plan at O'Brien STEM
Academy is a classic example of a really incredible plan because it is based on the organic needs
of the district).
23
Since 2011, the focus districts also have had seventeen School Improvement Grant (SIG)
schools between them that are administered through the CSDE's Turnaround Office, which
provides support and monitoring to those schools. DTX 6226, pp. 10-12; Cohn Tr., 5/25/16, p.
3. As Alliance Districts and lower wealth districts, the six focus districts also receive priority
with regard to, among other things, technology grants and low-performing bond funds; Section
IV.P.; PSD summer school and extended learning grants; DTX 6226, pp. 3-5; student supports
and wraparound funding; Section IV.O., Defs' Demonstrative 6; preschool funding; Section
IV.L.; professional development and LEAD CT opportunities; Sections IV.H. and N.; and
favorable school construction and adult education reimbursement rates. Sections IV.O. and R.
Further, as detailed infra, certain metrics that plaintiffs raised at trial actually demonstrate that
the six focus districts are favorable or comparable in relation to state averages, undermining any
claim that these districts are not equitably funded. See infra, Sections III.F (teacher and
administrator compensation) and III.G (class size).
C. By Any Reasonable Measure, Connecticut Compares Favorably to Other States in per Pupil Spending on Education and on the Fairness of the Allocation of that Spending.
By any reasonable measure, Connecticut compares favorably to most other states in per
pupil spending on education and on the fairness of the allocation of that spending. Although
there are many different possible comparisons to consider, a compelling starting place is the
authoritative book, now in its fourth edition, written, as first author, by plaintiffs' expert witness
Professor Bruce Baker. In this book, DTX 6054, Is School Funding Fair? A National Report
Card (4th Ed, Spring 2015), on page 2, and at trial, Tr. 6/27/16, pp. 120-121, Professor Baker
explains
Before we can effectively analyze how well states fund public education, we must answer one critical question: What is fair school funding? In this report, "fair" school funding is defined as a state finance system that ensures equal
24
educational opportunity by providing a sufficient level of funding distributed to districts within the state to account for additional needs generated by student poverty. In conducting his analysis of the fairness of school funding, Baker reports that his first
"fairness measure," called "funding level," measures the overall level of state and local revenue
provided to school districts and compares each state's average per-pupil revenue with that of
other states, while adjusting to reflect differences in regional wages, poverty, economies of scale
and population density. According to Baker's book and testimony, Connecticut ranks number
five out of all fifty states on this measure, outranked only by New York, Alaska, New Jersey and
Wyoming, and ahead of Massachusetts. DTX 6054, pp. 4, 7, Tr. 6/27/16, pp. 122-124. Baker
calls his second fairness measure "funding distribution," and he explains that it addresses the
"key question" of whether a state's funding system recognizes the additional resources required
for students in settings of concentrated student poverty. By this measure, he rated Connecticut as
"progressive," and ranked it number fifteen out of all the states. DTX 6054, pp. 4, 9, Tr. 6/27/16,
pp. 124-125. It is important to note that this rating, as the text shows, DTX 6054, p. 8, is based
on data from 2012, before Connecticut's major reform efforts, including the large boost in
funding to the poorest districts through Alliance District funding and other efforts, was in effect.
In addition, because Baker simply used the state's officially reported per pupil expenditures per
district, his measure fails to consider the substantial undercounting of real per pupil expenditures
in many of the poorest districts. See infra, Section III.I, pp. 39-41. Baker calls his third fairness
measure "effort," and says the "effort index" takes into account each state's local and state
spending on education in relation to the state's economic productivity, combining the two
elements into a ratio to provide a sense of the level of priority state and local budgets assign to
education. By this Baker measure, Connecticut ranks number ten out of all states, and merits a
25
letter grade of "A" for its effort. DTX 6054, pp. 18-19, Tr. 6/27/16, p. 125. Baker also notes, in
regard to the "effort" measure, that Connecticut is one of only four states in the nation that
actually increased its effort during the Great Recession years from 2008 to 2012. DTX 6054, pp.
21, Tr. 6/27/16, p. 126. See also DTX 6387 (Reschly Update), p. 7 (showing that from FY 08 to
FY 15, Connecticut ranks third in the nation in change in per pupil spending [9.1% increase], and
that per pupil spending remains more than 10% lower than 2008 in 14 states). It is hard to square
plaintiffs' expert Baker's evaluations of the fairness of education funding in Connecticut with
plaintiffs' claims in this case.
Other experts confirmed the picture of Connecticut as a leading state in generously and
fairly supporting public education. Professor Michael Podgursky reviewed various national data
and reported that CT was among the very top states in teacher salaries, that teacher salaries in
Connecticut were significantly higher than salaries for other broadly comparable professions in
Connecticut, that Connecticut has smaller student to teacher and student to staff ratios than most
states, and that, with the exception of a few nationally recognized shortage areas, qualified
applicants for teaching positions far outnumber the available positions. DTX 6393, Expert
Report of Michael Podgursky -- Relative Teacher Compensation in Connecticut. Tr., 4/21/16,
pp. 45-71. More specifically, Prof. Podgursky noted that Connecticut teacher salaries were the
third highest in the nation, after Massachusetts and New York, for 2012-13, and that Connecticut
ranked near the very top in its relative relationship of teacher salaries to salaries in non-teaching
professional positions. Id. Similarly, Professor Michael Wolkoff noted that on a per pupil basis,
Connecticut has consistently spent far more per pupil than most other states, with a differential
from the median in excess of $5,000 in recent years, that the differential has continued to grow,
and that Connecticut is consistently ranked sixth, seventh or eighth nationally in per pupil
26
expenditures. He also stated that Connecticut's growth in per pupil expenditures from 2007-08 to
2012-13 was about 16%, or nearly double the growth of the Consumer Price Index over that
period. DTX 2435 – Michael Wolkoff -- Connecticut School Finance Expert Report, pp. 2-3, Tr.
4/14/16, pp. 23-35. Moreover, per pupil expenditures in each of the plaintiffs' six focus districts
have increased since 2011. See DTX 5638-8, 5641, 5643-4, 5648 (district expenditure profiles).
D. NAEP Scores Provide Compelling Evidence of Connecticut's Generally Positive Standing in Comparison to the Rest of the Nation in Regard to Student Achievement and the Achievement Gap.
While plaintiffs have consistently implied that New Jersey and Massachusetts are obtaining
better student test results because they spend more money, and that Connecticut's poor and
minority students are performing unusually poorly compared to national standards, the facts,
taken as a whole, rather than cherry-picked, provide no support for those claims. As the largest
nationally representative and continuing assessment of what America's students know and can do
in various subject areas, including Reading and Math, at the end of Grades 4, 8, and 12, The
National Assessment of Educational Progress (NAEP) is considered the Nation's Report Card.
FOF 196, Doc. # 326.00 (attached hereto as Appendix 2). NAEP scores allow states to compare
the performance of their students to the performance of students, including subgroups, in other
states across the country. FOF 197, Doc. # 326.00, NAEP FOF 1, 7/15/16. Proficiency levels on
NAEP differ from that of some state assessments by being intentionally aspirational. This is
demonstrated by the 2015 NAEP results for Grades 4 and 8 Reading and Math, in which no
states reached the proficiency level, other than Massachusetts in Grade 4 Math. FOF 200, Doc. #
326.00; NAEP FOF 6, 7/15/16. It is also important to note that NAEP does not report
performance differences unless there is a statistically significant difference based on an analysis
of data using widely accepted statistical standards. FOF 198, 199, 201, Doc. # 326.00; RFA 539-
543, Doc. # 301.00.
27
Connecticut, as well as the rest of the country, often looks to compare its NAEP
performance to that of Massachusetts because of the reputation of Massachusetts's highly
regarded education system. FOF 206, Doc. #326.00. Although Connecticut does not typically
compare itself to New Jersey, defendants have also shown comparisons to New Jersey because
of testimony from plaintiffs in this case. Id. The evidence shows that Connecticut compares
favorably to Massachusetts, New Jersey, and the nation in terms of overall performance,
subgroup performance and achievement gaps.
In the most recent 2013 NAEP assessment for Grade 12, Connecticut outperformed all
states and the nation in Grade 12 Reading and is among the top performing states in Grade 12
Math, with Massachusetts and New Jersey. FOF 207, 208, Doc. #326.00. Connecticut was also
one of only 2 states to show a statistically significant gain in Grade 12 Reading compared to its
2009 performance and only one of four states to do the same in Grade 12 Math. Id. More
importantly, the results show that lower performing students are responsible for the improvement
in the NAEP Grade 12 Reading results, although similar improvement is not seen in the
distribution for the Math results. FOF 217, Doc. #326.00. In comparison, Massachusetts's and
New Jersey's performance in both Grade 12 Reading and Math remained flat between the 2009
and 2013 NAEP assessments. FOF 209, Doc. #326.00.
Not only are Connecticut's overall scores for the 2013 NAEP assessment for Grade 12
favorable, but the Reading scores show a significant narrowing of the Black/White achievement
gap. FOF 210, Doc. # 326.00. In addition, the results were positive in showing the lower
performing black subgroup increasing at a higher rate than the higher performing white
subgroup. Id. Compared to Massachusetts and New Jersey, Connecticut's Black/White
achievement gap as well as its other achievement gaps, the Hispanic/White and NSLP (National
28
School Lunch program/economically disadvantaged)/non NSLP gaps are not statistically
significantly different on both the NAEP Grade 12 Reading and Math assessments, with the
exception of the NSLP/non-NSLP gap for Grade 12 Math for New Jersey. FOF 211, Doc.
#326.00; NAEP FOF 23, 24, 30, 31, 35, 36, 37, 7/15/16. Further, Connecticut's Black and
NSLP subgroups outperformed the nation (National Public) on the NAEP Grade 12 Reading
assessment for the 2013 administration and improved their performances from 2009 to 2013.
FOF 212, 213, Doc. # 326.00. The Connecticut NSLP subgroup performance is not statistically
different than those of Massachusetts and New Jersey for this assessment. FOF 214, Doc. #
326.00. Likewise, Connecticut's Black subgroup outperformed the nation on the 2013 NAEP
Grade 12 Math assessment. FOF 215, Doc. # 326.00. Finally, Connecticut's Hispanic subgroup
performed no differently than the nation on the 2013 NAEP Grade 12 Reading assessment while
this subgroup and the NSLP subgroup performed no differently than the nation on the 2013
NAEP Grade 12 Math assessment. FOF 212, 215, Doc. # 326.00.
Similar to its Grade 12 overall performance, Connecticut is among the top performing
states in Reading for Grades 4 and 8 on the most recent 2015 NAEP assessment. NAEP FOF 2,
3, 7/15/16. New Jersey performed not differently than Connecticut on the Grade 4 Reading
assessment while both Massachusetts and New Jersey performed not differently than
Connecticut on the Grade 8 Reading assessment. Id.20 While Connecticut's Math results for
20 The NAEP Grade 4 Reading scores from 2003 to 2015 refute Plaintiffs' expert, Dr. Barnett's, claim that Connecticut has seen virtually no change in scores from 2002 to 2011 compared to New Jersey for the NSLP subgroup. PTX 333, Barnett 2012 Report, p. 14. The evidence shows only 2 administrations in which the New Jersey scores were statistically significantly higher than those of Connecticut, namely 2007 and 2011. DTX 6176, NAEP CT NJ 2003-2011 Grade 4 Reading Math NSLP, Savoie Tr. 4/27/16, pp. 136:27-139:27. Otherwise, the evidence shows that Connecticut and New Jersey's scores were not statistically different, including for the two most recent administrations in 2013 and 2015 for Grade 4 Reading for the NSLP subgroup, which Dr. Barnett did not consider. Id. Barnett Tr. 4/25/16, pp. 101:17-102:5, 103:9-105:4.
29
Grades 4 and 8 are not as strong, Connecticut, nonetheless, performed the same as 20 other states
on the Grade 4 Math assessment with 16 states outperforming Connecticut and 13 states
performing lower than Connecticut. NAEP FOF 4, 7/15/16. Similarly, Connecticut performed
the same as 21 other states on the NAEP Grade 8 Math assessment for 2015 while 9 states
outperformed Connecticut and 19 states scored lower. NAEP FOF 5, 7/15/16.
Connecticut's subgroup performances on the 2015 NAEP Reading assessments for
Grades 4 and 8 mirror its overall performance in that all three subgroups, NSLP, Black and
Hispanic, made strong performances. Specifically, all 3 subgroups performed not differently
than most of the country and, in the case of Grade 8 Reading, not differently than half the
country. NAEP FOF 7, 9, 11, 13, 15, 17, 7/15/16. In fact, no state outperformed Connecticut's
Black subgroup on the Grade 8 Reading assessment and only one state outperformed its Hispanic
subgroup on the Grade 4 Reading assessment, while no state outperformed Connecticut's
Hispanic subgroup on the Grade 8 Reading assessment. NAEP FOF 13, 15, 17, 7/15/16. In
addition, Connecticut's NSLP subgroup performed not differently than that of New Jersey on the
Grade 4 Reading assessment. NAEP FOF 7, 7/15/16. Also, Connecticut's Black subgroup
performed not differently than those of both Massachusetts and New Jersey on the Grade 8
Reading assessment and Connecticut's Hispanic subgroup performed not differently than those of
Massachusetts and New Jersey on both the Grades 4 and 8 Reading assessments. NAEP FOF 13,
15, 17, 7/15/16.
Connecticut's subgroup performances, like its overall performance, are not as strong on
the 2015 NAEP Math assessment as on the Reading assessment. While most of the country
outperformed Connecticut's NSLP subgroup on the Grades 4 and 8 Math assessments, the Black
and Hispanic subgroups made strong performances. NAEP FOF 8, 10, 12, 14, 7/15/16. The
30
Black subgroup performed the same as more than half the country on the Grade 4 Math
assessment and not differently than most of the country on the Grade 8 Math assessment,
including Massachusetts. NAEP FOF 12, 14, 7/15/16. The Hispanic subgroup performed not
differently than 23 other states on the Grade 4 Math assessment and not differently than most of
the country, including Massachusetts, on the Grade 8 Math assessment. NAEP FOF 16, 18,
7/15/16.21
Finally, Connecticut's achievement gaps provide further evidence that most of the
country, including Massachusetts and New Jersey, struggle with the same gaps. The NSLP/non-
NSLP gap is the same as half the country for the Grades 4 and 8 Reading, including
Massachusetts and New Jersey22 NAEP FOF 19, 21, 7/15/16. Likewise, the Black/White gap is
the same as most of the country for Grade 4 Math, Grade 8 Reading and Math, and Grade 12
Reading, including Massachusetts and New Jersey. NAEP FOF 26-28, 29, 7/15/16. In addition,
the Hispanic/White gap is the same as more than half the country for Grade 4 Reading and
almost half the country for Grade 8 Reading, including Massachusetts and New Jersey. NAEP
FOF 31, 33, 7/15/16. Connecticut's most serious gaps are the NSLP/Non-NSLP gap for Grade 12
Reading and for Grades 4, 8, 12 Math, the Black/White gap for Grade 4 Reading, the
Hispanic/White gap for Grade 12 Reading and for Grades 4 and 8 Math. NAEP FOF 23, 20, 22,
24, 25, 35, 32, 34, 7/15/16. In these instances, most of the country has smaller gaps than
21 Connecticut's overall poorer performance on 4th and 8th grade math, as compared to reading, actually further undercuts Plaintiffs' claims. There is no evidence that Connecticut devotes fewer resources to teaching math than to teaching reading, but its reading results are much better than its math results. In the absence of any other explanation, this fact surely reinforces the idea that quality of teaching and leadership, rather than resources, are the most important factors in producing better results. If there is a better explanation, plaintiffs have not presented it. 22 The achievement gap data is considered in light of the number of states with no reportable data for the Grades 4 and 8 NAEP assessments and the 13 states that participated in the Grade 12 2013 NAEP assessments as well as the number of those states that did not meet the NAEP reporting standards for Grade 12.
31
Connecticut. Even so, Connecticut's gaps are similar to those of Massachusetts and New Jersey
with only 3 exceptions: New Jersey has a smaller Grade 12 Math NSLP gap and both
Massachusetts and New Jersey have a smaller Grade 4 Reading White/Black gap. NAEP FOF
37, 7/15/16. Otherwise, the 2015 NAEP assessments demonstrate that Massachusetts and New
Jersey have the same achievement gaps as Connecticut. Id.
E. Connecticut's Teacher and Administrator Compensation Compares Very Favorably to Other States. The compensation of teachers and school administrators in Connecticut compares
favorably to compensation in most other states and the nation as a whole. In spite of a severe
recession beginning in 2008, the average pay of Connecticut educators and administrators has
risen consistently over the last decade and has kept pace with national measures of inflation and
wage growth. DTX 6393 (Podgursky Expert Report, "Relative Teacher Compensation in
Connecticut"), Figure 1; Podgursky Tr., 4/21/16, p. 47. Connecticut ranked third in the nation in
terms of teacher salary in 2012-13. DTX 6393, Figure 3. In 2012-13, Connecticut ranked 7th in
the nation in terms of salaries for teachers with a Bachelor's degree and 5th in the country in
terms of salaries for teachers with a Master's degree. Id., Figures 4 and 5. The compensation of
Connecticut teachers relative to non-teachers, including all wage and salary workers, medical
workers, and management workers, also compares favorably to most other states. Id., 6393.
Teacher salaries are keeping up with non-teacher salaries in Connecticut, compared to other
states. Podgursky Tr., 4/21/16, pp. 58-9.
Nationally, Connecticut teachers' benefits compare favorably with those of private sector
professionals. DTX 6393, p. 4. In Connecticut, benefits as a share of salary for public school
teachers are above the national average. DTX 6393, Figure 9; Podgursky Tr., 4/21/16, p. 59.
The retirement benefit rate for Connecticut teachers is far above the national rate for private
32
sector professionals. DTX 6393, p. 5. Connecticut's state administered pension system provides
a generous retirement for teachers that helps Connecticut hire and retain highly qualified
teachers. See, e.g., DTX 6393, Figures 12 and 13 (showing that in CT teacher applicants far
exceed vacancies).
F. Teacher and Administrator Compensation in Plaintiffs' Six Focus Districts Compares Well to Other Districts.
The compensation of teachers and school administrators in the plaintiffs' six focus
districts is on the whole comparable to state averages. DTX 6393, Figure 2; PTX 420;
Defendants' Demonstrative 16. The average elementary and English Language Arts salaries in
plaintiff districts were above those of non-plaintiff districts in 2010-11. DTX 6393, Figure 2.23
Regarding average salaries in 2012-13 for general education teachers, 3 of the six focus districts
(Danbury, East Hartford and New Britain) were above the state average. PTX 420; Defs'
Demonstrative 16. New Britain's average salary for general education teachers in 2012-13 was
about $4,000-$15,000 greater than each of its five adjoining towns: New Britain ($78,535);
Newington ($74,489); Farmington ($71,773); Berlin ($69,067); Southington ($65,570);
Plainville ($63,686). PTX 420. Salaries for new teachers in East Hartford are among the top
third in Hartford County. Quesnel Tr., 6/1/16, p. 183. Teachers who apply for positions in
Bridgeport likely also apply for positions in New Haven County. Rabinowitz Tr., 1/26/16, p. 17.
In 2012-13, the average general education teacher salary in Bridgeport was $64,103, compared to
nearby New Haven County districts like Orange ($65,695), West Haven ($63,507), New Haven
($59,767), Derby ($59,298), and Ansonia ($55,331). PTX 420. Regarding average salaries in
2012-13 for special education teachers (grades 1-12), 3 of the six focus districts (Danbury, East
23 "Plaintiff districts" were derived from the Corrected Third Amended Complaint, dated January 7, 2013, and were Bridgeport, Danbury, Windham, East Granby, Plainfield, Norwich, New Britain, New London, East Hartford, Hartford, and Stamford.
33
Hartford and New Britain) were above the state average. PTX 420; Defs' Demonstrative 16. In
New London, despite plaintiffs' claims about lower salaries as compared to Groton and
Waterford, the special education teachers (grades 1-12) in New London earned on average
$67,325 in 2012-13, which placed it 9th out of the 18 towns in New London County, above
nearby Norwich ($66,340), Stonington ($63,026), and East Lyme ($61,774), among others. PTX
420. Regarding average salaries in 2012-13 for principals, 2 of the six focus districts (Bridgeport
and New Britain) were above the state average. Id. Regarding salaries in 2012-13 for
superintendents, all 6 of the focus districts were above the state average. PTX 420; Defs'
Demonstrative 16. Bridgeport superintendent's salary was 9th in the state at $234,000, above
both New Haven and Hartford. PTX 420. Bridgeport's current superintendent, Frances
Rabinowitz, earns about $290,000, consisting of $190,000 from Bridgeport Public Schools and
about $100,000 from her state pension. Rabinowitz Tr., 6/2/16, p. 194.
In most Connecticut school districts, about 80-82% of the district budget is comprised of
personnel salary and benefits, with salaries alone in the 60-65% range. See, e.g., Pascarella Tr.,
2/2/16, p. 173. Through collective bargaining at the local level, teachers and school
administrators in the focus districts have consistently received salary increases over the last few
years, permitting those districts to hire and retain qualified teachers. See Teacher and
Administrator Compensation FOFs, 5/31/16 (##75-79), 7/15/16 (##2, 4); Thompson Tr., 2/18/16,
pp. 99-100 (New London teachers recently reached a 3-year collective bargaining agreement
effective July 1, 2016, with 9% raises over the three years); Rabinowitz Tr., 1/26/16, p. 16 (2%
increases per year for teachers), 6/2/16, p. 119 (all contracts in Bridgeport involve annual salary
increases).
34
There is no evidence in the data nor in testimony at trial that teacher compensation is
inadequate in the sense of preventing districts from staffing classrooms with qualified teachers.
Podgursky Tr., 4/21/16, p. 67. Teacher hiring and retention in the plaintiffs' six focus districts
(all are Alliance Districts and all but Danbury are Education Reform Districts) compare
favorably to other districts in the state. See, e.g., Quesnel Tr., 6/1/16, p. 168 ("Our retention
rates in our district are something we are comfortable with."); Garcia Tr., 3/4/16, p. 69 (teacher
turnover has decreased in Windham). For example, from 2012-13 to 2014-15, the Education
Reform Districts (the 10 lowest performing Alliance Districts) added 4.3% in additional total
certified positions, the remaining Alliance Districts added 2.6% in additional total certified
positions, and all other local districts added 0% additional positions. PTX 6334, Table 2, p. 2.
From 2012-13 to 2014-15, even though they increased their position counts, unlike the average
of the remainder of districts, the Education Reform Districts filled 91% of their available
positions by Oct 1, the remaining Alliance Districts filled 92.2% of their available positions by
October 1, and all remaining local districts filled 94.3% of their available positions by October 1,
so that all groups filled over 90% of their available positions by October 1. PTX 6334, Table 2,
p. 2. For 2014-15, both the Education Reform Districts and the remaining Alliance Districts
received a median number of 23 applications per available position, while all other districts
received a median of 20 applications per position. In other words, the Education Reform Districts
and the remaining Alliance Districts were slightly more popular with applicants than the
remaining districts, on average. PTX 6334, Table 2, p. 2. Additionally, though the total number
of certified positions statewide (excluding approved private special education programs) declined
slightly (less than one half of one percent) from 53,484 in 2014-15 to 53,225 in 2015-16, some
districts evidenced modest increases in certified positions. For example, in the Education Reform
35
Districts, the total number of certified positions increased by 1.6 percent (173 positions). DTX
6155, p. 4. Also, the number of vacancies that districts sought to staff prior to the start of the
school year decreased from 5,145 in fall of 2014 to 4,836 in fall of 2015 - a 6 percent decline.
The number of vacancies declined for all districts except Other LEAs and Approved Private
Special Education Programs. DTX 6155, p. 4. See also DTX 6393, Figures 12 and 13 (showing
that in Connecticut, applicants for teaching positions far exceed vacancies).
G. Class Size in Plaintiffs' Six Focus Districts Compares Well to Other Districts.
Contrary to anecdotal evidence from some of plaintiffs' witnesses, the average class sizes
in the plaintiffs' six focus districts are comparable to the state averages. For example, in the
2014-15 school year, the CSDE data on average class sizes in grades K-8 statewide and in the
focus districts showed that in general there are only small and inconsistent variations in class size
in the plaintiffs' focus districts as compared to the state average. Defs' Demonstrative 10; DTX
6444; Gopalakrishnan Tr., 5/18/16, pp. 124-32.24 See also Teacher and Admin. Compensation
FOFs, 5/31/16, # 89 (student to staff ratios in CT compare favorably to other states). This was
also true for Bridgeport, in spite of Superintendent Rabinowitz's anecdotal testimony about class
size. Defs' Demonstrative 10 (showing K-8 class sizes in Bridgeport ranging from 21.0-23.7
students, contrary to Superintendent Rabinowitz' testimony about class sizes ranging from 24-29
students); Rabinowitz Tr., 6/2/16, p. 13. See also Capasso Tr., 2/23/16, pp. 66-7 (8th grade math
teacher at Tisdale School in Bridgeport has 18-20 students in each of her classes this year, and
had 20-21 in her classes last year, which is a "very nice class size"); Simmons Tr., 1/28/16, pp.
94-7, PTX 358 (in 2012-13, Edison School in Bridgeport had an average of 22 students per class
in kindergarten, 20 students per class in 2nd grade, 15 students per class in 5th grade; and in 2014-
24 This data was accurate and reliable based on performance office calculations. See Gopalakrishnan Testimony, 5/18/16, pp. 124-32.
36
15, the averages were 22 in kindergarten and 18 in 5th grade); Pascarella Tr., 2/2/16, pp. 161-2
(Danbury High School had a student to teacher ratio of 16:1). Overall, class size averages in
grades K-8 were lower than the state average (20.4 average across all grades) in East Hartford
(20.3), New Britain (20.2), and Windham (19.0), while they were slightly higher in Bridgeport
(22.5) and Danbury (20.9).25 Defs' Demonstrative 10.
Additionally, research on the effects of class size on student achievement is inconclusive.
See Baker Tr., 1/27/16, pp. 148-50 (Hoxby study of class size data in CT middle schools found
no evidence of any correlation between lower class size and gains on academic measures); DTX
6415 (Hanushek Expert Report), pp. 1-2; Hanushek Tr., 5/3/16, pp. 105-7 (STAR study showed
that, while the results showed some small improvements during kindergarten, the small classes
did not continue to have an impact on achievement in the later grades of the experiment, even
though that would have been expected if small classes had an impact across grades; also, the
reductions in class size were very large [moving from 23 to 15 students per class], making it an
extraordinarily expensive policy; no comparable studies even exist for later grades); Seder Tr.,
4/26/16, pp. 84-7 (research shows that class size is very poor predictor of improved student
achievement); Pascarella Tr., 2/2/16, pp. 51-2, 191-2. What is more important is the skill level
of the teacher, i.e., how the teacher is planning for and instructing the class. Pascarella Tr.,
2/2/16, pp. 51-2, 191-2; Thompson Tr., 2/18/16, p. 118 ("You can have a lousy teacher with 4 or
28 kids, but usually the outcome is going to be the same. So it starts with a real highly skilled
teacher."); Rabinowitz Tr., 6/2/16, p. 15 (small class sizes, even as low as 15 students, won't
make a difference without an effective teacher). Moreover, class sizes in schools are typically a
25 New London's overall average class size for grades K-8 was 23.7; however, the data was skewed due to inaccurate reporting by one of the elementary schools. See Defs' Demonstrative 10.
37
result of individual decisions made by school leaders. See, e.g., Quesnel Tr., 6/1/16, p. 80 (using
school schedule to improve class size efficiency); Capasso Tr., 2/23/16, pp. 70-1 (stating that the
principal at Tisdale School in Bridgeport wanted smaller class sizes so she managed her
available funding in such a way that provided an additional teacher at the middle school);
Hanushek Tr., 5/3/16, pp. 99-100 (noting that good principals will give their best teachers the
larger classes and the poorer teachers the smaller classes).
H. By Any Reasonable Measure, the State's Distribution of Funds to School Districts is Fair and Rational.
Plaintiffs' core complaint appears to be an assertion that the state's distribution of funds to
local school districts is not fair or rational. The facts are entirely to the contrary. Dr. Michael
Wolkoff, an expert in school finance issues, carefully analyzed state aid and school districts'
expenditures in Connecticut as they related to two variables – percentage of students receiving
free or reduced price lunch ("FRPL"), a proxy for poorer students, and the state's measure of
property wealth in each school district. Prof. Wolkoff divided the K-12 districts in the state into
ten roughly equal groups, or deciles, as measured separately by each of these two variables. His
findings, in summary, were that while there was relatively little variation in per pupil
expenditures across the various deciles, there was an enormous variation in the amount of state
aid, and in the proportion of total education spending that came from the state and the federal
government, as compared to the funds coming from the local district, and that the variation
directed by far the most aid to the districts with the largest percentages of poor students and the
least property wealth. DTX 2435– Michael Wolkoff -- Connecticut School Finance Expert
Report, and DTX 2434 (Charts and data), Tr. 4/14/16, pp. 36-37, 56-67.26
26 In fact, Prof. Wolkoff's reports obviously understate the extent of these findings for three reasons – 1) they stop just before the most substantial additional funding for the poorest
38
In fact, when comparing deciles by proportion of FRPL children, the state aid going to
the decile with the highest percentage of those poor children is about eight times the state aid
going to the decile with lowest FRPL percentage, representing a difference in state aid of over
$8,000 per pupil. DTX 2434, Chart 11, Tr. 4/14/16, p. 56. Similarly, when comparing deciles by
district property wealth, state funding provides a much greater share of revenues to those districts
with lower wealth than those with higher wealth, so that the wealthiest decile is almost entirely
funded with local funds, and the poorest decile is primarily funded with state and federal funds.
DTX 2434, Chart 15, 16; Tr. 4/14/16, pp. 57-60. Overall, as shown in DTX 2434, there is
relatively little (and inconsistent) variation in per pupil expenditures among the various deciles
divided by percentage of FRPL children, DTX 2434, Chart 6, or by district property wealth,
DTX 2434, Chart 14, but, by a very wide margin, the greater the percentage of FRPL students or
the lower the level of property wealth per district, the more state (and federal) aid the district
receives, greatly equalizing differences among districts. DTX 2434, Charts 7, 8, 9, 15, 16, 17.
This distribution is obviously both fair and rational, as it has a consistent and entirely appropriate
result – the more poor students in a district, and the poorer the district is in terms of property
wealth, the more state aid it receives. For a confirmation check, Prof. Wolkoff also reviewed the
data through use of regression analyses that considered each individual school district, without
regard to deciles. In that analysis, also, he found that less property wealth in a district was
strongly correlated with more state aid received, and that percentage of FRPL students in a
district was strongly correlated to increased state aid. DTX 2435, pp. 6-7; Tr. 4/14/16, pp. 61-67.
The plaintiffs, who bear the burden of proof on all issues, have provided no evidence to the
(Alliance) districts begins 2) they do not take into account the understatement of per pupil expenditures in the poorest districts, See, infra, Section III.I, pp. 39-41, and 3) they do not take into account major reductions in ECS grants to the wealthiest districts in the new 2016-17 budget.
39
contrary. While they maintain that certain districts do not receive enough state aid, or that
certain specific aspects of the formula or appropriation do not give them enough aid, they have
provided no witness and no evidence to contradict this basic point – the poorer the district, the
more state aid it receives, by a long shot.
I. Funding and Accounting for Magnet School Students Result in per Pupil Expenditure Figures for the Plaintiff's Focus Districts which are Inaccurately Lower than the Actual Numbers by a Significant Amount, Creating an Appearance of Unfairness to Those Districts which is not Accurate. One of plaintiffs' consistent complaints has been that per pupil expenditures in some of
the plaintiffs' focus districts are comparatively low compared to many other districts. At least a
major part, if not all, of this discrepancy is a result of distortions in the way the per pupil
expenditure data is calculated, created by the ways in which students who attend interdistrict
magnet schools in and out of the plaintiffs' focus districts are counted and funded. In other
words, a substantial part of the claimed discrepancies is not real.
In her testimony, SDE Chief Financial Officer Kathleen Demsey, with the aid of
DTX6306, explained the anomalies and their effect, using New Britain and Bridgeport as
illustrative examples, Tr., 4/1/16, pp. 141-157; DTX 6306. First, she explained that because the
statutory definition of Net Current Expenditure Per Pupil has not been updated in relation to
magnet schools, the definition counts students as being educated in the district where they live,
even though a magnet school elsewhere may be educating them. Tr., 4/1/16, pp. 118-119. In
addition, as an examination of the applicable statutes reveals, the extra payments a district
receives from the state for students attending its interdistrict magnet schools do not count as part
of its ECS grant, further distorting the per pupil expenditure number.27 Turning first to New
27 The figure commonly referred to as "net current expenditure per pupil," or NCEP, is defined by statute in Conn. Gen. Stat. § 10-76f(a) as "per pupil cost," meaning "the quotient of net
40
Britain, that district sent 869 students to out of district magnets for which it paid no tuition, and
13 students (Great Path) plus 444 students (various CREC schools) plus 22 students (Goodwin
College schools) to schools to which it paid tuition ranging from $3330 to $5400 per pupil,
amounts which are always less than the per pupil ECS grant New Britain receives for them, DTX
6306. Although New Britain counts all of these students as part of its average daily attendance
upon which its ECS grant is calculated, it does not pay for educating 869 of them at all (except
for very limited transportation costs and for special education costs, which are likely minor, as
students with very severe disabilities would be unlikely to be able to benefit from magnet
schools), and pays well less than its per pupil ECS grant for those for whom it pays tuition.
Reviewing the ECS calculation document, DTX 3356, page CF1C, shows that New Britain was
counted as having 11,061.5 students, including 1348 students who were educated at out of
district magnets, but for each of whom New Britain received a full ECS grant. Further, DTX
3356, page CF7A, Column 1 for New Britain, shows that it received a total ECS grant of
$81,027,680, or roughly $7325 per reported pupil. However, 1348 of those reported pupils were
being educated out of district, but New Britain received roughly $9.8 million, or roughly 12% of
its ECS funding, for students it wasn't educating. Tr., 4/1/16, pp. 148-153. Because these
students are included in New Britain's student count, even though New Britain pays nothing for
most of them, and far less than it receives per student for the others, New Britain's reported per
pupil expenditure is artificially and inaccurately deflated. Tr., 4/1/16, pp. 152-153.
current expenses, as defined in section 10-261, divided by such school district's average daily membership, as defined in section 10-261." Section 10-261(2) defines "average daily membership" and section 10-261(3) defines "Net current expenditures" as total current educational expenses, with certain specified exceptions, including an exception for "(E) all tuition received on account of nonresident pupils." This exclusion has the effect of not counting tuition that districts receive for students in their own interdistrict magnet schools as part of their net current expenditures per pupil.
41
Ms. Demsey's illustrative testimony about the effects of magnet schools on funding
calculations for Bridgeport explains similar and additional anomalies that affect the per pupil
expenditure calculations. As Ms. Demsey explained, Bridgeport receives $7,085 for each of the
478 students from other districts whom it educates in its own interdistrict magnet schools, for a
total of almost $3.4 million, Tr. 4/1/16, pp.141-144, but that money does not count, per Conn.
Gen. Stat. § 10-261(3)(E), as part of Bridgeport's per pupil expenditures. Bridgeport also
receives $3000 in additional funding per student for its own students in its interdistrict magnets,
for 1106 students, DTX 6306, for a total of about $3.3 million, that does not count as ECS
funding. In addition, Bridgeport sends 460 students to out of district magnets, DTX 6306, but
still counts those students, as explained above, in its ECS student count.
While the precise details vary from district to district, it is apparent that the overall effect
of the anomalies described above is to inaccurately reduce the reported per pupil expenditures for
each of the plaintiffs' focus districts, often by a substantial sum.
J. The Credible Reliable Scientific Evidence Establishes that Within Connecticut, There is No Correlation Between Educational Expenditures and Standardized Test Results, or, More Importantly, Growth in Standardized Test Results. Two well-recognized experts in education and the economics of education conducted
separate scientific analyses of the performance of Connecticut students on standardized tests and
searched for correlations between per pupil expenditures and educational achievement. Each of
them, independently, came to the same conclusion: there is no such correlation, whether for all
students, poor students, English learners, or minorities. The plaintiffs, who bear the burden of
proof on every issue in this case, produced no witnesses to challenge the methodology or
accuracy of these analyses, nor the qualifications of the experts. They simply produced
42
anecdotes, or stories, or speculation about how more money might improve test scores, in spite
of this scientific evidence which they did not challenge.
Additionally, the witnesses who offered this testimony for the plaintiffs were, in almost
all cases, currently employed by districts that have a vested interest in this case by virtue of both
their employment and the fact that their employers are dues paying members of plaintiff
CCJEF. See DTX 6460. In fact, many of these witnesses said they were testifying in an attempt
to increase the amount of state money their employing district receives. See, e.g., Quesnel Tr.
1/15/16, pp. 160-61; Rabinowitz Tr. 1/22/16, pp. 97-98; Pascarella Tr., 2/2/16, pp. 156; Garcia
Tr., 3/4/16, p. 102; see also DTX 6043 (email from New Britain Superintendent Paul Salina to
staff indicating that when staff discusses the CCJEF case with the defendants they "may discuss
positive programs and success, but with the caveat that we could do so much more with better
funding"). Other credible testimony explained why superintendents must always insist that they
need more money. For example, Commissioner Wentzell testified that a superintendent never
says that she has enough resources to do her job, in part because one of the central roles of a
superintendent is to bring as many resources to the district as possible in order to offset the local
contribution. Wentzell Tr., 4/13/16, pp. 16-17. If a superintendent were not to seek additional
monies from the state and other sources, it would have an adverse impact on her evaluation
before the board. Id. Further, if student performance results are not what the community would
like, it is easier for a superintendent to claim that if the district had more resources, then there
would be better results. Id. Similarly, Dr. Villanova testified credibly that no superintendent
would ask for less resources from the state, particularly when they know the municipal
contribution is often fixed. Villanova Tr., 5/13/16, p. 119. Accordingly, the directly interested
testimony of superintendents deserves less weight than scientific evidence that shows a
43
consistent and persistent lack of relationship between dollars spent and growth of student
achievement.
Professor Michael Podgursky first analyzed the standardized test scores, on an individual
basis, for every student in Connecticut for whom data was available who took the Connecticut
Mastery Test, or CMT, in 2011 and 2012 (the most recent years available when he did his
analysis) and compared those scores to the per pupil expenditures of the districts where the
students attended school. He found, in a nutshell, no relationship between per pupil expenditure
and student achievement on this test, and he found that this result obtained equally for all
students, for poor (FRPL) students, for minority students and for English learners. DTX 6394 –
Podgursky Expert Report, pp 1, 16-19, Tr. 4/21/16, pp. 10-24. In other words, students did no
better in higher spending districts and did no worse in lower spending districts. Recognizing that
it was possible that some or many students had received some or all of their education in districts
other than the one where they were in school at the time of the tests, and because achievement
scores are tied to many factors, Dr. Podgursky conducted a second set of analyses to look solely
at growth in student achievement for students in the same district from one year to the next.
Common sense suggests that comparing growth of students who remain in the same district from
one year to the next is a good way to isolate the value that the district brings to each student's
growth. Dr. Podgursky used a well-recognized and accepted statistical approach, known
generally as value-added analysis, to compare growth in test score achievement for students who
remained in the same district over two consecutive years. The results of this approach were
virtually the same as those of the first approach: among Connecticut students, there was simply
no discernible correlation between growth in student achievement and district per pupil
expenditures. DTX 6394 – Podgursky Expert Report, pp 1, 20-40, Tr., 4/21/16, pp. 24-43.
44
Professor Podgursky noted in summary that there is no evidence of a positive relationship
between spending and student achievement and that there is therefore also no statistically
credible way to determine how much spending is required to reach a specified level of student
achievement. DTX 6394 – Podgursky Expert Report, p. 1, Tr., 4/21/16, pp. 10-11.
Dr. Podgursky was not alone in coming to these conclusions. Professor Eric Hanushek,
an internationally renowned and extensively published expert on the economics of education,
DTX 6490 – Hanushek CV, and also a scholar recognized and relied upon by the United States
Supreme Court, see "Defendants' Opposition to Plaintiffs' Motion in Limine," filed 10/15/15,
Doc. # 230.00, pp. 3-4, conducted independent analyses of student achievement in Connecticut
and came to similar results. While Prof. Podgursky analyzed test score performance on an
individual student basis, Dr. Hanushek conducted his analyses of the relationship of student test
scores and year over year growth in student test scores to per pupil expenditures on a district by
district basis. Although his approach was thus somewhat different, his results and conclusions
were almost exactly the same. He, too, found little or no relationship between student
achievement and growth in student achievement and per pupil expenditures. DTX 6415 –
Hanushek Expert Report, pp. 1, 3-4, 23-38, Tr., 5/3/16, pp. 13-58.
K. The Lack of a Relationship Between Student Achievement or Growth in Student Achievement and Expenditures per Student is a Consistently Repeated National Finding.
Both Dr. Podgursky and Dr. Hanushek noted that they consistently found a lack of a
relationship between spending and achievement across the United States and over time. DTX
6394, p. 1, DTX 6415, pp. 1-3. Tr., 5/3/16, pp. 110 -121. In fact, as Dr. Hanushek noted, the
state with the largest or among the largest test score gains from 1992 to 2011 was Florida, which
had the lowest increase in per pupil expenditures (near zero) of any state in the country over that
time. Tr., 5/4/16, pp. 95-97, PTX 1184, 4th page, Fig. 7.1. See also Reschly Tr., 4/20/16, pp.
45
117-19 (noting that with "very meager" resources Alabama successfully implemented SRBI and
showed "remarkable growth" in achievement from 1992 to 2011, going from being one of the
lowest states to being 1 point under the national average).
Moreover, plaintiffs' superintendent experts agreed that (1) there is an achievement gap
within their districts and within schools in their districts, and (2) there is no reason to believe that
students who are performing on the lower end of the achievement gap within a school or district
have fewer resources available to them than students who are performing at a higher level in that
same school. See, e.g., Salina Tr., 1/13/16, p. 80; Pascarella Tr., 2/2/16, pp. 126-7; Garcia Tr.,
3/4/16, p. 61; See also Podgursky Report, DTX 6394 (finding achievement gaps exist within
school districts and schools in other states as well). This testimony, too, supports the proposition
that the achievement gap, and poor student performance, are not caused by lack of financial
resources and will not be cured by an infusion of money.
L. Compelling Testimony of Highly Experienced School Leaders Shows that Leadership, Rather than Money, is the Key to Student Growth.
Three of the four most experienced school and district leaders who testified,
Commissioner Wentzell, Deputy Commissioner Cohn, and former Superintendent Villanova,
stated clearly and unequivocally, based on their training, study and vast personal experience, that
leadership, rather than funding, is the key to educational success. Their testimony, unlike that of
Interim Superintendent Rabinowitz, is also fully consistent with the essentially unchallenged
testimony of Dr. Podgursky and Dr. Hanushek that there is no discernible correlation between
spending and growth in student achievement, in Connecticut or almost anywhere else. While
presently serving superintendents have overwhelming incentives to insist that they need more
funding, both because that is their job and because it is a way to lay responsibility for
unimpressive results elsewhere, the more credible evidence is to the contrary.
46
While defendants cannot begin to summarize the testimony of these three key witnesses
within the confines of this brief, their testimony was consistent. Commissioner Wentzell noted,
for example, that "leadership is a lot more important than the money," and that "I've seen schools
in very challenging contexts with very few resources be very successful, more successful than
the other schools in the same district. And it was leadership." Tr. 3/31/16, p. 155, 4/13/16, p.
75. As the court noted in conversation with former Supt. Villanova, "The Court: So your point is
. . . that you see leadership as the linchpin -- The Witness: Absolutely." Tr. 5/11/16, p. 25.
Similarly, Deputy Commissioner Cohn noted that "leadership is key," and that "systems don't
always need more money." Tr. 5/24/16, p. 18; see also Tr. 5/13/16, p. 59 (leadership and
allocation of resources are most important factors).
The conclusion that leadership requires more effective use of existing funds contrasts
with the testimony of various superintendents that they failed to use data to identify less
successful initiatives in order to focus on those proven most effective. Superintendents (or
Assistant or Associate Superintendents) Salina, Locke, Rabinowitz, Johnson and Carver could
provide no examples of their use of comparative data in their systems to prioritize more cost-
effective initiatives and eliminate less successful ones. Salina Tr. 1/13/16, p. 84; Locke Tr.
1/13/16, p. 115; Rabinowitz Tr. 1/26/16, p. 42; Johnson Tr. 1/26/16, pp. 76-77; Carver Tr.
2/4/16, p. 84.
While some superintendents insisted they needed more funding specifically for Scientific
Research Based Interventions (SRBI), compelling evidence showed that they should focus their
efforts on improving their existing classroom instruction when facing classrooms where many or
most students were performing below standard. The state's official statement on using SRBI,
DTX 4344, (for which, as the second page states, Supt. Rabinowitz was a member of the
47
Advisory Panel), notes that "Implementation of SRBI largely involves finding more effective
ways to deploy existing resources," p. 10 (numbered p. 5)(emphasis in original). The document
goes on to note that effective teaching in the classroom should be meeting the needs of at least
80% of the students, and if it is not, schools should begin with "analysis of core general
education practices" as "a necessary first step to improving student outcomes." DTX 4344, p. 11
(numbered p. 7). The report also notes that both Tier II and Tier III interventions should be
"short-term (e.g., 8 to 20 weeks)," DTX 4344, p. 13 (numbered p. 8). Commissioner Wentzell
and Deputy Commissioner Cohn both explained that proper application of SRBI did not require
extensive resources. Wentzell Tr. 4/20/16, pp. 159-160; Cohn Tr. 5/24/16, pp. 38-9, 98.
IV. THE 2012 REFORMS PROVIDE SUBSTANTIAL ADDITIONAL SUPPORT TO PROVIDE ADEQUATE AND EQUITABLE EDUCATIONAL OPPORTUNITIES
A. The 2012 Reforms Provide Effective Targeted Assistance to Support Adequate Equitable
Educational Opportunities.
Plaintiffs’ claims must be tried based upon the education system in effect at the time of
trial. CCJEF v. Rell, 295 Conn. 240, 318-19 (plurality) and 321 (Palmer, J. concurring) (2010).
The educational landscape in Connecticut comprehensively and significantly changed with the
2012 enactment of Public Act 12-116 and its subsequent utilization. These educational reforms
increase funding and enhance educational opportunities for students in low performing school
districts in fundamental and innovative ways in an appropriate research-grounded effort to
improve educational opportunities in the neediest districts. Two of the most significant new
programs are the Alliance Districts, and the Commissioner's Network, along with the continued
availability of the Priority School District Grants. Wentzell Tr., 3/31/16, pp. 147:1-148:1, 92:15-
26. Under P.A. 12-116, Connecticut has also expanded early childhood educational
opportunities, focused on early literacy programs, and developed new teacher evaluation and
48
support guidelines and a related data collection system. Id. at 81:11-22, 128:1-8; Wentzell Tr.,
5/5/16, p. 47:14-19; Barzee Tr., 4/22/16, pp. 81:11-82:14.
Dr. Richard Seder described Connecticut's specific reforms as "leading edge," with the
state targeting where the most work needed to be done, and concluded that the state's reforms
were a rational and systematic approach to improvement. Seder Tr. 4/26/16, p. 83:1-24, 96:7-
97:24: See also DTX 2432 (Seder Report – CT's Rational Approach to Systemic Change), pp.
33-40 (discussing CT's early childhood intervention and child-centered services, targeted
assistance to low-performing schools and districts, efforts to ensure effective teachers and school
leaders, and the state as a service agency.) Dr. Seder also noted that more money is not the
answer. Tr., 4/26/16, p. 88. In addition, Dr. Rice testified that Connecticut's approach in its
Equity Plan, DTX 3888, is "focused on the right sets of priorities with respect to teacher and
leader quality in poor schools." Rice Tr., 3/3/16, p. 139:2-8. Accord, DTX 2430 (Seder –
School Site Visit Report Conclusion), p. 63 (leadership matters along with a systematic approach
to change); DTX 2432 (Seder – CT's Rational Approach to Systemic Change), pp. 37-41; Seder
Tr., 4/26/16, pp. 104:8-105:11, 122:11-19 (leadership matters in school climate as well as
instructional issues).
B. Alliance District (AD) and Priority School District Grants (PSD) Provide Major New Support for the Poorest Districts, Including All of Plaintiff's' Focus Districts.
The AD program provides additional ECS money and important other supports to the 30
lowest performing districts after SDE approval of a reform plan proposed by each district
designed to increase student outcomes. Cohn Tr., 5/25/16, p. 3:20-4:2; DTX 6451 (AD/PSD
application), p. 3. Continued approval of a plan is predicated on district progress and alignment
between use of funds and strategy set out in the plan. DTX 6451 at 3. SDE provides feedback
in an iterative process before approving the plans, monitors the plans and requires the districts to
49
produce evidence that their plans are effective. Cohn Tr., 5/25/16, p. 6:8-24; Wentzell Tr.,
3/31/16 p. 77:16-19. Alliance District Convenings are used to share best practices and provide
professional development amongst primarily superintendents, central office staff and principals.
Cohen Tr., 5/24/16, pp. 62:2-19; 5/25/16, pp. 45:24-48:6. 32
The PSD grants provide additional funds to the districts with the greatest academic need
for 8 approved reform areas, including, but not limited to extended school hours and summer
school programs. Id.; Cohn Tr., 5/24/16, pp. 72:6-9; 5-25-16, pp. 80:19-81:21; DTX 6451, p. 3
(lists 8 uses). At least 20% of the PSD funding must support early reading interventions. Id. at
p. 4. Fourteen of the 30 ADs, including Bridgeport,33 Danbury,34 East Hartford,35 New Britain,36
New London,37 and Windham,38 also qualify for PSDs during 2016-17. Id.
32Several superintendents extolled the benefits of the Alliance district program. E.g., Quesnel Tr., 1/15/16, p. 182 ("the Alliance District grant is a fantastic example of when funding and management and oversight and accountability all come together with a dynamic strategic plan towards student achievement based on student needs and based on the concept that what we're doing does not work and we need to do more and we need to do smarter to bring students to an adequate level of both performance and opportunity, [and] results begin to happen."); 1/19/16, p. 26 ("as a result of the Alliance District program where funding and accountability and a tight plan have come together we have begun to see results."); 6/1/16, pp. 79-80 (Quesnel has learned from Alliance District convening meetings, including the sustainability workshop, and has built community partnerships); pp. 106-7 (noting that one of the strengths of the Alliance District grant is the ability of districts to collaborate with the CSDE on their plans, and that the plans are not "one size fits all."); Rabinowitz Tr., 1/22/16, p. 113 (Alliance District funding is used for what the individual district determines is its highest priority needs); 1/22/16, p. 105 ("I have found great value in being able to work with other superintendents and staff members to collaborate on how they have solved some of their issues, whether it be interventions or suspensions."); Pascarella Tr., 2/2/16, pp. 174-6. (The 2012 reforms, including the Alliance District grant, have provided benefits to students, helped to narrow achievement gaps, and allowed districts to expand their initiatives.). In addition, Dr. Villanova testified that Connecticut is working to address the needs of children in urban districts through the Alliance District plan, which is "a significant and focused attempt to close the achievement gaps by using more high leverage, coherent strategies to move learning forward. And…that is the work that the districts that I know in Connecticut that are poised to make progress are focused on those strategies." Villanova Tr., 5/11/16, p. 44. 33 For the SY 2015-16, Bridgeport was approved to receive $18,071,380.32 in AD funds and $6,637,852.25 in PSD funds as summarized in DTX 6122 (Bpt AD/PSD Summary) and set forth
50
The reform framework in the AD/PSD application process centers on 4 turnaround
strategies: Talent, Academics, Culture and Climate, and Operations (TACO). DTX 6451, p. 5;
Cohn Tr., 5/25/16, pp. 7:15-11:27. SDE works with districts to plan sustainability of their AD
plans, which may take a few years, may involve realignment of other priorities, and may come
about with job-embedded professional development. Cohn Tr., 5/25/16, pp. 12:1-16:11, 40:20-
42:24 (the state pays the lion's share the first year and the district pays a minimal amount and
then those amounts decrease and increase respectively over the subsequent plan years).
Instructional coaching should not be a priority that lasts forever, as teachers retain the skills sets
they develop. Id. at 45:3-15.
in more detail in DTX 5363 (fully approved application). It was also approved to receive additional PSD grant amounts of $393,459 in an extended school hours grant and $457,729 for summer school grant. DTX 6120. 34 For SY 2015-16, Danbury was approved to receive $7,847,721 in AD funds and $2,056,661 in PSD funds as summarized in DTX 6140 (Danbury AD/PSD Summary) and set forth in more detail in DTX 5377 (fully approved). It was also approved to receive additional PSD grant amounts of $203,893 in an extended school hours grant and $230,212 for summer school. DTX 6141. 35 For SY 2015-16, East Hartford was approved to receive $7,852,667 in AD funds and $1,111,577 in PSD funds as summarized in DTX 6114 (EH AD/PSD Summary) and set forth in more detail in DTX 5381 (fully approved application). It was also approved to receive additional PSD grant amounts of $152,925 in extended school hours grant and $175,781 for summer school. DTX 6142. 36 For SY 2015-16, New Britain was approved to receive $12,749,366 in AD funds and $2,056,662 in PSD funds as summarized in DTX 6234 (NB AD/PSD Summary) and set forth in more detail in DTX 5400 (fully approved application). It was also approved to receive additional PSD grant amounts of $206,066 in extended school hours grant and $240,355 for summer school. DTX 6113. 37 For SY 2015-16, New London was approved to receive $3,118,238 in AD funds and $1,135,869 in PSD funds as summarized in DTX 6235 (NL AD/PSD Summary) and set forth in more detail in DTX 6458 (fully approved application). It was also approved to receive additional PSD grant amounts of $66,165 in extended school hours grant and $77,454 for summer school. DTX 6197. 38 For SY 2015-16, Windham received $2,646,307 in AD funds and $1,144,757 in PSD funds as summarized in DTX 6232 (Windham AD/PSD Summary) and set forth in more detail in DTX 5424 (fully approved application). It also received additional PSD grant amounts of $61,072 in extended school hours grant and $67,473 for summer school. DTX 6233.
51
Although it is good fiscal practice to spend grant money in the year for which it was
allocated, Cohn Tr., 5/25/16, pp. 14:18-16:11; 5/25/16, pp. 21:5-10), about one-third of the ADs
carry over grant funds, including all of the plaintiffs’ six focus districts in 2015-16, except
Windham. Id. at 25:10-13; DTX 6461, p. 2. The following are the AD amounts the plaintiffs’
focus districts had not spent for SY 2015-16 as of May 2, 2016: Bridgeport $5,918,992;
Danbury $1,047,221; East Hartford $452,667; New Britain $3,413,366; New London $647,602;
Windham $0. DTX 6461, p. 2. Not spending available money in the designated year obviously
deprives that year's students of the benefits of the funds.
C. Commissioner's Network Grants (CN) Provide More Targeted Support.
The CN program provides substantial funding as well as intensive supports and
monitoring for schools to engage in school level turnaround for up to 5 years. Cohn Tr., 5/25/16,
p. 4:3-17, 76:2-4; DTX 2110 (CN Support Handbook). 39 There are currently 14 schools
participating and there will be 17 in the fall of 2016. Id. at 18-21. There is no evidence that any
school has ever been turned down for the CN because of a lack of available funding. The
TACO framework is used as well within the CN context. Id. at 71:20-23. NetStat meetings are
used to share best practices and provide professional development within the CN schools. Cohen
Tr., 5/24/16, p. 62:2-19; 5/25/16, p. 74:19-75-5; DTX 2110, pp. 11-13. SDE also works with
the CN schools to support sustainability goals. Cohn Tr., 5/25/16, pp. 76:26-77:10; DTX 6471
(CN update), p. 3. The SY 2015-16 is the first year that sustainability is a requirement to join the
CN. Cohn Tr., 5/25/16, p. 60:1-16. Like AD plans, CN plans can also be revised as needed with
SDE approval. Id. at 71:12-19. 39 Quesnel Tr., 1/19/16, pp. 33:17-34:4 (CN plan at O'Brien STEM Academy is a classic example of a really incredible plan because "it is based on the organic needs of the district hammered on a battle through by experts, tight metrics around what success means, and funding to back it up").
52
Numerous schools within the CN have had significant unspent carry-over amounts in SY
2015-16 as of May 2, 2016. DTX 6461, p. 4. The following are the amounts each of the CN
schools found within the plaintiffs’ six focus districts had been approved and amounts not spent
as of May 2, 2016: Bridgeport - Curiale $352,000 approved/$73,804 unspent, Dunbar $500,000
approved/$79,007 unspent, Marin $1,000,000 approved/$259,158 unspent; New Britain –
DiLoreto $800,000 approved/$249,000 unspent. East Hartford Middle School spent all of its
$900,016 CN funds as did East Hartford's O’Brien with regard to its $550,000. Likewise,
Windham Middle School spent all of its $587,840. Id.
D. School Improvement Grants (SIG) Provide More Targeted Support.
There are two types of these federal grants: SIG 1003(a) and 1003(g). The SIG 1003(a)
grants are about $4 million this year, spread across 27 or 30 AD schools directed at a specific
group of students, such as high needs students, special education or chronically absent students.
Cohn Tr., 5/25/16, pp. 82:13-27. SIG 1003(g) is about $3.6 million directed at a small number
of schools for a whole school turnaround effort for 3 years under ESSA. Id. at 83:1-9.
For additional information including budgets for earlier years of grants and bonds
targeted to neediest districts and schools, see DTX 6226 (Demonstrative) (AD/PSD, CN, low-
performing, SIG, and schools of distinction).
E. The Next Generation Accountability System is Well-Designed to Support and Increase Accountability of Leaders, Schools and Districts.
Connecticut's Next Generation Accountability System (NextGen System) is the next
iteration of its school and district accountability plan that was outlined in its 3rd ESEA Flexibility
Request, which was ultimately approved on August 6, 2015 by the U.S. Department of
Education. Gopalakrishnan Tr., 5/18/16, p. 3. See PTX 204 (ESEA Flexibility Request, revised
8/3/15, Principle 2); DTX 5718 (9/22/15 Letter from Commissioner to Superintendents re:
53
Highlights from ESEA Flexibility Request). The NextGen System describes the indicators,
methods and approach that Connecticut will use to hold schools and districts accountable, and
makes public and transparent which schools and districts are doing a good job on delivering a
quality education to students. DTX 6111; Gopalakrishnan Tr., 5/18/16, p. 3; Wentzell Tr.,
3/31/16, p. 19; PTX 1141 (2014-15 School Categories in NextGen System). It is also tied to
supports from the state and consequences at the state level. PTX 1141; Wentzell Tr., 3/31/16, p.
19. Moreover, the CSDE provides technical assistance to districts concerning root-cause data
analyses, and offers opportunities for districts to share best practices, such as at Alliance District
convening meetings and Commissioner's Network "NetStat" meetings, and by publishing a guide
for superintendents to use the accountability data to improve and replicate high-performing
strategies, particularly for high needs students. Wentzell Tr., 4/13/16, p. 22, 24-5.
The NextGen System has 12 indicators, each weighted differently on an accountability
index. DTX 6111, pp. 5-6. For example, indicators 1 and 2, academic achievement and growth
in achievement on state mastery examinations for all students and high needs students, are
weighted 300 and 400 index points, respectively (starting in year 2). Id. The separate weighting
of high needs students demonstrates the state's commitment to reducing the achievement gap in
schools and districts between high needs students and their counterparts. Gopalakrishnan Tr.,
5/18/16, pp. 34-5. In elementary and middle schools, indicators 1 and 2 comprise 700 of the 850
points on the index (82%), demonstrating the state's emphasis on growth in achievement in
schools and districts, particularly for grades 3 to 8. Id..; Gopalakrishnan Tr., 5/18/16, pp. 12-13,
17 (growth in achievement is "a very solid indicator of which schools are helping students grow
academically").
54
In high school, where there is only one standardized assessment (and so there can be no
growth component), standardized academic achievement indicators account for 600 of 1250
points on the index (48%). Id.; Gopalakrishnan Tr., 5/18/16, pp. 9-10. Other indicators at the
high school level focus on college and career readiness. DTX 6111, p. 5. These indicators
provide safeguards that militate against adulterating graduation standards. Gopalakrishnan Tr.,
5/18/16, pp. 53, 60. See also Graduation Standards FOFs, 5/31/16, ## 125-95, 7/15/16, ## 1-32
(graduation standards). Districts are rewarded for exposing students to college and career
coursework and exams. For example, indicators 5 and 6 (50 points each) relate to participation
in college level coursework such as AP (advanced placement), IB (international baccalaureate),
dual enrollment, and career and technical education courses (indicator 5), as well as the
percentage of students reaching college readiness benchmarks on examinations such as the SAT,
ACT, AP and IB exams (indicator 6). DTX 6111, p. 5; Gopalakrishnan Tr., 5/18/16, pp. 48-50.
Additionally, indicator 7 (50 points) awards points to schools and districts for the percentage of
9th grade students earning at least 5 full year credits in the year and no more than one failing
grade in English, math, science or social studies. DTX 6111; Gopalakrishnan Tr., 5/18/16.
Graduation rates are weighted relatively low compared to other indicators, providing a
safeguard against districts lowering graduation standards in order to increase graduation rates.
DTX 6111, pp. 5-6; Gopalakrishnan Tr., 5/18/16, p. 60 (noting that, under the NextGen System,
if a district's 4-year graduation rate is, for example, 75%, the district does not get 0 points for
indicator 8; instead, it would get 75 out of 94 (state's 4-year graduation rate target)). Instead, as
the Court recognized, the NextGen System places greater emphasis on academic achievement
55
and academic growth than it does on graduation rates. Gopalakrishnan Tr., 5/18/16, p. 61.43
This emphasis on achievement and growth in achievement is supported by superintendents,
including plaintiffs' expert Nathan Quesnel. Quesnel Tr., 6/1/16, p. 133 (noting that a good thing
about the new accountability system is it is focused on achievement and growth between years).
The 4-year graduation rate (indicator 8) and the 6-year graduation rate for high needs students
are each weighted at 100, which is only 8% of the total index for a high school. Id. The
inclusion of the 6-year graduation rate for high needs students was the result of a concerted effort
by the CSDE to respond to the concerns of superintendents, such as Dr. Pascarella in Danbury,
about the needs of certain students such as English learners who may require more time to reach
grade level. Gopalakrishnan Tr., 5/18/16, pp. 32, 51-2. This factor encourages districts to retain
and reengage high needs students to ensure that they are ready academically before graduating.
Id.
The NextGen System also provides flexibility for recently arrived English learners with
regard to student achievement and growth; see DTX 6111, p. 15 (ELs newly arriving in US are
not counted in indicator 1 in first year but are counted in indicator 2 in second year and both
indicators 1 and 2 in third year); as well as any student who arrives in a school or district during
the course of the school year. Gopalakrishnan Tr., 5/18/16, pp. 45-6 (the NextGen System only
measures students who are full-year students, i.e., were in the school on October 1 of that same
school year). Other indicators include postsecondary entrance (indicator 10; high school only),
physical fitness (indicator 11), chronic absenteeism, DTX 6111, pp. 5, 17, and arts access
(indicator 12; high school only). DTX 6111, p. 5.
43 ("COURT: In other words, that you're weighting heavily toward academic achievement and academic growth. And so that is one way to say that if you're putting pressure on something, you're trying to put pressure on academic achievement and academic growth, because those are your biggest sets of the points.").
56
In March 2016, the CSDE published the first NextGen accountability reports for districts
and schools. See DTX 6111, p. 29. Under these index results, several high needs groups in
plaintiffs' focus district schools are outperforming the statewide high needs group average in one
or more subjects, including 10 schools in Bridgeport, 6 schools in New Britain, 4 schools in East
Hartford, and 2 schools in New London. DTX 6215 (high needs outperforming district and
state); Wentzell Tr., 4/13/16, pp. 19-26; Gopalakrishnan Tr., 5/18/16, pp. 80, 103-4. See also
DTX 6216 (schools exiting turnaround or focus status).
F. Connecticut has Created and Implemented More Objective and Uniform Teacher Performance Measures As Evidenced by PEAC, SEED, and CT Core Rubrics, That Are Rationally Related to the Education of Students44 (addresses Judge Q # 5).
The Performance Evaluation Advisory Council (PEAC) created new educator evaluation
and support guidelines, adopted by the State Board of Education in 2012, DTX 6305, and
updated in 2015 after receiving stakeholder feedback. DTX 6328. PEAC members include,
among others, the heads of SDE, AFT-CT, CT-CEA, CAPSS, CAS, CFSA, CABE, RESC
Alliance (EASTCONN and CREC), and the Chair of the Education Department of the Board of
Regents. DTX 6328, p. 26. Many of these organizations are also dues-paying members of
CCJEF. DTX 6460 (CCJEF membership list). Districts may develop their own evaluation and
support plans consistent with the PEAC core requirements or use the 2015 state model, known as
SEED (System for Educator Evaluation and Development), which is also aligned to PEAC's core
requirements. Barzee Trial Transcript, (hereinafter Barzee "Tr.") 4/22/16, p. 30:4-31:5. SEED is
grounded in CT Core Standards, CT’s Professional Standards, the Common Core of Teaching
(CCT), the Common Core of Learning (CCL), the CT School Leadership Standards, the CT
Framework K-12 Curricular Goals and Standards, the SBAC, and locally developed curriculum
44 See Defs' Findings of Fact: Teacher and School Leader Evaluation, 5/31/16, ## 103-124.
57
standards. DTX 3715, (SEED) p. 4. SEED is informed by a large body of research-based
standards for educator effectiveness, including the Gates Foundation’s Measures of Effective
Teaching (MET). Id. at 2, 4.45
Multiple sources of information and evidence are used to evaluate educators. DTX
6328, p. 8-13. Teachers are evaluated based on both student outcomes and teacher practice.
These two categories are further broken down as follows: (1) student growth and development
(45%) and whole school student learning indicators or student feedback (5%) 46 ; and (2)
observation of teacher performance and practice (40%) and parent or peer feedback, including
surveys (10%). Id. Similarly, the multiple sources used to evaluate administrators include:
multiple student learning indicators (45%) and teacher effectiveness outcomes (5%); leadership
practice (40%) and stakeholder feedback (10%). DTX 3715, pp. 3, 8. 48 “Accordingly, the
[SEED] model aims to minimize the variance between evaluations of practice and support
fairness and consistency within and across schools.” Id. at 4. Scoring from the 4 components
results in performance levels defined as Exemplary, Proficient, Developing, and Below Standard.
Id. at 8.
The measure of Student Growth and Development is based on carefully planned, long-
term academic objectives reflecting high expectations for learning and improvement, and aims
for mastery of content or skill development. DTX 3715, p. 25. The Student Learning Objectives
45 In 2012-13 a Pilot Study implemented SEED in 10 districts/district consortia. UCONN’s NEAG School of Education studied the pilot and provided feedback, which further guided the model design. DTX 3715, p. 2; Barzee Tr., 4/14/16, p. 118:13-21. 46 Districts may decide to use a whole school set of Student Learning Objectives (SLO), student feedback through surveys, or a combination of the two to determine the 5% component of SEED. DTX 3715, p. 33. Districts may develop their own valid and reliable student surveys or use the sample one developed by Panorama Education for the SEED model. Id. at 34. 48 See DTX 6328, p. 24, DTX 3715, pp. 16, 41-42, and DTX 5950 (SESS Rubric) for evaluation programs for educator support specialists.
58
(SLOs) are measured by Indicators of Academic Growth and Development (IAGDs) which
include specific assessments or measures of progress and targets for student mastery or progress.
Id. The final determinations of SLOs and IAGDs are reached at through mutual agreement
between the teacher and the evaluator and can be adjusted mid-year. Id. at 9, 26; Barzee Tr.,
4/22/16, p. 53:2-12, 54:8-10.
The state assessment (SBAC) will be used for the 22.5% of the student growth and
development component beginning in 2017-18. Barzee Tr., 4/22/16, p. 35:22-23. Until then, the
districts use another appropriate standardized assessment where one exists. Id. at 33:16-22; See
DTX 6328, pp. 9-10. And each of the six focus districts does utilize another appropriate
standardized assessment: Bridgeport – AIMSWEB, (Rabinowitz Tr. 1/21/16, pp. 76:26-77:1);
Danbury - STAR (Pascarella Tr., 2/2/16, pp. 69-71); East Hartford - STAR (DTX 6479 EH
Report; Quesnel Tr., 1/15/16, pp 114:26-115:5); New Britain - NWEA (Salina Tr., 1/13/16, pp.
25:26-26:4); New London - NWEA (Thompson Tr., 2/18/16, pp. 30:10-17); Windham - DIBELS
(DTX 6474 Ck3Li Report), and Riverside HMH1 replacing NWEA (Garcia Tr., 3/4/16, p. 70:8-
19).
The other 22.5% is made up of a maximum of one other standardized assessment and a
minimum of a non-standardized indicator. DTX 6328, pp. 9-10. Where non-standardized
assessments are based on student performance, rubrics must be used. Id. at 10. See DTX 6328,
p. 10. Thus, the use of non-standardized indicators is limited in use and weight, to no more than
22.5% of the growth and development component where districts use standardized assessments
other than the state assessment, and non-standardized indicators may be used for even less than
22.5% of the growth and development component. Id. at 9. See also DTX 3715, pp. 26-29.
59
Teacher Performance and Practice (40%) includes multiple observations by trained
evaluators, also evaluated against a standards-based rubric to identify strong practice,
development needs, and to inform support to meet those needs. DTX 3715, p. 16. Barzee Tr.
4/22/16, p. 45:10-27 (the 40% observation of practice is made more objective through the use of
rubrics, tools, and processes); 71:27-72:25 (proficiency trainings by external expert partners);
80:17-27 (evaluators must demonstrate own proficiency in evaluating). The CCT Rubric for
Teaching, 2014 (DTX 5949) aligns with Conn. Core of Teaching (CCT) and Connecticut Core
State Standards (CCSS) and reflects skills and knowledge teachers need to demonstrate. DTX
3715, p. 16. Barzee Tr. pp. 133:26 – 134:2. CCT Rubric for Teaching is organized into 4
domains of essential practice, each of equal weight and each with 3 indicators. Evaluators
average indicators within each domain to a tenth of a decimal to calculate domain-level scores.
DTX 3715, p. 21. This rubric was revised through collaborative efforts of SDE, RESCs, CAS,
two statewide teachers’ unions, teachers and school leaders with experience in using the
observation instrument. Id. at 16. Rubrics have also been created to provide objective standards
for evaluations and support for administrators and support specialists. See DTX 5953 (Leaders'
Rubric), 5950 (SESS Rubric) respectively; Barzee Tr., 4/22/16, pp. 65:15-71:26 (new rubrics
have significantly reduced the variation with which we observe; much less subjectivity than in
the absence of a rubric), 68:12-19.49
Connecticut's PEAC core requirements that districts must satisfy when adopting
evaluation plans for teachers and administrators are consistent with what Dr. Hanushek testified
constituted effective elements of evaluation. See Hanushek Tr., 5/3/16, pp. 61-78. More
49 Evidence guides, developed with national experts enhance the rubrics and inform deeper levels of look-fors and listen-fors to help educators evaluating outside of their own content area. Barzee Tr., 4/22/16, p. 71:10-24.
60
specifically, Dr. Hanushek stated that evaluations should include both objective and subjective
elements. Id. at 61:26-62:6; 63:4-64:13. Growth in student performance as measured by
standardized tests is a very important element, but should not be used exclusively. Id. at 64:1-13.
In Washington, D.C., "the most finely developed system today," this value-added score counts
for 35% of the overall evaluation of teachers who are in tested grades. Id. at 65:8-17, 67:10-12.
In D.C., the other 65% of the evaluation is done by full time district employees (including the
principal) trained in evaluation, and is based on objective rubrics that take into account a variety
of different factors of both classroom and outside the classroom factors. Id. at 66:6-13, 66:23-
67:9. For the other teachers who aren't in tested grades, the evaluators use an objective rubric-
based system instead of test scores. Id. at 67:12-27. An objective rubric consists of "a list of
factors that they are grading people on in terms of their interactions with students, in terms of
how well prepared they are for all the lessons that they're teaching." Id. at 69:13-19. Hanushek
testified that the results of these systems have proven to be very positive. Id. at 69:24-26. He
further explained that effective teacher evaluation in Connecticut could occur if the state "could
declare some broad guidelines on how much attention had to be given to test scores of students,
how much attention had been given to other measures….You have to have at least 40 percent of
the evaluation of teachers has to use test score information if it's available." Id. at 71:25-72:18.
Since 2012, Connecticut has in fact already taken this approach by developing core requirements
through the work of PEAC that require 45% of teacher evaluations be based on growth and
development from multiple indicators of standardized assessments. DTX 6328, pp. 8-11; DTX
3715. Hanushek also noted the importance of details of evaluation being founded in agreement
between the local teachers and principals. Hanushek Tr., 5/3/16, p. 73:16-20; 77:16-19. This,
too, is exactly what CT is doing. DTX 6328, p. 8. Hanushek approves of the use of parent
61
surveys, another tool that CT makes available for use in evaluation. Hanushek Tr., 5/3/16, p.
77:14-15; DTX 6328, p. 13 (10%).
SDE provides, free of charge extensive training with regard to the district’s evaluation
and support model, whether or not the district uses SEED. DTX 6328 at 16; DTX 3715 at 11;
Barzee Tr. 4/22/16, pp. 72:4-25, 78:23-83:10. In addition to training for evaluators, there is
training relating to calibration for fairness and accuracy across the districts, which eliminates a
large degree of subjectivity. Barzee Tr., 4/22/16, 79:25-80:13; 112:25-113:4 144:2-7. At the
request of a district or district employee, SDE will audit the summative rating when its
components are significantly dissimilar (e.g., below standard and exemplary) to determine a final
summative rating. SDE also performs an annual audit on two educators rated exemplary and two
educators rated below standard, one of whom must be a teacher, in a random selection of 10
districts. DTX 3715 at 12.
The evaluation process informs the professional learning opportunities identified for
individual teachers so that educators obtain the support they need. DTX 6328 at 13, 23; DTX
3715 at 13-14; Barzee Tr. 4.22.16, p. 84:1-90:3. Districts must create a differentiated plan of
support for teachers rated developing or below standard. DTX 3715 at 14. Rewarding
exemplary performance is also a part of this new plan. DTX 3715 at 15.
CT uses other performance measures rationally related to the education of students as
well. For example, with regard to Connecticut's entrance and exit standards for educator
preparation programs, there are new Praxis Core entry cut scores, aligned with CT Common
Core standards testing basic skills in reading, writing, and math, which are in line with the multi-
state recommended cut scores. And as to teacher qualifying standards testing content
knowledge, 13 of the teacher qualifying Praxis II cut scores are above the multi-state
62
recommended cuts. Barzee Tr., 4/14/16, p. 136:4-8. Id. at 123:8-24. In addition, based on the
work of EPAC, which is comprised of many of the testifying plaintiff district members and
CCJEF members, DTX 6315 (EPAC membership list), a new educator preparation program
standards (CAEP) and accountability system will be presented to the State Board of Education
for adoption in September 2016. DTX 3862 (EPAC update to SBE) at 4-6 and Appendix H-1;
DTX 6316 (EPAC Accountability); Barzee Tr., 4/14/16, pp. 145:16-20; 146:18-147:14.
SDE's Talent Office budget to further talent development and thereby benefit students for
the years 2012-2016 is seen in Def's Demonstrative 6396 and explained in Barzee's Tr., 4/22/16
pp. 108:6-114: 24. (2012-13: $7,277,523; 2013-14: $10,405,135; 2014-15: $9,475,887; 2015-16:
$7,041,173).
G. Connecticut Uses A Multitude of Effective Incentives and Opportunities to Resolve Teacher Shortage Areas.
There are shortages of teachers in certain subject areas nationwide, including in
Connecticut. DTX 6155 (SBE update re 2016-17 shortage areas), p. 4; Barzee Tr., 4/14/16, pp.
151:23-152:2. The SDE Talent Office has a manager and a consultant devoted to working on
shortage areas and exploring strategies to provide more opportunities to fill teacher shortage
areas. Barzee Tr., 4/14/16, p. 152:5-11. As one example, to enhance the number of people
obtaining cross-endorsements in TESOL and Bilingual through the Alternate Route to
Certification for ELs (ARCTELL),50 SDE has used Title III dollars to offset some of the tuition
cost for candidates who could not afford to participate in the ARCTELL program. Id. at 152:12-
23. DTX 6155, p. 2 (over 100 ARCTELL participants have received tuition assistance).51 SDE
also relaxed the usual three year ARC teaching prerequisite for the Advanced ARC cross-
50 See also Flick Tr., pp. 61:15-62:27 discussing ARCTELL success. 51 See also Flick Tr., p. 63:1-20 discussing state and local payments for ARCTELL tuition.
63
endorsement in Special Ed and Tesol/Bilingual. Id. at 152:24-153:10. These incentives resulted
in such an increase in the availability of TESOL teachers that the category dropped out of the top
ten in the shortage list for 2016-2017. DTX 6155; Barzee Tr., 4/14/16, pp. 151:14-22, 153:3-10.
SDE encourages educator preparation programs to provide more programs addressing
shortage areas. A new program at Sacred Heart in speech language pathology, a long time
designated shortage area, has recently been approved by the SBE. Id. at 153:21-154:2. SDE
and the RESCs have also provided scholarship money to shortage area candidates attending
educator preparation programs who need financial assistance. Barzee Tr. 4/14/16, pp. 11-22.
The state also publishes to the education community opportunities for shortage area
teachers for federal loan forgiveness or deferral incentives; mortgage interest rate reduction; and
no income cap restriction for rehiring of retired teachers. DTX 6334 (data bulletin), p. 1; DTX
6155, pp. 4-5; Barzee Tr., pp. 154:11-155:24. An extensive list of SDE proactive measures to
reduce vacancies is found in DTX 6155, pp. 2-5.
H. SDE and its Partners Offer Free Professional Development to All Types of Educators on a Multitude of Topics.
Professional Learning spans the career of an educator. DTX 6222, (Managing Educator
Talent) p. 7. It begins with the TEAM mentoring program provided to new teachers. A teacher
is provided a district mentor, who is paid $500 per mentee for multiple years. Barzee Tr., pp.
132:14-133:5 ($2.1 million supports mentor stipends). TEAM funding annually has been $3
million, which includes training, technical assistance to district facilitators, cooperating teachers
and data management to track progress through TEAM. Id.
During 2010-2012, SDE provided guidance to districts about how to implement the
Common Core (CC). Cohn Tr., 5/24/16, pp. 102:2-103:8; DTX 4033 (10-2013 implementation
letter to district leads). In 2012-13 SDE used $8 million to support CC implementation, and $6
64
million in each of the following two years. Cohn Tr., at 103:10-14, 111:9-12. In the spring of
2014 through the fall of 2015, SDE was running 42 CC workshops per month all around the state
focused on math and English Language Arts, broken down by grade and informing educators of
the changed standards requiring changes to instructional practices. Id. at 103:22-105:9, 106:7-13
(11,000 attendees). Teachers raved about a "Teachfest" event on the CC. Id. at 105:10-106:6.
SDE provided a CC professional development series focused on K-3 reading. Id. at 106: 14-16.
Professional development related to CC is available through SDE's website. Id. at 106:16-17.53
SDE's website also houses a Library of Professional Learning Materials that holds every printed
handout or material from workshops and an on-demand professional learning site that includes
any kind of electronic learning. Id. at 121:14-26. SDE created a monthly webinar series during
2014-15SY designed for principals and district-level administrators based on a 25 page book
they created called "The Principal's Look-for Book" to be used during walk-throughs to guide
instructional leadership. Cohn Tr., at 106:21-107:24. SDE also sends teams of consultants out
to the districts to provide technical assistance. Id. at 108:2-109:4. SDE contracts with the
RESCs to deliver professional development statewide, including free in-district coaching days.
Id. at 109:19, 110:4-12. SDE always gives priority registration to the AD and PSDs. Id. at
109:20-26. Three times a year an Alliance District Convening occurs, which includes different
forms of professional learning. Id. at 111:21-112:11 (sharing of best practices; SDE
presentations, external experts).
53 DTX 5570 (Digital Library, Math, learning modules, SBAC, ELs and Students with disabilities, SRBI); DTX 3826 (Summer Curriculum for ELA and Math, Model Algebra 2 and Geometry Training, Computer Science K-5); DTX 6166 (free principals' workshops); DTX 6167 (Smarter Balanced – formative assessments); see also DTX 4037 (AD Convening Tour of CC website).
65
SDE provides professional development for both the implementation (technical support)
and instructional side of SBAC (teach to the standards). Id. at 115:26-118:6. Extensive
professional development is also provided for teacher evaluation and support, Id. at 129:27-
130:4, ESL/Bilingual, Id. at 130:6-7, general ed and ESL teachers related to the new CELP
standards, Id. at 134:24-135:2; for special ed, Id. at 130:5-6, the Next Generation Science
Standards, Id. at 127:18-129:21, DTX 6110, p. 2; and K-3 Reading ($1 million per year for each
of 5 years), Cohn Tr., 5/24/16, pp. 79:17-80:10. Professional Development for SRBI is available
in different ways: CALI modules, embedded SRBI for Common Core State Standards, State
Personnel Development Grant, and SRBI webpage (DTX 4333).54 Cohn Tr., pp. 98:27-102:1.55
In addition, the Academic Office and each of its subunits, Turnaround Office and Talent
Office, send regular newsletters to interested educators, entities, and others. Cohn Tr., 5/24/16,
pp. 131:20-132:9, 133:1-3, 135:23-136:21; 5-25-16, pp. 65:12-67:3. In addition to the work of
LEAD CT,56 SDE is working to provide a professional development series for Superintendents
related to community and parent engagement, and the Commissioner talks with CAPSS on a
weekly basis. Cohn Tr., 5/25/16, pp. 54:13-57:16. The state's leadership training also includes
training school leaders, particularly in urban districts, to develop community support for
reforms. Wentzell Tr., 3/31/16, pp. 34-5.
I. Connecticut Provides Adequate and Equitable Opportunities to English Learners.
Roughly 6.6% of CT students are English Learners (ELs), and they speak over 160
languages. Flick Tr., pp. 26:25-27, 37:6-7, 138:13-15 (approximately 35,000 ELs). Plaintiffs' 54 Deputy Commissioner Ellen Cohn published a book on SRBI, which has been used in the field since 2008; p. 13:2-7, and also developed and authored SRBI training modules. Id. at 5/24/16, p. 12:14-25. 55 See also Defendants' undisputed and unobjected to RFAs ## 215-230 relating to SRBI and SPDG. 56 LEAD CT addresses superintendent and principal coaching and is discussed in a separate section, supra, Section IV.N, pp. 82-84; Cohn Tr., pp. 64:4-6, 64:26-65:6.
66
Exhibit, PTX 1102 (data bulletin), indicates that 76.8% of ELs in 2014-15 were also FRPL
eligible. See also Flick Tr., p. 27:4-6; Hakuta Tr., 2/9/16, p. 96:15-98:6 (most ELs are poor;
poverty and EL status are highly related.). Accordingly, a state that provides weight for poverty
is effectively also providing weight for ELs. Id. at 97:4-13. In CT's ECS formula, districts are
given a 30% credit for each student enrolled in free and reduced lunch, resulting in every free
and reduced-priced lunch student being treated as 1.3 of a child. Demsey Tr., 4/1/16, pp. 22:19-
23:4.
Classroom teachers who are well trained in current methods can and should meet most of
the needs of most ELs in their regular classrooms. Wentzell Tr., 4/3/16, pp. 49:9-50:1 (SDE has
provided a lot of training to general ed teachers on meeting the needs of ELs in their
classrooms); Flick Tr., 4/6/16, pp. 66:19-67:14 (CELP (DTX 5690) explicitly addresses how
general ed teachers can help to support ELs in their classrooms). SDE manages the Title III and
state bilingual grants for English Learners (ELs), including review of the districts' annual
evaluation reports,57 and oversees a new additional bilingual grant related to a pilot program in 4
districts. Flick Tr., pp. 24:8-17, 31:16-23, 95:11-18. SDE monitors the Title III recipients' use
of funds and approves any necessary revisions to those budgets. Id. at 31:12 – 33:27. SDE
reports Title III data to the federal government. Id. at 28:9-11. In addition, SDE provides
educators working with ELs professional development and answers district questions by phone
and email. Id. at 24:26-25:4. While SDE assists and supports local boards of education in
instituting high quality programs for English Learners, it is the responsibility of the district to
57 These reports reflect what is occurring with regard to ELs in each of the districts receiving these grants. See ELs FOFs, 7/15/16, pp. 60-62 to see number of ELs, support staff, types of programs, and EL student achievements as reported by the plaintiffs' six focus districts in 2014-15, which include, but are not limited to participation in National Honor Society, Honor Roll, school-wide awards, arts and sports, and growth in English language proficiency and academic content.
67
identify students as EL and to choose and implement a program of instruction for ELs. Id. at
27:25-30:7; PTX 170, pp. 1-5. The districts are adequately complying with all their
responsibilities outlined in PTX 170. Id. at 35:11-20; 109:25-110:5. The 2015 Every Student
Succeeds Act (ESSA) newly mandates that states identify standardized entrance and exit
procedures for ELs by school year 2017-18. Id. at 38:19-39:10. ELs are now tested annually
with an English language proficiency assessment called the LAS Links Form C, which tests
speaking, listening, reading and writing, and which is paid for by the state. Id. at 47:20-26, 51:1-
3. To exit EL status, a student must achieve an overall score on the LAS Links Form C of 4 or 5
(on scale of 1-5) and a score of 4 or 5 on the reading and writing subtests of Form C. Id. at 49:
21-27. By definition, the EL category applies to students who have lower academic
achievement, Hakuta Tr., pp. 96:7-10, 98:13-99:8, because their limitations in English language
proficiency make them unable to fully access the curriculum in English. Id. at 19:11-15. Once
ELs are reclassified out of that status, they do as well or better than English only students.
Hakuta Tr. pp. 98:24-99:3. Under ESSA, starting in 2017-18, states are allowed to count former
ELs as part of the EL subgroup for accountability purposes for up to 4 years after exit instead of
the prior 2 year consideration. Flick Tr., p. 56:7-13. This will allow the state to demonstrate the
success of former ELs. Id. 57:2-8, 58:8-12.
Districts must monitor former ELs for two years after exiting EL status. Flick Tr., 51:7-
22. During this time, districts may be providing additional content area support and even some
English language support. Id. at 13-22. If the district sees that after providing significant
educational supports, the exited student continues not to make appropriate progress, Scientific
Research-Based Interventions (SRBI) should be implemented. Id. at 51:23-52:13; DTX 4343
(SRBI for ELs Handbook). In addition, pursuant to recent federal guidelines, a student can be
68
re-identified as an EL if an English language proficiency assessment suggests that the student is
still in need of English services. Id. at 52:14-24, 55:1-9.
In CT, a bilingual program is required when a district reports that there are 20 or more
eligible students who speak the same language other than English in a given school building.
Conn. Gen. Stat. § 10-17e and f(b). The districts report the number of students with the same
dominant language by October 1, which triggers the bilingual program requirement for the next
school year. Flick Tr., pp. 43:1-17, 43:22-23. Transitional bilingual programs utilize the
student's native language to help the student acquire English and content. Id. at 43:23-44:2.
Districts may also offer other bilingual programs, such as a dual language model, where the goal
is to have both non-English speaking students and English speaking students become bilingual.
Id. at 44:2-14; Conn. Gen. Stat. § 10-17e(2)(E). As of the June 2015 Special Session, districts
may request approval from SDE for a student to remain in a transitional bilingual program for an
additional 30 months, for a total of up to 60 months. Id. at 46:5-15. There is no time limitation
for participating in a dual language program. Id. at 46:15-19. If a transitional bilingual student
does not meet the English mastery standard after completing the 30 or 60 month period, a district
must provide him with language transition and academic support services based on results of
both his content and English language proficiency assessments. Id. at 46:20-47:10.
In October 2015, SBE adopted new CT English Language Proficiency standards, DTX
5690 (CELP), which are intended to be used by both general ed teachers and TESOL
professionals in the areas of math, social studies, science, and ELA for ELs for K-12 and are
aligned to both the Common Core and LAS Links Form C. Id. at 65:22-26, 66:1-67:11, 70:7-8.
Extensive professional development related to CELP was provided both before and after
adoption free to the recipients. Flick Tr., pp. 70:11-72:23. Aside from professional development
69
regarding CELP, there are other professional development opportunities offered to support ELs,
including but not limited to training for tutors, training at the RESCs' Title III consortium
meetings, trainings on LAS, and trainings on basic ESL. Id. at 72:24-74:4. It is up to the districts
to determine how to provide professional development to teachers with regard to ELs. Id. at 74:
9-11.
All of the six focus districts and two-thirds of the Alliance Districts with high EL
populations have full time EL coordinators. Id. at 60:15-61:14. The six focus districts received
some additional assistance with Title III funds for 2015-16 based on the amount of the federal
grant and district per pupil enrollment of ELs. Id. at 75:18-27, 80:23-81:6; DTX 6335 (2015-16
Title III entitlement amounts). The traditional Bilingual grant has provided $1,916,130 over the
last few years, allocated to the districts mandated to provide bilingual programs based on the
number of bilingual students in the district. Id. at 95:4-10, 99:19-11. DTX 4729 (2015-16 State
Mandated Bilingual Grants), reflects the following focus district allocations: Bridgeport -
$210,184; Danbury - $186,682; East Hartford - $44,882; New Britain - $123,336; New London -
$57,074; Windham - $66,616. Evidence of EL successes in the six focus districts is found in
their Title III and Bilingual Grant Annual Evaluation Reports (AERs): DTX 5688 and DTX
4739 Bpt; DTX 6373 and DTX 6338 Danbury; DTX 6340 and DTX 4741 EH; DTX 4805 and
DTX 4743 New Britain; DTX 4808 and DTX 4744 New London; DTX 6339 and DTX 4748
Windham.
J. Connecticut Provides Adequate and Equitable Opportunities to Special Education Students. On June 3, 2016 the court directed the parties to address six statements, one of which
specifically concerns special education:
70
Connecticut spends a very substantial portion of its education funds on special education without rationally ensuring that the children who need special educational services are getting them while being certain that children who cannot profit from educational services are getting services at the expense of those who need them.
In asking the parties to address this point, the court noted that it was "fully apprised that
there is a federal mandate about special education" and that "[t]he question is whether [the
federal mandate] should affect the manner in which funding is handled on the state level to the
local level for special education." Tr., 6/3/16, p. 144.
Discussion of this issue must begin with the overlay of federal law concerning special
education. Under federal law62 each student who qualifies for special education services is
entitled to an individualized determination; each student has rights of due process and access to
federal court if dissatisfied with her special education services, including the requirements of a
"free appropriate public education" ("FAPE") in "the least restrictive environment." 20 U.S.C. §
1412(a)(1), (5). The IDEA mandates that “[t]o the maximum extent appropriate, children with
disabilities ... are educated with children who are not disabled, and special classes, separate
schooling, or other removal of children with disabilities from the regular educational
environment occurs only when the nature or severity of the disability of a child is such that
education in regular classes with the use of supplementary aids and services cannot be achieved
satisfactorily.” 20 U.S.C. § 1412(a)(5)(A). However, due to the "tension between the IDEA's
62 The Individuals with Disabilities in Education Act is not, strictly speaking, a federal mandate. Rather, states such as Connecticut agree to abide by the due process requirements of the IDEA and, in exchange, receive federal funding. 20 U.S.C. § 1415(a); M.C. ex rel. Mrs. C. v. Voluntown Bd. of Educ., 226 F.3d 60, 62 (2d Cir.2000)( “Under the Act, states that receive funding from Congress are required to provide ‘all children with disabilities' with a ‘free appropriate public education.’ ”). Put another way, states are free to forgo federal IDEA funds in which case they do not have to comply with the IDEA's due process requirements. All states now participate, although New Mexico did not participate until 1984. See Clare McCann, Federal Funding for Students with Disabilities: The Evolution of Federal Special Education Finance in the United States 15 (New America 2014).
71
goal of providing an education suited to a student's particular needs and its goal of educating that
student with his non-disabled peers as much as circumstances allow… courts have used a case-
by-case analysis in reviewing whether both of those goals have been optimally accommodated
under particular circumstances." P. ex rel. Mr. & Mrs. P. v. Newington Bd. of Ed., 546 F.3d
111, 119 (2d Cir. 2008)(internal citations omitted).
Although the IDEA requires the states to establish "procedural safeguards," 20 U.S.C.S §
1415(a), the fact that each disabled student is guaranteed an individualized determination
necessarily weighs against statewide dictates affecting special education identification rates and
services. Indeed, establishing arbitrary referral quotas or implicitly pressuring school officials to
reduce special education referrals, regardless of individual student needs, would be illegal. See,
e.g., Jose P v. Ambach, 557 F. Supp. 1230, 1237-38 (E.D.N.Y. 1983). The IDEA’s “principal
mechanism” for achieving the law's purpose is an individualized education program (“IEP”),
which is a “written document that must include the child’s level of performance, goals for [his]
improvement, and a plan about how to achieve that improvement.” T.K. v. N.Y.C. Dept. of
Educ., 810 F.3d 869, 875 (2d Cir. 2016). “The particular educational needs of a disabled child
and the services required to meet those needs must be set forth at least annually in a written" IEP.
M.C. ex rel. Mrs. C. v. Voluntown Bd. of Educ., 226 F.3d 60, 62 (2d Cir. 2000). The IDEA
provides that a parent or guardian of a disabled child may present a complaint "with respect to
any matter relating to the identification, evaluation, or educational placement of the child, or the
provision of a free appropriate public education to such child." 20 U.S.C. S 1415(b)(6). The
State of Connecticut is not a proper party to such a special education appeal. See Quatroche v.
E. Lyme Bd. of Educ., 604 F. Supp. 2d 403, 411 (D. Conn. 2009). Thus, if a disabled student is
dissatisfied with his or her special education services or identification, he or she has the right to
72
bring a claim under the IDEA against the local educational agency ("LEA") and the state has no
right to participate as a party in that process.
Additionally, as Dr. Reschly testified, it would be inappropriate to deny educational
services to students simply on the basis of their disabilities.64 Reschly Tr., 4/19/16, pp. 51.
Therefore the State of Connecticut does not and cannot make determinations as to which special
education students can or "cannot profit from educational services" or are "incapable of receiving
a primary and secondary education." Tr., 6/3/16, pp. 146-57. In fact, in passing the predecessor
to the IDEA – appropriately titled the Education for All Handicapped Children's Act -- Congress
acknowledged that a purpose of the federal law was to bring into the public schools many special
education students otherwise excluded. See "Statement of Findings and Purpose," Public L. No.
94-142, 89 Stat. 774 (1975)(current version at 20 U.S.C. §§ 1400-20 (2012))("one million of the
handicapped children in the United States are excluded entirely from the public school
system…..") In fact, a federal study found that almost 2 million children with disabilities were
excluded entirely from public schools. 1 H.R. Rep. No. 94-332, at 4 (1975). To the extent that
the court's question concerns funding for such students, that issue is dealt with in the section of
defendants' brief concerning excess cost. See infra.
Plaintiffs' operative complaint contains almost no allegations concerning special
education. To the extent plaintiffs' complaint does address special education, it does so in the
form of a process claim. Plaintiffs allege that the "level of funding for special education" is
64 The court asked "[w]hy it wouldn't make education sense" to determine whether certain low incidence students were "not worthy of receiving services." Reschly Tr., 4/19/16, pp. 51-52. In response Dr. Reschly stated: "I think we're -- your Honor, I think we're very reluctant to make that judgment because of the potential pernicious effects of starting to reject children based on our judgments of their ability to profit from an education. I think the -- I think the concern from a special educators point of view, if you reject this child, then what about the next one and the next one? And pretty soon it's not a law that protects all children but a law that only protects some children with disabilities." Id.
73
"unrelated to the actual costs of providing special education students with suitable and
substantially equal educational opportunities." Corrected Third Amended Complaint, Docket
No. HHD-CV05-4050526-S, Doc. # 163.00 ¶ 145. Plaintiffs also allege that "state funding for
special education students" is done through "an arbitrary formula." Id. at ¶ 146.
Plaintiffs offered no evidence at trial that any plaintiff failed to receive required special
education services and therefore failed to receive a minimally adequate educational
opportunity.65 Nor did they offer evidence that any particular non-special education student was
deprived of any particular adequate educational opportunity because of the requirements to meet
the needs of special education students. In fact, several of plaintiffs' witnesses testified that their
students' IEPs were fulfilled and/or there haven't been any due process hearings. See, e.g.,
Carver Tr., 2/4/16, p. 69; Stewart-Curley Tr., 2/10/16, p. 64; Thompson Tr., 2/18/16, p. 81;
Garcia Tr., 3/4/16, pp. 53-54; East Hartford has not alerted the CSDE about any due process
issues regarding special education services. Quesnel Tr., 6/1/16, p. 171.
Regarding the identification rates of special education students, the evidence at trial
demonstrated that the vast majority of school districts in Connecticut have identification rates
consistent with the state's identification rate, which is roughly the national median rate. DTX
2428 at 10. Dr. Reschly testified that based on Connecticut's identification rate the state was not,
on its face as a whole, overidentifying or underidentifying students with disabilities. Reschly Tr.,
4/19/16, p. 36. Dr. Reschly also testified that his research and the research of others in the field
has come up with "virtually nothing" that explains why there are variations across districts
around the country in disability identification. Reschly Tr., 4/19/16, p. 103. Dr. Reschly also
65 And, of course, to the extent that such claims of deprivation of special education services were to be made, each special education student enjoys the full panoply of due process rights under the Individuals with Disabilities in Education Act, 20 U.S.C. § 1412 et seq., including the right to a due process hearing and appeals thereafter.
74
testified that the variations in identification rates "have to be understood as the culmination of
decisions made by individuals," id. at 104, as required by federal law.
With respect to the "focus districts" chosen by plaintiffs, their special education
identification rates for the 2014-15 school year are reasonably similar to the average
identification rate statewide for that year (13%). DTX 5299. The rates for the six focus districts
for 2014-15 were as follows: Bridgeport: 14%; Danbury: 12%; East Hartford: 16%; New
Britain: 16%; New London: 17%; Windham: 14%. DTX 5299. Dr. Reschly also testified that
there was almost no correlation between spending on students with disabilities and whether the
district was a high or low poverty district.66 Reschly Tr., 4/19/16, p. 106. Dr. Reschly's report
and testimony explained that there was little or no correlation between special education
identification rates (for high and low incidence categories) and the number of students on free
and reduced priced lunches in a district. DTX 2428. Thus, to the extent plaintiffs' argument is
that special education students "cost" more to educate than most other students, the evidence
does not support a significant correlation between special education identification rates and rates
of poverty. In other words, there is no evidence that special education costs pose a greater or
different challenge in high poverty districts than in any other districts. Dr. Reschly also testified
extensively about how favorably Connecticut compared to other states nationally and in the
Northeast. Tr. 4/19/16, pp. 24-25, 38-41, 125; DTX 2428 at 15. And, with respect to funding, he
explained: "My conclusion, as I stated in the report, is that a student with a disability, if they are
in Connecticut, is in a very favorable situation with regard to resources compared to students
with disabilities in other states." Reschly Tr., 4/19/16, p. 154.
66 There was also no relationship between poverty level of a district and whether it was able to meet the requirements of the IDEA. Reschly Tr., 4/19/16, pp. 42-43.
75
K. There is Adequate and Equitable Funding for Appropriate Special Education Services. To the extent plaintiffs' claim is that there is not enough money for special education, that
claim finds no support in the evidence. The evidence at trial demonstrated that there are three
primary non-local methods for funding the education of special education students in
Connecticut.
First, there is the ECS formula itself. According to plaintiffs' Corrected Third Amended
Complaint, in 1995 the ECS foundation amount was increased "to adjust for the consolidation of
special education funding into the ECS formula." Corrected Third Amended Complaint, Docket
No. HHD-CV05-4050526-S, # 163.00 at 39-40. 19-22% of the current ECS grant is attributed
to special education.67 Demsey Tr., 4/5/16, pp. 150-151. Second, the state also transfers the
excess cost grant monies to municipalities to help the districts fund the education of special
education students for whom the districts are expending more than 4.5 times the net current
expenditures per pupil. Conn. Gen. Stat. § 10-76g(b).68 Third, the federal government sends
monies to the state which are in turn distributed to the school districts.
The plaintiffs made no specific claim, and presented no evidence, as to any district, that
the 19%-22% of ECS grants attributable to special education were not a reasonable contribution
by the state to those costs under the circumstances of that district. Plaintiffs also failed to present
any specific evidence that special education students are not receiving minimally adequate or
equitable educational opportunities. Furthermore, even if plaintiffs' generalized claims can be
taken to demonstrate that local districts have to use locally raised monies in addition to those
above to support the education of special education students, that situation would not be illegal
67 The Total ECS Entitlement for 2015-16 was $2,062,299,984. DTX 5682. 68At least one witness from a "focus district" testified that in his district the excess cost monies are not passed through from the municipal government to the Board of Education. Pascarella Tr., 2/2/16, p. 188.
76
or improper. The Horton III court specifically held that "the property tax is still a viable means of
producing income for education." Horton v. Meskill, 172 Conn. 615, 651 (1977).
L. Although There is No Constitutional Right to Preschool education, Connecticut Provides Broad and Effective Preschool Opportunities -- More and Better than Almost Any Other State.
The defendants continue to assert that there is no constitutional right to preschool
education under the Connecticut Constitution. Even though Connecticut provides neither a
constitutional right to pre-K nor any state law requirement for Pre-K,69 Connecticut is ranked 3rd
in the nation in state per pupil spending for Pre-K for 2014 and 5th in the nation for 2015. Pre-K
FOF 6, 7, 7/15/16. Given its fiscal constraints and the research on the effectiveness of pre-K for
children of low-income families, Connecticut focuses on providing greater universal access to
pre-K for families who would not have an opportunity to attend pre-K because of income. Pre-K
FOF 4. Connecticut is the highest ranking state in the country in terms of the percentage of
low-income children enrolled in preschool, and yet also has the highest percentage of any state
of non–low-income children enrolled in preschool. Pre-K FOF 5, 7/15/16. Connecticut's Office
of Early Childhood is one of only four cabinet level state agencies in the country, including
Massachusetts, Washington, and Georgia, focusing on early childhood. Pre-K FOF 1, 7/15/16.70
Connecticut encourages pre-K participation among low-income families by helping to
meet family needs through its state funded programs, including the Child Day Care Contracts,
the School Readiness Program, state Head Start, and Smart Start. Pre-K FOF 13, 16, 31, 48,
7/15/16. A variety of program lengths are offered, including full day/full year, school day/school
69 See Defs. Motion for Protective Order, Doc. # 228.00, HHD-CV-14-5037565-S; Defs. Reply to Pls. Opposition to Defs. Motion for Protective Order, Doc. # 244.00, HHD-CV-14-5037565-S; Decision Reserved, Doc. # 228.86. 70 OEC is responsible for the delivery of services and programs not just for pre-K but for children from birth to age 5. Its budget is $350 million. Pre-K FOF 2, 3.
77
year, part day/5 days a week/180 days a year and extended day. Pre-K FOF 17, 7/15/16. In
addition, parents are given choices in a variety of settings beyond the public schools, including
for profit and non-profit community programs, Head Start and day care programs, all in an effort
to encourage pre-K participation. Pre-K FOF 13, 16, 31, 48, 7/15/16. Unlike in many states,
access is not limited to 4 year olds, but provided to both 3 and 4 year olds. In fact, Connecticut's
access ranking among all states for 4 year olds has risen from 29 in 2014 to 23 in 2015,
according to the NIEER Yearbooks. Pre-K FOF 8, 7/15/16. Its access ranking for 3 year olds has
risen from 12 to 8. Id. Plaintiffs' expert witness, Dr. W Stephen Barnett, is the Director of
NIEER.71 Barnett Tr. 2/25/16, p. 117:22-24.
Aside from offering a variety of settings and lengths of day for its pre-K programs,
Connecticut seeks to remove barriers to access with assistance for payment of fees for its state
and federal programs. Pre-K FOF 19, 7/15/16. Those fees are based on a sliding scale of
income and parents can also establish hardship or obtain a subsidy through the Care4Kids
program. Pre-K FOF 19, 7/15/16; DTX 6429, Income Fee Schedule. These programs also
receive funds directly from the Care 4 Kids program in addition to the state reimbursement for
the slots. Pre-K FOF 19, 7/15/16.
Along with removing barriers to access, Connecticut sought to expand access with an
increase in the reimbursement rate for School Readiness full day slots in FY15 to $8,924, as well
as providing two recent expansions of the School Readiness Program in FY 13 and FY 15
71 Comparison to Florida's universal pre-K offerings as reported by NIEER is particularly illuminating. While Florida is ranked 3rd in the nation with regard to access to 4 year olds, it serves no 3 year olds. Pre-K FOF 9, 7/15/16. Florida also offers only pre-k programs for 3 hours per day, compared to the different dosages offered by Connecticut to meet family need. Pre-K FOF 9-12, 7/15/16. In addition, Florida spends $2,238 per child while Connecticut spends $8,925 per child. Pre-K FOF 11, 12, 7/15/16.
78
totaling 2020 additional slots. Pre-K FOF 24-27, 7/15/16. The result has been a steady increase
in funding for the School Readiness Program over the past 6 years to $94.3 million, serving
12,263 children. Pre-K FOF 29, 7/15/16. When the State's fiscal situation prevented additional
planned expansion of the School Readiness Program through FY 19, OEC pursued other ways to
expand pre-K through the Smart Start Program in the public schools and the federal Preschool
Development Grant ("PDG") in both public schools and community-based sites. Pre-K FOF 48,
53, 54, 7/15/16. Two cohorts of funding have been awarded to 18 districts to date for FY 16 and
FY 17, totaling $2.8 million, serving an additional 582 children through the Smart Start Program,
while Connecticut was also awarded $10.8 million for the first year of the four year federal
Preschool development Grant, serving an additional 712 children. Pre-K FOF 49, 53, 7/15/16.
Continued expansion is likely through the PDG, given that the present funding is for the first
year of the 4 year grant and the fact that first year recipients will receive priority for continued
funding. Pre-K FOF 53, 7/15/16. Meanwhile expansion will also continue through the Smart
Start program. Pre-K FOF 51, 7/15/16. Additional expansion has also occurred through the pre-
K slots offered by charter and magnet schools as well as those offered by school districts. Pre-K
FOF 63, 7/15/16.
Total state and federal spending for pre-K in Connecticut for FY 16 is $237 million,
serving approximately 35,000 children for primary preschool experience and/or a subsidy to help
pay for preschool. Pre-K FOF 62, 7/15/16.72 Most of this funding is focused on low income
families. Pre-K FOF 13, 16, 18, 19, 31, 48, 53, 7/15/16; DTX 6449, FY 16 Preschool Funding.
In addition, Connecticut also provided $1.1 million of quality enhancement grants for FY 16 for
the School Readiness Program to improve the quality and comprehensiveness of the programs.
72 This figure does not include state spending on pre-K by magnet and charter schools nor the amounts spent by districts using through education cost sharing funds. Pre-K FOF 63, 7/15/16.
79
Pre-K FOF 30, 7/15/16. The PDG was also supplemented with quality enhancement funds of $456, 411
to provide 112 slots for 3 year olds to ensure diversity of age because of the PDG's limitation to 4
year olds. Pre-K FOF 55, 7/15/16. This continued Connecticut's focus on providing access to
both 3 and 4 year olds. Pre-K FOF 55, 7/15/16. Additional state funding also has been provided
through the Minor Capital Improvement Grants totaling $1.7 million from 2013-2015 for
individual state funded programs to improve existing facilities. Pre-K FOF 64-66, 7/15/16.
Finally, the School Facilities Construction Grant program provides varying increases in
reimbursement rates to any district or regional school district for building expansions that
include space for an early childhood program or full day kindergarten programs and/or full day
preschool programs. Pre-K FOF 67, 68, 7/15/16.
Connecticut's funding for pre-K has also been accompanied with a focus on improving
the quality of its pre-K programs. Connecticut is phasing in the staff education requirement of a
Bachelor's degree by 2020 for its state funded programs. Pre-K FOF 40, 7/15/16. Connecticut
has demonstrated its commitment to this upgrade in teacher qualifications by investing $2.6
million in individual scholarships since 2013 and $1 million for FY16 alone, a 50% increase
since FY 15. Pre-K FOF 41-44, 7/15/16. In addition, the Early Childhood Teacher Credential
("ECTC") has been developed as an alternative to the Bachelor's degree to meet the staff
education requirements and develop a talent pipeline of teachers who meet high standards of
teacher preparation. Pre-K FOF 45, 7/15/16. To date, 288 ECTCs have been approved. Pre-K
FOF 46, 7/15/16.
Accreditation by the National Association for the Education of Young Children
("NAEYC") is another requirement for Connecticut's state-funded programs. FOF 33, 39,
7/15/16. Considered the gold standard among accrediting bodies in terms of being the most
80
rigorous and having the highest standards for child outcome, it is viewed by plaintiff's expert
witness, Dr. Barnett, as one route to higher quality and a valuable process for pre-K programs.
Pre-K FOF 33-37, 7/15/16. Despite its relatively small population, Connecticut ranks third in the
country in the number of pre-K programs accredited by the NAEYC, after the more populous
states of Massachusetts and California. Pre-K FOF 38, 7/15/16; FOF 17, Doc. # 265.00 (attached
hereto as Appendix 3).
Despite the focus on increased funding and the efforts to improve quality and access for
Connecticut pre-K programs, Connecticut's state and federal programs are underutilized, with
available funds often unspent in local districts, including $2.1 million in School Readiness funds,
$1.8 million in the Child Day Care Contract funds and $400,000 in federal Preschool
Development Grant (hereinafter "PDG") funds. Pre-K FOF 69, 7/15/16. The local School
Readiness Councils are responsible for administering the School Readiness Program and the
PDG, but the Councils vary in their effectiveness. Pre-K FOF 70, 71, 7/15/16. New Britain's
School Readiness Council is an example of a Council whose leadership has developed the
necessary community connections for high utilization. Pre-K FOF 76, 77, 7/15/16. Indeed,
Plaintiff's expert, Dr. Pamela Granucci, attributes New Britain's high percentage of pre-K
experience of 79% for the 2011/12 school year to the great collaboration among agencies in
cooperating to connect families to programs. Pre-K FOF 78, 7/15/16.73 In contrast, Bridgeport is
one of 3 districts which historically have been unable to utilize all of their available School
Readiness funds. Pre-K FOF 73, 7/15/16. In fact, Bridgeport's unspent School Readiness funds
for the past 6 years total over $2 million. Pre-K FOF 79, 7/15/16. In comparison, the amount of
73 New Britain's percentage of pre-K experience has continued to increase to 80.8%, above the state average of 79.2% for the 2015/16 school year. In contrast, Bridgeport's percentage is 64.5%. DTX 6277, Pre-K Exp. Update; Gopalakrishnan Tr. 5/18/16, pp. 137:14-138:6.
81
unspent funds for the Plaintiffs' other 5 focus districts is significantly lower, whether for FY 15
or based on a 6 year comparison, even giving consideration to the larger number of children
served by Bridgeport. Pre-K FOF 75, 79, 7/15/16.
Bridgeport also accounts for the lion's share of unspent PDG funds, specifically $240,000
of $400,000 for the 2015/16 school year. Pre-K FOF 59, 7/15/16. In contrast, the other districts
which received PDG funds had high utilization rates. Id. Bridgeport was unable to fill 54 slots
from July 2015 until February 2016, and did not reach full enrollment until April 2016. Id.
Despite the amount of unspent funds, OEC is continuing to determine and address the
issue of unmet need through its new unmet need report. Pre-K FOF 80-85, 7/15/16. Among
other items, this new report will address the issue of unspent funds by showing the status of each
community in terms of its leadership in encouraging program providers to do their work to meet
needs. Pre-K FOF 81, 7/15/16.
OEC has also undertaken several initiatives to improve the quality of the early childhood
system, impacting children from birth to age 5. These include the development of a Quality
Rating Improvement System ("QRIS"), an Early Childhood Information System ("ECIS"), the
Early Learning and Development Standards, ("ELDs"), the revised Kindergarten Entrance
Inventory, ("KEI"),74 the Core Knowledge and Competencies Framework, and the Pre-K Grade 3
Leadership Program. Pre-K FOF 86-97, 7/15/16.
74 Dr. Barnett claimed in his 2014 supplemental report that the difference in KEI results between DRGs A and B (higher income districts) compared to DRGs H and I (lower income districts) related to the DRGs' differing socioeconomic status. PTX 772, Barnett's Updated Analysis of DRG and Kindergarten Readiness Data. Dr. Barnett admitted that the evidence of the prevalence of red-shirting (parent choice to hold children back for a year from starting kindergarten) in high income districts compared to low-income districts may explain the difference in the KEI results. DTX 6303, Red-Shirting Data. Gopalakrishnan Tr. 5/18/16, pp. 138:25-142:27; Barnett Tr. 2/25/16, pp. 108:19-112:10.
82
M. Connecticut Provides Excellent Kindergarten Opportunities.
Full day kindergarten is offered in 143 of the 169 school districts in Connecticut. In
addition, 13 charter schools and 14 magnet schools offer full day kindergarten. Kindergarten
FOF 99, 7/15/16. The percentage of children who have enrolled in full day kindergarten in
Connecticut has increased dramatically in the past 4 years, to 94.2% for the 2014/15 school year.
Kindergarten FOF 100, 7/15/16.
N. Lead Connecticut Develops and Teaches Critical School Leadership Skills.
LEAD CT programs were developed specifically to support the 2012 education reforms
in recognition of the fact that school and district leadership is a critical component of the work of
school reform in Connecticut. Villanova Tr. 5/11/16, p. 69:24-27, DTX 5746. The programs
focus on recruiting, selecting, preparing, developing, and retaining school and district leaders
improve and strengthen student learning across all Connecticut districts and classrooms, with a
priority focus on the schools and districts in most need of improvement in student performance,
the Alliance Districts. Villanova Tr., 5/11/16 pp. 3:24-4:8, 66:15-68:21. Villanova Tr., 5/13/16,
p. 81:14-19. DTX 5744, LEAD CT Programs; FOF 19, Doc. # 265.00. LEAD CT offers
intensive training and coaching based on principal and superintendent competencies that have
been identified in research as essential skills for high performing and effective school leaders
who can promote sustainable and ongoing improvements in student learning. Villanova Tr.,
5/13/16, pp. 80:5-83:19, 84:2-13, DTX 5164, Principal Competencies; DTX 6413,
Superintendent Competencies. 76 LEAD CT's budget has been $1.8 million to $1.9 million
during each of the past 3 years. Villanova Tr., 5/11/16, pp. 79:13-80:1.
76 The principal competencies include academics, learning and teaching, human capital operations, strategic planning, culture and personal leadership characteristics. The superintendent
83
LEAD CT's programs for principals include the Turnaround Principal Program, which
has trained 59 principals during the past 3 years, approximately 20 each year, through 8 days of
intensive summer training accompanied by executive coaching each week to take over the most
challenging schools in the Alliance Districts and Commissioner's Network Schools. Id. pp.
70:13-71:22, DTX 5744. The Spring Fellowship Program for Early Hires provides 2 months of
training during the summer followed by participation in the Turnaround Principal Program
during the school year for principals hired in the spring of the school year. DTX 5744. Eight
principals participated during the first year, Villanova Tr., 5/11/16, pp. 71:23-73:2; DTX 6325.
In addition, the University of Connecticut's Administrator Preparation Program ("UCAPP"),
known as the strongest principal preparation program in Connecticut, has produced 17
turnaround principals in the past 2 years. In this program, with the recommendation of their
superintendents, strong teachers become administrative interns with a talented principal in their
current district and attend weekly a full day of instruction on principal effectiveness, preparing to
become turnaround principals in one year. Id. pp. 73:3-74:17; DTX 5744.
The principal programs are offered only to Alliance Districts, and the Alliance Districts
are given first priority for the superintendent programs. Id. p. 74:18-75-5. The Alliance
superintendents receive 3 years of coaching while every other superintendent is provided one
year of coaching; all funded by LEAD CT. Thirty-two superintendents have received executive
coaching in the past 2 years. Id. pp. 75:14-77:5. Along with executive coaching, LEAD CT
offers early career superintendents a community of practice, in which superintendents meet
monthly to talk about their work as new superintendents and the superintendent competencies are
reinforced. This program has served over 50 superintendents in the past 3 years. Id. 77:6-21.
competencies reflect a coherent approach to the work of the superintendent with his/her principals, teachers and the board of education and community. Villanova Tr., 5/13/16, p. 12:1-8.
84
The program also offers a website providing resources for developing a strategic approach to
talent development. Id. pp. 77:22:-78:16.
LEAD CT has also developed the District Leadership and Coherence Framework. DTX
6452. It requires coherence in the form of a strong working relationship among superintendents,
central office leaders, and boards of education to develop and communicate a shared vision for
how their work will improve student outcomes. Id. pp. 84:26-86:1, 87:17-89:24. In line with
the framework, LEAD CT has presented the Building District Coherence and Capacity Program
for the past 2 years, serving over 180 participants in 28 leadership teams from 28 districts,
including the Alliance Districts, which again were given priority. Over four days, the teams
were led though a process by national and local experts to create a 100 day plan to develop
coherence in the following school year. Id. pp. 86:25-87:16, Villanova Tr., 5/13/16, pp. 7:2-9:4,
DTX 6412, Coherence and Capacity Program. Also, consistent with the framework, LEAD CT
has assisted with the development of a model evaluation for superintendents based on the
superintendent competencies and a coherent relationship between the work of the superintendent
and the board of education. This is currently being used voluntarily by some districts in
CT. Villanova Tr., 5/11/16, p. 84:14-24, DTX 6410, 6411, Villanova Tr., 5/13/16, pp. 19:25-
20:7, 25:19-27:7.
O. Connecticut Provides Broad Wraparound Services (Student Supports).
The CSDE also provides significant "wraparound" funding and support to districts,
particularly to high poverty, low-performing districts such as the Alliance Districts and the
plaintiffs' six focus districts. See DTX 4716; Frassinelli Tr., 5/6/16, pp. 30-1, 33; Defs'
Demonstrative 6 (FY 15 Distribution of State and Federal Funds in Bureau of Health/Nutrition,
Adult Education and Family Services – focus districts and comparator districts). The CSDE's
85
Bureau of Health/Nutrition, Family Services & Adult Education, which consists of about 40 staff
members and manages roughly 60 programs and initiatives, is dedicated to supporting districts in
reducing and eliminating non-academic barriers to students' academic success. Frassinelli Tr.,
5/6/16, pp. 26-9. For example, the Bureau provides assistance to address the following issues:
the social and emotional health of students; see Wraparound Services FOFs, 7/15/16, ##1-3; the
physical health of students; id., ##4-5; the mental health of students; id., ##6-7; assistance for
preparation and transition to college; id., #8; after school and extended learning programs; id.,
#9; assistance for families in high poverty communities; id., #10; assistance for homeless and
transient students; id., #11; support for pregnant and parenting teens; id., #12; wraparound
programs specifically for Commissioner's Network schools; id., ##13-15; assistance for adult
learners; id., ##16-18; specific critical issues that impact student achievement, such as student
discipline; id., #19; and chronic absenteeism; id., #20; and assistance to districts in building
community partnerships and increasing family engagement. Id., #21.
These programs and initiatives are primarily targeted at the neediest districts, schools and
students in the state. Defs' Demonstrative 6 shows that the vast majority of the state and federal
funding from the Bureau is distributed to high poverty, low-performing districts, such as the
plaintiffs' six focus districts. Defs' Demonstrative 6 (showing the difference between the large
amount of funding to the focus districts compared with little to no funding to the wealthy
comparator districts); DTX 4716; Frassinelli Tr., 5/6/16, pp. 35-6, 37 ("[O]ur effort [is] to work
on targeting the districts with the most vulnerable students so that we're able to provide
resources, both technical assistance and financial resources, to those districts; and again, trying to
eliminate those barriers to their academic achievement. So that's where the need is. And so
that's where we gear the opportunities for funding primarily.").
86
P. Connecticut Provides Additional Funds for Technology and Other Additional Financial Assistance to Low-Performing Districts. Over the last several years, the state has made a significant financial investment to
upgrade the facilities and technological infrastructure in schools across Connecticut, particularly
in low-performing schools. See, e.g., DTX 4716 (summary of state and federal funding for focus
districts); DTX 6307 (summary of bond allocations in plaintiff districts); DTX 6226 (Turnaround
Grants Overview), pp. 8-9; Demsey Tr., 4/1/16, pp. 105-6, 110-18, 160; Cohn Tr., 5/24/16, p.
138. For example, the State Bond Commission authorized about $24.4M in January 2014 and
about $11M in January 2016 for grants-in-aid for alterations, repairs, improvements, technology,
equipment and capital start-up costs, including acquisition costs, to expand the availability of
high-quality school models and assist in the implementation of the Common Core State
Standards and related Smarter Balanced assessments. DTX 4716; DTX 6307 (lines 125-8); DTX
6236; Demsey Tr., 4/1/16, pp. 157-8. In January 2014, grant recipients included Bridgeport
($899,797), Danbury ($238,171), East Hartford ($337,414), New Britain ($237,875), New
London ($128,469), and Windham ($349,525). DTX 4716 (Bridgeport- line 49; Danbury- line
38; East Hartford- line 39; New Britain- line 46; New London- line 42; Windham- line 43). In
January 2016, grant recipients included Bridgeport ($463,892) for Chromebooks/ Computers,
Danbury ($240,064) for Chromebooks/Carts, East Hartford ($154,505) for Otter Boxes/cables
and Cisco Wireless Access Points/iPads/Charging Stations/Projectors, New Britain ($220,132)
for Chromebooks/ Chromebook Carts, New London ($70,400) for Chromebooks/carts, and
Windham ($69,498) for Laptops/Laptop Cart/Samsung Zero Client. DTX 6236.
Over the last three years, the State Bond Commission has also approved various projects
for low-performing schools, including numerous projects in 5 of the six focus districts. DTX
6289, all tabs; DTX 6226 (Turnaround Grants Overview), pp. 8-9; Demsey Tr., 4/5/16, p. 3. As
87
of March 10, 2016, the funding for projects with existing approvals by the Bond Commission
since 2013 totaled roughly $22.5M. DTX 6289, summary tab. Just within the last year, the
projects in the focus districts included, but were not limited to: computer labs, classroom
instructional technology, general facility upgrades and furniture at East Hartford Middle School
($500,000); all bathrooms upgrade, sound reduction panels installed in the gymnasium,
technology upgrades, new lockers, and security system upgrades at Bennie Dover Jackson
Middle School in New London ($850,000); general facility upgrades, classroom improvement,
student technology, and other building technology and equipment at Marin School in Bridgeport
($189,350); playground equipment, HVAC improvements, safety/security enhancements, and
general facility upgrades at DiLoreto School in New Britain ($200,000); gymnasium upgrade,
auditorium upgrades, bathrooms and classroom technology at Windham Middle School
($200,000).77 DTX 6289, 1/29/16(1) and (2) tabs, 7/28/15 tab. There is also a request for
proposals for eligible districts to apply for additional low-performing school bond funding for
the 2016-17 school year. DTX 6298; Demsey Tr., 4/5/16, pp. 5-7. There is approximately
$9.6M available for these applications, which were sent specifically to the Alliance Districts and
also posted on the CSDE's website. Demsey Tr., 4/5/16, pp. 5-7. The applications closed on
February 29, 2016, and as of April 5, 2016 they were under review at the CSDE. Id.
Many other grants have been awarded to districts and schools in the past several years,
typically with preference to Alliance Districts, including teacher mini-grants; Cohn Tr., 5/24/16,
pp. 138-9; grants for in-district coaching by RESCs ($4M over two years); id., 140-1; and local
assessment reduction grants ($500,000). Id., 141-4. See also DTX 4716; DTX 6226.
77 There is also $1.6M assigned to New London High School, pending approved reauthorization of use. See DTX 6289, summary tab, footnote. **
88
Q. The State Provided Effective Special Master Assistance to Windham and New London. To the extent local control is rendered ineffective due to severe and irreparable school
governance issues, the state has acted appropriately to assist districts. See, e.g., Villanova Tr.,
5/13/16, p. 107 (noting that the state has recently intervened in Winchester, which has a board
"that was not functioning in a way that would ever make a difference in achievement for
students"). The State hired consultants, including Dr. Villanova, to conduct Governance,
Leadership and Organization audits of the Windham and New London Districts (both focus
districts) in 2010 and 2012, respectively. DTX 2397 (Windham Governance Report), PTX 295
(New London Governance Report). Both districts suffered from leadership incoherence and
ineffectiveness, dysfunctional connections between the board of education and the
superintendent, and a loss of confidence in the school system by fiscal authorities and elected
officials in the town. Villanova Tr. 5/11/16, pp. 46:24-27, 46:1-5; Villanova Tr. 5/13/16, p. 30
(Windham had a "chaotic and conflict-ridden board of education-superintendent arrangement"),
p. 41 (In New London, "the interaction between the board of education and the city council and
superintendent were in disarray and disruptive to the education process at that time"). In
Windham, the Board of Education had a diminishing regard for the leadership potential of the
superintendent and treated her like a staff member as opposed to the chief operating officer of the
district and the Board's Chief Executive Officer. Villanova Tr., 5/11/16, p. 47:11-15. The
communications between the board and superintendent were "practically nil: very little
communication, most of it negative." Villanova Tr., 5/11/16, p. 47:18-21. The town's elected
officials were wary of the Board of Education's budgeting promises and their budget figures in
general. The consistent chaotic governance climate resulted in the Central Office operating
separately from the schools to simply feed the schools money rather than providing leadership to
89
create the conditions for outstanding schools by putting systems and structures in place. Not
only was there no attempt to develop and hire talented people to address the needs of students,
but the academic programs were "unfocused and sloppy" and without a written curriculum.
Villanova Tr., 5/11/16, pp. 52:22-27, 53:1-27. A similar situation existed in New London. The
Board of Education and the Superintendent were in regular disagreement, with board meetings
being very chaotic events at which the superintendent was subject to heavy board criticism.
Villanova Tr., 5/11/16, p. 61:13-18. Any improvement plans were thwarted by the politics and
governance issues of the district. The districts operated without the support of town
administration or the community because they had lost the trust of the community. In fact, the
"war" among elected officials "pervaded everything else in the district." Villanova Tr., 5/11/16
pp. 61:13-27, 62:1-2.
The Windham and New London Governance Reports set forth recommendations to
address the issues surrounding organization, governance, and leadership, which could be made
within a short timeframe and without significant additional resources by changes in policy,
practice and procedure. Villanova Tr., 5/11/16, pp. 52:1-19, 62:5-12. Following the Governance
Reports, a Special Master, Dr. Steven Adamowski, was appointed for each of these districts. His
recommendations tracked the 2012 reforms and many of the recommendations in the reports.
Villanova Tr., 5/11/16, pp. 62:25-27, 63:1-16. After the Windham Governance Report in 2010,
which found that the district's challenges were systematic and that it lacked the capacity to
improve on its own, special legislation (PA 11-61, § 138) was enacted placing Windham under
the CSBE supervision through a special master. PTX 317 (Windham Special Master Report
2011-12), p. 3. New London was similarly mired in governance and financial issues and on the
brink of being unable to operate, when a request was made in June 2012 by the Superintendent
90
and the then Chairman of the New London Board of Education for state intervention. PTX 630
(State Supervision and Support of the New London School District 2012-13 Report and
Recommendations), p. 6. After meetings with key New London stakeholders and elected
officials, as well as various reviews of district operations (including the New London
Governance Report) in 2012, Id., acting under its new authority in PA 12-116 (consistent with
PA 11-61, § 138), the CSBE appointed a special master for New London in August 2012, and
provided specific requirements for local Board training and the development of a multi-year
improvement plan. Id. Support for Board training and limited other assistance was funded by
the CSDE in 2012-13. Id. Both districts welcomed the state assistance. PTX 317, p. 20; PTX
630, p. 67.78
Dr. Adamowski served as special master in Windham from 2011-12 to 2013-14, and in
New London from 2012-13 to 2014-15. Significant progress was made in both districts during
state supervision. See PTX 317, pp. 6-13; PTX 626 (State Supervision and Support of the
Windham School District 2012-13 Report and Recommendations), pp. 8-15; PTX 630, pp. 8-15;
PTX 885 (State Supervision and Support of the New London School District 2013-14 Report and
Recommendations), pp. 6-14. This progress has continued to the present in both districts, which
have seen improved relations between their respective boards and school leaders and are being
led by capable superintendents -- Dr. Patricia Garcia in Windham and Dr. Manuel Rivera in New
78 Thus, both of these situations contrast with the current situation in Bridgeport. Bridgeport Superintendent Fran Rabinowitz explicitly testified that she does not want state supervision of her district; see Rabinowitz Tr., 6/2/16, p. 76 ("I'm not asking for a state takeover"); and plaintiffs have not sought state supervision of any of their focus districts. See also infra Section V. (local control); Conn. Gen. Stat. § 10-220; Pereira v. State Bd. of Educ., 304 Conn. 1 (2012). Furthermore, CCJEF member CABE offers training to local school boards. Villanova Tr., 5/13/16, p. 50; DTX 6460.
91
London. Defs' Findings of Fact Per 5/9/16 Order ## 47-51, 53-7, 166-9 (showing positive
academic outcomes in Windham and New London); Villanova Tr., 5/11/16, p. 55:11-14;
Villanova Tr., 5/11/16, pp. 56:16-27, 57:1-14, Villanova Tr., 5/13/16, pp. 40:15-27, 41:1-12
("There is now appropriate professional relations among the governance structure in Windham
which allows the superintendent to focus on district goals, academic, talent development,
changing operational procedures, and having a better culture and climate for student performance
as opposed to only the politics of getting the budget passed," and "Compared to 2010 when I was
[in Windham], the board of education and superintendent are collaborating around governance in
a much more effective way"); Villanova Tr., 5/11/16, pp. 63:17-27, 64:1-12 ; Villanova Tr.,
5/13/16, pp. 41:17-27, 42:1-9 (" [in New London] my impression is from 2012 through now,
they've improved the collaborative connection between the board and superintendent), pp. 105-6.
R. The State Provides Adequate and Equitable Funding for School Facilities.
The State funds a generous School Construction Grant -- $1 billion for FY 16 and $700
million to $800 million in previous years. Dixon Tr., 6/3/16, pp. 23:20-24:1, 59:23-60:10. The
State provides generous reimbursement percentages to towns based on statutory formulas related
to town wealth and relative population and the type of project. The percentages range from 20%
to 80% for alterations and renovations and from 10% to 70% for new construction. See Conn.
Gen Stat. § 10-285a(a); DTX 6406, 2015/16 Reimbursement Percentage. The reimbursement
percentage strongly favor poorer districts, including the Plaintiffs' six focus districts. DTX 6477,
Reimbursement Rates, 2013-16. Reimbursement percentages are the same for roofs over 20
years old as for renovations and alterations, with decreasing reimbursement percentages for roofs
between 19 and 15 years old. See Conn. Gen Stat. § 10-286(a)(6); Dixon Tr. 6/3/16, pp. 10:16-
12:6. As part of the State's effort to provide early childhood education and full-day kindergarten,
92
building expansions that include space for a School Readiness program or full day kindergarten
and/or full day preschool programs receive additional reimbursement percentages of 5% and
10%. See Conn. Gen. Stat. § 10-285a(e) and 10-285a(h); Pre-K FOF 67, 68. Renovation of a
building for use as a Lighthouse School also receives a 10% increase in the reimbursement
percentage. See Conn. Gen. Stat. § 10-285a(f). Finally, projects for technical high schools are
funded 100% under the grant, and interdistrict magnet schools are funded 80% under the grant.
See Conn. Gen. Stat. §§ 10-283b and 10-264h.79
The Plaintiffs' six focus districts have received funding for numerous construction
projects as detailed in DTX 3844, which includes the projects for each district from 2005 to
2015. The following are the total amounts of the project costs approved by the legislature for
this period as set forth in Column J of DTX 3844 for each district:80 Bridgeport $455,468,303,
Danbury $9,147,750, East Hartford $9,147,750, New Britain $66,485,000, New London
$68,056,463, and Windham $47,956,250, for a total of $722,315,126. In addition,
Danbury received approval for another project this year involving extension/alteration and a new
roof for its high school. It will receive a grant for this project of $31.7 million based on its
2015/16 reimbursement percentage of 63.2% being applied to the total project costs of $50.2
million. DTX 6027, 2016 Priority List; DTX 6406, 2015/16 Reimbursement Percentages; Dixon
Tr. 5/3/16, pp. 66:12-67:26.In addition, the Alliance District Grant for repairs has provided a
total of $50 million in two rounds of applications for the 2 year period of the grant from 2015-
2017. DTX 6165, Alliance Dis Repair Grant; Dixon Tr. 6/3/16, p. 69:2-72:22. Eligible repairs 79 There is presently a moratorium for magnet school programs. See Conn. Gen. Stat. § 10-264l(b)(1). 80 In order to determine the actual amount paid or allocated by the State for each project, the applicable reimbursement percentage for each district for a given year would have to be applied to the state grant commitments. Doc. # 331.00, School Construction Spending Stipulation Regarding Defendants' Exhibit 3844.
93
include boiler replacements, bathroom renovations, painting, etc. Dixon Tr. 6/3/16, pp.73:23-
74:19. The Plaintiffs' six focus districts received the following total amounts in the 2 rounds of
applications: Bridgeport $2.6 million, Danbury $1.7 million, East Hartford $1.7 million, New
Britain $1.7 million, New London $1.2 million, and Windham $1.2 million. DTX 6115, Bond
Comm. Agenda Items 1/29/16 p. 21, DTX 6491, Bond Comm. Agenda Items 5/27/16, p. 12.
V. THE TESTIMONY AND REPORTS OF DR. ROBERT PALAICH SHOULD BE STRICKEN FROM THE RECORD BECAUSE THEY ARE NOT SCIENTIFIC AND LACK VIRTUALLY ALL BASIC INDICIA OF RELIABILITY
Whether it is described as the duty to exclude unreliable evidence generally, or as the
more specific duty to exclude claims masquerading as scientific evidence when they are not, the
trial court is required to serve a gatekeeper function, separating the wheat from the chaff, and not
relying upon claims of experts when the reliability of those claims has not been established.
State v. Porter, 241 Conn. 57, 87 (1997); Conn. Code of Evid. § 7-2. In this trial, defendants
moved to exclude the testimony and reports of Dr. Robert Palaich; Tr. 2/10/16, pp. 69, 129 (PTX
31), 169 (PTX 715), Tr. 2/11/16, pp. 71-109; and other testimony and reports, in particular
sections of the reports and testimony of Dr. Bruce Baker; Tr. 1/27/16, pp. 49-53, 56-7 (PTX
236); which refer to or rely upon those exhibits. Defendants previously moved to exclude this
testimony in their Motion in Limine, 9/2/15, Doc. # 207.00, denied without prejudice on
10/15/15, Doc. # 207.86, and again in more detail orally on 2/11/16, Tr. pp. 71-109, when the
court reserved ruling, Id., p. 109.81
81 Defendants continue to press their motion in limine Doc. # 207.00 with regard to Levin as the court also reserved ruling at trial as to his testimony and report, PTX 189. See Levin Tr., 2/18/16, pp. 104, 115-116, 152-153; Levin Tr., 2/19/16, pp. 105-112. His supplemental report PTX 733, which was also objected to in the Motion in Limine, was never offered. Defendants also continue to press their motion in limine Doc. # 207.00 with regard to Carver. See Carver Tr., 1/20/16. With regard to Hakuta, plaintiffs never tried to admit his reports or the underlying reports, which were the subject of the motion in limine, so that part of the motion in limine is
94
As the testimony of Dr. Palaich revealed, his reports were designed not in compliance
with principles of science nor even of common sense, but in order to maximize the claimed
amount of additional money that Connecticut supposedly must spend on public education
(roughly $2 billion over ten years ago!), Tr., 2/11/16, p. 50, PTX 31, p. v (also marked p. 6). In
addition, to the limited extent that his study had rules, he and his colleagues ignored their own
rules. Some of the key deficiencies in Dr. Palaich's "study" are highlighted in his cross-
examination, Tr. 2/11/16, pp. 1-56, and they are too numerous to list fully here. Among the key
deficiencies in his reports, however, that render them completely unreliable, are the following:
• All of the data relied upon to determine goals and previously successful schools came from the years 2001 to 2004 – eons ago in terms of federal and state educational policies, and so outdated as to be meaningless. Tr. 2/11/16, pp. 3-4.
• The professional judgment panels were instructed to determine how much it would cost to meet a goal – of achieving 95% proficient test scores -- that no urban school districts had ever met, something for which there was obviously no precedent from which to make sound judgments. Tr. 2/11/16, p. 29.
• The "professional judgment" panels were told not to think about where the money would
come from, to be creative, and not to be limited by knowledge based on their personal experiences. They were not instructed to include cost effectiveness in their considerations. Tr. 2/11/16, pp. 21-25.
• Every member of every "professional judgment" panel was selected by the executive
director of the plaintiff. Tr. 2/11/16, p. 14.
• Although the study stated criteria for membership on the "professional judgment" panels, including a majority of each panel from "successful" school districts, there was no attempt to see that the panel membership met the criteria, and not a single one of the panels was constituted in accordance with the stated membership criteria. Tr. 2/11/16, pp. 32-37.
• Although the "highest" level panel had the authority, which it exercised, in unrecorded ways, to adjust or change all of the recommendations from the other panels, there were no stated criteria by which it could or should act. Tr. 2/11/16, pp. 26-28.
moot. Plaintiffs did not offer testimony or reports from Ronald Jakubowski or Walter Gilliam, and so those portions of the motion in limine are also moot.
95
• The professional judgment panels were advised to start with an assumption that no
elementary school classroom should exceed 17.5 students, although this figure had no connection to or basis in any Connecticut data. Tr. 2/11/16, pp. 37-41.
• The study added an "urban factor" cost multiplier and determined to which districts that multiplier should apply without any objective or recorded criteria. Tr. 2/11/16, pp. 42-44.
• The study threw out the results of certain panels when they didn't agree with the results, without any stated criteria. Tr. 2/11/16, pp. 26-28.
• The study either did not record or is unable to produce virtually all crucial documentation of its work, including records of the deliberations of the panels and the reasons for their determinations, and even which persons were actually members of which panels, further making it impossible to validate the accuracy or reliability of the work. Tr. 2/11/16, pp. 13, 15-17, 26-28.
• When evaluating "successful schools," the study made no effort to focus on those that had been successful at the lowest cost, even though the investigators did so in other states. Tr. 2/11/16, pp. 6-7.
• The "update" to the report, PTX 715, was done by an approach which was admittedly not best practice. Tr. 2/11/16, pp. 48-49.
• The "update," arbitrarily and without any explanation, dropped the results of the "successful schools" review, which were about 30% lower, in favor of considering only the higher "professional judgment" cost figures. Tr. 2/11/16, pp. 49-50. Neither the study nor Dr. Palaich could provide any explanation whatsoever as to how much of the final figures in the study were attributable to preschool costs, or how those costs were derived. Dr. Palaich did not know, and the report does not explain, for example, whether it includes costs of providing all of the cost of full day public school preschool to every child in Connecticut, or something less, and how that was determined. Tr. 2/11/16, pp. 45-48.
See also DTX 2432, pp. 23-29 (Seder Report - critique of Palaich), Tr. 4/26/16, pp. 88-90
(testimony of Seder).
In sum, the deficiencies in this report and testimony go far beyond some minor defects that
should be considered in determining the weight to be given to it. In this case, the entire study
was rigged, in every possible way, to ignore science and reliability in order to come up with the
largest possible number, a number which is, for a state that is already near the top in education
96
spending, ridiculous on its face. Because the reports have no basis in science and are utterly
unreliable in every aspect of their construction and application, they, and all testimony and
evidence based upon them, must be stricken.
VI. IF THE COURT RULES IN FAVOR OF PLAINTIFFS, RELIEF IS LIMITED TO DEFERRAL TO LEGISLATIVE ACTION.82
A. The Connecticut Supreme Court Dictates Deferral to the Legislature to Determine
Competing Constitutional Priorities. (addresses Judge Q # 2)
Connecticut caselaw is clear that even when constitutional violations have been found in
the education area, the courts in the first instance should defer to the elected branches of state
government to address the matter. E.g., CCJEF v. Rell, 295 Conn. at 261-63, 265, 314, 318, n.
22 and n. 59 (plurality), 329, 335-38 (Palmer J., concurring), 398 (Vertefuille J., (dissenting));
410, 413, 416-17 (Zarella J., dissenting); Horton v. Meskill, 172 Conn. 615, 653 (1977); Sheff v.
O'Neill, 238 Conn. 1, 46 (1996).83 84 Accord, Seymour v. Region One Bd. Of Education, 261
Conn. 475, 484 (2002).
82 See also Doc. # 296.00, Defs' 3/3/16 Response to Pls' Brief re January 2016 Question 1. 83 In the present case, the Connecticut Supreme Court justices were unanimous in their concern and respect for the separation of powers. The plurality expressly warned that "separation of powers concerns necessarily will inform the creation of any remedy in this case, should one ultimately be required." CCJEF, 295 Conn. at 265 n. 22 (plurality opinion). The plurality went on to explain that "[w]e are cognizant of the risks and separation of powers concerns attendant to intensive judicial involvement in educational policy making…and emphasize that our role in explaining article eighth, § 1, is to articulate the broad parameters of that constitutional right, and to leave their implementation to the expertise of those who work in the political branches of state and local government, informed by the wishes of their constituents." Id. at 318, fn. 59. Justice Schaller stated that the court would likely need to turn to the legislature first for any remedy "to avoid a conflict concerning the separation of powers." Id. at 381-382 (Schaller, J., concurring). Justice Palmer concluded that "it is unrealistic to believe that a remedy can be devised that will not give rise to separation of powers concerns" Id. at 338 n. 12 (Palmer, J., concurring). And Justice Zarella observed that "[j]udical intervention to resolve an issue with potentially vast financial consequences demonstrates a lack of respect for a coordinate branch of government because the court is treading on a constitutional prerogative of the legislature regarding
97
As the Court demonstrated in Horton v. Meskill, 172 Conn. 615 (1977) (“Horton I”), and
Sheff v. O’Neill, 238 Conn. 1 (1996), separation of powers vests the legislature, not the courts,
with the function and duty to fashion a constitutional system of education and education
financing. In both Horton I and Sheff, the Court declined to dictate a remedy, stating that
"judicial intervention should be stayed 'to afford the General Assembly an opportunity to take
appropriate legislative action.'" Sheff, 238 Conn. at 45-46, quoting Horton I, 172 Conn. at 653.
This case is no different. Because "separation of powers concerns necessarily will inform the
creation of any remedy in this case, should one ultimately be required," CCJEF, 295 Conn. at
265 n. 22 (plurality opinion), this court should not entangle itself in the complexities of what is
fundamentally a legislative matter. “[T]he ultimate solutions [to education financing] must come
from the lawmakers and from the democratic pressures of those who elect them.” Horton I, 172
Conn. at 644, quoting San Antonio Independent School District v. Rodriguez, 411 U.S. 1, 58
(1973). Any remedy that orders the legislature to spend additional money or spend it differently
will, of necessity, intrude on the exclusively legislative power to appropriate. City of Bridgeport
v. Agnostinelli, 163 Conn. 537, 544 (1972).
Any judicially imposed remedy would also interfere with the core legislative power to
determine education policy. See Conn. Const. Art. Eighth, § 1 (explaining that the general
assembly "shall implement" the principle of free public elementary and secondary schools "by
appropriate legislation"); Sic v. Nunan, 307 Conn. 399, 410 (2012) ("it is undisputed that the
legislature . . . has the 'primary responsibility for formulating public policy'"); Stolberg v.
education and the legislature's exclusive authority to appropriate funds." Id. at 440 (Zarella, J., dissenting) (italics omitted). 84 The plurality in CCJEF deemed the judicial remedies in NJ's Abbott cases "particularly aggressive" and warned that they "could well raise some separation of powers issues." Id. at 264 n. 21 (plurality opinion) (referencing extensive litigation stemming from Abbott ex rel Abbott v. Burke, 100 N.J. 269 (1985)).
98
Caldwell, 175 Conn. 586, 603 (1978) ("[i]t is the province of the legislative department of our
government . . . to determine the general public policy in the area of higher education");
Regional High School District No. 3 v. Town of Newtown, 134 Conn. 613, 617 (1948) ("[t]he
determination of the state policy . . . [concerning the creation of regional school districts] is for
the General Assembly"). This court cannot mandate increased or altered educational spending
for particular purposes and priorities without treading on the core legislative power to determine
educational policy. See CCJEF, 295 Conn. at 317 n.59 (plurality opinion) (recognizing the
“separation of powers concerns attendant to intensive judicial involvement in educational policy
making”).
Other state courts have also looked to their legislatures for solutions to their educational
challenges. E.g., Lobato v. State, 304 P.3d 1132, 1143-4 (2013) (“courts must avoid making
decisions that are intrinsically legislative. It is not up to the court to make policy or to weigh
policy."); Hancock v. Commissioner of Education, 443 Mass. 428, 431 (2005) (Marshall, J.
concurring, with whom Spina and Cordy, Justices join) (prior determination of constitutional
violation (now reversed) was to be corrected by the legislature); Abbeville County School
District v. State, 335 S.C. 58 (1999) ("[w]e do not intend the courts of this State to become
super-legislatures or super-school boards."), order superseded and amended, 415 S.C. 2d 19, 21
(2015) (court "will give due consideration to the General Assembly's prerogative to choose the
methodology by which the constitutional violation shall be remedied.").
B. Any Injunctive Relief Must Be Limited to the Complaint, The Prayer for Relief, and Proper Parties Before the Court.
In ... (their) prayer for equitable relief, the plaintiff(s) ... (were)
claiming the extraordinary remedy of an injunction. This is a power that courts exercise cautiously. A party seeking injunctive relief has the burden of alleging and proving irreparable harm and lack of an adequate remedy at
99
law. The allegations and proof are conditions precedent to the granting of an injunction. [citations omitted.]
Waterbury Teachers Ass'n v. Civil Serv. Comm'n of City of Waterbury, 178 Conn. 573, 577-78,
424 A.2d 271, 273 (1979). “[P]arties are bound by their pleadings.” New Breed Logistics, 129
Conn. App. 563, 573 (2011), quoting Edelman v. Page, 123 Conn. App. 233, 243, cert. denied,
299 Conn. 908, (2010). The case before the court is not a class action lawsuit. See Doc. # 163
X07-HHD-cv05-4050526-S, Corrected Third Amended Complaint (CTAC). Therefore any
injunctive relief can only bind the parties properly before the court. Connecticut Emp. Union
Indep., Inc. v. Connecticut State Emp. Ass'n, Inc., 183 Conn. 235, 248-49 (1981) ("Equity cannot
act where parties to be affected are not before the court or have not been given the opportunity to
be heard."); Stefan v. P.J. Kids, 2005 WL 834208 (Waterbury 2005) (impermissibly broad
injunctive request sought to extend to and bind unknown third parties, neither before the court
nor represented by plaintiffs' counsel). Cf. Horton I, 172 Conn. at 627 (declaratory judgment
procedure may only be employed "where all persons having an interest in the subject matter of
the complaint are parties to the action or have reasonable notice thereof.")
The plaintiffs only put on evidence as to their six focus districts. Accordingly, even if the
court should determine that some sort of injunctive relief is merited, it could not possibly exceed
whatever facts the court finds plaintiffs have proved, and plaintiffs have not put on specific
evidence about facts outside of the six focus districts. Plainly, statewide relief is insupportable
even if the court finds the evidence offered establishes some violation somewhere. Horne v.
Flores, 557 U.S. 433, 470-2 (2009) (statewide injunction not shown to be justified in light of no
evidence that any school district other than the one plaintiff district failed to provide equal
educational opportunities to ELL students; and statewide injunction intruded deeply into state's
100
budgetary processes).85 To the extent plaintiffs' Prayer for Relief in CTAC ¶ 180 exceeds the
evidence presented, any injunction must be narrowly limited to remedying specific proven
violations. H.O. Canfield Co. v. United Construction Workers, 134 Conn. 623, 626 (1948) ("The
issuance of a permanent injunction is, however, to be decided upon the facts proven at the
trial.").
85 Even when a trial court found a violation, it limited relief to only the four focus districts for which it heard evidence and found to have lacked adequate opportunities. See, e.g., Hancock v. Driscoll, 2004 WL 877984 *4, *160 (2004), reversed by Hancock v. Comm'r of Educ., 443 Mass. 428 (2005) (rejecting trial court report and recommendation and finding no constitutional violation).
101
DEFENDANTS, GEORGE JEPSEN ATTORNEY GENERAL
By: /s/ Joseph Rubin Joseph Rubin, Juris No. 085055 Associate Attorney General [email protected]
By: /s/ Beth Z. Margulies Beth Z. Margulies, Juris No. 085054 Assistant Attorney General [email protected]
By: /s/ Eleanor M. Mullen Eleanor M. Mullin, Juris No. 414110 Assistant Attorney General [email protected]
By: /s/ Darren P. Cunningham Beth Z. Margulies, Juris No. 421685 Assistant Attorney General [email protected]
By: /s/ John P. DiManno John P. DiManno, Juris No. 435642 Assistant Attorney General [email protected] 55 Elm Street, P.O. Box 120 Hartford, CT 06141-0120 Tel: 860-808-5318 Fax: 860-808-5347
102
CERTIFICATION
The foregoing Defendants' Post Trial Brief was e-mailed this 15th day of July, 2016 to the following counsel of record:
Joseph P. Moodhe, Esq., [email protected] Helen V. Cantwell, Esq., [email protected] Megan K. Bannigan, Esq., [email protected] David B. Noland, Esq., [email protected] Dustin N. Nofziger, Esq., [email protected] Alexandra S. Thompson, Esq., [email protected] Olivia Cheng, Esq., [email protected] Emily A. Johnson, Esq., [email protected] Gregory P. Copeland, Esq., [email protected] Christel Y. Tham, Esq., [email protected] Sean Heikkila, Esq., [email protected] Lindsay C. Cornacchia, Esq., [email protected] Edward Bradley, Esq., [email protected] Cara A. Moore, Esq., [email protected] Johanna N. Skrzypczyk, Esq., [email protected] Susan R. Gittes, Esq. [email protected] Debevoise & Plimpton, LLP, 919 Third Avenue, New York, NY 10022 David N. Rosen, Esq., [email protected] David Rosen & Associates, P.C., 400 Orange Street, New Haven, CT 06511 Beth Z. Margulies, Esq., [email protected] Eleanor M. Mullen, Esq., [email protected] Darren P. Cunningham, Esq., [email protected] John P. DiManno, Esq., [email protected] Cynthia Courtney, Esq., [email protected]
/s/ Joseph Rubin Joseph Rubin Associate Attorney General
APPENDIX
DOCKET NO. X07 HHD-CV-14-5037565-S
CONNECTICUT COALITION FOR : SUPERIOR COURT JUSTICE IN EDUCATION FUNDING : INC., et al. : Plaintiffs : COMPLEX LITIGATION DOCKET : AT HARTFORD v. : : M. JODI RELL, et al. : Defendants : JULY 15, 2016
DEFENDANTS' PROPOSED FINDINGS OF FACT
TABLE OF CONTENTS
I. Focus Districts .......................................................................................................... 1 A. Bridgeport ........................................................................................................... 2 B. Danbury ............................................................................................................ 11 C. East Hartford ..................................................................................................... 16 D. New Britain ...................................................................................................... 21 E. New London ..................................................................................................... 28 F. Windham................................................................................................................33
II. Reforms .................................................................................................................. 38
III. Scientifically Research-Based Interventions (SRBI ................................................. 41
IV. Class Size and Staffing ........................................................................................... 43
V. Pre-K ..................................................................................................................... 46
A. Child Care Contracts ......................................................................................... 47 B. School Readiness Programs .............................................................................. 47 C. State Head Start Programs ................................................................................. 50 D. Requirements for State Funded Programs .......................................................... 50 E. Smart Start ........................................................................................................ 52 F. Federal Preschool Development Grant .............................................................. 53 G. Total State/Federal Spending on Pre-K .............................................................. 54 H. Pre-K in Public, Magnet and Charter Schools .................................................... 55 I. Other Sources of Pre-K Funding/Facilities Funding .......................................... 55 J. Unspent Funds .................................................................................................. 55
APPENDIX 1
ii
K. Unmet Need Report ......................................................................................... 57 L. OEC Initiatives ................................................................................................ 58 M. Kindergarten .................................................................................................... 60
VI. English Learners .................................................................................................... 60
VII. Wraparound Services .............................................................................................. 62
A. The social and emotional health of students ....................................................... 62 B. The physical health of students .......................................................................... 63 C. The mental health of students ............................................................................ 63 D. Assistance for preparation and transition to college ........................................... 63 E. After school and extended learning programs .................................................... 63 F. Assistance for families in high poverty communities ......................................... 63 G. Assistance for homeless and transient students .................................................. 64 H. Support for pregnant and parenting teens .......................................................... 64 I. Wraparound programs specifically for Commissioner's Network schools .......... 64 J. Assistance for adult learners ............................................................................. 64 K. Specific critical issues that impact student achievement .................................. .64
1. Student discipline ................................................................................. 64 2. Chronic absenteeism ............................................................................. 65
L. Assistance to districts in building community partnerships and increasing family engagement ...................................................................................................... 65
VIII. NAEP Grades 4 and 8
A. Overall .............................................................................................................. 65 B. Subgroup Performance ...................................................................................... 66 C. Achievement Gap, including Grade 12 .............................................................. 67 D. PISA ................................................................................................................. 70
IX. Palmer Standard ..................................................................................................... 70
(1) “minimally adequate physical facilities and classrooms which provide enough
light, space, heat, and air to permit children to learn" ....................................... 70 (2) “minimally adequate instrumentalities of learning such as desks, chairs, pencils,
and reasonably current textbooks" .................................................................... 73 (3) “minimally adequate teaching of reasonably up-to-date basic curricula such as
reading, writing, mathematics, science, and social studies” ............................... 77 (4) “sufficient personnel adequately trained to teach those subject areas.” .............. 79
X. Revisions to Defs' Proposed Findings of Fact Per May 9, 2016 Court Order ........... 80
iii
A. Special Education .............................................................................................. 80 B. Teacher and School Leader Compensation ....................................................... 81 C. Teacher and School Leader Evaluation ............................................................. 82 D. High School Graduation Standards ................................................................... 82
XI. Revisions to Defs' Corrected Preliminary Findings of Fact ...................................... 88
Defendants' Proposed Findings of Fact Per May 9, 2016 Court Order (Doc. #326.00) ........................................................................................................... Appendix 2 Defendants' Corrected Preliminary Proposed Findings of Fact and Conclusions of Law (Doc. #265.00) ...........................................................................Appendix 3
1
Defendants incorporate herein Defendants' Proposed Findings of Fact Per May 9, 2016
Court Order (Docket # 326) (Appendix 2) and Defendants' Corrected Preliminary Proposed
Findings of Fact (Docket # 265) (attached hereto as Appendix 3).
I. Focus Districts
1. Growth in achievement is one of the most important objective indicators of the effectiveness of educational opportunities over time. See Gopalakrishnan Testimony, 5/18/16, pp. 13-14; DTX 6111 (growth is largest indicator in NextGen system). 2. While growth cannot yet be measured using the SBAC test, as there is only data available for a single year, various district benchmark assessments can be used to measure recent growth in achievement in the 6 focus districts. Under these assessments, each of the 6 focus districts has shown growth in achievement over the last 2-3 years. See, e.g., DTX 6375 (showing gains in AIMSWeb test results from winter 2015 to winter 2016 in Bridgeport); DTX 6022 (since instituting SIOP in 2008-9, the percentage of ELs in Danbury making progress in attaining English language proficiency has been nearly 90%, well surpassing the state target of 80%); DTX 6061 (Morris Street School in Danbury, which has its highest FRPL and EL population, was identified as the number one school in Fairfield County for sustained academic achievement for a seven-year period); Quesnel Testimony, 6/1/16, p. 126, 159 (East Hartford has seen double-digit gains in its SAT scores); DTX 6479, p. 1 (showing growth in STAR reading and math scores from fall to winter 2015-16); Gay Testimony, 2/23/16, p. 97 (Reading scores on the NWEA in New Britain have shown progress); Salina Testimony, 1/13/16, p. 41 (when the 1,700 EL students in New Britain were tested in September of 2014, they showed a 75% increase in reading scores over the previous year); Salina Testimony, 1/13/16, p. 41 (DiLoreto School in New Britain, a Commissioner's Network school, went from being rated the 8th worst school in the state to being recognized in 2014 as a model for dual language programs in CT with credible performances by its students including its ELs); DTX 5358, p. 18 (showing among several other indicators a steady increase in reading and math NWEA standardized test scores from fall 2014 to fall 2015 at New London High School); DTX 4808 ("In 2014-15, 3rd graders at Jennings Elementary School grew at a faster rate than the National Expected Growth and at a faster rate than students at the other two elementary schools in math on the NWEA universal screener"); DTX 4744 ("In 2014-15, English Learners in grades 4-7 exceeded the expected growth target in Math on the NWEA, with grade 7 English Learners exceeding by almost double the expected growth norm"); DTX 6474 (showing improvements on DIBELS and Riverside HMH1 for K-3 reading in Windham); DTX 6094 (Based on ELA and math benchmark assessment results for grades 3-11, Windham students improved considerably from fall to winter in 2015-16); Garcia Testimony, 3/4/16, pp. 88-9; DTX 6095, p. 4 (Between 2014-15 and 2015-16 [as of Oct. 2015], there was a 9.8% increase for students reading at grade level under the NWEA test). 3. Moreover, from 2009-10 to 2012-13 under the CMT and CAPT tests, the focus districts showed growth in achievement that in many cases outpaced the state average rates of growth. See, e.g., Defs' Demonstrative 8 (showing that 4 of the 6 focus districts outperformed the state average rate of growth on the CMT, both for all students and their high needs students); Defs' Demonstrative 9 (showing that 4 of the 6 focus districts outperformed the state average rate on
2
the CAPT for all students, and that 2 of the 6 outperformed the state average rate of growth for high needs students).
A. Bridgeport
*See Defs' Findings of Fact Per 5/9/16 Order (Doc. # 326) ## 43-6, 71-5, 92, 160, 171, 173-8.
4. Bridgeport is moving forward as a school district in terms of qualitative inputs and quantitative data. Rabinowitz Testimony, 6/2/16, pp. 74, 178. 5. Bridgeport focuses on growth in student achievement as a measure of student success. Rabinowitz Testimony, 6/2/16, p. 20. Bridgeport has seen increases in the rates of growth with literacy within the last two years. Id. 6. During Superintendent Rabinowitz' tenure, Bridgeport has shown incremental positive gains in student achievement (e.g., AIMSWeb scores) and behavioral components, such as chronic absenteeism and both in- and out-of-school suspensions. See, e.g., Rabinowitz Testimony, 1/22/16, p. 103, 6/2/16. 7. Bridgeport has seen good outcomes and solid growth in AIMSWeb scores from 2014-15 to 2015-16 in nearly all grade levels and in most subject areas, with fewer students below grade level in math and reading and more students above grade level. Rabinowitz Testimony, 6/2/16, p. 178. Bridgeport has seen increases in the level of growth in achievement across all grades. Id.; DTX 6375 (showing gains in AIMSWeb test results from winter 2015 to winter 2016). 8. Bridgeport is making solid growth to reaching the goal of getting all students to grade level, which will take time to accomplish. Rabinowitz Testimony, 6/2/16, p. 178:6-22. 9. Bridgeport saw growth in academic achievement and behaviorally in language arts, overall academic achievement, behavior, attendance and graduation rates from 2012 through 2014; DTX 6053; Rabinowitz Testimony, 1/26/16, p. 20:4-17; and that continued in 2014-15. Id. 10. Bridgeport is now ready to buy into the state's CK3LI program and absolutely believes in what the program is teaching. Rabinowitz Testimony, 6/2/16, p. 72. One of its schools, Columbus School, is already involved. Id. See also Cohn Testimony, 5/24/16, p. 94 ("[T]here isn't a single school [in the state] that hasn’t made gains in the CK3LI model."). 11. Leadership is a major factor in student success, as are effective systems and organization within a school system; namely, systems in place to deliver effective instruction, identify students for additional services, and prioritize spending. Bridgeport has many of these systems in place and has done a good job of looking at effective teaching. Rabinowitz Testimony, 6/2/16, p. 15. 12. The first system is curricular development and implementation, and Bridgeport has put a curriculum in place aligned with the Common Core State Standards and has provided training to all of its teachers in that curriculum. Rabinowitz Testimony, 6/2/16, pp. 15-16. Bridgeport has
3
used Alliance District funding for this purpose. See DTX 5363 (2015-16 Bridgeport Alliance District Plan). 13. Bridgeport's funding system was in "really good shape" when Superintendent Rabinowitz came to Bridgeport. Rabinowitz Testimony, 6/2/16, p. 16. 14. Bridgeport is always working with staff to improve Tier I instruction. Rabinowitz Testimony, 6/2/16. 15. Bridgeport now has training in place for its school leaders in effective teacher evaluation. Rabinowitz Testimony, 6/2/16. This training is funded through the Alliance District grant. See DTX 6122 (2015-16 Bridgeport Alliance District Plan Summary). 16. Bridgeport's system of intervention is working well and is in better shape than it was when Superintendent Rabinowitz came to Bridgeport. Rabinowitz Testimony, 6/2/16. Rabinowitz reinstituted the Directors of Literacy and Math, which she hired using Alliance District funding. Id.; Rabinowitz Testimony, 1/22/16, p. 117. Bridgeport has a 90-minute literacy period followed by an SRBI period which has an 'all hands on deck' approach that redistributes and differentiates students based on their needs. Rabinowitz Testimony, 6/2/16, p. 18. All 29 elementary schools in Bridgeport have had the 90-minute blocks since 2014-15. Id., 18:14-19:24; Cohn Testimony, 5/24/16, p. 85:24-27. The intervention system is coming along and working well. Id. Bridgeport has used its Alliance District funding to support this system. Cohn Testimony, 5/24/16, pp. 85-6. The system helps defray the cost of interventionists by having time set aside where classroom teachers can do some of the intervention. Id. 17. At Waltersville School in Bridgeport, SRBI is being effectively applied to all students. Briganti Testimony, 2/5/16, pp. 94-8 ("Q: Do all students that are below grade level in reading receive interventions in some form? A: At some point the children receive interventions."). Most teachers are engaged in tiered instruction, and all teachers and interventionists are training in SRBI strategies. Id., 131-2. There are also teachers trained in the Wilson, Lexia and Just Words reading programs for K-3. Id., 132-9. 18. Bridgeport is also implementing a data team system, which will take about 3 years to be fully implemented. Rabinowitz Testimony, 1/22/16, p. 99:17-25, 99:26-100:17. This approach has virtually unanimous support from contemporary scholars in education, and was missing in Bridgeport when Superintendent Rabinowitz started her tenure there. Id., 99-100. 19. Superintendent Rabinowitz disagrees with plaintiffs' expert Dr. Rice regarding the importance of test scores and experience for teachers; Superintendent Rabinowitz does not believe that they are deciding factors as to teacher effectiveness. Rabinowitz Testimony, 6/2/16. See also Ryan Testimony, 3/1/16, pp. 68-9 (failing Praxis 2 did not indicate he was a less-effective teacher; he was later named Principal of the Year); Hanushek Testimony, 5/4/16, p. 19 (test scores of teachers are not that highly correlated with the performance in the classroom); Wentzell Testimony, 5/5/16, p. 123 (mobility and experience are not proxies for teacher effectiveness). Rabinowitz does not believe there is a 1:1 correlation between teacher quality and years of experience. Id. Instead, the disposition to be a teacher (empathy, collaboration,
4
patience), which cannot be taught, is more important as to teacher effectiveness. Id.; see also Hanushek Testimony, 5/4/16, p. 83 (the variation in teacher effectiveness within schools is much larger than that between schools). 20. Bridgeport has 4 interdistrict magnet schools with about 2,000 students and receives an additional $3,000 from the state for each Bridgeport student who attends (about 70% of the 2,000). Rabinowitz Testimony, 1/22/16, p. 157. Bridgeport also receives about $7,000 per pupil for each of the out-of-district students enrolled (about $4.2M). Id., 158. Bridgeport offers "great programs" in its inter-district magnet schools. Rabinowitz Testimony, 6/2/16. Bridgeport is opening a new magnet school, Geraldine Clayton School, in Jan. 2017, which will provide additional state funding to the district. Rabinowitz Testimony, 6/2/16. 21. Bridgeport has several groups where it is developing teachers to be leaders, which gives the teachers more training and the opportunity to influence the school system. Rabinowitz Testimony, 6/2/16. One such program is through CCSU. Id. Bridgeport also participates in LEAD CT's Turnaround Principals' Program and the Coherence Practices for District Leadership Teams Institute. DTX 6325. 22. Parental involvement is a critical factor in student success. Rabinowitz Testimony, 6/2/16. 23. Superintendent Rabinowitz agrees with the BHEA letter about board dysfunction (see DTX 6485). Rabinowitz Testimony, 6/2/16. The letter says among other things that "there is consensus among teachers' and administrators' unions, Bridgeport's student and parent groups, as well as out-of-school agencies that the district under … Rabinowitz has made remarkable progress these past two years." Id. 24. The relationship between the superintendent and the board of education of Bridgeport impacts the effectiveness of the reforms that have been put in place or adopted in 2012. Villanova Transcript, 5/13/2016, p. 56; Wentzell Testimony, 5/5/16, pp. 154-6 (board is dysfunctional and impedes reform efforts; state previously tried to supervise the district). 25. Superintendent Rabinowitz is "staying as long as I continue to see outcomes moving forward and people moving forward." Rabinowitz Testimony, 6/2/16. 26. The Commissioner's Network program has had a positive effect in terms of providing funding for professional development, instructional coaching, smaller class sizes and more interventions. Rabinowitz Testimony, 1/22/16, p. 105; Cohn Testimony, 5/25/16, pp. 140-7. For example, attendance is up to 95% at Curiale School. Rabinowitz Testimony, 1/22/16, p. 124. 27. Also, suspensions in classes that participated in the ALIVE wraparound program were reduced by 23%. DTX 6426, p. 3. Out-of-school suspensions have dramatically dropped this year at Marin School. Cohn Testimony, 5/25/16, pp. 140-1. Additionally, Dunbar School saw an improvement in its culture and climate, including an over 30% decrease in in- and out-of-school suspensions. DTX 6428, p. 8.

5
28. The CSDE gave Bridgeport Public Schools $200,000 for Columbus School (pk-8) even without it being a Commissioner's Network school. Rabinowitz Testimony, 6/2/16, p. 96; Wentzell Testimony, 5/5/16, pp. 137-8 (Rabinowitz admitted that principal was ineffective but initially did not want to remove him, despite that it was a non-negotiable part of network plan; ultimately state and district came to agreement). With that money, Bridgeport helped put the Columbus School's principal through LEAD Connecticut training to help build his capacity to be an effective leader. Id. Columbus School has also seen growth in outcomes (e.g., AIMSWeb scores) and reduced out-of-school suspensions significantly. Id. The principal is now at a different school in Bridgeport and is expected to succeed there, given his training. Id. Columbus has a new principal and has reapplied to the Commissioner's Network. Id. 29. Bridgeport has a head of early childhood. Simmons Testimony, 1/28/16, p. 104. Bridgeport has a universal preschool task force and is looking at establishing preschools throughout the city, and has done more marketing to reach out to parents about preschool opportunities. Rabinowitz Testimony, 1/22/16, p. 163; 6/2/16. 30. Bridgeport has worked with the United Way to find children and provide services in those areas. Rabinowitz Testimony, 6/2/16. 31. More than 2/3 of kindergarteners in Bridgeport have had a preschool experience. Rabinowitz Testimony, 6/2/16. 32. Out of roughly 1,500 teachers, only about 120 resigned last year (8%). Rabinowitz Testimony, 6/2/16, p. 113. Another 80 teachers retired (5%). Id. Thus, about 1,380, or 87%, of teachers stayed in the district. See also Wentzell Testimony, 5/5/16, p. 123 (teacher mobility is not major issue in CT; Rabinowitz is only superintendent in the state who complains about teacher mobility), p. 125 (during Wentzell's tenure in Hartford, they hired 150-200 teachers a year, which is typical of a large urban district), p. 126 (LEAD CT helps turnaround principals with planning for hiring). Contra Pls FOF #136. 33. Teachers in Bridgeport are not primarily motivated by salary, and according to Superintendent Rabinowitz they would not leave their jobs if they did not get raises in a given year. Rabinowitz Testimony, 6/1/16, p. 147. 34. All contracts in Bridgeport Public Schools involve raises every year. Rabinowitz Testimony, 6/2/16, p. 119. 35. Bridgeport has a district-wide behavioral support program called RULER which is an early intervention strategy where trauma in students is identified and, rather than identifying them as special needs, the program removes the children from the classroom to receive "high-powered" behavioral support, including work with families and schools, and then returns the students to the classroom after completion of the program. Rabinowitz Testimony, 6/2/16. Through this program, parents are very committed and try to come in to learn better ways of parenting. Rabinowitz Testimony, 1/21/16, p. 34. Bridgeport has also seen attendance improving, chronic absenteeism going down and out-of-school suspensions decreasing as a result
6
of the RULER program, which is a relatively inexpensive program. Rabinowitz Testimony, 1/22/16, p. 151:22-152:11. 36. The Connecticut Speaker of the House agreed to include the RULER program in the state's regional incentive plan to expand it to neighboring towns as well. Rabinowitz Testimony, 6/2/16, pp. 175-7. This is a $3M investment by the state (approved in the new budget) and will help save money on special education expenses by reducing the identification rate. Id. Next year, Bridgeport will regionalize the program and will receive money from other districts for providing those services. Id. 37. Bridgeport's new Career and Craftsmanship School is an alternative high school that helps overaged, underage students at risk of dropping out. Rabinowitz Testimony, 1/22/16, p. 37; Johnson, 1/26/16, p. 84. At the school, which is extended day and provides transportation, students receive tutoring on core subjects and attend Bullard Havens technical school to experience trades such as masonry, culinary, carpentry and healthcare. Id. 38. On 3/1/16, Superintendent Rabinowitz was reminded by the CSDE by email about the need for Bridgeport to spend down its Alliance District and Commissioner's Network funding and that it was behind on doing so. Rabinowitz Testimony, 6/2/16. Another reminder came from the CSDE on 5/2/16. Id. 39. In 2015-16, Bridgeport received over $18M in Alliance District funding and over $6.6M in Priority School District funding. DTX 6122. Beyond these grants, Bridgeport received almost $6.5M in 2014-15 in competitive state, federal and private grants. Rabinowitz Testimony, 1/22/16, p. 145. 40. Using its Year 4 Alliance District funding this school year, Bridgeport has utilized embedded literacy and math coaching, professional development to support the district's improvement plan, professional development for administrators in CCT Rubric in the Teacher Evaluation Framework, and recruitment and human capital pipelines in collaboration with local colleges and universities. Rabinowitz Testimony, 6/2/16; DTX 5363, p. 2 (Talent). 41. Through the Alliance District grant, Bridgeport funds 42 university interns and 32 interventionists to work on SRBI intervention and professional development at the elementary level. Cohn Testimony, 5/24/16, p. 85; Cohn Testimony, 5/25/16, p. 85; Rabinowitz Testimony, 1/22/16, pp. 117-8. Bridgeport is using its grant to hire and train literacy coaches in every elementary school and math coaches for selected schools (some new hires, others already employed), who will then use half of their time to train teachers in the schools to help students with math and reading needs, and the other half of their time to work directly with students most in need of help. Rabinowitz Testimony, 1/22/16, pp. 113-4. Bridgeport also uses its grant for enrichment and intervention blocks, which help defray the cost of interventionists by having time set aside where classroom teachers can do some of the intervention. Cohn Testimony, 5/24/16, pp. 85-6.
7
42. Overall, state aid to Bridgeport increased by $7M in the new budget. Rabinowitz Testimony, 6/2/16, p. 174. Along with this additional aid, the City of Bridgeport will be giving the district the $904,000. Id. 43. Bridgeport's per pupil expenditures have increased since 2011-12. DTX 5638 (Bridgeport expenditure profile). Of that spending, 70% comes from the state, 21% from the municipality and 8% from the federal government. Id. 44. Bridgeport outpaced the state average in growth on the CAPT from 2009-10 to 2012-13 for all students. Defs' Demonstrative 9. 45. In 2012-13, salaries for principals and the superintendent in Bridgeport were greater than the state average. Defs' Demonstrative 16. Teachers received 2% increases each year in the last 2-3 years. Rabinowitz Testimony, 1/26/16, p. 16. Teachers who apply for positions in Bridgeport likely also apply for positions in New Haven County. Rabinowitz Testimony, 1/26/16, p. 17. In 2012-13, the average general education teacher salary in Bridgeport was $64,103, compared to nearby New Haven County districts like Orange ($65,695), West Haven ($63,507), New Haven ($59,767), Derby ($59,298), and Ansonia ($55,331). PTX 420. 46. Bridgeport was awarded $2.68M for improvements to school buildings under the Alliance District school building grant. Rabinowitz Testimony, 1/22/16, pp. 123-4. Bridgeport will use these funds for facility updates, including boiler replacements. Id., 124. 47. Bridgeport schools have received assistance in SRBI and PBIS through the State Personnel Development Grant (SPDG) and the School Climate Transformation Grant (SCTG), respectively. Rabinowitz Testimony, 1/22/16, p. 125. 48. Bridgeport schools have received school improvement grants (SIG) since 2011. See DTX 6226 (Turnaround Grants Overview), pp. 8-9. For example, Roosevelt School received a 1003g SIG from 2011-14 (over $800,000 per year), and 4 schools (Cesar Batalla School, Geraldine Johnson School, Columbus School, Tisdale School) received a 1003a SIG from 2014-15 to present (between $130,000 and $200,000 per year each). Id. 49. The Lighthouse program serves about 2,000 students in Bridgeport and offers after school and summer programs, and includes homework help, reading and math enrichment, computer instruction, music, arts, tutoring. The program is available during the school year for a sliding scale of $5 to $20 per week, with scholarships available, and in the summer all day. The all-day program is available for $10 to $40 a week on a sliding scale with scholarships available. Rabinowitz Testimony, 1/22/16, pp. 126-30. 50. DTX 6049 lists descriptions of the various school construction projects in Bridgeport, which are reimbursed by the state at 80% for renovations and 100% for roof replacements. Rabinowitz Testimony, 1/22/16, pp. 132-42. 51. In 2014-15, Bridgeport upgraded over 10,000 Chromebooks. Rabinowitz Testimony, 1/22/16, pp. 142. Bridgeport has more than one Chromebook for every two students. Id., 142-3.
8
Bridgeport also tripled its internet access in 2014-15 after hiring a new technology director. Id., 143. Bridgeport received about $10M in E-Rate funding which will be used to provide additional access points for computer use and double the internet bandwidth this summer. Id., pp. 143-4. Bridgeport is also receiving an expansion of wireless internet infrastructure for all 3rd to 12th grade classrooms this year. Simmons Testimony, 1/28/16, p. 100. 52. Bridgeport also received an Apple grant that provided for an iPad for every student and teacher in K-8 in five different schools. Rabinowitz Testimony, 1/22/16, p. 144. This grant was given to only 114 schools nationwide, 5 of which are in Bridgeport. Id. The roughly 3,000 students in those schools will not need Chromebooks. Id. 53. Bridgeport received a grant for five elementary schools, including Waltersville School, to provide a resident artist in each school who works with students and gives teachers and the principals training on how to integrate the arts into instruction. Rabinowitz Testimony, 1/22/16, pp. 152-3. It also provides about $40,000 for supplies across the five schools. Id. 54. Bridgeport has implemented the MyOn program in K-9 classes, which is "an excellent program" that provides online and offline access for students to over 6,000 digital books. Rabinowitz Testimony, 1/22/16, p. 154. MyOn allow students to read genres that they like; monitors where the students are, gives a quick quiz after every book that is read and suggests other books and allows students to learn about other genres. Id. 55. Bridgeport participates in the Jobs for the Future program for grades 9-12, which helps the district design pathways (courses) for students in the areas of culinary, business, the arts, etc. Rabinowitz Testimony, 1/22/16, p. 155. Using this funding program, Bridgeport has done incredible amounts of training in grades 7-10 in good strategies for literacy to get students to be college and career ready. Id., 156. Bridgeport also developed a program through this grant with Housatonic Community College where a number of students attend advanced manufacturing classes at the college (with transportation provided). Id. 56. Since beginning her tenure, Superintendent Rabinowitz has added interventionists, added the I3 STEM grant for career pathways ($3M over 5 years), done a lot of work around data-driven decision-making where all 37 schools have bought into a system of monitoring certain uniform indicators on a monthly basis, has adhered to an SRBI manual, has worked a lot on systematic curriculum development, created many electronic programs to help monitor the data around out-of-school suspensions and chronic absenteeism, created a task force around the social-emotional development of students and introduced through the partnership with Yale the RULER (Recognizing, Understanding, Labeling, Expressing and Regulating Emotions) program, which is a program that is pre-K-8 and soon to be Grade 9 around social-emotional development, anti-bullying. Rabinowitz Testimony, 1/26/16, pp. 11-12; Johnson Testimony, 1/26/16, p. 132. This program is used in all elementary schools and is expanding to the high schools in the fall 2016. Id. 57. All curriculum in Bridgeport is aligned to the Common Core State Standards. Rabinowitz Testimony, 1/26/16, p. 21. That is generally true of schools in CT. Id.
9
58. The CSDE's Bureau of Special Education is working with Bridgeport to provide 8 days of in-district training development sessions to support their efforts to improve their Child Find work this year. Rabinowitz Testimony, 1/26/16, pp. 36-7. The state is also doing focused monitoring in Bridgeport for special education. Id. Bridgeport also receives other in-kind support from the CSDE IDEA staff. Id., 38. 59. Harding High School in Bridgeport has international baccalaureate (IB) and law academy programs. Johnson Testimony, 1/26/16, pp. 137-8. 60. Principals at Central High School and Bridgeport Military Academy were "good hires" and have performed well. Johnson Testimony, 1/26/16, pp. 139-40. 61. Bridgeport has a nice portfolio of professional development opportunities for teachers and administrators that it conducts in-house in Bridgeport. Johnson Testimony, 1/26/16, p. 142. 62. Mr. Furlong's classroom has a SMART board, a set of 29 Chromebooks (used for a variety of purposes including accessing math and reading programs and doing internet research) and wifi, and the textbooks are up to date and some are new, and there are enough for each student to bring home. Furlong Testimony, 2/11/16, pp. 181. 63. The literacy and math coaches at Bryant School are trained in various reading and math initiatives for the purpose of bringing them back to present to teachers in the classroom. Furlong Testimony, 2/11/16, p. 163. 64. Bridgeport implemented a new math program that was geared towards the Common Core called Math in Focus. This was a paradigm shift in teaching math in each grade, building on the foundation of the previous grade starting with kindergarten through Grade 8. Furlong Testimony, 2/11/16, p. 164. Professional development was given to teachers on this program. Id., 165. 65. Bryant School has a positive school climate. Furlong Testimony, 2/11/16, p. 176. 66. Ms. Capasso's 8th grade mathematics students master what she teaches them in class. Capasso Testimony, 2/23/16, p. 66. Most of her students improve at least one grade level in math in their year with her. Id. 67. Roosevelt School in Bridgeport is a new facility. Simmons Testimony, 1/28/16, p. 114. There have been gains at Roosevelt School in attendance this year. Id., 113. Each student at Roosevelt has received an iPad mini from an Apple grant, and the teachers receive MacBook Airs and iPad minis as well. Id., 113-4. 68. At Edison School, not every classroom needs an aid, and the school did not need a full-time psychologist to do assessments. Simmons Testimony, 1/28/16, pp. 104-6. After receiving additional paraprofessionals in the fall of 2014, Edison had a full allocation of paraprofessionals. Id., 104. Edison School never had to be closed or canceled as a result of any issues with regard to heating or cooling. Id., 113.
10
69. Regarding raises every year for teachers, Superintendent Rabinowitz didn’t think about asking teachers to make certain concessions given the budgetary issues in Bridgeport and the state. Rabinowitz Testimony, 6/2/16, pp. 115-20. According to Rabinowitz, because of collective bargaining, the board has to negotiate the terms with the unions, and they would likely refuse to consider these concessions, such as not having salary increases every year. Id. These changes would be difficult, especially given binding arbitration. Id. 70. Superintendent Rabinowitz' relationship with the Bridgeport Board of Education is a challenge. Rabinowitz Testimony, 6/2/16. Some board members have a difference of opinion and one is incredibly difficult to deal with and influences the board. Id. That member, Ms. Pereira, has a personal vendetta against Rabinowitz, and rules by intimidation. Id. The board gets stuck for 4 ½ hours on political issues (e.g., whether the superintendent's contract is legal) and "bickers about trivial matters," which leaves little time for substantive matters. Id. It is difficult to conduct business, and the board often loses a quorum because it is so late by the time they get to substantive issues. Id. Some teachers even say they don’t want to bring their students to board meetings. Id. 4 members are opposed to most of whatever Rabinowitz wants to do. Id. She is bullied by Ms. Pereira. Id. Pereira says her main priority is to get rid of Rabinowitz. Id. When asked what her other priorities are, she says "she'll figure it out." Id. This dysfunction interferes with the functioning of the board and its ability to work on policy. Rabinowitz Testimony, 1/22/16, p. 97. 71. All of the students in Gregory Furlong's 5th grade class at Bryant School made progress toward reaching or exceeding grade level. Furlong Testimony, 2/11/16, pp. 156-8. 72. Tisdale School in Bridgeport was built in 2008 and is state of the art. Capasso Testimony, 2/23/16, p. 63. 73. Eleven schools in Bridgeport, in one subject or another, reflect high needs students who are outperforming the state average of high needs students. DTX 6215, p. 1.
B. Danbury
*See Defs' Findings of Fact Per 5/9/16 Order (Doc. # 326) ## 2-3, 68, 70, 72, 76-7, 92, 179-80.
1. The Danbury students who expose themselves to the resources Danbury offers have adequate and equitable resources to be college and career ready. Pascarella Testimony, 2/2/16, p. 158:6-26. 2. Morris Street School in Danbury was identified as the number one school in Fairfield County for sustained academic achievement for a seven-year period. DTX 6061; Pascarella Testimony, 2/2/16, pp. 170-1. Morris Street School had the highest number of children in poverty and English Learners in the district. DTX 6061; Pascarella Testimony, 2/2/16, p. 172. 3. Danbury ranked number two overall in the Connecticut Statewide Career and Technical Education Assessment for schools with 100 or more concentrators. Pascarella Testimony, 2/2/16, p. 172.
11
4. Danbury outpaced the state average in growth on the CAPT from 2009-10 to 2012-13 for all students and high needs students. Defs' Demonstrative 9. 5. Over 80% of Danbury High School graduates attend college. DTX 6057; DTC 6058. 6. Danbury High School had a student to teacher ratio of 16:1. Pascarella Testimony, 2/2/16, pp. 161-2. 7. Danbury's average class sizes in 2014-15 were comparable to the state averages for grades K-8. Defs' Demonstrative 10 (showing that for grades K-8 in the aggregate Danbury's average class size was 20.9 while the state average was 20.4). 8. Danbury High School has the lowest percentage of chronic absenteeism out of all Alliance Districts, and last year had the highest overall average attendance rates out of the Alliance Districts. DTX 6057. 9. Danbury High School was recently rated number one in the state for teaching students about computer information systems. DTX 6057. 10. At Danbury High School, students in chemistry and biology are able to receive UConn credit, and students enrolled in English Lit, English Lang, and calculus are able to receive Western Connecticut State University credit while taking their AP courses. DTX 6059; Pascarella Testimony, 2/2/16, pp. 165-6. 11. In the past year, 100 students at Danbury High School enrolled in a new program that will allow students to earn an associate’s degree together with their high school diploma. Pascarella Testimony, 2/2/16, p. 166. 12. In June 2015, Danbury voters approved a $53.5M expansion of Danbury High School. Pascarella Testimony, 2/2/16, p. 166. 62% of that amount will be reimbursed by state taxpayers. Id. The expansion will be in time for the 2017-18 school year and will add 55,000 square feet and 26 new classrooms. DTX 6057, p. 1. 13. 89% of 8th graders were proficient on the CMT after 5 years in the Danbury schools. The figure was only 62% for students who were enrolled fewer than 5 years. DTX 6060; Pascarella Testimony, 2/2/16, p. 167. 14. In math, students exceeded the state average with a score of 41, compared to the state’s 36, according to CMT results. DTX 6060; Pascarella Testimony, 2/2/16, p. 167. 15. English Learner students at the Danbury middle schools outpaced the state in reading scores, growing an average of 47 points versus the overall state growth of 34. DTX 6060; Pascarella Testimony, 2/2/16, p. 167.
12
16. Danbury has the region’s only STEM middle school. DTX 6060; Pascarella Testimony, 2/2/16, p. 168. 17. Danbury is the only district in the area that offers middle school students a chance to learn abroad. For example, Rogers Park School students taking Spanish 2 have the opportunity to travel to Puerto Rico. DTX 6060; Pascarella Testimony, 2/2/16, p. 168. 18. Broadview Middle School has award winning groups that include the BMS Media Club and the Mathletes. DTX 6060; Pascarella Testimony, 2/2/16, p. 168. 19. Danbury's EXCEL program offers college prep to lower income and first generation future college students. Middle school students move up to ConnCAP/Upward Bound at the high school level. Student success has been proven in the program’s high retention rate and rate of attendance at four-year colleges. DTX 6060; Pascarella Testimony, 2/2/16, p. 168. 20. The Academy of International Studies (AIS) Magnet School was named Connecticut Elementary School of the Year for 2014-2015. DTX 6061; Pascarella Testimony, 2/2/16, p. 169. 21. Park Avenue School in Danbury underwent major renovations in 2014, including an additional 20,000 square feet which included 12 new classrooms and a new media center equipped with a SMART Board. DTX 6061; Pascarella Testimony, 2/2/16, p. 171. 22. Shelter Rock School in Danbury was named a "success story" in 2014 by ConnCAN. DTX 6061; Pascarella Testimony, 2/2/16, p. 171. Shelter Rock has 100% parent participation rate in parent/teacher conference attendance. Id. 23. Stadley Rough School in Danbury has been successful at differentiating instruction. DTX 6061; Pascarella Testimony, 2/2/16, pp. 171-2. It also has a school psychologist and social worker to provide social skills to students. Id. 24. Per pupil spending in Danbury has increased every year from 2011-12 to 2014-15 (last available year of data). DTX 5639 (Danbury expenditure profile). 25. The Alliance District grant in Danbury has helped it fund programs such as full-day kindergarten, specialized training for teachers, sheltered instruction observation protocol (SIOP) training, and technology infrastructure work. Pascarella Testimony, 2/2/16, pp. 175-6. 26. In 2014-15, a new cohort of elementary teachers and new hires from ESL/Bilingual and World Language Departments received training in SIOP. SIOP-trained teachers at the Danbury High School and three middle schools received job-embedded support from SIOP Coaches. DTX 6373 (2014-15 Danbury Title III AER), pp. 2, 5. Teams of TESOL and general education teachers attend many state offerings throughout the year. Id. 27. Since instituting SIOP in 2008-9, the percentage of English Learners in Danbury making progress in attaining English language proficiency has been nearly 90%, well surpassing the state
13
target of 80%. DTX 6022; Pascarella Testimony, 2/2/16, p. 177. ELs attaining proficiency have steadily been at 55%, exceeding the state goal of 30%. Id. Even prior to the installation of SIOP, the district always met or exceeded state goals for 10 consecutive years, beginning in the 2003-4 school year. Id. 28. Danbury has full-day kindergarten for the entire district. Pascarella Testimony, 2/2/16, pp. 180-1. 29. In 2015-16, Danbury's Alliance District grant was increased to over $7.8M, and its Priority School District grant was over $2M. Pascarella Testimony, 2/2/16, p. 181. See DTX 6140 (Danbury 2015-16 Alliance District Plan Summary). This funding was used for, among other things, an associate principal of instruction for the middle schools, a Marzano evaluator, administrator positions to help increase student attendance at Danbury High School, 7 math coaches at the elementary schools, 36 kindergarten teachers in all of the elementary schools, summer school for 8-9th graders, 5 SIOP coaches, 10 EL teachers, Head Start, Common Core supplies, materials and technology equipment, 32 part-time interventionist substitutes, credit recovery/summer program, and the hiring of 11 social workers to support school climate. Id., pp. 181-5. 30. In 2012-13, salaries in Danbury were higher than the state average for general education teachers and special education teachers, as well as its superintendent. PTX 420; Defs' Demonstrative 16. 31. Ellsworth Avenue School, which has the highest percentage of EL's in Danbury, is 5 years old and in excellent condition, with SMART boards in every classroom, Chromebooks in each 4th and 5th grade classroom, and carts of laptops available for the remaining grade levels and an iPad cart for kindergarten. Rocco Testimony, 2/26/16, pp. 43-4, 51. The school has an SRBI interventionist who works with the same group of 24 students four days a week. Id., 45-6. 32. Classroom teachers are also able to provide interventions to small groups in their classrooms. Id., 46. Teachers can and do routinely provide Tier 1 and 2 interventions in their classrooms. Id., 48. 33. For the high school students who walk into the media center at Danbury High School, Ms. Gencarelli or one of the other media specialists are able to meet their needs in terms of the media center resources. Gencarelli Testimony, 2/5/16, p. 55. 34. Media specialists are available at Danbury High School for an hour after school each day. Gencarelli Testimony, 2/5/16, p. 54. 35. At Danbury High School, Ms. Gencarelli is able to work one on one with students, provide individualized instruction and problem solving for students, provide small group instruction, help with technology like Google Docs or iMovie, help with classroom assignments, provide professional development for teachers, and set up equipment for teachers. Gencarelli Testimony, 2/5/16, p. 56.
14
36. The media centers at all Danbury schools are at various stages in the process of transforming into what are called Learning Commons. Gencarelli Testimony, 2/5/16, p. 67. A Learning Commons is an area that students can come into and create a hands-on experience on all different types of subject areas, such as animation, film or jewelry. Id. The subject area changes – students can learn about a subject in depth and can become part of that subject. Id. 37. Danbury High School purchased additional Chromebooks and iMacs for classrooms and the media center for the 2014-15 school year. Gencarelli Testimony, 2/5/16, p. 72. 38. In January 2016, the State Bond Commission approved over $240,000 for technology for Danbury, including for Chromebooks and Chromebook carts. Pascarella Testimony, 2/2/16, p. 185. 39. The library media center website at Danbury High School provides free access for students to online and print resources, assistance with audio and eBooks outside of the high school, and a teacher projects database for all classes, which includes links to print and online resources for individual teacher research projects. Gencarelli Testimony, 2/5/16, pp. 64-5. 40. Danbury High School has Chromebooks and free access to eBooks and online databases like iConn which can be read on a Chromebook. Gencarelli Testimony, 2/5/16, pp. 30-1. The eBooks can be checked out by multiple users at the same time. Id. Students also have free access to Danbury Public Library. Id., 60. 41. All classrooms at Danbury High School are equipped with projectors and teachers have laptops or desktops with high speed internet and 24/7 access to the network and their files. Gencarelli Testimony, 2/5/16, pp. 38, 59. Some classrooms, including special education classes and the social studies department also have SMART boards, provided through a grant. Id., 41, 62. Teachers are able to instruct their students with whiteboards or laptops just as effectively as with SMART boards. Id., 62. See also Wentzell Testimony, 5/5/16, p. 75 (noting that SMART boards are generally used for teachers to project their notes, which can just as effectively be done with a chalkboard or whiteboard; and that the national teacher of the year, from Waterbury, teaches with a chalkboard). 42. There are at least five computer labs throughout Danbury High School, each with at least 25 stations. Gencarelli Testimony, 2/5/16, p. 58. This includes labs on every floor in the D building, and computers in specific rooms like the art rooms. Id. In addition to what is in the library media center, there are also mobile carts with laptops, Macbooks, Chromebooks, iPad carts and iPods available upon reservation. Id., 59. There are also classroom labs with advanced software for specialized instruction in the areas of business, art and technology. Id. 43. All computers at the Danbury High School have internet access. Gencarelli Testimony, 2/5/16, p. 59. Danbury High School has wireless technology for students to access the internet from their own devices, which helps increase access to online resources, and reduces some of the demand on school equipment. Id., 60. See also Wentzell Testimony, 5/5/16, p. 76 (many districts are moving to bring-your-own-device policies). Danbury High School also has a Citrix Gateway that allows authorized users access from any device with Citrix downloaded on it. Id.
15
44. In 2012-13, the elementary schools in Danbury had more books per student than Danbury High School. DTX 359; contra Pls' FOF #243. Electronic resources that are now more prevalent than print resources are not captured in the data regarding the number of volumes of books in schools. Wentzell Testimony, 5/5/16, pp. 70-1. 45. Ms. Gencarelli has never worked at an elementary school in Danbury, nor has she worked at Greenwich High School, so her testimony is limited to her work at Danbury High School and the three elementary schools that she worked at in Greenwich. Gencarelli Testimony, 2/5/16, p. 55. Ms. Gencarelli has never been a classroom teacher nor ordered classroom textbooks or established a school budget. Id., pp. 55, 62-4. Ms. Gencarelli does not know the total number of computers at the elementary schools in Danbury, or at Greenwich High School, or the percentage of computers with internet access at Greenwich High School, or the number of computers at the Greenwich elementary schools for this school year, or the ratio of computers to students at Greenwich High School, at Danbury elementary schools, or at Greenwich elementary schools for this year. Id., 60-2, 66. She also does not know the number of books per student in the media center at Danbury High School, nor the number of books at Greenwich High School, at the Danbury elementary schools, or at the elementary schools in Greenwich currently. Id. 46. In Danbury, the 2012 reforms, including the Alliance District grant, have provided benefits to the district, helped to narrow the achievement gaps, and allowed the district to expand its initiatives. Pascarella Tr., 2/2/16, pp. 175:19-21, 176:14-16. 47. Middle School students in Danbury exceeded the state average in math and English Learner students outpaced the state in reading scores. Pascarella Tr., 2/2/16, pp. 167:18-27; DTX 6060, p. 2. ELs district wide are way above the state objectives in making progress and attaining English language proficiency. Id., 178:2-5; DTX 6062.
C. East Hartford
*See Defs' Findings of Fact Per 5/9/16 Order (Doc. # 326) ## 43, 60, 68, 70, 72, 92, 159-65. 1. There has been incredible movement in East Hartford since 2011 based on positive outcome data. Quesnel Testimony, 6/1/16, p. 143. 2. There are so many points of positive things happening in East Hartford. Quesnel Testimony, 6/1/16, p. 123:18-20. 3. Superintendent Quesnel is comfortable with and proud of the direction East Hartford is heading, the work it is doing and the quality of leaders in the district. Quesnel Testimony, 6/1/16, p. 57.
16
4. Superintendent Quesnel agrees with East Hartford High School Principal Matt Ryan that East Hartford is educating more and better educated students than it was 10 years ago. Quesnel Testimony, 6/1/16, p. 159. This can be seen in part by the double-digit gains in SAT scores. Id. 5. East Hartford and the state as a whole are in the midst of new raised expectations; the Common Core State Standards have raised the bar of what career and college ready means and what it stands for. Quesnel Testimony, 6/1/16, p. 131. 6. East Hartford has seen double-digit gains in its SAT scores. Quesnel Testimony, 6/1/16, p. 159. Coupled with increased graduation rates, this is a good sign for the district. Id. 7. East Hartford provides a large, expansive and complex continuum of special education services to its students, and works equally with low and high cost special education students. Quesnel Testimony, 6/1/16, p. 77. 8. East Hartford has not alerted the CSDE about any due process issues regarding special education services. Quesnel Testimony, 6/1/16. 9. In 2013, the Hartford Courant and FOX CT named East Hartford Public Schools the 7th best place to work in the state. Snyder Testimony, 2/17/16, p. 79. 10. An East Hartford principal recently told Superintendent Quesnel that the culture (based on rate of suspensions) at East Hartford Public Schools is the "best [he's] ever seen it" in 36 years in East Hartford schools. Quesnel Testimony, 6/1/16, p. 179:8-18. 11. Superintendent Quesnel is comfortable with the teacher retention rates in East Hartford. Quesnel Testimony, 6/1/16, p. 168. At East Hartford High School, Principal Ryan does not have to hire teachers because they do not leave very often to go teach elsewhere. Ryan Testimony, 3/1/16, pp. 83-4. 12. Total per pupil expenditures have increased in East Hartford every year from 2011-12 to 2014-15. DTX 5641 (East Hartford expenditure profile); Quesnel Testimony, 6/1/16 (Alliance District funding has increased and municipal funding has not decreased while enrollment has stayed the same). 13. East Hartford spends a tremendous amount of money on the municipal side, and should be persuaded by the superintendent and board to reassess its priorities and spend more money on education. Cohn Testimony, 5/25/16, p. 50. It is the responsibility of a superintendent to advocate for resources and lift up the importance of education. Quesnel Testimony, 6/1/16, p. 35. 14. East Hartford does not have a coherent sustainability plan with regard to its Alliance District or Commissioner's Network plans. Cohn Testimony, 5/25/16, pp. 58-60. Instead, it goes from grant to grant. Id.
17
15. Although school turnaround doesn’t happen overnight or even in a year, O'Brien School has seen strong signs of progress in its 2nd year as a Commissioner's Network School. Quesnel Testimony, 6/1/16, pp. 5, 9-10, 16. 16. East Hartford Middle School Principal Anthony Menard is a graduate of the LEAD CT program, which he found to be a transformative process. Cohn Testimony, 5/25/16, p. 155. EHMS also uses the RISE program which provides behavioral support to students in need. Id. 17. O'Brien STEM Academy in East Hartford has seen significant growth as a Commissioner's Network School, including levels of literacy across grade levels, chronic absenteeism rates, and parental engagement. Quesnel Testimony, 6/1/16, p. 16. The CN Plan at O'Brien is a classic example of a really incredible plan because it is based on the organic needs of the district, tight metrics around what success means, and funding to back it up. Id., 1/19/16, pp. 33:17-34:4. 18. O'Brien School has done a great job of responding to the needs of the community; the school has a parent center and a food pantry. Cohn Testimony, 5/25/16, p. 46. East Hartford has also secured a $750,000 grant from The Hartford Foundation for Public Giving to support efforts around family and community engagement, including developing a teaching and learning center and launching an office of family and community partnership. Quesnel Testimony, 1/19/16, pp. 19-20. The district will use the Harvard School of Education's family engagement model and dual capacity building framework to help district leaders and teachers develop the necessary skills, abilities, and mindset to more effectively engage in work with families, with the special focus on culturally responsive practices. Id., 20. Superintendent Quesnel believes the plan will have a long-lasting impact on the East Hartford community. Id., 21. 19. The Commissioner's Network is a tremendous opportunity and is showing positive results at both O'Brien and East Hartford Middle School. Quesnel Testimony, 6/1/16, pp. 10:26-11:1, 16:7-18. East Hartford has been able to do some really amazing things at its Commissioner's Network schools. Id., 1/19/16, p. 34:5-7. 20. Despite these successes at O'Brien and East Hartford Middle School, East Hartford has not applied for more Commissioner's Network schools, although it is eligible for up to 5. Quesnel Testimony, 6/1/16; Cohn Testimony, 5/25/16, p. 164. Conversely, Bridgeport has 4 Commissioner's Network schools, and is applying for another, and New Haven has 3 Commissioner's Network schools. DTX 6226, p. 6; Rabinowitz Testimony, 6/2/16. 21. Tracking students is not effective at closing achievement gaps and in fact can lead to widening of gaps between white and black students. Wentzell Testimony, 5/5/16, pp. 136-7, 157-9; see 5/31 Findings of Fact # 179 (Danbury has seen positive results since it stopped tracking 5 years ago). Despite this, Superintendent Quesnel has been reluctant to detrack students in East Hartford. Id. 22. The state's CK3LI is a great program and has had a tremendous impact in East Hartford, and has changed the approach to reading across the district. Quesnel Testimony, 6/1/16, p. 104. East Hartford is using CK3LI strategies across the district and it has changed the district's
18
approach towards reading. Id. East Hartford piloted the program at Norris School and Langford School. In part due to improvements resulting from the CK3LI program, Norris School just exited turnaround status. Cohn Testimony, 5/24/16, p. 81. 23. East Hartford's new early childhood center was built along a bus line to help increase access for students. Quesnel Testimony, 6/1/16. 24. Every district in Connecticut deserves to be led by a highly competent leader. Quesnel Testimony, 6/1/16, p. 118. Without leadership, none of the schools in East Hartford or in the state would grow. Id.; see also Quesnel Testimony, 1/14/16, p. 110 ("we know that having a committed, dedicated family member in a child's life is one of the most impactful things that children have. We know having a stable, consistent high-quality teacher in a child's life is one of those things. And we know, third, that the power of leadership at the school level, the impact it can have on children's lives."). 25. The local district controls graduation rates; it is an internal measure. Quesnel Testimony, 6/1/16, p. 128. 26. A good thing about the Next Generation Accountability System is that it is focused on achievement and growth between years. Quesnel Testimony, 6/1/16, p. 133. 27. East Hartford's International Baccalaureate Academy High School was ranked as the best magnet high school in Connecticut and the 11th best in the nation this year. Quesnel Testimony, 6/1/16, p. 144. 28. East Hartford is developing social and emotional standards in the same way as they have adopted new academic standards aligned with the Common Core State Standards. Quesnel Testimony, 6/1/16, p. 151. 29. East Hartford is making progress toward its goals in both math and reading on the STAR assessment across all grades. Quesnel Testimony, 6/1/16; DTX 6479 (East Hartford Public Schools Memo re 135 Day Report 4/1/16), p. 1 (showing growth in STAR reading and math scores from fall to winter 2015-16). 30. East Hartford also increased the usage of academic interventions from 2015 to 2016. DTX 6479, p. 2. 31. From 2015 to 2016, East Hartford also saw a 25% decrease district-wide in students chronically absent, including a 39% decrease in elementary students chronically absent. DTX 6479, p. 2. 32. From 2015 to 2016, East Hartford also saw a steady decline in in- and out-of-school suspensions across the district. DTX 6479, p. 3.
19
33. With respect to the metrics in DTX 6479, these improvements (such as reductions in suspensions and chronic absenteeism) are helping East Hartford graduate students who are more college and career ready. Quesnel Testimony, 6/1/16, pp. 158-9. 34. East Hartford outpaced the state average in growth on both the CMT and CAPT from 2009-10 to 2012-13 for all students and high needs students. Defs' Demonstratives 8 and 9. 35. In 2014-15, East Hartford's average class sizes for each of grades K-6 were below the state average. Defs' Demonstrative 10. 36. In 2012-13, East Hartford teacher salaries were higher than the state average for general education and special education teachers. Defs' Demonstrative 16. For general education teachers, East Hartford's salaries were higher than nearby districts like Hartford, Manchester and Windsor. PTX 420. East Hartford's superintendent salary was also above the state average in that year. Defs' Demonstrative 16. 37. New teacher salaries in East Hartford are in the top third of all Hartford County districts. Quesnel Testimony, 6/1/16, p. 183. 38. The East Hartford school budget is not currently in the red. Quesnel Testimony, 6/1/16, p. 173. 39. East Hartford uses Alliance funding to hire behavior managers as well as attendance officers at East Hartford High School, East Hartford Middle School, and Synergy. Quesnel Testimony, 1/19/16, pp. 21-2. An attendance task force consisting of representatives from each school meets monthly to share strategies. Id., 22. Alliance funding is also used to fund the STEP program at the high school, a transition program for students in high school who are experiencing significant personal challenges. Id., 22-3. Alliance funding is also used for professional development, teacher evaluation, embedded literacy and math coaching, SRBI, prek-3 literacy (Smart Start classrooms and Fundations), a chief turnaround officer, and an IB pipeline. DTX 6114 (East Hartford Year 4 Alliance District Summary). See Cohn Testimony, 5/25/16, p. 151 (IB pipeline is "one of the gems" of East Hartford). 40. East Hartford developed a partnership with Asnuntuck Community College, Manchester Community College and Goodwin College to work with students at Synergy who are able to enroll in college-level courses and engage in field experiences. Quesnel Testimony, 1/19/16, pp. 24-5. At Synergy, students focus on a career-readiness component called the Above and Beyond Program. Id., 24-5. 41. As a result of the Alliance District program where funding and accountability and a tight plan have come together, East Hartford has begun to see results. Quesnel Testimony, 1/19/16, p. 26. For example, the district has seen growth in internal assessments on a year to year basis, on all the metrics that the district uses, including increases in reading and math scores. Id., 26-7. 42. East Hartford extended the school day at O'Connell School by 300 hours using Alliance funding. Quesnel Testimony, 1/19/16, p. 29. The school also has an international baccalaureate
20
curriculum, which is a very rigorous, challenging curriculum. Id., 30-1. Students are provided intervention so that they can succeed in this curriculum. Id., 31. The school also added new teachers who are "incredible." Id., 32. In the first year after integrating students from other neighborhoods into O'Connell School, which raised the free and reduced price lunch student enrollment, things were as good or better, with math scores increasing by over 5%. Id., 31-2. 43. In 2014, East Hartford received a technology grant of $337,414 to purchase 480 iPad 2's and 16 carts. Quesnel Testimony, 1/19/16, p. 62. 44. At East Hartford High School (EHHS), Alliance District funding was used to hire two additional social workers, a remedial reading teacher, behavior managers, and attendance officers. Ryan Testimony, 3/1/16, pp. 72-4. EHHS also has two EL bilingual tutors, a psychologist, 4 social workers, and employs the co-teaching model. Id., 76. EHHS also has about 45 student clubs, including a Future Teachers Club. Id., 88, 115. It also has a teacher leadership academy for leadership professional development. Id., 77. EHHS has had professional development in reading training, reading strategies, chronic absenteeism workshops, PBIS training, Next Generation Science Standards training, Common Core training, STAR reading and math training, and teacher evaluation training. Id., 82. Also, SRBI is being implemented at EHHS, supported by the Alliance grant. Id., 80. Students in math intervention at EHHS are on track to exceed their projected growth rate, and are no longer in the intervention. Id. 45. In 2014, EHHS Principal Matt Ryan was named Principal of the Year by CAS (a CCJEF member). DTX 6068. In 2011, CAS named EHHS Assistant Principal Michelle Marion Assistant Principal of the Year. Ryan Testimony, 3/1/16, p. 84. 46. EHHS has a structure in place with a dedicated team in 9th and 10th grade for gifted and talented students, some of whom feed into honors and AP classes. Ryan Testimony, 3/1/16, pp. 89-90. EHHS also offers at least 15 AP classes. Id., 94. 47. EHHS has a special education inclusion program called REALITIES, which focuses on academic skills, community participation, vocational training, and independent living skills. Ryan Testimony, 3/1/16, pp. 92-3. 48. EHHS has a program called Team Aspire for EL students, with the goal of moving students out of the need for EL assistance and helping to develop their life skills and encourage community involvement. Ryan Testimony, 3/1/16, pp. 94-5. 49. EHHS has a Jobs for America's Graduates (JAG) program, which is an elective credit course teaching professional skills and offering individual mentoring and counseling to students. Ryan Testimony, 3/1/16, p. 93. A senior at EHHS won second place in an employability contest at the JAG National Student Leadership Academy in Washington, D.C. Id. 50. Governor Malloy has worked hard to make sure that school districts and ED reform cities have the resources they need to make the changes they need to make. Quesnel Tr., 6/1/16, pp. 143:10-144:2, 159:1-13.
21
51. Data results in the 135th Day Report for SY 2015-16 indicate a decrease in disciplinary actions and in- and out-of-school suspensions across the district, increased attendance, and continuing gains in academic achievement. DTX 6479, p. 3. 52. In 2014-15, four schools in East Hartford, in one subject or another, reflect high needs students who are outperforming the state average of high needs students.
D. New Britain
*See Defs' Findings of Fact Per 5/9/16 Order (Doc. # 326) ## 61, 68-72, 92, 160, 170, 172. 1. There have been a number of positive developments in the New Britain school district over the last three years. Gay Testimony, 2/23/16, p. 96; see also Cohn Testimony, 5/26/16, p. 12 ("I'm hopeful, more than I've been in the past, about the direction New Britain is taking. I like what I'm hearing."). For example, New Britain partnered with community organizations to run a successful program to reduce summer learning loss. Id. Reading scores on the NWEA in New Britain have shown progress. Id., 97. The town issued bonds to buy new textbooks and put SMART boards in every classroom. Id. The district used Alliance and Commissioner's Network funds to add assistant principals in schools that did not have them, which has helped them to better supervise and evaluate teachers. Id. Gaffney School has been completely rebuilt with 80% state funding into what is now a beautiful effectively new facility. Id. 2. Chronic absenteeism has decreased significantly in New Britain. For example, chronic absenteeism in kindergarten in New Britain dropped from 30% in 2011-12 to 13.4% in 2013-14. Salina Testimony, 1/13/16, pp. 49:23-27. The rate decreased for elementary schools as well, including from 19% in 2014-15 to 10-12% as of January 2016 at Lincoln Elementary School. Id., p. 50:1-4; Cabral Testimony, 1/13/16, pp. 156-7. Decreases in chronic absence and corresponding increases in time in class for instruction are correlated with better performance in school. Frassinelli Testimony, 5/6/16; Salina Testimony, 1/13/16, p. 50 ("it is a good thing that they have had success in getting more of the students in the classroom"). See also DTX 6422-24 and Defs' Demonstrative 12 (decreases in chronic absence in focus districts, all outpacing the state average). 3. New Britain's graduation rate has increased from 55% in 2011 to 69% in 2015, due in part to New Britain's reinstituting some courses at the high school, such as technology education, consumer classes and fine arts classes, which have helped draw students and maintain their interest in school. Salina Testimony, 1/13/16, pp. 31:5-32:8. 4. New Britain's average class sizes in 2014-15 were comparable to the state averages for grades K-8. Defs' Demonstrative 10 (showing that for grades K-8 in the aggregate New Britain's average class size was 20.2 while the state average was 20.4). 5. Efforts to reduce class sizes at the elementary level over the past three years have worked. Salina Testimony, 1/13/16, p. 52. The 2015-16 class sizes are very good compared to previous years. Id.
22
6. New Britain's transition back to neighborhood schools in 2012-13 led to positive results, such as greater involvement of parents with schools, greater communication between schools and parents, and savings on transportation costs. Salina Testimony, 1/13/16, pp. 36:22-37. 7. Using Alliance funding, New Britain has a transition plan from 8th to 9th grade to place students immediately based on strengths and weaknesses to improve instructional practices. Cohn Testimony, 5/26/16, p. 7. 8. New Britain has several schools that have received SIG funding: 1003g schools are Slade Middle School and Pulaski Middle School; 1003a schools are Smalley Academy, Northend, Smith, Slade and Pulaski. DTX 6226, pp. 10-12. At Pulaski and Slade, there have been significant reductions in absenteeism and in- and out-of-school suspensions. Cohn Testimony, 5/26/16, p. 12. There has also been significant improvement in most classrooms in terms of the impact of coaching. Id., 13. 9. In 2013-14, New Britain received $9.3M in bonding from the city to buy new textbooks and technology for every classroom, including a language arts series for all grades K-8, including hard cover textbooks, soft cover reading books, and writing journals. Salina Testimony, 1/13/16, p. 37. New Britain also purchased Chromebook mobile labs with a set of laptops for every four classrooms. Id., 38. 10. In August 2015, New Britain purchased four Chromebook carts for Slade Middle School to provide teachers with necessary technology to meet the needs of students. Salina Testimony, 1/13/16, p. 38. In October 2015, two additional Chromebook carts were purchased for New Britain's Satellite Careers Academy and an additional Chromebook cart with 32 Chromebooks for Pulaski Middle School using state grant funds. Id., 38-9. 11. New Britain had a five-year capital improvement plan for 2008-2013. DTX 6040. All projects in the plan were completed. Salina Testimony, 1/13/16, p. 39. New Britain has the latest in high-tech SMART Boards in every classroom in the district. Salina Testimony, 1/13/16, p. 37. 12. New Britain's NWEA assessment tool, purchased in 2013-14, assists the district in tracking performance and helps teachers work better with students by identifying deficiencies. Salina Testimony, 1/13/16, p. 38. 13. New Britain operates preschool classes that are available to all children in the district on a sliding scale. Salina Testimony, 1/13/16, p. 40. In 2014-15, 81% of kindergarteners in New Britain had received a preschool experience, above the state average of 79%. DTX 6277. New Britain has all-day kindergarten in all of its elementary schools. Salina Testimony, 1/13/16, p. 40. 14. New Britain has an established curriculum for each subject in each grade. Salina Testimony, 1/13/16, p. 40. New Britain teachers teach to the new Common Core State Standards. Locke Testimony, 1/12/16, p. 163.
23
15. New Britain recently started to make greater use of the English Language Development teachers and coaches through an English Language Development program for EL instructors. Salina Testimony, 1/13/16, p. 40:26-41:15. As a result, English Learner students are increasing their English proficiency. Id. For example, when the 1,700 EL students in New Britain were tested in September of 2014, they showed a 75% increase in reading scores over the previous year. Id. 16. Using Alliance District funding, New Britain hired Clark Consulting to revamp its EL program during Ms. Locke's tenure as CAO. Locke Testimony, 1/12/16, p. 173. In 2014-15, all Bilingual, TESOL, general education teachers, and ELD tutors/teachers received 6 ELD training sessions with an outside consultant. DTX 4805 (Title III AER New Britain 2014-15), p. 2. Each teacher additionally received demonstration lessons, co-planning/co-teaching sessions, and coaching with the outside consultant and in-house ELD coaches. Id. The two ELD tutors and 4 language support assistants attended the RESC Alliance professional development sessions: Strategies for Teaching English Learners. Id. Those teachers trained in ELD then go into the classrooms and provide embedded coaching to train other teachers. Saavedra Testimony, 3/1/16, p. 174 (ELD coaching model; coaching is "very effective" and builds capacity). 17. DiLoreto School in New Britain, a Commissioner's Network school, went from being rated the 8th worst school in the state to being recognized in 2014 as a model for dual language programs in CT with credible performances by its students including its ELs. Salina Testimony, 1/13/16, p. 41:16-42:11. See also Cohn Testimony, 5/24/16, p. 77 ("I've been really impressed to see that [DiLoreto School] has an English language development and enrichment program built right into Tier I. So when you go to your English language arts class – and it's a K-8 school – there are automatically strategies built into every single class that address the needs of English learners."). 18. The Commissioner's Network funding for DiLoreto School extended the school day for students and provided for physical upgrades to the building. Salina Testimony, 1/13/16, p. 43. Alex Ortiz, Principal at DiLoreto School, is an incredibly dynamic principal with the traits the CSDE looks for in a turnaround principal. Cohn Testimony, 5/26/16, p. 10. Ortiz has done a tremendous amount with monies that he has been given in the early years of the Commissioner's Network. Id. And he is responsible for having brought the English language arts development and enhancement strategies to New Britain; they started first in DiLoreto, and have spread across the district to other schools including the middle schools. Id. He also has a sustainability plan for DiLoreto School. Id., 11. 19. The culture and climate have improved at DiLoreto School. Cohn Testimony, 5/26/16, p. 11. For example, rates of in- and out-of-school suspensions have declined significantly, in part due to the ALIVE wraparound program at the school. DTX 6427, p. 3. 20. New Britain High School has expressed significant interest in joining the Commissioner's Network. Cohn Testimony, 5/26/16, p. 11.
24
21. Using state and federal funding as well as community partnerships, all schools in New Britain have some form of after school or extended day programs, other than the Satellite Careers Academy and the Alternative Center. Salina Testimony, 1/13/16, pp. 43-4; DTX 4716. 22. In 2015-16, New Britain completed a total renovation of Gaffney Elementary School, adding about 15,000 square feet and additional classrooms. 80% of the total cost of the project was paid by the state. Salina Testimony, 1/13/16, p. 44. As a general rule over recent years, the state has a standing offer to pay 80% of the costs for any major new school construction or renovation project in New Britain. Id., 44-5. 23. New Britain High School's Finance Academy is a partnership between the district and local businesses to serve as a career pathway for students in the area of finance. Salina Testimony, 1/13/16, pp. 45-6. Students have been successful in this program, and the number of students desiring to participate has increased by 102 students in its second year. Id., 46. The Academy also became part of the National Academy Foundation, which will give students a certification that is looked favorably upon by Fortune 500 companies. Id., 47-8. 24. New Britain offers about 15 AP courses in all of the major academic subjects as well as fine arts areas. Salina Testimony, 1/13/16, p. 51. 25. The City of New Britain completed fiscal year 2015 with a surplus of $14.9M. Salina Testimony, 1/13/16, p. 71. New Britain school district is in the process of exploring the possibility of seeking some or all of that surplus to apply to its school budget. Id. 26. New Britain used its 2015-16 Alliance District funding for various initiatives and staffing, including 6 building administrators to support teacher evaluation and development, Clark Consulting to provide professional development for ELD training throughout the district and ELE for two middle schools, 10 kindergarten teachers for extended day, 10 reading interventionists for Tier III, ELD tutors and coaches, 2 district coordinators for SRBI and academics, 6 math teachers, professional development for reading and interventions, 39 ELD teachers, 36 teachers (reading, interventionists, early literacy, language arts and middle school reform ELE), 6 math teachers, and other professional development. DTX 6234 (New Britain 2015-16 Alliance District summary), pp. 1-2; Cohn Testimony, 5/25/16, pp. 182-3. 27. The Read 180 intervention program helps students who are behind grade level and assesses and addresses individual needs through adaptive instructional software, high interest texts, and direct instruction in reading and writing skills. Maselek Testimony, 1/28/16, pp. 178-9. Alliance District funding is being used to train reading interventionists in New Britain on Read 180. Id. 28. In 9 schools to date (including NBHS and Smalley Academy), New Britain has implemented well-managed classroom training (Boys Town model) for all teachers on understanding the social and emotional needs of students through the Safe Schools Healthy Student grant. Maselek Testimony, 1/28/16, p. 185; Frassinelli Testimony 5/6/16, pp. 84-9; Saavedra Testimony, 3/1/16, pp. 177-8). New Britain is "doing great things with well-managed classroom." Saavedra Testimony, 3/1/16, p. 189.
25
29. Data teams at New Britain High School meet twice a week, are a good form of professional development, and help improve student performance. Maselek Testimony, 1/28/16, pp. 188-90. 30. Teachers in New Britain have access to the Bloomboard platform, which provides resources for teachers including books, videos, webinars, and other documents for professional learning. Maselek Testimony, 1/28/16, p. 190. All teachers received a $75 credit to use the website. Id. 31. Common Core curriculum has been implemented at New Britain High School. Maselek Testimony, 1/28/16, p. 190. Teachers received training to assist in this implementation. Id., 190-1. 32. All classrooms at New Britain High School have interactive ENO boards. Maselek Testimony, 1/28/16, pp. 193-4. 33. At Lincoln Elementary School in New Britain, two of the three pre-k classrooms are co-taught classes, where a special education and regular education teacher co-teach special education and regular education students (peer model). Cabral Testimony, 1/13/16, p. 151. These special education students receive their services in-district. Id. This is an ideal model. Id., 152. There are 5 teachers and 4 paraprofessionals for the 3 pre-k classes. Id. 34. The class sizes range from 15 to 20 students at Lincoln Elementary. Cabral Testimony, 1/13/16, pp. 152-3. This is at or below state averages for K-5, which are between 19.1 and 21.4. Defs' Demonstrative 10. 35. Lincoln Elementary is safe, clean and well-maintained. Cabral Testimony, 1/13/16, pp. 175-6. It was renovated extensively ten years ago. Cabral Testimony, 1/14/16, pp. 26-7. Classes at Lincoln Elementary have not been canceled due to heating issues. Cabral Testimony, 1/13/16, p. 155. Classes were only canceled once due to severely cold weather, at a time when many other districts canceled school as well. Id., 153-4. That school day was eventually made up. Id., 155. 36. Lincoln Elementary has full-day kindergarten for all students, funded through the Priority School District grant. Cabral Testimony, 1/13/16, p. 155, 1/14/16, p. 12. It also has wifi and ENO boards in each room, and all teachers have iPads which are used among other things for Power School to keep contact with parents and keep track of student attendance and grades. Id., 159-60. 37. New Britain undertook a kindergarten initiative to make connections with parents on the importance of attendance in early grades. Cabral Testimony, 1/13/16, pp. 155-6. Two attendance monitors were hired in 2012-13 at Lincoln Elementary to focus strictly on kindergarten students, and make home visits. Id., 156. Lincoln Elementary and all other elementary schools in New Britain formed school attendance groups of teachers and social workers. Id. These efforts have been successful in decreasing chronic absenteeism and improving attendance, particularly in kindergarten. Id. For example, Lincoln Elementary has decreased its chronic absenteeism rate from 19% to 10-12%. Id., 157.
26
38. Lincoln Elementary provides an adequate learning environment for students to be successful. Cabral Testimony, 1/13/16, p. 168. 39. At Lincoln Elementary, each grade level made an average of one year's growth or more on the Spring 2015 NWEA assessment. Cabral Testimony, 1/13/16, p. 171; DTX 6044 (Campus Improvement Plan), p. 3. 40. With Title I federal funding, Lincoln Elementary received three literacy interventionists at a cost of $24,990 for 392 hours of tutoring from January 3rd to June 1, 2013, as well as $2,500 for the chronic absentee intervention and $4,500 to purchase intervention materials (individualized reading books) for identified students as well as DRA 2 software (and iPads for all teachers) for student progress monitoring. Cabral Testimony, 1/14/16, pp. 10-12. 41. The assistant principal position that Lincoln Elementary received was paid for with Alliance District funding. Cabral Testimony, 1/14/16, p. 11. Administrative professional development was also funded through the Alliance grant. Id., 12. Lincoln Elementary also received state funding for summer school intervention. Id. 42. At Lincoln Elementary, the IDRIVE teacher evaluation platform causes the teachers to be very reflective practitioners and review their own practice and to work in teams to improve their practices with each other and by learning from each other. It is a very organized platform for the school to provide consistent feedback to the teachers on their performance and using the rubric from the state (SEED) to give teachers specific feedback on areas they can work on and areas that they excel in. Cabral Testimony, 1/13/16, p. 161. 43. Smalley Academy in New Britain was selected as one of only 33 schools of distinction in the nation by College for Every Student in June 2015, as a school with exemplary programs incorporating mentoring, leadership through service, and pathways to college (providing students with college experiences). Saavedra Testimony, 3/1/16, pp. 154-5. 44. Smalley Academy has a school attendance team that meets biweekly to discuss student attendance and chronic absenteeism. Saavedra Testimony, 3/1/16, p. 162. Smalley Academy has seen a 50% reduction in suspensions from when Principal Saavedra started there to present. Id., 179. 45. Smalley Academy has four interventionists and additional reading tutors paid for with SIG funding. Saavedra Testimony, 3/1/16, p. 165. As a result, there has been growth across the board in student achievement in fall 2014 and fall 2015. Id., 165-70; DTX 6090. 46. Classroom teachers at Smalley Academy provide interventions to small groups in their classrooms. Saavedra Testimony, 3/1/16, p. 170. All teachers are trained in providing differentiated instruction and interventions in the classroom. Id., 171. 47. Regarding SRBI and math intervention, New Britain has used the Alliance District grant to fund 2 district coordinators for SRBI and Academics, 6 math teachers (middle school reform)
27
and 6 other math teachers, as well as an intervention team in each building using Power School/Teacher "intervention homepage" to track and record interventions and progress monitor. DTX 6234 (2014-15 New Britain Alliance Plan Summary), pp. 1-2. 48. All new teachers at Smalley Academy have gone through Common Core training for ELA and math, new assessments including NWEA, ELD/ELA, and SRBI interventions. Saavedra Testimony, 3/1/16, p. 175. 49. Smalley Academy has new technology for blended learning that incorporates digital instruction beyond textbook instruction in every classroom. Saavedra Testimony, 3/1/16, p. 175. 50. Using federal funding, Merrill Gay helped organize and run a forum for kindergarten teachers and elementary school administrators about the role of imaginative play in developing executive functioning in kindergarten students, which has had positive feedback and will be expanded. Gay Testimony, 2/23/16, pp. 98-100. 51. From fall 2013 to winter 2014, there was growth in NWEA reading for all grades except 8th grade. Gay Testimony, 2/23/16, p. 101; DTX 6083. For EL students, the percentage of students at or above average increased and often substantially. Id., 102. For NWEA language usage, the percentage of students at or above average increased for all but grade 7, and overall by 3%. Id. Most grades also saw increases for EL students. Id. There was also substantial growth in NWEA scores from fall 2013 to fall 2014. Id., 104; DTX 6084. 52. For every single subject at every single school in New Britain there has been some positive growth shown in the total number of students falling into the average and above average bands from fall 2014 to spring 2015 in NWEA. Gay Testimony, 2/23/16, p. 107; DTX 6085. 53. New Britain outpaced the state average in growth on the CMT from 2009-10 to 2012-13 for all students and high needs students. Defs' Demonstrative 8. 54. In 2012-13, salaries for general education teachers, special education teachers, principals and the superintendent were higher than the state average. PTX 420; Defs' Demonstrative 16. 55. The salaries for general education teachers in New Britain that year were $4,000-$15,000 greater than each of the adjoining towns. PTX 420. 56. Per pupil spending in New Britain has increased every year from 2011-12 to 2014-15 (last available year of data). DTX 5643 (New Britain expenditure profile). Of that spending, 62% comes from the state, 31% from the municipality and 7% from the federal government. Id. 57. On a per pupil basis, New Britain receives the fifth highest amount of ECS funding of all the districts in the state. Salina Testimony, 1/13/16, p. 60. 58. In 2014-15, six schools in New Britain, in one subject or another, include high needs students who are outperforming the state average of high needs students. DTX 6215, p. 3.
28
New London
*See Defs' Findings of Fact Per 5/9/16 Order (Doc. # 326) ## 4-9, 43, 52-7, 72, 78, 92, 166-8. 1. During and after state supervision (2012-15), significant progress has been made in New London in terms of board governance as well as academic and non-academic indicators. See PTX 630, p. 8-15; PTX 885, pp. 6-14; Defs' Findings of Fact Per 5/9/16 Order ## 52-7, 166-8 (showing positive academic outcomes in New London); Villanova Tr. 5/13/16, pp. 41:17-27, 42:1-9 ("relationships between the board and the superintendent [in New London] improved and the personnel and structural changes to help improve the connection between the board and superintendent, my impression is from 2012 through now, they've improved the collaborative connection between the board and superintendent). 2. There have been steady increases in reading and math standardized test scores from fall 2014 to fall 2015 at New London High School (NLHS); steady increases in daily attendance from 2011-12 to 2014-15 at NLHS; decreases in out of school suspensions from 2012-13 to 2014-15 at NLHS; and steady increases in graduation rates from 2011-12 to 2013-14 at NLHS. DTX 5358 (NLHS exiting turnaround status), p. 18. According to NLHS Principal Tommy Thompson, this shows that "the trajectory at NLHS is exactly where it should be and that's up." Id., 31:6-18. 3. In 2012, New London High School increased its CAPT scores by 33.3% in reading and 15.6% in math. DTX 6081 (NLHS 5 Year Progress Report), p. 28. It also met its goal of increasing every subgroup and nearly eliminated the achievement gap in reading between white and black students with both groups earning about 82% proficiency or above. Id. 4. New London High School was awarded a bronze medal as part of the US News & World Report's 2014 Best High Schools rankings for its subgroups outperforming their peers in the state based on CAPT and SAT scores as well as AP course participation from 2010 to 2014. Thompson Testimony, 2/18/16, pp. 7:13-. 5. New London outpaced the state average in growth on the CMT for all students and high needs student and CAPT for all students from 2009-10 to 2012-13. Defs' Demonstratives 8 and 9. 6. In 2014-15, 3rd graders at Jennings Elementary School grew at a faster rate than the National Expected Growth and at a faster rate than students at the other two elementary schools in math on the NWEA universal screener. DTX 4808 (Title III AER 2014-15), p. 2. 7. In 2014-15, English Learners in grades 4-7 exceeded the expected growth target in Math on the NWEA, with grade 7 English Learners exceeding by almost double the expected growth norm. DTX 4744 (Bilingual Grant AER 2014-15), p. 1. 8. In 2014-15, the seventh grade ELs scored 15% higher in the proficiency and advanced ranges than in the previous year as 6th graders on the LAS Links test. DTX 4744 (Bilingual Grant AER 2014-15), p. 2.
29
9. New London's graduation rate in 2014 was 72%, the highest it has been in the last 8-9 years. Thompson Testimony, 2/22/16, p. 3. This was attributable to additional supports for students. Id. For example, based on results such as progress in attendance and decreases in out-of-school suspensions, the SRBI model is working in New London. Id., 59. 10. The number of English Learners who graduated in 4 years increased 10% from 2012 to 2014. DTX 4808 (Title III AER 2014-15), p. 2. 11. According to Principal Thompson, through the hard work of students and through caring adults NLHS positions its students well for the future. Thompson Testimony, 2/18/16, p. 32. Moreover, in New London, "we know we are changing and saving lives. Transformation does not come easy, but we personalize what we do. We set high expectations. We hold ourselves accountable. We lead and focus on excellent teaching." Id. 12. Transformational change will take time, but with continued support NLHS expects to see growth each year moving forward. Thompson Testimony, 2/18/16, pp. 31:19-32:3. 13. Since 2011, NLHS has utilized in various ways both the 1003a and 1003g School Improvement Grant (SIG) funding. See DTX 5358, pp. 3-4; DTX 6226, pp. 10-12. For example, using its SIG 1003a funding, NLHS has trained teachers "to aid in building capacity of coordinators in each content area who will then be able to replicate the training for all teachers…. And this helps build sustainability." Thompson Testimony, 2/18/16, p. 55. Some of the positions at NLHS that were funded through the SIG grant will be integrated into the Alliance District plan such as the motivational officer, afterschool program coordinator, credit recovery facilitator, and behavior support personnel. Thompson Testimony, 2/18/16, p. 57. 14. Based on results such as progress in attendance and decrease in out-of-school suspensions, as well as stories of students connecting with adults, the SRBI model is working in New London. Thompson Testimony, 2/18/16, pp. 59:3-60:14. 15. Through the State Personnel Development Grant (SPDG), training in SRBI by SERC for teachers and administrators at NLHS has helped build the capacity of administrators and teachers. Thompson Testimony, 2/18/16, pp. 60-1. School personnel have also received training in PBIS, as well as in trauma informed schooling through the Project Prevent Grant, which is aimed at expanding staff's understanding of the impact of trauma on student learning and behavior. Id., 61-2; DTX 6235 p. 1 (New London is using its Alliance District grant to fully implement PBIS in 2015-16). 16. NLHS employs various cost-neutral methods of improving student behavior, attendance and performance, such as formal advisory periods, where every student meets for about 20 minutes a day with a designated staff member, having adults in hallways during every transition in the school day, positive reinforcements and "shout-outs." Thompson Testimony, 2/18/16, pp. 63:-64. These efforts, which do not cost money, have helped improve student behavior and decrease out –of-school suspensions. Id., 64.
30
17. According to Principal Thompson, NHLS "has raised its expectations for students and staff not through test prep but through a steady diet of reading, writing, debate and discussion. We knew if we focused on the right things that good things would happen." Thompson Testimony, 2/18/16, p. 68. 18. According to Principal Thompson, NLHS has "turned a corner" with help from its teachers, students and community members that are in the school each day, and he didn’t need a test score to tell him that. Thompson Testimony, 2/18/16, p. 68. 19. Regarding any facilities issues asserted by plaintiffs; see Plaintiffs' Findings of Fact #256; NLHS has not had to close school and students have always been able to receive instruction. Thompson Testimony, 2/18/16, p. 69. 20. The city of New London, not the state, ultimately makes decisions on which facilities issues to address. Thompson Testimony, 2/18/16, pp. 69-70. In the past, there was a constant battle between the local school board and city over school funding, with little to no support at the city level for the school budget. Id. This has changed in the past few years, following state supervision in New London (2012-15). Id. Currently, the city is making the decisions regarding what needs to be repaired now versus what can wait until the new high school is built in 2020. Id., 77. 21. In December 2015, NLHS requested $845,000 from the state which had been set aside for NLHS for renovations and improvements. Thompson Testimony, 2/18/16, p. 71; DTX 6289, summary tab*. 22. In 2014, New London voters approved an additional $168M for construction of two new high school campuses. Thompson Testimony, 2/18/16, pp. 72-3. In June 2015, the General Assembly approved the school construction bonding package. Id. An architect was selected for this project by the Architects Selection Committee. Id. 23. After the new school is built, all facilities issues, including any heating issues or ADA compliance issues, will be remedied. Thompson Testimony, 2/18/16, p. 78. 24. Principal Thompson has partnered with LEAD CT to promote leadership in the bilingual department by mentoring a New London teacher. Thompson Testimony, 2/18/16, p. 80. 25. Beginning in 2014-15, consultants from SCSU have been providing professional development on EL instruction to NLHS teachers. Thompson Testimony, 2/18/16, p. 80. NLHS is training more teachers in EL instructional strategies this year (2015-16). Id., 81. Ultimately, NLHS plans to have all staff trained in EL instruction. Id. 26. New London High School is in compliance with the IDEA. Thompson Testimony, 2/18/16, p. 81. 27. New London has reduced the growth and number of special education outplacements, resulting in savings in tuition and transportation, in part through the High Roads program.
31
Thompson Testimony, 2/18/16, pp. 82-3. See also Defs' Findings of Fact per 5/9/16 Order ## 4-9 (progress in special education in New London during Dr. Carver's tenure). 28. In partnership with LEARN (a local RESC) and using Alliance District funding, New London is training special education teachers on implementing IEPs aligned to the Common Core State Standards. Thompson Testimony, 2/18/16, p. 82; DTX 6235, p. 1 (New London Year 4 Alliance District Plan Summary- training on Exemplary IEPs and 504s). 29. The self-contained special education classrooms at New London High School range from 12:1 to 18:1 student to staff ratio. Thompson Testimony, 2/18/16, p. 82. 30. New London High School has a transitional coordinator and job coaches paid with Alliance District funding who help special needs students transition to the world of work by helping find employment for students and monitoring them on the job site. Thompson Testimony, 2/18/16, pp. 85-6. 31. Using Alliance District funding, NLHS also works with Higher Edge to assist with college applications. Thompson Testimony, 2/18/16, p. 87. 32. NLHS has an afterschool program, early college opportunity program, AP courses, adult education programs, and a central office welcome center. Thompson Testimony, 2/18/16, pp. 88-90. 33. Harbor School and Friendship School provide preschool opportunities to New London children. Thompson Testimony, 2/18/16, pp. 90-1. See Carver Testimony, 2/4/16, p. 63 ("We did have a couple of programs in New London that we were utilizing to help with our preschool population…it did have some impact."). 34. All freshmen, sophomores, and juniors at NLHS have individual Chromebooks, paid for through a state technology grant. Thompson Testimony, 2/18/16, pp. 93-4; DTX 4716; DTX 6236. 35. At NLHS, all teachers have access to whiteboards, and there are also SMART boards in some classrooms. Thompson Testimony, 2/18/16, p. 95. 36. The library media center at NLHS used information from MAP and Achieve 3000 to source and purchase materials at various reading levels for students. As of 2013, all media resources requested were approved and purchased. Thompson Testimony, 2/18/16, pp. 96-7. 37. NLHS has wifi and computer labs, and the district recently received new software, video desk phones, and an Office 365 rollout. Thompson Testimony, 2/18/16, p. 97. NLHS also has a technology person housed in the building to ensure technology issues are addressed in a timely manner. Id. 38. NLHS has not received any union grievances for lack of facilities, training, or support. Thompson Testimony, 2/18/16, pp. 97-8.
32
39. New London teachers will receive 9% salary increases over the next 3 years under the new collective bargaining agreement. Thompson Testimony, 2/18/16, pp. 99-100. 40. Dr. Carver left New London in May 2012, and is not aware of the reforms instituted in New London since that time, nor is she aware of the current status of technology, professional development, academic achievement, or any other specifics of the district. Carver Testimony, 2/4/16, pp. 64-6, 77, 80, 82. Nor was Dr. Carver in New London during the tenure of Special Master Adamowski. Id., p. 64. 41. The truancy review board in New London has had significant success at reducing chronic absenteeism. Carver Testimony, 2/4/16, pp. 74-5. 42. Total per pupil funding in New London increased during Dr. Carver's tenure there, and has continued to increase overall since her departure. Carver Testimony, 2/4/16, p. 68; DTX 5644 (New London expenditure profile) (showing increase in per pupil expenditures in New London in the last two years and from 2008-9 to 2014-15). 43. During Dr. Carver's tenure in New London, the percentage of students reaching proficiency on standardized tests in the areas of reading, writing, and mathematics in most grade levels, including the middle school, increased. Carver Testimony, 2/4/16, p. 68. 44. During Dr. Carver's tenure in New London, the district expanded opportunities for AP, college credit, and early college experience (ECE) courses. Carver Testimony, 2/4/16, pp. 70-1. 45. During Dr. Carver's tenure in New London, the district significantly reduced out-of-school suspensions and disciplinary referrals. Carver Testimony, 2/4/16, pp. 72-3. NLHS has a credit recovery program that uses Apex Learning, which is a web-based digital curriculum aligned to CCSS. Thompson Testimony, 2/18/16, pp. 66-7. NLHS has found success in using a certified English teacher who has provided blended learning, which is some traditional instruction combined with online learning, that has yielded good results. Id., 67.
E. Windham *See Defs' Findings of Fact Per 5/9/16 Order (Doc. # 326) ## 47-51, 72, 79, 92, 169. 1. Between 2014-15 and 2015-16 (as of Oct. 2015), there was a 17% increase in Windham in the number of courses offered for college credit, a 2.5% decline in student absences, an 8% increase in the graduation rate, a 16% increase in students scoring 3 or better on AP exams, and a 9.8% increase for students reading at grade level under the NWEA test. Garcia Testimony, 3/4/16, pp. 88-9; DTX 6095, p. 4. 2. During and after state supervision (2011-14), significant progress has been made in Windham in terms of board governance as well as academic and non-academic indicators. See PTX 317, pp. 6-13; PTX 626, pp. 8-15; Defs' Findings of Fact Per 5/9/16 Order ## 47-51, 169 (showing positive academic outcomes in Windham); Villanova Tr. 5/11/16, p. 55:11-14 ("The
33
foundation that the Special Master put in place aligned with the reform effort are the areas that [Dr. Garcia] is driving now"); Villanova Tr 5/11/16, p. 56:16-27, 57:1-14, Villanova Tr. 5/13/16, pp. 40:15-27, 41:1-12 ("There is now appropriate professional relations among the governance structure in Windham which allows the superintendent to focus on district goals, academic, talent development, changing operational procedures, and having a better culture and climate for student performance as opposed to only the politics of getting the budget passed," and "Compared to 2010 when I was [in Windham], the board of education and superintendent are collaborating around governance in a much more effective way"). 3. Per pupil expenditures in Windham are well above the state average, and have steadily increased since 2011-12. DTX 5648 (Windham expenditure profile). 4. Windham outpaced the state average in growth on the CMT from 2009-10 to 2012-13 for all students and high needs students. Defs' Demonstrative 8. 5. Windham's average class sizes in 2014-15 were comparable to the state averages for grades K-8. Defs' Demonstrative 10 (showing that for grades K-8 in the aggregate Windham's average class size was 19.0 while the state average was 20.4). 6. Windham is making gains in regard to providing a high-quality education to its students within currently available resources. Garcia Testimony, 3/4/16, pp. 69:9-12, 107:2-8. 7. Using Alliance District funding, Windham has expanded the use of the CK3LI model across the district in grades K-3 (serving 1,159 students), which has helped create dramatic improvement for K-3 students in DIBELS reading scores and the Riverside Interim Assessment in ELA. Garcia Testimony, 3/4/16, pp. 72-8; Cohn Testimony, 5/24/16, pp. 17-27, 5/25/16, p. 171:7-9; DTX 6474 (Narrowing the Achievement Gap). 8. Small learning communities in Windham schools provide opportunity for collaboration and building relationships, and have been funded through the Alliance District and Commissioner's Network grants. Garcia Testimony, 3/4/16, p. 34. They also provide for small class sizes; for example, average class sizes at Windham Middle School are 18. Garcia Testimony, 3/4/16, p. 83. 9. Windham is receiving $700,000 annually as part of its transition following state supervision. Garcia Testimony, 3/4/16, pp. 35-6. The first $700,000 was received around June 30, 2015, and was used for summer schools, textbooks, AP resources, science resources and professional development for teachers. Id., 36. The second $700,000 is expected by June 2016, and will be used for summer school, outdoor camp for students, and training for teachers and principals. Id. 10. Using their 2015-16 Alliance District grant, Windham hired 5 full-time EL teachers. Garcia Testimony, 3/4/16, p. 38. Other than the EL teachers, Windham has hired about 40 teachers. Id. Windham has a clear sustainability plan in its Alliance and Commissioner's Network plans, and is bringing administrators up to speed on teacher evaluation. Cohn Testimony, 5/25/16, p. 170. It also has a robust plan for minority teacher recruitment. Id.
34
Windham has also taken on the cost of some of the CK3LI coaches to build sustainability. Id., 181. 11. Windham's 2015-16 Alliance District Plan also provides funding for 12 literacy specialists, 5 full-time ELA and math coaches, a half-time kindergarten to 3rd grade literacy coach, a full-time special education instructional specialist, a full-time instructional specialist at Windham Middle School, an early college opportunity math teacher, 9 part-time kindergarten teachers, an almost-full-time preschool special education teacher. Garcia Testimony, 3/4/16, pp. 38-9. 12. Windham's Companeros program, providing a dual language program to roughly 300 EL students from pre-k to 8th grade, has been very successful. Garcia Testimony, 3/4/16, pp. 41:8-42:1. 13. Windham will be redesigning the district's bilingual program. Garcia Testimony, 3/4/16, p. 46. 14. Windham's EL staff participates in extensive professional development. DTX 6339 (Windham Title III AER 2014-15), p. 3. 15. Windham recently received approval to participate in a pilot program for bilingual second language students to develop a comprehensive program to help 15 new arrivals in grades 6-12 build their literacy skills in English and their native language. Garcia Testimony, 3/4/16, p. 45. The grant provides Windham with $200,000 in each of the 2 years of the grant. Id., 45-6. Windham already has access to these funds. Id. 16. School culture and climate in Windham has been improving over the last two years. Garcia Testimony, 3/4/16, pp. 47:1-3, 69. Attendance has improved, the dropout rate has diminished, and the number of discipline issues has decreased. Id. In particular, Windham Middle School has seen a dramatic decline in discipline referrals since joining the Commissioner's Network. Id., 48:1-5, 84:4-14. Windham's PBIS system has also benefited students. Id., 48:9-15. 17. During Dr. Garcia's tenure, Windham has fulfilled students' IEPs. Garcia Testimony, 3/4/16, p. 53. There have been no governmental findings of violations with regard to special education services in Windham during that time. Id., 54. 18. Special education students at Windham Middle School have support in both the mainstream and resource classes with special education teachers, tutors, and paraprofessionals. Garcia Testimony, 3/4/16, p. 55. 19. Preschool is available for all Windham children on a sliding scale. Garcia Testimony, 3/4/16, p. 55. In 2014-15, 78% of kindergarteners in Windham had received a preschool experience, comparable to the state average of 79%. DTX 6277. As of the 2015-16 school year, Windham added two preschool classrooms at Barrows STEM School for a total of 36 preschool students. Id. The Kramer School also has 8 preschool classes for a total of about 250 students.
35
Id., 55-6. Windham also has about 295 preschool development grant spaces for 3 and 4 year olds funded by state and federal preschool grants. Id., 56. The Windham Early Childhood Program achieved NAEYC accreditation in 2014-15. Id. Once the high school gets renovated, Windham will add more preschool classrooms. Id. 20. Two of Windham's principals (North Windham and Natchaug schools) have participated in LEAD CT. Garcia Testimony, 3/4/16, p. 59. This program has benefited them in regard to knowledge of instructional practices. Id., 60. The principals have shared their new-found knowledge with other principals in Windham. Id. 21. In 2015-16, Windham received more than $2.6M in Alliance District grant funds, over $1M in Priority School District (PSD) grant funds, $61,072 in PSD extended school hours funds, and $67,473 in PSD summer school grant funds. Garcia Testimony, 3/4/16, pp. 61-2. Windham also carried over about $100,000 in Alliance District funds from 2014-15 to 2015-16. Id., 62. Windham High School also received a school improvement grant from 2011-14 in the amount of $800,000 per year. DTX 6226, p. 10. 22. Windham has after school enrichment programs which include additional music and arts programs, debate and cooking. Garcia Testimony, 3/4/16, p. 64. Windham also offers K-3 summer school programs in reading and math. Id. In 2015-16, Windham also instituted the algebra readiness camp to prepare students to take algebra in 8th grade. Id. 23. Windham's early college opportunity (ECO) program permits high school students to graduate with an associate's degree in 4, 5 or 6 years, for no additional cost to students. Garcia Testimony, 3/4/16, pp. 64-5. The students are then able to enter the workforce in manufacturing. Id., 65. Windham is working with Electric Boat, QVCC and Squab Industry for this program. Id. Electric Boat donated 40 laptops to Windham High School for the program. Id. Windham used Alliance District funding to staff the program. See DTX 6232 (ECO math coach). 24. Windham has in place guidelines to implement a gifted and talented program for 2017-18. Garcia Testimony, 3/4/16, p. 67. 25. Windham received 40-50 SMART boards in 2014-15. Garcia Testimony, 3/4/16, pp. 67-8. Windham also has a student technology club where several students have received recognition and awards. Garcia Testimony, 3/4/16, p. 68. 26. Teacher turnover has decreased in Windham. Garcia Testimony, 3/4/16, p. 69:17-20. 27. Windham has seen more of a commitment from the community and parents. Garcia Testimony, 3/4/16, p. 69:21-26. 28. Windham Middle School, a Commissioner's Network school, has improved in preparing students for high school based in part on the additional learning time and after-school enrichment programs. Garcia Testimony, 3/4/16, p. 70:3-7; Cohn Testimony, 5/25/16, p. 173. 29. Based on ELA and math benchmark assessment results for grades 3-11, Windham students improved considerably from fall to winter in 2015-16. DTX 6094; Garcia Testimony,
36
3/4/16, pp. 70-8. In grades K-2, students saw significant growth in DIBELS early literacy scores from fall to winter 2015-16. DTX 6094; Garcia Testimony, 3/4/16, p. 78. 30. From 2012 to 2015, Windham's graduation rates increased from 70.2% to 81.7%. Garcia Testimony, 3/4/16, pp. 78-9. The graduation rates of Hispanics and special education students have increased as well. Id., 79:8-10. 31. It can take 5-10 years to see results after a structural change occurs in a school district. Garcia Testimony, 3/4/16, p. 80. 32. New language arts and math curricula were implemented in all grades in Windham and are aligned to the Common Core State Standards. Garcia Testimony, 3/4/16, p. 85; DTX 6095. 33. During the 2015-16 school year, 77 SMART boards were installed throughout Windham schools. Garcia Testimony, 3/4/16, p. 85; DTX 6095. 34. Windham anticipates that by the year 2020, each student will have a computing device available to them at school. Garcia Testimony, 3/4/16, p. 85; DTX 6095. 35. Windham High School introduced new courses in 2015-16, many of which align with careers and 21st century technological skills like robotics, bioinformatics, audio visual production, civil engineering, and architecture, that will help put each student on track for graduation and success in college and a career. Garcia Testimony, 3/4/16, p. 86; DTX 6095. 36. Windham High School offers 20 college credit bearing courses from Eastern CT State University and UConn. Garcia Testimony, 3/4/16, p. 86; DTX 6095. 37. Over the summer of 2015, Windham saw dramatic improvements to its school facilities made by custodians and maintenance technicians, including renovations of restrooms and cafeteria space. Garcia Testimony, 3/4/16, pp. 87-8. 38. Windham schools have received significant aid through technology grants to assist with implementation of Common Core State Standards and the computer adaptive SBAC tests, as well as low-performing bond funding since 2014, which have been used for such projects as gymnasium, auditorium and bathroom upgrades, laptops, calculators, software, SMART boards, Lenovo Think Pads, and carts. Garcia Testimony, 3/4/16, pp. 89-92. 39. Windham also received over $1.1M in January 2016 for repairs and maintenance to Windham schools as part of the Alliance District school building grant program. Garcia Testimony, 3/4/16, pp. 92-3; DTX 6065 (Windham Improvement Projects); DTX 6066 (approval of grant); Donaldson Testimony, 2/3/16, pp. 133-7. Improvements include improvements to school security, school kitchens, districtwide IT reliability, parking and school maintenance storage, student laboratories, student communications, student playgrounds and the districtwide server room. Id., 93.
37
40. Windham's school budget passed the referendum on the first try in 2015-16, in part because the superintendent was very visible in the community. Garcia Testimony, 3/4/16, p. 94. At the end of fiscal year 2016, Windham schools expected to have a surplus between $25,000 and $30,000. Garcia Testimony, 3/4/16, pp. 94-5. 41. Some districts have enrolled their employees in the state health plan and saved a significant amount of money. Garcia Testimony, 3/4/16, p. 95. Windham has looked into this option. Id. 42. The United Way contributes about $65,000 annually for after-school programs in Windham. Garcia Testimony, 3/4/16, p. 95. 43. All Windham schools have Tier 1 intervention based on positive behavioral interventions and supports (PBIS). Caban-Owen Testimony, 1/15/16, p. 81. 44. Ms. Caban-Owen, a social worker at North Windham School, has never had to cancel a counseling session due to heating issues, damaged tiles or other facilities issues. Caban-Owen Testimony, 1/15/16, pp. 86-7. She also receives assistance with both formal and informal counseling from 6 interns. Id., 89-90. 45. In Windham, about 45% of local monies for the town go to the board of education. Garcia Testimony, 3/4/16, p. 93. Local funding accounts for only 35.6% of the school budget, while the rest is state and federal funding. Id., 99. See DTX 5648 (in 2014-15, local funding was 34.2%, state funding was 56.4% and federal was 8%). Windham received budget increases of 3.6% between Dr. Garcia's first and second year. Id. She is proposing a 3% increase for 2016-17, which includes a 3% increase in staff salaries, $800,000-1M for the Companeros program, and $1M for non-Companeros ESL students. Id., 99-100. 46. The board of education in Windham has approved a renovation like new of the Windham High School costing about $90M. Garcia Testimony, 3/4/16, p. 101. The state will reimburse Windham for about 79% of that cost. Id. After that renovation, Windham High School will house about 600 high school students, up to 434 early childhood students, and the board of education offices. Id. 47. Windham Middle School is getting its roof replaced and a microgrid installed, costing around $3M. Garcia Testimony, 3/4/16, p. 101. The state will reimburse 100% of the cost of the roof replacement. Id. The Natchaug School roof was replaced prior to Dr. Garcia's tenure in Windham. Id. The Windham Interdistrict Magnet School project for $42M was completed, with the state paying 95% of the cost. Donaldson Testimony, 2/3/16, pp. 129-30. Other projects included a roof replacement, asbestos abatement and flooring replacement in one wing in the cafeteria at Windham High School, new wells and other renovations at North Windham School and Windham Center School, and a microgrid at Sweeney School. Id., 130-2, 137. 48. There is adequate space at Windham Middle School and Windham High School. In fact, half of Windham High School is empty. Donaldson Testimony, 2/3/16, p. 122. There is also adequate heating and lighting at all schools in Windham. Id., 122-4. Schools have never closed
38
in Windham due to heating issues during Mr. Donaldson's tenure. Id., 125. None of the facilities problems described by Mr. Donaldson required school closure in 2015-16. Id. 49. In 2014-15, four schools in Windham, in one subject or another, include high needs students who are outperforming the state average of high needs students. DTX 6215, p. 4. 50. Windham's efforts to bring back outplaced special education students during Dr. Garcia's tenure have led to a savings of about $200,000. Garcia Testimony, 3/4/16, p. 53. That money will go back to benefit the special education students. Id. II. Reforms
1. When asked to define a "needs-based assessment" to address equity issues, Plaintiffs' expert Dr. Jennifer King Rice said in part the following:
So you know I think thinking towards a one size fits all solution is – it's hard not to think that way when we're talking at a state level. But I think it's not the most productive way to think about how to invest resources in fixing an equity issue like we're seeing here. So a needs assessment involves taking the best empirical information that we have at our disposal, organizing that information in terms of almost a hierarchy or a set of priorities that need to be in place, and then working with local school districts to understand their most pressing challenges and the resources that they currently have available and trying to come up with a plan that will best serve their students with the additional resources that we're making available to them given what we know from the empirical research.
Rice Testimony, 3/3/16, pp. 103-4. This description accurately describes Connecticut's 2012 reform model, particularly the Alliance District and Commissioner's Network programs. Quesnel Testimony, 6/1/16, pp. 106-7 (noting that one of the strengths of the Alliance District plan is the ability of districts to collaborate with the CSDE on their plans, and that the plans are not "one size fits all"); Quesnel Testimony, 1/19/16, pp. 33:17-34:4 (Commissioner's Network plan at O'Brien STEM Academy is a classic example of a really incredible plan because it is based on the organic needs of the district, tight metrics around what success means, and funding to back it up); Rabinowitz Testimony, 1/22/16, p. 113 (Alliance District funding is used for what the individual district determines is its highest priority needs). 2. Regarding Connecticut's 2012 reforms, Connecticut has pursued a very rational, systematic approach to improvement: Be targeted, learning, phase-in, move forward where it makes sense to move forward. Seder Testimony, 4/26/16, p. 97; see also DTX 2432 (Seder Expert Report); Seder Testimony, 4/26/16, p. 83 ("[I]n looking at Connecticut's policy, legislative initiatives, trying to address the issues of low-performing schools and low-performing school districts, that the approach being taken by the state was a pretty rational approach; that rather than subscribing to research and grabbing on to research that is correlational in nature -- so
39
not causal, not definitive, not anything of the sort -- and grabbing on to that research and wholesale implementing it in the state at great expense without much learning from what those experiences could be, the state instead targeted those school districts -- targeted those student and child populations where in fact the most work could -- where the most work could and probably should be done. And so through a variety of initiatives -- from early childhood through intervening with low-performing schools and school districts through the Commissioner's Network and the Alliance District program, new-teacher evaluation systems -- that generally Connecticut was on the leading edge of putting forward initiatives, putting in place conscious efforts to learn from those experiences, going in with phase-in or pilot programs to find out if these programs that may have worked someplace else might work also in Connecticut."). 3. Similarly, the Alliance District grant is a fantastic example of when funding and management and oversight and accountability all come together with a dynamic strategic plan towards student achievement based on student needs and based on the concept that what we are doing does not work and we need to do more and we need to do smarter to bring students to an adequate level of both performance and opportunity, and results begin to happen. Quesnel Testimony, 1/15/16, p. 182. Further, as a result of the Alliance District program where funding and accountability and a tight plan have come together we have begun to see results. Quesnel Testimony, 1/19/16, p. 26. 4. Connecticut is working to address the needs of children in urban districts through the Alliance District plan, which is a significant and focused attempt to close the achievement gaps by using more high leverage, coherent strategies to move learning forward. And that is the work that the districts that I know in Connecticut that are poised to make progress are focused on those strategies. Villanova Testimony, 5/11/16, p. 44; see also Cohn Testimony, 5/26/16, p. 21 (noting that the CSDE is even more engaged with districts under Commissioner Wentzell, and that "we are moving in the direction of tighter monitoring of all those things"). 5. There is evidence that leadership behaviors that are known to correlate highly with improved teaching have improved in Connecticut. Villanova Testimony, 5/13/16, p. 81. 6. Alliance District plans and Commissioner's Network plans can be revised if needs change mid-program. Cohn Testimony, 5/25/16, p. 71. SIG plans can also be revised mid-program. Id., 84. The CSDE provides feedback and advises districts on their Alliance District and Commissioner's Network plans, which are iterative processes with further modifications always possible. Id. After this collaborative review by the CSDE, no district's Alliance District application has ever not been approved. Demsey Testimony, 4/5/16, p. 158; Rabinowitz Testimony, 1/22/16, p. 109.
40
7. No district has ever received less than the Alliance District amount allotted. Demsey Testimony, 4/5/16, p. 158. No Commissioner's Network application has been denied for budget reasons. Demsey Testimony, 4/5/16, p. 170. 8. Connecticut, under its Equity Plan, is focused on the right sets of priorities with respect to teacher and leader quality in poor schools. Rice Testimony, 3/3/16, p. 139. 9. The 2012 reforms, including the Alliance District grant, have provided benefits to districts, helped to narrow achievement gaps, and allowed districts to expand their initiatives. Pascarella Testimony, 2/2/16, pp. 174-6. 10. Alliance District school leaders and teachers have benefited from sharing best practices, such as at the quarterly Alliance District Convening meetings, which provide Alliance Districts with the opportunity to share best practices and connect with community partners. See, e.g., Quesnel Testimony, 6/1/16 (East Hartford Superintendent Quesnel has learned from Alliance District convening meetings, including the sustainability workshop, and has built community partnerships); Rabinowitz Testimony, 1/22/16, p. 105 ("I have found great value in being able to work with other superintendents and staff members to collaborate on how they have solved some of their issues, whether it be interventions or suspensions."); Wentzell Testimony, 4/13/16, p. 24-5 (describing PD such as root cause analysis for districts and appreciative inquiry); Cohn Testimony, 5/25/16, pp. 45-8 (describing Alliance convening meeting programs such as K-3 literacy, Attendance Works on chronic absenteeism, fiscal management, and community engagement); DTX 6456 (May 25, 2016 Alliance Convening agenda). The CSDE is also planning a professional development series in collaboration with CAPSS (a CCJEF member) to provide support and education to superintendents on engaging the community and managing the political aspects of the superintendent's role. Cohn Testimony, 5/25/16, pp. 54-6. Similarly, Commissioner's Network school leaders and teachers have benefited from shared best practices at NetStat sessions. Cohn Testimony, 5/25/16, pp. 72-5. 11. Alliance District teachers can attend the state’s Common Core State Standards training for free. See, e.g., Pascarella Testimony, 2/2/16, p. 175. 12. No evidence was presented by plaintiffs that the Alliance District grant funding will be discontinued in the future. Quesnel Testimony, 6/1/16; Rabinowitz Testimony, 6/2/16 (Superintendent Rabinowitz has "every reason to believe" that alliance funding will continue); Thompson Testimony, 2/18/16, p. 55 (New London will continue to receive Alliance District grant funding after it exits turnaround status). 13. There are sustainability formulas in both programs where if, for instance, part of an Alliance District plan -- or if it's a Commissioner's Network school, their school plan -- requires additional interventionists in the first year, the district can use 75% of its grant money for that salary. Wentzell Testimony, 4/13/16, p. 42. And then, as capacity is built and the teachers know better techniques, the outcome should be better and the need should be reduced for extra staff in two ways: one is they need less technical assistance to be effective teachers in reading; and two, they have fewer kids who are needing Tier 2 interventions. Id., 42-3. So, the sustainability formulas in both of those grant programs support the idea that the district or school is getting a
41
little better at that every year and needing fewer additional resources. Id., 43. Similarly, in Title I, which is a federal grant program, there are built-in sustainability formulas that the federal government requires. Id. The CSDE supports very directly the Alliance District superintendents in planning that sustainability plan, which superintendents are also taught as part of their schooling. Id. 14. The SBAC test offers significant improvement over previous tests, and makes use of computer-adaptive technology which provides more accurate information about student achievement. Garcia Testimony, 3/4/16, p. 87. It also allows districts the opportunity to have results much earlier than previous assessments. Id. The SBAC test is both reliable and valid, and is more rigorous than prior tests. Gopalakrishnan, 5/18/16, pp. 19, 90, 95. The test time is shorter for the SBAC, giving teachers more instructional time. Id., pp. 89, 106. Further, in 2015 the redesigned SAT aligned to the CCSS became the mastery examination for high school students, which also shortens test taking time for students. Id., 109; DTX 6214. SAT prep is available for free to all students through Khan Academy. Id., 110-11. The state also pays for universal administration of the PSAT for students in Alliance Districts. Id., 113. 15. In addition to the Alliance Districts and Commissioner's Network schools, the CSDE also identifies the lowest-performing schools, turnaround schools, as well as the lowest-performing subgroups of students, focus schools, which allows the CSDE to hone in on where issues are the most severe and direct attention and resources to those areas. Gopalakrishnan Testimony, 5/18/16, pp. 74, 79. III. Scientific Research-Based Interventions (SRBI)
*See Defs' Requests for Admission ## 215-21 (SRBI).
1. Implementation of SRBI largely involves finding more effective ways to deploy existing resources. DTX 4344 (CT's Framework for RTI). Reliance on additional staff is a typical misunderstanding. Wentzell Testimony, 4/15/16, pp. 46-50. 2. Many practices involved in SRBI are those which educators already are responsible for assessing students developing or selecting core curriculums using instructional strategies effectively and managing student behavior. DTX 4344. Implementation of SRBI should not require extensive additional time commitments for educators, administrators and support services personnel although for some of these groups it certainly may change how educators spend their time. Id. Primarily, SRBI will require using more systemic approaches to educational practices as well as gathering, analyzing and applying the appropriate data to maximize the effectiveness of these practices. Id. Similarly with regard to finances, implementing SRBI will involve changing patterns of expenditures to get the greatest educational effectiveness from available resources. Id. Prevention and early intervention typically are much more cost effective than trying to fix entrenched problems. Id. Therefore over time districts should realize certain savings that offset the costs of SRBI implementation. Id. 3. While interventions may be provided by outside interventionists, interventions can be provided by properly trained classroom teachers. Saavedra Testimony, 3/1/16, pp. 170-2 (classroom teachers at Smalley Academy provide interventions to small groups in their
42
classrooms; all teachers are trained in providing differentiated instruction and interventions in the classroom); Pascarella Testimony, 2/2/16, p. 195; Frassinelli Testimony, 5/6/16, pp. 69-70 (with SRBI and PBIS, "the more students who buy in at Tier I, the less intensive work they need; so the less involvement of the certified staff in the district are necessary to support it"); Cohn Testimony, 5/26/16, p. 91 ("I had no interventionists and did Tier III with upwards of three children using a paraprofessional. We redeployed our staff. So it is not the only way. And one on one, I know very few schools that actually sit someone for 60 minutes one child and one teacher."). For example, at Ellsworth Avenue School, which has the highest percentage of EL's of any school in Danbury, classroom teachers can and do routinely provide Tier 1 and 2 interventions in their classrooms. Rocco Testimony, 2/26/16, pp. 46-8. 4. The CSDE has been providing direct technical assistance on the teaching of reading through an effort that it has with its Alliance Districts so that the Tier 1 instruction will be more effective and reduce the need for intervention. Wentzell Testimony, 4/13/16, p. 41, 4/15/16, pp. 46-50. In East Hartford, the CSDE helped the Commissioner's Network schools (O'Brien and EHMS) to design intervention systems that East Hartford is replicating throughout the district. Id. 5. For SRBI programs, districts can redeploy staff without the need to hire additional interventionists, and approach it through an 'all hands on deck' method where they might break grade levels into intervention enrichment blocks; at the high school level they might use an elective course; and at the middle school level they might embed it in a "workshop," 30 minutes on each school team at the middle school level and have classroom teachers provide intervention. Cohn Testimony, 5/24/16, p. 98. 6. For example, Bridgeport has a 90-minute literacy period followed by an SRBI period which has an 'all hands on deck' approach that redistributes and differentiates students based on their needs. Rabinowitz Testimony, 6/2/16, p. 18. All 29 elementary schools in Bridgeport have had the 90-minute blocks since 2014-15. Id., 18:14-19:24; Cohn Testimony, 5/24/16, p. 85:24-27. The intervention system is coming along and working well. Id. Bridgeport has used its Alliance District funding to support this system. Cohn Testimony, 5/24/16, pp. 85-6. The system helps defray the cost of interventionists by having time set aside where classroom teachers can do some of the intervention. Id. See also Cohn Testimony, 5/25/16, p. 100 ("I believe SRBI will make a difference in Bridgeport Public Schools"). 7. At Waltersville School in Bridgeport, SRBI is being effectively applied to all students. Briganti Testimony, 2/5/16, pp. 94-8 ("Q: Do all students that are below grade level in reading receive interventions in some form? A: At some point the children receive interventions."). Most teachers are engaged in tiered instruction, and all teachers and interventionists are training in SRBI strategies. Id., 131-2. 8. The state provides several avenues of professional development to districts in SRBI, including the CALI initiatives modules, the State Personnel Development Grant (SPDG), embedded SRBI in all of its professional development for Common Core State Standards, SRBI symposiums, and a website with many resources for districts on SRBI, including an SRBI manual and guidance tools. Cohn Testimony, 5/24/16, pp. 98-102, 125. The SPDG grant is a
43
$1M annual grant for 5 years where SERC provides on-site training in SRBI to teachers and administrators in many schools throughout the state, including schools in Bridgeport, Windham and New London. Id., 100-1. See Defs' RFAs 222-30 (SPDG). 9. During Commissioner Wentzell's time in South Windsor, the district saw gains in student performance through discontinuing ineffective programs, reallocating resources and reassigning staff rather than adding staff. Wentzell Testimony, 5/5/16, p. 150. 10. All districts have staff available that can be trained to do a better job at what they are doing, and all districts have principals that can reschedule the school day such that teachers can be more effective. Wentzell Testimony, 5/5/16, p. 153. The CSDE works closely with Alliance Districts and Commissioner's Network schools to do just that. Id., 154. IV. Class Size and Staffing
*See Findings of Fact Per 5/9/16 Order (Docket # 326) ## 88-99 (class sizes, staffing and vacancies).
1. Contrary to anecdotal evidence from some of plaintiffs' witnesses, the average class sizes in the focus districts are comparable to the state averages. For example, in the 2014-15 school year, the CSDE data on the average class sizes in grades K-8 statewide and in the focus districts showed that in general there are only small and inconsistent variations in class size in the focus districts as compared to the state average. Defs' Demonstrative 10; DTX 6444; Gopalakrishnan Testimony, 5/18/16, pp. 124-32.1 See also Defs' Findings of Fact Per 5/9/16 Order # 89 (student to staff ratios in CT compare favorably to other states). 2. This was also true for Bridgeport, in spite of Superintendent Rabinowitz' anecdotal testimony about class size. Defs' Demonstrative 10 (showing K-8 class sizes in Bridgeport ranging from 21.0-23.7 students, contrary to Superintendent Rabinowitz' testimony about class sizes ranging from 24-29 students); Rabinowitz Testimony, 6/2/16. See also Capasso Testimony, 2/23/16, pp. 66-7 (8th grade math teacher at Tisdale School in Bridgeport who has 18-20 students in each of her classes this year, and had 20-21 in her classes last year); Simmons Testimony, 1/28/16, pp. 94-7, PTX 358 (in 2012-13, Edison School in Bridgeport had an average of 22 students per class in kindergarten, 20 students per class in 2nd grade, 15 students per class in 5th grade; and in 2014-15, the averages were 22 in kindergarten and 18 in 5th grade); Thompson Testimony, 2/18/16, p. 82 (self-contained special education class sizes in New London range from 12 to 18 students per class); Pascarella Testimony, 2/2/16, pp. 161-2 (Danbury High School had a student to teacher ratio of 16:1). 3. Overall, class size averages in grades K-8 were lower than the state average (20.4 average across all grades) in East Hartford (20.3), New Britain (20.2), and Windham (19.0), while they were slightly higher in Bridgeport (22.5) and Danbury (20.9).2 Defs' Demonstrative 10.
1 This data was accurate and reliable based on performance office calculations. See Gopalakrishnan Testimony, 5/18/16, pp. 124-32. 2 New London's overall average class size for grades K-8 was 23.7; however, the data was skewed due to inaccurate reporting by one of the elementary schools. See Defs' Demonstrative 10.
44
Additionally, research on the effects of class size on student achievement is inconclusive. See Baker Testimony, 1/27/16, pp. 148-50 (Hoxby study of class size data in CT middle schools found no evidence of any correlation between lower class size and gains on academic measures); DTX 6415 (Hanushek Expert Report), pp. 1-2; Hanushek Testimony, 5/3/16, pp. 105-7 (STAR study showed that, while the results showed some small improvements during kindergarten, the small classes did not continue to have an impact on achievement in the later grades of the experiment, even though that would have been expected if small classes had an impact across grades; also, the reductions in class size were very large [moving from 23 to 15 students per class], making it an extraordinarily expensive policy; no comparable studies even exist for later grades); Pascarella Testimony, 2/2/16, pp. 51-2, 191-2. What is more important is the skill level of the teacher, i.e., how the teacher is planning for and instructing the class. Pascarella Testimony, 2/2/16, pp. 51-2, 191-2; Thompson Testimony, 2/18/16, p. 118 ("You can have a lousy teacher with 4 or 28 kids, but usually the outcome is going to be the same. So it starts with a real highly skilled teacher."); Rabinowitz Testimony, 6/2/16 (noting that small class sizes, even as low as 16 students, won't make a difference without an effective teacher). 4. Moreover, class sizes in schools are typically a result of individual decisions made by school leaders. See, e.g., Capasso Testimony, 2/23/16, pp. 70-1 (stating that the principal at Tisdale School in Bridgeport wanted smaller class sizes so she managed her available funding in such a way that provided an additional teacher at the middle school); Hanushek Testimony, 5/3/16, pp. 99-100 (noting that good principals will give their best teachers the larger classes and the poorer teachers the smaller classes). 5. In 2014-15, East Hartford's average class sizes for each of grades K-6 were below the state average. Defs' Demonstrative 10. 6. New Britain's average class sizes in 2014-15 were comparable to the state averages for grades K-8. Defs' Demonstrative 10 (showing that for grades K-8 in the aggregate New Britain's average class size was 20.2 while the state average was 20.4). 7. Efforts to reduce class sizes at the elementary level over the past three years have worked. Salina Testimony, 1/13/16, p. 52. The 2015-16 class sizes are very good compared to previous years. Id. 8. In 2010-11, ratios of special education teachers, speech pathologists, and school psychologists to the number of students with disabilities were substantially better than national averages. DTX 2428 (Reschly Expert Report), p. 47, Table 20; Reschly Testimony, 4/20/16, pp. 129-30 (Bridgeport's ratio of school psychologists to students with disabilities was favorable). There are also other staff that can help implement the IDEA beyond special education teachers, speech and language pathologists, and psychologists. Reschly Testimony, 4/20/16, p. 102. 9. Specific staffing in schools, such as counselors, school psychologists, and library media specialists, is a leadership decision based on priorities. Wentzell Testimony, 5/5/16, p. 51, 59, 72 ("[I]t's about the priorities and that you organize around your priorities, you staff around your priorities, and you dedicate resources around your priorities."); Villanova Testimony, 5/13/16, p. 59 ("[H]ow resources are allocated and directed in a school district through leadership makes the
45
biggest difference and… has the potential to make the biggest difference and have the biggest impact on overall performance. So leadership… and then the allocation of resources by the leaders in the right places, at the high-leverage places seem to me to be critical."), p. 87 ("I and my staff took calculated risks and hired people well in advance of budget approval"). The title of who is meeting the needs of students is not important. Id., 51-2. The CSDE works with Alliance Districts (and through LEAD CT) to train principals to build the capacity of teachers and provide supports for students and families. Id., 55. 10. There has been a reduction in staff frustration with their ability to deal with social and emotional needs of students in a lot of Alliance Districts where leadership planning has dedicated a lot of efforts toward Tier 1 social and emotional support. Wentzell Testimony, 5/5/16, p. 54. 11. The presence or absence of school counselors is not directly correlated with whether students' social or emotional needs are being met. Wentzell Testimony, 5/5/16, pp. 50-1. What is more important is the capacity of the classroom teacher to meet the social and emotional needs of their students. Id. Teachers are trained to meet social and emotional needs of their students in preservice and through continuing education. Id. The state has also invested significant resources into training teachers to address the social and emotional needs of students. See Post-Trial Brief, Wraparound Services Section; Findings of Fact, Wraparound Services Section. Regarding staffing for positions such as school psychologists or library media specialists, it is an individual decision made by school leaders in a district based on priorities. Wentzell Testimony, 5/5/16, p. 58-9. 12. Teachers are not more effective in wealthier, nonminority districts than in minority, impoverished districts. Wentzell Testimony, 5/5/16, p. 86. In fact, while an administrator in South Windsor, Commissioner Wentzell sought to hire teachers from Priority School Districts because they had gotten the best training and professional development. Id. Also, effective principals attract teachers who are interested in making a difference, regardless of the wealth or makeup of a community. Id., 110. V. Pre-K
1. Connecticut's Office of Early Childhood ("OEC") is one of only four cabinet-level state agencies in the country, including Massachusetts, Washington, and Georgia, which focus exclusively on early childhood education. Jones-Taylor Tr. 5/10/16, pp. 67:22-27, 68:1-3; Defs. RFA 843-845, Doc. #301.00. 2. OEC is responsible for the delivery of services and programs that were formerly handled by five state agencies for children birth to age 5. These programs and services now reside in one of its 4 divisions of Early Care and Education, Licensing, Family Support, and Quality Improvement. Jones-Taylor Tr. 5/10/16, pp.59:8-27, 60-63, 64:1-10; Defs. RFA 844, 845, Doc. #301.00. 3. OEC has a budget of $350 million. (Jones-Taylor Tr. 5/10/16, p. 59:26-27).
46
4. Given its fiscal constraints and the research on the effectiveness of pre-K for children of low income families, Connecticut focuses on universal access to pre-k for those families who would not have an opportunity to attend pre-k because of income and does not provide universal pre-K to all children, regardless of income. Jones-Taylor Tr. 5/10/16, pp 77:17-27, 78:1-19, 82:1-6, Jones-Taylor Tr. 5/13/16, 143:24-144:1. 5. In terms of the percentage of low-income children enrolled in preschool, Connecticut is the highest ranking state in the country, and Connecticut has the highest percentage of any state of non–low-income children enrolled in preschool. Baker Tr. 1/27/16, p. 128, DTX 6054, pp. 26-27. 6. In 2014, Connecticut was ranked 3rd in the nation in state per pupil spending for pre-K which includes the childcare subsidy and parent fee. DTX 4548, 2014 NIEER Yearbook, p. 17. 7. In 2015, Connecticut was ranked 5th in the nation in state per pupil spending with the recognition of its Child Day Care Contracts as one of its state funded programs by NIEER and inclusion in the 2015 NIEER (National Institute for Early Education Research) Yearbook. The lower ranking is due to the different funding sources for the Child Day Care Contracts compared to the School Readiness grant in that the Child Day Care Contracts do not receive all the same funding sources of the School Readiness Program such as quality enhancement grants. The funding sources of both grants taken together and divided by 2 result in the lower ranking. Adams Tr.5/17/16, pp. 82:25-83:12, DTX 4548, 2014 NIEER Yearbook, p. 17; DTX 6459, 2015 NIEER Yearbook, p. 18. 8. With the inclusion of the Connecticut's Child Day Care Contracts in the 2015 NIEER Yearbook, Connecticut's access ranking for 4 year olds has risen from 29 in the 2014 NIEER Yearbook to 23 in the NIEER 2015 Yearbook. The access ranking for 3 year olds has risen from 12 to 8. Adams Tr. 5/17/16, pp. 80:6-81:21, DTX 4548, NIEER 2014 Yearbook, p.39; DTX 6459, 2015 NIEER Yearbook, p. 60. 9. Florida provides universal pre-K and is ranked 3rd in the nation with regard to access for pre-K 4 year olds but serves no 3 year olds. Jones-Taylor Tr. 5/10/16, pp.83:16-27, 84:1-2; DTX 4548, p. 45. 10. Florida offers pre-K programs for 3 hours a day and Connecticut offers several different dosages to meet family needs, including full day/school day, and part day spaces. These include full day/full year spaces for 10 hours a day, 50 weeks a year; school day/school year for 6 hours a day, 5 days a week, 180 days a year; part day spaces for 2 ½ hours a day, 5 days a week, 180 days a year and extended day programs. (Jones-Taylor Testimony 5/10/16, p. 88:17-27, 89:1-7; DTX 6320, p. 2, Defs. RFA 855, Doc. #301.00. 11. Florida offer universal pre-K and spent $2,238 per child in 2014 and $2,304 per child in 2015. Jones-Taylor Tr. 5/10/16, p. 85:1-6. DTX 6459, NIEER 4548, NIERR 2014 Yearbook, p. 46; DTX 6459, NIEER 2015 Yearbook, p. 68.
47
12. Since Florida charges no parent fee, Connecticut and Florida's state spending per child can be compared based on Connecticut's reimbursement rates of $8,925 to Florida's $2,238.00 per child. Jones-Taylor Tr. 5/10/16, pp. 85:16-25, 87:25-88:1-5.
A. Child Care Contracts
13. Among Connecticut's state-funded pre-K programs are the Child Day Contracts which are the oldest, created in the 1960s as part of President Johnson's war on poverty, for which the state pays 54 % of the total allocation in the amount of $10,473,088 and serves 1,482 children. The program can only enroll children of families whose income falls below 75% of the State Median Income. Jones-Taylor Tr. 5/10/16 p, 68:13-20, DTX 6429, Fee Schedule, DTX 6449, FY16 Pre-K Funding. 14. Connecticut's Child Day Care Contracts have been recognized by NIEER of which Plaintiffs' expert witness, Dr. W. Stephen Barnett, is the Director, for inclusion in its 2015 Yearbook as one of Connecticut's state funded pre-K programs, thereby increasing the number served by Connecticut's state-funded pre-K. Jones-Taylor Tr. 5/10/16, pp. 121:23-27, 122:12. 15. The NIEER Yearbook is a report based on a survey of state-funded pre-school programs whose purpose is to provide comparable information across the states on state reported spending, enrollment information, the extent to which programs meet a set of 10 benchmarks for state policies relating to quality. The benchmarks include teacher qualifications, early learning standards, class size, teacher/student ratio, and professional development. Jones-Taylor Tr. 5/10/16, pp. 121:23-122-12; Barnett Tr. 2/25/16, pp.113:23-115:15; DTX 6459, 2015 NIEER Yearbook.
B. School Readiness Programs
16. Among Connecticut's state funded pre-K programs are the School Readiness Program which provides high quality pre-K to children in the 19 Priority School Districts, the highest poverty communities and the Competitive School Districts which also show signs of poverty. The program is a mixed delivery model that seeks to provide parents with choices in providing spaces in both public schools, for profit and non-profit (community) early childhood programs, Head Start and state funded day care programs. The programs serve over 12,000 children annually through state funding totaling $93.8 million. Jones-Taylor Tr. 5/10/16, pp. 68:21-69:10; 74:1-10, DTX 6449, Pre-K State Federal Funding, DTX 6331, PSR Slots Allocation 2007-Present; DTX 6321, PSR and CSR Slot Grids 2007-16; DTX 6330, CSR FY08-FY16. 17. The School Readiness Grant program seeks to accommodate a diverse set of family situations by offering extended day spaces in addition to full day, school day, and part- day spaces. Full day spaces are available for 10 hours per day, 50 weeks per year and are reimbursed at the increased rate $8,924 per child for FY 16, an increase from $8,670. At least 50% of the spaces in a priority district must be full day/full year. School-day and part-day spaces are available respectively for 6 and 2 ½ hours per day, for 5 days per week, and 180 days per year and are reimbursed at the rate of $6000 and $4,500 per child respectively. Extended day spaces extend the hours, days and/or weeks of children in an existing state funded, part time program or
48
Head Start program, in order to provide those children a full time program of 10 hours per day or extend the program for a year or for 50 weeks. Extended day spaces are reimbursed at the rate of $2,772 per child. Defs. RFA 855, Doc. #301.00; DTX 6320, School Readiness Overview. 18. Children who are ages 3 and 4 may enroll in the School Readiness program, 60% of whose families must be at or below 75% of the State Median Income. The parent fee for these families is based on the relationship between the state median income and the federal poverty level. Adams Tr. 5/17/16, pp. 36:1-39:10. 19. Parents can claim a hardship for paying the parent fee of any state or federal funded program and develop a contract with the provider based on documentation of the hardship if the provider has a hardship policy. In addition, eligible families can obtain a subsidy through the Care 4 Kids Program. This program is part of the larger federal Childcare Block Grant which requires the State to contribute more than what the federal government provides. The program also requires parents to be working or in an approved training program and family income to be less than 50% of the state median income. Not only do parents benefit in getting the parent fee basically paid for them but the program also receives funds from the Care 4 Kids program in addition to the state reimbursement. In addition to providing subsidies for families of infant toddlers and school age children, the Care 4 Kids program provides $40.6 million in subsidies for preschool children and serves 13,046 preschool children. Jones-Taylor Tr. 5/10/16, pp. 76:25-77:5; Adams Tr. 5/17/16, pp. 39:1-44:24; DTX 6403, C4K Provider Payments 2016; http://www.ct.gov/oec/cwp/view.asp?a=4541&q=545048#17b74905, DTX 6429, Income Fee Schedule, DTX 6449, Pre-K State Federal Funding. 20. Local School Readiness Councils in each school district are responsible for making recommendations to OEC regarding application/proposals from interested providers for pre-K spaces based on a preliminary funding allocation amount provided by OEC that is determined by a legislative formula. The providers are from a variety of settings including public schools, for profit and non-profit early childhood programs, Head Start and state funded day care programs. In the event the legislature authorizes an increase in School Readiness funding from the previous year, OEC reviews the applications/proposals with a view to funding spaces to which children can have immediate access, i.e., that are viable in terms of accreditation and actual physical space. Adams Tr. 5/17/16, p. 30:7-25; Defs. RFA 854, Doc. #301.00. 21. The School Readiness Councils are co-chaired by the Superintendent in each district and the Mayor. A liaison acts as the staff to the Council. Adams Tr. 5/17/16, p. 30: 7-25, Jones-Taylor Tr. 5/10/16, pp. 74:11-75:6; DTX 6320, OEC Website SR Overview. 22. OEC provides assistance to the School Readiness Councils through monthly liaison meetings to discuss challenges faced by the communities in filling spaces as well as share forms among liaisons and allow liaisons to provide input into the design of funding proposals and the state's general policies. Adams Tr. 5/17/16, p. 32:8-25. 23. The residency requirement for School Readiness Programs was removed recently by legislation. Adams Tr. 5/17/16, p. 35:23-27.
49
24. The reimbursement rate for School Readiness full day slots was increased in FY 15 to $8,924. Adams Tr. 5/17/16, pp. 92:24-93:1; DTX 6320, OEC Website SR Overview. 25. Two recent expansions of the School Readiness program have expanded access to pre-K to low income children in FY13 with the addition of 1000 slots and in FY 15 with the addition of 1020 slots. When the State's fiscal situation made clear that the Governor's proposal for continued expansion of the School Readiness program through FY19 would not occur, OEC pursued other ways to expand pre-K through the Smart Start Program and the federal Preschool Development Grant. Jones-Taylor Tr. 5/10/12, pp. 122:23-27, 123:1-7; Jones-Taylor Tr. 5/13/16, pp. 161:7-163:11; Adams Tr. 5/17/16, pp. 35:10-22, 125:8-127:25; DTX 6435, SR Program Allocation Trend FY10-FY16. 26. The expansion slots for FY15 were allocated based on a tiered decision-making process that ranked programs as to several criteria related to quality, including NAEYC accreditation or Head Start approval, staffing qualifications, current approval and funding by School Readiness Councils, physical space needing no renovations, and utilization rate. Adams Tr. 5/17/16, p. 129:1-10; DTX 6331, PSR Slot History; DTX 6457, FY15 Priority and Competitive SR Expansion; Adams 5/17/16, pp. 98:26-99:1. 27. Of the 44 programs ranked as Tier 1, 35 programs were funded. Of the 9 programs ranked as Tier 2, three programs were funded. No Tier 3 programs were funded. Not all Tier 1 programs were funded because the decision was made by OEC not to fund requests for extended day spaces because such spaces wrap an existing funding stream and OEC wanted to provide as many new spaces as possible. Adams Tr. 5/17/16, pp. 94:23-97:1, 128:1-23; DTX 6457, FY15 Priority and Competitive SR Expansion. 28. Aside from the denial of Tier 1 programs for extended day spaces in the FY 15 expansion, Bridgeport was denied spaces because of its notorious underutilization of spaces and its history of not being able to handle new spaces to meet its need despite its Scholl Readiness liaison telling OEC that Bridgeport is ready to receive new spaces. Adams Tr. 5/17/16, pp. 129:14-131:15. 29. Over the past 6 fiscal years, the funding for School Readiness grant steadily increased from $70 million for the Priority Districts and $5 million for the Competitive Districts in 2010 to $83 million for the Priority Districts and $11 million for the Competitive Districts in 2016, serving 12,263 children. Adams Tr. 5/17/16, p. 125:1-17; DTX 6449, FY16 Pre-k Funding. 30. Quality Enhancement Grants are supplemental grants that are available to school readiness municipalities to improve the quality and comprehensiveness of school readiness programs. The grants are awarded annually by OEC upon application by Local School Readiness Councils. More than $1.1 million of quality enhancement grants were awarded for FY16. They can be used, among other items, to help providers to obtain accreditation, provide training for directors and administrators, purchase educational equipment, provide comprehensive services, such as enhanced access to health care, parent education, literacy and parent involvement, community and home outreach programs as well as provide scholarships to
50
advance academic degree attainment. Defs RFA 853, Doc. #301.00P; DTX 6320, p. 5, School Readiness Overview; Jones-Taylor Tr. 5/10/16, p. 70:17-26.
C. State Head Start Programs
31. Connecticut's state funded pre-K programs also include the State Head Start supplement of $5.6 million to enhance the federal Head Start Program which promotes the school readiness of children from low income families by supporting the comprehensive development of children from birth to age 5. The state funds are used to either extend the day of a Head Start program or extend the year of a Head Start program for the 6,691 children served by the federal Head Start program. DTX 6322, Head Start Appropriation July 2015, DTX 6449, FY16 Preschool Funding, Jones-Taylor Tr. 5/10/16, pp. 69:27-70:6. http://www.acf.hhs.gov/programs/ohs/about/head-start.
D. Requirements for State Funded Programs
32. Among the requirements for School Readiness programs and all state funded programs is accreditation by the National Association for the Education of Young Children (NAEYC) or Head Start approval. Adams Tr.5/17/16, pp. 44:25-45:26. 33. Accreditation is a rigorous process involving self-reflection by a program demonstrating that a program has met the requirements of an independent organization and has continuously improved to meet high standards of child/teacher interactions, family engagement in partnering with families in the education of their children, racial inclusion and inclusion of special needs children. It acts as a marker of excellence. Jones-Taylor Tr. 5/10/16, pp. 98:14-27, 99:1-4. 34. NAEYC accreditation is considered the gold standard among accrediting bodies in terms of being the most rigorous and having the highest standards for child outcomes. Jones-Taylor Tr. 5/10/16, pp. 112:22-27, 113:1-8; Granucci Tr. 2/4/16, p.166:8-13. 35. Barnett considers NAEYC accreditation to be higher than other accreditations. Barnett Tr. 2/25/16, p. 131:15-26. 36. Barnett considers accreditation to be a valuable process for pre-K to go through. Barnett Tr. 2/25/16, p. 131:2-14. 37. Barnett views NAEYC accreditation as one route to higher quality. Barnett Tr. 2/25/16, p. 132:1-20. 38. Despite its relatively small population, Connecticut ranks third in the country in the number of pre-K programs accredited by the NAEYC, a widely respected preschool credentialing organization after the more populous states of, Massachusetts and California. Jones-Taylor Tr. 5/10/16, pp. 113:9-27, 114:1-10, DTX 4545. 39. The State provides parents access to information on program location as well as licensing and accreditation status through its website and a call center staffed by over 100 staff by calling Childcare 211, the state Childcare and Resource Referral phone line, run by United Way of
51
Connecticut. In addition, parents can obtain further information on NAEYC accreditation status through the link on the OEC website to the NAEYC website. Jones-Taylor 5/10/16, pp. 109:12-27, 110:1-27, 111:1-2. 40. As another element of quality, Connecticut's staff education qualifications require all teachers in state funded programs to have a Bachelor's ("BA") degree by 2020 with a phase-in of one-half the teachers by 2017. The phase-in was intended to avoid the immediate closure of programs and provide support to providers in meeting the requirements. Jones-Taylor Tr. 5/10/16, pp. 115:22-116:1-14. 41. The OEC Commissioner views the Bachelor degree requirement as important to elevating the pre-K profession but not a guarantee of high quality given her experience in viewing classrooms taught by all bachelor degree teachers with a lack of age appropriate activities for 3 and 4 year olds versus the child engagement of providers without a BA degree in family daycare centers. Jones-Taylor Tr. 5/13/16, p. 186:2-14. 42. Granucci considers the BA degree requirement as the foundation for a high quality program but not a guarantee that the teacher will provide a quality program. Quality is a matter of teacher interaction with students and how the teacher carries out his/her responsibilities for designing the learning environment, lesson planning communicating/relating to parents and pursuing professional development. Teacher quality is more important than facilities. The best teachers are not necessarily the ones who are paid the most. Granucci Tr. 2/4/16, pp. 171:9-172:5. 43. The staff education requirements apply to all the classrooms of a program that receives School Readiness funding and not just to the classrooms receiving School Readiness spaces. Likewise, the same is true for Child Day Care programs, including the infant toddler classrooms, even though these classrooms do not receive School Readiness funding. The same is true for state Head Start. Jones-Taylor Tr. 5/10/16, pp.120:21-27, 121:1-21, 123:13-22; Adams Tr.5/17/16, pp. 46:15-47:3. 44. Beyond the phase-in requirement, OEC has provided support for meeting the staff education requirements through investing $2.6 million in individual scholarships since 2013 and specifically $1million for FY16, a 50% increase from FY15. Defs RFA 865, Doc. #301.00, DTX 6299, Scholarship History. 45. OEC has also developed the Early Childhood Teacher Credential (ECTC) as an alternative to the BA degree to meet the staff education qualifications and develop a pipeline of teachers that meet high standards of teacher preparation and early care settings. Eight colleges have been approved to offer the ECTC. Jones-Taylor Tr. 5/10/16, pp. 116:15-118:27; Adams Tr. 5/17/16, pp. 64:17-27, 65-66, 67:1-6, DTX 4507, ECTC Flyer, DTX 6278, CT EC Bachelor Degree Colleges. 46. To date, 288 ECTCs have been approved. Adams Tr. 5/17/16, p. 76:7-26. DTX 6278, ECTC Data.
52
47. Among the other requirements for state funded programs are class sizes not exceeding 20 although OEC recommends class size not to exceed 18 and a teacher/child ratio of 1 to 9. In addition, 9 hours of professional development are required a year. Adams Tr. 5/17/16, pp. 45:27-46:14.
E. Smart Start
48. Access to pre-K for low-income children has been expanded in the public schools through the Smart Start program with the addition of 581 slots in public schools for the 2015/2016 school year and the same for the upcoming 2016/2017 school year. Boards of education must demonstrate an unmet need for low-income children and allocate at least 60% of the slots to children of families who are at or below 75% of the state median income, or 50% of the slots to children who are eligible for free and reduced price lunches. This program provides a grant to school districts for a portion of operating costs; up to 75,000 per classroom which equates to $5,000 per child for 15 children awarded annually for up to 10 years, and capital improvements; up to $300,000 as a one- time award for up to four classrooms following the same formula. The program was intentionally designed by the Legislature to incentivize public schools to provide pre-K by not covering the full operating costs with the expectation that the District pay for the differential. Jones-Taylor Tr. 5/10/16, p. 69:12-22, Jones-Taylor Tr. 5/13/16, pp. 164:3-168:22. DTX 6439, Smart Start, Cohorts I and II. Public Act 14-41. https://www.cga.ct.gov/2014/act/pa/2014PA-00041-R00SB-00025-PA.htm. 49. There have been 2 cohorts of funding for the Smart Start program awarded to 18 districts totaling $1,923,350 for operations and $1,587,955 for capital improvements for the FY 16 and $899,073 for operations and $1,218,405 for capital improvements for the FY 17. Adams Tr. 5/17/16, pp. 53:12-54:10. 50. The amount that a district has to cover under the Smart Start program is based on the difference between the amount of reimbursement for a school day/school year space in the School Readiness Program, $6000 per child, and the amount received under the grant, $5,000 per child, the district then covering $1,000 per child and any other costs to run the program above and beyond the $1,000 difference in reimbursement between the School Readiness and Smart Start funding. Jones-Taylor Tr. 5/13/16, p. 168:3-20. 51. Additional funds for Smart Start are available for FY 17. OEC has done outreach to encourage public schools to apply. Districts need to step up and apply. Jones-Taylor Tr. 5/13/16 p. 164:3-8. 52. The locations of the various state funded pre-K programs are evenly split throughout the state; 85 towns having a state-funded site and the other 84 towns having none. Adams Tr. 5/17/16, pp. 54:11-20, 55:6-21; DTX 6231, State-Funded Program Locations.
F. Federal Preschool Development Grant
53. Access to pre-K has also been expanded through the federal Pre-School Development Grant ("PDG"). The grant was awarded to Connecticut, as one of 18 states, in December 2014 in
53
the amount of $10,844,079 for the first of the 4 year, 47.5 million grant. The purpose of the grant is to expand and improve high quality pre-K spaces for four year olds whose families earn under 200% of the federal poverty line. It includes comprehensive services, including dental, health, nutrition screening, and mental health services as well as rigorous professional development that might be expanded to School Readiness providers and Child Daycare contract providers. OEC is aggressively pursuing the next year of the PDG, having been briefed by the Department of Education in Washington, D.C. that the first year recipients will have priority for the second year. Jones-Taylor Tr. 5/13/16, pp. 125:4-18, 129:27-130:10, 163:20-164:2; Defs. RFA 871, Doc. #301.00; DTX 6449, FY16 Pre-K Funding. 54. The first year of the PDG grant for FY 16 funded 712 spaces and includes both expansion (new) (428) and improvement spaces (for a longer period of time) (248). In order to honor Connecticut's mixed delivery system, the recipients included 19 public schools and 19 community-based provider sites (including 10 Head Start provider sites), offering either school/day school year or full day/full year spaces. Defs. RFA 872, Plaintiffs' Responses to Defendants' Third Request for Admissions, 12/2/15; Jones Taylor Tr. 5/10/16, pp. 75:22-76:9; Jones-Taylor Tr. 5/13/16, p. 121:6-26. 55. Since the PDG grant is limited to 4 year olds, the state supplemented the grant through quality enhancement funds in the amount of $456,411 to provide 112 spaces for 3 year olds to ensure diversity of age. Jones-Taylor Tr. 5/10/16, p. 76:10-15; Jones Taylor Tr. 5/13/16, p. 123:11-18; Adams Tr. 5/17/16, pp. 55:22-56:4, DTX 6446, PDG Locations, DTX 6438, Federal PDG Grant. 56. In an effort to address Bridgeport's unmet need, Bridgeport was the only Priority District allowed to apply for the PDG. Otherwise, the recipients were the Competitive School Districts which typically do not receive the slots they need. Jones-Taylor Tr. 5/13/16, pp. 174:4-175:19; Jones Taylor Tr. 5/17/16, pp. 11:21-12:13. 57. Due to Bridgeport's School Readiness liaison's modest proposal for the PDG in comparison to Bridgeport's unmet need, the OEC Commissioner actually called Bridgeport's Superintendent to encourage the district to apply. Bridgeport received funding for 270 spaces and 18 classrooms though the first year of the PDG grant for a total of $4,008,350. DTX 6453, Pre-K Funding Selected Districts; Jones Taylor Tr. 5/17/16, pp. 12:14-13-9; Defs RFA 873, Doc. # 301.00. 58. Bridgeport also received $215,259 in quality enhancement funds through the PDG grant for FY 16 to support spaces and comprehensive services for ineligible children under the grant due to their age and income requirements. Defs. RFA 875, Doc. #301.00. 59. The local School Readiness Council, of which the Superintendent and Mayor of Bridgeport or their designees are members, administered the PDG through a School Readiness liaison. Despite PDG funds being used to hire an additional liaison for Bridgeport to assist with filling the additional PDG spaces, Bridgeport is responsible for the lion share of unspent funds for the PDG grant for FY 16, specifically $240,000 of the total $400,000, the other districts having high utilization rates. OEC approved Bridgeport's proposal to construct 3 new classrooms based on the understanding that the 54 children would be placed in temporary spaces within the
54
community which never occurred. The construction was not completed until December 2015. The 54 spaces remained unfilled from July 2015 until February 2016 when 50 children were enrolled. Full enrollment did not occur until April 2016. Jones-Taylor 5/10/16, pp.138:26-140:20; Jones Taylor 5/17/16, pp. 13:16-15:10. 60. The Superintendent was not aware of the unspent funds for the PDG grant until it was brought to her attention by the OEC Commissioner, following which the Superintendent was provided direct reports of unspent funds. Jones-Taylor Tr. 5/10/16, pp. 141:23-143:1. 61. In order to address the research showing transportation as a barrier to parents accessing pre-K, funding for transportation was provided by the PDG grant. Decisions were made at the program level on the use of the funds whether for buses/vans or as a transportation subsidy through bus fares. The transportation subsidy provided by programs to parents through the PDG grant went unspent because of carpooling. Jones-Taylor Tr. 5/10/16, pp. 140:21-141:22; Jones-Taylor 5/13/16, p. 126:16-26.
G. Total State/Federal Spending on Pre-K
62. The State provides $107.5 million, serving 13,520 children through the state funded programs, namely School Readiness, Child Day Care Contracts and Smart Start. In addition, the state provides $0.5 million to the federal Preschool Development Grant for serving 112 children, $5.6 million to State Head Start to extend the day of a Head Start program or extend the year of a Head Start program. In addition, the federal government provides $10.8 million for the federal Preschool Development Grant for serving 712 children, $9.1 million for the federal portion of the Child Day Care Contracts serving 985 children, $63.8 million for the federal Head Start programs serving 6,691 children and $40.6 million the Care4Kids programs, providing a subsidy to 13,046 children within licensed and unlicensed programs. The total state and federal funding for pre- K in Connecticut is $237 million serving approximately 35,000 children for primary preschool experience and/or a subsidy to help pay for preschool. Not included in these figures is the state funding provided by the Capital improvement grants or the quality enhancement grants. DTX 6449, FY 16 Preschool Funding, Adams Tr. 5/17/16, pp. 56:4-58:17, 60:6-18, 100:26-101:19.
H. Pre-K in Public, Magnet and Charter Schools
63. Access to pre-K has also been expanded through the pre-K spaces offered by magnet and charters schools as well as the districts which use their own funds to provide pre-K. Jones-Taylor Tr. 5/10/16, p.77:6-16; Jones-Taylor Tr. 5/13/16, pp. 132:2-133:7; DTX 6472, Magnet pre-K tuition, Cohn Tr. 5/26/16, pp. 50:10-52:1; DTX 6382, PK Enrollment Counts, Gopalakrishnan Tr. 5/18/16, p. 138:7-23.
I. Other Sources of Pre-K Funding/Facilities Funding
64. Minor Capital Improvement Grants are available for individual state funded programs to improve existing facilities, including security systems, playgrounds improvements, HVAC systems, roofs, windows, sinks etc. Jones-Taylor Tr. 5/10/16, pp. 71:3-73:18; Adams Tr. 5/17/16, pp. 50:9-19, 51:7-52:5.
55
65. Minor Capital Improvement Bond Funds were awarded in three cohorts in 2013, 2014 and 2015 in the amounts of $5,601,232, $2,475,396, and $7,454,986 respectively for a total of $15.7 million. Defs. RFA 883, Doc. #301.00. 66. Of those bond funds, Bridgeport received $1,093,279, $497,170 and $679,995 respectively for the three years for a total of $2,270,444. New Britain received $272,000, $70,000, and 190,000 respectively for the three years for a total of $532,000. New London received $292,000, $54,494, and $178,510 respectively for the three years for a total of $525,004. Danbury received $50,000, $41,885 and $318,742 respectively for the three years for a total of $410,627. Plainfield received $81,902 for the third year. Defs RFA 884, Doc. #301.00. 67. The School Facilities Construction Grant Program provides a 5% increase in the reimbursement rates to any district or regional school district for any new building or expansion of an existing building for an elementary school that includes space for an early childhood program for the portion of the building where the program is located. Dixon Tr. 6/3/16, p. 49:4-17. 68. The School Facilities Construction Grant Program provides a 10% increase in the reimbursement rates to any district or regional school district for full day kindergarten programs and full day preschool programs for the portion of the building where the program is located. Dixon Tr. 6/3/16, p. 49:18-23.
J. Unspent Funds
69. Unspent funds have been an issue for the state and federal pre-K programs, including roughly $2.1 million in School Readiness funds, $1.8 million in CDCs funds and $400,000 in federal Preschool Development Grant (hereinafter "PDG") funds for FY16. Jones-Taylor Tr. 5/10/16, p. 130:15-23. 70. Local School Readiness Councils vary in their ability to meet the challenge of filling Pre-K spaces that build up or accumulate from the beginning of the fiscal year in July when School Readiness funding becomes available as well as when a child leaves midyear or for kindergarten. The challenge requires the Local School Readiness Councils to be proactive given that they know their allotment every July and need to have good connections and relationships in the community with the providers to communicate with parents to fill the Pre-K spaces. Jones-Taylor Tr. 5/10/16, pp. 130:24-133:14, 134:16-135:12. 71. The same challenge occurs in expansion years due to a lack of planning time between May when the expansion proposal is announced and July when the budget is passed. In Adam's experience as the former Manager of the School Readiness Grant, smaller districts handle expansions better than larger districts but, in general, the liaisons for School Readiness Councils who work well with their Council and also go around their neighborhoods to establish good relationships with their providers do better in handling the expansion and filling spaces. Adams Tr. 5/17/16, p. 34:27-35:9.
56
72. In order address the issue of unspent funds, OEC follows a process of contacting local School Readiness Councils in October following the availability of School Readiness funds in July to determine chronically unfilled slots. The Councils are asked to come up with a plan to fill the spots quickly. If the spots are not filled by November, the spots are redistributed to other communities that have a need and the capacity to fill them. Joes-Taylor Tr. 5/17/16, pp. 16:10-17:15. 73. Bridgeport is one of 3 districts which historically have unspent funds. The other 2 districts are Hartford and Waterbury. For FY 15, Bridgeport and Waterbury each had over a half million dollars of unspent funds while Hartford had over $1 million. As of February 2016 before the final tally of unspent funds in May 2016 for FY 16, Bridgeport and Waterbury each had over $430,000 of unspent funds and Hartford had $650,579. Jones-Taylor Tr. 5/10/16, pp.136:18-138:10; DTX 6293, Unspent SR Funds 2010-16. 74. To address the issue of chronic unspent funds in Bridgeport, Hartford and Waterbury, Adams in her former position of Manager of the School Readiness Program would attend the School Readiness Council meetings in those districts to talk candidly about the need for the public schools and community providers to work better together to fill the spaces and the consequences of losing the spaces to other communities. She also went to the Mayor's Office in Hartford to discuss the issue. Adams Tr. 5/17/16, pp. 32:26-33:14. 75. In comparison, the amounts of unspent funds for the other 5 Focus districts, including Danbury, East Hartford, New Britain, New London and Windham are significantly lower even giving consideration to the larger number of children served by Bridgeport compared to these districts. For FY 15, the following are the amounts of unspent funds for Danbury-$170,600, East Hartford-116,800, New Britain-$3,613, New London-$97,560, and Windham-$94,280. The following are the amount of unspent funds for FY 16 as of February 2016 before the final tally of unspent funds in May 2016: Danbury-$39,984, East Hartford-$40,901, New Britain-$14,793, New London-$23,349, and Windham-$68,171. Jones-Taylor Tr. 5/10/16, p. 138:11-24, DTX 6293, Unspent SR Funds 2010-16. 76. New Britain has a "very good track record" over the last 6 years of figuring out how to fill their Pre-K spaces. Jones-Taylor Tr. 5/10/16, p. 135:14-20; Granucci Tr. 2/4/16, pp. 159:15-160:5. 77. New Britain maxed out the number of its preschool providers receiving School Readiness funding through a cooperative venture between community providers and the Board of Education. By the 2011/12 school year, every preschool provider in New Britain was recipients of the School Readiness grant except for the parochial schools and the cooperative nursery school. Shortly, thereafter, one of the parochial schools became a recipient of School Readiness funding. Granucci Tr. 2/4/16, p. 162:7-163:12. 78. Granucci attributed New Britain's high percentage of Pre-K experience of 79% for the 2011/12 school year compared to that of other districts, including Bridgeport's percentage of pre-K experience of 65%, to the great collaboration among agencies in cooperating to connect parents to programs. She pointed to the example of the Board of Education providing space to
57
Head Start and the Y to open classrooms through School Readiness funding when they had no space. Granucci Tr. 2/4/16, p. 164:4-16. 79. During the past 6 years, Bridgeport's total of unspent School Readiness funds is $2,136,483, New Britain's total of unspent School Readiness funds is $128,148, Bridgeport's total is $2,136,483, Danbury's total is $413,993, New London's total is $165,339, East Hartford's total is $279,166, and Windham's total is $316,157. DTX 6453, Pre-K Funding Selected Districts.
K. Unmet Need Report
80. To date, Connecticut's focus on universal access for pre-K has been directed at poor families in poor communities as identified in unmet need studies limited to certain poor districts; specifically the Priority and Competitive School Districts. This direction will change with the new unmet need report which will determine the need statewide not just for pre-k but infant toddler care, the need from birth to age 5. In addition, the new unmet need report will determine the density of the need and the access to available programs, what families need, not just in terms of the dosage presently offered but additional options of night/weekend care. The report will also examine the reasons for family preference in not sending their child to pre-K. Jones-Taylor Tr. 5/10/16, pp. 82:11-83:13, 125:23-130:14; Jones-Taylor Tr. 5/13/16, pp. 148:15-23, 156:1-17; DTX 6399, Unmet Need Reports Differences; DTX 6231, Program Location. 81. The new report will also show the status of each community in terms of its leadership in rallying program providers to do their work to meet the need. Adams Tr. 5/17/16, p. 114:11-26. 82. The previous unmet needs reports were not studies but surveys collected by the School Readiness Councils; the accuracy of which was only as good as the effort made by the Councils to collect accurate data. Although OEC helped to create the survey with questions aimed at determining the community need for preschool and provided data on population, licensing programs, charters, magnets, the School Readiness Councils, there was no consistency as to the method of collection by the Councils. Those reports are considered unreliable. Adams Tr. 5/17/16, pp. 86:27-88:20, 102:21-103:6, 112:16-17. 83. The wide variation in non participation rates from 70% to 90% reported by local School Readiness Councils with no rationale for the 2014 Unmet Need report caused OEC in consultation with CHEFA (Connecticut Health and Educational Facilities) to use the non participation rate provided by the National Household Education Survey Program for that report. Jones-Taylor Tr. 5/13/16, p. 155:3-25; Adams Tr. 5/17/16, pp. 88:21-89:11. 84. No other state calculates unmet need for purposes of funding. Adams Tr. 5/17/16, p. 89:19-24. 85. The different numbers on unmet need set forth in the 2014 OEC unmet need, the two reports by CHEFA and the Governor's proposal of 4,010 space for universal access created the reason for the new unmet need report to provide a good target number to address the need. Jones-
58
Taylor Tr. 5/13/16, 173:4-10, PTX 675, 2014 OEC Unmet Need Report, PTX 515, 2013 CHEFA Report, PTX 924, CHEFA 2014 Smart Start Study.
L. OEC Initiatives 86. Among the initiatives undertaken by OEC is an initiative to improve the child care licensing system to ensure basic health and safety as the foundation to early care and education. This initiative included the drafting of a standardized procedure manual and the hiring of 17 new licensing staff to conduct annual inspections of child care programs. Jones-Taylor Tr. 5/10/16, pp. 150:4-152:4. 87. Among the initiatives undertaken by OEC is the development of an integrated home visiting system and a universal screening for development delays. Jones Taylor Tr. 5/10/16, pp. 167:17-168:11. 88. Among the initiatives undertaken by OEC is the development of a quality rating improvement system ("QRIS") with the development first of the quality improvement system rather than the rating system. The focus is to improve the quality of care that children receive through providing professional development and mentoring/coaching of teachers as well as technical assistance and consultation for early care and education programs. The building of the QIS infrastructure has begun with United Way's construction of the website and robust trainings occurring this summer. Jones Taylor-Tr. 5/13/16, pp. 159:6-162:20, 177:13-178:3, DTX 6454, QIS. 89. The standard conceptualization of the QRIS is different levels of quality and incentives for programs to reach those different levels. Jones-Taylor Tr. 5/10/16, pp. 159:22-162:20; Adams Tr. 5/17/16, p. 121:18-24. 90. OEC has chosen to focus on a quality improvement system rather than a quality rating system because of the national debate about the effectiveness of the rating system on improved outcomes and the lack of research showing the same. The QIS will be developed for the next 2 years, followed by a pilot in the 3rd year and full implementation in the 4th year with the statewide rating being implemented in the 5th year. Jones-Taylor Tr. 5/13/16, pp. 153:5-156:11, 157:10-20, 181:13-182:7. 91. Among the initiatives undertaken by OEC is development of an early childhood data system, the Early Childhood Information System ("ECIS") which is considered the "holy grail" of the early childhood field in providing data on how children from birth to age 5 are being served or the constellation of state services children are receiving whether through early intervention, home visiting services, pre-K etc. It will provide an unduplicated count of children who are receiving services through the assignment of a state assigned student identification number ("SASID") number that a child will have through grade 12. Among the benefits specific to pre-K is the tracking of program funding to determine how programs fund slots through parent fee or subsidy. Together with the new unmet need report, it will allow for integrating the pre-K services to target the need. Jones-Taylor Tr. 5/10/16, pp. 164:19-167:16, 170:5-173:16.
59
92. Among the initiatives undertaken by OEC is the reconstruction of the professional development system which is associated with the QIS but broader in reviewing the trainer approval system and the competencies associated with training the early childhood workforce. 93. The competencies have been developed through the Core Knowledge and Competency Framework ("CKCs") which are guidance standards for what practitioners should know and be able to do in working with young children and families from birth to age 5. The practitioners include the varying levels of the early childhood spectrum, including higher education, teachers, coaches, social workers, mental health professionals. The CKCs are the foundation for the QIS. Adams Tr. 5/17/16, pp. 69:2-70-24, 71:5-23, 77:1-12, 121:25-122:8. 94. Connecticut is the only state to design CKCs that are interdisciplinary in that the shared competencies are common across multiple roles of practitioners in addition to the specific competencies unique to a role. Adams Tr. 5/17/16, p. 71:5-23. 95. Among the initiatives undertaken by OEC is the development of the Early Learning and Development Standards of what children should know and be able to do from birth to age 5. Curriculum will be tied to these standards. Jones-Taylor Tr. 5/10/16, p. 112:3-21. 96. As part of a 7 state consortium through a $4.9 million grant, OEC has developed a new Kindergarten Entrance Inventory ("KEI") based on the ELDs which is an informative assessment for Kindergarten children that will be administered by the Department of Education. Jones-Taylor Tr. 5/10/16, pp.146:15-147:26. DTX 6285, KEI. 97. The Pre-K-Grade 3 Leadership Program is a yearlong program developed jointly by OEC and the University of Connecticut NEAG School of Education to train administrators, including principals and superintendents, as well as lead teachers, community provider directors, special education providers on curriculum and instruction, assessment and evaluation for early child development from pre-K through Grade 3. The program is funded by OEC in the amount of $320,000 for two cohorts, Cohort 1,July 2015-May 2016 having ended and Cohort II, July 2016-May 2017, presently taking place. OEC offers grants of $1500 per participant to defray the tuition cost. Districts across the state have participated, including the Plaintiffs' Focus districts, specifically the Preschool Coordinator, School Readiness Coordinator, and Instructional Kindergarten Coach for New Britain, the Director of Early Childhood and the Executive Director of Elementary Education for Bridgeport, the Assistant Superintendent and a principal for East Hartford. Jones-Taylor Tr.5/10/17, pp. 173:17-175:25, DTX 6401.
M. Kindergarten
98. Of the 169 School districts in Connecticut, 143 Districts offer full day kindergarten. In addition, 13 charter schools and 14 magnet schools offer full day kindergarten. Gopalakrishnan Tr. 5/18/16, pp. 133:23-134:22, DTX 4349, Kindergarten Enrollment 2014-15. 99. The percentage of children enrolled in full-day kindergarten in Connecticut has increased dramatically in the past 4 years to 94.2% for the 2014/15 school year. Defs. Demo 011, Full Day Kindergarten Participation; Gopalakhrisnan Tr. 5/18/16, p. 134:7-22.
60
VI. English Learners
1. In 2014-15, Bridgeport had 3089 ELs in dual language, transitional bilingual, sheltered instruction, push-in content based ESL, pull-out ESL, language transition support services, and Native Language tutoring programs. DTX 5688 (Bpt Title III AER), pp. 1-2. The district had 32 TESOL certified teachers, 42 bilingual certified teachers, 12 paraprofessionals, all who received ESL training. Id. at pp. 1-2. Examples in the "Evidence of Student Success" section include, but are not limited to: Bilingual Talented and Gifted Expo and Debate Winners; and The Mary McCann Bradicich Scholarship for ELLS graduating seniors achieving academic excellence, academic progress of recently mainstreamed or LTSS students, National Honor Society membership, Science Fair and Science Expo demonstrations, participants and winners in writing contests, and participation in poetry contest, afterschool organized sports, district-wide Debate and Math Teams. Id. at 2; DTX 4739 (Bridgeport Bil AER), pp. 1-2. 2. In 2014-15, Danbury had 2414 ELs in transitional bilingual, sheltered instruction, push-in content-based ESL, pull-out ESL, and Newcomers/Acculturation class programs. DTX 6373 (2014-15 Danbury Title III AER), pp. 1, 3. The district had 24 TESOL certified teachers, 24 Bilingual certified teachers, 22 ESL/Bilingual Paraprofessionals, 1 ELL Department Head at DHS; 5 SIOP Coaches (2 at high school/3 at middle schools), all of whom received ESL training. Id. at. 1-3. The "Evidence of Student Success" section includes, but is not limited to: increased academic and fluency skills, increase in classroom participation and other school activities, student of the month awards, All City Orchestra, improved DRA reading levels and LAS Links scores, honor roll, schoolwide awards, participation in Science Fair and Invention-Convention (2 competing state-wide), first prize in a local poetry contest, and numerous students exited EL status. Id. at 3-5; DTX 6338 (2014-15 Danbury Bilingual Grant AER Report), pp. 1-3. 3. In 2014-15, East Hartford had 714 ELs in dual language, transitional bilingual, sheltered instruction, push-in content based ESL, and pull-out ESL programs. DTX 6340 (EH Title III AER), p. 1. The district had 9 TESOL certified teachers, 6 bilingual certified teachers, 1 bilingual paraprofessional and 10 bilingual tutors, all who received ESL training. Id. at 2. The district provided examples in the "Evidence of Student Success" section. First, a student who came to EHHS at the beginning of last school year from another country with interrupted schooling and very little exposure to English made steady growth, and as an 11th grader in the next year, was highly recommended to begin the Allied Health program where she hopes to start working toward a nursing career. Secondly, a 16 year old new English language acquisition arrival at EHHS as a 9th grader, who after being placed in the Team Aspire EL team, her English and literacy skills continued to steadily increase and as a senior, she has taken many of her classes off of Team Aspire and is on target to graduate with the plan to start a C.N.A. course this summer and go on to a 4 year college in the future. Id. at 2-3. Other examples include bilingual students successfully taking advantage of Rosetta Stone programs on ipads and computers, which provided intensive practice speaking, listening, reading, and writing English; and several EHHS students were honored at the school's quarterly celebrations for their grades. DTX 4741 (EH Bilingual AER), pp. 1-2.
61
4. In 2014-2015, New Britain had 1761 ELs in dual language, sheltered instruction, push-in content-based ESL, and pull-out ESL programs. DTX 4805 (NB Title III AER report), pp. 1-2. The district had 6 TESOL certified teachers, 34 Bilingual certified teachers, 2 English Language Development (ELD) tutors, and 4 language support assistants, all who have received ESL training. Id at 2. The "Evidence of Student Success" section sets out the number of EL students receiving various awards: Citizenship Award – 17; student of the Month Award – 65; Perfect Attendance – 10; Academic Improvement Award – 4; Spelling Award – 4; Math Award – 17; Honor roll – 13; Superintendent Student of the Month – 3; Presidential Award gold – 1; Social Studies Award – 4; Health Award – 1; top Student Foreign Language – 1; Star Scholar – 6; Student Art Show Award – 1; Certificate of Excellence – 7; Scholarships – 13; Reading Award – 16; Writing Award – 11; NWEA Reading Award – 2; ELD Award – 12; Science Award – 4; Technology Education Award – 1; National Jr. Honor Society – 1. Id. at 2-3; DTX 4743 (2014-15 NB Bilingual Grant AER), pp. 1-2. 5. In 2014-15, New London had 738 ELs in dual language, sheltered instruction, push-in content-based ESOL and pull-out ESOL programs. DTX 4808 (NL Title III AER), pp. 1-2. The district had 10 TESOL certified teachers, 20 Bilingual certified teachers, 18 bilingual tutors, all of whom received ESOL training. Id. at 2. Examples in the "Evidence of Student Success" section include: third graders at Jennings grew at a faster rate than the National Expected Growth and at a faster rate than students at the other two elementary schools in math on the NWEA universal screener; and the number of ELs who graduated in 4 years increased 10% from 2012-14. Id. Also related to NWEA MAP Data student success, ELs in grades 4,5,6,7, and 9 exceeded the expected growth target in Math, with grade 7 ELs exceeding by almost double the expected growth norm. DTX 4744 (2014-15 NL Bilingual AER), p. 1, 5. And that year's 7th grade ELs scored 15% higher in the LAS Links proficiency and advanced ranges than last year as 6th graders. Id. at 2, 6. 6. In 2014-15, Windham had 814 ELs in dual language, transitional bilingual, sheltered instruction, push-in content based ESL, pull-out ESL programs and students working with tutors in content area classes. DTX 6339 (Windham Title III AER), pp. 1-2. The district had 19 TESOL certified teachers, 12 Bilingual certified teachers, 9 DSAPs or Long term subs certified in other states, all of whom received ESL training. Id. at 2. Examples of "Evidence of Student Success" include: parents of students from two non-Spanish speaking countries gave positive feedback about their children's experiences in school, and everyone participated in WHS' play as part of their final exam. Id. at 3. Other examples include, but are not limited to: WHS students participated in Varsity and JV athletics (some named to All State and All League teams), participation in the exchange trip to Spain, cheerleading, art shows and painting murals, spoke in English about experiences in New Arrivals Program, graduation rate for ELs increased more than that of any other group. DTX 4748 (Windham Bilingual AER), p. 1. At WMS, one student received a citizenship award from the town, an exited student was named valedictorian of the 8th grade class and spoke to her classmates about achieving academically and learning English, participation in the Puentes al Futuro program and sports teams, 3 students received the TESOL awards form their Small Learning Communities and another was recognized for achievement on the NWEA and college readiness. Id. at 2. At Sweeney, students made huge gains socially, emotionally, behaviorally and academically in English and in content areas (NWEA growth). Id. At Barrows STEM Academy, two 6th graders made 2 years of grown on MAPS testing, other
62
bilingual and LTSS students participated in Invention Convention and the school-wide musical. A bilingual student received the Problem Solving award, and another received an award for being most improved in all academic areas. Id.
VII. Wraparound Services
A. The social and emotional health of students
1. Connecticut was one of only 12 states awarded the School Climate Transformation Grant, which provides on-site positive behavioral interventions and supports [PBIS] training to districts, with the first cohort including Bridgeport, and stipends for substitutes during trainings, as well as tiered fidelity inventory in 300 schools in the state where PBIS systems are assessed and recommendations made on how to improve them. Frassinelli Testimony, 5/6/16, pp. 65-6, 69-70.
2. The social worker on staff in the CSDE's Bureau of Health/Nutrition, Family Services & Adult Education (the "Bureau") provides biannual trainings for school social workers, works on crisis preparedness and response, assists districts after tragedies, assesses and develops guidelines for alternative education programs, helps develop guidelines for trauma informed care, and works on the school-based diversion initiative, which provides professional development and training to help schools in Bridgeport, East Hartford, New Britain and other districts prevent Tier 3 students from being referred to court or arrested, and connects schools with community-based support, which has led to a 45% reduction in court referrals as well as improved attendance rates and decrease in chronic absenteeism rates. Frassinelli Testimony, 5/6/16, pp. 74-81; DTX 6052.
3. Connecticut was one of only 5 states to receive the Safe Schools Healthy Students Grant, which provides $2M over 4 years each to Bridgeport (11 schools), New Britain (16 schools) and Middletown (11 schools) for work around early childhood development, social-emotional behavioral support for students (including RULER and SOARS/AIM in Bridgeport and Boys Town and Klingberg family center in New Britain), building family and community partnerships, drug and alcohol prevention, and school safety and violence prevention. Frassinelli Testimony, 5/6/16, pp. 84-9.
B. The physical health of students
4. The Bureau oversees numerous school nutrition programs. Frassinelli Testimony, 5/6/16, pp. 38-42.
5. Connecticut is one of the top 3 states in adding school breakfast programs since 2009. Id.
C. The mental health of students
6. The school psychologist on staff at the Bureau provides professional development, trainings, orientation, best practices, guidelines, and technical assistance to school psychologists in districts. Frassinelli Testimony, 5/6/16, pp. 52-3; DTX 4226
7. Special education bureau resources, including guidelines for school psychologists and special education identification);
63
D. Assistance for preparation and transition to college
8. The school counselor on staff at the Bureau provides technical assistance, best practices, guidance, professional development and training to school counselors around core competencies, including college and career readiness, social skills and behavioral skills development, works on the "Connecticut Comprehensive School Counselor Program" to provide training and technical assistance to school counselors in CT on subjects including study habits, career exploration, and social-emotional skills, and on the "American College Application Campaign" in New Haven and Bridgeport which brings in supports for students in applying for colleges. Frassinelli Testimony, 5/6/16, pp. 70-4.
E. After school and extended learning programs
9. There are several state and federally funded after school and extended learning programs in CT, including: state after school grant program, including 9 schools in Bridgeport, 6 schools in New Britain, 3 schools in Windham and 2 schools in New London; state extended school hours program in all Priority School Districts totaling $2.9M per year; 21st Century Community Learning Center after school and expanded learning time in all focus districts; all of which have led to improvements such as increases in attendance and reductions in suspensions. Frassinelli Testimony, 5/6/16, pp. 113-21
F. Assistance for families in high poverty communities
10. The Bureau assists families in high poverty communities through youth service bureaus and family resource centers, with funding totaling about $3.5M and $3M, respectively. Frassinelli Testimony, 5/6/16, pp. 121-5.
G. Assistance for homeless and transient students
11. The McKinney-Vento Act grant and associated supports by the Bureau assist homeless and transient students in 12 CT districts, including Bridgeport, New London and Windham. Frassinelli Testimony, 5/6/16, pp. 125-7.
H. Support for pregnant and parenting teens
12. The Bureau provides support for pregnant and parenting teens and young parents through various programs, which have led to positive academic and non-academic results for those students. Frassinelli Testimony, 5/6/16, pp. 110-12.
I. Wraparound programs specifically for Commissioner's Network schools
13. The scholar development room at Dunbar School in Bridgeport has led to decreased in- and out-of-school suspensions and is being sustained by hiring of behavioral coach and PBIS training through Commissioner's Network funding. DTX 6428; Frassinelli Testimony, 5/6/16, pp. 128-36.
14. The dental clinic and ALIVE trauma informed care program at Curiale School in Bridgeport have led to decreased in- and out-of-school suspensions and increases in oral reading
64
and math computation scores on AIMSWeb test, and are being sustained by partnerships with Southwest Community Health Center and the United Way, respectively. DTX 6426; Frassinelli Testimony, 5/6/16, pp. 128-36.
15. The ALIVE program at DiLoreto School in New Britain has led to decreased in- and out-of-school suspensions and chronic absenteeism rates as well as gains in literacy and numeracy, and is being sustained through Commissioner's Network funding. DTX 6427; Frassinelli Testimony, 5/6/16, pp. 128-36.
J. Assistance for adult learners
16. The reimbursement rates for adult education in 2015-16 ranged from 0-65%, with 5 of the 6 focus districts above 61% and Danbury at 48%. DTX 6406.
17. Connecticut is one of only 7 states in the U.S. that reimburses for adult education, providing over $19M annually. Frassinelli Testimony, 5/6/16, pp. 141-6.
18. CT also provides trainings and technical assistance for adult education directors, an adult reading incentive program in New Haven and Bridgeport, which have led to improvement in literacy levels, and a transition to community college pilot program in North Haven, Meriden and Manchester, which have led to decreases in the need for remedial classes. Frassinelli Testimony, 5/6/16, pp. 141-6.
K. Specific critical issues that impact student achievement
1. Student discipline
19. The CSDE is making many efforts to address issues relating to student discipline, including guidance documents, trainings on cultural competency, positive school climate development (48 districts), and PBIS (39 schools), the positive and effective discipline work group, and specific focus and technical assistance on student discipline in the Alliance Districts under the "climate" section of the alliance district plans, which have led to reductions in in- and out-of-school suspensions throughout the state. Frassinelli Testimony, 5/6/16, pp. 57-61.
2. Chronic absenteeism
20. The CSDE is also making many efforts to address issues relating to chronic absenteeism, including the interagency council for ending the achievement gap, best practices workshops, the Strategic Action Group, and specific focus and technical assistance on chronic absenteeism in the Alliance Districts under the "climate" section of the alliance district plans, which have led to reductions in rates of chronic absenteeism in the focus districts that have outpaced the state average. Frassinelli Testimony, 5/6/16, pp. 137-40; Defs' Demonstrative 12 (reductions in chronic absenteeism in focus districts and statewide); Wentzell Testimony, 5/5/16, p. 68 (CT is recognized nationally as a leader in chronic absenteeism work).
L. Assistance to districts in building community partnerships and increasing family engagement
21. The CSDE has also dedicated significant time and resources into assisting districts in building community partnerships and increasing family engagement in their schools, including
65
the Alliance District Convening meetings on best practices and assistance for Alliance Districts to connect with community partners, School Governance Councils, the Family Engagement Conference and Commissioner's Roundtable on family engagement, Friday CAFEs for Alliance Districts and others, and Parent Universities. Frassinelli Testimony, pp. 92-110.
VIII. NAEP Grades 4 and 8
*See Findings of Fact Per 5/9/16 Order (Doc. # 326) ## 196-217 (NAEP Grade 12) 1. NAEP provides a measuring stick to look at the performance of states across the country to see how Connecticut's performance compares to other states in different respects. State assessments do not allow for similar comparisons because of different state assessments with different content standards. NAEP is highly regarded and often referred to as the gold standard. (Savoie Testimony 4/27/16, pp. 144:11-27, 145:1-4; Savoie Testimony 5/5/16, pp. 164:14-27, 165:1-14). A. Overall 2. Only Massachusetts outperformed Connecticut on the NAEP Grade 4 Reading assessment for 2015 while 13 states, including New Jersey, performed not differently than Connecticut and 35 states performed lower than Connecticut. Savoie Tr. 4/27/16, pp. 97:27, 98, 99:1-7, 19-27, 100:1-6, 27, 101:1-9, 103:5-16; 106:23-27, 107:1-2, 8-19; DTX 6300, 6302, 5755. 3. No states outperformed Connecticut on the NAEP Grade 8 Reading assessment for 2015 while 5 states, including Massachusetts and New Jersey, performed not differently than Connecticut and the majority, 44 states, performed lower than Connecticut. (Savoie Tr. 4/27/16, pp. 97:27, 98:1, 100:9-16, 104:13-24, 107:20-24, 27, 108:1-2, 4-6; DTX 6300, 6302, 5755). 4. Connecticut performed the same as 20 other states on the NAEP Grade 4 Math assessment for 2015 while 16 states outperformed Connecticut and 13 states performed lower than Connecticut. Savoie Tr. 4/27/16, pp. 106:23-27, 107:1-8, DTX 6300, 6302, 5755. 5. Connecticut performed the same as 21 other states on the NAEP Grade 8 Math assessment for 2015 while 9 states outperformed Connecticut and 19 states scored lower. Savoie Tr. 4/27/16, pp.106:23-27, 107:1-2, 20-27, 108:1-8, 164:14-27, 165:1-14; DTX 6300, 6302, 5755). 6. No state reached the NAEP proficiency standard of "competency over challenging subject matter" in the NAEP Grades 4 and 8 Math and Reading assessments for 2015 except for Massachusetts and Minnesota in the Grade 4 Math assessment. (Savoie Tr. 4/27/16, pp. 93:10-22, 102:7-14, 27, 103:1, 104:10-12; PTX 528 at pp.15-16, DTX 5755).
B. Subgroup Performance 7. Connecticut's NSLP subgroup performance on the NAEP Grade 4 Reading assessment for 2015 is not different than that of 32 other states, including New Jersey as well as National
66
Public (the nation). Eleven other states outperformed Connecticut and 6 states and the District of Columbia performed lower than Connecticut. Savoie Tr. 5/5/16, pp. 111:23-27, 112:1-12, 133:26-27, 134:1-27, 135:1-12; DTX 6182, 6391. 8. Connecticut's NSLP subgroup performance on the NAEP Grade 4 Math assessment for 2015 is not different than that of 9 other states and the District of Columbia. Forty other states outperformed Connecticut. Savoie Tr. 2/27/16, p. 111:3-18; DTX 6179, 6384. 9. Connecticut's NSLP subgroup performance on the NAEP Grade 8 Reading assessment for 2015 is not different than that of 35 states, including Massachusetts and New Jersey as well as National Public. Thirteen other states and the District of Columbia performed lower and only one state outperformed Connecticut. Savoie Tr. 4/27/16, pp. 135:13-27, 136:1-3; DTX 6188, 6392. 10. Connecticut's NSLP subgroup performance on the NAEP Grade 8 Math assessment for 2015 is not different than that of 16 other states. Thirty-two states outperformed Connecticut. One state and the District of Columbia performed lower. Savoie Tr. 4/27/16, p. 113:12-22, DTX 6185, 6385. 11. Connecticut's Black subgroup performance on the NAEP Grade 4 Reading assessment for 2015 is not different than that of more than half the country, including National Public. Six states outperformed Connecticut. Two states performed lower than Connecticut and 9 states do not have reportable data. Savoie Tr. 4/27/16, pp. 110:19-27, 111:1-7; DTX 6180). 12. Connecticut's Black subgroup performance on the NAEP Grade 4 Math assessment for 2015 is not different than that of more than half the country. Twelve states outperformed Connecticut. Eight states do not have reportable data. Savoie Tr. 4/27/16, pp. 108:20-27, 109:1-10; DTX 6177. 13. No state outperformed Connecticut for the Black subgroup on the NAEP Grade 8 Reading assessment for 2015 and Connecticut's performance is not different than that of more than half the country, including Massachusetts and New Jersey as well as National Public. Three states and the District of Columbia performed lower than Connecticut and 8 states do not have reportable data. Savoie Tr. 4/27/16, pp.113:23-27, 114:1-7; DTX 6186). 14. Only one state, New Jersey, outperformed Connecticut for the Black subgroup on the NAEP Grade 8 Math assessment for 2015 and Connecticut's performance is not different than that of most of the country, including Massachusetts and National Public. Eleven states do not have reportable data. Savoie Tr. 4/27/16, p. 112:13-27; DTX 6183. 15. Only one state outperformed Connecticut for the Hispanic subgroup on the NAEP Grade 4 Reading assessment and Connecticut's performance is not different than that of most of the country, including Massachusetts and New Jersey as well as National Public. Seven states performed lower than Connecticut and 3 states do not have reportable data. Savoie Tr. 4/27/16, p. 111:8-22, DTX 6181.
67
16. Connecticut's Hispanic subgroup performance on the NAEP Grade 4 Math assessment for 2015 is not different than that of 23 other states. Twenty-three other states and the District of Columbia outperformed Connecticut. Three states do not have reportable data. Savoie Tr. 4/27/16, p. 109:16-27, 110:1-2; DTX 6178. 17. No state outperformed Connecticut for the Hispanic subgroup on the NAEP Grade 8 Reading assessment for 2015. Most of the country's performance is not different than that of Connecticut, including that of Massachusetts and New Jersey. One state scored lower and 4 states do not have reportable data. Savoie Tr. 4/27/16, p. 114:8-15; DTX 6187. 18. Connecticut's Hispanic subgroup performance on the NAEP Grade 8 Math assessment for 2015 is not different than that of most of the country, including that of Massachusetts. Less than half the country outperformed Connecticut. Three states do not have reportable data. Savoie Tr. 4/27/16, p. 113:1-11; DTX 6184.
C. Achievement Gaps, including Grade 12
19. Connecticut's NSLP/non NSLP gap on the NAEP Grade 4 Reading assessment for 2015 is not different than that of 26 other states, including Massachusetts and New Jersey as well as National Public. Twenty-three other 23 states have a smaller gap and the District of Columbia has a larger gap than that of Connecticut. Savoie Tr. 4/27/16, pp. 127:15-27, 128:1-3, DTX 6346. 20. Connecticut's NSLP/non NSLP gap on the NAEP Grade 4 Math assessment for 2015 is not different than that of 16 other states, including Massachusetts and New Jersey. Thirty-three other states and National Public have a smaller gap and the District of Columbia has a larger gap than that of Connecticut. Savoie Tr. 4/27/16, pp. 124:24-27, 125, 126:21-27, 127:1-14; DTX 6343. 21. Connecticut's NSLP/non NSLP gap on the NAEP Grade 8 Reading assessment for 2015 is not different than that of 27 other states, including Massachusetts and New Jersey as well as National Public. Twenty-two other states have a smaller gap and the District of Columbia has a larger gap than that of Connecticut. Savoie Tr. 4/27/16, pp. 130:13-27, 131:1-5; DTX 6352. 22. Connecticut's NSLP/non NSLP gap on the NAEP Grade 8 Math assessment for 2015 is not different than that of 13 other states, including Massachusetts and New Jersey as well as the District of Columbia. Thirty-six other states and National Public have a smaller gap and no states have a bigger gap than that of Connecticut. Savoie Tr. 4/27/16, pp. 129:8-27, 130:1, DTX 6349. 23. Connecticut's NSLP/non NSLP gap on the NAEP Grade 12 Reading assessment for 2013 is not different than that of 3 other states, including Massachusetts and New Jersey. Nine other states and National Public have a smaller gap than that of Connecticut. Savoie Tr. 4/27/16, pp. 132:8-19; DTX 6358). 24. Connecticut's NSLP/non NSLP gap on the NAEP Grade 12 Math assessment for 2013 is not different than that of 3 other states, including Massachusetts. Nine 9 other states and
68
National Public have a smaller gap than that of Connecticut. Savoie Tr. 4/27/16, pp. 131:11-27, 132:1-3; DTX 6355. 25. Connecticut's Black/White gap on the NAEP Grade 4 Reading assessment for 2015 is not different than that of 16 other states. Twenty-four other states as well as National Public have a smaller gap, the District of Columbia has a larger gap than that of Connecticut and 9 states have no reportable data. DTX 6347. 26. Connecticut's Black/White gap on the NAEP Grade 4 Math assessment for 2015 is not different than that of 25 other states, including Massachusetts and New Jersey. Sixteen other states as well as National Public have a smaller gap, the District of Columbia has a larger gap than that of Connecticut and 8 states have no reportable data. DTX 6344. 27. Connecticut's Black/White gap on the NAEP Grade 8 Reading assessment for 2015 is not different than that of 31 other states, including Massachusetts and New Jersey as well as National Public while 10 states have a smaller gap, the District of Columbia has a larger gap, and 8 states have no reportable data. DTX 6353. 28. Connecticut's Black/White gap on the NAEP Grade 8 Math assessment for 2015 is not different than that of 21 other states, including Massachusetts and New Jersey. Seventeen other states as well as National Public have a smaller gap, the District of Columbia has a larger gap and 11 states have no reportable data. DTX 6350. 29. Connecticut's Black/White gap on the NAEP Grade 12 Reading assessment for 2013 is not different than that of 8 other states, including Massachusetts and New Jersey as well as National Public. One state has a smaller gap than that of Connecticut and 3 other states did not meet the NAEP reporting standards. DTX 6359. 30. Connecticut's Black/White gap on the NAEP Grade 12 Math assessment for 2013 is not different than that of 6 other states, including Massachusetts and New Jersey as well as National Public. Two states have a larger gap and one state has a smaller gap that that of Connecticut. Three states did not meet the NAEP reporting standards. DTX 6356. 31. Connecticut's Hispanic/White gap on the NAEP Grade 4 Reading assessment for 2015 is not different than that of 27 states, including Massachusetts and New Jersey. Nineteen other states as well as National Public have a smaller gap, the District of Columbia has a larger gap, and 3 states have no reportable data. DTX 6348. 32. Connecticut's Hispanic/White gap on the NAEP Grade 4 Math assessment for 2015 is not different than that of 17 other states, including Massachusetts and New Jersey. Twenty-nine other states as well as National Public have a smaller gap, the District of Columbia has a larger gap, and 3 states have no reportable data. DTX 6345. 33. Connecticut's Hispanic/White gap on the NAEP Grade 8 Reading assessment for 2015 is not different than that of 23 other states, including Massachusetts and New Jersey as well as
69
National Public. Twenty-two other states have a smaller gap, the District of Columbia has a larger gap and 4 states have no reportable data. DTX 6354. 34. Connecticut's Hispanic/White gap on the NAEP Grade 8 Math assessment for 2015 is not different than that of 10 other states, including Massachusetts and New Jersey. Thirty-six other states have a smaller gap as well as National Public and the District of Columbia has a larger gap and 3 states have no reportable data. DTX 6351. 35. Connecticut's Hispanic/White gap on the NAEP Grade 12 Reading assessment for 2013 is not different than that of 3 other states, including Massachusetts and New Jersey. Six other states and National Public have a smaller gap than that of Connecticut. Three other states did not meet the NAEP reporting standards. DTX 6360.
36. Connecticut's Hispanic/White gap on the NAEP Grade 12 Math assessment for 2013 is not different than that of 7 other states, including Massachusetts and New Jersey. Two other states and National Public have a smaller gap than that of Connecticut. Three other states did not meet the NAEP reporting standards. DTX 6357. 37. Connecticut's achievement gaps, including the NSLP/nonNSLP, White/Black, and Hispanic/White gaps, indicated by the NAEP Grades 4 and 8 Reading and Math assessments for 2015 and the NAEP Grade 12 Math and Reading assessments for 2013 are no different than those gaps of Massachusetts and New Jersey except in 3 instances; namely Connecticut's 2013 Grade 12 Math NSLP gap being larger than that of New Jersey and Connecticut's 2015 Grade 4 Reading White/Black gap being larger than Massachusetts and New Jersey. Savoie Tr. 4/27/16, pp. 140:12-27, 141:1-19; DTX 6376.
D. PISA
38. PISA (Program for International Student Assessment) is an international assessment, given every 3 years to 15 year old students, that allows for comparisons beyond the student and district results of state assessments and cross-state comparisons of NAEP to performance in an international context. Savoie Tr. 5/5/16, pp. 169:13-27, 170:1-14. 39. Connecticut is only one of 3 states in the United States that participated in PISA in 2012 to obtain state level results for the first time, the other 2 states being Massachusetts and Florida. Savoie Tr. 5/5/16, p. 169:19-27, 170:1-2. 40. PISA like NAEP reports its scores in terms of statistical significance. Savoie Tr. 5/5/16, p. 171:20-24. 41. The PISA 2012 Reading Literacy results show that 4 education systems outperformed Connecticut, 17 education systems, including Massachusetts, performed not differently than Connecticut, and 47 education systems, including the United States, performed lower. Savoie Tr. 5/5/16, p. 171:4-27, DTX 5758.
70
42. The PISA 2012 Math Literacy results show that 12 education systems outperformed Connecticut. Sixteen education systems, including Massachusetts, performed not differently than Connecticut, and 40 education systems, including the Unites States, performed lower than Connecticut. Savoie Tr. 5/6/16, p. 4:5-19; DTX 5756. 43. The PISA 2012 Science Literacy results show that 7 education systems outperformed Connecticut. Sixteen education systems, including Massachusetts, performed not differently than Connecticut, and 25 education systems, including the Unites States, performed lower than Connecticut. Savoie Tr. 5/6/16, p. 5:2-15; DTX 5760. IX. Palmer Standard
(1) “minimally adequate physical facilities and classrooms which provide enough light, space, heat, and air to permit children to learn":
1. The Alliance Districts have been awarded significant funding ($50M over 2 years) for necessary repairs and general maintenance to their school facilities. DTX 6165; Dixon Testimony, 6/3/16, pp. 68-74. 2. The plaintiffs' 6 focus districts have received significant state funding for school construction projects with generous reimbursement rates (up to 80% for renovations as new and 100% for roof replacements). DTX 3844 (school construction projects for selected districts 2005-15). 3. DTX 6049 describes the various school construction projects in Bridgeport, which are reimbursed by the state at 80% for renovations and 100% for roof replacements. Rabinowitz Testimony, 1/22/16, pp. 132-42. 4. Bridgeport was awarded $2.68M for improvements to school buildings under the Alliance District school building grant. Rabinowitz Testimony, 1/22/16, pp. 123-4. Bridgeport will use these funds for facility updates, including boiler replacements. Id., 124. 5. Roosevelt School in Bridgeport is a beautiful new school. Simmons Testimony, 1/28/16, pp. 66. 6. Bridgeport has never had to cancel school at Edison School because the classrooms were too hot or cold. Simmons Testimony, 1/28/16, p. 113. 7. Mr. Furlong's class size at Bryant School in Bridgeport is not too big to meet students' needs. Furlong Testimony, 2/11/16, p. 177. 8. Safety is not an issue at Bryant School. Furlong Testimony, 2/11/16, p. 178. 9. Tisdale School in Bridgeport was built in 2008 and is state of the art. Capasso Testimony, 2/23/16, p. 63. 10. In June 2015, Danbury voters approved a $53.5M expansion of Danbury High School. Pascarella Testimony, 2/2/16, p. 166. 62% of that amount will be reimbursed by state taxpayers.
71
Id. The expansion will be in time for the 2017-18 school year and will add 55,000 square feet and 26 new classrooms. DTX 6057, p. 1. 11. Ellsworth Avenue School, which has the highest percentage of EL's in Danbury, is 5 years old and in excellent condition. Rocco Testimony, 2/26/16, pp. 43-4, 51. 12. Park Avenue School in Danbury underwent major renovations in 2014, including an additional 20,000 square feet which included 12 new classrooms and a new media center equipped with a SMART Board. DTX 6061; Pascarella Testimony, 2/2/16, p. 171. 13. Ms. Snyder's classroom at East Hartford High School has central air conditioning. Snyder Testimony, 2/17/16, p. 75-6. 14. New Britain had a five-year capital improvement plan for 2008-2013. DTX 6040. All projects in the plan were completed. Salina Testimony, 1/13/16, p. 39. 15. Classes at Lincoln Elem. in New Britain have not been canceled due to lack of heat. Cabral Testimony, 1/13/16, p. 155. 16. Lincoln Elem. facility is safe, clean and well-maintained with an amazing security system. Cabral Testimony, 1/13/16, p. 175-6. 17. In 2015-16, New Britain completed a total renovation of Gaffney Elementary School, adding about 15,000 square feet and additional classrooms. Salina Testimony, 1/13/16, p. 44. 80% of the total cost of the project was paid by the state. Id. As a general rule over recent years, the state has a standing offer to pay 80% of the costs for any major new school construction or renovation project in New Britain. Id., 44-5. 18. New London High School (NLHS) will have a new facility by 2020. Thompson Testimony, 2/17/16, p. 156. 19. NLHS meets local fire, health and safety regulations, has a school resource officer and 4 custodians that do a phenomenal job and keep the school clean and well-maintained. Thompson Testimony, 2/18/16, p. 69. 20. NLHS has not had to close school due to any facilities issues, and students have always been able to receive instruction. Thompson Testimony, 2/18/16, p. 69. 21. There are wheelchair accessible desks on each floor and in each content area in elective classes at NLHS. Thompson Testimony, 2/18/16, p. 76. 22. There have been no union grievances from teachers regarding facilities at NLHS. Thompson Testimony, 2/18/16, p. 98. 23. Every student at Bennie Dover Jackson Middle School in New London has a place to sit. Stewart-Curley Testimony, 2/10/16, p. 60-1.
72
24. The physical facilities in Windham are adequate. See Donaldson Testimony, 2/3/16, p. 13 (renovations at Windham Center School include restrooms, cafeteria), p. 16 (other projects funded with 2015-16 capital budget including vehicle replacement, doors), p. 22, 71 (roof replaced at Natchaug in 2013-14), p. 49 (burners on boilers at Sweeney are decent, replaced 6-7 years ago), p. 67 (more than sufficient heat at Natchaug), p. 71 (adequate lighting at Natchaug), p. 121 (more than adequate space at middle school), p. 121 (district has lighting upgrade program with CL&P), p. 122 (enough light in classrooms with all new bulbs), p. 124 (more than adequate space at Windham High School), p. 124 (all standard general classrooms have heat), p. 125 (schools never closed due to heating issues in elementary school rooms), p. 137 (town funded renovations to Windham Center last summer), p. 137 (follows district asbestos abatement program), p. 144 (air tested at Natchaug is safe). 25. Over the summer of 2015, Windham saw dramatic improvements to its school facilities made by custodians and maintenance technicians, including renovations of restrooms and cafeteria space. Garcia Testimony, 3/4/16, pp. 87-8. 26. Windham also received over $1.1M in January 2016 for repairs and maintenance to Windham schools as part of the Alliance District school building grant program. Garcia Testimony, 3/4/16, pp. 92-3; DTX 6065 (Windham Improvement Projects); DTX 6066 (approval of grant); Donaldson Testimony, 2/3/16, pp. 133-7. Improvements include improvements to school security, school kitchens, districtwide IT reliability, parking and school maintenance storage, student laboratories, student communications, student playgrounds and the districtwide server room. Id., 93. 27. Ms. Caban-Owen, a social worker at North Windham School, has never had to cancel a counseling session due to heating issues, damaged tiles or other facilities issues. Caban-Owen Testimony, 1/15/16, pp. 86-7. 28. The board of education in Windham has approved a renovation like new of the Windham High School costing about $90M. Garcia Testimony, 3/4/16, p. 101. The state will reimburse Windham for about 79% of that cost. Id. After that renovation, Windham High School will house about 600 high school students, up to 434 early childhood students, and the board of education offices. Id. 29. Windham Middle School is getting its roof replaced and a microgrid installed, costing around $3M. Garcia Testimony, 3/4/16, p. 101. The state will reimburse 100% of the cost of the roof replacement. Id. The Natchaug School roof was replaced prior to Dr. Garcia's tenure in Windham. Id. The Windham Interdistrict Magnet School project for $42M was completed, with the state paying 95% of the cost. Donaldson Testimony, 2/3/16, pp. 129-30. Other projects included a roof replacement, asbestos abatement and flooring replacement in one wing in the cafeteria at Windham High School, new wells and other renovations at North Windham School and Windham Center School, and a microgrid at Sweeney School. Id., 130-2, 137. 30. There is adequate space at Windham Middle School and Windham High School. In fact, half of Windham Middle School is empty. Donaldson Testimony, 2/3/16, p. 122. There is also
73
adequate heating and lighting at all schools in Windham. Id., 122-4. Schools have never closed in Windham due to heating issues during Mr. Donaldson's tenure. Id., 125. None of the facilities problems described by Mr. Donaldson required school closure in 2015-16. Id.
(2) “minimally adequate instrumentalities of learning such as desks, chairs, pencils, and reasonably current textbooks":
31. There are no classrooms in Bridgeport without paper, pens and pencils. Rabinowitz, 1/22/16, p. 102. 32. Bridgeport received an Apple grant that provided for an iPad for every student and teacher in K-8 in five different schools. Rabinowitz, 1/21/16, p. 144. 33. Technology in Bridgeport is very good in grades 7-12 with enough Chromebooks for every student. Rabinowitz, 1/21/16, p. 142-3. Bridgeport is awaiting bonding on a state technology grant for Chromebooks in grades 3-6. Id., 103. 34. In Bridgeport, there were over 10,800 Chromebooks updated in 2014-15 used in grades 7-12, more than 1 for every 2 students. Rabinowitz, 1/22/16, p. 142-3. 35. Bridgeport tripled its internet access in 2014-15 after hiring a new technology director. Rabinowitz, 1/22/16, p. 143. Bridgeport received about $10M in E-Rate funding which will be used to provide additional access points for computer use and double the internet bandwidth this summer. Id., pp. 143-4. Bridgeport is also receiving an expansion of wireless internet infrastructure for all 3rd to 12th grade classrooms this year. Simmons Testimony, 1/28/16, p. 100. 36. Edison School in Bridgeport received new textbooks 3-4 years ago. Simmons Testimony, 1/28/16, p. 99. 37. Each student at Roosevelt School in Bridgeport received an iPad mini from an Apple Grant, and the teachers received MacBook Air and iPad minis as well. Simmons Testimony, 1/28/16, pp. 113-4. 38. Mr. Furlong (Bryant School in Bridgeport) received SMART board training and 29 Chromebooks in 2013-14 for a variety of purposes. Furlong Testimony, 2/11/16, p. 182. 39. Ms. Capasso's classroom at Tisdale School in Bridgeport received new textbooks in 2012. Capasso Testimony, 2/23/16, p. 40. Her classroom also has 4 student computers, Chromebooks, regular and drafting calculators, SMART board and printer. Id., p. 52-3. 40. Danbury used $900,000 worth of supplies and materials to support the Common Core. Pascarella Testimony, 2/2/16, p. 184. There was also bond approval of $240,000 for technology for Danbury which will include Chromebooks and carts. Id., 185.
74
41. Park Avenue School in Danbury underwent major renovations in 2014, including an additional 20,000 square feet which included 12 new classrooms and a new media center equipped with a SMART Board. DTX 6061; Pascarella Testimony, 2/2/16, p. 171. 42. Ellsworth Avenue School, which has the highest percentage of EL's in Danbury, is 5 years old and in excellent condition, with SMART boards in every classroom, Chromebooks in each 4th and 5th grade classroom, and carts of laptops available for the remaining grade levels and an iPad cart for kindergarten. Rocco Testimony, 2/26/16, pp. 43-4, 51. 43. There are computers including laptops and iPads with internet access throughout the school available to students at Danbury High School. Gencarelli Testimony, 2/5/16, pp. 58-60. 44. For the high school students that walk into the media center at Danbury High School, Ms. Gencarelli or one of the other media specialists are able to meet their needs in terms of the media center resources. Gencarelli Testimony, 2/5/16, p. 55. The media centers at all Danbury schools are at various stages in the process of transforming into what are called Learning Commons. Gencarelli Testimony, 2/5/16, p. 67. 45. Danbury High School purchased additional Chromebooks and iMacs for classrooms and the media center for the 2014-15 school year. Gencarelli Testimony, 2/5/16, p. 72. 46. The library media center website at Danbury High School provides free access for students to online and print resources, assistance with audio and eBooks outside of the high school, and a teacher projects database for all classes, which includes links to print and online resources for individual teacher research projects. Gencarelli Testimony, 2/5/16, pp. 64-5. 47. Danbury High School has Chromebooks and free access to eBooks and online databases like iConn which can be read on a Chromebook. Gencarelli Testimony, 2/5/16, pp. 30-1. The eBooks can be checked out by multiple users at the same time. Id. Students also have free access to Danbury Public Library. Id., 60. 48. All classrooms at Danbury High School are equipped with projectors and teachers have laptops or desktops with high speed internet and 24/7 access to the network and their files. Gencarelli Testimony, 2/5/16, pp. 38, 59. Some classrooms, including special education classes and the social studies department also have SMART boards, provided through a grant. Id., 41, 62. Teachers are able to instruct their students with whiteboards or laptops just as effectively as with SMART boards. Id., 62. See also Wentzell Testimony, 5/5/16, p. 75 (noting that SMART boards are generally used for teachers to project their notes, which can just as effectively be done with a chalkboard or whiteboard; and that the national teacher of the year, from Waterbury, teaches with a chalkboard). 49. There are at least five computer labs throughout Danbury High School, each with at least 25 stations. Gencarelli Testimony, 2/5/16, p. 58. This includes labs on every floor in the D building, and computers in specific rooms like the art rooms. Id. In addition to what is in the library media center, there are also mobile carts with laptops, Macbooks, Chromebooks, iPad
75
carts and iPods available upon reservation. Id., 59. There are also classroom labs with advanced software for specialized instruction in the areas of business, art and technology. Id. 50. All computers at the Danbury High School have internet access. Gencarelli Testimony, 2/5/16, p. 59. Danbury High School has wireless technology for students to access the internet from their own devices, which helps increase access to online resources, and reduces some of the demand on school equipment. Id., 60. See also Wentzell Testimony, 5/5/16, p. 76 (many districts are moving to bring-your-own-device policies). Danbury High School also has a Citrix Gateway that allows authorized users access from any device with Citrix downloaded on it. Id. 51. In 2014, East Hartford received a technology grant of $337,414 to purchase 480 iPad 2's and 16 carts. Quesnel Testimony, 1/19/16, p. 62. Ms. Snyder's classroom at EHHS has SMART board and computer. Snyder Testimony, 2/17/16, p. 76. 52. Technology in New Britain was more up to date upon Sharon Locke's departure. Locke Testimony, 1/12/16, p. 176. 53. New Britain received $9.3M in state bonding for textbooks (language art series) and technology (SMART boards, NWEA tools, Chromebooks, laptops) in 2013-14. Salina Testimony, 1/13/16, p. 37. New Britain also purchased Chromebooks with a SIG grant in 2014-15. Id., 38-9. 54. Lincoln Elem. in New Britain has wifi and iPads for students. Cabral, 1/13/16, p. 159-60. It also uses private funding to provide backpacks with school supplies to 40-50 students per year. Id., 13. 55. Ms. Maselek's classroom at NBHS received new Civics textbooks in 2013-14. Maselek Testimony, 1/28/16, p. 192. NBHS has several Chromebook carts, computer labs, new interactive ENO boards in classrooms, and the school provides supplies including white lined paper. Id., 193-7. 56. New Britain has the latest in high-tech SMART Boards in every classroom in the district. Salina Testimony, 1/13/16, p. 37. 57. Smalley Academy has new technology for blended learning that incorporates digital instruction beyond textbook instruction in every classroom. Saavedra Testimony, 3/1/16, p. 175. 58. In August 2015, New London purchased four Chromebook carts for Slade Middle School to provide teachers with necessary technology to meet the needs of students. Salina Testimony, 1/13/16, p. 38. In October 2015, two additional Chromebook carts were purchased for New Britain's Satellite Careers Academy and an additional Chromebook cart with 32 Chromebooks for Pulaski Middle School using state grant funds. Id., 38-9. 59. NLHS used SIG funding to purchase CCSS aligned textbooks. Thompson Testimony, 2/18/16, p. 52.
76
60. All freshmen, sophomores and juniors at NLHS have Chromebooks; seniors have access to them. Thompson Testimony, 2/18/16, p. 93. 61. The majority of classrooms at NLHS have SMART Boards or Epson Brightlink projectors. Thompson Testimony, 2/18/16, p. 94-5. Teachers use Elmo document cameras and some use Kindle Fires and iPads. Id., 95. There is a technology person housed at NLHS to address technology issues in timely manner. Id., 97. 62. Every student has a place to sit at BDJMS. Stewart-Curley Testimony, 2/10/16, p. 60-1. 63. Ms. Stewart-Curley's classroom at BDJMS received an Epson projector in 2014-15. Id., 39. 64. Windham received 40-50 SMART boards in 2014-15. Garcia Testimony, 3/4/16, pp. 67-8. During the 2015-16 school year, 77 SMART boards were installed throughout Windham schools. Garcia Testimony, 3/4/16, p. 85; DTX 6095. Windham anticipates that by the year 2020, each student will have a computing device available to them at school. Garcia Testimony, 3/4/16, p. 85; DTX 6095. 65. Windham schools have received significant aid through technology grants to assist with implementation of Common Core State Standards and the computer adaptive SBAC tests, as well as low-performing bond funding since 2014, which have been used for such projects as gymnasium, auditorium and bathroom upgrades, laptops, calculators, software, SMART boards, Lenovo Think Pads, and carts. Garcia Testimony, 3/4/16, pp. 89-92. 66. Alliance Districts can use their alliance funding for supplies, textbooks and technology. See, e.g., DTX 6114 (East Hartford Year 4 Summary), p. 1 (technology teacher; library media); DTX 6122 (Bridgeport Year 4 Summary), p. 3 (Technology integration plan including expansion of wireless internet infrastructure for all 3-12 classrooms/upgrading and computer technicians to support all technology); DTX 6140 (Danbury Year 4 Summary), p. 1 (instructional supplies); DTX 6234 (New Britain Year 4 Summary), pp. 2-3 (instructional supplies: Foundational Reading supplies/supplies for literacy for the Satellite Careers Academy; support digital programs to make an easier transition to blended learning); DTX 6235 (New London Year 4 Summary), p. 1 (MyOn reader online digital library; instructional software to support student learning [MyOn, Lexia, ST Math] and assessment software [NWEA, School Net, LAS Links, etc]); DTX 6232 (Windham Year 4 Summary), p. 1 (resources and textbooks aligned to CCSS, NGSS and high stakes mandates with onsite consultation; instructional supplies for extended time at WMS). 67. On CSDE's website and the IConn website, there is an enormous amount of free books and electronic learning materials for teachers and students at different levels. Wentzell Testimony, 5/5/16, p. 70. There are also a lot of books in schools and a lot of programs for poor students to apply to for free books and other resources. Id. The data on volumes of books in schools from the strategic school profiles is dated and does not include electronic resources that schools now use. Id., 71, 77.
77
(3) “minimally adequate teaching of reasonably up-to-date basic curricula such as reading, writing, mathematics, science, and social studies”:
68. The Common Core State Standards have raised the bar of what career and college ready means and what it stands for. Quesnel Testimony, 6/1/16, p. 131. All curriculum in the focus districts is aligned to the CCSS. 69. All curriculum in Bridgeport is aligned to the Common Core State Standards and Bridgeport has provided training to all of its teachers in that curriculum. Rabinowitz Testimony, 1/26/16, p. 21; 6/2/16, pp. 15-16; Capasso Testimony, 2/23/16, pp. 47-8 (curricula created in 2014 using state template and CCSS). There is also IB curriculum at Harding High School. Johnson Testimony, 1/26/16, pp. 137-8. 70. Bridgeport implemented a new math program that was geared towards the Common Core called Math in Focus. This was a paradigm shift in teaching math in each grade, building on the foundation of the previous grade starting with kindergarten through Grade 8. Furlong Testimony, 2/11/16, p. 164. 71. East Hartford is developing social and emotional standards in the same way as they have adopted new academic standards aligned with the Common Core State Standards. Quesnel Testimony, 6/1/16, p. 151. East Hartford also has a very rigorous, challenging international baccalaureate (IB) curriculum at IB Academy and O'Connell School. Quesnel Testimony, 1/19/16, p. 29-31. 72. Danbury follows the Common Core curriculum in all grades. Pascarella Testimony, 2/2/16, p. 203. 73. New Britain has an established curriculum for each subject in each grade. Salina Testimony, 1/13/16, p. 40. New Britain teachers teach to the new Common Core State Standards. Locke Testimony, 1/12/16, p. 163. Common Core curriculum has been implemented at New Britain High School. Maselek Testimony, 1/28/16, p. 190. Teachers received training to assist in this implementation. Id., 190-1. 74. New London High School used SIG funding in 2011 for a 3-year professional development plan aligned with instructional improvement activities throughout the year that addressed effective teaching, implementation of written curriculum and the embedding of literacy and mathematics across the curriculum. Thompson Testimony, 2/18/16, p. 39. Data teams at NLHS are working on vertical alignment of curriculum. Id., 43. NLHS also used SIG funding in 2014 to support alignment of current curricula to the CCSS and to produce end-of-course assessments. Id., 52. NLHS curriculum is aligned to the CCSS. Id., 54. New curricula in the core content areas, such as social studies and the humanities, are being written. Id. NLHS also has a credit recovery program that uses Apex Learning which is a web-based digital curriculum aligned to CCSS. Id., 66-7. 75. New language arts and math curricula were implemented in all grades in Windham and are aligned to the Common Core State Standards. Garcia Testimony, 3/4/16, p. 85; DTX 6095.
78
76. Windham High School introduced new courses in 2015-16, many of which align with careers and 21st century technological skills like robotics, bioinformatics, audio visual production, civil engineering, and architecture, that will help put each student on track for graduation and success in college and a career. Garcia Testimony, 3/4/16, p. 86; DTX 6095. 77. The CSDE is also mapping a 5-year transition plan for Next Generation Science Standards (NGSS) which were adopted by the SBE in 2015 that includes sustained support and resources for educators, principals, teacher preparation faculty, families and other science educators. DTX 6110, p. 2. The CSDE is working on expanding NGSS resources to include curriculum development institutes, sample learning units, and new performance tasks. Id. 78. Alliance Districts can use their alliance funding for curriculum development. See, e.g., DTX 6114 (East Hartford Year 4 Summary), p. 1 (CCSS aligned curriculum transition: curriculum development/program transition; Theme Development: IB pipeline); DTX 6122 (Bridgeport Year 4 Summary), p. 2 (positions to support Common Core aligned curriculum transition including visual and performing arts as developed by newly appointed Director of performing arts on Academic Team; Atlas Rubicon web-based curriculum mapping with PD for CCSS); DTX 6140 (Danbury Year 4 Summary), p. 1 (curriculum development: PD for curriculum writers; curriculum development and related assessments [STAR]); DTX 6234 (New Britain Year 4 Summary), p. 2 (Year 3 of CCSS aligned curriculum trained coaches will provide PD and revise curriculum over the spring and summer and model in classrooms to build capacity; HS curriculum development; Satellite Academy – Literacy and interventions); DTX 6235 (New London Year 4 Summary), p. 1 (writing units of study; read alouds and guided reading training; full implementation of PBIS); DTX 6232 (Windham Year 4 Summary), p. 1 (comprehensive assessment management system, including mgt. system, DIBELS, HMH1, Sunguard).
(4) “sufficient personnel adequately trained to teach those subject areas.”: 79. As an Alliance District, teachers can attend the state’s Common Core State Standards training for free. See, e.g., Pascarella Testimony, 2/2/16, p. 175. 80. Teachers and administrators in the Alliance Districts receive extensive free trainings from the state, local RESCs and consultants in such areas as CCSS and NGSS, CELP standards for EL students, SBAC, SAT and benchmark assessments testing, and SRBI and PBIS interventions. See Defs' Post-Trial Brief, Section III.G (free professional development). 81. The CSDE and RESC's provide professional development to districts in free CCSS and NGSS trainings, SBAC technology training, SRBI training to classroom teachers, monthly webinars on topics of interest to administrators, and free CELP standards training, among others. Garcia Testimony, 3/4/16, pp. 57-9; Cohn Testimony, 5/24/16, pp. 127-9; DTX 6110, p. 2. SDE also has dedicated staff members for NGSS. Cohn Testimony, 5/24/16, p. 129 (science consultant and science assessment staff member). 82. Extensive professional development related to CELP was made available both before and after adoption and is free to the recipients. Flick Tr., pp. 70:11-72:23.
79
83. All curriculum in Bridgeport is aligned to the CCSS and training to all of its teachers in that curriculum has been provided. Rabinowitz Testimony, 1/26/16, p. 21; 6/2/16, pp. 15-16. Bridgeport has used Alliance District funding for this purpose. See DTX 5363 (2015-16 Bridgeport Alliance District Plan). 84. Professional development was given to teachers in Bridgeport on the Math in Focus program. Furlong Testimony, 2/11/16, p. 165. 85. All new teachers at Smalley Academy in New Britain have gone through Common Core training for ELA and math, new assessments including NWEA, ELD/ELA, and SRBI interventions. Saavedra Testimony, 3/1/16, p. 175. 86. NLHS used SIG funding for curricular alignment sessions in each content area. Thompson Testimony, 2/18/16, p. 52-3. For monthly training, SIG funds were used to secure substitutes. Id., 54. NLHS also has a partnership with LEARN RESC where its special education teachers receive training on implementing IEPs aligned to the CCSS. Id., 82. Alliance Districts can use their alliance funding for professional development. See, e.g., DTX 6114 (East Hartford Year 4 Summary), p. 1 (Professional Development: Reading to learn, intervention, NGSS Practices, student motivation, reading/writing across content areas, health curriculum writing and assessment); DTX 6122 (Bridgeport Year 4 Summary), p. 1 (16 literacy coaches in each school and 15 math coaches assigned to selected schools to provide embedded PD to teachers to improve instruction and differentiate for all students [will support SRBI model for tier 3 as well]); DTX 6140 (Danbury Year 4 Summary), p. 1 (job embedded coaching; PD for curriculum writers; Marzano Protocol inter-rater reliability); DTX 6234 (New Britain Year 4 Summary), p. 1 (district curriculum supervisors to provide instructional coaching/work with Clark Consulting and train in buildings to sustain learning and increase capacity within the district); DTX 6235 (New London Year 4 Summary), p. 1 (embedded coaching of literacy/instructional coaches; EL training for teachers); DTX 6232 (Windham Year 4 Summary), p. 1 (literacy and math coaches; literacy and technology specialists; CK3LI training and coach). 87. Teacher hiring and retention in the focus districts, as well as average class sizes, are comparable to other districts in the state. See Defs' Post-Trial Brief, Sections III.F (teacher and administrator compensation) and G (class size); Findings of Fact Per 5/9/16 Order (Docket # 326) ## 88-99 (class sizes, staffing and vacancies). 88. 99% of students in CT are taught by "highly qualified" teachers (fully certified to teach in that subject area) in the core subjects, with 99.5% in low poverty districts and 98% in high poverty districts. PTX 1026, Table 1; see also PTX 1117, p. 2 and PTX 1119, p. 2 (99.7% of teachers in Bridgeport and East Hartford are highly qualified, which is above both high and low poverty school averages). CT compares very favorably with other states in terms of the percentage of students taught by highly qualified teachers. Wentzell Testimony, 4/13/16, p. 67-8.
X. Revisions to Defendants' Proposed Findings of Fact Per May 9, 2016 Court Order
80
The following findings of fact revise and supplement the Defendants' Proposed Findings
of Fact Per 5/9/16 Court Order (Docket # 326) (attached hereto as Appendix 2). Because
defendants did not have the benefit of many of the transcripts at the time that the findings of fact
were due, transcript citations were not included. Transcript citations and some additional
findings of fact are now provided.
A. Special Education
1. Bridgeport will bring some special education students back to district next year (2016-17 school year). Cohn Testimony. This is happening in many districts (alliance and others) in order to save money on transportation and tuition from outplacement, and because districts can build programs internally to meet the needs of students, for which the CSDE provides assistance. Cohn Testimony, 5/25/16, p. 119; Wentzell Testimony, 4/20/16, pp. 157-60. (Revises # 44) 2. East Hartford provides a large, expansive and complex continuum of special education services to its students, and works equally with low and high cost special education students. Quesnel Testimony, 6/1/16, p. 77. 3. Using the SEEP method, for Fiscal Year 2011 Connecticut's SEEP ratio was 2.87. PTX470; Reschly Tr., 4/20/16 pp. 123-124. That is to say, for that year if you divide the average expenditure of students in special education plus the average spending per regular education student by the average spending per regular education student the ratio in Connecticut is 2.87. This ratio exceeds the SEEP study ratio of 1.9. Plaintiffs' FOF, 5/31/16 ¶ 84.
B. Teacher and School Leader Compensation 1. Superintendent Quesnel is comfortable with the teacher retention rates in East Hartford. Quesnel Testimony, 6/1/16, p. 168. At East Hartford High School, Principal Ryan does not have to hire teachers because they do not leave very often to go teach elsewhere. Ryan Testimony, 3/1/16, pp. 83-4. 2. New teacher salaries in East Hartford are in the top third of all Hartford County districts. Quesnel Testimony, 6/1/16, p. 183. 3. Bridgeport's current superintendent, Frances Rabinowitz, earns about $290,000, consisting of $190,000 from Bridgeport Public Schools and about $100,000 from her state pension. Rabinowitz Tr., 6/2/16, p. 194. 4. Out of roughly 1,500 teachers, only about 120 resigned last year (8%). Rabinowitz Testimony, 6/2/16, p. 113. Another 80 teachers retired (5%). Id. Thus, about 1,380, or 87%, of teachers stayed in the district. See also Wentzell Testimony, 5/5/16, p. 123 (teacher mobility is not major issue in CT; Rabinowitz is only superintendent in the state who complains about
81
teacher mobility), p. 125 (during Wentzell's tenure in Hartford, they hired 150-200 teachers a year, which is typical of a large urban district), p. 126 (LEAD CT helps turnaround principals with planning for hiring). Contra Pls FOF #136. 5. Regarding the state's Equity Plan (PTX 1026), CT fares well in the required federal analysis. Wentzell Testimony, 5/5/16, p. 123. Regarding Figure 5 of the Equity Plan, given the number of teachers in the state (about 50,000 in 2008) and a five-year period, this is a small number of teachers moving around. Id., 122, 4/13/16, p. 72-4. Moreover, much of the movement may be within the district rather than from one district to another, particularly in large urban districts with many schools. Wentzell Testimony, 4/13/16, p. 70-1. Also, in the last 5 years, large urban districts in CT are hiring at a much more rapid rate than smaller suburban communities. Id., 71. With the exception of Superintendent Rabinowitz (see Bridgeport FOF #32), no superintendents of high poverty districts express concerns to CSDE about teacher mobility out of their districts. Id., 123. Further, the state's focus on educator effectiveness and evaluation and professional development is far more important than where educators are serving. Id.. Mobility and experience are not proxies for teacher effectiveness. Id.; see also Wentzell Testimony, 5/5/16, p. 120 (Teachers typically do not move from one district to another for a similar position based on money). 6. 99% of students in CT are taught by "highly qualified" teachers (fully certified to teach in that subject area) in the core subjects, with 99.5% in low poverty districts and 98% in high poverty districts. PTX 1026, Table 1; see also PTX 1117, p. 2 and PTX 1119, p. 2 (99.7% of teachers in Bridgeport and East Hartford are highly qualified, which is above both high and low poverty school averages). CT compares very favorably with other states in terms of the percentage of students taught by highly qualified teachers. Wentzell Testimony, 4/13/16, p. 67-8. 7. Because there was such little difference between high and low poverty schools in the percentage of teachers with 2 years or less of experience and 3 years or less of experience, the state used 4 years' experience as the measure in its Equity Plan, which was not required by the federal government. Wentzell Testimony, 4/13/16, p. 68. There is not a difference among teachers based on experience between four and five years. Id., 69.
C. Teacher and School Leader Evaluation 1. LEAD CT has developed a model evaluation for superintendents. Wentzell Testimony, 5/5/16, pp. 150-1; Villanova Testimony, 5/11/16 p. 84, 5/13/16 pp. 19, 25; DTX 6410, 6411. This model is currently being used voluntarily by some districts in CT. Id. (Revises # 123) 2. The state used performance-based evaluations for superintendents in New London and Windham as part of the special master program in those districts. Wentzell Testimony, 5/5/16, pp. 149-50. (Revises # 124)
D. High School Graduation Standards
82
1. Local school districts are required to ensure that students have a satisfactory level of basic skills competency prior to graduation. Conn. Gen. Stat. § 10-223a(b). See DTX 6430; Gopalakrishnan Testimony, 5/18/16, pp. 63-75. (Revises # 125) 2. Prior to July 1, 2013, the mastery examination for high school was the Connecticut Academic Performance Test (CAPT), administered in grade 10. Testimony of Dianna Wentzell, 4/15/16, p. 69. For the 2013-14 and 2014-15 school years, the high school level mastery examination for reading, writing and mathematics was the Smarter Balanced Assessment Consortium (SBAC), administered in grade 11, and the CAPT for science, administered in grade 10. RFA 191; Gopalakrishnan Testimony, 5/17/16, p. 154, 5/18/16, p. 78. (Revises # 129) 3. In the 2013-14 school year, the SBAC assessment was given as a field test only, so results were not available. Therefore, the baseline year for the SBAC assessment is 2014-15. Gopalakrishnan 5/17/16 p. 154, 5/18/16, p. 92-3. In 2015-16, the high school level mastery examination for reading, writing and mathematics was changed from the SBAC to the SAT, administered in grade 11, and was again the CAPT for science, administered in grade 10. Gopalakrishnan Testimony, 5/17/16 p. 155, 5/18/16, p. 108. (Revises # 130) 4. Although the CSDE does not have the authority to define what "satisfactory level of competency prior to graduation" means for each local school district (prerogative of each local/regional school district under C.G.S. § 10-223a), the CSDE has provided guidance and support to districts on how to specify a "competency" and then identify how they will assess students' competencies and determine the level or standard required to be met (assessment criteria) for graduation. DTX 6430; Wentzell Testimony, 4/15/16, p. 67; Gopalakrishnan Testimony, 5/18/16, pp. 52-75. (Revises # 131) 5. In accordance with § 10-223a(b), the CSDE has set up achievement levels on the mastery examinations that can be used by local districts. For example, local districts decided whether "a satisfactory level of basic skills competency" on the CAPT test was either at goal or proficiency, based on guidance from the CSDE's achievement level descriptors. Wentzell Testimony, 4/15/16, p. 65; Gopalakrishnan Testimony, 5/18/16, pp. 104-5. Under the SBAC test, the desired achievement level was level 3. Gopalakrishnan Testimony, 5/18/16, pp. 90-2, 104-5, 159-60. The achievement level descriptor for grade 11 stated that "students performing at [level 3] are on track for likely success in rigorous high school coursework and entry level, credit-bearing college coursework or career training." PTX 1200, pp. 15, 18. Through such descriptors, the CSDE conveys its expected level of performance to all districts. Gopalakrishnan Testimony, 5/18/16, pp. 159-60. Achievement levels on the redesigned SAT, which was used for the first time in 2015-16, have not yet been established. Id., 98. They will be established during the summer of 2016 and made available to districts thereafter. Id. Setting these standards first requires review and use of the SAT results from 2015-16. Id. Once that occurs, the SAT will also become part of the Next Generation Accountability System. Id., 111-12. (Revises # 133) 6. For a state-issued high school diploma, the CSDE uses an objective measure, i.e., the GED exam and its objectively established passing standards, to determine the student eligibility for a high school diploma. Conn. Gen. Stat. § 10-5. (Revises # 135)
83
7. In 2010, the Connecticut State Board of Education (CSBE) adopted the Common Core State Standards (CCSS) in English Language Arts and Mathematics. In 2015, the CSBE adopted the Next Generation Science Standards (NGSS). Wentzell Testimony, 4/15/16, p. 77. As a result, the state has (1) set more rigorous curricular standards focused on college and career readiness (Common Core State Standards and Next Generation Science Standards), (2) aligned mastery examinations to those more rigorous standards (SBAC, redesigned SAT, and CAPT in science), and (3) set or will be setting (in the summer of 2016) achievement level goals for those examinations (level 3 for SBAC, proficiency or goal for CAPT, and SAT levels to be set in summer 2016). Gopalakrishnan Testimony, 5/18/16, pp. 90-105, 159-60. The state has also provided substantial support and guidance to districts, and devoted considerable financial resources to assist districts in implementing the new standards and tests. DTX 4716; DTX 6236; Demsey Testimony, 1/14/16, p. 114; Defs' Post-Trial Brief Section IV.H (professional development). (Revises # 136) 8. The state dedicated $8M in 2012-13 and $6M each subsequent year for implementation of the CCSS. Cohn testimony, 5/24/16, pp. 102-3. That investment included professional development, the CCSS website, and direct funding to districts for implementing CCSS in their schools. Id. Districts are also using Alliance District funding for CCSS implementation. See, e.g., Quesnel Testimony, 1/15/16, pp. 182-3 (Using Alliance District funding, East Hartford began implementing CCSS and developed literacy and math programs aligned with the CCSS); DTX 6122, p. 2 (Bridgeport Year 4 Summary – positions to support Common Core aligned Curriculum Transition including visual and performing arts as developed by newly appointed Director of performing arts on Academic Team). The state has also provided substantial funding in technology grants to help districts align their technology to the CCSS, SBAC and redesigned SAT. DTX 4716; DTX 6236; Demsey Testimony, 1/14/16, p. 114. (Revises # 138) 9. The CSDE also provides professional development to districts for implementation of the NGSS. Cohn testimony, 5/24/16, pp. 127-9; DTX 6110. RESCs also provide professional development for CCSS curriculum development which has informed the work of districts, including Danbury and Windham. Pascarella Testimony, 2/2/16, p. 204; Garcia Testimony, 3/4/16, p. 58. Teachers in Alliance Districts can attend the CSDE's CCSS trainings for free. Id., 175. Alliance District funding has also been used to purchase supplies, instructional materials and technology aligned to the CCSS. Id., 183. (Revises # 139) 10. The CSDE has a fully dedicated staff member for NGSS assessments and another for NGSS implementation. The CSDE has also contracted with the CT Science Center to develop professional development to train teachers, sample curriculum units and lessons, and perform tasks. Cohn testimony, 5/24/16, pp. 127-9. (Revises # 140) 11. The CSDE also provides supports to districts regarding standardized assessment testing and technology training for tests such as the SBAC and SAT. Cohn testimony, 5/24/16, pp. 115-18; Garcia Testimony, 3/4/16, p. 58. (Revises # 141) 12. The SBAC and newly redesigned SAT tests are designed to align with the more rigorous CCSS. Gopalakrishnan Testimony, 5/18/16, pp. 19, 88-90. (Revises # 142)
84
13. As part of establishing the SAT as the mastery examination for 11th graders, all students are afforded free access to the examination and can benefit from the information and supports that accompany the examination which encourage students to think about college. Gopalakrishnan Testimony, 5/18/16, pp. 109-11. The state also offers free SAT preparation classes for students through a partnership with Khan Academy. Id. (Revises # 143) 14. The state also pays for the universal administration of the PSAT in the Alliance Districts. Gopalakrishnan Testimony, 5/18/16, p. 113. The PSAT offers predictive information relative to AP potential. The CSDE sends letters to individual students who achieve a certain score on the PSAT encouraging them to ask their schools and districts about the availability of AP courses. Id. (Revises # 144) 15. In accordance with C.G.S. § 10-221a(f), in June, 2015, the CSBE adopted a set of guidelines for school districts that are permissively moving toward a mastery-based credentialing system. DTX 5590. Currently there are about twenty high schools in Connecticut that utilize mastery-based credentialing, including schools in New Haven (including a Commissioner's Network school) and Windsor Locks, both Alliance Districts. Wentzell 3/31/16, pp. 100-1; Cohn Testimony, 5/24/16, pp. 144-52; DTX 5590. (Revises # 149) 16. The NextGen system and supports from the state demonstrate the state's commitment to collaborating with districts to graduate students who are prepared for college or career. DTX 6111; Gopalakrishnan Tr., 5/18/16, p. 3, 53, 60-1; Wentzell Tr., 3/31/16, p. 19, 22, 24-5; PTX 1141. The system is also structured so as not to create undue pressure on districts to raise graduation rates. Id. Under the NextGen system, graduation rates are one of several indicators at the high school level, and are weighted relatively low compared to achievement and growth in achievement on standardized assessments, thereby providing a safeguard against districts lowering graduation standards in order to increase graduation rates. Id. (Revises # 153) 17. The NextGen system looks at graduation in two ways -- one is the 4-year rate; the other is the 6-year rate for high needs students. DTX 6111; Gopalakrishnan Testimony, 5/18/16, pp. 32, 51-2, 61. Both the 4- and 6-year rates are weighted equally. Id. The 4-year graduation rate (indicator 8) is weighted at 100, which is only 8% of the total index for a given school or district. Id. The 6-year graduation rate for high needs students (indicator 9) is also weighted at 100, which encourages districts to retain and reengage high needs students to ensure that they are ready academically before graduating. Id. Despite pushback from the USDOE, the CSDE fought hard to include the 6-year graduation rate in the NextGen system, and listened to feedback from superintendents, such as Dr. Pascarella in Danbury, who wanted the 6-year rate to be part of the system because high needs students such as English learners might need more time to reach grade level. Id. (Revises # 154) 18. Under the NextGen system, if a district's 4-year graduation rate is, for example, 70%, the district does not get 0 points for indicator 8. DTX 6111; Gopalakrishnan Testimony, 5/18/16, p. 60. Instead, it would get 74.46 out of 100 points (94 is the state's 4-year graduation rate target). Id. This too safeguards against lowering standards to increase graduation rates. Id. (Revises # 156)
85
19. In addition to the graduation rates themselves, the NextGen system has other indicators that emphasize academic readiness based on test-based measures; this includes the performance index for state mastery examinations (indicators 1 and 2), as well as performance on SAT/ACT/AP/IB (International Baccalaureate) exams and workplace experience (indicators 5 and 6). DTX 6111, p. 5; Gopalakrishnan Tr., 5/18/16, pp. 9-10, 48-50, 53, 60. These indicators provide safeguards that militate against adulterating graduation standards. Id. For example, indicators 5 and 6, 50 points each in the index, are for preparation for postsecondary and career readiness -- coursework and exams, respectively. Id. So, districts are rewarded for exposing students to college and career coursework and exams. Indicator 5, which is an opportunity access indicator, includes coursework such as AP, IB, dual enrollment coursework, career and technology education (CTE) coursework, and workplace experience "courses." Id. Indicator 6 is for students achieving college and career readiness benchmark in assessments including SBAC 11th grade, SAT, ACT, AP and IB. Id. (Revises # 157) 20. Additionally, Indicator 7 in the NextGen system awards points to schools and districts for the percentage of 9th grade students earning at least 5 full year credits in the year and no more than one failing grade in English, math, science or social studies. DTX 6111. (Revises # 158) 21. The CSDE is unaware of any school in CT where none of the students are at grade level. Wentzell Testimony 3/31/16, p. 95. In fact, under the NextGen system's recent index results, several high needs groups in focus district schools are outperforming the statewide high needs group average in one or more subjects, including 10 schools in Bridgeport, 6 schools in New Britain, 4 schools in East Hartford, and 2 schools in New London. DTX 6215; Gopalakrishnan Testimony, 5/18/16, pp. 80, 103-4. (Revises # 162) 22. East Hartford High School is graduating more and better educated students today than it was ten years ago. Ryan Testimony, 3/1/16, 44:3-9. Superintendent Quesnel agrees with East Hartford High School Principal Matt Ryan that East Hartford is educating more and better educated students than it was 10 years ago. Quesnel Testimony, 6/1/16, p. 159. This can be seen in part by the double-digit gains in SAT scores. Id. (Revises # 162) 23. In Hartford, there are online credit recovery programs that are very rigorous. Wentzell Testimony, 3/31/16, p. 98. In Windham, the online credit recovery programs are an adequate way to fill in the gaps for students who are undercredited. Garcia Testimony, 3/4/16, p. 30. Dr. Carver, when she was Assistant Superintendent in New London, developed two credit recovery programs for "at risk" high school students, increasing graduation rates. Carver Testimony, 2/4/16, p. 72. One program was off-campus for expelled students, and the other was an online credit recovery program at New London High School (NLHS). Id. NLHS currently has a credit recovery program that uses Apex Learning which is a web-based digital curriculum aligned to CCSS. Thompson Testimony, 2/18/16, pp. 66-7. NLHS has found success in using a certified English teacher that has provided blended learning which is some traditional instruction combined with online learning that has yielded good results. Id., 67. Danbury uses its Alliance District grant for a credit recovery program. DTX 6140. East Hartford uses their Alliance District grant for a credit recovery teacher. DTX 6114. New London will also be using their Alliance grant for a credit recovery facilitator. Thompson Testimony, 2/18/16, p. 57. Feedback
86
and monitoring of Alliance District plans are provided by the Turnaround Office. See Cohn Testimony, 5/25/16, p. 6; Wentzell Testimony, 3/31/16, p. 77. (Revises # 185) 24. High school graduates who may not have attained college level literacy may be required to take a remedial course upon entering college. Wentzell Testimony, 3/31/16, p. 84. This is a national phenomenon, and remediation rates tend to be higher at community colleges than at state universities. Gopalakrishnan Testimony, 5/18/16, pp. 64-75; PTX 963, p. 17. (Revises # 187) 25. The remediation rates identified in the P20Win Report (PTX 963) are for the Class of 2010 cohort. PTX 963 p. 14 ("Students are included in the 2010 Graduation Cohort if they were first-time 9th graders in school year 2006-2007 and obtained a regular high school diploma in four years or less.") This group of students graduated before the more rigorous Common Core State Standards and Next Generation Science Standards were implemented in 2010 and 2015, respectively. Gopalakrishnan Testimony, 5/18/16, pp. 10, 95, 102. CCSS leads to more complex, college and career readiness reading and writing and math skills, and in specific subject areas, than under the old standards. Id. The remedial rates in the report also did not include students who may have graduated in 5 or 6 years. PTX 963 p. 14. Nor did the rates include students who attended the University of Connecticut, out-of-state schools, or private colleges or universities. Gopalakrishnan Testimony, 5/18/16, pp. 64-75. (Revises # 188) 26. In response to the remediation issue, and to build stronger ties among educators and policymakers at all levels of education in the state, from preschool to graduate school, the legislature passed PA 12-40, amended by PA 14-217, sec. 209. This law is intended to shift the state from conventional, developmental remediation to a model of embedded, intensive, transitional instruction, where students will receive their remedial education either embedded in college level classes, through an intensive remedial course, or via transitional programs associated with the community college structure. Cohn Testimony, 5/24/16, pp. 152-5. It also requires the Board of Regents to examine the effectiveness of the remedial coursework and how students are getting identified for the remedial coursework so that there will be more connection between the two systems. Wentzell Testimony, 4/15/16, p. 55. (Revises # 190) 27. The transition to community college pilot program, thus far operating in Manchester, New Haven and Meriden, has led to a significant reduction in the number of remedial courses needed by students entering community college. Frassinelli Testimony, 5/6/16, pp. 141-3. (Revises # 194) 28. These efforts produced an agreement on a menu of assessments to use for placement, common cut scores, and establishing only two levels of remediation. PA 12-40; Cohn Tr. 5/24/16 pp. 152-5; Gopalakrishnan Tr. 5/18/16, pp. 64-75. In terms of placement, rather than simply using a single placement test, public institutions of higher education in the state are now using multiple measures, such as high school GPAs and transcripts, SATs and other entrance exam scores, written essays, in addition to standard tests like the Accuplacer. Id. Previously, there was an overreliance on the Accuplacer, a single test taken only once which was not necessarily accurate and was likely sending too many students into non-credit bearing remedial classes, including students close to the cut score who may only need a single remedial class or
87
minimal embedded support in a credit-bearing course. Id. In fact, many more students can succeed in college-level gateway courses than have historically been placed into them. Id. (Revises # 195) 29. The need for remedial education, particularly in community colleges, is a national issue. Gopalakrishnan Testimony, 5/18/16, p. 77 ("[I]n conversation with other states, this is a topic that comes up often. And those are part of the reasons…why states…got together to write new standards that define what it is that kids should know and be able to do, the Common Core standards, where there was a lot of higher education involvement in…the writing of those standards so that we can align expectations all the way up."), 5/19/16, p. 52. Nearly 60% of first-year college students in the U.S. require some remedial instruction, with 75% of students at two-year colleges needing remedial work in English, mathematics, or both. DTX 6478 (NCPPHE College Readiness Report). 30. For the 2010 class of graduates in CT, there were roughly 40,000 graduates, with about 16,000 attending CT community colleges or state universities and 4,000 attending UConn. Gopalakrishnan Testimony, 5/19/16, p. 14. Of the 16,000 who attended CT community colleges or state universities, the remediation rate was about 46%. Id. Thus, for the entire graduating class of 40,000, the rate of those requiring remediation was closer to about 18%. There are over 11,000 students (roughly 9% of the total high school population in CT) in 17 comprehensive high schools with over 30 trade certifications in the state's technical high school system (CTHSS). Wentzell Testimony, 3/31/16, p. 133, 143-4. The trades were recently aligned to the regional workforce to help prepare graduates that are ready for jobs where they live. Id., 145. Students graduating from the CTHSS are very successful. Id., 146. 31. Regarding college and career ready standards, which implies numeracy skills, literacy skills, operating problems, most good local school systems have that all laid out specifically so that the targets are much clearer than they might have been in the 1980s and 1990s. Villanova Tr. 5-13-16, pp. 65, 67. The secondary schools' sorting and selecting process is complicated and has improved because districts have more clear targets now. Id. 32. There are over 11,000 students (roughly 9% of the total high school population in CT) in 17 comprehensive high schools with over 30 trade certifications in the state's technical high school system (CTHSS). Wentzell Testimony, 3/31/16, p. 133, 143-4. The trades were recently aligned to the regional workforce to help prepare graduates that are ready for jobs where they live. Id., 145. Students graduating from the CTHSS are very successful. Id., 146. XI. Revisions to Defendants' Corrected Preliminary Findings of Fact
The following findings of fact revise the Defendants' Corrected Preliminary Proposed
Findings of Fact and Conclusions of Law (Docket # 265) (attached hereto as Appendix 3), with
citations to full exhibits and transcripts provided.
88
1. Connecticut has a system of strong local control deeply embedded in both our traditions and state law. Connecticut's districts exert substantial control over how much money is spent on education and how it is spent. See Defendants' Post-Trial Brief, Section II.F. (Revises #1) 2. Connecticut has a high quality educational system that produces excellent results. E.g., DTX 6415, PP 17, 18. 3. Connecticut's public education system spends more per pupil on education than almost any other state, even accounting fully for the cost of living in Connecticut. See, e.g., DTX 2435, CHART 4; DTX 2422, CHART 14. By almost any measure, Connecticut ranks in the top handful of states for per pupil education spending, along with New York and Massachusetts. In 2011-12, when the federal stimulus money (more formally, funds provided by the American Recovery and Reinvestment Act, or ARRA) to the states ran out, Connecticut was one of only a few states to fully refill that gap with state revenue. DTX 6054, pp. 21, Tr. 6/27/16, p. 126. Connecticut is one of only four states in the nation that actually increased its effort during the Great Recession years from 2008 to 2012. Id. From FY 08 to FY 15, Connecticut ranks third in the nation in change in per pupil spending (9.1% increase), and per pupil spending remains more than 10% lower than 2008 in 14 states. DTX 6387 (Reschly Update), p. 7. 4. Connecticut has spent over 3 billion of state dollars and has administered over 430 million of federal funds for educational purposes from 2012 – 2015 in selected districts as broken down in DTX 4716 and DTX 5813 (Bloomfield). See also Defendants' Post-Trial Brief, Introduction. 5. Connecticut has committed over 2 billion dollars in school construction projects in selected districts over the last ten years as seen in DTX 3844. The State has a generous reimbursement/funding system for school construction. The poorer a school district, the higher proportion of expenses the state reimburses the district. See DTX 6406. 6. Connecticut has allocated $196,971,032 in bond grants to selected towns (exclusive of school construction principal and interest) as reflected in DTX 6307, 6289, 6298, Demsey Tr., 4/5/16, p. 3. 8. Connecticut's teachers' average salaries rank at the very top in the nation, see DTX 6393, Figure 3. Connecticut's average teachers' salaries have risen steadily over the past twelve years, from $54,607 in 2002-03 to $69,958 in 2013-14. See DTX 3813. 10. In implementing the reforms, the executive and legislative branches of government have acted aggressively and appropriately to provide professional support, professional resources, financial resources and strong accountability to help improve those districts most in need through programs including the Alliance Districts and Commissioner's Network. P.A. 12-116; Wentzell Tr., 3/31/16, pp. 147:1-148:1, 92:15-26, Cohn Tr., 5/25/16, p. 3:20-4:2; DTX 6451 (AD/PSD application), p. 3. 12. While these reform programs have not been in effect long enough to produce definitive results, they are aggressive well thought out best practices appropriately aimed at bringing major
89
improvement to the targeted districts. In addition, this massive infusion of new funds has remained relatively untouched as many other areas of the state budget have been significantly reduced. See Defendants' Post-Trial Brief, Introduction, http://www.sde.ct.gov/sde/lib/ sde/PDF/dgm/report1/ecs-alliance-nonalliance.pdf, DTX 6488, 5681, 5682, 4716, 6461, 3814. 13. As Connecticut's public school population has declined, DTX 2435, p. 1, 2434, p. 1, state funding for education has increased. DTX 5682. There is virtually no relationship in Connecticut between per pupil spending and either student achievement or growth in student achievement. See, e.g., DTX 6394 (Podgursky Expert Report), p. 1, "Knowing how much a district spends per student tell us virtually nothing about the level or growth of achievement of a student . . . "; pp. 16 Figure 10, p. 16 (virtually no relationship between per pupil expenditure and achievement or growth in achievement), Podgursky Tr. 4/21/16, pp. 10-24, DTX 6415 (Hanushek Expert Report), pp. 1, 3-4, 23-38, Hanushek Tr., 5/3/16, pp. 13-58; See also Horne v. Flores, 557 U.S. 433, 464-5, 467 (2009) (recognizing the "growing consensus in education research that increased funding alone does not improve student achievement" and that "education literature overwhelmingly supports reliance on accountability-based reforms as opposed to pure increases in spending," citing, among others, defendants' expert Eric Hanushek). 14. Similarly, there is no relationship between the nature or size of the achievement gap and per pupil expenditures in CT. DTX 6394, Tr. 4/21/16, pp. 10-24, DTX 6415, Tr., 5/3/16, pp. 13-58; see Defendants' Post-Trial Brief, Sections III.J-K. Educational improvement comes primarily from improved leadership, administration, accountability measures, and strong support for stronger teaching, and not from adding money to an already well-financed system. See Defendants' Post-Trial Brief, Section III.L (Compelling Testimony of Highly Experienced School Leaders Shows that Leadership, Rather than Money, is the Key to Student Growth). 16. Connecticut's Office of Early Childhood ("OEC") is one of only four cabinet-level state agencies in the country, including Massachusetts, Washington, and Georgia, which focus exclusively on early childhood education. Jones-Taylor Tr., 5/10/16, pp. 67:22-68:1. 17. Despite its relatively small population, CT ranks third in the country in the number of pre-K programs accredited by the National Association for the Education of Young Children (NAEYC), a widely respected preschool credentialing organization after only the much more populous states of, Massachusetts and California. DTX 4545, Jones-Taylor Tr., 5/10/16, p. 113:9-27. 19. As part of its efforts to narrow the achievement gap, Connecticut supports LEAD CT, a collaboration of several Connecticut and national organizations, focused on recruiting, selecting, preparing developing, and retaining school and district leaders to strengthen student learning across all Connecticut districts and classrooms, with a priority focus on the schools and districts in most need of improvement in student performance, the Alliance Districts. DTX 5744, Villanova Tr., 5/11/16, pp. 3:24-4:8, 66:15-68:21, 5/13/16, p. 81:14-19. 20. As of the academic school year 2014 - 2015, Connecticut had 34,833 English Learners (ELs) in 173 public Local Education Agencies. They constituted 6.6% of all public school students in kindergarten through twelfth grade. ELs receive English language services from Teachers of English to Speakers of Other Languages (TESOL), bilingual certified teachers, or
90
other personnel who have received training in English language acquisition. PTX 1102, SDE August 2015 Data Bulletin. 21. Federal Title III and state Bilingual grants, totaling approximately $7 million in 2014-15 and 2015-16 are available for districts to use in support of EL students, although not all districts apply for them. PTX 1102, SDE August 2015 Data Bulletin; DTX 6335, DTX 6336, DTX 4729, Flick Tr., 4/6/16, pp. 95:4-10, 100:9-11, 78:10-12. 22. SDE provides technical assistance and professional development training regarding teaching EL students to the districts and regional education services centers throughout the State and has developed a three tier monitoring cycle for Title III federal funds intended to benefit EL students. Flick Tr., 4/6/16, pp. 24:18-25:4, 65:17-26, 66:19-67:14, 70:9-74:8, 108:4-7. 23. CSBE and CSDE provide guidelines and assistance regarding the different responsibilities of the state, districts, schools, and educators related to the support of English Learners. PTX 170, CSBE’s 2010 Position Statement on the Education of Students Who Are English Language Learners - Components of High Quality English as a Second Language (ESL) and Bilingual Education Programs, Guidelines for Policymakers; DTX 5696, English Learner Programs and Services in Connecticut Public Schools: A Resource Handbook for Administrators (2nd edition); DTX 4343, Scientific Research-Based Interventions for English Language Learners: A Handbook to Accompany Connecticut’s Framework for RTI as guidelines. 24. CSDE developed new standards for proficiency in English, with Correspondences to K–12 English Language Arts (ELA), Mathematics, Connecticut C3 Social Studies, and Science Connecticut Core Practices, K–12 English Language Arts Connecticut Core Standards (CCS), and 6-12 Connecticut Core Standards for Literacy in the Content Areas, known as the Connecticut English Language Proficiency Standards (CELP) and, on October 7, 2015, these standards were adopted by the CSBE. DTX 5690; Flick Tr., 4/6/16, p. 66:14-15. Connecticut is the only state in the nation to provide English Language Proficiency standards in the Social Studies area. Flick Tr., 4/6/16, p. 67:15-17. 28. CSDE provides materials, resources and support to Districts to assist them in developing curricula that align with the Common Core State Standards (CCSS) and State assessments in the various instructional subject matter areas. See Defendants' Post-Trial Brief, Section IV.H. 29. For school years 2013-14, 2014-15 and 2015-16, the State made funding available to Districts through technology grants to assist Districts with various technological aspects of implementing the CCSS and the related Smarter Balanced Assessments. DTX 4716, 6307, 6236, Cohn Tr., 5/24/16, p. 138, Demsey Tr. 4/1/16, pp. 105-6, 110-18, 157-60.
NO. X07 HHD-CV-14-5037565-S CONNECTICUT COALITION FOR : SUPERIOR COURT JUSTICE IN EDUCATION FUNDING : INC., et al. : Plaintiffs : COMPLEX LITIGATION DOCKET : AT HARTFORD v. : : M. JODI RELL, et al. : Defendants : MAY 31, 2016
DEFENDANTS' PROPOSED FINDINGS OF FACT PER MAY 9, 2016 COURT ORDER
Pursuant to the Court's Order dated May 9, 2016 (Order No. 434447), the Defendants'
hereby file the following proposed findings of fact concerning "special education, the
compensation and evaluation of school teachers and leaders, and high school graduation
standards." Defendants' proposed findings of fact are not intended to be exhaustive, especially
given that transcripts of the court's proceedings are available only through April 27,
2016. Additionally, for purposes of complying with the Court's Order, Defendants have not
listed all Requests for Admission; see Doc. #301.00; that might be relevant.
Findings of Fact: Special Education
1. No plaintiff demonstrated that their special education needs were not met.
2. Danbury's percentage of special education population is below the state average, the
result of successful SRBI. Pascarella Testimony, 2/2/16, p. 193.
3. The Danbury students who expose themselves to the resources Danbury offers have
adequate and equitable resources to be college and career ready. Pascarella Testimony, 2/2/16,
p. 158.
APPENDIX 2
2
4. From 2000-2012, the mainstreaming of special education students in New London
increased. PTX1044; Carver Testimony, 2/4/16, p. 69.
5. From 2000-2012, it was infrequent that a parent of a special education student in New
London filed a complaint regarding their IEP services. PTX1044; Carver Testimony, 2/4/16, p.
69.
6. From approximately 2000-2012, there were no special education due process hearings in
New London. PTX1044; Carver Testimony, 2/4/16, p. 69.
7. From 2002-08, there was a significant reduction in out of district costs for special
education in New London. PTX1044; Carver Testimony, 2/4/16, pp. 69, 73-4.
8. From 2002-08, there was a significant reduction in special education prevalence rate an
disproportionate identification in New London. PTX1044; Carver Testimony, 2/4/16, p. 75.
9. Prior to 2008, New London developed and implemented a "co-teaching" model in grades
K-12. One purpose of the co-teaching model was to improve the educational opportunities for
special education students. PTX1044; Carver Testimony, 2/4/16, p. 77.
10. Dr. Daniel Reschly conducted interviews with ten special education directors in the State
of Connecticut. The interviews consisted of a semi-structured interview schedule. Reschly
Testimony, 4/19/16, pp. 15, 17.
11. Connecticut's special education identification rate in 2012-13 was 12.7%. DTX6397.
That same year the national mean was 12.9% and the national median was 13.5%. Id.
12. Since the year 2007, Connecticut has had a better IDEA compliance record than any state
in the Northeast except Pennsylvania. Reschly Testimony, 4/19/16, p. 39.
13. Since 2007 – when the ratings were first published – the State of Connecticut has never
3
been cited for failure to meet requirements of the Part C portion of IDEA. Reschly Testimony,
4/19/16, pp. 39.
14. In the 2011-12 school year, 90 percent of Connecticut's 166 school districts met the
requirements of the IDEA. Reschly Testimony, 4/19/16, pp. 40.
15. In the 2011-12 school year, 3 percent of Connecticut school districts were found to have
needed assistance two years in a row. And in about 90 percent of those districts the needs
assistance finding was due to difficulties complying with timelines with regard to initiating the
initial evaluation, completing the evaluation, developing the IEP, meeting with parents and
implementing the program. Reschly Testimony, 4/19/16, pp. 40.
16. Of the Connecticut districts that needed assistance two years in a row, there was no
relationship to the number of free and reduced price lunch students. Reschly Testimony,
4/19/16, pp. 42-43. At least one district that needed assistance two years in a row had a FRPL
population of 2 or 3 percent. Id.
17. About 1% of Connecticut's school population is made up of low incidence/high cost
special education students. Reschly Testimony, 4/19/16, p. 44.
18. The identification of learning disabilities throughout the United States and in the State of
Connecticut has declined over the last ten years. Reschly Testimony, 4/19/16, p. 50.
19. Connecticut's education cost sharing procedure provides maximum flexibility at the local
level; local officials are able to determine what is best for their district. Reschly Testimony,
4/19/16, pp. 57, 60-1.
20. General educators and school superintendents throughout the United States generally
hold the opinion that special education funding is crowding out or reducing the amount of money
spent on general education students. Reschly Testimony, 4/19/16, p. 59.
4
21. In CT, state expenditures for special education come from within the local ECS allocation
as well as from the separate excess cost grant funding. The excess cost grant kicks in over 4 1/2
times the net current expenditures per pupil. Demsey Testimony, 4/5/16, pp. 150-151.
22. The City of Danbury receives the excess cost reimbursement from the state and doesn't
share that money with the Danbury Board of Education. Pascarella Testimony, 2/2/16, p. 188.
23. Most school districts don't have a single child who costs $180,000 per year to educate.
Reschly Testimony, 4/19/16, p. 71.
24. Average per pupil spending in Connecticut for all students in 2011-12 was $17,403 per
student. That same year the national average was about $11,000. DTX 6397 (Update of Tables
and Figures from the Reschly (2014, April) Report), p. 6; Reschly Testimony, 4/19/16, p. 73.
25. Connecticut has continued to increase overall education spending despite the recession.
Reschly Testimony, 4/19/16, p. 73.
26. From 2008 to 2015 Connecticut was one of only 16 states that increased educational
funding. Reschly Testimony, 4/19/16, pp. 76. During that same time 31 states decreased
educational funding. Reschly Testimony, 4/19/16, p. 76.
27. Autistic students generally have more expensive special education programs than the
average for all special education students. Reschly Testimony, 4/19/16, p. 78.
28. In Connecticut, in 2012-13, low-wealth districts were no more likely to have children
with autism than high-wealth districts. Reschly Testimony, 4/19/16, p. 78.
29. In Connecticut, in 2012-13, 75% of the variation of students with disabilities levels
among districts is not attributable to poverty. Reschly Testimony, 4/19/16, p. 80.
30. In Connecticut, in 2012-13, there was virtually no statistical relationship between poverty
and the identification of students with learning disabilities. Reschly Testimony, 4/19/16, p. 80.
5
31. In Connecticut, in 2012-13, 82% of the variation of students with intellectual disabilities
is not attributable to poverty. Reschly Testimony, 4/19/16, p. 86.
32. In Connecticut, in 2012-13, 72% of the variation of students with emotional disturbance
is not attributable to poverty. Reschly Testimony, 4/19/16, pp. 87.
33. In Connecticut, in 2012-13, virtually none of the variation of students with other health
impairment is attributable to poverty. Reschly Testimony, 4/19/16, pp. 98-99.
34. In Connecticut, in 2012-13, 10% of the variation of students with low incidence
disabilities is attributable to poverty. Reschly Testimony, 4/19/16, pp. 99.
35. In Connecticut, in 2011-12, the non-plaintiff districts spent $1220 more per special
education student than the plaintiff districts. Reschly Testimony, 4/19/16, pp. 105-06. "Plaintiff
districts" were derived from the Corrected Third Amended Complaint, dated January 7, 2013,
and were Bridgeport, Danbury, Windham, East Granby, Plainfield, Norwich, New Britain, New
London, East Hartford, Hartford, and Stamford.
36. In 2011-12, the national average for special education students in the general education
classroom for 80% or more of the school day was 61%. Reschly Testimony, 4/19/16, pp. 109.
37. In 2011-12, the Connecticut average for special education students in the general
education classroom for 80% or more of the school day was 69%. Reschly Testimony, 4/19/16,
pp. 109.
38. Over the last several years, Connecticut districts have improved (i.e., reduced) the
number of special education students outplaced. Reschly Testimony, 4/19/16, pp. 109.
39. In Connecticut there is no statistically significant relationship between the number of
special education students outplaced and the poverty level of their district. Reschly Testimony,
4/19/16, pp. 111-13.
6
40. Out-of-district placements are typically more costly. Reschly Testimony, 4/19/16, pp.
113.
41. Connecticut is trying to improve the implementation of SRBI in all Connecticut schools
with the idea of improving reading performance overall. Reschly Testimony, 4/19/16, pp. 118.
42. Connecticut's 2010-11 ratios of special education teachers, speech language pathologists,
and school psychologists to number of students with disabilities are substantially better than the
United States averages for all three of these groups. Reschly Testimony, 4/19/16, pp. 120.
43. Alliance districts can use their alliance district plans to help fund existing and additional
special education staff supports, such as programs and professional development. See, e.g.,
Garcia Testimony, 3/4/16, pp. 38-9; DTX 6122, p. 2 (Bridgeport Alliance District Plan Year 4
Summary- 2.5 FTE Special Education Supervisors plus 1 per diem, 32 FTE Special Education
Resource Teachers: Intervention and Prevention Model (2.2M)); DTX 6114, p. 1 (East Hartford
Alliance District Plan Year 4 Summary- FTE special education teachers); DTX 6235, p. 1 (New
London Year 4 Summary- training on Exemplary IEPS and 504s).
44. Bridgeport will bring some special education students back to district next year (2016-17
school year). Cohn Testimony. This is happening in many districts (alliance and others) in order
to save money on transportation and tuition from outplacement, and because districts can build
programs internally to meet the needs of students, for which the CSDE provides assistance. Cohn
Testimony; Wentzell Testimony, 4/20/16, pp. 157-60.
45. The CSDE is working with Bridgeport to provide eight days of in-district training and
development sessions to support its efforts to improve its Child Find work this year. The CSDE
is also doing focused monitoring in Bridgeport. Rabinowitz Testimony, 1/26/16, pp. 35-6.
7
Taken together, most of Bridgeport's operating budget comes from the state. Rabinowitz
Testimony, 1/26/16, p. 72; DTX 5638 (Bridgeport Expenditure Profile 2008-15).
46. Bridgeport has programs for special education students, such as SOAR for emotionally
disturbed students and ASD for autistic students. Johnson Testimony, 1/26/16, p. 86.
47. During Superintendent Garcia's tenure in Windham, Windham has returned 16 special
education students into the district, which has resulted in a cost savings of about $200,000 for the
district. Garcia Testimony, 3/4/16, pp. 18-9. That money, in turn, will go to benefit special
education students in Windham. Id., 19.
48. During Superintendent Garcia's tenure in Windham, Windham has fulfilled its students
IEPs, and there have been no governmental findings of violations with regard to special
education services in the district. Garcia Testimony, 3/4/16, pp. 53-4.
49. Windham has started a co-teaching model for special education students. Garcia
Testimony, 3/4/16, pp. 66-7.
50. The graduation rate of special education students has increased in Windham. Garcia
Testimony, 3/4/16, pp. 79.
51. "The high rate of referral for special education services [in Windham prior to 2012-13]
was in retrospective analysis, due to the lack of effective core instruction in reading and math
(Tier I), Tier II interventions, and Tier III support. As the District implements the SRBI
framework in grades K-8, particularly in reading and math, the rate of referral will trend toward
normal levels. Early evidence of that now exists in the primary grades where all three tiers of the
SRBI continuum are present." PTX 626, p. 15 (Adamowski Special Master Report, Windham
2012-13).
52. "As referenced earlier in this report, under status of the Strategic Operating Plan (SOP),
8
the outplacement of a large number of special education students has significant education
implications for the students involved as well as financial implications for the [New London]
district, affecting all students. In 2013-14 the district made significant progress developing
special programs for outplaced students, itself or in partnership with other providers, and
returned or initially in-placed approximately 60 students utilizing leased space and space at the
Harbor School. Progress in this area needs to continue in 2014-15 with the continuum of
programs for special need students that are offered within the District expanded further." PTX
885, p. 16 (Adamowski Special Master Report, New London 2013-14).
53. New London High School is in compliance with the IDEA. Thompson Testimony,
2/18/16, p. 81.
54. New London has reduced the growth and number of special education outplacements,
resulting in savings in tuition and transportation, in part through the High Roads program.
Thompson Testimony, 2/18/16, pp. 82-3.
55. In partnership with LEARN (a local RESC) and using Alliance District funding, New
London is training special education teachers on implementing IEPs aligned to the Common
Core State Standards. Thompson Testimony, 2/18/16, p. 82; DTX 6235, p. 1 (New London Year
4 Alliance District Plan Summary- training on Exemplary IEPs and 504s).
56. The self-contained special education classrooms at New London High School range from
12:1 to 18:1 student to staff ratio. Thompson Testimony, 2/18/16, p. 82. Some of these classes
have more than 1 adult in the room, such as paraprofessionals or special education assistants. Id.
57. New London High School has a transitional coordinator and job coaches paid with
alliance district funding who help special needs students transition to the world of work by
9
helping find employment for students and monitoring them on the job site. Thompson
Testimony, 2/18/16, pp. 85-6.
58. During Commissioner Wentzell's tenure in South Windsor, the district brought back
outplaced special education students while staying within its budget. Wentzell Testimony,
4/20/16, p. 152. They did so by discontinuing other actions that were less of a priority, and
training existing staff, finding time to do so by reassigning them. Id.
59. The CSDE assists districts to comply with the IDEA. Wentzell Testimony, 4/20/16, pp.
154-7. The CSDE contracts with the State Education Resource Center (SERC) to provide
supports and professional development to districts in the area of special education. Frassinelli
Testimony, 5/6/16. The CSDE also assists districts to develop in-house programs and bring
special education students back to their districts by providing technical assistance and connecting
them with experts during Alliance District convening meetings or other districts, such as
assisting Bridgeport with a Tier 1 behavioral program that had been used in New Haven and
Hartford. Wentzell Testimony, 4/20/16, pp. 154-7; 159-60; Reschly Testimony, 4/19/16, pp. 63-
4.
60. East Hartford High School has an inclusion program for special education students. Ryan
Testimony, 3/1/2016, pp. 92.
61. Barbara Maselek's classroom with the largest number of special education students in it is
an "inclusion class," and includes, in addition to Ms. Maselek, a special education teacher in it as
well as a paraprofessional in it who has been very helpful, has worked with her since 2013, has a
college degree in psychology, and is "very aware" of the students in the room and their special
education needs. Maselek Testimony, 1/28/16, p. 178.
10
Findings of Fact: Teacher and School Leader Compensation
62. In spite of a severe recession in 2008, the average pay of Connecticut educators and
administrators has risen consistently over the last decade and has kept pace with national
measures of inflation and wage growth. Podgursky, 4/21/16, p. 47; DTX 6393 (Podgursky
Expert Report, "Relative Teacher Compensation in Connecticut"), Figure 1.
63. Connecticut ranked third in the country in terms of teacher salary in 2012-13. DTX 6393
(Podgursky Expert Report, "Relative Teacher Compensation in Connecticut"), Figure 3.
64. Connecticut ranked 7th in the country in terms of salaries for teachers with a Bachelor's
degree and 5th in the country in terms of salaries for teachers with a Master's degree and 20 or
more years' experience in 2011-12. DTX 6393 (Podgursky Expert Report, "Relative Teacher
Compensation in Connecticut"), Figures 4 and 5.
65. There is not a good cost of living index that says how much more it costs to live in CT or
RI than Wyoming or Texas. The Bureau of Labor does not publish such an indicator. A better
measure is to compare salaries of teachers to those of other professions within particular states.
That comparison reflects the overall level of cost and the opportunities of being a teacher versus
not a teacher across states. Podgursky Testimony, 4/21/16, p. 54.
66. The compensation of Connecticut teachers relative to non-teachers, including all wage
and salary workers, medical workers, and management workers, compares favorably to most
other states. DTX 6393 (Podgursky Expert Report, "Relative Teacher Compensation in
Connecticut"), Figures 6-8. Teacher salaries are keeping up with non-teacher salaries in
Connecticut, compared to other states. Podgursky Testimony, 4/21/16, pp. 58-9.
67. Average elementary and English Language Arts teacher salaries in plaintiff districts were
11
above those of non-plaintiff districts in 2010-11. DTX 6393 (Podgursky Expert Report,
"Relative Teacher Compensation in Connecticut"), Figure 2. "Plaintiff districts" were derived
from the Corrected Third Amended Complaint, dated January 7, 2013, and were Bridgeport,
Danbury, Windham, East Granby, Plainfield, Norwich, New Britain, New London, East
Hartford, Hartford, and Stamford.
68. Regarding average salaries in 2012-13 for general education teachers, 3 of the 6 focus
districts (Danbury, East Hartford and New Britain) were above the state average. PTX 420;
Defs' Demonstrative 16.
69. New Britain's average salary for general education teachers in 2012-13 was about $4,000-
$15,000 greater than each of its adjoining towns: New Britain ($78,535); Newington (74,489);
Farmington (71,773); Berlin (69,067); Southington (65,570); Plainville (63,686). PTX 420.
70. Regarding average salaries in 2012-13 for special education teachers (grades 1-12), 3 of
the 6 focus districts (Danbury, East Hartford and New Britain) were above the state average.
PTX 420; Defs' Demonstrative 16.
71. Regarding average salaries in 2012-13 for principals, 2 of the 6 focus districts
(Bridgeport and New Britain) were above the state average. PTX 420; Defs Demonstrative 16.
Due to the small numbers of principals in 2 of the other 4 focus districts, Windham and New
London, average salaries in those districts may have shown greater variability. Id.;
Gopalakrishnan Testimony, 5/18/16.
72. Regarding average salaries in 2012-13 for superintendents, all 6 of the focus districts
were above the state average. PTX 420; Defs' Demonstrative 16. Bridgeport superintendent's
salary was 9th in the state, above both New Haven and Hartford. PTX 420.
73. Teachers who apply for jobs in Bridgeport likely also apply for jobs in New Haven
12
County. Rabinowitz Testimony, 1/26/16, p. 17. In 2012-13, the average general education
teacher salary in Bridgeport was $64,103, compared to nearby New Haven County districts like
Orange ($65,695), West Haven ($63,507), New Haven ($59,767), Derby ($59,298), and Ansonia
($55,331). PTX 420.
74. The best leaders are not necessarily the highest paid leaders. Rabinowitz Testimony,
1/22/16, p. 101.
75. In Bridgeport, teachers have had salary increases of about 2% each year for the last 2-3
years. Rabinowitz Testimony, 1/26/16, p. 16.
76. In Danbury, teachers received salary increases of approximately 1%, 1 ¼%, and 1.5% for
each respective year in their current contract (2014-17). Pascarella Testimony, 2/2/16, p. 173.
Administrators received salary increases of 2.75%, 2.5%, and 2.5% for each of their 3 years, for
a total of 7.5%. Id. In both cases, the Danbury school board negotiated these raises. Id.
77. In Danbury, as in most districts, about 80-82% of the district budget is comprised of
personnel salary and benefits, with salaries alone in the 60-65% range. Pascarella Testimony,
2/2/16, p. 173.
78. New London teachers recently reached a 3-year collective bargaining agreement effective
July 1, 2016, with 9% raises over the three years. Thompson Testimony, 2/18/16, p. 99. New
London Public Schools Superintendent Manuel Rivera said that the contract will help the district
remain competitive and maintain high morale. Id., 99-100. The New London teachers' union
president said the union members' support for the contract was overwhelming. Id., 100.
79. In Windham, school personnel received increases in each of the 3 years of the collective
bargaining agreement ending in 2016, including a 3.3% increase in 2015-16. Garcia Testimony,
3/4/16, pp. 60-1.
13
80. For information on teacher pensions in Connecticut, see undisputed and unobjected to
Defs' RFAs ## 363-82, and DTX 3814 and 5984.
81. Nationally, benefits for school teachers compare favorably with those of private sector
professionals. DTX 6393, p. 4.
82. In Connecticut, benefits as a share of salary for public school teachers is above the
national average. DTX 6393, Figure 9; Podgursky Testimony, 4/21/16, p. 59.
83. The retirement benefit rate for Connecticut teachers is far above the national rate for
private sector professionals. DTX 6393, p. 5.
84. Under the Teacher Negotiation Act, Conn. Gen. Stat. § 10-153a et seq. (TNA), local
school boards are required to negotiate with the teachers' and administrators' union over the
terms and conditions of employment, including salary and benefits. C.G.S. § 10-153d(b). The
TNA covers principals, assistant principals, and teachers. C.G.S. § 10-153b. Superintendents
are excluded from this provision. C.G.S. § 10-153b(b). Superintendents, who have executive
authority over the school system and responsibility for its supervision, maintain individual
contracts with the local school boards. C.G.S. § 10-157(a).
85. The TNA defines the duty to negotiate in good faith as follows: "'[T]o negotiate in good
faith' is the performance of the mutual obligation of the board of education or its representatives
or agents and the organization designated or elected as the exclusive representative for the
appropriate unit to meet at reasonable times, including meetings appropriately related to the
budget-making process, and to participate actively so as to indicate a present intention to reach
agreement with respect to salaries, hours and other conditions of employment, or the negotiation
of an agreement, or any question arising thereunder and the execution of a written contract
incorporating any agreement reached if requested by either party, but such obligation shall not
14
compel either party to agree to a proposal or require the making of a concession." C.G.S. § 10-
153e(d). Thus, neither party may put conditions on their willingness to negotiate, and both
parties are free to hold their positions as long as desired provided they participate in good faith in
negotiations.
86. Though local boards of education can act unilaterally in setting the school year or day,
negotiations may be required. For example, unions retain the right to demand negotiations over
the impact of any changes in the school day or year that affect their hours of employment.
C.G.S. § 10-153d(b).
87. The teachers in Connecticut, like teachers in most states, are paid according to salary
schedules set forth in collective bargaining agreements negotiated by the school district and
teachers' union, that base the pay of every teacher in the district on years of experience.
Podgursky Testimony, 4/27/16, p. 66. See DTX 5982 (2013-16 New London Teachers'
Contract). The columns in the salary schedules will be years of education or professional
graduate credits or BA, BA plus 15 credits, MA, and so on. Podgursky Testimony, 4/27/16, p.
66. These contracts almost never differentiate across the field by the type of teacher or subject
area taught. The only differentiation is typically in terms of extra duties. Id., p. 67. C.G.S. § 10-
153a et seq. For example, in Danbury, the teachers' contract provides that the district not be
permitted to pay certain teachers more based on their area of teaching. Pascarella Testimony,
2/2/16, p. 193. For example, the district pays elementary gym teachers the same as bilingual
teachers, even though there is no shortage of elementary gym teachers. Id.
88. Connecticut ranks favorably nationally on student-teacher and student-staff ratios; both
15
measures are well below those in most other states -- 9th lowest and 6th lowest in the nation,
respectively. DTX 6393 (Podgursky Expert Report, "Relative Teacher Compensation in
Connecticut"), Figures 10 and 11; Podgursky Testimony, 4/21/16, p. 61.
89. In CT, there are six students for every full-time adult on the payroll, which is low
compared to other states. DTX 6393 (Podgursky Expert Report, "Relative Teacher
Compensation in Connecticut"), Figure 11; Podgursky Testimony, 4/21/16, p. 61.
90. Research varies as to the impact on student achievement of the number of students per
teacher in a classroom. Pascarella Testimony, 2/2/16, pp. 51-2, 191-2. In fact, in one study that
is relied on by those who argue that class size impacts student achievement, while the results
showed some small improvements during kindergarten, the small classes did not continue to
have an impact on achievement in the later grades of the experiment, even though that would
have been expected if small classes had an impact across grades. Moreover, the reductions in
class size were very large (moving from 23 to 15 students per class), making it an extraordinarily
expensive policy. No comparable studies even exist for later grades. Hanushek Testimony,
5/3/16; DTX 6415.
91. What is more important is the skill level of the teacher, i.e., how the teacher is planning
for and instructing the class. Hanushek Testimony, 5/3/16; Pascarella Testimony, 2/2/16, pp. 51-
2, 191-2; Thompson Testimony, 2/18/16, p. 118 ("You can have a lousy teacher with 4 or 28
kids, but usually the outcome is going to be the same. So it starts with a real highly skilled
teacher.").
92. Regarding average class size in the 2014-15 school year, the CSDE data on the average
class sizes in grades K-8 statewide and in the focus districts showed that in general there are only
small and inconsistent variations in class size in the focus districts as compared to the state
16
average. This was also true for Bridgeport, in spite of Superintendent Rabinowitz' anecdotal
testimony about class size. DTX 6444; Defs' Demonstrative 10; Gopalakrishnan Testimony,
5/18/16.
93. There is no evidence in the data that teacher compensation is inadequate in the sense of
preventing districts from staffing classrooms with qualified teachers. Podgursky Testimony,
4/21/16, p. 67.
94. One indicator to look at regarding whether teacher compensation is adequate to staff
schools is the ratio of applicants to vacancies. Podgursky Testimony, 4/21/16, p. 63. Data on
applicants and vacancies collected by the CSDE in fall 2012 shows little evidence of general
shortages of qualified teachers. In general, applicants far exceed vacancies. DTX 6393, Figures
12 and 13. While a small number of fields, such as bilingual PK-12 and language pathology
specialists, had relatively few applicants, these tended to be areas with relatively few vacancies.
DTX 6393, Figure 13; Podgursky Testimony, 4/21/16, p. 67.
95. From 2012-13 to 2014-15, the Education Reform Districts added 4.3% in additional total
certified positions, the remaining Alliance Districts added 2.6% in additional total certified
positions, and all other local districts added 0% additional positions. PTX 6334, Table 2, p. 2
(SDE's October 2015 Data Bulletin regarding Public School Hiring Trends and Certification
Subject Shortage Areas for 2015-16)
96. From 2012-13 to 2014-15, even though they increased their position counts, unlike the
average of the remainder of districts, the Education Reform Districts filled 91% of their available
positions by Oct 1, the remaining Alliance Districts filled 92.2% of their available positions by
October 1, and all remaining local districts filled 94.3% of their available positions by October 1,
17
so that all groups filled over 90% of their available positions by October 1. PTX 6334, Table 2,
p. 2.
97. For 2014-15, both the Education Reform Districts and the remaining Alliance Districts
received a median number of 23 applications per available position, while all other districts
received a median of 20 applications per position. In other words, the Education Reform
Districts and the remaining Alliance Districts were slightly more popular with applicants than the
remaining districts, on average. PTX 6334, Table 2, p. 2.
98. Though the total number of certified positions statewide (excluding approved private
special education programs) declined slightly (less than one half of one percent) from 53,484 in
2014-15 to 53,225 in 2015-16, some districts evidenced modest increases in certified positions.
For example, in the 10 lowest performing Alliance Districts (i.e., the Education Reform
Districts), the total number of certified positions increased by 1.6 percent (173 positions). DTX
6155, p. 4.
99. The number of vacancies that districts sought to staff prior to the start of the school year
decreased from 5,145 in fall of 2014 to 4,836 in fall of 2015 - a 6 percent decline. The number of
vacancies declined for all districts except Other LEAs and Approved Private Special Education
Programs. DTX 6155, p. 4.
100. Financial incentives offered to support teaching in shortage areas or Priority
School
Districts include: federal loan forgiveness or deferral; state mortgage assistance by way of lower
interest rates, consistent with C.G.S. sec. 8-265pp; retired educators can teach in a shortage area
or a Priority School District and not be limited to earning only 45% of their salary as is the
customary rule; tuition assistance by allocating SDE Title III monies to reduce tuition costs and
18
increase the number of candidates who enroll in the Alternate Route to Certification for Teachers
of English Language Learners (ARCTELL) program administered by Area Cooperative
Education Services (ACES); and SDE scholarships for students enrolled in educator preparation
programs in specified shortage areas. DTX 6155 p. 4; Barzee Testimony, 4-14-16, pp. 152, 154-
5.
101. For substitutes, when a substitute teacher has certification and has been in the
same position more than forty days in a school year, he/she is a "long term substitute" under the
certification regulations. R.C.S.A. § 10-145d-400(mm). Since that person must be appropriately
certified, he/she is a member of the teachers' bargaining unit, notwithstanding his/her status as a
substitute. C.G.S. § 10-153b(a).
102. The CSDE may also issue durational shortage area permits (DSAP) upon the
application of a school district when it is not possible to hire a teacher with appropriate
certification for the position. R.C.S.A. § 10-145d-421. To be eligible for a DSAP, an individual
must have a bachelor's degree, must have passed Praxis I, must have completed at least twelve
semester hours in the subject for which the permit will be issued, and must file an intent to be or
actually be in a planned program leading to certification (if such a program is required). The
regulations permit the CSDE to reissue a DSAP up to two times provided that specified
conditions are met. R.C.S.A. § 10-145d-422. Persons holding a DSAP are included by statute in
the teachers' bargaining unit. C.G.S. § 10-153b(a). School boards are therefore required to
negotiate with the teachers' union over their terms and conditions of employment.
Findings of Fact: Teacher and School Leader Evaluation
103. New legislation in 2012 brought in a new educator evaluation and support system
for CT educators. P.A. 12-116 §§ 51-55; Barzee Testimony, 4-22-16, p. 27:9-19.
19
104. The entity responsible for developing the guidelines for educator evaluation and
support is the Performance Evaluation Advisory Council (PEAC). Barzee Testimony, 4-22-16,
p. 20-23.
105. PEAC’s guidelines include core requirements for evaluation of and support for
teachers, administrators below the superintendent level, and support specialists. Barzee
Testimony, 4-22-16, p. 31:7-9; DTX 6305 (2012); DTX 6328 (2015).
106. Districts may develop their own evaluation and support plans, but they must to
align them to the core requirements set forth in the PEAC guidelines. Barzee Testimony, 4-22-
16, p. 30:4-26; Wentzell Testimony, 5/5/16 (Connecticut has one of the most flexible evaluation
and support systems in the country).
107. SDE provides a model-teacher and administrator evaluation and support system:
Connecticut’s System for Educator Evaluation and Development (SEED). SEED is aligned to
the Connecticut Guidelines for Educator Evaluation and serves as one option for districts that
choose to implement a pre-approved evaluation system. Districts may choose to propose
variations upon the SEED model so long as the model is consistent with the Connecticut
Guidelines for Educator Evaluation. DTX 6328, p. 5; DTX 3715, Intro, p. 2.
108. The SEED model was piloted in 2012-13 in ten districts/district consortia.
UCONN’s Neag School of Education studied the pilot and provided feedback. The feedback
further guided the design of the model. DTX 3715, Intro, p. 2; DTX 6328, p. 5.
109. Educator evaluation in Connecticut is standards-based, using the Connecticut
Common Core of Teaching for teacher evaluation, Common Core of Leading: Connecticut
Leadership Standards for administrator evaluation, and national pupil personnel services
standards for evaluation of educators in pupil services as reflected in the CT Guidelines for
20
Educator Evaluation, updated June 2015. DTX 6328, p. 4; Barzee Testimony, 4-14-16, p.
133:26-134: 2.
110. The Connecticut Common Core of Teaching (CCT) Rubric for Effective Teaching
2014 is a standards based tool, aligned with the Common Core of Teaching, offered as an option
for use as part of a district’s evaluation and support plan when evaluating teachers. DTX 5949,
Intro, p. 2.
111. The Connecticut Leader Evaluation and Support Rubric 2015 is a standards based
tool, aligned with the Common Core of Leading, offered as an option for use as part of a
district’s evaluation and support plan when evaluating administrators. DTX 5953, Intro p. 2;
DTX 6328 p. 4; Barzee Testimony, 4-14-16, p. 136:9-11.
112. The Connecticut Common Core of Teaching (CCT) Rubric for Effective Service
Delivery 2015 is a standards based tool, aligned with the CCT, offered as an option for use as
part of a district’s evaluation and support plan when evaluating educator support specialists,
including but not limited to: school psychologists, speech and language pathologists, school
social workers, school counselors, board certified behavior analysts, home school family liaison,
instructional coaches, and transition coordinators. DTX 5950, Intro p. 2, 4.
113. A majority of an educator’s evaluation is based on objective components as
reflected in the rubrics aligned to the educator evaluation process. Barzee, Trial Testimony pp.
45-46, 65-68; DTX 5949, 5953, 5950.
114. Summative evaluations are required on an annual basis. Barzee Testimony, 4-22-
16, p. 31:13-14.
115. There are four levels of performance designations: exemplary, proficient,
developing, and below standard. Barzee Testimony, 4-22-16, p. 3116-20; DTX 6328, p. 6.
21
116. The evaluation system is comprised of multiple measures that include: 50%
outcomes, further broken down into 45% student growth using multiple indicators of academic
growth and development developed through mutual agreement by each teacher and their
evaluator at the beginning of the year and 5% student feedback or whole-school indicator; and
50% practice, further broken down into 40% observation of an educator’s practice and
performance and 10% stakeholder feedback, which could be either parent feedback or peer
feedback. DT 6328, pp. 8-13; Barzee Testimony, 4-22-16, p. 31:27-32:22.
117. With regard to the 45% academic growth and development indicator, half of that
portion (22.5%) had been planned to be based on the state test assessment for teachers to whom
it applies, but that requirement is still being studied. DTX 6328, p. 9; Barzee Testimony, 4-22-
16, pp. 32:23-36:26. While the state assessment is not yet used, districts use other standardized
assessments where available, and in the absence of another standardized assessment, it is
acceptable to use non-standardized assessments appropriate to the role of the educator. Barzee,
4-22-16, pp. 33-34.
118. Districts and schools must provide professional learning opportunities for teachers
based on the individual’s needs identified through the evaluation process. DTX 6328, p. 13.
119. The most important part of the evaluation of teachers is the courage of the
principal to have difficult conversations with the teacher during the evaluation process. That
skill cannot be legislated, but can be taught, and in fact is being taught through the LEAD CT
program. Wentzell Testimony, 5/5/16; Villanova Testimony.
120. Evaluations of non-tenured, ineffective teachers as well as tenured ineffective
22
teachers are reviewed by the Superintendent herself and action is taken to ensure that only highly
effective teachers staff schools in districts, such as Bridgeport Public Schools. Cohn
Testimony.
121. Danbury Public Schools used Alliance District money to pay for teacher
evaluations and for an evaluator for the Marzano protocol, an inter-rater reliability training to
build greater internal and instructional coherence. Pascarella Testimony, 2/2/16, pp. 182-
3. Similarly, other focus districts are using Alliance District funding for teacher and
administrator evaluations. See, e.g., DTX 6114, p. 1 (East Hartford Year 4 Summary –
evaluation - training new teacher and administrators); DTX 6122, pp. 1-2 (Bridgeport Year 4
Summary – TEVAL and PD Committee will establish learning opportunities based on needs
related to teacher evaluations, new professional practices and programs, SRBI, and other
mandates. Pro-traxx will be used to catalog sessions and choice given to teachers based on data
and recommendations. PD for administrators to include recalibration of ratings, classroom visits
and review of current research to improve teaching and learning. PhocusD Learning to support
administrator evaluation/calibration.); DTX 6234, p. 1 (New Britain Year 4 Summary – 6
building administrators to support evaluation and development with feasible teacher ratio-PD to
support classroom walkthroughs and additional training for leaders in ELD/ELE to become
highly effective leaders); DTX 6232, p. 1 (Windham Year 4 Summary – administrator training
on state evaluation system).
122. Under Conn. Gen. Stat. § 10-157(a), local boards of education shall evaluate the
performance of the superintendent annually in accordance with guidelines and criteria mutually
determined and agreed to by such board and such superintendent.
123. LEAD CT has developed a model evaluation for superintendents. Wentzell
23
Testimony, 5/5/16. This model is currently being used voluntarily by some districts in CT. Id.
124. The state used performance-based evaluations for superintendents in New London
and Windham as part of the special master program in those districts. Wentzell Testimony,
5/5/16.
Findings of Fact: High School Graduation Standards
Statutory Framework
125. Local school districts are required to ensure that students have a satisfactory level
of basic skills competency prior to graduation. Conn. Gen. Stat. § 10-223a(b). See DTX 6430.
126. State law guides local districts in establishing their high school graduation
policies. Conn. Gen. Stat. § 10-223a(b) provides in relevant part that "each local and regional
board of education shall specify the basic skills necessary for graduation . . . and include a
process to assess a student's level of competency in such skills. The assessment criteria shall
include, but not be exclusively based on, the results of the mastery examination, pursuant to
section 10-14n, for students in grade ten or eleven. Each local and regional board of education
shall identify a course of study for those students who have not successfully completed the
assessment criteria to assist such students to reach a satisfactory level of competency prior to
graduation." C.G.S. § 10-223a(b).
127. Conn. Gen. Stat. § 10-14n provides in relevant part that the "mastery
examination" means "an examination or examinations, approved by the State Board of
Education, that measure essential and grade-appropriate skills in reading, writing, mathematics
or science." C.G.S. § 10-14n.
128. Conn. Gen. Stat. § 10-14n(e) provides that "No public school may require
24
achievement of a satisfactory score on a mastery examination, or any subsequent retest on a
component of such examination as the sole criterion of promotion or graduation." Thus,
satisfactory completion of the mastery examination is part of, but not solely, what a local district
must consider in the construction of its local graduation requirements. Id.; Wentzell Testimony,
4/15/16, p. 70.
129. Prior to July 1, 2013, the mastery examination for high school was the
Connecticut Academic Performance Test (CAPT), administered in grade 10. Testimony of
Dianna Wentzell, 4/15/16, p. 69; Gopalakrishnan Testimony. For the 2013-14 and 2014-15
school years, the high school level mastery examination for reading, writing and mathematics
was the Smarter Balanced Assessment Consortium (SBAC), administered in grade 11, and the
CAPT for science, administered in grade 10. RFA 191; Gopalakrishnan Testimony, 5/18/16.
130. In the 2013-14 school year, the SBAC assessment was given as a field test only,
so results were not available. Therefore, the baseline year for the SBAC assessment is 2014-15.
Gopalakrishnan Testimony, 5/18/16. In 2015-16, the high school level mastery examination for
reading, writing and mathematics was changed from the SBAC to the SAT, administered in
grade 11, and was again the CAPT for science, administered in grade 10. Gopalakrishnan
Testimony, 5/18/16.
131. Although the CSDE does not have the authority to define what "satisfactory level
of competency prior to graduation" means for each local school district (prerogative of each
local/regional school district under C.G.S. § 10-223a), the CSDE has provided guidance and
support to districts on how to specify a "competency" and then identify how they will assess
students' competencies and determine the level or standard required to be met (assessment
25
criteria) for graduation. DTX 6430; Wentzell Testimony, 4/15/16, p. 67; Gopalakrishnan
Testimony, 5/18/16.
132. The CSDE has also provided model high school graduation policies to districts
that it distributed to all superintendents in the state and makes publicly available on its website.
DTX 6430. The Connecticut Association of Boards of Education (CABE), a CCJEF member,
also develops model policies for districts. The CSDE has worked directly with CABE to develop
model policies for boards of education in the area of local graduation requirements. Wentzell
testimony, 4/15/16, p. 73.
133. In accordance with § 10-223a(b), the CSDE has set up achievement levels on the
mastery examinations that can be used by local districts. For example, local districts decided
whether "a satisfactory level of basic skills competency" on the CAPT test was either at goal or
proficiency, based on guidance from the CSDE's achievement level descriptors. Wentzell
Testimony, 4/15/16, p. 65; Gopalakrishnan Testimony, 5/18/16. Under the SBAC test, the
desired achievement level was level 3. Gopalakrishnan Testimony, 5/18/16. The achievement
level descriptor for grade 11 stated that "students performing at [level 3] are on track for likely
success in rigorous high school coursework and entry level, credit-bearing college coursework or
career training." PTX 1200, pp. 15, 18. Through such descriptors, the CSDE conveys its
expected level of performance to all districts. Gopalakrishnan Testimony, 5/18/16.
Achievement levels on the redesigned SAT, which was used for the first time in 2015-16, have
not yet been established. Id. They will be established during the summer of 2016 and made
available to districts thereafter. Id. Setting these standards first requires review and use of the
SAT results from 2015-16. Id. Once that occurs, the SAT will also become part of the Next
Generation Accountability System. Id.
26
134. Pursuant to § 10-223a(b), where a student does not meet the satisfactory level of
competency on a mastery examination, additional support is provided to the student to assist
him/her in demonstrating competency prior to graduation. For example, in New Britain during
Sharon Locke's tenure as Chief Academic Officer, ending in 2013-14, if a student scored basic or
below basic on the CAPT test, that student could take an alternative assessment that New Britain
created in-district. Locke Testimony, 1/12/16, pp. 146-7. Or if a student had an individualized
education plan (IEP), that student could do a portfolio presentation or demonstrate proficiency in
some other way. Id. New Britain would offer intervention classes for students below proficient
at high school level. Id. Students would also continue to take the in-house performance measure
until they demonstrated mastery. Id. The in-house test used the constructs of the CAPT
assessment. Id. Students could also demonstrate mastery on the SAT test. Id. Similarly, in East
Hartford, if a student did not reach proficiency on the CAPT, he/she would take an additional
class and could earn proficiency through successful completion of that class. Quesnel
Testimony, 1/14/16, pp. 121-4.
135. For a state-issued high school diploma, the CSDE uses an objective measure, i.e.,
the GED exam and its objectively established passing standards, to determine the student
eligibility for a high school diploma. Conn. Gen. Stat. § 10-5; Gopalakrishnan Testimony,
5/18/16.
136. In 2010, the Connecticut State Board of Education (CSBE) adopted the Common
Core State Standards (CCSS) in English Language Arts and Mathematics. In 2015, the CSBE
adopted the Next Generation Science Standards (NGSS). Wentzell Testimony, 4/15/16, p. 77;
Cohn Testimony. As a result, the state has (1) set more rigorous curricular standards focused on
college and career readiness (Common Core State Standards and Next Generation Science
27
Standards), (2) aligned mastery examinations to those more rigorous standards (SBAC,
redesigned SAT, and CAPT in science), and (3) set or will be setting (in the summer of 2016)
achievement level goals for those examinations (level 3 for SBAC, proficiency or goal for
CAPT, and SAT levels to be set in summer 2016). Gopalakrishnan Testimony, 5/18/16. The
state has also provided substantial support and guidance to districts, and devoted considerable
financial resources to assist districts in implementing the new standards and tests. DTX 4716;
DTX 6236; Demsey Testimony, 1/14/16, p. 114; Cohn Testimony.
137. Many superintendents have reported to the CSDE that the new more rigorous state
standards are having a positive impact on what students are learning at school and in their
readiness for life after high school. Wentzell, 3/31/16, 26-7.
138. The state dedicated $8M in 2012-13 and $6M each subsequent year for
implementation of the CCSS. Cohn testimony, 5/24. That investment included professional
development, the CCSS website, and direct funding to districts for implementing CCSS in their
schools. Cohn testimony, 5/24/16. Districts are also using Alliance District funding for CCSS
implementation. See, e.g., Quesnel Testimony, 1/15/16, pp. 182-3 (Using Alliance District
funding, East Hartford began implementing CCSS and developed literacy and math programs
aligned with the CCSS); DTX 6122, p. 2 (Bridgeport Year 4 Summary – positions to support
Common Core aligned Curriculum Transition including visual and performing arts as developed
by newly appointed Director of performing arts on Academic Team). The state has also
provided substantial funding in technology grants to help districts align their technology to the
CCSS, SBAC and redesigned SAT. DTX 4716; DTX 6236; Demsey Testimony, 1/14/16, p.
114; Cohn Testimony.
139. The CSDE also provides professional development to districts for implementation
28
of the NGSS. Cohn testimony, 5/24/16. RESCs also provide professional development for
CCSS curriculum development which has informed the work of districts, including Danbury and
Windham. Pascarella, 2/2/16, p. 204; Garcia Testimony, 3/4/16, p. 58. Teachers in Alliance
Districts can attend the CSDE's CCSS trainings for free. Id., 175. Alliance District funding has
also been used to purchase supplies, instructional materials and technology aligned to the CCSS.
Id., 183.
140. The CSDE has a fully dedicated staff member for NGSS assessments and another
for NGSS implementation. The CSDE has also contracted with the CT Science Center to
develop professional development to train teachers, sample curriculum units and lessons, and
perform tasks. Cohn testimony, 5/24/16.
141. The CSDE also provides supports to districts regarding standardized assessment
testing and technology training for tests such as the SBAC and SAT. Cohn testimony, 5/24/16;
Garcia Testimony, 3/4/16, p. 58.
142. The SBAC and newly redesigned SAT tests are designed to align with the more
rigorous CCSS. Gopalakrishnan Testimony, 5/18/16.
143. As part of establishing the SAT as the mastery examination for 11th graders, all
students are afforded free access to the examination and can benefit from the information and
supports that accompany the examination which encourage students to think about college.
Gopalakrishnan Testimony, 5/18/16. The state also offers free SAT preparation classes for
students through a partnership with Khan Academy. Id.
144. The state also pays for the universal administration of the PSAT in the Alliance
Districts. Gopalakrishnan Testimony, 5/18/16. The PSAT offers predictive information relative
to AP potential. The CSDE sends letters to individual students who achieve a certain score on
29
the PSAT encouraging them to ask their schools and districts about the availability of AP
courses. Id.
145. Conn. Gen. Stat. §§ 10-221a(a)-(e) sets forth high school graduation requirements
pertaining to the completion of credits. For example, §§ 10-221a(b) and (c) set forth the
requirements for credit completion for classes graduating from 2004 to 2020, and 2021 and
thereafter, respectively. In 2021, the graduation standards will increase from 20 to 25 credits,
with more specificity as to the composition of those credits. Id.; Wentzell 4/15/16, p. 57.
146. While the current minimum requirement is 20 credits, some districts have a tiered
credit system. In Windham, for example, students need to complete at a minimum 21 credits to
graduate. Students can also complete 25 credits to graduate with distinction. Garcia Testimony,
3/4/16, p. 80.
147. C.G.S. § 10-221a(d) provides that, "Commencing with classes graduating in 2021,
and for each graduating class thereafter, local and regional boards of education shall provide
adequate student support and remedial services for students beginning in grade seven. Such
student support and remedial services shall provide alternate means for a student to complete any
of the high school graduation requirements or end of the school year examinations described in
subsection (c) of this section, if such student is unable to satisfactorily complete any of the
required courses or exams. Such student support and remedial services shall include, but not be
limited to, (1) allowing students to retake courses in summer school or through an on-line course;
(2) allowing students to enroll in a class offered at a constituent unit of the state system of higher
education, as defined in section 10a-1, pursuant to subdivision (4) of subsection (g) of this
section; (3) allowing students who received a failing score, as determined by the Commissioner
of Education, on an end of the school year exam to take an alternate form of the exam; and (4)
30
allowing those students whose individualized education programs state that such students are
eligible for an alternate assessment to demonstrate competency on any of the five core courses
through success on such alternate assessment."
Mastery-Based Learning
148. In 2013, legislation was passed that allows school districts to move toward a
"mastery-based diploma," where students are able to accumulate credits based on demonstrations
of competencies rather than on the number of hours that they spend in class. Wentzell
Testimony, 4/15/16, pp. 64-5. Conn. Gen. Stat. § 10-221a(f) provides in relevant part that
"Determination of eligible credits shall be at the discretion of the local or regional board of
education, provided the primary focus of the curriculum of eligible credits corresponds directly
to the subject matter of the specified course requirements. . . . For purposes of this section, a
credit shall consist of not less than the equivalent of a forty-minute class period for each school
day of a school year except for a credit or part of a credit toward high school graduation earned
(1) at an institution accredited by the Board of Regents for Higher Education or Office of Higher
Education or regionally accredited, (2) through on-line coursework that is in accordance with a
policy adopted pursuant to subsection (g) of this section, or (3) through a demonstration of
mastery based on competency and performance standards, in accordance with guidelines
adopted by the State Board of Education." (Emphasis added.)
149. In accordance with C.G.S. § 10-221a(f), in June, 2015, the CSBE adopted a set of
guidelines for school districts that are permissively moving toward a mastery-based credentialing
system. DTX 5590. Currently there are about twenty high schools in Connecticut that utilize
mastery-based credentialing, including schools in New Haven (including a Commissioner's
31
Network school) and Windsor Locks, both Alliance Districts. Wentzell 3/31/16, pp. 100-1;
Cohn Testimony; DTX 5590.
150. The CSBE guidelines on mastery-based learning are designed to support local
decisions regarding policy, practice and community engagement. DTX 5590. The guidelines are
developed so that student expectations for mastery-based learning align with state content
standards. Id. They also include provisions for multiple pathways for learning and local
accountability for the implementation of equitable learning for all students. Id. Under the
guidelines, students must demonstrate mastery in order to advance. Id.; Wentzell Testimony,
3/31/16, p. 99. The intent is to create increased flexibility for students, teachers, schools,
districts and their communities to design and individualize learning in alignment with state
content standards and frameworks. DTX 5590. The standards are objective in each content area.
Wentzell Testimony, 3/31/16, p. 101. Additionally, the CSDE will develop a series of resources
for local use and distribute these resources in multiple ways including using a website. DTX
5590. The CSDE also has a staff member dedicated to mastery-based learning. Cohn Testimony,
5/24/16.
151. Mastery-based learning places emphasis on rigorous college and career learning
competencies and quality instruction and curriculum drawn from state graduation requirements
and state content standards. DTX 5590. Learning will emphasize authentic experiences and
application of critical knowledge that students engage in at school, in the community or online.
Id. While teachers have always used state content standards in their summative assessments,
mastery-based learning requires students to demonstrate mastery of the aligned competencies in
order to move ahead. Id. Mastery-based learning pushes schools to create powerful learning
experiences for every student regardless of his/her past learning history and allows students to
32
demonstrate mastery through a body of evidence. Id. Mastery-based learning requires students
to meet state identified standards and local competencies that are assessed through multiple and
flexible pathways in a learner-centered environment. DTX 5590.
Next Generation Accountability System
152. Connecticut's Next Generation Accountability System (NextGen system) makes
very public and transparent which schools are doing a good job on delivering a quality education
to students and is an important indicator of whether students have been served well by their
district. The system is also tied to supports from the state and consequences at the state level.
Wentzell Testimony, 3/31/16, p. 19.
153. The NextGen system and supports from the state demonstrate the state's
commitment to collaborating with districts to graduate students who are prepared for college or
career. Gopalakrishnan Testimony, 5/18/16. The system is also structured so as not to create
undue pressure on districts to raise graduation rates. Id. Under the NextGen system, graduation
rates are one of several indicators at the high school level, and are weighted relatively low
compared to achievement and growth in achievement on standardized assessments, thereby
providing a safeguard against districts lowering graduation standards in order to increase
graduation rates. DTX 6111; Gopalakrishnan Testimony, 5/18/16.
154. The NextGen system looks at graduation in two ways -- one is the 4-year rate; the
other is the 6-year rate for high needs students. DTX 6111; Gopalakrishnan Testimony, 5/18/16.
Both the 4- and 6-year rates are weighted equally. Id. The 4-year graduation rate (indicator 8) is
weighted at 100, which is only 8% of the total index for a given school or district. Id. The 6-
year graduation rate for high needs students (indicator 9) is also weighted at 100, which
encourages districts to retain and reengage high needs students to ensure that they are ready
33
academically before graduating. Id. Despite pushback from the USDOE, the CSDE fought hard
to include the 6-year graduation rate in the NextGen system, and listened to feedback from
superintendents, such as Dr. Pascarella in Danbury, who wanted the 6-year rate to be part of the
system because high needs students such as English learners might need more time to reach
grade level. Gopalakrishnan Testimony, 5/18/16.
155. Under the NextGen system, if a district's 4-year graduation rate is, for example,
70%, the district does not get 0 points for indicator 8. DTX 6111; Gopalakrishnan Testimony,
5/18/16. Instead, it would get 74.46 out of 100 points (94 is the state's 4-year graduation rate
target). Id. This too safeguards against lowering standards to increase graduation rates. Id.
156. In addition to the graduation rates themselves, the NextGen system has other
indicators that emphasize academic readiness based on test-based measures; this includes the
performance index for state mastery examinations (indicators 1 and 2), as well as performance
on SAT/ACT/AP/IB (International Baccalaureate) exams and workplace experience (indicators 5
and 6). DTX 6111; Gopalakrishnan Testimony, 5/18/16. These indicators provide safeguards
that militate against adulterating graduation standards. Gopalakrishnan Testimony, 5/18/16. For
example, indicators 5 and 6, 50 points each in the index, are for preparation for postsecondary
and career readiness -- coursework and exams, respectively. DTX 6111; Gopalakrishnan
Testimony, 5/18/16. So, districts are rewarded for exposing students to college and career
coursework and exams. Indicator 5, which is an opportunity access indicator, includes
coursework such as AP, IB, dual enrollment coursework, career and technology education (CTE)
coursework, and workplace experience "courses." Id. Indicator 6 is for students achieving
college and career readiness benchmark in assessments including SBAC 11th grade, SAT, ACT,
AP and IB. Id.
34
157. Additionally, Indicator 7 in the NextGen system awards points to schools and
districts for the percentage of 9th grade students earning at least 5 full year credits in the year and
no more than one failing grade in English, math, science or social studies. DTX 6111;
Gopalakrishnan Testimony, 5/18/16.
158. The CSDE is unaware of any school in CT where none of the students are at grade
level. Wentzell Testimony 3/31/16, p. 95. In fact, under the NextGen system's recent index
results, several high needs groups in focus district schools are outperforming the statewide high
needs group average in one or more subjects, including 10 schools in Bridgeport, 6 schools in
New Britain, 4 schools in East Hartford, and 2 schools in New London. DTX 6215;
Gopalakrishnan Testimony, 5/18/16.
Graduation Standards in Focus Districts
159. Plaintiffs have presented no evidence that graduation standards have decreased in
recent years. In fact, graduation standards have not fallen while at the same time graduation
rates have steadily increased across the state over the last 5-6 years. Wentzell Testimony,
3/31/16, p. 24; Ryan Testimony, 3/1/16, 43-4; DTX 3647, 5281; Defs' Demonstrative 7 (Trend in
Statewide Adjusted Cohort Graduation Rates).
160. Graduation rates have increased as students in CT are becoming more engaged in
the classroom, particularly in the focus districts. For example, attendance has been increasing;
see, e.g., Rabinowitz Testimony, 1/22/16, pp. 151-2, DTX 5358, p. 18; chronic absenteeism has
declined; see, e.g., DTX 6422-24, Defs' Demonstrative 12, Salina Testimony, 1/13/16, p. 49; and
the rates of in- and out-of-school suspensions has declined. See, e.g., DTX 6479 (East Hartford
Public Schools Memo re 135 Day Report 4/1/16); Rabinowitz Testimony, 1/22/16, pp. 151-2.
161. The graduation and handing of a diploma to a student signifies that a student has
35
successfully met mastery in the requirements that the local school districts are tasked to provide
to students. Quesnel Testimony, 1/14/16, p. 120. Superintendents have to certify every year at
graduation that each of the diplomas they award indicates that the student has met the state
graduation requirements. Wentzell Testimony, 3/31/16, p. 16. A superintendent who knowingly
graduates students she knows are "illiterate" is not meeting her ethical obligations as a
superintendent, and is breaking the code of ethics for a professional educator in CT. Id., 82.
162. East Hartford High School is graduating more and better educated students today
than it was ten years ago. Ryan Testimony, 3/1/16, 43-4.
163. East Hartford's other high school is the International Baccalaureate (IB)
Academy. Using Alliance District funding, East Hartford has also adopted the IB curriculum in
some of its elementary schools and middle schools. Quesnel Testimony, 1/15/16, p. 115. This
curriculum focuses students on high level, rigorous thinking skills. Id., 116. It is a dynamic
program which is on par with Advanced Placement (AP) coursework. Id.
164. From April 2015 to April 2016, East Hartford has seen an increase in STAR
Reading and Math assessments, an increase in intervention fidelity, and a decrease in chronic
absenteeism and in- and out-of-school suspensions. DTX 6479 (East Hartford Public Schools
Memo re 135 Day Report 4/1/16).
165. Regarding any perceived pressure to increase graduation rates, East Hartford High
School Principal Matt Ryan does not focus on "whether I have what the numbers people want me
to have," but says that "if we do the right things or try to do the right things, the numbers
eventually follow…. As far as adhering to the expectations, we try to focus in on those and do
the best we can. I haven’t had penalties...." Ryan Testimony, 3/1/16, p. 43.
166. New London's graduation rate in 2014 was 72%, the highest it has been in the last
36
8-9 years. Thompson Testimony, 2/22/16, p. 3. This was attributable to additional supports for
students. Id. For example, based on results such as progress in attendance and decreases in out-
of-school suspensions, the SRBI model is working in New London. Id., 59.
167. There have been steady increases in reading and math standardized test scores
from fall 2014 to fall 2015 at New London High School (NLHS); steady increases in daily
attendance from 2011-12 to 2014-15 at NLHS; decreases in out of school suspensions from
2012-13 to 2014-15 at NLHS; and steady increases in graduation rates from 2011-12 to 2013-14
at NLHS. DTX 5358, p. 18. According to NLHS Principal Tommy Thompson, this shows that
"the trajectory at NLHS is exactly where it should be and that's up." Id., 31.
168. In 2012, New London High School increased its CAPT scores by 33.3% in
reading and 15.6% in math. DTX 6081 (NLHS 5 Year Progress Report), p. 28. It also met its
goal of increasing every subgroup and nearly eliminated the achievement gap in reading between
white and black students with both groups earning about 82% proficiency or above. Id. New
London High School was awarded a bronze medal as part of the US News & World Report's
2014 Best High Schools rankings for its subgroups outperforming their peers in the state based
on CAPT and SAT scores as well as AP course participation from 2010 to 2014. Thompson
Testimony, 2/18/16, pp. 7-8.
169. From 2012 to 2015, Windham's graduation rates increased from 70.2% to 81.7%.
Garcia Testimony, 3/4/16, pp. 78-9. During that time, Windham teachers and administrators
have received SRBI training as well as PBIS training from the state. Id., pp. 89-90. Using
Alliance District funding, Windham has also been utilizing the CK3LI model in grades K-3
(serving 1,159 students), which has helped create dramatic improvement for K-3 students in
37
DIBELS reading scores and the Riverside Interim Assessment in ELA. Garcia Testimony,
4/3/16, pp. 72-8; Cohn Testimony, 5/24/16; DTX 6474 (Narrowing the Achievement Gap).
170. New Britain's graduation rate has increased from 55% in 2011 to 69% in 2015,
due in part to New Britain's reinstituting some courses at the high school, such as technology
education, consumer classes and fine arts classes, which have helped draw students and maintain
their interest in school. Salina Testimony, 1/13/16, pp. 31-2.
171. In Bridgeport, international baccalaureate programs provide students with access
to a rigorous curriculum. Johnson Testimony, 1/26/16, p. 137.
172. Chronic absenteeism has decreased significantly in New Britain. For example,
chronic absenteeism in kindergarten in New Britain dropped from 30% in 2011-12 to 13.4% in
2013-14. Salina Testimony, 1/13/16, p. 49. The rate decreased for elementary schools as well,
including from 19% in 2014-15 to 10-12% as of January 2016 at Lincoln Elementary School.
Id., p. 50; Cabral Testimony, 1/13/16, pp. 156-7. Decreases in chronic absence and
corresponding increases in time in class for instruction are correlated with better performance in
school. Frassinelli Testimony, 5/5/16; Salina Testimony, 1/13/16, p. 50 ("it is a good thing that
they have had success in getting more of the students in the classroom"). See also DTX 6422-24
and Defs' Demonstrative 12 (decreases in CA in focus districts, all outpacing the state average).
173. In accordance with her responsibility as Superintendent of Schools, Bridgeport
Superintendent Frances Rabinowitz has worked to ensure that her students are graduating
prepared for life after high school. The curriculum in all of Bridgeport's schools is aligned to the
more rigorous Common Core State Standards. Rabinowitz, 1/26/16, p. 20. Also, Superintendent
Rabinowitz held back several students in 2015 because she did not believe they were meeting the
38
graduation standards based on inadequate work they were doing using an online credit recovery
program. Rabinowitz Testimony, 1/22/16, pp. 82-3.
174. To work on compliance with new graduation requirements, Bridgeport will be
establishing a high school graduation committee, comprised of Aresta Johnson, Assistant
Superintendent for Secondary Schools, the district's director of guidance, a principal in the
district, and other administrators, counselors and teachers in the district. Johnson Testimony,
1/26/16, pp. 94-5.
175. In its Alliance plan, Bridgeport has added additional supports, including, but not
limited to, literacy and math coaches to support SRBI by providing embedded professional
development to teachers to improve instruction and differentiation for all students, as well as
interventionists, intervention and enhancement at the elementary level, and attendance
intervention officers at the high school. DTX 6122, pp. 1-3. Bridgeport high schools have
literacy interventionists available to students. Johnson Testimony, 1/26/16, p. 100. Bridgeport
also has literacy programs in reading, such as myOn, Wilson Just Words, and American Reading
Company, and in math, such as Symphony Math. Id. Bridgeport has also received SRBI
training through the State Personnel Development Grant (SPDG), PBIS (Positive Behavioral
Interventions and Supports) training through the School Climate Transformation Grant (SCTG),
and additional support through the Safe Schools and Health Student Grant (SSHS), such as well-
managed classroom training, which trains teachers in better responding to the social and
emotional needs of children, and the hiring of three additional social workers. Cohn Testimony;
Frassinelli Testimony, 5/6/16; Rabinowitz Testimony, 1/22/16, p. 121. The well-managed
classroom training is also provided to New Britain through the SSHS grant. Frassinelli
Testimony, 5/6/16; Maselek Testimony, 1/28/16, pp. 185-6.
39
176. Bridgeport also uses the Ruler Program, which provides training to teachers and
administrators in social and emotional support for students. Rabinowitz Testimony, 1/22/16, pp.
149-52. This program uses private funding as well as funding through the Safe Schools and
Health Students Grant, and is relatively inexpensive. Id., 152; Frassinelli Testimony, 5/6/16. As
a result of this training, Bridgeport has seen attendance improving and both chronic absenteeism
and out-of-school suspensions decreasing. Id., 151-2.
177. In Bridgeport, based on results from interim assessments, students are making
incremental positive changes in test scores in reading and math, and showing growth in
behavioral components, such as chronic absenteeism and both in- and out-of-school suspensions.
Rabinowitz Testimony, p. 1/22/16, p. 103.
178. More recently, Bridgeport elementary students have made academic progress on
AIMSWeb assessments, which is on the approved list of early reading screening tests that
Priority School Districts are required to administer in grades K-3. DTX 6341. The test reflects
whether a student is on grade level for literacy and math. Johnson Testimony, 1/26/16, p. 103.
The AIMSWeb results show that from the winter of 2015 to the winter of 2016, across the board,
for grades 1-9, the number of students scoring below the 25th percentile declined for reading
fluency, comprehension and math. Id. The percentage of students scoring in the 50th and 75th
percentiles grew. Id. In addition to comparing scores one year to the next, the district also
looked at cohort scores over time, and found in almost all cases students did better in 2016 than
in 2015. Id. Superintendent Rabinowitz said that these gains were due to a heavy emphasis on
reading and math. She added, "What we can say is growth is taking place across the grades," and
that "It makes sense that if students are better readers, they should perform better on other
assessments that require reading." Id.
40
179. Five years ago, Danbury Public Schools eliminated all "low track" courses for
high school students, and instead integrated classes. Pascarella Testimony, 2/2/16, pp. 130-40.
As a result, there is more diversity in classes, and gains have been realized in having advanced
students in the same class as struggling students for role modeling and mentoring. Id. These
students now feel part of the culture and climate of the school by having access to all programs.
Id. If students are struggling academically, they are provided special support, which has been
aided by the use of grants. Id. Instruction is now differentiated in order to integrate the
different tiers of students in the classroom. Id. The district uses professional development to
train teachers to differentiate instruction. Id.
180. Danbury Public Schools do not "socially promote," i.e., do not advance students
who do not earn the required credits. Pascarella Testimony, 2/2/16, p. 159. Moreover, the
EXCEL program in Danbury offers college preparation to lower income and future first
generation college students. Middle school students move up to ConnCAP/Upward Bound at the
high school level. Id. Student success has been proven in the program's retention rate and rate
of attendance at four-year colleges. Id.
181. In Hartford during Commissioner Wentzell's tenure there (2011-13), graduation
rates increased while at the same time higher standards were adopted. Wentzell Testimony,
3/31/16, p. 12, 22, 24, 89-93.
182. Another beneficial program is the summer school learning grant for PSDs.
Wentzell Testimony, 3/31/16, p. 92-3; Cohn Testimony. During Commissioner Wentzell's
tenure in Hartford, the district used that opportunity to redesign summer learning to be a
meaningful intervention for students behind grade level. Wentzell Testimony, 3/31/16, p. 92-3.
All of the students not at grade level by January of the school year in grades K-7 were required
41
to attend summer school. Id. As a result of these structural changes, Hartford Public Schools
increased its graduation rates while at the same time raising standards. Wentzell Testimony,
3/31/16, p. 24.
Alternative Credit Recovery Programs
183. Alternative schools provide credit recovery options for students. See C.G.S. § 10-
221a(d), (f). For example, New Britain's Satellite Careers Academy is an alternative school
located in a separate building from the high school that assists overaged, undercredited students
to graduate. Maselek Testimony, 1/28/16, 174-5.
184. Regarding online credit recovery programs, in 2010, the legislature passed P.A.
10-111, codified in Conn. Gen. Stat. 10-223g, which provides that "A local or regional board of
education for a school district with a dropout rate of eight per cent or greater in the previous
school year shall establish an on-line credit recovery program. Such program shall allow those
students who are identified by certified personnel as in danger of failing to graduate to complete
on-line coursework approved by the local or regional board of education for credit toward
meeting the high school graduation requirement pursuant to section 10-221a. Each school in the
school district shall designate, from among existing staff, an on-line learning coordinator who
shall administer and coordinate the on-line credit recovery program pursuant to this section."
185. In Hartford, there are online credit recovery programs that are very rigorous.
Wentzell Testimony, 3/31/16, p. 98. In Windham, the online credit recovery programs are an
adequate way to fill in the gaps for students who are undercredited. Garcia Testimony, 3/4/16, p.
30. Dr. Carver, when she was Assistant Superintendent in New London, developed two credit
recovery programs for "at risk" high school students, increasing graduation rates. Carver
42
Testimony, 2/4/16, p. 72. One program was off-campus for expelled students, and the other was
an online credit recovery program at New London High School. Id.
Remedial courses
186. In her testimony, Superintendent Rabinowitz was asked by the Court whether a
"functionally illiterate" person has graduated from Bridgeport Public Schools. Rabinowitz
Testimony, 1/22/16, p. 63. This was the first time the term "functionally illiterate" was used at
trial, and no other plantiffs' witness used the term in their testimony to describe graduates of their
schools or districts. Superintendent Rabinowitz responded that "I would hope it doesn’t happen,
but I can't say with complete certainty … that it has never happened or doesn’t happen." Id. She
added that the term "functionally illiterate" has different meanings and that, to her, if an
individual is not successful, "even in a job that doesn’t require tremendous skill, they're
functionally illiterate." Id., 63-4. She later added that, "there's a percentage of students that are
graduating without the requisite skills. And we know that because if they go to college, they're
taking remedial courses." Id., 65.
187. High school graduates who may not have attained college level literacy may be
required to take a remedial course upon entering college. Wentzell Testimony, 3/31/16, p. 84.
This is a national phenomenon, and remediation rates tend to be higher at community colleges
than at state universities. Gopalakrishnan Testimony, 5/18/16; PTX 963, p. 17.
188. The remediation rates identified in the P20Win Report (PTX 963) are for the
Class of 2010 cohort. PTX 963 p. 14 ("Students are included in the 2010 Graduation Cohort if
they were first-time 9th graders in school year 2006-2007 and obtained a regular high school
diploma in four years or less.") This group of students graduated before the more rigorous
Common Core State Standards and Next Generation Science Standards were implemented in
43
2010 and 2015, respectively. Gopalakrishnan Testimony, 5/18/16. CCSS leads to more
complex, college and career readiness reading and writing and math skills, and in specific subject
areas, than under the old standards. Gopalakrishnan Testimony, 5/18/16. The remedial rates in
the report also did not include students who may have graduated in 5 or 6 years. PTX 963 p. 14.
Nor did the rates include students who attended the University of Connecticut, out-of-state
schools, or private colleges or universities. Gopalakrishnan Testimony, 5/18/16.
189. Further, the remediation classes in PTX 963 are those that were classified as
remedial at CT State Universities and Community Colleges based on the manner in which
remedial courses were identified through the spring of 2013. PTX 963 p. 16. Since then, CT
State Universities and Community Colleges have made changes to their remedial and
developmental education offerings based on education reform required by PA 12-40. Id. For
example, the content of some remedial courses, the method in which these courses are taught and
the manner in which students are placed into these courses have changed in many cases. Id.
Because of these differences, data points in PTX 963 should not be directly compared to data
points about remediation from more recent academic years. Id.
190. In response to the remediation issue, and to build stronger ties among educators
and policymakers at all levels of education in the state, from preschool to graduate school, the
legislature passed PA 12-40, amended by PA 14-217, sec. 209. This law is intended to shift the
state from conventional, developmental remediation to a model of embedded, intensive,
transitional instruction, where students will receive their remedial education either embedded in
college level classes, through an intensive remedial course, or via transitional programs
associated with the community college structure. Cohn Testimony, 5/24/16. It also requires the
Board of Regents to examine the effectiveness of the remedial coursework and how students are
44
getting identified for the remedial coursework so that there will be more connection between the
two systems. Wentzell Testimony, 4/15/16, p. 55.
191. PA 12-40 (amended by PA 14-217, sec. 209) requires that, starting in the fall
semester of 2014 for the Connecticut State University System and not later than the start of the
fall semester of 2015 for the regional-community technical colleges, public institutions of higher
education in the state must provide embedded remedial support within credit-bearing courses
rather than in stand-alone remedial courses for students identified using multiple commonly
accepted measures of skill level as below the skill level required for success in college level
work with supplemental support. PA 14-217, section 209(b).
192. It also provides that, not later than the start of the fall semester of 2015, public
institutions in the state shall offer such students (as identified above) one intensive semester of
remedial support that (1) is designed to provide such student with the knowledge and skills
necessary to be placed in an entry level course in a college level program, and (2) such student
may repeat subject to the public institution of higher education's course repeat policy provided
that such policy shall not prohibit a minimum of one repeat attempt. PA 14-217, section 209(c).
For those students who are identified as below a skill level required for success in an intensive
semester of remedial support, the public institution of higher education must offer the student the
opportunity to participate in a transitional college readiness program, developed by the Board of
Regents of Higher Education (BOR) in consultation with its faculty advisory committee and the
P-20 Council, before the start of the next semester, prior to receiving embedded remedial support
or intensive remedial support. PA 14-217, section 209(d).
193. The law also provides that the BOR may enter into a memorandum of
45
understanding with the CSDE for the purpose of delivering a transitional college readiness
program that will enable adults to enroll directly in a program of higher learning at an institution
of higher education upon completion of such program. PA 14-217, section 209(f).
194. The transition to community college pilot program, thus far operating in
Manchester, New Haven and Meriden, has led to a significant reduction in the number of
remedial courses needed by students entering community college. Frassinelli Testimony, 5/6/16.
195. These efforts produced an agreement on a menu of assessments to use for
placement, common cut scores, and establishing only two levels of remediation. Cohn
Testimony, 5/24/16. In terms of placement, rather than simply using a single placement test,
public institutions of higher education in the state are now using multiple measures, such as high
school GPAs and transcripts, SATs and other entrance exam scores, written essays, in addition to
standard tests like the Accuplacer. PA 12-40; Cohn Testimony, 5/24/16; Gopalakrishnan
Testimony, 5/18/16. Previously, there was an overreliance on the Accuplacer, a single test taken
only once which was not necessarily accurate and was likely sending too many students into
non-credit bearing remedial classes, including students close to the cut score who may only need
a single remedial class or minimal embedded support in a credit-bearing course. Gopalakrishnan
Testimony, 5/18/16. In fact, many more students can succeed in college-level gateway courses
than have historically been placed into them. Id.
NAEP 12th Grade
196. The National Assessment of Educational Progress (NAEP) is the largest
Nationally representative and continuing assessment of what America’s students know and can
do in various subject areas, including Reading and Math for Grades 4, 8, and 12. (Savoie
testimony 4/27/15, p. 83, PTX 528).
46
197. The results from NAEP, often called, the "The Nation's Report Card," report the
educational progress of students across the nation and allow states to compare the performance
of their students to the performance of students in other states across the country, including
subgroups and achievement differences between groups. (Savoie Testimony 4/27/16, p. 144:11-
22, DTX 5755, PTX 528).
198. NAEP does not test every student but uses a complex sampling design to select
representative samples of students for testing. Schools are selected to participate based on
factors such as size, location, or demographic data. Students are randomly selected from the
selected schools. (Savoie Testimony 4/27/16, pp. 85:11-27, 86, 87, 88:1-6, DTX 3685, DTX
6379).
199. Performance is reported in terms of average scale scores and performance level,
specifically the percentage of students at/above the three NAEP achievements level of basic,
proficient, and advanced. (Savoie Testimony 4/27/16, p. 92:14-27).
200. NAEP describes the proficiency level as "competency over challenging subject
matter." NAEP set its proficiency level before the term became pervasive in discussing student
performance because of the No Child Left Behind Act. NAEP's proficiency level was intended to
be an aspirational standard. (Savoie Testimony 4/27/16, p. 93:8-26, PTX 528).
201. Data is analyzed using widely accepted statistical standards so that NAEP does
not make statements claiming performance differences unless there is a statistically significant
difference. (Savoie Testimony 4/27/16, pp. 85:11-27, 86, 87, 88:1-6, 95:5-27, 96:1-27, 97:1-5,
DTX 3685, DTX 6379).
202. Connecticut has participated in every state level assessment of NAEP since the
very first administration in 1990. (Savoie Testimony 4/27/16, p. 97:11-26).
47
203. Schools in Connecticut are required to participate in NAEP by state law passed in
1990. (Connecticut General Statute Section 10-239i). In addition, federal law requires any
district receiving Title I funding to participate in NAEP testing. (Savoie Testimony 4/27.16, p.
88:6-27, 89:1-10).
204. State level NAEP results for Grades 4 and 8 in Reading and Mathematics are
provided every two years. State level results for Grade 12 in Reading and Math have been
provided twice in 2009 and 2013. (Savoie Testimony 4/27/16; p. 84:7-13).
205. The 2009 Grade 12 administration of NAEP was the first time that states could
elect to assess a sample of Grade 12 students large enough to yield state-level results. In 2009,
eleven states participated in the first Grade 12 state level NAEP administration. In 2013, thirteen
states participated in the second Grade 12 state level NAEP administration. Connecticut
participated in both administrations of the state level NAEP assessments for Grade 12. (Savoie
Testimony 4/27/16; p. 84:6-13, 116:7-27, DTX 3681).
206. Connecticut as well as the rest of the country often looks to compare its NAEP
performance to that of Massachusetts because of the reputation of Massachusetts' highly
regarded education system. Although Connecticut does not typically compare itself to New
Jersey, comparisons to New Jersey have been made because of adverse testimony in this case.
(Savoie Testimony 4/27/16, p. 115:6-20).
207. Connecticut outperformed all states and the nation in the Grade 12 Reading for
the NAEP 2013 administration and was only one of 2 states with a statistically significant gain in
Grade 12 Reading from its 2009 performance. (Savoie Testimony 4/27/16, p.105:18-27, 106:1-8,
118:8-27, 119:1-4, DTX 3681, DTX 6300, DTX 6301).
208. Connecticut was among the top performing states in Grade 12 Math for the NAEP
48
2013 administration, including Massachusetts and New Jersey, and was one of four states
showing gains in the Grade 12 Math compared to its 2009 performance. (Savoie Testimony
4/27/16, p.119:10-22, 120:1-11, DTX 6300, DTX 6301).
209. Massachusetts and New Jersey's performance in both Grade 12 Reading and
Mathematics remained flat between the 2009 and 2013 NAEP administrations. (Savoie
Testimony 4/27/16, p. 119:5-9, 119:23-25, 120:1-11, DTX 3681).
210. Connecticut's 2013 NAEP performance for Grade 12 Reading shows a
statistically significant narrowing of the achievement gap between black and white students from
2009 to 2013. In addition, the results show the lower performing black subgroup increasing at a
higher rate than the higher performing white subgroup. (Savoie testimony 4/27/16, p. 120:12-27,
121:1-6, DTX 3681).
211. Connecticut's achievement gaps, including the Black/White, Hispanic/White and
NSLP (National School Lunch program/economically disadvantaged)/non NSLP gaps are the
same as those of Massachusetts and New Jersey based on the NAEP Grade 12 Reading and Math
assessments for the 2013 administration with the exception of the NSLP gap for Grade 12 Math.
(Savoie testimony 4/27/16, p. DTX 6376, DTX 6356, 6357, 6355, 6359, 6360, 6358).
212. Connecticut's Black and NSLP subgroups, outperformed the nation (national
public) in the NAEP Grade 12 Reading assessment for the 2013 administration. Connecticut's
Hispanic subgroup performed no differently than the nation. (Savoie testimony 4/27/16, p.
121:18-27, 122:1-16, DTX 3681).
213. Connecticut's Black and NSLP subgroups improved their performance from 2009
49
on the NAEP Grade 12 Reading assessment for 2013. The performance of Connecticut's
Hispanic subgroup remained the same from 2009 to 2013. (Savoie testimony 4/27/16, p. 122:17-
24, DTX 3681).
214. Massachusetts and New Jersey's NSLP subgroup performance for the NAEP
Grade 12 Reading assessment for the 2013 administration is not statistically different than that of
Connecticut. (DTX 6390).
215. Connecticut's Black subgroup outperformed the nation (national public) in the
NAEP Grade 12 Math assessment for 2013. Connecticut's NSLP and Hispanic subgroups
performed no differently than the nation (national public). (Savoie testimony 4/27/16, p.122:26-
27, 123:1-8, DTX 3681).
216. The performance of the Black, NSLP, and Hispanic subgroups in Connecticut
remained the same from 2009 to 2013 for the NAEP Grade 12 Math assessment. (Savoie
testimony 4/27/16, p.123:9-14, DTX 3681).
217. NAEP reports scores at five selected percentiles to show progress being made by
lower, middle, and higher performing students. Percentile changes over time help indicate trends
in performance by lower, middle, and higher performing students. Results from the NAEP Grade
12 Reading assessments for 2013 show that low and middle performing students (10th percentile,
25th percentile, and 50th percentile) showed improvement while scores for high performing
students (75th and 90th percentiles) remained steady. This demonstrates that lower performing
students are largely responsible for the improvement in the NAEP Grade 12 Reading
results. Similar improvement is not seen in the distribution for the NAEP Grade 12 Mathematics
scores but no declines in performance occurred. (Savoie testimony 4/27/16, p.123:18-27, 124:1-
17, DTX 3681).
50
DEFENDANTS,
GEORGE JEPSEN ATTORNEY GENERAL Joseph Rubin Associate Attorney General Beth Z. Margulies Assistant Attorney General Eleanor M. Mullen Assistant Attorney General Darren P. Cunningham Assistant Attorney General John P. DiManno Assistant Attorney General
/s/ Joseph Rubin
Joseph Rubin Associate Attorney General Juris No. 085055 55 Elm Street, P.O. Box 120 Hartford, CT 06141-0120 Tel: 860-808-5318 Fax: 860-808-5347 [email protected]
51
CERTIFICATION
The foregoing Defendants' Findings of Fact per May 9, 2016 Court Order was e-mailed
this 31st day of May, 2016 to the following counsel of record:
Joseph P. Moodhe, Esq., [email protected] Helen V. Cantwell, Esq., [email protected] Megan K. Bannigan, Esq., [email protected] David B. Noland, Esq., [email protected] Dustin N. Nofziger, Esq., [email protected] Alexandra S. Thompson, Esq., [email protected] Olivia Cheng, Esq., [email protected] Emily A. Johnson, Esq., [email protected] Gregory P. Copeland, Esq., [email protected] Christel Y. Tham, Esq., [email protected] Sean Heikkila, Esq., [email protected] Lindsay C. Cornacchia, Esq., [email protected] Edward Bradley, Esq., [email protected] Cara A. Moore, Esq., [email protected] Johanna N. Skrzypczyk, Esq., [email protected] Susan R. Gittes, Esq. [email protected] Debevoise & Plimpton, LLP, 919 Third Avenue, New York, NY 10022 David N. Rosen, Esq., [email protected] David Rosen & Associates, P.C., 400 Orange Street, New Haven, CT 06511 Beth Z. Margulies, Esq., [email protected] Eleanor M. Mullen, Esq., [email protected] Darren P. Cunningham, Esq., [email protected] John P. DiManno, Esq., [email protected] Cynthia Courtney, Esq., [email protected]
/s/ Joseph Rubin Joseph Rubin Associate Attorney General
Attorney/Firm: AAG JOSEPH RUBIN (085055) E-Mail: [email protected] Logout
Hide Instructions You have successfully e-filed!Instructions: The information about the item you filed is on this confirmation page. You must print a copy of this page for your records.Choose Print This Page at the top of the page to print your copy.
Choose E-File Another Pleading/Motion/Other on this Case to go back to the Select a Motion page to choose another document nameand file another document.
Choose Return to Civil/Family Menu to go back to the menu page.
Choose Return to Case Detail to look at the documents filed in this case or to file a reclaim in this case.
Print This Page
Confirmation of E-filed Transaction (print this page for your records)Docket Number: HHD-CV-14-5037565-SCase Name: CONN COALITION JUS Et Al v. RELL, JODI, M Et AlType of Transaction: Pleading/Motion/Other documentDate Filed: Jun-1-2016Motion/Pleading by: AAG JOSEPH RUBIN (085055)Document Filed: 326.00 PROPOSED STATEMENT OF FACTS
DEF Findings of FactDate and Time of Transaction: Tuesday, May 31, 2016 5:01:30 PM
E-File Another Pleading/Motion/Other document on this Case
Return to Civil / Family Menu Return to Case Detail
Copyright © 2016, State of Connecticut Judicial Branch
Page 1 of 1You have successfully e-filed!
5/31/2016https://efile.eservices.jud.ct.gov/motion/EFileConfirmation.aspx?crn=3499385&UnID=16...
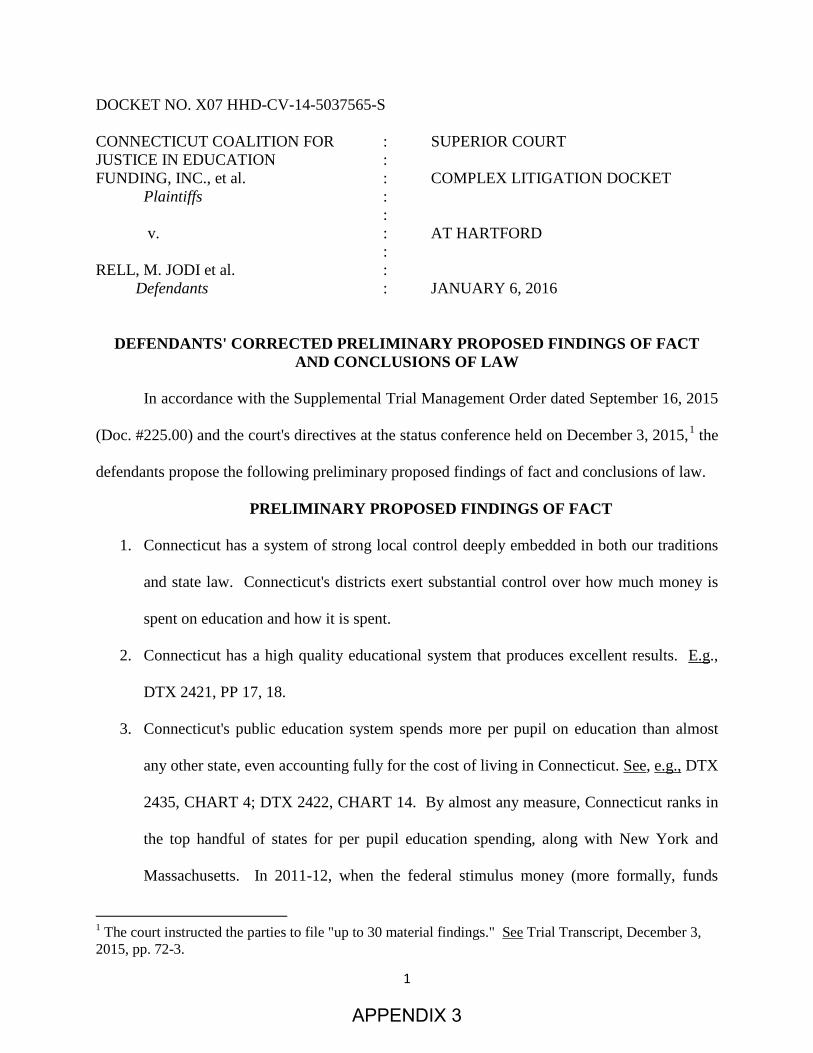
1
DOCKET NO. X07 HHD-CV-14-5037565-S CONNECTICUT COALITION FOR : SUPERIOR COURT JUSTICE IN EDUCATION : FUNDING, INC., et al. : COMPLEX LITIGATION DOCKET Plaintiffs : : v. : AT HARTFORD : RELL, M. JODI et al. : Defendants : JANUARY 6, 2016
DEFENDANTS' CORRECTED PRELIMINARY PROPOSED FINDINGS OF FACT
AND CONCLUSIONS OF LAW
In accordance with the Supplemental Trial Management Order dated September 16, 2015
(Doc. #225.00) and the court's directives at the status conference held on December 3, 2015,1 the
defendants propose the following preliminary proposed findings of fact and conclusions of law.
PRELIMINARY PROPOSED FINDINGS OF FACT
1. Connecticut has a system of strong local control deeply embedded in both our traditions
and state law. Connecticut's districts exert substantial control over how much money is
spent on education and how it is spent.
2. Connecticut has a high quality educational system that produces excellent results. E.g.,
DTX 2421, PP 17, 18.
3. Connecticut's public education system spends more per pupil on education than almost
any other state, even accounting fully for the cost of living in Connecticut. See, e.g., DTX
2435, CHART 4; DTX 2422, CHART 14. By almost any measure, Connecticut ranks in
the top handful of states for per pupil education spending, along with New York and
Massachusetts. In 2011-12, when the federal stimulus money (more formally, funds
1 The court instructed the parties to file "up to 30 material findings." See Trial Transcript, December 3, 2015, pp. 72-3.
APPENDIX 3
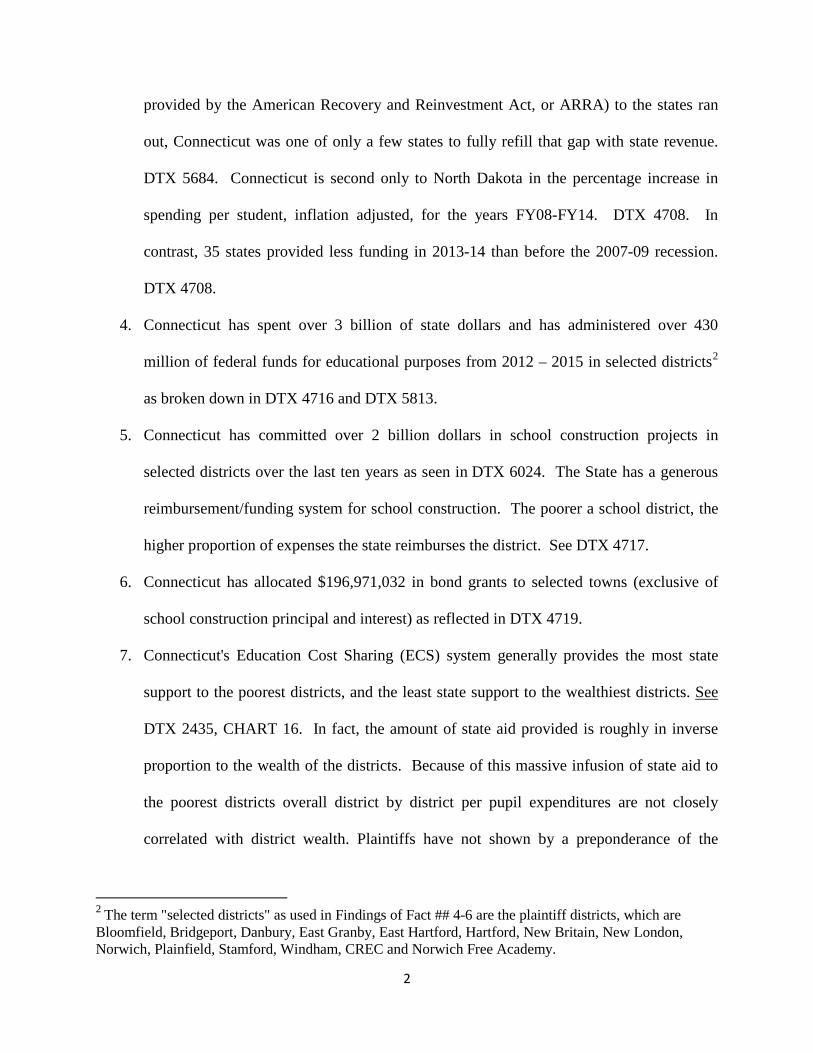
2
provided by the American Recovery and Reinvestment Act, or ARRA) to the states ran
out, Connecticut was one of only a few states to fully refill that gap with state revenue.
DTX 5684. Connecticut is second only to North Dakota in the percentage increase in
spending per student, inflation adjusted, for the years FY08-FY14. DTX 4708. In
contrast, 35 states provided less funding in 2013-14 than before the 2007-09 recession.
DTX 4708.
4. Connecticut has spent over 3 billion of state dollars and has administered over 430
million of federal funds for educational purposes from 2012 – 2015 in selected districts2
as broken down in DTX 4716 and DTX 5813.
5. Connecticut has committed over 2 billion dollars in school construction projects in
selected districts over the last ten years as seen in DTX 6024. The State has a generous
reimbursement/funding system for school construction. The poorer a school district, the
higher proportion of expenses the state reimburses the district. See DTX 4717.
6. Connecticut has allocated $196,971,032 in bond grants to selected towns (exclusive of
school construction principal and interest) as reflected in DTX 4719.
7. Connecticut's Education Cost Sharing (ECS) system generally provides the most state
support to the poorest districts, and the least state support to the wealthiest districts. See
DTX 2435, CHART 16. In fact, the amount of state aid provided is roughly in inverse
proportion to the wealth of the districts. Because of this massive infusion of state aid to
the poorest districts overall district by district per pupil expenditures are not closely
correlated with district wealth. Plaintiffs have not shown by a preponderance of the
2 The term "selected districts" as used in Findings of Fact ## 4-6 are the plaintiff districts, which are Bloomfield, Bridgeport, Danbury, East Granby, East Hartford, Hartford, New Britain, New London, Norwich, Plainfield, Stamford, Windham, CREC and Norwich Free Academy.
3
evidence that any district has inadequate resources to provide adequate educational
opportunities.
8. Connecticut's teachers' average salaries rank at the very top in the nation, see DTX 2427,
Figure 3. Connecticut's average teachers' salaries have risen steadily over the past twelve
years, from $54,607 in 2002-03 to $69,958 in 2013-14. See DTX 3813.
9. In 2013-14, the vast majority of Connecticut's rated teachers were rated as "proficient" or
"exemplary." DTX 3699 and DTX 3701.
10. In implementing the reforms, the executive and legislative branches of government have
acted aggressively and appropriately to provide professional support, professional
resources, financial resources and strong accountability to help improve those districts
most in need through programs including the Alliance Districts and Commissioner's
Network. Testimony of Wentzell, Pryor, Barth, Adamowski and Villanova. P.A. 12-116.
11. In addition to additional management and administrative support, the Alliance District
program poured well over an additional $400 million into the 30 lowest performing
districts alone in the last 3 fiscal years, an unprecedented increase in resources in such a
short period of time for those districts. DTX 5682 (TOP LINE).
12. While these reform programs have not been in effect long enough to produce definitive
results, they are aggressive well thought out best practices appropriately aimed at
bringing major improvement to the targeted districts. In addition, this massive infusion of
new funds has remained relatively untouched as many other areas of the state budget
have been significantly reduced. At its most recent special session the General Assembly
reduced the current State budget by over $300 million, leaving ECS funding, including
the Alliance Districts, substantially untouched.
4
13. As Connecticut's public school population has declined, state funding for education has
increased. DTX 5353 and DTX 5682. There is virtually no relationship in Connecticut
between per pupil spending and either student achievement or growth in student
achievement. See, e.g., DTX 2426, p. 1, "Knowing how much a district spends per
student tell us virtually nothing about the level or growth of achievement of a student . . .
"; pp. 16 Figure 10, p. 16. (virtually no relationship between per pupil expenditure and
achievement or growth in achievement) See also Horne v. Flores, 557 U.S. 433, 464-5,
467 (2009) (recognizing the "growing consensus in education research that increased
funding alone does not improve student achievement" and that "education literature
overwhelmingly supports reliance on accountability-based reforms as opposed to pure
increases in spending," citing, among others, defendants' expert Eric Hanushek).
14. Similarly, there is no relationship between the nature or size of the achievement gap and
per pupil expenditures in CT. Testimony of Podgursky. Educational improvement
comes primarily from improved leadership, administration, accountability measures, and
strong support for stronger teaching, and not from adding money to an already well-
financed system. Testimony of Wentzell, Pryor, Adamowski, Villanova, Leone.
15. The achievement gap is a complex problem not easily remedied by courts or the
government. Our own state Achievement Gap Task Force has acknowledged that
threshold issues affecting the achievement gap are poverty, hunger and inadequate
housing. DTX3364 at 9 – 14. Attempting to remediate those problems is admirable and
desirable. But, our Supreme Court has held that adequate income, adequate housing and
adequate food are not constitutional rights under our state constitution. Our schools and
educational system cannot eliminate poverty or poor housing. Our schools and
5
educational system are effectively working to level the playing field, but they cannot be
held accountable for eliminating ALL of the effects of poverty and other factors beyond
their control. Nevertheless, Connecticut is making important progress. For
example: plaintiffs admit in response to Defendants' RFA # 520, "CT's results show a
statistically significant narrowing of the achievement gap between Grade 12 black and
white students in reading from 2009 to 2013"; plaintiffs admit in response to RFA#760
that "over the last 4 years, graduation rates increased by nearly 10 points for black
students, by 10 points for Hispanic students, and 13.2 points for all low-income students."
16. Connecticut's Office of Early Childhood ("OEC") is one of only four cabinet-level state
agencies in the country, including Massachusetts, Washington, and Georgia, which focus
exclusively on early childhood education. PTX 512.
17. Despite its relatively small population, CT ranks third in the country in the number of
pre-K programs accredited by the National Association for the Education of Young
Children (NAEYC), a widely respected preschool credentialing organization after only
the much more populous states of, Massachusetts and California. DTX 4545, 4579,
OEC_Adams0028284-0030410, https://www.naeyc.org/academy/accreditation/search,
http://eclkc.ohs.acf.hhs.gov/hslc/HeadStartOffices?language=0&searchBy=state&findTy
pe=All&findAddress=&findCity=&findState=CT&findZip=&findRadius=5&submitSear
ch=Search#entryTotal.
18. Connecticut ranks third in the country in state per pupil spending for pre-K. DTX 4548
p. 17.
19. As part of its efforts to narrow the achievement gap, Connecticut supports LEAD CT, a
collaboration of several Connecticut and national organizations, focused on recruiting,
6
selecting, preparing developing, and retaining school and district leaders to strengthen
student learning across all Connecticut districts and classrooms, with a priority focus on
the schools and districts in most need of improvement in student performance, the
Alliance Districts. DTX 5746, Testimony of Villanova, Barzee.
20. As of the academic school year 2014 - 2015, Connecticut had 34,833 English Learners
(ELs) in 173 public Local Education Agencies. They constituted 6.6% of all public
school students in kindergarten through twelfth grade. ELs receive English language
services from Teachers of English to Speakers of Other Languages (TESOL), bilingual
certified teachers, or other personnel who have received training in English language
acquisition. SDE August 2015 Data Bulletin.
http://www.sde.ct.gov/sde/lib/sde/pdf/evalresearch/el_databulletin_aug2015.pdf.
21. Federal Title III and state Bilingual grants, totaling approximately $7 million in 2014-15
and 2015-16 are available for districts to use in support of EL students, although not all
districts apply for them. http://www.sde.ct.gov/sde/cwp/view.asp?a=2683&Q=320346.
SDE August 2015 Data Bulletin,
http://www.sde.ct.gov/sde/lib/sde/pdf/evalresearch/el_databulletin_aug2015.pdf; Salazar-
Glowski Depo testimony 8-24-15, p. 34:4-7; p. 84:17-86:13. Proposed testimony of
Alubicki Flick.
22. SDE provides technical assistance and professional development training regarding
teaching EL students to the districts and regional education services centers throughout
the State and has developed a three tier monitoring cycle for Title III federal funds
intended to benefit EL students. Salazar-Glowski Depo Transcript 8-24-15, pp. 35:12-
41:3; pp. 98-100. Proposed testimony of Alubicki Flick.
7
23. CSBE and CSDE provide guidelines and assistance regarding the different
responsibilities of the state, districts, schools, and educators related to the support of
English Learners. CSBE’s 2010 Position Statement on the Education of Students Who
Are English Language Learners - Components of High Quality English as a Second
Language (ESL) and Bilingual Education Programs, Guidelines for Policymakers,
http://www.sde.ct.gov/sde/LIB/sde/pdf/board/esl.pdf; English Learner Programs and
Services in Connecticut Public Schools: A Resource Handbook for Administrators (2nd
edition),
http://www.sde.ct.gov/sde/lib/sde/pdf/curriculum/bilingual/el_admin_resource_handbook
.pdf; Scientific Research-Based Interventions for English Language Learners: A
Handbook to Accompany Connecticut’s Framework for RTI as guidelines.
http://www.sde.ct.gov/sde/lib/sde/pdf/curriculum/bilingual/SRBI_ELL.pdf.
24. CSDE developed new standards for proficiency in English, with Correspondences to K–
12 English Language Arts (ELA), Mathematics, Connecticut C3 Social Studies, and
Science Connecticut Core Practices, K–12 English Language Arts Connecticut Core
Standards (CCS), and 6-12 Connecticut Core Standards for Literacy in the Content Areas,
known as the Connecticut English Language Proficiency Standards (CELP) and, on
October 7, 2015, these standards were adopted by the
CSBE. http://www.sde.ct.gov/sde/lib/sde/pdf/curriculum/bilingual/celp_standards.pdf.
Proposed Testimony of Ellen Cohn. Connecticut is the only state in the nation to provide
English Language Proficiency standards in the Social Studies area. Proposed Testimony
of Megan Alubicki Flick.
8
25. The State of Connecticut and the school districts in Connecticut properly implement the
federal Individuals with Disabilities Education Act (IDEA) and the parallel Connecticut
special education statutes and state rules. Reschly Report, Exhibit 2428, pp. 4,
19. Districts with past compliance problems receive additional monitoring and assistance
from the state. Id., p. 19. The current resources for IDEA implementation are adequate
to meet the statutory requirements of the state and federal legislation. Id., p. 4. Further,
Connecticut has a more favorable record in implementing the IDEA than nearly all other
states in the northeast region. Id., pp. 14-16.
26. Connecticut Education Reform legislation enacted in 2012, P.A. 12-116, §§ 7, 19, 89-91,
is intended to improve school achievement through implementation of scientific research-
based instruction, particularly in reading, matched to student needs. Reschly Report,
Exhibit 2428, pp. 49-51. The provisions of this law, once fully implemented, have
significant potential to improve teacher preparation and achievement in general and
special education in particular. Id.
27. Connecticut high school graduation rates are continuing to improve.
a. In 2014, the statewide graduation rate increased 1.5 points to 87.0 percent, up a total
of 5.2 points since 2010. In 2014, black, Hispanic, and free-or-reduced-price-lunch-
eligible (an indicator of poverty) students continued to outpace the statewide average
yearly increase in graduation rates at 2.9 points, 3.8 points, and 3.8 points,
respectively. Over the last four years, graduation rates increased by nearly 10 points
for black students, by 10 points for Hispanic students, and by 13.2 points for low-
income students. Def's RFA's ## 759(b), 760.
9
b. The Educational Reform Districts, a subset of the Alliance Districts constituting the
10 lowest performing districts in the state, showed a 2.5-point gain in graduation rates
in 2014 as compared with 2013. New Haven Public Schools, an educational reform
district, have increased their graduation rate by 13 points since 2010, to a 75.5 percent
graduation rate in 2014. Def's RFA # 761.
c. By 2014, the graduation rate gap between black students and white students
decreased to a 13.6-point gap, down from 20 points in 2010. Overall, the gap has
decreased 6.4 points since 2010, representing a gap closure of 31.8 percent. The
graduation rate gap between Hispanic students and white students decreased to an
18.3-point gap-down from 24.7 points in 2010. Overall, the gap decreased 6.4 points
since 2010, representing a gap closure of 26.1 percent. Def's RFA ## 762-763.
d. Using free and reduced-priced meal eligibility as an indicator of family wealth, the
graduation rate gap between low-income students and their more affluent peers
decreased by 2014 to a 17.9-point gap, down from 25.7 points in 2010. Overall, the
gap decreased by 7.8 points since 2010, representing a gap closure of 30.2 percent.
Def's RFA # 764.
28. CSDE provides materials, resources and support to Districts to assist them in developing
curricula that align with the Common Core State Standards (CCSS) and State
assessments in the various instructional subject matter areas.
http://www.sde.ct.gov/sde/cwp/view.asp?a=2618&Q=320954 ;
Testimony of Cohn and Wentzell.
29. For school years 2013-14, 2014-15 and 2015-16, the State made funding available to
Districts through technology grants to assist Districts with various technological aspects
10
of implementing the CCSS and the related Smarter Balanced Assessments. (Testimony
of Ellen Cohn; Defs. Ex. #4146; 2013-14 CSDE Request for Proposals, Technology
Investments to Implement Common Core State Standards and Administer Common Core
aligned Assessments, Specifically Smarter Balanced Assessments 2013-14 (2013-14
RFP), available at:
http://www.sde.ct.gov/sde/lib/sde/pdf/rfp/rfp801_ccss_technology_2013.pdf; 2014-15
Request for Proposals, District Technology Upgrades to Support Transition to the New
Standards, available at:
http://www.sde.ct.gov/sde/lib/sde/pdf/rfp/rfp813_district_technology_support_transition_
new_standards.pdf ; 2015-16 Request for Proposals, District Technology Upgrades to
Support Transition to the New Standards, available at:
http://www.sde.ct.gov/sde/lib/sde/pdf/rfp/rfp813_technology_grant_15-16.pdf.
30. All plaintiffs have failed to prove a deprivation of their constitutional rights.
PRELIMINARY PROPOSED MATERIAL CONCLUSIONS OF LAW
1. The opinion of Justice Palmer constitutes the applicable legal standard.
When this case was remanded by our supreme court for trial, there was no majority opinion
of the court. Connecticut Coalition for Justice in Education Funding v. Rell, 295 Conn. 240
(2010)(hereafter "CCJEF v. Rell"). Although four justices voted to reverse the granting of
defendants' motion to strike and remand the case for trial, those four justices did not agree on the
legal standard to be applied at trial. Justice Palmer, who provided the deciding fourth vote to
reverse and remand for trial, explicitly rejected the scope of the right articulated by the plurality
and instead articulated a more narrow and specific standard. CCJEF v. Rell, 295 Conn. at 321
(Palmer, J., concurring)("I am unable to join the plurality opinion, however, primarily because I
11
take a different view from the plurality with respect to the scope of the right .... in my view,
[CCJEF] will not be able to prevail on their claims unless they are able to establish that what the
state has done to discharge its obligations ... is so lacking as to be unreasonable by any fair or
objective standard."); see also id. at 342 (Palmer, J., concurring) (setting forth specific essential
requirements for a minimally adequate education).
Justice Palmer's definition of a "minimally adequate education" in his concurring opinion
and his view of the deference owed to the political branches of government constitute the ruling
of the Supreme Court as to the scope of the constitutional right guaranteed by article eighth, § 1.
CCJEF v. Rell, 295 Conn. at 320-47 (Palmer, J., concurring). Justice Palmer's concurring
opinion constitutes "the holding of the Court," as it was based on the "narrowest grounds [upon
which a majority of the court agreed]." State v. Ross, 272 Conn. 577, 604 n.13 (2005), quoting
Marks v.United States, 430 U.S. 188, 193 (1977). Accordingly, plaintiffs' claims must be
evaluated using Justice Palmer's standard, which affords considerable deference to the political
branches. See Docket No. HHD-CV05-4050526-S, #144.00 at 3-6 (summarizing Justice
Palmer's opinion); CCJEF, 295 Conn. at 343-44 (Palmer, J., concurring)("…the deference owed
to the political branches in matters of education policy dictates that, unless the plaintiffs can
demonstrate that the actions that the state has taken to satisfy the particular requirement in
dispute cannot reasonably be defended as minimally adequate, the court must defer to the
judgment of the political branches in the matter…. the plaintiffs must establish that the action
that the legislature has taken to comply with article eighth, § 1, reasonably cannot be considered
sufficient by any fair measure. Put differently, the plaintiffs are not entitled to relief unless they
can demonstrate that the legislature's formulation of the scope of the right to a minimally
adequate public education and its efforts in implementing that formulation are unreasonably
12
insufficient. Any less demanding standard would give insufficient voice to the reasoned
judgment of the legislature."); at 317 (plurality)("So long as those authorities prescribe and
implement a program of instruction rationally calculated to enforce the constitutional right to a
minimally adequate education as set forth herein, then the judiciary should stay its hand.") Thus,
this court must decide this case by determining whether the state offers a "minimally adequate
education," as defined by Justice Palmer, giving deference to the determinations of the political
branches of government.
Based upon this legal standard, the plaintiffs have failed to prove by a preponderance of
the evidence that Connecticut does not offer a minimally adequate educational opportunity to its
students.
2. Plaintiffs have failed to demonstrate that no set of circumstances exist under which the public educational system in Connecticut is constitutional. Therefore they fail in their facial challenge.
Plaintiffs initially pleaded this case as a class action. See Docket No. HHD-CV05-
4050526-S, First Amended Complaint dated January 20, 2006 at 16-17 ¶¶ 39-44 (class
allegations). Despite removing the class allegations, plaintiffs continue to request that this court
"declare that the existing school funding system [in Connecticut] is unconstitutional, void and
without effect" and "enjoin defendants from operating the current public education system,
except as necessary to provide an expedient and efficient transition to a constitutional public
education system….." Docket No. HHD-CV05-4050526-S, Doc. #163 at 46. Because these
prayers for relief seek to invalidate entire portions of state law affecting all students, they must
be treated as a facial challenge. See State v. Long, 301 Conn. 216, 244 (2011). "A facial
challenge to the constitutionality of a statute or regulation, as distinguished from an as-applied
challenge, seeks to invalidate a statute or regulation itself." 16 C.J.S. Constitutional Law § 243;
Citizens United v. Federal Election Com'n, 558 U.S. 310 (2010) ("The distinction [between
13
facial constitutional challenges and as-applied constitutional challenges] is both instructive and
necessary, for it goes to the breadth of the remedy employed by the Court, not what must be
pleaded in a complaint").
A facial challenge essentially is “a claim that the law is invalid in toto—and therefore
incapable of any valid application.” (Internal quotation marks omitted.) State v. Long, 268 Conn.
508, 522 n.21 (2004). "The proper framework to apply in a facial challenge is not to require the
challenger to disprove every possible hypothetical situation in which the restriction might be
validly applied but rather to apply the appropriate constitutional test to determine whether the
challenged restriction is invalid on its face and thus incapable of any valid application." 16
C.J.S. Constitutional Law § 243; see also State v. Ross, 230 Conn. 183, 236 (1994)("The burden
of proving unconstitutionality is especially heavy when, as at this juncture, a statute is challenged
as being unconstitutional on its face." (citation omitted)) “In order to challenge successfully the
facial validity of a statute, a party is required to demonstrate as a threshold matter that the statute
may not be applied constitutionally to the facts of [the] case.” (Internal quotation marks omitted.)
State v. Bloom, 86 Conn.App. 463, 468 (2004),
Here, plaintiffs' own complaint concedes that some Connecticut students are receiving a
constitutionally adequate education. Plaintiffs' complaint refers to various Connecticut students
as "non-plaintiff students" and repeatedly compares them to the named student-plaintiffs. Such
comparisons are set out by referencing different schools and school districts. See, e.g,, Docket
No. HHD-CV05-4050526-S, Doc. #163.00 at 26- 38, ¶¶ 87, 90, 93, 102, 109, 118, 123, 135; see
also at 38, ¶ 135 ("the municipalities in which the plaintiffs reside"). Also, plaintiffs' complaint
does not even allege that all student-plaintiffs suffer equally. See, e.g., id. at 26-36, ¶¶ 86, 102,
103-07, 111, 112, 119, 120, 124. Plaintiffs have therefore failed to demonstrate or even allege
14
that the "existing school funding system" is incapable of any valid application. By plaintiffs'
own complaint, many Connecticut students are receiving a constitutionally adequate education
under the "existing school funding system" enacted by the legislative branches.
Additionally, the court must consider the nature of the constitutional right at issue in this
case in light of plaintiffs' broad prayer for relief. Connecticut's affirmative constitutional duty to
provide free elementary and secondary schools is owed to all Connecticut students. Horton v.
Meskill, 187 Conn. 187, 195-96 (1982). The overwhelming majority of Connecticut's public
school students are not parties to this case and plaintiffs' counsel do not represent them. By
seeking to upend the entire Connecticut education system, plaintiffs are no doubt taking positions
contrary to the interests of Connecticut students who have not chosen to challenge the
constitutionality of their public education. Yet plaintiffs' requested relief to, inter alia, "declare
that the existing school funding system [in Connecticut] is unconstitutional, void and without
effect" and "enjoin defendants from operating the current public education system, except as
necessary to provide an expedient and efficient transition to a constitutional public education
system….." would necessarily deprive these students of their due process rights to the public
education system enacted by the elected branches of state government. See State v. Long, 301
Conn. 216, 244 (2011)(finding that "the United States Supreme Court has recently explained that
when a party's claim and the relief that would follow . . . reach beyond the particular
circumstances of that party, the party must satisfy the standards for a facial challenge to the
extent of that reach" (footnote and citations omitted)). Connecticut's students who are not parties
to this case may not be stripped of their affirmative rights to the public education system
established by their elected branches of government without due process or a successful facial
15
challenge. See Conn. Const. art. VIII, § 1 ("The general assembly shall implement this principle
by appropriate legislation.")
3. Plaintiffs have failed as a matter of law in their burden to establish each of their claims. Plaintiffs have failed in their burden to establish an "as applied" challenge.
Even if plaintiff CCJEF has standing, see infra, this case is not a class action. Compare
Docket No. HHD-CV05-4050526-S, First Amended Complaint dated January 20, 2006 at 16-17
¶¶ 39-44 (class allegations) with Second Amended Complaint dated November 18, 2010 (Doc.
#135.00)(class allegations removed) and Corrected Third Amended Complaint, Doc. #163.00(no
class allegations). Therefore, each plaintiff must prove, inter alia, the current and ongoing
irreparable deprivation of his or her constitutional right to a public education and show how he or
she lacks an adequate remedy at law.
A party mounting a constitutional challenge to the validity of a statute must provide an adequate factual record in order to meet its burden of demonstrating the statute's adverse impact on some protected interest of its own, in its own particular case, and not merely under some hypothetical set of facts as yet unproven. Whether a case comes to us by way of reservation or after a final judgment, the rule is the same. We do not give advisory opinions, nor do we sit as roving commissions assigned to pass judgment on the validity of legislative enactments….
Motor Vehicle Manufacturers Assn. of the United States, Inc. v. O'Neill, 203 Conn. 63, 75
(1987); see also Lehrer v. Davis, 214 Conn. 232, 234–35 (1990); State v. Zach, 198 Conn. 168,
176–78 (1985).
Plaintiffs' burden is extremely high. State statutes enjoy "a presumption in favor of …
constitutionality." State v. Joyner, 225 Conn. 450, 460 (1993) “The party attacking a validly
enacted statute ... bears the heavy burden of proving its unconstitutionality beyond a reasonable
doubt and we indulge in every presumption in favor of the statute's constitutionality.... In
choosing between two constructions of a statute, one valid and one constitutionally precarious,
we will search for an effective and constitutional construction that reasonably accords with the
16
legislature's underlying intent....” State v. Breton, 212 Conn. 258, 269 (1989)(citations omitted).
Our supreme court has long instructed that "before an act of the legislature ought to be declared
unconstitutional, its repugnance to the provisions or necessary implications of the constitution
should be manifest and free from all reasonable doubt. If its character in this regard be
questionable, then comity, and a proper respect for a co-ordinate branch of the government,
should determine the matter in favor of the action of the latter.’” State ex rel. Andrew v. Lewis,
51 Conn. 113, 127–28 (1883), quoting Hartford Bridge Co. v. Union Ferry Co., 29 Conn. 210,
227 (1860).
Plaintiffs have failed to meet their burden of proof even by a preponderance of evidence
under this standard.
4. Plaintiffs have failed as a matter of law in their burden to establish their equity claims.
Regarding plaintiffs' equity claims, our supreme court has explained that with respect to
public education in Connecticut "absolute equality or precisely equal advantages are not required
and cannot be attained in the most relative sense." Horton v. Meskill, 172 Conn. 615, 652
(1977). A "substantial degree of equality of educational opportunity" fulfills the state's
constitutional requirement. Id. at 651. Additionally, our supreme court has also made clear that
"the property tax is still a viable means of producing income for education." Id.
Based upon these legal standards, Plaintiffs have failed to meet their burden of proof
even by a preponderance of the evidence.
5. Local boards of education carry out the state's constitutional responsibility to provide free public schools
"The state's responsibility for education is distributed through the ... statutory framework.
The state board [of education] is charged with the broad and general power to supervise and
control the educational interests of the state.” (Internal quotation marks omitted.) New Haven v.
17
State Board of Education, 228 Conn. 699, 703 (1994); see also Conn. Gen. Stat. § 10-4(a).
Connecticut General Statutes § 10–220 “delegates the duty to provide and administer public
education to local and regional boards of education.” New Haven, 228 Conn. at 703–704; see
also W. Hartford Education Assn., Inc. v. DeCourcy, 162 Conn. 566, 573, 295 A.2d 526 (1972)
(“The chief function of local boards of education is to serve as policy maker on behalf of the
state and for the local community on educational matters. The state has had a vital interest in the
public schools from the earliest colonial times.... Article VIII, § 1, of the Connecticut
constitution provides that ‘[t]here shall always be free public elementary and secondary schools
in the state. The [G]eneral [A]ssembly shall implement this principle by appropriate legislation.’
Obviously, the furnishing of education for the general public is a state function and duty.... By
statutory enactment the legislature has delegated this responsibility to the local boards who serve
as agents of the state in their communities.... Our statutes have conferred on the local board
broad power and discretion over educational policy.” [Citations omitted; emphasis added.] ).
Local boards of education must “fulfill the educational interests of the state by meeting
certain mandates.... Public education mandates include the following: adequate and reasonable
pupil transportation for those students who need transportation ... special education services
sufficient to meet the individualized needs of certain children in the locality ... and the [minimum
expenditure requirement]. If the local board of education fails or is unable to implement the
educational interests of the state by carrying out these mandates, the state board may conduct an
investigation, hold an administrative hearing pursuant to the Uniform Administrative Procedure
Act [General Statutes § 4–166 et seq.], order appropriate remedial steps, and, if necessary,
enforce its order in the Superior Court.” (Citations omitted.) New Haven, 228 Conn. at 704–705.
18
The "general rule" is that "local educational matters are managed by local boards of
education comprised of locally elected members. Even local boards of education overseeing low
achieving schools and districts do not lose their local autonomy entirely simply because they are
subject to additional supervision and direction by the state board pursuant to [Conn. Gen. Stat.] §
10–223e(c)." Pereira v. State Bd. of Educ., 304 Conn. 1, 33-35 (2012).
Additionally, although the right to a public education is fundamental, not all allegations
regarding school policy made by the districts fall within the scope of article eighth, § 1. See
Campbell v. Bd. of Ed, 193 Conn. 93, 104-5 (1984)(school board's policy of imposing uniform
school-wide academic sanctions for nonattendance "does not jeopardize any fundamental rights
under our state constitution") Such district policies are reviewed "under the rational basis test"
because of "the substantive due process requirement that all government acts be minimally
rational rather than by any requirement stemming from the education guarantee." Benjamin v.
Bailey, 234 Conn. 455, 464 (1995) citing Campbell, 193 Conn. at 105-06.
6. Whether the state has met its constitutional obligations must be judged by the educational opportunities provided to the plaintiffs, rather than by the plaintiffs' educational outcomes.
Plaintiffs' claims must fail unless they can demonstrate that the state is failing to provide
plaintiffs with minimally adequate and equitable educational opportunities. CCJEF v. Rell, 295
at 320-21 (Palmer, J., concurring). Just as the Declaration of Independence guaranteed the
pursuit of happiness and not happiness itself, the Connecticut Constitution guarantees each
public school student a constitutional educational opportunity and not a particular outcome of
education, such as a guaranteed test score or college admission. CCJEF v. Rell, 295 at 320-21
(Palmer, J., concurring).
19
A majority of our supreme court made clear that the education clause "is not a panacea
for all of the social ills that contribute to many of the achievement deficiencies identified by the
plaintiffs in their complaint." CCJEF v. Rell, 295 Conn. at 318-19 (plurality); 295 Conn. at 344-
45 (Palmer, J., concurring)("It reasonably cannot be disputed, however, that, even though
'schools are important socializing institutions in our democratic society, they cannot be
constitutionally required to overcome every serious social and personal disadvantage that
students bring with them to school, and that seriously hinder[s] the academic achievement of
those students.' Sheff v. O'Neill, supra, 238 Conn. at 144, 678 A.2d 1267 (Borden, J.,
dissenting); see also part III of the plurality opinion ('[T]he failure of students to achieve the
goals of a constitutionally mandated education may be ... caused by factors not attributable to, or
capable of remediation by, state action.... [W]e [therefore] recognize that [article eighth, § 1] is
not a panacea for all of the social ills that contribute to many of the achievement deficiencies
identified by the plaintiffs in their complaint....' [Citations omitted.] ").
7. PreSchool Services are not required by the Connecticut Constitution
Preschool services are not part of the state constitutional right at issue in this case for all
of the reasons articulated in defendants' previous motion and accompanying briefs. See Doc.
##228.00(defendants' motion), 244.00 (reply), 228.86 (court reserved decision). As our supreme
court has explained, "We are especially hesitant to read into the constitution unenumerated
affirmative governmental obligations. In general, the declaration of rights in our state
constitution was implemented not to impose affirmative obligations on the government, but
rather to secure individual liberties against direct infringement through state action." Moore v.
Ganim, 233 Conn. 557, 595 (1995).
20
8. Plaintiff CCJEF Lacks Standing.
Plaintiff CCJEF lacks associational standing for all of the reasons articulated in
defendants' previous motion and accompanying briefs. See Docket No. HHD-CV05-4050526-S,
Doc. ##103.00, 103.1, 106.00, 164.00 (motion to dismiss), 165.00 (memorandum in support of
motion to dismiss), 180.00 (reply) denied in part #206.00. Under CCJEF's Articles of
Incorporation and by-laws, the only "members" of CCJEF with standing on their own (parents
and students) lack voting rights in CCJEF. See Docket No. HHD-CV05-4050526-S, Doc.
#180.00 at 22. Because these members lack the ability to influence CCJEF and direct the
litigation on that group's behalf, they are not actually "members" in any legally cognizable sense.
Further, even if CCJEF's parent and child members were "real" members of that
organization, the organization alone would not have standing to make the claims it seeks to make
in this case. This is because CCJEF cannot satisfy the third prong of the Hunt/Worrell test so that
the participation of the individual members is not required. Connecticut Ass'n of Health Care
Facilities, Inc. v. Worrell, 199 Conn. 609, 617 (1986).
Subsequent to the trial court's decision with respect to CCJEF's associational standing in
this case (Docket No. HHD-CV05-4050526-S, Doc. #206.00), another trial court has issued a
decision directly and accurately analyzing whether the individual participation of association
members in a constitutional challenge of a similar nature is required under the thee part
Hunt/Worrell test for associational standing. See Disabled Americans for Firearm Rights, LLC
v. Malloy, No. CV136016992, 2014 WL 1012285 at *5 (February 6, 2014)(explaining that the
association's challenge to state law based on the state constitutional right to bear arms "would
clearly require the participation of individual members of [the association]. In their complaint,
the plaintiffs allege that disabled persons, including members of [the association], require certain
21
features [of firearms] prohibited by Public Act 13–3 in order to exercise their rights. A
determination of this allegation would require evidence of the specific physical disabilities of
each individual.") (hereafter "DAFR"). DAFR, like this case, involved an association seeking to
challenge state law on the basis of the Connecticut Constitution. And, as in DAFR, CCJEF as an
organization cannot establish associational standing because the individual participation of those
CCJEF members who would have standing is required. As was the case in DAFR, this court
cannot determine whether the pertinent members of CCJEF have been denied their constitutional
right to a public education without considering evidence as to those individuals. Accordingly,
CCJEF fails to meet the third prong of the Hunt/Worrell test.
While CCJEF's actual voting membership includes local boards of education and
municipalities, it is beyond dispute that those entities do not have standing to sue the defendants
in this case. See Docket No. HHD-CV05-4050526-S, Doc. #163.00 at 15-16, ¶ 47. The local
board of education, in providing educational services, is actually an arm of the state – the
defendants in this case. See Pereria v. State Bd. of Educ., 304 Conn. 1, 33, 44-45; R.A. Civitello
Co. v. New Haven, 6 Conn. App. 212, 218 (1986); Derfall v. W. Hartford, 25 Conn. Supp. 302,
304-05 (1964) ("In this state, local boards of education are not agents of the towns but are
creatures of the state."); see also Docket No. HHD-CV05-4050526-S, Plaintiffs' Corrected Third
Amended Complaint, Doc. #163.00 at 37 ¶ 128 ("Public schools in Connecticut are agencies of
the State."). With respect to municipalities, the Connecticut Supreme Court has long held that
"[t]owns ... are creatures of the state, and though they may question the interpretation, they
cannot challenge the legality of legislation enacted by their creator." Conn. Ass'n of Bds. of
Educ. v. Shedd, 197 Conn. 554, 558-59 (1985); Berlin v. Santaguida, 181 Conn. 421, 424
(1980); Windsor v. Windsor Police Dep't Employees Ass'n., Inc, 154 Conn. 530 (1967);
22
Waterford v. Conn. State Bd. of Educ., 148 Conn. 238, 245 (1961). And, of course,
municipalities and boards of education enjoy no constitutional rights under Article Eighth, § 1.
Horton v. Meskill, 187 Conn. 187, 195-96 (1982).
As the trial court correctly held in ruling on a precursor to this litigation, in Johnson v.
Rowland, X03 CV 98 0492103S, Memorandum of Decision on Motion to Dismiss dated May
18, 1999 “[t]he plaintiff municipalities not only have no authority to allege violations of
constitutional rights that do not belong to them, but also have no authority to challenge the
constitutionality of laws enacted by their creators, the State of Connecticut.” Id. at 2-3. The
various dues paying and voting members of CCJEF – including Connecticut municipalities –
who otherwise lack the ability to “allege violations of constitutional rights that do not belong to
them” cannot achieve standing by adding so-called "members" who lack the essential indicia of
that status.
9. Plaintiff Richard Molinaro lacks standing.
Plaintiffs' operative complaint provides: "The plaintiff, Richard Molinaro, a resident of
Danbury, brings this action on his own behalf and as next friend of his minor granddaughter,
Jada Mourning." Docket No. HHD-CV05-4050526-S, Doc. #163.00 at 5 ¶ 8. Plaintiffs'
complaint further states that Jada Mourning "resides with her mother." Id. at 5 ¶ 9.
The complaint fails to allege, as it must, that Plaintiff Molinaro is Mourning's guardian or
otherwise explain how due to "certain exceptional circumstances" Molinaro has standing in this
case to raise the claims of his granddaughter. See Orsi v. Senatore, 230 Conn. 459, 466-67
(1994). Although Molinaro claims he is bringing this lawsuit "on his own behalf," only students
are entitled to attend "free public elementary and secondary schools" pursuant to Article Eighth,
§ 1 of the Connecticut Constitution. Sheff v. O'Neill, 238 Conn. 1 (1996); Broadley v. Board of
23
Education, 229 Conn. 1 (1994); Horton v. Meskill, 172 Conn. 615 (1974). While typically
parents do have the right to pursue claims on behalf of their children, as indeed they have done
elsewhere in this lawsuit, parents do so, not in their own right, but rather as "next friends" to
their minor children. See Carrubba v. Moskowitz, 274 Conn. 533, 550-551 (2005).
10. Plaintiff Emily Black lacks standing.
Plaintiff Emily Black graduated Norwich Free Academy in 2014. Since she is no longer
a public school student, she lacks standing in this case, which seeks declaratory and injunctive
(prospective) relief. See Aqleh v. Cadlerock Joint Venture II, L.P., 299 Conn. 84, 98 (2010)
(“[T]he extraordinary nature of injunctive relief requires that the harm complained of is
occurring or will occur if the injunction is not granted. Although an absolute certainty is not
required, it must appear that there is a substantial probability that but for the issuance of the
injunction, the party seeking it will suffer irreparable harm.”); Moore v. Bender, 2014 WL
4099345, at *9 (Conn. Super. Ct. July 14, 2014) ("[O]ur Supreme Court has concluded that
because of the prospective and forward-looking nature of injunctive relief, a party seeking an
injunction is only required to show substantial probability that it is suffering or will suffer
irreparable harm unless the injunction is granted by the court.")
11. Plaintiff Gregory Gay lacks standing.
Plaintiff Gregory Gay graduated New Britain High School in 2015. Since he is no longer
a public school student, he lacks standing in this case, which seeks declaratory and injunctive
(prospective) relief for the same reasons stated regarding Plaintiff Emily Black.
12. Plaintiff Merrill Gay lacks standing.
Plaintiff Merrill Gay has brought this action "on his own behalf and on behalf of his
minor child, Gregory Gay." Docket No. HHD-CV05-4050526-S, Doc. #163.00 at 12 ¶ 35. As
24
noted above, Merrill Gay's son Gregory Gay lacks standing. Although Merrill Gay claims he is
bringing this lawsuit "on his own behalf" only students are entitled to attend "free public
elementary and secondary schools" pursuant to Article Eighth, § 1 of the Connecticut
Constitution. Sheff v. O'Neill, 238 Conn. 1 (1996); Broadley v. Board of Education, 229 Conn.
1 (1994); Horton v. Meskill, 172 Conn. 615 (1974). While typically parents do have the right to
pursue claims on behalf of their children, as indeed they have done elsewhere in this lawsuit,
parents do so, not in their own right, but rather as "next friends" to their minor children. See
Carrubba v. Moskowitz, 274 Conn. 533, 550-551 (2005).
13. Plaintiff Stephanie Illingworth lacks standing.
Plaintiff Stephanie Illingworth graduated Central High School (Bridgeport) in 2015.
Since she is no longer a public school student, she lacks standing in this case, which seeks
declaratory and injunctive (prospective) relief for the same reasons stated regarding Plaintiff
Emily Black.
14. Plaintiff Hernan Illingworth lacks standing.
Plaintiff Hernan Illingworth has brought this action "on his own behalf and on behalf of
his minor child, Stephanie Illingworth." Docket No. HHD-CV05-4050526-S, Doc. #163.00 at
7 ¶ 15. As noted above, Hernan Illingworth's daughter Stephanie Illingworth lacks standing.
Therefore, Hernan Illinngworth lacks standing for the same reasons stated regarding Plaintiff
Merrill Gay.
25
15. Plaintiff Dharan Velasquez lacks standing.
Plaintiff Dharan Velasquez graduated Capital Prep, a public high school, in 2014. Since
he is no longer a public school student, he lacks standing in this case, which seeks declaratory
and injunctive (prospective) relief for the same reasons stated regarding Plaintiff Emily Black.
16. Plaintiff Brian Wisniewski lacks standing.
Plaintiff Brian Wisniewski graduated Plainfield High School in 2015. Since he is no
longer a public school student, he lacks standing in this case, which seeks declaratory and
injunctive (prospective) relief for the same reasons stated regarding Plaintiff Emily Black.
17. Plaintiff Donna Johnston lacks standing.
Plaintiff Donna Johnston has brought this action "on her own behalf and on behalf of her
minor child, Brian Wisniewski." Docket No. HHD-CV05-4050526-S, Doc. #163.00 at 6 ¶ 14.
As noted above, Donna Johnston's son Brian Wisniewski lacks standing. Therefore, Donna
Johnston lacks standing for the same reasons stated regarding Plaintiff Merrill Gay.
18. Plaintiff Brandon Wolfe lacks standing.
Plaintiff Brandon Wolfe graduated Westhill High School in 2015. Since he is no longer a
public school student, he lacks standing in this case, which seeks declaratory and injunctive
(prospective) relief for the same reasons stated regarding Plaintiff Emily Black.
19. Plaintiff Zenitra Wolfe lacks standing.
Plaintiff Zenitra Wolfe has brought this action "on her own behalf and on behalf of her
minor child, Brandon Wolfe." Docket No. HHD-CV05-4050526-S, Doc. #163.00 at 13 ¶ 40.
As noted above, Zenitra Wolfe's son Brandon Wolfe lacks standing. Therefore, Zenitra Wolfe
lacks standing for the same reasons stated regarding Plaintiff Merrill Gay.
26
20. Jacob Hall lacks standing.
Plaintiff Jacob Hall left Bridgeport public schools in 2014 to attend Fairfield Prep, a
private school. Since he is no longer a public school student, he lacks standing in this case,
which seeks declaratory and injunctive (prospective) relief for the same reasons stated regarding
Plaintiff Emily Black.
21. Ricardo Figueroa and his mother Jennifer Lemus have failed to comply with discovery requests and, accordingly, should be dismissed.
22. Jennifer Lemus has brought this action "on her own behalf and on behalf of her minor child, Ricardo Figueroa." Docket No. HHD-CV05-4050526-S, Doc. #163.00 at 9 ¶ 24. Once her son is dismissed, Jennifer Lemus lacks standing.
23. Sovereign Immunity Bars Plaintiffs’ Claims.
The defendants raised the issue of sovereign immunity both in support of their motion to
dismiss and in response to plaintiffs’ memorandum in opposition. See Docket No. HHD-CV05-
4050526-S, Doc. ##164.00, 165.00 and 180.00 at 2-3. In particular, the defendants argued that
to the extent plaintiffs seek increased monies from the state, such claims are barred by sovereign
immunity. The court’s opinion denying in part the defendants' motion to dismiss did not address
the issue of sovereign immunity. See Docket No. HHD-CV05-4050526-S, Doc. #206.00.
“Sovereign immunity relates to a court's subject matter jurisdiction over a case.”
Columbia Air Servs. v. DOT, 293 Conn. 342, 349 (2009). “[T]he sovereign immunity enjoyed
by the state is not absolute. There are [three] exceptions: (1) when the legislature, either
expressly or by force of a necessary implication, statutorily waives the state's sovereign
immunity; (2) when an action seeks declaratory or injunctive relief on the basis of a substantial
claim that the state or one of its officers has violated the plaintiff's constitutional rights; and (3)
when an action seeks declaratory or injunctive relief on the basis of a substantial allegation of
wrongful conduct to promote an illegal purpose in excess of the officer's statutory authority.” Id.
27
(internal citations omitted). In the absence of a statutory waiver of sovereign immunity, a
plaintiff may not bring a monetary action against the state without authorization from the claims
commissioner to do so. Miller v. Egan, 265 Conn. 301, 317 (2003).
The complaint itself supports defendants’ position. Plaintiffs have explicitly requested
that this court, inter alia, “declare that the existing school funding system is unconstitutional,
void and without effect…” and “order defendants to create and maintain a public education
system that will provide suitable and substantially equal educational opportunities to
plaintiffs.” Docket No. HHD-CV05-4050526-S, Doc. #163.00 at 46. While these prayers for
relief sound in equity and do not explicitly request the court to order an increase in state
education funding, a thorough and fair reading of the entire complaint shows that an increase in
state funding of education is precisely what plaintiffs seek. See id. at 3 ¶ 4(“The level of
resources provided by the State's education funding scheme is arbitrary and not related to the
actual costs of providing a suitable education.”); 37 ¶ 125 (“The unsuitability and inequality of
the plaintiffs’ educational opportunities, as well as the subsequent harm suffered, is caused by a
flawed educational funding system.”); 38 ¶ 120 (complaining that the state funded 39% of
education statewide in 2003 and asserting that number should have been 50%); 38 ¶ 134 (“The
municipalities in which plaintiffs reside do not have the ability to raise the funds needed to
compensate for the monetary shortfalls that result from the State's arbitrary and inadequate
funding system.”); 39 ¶ 144 (complaining that in October of 2003 the "foundation" amount of
the Education Cost Sharing Formula should have been $2,009 more than the current
"foundation" amount).
Notably, plaintiffs do not seek to declare unconstitutional any state laws involving
education that do not involve funding. Plaintiffs argue that the state should increase the overall
28
level of state funding (adequacy) and distribute that funding in a different manner (equity), but
they do not argue that anything else about public education other than state funding should be
changed. Plaintiffs argue that until this is done they are being deprived of their constitutional
rights under Article Eighth,§ 1. These prayers for relief show that plaintiffs' case is solely about
money.
Our supreme court has held that in determining the nature of relief sought, a court must
look beyond the manner in which the plaintiffs have worded the complaint. See
DaimlerChrysler Corp. v. Law, 284 Conn. 701, 723 (2007) (“The plaintiff’s request for relief –
an order that the defendant refund all sales taxes for which the plaintiff had submitted a claim for
refund – must be characterized as a claim for damages.”) Plaintiff CCJEF describes the nature of
its activities in its bylaws as follows:
(a) engage in activities that promote the adequate funding of education in the State of Connecticut; (b) engage in activities that relieve the burdens of Connecticut municipalities in funding education; (c) engage, subject to the limitations of IRC Section 501(c)(3) and those set forth below, in any lawful act or activity for which a corporation may be organized under the Revised Nonstock Corporation Act of the State of Connecticut in furtherance of the foregoing. Docket No. HHD-CV05-4050526-S, Doc. #180, Exhibit 10. These activities do not
concern remedies sounding in equity; they concern both increasing the amount of state funding
for education and decreasing the amount of local funding. Plaintiffs also argued in their
opposition brief “[t]he irrational, underfunded ECS formula ... is at the core of the Plaintiffs'
case.” Docket No. HHD-CV05-4050526-S, Doc. #174.00 at 12 and that the 2012 reforms were
legally insignificant because they did not involve significant increases in money. Id. at 9.
Overwhelming evidence demonstrates that this case is about money. There is no question
that plaintiffs seek an increase in state funding of public education. Accordingly, sovereign
29
immunity bars this court from hearing such claims. Plaintiffs must instead bring their claims to
the Claims Commissioner.
RESERVATION OF RIGHTS
Defendants hereby reserve all the legal arguments previously made in other pleadings,
not addressed here, and any other legal arguments based upon evidence and lack of evidence at
trial.
DEFENDANTS,
GEORGE JEPSEN ATTORNEY GENERAL Joseph Rubin Associate Attorney General Beth Z. Margulies Assistant Attorney General Eleanor M. Mullen Assistant Attorney General John P. DiManno Assistant Attorney General
/s/ Darren P. Cunningham
Darren P. Cunningham Assistant Attorney General Juris No. 421685 55 Elm Street, P.O. Box 120 Hartford, CT 06141-0120 Tel: 860-808-5318 Fax: 860-808-5347 [email protected]
30
CERTIFICATION
The foregoing Defendants' Corrected Preliminary Proposed Findings of Fact and
Conclusions of Law was e-mailed this 6th day of January, 2016 to the following counsel of
record:
Joseph P. Moodhe, Esq., [email protected] Helen V. Cantwell, Esq., [email protected] Megan K. Bannigan, Esq., [email protected] David B. Noland, Esq., [email protected] Dustin N. Nofziger, Esq., [email protected] Alexandra S. Thompson, Esq., [email protected] Olivia Cheng, Esq., [email protected] Emily A. Johnson, Esq., [email protected] Gregory P. Copeland, Esq., [email protected] Christel Y. Tham, Esq., [email protected] Sean Heikkila, Esq., [email protected] Lindsay C. Cornacchia, Esq., [email protected] Edward Bradley, Esq., [email protected] Cara A. Moore, Esq., [email protected] Johanna N. Skrzypczyk, Esq., [email protected] Susan R. Gittes, Esq., [email protected] Debevoise & Plimpton, LLP, 919 Third Avenue, New York, NY 10022 David N. Rosen, Esq., [email protected] David Rosen & Associates, P.C., 400 Orange Street, New Haven, CT 06511 Joseph Rubin, Esq., [email protected] Beth Z. Margulies, Esq., [email protected] Eleanor M. Mullen, Esq., [email protected] John P. DiManno, Esq., [email protected] Cynthia Courtney, Esq., [email protected]
/s/ Darren P. Cunningham Darren P. Cunningham Assistant Attorney General
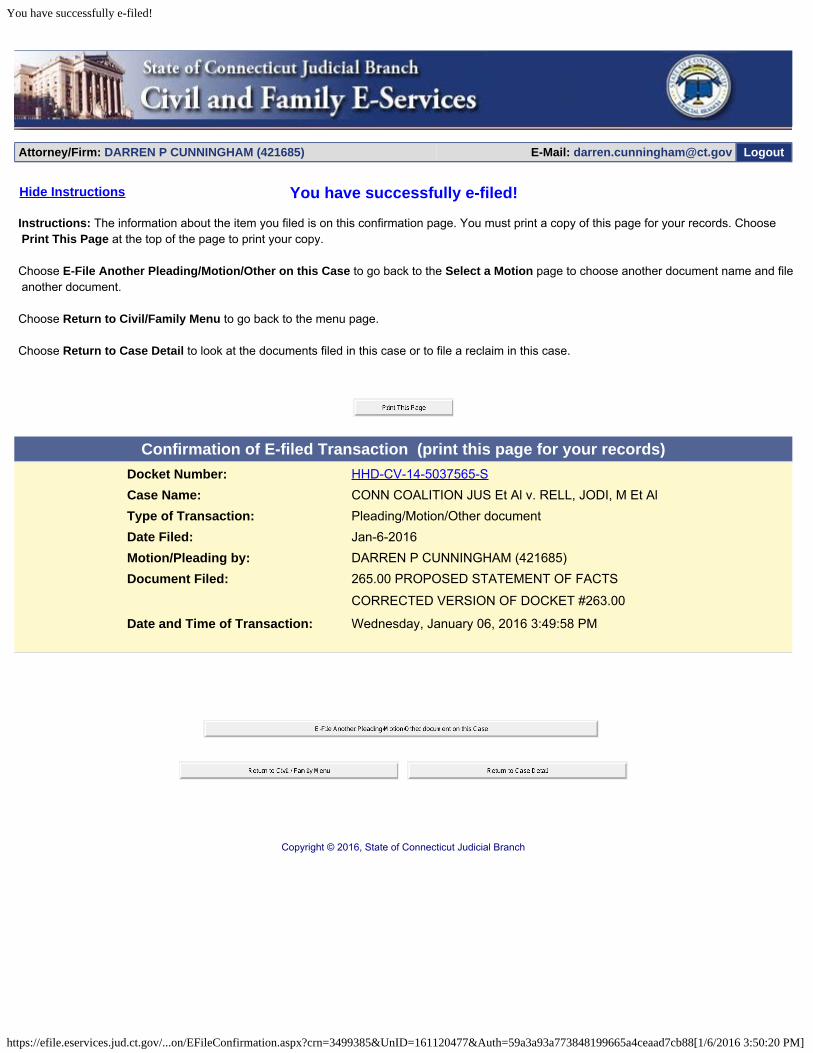
You have successfully e-filed!
https://efile.eservices.jud.ct.gov/...on/EFileConfirmation.aspx?crn=3499385&UnID=161120477&Auth=59a3a93a773848199665a4ceaad7cb88[1/6/2016 3:50:20 PM]
Attorney/Firm: DARREN P CUNNINGHAM (421685) E-Mail: [email protected] Logout
Hide Instructions You have successfully e-filed!
Instructions: The information about the item you filed is on this confirmation page. You must print a copy of this page for your records. Choose Print This Page at the top of the page to print your copy.
Choose E-File Another Pleading/Motion/Other on this Case to go back to the Select a Motion page to choose another document name and file another document.
Choose Return to Civil/Family Menu to go back to the menu page.
Choose Return to Case Detail to look at the documents filed in this case or to file a reclaim in this case.
Confirmation of E-filed Transaction (print this page for your records)Docket Number: HHD-CV-14-5037565-SCase Name: CONN COALITION JUS Et Al v. RELL, JODI, M Et AlType of Transaction: Pleading/Motion/Other documentDate Filed: Jan-6-2016Motion/Pleading by: DARREN P CUNNINGHAM (421685)Document Filed: 265.00 PROPOSED STATEMENT OF FACTS
CORRECTED VERSION OF DOCKET #263.00
Date and Time of Transaction: Wednesday, January 06, 2016 3:49:58 PM
Copyright © 2016, State of Connecticut Judicial Branch
1
Docket No. X07 HHD-CV-14-5037565-S : SUPERIOR COURT
CONNECTICUT COALITION FOR : COMPLEX LITIGATIONJUSTICE IN EDUCATION FUNDING, INC. DOCKETET AL.
: AT HARTFORD
v.
M. JODI RELL, ET AL. : JANUARY 9, 2015
PLAINTIFFS’ AMENDED RESPONSES TO DEFENDANTS’INTERROGATORIES
Pursuant to Connecticut Practice Book § 13-15, Plaintiffs hereby submit amended
responses to Defendants’ Interrogatories. As noted below, Plaintiffs reserve their rights
to continue to amend and/or supplement these responses consistent with further
investigation and discovery.
Plaintiffs hereby expressly incorporate and do not waive any of the general or
specific objections stated in their May 19, 2014 Responses and Objections to Defendants’
Interrogatories.
Responses
APPENDIX 4
(PERTINENT PORTION # 8 ONLY)
26
8. Please list and describe every kind of higher education (post high school) prior
and current student Plaintiffs, prior and current CCJEF student members, and students of
prior and current CCJEF parent members have pursued or are pursuing including dates
involved and nature of studies.
ANSWER:
Plaintiffs state that Emily Black began attending the University of
Connecticut in the fall of 2014, majoring in marine science. Dharan Velasquez began
attending the University of Massachusetts – Lowell in the fall of 2014, majoring in
liberal arts. To the extent this request seeks information regarding former Plaintiff
students, former and current CCJEF student members, and students of former and
current CCJEF parent members, such information is not within Plaintiffs’ custody or
control.
174
THE PLAINTIFFS
By___________/s/__________Helen V. CantwellMegan K. BanniganDavid GopsteinDustin N. NofzigerDavid B. NolandEmily JohnsonOlivia ChengAlexandra S. ThompsonGregory CopelandDebevoise & Plimpton, LLP919 Third AvenueNew York, New York 10022(212) 909-6000(212) 909-6836 FaxJuris No.: [email protected]
By__________/s/____________David N. RosenDavid Hunter Smith

175
David Rosen & Associates, P.C.400 Orange StreetNew Haven CT 06511(203) 787-3513(203) 789-1605 FaxJuris No.: [email protected]
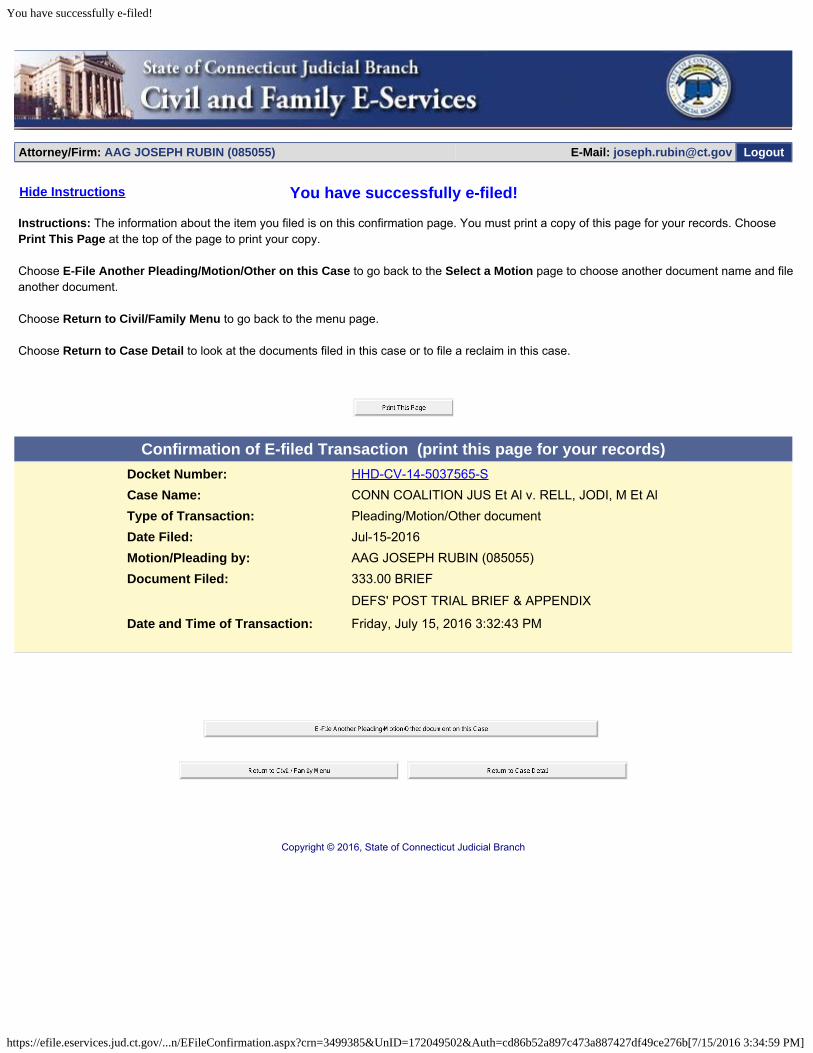
You have successfully e-filed!
https://efile.eservices.jud.ct.gov/...n/EFileConfirmation.aspx?crn=3499385&UnID=172049502&Auth=cd86b52a897c473a887427df49ce276b[7/15/2016 3:34:59 PM]
Attorney/Firm: AAG JOSEPH RUBIN (085055) E-Mail: [email protected] Logout
Hide Instructions You have successfully e-filed!
Instructions: The information about the item you filed is on this confirmation page. You must print a copy of this page for your records. ChoosePrint This Page at the top of the page to print your copy.
Choose E-File Another Pleading/Motion/Other on this Case to go back to the Select a Motion page to choose another document name and fileanother document.
Choose Return to Civil/Family Menu to go back to the menu page.
Choose Return to Case Detail to look at the documents filed in this case or to file a reclaim in this case.
Confirmation of E-filed Transaction (print this page for your records)Docket Number: HHD-CV-14-5037565-SCase Name: CONN COALITION JUS Et Al v. RELL, JODI, M Et AlType of Transaction: Pleading/Motion/Other documentDate Filed: Jul-15-2016Motion/Pleading by: AAG JOSEPH RUBIN (085055)Document Filed: 333.00 BRIEF
DEFS' POST TRIAL BRIEF & APPENDIX
Date and Time of Transaction: Friday, July 15, 2016 3:32:43 PM
Copyright © 2016, State of Connecticut Judicial Branch


![Europen Union Funding in Turkey [Presentation]](https://img.pdfslide.net/doc/110x75/634f085448cb0bd7320f4517/europen-union-funding-in-turkey-presentation.jpg)


