Embed Size (px)
Citation preview
Neuron, Volume 59
Supplemental Data
Neuregulin-1/ErbB Signaling Serves Distinct Functions in Myelination of the Peripheral and Central Nervous System B.G. Brinkmann, A. Agarwal, M.W. Sereda, A.N. Garratt, T. Müller, H. Wende, R.M. Stassart, S. Nawaz, C. Humml, V. Velanac, K. Radyuschkin, S. Goebbels, T.M. Fischer, R.J. Franklin, C. Lai, H. Ehrenreich, C. Birchmeier, M.H. Schwab, and K.-A. Nave
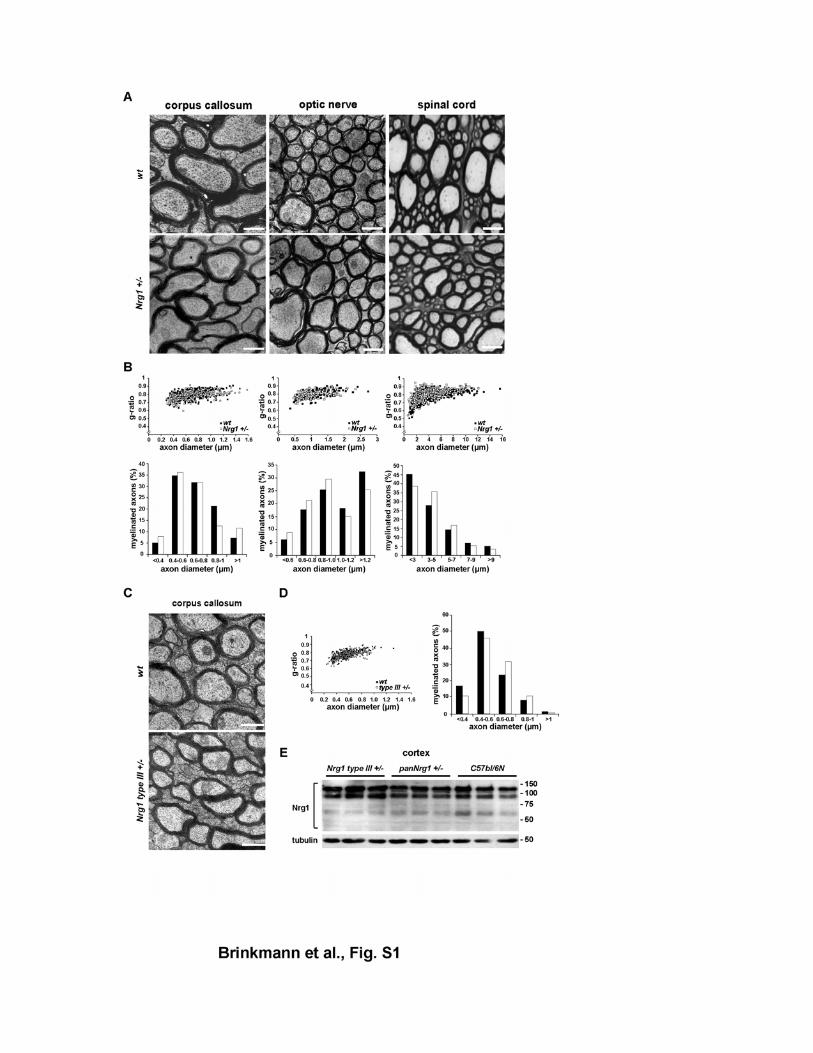
Figure S1 CNS myelination in mice with reduced Nrg1 gene dosage (A) Normal myelination of the CNS by electron microscopy of ultrathin cross sections
from Nrg1 null (+/-) heterozygous and wildtype mice, aged 4.5 months (corpus
callosum, optic nerve) and 6 months (spinal cord, ventro-medial region, cervical
segment 7). Scale bars, 1 µm (left, middle) and 5 µm (right).
(B) Myelin sheath thickness (top) and axon size distribution (bottom) in the corpus
callosum (left), optic nerve (middle), and spinal cord (right) of Nrg1 null heterozygotes
(n=3 per genotype). Scatter plots display g-ratios of individually scored fibers as a
function of the respective axon diameter. Differences are not significant.
(C) By electron microscopy, myelin sheath thickness in the corpus callosum of adult
wildtype control mice (wt; top) is indistinguishable from adult mice heterozygous for
the Nrg1 type III isoform (Nrg1 type III +/-; bottom).
(D) Quantitation of the data in (C), revealing normal myelin sheath thickness by g-
ratio scatter plotting (left) and a normal axon size distribution (right).
(E) By Western blotting, steady-state levels of the major NRG1 isoforms are the
same in protein lysates from forebrains of adult (age 4-5 months) Nrg1 type III
heterozygotes (left), Nrg1 null heterozygotes (middle), and age-matched controls
(right), comparing 3 mice per genotype (loading control, tubulin).
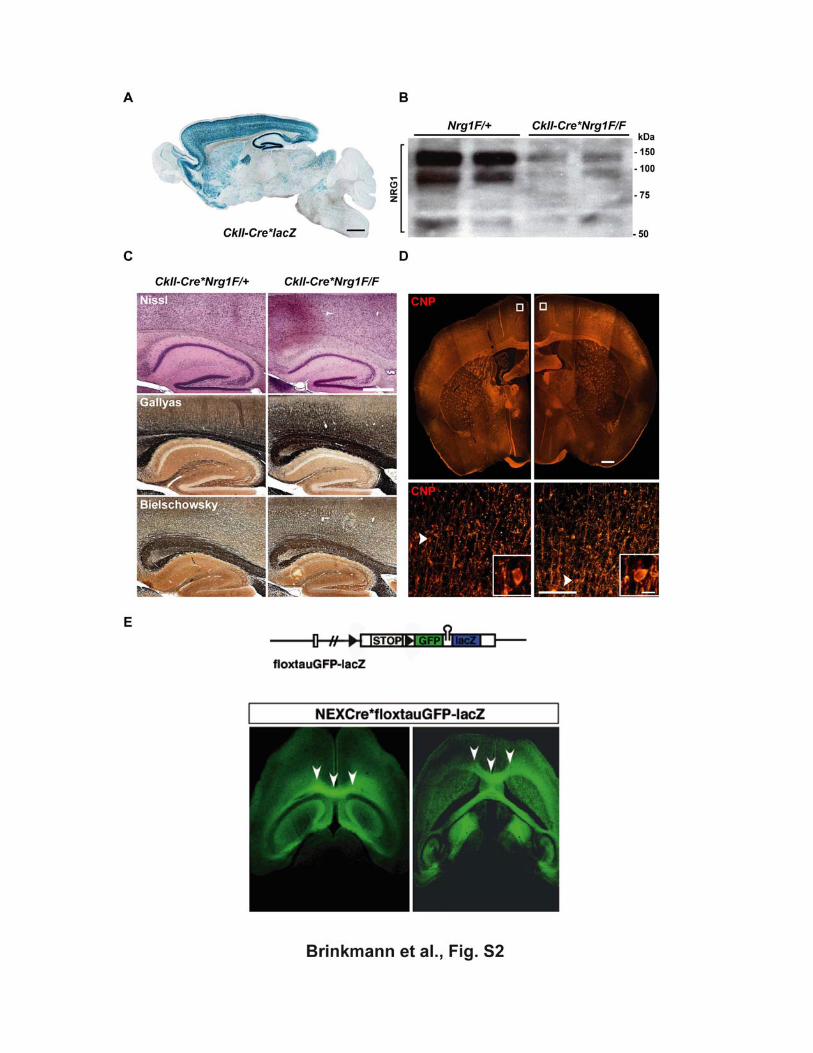
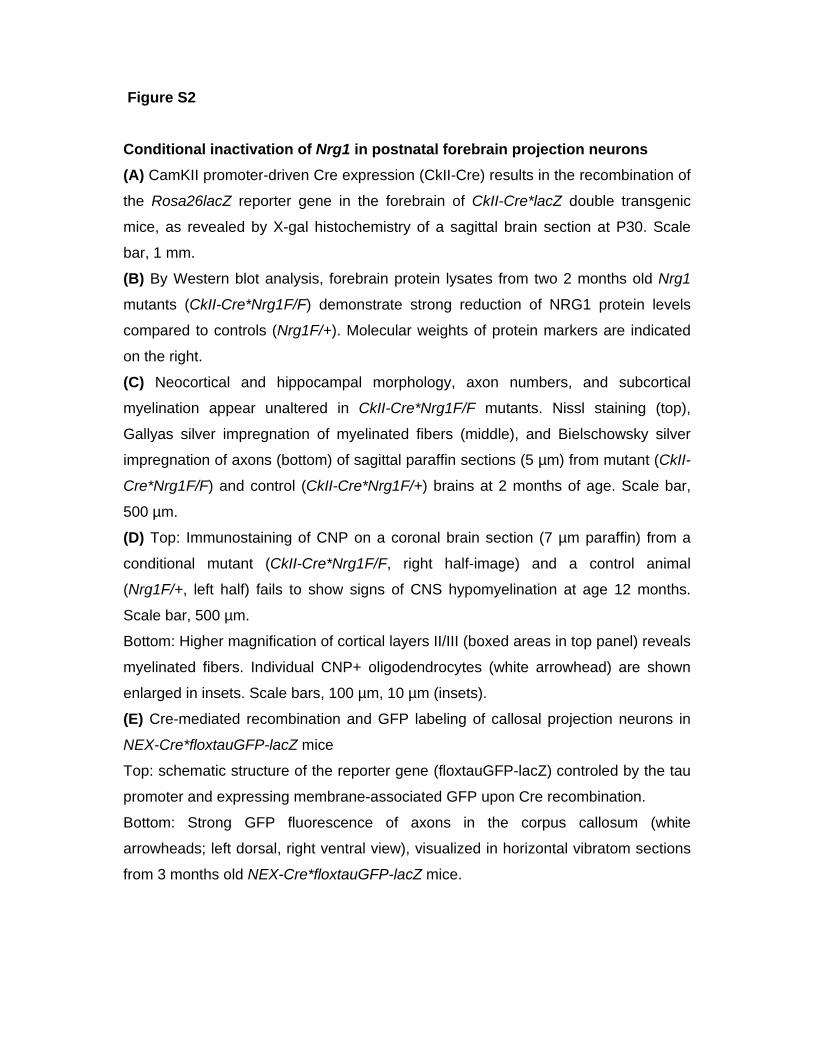
Figure S2 Conditional inactivation of Nrg1 in postnatal forebrain projection neurons
(A) CamKII promoter-driven Cre expression (CkII-Cre) results in the recombination of
the Rosa26lacZ reporter gene in the forebrain of CkII-Cre*lacZ double transgenic
mice, as revealed by X-gal histochemistry of a sagittal brain section at P30. Scale
bar, 1 mm.
(B) By Western blot analysis, forebrain protein lysates from two 2 months old Nrg1
mutants (CkII-Cre*Nrg1F/F) demonstrate strong reduction of NRG1 protein levels
compared to controls (Nrg1F/+). Molecular weights of protein markers are indicated
on the right. (C) Neocortical and hippocampal morphology, axon numbers, and subcortical
myelination appear unaltered in CkII-Cre*Nrg1F/F mutants. Nissl staining (top),
Gallyas silver impregnation of myelinated fibers (middle), and Bielschowsky silver
impregnation of axons (bottom) of sagittal paraffin sections (5 µm) from mutant (CkII-
Cre*Nrg1F/F) and control (CkII-Cre*Nrg1F/+) brains at 2 months of age. Scale bar,
500 µm.
(D) Top: Immunostaining of CNP on a coronal brain section (7 µm paraffin) from a
conditional mutant (CkII-Cre*Nrg1F/F, right half-image) and a control animal
(Nrg1F/+, left half) fails to show signs of CNS hypomyelination at age 12 months.
Scale bar, 500 µm.
Bottom: Higher magnification of cortical layers II/III (boxed areas in top panel) reveals
myelinated fibers. Individual CNP+ oligodendrocytes (white arrowhead) are shown
enlarged in insets. Scale bars, 100 µm, 10 µm (insets).
(E) Cre-mediated recombination and GFP labeling of callosal projection neurons in
NEX-Cre*floxtauGFP-lacZ mice
Top: schematic structure of the reporter gene (floxtauGFP-lacZ) controled by the tau
promoter and expressing membrane-associated GFP upon Cre recombination. Bottom: Strong GFP fluorescence of axons in the corpus callosum (white
arrowheads; left dorsal, right ventral view), visualized in horizontal vibratom sections
from 3 months old NEX-Cre*floxtauGFP-lacZ mice.
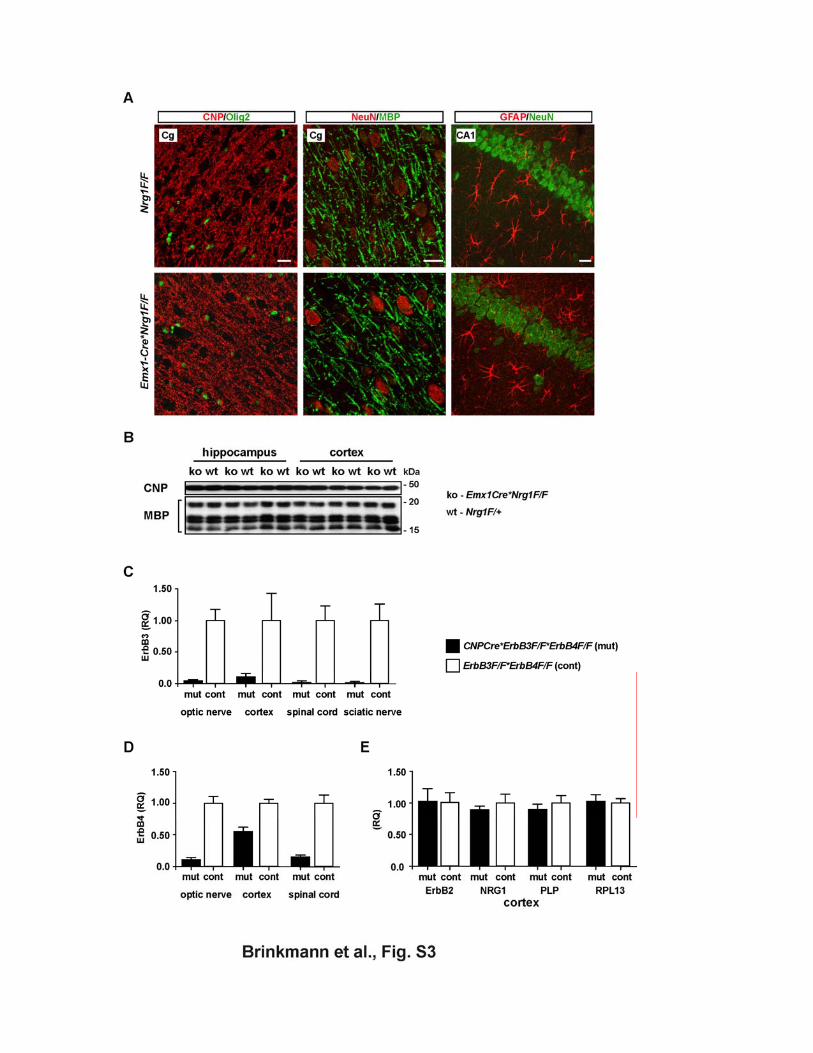
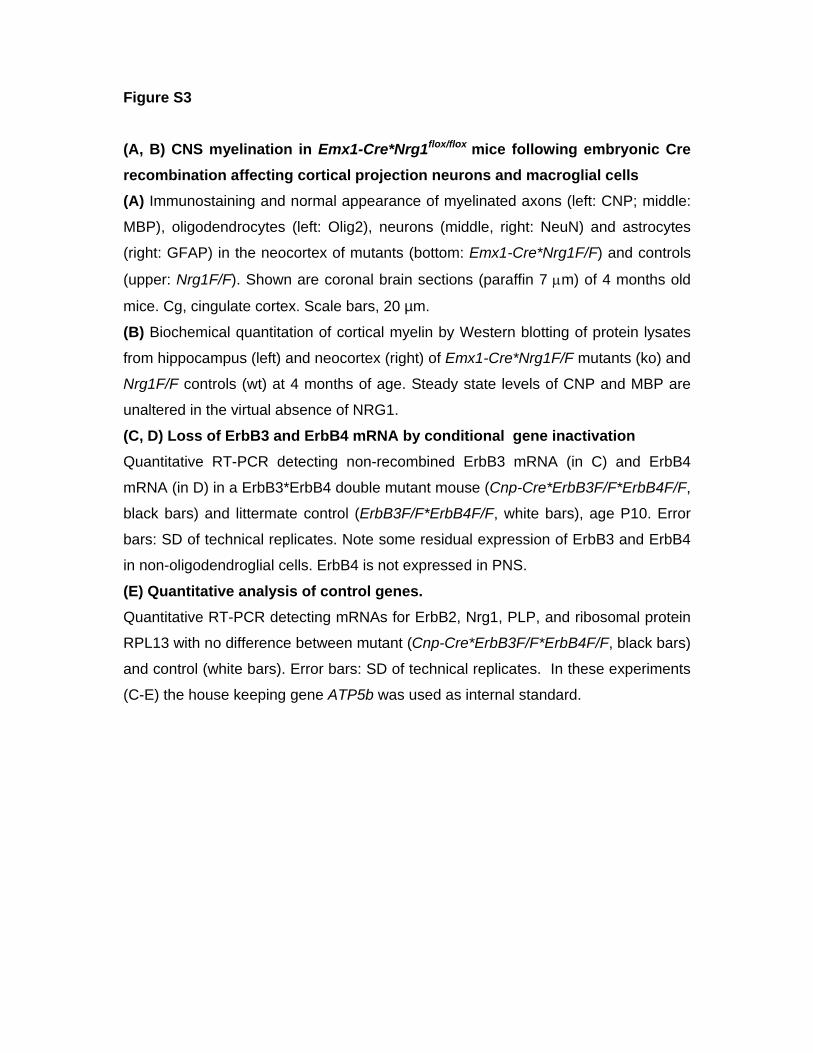
Figure S3 (A, B) CNS myelination in Emx1-Cre*Nrg1flox/flox mice following embryonic Cre recombination affecting cortical projection neurons and macroglial cells (A) Immunostaining and normal appearance of myelinated axons (left: CNP; middle:
MBP), oligodendrocytes (left: Olig2), neurons (middle, right: NeuN) and astrocytes
(right: GFAP) in the neocortex of mutants (bottom: Emx1-Cre*Nrg1F/F) and controls
(upper: Nrg1F/F). Shown are coronal brain sections (paraffin 7 µm) of 4 months old
mice. Cg, cingulate cortex. Scale bars, 20 µm.
(B) Biochemical quantitation of cortical myelin by Western blotting of protein lysates
from hippocampus (left) and neocortex (right) of Emx1-Cre*Nrg1F/F mutants (ko) and
Nrg1F/F controls (wt) at 4 months of age. Steady state levels of CNP and MBP are
unaltered in the virtual absence of NRG1.
(C, D) Loss of ErbB3 and ErbB4 mRNA by conditional gene inactivation Quantitative RT-PCR detecting non-recombined ErbB3 mRNA (in C) and ErbB4
mRNA (in D) in a ErbB3*ErbB4 double mutant mouse (Cnp-Cre*ErbB3F/F*ErbB4F/F,
black bars) and littermate control (ErbB3F/F*ErbB4F/F, white bars), age P10. Error
bars: SD of technical replicates. Note some residual expression of ErbB3 and ErbB4
in non-oligodendroglial cells. ErbB4 is not expressed in PNS.
(E) Quantitative analysis of control genes. Quantitative RT-PCR detecting mRNAs for ErbB2, Nrg1, PLP, and ribosomal protein
RPL13 with no difference between mutant (Cnp-Cre*ErbB3F/F*ErbB4F/F, black bars)
and control (white bars). Error bars: SD of technical replicates. In these experiments
(C-E) the house keeping gene ATP5b was used as internal standard.
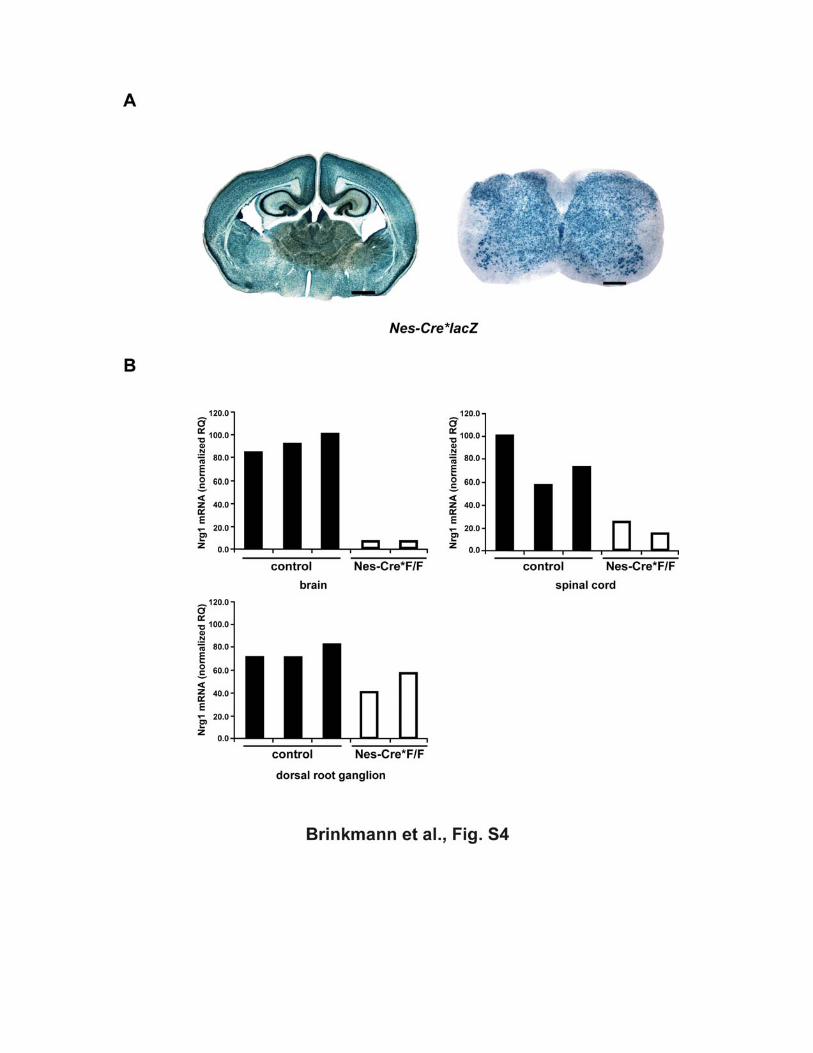
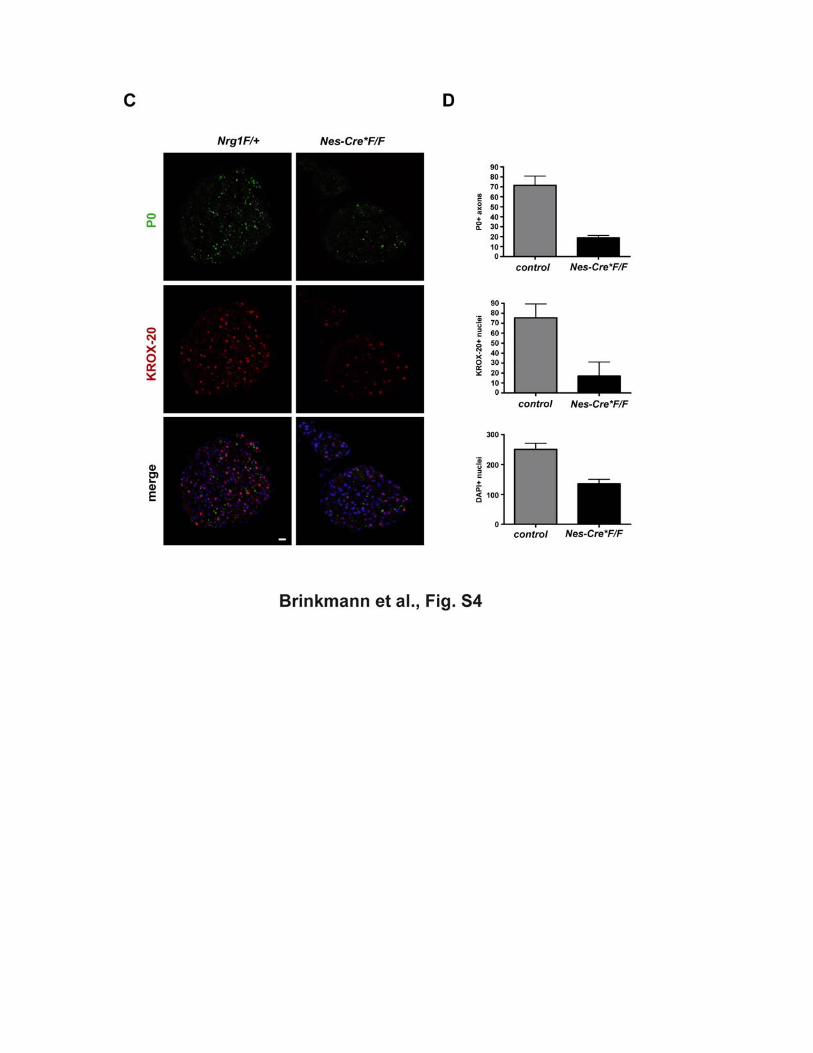
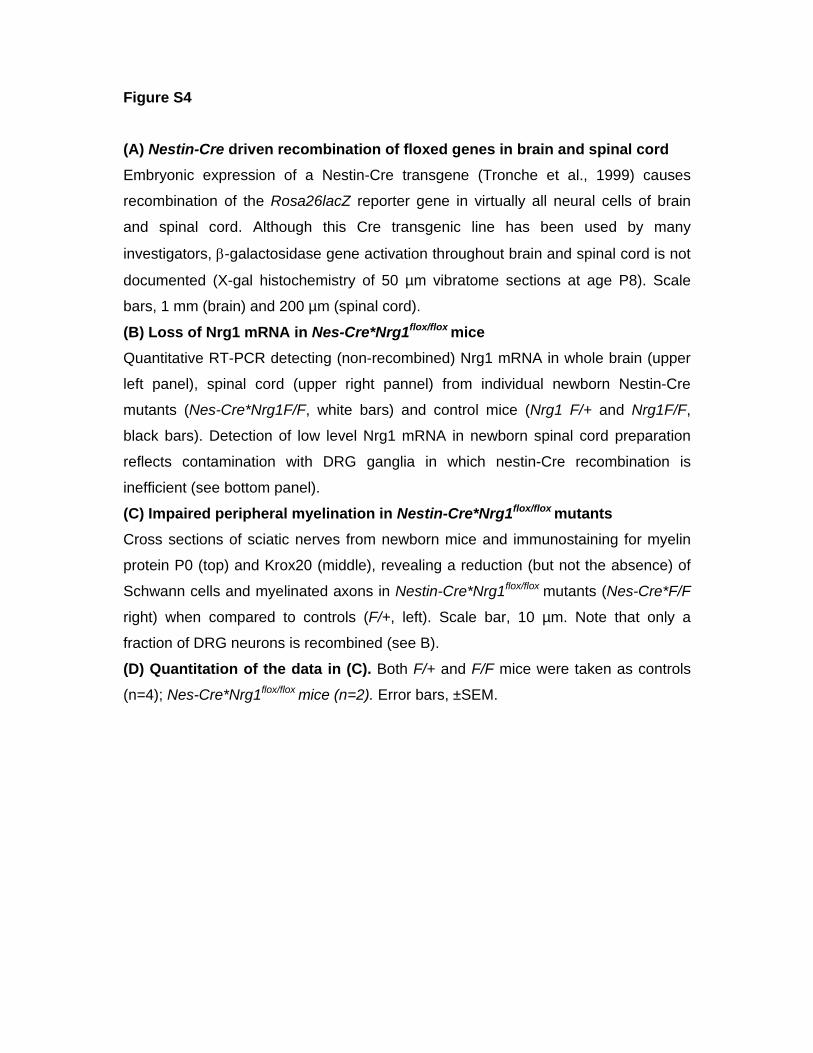
Figure S4 (A) Nestin-Cre driven recombination of floxed genes in brain and spinal cord Embryonic expression of a Nestin-Cre transgene (Tronche et al., 1999) causes
recombination of the Rosa26lacZ reporter gene in virtually all neural cells of brain
and spinal cord. Although this Cre transgenic line has been used by many
investigators, β-galactosidase gene activation throughout brain and spinal cord is not
documented (X-gal histochemistry of 50 µm vibratome sections at age P8). Scale
bars, 1 mm (brain) and 200 µm (spinal cord).
(B) Loss of Nrg1 mRNA in Nes-Cre*Nrg1flox/flox mice Quantitative RT-PCR detecting (non-recombined) Nrg1 mRNA in whole brain (upper
left panel), spinal cord (upper right pannel) from individual newborn Nestin-Cre
mutants (Nes-Cre*Nrg1F/F, white bars) and control mice (Nrg1 F/+ and Nrg1F/F,
black bars). Detection of low level Nrg1 mRNA in newborn spinal cord preparation
reflects contamination with DRG ganglia in which nestin-Cre recombination is
inefficient (see bottom panel).
(C) Impaired peripheral myelination in Nestin-Cre*Nrg1flox/flox mutants Cross sections of sciatic nerves from newborn mice and immunostaining for myelin
protein P0 (top) and Krox20 (middle), revealing a reduction (but not the absence) of
Schwann cells and myelinated axons in Nestin-Cre*Nrg1flox/flox mutants (Nes-Cre*F/F
right) when compared to controls (F/+, left). Scale bar, 10 µm. Note that only a
fraction of DRG neurons is recombined (see B).
(D) Quantitation of the data in (C). Both F/+ and F/F mice were taken as controls
(n=4); Nes-Cre*Nrg1flox/flox mice (n=2). Error bars, ±SEM.
Figure S5 NRG1 is dispensable for cortical oligodendrocytes to myelinate axons in vitro. (A) Neuron-oligodendrocyte cocultures were established by the addition of wildtype
oligodendrocytes to control (Nrg1F/+) or mutant (Nes-Cre*Nrg1F/F) cortical neurons,
all prepared from E17 brains. Five days after addition of oligodendrocytes,
immunostaining with antibodies against β-tubulin (Tuj1, in green) and MBP (in red)
reveals numerous myelinated fibers (arrowheads) in mutant and control cultures.
Scale bar, 10 µm.
(B) When mixed primary cultures were prepared from mutant (Nes-Cre*Nrg1F/F)
cortices at E17, cultured for two weeks, and immunostained for β-tubulin (Tuj1, in
green) and MBP (in red), endogenous oligodendrocytes have survived, differentiated,
and myelinated axons in the absence of NRG1. Arrowheads point to MBP+ myelin
internodes. Scale bars, 5 µm (left) and 20 µm (right).
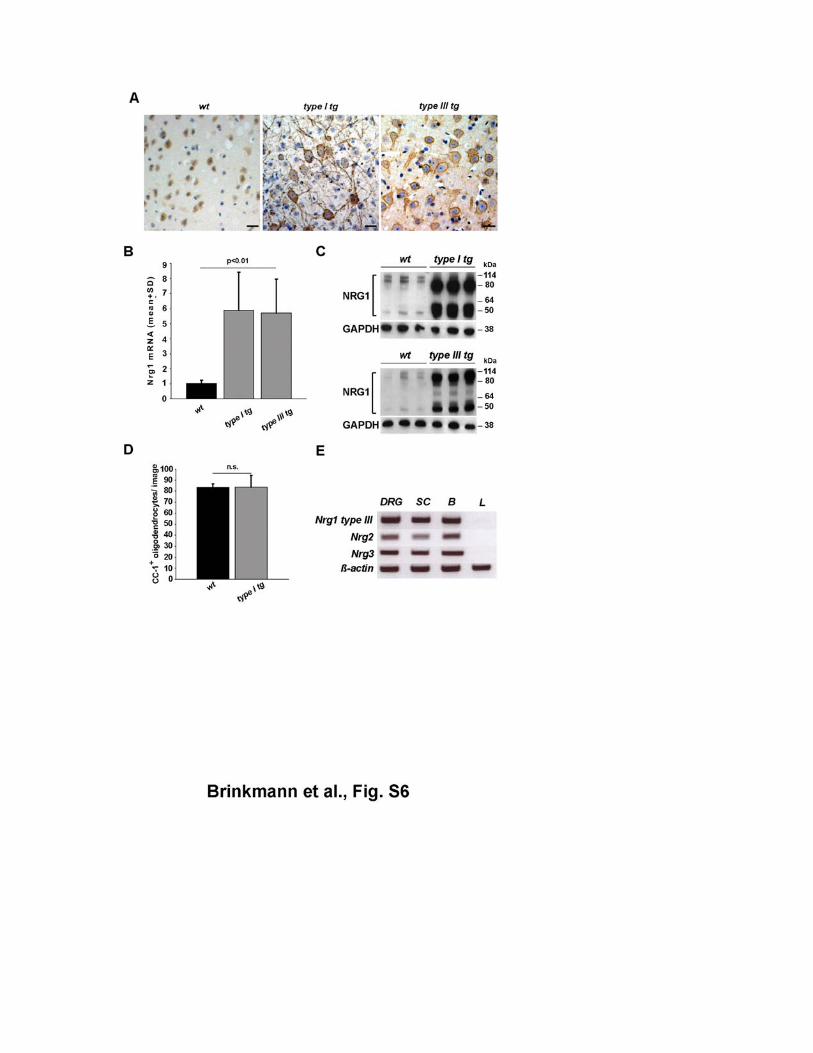
Figure S6 Transgenic overexpression of NRG1 in cortical projection neurons (A) Expression of NRG1 in cortical neurons of wildtype (left), Nrg1 type I transgenic
(middle) and Nrg1 type III transgenic mice (right), as revealed by immunostaining of
the NRG1 C-terminus, shared by all isoforms. Note immunodetectable NRG1 also in
neuronal processes of transgenic mice, but barely in wildtype brains (age 6 months).
Scale bars, 20 µm.
(B) Nrg1 mRNA in brains from wildtype (wt), Nrg1 type I, and NRG1 type III
transgenic mice (n=3 per genotype, age P25). By RT-PCR, targeting the coding
region for the EGF-like domain, steady state mRNA levels were approximately 5-fold
(error bars, ±SD) elevated in transgenic mice compared to wildtype littermates. (C) Western blotting confirms overexpression of NRG1 in individual brains of Nrg1 type I
transgenic mice (top) and Nrg1 type III transgenic mice (bottom; GAPDH, loading
control), aged 4.5 months. Minor differences in NRG1 band sizes between these gels
(4-12% Bis-Tris gradients) and those of Fig. 1, 2 and 4 are due to different gel
systems (8% Tris-Glycin gel).
(D) Equal density of CC1+ oligodendrocytes in the corpus callosum of 4.5 months old
Nrg1 type I transgenic mice (n=3) compared to wildtype controls (wt, n=2). Two
images (350 mm2) per mouse were quantified (error bars, ±SD).
(E) RT-PCR demonstrating that transcripts for Nrg1 type III, Nrg2, and Nrg3 are
present in dorsal root ganglia (DRG) of wildtype mice (age P10). Spinal cord (SC)
and brain (B) were used as positive controls, and liver (L) cDNA as negative control.
RT-PCR of β-actin mRNA demonstrates similar cDNA input.
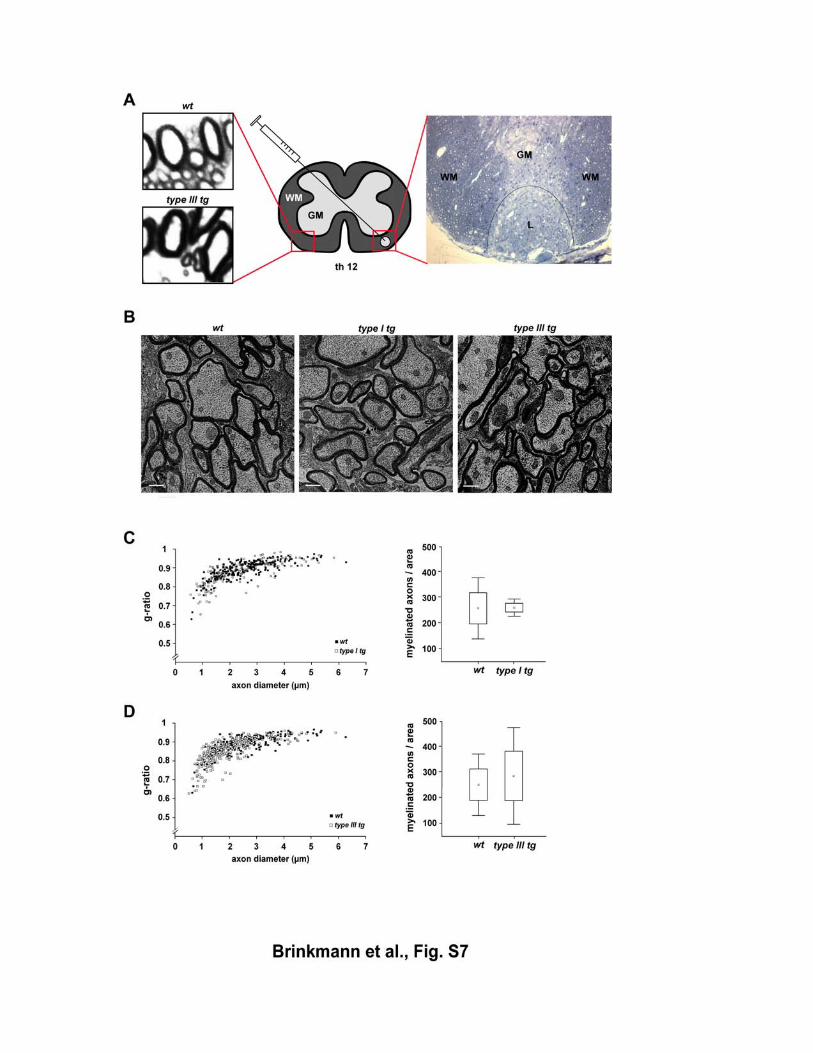
Figure S7 Repair of demyelinated lesions in the CNS of NRG1 type I and NRG1 type III overexpressing mice (A) Schematic drawing (center) and methylenblue-azur staining (right) of a spinal
cord cross-section one week post lysolecithin injection, illustrating a demyelinated
lesion in the right ventro-lateral funiculus. The blow-up (lower left) shows
hypermyelination contralaterally to the lesioned area in Nrg1 type III transgenic
animals, as visualized by light microscopy (magnification 100x) and compared to
wildtype controls (wt, upper left). GM, Gray matter; WM, white matter; L, lesion.
(B) Electron micrographs of the lesion centre in wildtype, NRG1 type I transgenic,
and NRG1 type III transgenic mice (age 8 weeks), four weeks post injection,
revealing thinly myelinated axons and ongoing remyelination. No obvious difference
in the kinetics or extent of remyelination is seen. Scale bars, 2,5 µm.
(C) Quantitation of morphometric data from NRG1 type I transgenic mice (8 week;
n=3 per genotype), following electron microscopy of the spinal cord (ventro-lateral
region, thoracic segment 12). Left panel: when g-ratios were plotted as a function of
axon size, randomly chosen fibers in spinal cord were unaltered (open rectangles,
transgenic; closed rectangles, wildtype). Right panel: The density of remyelinated
axons (per area of 0.02mm2) is not increased in lesions of Nrg1 type I transgenic
mice (white bar, transgenic; black bar, wildtype).
(D) Same analysis as in (C), for Nrg1 type III transgenic mice.
Supplemental Methods Cell culture. Mixed brain cultures from 15-17 days old fetal mice were prepared as
described previously (Trajkovic et al., 2006). Briefly, brains were trypsinized for 5 min
at 37°C. Enzymatic reaction was stopped by adding FCS. Cells were plated in DMEM
containing B27 supplement, 1% horse serum, L-thyroxine, tri-iodo-thyronine, glucose,
glutamine, gentamycine and pyruvate onto poly-L-lysine-coated coverslips at a
density of 50,000-200,000 cells/cm2. After 2 weeks in culture, cells were fixed with
4% PFA and stained with antibody directed against MBP and neuronal β-tubulin.
Primary cultures of oligodendrocytes were prepared as described (Simons et al.,
2000). Co-cultures of neurons and oligodendrocytes were produced by adding
oligodendrocytes to two week old mixed brain cultures as described (Fitzner et al.,
2006), and analyzed after 5 days.
Protein analysis. Protein lysates were prepared using an Ultraturrax (T8) at highest
settings (20-30s). Tissues were homogenized in 1 ml of modified RIPA buffer (50mM
Tris-HCl pH 7.4, 150mM NaCl, 1mM EDTA, 0.1% SDS, 1% TritonX-100, 1% Sodium
deoxycholate, 1mM PMSF and 1mM Sodium vanadate) and protease inhibitors
(Complete tablets, Roche). After incubation for 15 min on ice the insoluble material
was pelleted by centrifugation at 16,000g at 4ºC for 30 min and supernatant was
used for further analysis. After Western Blotting membranes were blocked in 5% milk
powder prepared in TBS buffer (50mM Tris-HCl, pH 7.4 and 150 mM NaCl) for 1-2
hours at room temperature. Primary antibodies directed against MAG (1:500,
Chemicon), CNP (1:500, Sigma), MBP (pRb, 1:500; DAKO), PLP (3F4; 1:50, a gift
from M. Lees), tubulin (1:2000, Sigma), GAPDH (1:1000, Advance ImmunoChemical
Inc.) and NRG1 (Sc-348, pRb, 1:500, Santa Cruz Biotechnology) were diluted in
blocking buffer and incubated overnight at 4°C. Membranes were washed three times
(10 min each) in TBS-T buffer (50 mM Tris-HCl, pH 7.4, 150 mM NaCl and 0.05%
Tween-20), followed by an incubation with a horseradish peroxidase-conjugated
secondary antibody (diluted 1:5.000-10.000 in blocking buffer). After 5 additional
washes (10 min each) with TBS-T buffer, proteins were detected with an enhanced
chemiluminescence kit (Western Lightning™, Western Blot Chemiluminescence
Reagent Plus, PerkinElmer Life Sciences, Inc.) according to the manufacturer’s
instructions. Exposure of ECL films (Hyperfilm™, Amersham Biosciences) was
carried out varying from 10 seconds to 15 minutes depending upon signal intensity.
Films were scanned at greyscale (300 dpi resolution) using a regular image scanner
(UMAX, Astra). The densitometeric analysis of scanned ECL films was carried out
using QuantityOne® software from BioRad. The peak intensity value for the band of
interest calculated by the software was normalized to the peak intensity value of
GAPDH or tubulin. The normalized values (±SEM) were depicted as histograms
using Microsoft-Excel 2003.
X-gal histochemistry. Mice were anesthetized with avertin and perfused with 4%
paraformaldehyde in phosphate buffered saline (PBS). Brains were postfixed at room
temperature in 4% paraformaldehyde for one hour. Vibrotome sections (50 µm) were
incubated at 37ºC in X-gal solution (5 mM K3[Fe(CN)6], 5 mM K4[Fe(CN)6], 2 mM
MgCl2, 1.2 mg/ml 5-bromo-2-chloro-3-indoyl-b-D-galactopyranoside (Xgal) in PBS)
for 20 minutes to overnight in the dark, rinsed in PBS (2-3 times) and mounted in
Immu-mount (Thermo Electron Corporation).
Imaging oligodendrocyte morphology. 6 months old mice (n=3 for each gentoype)
were perfused intracardially with freshly prepared 4% paraformaldehyde in 0.1 mM
phosphate buffer containing 0.8% sodium chloride. After perfusions brains were
postfixed in 4% paraformaldehyde for 1-2 hour at 4°C. Coronal vibratome brain
sections of 100 µm thickness were cut. Sections were immunostained overnight at
4°C with anti-CNP primary antibody (mM; 1:300, Sigma Aldrich) and Cy3-coupled
anti mouse secondary antibody and mounted on superfrost glass slides using Aqua
Polymount. CNP+ oligodendrocytes (OL) from layers 2-3 of the prefrontal cortex were
randomly selected.
Spinal cord demyelinating lesions. Under anaesthesia, a focal spinal cord
demyelination was created by stereotactic injection of 1 µl lysolecithin (1%) into the
ventro-lateral funiculus of 8-week old animals, as described (Zhao et al., 2006). The
injection was performed with a 10 µl Hamilton syringe, fitted with a thin tapered glass
tip, at a rate of approximately 1 µl/min. This procedure created fusiform
demyelinating lesions, 5–6 mm in length. Animals were kept in individual cages after

surgery and were sacrificed 4 weeks post-injection. Spinal cord tissue was processed
for electron microscopy.
References.
Fitzner, D., Schneider, A., Kippert, A., Mobius, W., Willig, K. I., Hell, S. W., Bunt, G.,
Gaus, K., and Simons, M. (2006). Myelin basic protein-dependent plasma membrane
reorganization in the formation of myelin. Embo J 25, 5037-5048.
Simons, M., Kramer, E. M., Thiele, C., Stoffel, W., and Trotter, J. (2000). Assembly of
myelin by association of proteolipid protein with cholesterol- and galactosylceramide-
rich membrane domains. J Cell Biol 151, 143-154.
Trajkovic, K., Dhaunchak, A. S., Goncalves, J. T., Wenzel, D., Schneider, A., Bunt,
G., Nave, K. A., and Simons, M. (2006). Neuron to glia signaling triggers myelin
membrane exocytosis from endosomal storage sites. J Cell Biol 172, 937-948.
Zhao, C., Li, W. W., and Franklin, R. J. (2006). Differences in the early inflammatory
responses to toxin-induced demyelination are associated with the age-related decline
in CNS remyelination. Neurobiol Aging 27, 1298-1307.


