Embed Size (px)
Citation preview
Supplementary Figures
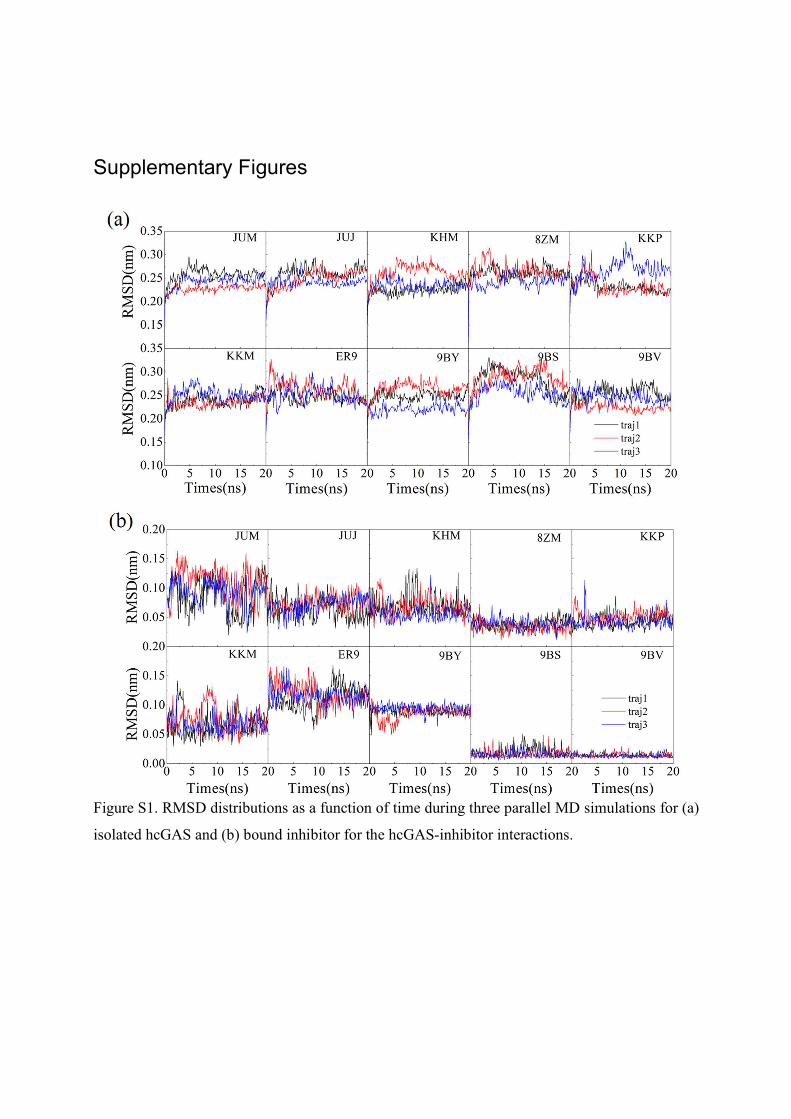
Figure S1. RMSD distributions as a function of time during three parallel MD simulations for (a)
isolated hcGAS and (b) bound inhibitor for the hcGAS-inhibitor interactions.
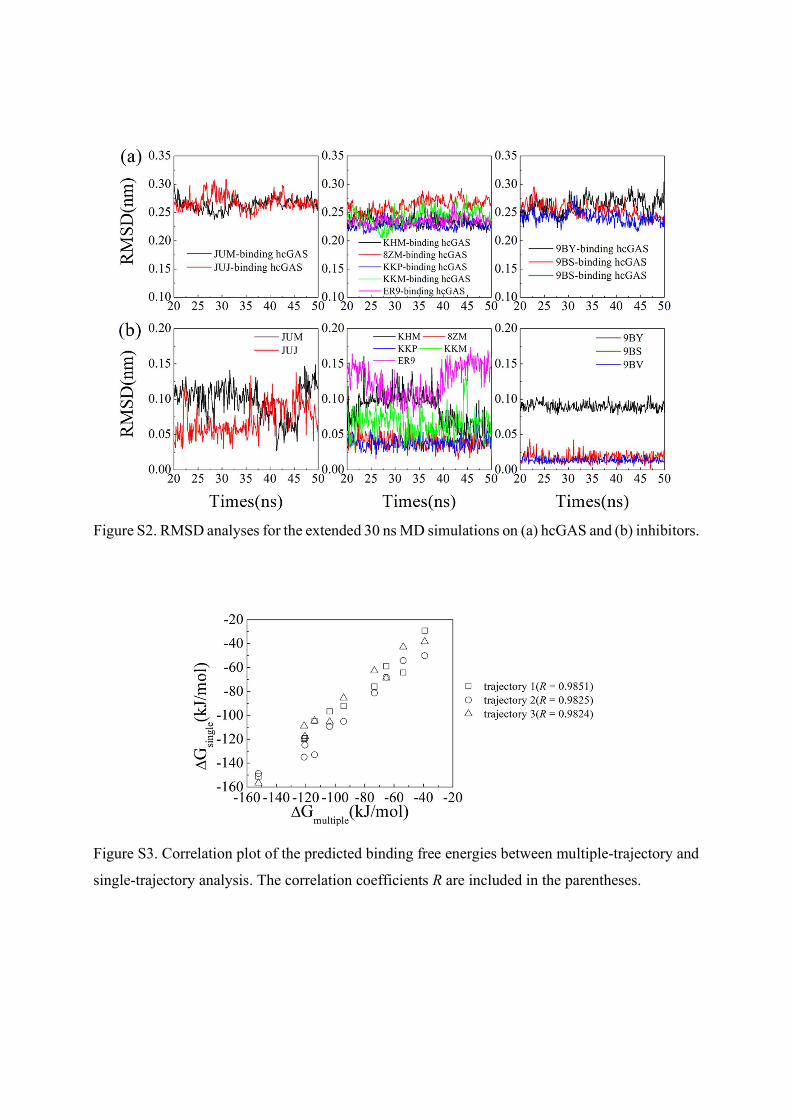
Figure S2. RMSD analyses for the extended 30 ns MD simulations on (a) hcGAS and (b) inhibitors.
Figure S3. Correlation plot of the predicted binding free energies between multiple-trajectory and
single-trajectory analysis. The correlation coefficients R are included in the parentheses.
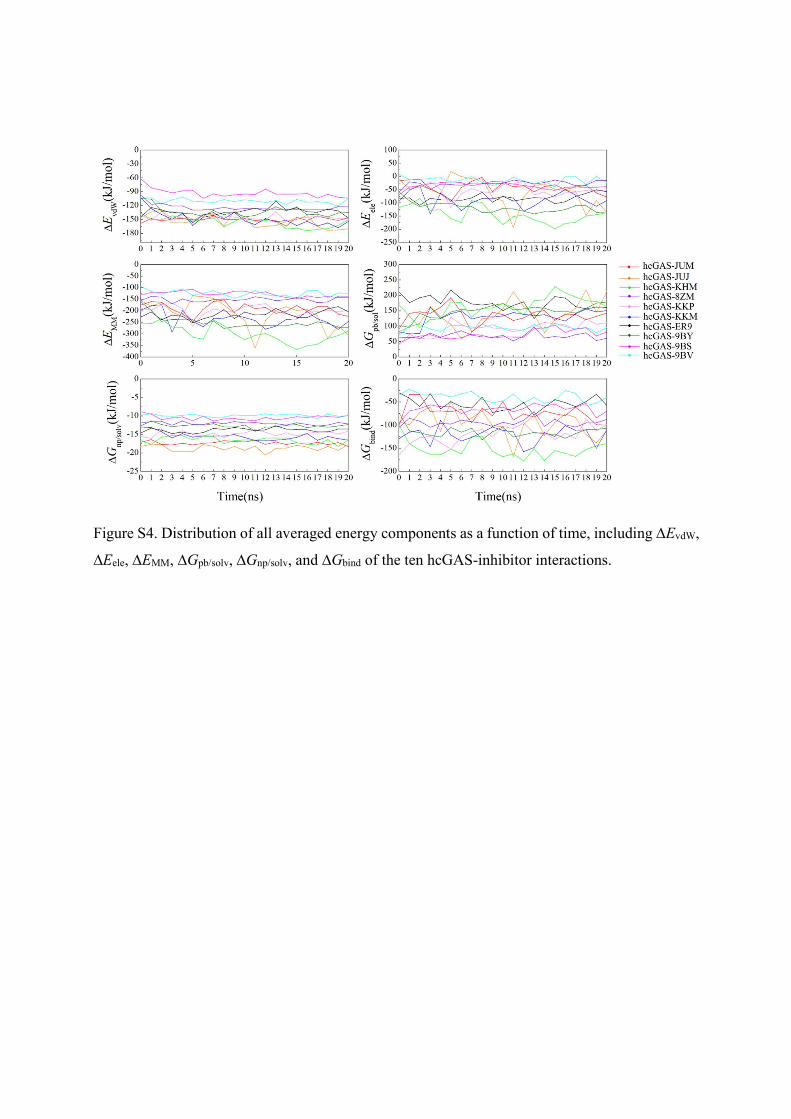
Figure S4. Distribution of all averaged energy components as a function of time, including ∆EvdW,
∆Eele, ∆EMM, ∆Gpb/solv, ∆Gnp/solv, and ∆Gbind of the ten hcGAS-inhibitor interactions.
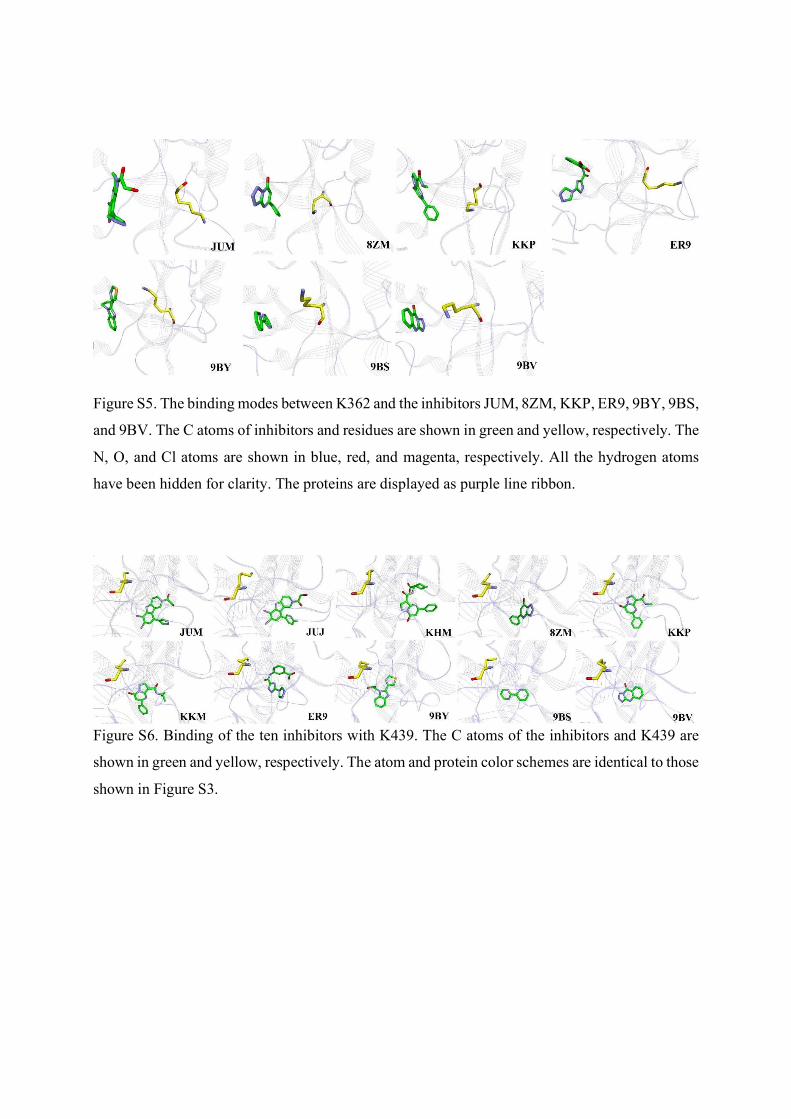
Figure S5. The binding modes between K362 and the inhibitors JUM, 8ZM, KKP, ER9, 9BY, 9BS,
and 9BV. The C atoms of inhibitors and residues are shown in green and yellow, respectively. The
N, O, and Cl atoms are shown in blue, red, and magenta, respectively. All the hydrogen atoms
have been hidden for clarity. The proteins are displayed as purple line ribbon.
Figure S6. Binding of the ten inhibitors with K439. The C atoms of the inhibitors and K439 are
shown in green and yellow, respectively. The atom and protein color schemes are identical to those
shown in Figure S3.
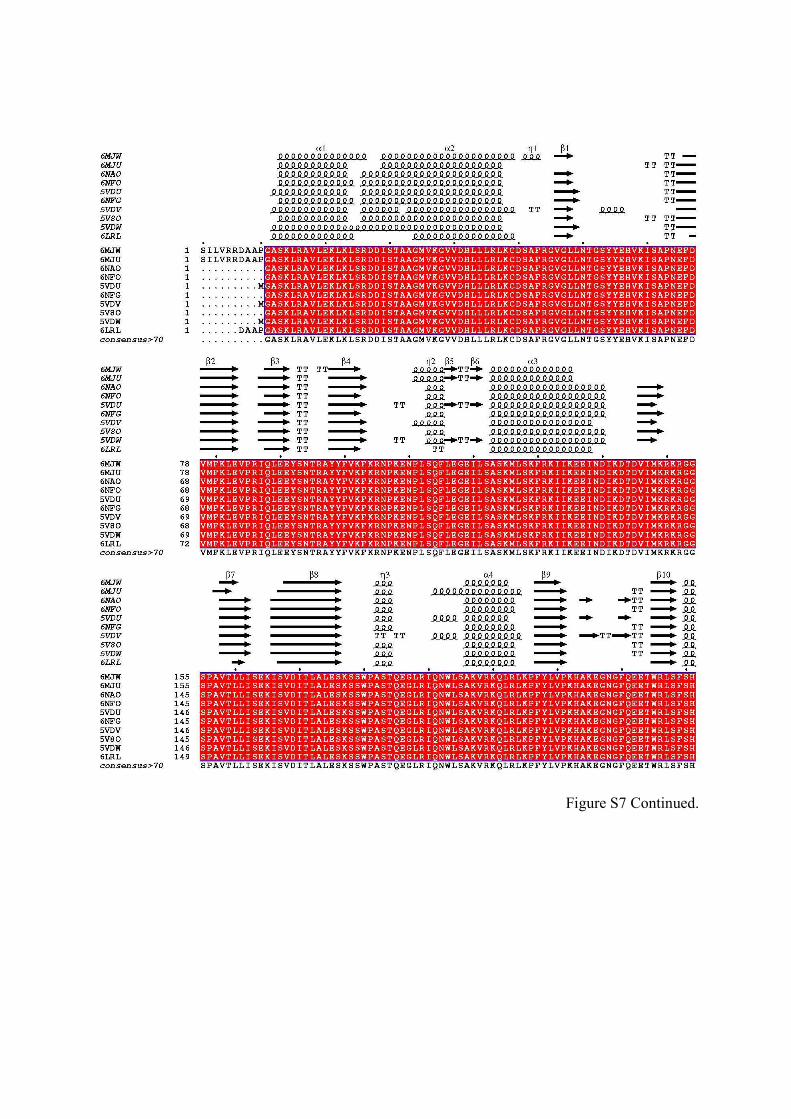
Figure S7 Continued.
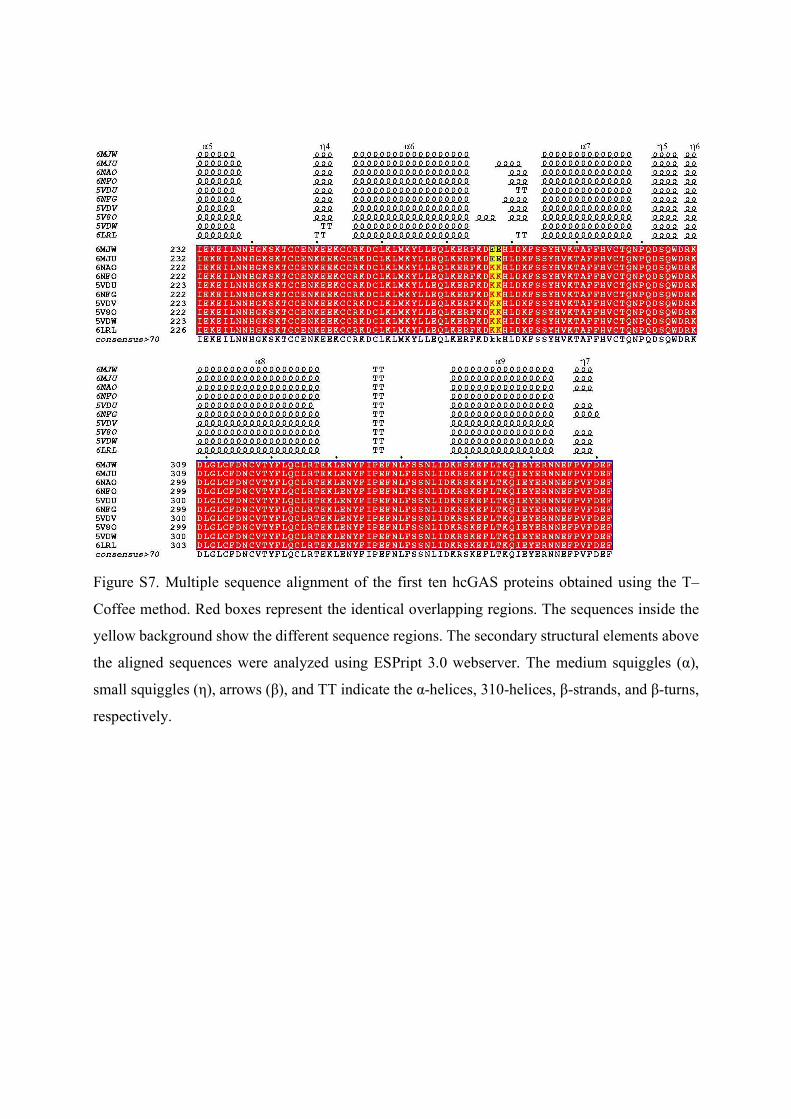
Figure S7. Multiple sequence alignment of the first ten hcGAS proteins obtained using the T–
Coffee method. Red boxes represent the identical overlapping regions. The sequences inside the
yellow background show the different sequence regions. The secondary structural elements above
the aligned sequences were analyzed using ESPript 3.0 webserver. The medium squiggles (α),
small squiggles (η), arrows (β), and TT indicate the α-helices, 310-helices, β-strands, and β-turns,
respectively.
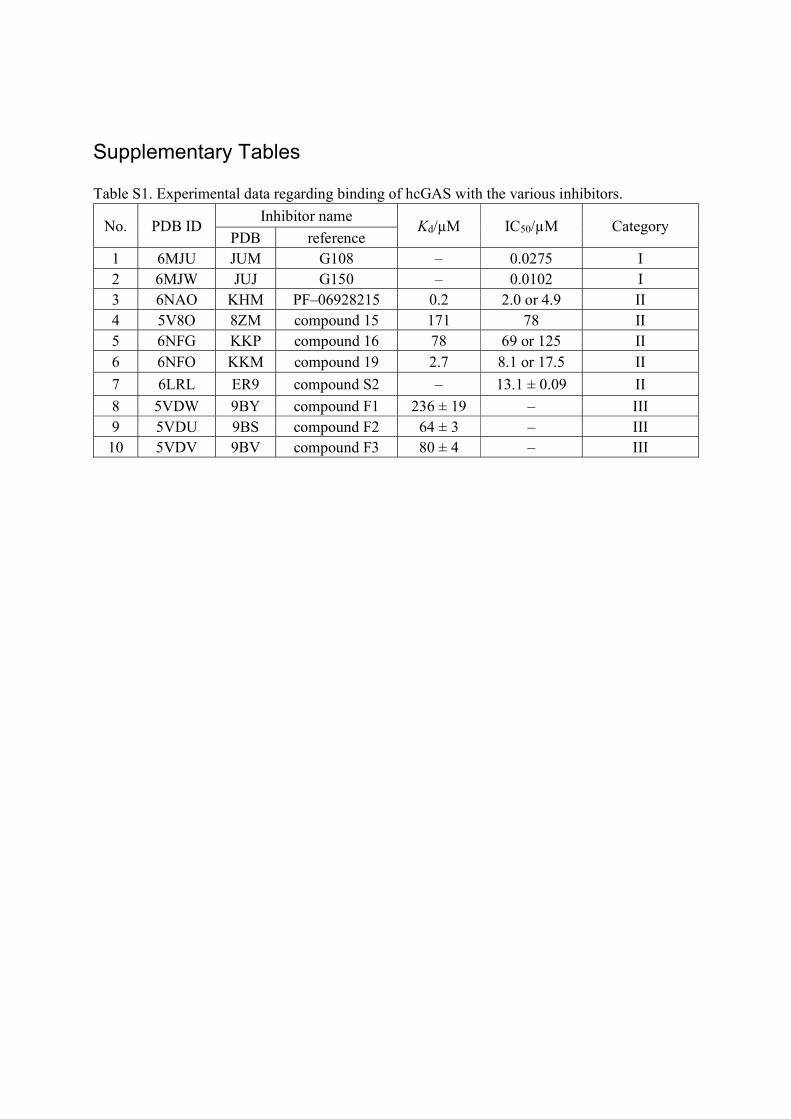
Supplementary Tables Table S1. Experimental data regarding binding of hcGAS with the various inhibitors.
No. PDB ID Inhibitor name
Kd/µM IC50/µM Category PDB reference
1 6MJU JUM G108 – 0.0275 I 2 6MJW JUJ G150 – 0.0102 I 3 6NAO KHM PF–06928215 0.2 2.0 or 4.9 II 4 5V8O 8ZM compound 15 171 78 II 5 6NFG KKP compound 16 78 69 or 125 II 6 6NFO KKM compound 19 2.7 8.1 or 17.5 II
7 6LRL ER9 compound S2 – 13.1 ± 0.09 II
8 5VDW 9BY compound F1 236 ± 19 – III 9 5VDU 9BS compound F2 64 ± 3 – III
10 5VDV 9BV compound F3 80 ± 4 – III
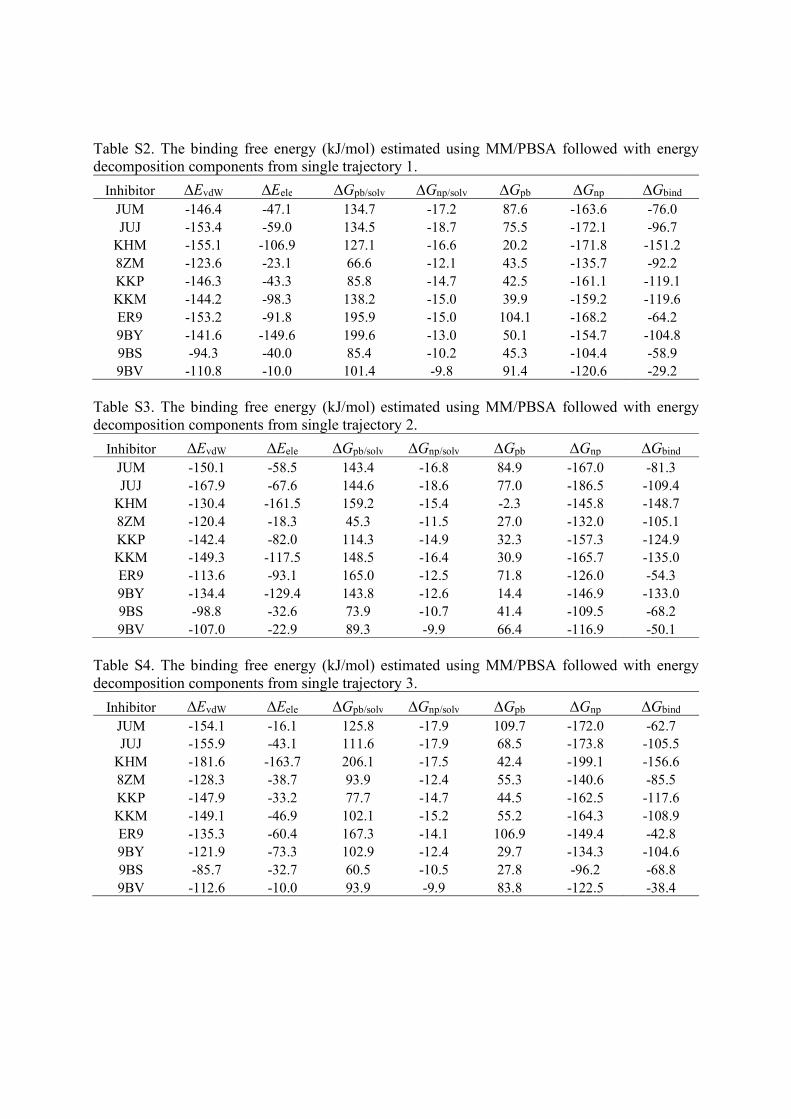
Table S2. The binding free energy (kJ/mol) estimated using MM/PBSA followed with energy decomposition components from single trajectory 1.
Inhibitor ∆EvdW ∆Eele ∆Gpb/solv ∆Gnp/solv ∆Gpb ∆Gnp ∆Gbind JUM -146.4 -47.1 134.7 -17.2 87.6 -163.6 -76.0 JUJ -153.4 -59.0 134.5 -18.7 75.5 -172.1 -96.7
KHM -155.1 -106.9 127.1 -16.6 20.2 -171.8 -151.2 8ZM -123.6 -23.1 66.6 -12.1 43.5 -135.7 -92.2 KKP -146.3 -43.3 85.8 -14.7 42.5 -161.1 -119.1 KKM -144.2 -98.3 138.2 -15.0 39.9 -159.2 -119.6 ER9 -153.2 -91.8 195.9 -15.0 104.1 -168.2 -64.2 9BY -141.6 -149.6 199.6 -13.0 50.1 -154.7 -104.8 9BS -94.3 -40.0 85.4 -10.2 45.3 -104.4 -58.9 9BV -110.8 -10.0 101.4 -9.8 91.4 -120.6 -29.2
Table S3. The binding free energy (kJ/mol) estimated using MM/PBSA followed with energy decomposition components from single trajectory 2.
Inhibitor ∆EvdW ∆Eele ∆Gpb/solv ∆Gnp/solv ∆Gpb ∆Gnp ∆Gbind JUM -150.1 -58.5 143.4 -16.8 84.9 -167.0 -81.3 JUJ -167.9 -67.6 144.6 -18.6 77.0 -186.5 -109.4
KHM -130.4 -161.5 159.2 -15.4 -2.3 -145.8 -148.7 8ZM -120.4 -18.3 45.3 -11.5 27.0 -132.0 -105.1 KKP -142.4 -82.0 114.3 -14.9 32.3 -157.3 -124.9 KKM -149.3 -117.5 148.5 -16.4 30.9 -165.7 -135.0 ER9 -113.6 -93.1 165.0 -12.5 71.8 -126.0 -54.3 9BY -134.4 -129.4 143.8 -12.6 14.4 -146.9 -133.0 9BS -98.8 -32.6 73.9 -10.7 41.4 -109.5 -68.2 9BV -107.0 -22.9 89.3 -9.9 66.4 -116.9 -50.1
Table S4. The binding free energy (kJ/mol) estimated using MM/PBSA followed with energy decomposition components from single trajectory 3.
Inhibitor ∆EvdW ∆Eele ∆Gpb/solv ∆Gnp/solv ∆Gpb ∆Gnp ∆Gbind JUM -154.1 -16.1 125.8 -17.9 109.7 -172.0 -62.7 JUJ -155.9 -43.1 111.6 -17.9 68.5 -173.8 -105.5
KHM -181.6 -163.7 206.1 -17.5 42.4 -199.1 -156.6 8ZM -128.3 -38.7 93.9 -12.4 55.3 -140.6 -85.5 KKP -147.9 -33.2 77.7 -14.7 44.5 -162.5 -117.6 KKM -149.1 -46.9 102.1 -15.2 55.2 -164.3 -108.9 ER9 -135.3 -60.4 167.3 -14.1 106.9 -149.4 -42.8 9BY -121.9 -73.3 102.9 -12.4 29.7 -134.3 -104.6 9BS -85.7 -32.7 60.5 -10.5 27.8 -96.2 -68.8 9BV -112.6 -10.0 93.9 -9.9 83.8 -122.5 -38.4
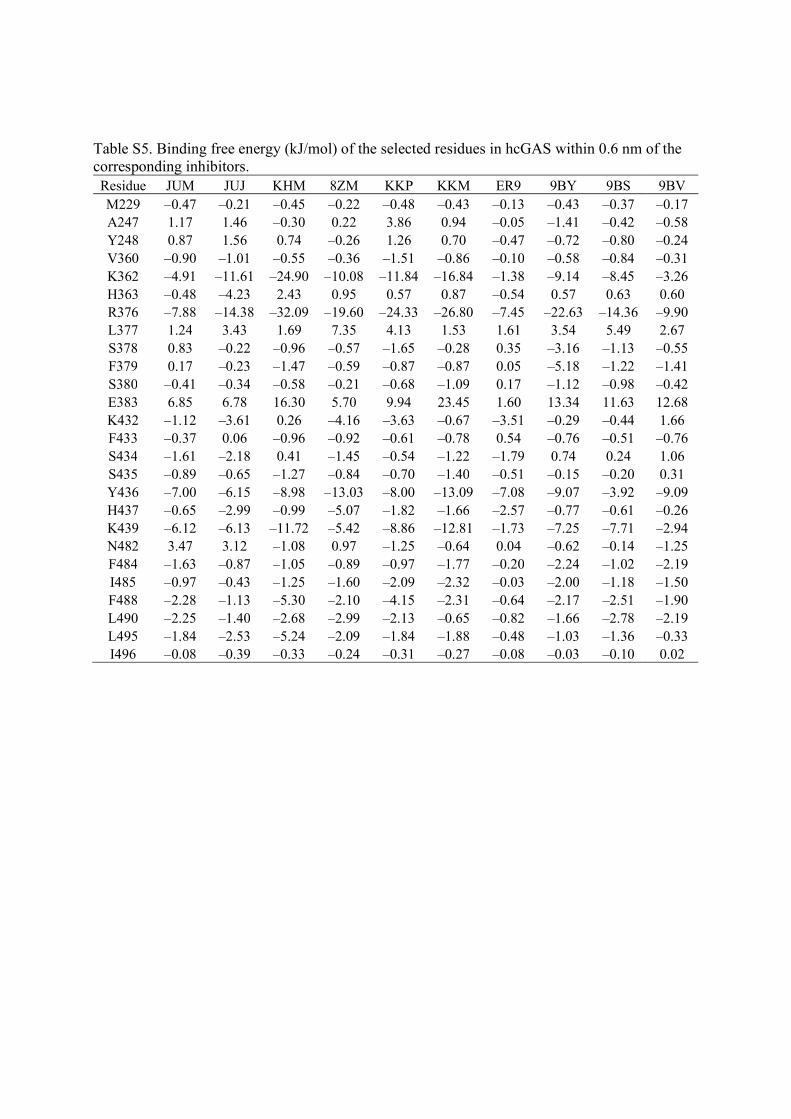
Table S5. Binding free energy (kJ/mol) of the selected residues in hcGAS within 0.6 nm of the corresponding inhibitors. Residue JUM JUJ KHM 8ZM KKP KKM ER9 9BY 9BS 9BV M229 –0.47 –0.21 –0.45 –0.22 –0.48 –0.43 –0.13 –0.43 –0.37 –0.17 A247 1.17 1.46 –0.30 0.22 3.86 0.94 –0.05 –1.41 –0.42 –0.58 Y248 0.87 1.56 0.74 –0.26 1.26 0.70 –0.47 –0.72 –0.80 –0.24 V360 –0.90 –1.01 –0.55 –0.36 –1.51 –0.86 –0.10 –0.58 –0.84 –0.31 K362 –4.91 –11.61 –24.90 –10.08 –11.84 –16.84 –1.38 –9.14 –8.45 –3.26 H363 –0.48 –4.23 2.43 0.95 0.57 0.87 –0.54 0.57 0.63 0.60 R376 –7.88 –14.38 –32.09 –19.60 –24.33 –26.80 –7.45 –22.63 –14.36 –9.90 L377 1.24 3.43 1.69 7.35 4.13 1.53 1.61 3.54 5.49 2.67 S378 0.83 –0.22 –0.96 –0.57 –1.65 –0.28 0.35 –3.16 –1.13 –0.55 F379 0.17 –0.23 –1.47 –0.59 –0.87 –0.87 0.05 –5.18 –1.22 –1.41 S380 –0.41 –0.34 –0.58 –0.21 –0.68 –1.09 0.17 –1.12 –0.98 –0.42 E383 6.85 6.78 16.30 5.70 9.94 23.45 1.60 13.34 11.63 12.68 K432 –1.12 –3.61 0.26 –4.16 –3.63 –0.67 –3.51 –0.29 –0.44 1.66 F433 –0.37 0.06 –0.96 –0.92 –0.61 –0.78 0.54 –0.76 –0.51 –0.76 S434 –1.61 –2.18 0.41 –1.45 –0.54 –1.22 –1.79 0.74 0.24 1.06 S435 –0.89 –0.65 –1.27 –0.84 –0.70 –1.40 –0.51 –0.15 –0.20 0.31 Y436 –7.00 –6.15 –8.98 –13.03 –8.00 –13.09 –7.08 –9.07 –3.92 –9.09 H437 –0.65 –2.99 –0.99 –5.07 –1.82 –1.66 –2.57 –0.77 –0.61 –0.26 K439 –6.12 –6.13 –11.72 –5.42 –8.86 –12.81 –1.73 –7.25 –7.71 –2.94 N482 3.47 3.12 –1.08 0.97 –1.25 –0.64 0.04 –0.62 –0.14 –1.25 F484 –1.63 –0.87 –1.05 –0.89 –0.97 –1.77 –0.20 –2.24 –1.02 –2.19 I485 –0.97 –0.43 –1.25 –1.60 –2.09 –2.32 –0.03 –2.00 –1.18 –1.50 F488 –2.28 –1.13 –5.30 –2.10 –4.15 –2.31 –0.64 –2.17 –2.51 –1.90 L490 –2.25 –1.40 –2.68 –2.99 –2.13 –0.65 –0.82 –1.66 –2.78 –2.19 L495 –1.84 –2.53 –5.24 –2.09 –1.84 –1.88 –0.48 –1.03 –1.36 –0.33 I496 –0.08 –0.39 –0.33 –0.24 –0.31 –0.27 –0.08 –0.03 –0.10 0.02
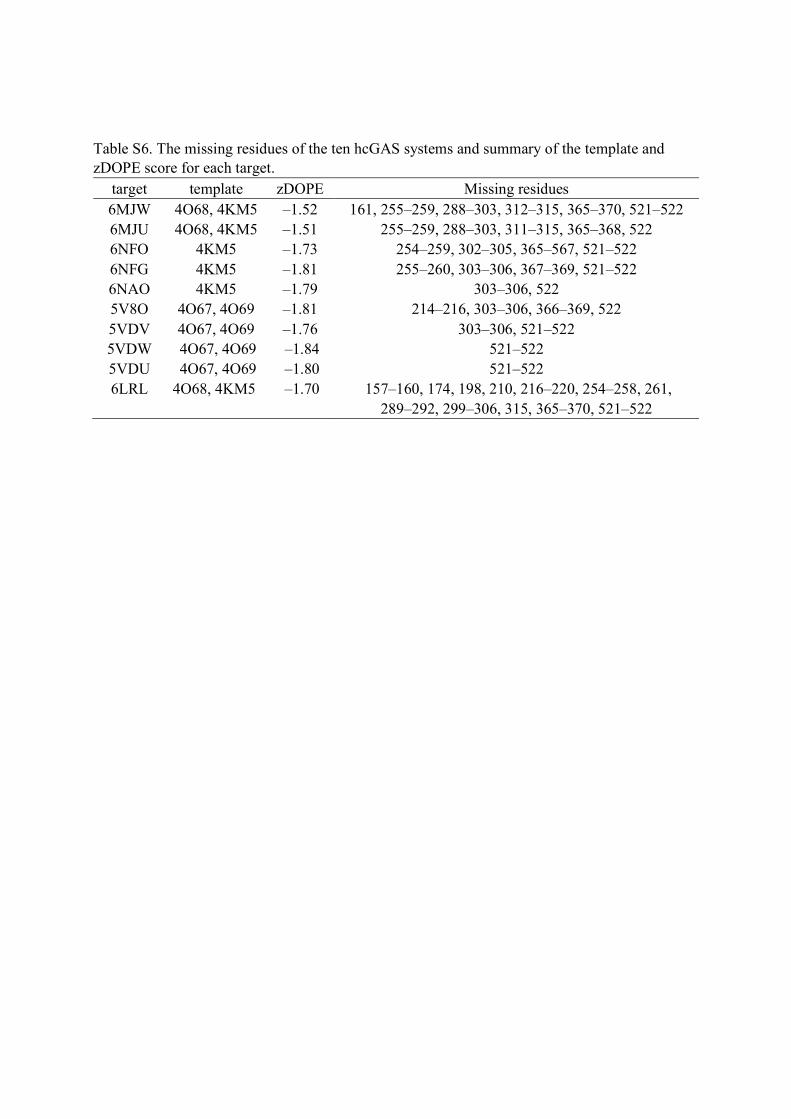
Table S6. The missing residues of the ten hcGAS systems and summary of the template and zDOPE score for each target.
target template zDOPE Missing residues 6MJW 4O68, 4KM5 ‒1.52 161, 255‒259, 288‒303, 312–315, 365‒370, 521‒522 6MJU 4O68, 4KM5 ‒1.51 255‒259, 288‒303, 311‒315, 365‒368, 522 6NFO 4KM5 ‒1.73 254‒259, 302‒305, 365‒567, 521‒522 6NFG 4KM5 ‒1.81 255‒260, 303‒306, 367‒369, 521‒522 6NAO 4KM5 ‒1.79 303‒306, 522 5V8O 4O67, 4O69 ‒1.81 214‒216, 303‒306, 366‒369, 522 5VDV 4O67, 4O69 ‒1.76 303‒306, 521‒522 5VDW 4O67, 4O69 ‒1.84 521‒522 5VDU 4O67, 4O69 ‒1.80 521‒522 6LRL 4O68, 4KM5 ‒1.70 157‒160, 174, 198, 210, 216‒220, 254‒258, 261,
289‒292, 299‒306, 315, 365‒370, 521‒522