Embed Size (px)
Citation preview
SUPPLEMENTARY INFORMATION
Assessment of Fine Particles Released During Paper Printing and Shredding Processes
Nara Shina, Kalpana Velmuruganb, Cathy Sua, Alison K. Bauerb, Candace Su-Jung Tsaia**
a Department of Environmental and Radiological Health Sciences, College of Veterinary
Medicine and Biomedical Sciences, Colorado State University, Fort Collins, CO, 80528
b Department of Environmental and Occupational Health, Colorado School of Public Health,
University of Colorado Anschutz Medical Campus, Aurora, CO, 80045
Corresponding author:
**Prof. Candace S.J. Tsai
Department of Environmental and Radiological Health Sciences, College of Veterinary Medicine
and Biomedical Sciences, Colorado State University, Fort Collins, CO, 80528
Address: 1681 Campus Delivery, Fort Collins, CO 80523-1681
Email: [email protected]
P +1 (970) 191-1340
F +1 (970) 491-2940
Submitted to: Environmental Science: Processes & Impacts
Keywords: particle release, printer, shredding, airborne particle, metal, inhalation, nanoparticle
Total words:
Electronic Supplementary Material (ESI) for Environmental Science: Processes & Impacts.This journal is © The Royal Society of Chemistry 2019
Table of Contents
Table S1. ICP-MS individual sample results for printed and plain paper particle mixed media
Table S2. Average particle concentrations of one-half fractions of each experiment during shredding only
by particle size
Figure S1. Real time instrument (RTI) data of printer particle release tests from running 1,000 plain paper
sheets and printing 1,000 sheets. (a) Particle size distribution for running 1,000 plain sheets, as
determined by OPS (0.3–10 m). (b) Particle size distribution for printing 1,000 sheets, as
determined by OPS.
Figure S2. Microscopic analysis (SEM/TEM/EDS) of printer emitted particles. Various shapes of
particles were observed.
Figure S3. Printer released particle analysis via EDS, showing granules attached in one particle,
as determined using TDS.
Figure S4. Paper particles observed from the shredding process. Various shapes of particles were
observed through TEM.
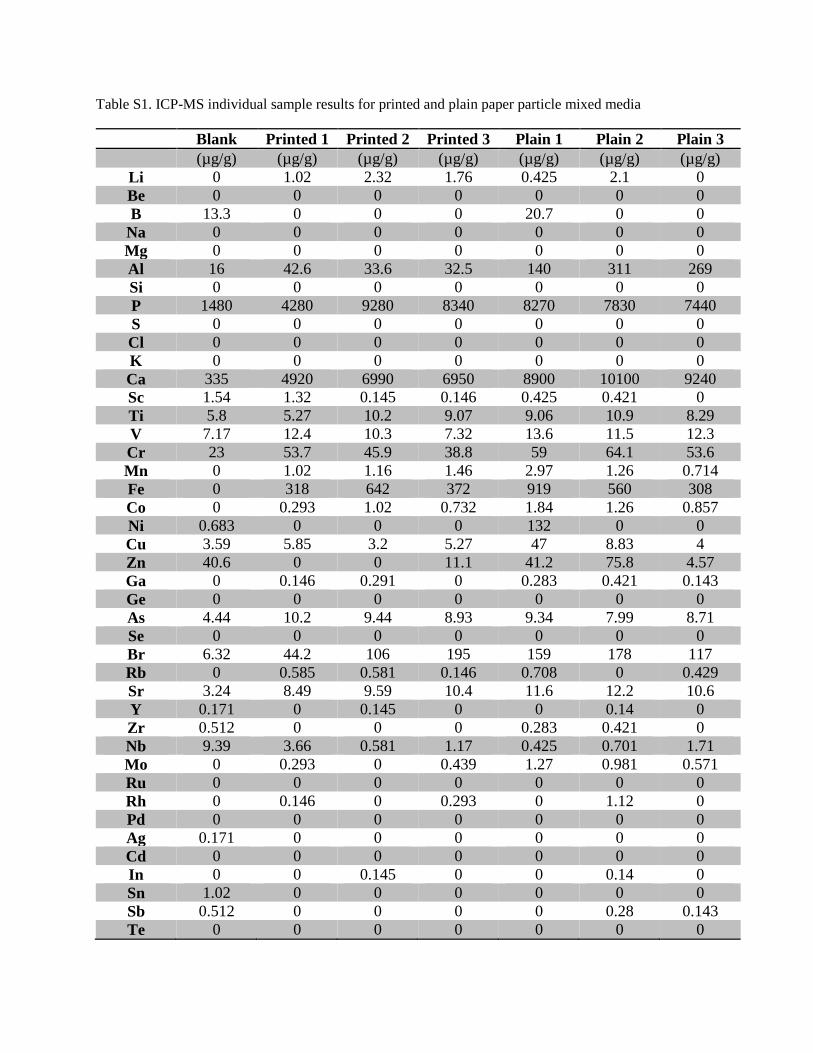
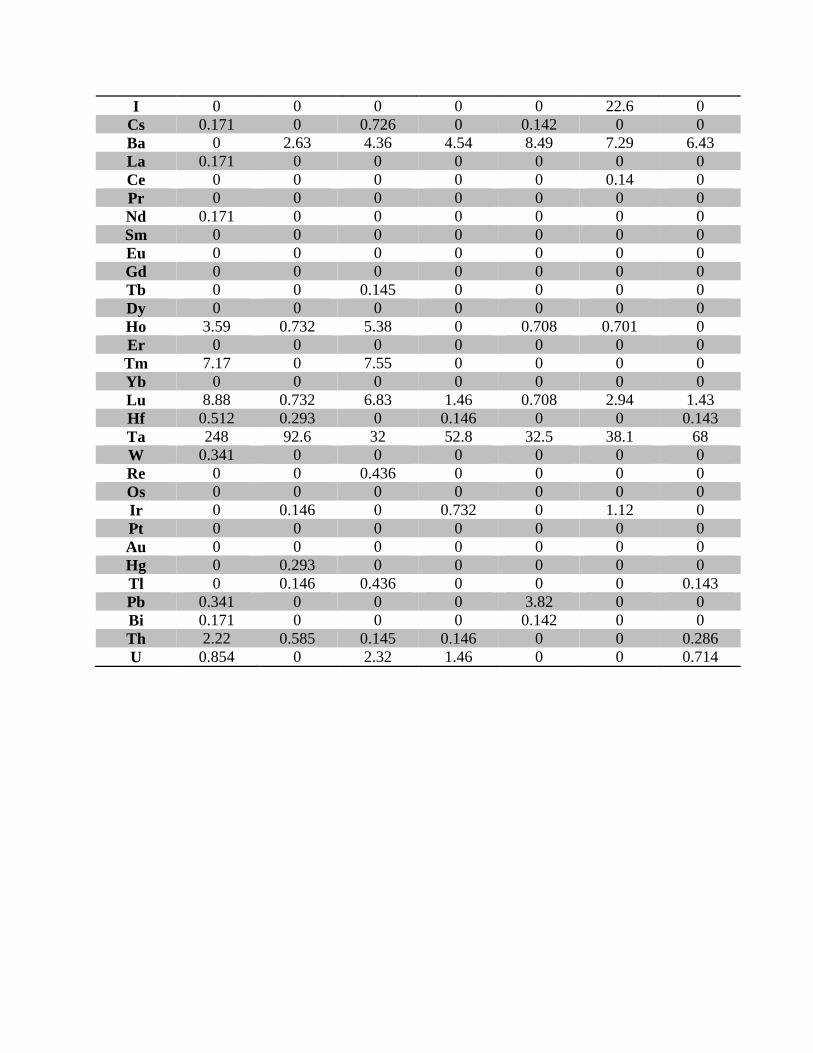
Table S1. ICP-MS individual sample results for printed and plain paper particle mixed media
Blank Printed 1 Printed 2 Printed 3 Plain 1 Plain 2 Plain 3
(µg/g) (µg/g) (µg/g) (µg/g) (µg/g) (µg/g) (µg/g)
Li 0 1.02 2.32 1.76 0.425 2.1 0
Be 0 0 0 0 0 0 0
B 13.3 0 0 0 20.7 0 0
Na 0 0 0 0 0 0 0
Mg 0 0 0 0 0 0 0
Al 16 42.6 33.6 32.5 140 311 269
Si 0 0 0 0 0 0 0
P 1480 4280 9280 8340 8270 7830 7440
S 0 0 0 0 0 0 0
Cl 0 0 0 0 0 0 0
K 0 0 0 0 0 0 0
Ca 335 4920 6990 6950 8900 10100 9240
Sc 1.54 1.32 0.145 0.146 0.425 0.421 0
Ti 5.8 5.27 10.2 9.07 9.06 10.9 8.29
V 7.17 12.4 10.3 7.32 13.6 11.5 12.3
Cr 23 53.7 45.9 38.8 59 64.1 53.6
Mn 0 1.02 1.16 1.46 2.97 1.26 0.714
Fe 0 318 642 372 919 560 308
Co 0 0.293 1.02 0.732 1.84 1.26 0.857
Ni 0.683 0 0 0 132 0 0
Cu 3.59 5.85 3.2 5.27 47 8.83 4
Zn 40.6 0 0 11.1 41.2 75.8 4.57
Ga 0 0.146 0.291 0 0.283 0.421 0.143
Ge 0 0 0 0 0 0 0
As 4.44 10.2 9.44 8.93 9.34 7.99 8.71
Se 0 0 0 0 0 0 0
Br 6.32 44.2 106 195 159 178 117
Rb 0 0.585 0.581 0.146 0.708 0 0.429
Sr 3.24 8.49 9.59 10.4 11.6 12.2 10.6
Y 0.171 0 0.145 0 0 0.14 0
Zr 0.512 0 0 0 0.283 0.421 0
Nb 9.39 3.66 0.581 1.17 0.425 0.701 1.71
Mo 0 0.293 0 0.439 1.27 0.981 0.571
Ru 0 0 0 0 0 0 0
Rh 0 0.146 0 0.293 0 1.12 0
Pd 0 0 0 0 0 0 0
Ag 0.171 0 0 0 0 0 0
Cd 0 0 0 0 0 0 0
In 0 0 0.145 0 0 0.14 0
Sn 1.02 0 0 0 0 0 0
Sb 0.512 0 0 0 0 0.28 0.143
Te 0 0 0 0 0 0 0
I 0 0 0 0 0 22.6 0
Cs 0.171 0 0.726 0 0.142 0 0
Ba 0 2.63 4.36 4.54 8.49 7.29 6.43
La 0.171 0 0 0 0 0 0
Ce 0 0 0 0 0 0.14 0
Pr 0 0 0 0 0 0 0
Nd 0.171 0 0 0 0 0 0
Sm 0 0 0 0 0 0 0
Eu 0 0 0 0 0 0 0
Gd 0 0 0 0 0 0 0
Tb 0 0 0.145 0 0 0 0
Dy 0 0 0 0 0 0 0
Ho 3.59 0.732 5.38 0 0.708 0.701 0
Er 0 0 0 0 0 0 0
Tm 7.17 0 7.55 0 0 0 0
Yb 0 0 0 0 0 0 0
Lu 8.88 0.732 6.83 1.46 0.708 2.94 1.43
Hf 0.512 0.293 0 0.146 0 0 0.143
Ta 248 92.6 32 52.8 32.5 38.1 68
W 0.341 0 0 0 0 0 0
Re 0 0 0.436 0 0 0 0
Os 0 0 0 0 0 0 0
Ir 0 0.146 0 0.732 0 1.12 0
Pt 0 0 0 0 0 0 0
Au 0 0 0 0 0 0 0
Hg 0 0.293 0 0 0 0 0
Tl 0 0.146 0.436 0 0 0 0.143
Pb 0.341 0 0 0 3.82 0 0
Bi 0.171 0 0 0 0.142 0 0
Th 2.22 0.585 0.145 0.146 0 0 0.286
U 0.854 0 2.32 1.46 0 0 0.714
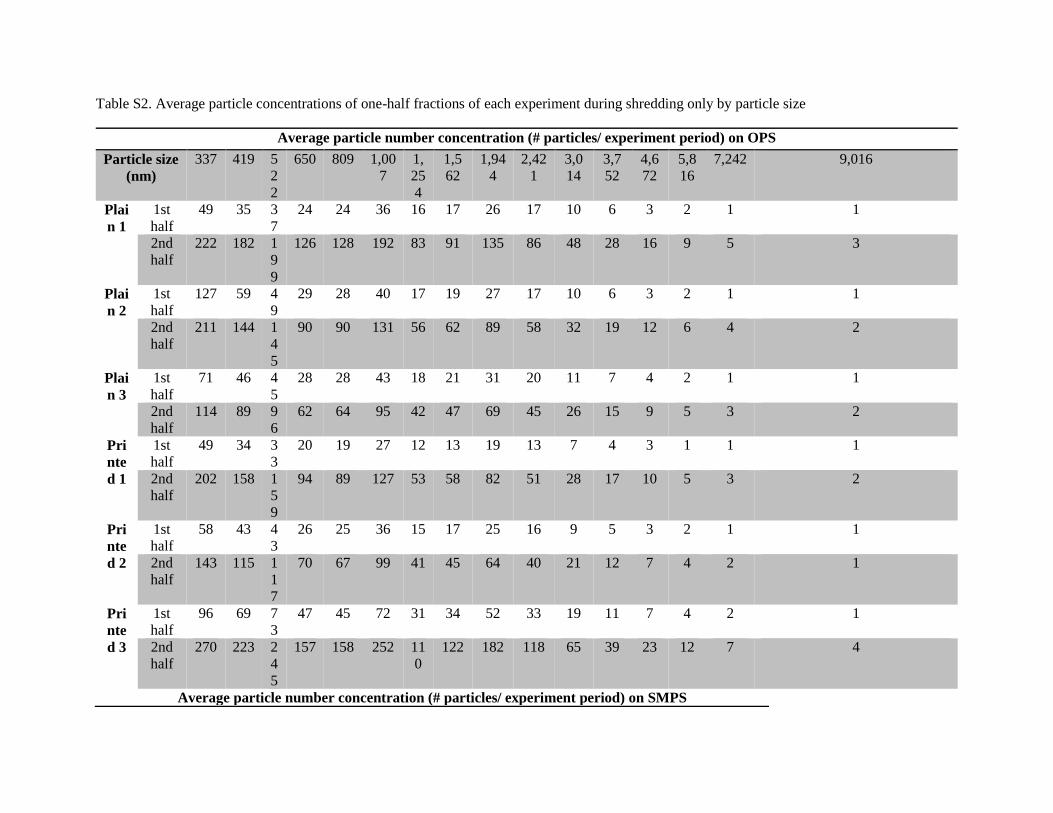
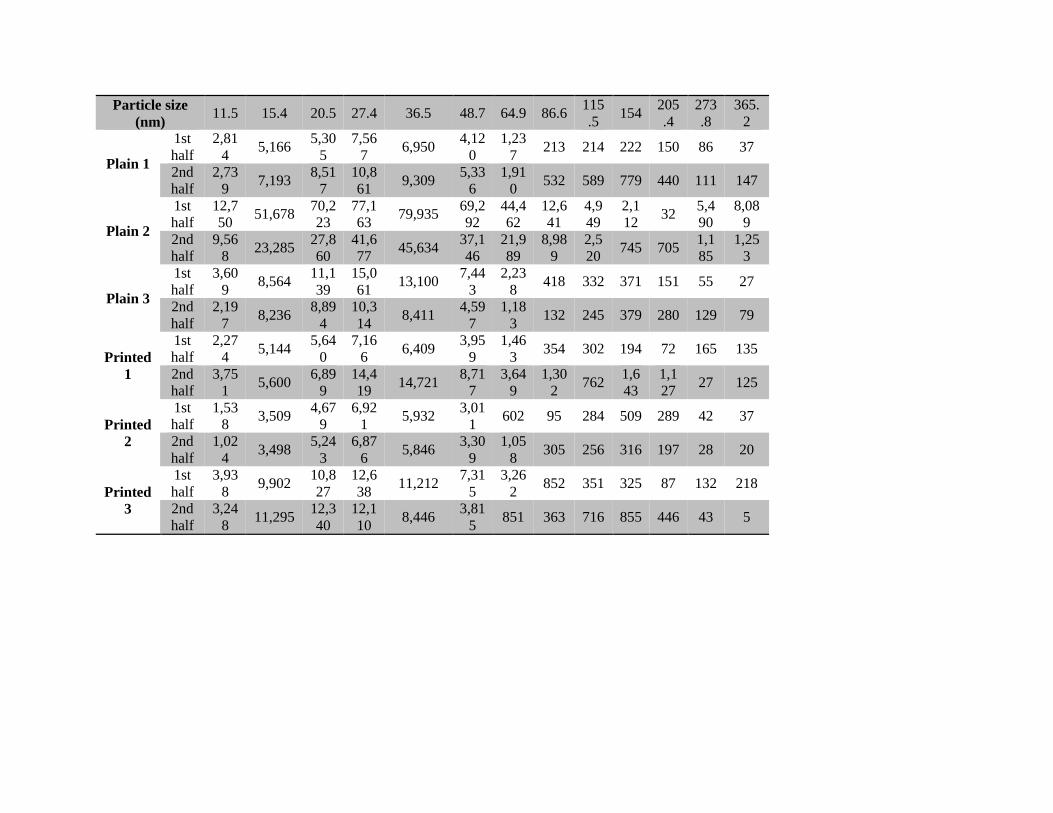
Table S2. Average particle concentrations of one-half fractions of each experiment during shredding only by particle size
Average particle number concentration (# particles/ experiment period) on OPS
Particle size
(nm)
337 419 5
2
2
650 809 1,00
7
1,
25
4
1,5
62
1,94
4
2,42
1
3,0
14
3,7
52
4,6
72
5,8
16
7,242 9,016
Plai
n 1
1st
half
49 35 3
7
24 24 36 16 17 26 17 10 6 3 2 1 1
2nd
half
222 182 1
9
9
126 128 192 83 91 135 86 48 28 16 9 5 3
Plai
n 2
1st
half
127 59 4
9
29 28 40 17 19 27 17 10 6 3 2 1 1
2nd
half
211 144 1
4
5
90 90 131 56 62 89 58 32 19 12 6 4 2
Plai
n 3
1st
half
71 46 4
5
28 28 43 18 21 31 20 11 7 4 2 1 1
2nd
half
114 89 9
6
62 64 95 42 47 69 45 26 15 9 5 3 2
Pri
nte
d 1
1st
half
49 34 3
3
20 19 27 12 13 19 13 7 4 3 1 1 1
2nd
half
202 158 1
5
9
94 89 127 53 58 82 51 28 17 10 5 3 2
Pri
nte
d 2
1st
half
58 43 4
3
26 25 36 15 17 25 16 9 5 3 2 1 1
2nd
half
143 115 1
1
7
70 67 99 41 45 64 40 21 12 7 4 2 1
Pri
nte
d 3
1st
half
96 69 7
3
47 45 72 31 34 52 33 19 11 7 4 2 1
2nd
half
270 223 2
4
5
157 158 252 11
0
122 182 118 65 39 23 12 7 4
Average particle number concentration (# particles/ experiment period) on SMPS
Particle size
(nm) 11.5 15.4 20.5 27.4 36.5 48.7 64.9 86.6
115
.5 154
205
.4
273
.8
365.
2
Plain 1
1st
half
2,81
4 5,166
5,30
5
7,56
7 6,950
4,12
0
1,23
7 213 214 222 150 86 37
2nd
half
2,73
9 7,193
8,51
7
10,8
61 9,309
5,33
6
1,91
0 532 589 779 440 111 147
Plain 2
1st
half
12,7
50 51,678
70,2
23
77,1
63 79,935
69,2
92
44,4
62
12,6
41
4,9
49
2,1
12 32
5,4
90
8,08
9
2nd
half
9,56
8 23,285
27,8
60
41,6
77 45,634
37,1
46
21,9
89
8,98
9
2,5
20 745 705
1,1
85
1,25
3
Plain 3
1st
half
3,60
9 8,564
11,1
39
15,0
61 13,100
7,44
3
2,23
8 418 332 371 151 55 27
2nd
half
2,19
7 8,236
8,89
4
10,3
14 8,411
4,59
7
1,18
3 132 245 379 280 129 79
Printed
1
1st
half
2,27
4 5,144
5,64
0
7,16
6 6,409
3,95
9
1,46
3 354 302 194 72 165 135
2nd
half
3,75
1 5,600
6,89
9
14,4
19 14,721
8,71
7
3,64
9
1,30
2 762
1,6
43
1,1
27 27 125
Printed
2
1st
half
1,53
8 3,509
4,67
9
6,92
1 5,932
3,01
1 602 95 284 509 289 42 37
2nd
half
1,02
4 3,498
5,24
3
6,87
6 5,846
3,30
9
1,05
8 305 256 316 197 28 20
Printed
3
1st
half
3,93
8 9,902
10,8
27
12,6
38 11,212
7,31
5
3,26
2 852 351 325 87 132 218
2nd
half
3,24
8 11,295
12,3
40
12,1
10 8,446
3,81
5 851 363 716 855 446 43 5
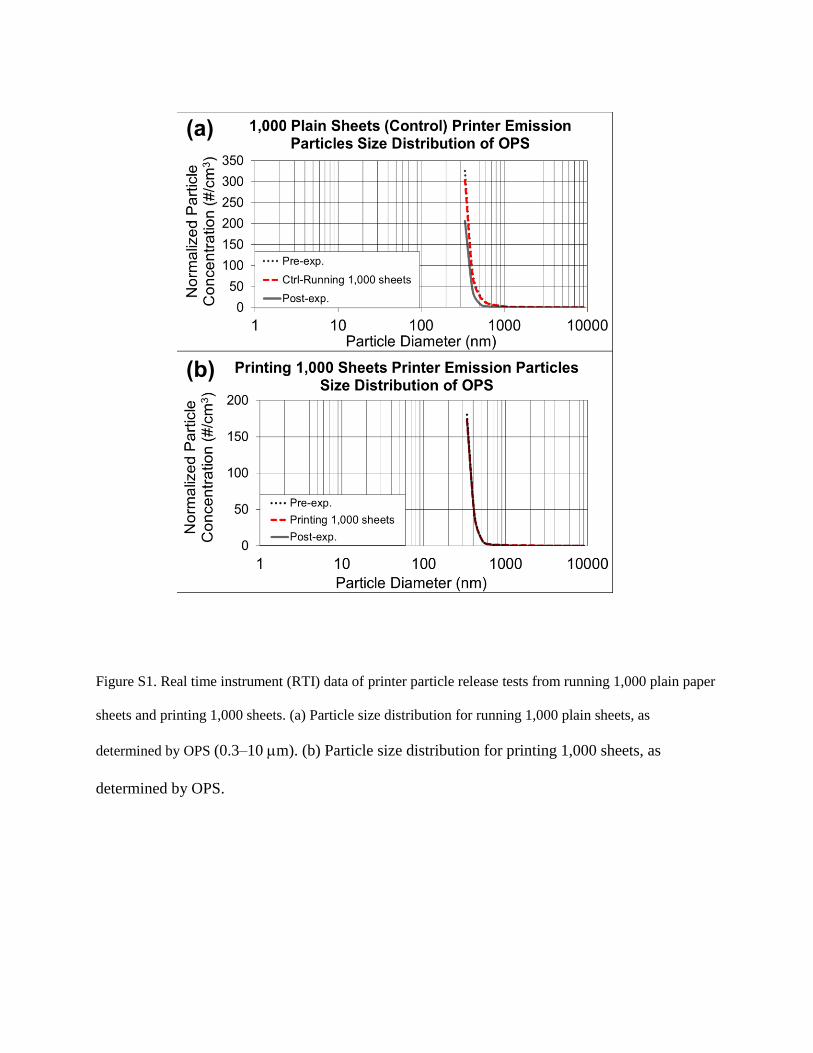
Figure S1. Real time instrument (RTI) data of printer particle release tests from running 1,000 plain paper
sheets and printing 1,000 sheets. (a) Particle size distribution for running 1,000 plain sheets, as
determined by OPS (0.3–10 m). (b) Particle size distribution for printing 1,000 sheets, as
determined by OPS.
(a)
(b)
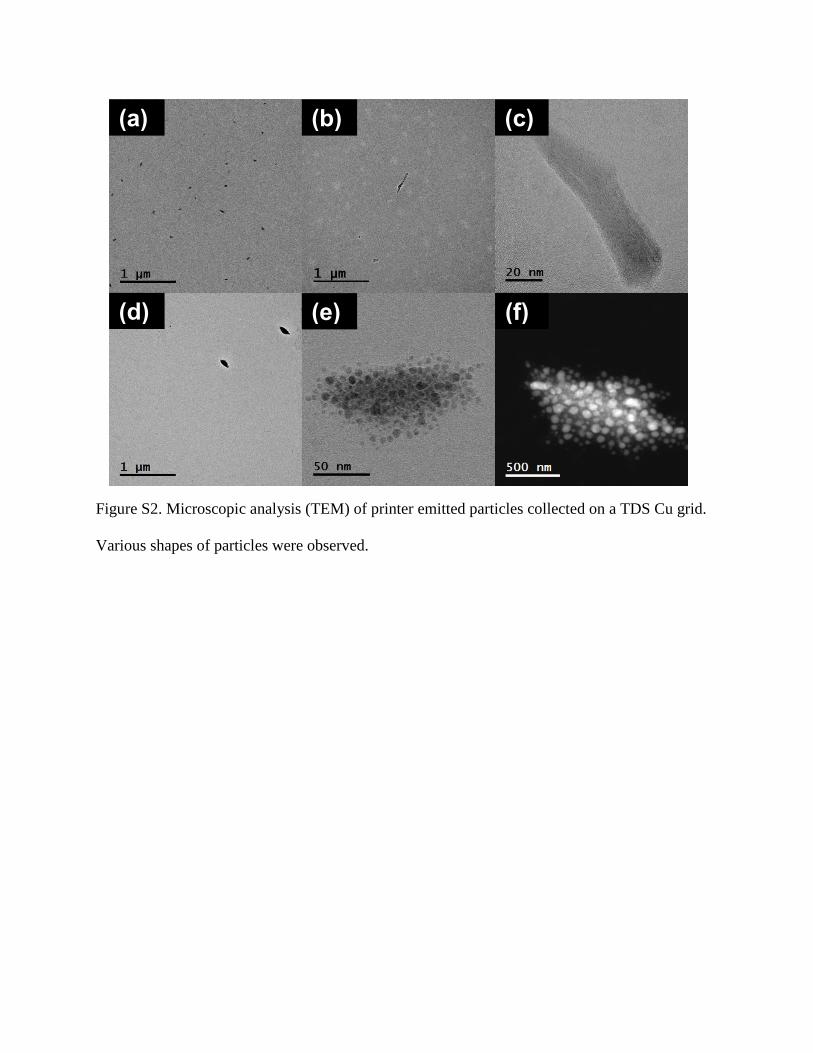
Figure S2. Microscopic analysis (TEM) of printer emitted particles collected on a TDS Cu grid.
Various shapes of particles were observed.
(c) (a) (b)
(d) (e) (f)
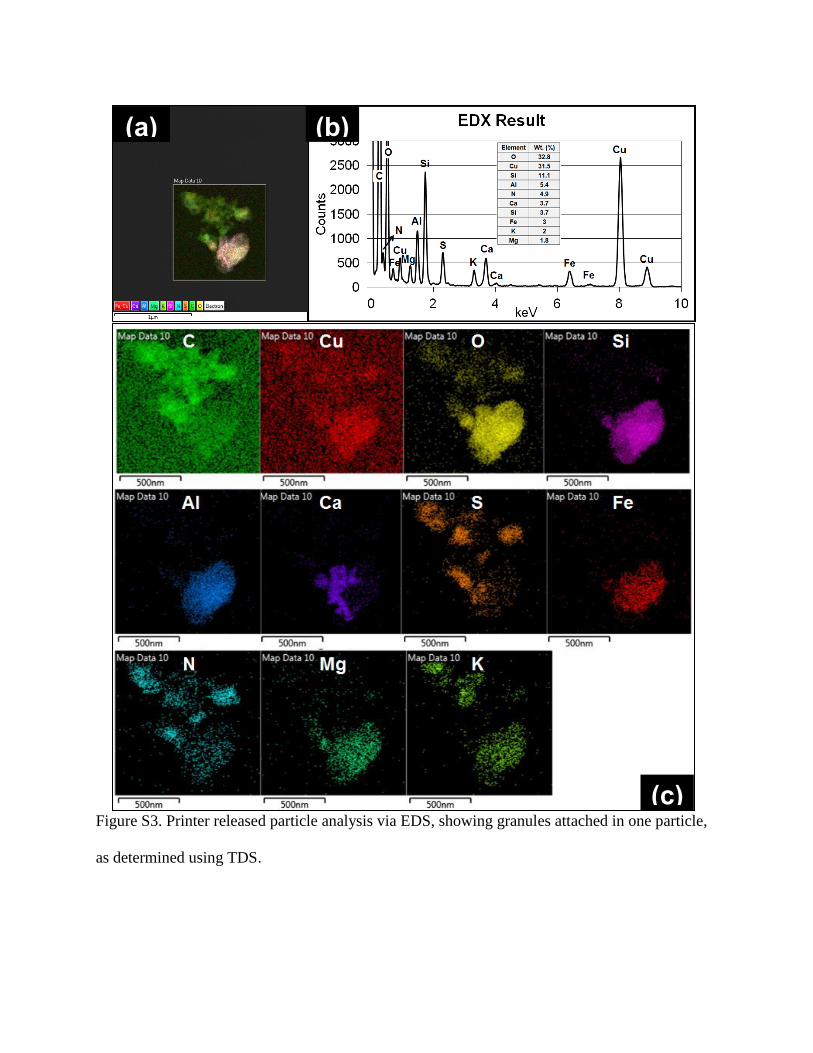
Figure S3. Printer released particle analysis via EDS, showing granules attached in one particle,
as determined using TDS.
(a) (b)
(c)
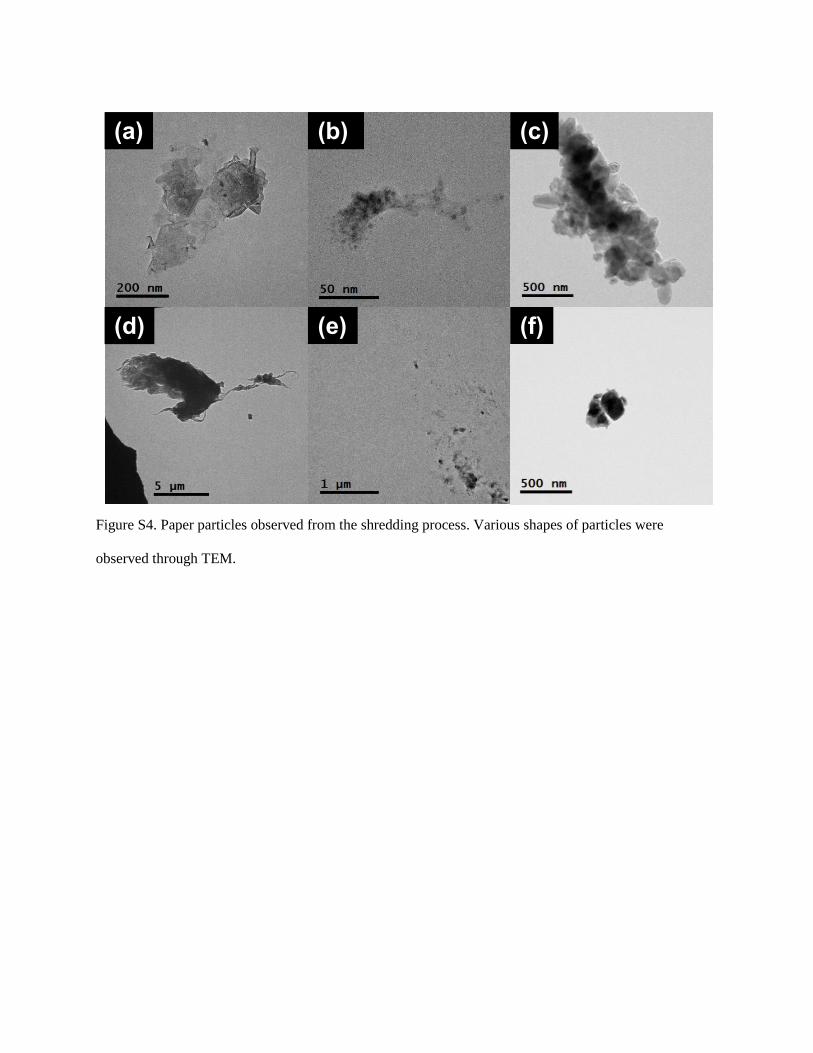
Figure S4. Paper particles observed from the shredding process. Various shapes of particles were
observed through TEM.
(a) (b) (c)
(d) (e) (f)


