Embed Size (px)
Citation preview

Seediscussions,stats,andauthorprofilesforthispublicationat:https://www.researchgate.net/publication/269400584
Supplementarymaterialsto"StrictreactionandsubstratespecificityofAGXT2L1,thehumanO-phosphoethanolaminephospho-lyase"
DATASET·DECEMBER2014
READS
16
4AUTHORS,INCLUDING:
DavideSchiroli
UlsterUniversity
6PUBLICATIONS10CITATIONS
SEEPROFILE
SimonaCirrincione
UniversitàdegliStudidiTorino
5PUBLICATIONS7CITATIONS
SEEPROFILE
AlessioPeracchi
UniversitàdeglistudidiParma
53PUBLICATIONS1,727CITATIONS
SEEPROFILE
Availablefrom:AlessioPeracchi
Retrievedon:03February2016

Schiroli et al., Supporting Information
1
MATERIALS AND METHODS
Materials
Recombinant AGXT2L1 was prepared as described (1). Yeast alcohol
dehydrogenase (ADH) and Bacillus subtilis L-alanine dehydrogenase were from Sigma,
rabbit muscle lactate dehydrogenase (LDH) was from Fluka. Ciliatine was from Wako
Chemicals. Glycerophosphoethanolamine was a kind gift from Euticals (Lodi, Italy). O-
phospho-L-homoserine was prepared enzymatically (2). All other reagents were from
Fluka or Sigma-Aldrich.
Enzymatic assays
Solutions for the PEA phospho-lyase assay (200 l final volume) contained 25 mM
buffer (triethanolamine or MES) at the desired pH value, 100 mM KCl, 0.8 mM EGTA, 5
M PLP, 0.5 mg/ml bovine serum albumin (BSA), 0.2 mM NADH, 50 units/ml ADH, in
addition to AGXT2L1 (typically 0,5 M) and PEA. Reactions were conducted at 30°C, and
the rate of acetaldehyde formation was measured by monitoring spectrophotometrically
the coupled disappearance of NADH at 340 nm. Nonlinear least-squares fittings of the
data were performed using Sigma Plot (SPSS Inc.).
Tests for 1,2-elimination reactions involving PEA analogs such as O-
sulfoethanolamine (SEA) were conducted as above, except that the analogs were used in
place of PEA.
To test the possible phospho-lyase activity of AGXT2L1 towards O-phospho-L-
serine, O-phospho-L-threonine or O-phospho-L-homoserine, we assessed formation of the
predicted carbonyl products (pyruvate or -ketobutyrate) by a coupled assay with LDH (2).
The reaction mixture contained 25 mM triethanolamine (pH 8, 30ºC), 100 mM KCl, 5 M

Schiroli et al., Supporting Information
2
PLP, 0.5 mg/ml BSA, 0.2 mM NADH, 50 units/ml LDH, in addition to AGXT2L1 (3 M) and
the phosphorylated amino acid.
The amine-pyruvate transaminase reactions, leading to the formation of alanine,
were tested by a discontinuous assay based on the use of L-alanine dehydrogenase (3).
AGXT2L1 (16 M) was incubated with the amino-donor compound (e.g., hypotaurine 20
mM) and pyruvate (20 mM) in 50 mM triethanolamine buffer, pH 8, 30ºC. Total initial
volume was 200 l. Aliquots (50 l each) were collected at appropriate intervals over a six-
hour period. Further reaction in each aliquot was stopped by mixing with 2.5 l of a
hydrazine (10 M)/EDTA (14 mM) solution; samples were also heated at 95 °C for 5 min to
completely inactivate the enzyme. Each aliquot was subsequently mixed with 50 µl of a
solution containing 100 mM sodium carbonate (pH 10), L-alanine dehydrogenase (1.26
unit), and NAD+ (0.25 mM) and incubated at 25 °C for 30 min, until an end-point was
reached. Finally, absorption spectra in the 340 nm region were taken to quantitate the
extent of NADH formation and hence the concentration of L-alanine in the initial aliquot.
Spectrophotometric measurements
To monitor the interaction of AGXT2L1 with amino compounds (potential substrates
or inhibitors), solutions containing the enzyme (9 M) in 25 mM bis-tris propane (BTP)
buffer, pH 8, 20 ºC, were supplemented with the compound under examination (typically, 5
mM). Changes in the PLP absorption were monitored using a Cary 400 spectrophotometer
(Varian).
The setup for measuring the kinetics of half-transamination reactions was as above,
except that triethanolamine buffer (pH 8) was used and the temperature was 30 °C.
Spectra were collected at regular intervals after mixing the enzyme with the ligand.

Schiroli et al., Supporting Information
3
pH
6 7 8 9
kcat/K
M (
M-1
s-1
)
0.1
1
10
100
1000
10000
PEA
SEA
Supplementary Figure 1 – pH dependence of ( ⁄ ) (circles) and ( ⁄ ) (triangles). Kinetics were measured as described in the Methods, in triethanolamine (blue
datapoints) or MES buffer (red datapoints). Note that the pH dependence of ( ⁄ )
was almost entirely dictated by changes in , as
changed little in the explored pH range (data not shown). The solid line through the PEA data is a least-squares fitting to an
equation that assumes the dependence of ( ⁄ ) on the ionization of two groups (4): one group with apparent pKa=6.9 ± 0.5 and another with apparent pKa=8.9 ± 0.4. Absence of the alkaline limb of the dependence for the SEA data suggests that one of the two groups might be a general acid involved in activation of the substrate leaving group.

Schiroli et al., Supporting Information
4
Wavelength (nm)
300 400 500
Ab
so
rban
ce
0.00
0.02
0.04
0.06
0.08
20 min
no PEA
1.5 min
Supplementary Figure 2 –Changes in the UV-visible spectrum accompanying the
reaction of AGXT2L1 (9 M) with PEA (50 mM), in 25 mM Bis-Tris propane, pH 8, 20C. Addition of the substrate to the enzyme caused an immediate shift from ~410 to ~400 nm of the main PLP absorption band, whose intensity also decreased. This could indicate the disappearance of the ‘internal’ Schiff base between PLP and the enzyme, with accumulation of an ‘external’ Schiff base between PLP and PEA. In PLP-dependent enzymes, formation of external Schiff bases usually causes a red-shift of the spectrum, but blue shifts are also occasionally observed (e.g., ref. 5). Alternatively, the spectral change may indicate the formation of intermediates further down the reaction pathway, for example an ethyleneamine intermediate formed upon release of the phosphate leaving
group. Over time, the max of the main PLP band reverted to ~410 nm, although absorption remained low.
Schiroli et al., Supporting Information
5
Time (s)
0 5000 10000
[Ala
nin
e]
( M
)
0
50
100
150
3-APP
hypotaurine
maximum
possible
rate
of 3-APPtransamination
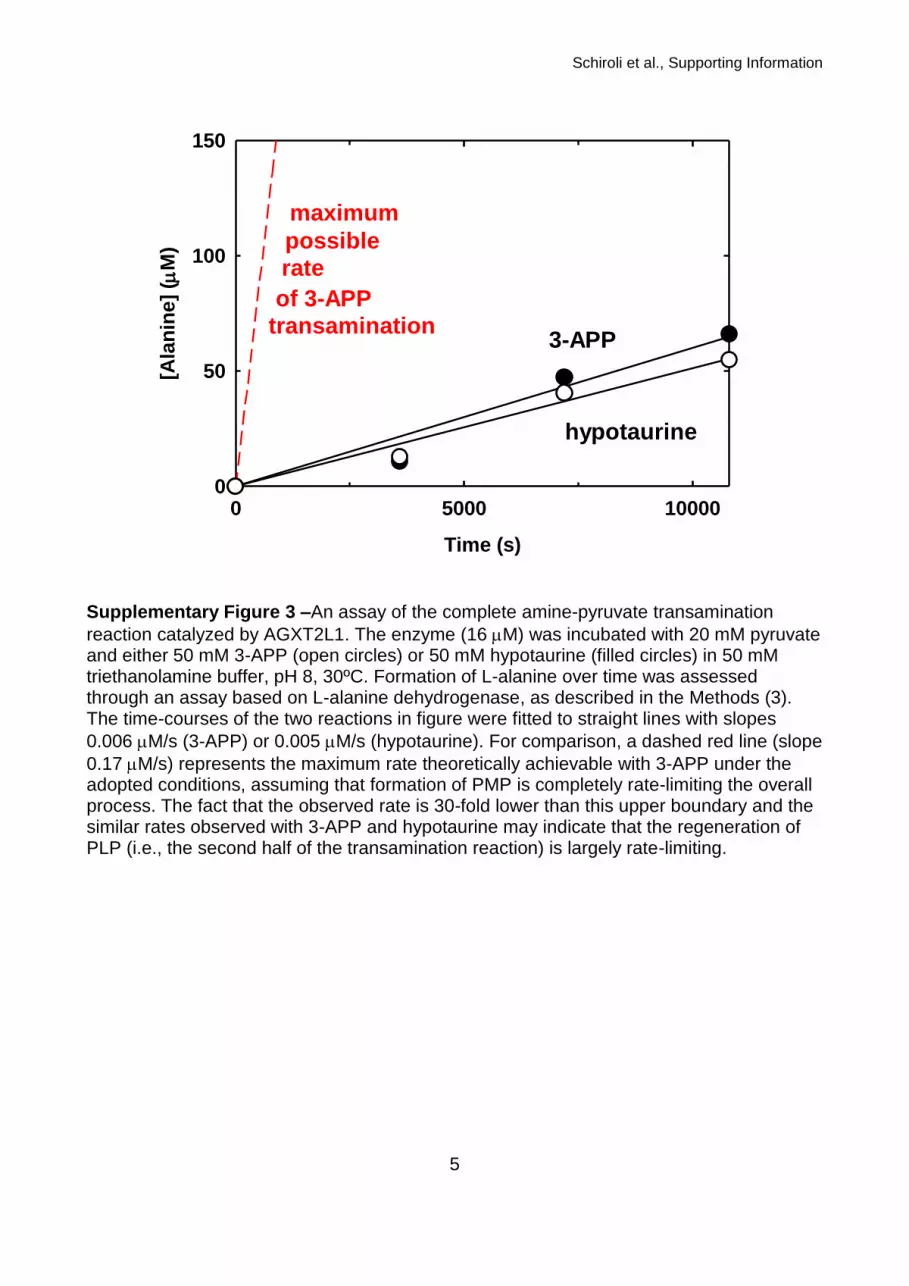
Supplementary Figure 3 –An assay of the complete amine-pyruvate transamination
reaction catalyzed by AGXT2L1. The enzyme (16 M) was incubated with 20 mM pyruvate and either 50 mM 3-APP (open circles) or 50 mM hypotaurine (filled circles) in 50 mM triethanolamine buffer, pH 8, 30ºC. Formation of L-alanine over time was assessed through an assay based on L-alanine dehydrogenase, as described in the Methods (3). The time-courses of the two reactions in figure were fitted to straight lines with slopes
0.006 M/s (3-APP) or 0.005 M/s (hypotaurine). For comparison, a dashed red line (slope
0.17 M/s) represents the maximum rate theoretically achievable with 3-APP under the adopted conditions, assuming that formation of PMP is completely rate-limiting the overall process. The fact that the observed rate is 30-fold lower than this upper boundary and the similar rates observed with 3-APP and hypotaurine may indicate that the regeneration of PLP (i.e., the second half of the transamination reaction) is largely rate-limiting.

Schiroli et al., Supporting Information
6
Supplementary Figure 4 - Phylogenetic relationships of AGXT2L1 with 35 functionally
validated enzymes of the same structural subgroup (“class-II aminotransferases”).
Sequences taken from the B6 database (6) were aligned with the Clustal Omega software
(7). An unrooted phylogenetic tree was calculated with ClustalW2 (8) using the neighbor-
joining algorithm after correction for multiple substitutions and displayed with FigTree (v,
1.4.0; http://tree.bio.ed.ac.uk/software/figtree/). Branches leading to enzymes with
aminotransferase activity are shown in blue. Dialkylglycine decarboxylases (DGD) and
glutamate semialdehyde aminomutases (GSA) are included among aminotransferases
because their reaction mechanisms comprise the formation of PMP. Branches leading to
enzymes with racemase activity (2-aminohexano-6-lactam racemases, AHLR) are shown
in yellow. Branches leading to enzymes with lyase activity (including AGXT2L1) are shown
in red. The tree does not include some bacterial homologs of AGXT2L1 that almost
invariably possess an additional kinase domain (9). Although the function of these
homologs has not been experimentally validated, they are almost certainly phospho-
lyases. Indeed, it was precisely thanks to clues offered by the genomic context of these
bacterial homologs that Veiga-da-Cunha and collaborators discovered the PEA phospho-
lyase activity of AGXT2L1 (10). Independently, but following an identical line of reasoning,
our group had also reached the same functional identification (11).

Schiroli et al., Supporting Information
7
Supplementary Figure 5 – A schematic view of the metabolism of PEA. The reaction catalyzed by AGXT2L1/PEA phospho-lyase (1) is shown as the red arrow. Other reactions are catalyzed by: 2) sphingosine-1-phosphate lyase (12); 3) PEA phosphatases (13); 4) ethanolamine kinase (14); 5) methyl-transferases, phosphatases and O-acetyltransferases leading to the formation of acetylcholine 6) ethanolamine-phosphate cytidylyltransferase (15); 7) CDP-ethanolamine:diacylglycerol ethanolaminephosphotransferase; 8) phospholipase D; 9) phospholipase A1 and lysophospholipase; 10) glycerophosphodiester phosphodiesterase.

Schiroli et al., Supporting Information
8
Supplementary Table 1 Absolute and relative specificity of AGXT2L1 for various PEA analogs
Compound ⁄ (M-1 s-1)
( ⁄ )
( ⁄ )
O-phosphoethanolamine (PEA)
PO
NH3+
O-
-O
O
2600 (1)
O-sulfoethanolamine (SEA)
SO
NH3+
O-
O
O
1.4 5.410-4
2-bromoethylamine
BrNH3
+
0.12 a 4.610-5
Ethanolamine
OHNH3
+
<0.015 b <5.810-6
Cysteamine
SHNH3
+
<1 c <3.810-4
Ciliatine
O-
OP
NH3+-
O
<0.015 b <5.810-6
3-aminopropyl phosphonate (3-APP)
P NH3+
O-
-O
O
<0.5 d <1.910-4
Taurine
O-O
SNH3
+O
<0.015 b <5.810-6
Hypotaurine O-
SNH3
+
O
<0.2 d <7.610-5
-alanine O-
CNH3
+
O
<0.015 b <5.810-6
Glycerophospho ethanolamine
OHP
ONH3
+O
-O
O
OH
0.27 e 10-4
O-phospho-L-serine
PO
NH3+
O-
-O
O
COO-
<0.015 b <5.810-6

Schiroli et al., Supporting Information
9
a The very slow elimination reaction with 2-bromoethylamine ended after a few turnovers, due presumably to irreversible inactivation of the enzyme. b These analogs did not undergo any detectable elimination when reacted at a 30 mM
concentration with 3 M enzyme (< 2 M product formed in 20 min). c No elimination detected. A limit was estimated considering that, within a few minutes, cysteamine formed an unreactive thiazolidine adduct with PLP. d No elimination detected. Limits were estimated considering that, in a few minutes, these analogs completely converted PLP to PMP. e Glycerophosphoethanolamine could be contaminated by small amounts of PEA, so
this ⁄ may also be an upper limit.
O-phospho-L-threonine
PO
NH3+
O-
-O
O
COO-
<0.015 b <5.810-6
O-phospho-L- homoserine P
O
O-OH
NH3+
COO-
O
<0.015 b <5.810-6

Schiroli et al., Supporting Information
10
Supplementary Table 2 Inhibition of the PEA phospho-lyase reaction by different anions. Reactions were
performed as described in the Methods, at pH 8, 30ºC. PEA concentration was 1 mM.
Anions were usually added as sodium salts; for each of them, the maximum concentration
used was 15 mM. Decreases in activity as a function of the added anion were fit to the
equation:
The equation assumes purely competitive inhibition. vi is the reaction rate measured in the
presence of the inhibitor, while v0 is the rate in the absence of inhibitor. [I] is the
concentration of the anion and Ki is the respective inhibition constant.
a The Ki of phosphate is identical, within error, to the value reported for a partially purified PEA
phospho-lyase from rabbit (16).
b The Ki of glyoxylate was roughly threefold smaller at pH 8.5; at this higher pH, we also compared the glyoxylate inhibition observed in triethanolamine with that observed in
borate-Na, obtaining essentially identical Ki values in the two buffer systems. c To obtain a Ki for 3-APP, vi was measured in the first minute of the kinetics. On longer times, a further progressive decrease of the reaction rate was evident, as 3-APP slowly converted the enzyme-bound PLP to PMP (see main text).
Anion Ki (mM) Phosphate 1.2 ± 0.2 a Sulfate 1.2 ± 0.2 Phosphite 1 ± 0.2 Arsenate 3.6 ± 0.9 Pyrophosphate 1.3 ± 0.4 Methyl sulfate 15 ± 3 Oxalate 2.8 ± 0.7 Glyoxylate 0.7 ± 0.2 b Pyruvate 5.0 ± 1.6
-ketoglutarate 2.7 ± 0.9
SEA >25 Ciliatine 7.6 ± 2.0 3-APP 1.8 ± 0.4 c

Schiroli et al., Supporting Information
11
Supplementary Table 3 Spectroscopic changes observed upon reacting AGXT2L1 with selected amino compounds. Potential ligands (5 mM) were mixed with the enzyme at pH 8, 20 °C. Spectral changes were measured within 5 min after mixing, looking in particular for the disappearance of the main band of PLP (410 nm) and concomitant appearance of new bands, such as those attributable to PMP (~330 nm), thiazolidine adducts (~340 nm) or quinonoids (>450 nm). The accumulation of new spectroscopic species is indicated semi-quantitatively by a number of + signs ranging from none (negligible) to three (nearly complete). PMP Quinonoid Thiazolidine Other
a
Standard amino acids
L-Alanine
L-Arginine
L-Asparagine
L-Aspartate
L-Cysteine +++
L-Gluamate
L-Glutamine
Glycine
L-Histidine
L-Isoleucine
L-Leucine
L-Lysine +
L-Methionine
L-Phenylalanine
L-Proline
L-Serine
L-Threonine
L-Tryptophan
L-Tyrosine
L-Valine
Other -amino acids
L-Citrulline
L-Homocysteine ++
L-Ornithine +
L-Allysine
L-Kynurenine
3-hydroxy L-kynurenine
L-Phosphoserine
S-methyl L-cysteine
NG,N
G-dimethyl-L-arginine
L-Cycloserine ++
D-Cycloserine +
D-Alanine

Schiroli et al., Supporting Information
12
D-Cysteine ++
-, -, or -amino acids
-alanine +
Isoserine
2-amino isobutyrate
-aminobutyrate (GABA) +
5-aminovalerate
5-aminolevulinate (5-ALA)b ++
Anionic amines
Sulfoethanolamine (SEA)
Ciliatine +
3-aminopropyphosphonate (3-APP) +++
3-aminopropylsulfonate +
Taurine ++
Hypotaurine +++
Thiotaurine ++
Aromatic amines
Tyramine
Octopamine +
Dopamine
Norepinephrine
Phenylethylamine
Phenylethanolamine
Serotonin +
Kynurenamine
Serotonin O-sulfate
4’-bromo-2-aminoacetophenone b ++
2-aminoacetophenone b ++
Trans-2-phenylcyclopropylamine
Other amines
Ethanolamine
2-bromoethylamine +
Cysteamine +++
Penicillamine +++
L-Leucine chloromethyl ketone +
Histamine
Spermidine
Putrescine
Sarcosine
D-Glucosamine
D-Galactosamine
D-Mannosamine
1,4-diamino-2-butanone ++

Schiroli et al., Supporting Information
13
a – L-cycloserine caused a substantial decrease in absorption at 410 nm, with a concomitant broad increase in the region below 350 nm. D-cycloserine caused a shift of the main PLP band to 420 nm. 2-bromoethylamine, over the course of a few minutes, caused a red shift of the main PLP band and a broad increase in the region below 350 nm. b – The quite spectacular spectral changes caused by 5-ALA and by other compounds that bear a keto function adjacent to the amino group (see Figure 2A in the main text) reflected the very high extinction coefficients of quinonoids, rather than a high affinity of the ligands, which in fact were only weak inhibitors of the lyase reaction.

Schiroli et al., Supporting Information
14
Supplementary Table 4 Comparison of the residues found at selected active site positions in three phylogenetically
related enzymes: E. coli -aminobutyrate aminotransferase (GABA-AT), rat alanine-glyoxylate aminotransferase 2 (AGXT2) and human PEA phospho-lyase (AGXT2L1). The overall sequence identities are: 31% between GABA-AT and AGXT2, 30% between GABA-AT and AGXT2L1, 36% between AGXT2 and AGXT2L1. The role of individual residues in the GABA-AT active site is based on the crystal structure of this enzyme (17).
Role in the GABA-AT active site GABA-AT AGXT2 AGXT2L1
Forms the internal Schiff base with PLP K268 K348 K278
Binds the N1 atom of PLP D239 D318 D246
Binds the O3 atom of PLP Q242 Q321 Q249
Supports the pyridine ring V241 V320 V248
Supports the pyridine ring Y138 Y195 Y139
Defines the substrate binding sitea I50 V110 -
Binds the COO- group of the ketoacid substrate R398 R480 K410
Binds the COO- group of GABA R141 C198 H142
a In another related enzyme, dialkylglycine decarboxylase, the corresponding residue at this position (Gln52) is apparently important for dictating the reaction specificity (18). In the multiple alignment including GABA-AT, AGXT2 and AGXT2L1, this latter sequence shows a gap corresponding to this position. The AGXT2L1 residue closest to the gap is Asn55.

Schiroli et al., Supporting Information
15
References
1. Donini, S. et al. (2009). Recombinant production of eight human cytosolic aminotransferases and assessment of their potential involvement in glyoxylate metabolism. Biochem. J. 422, 265-272.
2. Donini, S., Percudani, R., Credali, A., Montanini, B., Sartori, A. and Peracchi, A. (2006). A threonine synthase homolog from a mammalian genome. Biochem. Biophys. Res. Commun. 350, 922-8.
3. Laue, H. and Cook, A.M. (2000). Biochemical and molecular characterization of taurine:pyruvate aminotransferase from the anaerobe Bilophila wadsworthia. Eur. J. Biochem. 267, 6841-8.
4. Fersht, A.R. (1999) Structure and Mechanism in Protein Science - A Guide to Enzyme Catalysis and Protein Folding, Freeman & Co. New York.
5. Cellini, B., Bertoldi, M., Montioli, R., Paiardini, A. and Borri Voltattorni, C. (2007). Human wild-type alanine:glyoxylate aminotransferase and its naturally occurring G82E variant: functional properties and physiological implications. Biochem. J. 408, 39-50.
6. Percudani, R. and Peracchi, A. (2009). The B6 database: a tool for the description and classification of vitamin B6-dependent enzymatic activities and of the corresponding protein families. BMC Bioinformatics 10, 273.
7. Sievers, F. et al. (2010). Fast, scalable generation of high-quality protein multiple sequence alignments using Clustal Omega. Mol. Syst. Biol. 7, 539.
8. Larkin, M.A. et al. (2007). Clustal W and Clustal X version 2.0. Bioinformatics 23, 2947-8. 9. Donini, S. (2008) Molecular cloning and biochemical characterization of pyridoxal 5’-
phosphate dependent enzymes of unknown function, PhD Thesis, University of Parma 10. Veiga-da-Cunha, M., Hadi, F., Balligand, T., Stroobant, V. and Van Schaftingen, E. (2012).
Molecular identification of hydroxylysine kinase and of the ammoniophospholyases acting on 5-phosphohydroxy-L-lysine and phosphoethanolamine. J. Biol. Chem. 287, 7246-55.
11. Schiroli, D. (2011) The brain enzyme AGXT2L1 is a phospho-lyase acting on phosphorylated amines, MS Thesis, University of Parma
12. Bourquin, F., Capitani, G. and Grütter, M.G. (2011). PLP-dependent enzymes as entry and exit gates of sphingolipid metabolism. Protein Sci,
13. Roberts, S.J., Stewart, A.J., Sadler, P.J. and Farquharson, C. (2004). Human PHOSPHO1 exhibits high specific phosphoethanolamine and phosphocholine phosphatase activities. Biochem. J. 382, 59-65.
14. Lykidis, A., Wang, J., Karim, M.A. and Jackowski, S. (2001). Overexpression of a mammalian ethanolamine-specific kinase accelerates the CDP-ethanolamine pathway. J. Biol. Chem. 276, 2174-9.
15. Bakovic, M., Fullerton, M.D. and Michel, V. (2007). Metabolic and molecular aspects of ethanolamine phospholipid biosynthesis: the role of CTP:phosphoethanolamine cytidylyltransferase (Pcyt2). Biochem. Cell. Biol. 85, 283-300.
16. Fleshood, H.L. and Pitot, H.C. (1970). The metabolism of O-phosphorylethanolamine in animal tissues. I. O-phosphorylethanolamine phospho-lyase: partial purification and characterization. J. Biol. Chem. 245, 4414-20.
17. Liu, W., Peterson, P.E., Carter, R.J., Zhou, X., Langston, J.A., Fisher, A.J. and Toney, M.D.
(2004). Crystal structures of unbound and aminooxyacetate-bound Escherichia coli -aminobutyrate aminotransferase. Biochemistry 43, 10896-905.
18. Fogle, E.J., Liu, W., Woon, S.T., Keller, J.W. and Toney, M.D. (2005). Role of Q52 in catalysis of decarboxylation and transamination in dialkylglycine decarboxylase. Biochemistry 44, 16392-404.