Embed Size (px)
Citation preview

S1
Supporting Information for Publication
Direct Thiol-Ene Photocoating of Polyorganosiloxane
Microparticles
Christian Kuttner,* ,a Petra C. Maier, a Carmen Kunert, a
Helmut Schlaad, b and Andreas Fery *,a
a Department of Physical Chemistry II, University of Bayreuth, Bayreuth 95440, Germany
d Department of Colloid Chemistry, Max Planck Institute of Colloids and Interfaces, Potsdam 14424, Germany
* E-mail: [email protected], [email protected]
1. Applied UV Irradiation
Figure S1. Emission spectrum of the applied UV lamp (overlayed in red color) as a result of a
Hg lamp and a blue filter (transmission, dashed line).

S2
2. Dye Adsorption onto Polyorganosiloxane Particles
Figure S2. Dye p-(dimethylamino) azobenzene (dimethyl yellow): (a) pH-dependent color
change; (b) image of exemplary samples drawn from the reference solution without particles
(left, yellow) and from the particles solution (right, red); (c) image of exemplary samples after
centrifugation before UV/Vis analysis (sedimented particles are red, supernatant is yellow).

S3
3. Photoinitiation by UV Light – Thiyl Formation
In 1928, Ashworth and Burkhardt found that light accelerates the addition of thiols to olefins,
particularly ultraviolet light. [1] Therefore, thiyls can be formed by homolysis of the SH bond
upon UV-irradiation. However, olefins and alkylmercaptans absorb UVC light but virtually no
light above 280 nm. Therefore, UVC light is capable to from thiyls, whereas UVA light is
not. [2,3]
By 1991, Klemm and Sensfuß published several studies[4-6] on photopolymerization,
photoinitiation at 365 nm, and on the influence of oxygen. One major result was that oxygen has
no significance influence on thiyl formation. [6]
The other major finding was that radicals were only detected in the presence of an olefin, which
lead to the proposition that a thiol-olefin charge-transfer (CT) complex is responsible for
photoinitiation. [6] Such a CT complex has been proposed before in context of thiol-ene
cooxidation by Szmant and co-workers. [7,8] The two structural proposals are a π-olefinic
complex and a hydrogen-bonded complex. [7,9] By UVA-irradiation, the CT complex absorbs
light and dissociates upon thiyl formation.
In 2002, Cramer et al. reported that the radical generation rate differs dramatically for UVA
(315 nm < λ < 380 nm) and UVC light (200 nm < λ < 280 nm). Although, thiol-ene photo-
polymerizations proceeded with light centered around 365 nm, the reaction was significantly
faster when 254 nm light was used. [10] It has been found that the initiation rate for UVA light is
proportional to the concentration of ene-functional groups — whereas for UVC light this is not
the case. The latter is proportional to the concentration of thiols. [11]
The corrected mechanism reads as
(S1)
(S2)
Photolytic initiation by UVC light is a first-order reaction and proceeds at much higher rates than
the UVA-mediated second-order process. [10] If olefins are available in excess, UVA-initation is
pseudo first-order. Figure S3 shows a schematic mechanism of thiyl formation by UV light.
R’—SHh⌫,254 nm�! R’—S⇤ +H⇤
R’—SH + H2C=CHR ��! � [CT-complex]h⌫,365 nm�! R’—S⇤ +H3C—C⇤HR

S4
Figure S3. Schematic mechanism of thiyl formation by UV photoinitiation.
For 365 nm light, not one but two unsaturated species are required to form a growing chain. The
active olefin species (formed in the initial initiation process) may also contribute to the formation
of thiyls by sufhydryl H-abstraction. However, the likelihood of this event strongly depends on
the concentration ratio of olefins to thiols, further reactants, and the solvent. In any case, the
majority of thiyls are formed by direct photoinitiation and only a small fraction can be attributed
to subsequent radical transfer reactions. In all synthetic approaches of this work, UVA light with
a maximum intensity at 365 nm has been used (see Figure S1), consequently without additional
photoinitiator.

S5
4. Scanning Electron Micrographs of Polystyrene-Coated Polyorganosiloxane Particles
Figure S4. Scanning electron mircographs of polystryrene-coated polyorganosiloxane
microparticles after different times of polymerization.

S6
5. Dynamic Light Scattering of Photocoated and Uncoated Particles
Figure S5. Size-dispersity (PDI) determined by dynamic light scattering of uncoated
polyorganosiloxane particles in toluene (a) and ethanol (b).
a b
c d
a b
c d
a b20
15
10
5
0
Nor
m. P
roba
bilit
y, %
0.50.40.30.20.10.0PDI
Uncoated particlesin toluenePDI = 0.047
20
15
10
5
0
Nor
m. P
roba
bilit
y, %
0.50.40.30.20.10.0PDI
Uncoated particles in ethanolPDI = 0.048
20
15
10
5
0
Nor
m. P
roba
bilit
y, %
0.50.40.30.20.10.0PDI
PB854-b-PS360PDI = 0.089
20
15
10
5
0
Nor
m. P
roba
bilit
y, %
0.50.40.30.20.10.0PDI
PB43-b-PS360PDI = 0.094
20
15
10
5
0
Nor
m. P
roba
bilit
y, %
0.50.40.30.20.10.0PDI
PB339-b-PS360PDI = 0.064
20
15
10
5
0
Nor
m. P
roba
bilit
y, %
0.50.40.30.20.10.0PDI
PB663-b-PS360PDI = 0.089
20
15
10
5
0
Nor
m. P
roba
bilit
y, %
0.50.40.30.20.10.0PDI
HSP@PS 6hPDI = 0.041
20
15
10
5
0
Nor
m. P
roba
bilit
y, %
0.50.40.30.20.10.0PDI
HSP@PS 18hPDI = 0.053
20
15
10
5
0
Nor
m. P
roba
bilit
y, %
0.50.40.30.20.10.0PDI
HSP@PS 12hPDI = 0.11
20
15
10
5
0
Nor
m. P
roba
bilit
y, %
0.50.40.30.20.10.0PDI
HSP@PS 24hPDI = 0.12
S7
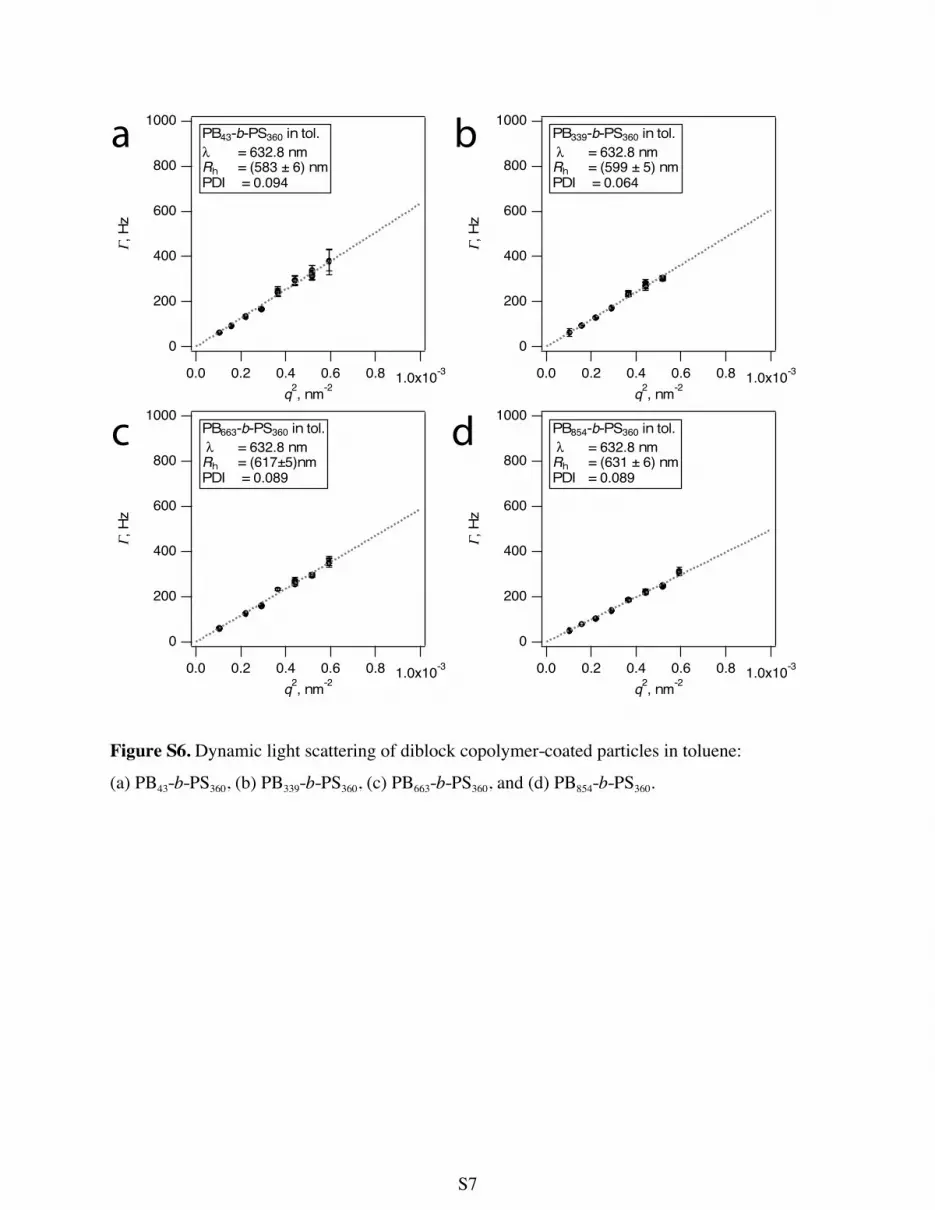
Figure S6. Dynamic light scattering of diblock copolymer-coated particles in toluene:
(a) PB43-b-PS360, (b) PB339-b-PS360, (c) PB663-b-PS360, and (d) PB854-b-PS360.
a b
c d
a b
c d
1000
800
600
400
200
0
Γ , H
z
1.0x10-30.80.60.40.20.0q2, nm-2
PB43-b-PS360 in tol. λ = 632.8 nmRh = (583 ± 6) nmPDI = 0.094
1000
800
600
400
200
0
Γ, H
z
1.0x10-30.80.60.40.20.0q2, nm-2
PB339-b-PS360 in tol. λ = 632.8 nmRh = (599 ± 5) nmPDI = 0.064
1000
800
600
400
200
0
Γ , H
z
1.0x10-30.80.60.40.20.0q2, nm-2
PB663-b-PS360 in tol. λ = 632.8 nmRh = (617±5)nmPDI = 0.089
1000
800
600
400
200
0
Γ, H
z
1.0x10-30.80.60.40.20.0q2, nm-2
PB854-b-PS360 in tol. λ = 632.8 nmRh = (631 ± 6) nmPDI = 0.089
1000
800
600
400
200
0
Γ , H
z
1.0x10-30.80.60.40.20.0q2, nm-2
HSP@PS 12h λ = 532 nmRh = (642 ± 4) nmPDI = 0.11
1000
800
600
400
200
0
Γ , H
z
1.0x10-30.80.60.40.20.0q2, nm-2
HSP@PS 24h λ = 532 nmRh = (631 ± 5) nmPDI = 0.12
1000
800
600
400
200
0
Γ, H
z
1.0x10-30.80.60.40.20.0q2, nm-2
HSP@PS 6h λ = 532 nmRh = (642 ± 3) nmPDI = 0.041
1000
800
600
400
200
0
Γ, H
z
1.0x10-30.80.60.40.20.0q2, nm-2
HSP@PS 18h λ = 532 nmRh = (631 ± 3) nmPDI = 0.053

S8
Figure S7. Size-dispersity (PDI) determined by dynamic light scattering of diblock copolymer-
coated particles in toluene: (a) PB43-b-PS360, (b) PB339-b-PS360, (c) PB663-b-PS360, and (d) PB854-b-
PS360.
a b
c d
a b
c d
a b20
15
10
5
0
Nor
m. P
roba
bilit
y, %
0.50.40.30.20.10.0PDI
Uncoated particlesin toluenePDI = 0.047
20
15
10
5
0
Nor
m. P
roba
bilit
y, %
0.50.40.30.20.10.0PDI
Uncoated particles in ethanolPDI = 0.048
20
15
10
5
0
Nor
m. P
roba
bilit
y, %
0.50.40.30.20.10.0PDI
PB854-b-PS360PDI = 0.089
20
15
10
5
0
Nor
m. P
roba
bilit
y, %
0.50.40.30.20.10.0PDI
PB43-b-PS360PDI = 0.094
20
15
10
5
0
Nor
m. P
roba
bilit
y, %
0.50.40.30.20.10.0PDI
PB339-b-PS360PDI = 0.064
20
15
10
5
0
Nor
m. P
roba
bilit
y, %
0.50.40.30.20.10.0PDI
PB663-b-PS360PDI = 0.089
20
15
10
5
0
Nor
m. P
roba
bilit
y, %
0.50.40.30.20.10.0PDI
HSP@PS 6hPDI = 0.041
20
15
10
5
0
Nor
m. P
roba
bilit
y, %
0.50.40.30.20.10.0PDI
HSP@PS 18hPDI = 0.053
20
15
10
5
0
Nor
m. P
roba
bilit
y, %
0.50.40.30.20.10.0PDI
HSP@PS 12hPDI = 0.11
20
15
10
5
0
Nor
m. P
roba
bilit
y, %
0.50.40.30.20.10.0PDI
HSP@PS 24hPDI = 0.12

S9
Figure S8. Dynamic light scattering of polystyrene-coated particles in toluene: (a) 6 h, (b) 12 h,
(c) 18 h, and (d) 24 h.
a b
c d
a b
c d
1000
800
600
400
200
0
Γ , H
z
1.0x10-30.80.60.40.20.0q2, nm-2
PB43-b-PS360 in tol. λ = 632.8 nmRh = (583 ± 6) nmPDI = 0.094
1000
800
600
400
200
0
Γ, H
z
1.0x10-30.80.60.40.20.0q2, nm-2
PB339-b-PS360 in tol. λ = 632.8 nmRh = (599 ± 5) nmPDI = 0.064
1000
800
600
400
200
0
Γ , H
z
1.0x10-30.80.60.40.20.0q2, nm-2
PB663-b-PS360 in tol. λ = 632.8 nmRh = (617±5)nmPDI = 0.089
1000
800
600
400
200
0
Γ, H
z
1.0x10-30.80.60.40.20.0q2, nm-2
PB854-b-PS360 in tol. λ = 632.8 nmRh = (631 ± 6) nmPDI = 0.089
1000
800
600
400
200
0
Γ , H
z
1.0x10-30.80.60.40.20.0q2, nm-2
HSP@PS 12h λ = 532 nmRh = (642 ± 4) nmPDI = 0.11
1000
800
600
400
200
0
Γ , H
z
1.0x10-30.80.60.40.20.0q2, nm-2
HSP@PS 24h λ = 532 nmRh = (631 ± 5) nmPDI = 0.12
1000
800
600
400
200
0
Γ, H
z
1.0x10-30.80.60.40.20.0q2, nm-2
HSP@PS 6h λ = 532 nmRh = (642 ± 3) nmPDI = 0.041
1000
800
600
400
200
0
Γ, H
z
1.0x10-30.80.60.40.20.0q2, nm-2
HSP@PS 18h λ = 532 nmRh = (631 ± 3) nmPDI = 0.053

S10
Figure S9. Size-dispersity (PDI) determined by dynamic light scattering of polystyrene-coated
particles in toluene: (a) 6 h, (b) 12 h, (c) 18 h, and (d) 24 h.
a b
c d
a b
c d
a b20
15
10
5
0
Nor
m. P
roba
bilit
y, %
0.50.40.30.20.10.0PDI
Uncoated particlesin toluenePDI = 0.047
20
15
10
5
0
Nor
m. P
roba
bilit
y, %
0.50.40.30.20.10.0PDI
Uncoated particles in ethanolPDI = 0.048
20
15
10
5
0
Nor
m. P
roba
bilit
y, %
0.50.40.30.20.10.0PDI
PB854-b-PS360PDI = 0.089
20
15
10
5
0
Nor
m. P
roba
bilit
y, %
0.50.40.30.20.10.0PDI
PB43-b-PS360PDI = 0.094
20
15
10
5
0
Nor
m. P
roba
bilit
y, %
0.50.40.30.20.10.0PDI
PB339-b-PS360PDI = 0.064
20
15
10
5
0
Nor
m. P
roba
bilit
y, %
0.50.40.30.20.10.0PDI
PB663-b-PS360PDI = 0.089
20
15
10
5
0
Nor
m. P
roba
bilit
y, %
0.50.40.30.20.10.0PDI
HSP@PS 6hPDI = 0.041
20
15
10
5
0
Nor
m. P
roba
bilit
y, %
0.50.40.30.20.10.0PDI
HSP@PS 18hPDI = 0.053
20
15
10
5
0
Nor
m. P
roba
bilit
y, %
0.50.40.30.20.10.0PDI
HSP@PS 12hPDI = 0.11
20
15
10
5
0
Nor
m. P
roba
bilit
y, %
0.50.40.30.20.10.0PDI
HSP@PS 24hPDI = 0.12

S11
6. Calculation of the Coating Thickness of Spherical Core/Shell Particles from TGA Mass Loss
The volume of the uncoated particle Vcore is given by its radius r, and the volume of the coating
Vshell is a shell of thickness t. The mass fraction of polymer shell wshell and core particle wcore are
given by the mass loss.
(S3)
(S4)
(S5)
where ρ is the bulk density. Rearrangement of Eqn. S6 yields
(S6)
Eqn. S6 can be solved for t. The coating thickness of spherical particles can be calculated from
the TGA mass loss with the following Equation.
(S7)
Using wcore = 1-wshell, the uncertainty of the thickness value can be calculated using Gaussian
error propagation and the respective derivations.
(S8)
(S9)
(S10)
(S11)
0 =
✓t
r
◆3
+ 3
✓t
r
◆2
+ 3
✓t
r
◆� w
shell
wcore
%core
%shell
t =
✓3
r1 +
wshell
wcore
%core
%shell
� 1
◆r =
✓3
r1 +
wshell
1� wshell
%core
%shell
� 1
◆r
@r t =
✓3
r1 +
wshell
1� wshell
%core
%shell
� 1
◆=
t
r
@%shell
t =1
3r
wshell
wshell
� 1
%core
%2shell
✓%core
%shell
wshell
1� wshell
+ 1
◆�2/3
@%core
t =1
3r
wshell
1� wshell
%�1
shell
✓%core
%shell
wshell
1� wshell
+ 1
◆�2/3
@wshell
t =1
3r%core
%core
(wshell
� 1)�2
✓� %
core
%shell
wshell
wshell
� 1+ 1
◆�2/3
wshell
wcore
=m
shell
mcore
=%shell
Vshell
%core
Vcore
with Vi =4
3⇡ r3i
=%shell
%core
V(r + t)� V(r)V(r)
=%shell
%core
"✓t
r+ 1
◆3
� 1
#

S12
Combination allows for calculation of the thickness variance σt2 based on the measurement
uncertainty σw,shell, the model uncertainty σρ, and the size dispersity of the core particles σr.
(S12)
(S13)
Assumed errors are 0.1 g/cm3 for the densities, 70 nm for the radius (DLS, σRh/ ), and 0.5% for
the mass loss.
7. Simplified Estimation for Polymer-Coated Polyorganosiloxane Particles
Upon assumption of a linear correlation of the relative coating thickness t/r and the polymer
content (mass loss) wshell, a simplified estimation for polymer-coated polyorganosiloxane
particles with r = 485 nm (Rh in ethanol) can be formulated:
(S14)
where, kρ represents the density ratio of core to shell. Error by Gaussian error propagation:
(S15)
with assumed errors of σr = 70 nm (DLS, σRh/ ) and σw,shell = 0.5%.
p2
p2
�2
t =(@r t)2 �2
r + (@wshell
t)2 �2
wshell
+ (@⇢shell
t)2 �2
⇢shell
+ (@⇢core
t)2 �2
⇢core
⇡fsize dispersity
(r, t) + fTGA
(wshell
) + fmodel
(�%)
�t ⇡ 0.741q
w2shell �
2r + r2 �2
wshell
t ⇡ 0.741 r wshell for polymer on polyorganosiloxane k% =2
1
S13
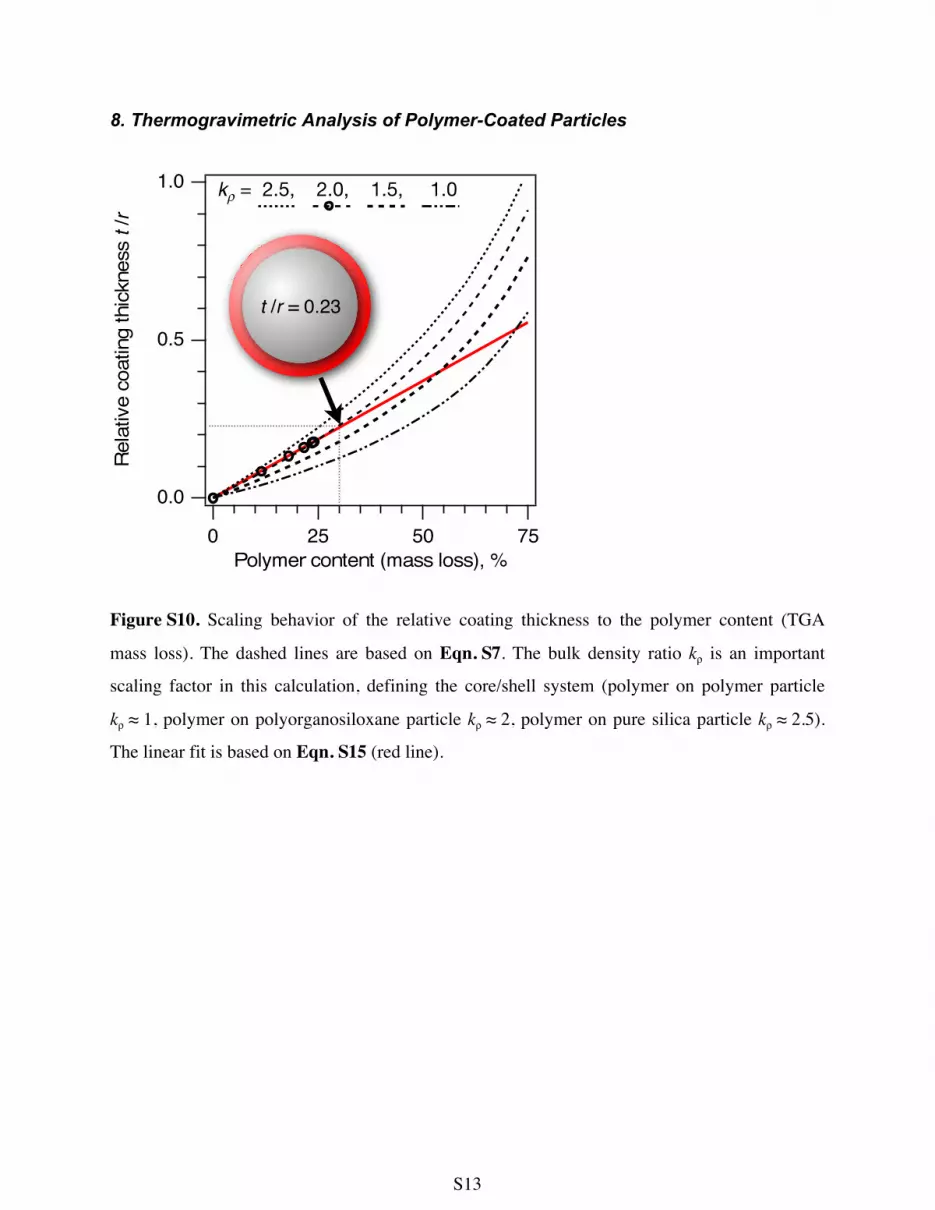
8. Thermogravimetric Analysis of Polymer-Coated Particles
Figure S10. Scaling behavior of the relative coating thickness to the polymer content (TGA
mass loss). The dashed lines are based on Eqn. S7. The bulk density ratio kρ is an important
scaling factor in this calculation, defining the core/shell system (polymer on polymer particle
kρ ≈ 1, polymer on polyorganosiloxane particle kρ ≈ 2, polymer on pure silica particle kρ ≈ 2.5).
The linear fit is based on Eqn. S15 (red line).
130314 P8 5er Serie.pxp
130314 TGA 5Vol% + Referenzsilica
density between 1 and 2.5
1 PDMS 2.5 silica1.5 siloxanes
a
b
0.741
t /r = 0.23
1.5
1.0
0.5
0.0
Rel
ativ
e co
atin
g th
ickn
ess t /r
100806040200Polymer content (mass loss), %
kρ = 2.5, 2.0, 1.5, 1.0
100
90
80
70
60
50
40
30
Mas
s lo
ss (T
GA)
, %
8006004002000Temperature, °C
pure silica
hybrid silica
12h
3h
6h
18h 24h
30
25
20
15
10
5
0
Poly
mer
con
tent
(mas
s lo
ss),
%
0 3 6 12 18 24Polymerization time, h
100
80
60
40
20
0
Coating thickness, nm
uncoatedpolyorgano-
siloxane 1.0
0.5
0.0
Rel
ativ
e co
atin
g th
ickn
ess t /r
7550250Polymer content (mass loss), %
kρ = 2.5, 2.0, 1.5, 1.0
t /r = 0.23

S14
9. Raman Spectroscopy of Polystyrene-Coated Particles
Figure S11. Raman spectra of polystyrene-coated particles with different polymerization times.
(a) Overview of the complete spectra, normalized for the area under the vibrations of aliphatic
CH2 at 2800 to 3000 cm-1. (b) Detail spectra of the range of 400 to 1750 cm-1 with vibrational
assignments. From the changes of the Raman signals, the increase of the coating thickness for
longer polymerization times can be followed. Figure S12 presents the normalization procedure.
Table S1 gives an overview of the observed Raman frequencies and vibrational assignments.
a
b 1500
1000
500
0
Norm
alize
d in
tens
ity, a
.u.
1600140012001000800600400Raman shift, cm-1
νSiC
νCC
δCH2
ωCH2
νCCar.
δOSiO
νphenylνSiOSi
νCC
αCCC, phenyl
γCH, ar.
νCC, phenyl
TCH2
0h 3h 6h12h18h24h
5000
4000
3000
2000
1000
0
Nor
mal
ized
inte
nsity
, a.u
.
40003600320028002400200016001200800400Raman shift, cm-1
0h 3h 6h12h18h24h

S15
Figure S12. Procedure used to normalize the spectra for the area under the vibrations of aliphatic
CH2 at 2800 to 3000 cm-1: The respective frequency range of each Raman spectrum was
processed by a multi-peak fitting using IGOR Pro by WaveMetrics. The measured spectra could
be described by 6 to 8 Voigt signals. The residuals, indicated above each fit in red color, were
below 5%. A normalization factor was calculated based on the areas of the individual Voigt fits.
(a) 0h, uncoated particles; (b) 3h; (c) 6h; (d) 12h; (e) 18h; and (f) 24h of polymerization time.
12001000
800600400200
0
40003500300025002000
Raman shift, cm-1
1200
800
400
0
-400
40
Location: 2566.2Area: 33544Location: 2668.5Area: 250.48
Location: 2799.9Area: 924.67 Location: 2860.8
Area: 9117.4
Location: 2888.8Area: 36743
Location: 2921.1Area: 43455
Location: 2963.5Area: 9186.5
P8 uncoated 800
600
400
200
0
40003500300025002000
Raman shift, cm-1
800600400200
0
-40-20
02040
Location: 2568.2Area: 10659
Location: 2868.7Area: 19556
Location: 2886.9Area: 7394.1
Location: 2916.5Area: 35546 Location: 2961.9
Area: 13135
Location: 3036.3Area: 1166.8
Location: 3052.8Area: 1914.9
Location: 3062.3Area: 5345.3
P8S3
400
300
200
100
0
40003500300025002000
Raman shift, cm-1
400300200100
0
-20-10
01020
Location: 2569.6Area: 3301.6
Location: 2645.6Area: 2349.1
Location: 2881.6Area: 7452.2
Location: 2917.1Area: 26761
Location: 3036.7Area: 553.46
Location: 3052.3Area: 787.29
Location: 3061.2Area: 3672.5
P8S6 800
600
400
200
0
40003500300025002000
Raman shift, cm-1
800600400200
0
-40-20
02040
Location: 2573.9Area: 1404.6
Location: 2644.4Area: 2088.8
Location: 2862.9Area: 4273.8
Location: 2885.2Area: 2327.8
Location: 2914.8Area: 57710
Location: 3038Area: 4078.9
Location: 3052.8Area: 2264.4
Location: 3062.6Area: 8507.3
P8S12
800
600
400
200
0
40003500300025002000
Raman shift, cm-1
800600400200
0
-40-20
02040
Location: 2574.6Area: 339.86
Location: 2858.5Area: 5510.5
Location: 2882.4Area: 2046.2
Location: 2913.6Area: 67598
Location: 3036.3Area: 4258.7
Location: 3052.2Area: 3131.2
Location: 3060.6Area: 14722
P8S24
800600400200
040003500300025002000
Raman shift, cm-1
800
600
400
200
0
-40-20
02040
Location: 2573.2Area: 478.94
Location: 2871.2Area: 7442.9
Location: 2914.9Area: 52443
Location: 3041.8Area: 6728.9
Location: 3053.4Area: 2864
Location: 3062.8Area: 7507.2
P8S18
a b
c d
e f
0h
6h
18h 24h
12h
3h
residuals
residuals
residuals residuals
residuals
residuals
data+fit
data+fit
data+fit data+fit
data+fit
data+fit
fit
fit fit
fit

S16
Table S1. Observed vibrational frequencies of uncoated polyorganosiloxane particles (left),
prepared from MPTMS as precursor, and additional vibrational frequencies after photocoating
with polystyrene (right) via “grafting-from”. Vibrational assignments are based on [12] and [13].
Polyorganosiloxane Particles Polystyrene-Coated Particles
Raman shift, cm-1 Assignment Raman shift, cm-1 Assignment 511 ν(SiOSi) or δ(OSiO)
620 ν(CC) 651, 696 ν(SiC)
742 ν(SC) 759 α(CCC) phenyl
ring deformation 807 δ(CSH)
827 γ(CH) aromatic 863, 919 γ(CH2)
1003 ν(CC) 1001 ν(CC) and ν(CC) phenyl
1030 ν(CC) phenyl 1039, 1115 νa(SiOC) 1175, 1302 T(CH2) 1155, 1178, 1190,
1200, 1225 ν(phenyl)
1255, 1342 ω(CH2) 1427 δ(CH2)
1583, 1603 ν(CC) aromatic
2566 ν(SH) 2860, 2889 νs(CH2) aliphatic 2921, 2965 νa(CH2) aliphatic
3040, 3053 ν(CH) aromatic

S17
References:
[1] Ashworth, F.; Burkhardt, G. N. Effects induced by the phenyl group. Part I. The addition of polar reagents to styrene and the behaviour of the halogenated ethylbenzenes. J Chem Soc 1928, 1791.
[2] Cramer, N. B.; Reddy, S. K.; Cole, M.; Hoyle, C.; Bowman, C. N. Initiation and kinetics of thiol–ene photopolymerizations without photoinitiators. J Polym Sci Pol Chem 2004, 42, 5817–5826.
[3] Sayamol, K.; Knight, A. R. Reactions of Thiyl Radicals .3. Phtochemical Equilibrium in Photolysis of Liquid Disulfide Mixtures. Can J Chem 1968, 46, 999–1003.
[4] Klemm, E.; Sensfuß, S.; Holfter, U.; Schütz, H. Untersuchungen zur linearen thiol-en-photopolymerisation. Makromol Chem 1990, 191, 2403–2411.
[5] Klemm, E.; Sensfuß, S. Investigations on the Mechanism of Autoinitiation in Thiol en-Polymerization. Makromol Chem 1991, 192, 159–164.
[6] Sensfuß, S.; Friedrich, M.; Klemm, E. Untersuchungen zur Thio/En-Polymerisation. Makromol Chem 1991, 192, 2895–2900.
[7] Dsouza, V. T.; Nanjundiah, R.; Baeza, J.; Szmant, H. H. Thiol-Olefin Cooxidation (Toco) Reaction .7. a H-1-NMR Study of Thiol Solvation. J Org Chem 1987, 52, 1720–1725.
[8] Dsouza, V. T.; Iyer, V.; Szmant, H. H. Thiol-Olefin Cooxidation (Toco) Reaction .8. Solvent Effects in the Oxidation of Some Thiols with Molecular-Oxygen. J Org Chem 1987, 52, 1725–1728.
[9] Fouassier, J.-P.; Rabek, J. F., Radiation Curing in Polymer Science and Technology; Kluwer Academic Print on Demand: 1993.
[10] Cramer, N. B.; Scott, J. P.; Bowman, C. N. Photopolymerizations of Thiol-Ene Polymers without Photoinitiators. Macromolecules 2002, 35, 5361–5365.
[11] Cramer, N. B.; Reddy, S. K.; Cole, M.; Hoyle, C.; Bowman, C. N. Initiation and kinetics of thiol–ene photopolymerizations without photoinitiators. J Polym Sci Pol Chem 2004, 42, 5817–5826.
[12] Li, Y.; Wang, Y.; Tran, T.; Perkins, A. Vibrational Spectroscopic Studies of (3-Mercaptopropyl) Trimethoxylsilane Sol-Gel and Its Coating. Spectrochim Acta A 2005, 61, 3032–3037.
[13] Polystyrol - Band 4 von Kunststoff-Handbuch. Neuausgabe; Gausepohl, H.; Bender, D., Eds.; Hanser Verlag, 1996.


![1Methoxy3- o -tolylbicyclo[2.2.2]oct-5-ene-2,2-dicarbonitrile](https://img.pdfslide.net/doc/110x75/6320e2c8069357aa4506677a/1methoxy3-o-tolylbicyclo222oct-5-ene-22-dicarbonitrile.jpg)


