Embed Size (px)
Citation preview
Supporting Information for
Proving and interpreting the spontaneous formation of bulk nanobubbles in
aqueous organic solvent solutions: effects of solvent type and content
Ananda J. Jadhav, Mostafa Barigou
School of Chemical Engineering, University of Birmingham, Edgbaston, Birmingham B15
2TT, United Kingdom
Electronic Supplementary Material (ESI) for Soft Matter.This journal is © The Royal Society of Chemistry 2020
Nanoparticle tracking analysis
Measurements were conducted at 25 ˚C using a blue laser light source (70 mW, = 405 nm).
The sample was introduced using a syringe pump (flowrate set to 100 in arbitrary units). NTA
is based on a laser-illuminated microscopic technique and the Brownian motion of BNBs in
solution is detected and recorded by a scientific CMOS camera. A video of the scattered light
from the bubble in a flow field was recorded in triplicates, each recording lasting 60 s at a
camera level of 13−16. Subsequently, a particle tracking image analysis program (i.e., the
NTA software version 3.2) determines the size distribution by tracking the visualized bubbles
simultaneously but separately. The analysis parameters used were the threshold set within 5 to
10 to avoid noise, and the gain set to 512. Prior to NTA measurements, the visualisation cell
was first rinsed with pure water and dried with dry Nitrogen gas.
Zeta potential measurements
Zeta potential is the potential difference between the dispersion medium and the stationary
layer of fluid attached to the dispersed colloidal particle. Zeta potential cannot be measured
directly, but it can be derived using a theoretical model and an experimentally determined
electrophoretic mobility of charged entities under an applied electric field. The electrophoretic
mobility, e, is defined as
(1)𝜇𝑒=
𝑢𝐸
where u is the drift velocity of the dispersed particle and E is the strength of the applied electric
field.
Thus, the zeta potential, ζ, can be calculated from
𝜇𝑒=2𝜀𝑟𝜀0𝜁𝑓(𝜅𝑎)
3𝜂(2)
where r0and f ( are the relative permittivity or dielectric constant of the dispersion
medium, the permittivity of vacuum, the dynamic viscosity of the dispersion medium at the
experimental temperature, and Henry’s function, respectively, which describes the
electrophoretic mobility of a spherical colloidal particle in the limit of low surface potentials.
Solvent separation from BNB suspensions
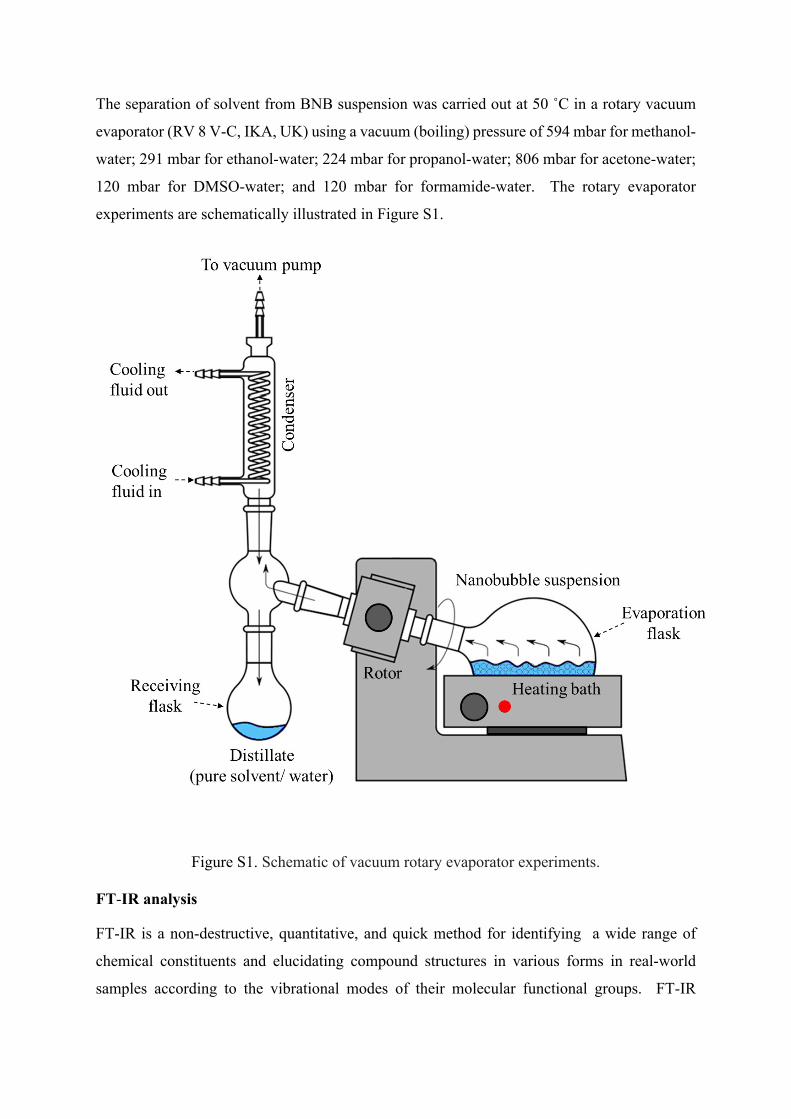
The separation of solvent from BNB suspension was carried out at 50 ˚C in a rotary vacuum
evaporator (RV 8 V-C, IKA, UK) using a vacuum (boiling) pressure of 594 mbar for methanol-
water; 291 mbar for ethanol-water; 224 mbar for propanol-water; 806 mbar for acetone-water;
120 mbar for DMSO-water; and 120 mbar for formamide-water. The rotary evaporator
experiments are schematically illustrated in Figure S1.
Figure S1. Schematic of vacuum rotary evaporator experiments.
FT-IR analysis
FT-IR is a non-destructive, quantitative, and quick method for identifying a wide range of
chemical constituents and elucidating compound structures in various forms in real-world
samples according to the vibrational modes of their molecular functional groups. FT-IR
spectroscopic measurements were used here to investigate the purity of bulk nanobubble
suspensions produced in water-solvent mixtures. Spectroscopic measurements were performed
on a Tensor 27 instrument (Bruker, Germany) coupled with an ATR accessory. The scanned
spectral range was from 400−4000 cm−1, with a resolution of 2 cm−1 and a wavenumber
accuracy of 0.01 cm−1.
GC-MS analysis
GC-MS analysis of water and BNB suspensions was performed with an Agilent 7890A gas
chromatograph (Agilent Technology, UK) equipped with ZB-WAX column (30 m × ϕ 0.25
mm, thickness 0.25 m, Phenomenex, UK) coupled to a GCT Premier mass spectrometer
(Waters, UK) operated in electron ionization (EI+) mode. Helium was used as a carrier and
make-up gas passed through the column at a constant flowrate of 1.0 mL.min1. The injection
volume was 1 L, which was used with a split ratio of 1:10. The column temperature
programme was as follows: temperature was held at 50 ˚C for 2 min, increased to 250 ˚C at 5
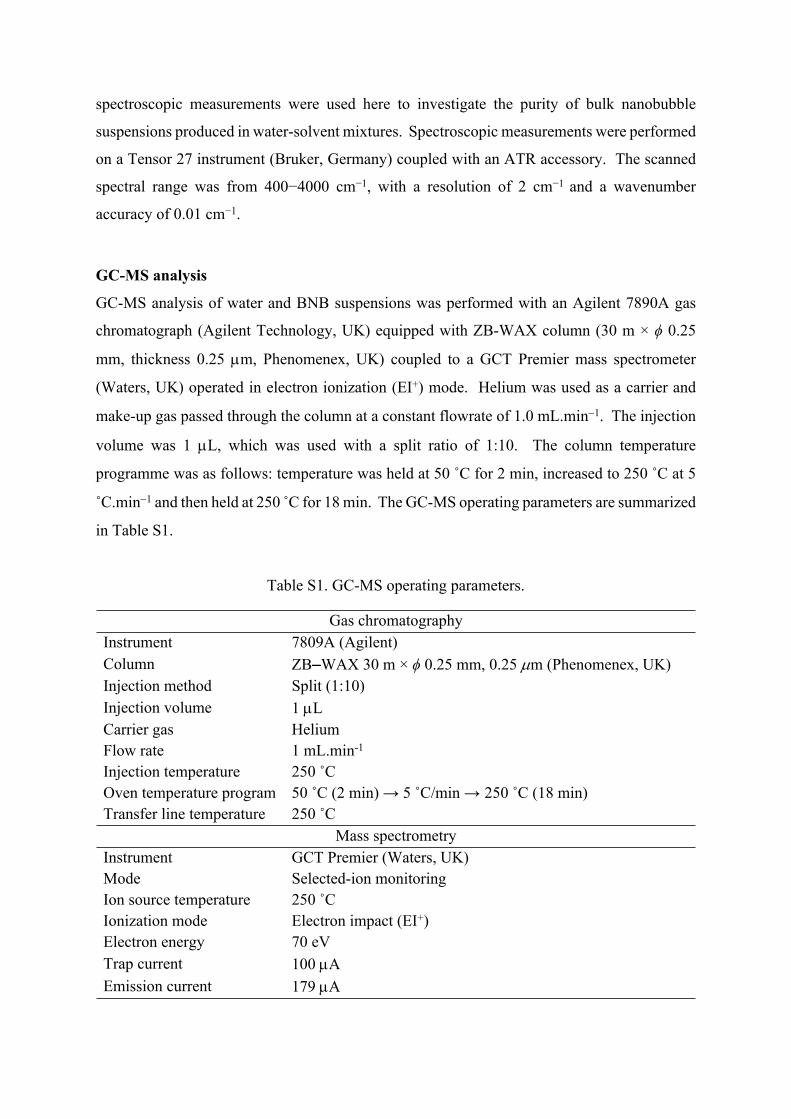
˚C.min1 and then held at 250 ̊ C for 18 min. The GC-MS operating parameters are summarized
in Table S1.
Table S1. GC-MS operating parameters.
Gas chromatographyInstrument 7809A (Agilent)Column ZB‒WAX 30 m × ϕ 0.25 mm, 0.25 m (Phenomenex, UK)Injection method Split (1:10)Injection volume 1 LCarrier gas HeliumFlow rate 1 mL.min˗1
Injection temperature 250 ˚COven temperature program 50 ˚C (2 min) → 5 ˚C/min → 250 ˚C (18 min)Transfer line temperature 250 ˚C
Mass spectrometryInstrument GCT Premier (Waters, UK)Mode Selected-ion monitoringIon source temperature 250 ˚CIonization mode Electron impact (EI+)Electron energy 70 eVTrap current 100 AEmission current 179 A
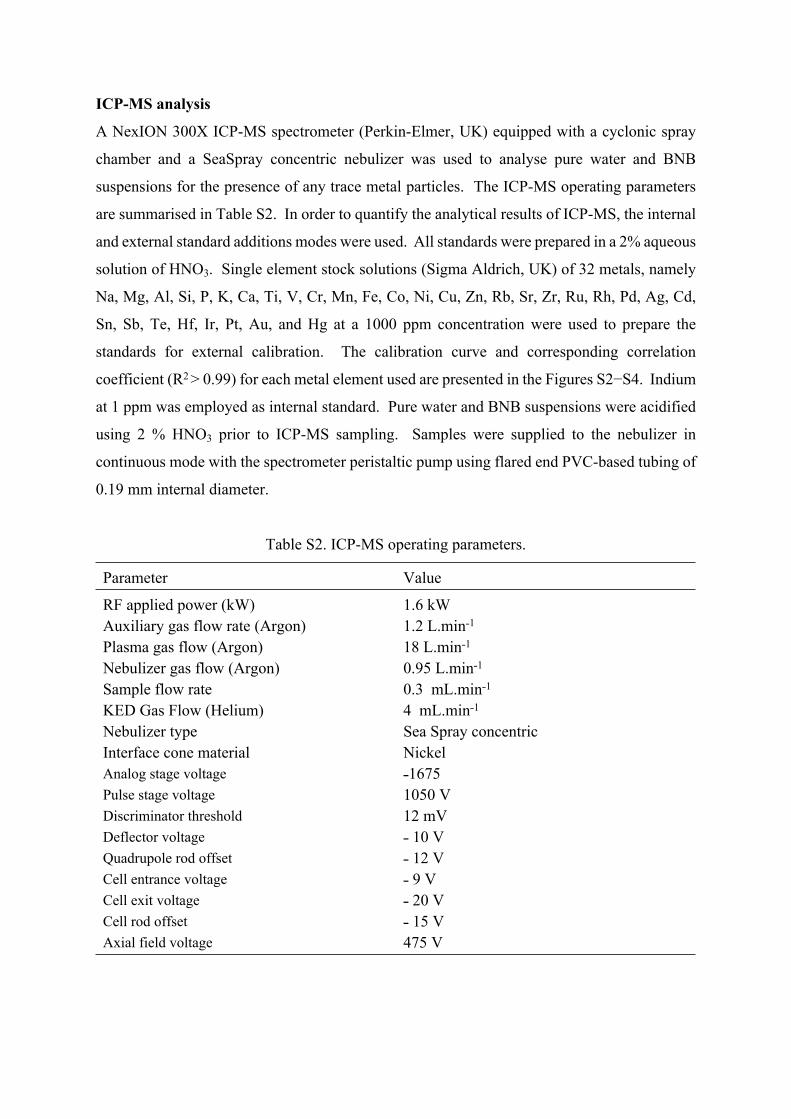
ICP-MS analysis
A NexION 300X ICP-MS spectrometer (Perkin-Elmer, UK) equipped with a cyclonic spray
chamber and a SeaSpray concentric nebulizer was used to analyse pure water and BNB
suspensions for the presence of any trace metal particles. The ICP-MS operating parameters
are summarised in Table S2. In order to quantify the analytical results of ICP-MS, the internal
and external standard additions modes were used. All standards were prepared in a 2% aqueous
solution of HNO3. Single element stock solutions (Sigma Aldrich, UK) of 32 metals, namely
Na, Mg, Al, Si, P, K, Ca, Ti, V, Cr, Mn, Fe, Co, Ni, Cu, Zn, Rb, Sr, Zr, Ru, Rh, Pd, Ag, Cd,
Sn, Sb, Te, Hf, Ir, Pt, Au, and Hg at a 1000 ppm concentration were used to prepare the
standards for external calibration. The calibration curve and corresponding correlation
coefficient (R2 > 0.99) for each metal element used are presented in the Figures S2−S4. Indium
at 1 ppm was employed as internal standard. Pure water and BNB suspensions were acidified
using 2 % HNO3 prior to ICP-MS sampling. Samples were supplied to the nebulizer in
continuous mode with the spectrometer peristaltic pump using flared end PVC-based tubing of
0.19 mm internal diameter.
Table S2. ICP-MS operating parameters.
Parameter Value
RF applied power (kW) 1.6 kWAuxiliary gas flow rate (Argon) 1.2 L.min˗1
Plasma gas flow (Argon) 18 L.min˗1
Nebulizer gas flow (Argon) 0.95 L.min˗1
Sample flow rate 0.3 mL.min˗1
KED Gas Flow (Helium) 4 mL.min˗1
Nebulizer type Sea Spray concentricInterface cone material NickelAnalog stage voltage ˗1675Pulse stage voltage 1050 VDiscriminator threshold 12 mVDeflector voltage ˗ 10 VQuadrupole rod offset ˗ 12 VCell entrance voltage ˗ 9 VCell exit voltage ˗ 20 VCell rod offset ˗ 15 VAxial field voltage 475 V
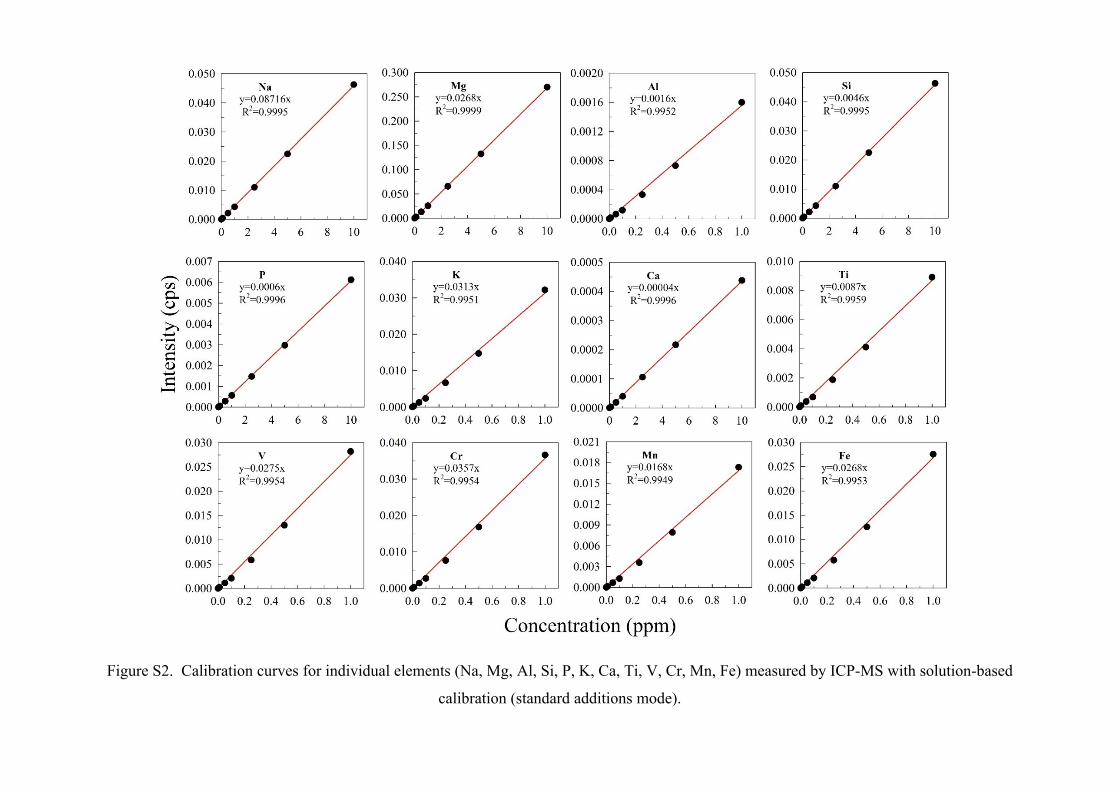
Figure S2. Calibration curves for individual elements (Na, Mg, Al, Si, P, K, Ca, Ti, V, Cr, Mn, Fe) measured by ICP-MS with solution-based
calibration (standard additions mode).
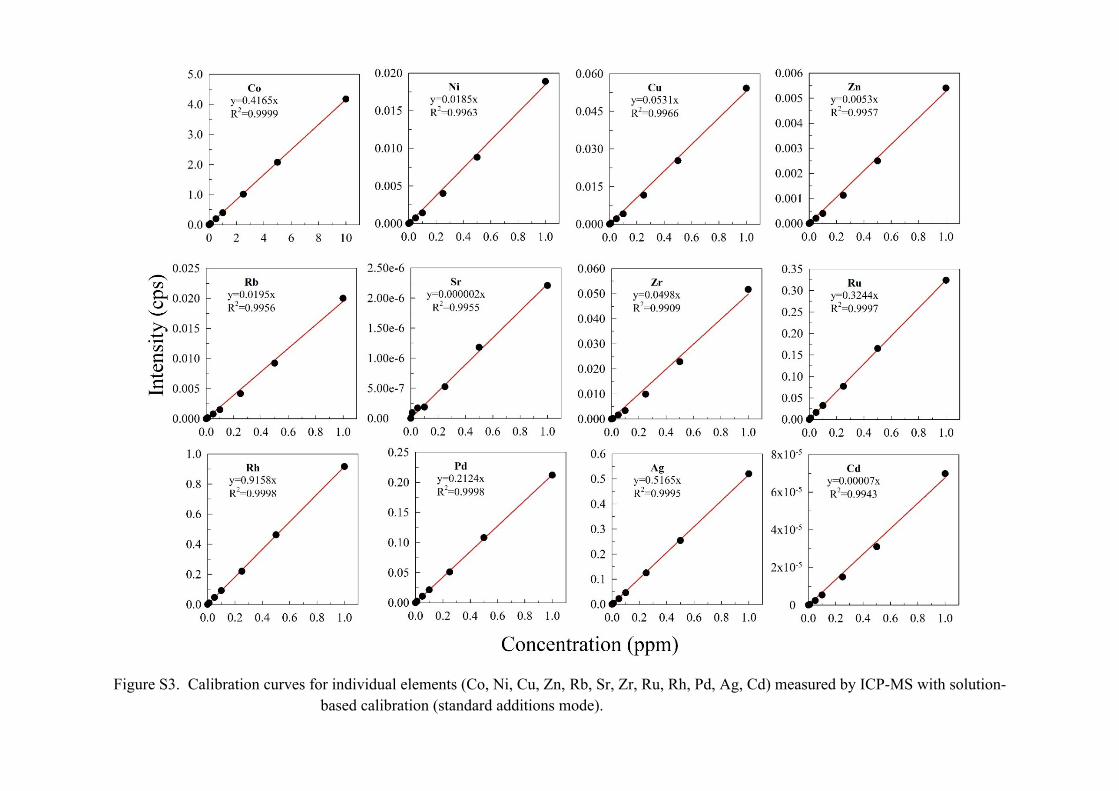
Figure S3. Calibration curves for individual elements (Co, Ni, Cu, Zn, Rb, Sr, Zr, Ru, Rh, Pd, Ag, Cd) measured by ICP-MS with solution-based calibration (standard additions mode).
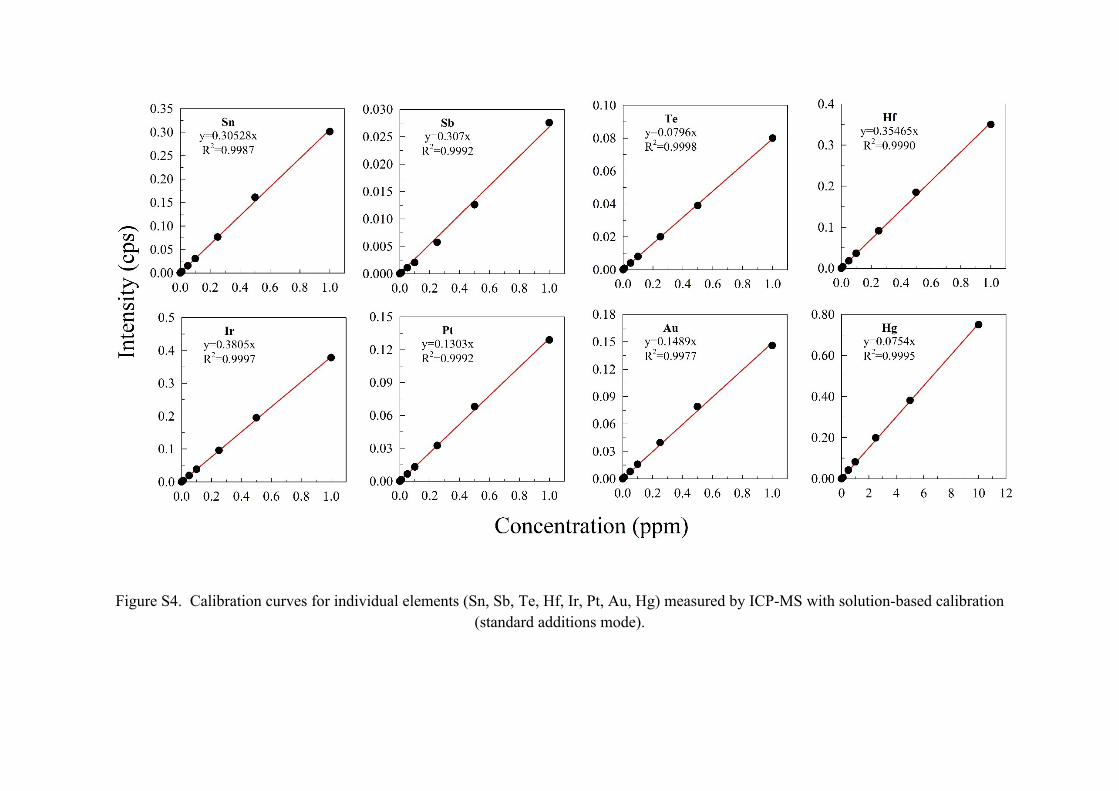
Figure S4. Calibration curves for individual elements (Sn, Sb, Te, Hf, Ir, Pt, Au, Hg) measured by ICP-MS with solution-based calibration (standard additions mode).
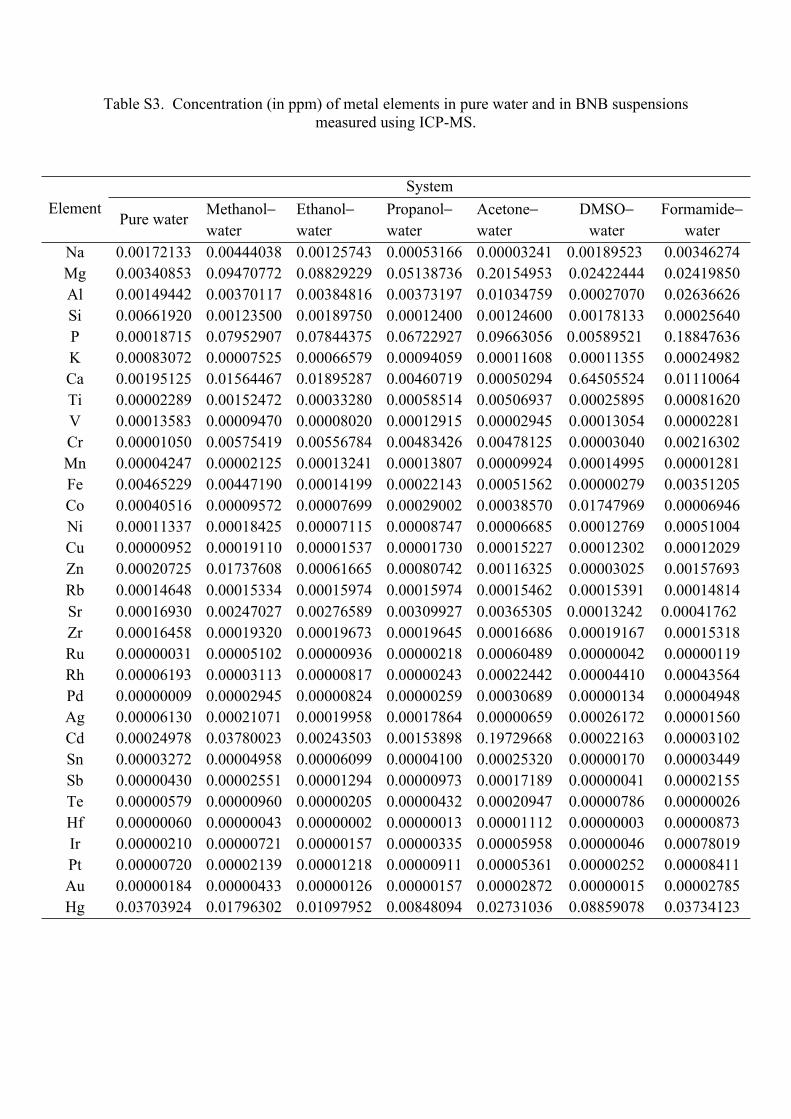
Table S3. Concentration (in ppm) of metal elements in pure water and in BNB suspensions measured using ICP-MS.
SystemElement
Pure water Methanolwater
Ethanol water
Propanol water
Acetonewater
DMSO water
Formamide water
Na 0.00172133 0.00444038 0.00125743 0.00053166 0.00003241 0.00189523 0.00346274Mg 0.00340853 0.09470772 0.08829229 0.05138736 0.20154953 0.02422444 0.02419850Al 0.00149442 0.00370117 0.00384816 0.00373197 0.01034759 0.00027070 0.02636626Si 0.00661920 0.00123500 0.00189750 0.00012400 0.00124600 0.00178133 0.00025640P 0.00018715 0.07952907 0.07844375 0.06722927 0.09663056 0.00589521 0.18847636K 0.00083072 0.00007525 0.00066579 0.00094059 0.00011608 0.00011355 0.00024982Ca 0.00195125 0.01564467 0.01895287 0.00460719 0.00050294 0.64505524 0.01110064Ti 0.00002289 0.00152472 0.00033280 0.00058514 0.00506937 0.00025895 0.00081620V 0.00013583 0.00009470 0.00008020 0.00012915 0.00002945 0.00013054 0.00002281Cr 0.00001050 0.00575419 0.00556784 0.00483426 0.00478125 0.00003040 0.00216302Mn 0.00004247 0.00002125 0.00013241 0.00013807 0.00009924 0.00014995 0.00001281Fe 0.00465229 0.00447190 0.00014199 0.00022143 0.00051562 0.00000279 0.00351205Co 0.00040516 0.00009572 0.00007699 0.00029002 0.00038570 0.01747969 0.00006946Ni 0.00011337 0.00018425 0.00007115 0.00008747 0.00006685 0.00012769 0.00051004Cu 0.00000952 0.00019110 0.00001537 0.00001730 0.00015227 0.00012302 0.00012029Zn 0.00020725 0.01737608 0.00061665 0.00080742 0.00116325 0.00003025 0.00157693Rb 0.00014648 0.00015334 0.00015974 0.00015974 0.00015462 0.00015391 0.00014814Sr 0.00016930 0.00247027 0.00276589 0.00309927 0.00365305 0.00013242 0.00041762Zr 0.00016458 0.00019320 0.00019673 0.00019645 0.00016686 0.00019167 0.00015318Ru 0.00000031 0.00005102 0.00000936 0.00000218 0.00060489 0.00000042 0.00000119Rh 0.00006193 0.00003113 0.00000817 0.00000243 0.00022442 0.00004410 0.00043564Pd 0.00000009 0.00002945 0.00000824 0.00000259 0.00030689 0.00000134 0.00004948Ag 0.00006130 0.00021071 0.00019958 0.00017864 0.00000659 0.00026172 0.00001560Cd 0.00024978 0.03780023 0.00243503 0.00153898 0.19729668 0.00022163 0.00003102Sn 0.00003272 0.00004958 0.00006099 0.00004100 0.00025320 0.00000170 0.00003449Sb 0.00000430 0.00002551 0.00001294 0.00000973 0.00017189 0.00000041 0.00002155Te 0.00000579 0.00000960 0.00000205 0.00000432 0.00020947 0.00000786 0.00000026Hf 0.00000060 0.00000043 0.00000002 0.00000013 0.00001112 0.00000003 0.00000873Ir 0.00000210 0.00000721 0.00000157 0.00000335 0.00005958 0.00000046 0.00078019Pt 0.00000720 0.00002139 0.00001218 0.00000911 0.00005361 0.00000252 0.00008411Au 0.00000184 0.00000433 0.00000126 0.00000157 0.00002872 0.00000015 0.00002785Hg 0.03703924 0.01796302 0.01097952 0.00848094 0.02731036 0.08859078 0.03734123


