Embed Size (px)
Citation preview
Surface Tension of Supercooled Water Determined by Using aCounterpressure Capillary Rise MethodVaclav Vins,*,† Maurice Fransen,†,‡ Jirí Hykl,† and Jan Hruby †
†Institute of Thermomechanics of the CAS, v. v. i., Dolejskova 5, Prague 8, 182 00, Czech Republic‡Eindhoven University of Technology, Den Dolech 2, 5612 AZ Eindhoven, The Netherlands
*S Supporting Information
ABSTRACT: Measurements of the surface tension of supercooled water down to −25 °C have beenreported recently (Hruby et al. J. Phys. Chem. Lett. 2014, 5, 425−428). These experiments did notshow any anomalous temperature dependence of the surface tension of supercooled water reported bysome earlier measurements and molecular simulations. In the present work, this finding is confirmedusing a counterpressure capillary rise method (the counterpressure method) as well as through the useof the classical capillary rise method (the height method). In the counterpressure method, the liquidmeniscus inside the vertical capillary tube was kept at a fixed position with an in-house developedhelium distribution setup. A preset counterpressure was applied to the liquid meniscus when itstemperature changed from a reference temperature (30 °C) to the temperature of interest. Themagnitude of the counterpressure was adjusted such that the meniscus remained at the same height,thus compensating the change of the surface tension. One advantage of the counterpressure methodover the height method consists of avoiding the uncertainty due to a possible variation of the capillary diameter along its length. Asecond advantage is that the equilibration time due to the capillary flow of the highly viscous supercooled water can be shortened.For both the counterpressure method and the height method, the actual results are relative values of surface tension with respect tothe surface tension of water at the reference temperature. The combined relative standard uncertainty of the relative surfacetensions is less than or equal to 0.18%. The new data between −26 and +30 °C lie close to the IAPWS correlation for the surfacetension of ordinary water extrapolated below 0.01 °C and do not exhibit any anomalous features.
■ INTRODUCTION
The surface tension of supercooled liquids, in particular, waterand aqueous mixtures, is an important property both inacademia and in industry. It plays an essential role inatmospheric research of the nucleation and growth of waterdroplets1 and ice crystals.2 It is known that water in clouds canpersist in a supercooled liquid form at temperatures down to−38 °C.3 Manka et al.4 recently showed that liquid waternanodroplets rather than ice crystals form by homogeneousnucleation at temperatures down to −73 °C. Reliable data forthe surface tension of supercooled aqueous systems are alsoimportant in technical applications such as operation of windturbines,5 aircraft icing,6 or design of secondary refrigerationsystems operating with brine.7
Compared to other fluids, water shows several anomalies atlow temperatures, e.g., the well-known maximum in the liquiddensity at +4 °C at atmospheric pressure. The unusual behaviorof liquid water becomes more distinct in the metastablesupercooled region below 0 °C. For instance, the isobaric heatcapacity and the isothermal compressibility seemingly diverge(or approach a sharp maximum) when extrapolated totemperatures around −45 °C, i.e., below the homogeneousnucleation temperature TH = −38 °C at atmospheric pressure.8
On the basis of both the experimental and theoretical studies,Mishima and Stanley9 proposed an explanation for some ofthese anomalies. The liquid−liquid phase transition (LLPT)hypothesis with the hypothesized second critical point of water
seems to provide a rational explanation of the anomalousthermophysical properties of supercooled water.10−12
Early measurements of the surface tension at subzerotemperatures13,14 indicated another anomaly of supercooledwater: a distinct change in the temperature trend, called thesecond inflection point (SIP), in the surface tension ofwater.15,16 Feeney and Debenedetti17 supported the existenceof SIP with their model based on the van der Waals theory ofinterfaces combined with the LLPT hypothesis. Molecularsimulations by Lu and Wei18 also pointed to the existence ofSIP at temperatures around +30 °C. On the other hand, othermolecular simulations, e.g., by Chen and Smith19 or Viererblova and Kolafa,20 did not indicate this anomaly. New measurementsperformed in this study down to −26 °C show that the SIPanomaly expected in the temperature range from +30 to −9 °Cseems to be an artifact in older experiments and molecularsimulations.Methods to measure the surface tension have been reviewed,
e.g., by Franses et al.21 or Adamson and Gast.22 The usualtensiometric techniques cannot be employed for measurementsunder metastable supercooled conditions, because they requirerelatively large volumes of the liquid. The probability of theappearance of an ice nucleus within the time scale of the
Received: January 19, 2015Revised: March 4, 2015
Article
pubs.acs.org/JPCB
© XXXX American Chemical Society A DOI: 10.1021/acs.jpcb.5b00545J. Phys. Chem. B XXXX, XXX, XXX−XXX
experiment is proportional to the sample volume.23 Moreover,small samples can be cooled more rapidly and the experimentaltime scale can be shortened. It is thus desirable that the samplevolume under the metastable condition is as small as possible.Furthermore, contacts with solid surfaces promoting crystal-lization must be avoided and the liquid samples have to bechemically pure and free of mechanical particles to suppressheterogeneous ice nucleation. Consequently, the methods usedsuccessfully for the measurement of the surface tension ofsupercooled water employ short columns of liquid in glass orfused silica capillary tubes.14,16,24
In the early days of surface tension measurement, the purityof water samples and the quality of capillary tubes weretroublesome criteria. Nonetheless, in 1895, Humphreys andMohler13 managed to measure the surface tension of pure waterat subzero temperatures down to −8 °C using the capillary risetechnique. The first extensive data set for the surface tension ofsupercooled water was reported by Hacker14 in 1951. Hacker’smeasurements were based on a method developed by Fergusonand Kennedy,25 who used a horizontally oriented capillary tube,partially filled with liquid, with a gas counterpressure applied toone end of the capillary tube. A short water thread was loadedinto the capillary tube such that one liquid meniscus waslocated at the planar open end of the capillary tube.The shapeof the outer meniscus was at first concave but gradually becameplanar and, subsequently, changed into convex by applying anincreasing counterpressure at the other end of the capillarytube.The surface tension could be determined from the
counterpressure corresponding to the plane meniscus byemploying the Young−Laplace equation given as follows
σθ
=Δpd
4 cos (1)
In eq 1, Δp denotes the pressure difference compared with thebarometric pressure, d marks the inner diameter of the capillarytube, and θ is the contact angle between water and the capillarywall, usually considered equal to zero for glass or fused silica.Hacker’s data, measured down to −22.5 °C, showed a clearinflection point at subzero temperatures (SIP) around −9 °C.Existence of SIP could not be confirmed nor denied by
subsequent measurements made by Floriano and Angell24 andTrinh and Ohsaka,26 as both data sets showed relatively largescatter. Furthermore, the data by Trinh and Ohsaka26 mighthave suffered from an experimental artifact, as it shows asignificant offset from the IAPWS (International Association forthe Properties of Water and Steam) standard for the surfacetension of ordinary water27 above the triple point. The IAPWScorrelation approved for use at temperatures between the triplepoint and the critical point of water has the following form
σ τ τ= +μT B b( ) (1 )corr (2)
where σcorr denotes the correlated surface tension, τ = (Tc −T)/(Tc + 273.15) is the dimensionless distance from the criticaltemperature Tc = 373.946 °C, μ = 1.256 is a universal criticalexponent, and the coefficients B and b have values235.8 mN·m−1 and −0.625, respectively. Equation 2 is basedon the correlation of Vargaftik et al.28 updated by IAPWS forthe ITS-90 temperature scale. It shows one inflection point at atemperature of 256.46 °C.Recently, our group managed to make an important
breakthrough in the discussion about SIP. Measurements byHruby et al.16 did not confirm the existence of SIP or any other
anomaly in the temperature course of the surface tension ofsupercooled water down to −25 °C. The data collected on twodifferent apparatuses by two independent research groups fromPrague and from Pilsen were in mutual agreement and could berelatively well reproduced by the IAPWS correlation (eq 2)extrapolated below 0.01 °C. Both experimental setups werebased on the classical capillary rise technique modified foroperation under the metastable supercooled conditions.In this study, new data sets verifying our previous
measurements16,29 were collected. The Prague setup wasmodified such that it could be used for two slightly differentmeasuring techniques: a classical capillary rise method (heighttechnique) with improved accuracy and a new approach basedon the counterpressure capillary rise method (counterpressuretechnique). The main goals of the present study were toimprove the original measuring technique and to obtain a newconsistent data set at a high degree of supercooling with smalleruncertainty. A more comprehensive description of theexperimental setup and the evaluation of the surface tensionis provided in comparison with the previous study.16
■ EXPERIMENTAL METHODS
The counterpressure method, combining the classical capillaryrise method with the counterpressure of inert gas, has beendeveloped and used for measuring the surface tension ofsupercooled water. The liquid column elevated in a verticalcapillary tube was kept at a constant height with the help of anin-house developed helium distribution setup. A counter-pressure of helium was adjusted such that it compensated thechange of the surface tension due to the temperature jump.Keeping the liquid meniscus at a fixed position within thecapillary tube avoided the uncertainty from a possible variationof the capillary tube inner diameter along its length. Moreover,the equilibration time of the capillary flow of highly viscoussupercooled water was reduced in the counterpressure methodbecause of a constant height of the elevated liquid column. Inaddition to the counterpressure method, the classical capillaryrise technique was employed for comparison. The heighttechnique provided more accurate results compared to theprevious study16 thanks to a new device for the heightmeasurement.
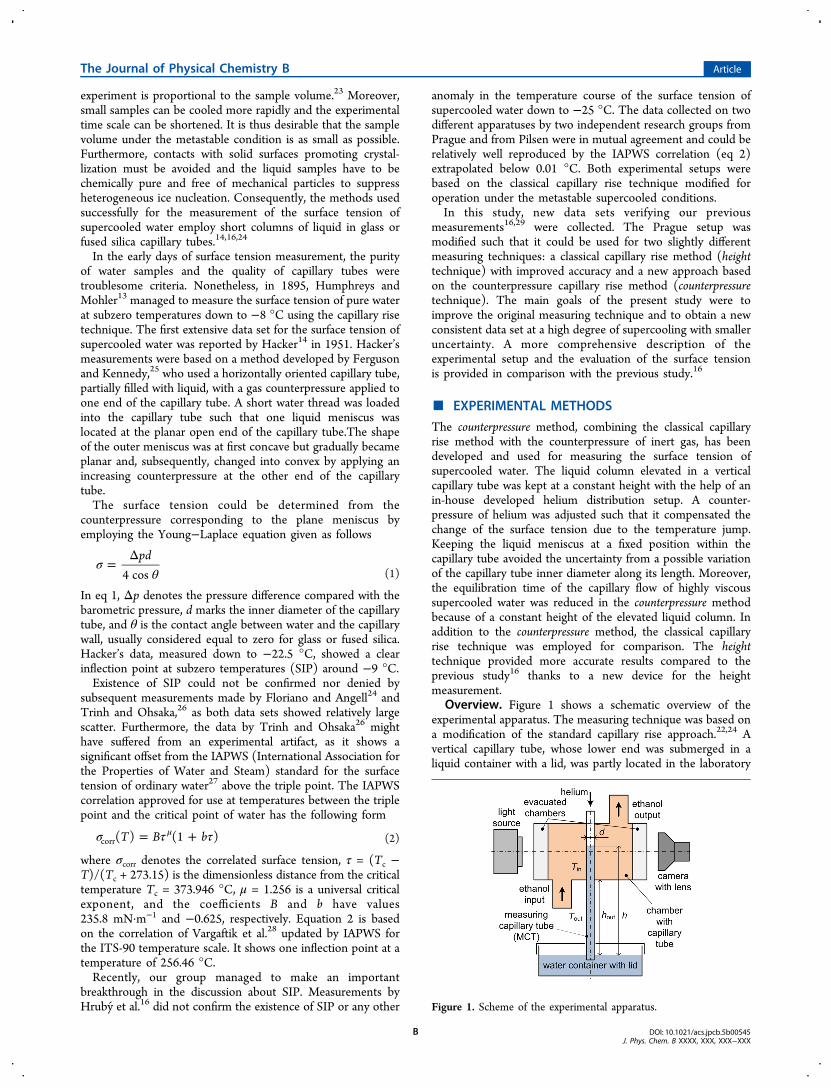
Overview. Figure 1 shows a schematic overview of theexperimental apparatus. The measuring technique was based ona modification of the standard capillary rise approach.22,24 Avertical capillary tube, whose lower end was submerged in aliquid container with a lid, was partly located in the laboratory
Figure 1. Scheme of the experimental apparatus.
The Journal of Physical Chemistry B Article
DOI: 10.1021/acs.jpcb.5b00545J. Phys. Chem. B XXXX, XXX, XXX−XXX
B
environment and partly in a special in-house designed glasschamber. The lower part of the capillary tube together with thewater container was kept at the ambient temperature Tout. Theliquid container was positioned in such a way that the upperliquid meniscus inside the measuring capillary tube (MCT) waslocated approximately in the center of the glass chamber. Theheight of the outer part of the capillary tube slightly variedaround hout = 60 mm. An external fan was blowing ambient airon the capillary tube to ensure a constant temperature Toutalong the entire outer part. The upper part of the capillary tube,mounted in the glass chamber with inner temperature Tin, had alength of 45 mm. The liquid column inside the capillary tubeelevated to a certain total height h resulting from theequilibrium between the surface forces and the pressuredifference Δp in the Young−Laplace equation (eq 1).The cylindrical glass chamber, insulated with 10 mm thick
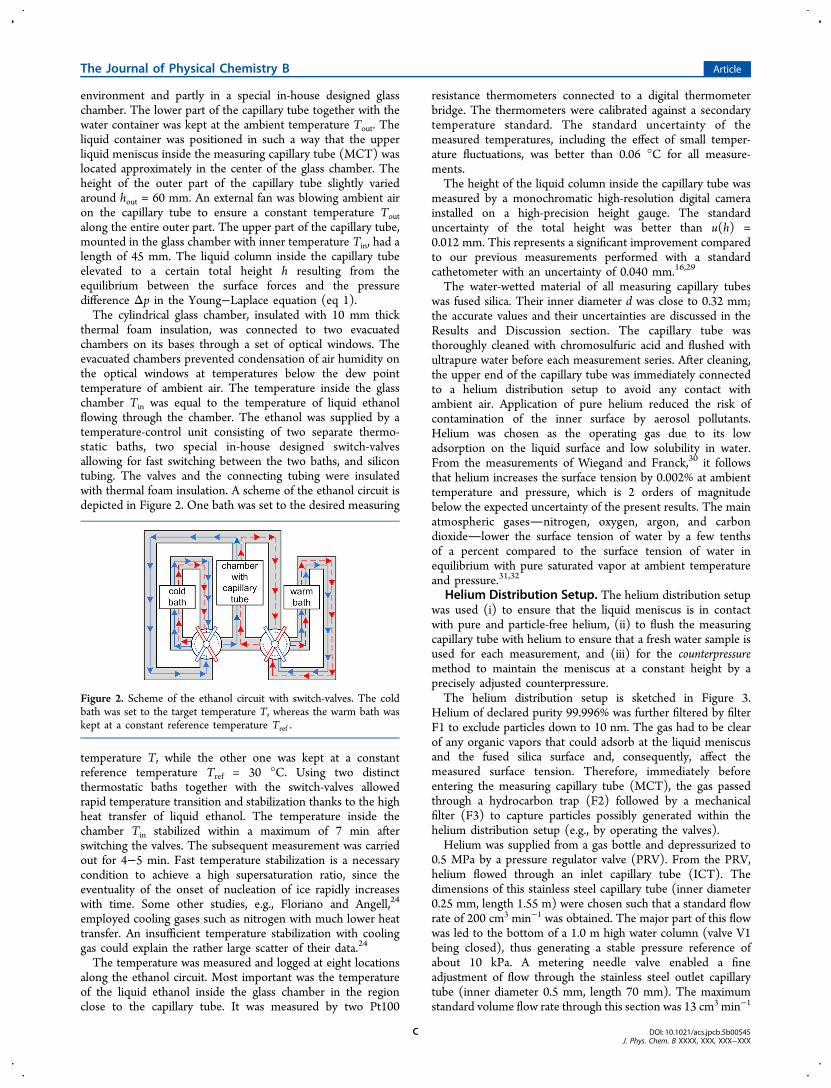
thermal foam insulation, was connected to two evacuatedchambers on its bases through a set of optical windows. Theevacuated chambers prevented condensation of air humidity onthe optical windows at temperatures below the dew pointtemperature of ambient air. The temperature inside the glasschamber Tin was equal to the temperature of liquid ethanolflowing through the chamber. The ethanol was supplied by atemperature-control unit consisting of two separate thermo-static baths, two special in-house designed switch-valvesallowing for fast switching between the two baths, and silicontubing. The valves and the connecting tubing were insulatedwith thermal foam insulation. A scheme of the ethanol circuit isdepicted in Figure 2. One bath was set to the desired measuring
temperature T, while the other one was kept at a constantreference temperature Tref = 30 °C. Using two distinctthermostatic baths together with the switch-valves allowedrapid temperature transition and stabilization thanks to the highheat transfer of liquid ethanol. The temperature inside thechamber Tin stabilized within a maximum of 7 min afterswitching the valves. The subsequent measurement was carriedout for 4−5 min. Fast temperature stabilization is a necessarycondition to achieve a high supersaturation ratio, since theeventuality of the onset of nucleation of ice rapidly increaseswith time. Some other studies, e.g., Floriano and Angell,24
employed cooling gases such as nitrogen with much lower heattransfer. An insufficient temperature stabilization with coolinggas could explain the rather large scatter of their data.24
The temperature was measured and logged at eight locationsalong the ethanol circuit. Most important was the temperatureof the liquid ethanol inside the glass chamber in the regionclose to the capillary tube. It was measured by two Pt100
resistance thermometers connected to a digital thermometerbridge. The thermometers were calibrated against a secondarytemperature standard. The standard uncertainty of themeasured temperatures, including the effect of small temper-ature fluctuations, was better than 0.06 °C for all measure-ments.The height of the liquid column inside the capillary tube was
measured by a monochromatic high-resolution digital camerainstalled on a high-precision height gauge. The standarduncertainty of the total height was better than u(h) =0.012 mm. This represents a significant improvement comparedto our previous measurements performed with a standardcathetometer with an uncertainty of 0.040 mm.16,29
The water-wetted material of all measuring capillary tubeswas fused silica. Their inner diameter d was close to 0.32 mm;the accurate values and their uncertainties are discussed in theResults and Discussion section. The capillary tube wasthoroughly cleaned with chromosulfuric acid and flushed withultrapure water before each measurement series. After cleaning,the upper end of the capillary tube was immediately connectedto a helium distribution setup to avoid any contact withambient air. Application of pure helium reduced the risk ofcontamination of the inner surface by aerosol pollutants.Helium was chosen as the operating gas due to its lowadsorption on the liquid surface and low solubility in water.From the measurements of Wiegand and Franck,30 it followsthat helium increases the surface tension by 0.002% at ambienttemperature and pressure, which is 2 orders of magnitudebelow the expected uncertainty of the present results. The mainatmospheric gasesnitrogen, oxygen, argon, and carbondioxidelower the surface tension of water by a few tenthsof a percent compared to the surface tension of water inequilibrium with pure saturated vapor at ambient temperatureand pressure.31,32
Helium Distribution Setup. The helium distribution setupwas used (i) to ensure that the liquid meniscus is in contactwith pure and particle-free helium, (ii) to flush the measuringcapillary tube with helium to ensure that a fresh water sample isused for each measurement, and (iii) for the counterpressuremethod to maintain the meniscus at a constant height by aprecisely adjusted counterpressure.The helium distribution setup is sketched in Figure 3.
Helium of declared purity 99.996% was further filtered by filterF1 to exclude particles down to 10 nm. The gas had to be clearof any organic vapors that could adsorb at the liquid meniscusand the fused silica surface and, consequently, affect themeasured surface tension. Therefore, immediately beforeentering the measuring capillary tube (MCT), the gas passedthrough a hydrocarbon trap (F2) followed by a mechanicalfilter (F3) to capture particles possibly generated within thehelium distribution setup (e.g., by operating the valves).Helium was supplied from a gas bottle and depressurized to
0.5 MPa by a pressure regulator valve (PRV). From the PRV,helium flowed through an inlet capillary tube (ICT). Thedimensions of this stainless steel capillary tube (inner diameter0.25 mm, length 1.55 m) were chosen such that a standard flowrate of 200 cm3 min−1 was obtained. The major part of this flowwas led to the bottom of a 1.0 m high water column (valve V1being closed), thus generating a stable pressure reference ofabout 10 kPa. A metering needle valve enabled a fineadjustment of flow through the stainless steel outlet capillarytube (inner diameter 0.5 mm, length 70 mm). The maximumstandard volume flow rate through this section was 13 cm3 min−1
Figure 2. Scheme of the ethanol circuit with switch-valves. The coldbath was set to the target temperature T, whereas the warm bath waskept at a constant reference temperature Tref .
The Journal of Physical Chemistry B Article
DOI: 10.1021/acs.jpcb.5b00545J. Phys. Chem. B XXXX, XXX, XXX−XXX
C
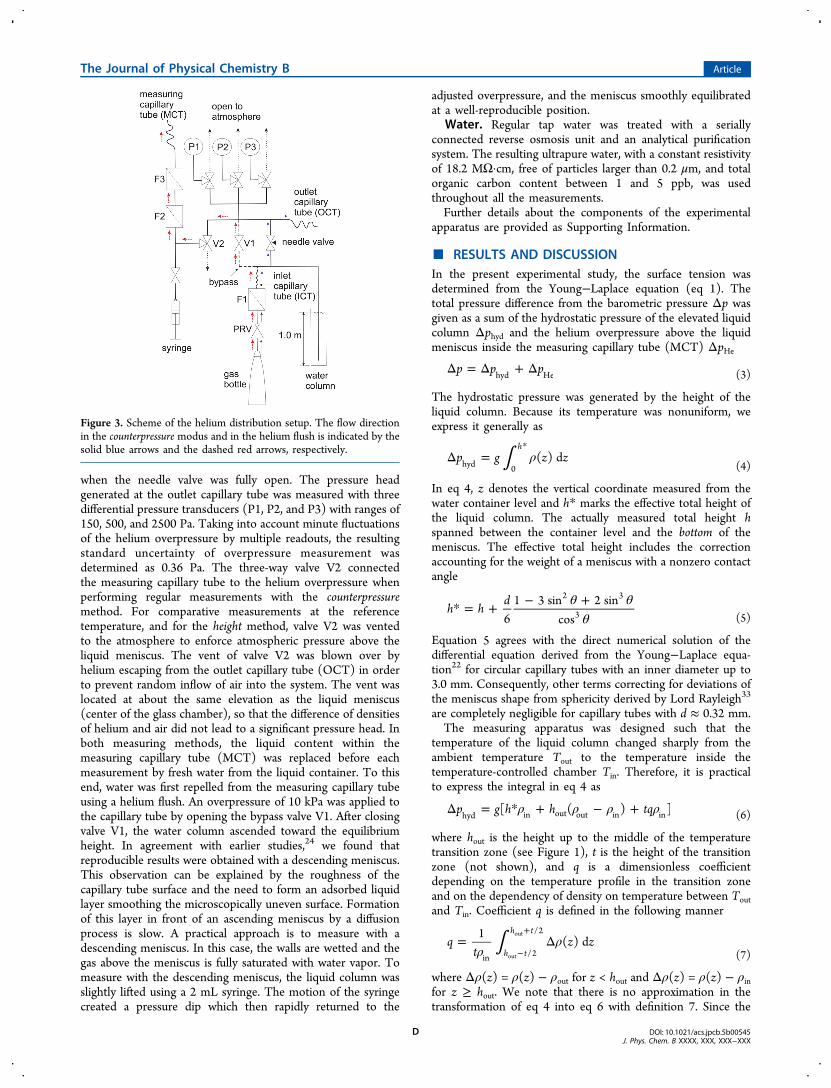
when the needle valve was fully open. The pressure headgenerated at the outlet capillary tube was measured with threedifferential pressure transducers (P1, P2, and P3) with ranges of150, 500, and 2500 Pa. Taking into account minute fluctuationsof the helium overpressure by multiple readouts, the resultingstandard uncertainty of overpressure measurement wasdetermined as 0.36 Pa. The three-way valve V2 connectedthe measuring capillary tube to the helium overpressure whenperforming regular measurements with the counterpressuremethod. For comparative measurements at the referencetemperature, and for the height method, valve V2 was ventedto the atmosphere to enforce atmospheric pressure above theliquid meniscus. The vent of valve V2 was blown over byhelium escaping from the outlet capillary tube (OCT) in orderto prevent random inflow of air into the system. The vent waslocated at about the same elevation as the liquid meniscus(center of the glass chamber), so that the difference of densitiesof helium and air did not lead to a significant pressure head. Inboth measuring methods, the liquid content within themeasuring capillary tube (MCT) was replaced before eachmeasurement by fresh water from the liquid container. To thisend, water was first repelled from the measuring capillary tubeusing a helium flush. An overpressure of 10 kPa was applied tothe capillary tube by opening the bypass valve V1. After closingvalve V1, the water column ascended toward the equilibriumheight. In agreement with earlier studies,24 we found thatreproducible results were obtained with a descending meniscus.This observation can be explained by the roughness of thecapillary tube surface and the need to form an adsorbed liquidlayer smoothing the microscopically uneven surface. Formationof this layer in front of an ascending meniscus by a diffusionprocess is slow. A practical approach is to measure with adescending meniscus. In this case, the walls are wetted and thegas above the meniscus is fully saturated with water vapor. Tomeasure with the descending meniscus, the liquid column wasslightly lifted using a 2 mL syringe. The motion of the syringecreated a pressure dip which then rapidly returned to the
adjusted overpressure, and the meniscus smoothly equilibratedat a well-reproducible position.
Water. Regular tap water was treated with a seriallyconnected reverse osmosis unit and an analytical purificationsystem. The resulting ultrapure water, with a constant resistivityof 18.2 MΩ·cm, free of particles larger than 0.2 μm, and totalorganic carbon content between 1 and 5 ppb, was usedthroughout all the measurements.Further details about the components of the experimental
apparatus are provided as Supporting Information.
■ RESULTS AND DISCUSSIONIn the present experimental study, the surface tension wasdetermined from the Young−Laplace equation (eq 1). Thetotal pressure difference from the barometric pressure Δp wasgiven as a sum of the hydrostatic pressure of the elevated liquidcolumn Δphyd and the helium overpressure above the liquidmeniscus inside the measuring capillary tube (MCT) ΔpHe
Δ = Δ + Δp p phyd He (3)
The hydrostatic pressure was generated by the height of theliquid column. Because its temperature was nonuniform, weexpress it generally as
∫ ρΔ =*
p g z z( ) dh
hyd 0 (4)
In eq 4, z denotes the vertical coordinate measured from thewater container level and h* marks the effective total height ofthe liquid column. The actually measured total height hspanned between the container level and the bottom of themeniscus. The effective total height includes the correctionaccounting for the weight of a meniscus with a nonzero contactangle
θ θθ
* = + − +h h
d6
1 3 sin 2 sincos
2 3
3 (5)
Equation 5 agrees with the direct numerical solution of thedifferential equation derived from the Young−Laplace equa-tion22 for circular capillary tubes with an inner diameter up to3.0 mm. Consequently, other terms correcting for deviations ofthe meniscus shape from sphericity derived by Lord Rayleigh33
are completely negligible for capillary tubes with d ≈ 0.32 mm.The measuring apparatus was designed such that the
temperature of the liquid column changed sharply from theambient temperature Tout to the temperature inside thetemperature-controlled chamber Tin. Therefore, it is practicalto express the integral in eq 4 as
ρ ρ ρ ρΔ = * + − +p g h h tq[ ( ) ]hyd in out out in in (6)
where hout is the height up to the middle of the temperaturetransition zone (see Figure 1), t is the height of the transitionzone (not shown), and q is a dimensionless coefficientdepending on the temperature profile in the transition zoneand on the dependency of density on temperature between Toutand Tin. Coefficient q is defined in the following manner
∫ρρ= Δ
−
+q
tz z
1( ) d
h t
h t
in /2
/2
out
out
(7)
where Δρ(z) = ρ(z) − ρout for z < hout and Δρ(z) = ρ(z) − ρinfor z ≥ hout. We note that there is no approximation in thetransformation of eq 4 into eq 6 with definition 7. Since the
Figure 3. Scheme of the helium distribution setup. The flow directionin the counterpressure modus and in the helium flush is indicated by thesolid blue arrows and the dashed red arrows, respectively.
The Journal of Physical Chemistry B Article
DOI: 10.1021/acs.jpcb.5b00545J. Phys. Chem. B XXXX, XXX, XXX−XXX
D
height of the transition zone was quite small, it suffices toconsider a linear temperature profile T(z) in the transition zonehout − t/2 < z < hout + t/2, allowing to express coefficient qexclusively based on the dependency ρ(T) as
∫ρρ=
−Δq
T TT T
1( )
( ) dT
T
in out in out
in
(8)
where Δρ(T) = ρ(T) − ρout if T − (Tout + Tin)/2 has theopposite sign as T − Tout and Δρ(T) = ρ(T) − ρin otherwise.Equation 6 is written in a form allowing one to appreciate the
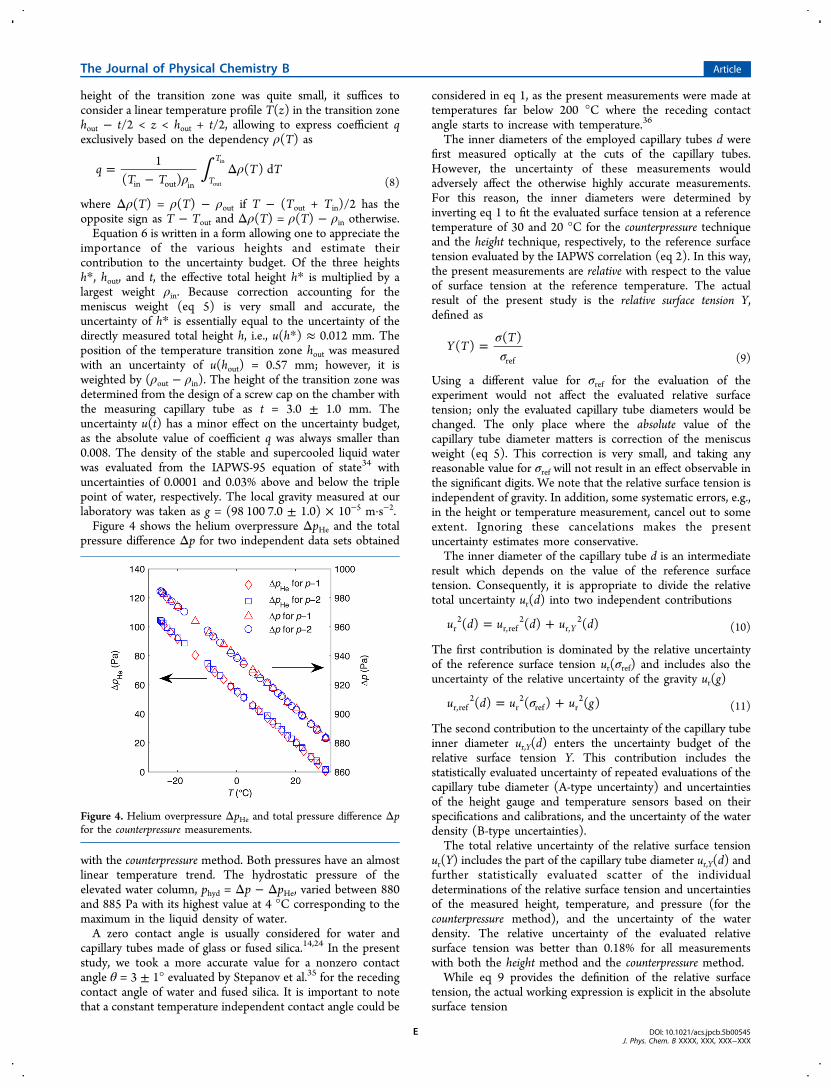
importance of the various heights and estimate theircontribution to the uncertainty budget. Of the three heightsh*, hout, and t, the effective total height h* is multiplied by alargest weight ρin. Because correction accounting for themeniscus weight (eq 5) is very small and accurate, theuncertainty of h* is essentially equal to the uncertainty of thedirectly measured total height h, i.e., u(h*) ≈ 0.012 mm. Theposition of the temperature transition zone hout was measuredwith an uncertainty of u(hout) = 0.57 mm; however, it isweighted by (ρout − ρin). The height of the transition zone wasdetermined from the design of a screw cap on the chamber withthe measuring capillary tube as t = 3.0 ± 1.0 mm. Theuncertainty u(t) has a minor effect on the uncertainty budget,as the absolute value of coefficient q was always smaller than0.008. The density of the stable and supercooled liquid waterwas evaluated from the IAPWS-95 equation of state34 withuncertainties of 0.0001 and 0.03% above and below the triplepoint of water, respectively. The local gravity measured at ourlaboratory was taken as g = (98 100 7.0 ± 1.0) × 10−5 m·s−2.Figure 4 shows the helium overpressure ΔpHe and the total
pressure difference Δp for two independent data sets obtained
with the counterpressure method. Both pressures have an almostlinear temperature trend. The hydrostatic pressure of theelevated water column, phyd = Δp − ΔpHe, varied between 880and 885 Pa with its highest value at 4 °C corresponding to themaximum in the liquid density of water.A zero contact angle is usually considered for water and
capillary tubes made of glass or fused silica.14,24 In the presentstudy, we took a more accurate value for a nonzero contactangle θ = 3 ± 1° evaluated by Stepanov et al.35 for the recedingcontact angle of water and fused silica. It is important to notethat a constant temperature independent contact angle could be
considered in eq 1, as the present measurements were made attemperatures far below 200 °C where the receding contactangle starts to increase with temperature.36
The inner diameters of the employed capillary tubes d werefirst measured optically at the cuts of the capillary tubes.However, the uncertainty of these measurements wouldadversely affect the otherwise highly accurate measurements.For this reason, the inner diameters were determined byinverting eq 1 to fit the evaluated surface tension at a referencetemperature of 30 and 20 °C for the counterpressure techniqueand the height technique, respectively, to the reference surfacetension evaluated by the IAPWS correlation (eq 2). In this way,the present measurements are relative with respect to the valueof surface tension at the reference temperature. The actualresult of the present study is the relative surface tension Y,defined as
σσ
=Y TT
( )( )
ref (9)
Using a different value for σref for the evaluation of theexperiment would not affect the evaluated relative surfacetension; only the evaluated capillary tube diameters would bechanged. The only place where the absolute value of thecapillary tube diameter matters is correction of the meniscusweight (eq 5). This correction is very small, and taking anyreasonable value for σref will not result in an effect observable inthe significant digits. We note that the relative surface tension isindependent of gravity. In addition, some systematic errors, e.g.,in the height or temperature measurement, cancel out to someextent. Ignoring these cancelations makes the presentuncertainty estimates more conservative.The inner diameter of the capillary tube d is an intermediate
result which depends on the value of the reference surfacetension. Consequently, it is appropriate to divide the relativetotal uncertainty ur(d) into two independent contributions
= +u d u d u d( ) ( ) ( )Yr2
r,ref2
r,2
(10)
The first contribution is dominated by the relative uncertaintyof the reference surface tension ur(σref) and includes also theuncertainty of the relative uncertainty of the gravity ur(g)
σ= +u d u u g( ) ( ) ( )r,ref2
r2
ref r2
(11)
The second contribution to the uncertainty of the capillary tubeinner diameter ur,Y(d) enters the uncertainty budget of therelative surface tension Y. This contribution includes thestatistically evaluated uncertainty of repeated evaluations of thecapillary tube diameter (A-type uncertainty) and uncertaintiesof the height gauge and temperature sensors based on theirspecifications and calibrations, and the uncertainty of the waterdensity (B-type uncertainties).The total relative uncertainty of the relative surface tension
ur(Y) includes the part of the capillary tube diameter ur,Y(d) andfurther statistically evaluated scatter of the individualdeterminations of the relative surface tension and uncertaintiesof the measured height, temperature, and pressure (for thecounterpressure method), and the uncertainty of the waterdensity. The relative uncertainty of the evaluated relativesurface tension was better than 0.18% for all measurementswith both the height method and the counterpressure method.While eq 9 provides the definition of the relative surface
tension, the actual working expression is explicit in the absolutesurface tension
Figure 4. Helium overpressure ΔpHe and total pressure difference Δpfor the counterpressure measurements.
The Journal of Physical Chemistry B Article
DOI: 10.1021/acs.jpcb.5b00545J. Phys. Chem. B XXXX, XXX, XXX−XXX
E
σ σ=T Y T( ) ( ) ref (12)
As explained before, the experimentally determined relativesurface tension Y is independent of the reference surfacetension σref. Correspondingly, the uncertainty of the surfacetension is obtained as
σ σ= +u u Y u( ) ( ) ( )r2
r2
r2
ref (13)
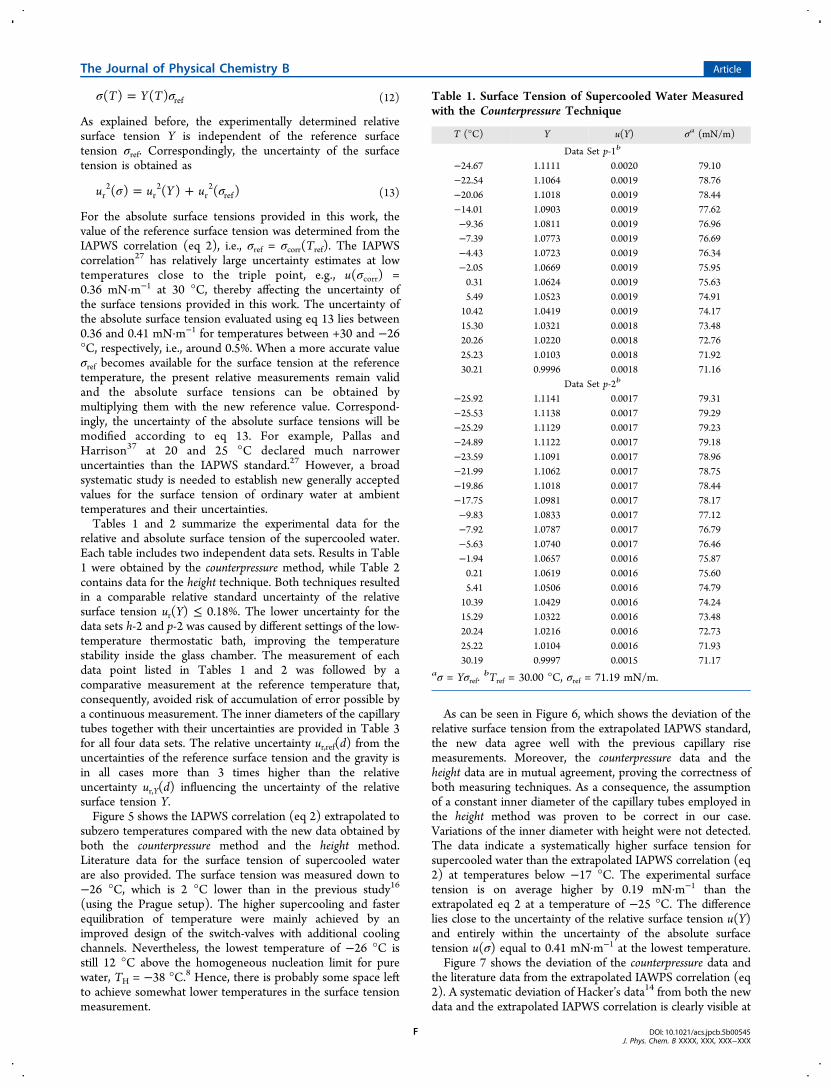
For the absolute surface tensions provided in this work, thevalue of the reference surface tension was determined from theIAPWS correlation (eq 2), i.e., σref = σcorr(Tref). The IAPWScorrelation27 has relatively large uncertainty estimates at lowtemperatures close to the triple point, e.g., u(σcorr) =0.36 mN·m−1 at 30 °C, thereby affecting the uncertainty ofthe surface tensions provided in this work. The uncertainty ofthe absolute surface tension evaluated using eq 13 lies between0.36 and 0.41 mN·m−1 for temperatures between +30 and −26°C, respectively, i.e., around 0.5%. When a more accurate valueσref becomes available for the surface tension at the referencetemperature, the present relative measurements remain validand the absolute surface tensions can be obtained bymultiplying them with the new reference value. Correspond-ingly, the uncertainty of the absolute surface tensions will bemodified according to eq 13. For example, Pallas andHarrison37 at 20 and 25 °C declared much narroweruncertainties than the IAPWS standard.27 However, a broadsystematic study is needed to establish new generally acceptedvalues for the surface tension of ordinary water at ambienttemperatures and their uncertainties.Tables 1 and 2 summarize the experimental data for the
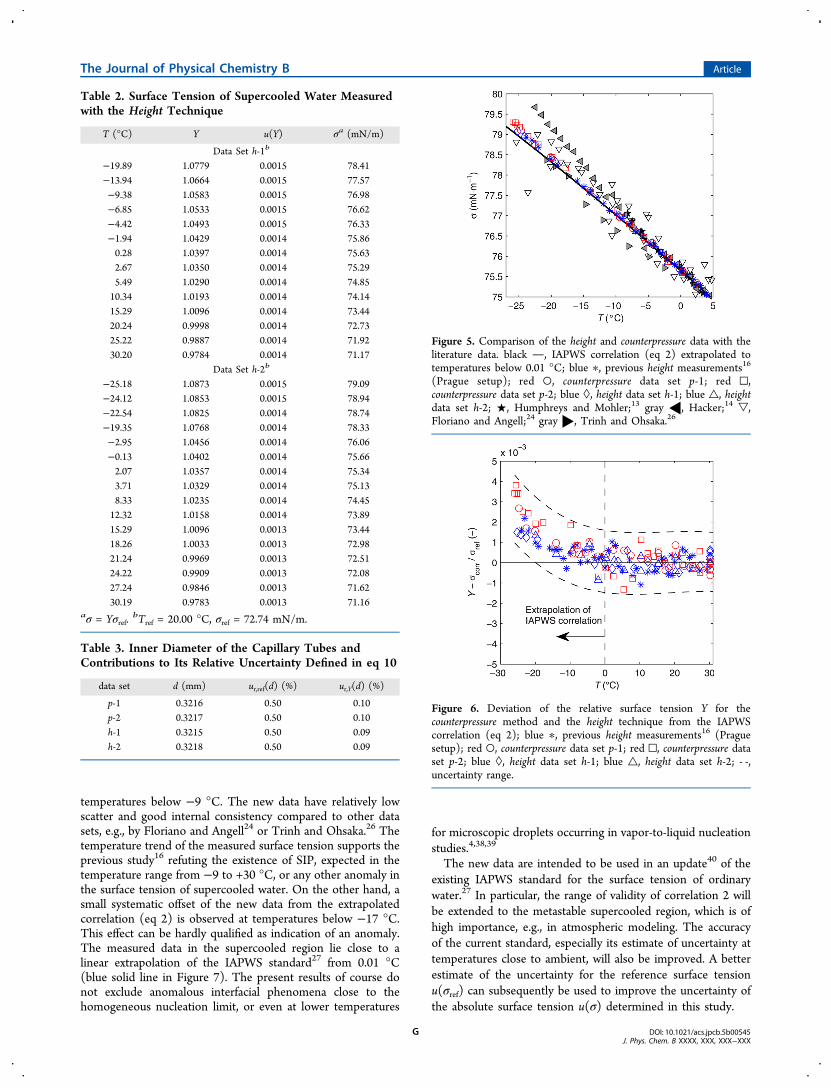
relative and absolute surface tension of the supercooled water.Each table includes two independent data sets. Results in Table1 were obtained by the counterpressure method, while Table 2contains data for the height technique. Both techniques resultedin a comparable relative standard uncertainty of the relativesurface tension ur(Y) ≤ 0.18%. The lower uncertainty for thedata sets h-2 and p-2 was caused by different settings of the low-temperature thermostatic bath, improving the temperaturestability inside the glass chamber. The measurement of eachdata point listed in Tables 1 and 2 was followed by acomparative measurement at the reference temperature that,consequently, avoided risk of accumulation of error possible bya continuous measurement. The inner diameters of the capillarytubes together with their uncertainties are provided in Table 3for all four data sets. The relative uncertainty ur,ref(d) from theuncertainties of the reference surface tension and the gravity isin all cases more than 3 times higher than the relativeuncertainty ur,Y(d) influencing the uncertainty of the relativesurface tension Y.Figure 5 shows the IAPWS correlation (eq 2) extrapolated to
subzero temperatures compared with the new data obtained byboth the counterpressure method and the height method.Literature data for the surface tension of supercooled waterare also provided. The surface tension was measured down to−26 °C, which is 2 °C lower than in the previous study16
(using the Prague setup). The higher supercooling and fasterequilibration of temperature were mainly achieved by animproved design of the switch-valves with additional coolingchannels. Nevertheless, the lowest temperature of −26 °C isstill 12 °C above the homogeneous nucleation limit for purewater, TH = −38 °C.8 Hence, there is probably some space leftto achieve somewhat lower temperatures in the surface tensionmeasurement.
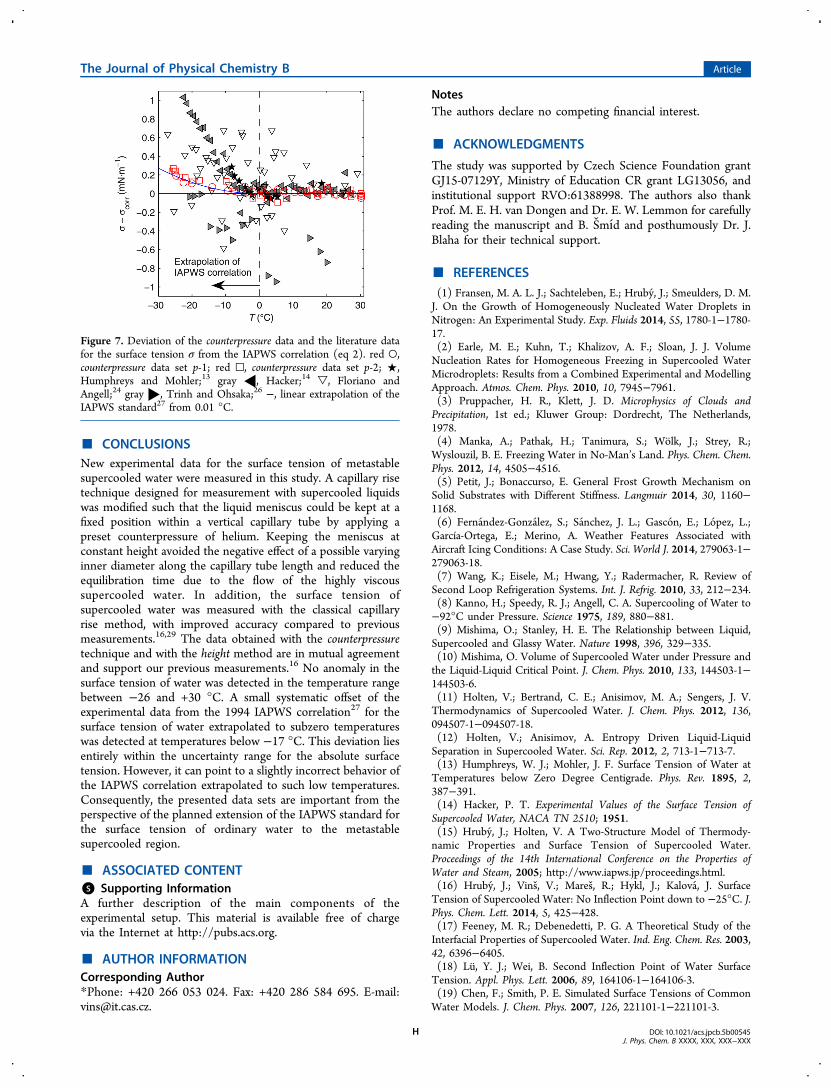
As can be seen in Figure 6, which shows the deviation of therelative surface tension from the extrapolated IAPWS standard,the new data agree well with the previous capillary risemeasurements. Moreover, the counterpressure data and theheight data are in mutual agreement, proving the correctness ofboth measuring techniques. As a consequence, the assumptionof a constant inner diameter of the capillary tubes employed inthe height method was proven to be correct in our case.Variations of the inner diameter with height were not detected.The data indicate a systematically higher surface tension forsupercooled water than the extrapolated IAPWS correlation (eq2) at temperatures below −17 °C. The experimental surfacetension is on average higher by 0.19 mN·m−1 than theextrapolated eq 2 at a temperature of −25 °C. The differencelies close to the uncertainty of the relative surface tension u(Y)and entirely within the uncertainty of the absolute surfacetension u(σ) equal to 0.41 mN·m−1 at the lowest temperature.Figure 7 shows the deviation of the counterpressure data and
the literature data from the extrapolated IAWPS correlation (eq2). A systematic deviation of Hacker’s data14 from both the newdata and the extrapolated IAPWS correlation is clearly visible at
Table 1. Surface Tension of Supercooled Water Measuredwith the Counterpressure Technique
T (°C) Y u(Y) σa (mN/m)
Data Set p-1b
−24.67 1.1111 0.0020 79.10−22.54 1.1064 0.0019 78.76−20.06 1.1018 0.0019 78.44−14.01 1.0903 0.0019 77.62−9.36 1.0811 0.0019 76.96−7.39 1.0773 0.0019 76.69−4.43 1.0723 0.0019 76.34−2.05 1.0669 0.0019 75.950.31 1.0624 0.0019 75.635.49 1.0523 0.0019 74.9110.42 1.0419 0.0019 74.1715.30 1.0321 0.0018 73.4820.26 1.0220 0.0018 72.7625.23 1.0103 0.0018 71.9230.21 0.9996 0.0018 71.16
Data Set p-2b
−25.92 1.1141 0.0017 79.31−25.53 1.1138 0.0017 79.29−25.29 1.1129 0.0017 79.23−24.89 1.1122 0.0017 79.18−23.59 1.1091 0.0017 78.96−21.99 1.1062 0.0017 78.75−19.86 1.1018 0.0017 78.44−17.75 1.0981 0.0017 78.17−9.83 1.0833 0.0017 77.12−7.92 1.0787 0.0017 76.79−5.63 1.0740 0.0017 76.46−1.94 1.0657 0.0016 75.870.21 1.0619 0.0016 75.605.41 1.0506 0.0016 74.7910.39 1.0429 0.0016 74.2415.29 1.0322 0.0016 73.4820.24 1.0216 0.0016 72.7325.22 1.0104 0.0016 71.9330.19 0.9997 0.0015 71.17
aσ = Yσref.bTref = 30.00 °C, σref = 71.19 mN/m.
The Journal of Physical Chemistry B Article
DOI: 10.1021/acs.jpcb.5b00545J. Phys. Chem. B XXXX, XXX, XXX−XXX
F
temperatures below −9 °C. The new data have relatively lowscatter and good internal consistency compared to other datasets, e.g., by Floriano and Angell24 or Trinh and Ohsaka.26 Thetemperature trend of the measured surface tension supports theprevious study16 refuting the existence of SIP, expected in thetemperature range from −9 to +30 °C, or any other anomaly inthe surface tension of supercooled water. On the other hand, asmall systematic offset of the new data from the extrapolatedcorrelation (eq 2) is observed at temperatures below −17 °C.This effect can be hardly qualified as indication of an anomaly.The measured data in the supercooled region lie close to alinear extrapolation of the IAPWS standard27 from 0.01 °C(blue solid line in Figure 7). The present results of course donot exclude anomalous interfacial phenomena close to thehomogeneous nucleation limit, or even at lower temperatures
for microscopic droplets occurring in vapor-to-liquid nucleationstudies.4,38,39
The new data are intended to be used in an update40 of theexisting IAPWS standard for the surface tension of ordinarywater.27 In particular, the range of validity of correlation 2 willbe extended to the metastable supercooled region, which is ofhigh importance, e.g., in atmospheric modeling. The accuracyof the current standard, especially its estimate of uncertainty attemperatures close to ambient, will also be improved. A betterestimate of the uncertainty for the reference surface tensionu(σref) can subsequently be used to improve the uncertainty ofthe absolute surface tension u(σ) determined in this study.
Table 2. Surface Tension of Supercooled Water Measuredwith the Height Technique
T (°C) Y u(Y) σa (mN/m)
Data Set h-1b
−19.89 1.0779 0.0015 78.41−13.94 1.0664 0.0015 77.57−9.38 1.0583 0.0015 76.98−6.85 1.0533 0.0015 76.62−4.42 1.0493 0.0015 76.33−1.94 1.0429 0.0014 75.860.28 1.0397 0.0014 75.632.67 1.0350 0.0014 75.295.49 1.0290 0.0014 74.8510.34 1.0193 0.0014 74.1415.29 1.0096 0.0014 73.4420.24 0.9998 0.0014 72.7325.22 0.9887 0.0014 71.9230.20 0.9784 0.0014 71.17
Data Set h-2b
−25.18 1.0873 0.0015 79.09−24.12 1.0853 0.0015 78.94−22.54 1.0825 0.0014 78.74−19.35 1.0768 0.0014 78.33−2.95 1.0456 0.0014 76.06−0.13 1.0402 0.0014 75.662.07 1.0357 0.0014 75.343.71 1.0329 0.0014 75.138.33 1.0235 0.0014 74.4512.32 1.0158 0.0014 73.8915.29 1.0096 0.0013 73.4418.26 1.0033 0.0013 72.9821.24 0.9969 0.0013 72.5124.22 0.9909 0.0013 72.0827.24 0.9846 0.0013 71.6230.19 0.9783 0.0013 71.16
aσ = Yσref.bTref = 20.00 °C, σref = 72.74 mN/m.
Table 3. Inner Diameter of the Capillary Tubes andContributions to Its Relative Uncertainty Defined in eq 10
data set d (mm) ur,ref(d) (%) ur,Y(d) (%)
p-1 0.3216 0.50 0.10p-2 0.3217 0.50 0.10h-1 0.3215 0.50 0.09h-2 0.3218 0.50 0.09
Figure 5. Comparison of the height and counterpressure data with theliterature data. black , IAPWS correlation (eq 2) extrapolated totemperatures below 0.01 °C; blue ∗, previous height measurements16(Prague setup); red ○, counterpressure data set p-1; red □,counterpressure data set p-2; blue ◊, height data set h-1; blue △, heightdata set h-2; ★, Humphreys and Mohler;13 gray ◀, Hacker;14 ▽,Floriano and Angell;24 gray ▶, Trinh and Ohsaka.26
Figure 6. Deviation of the relative surface tension Y for thecounterpressure method and the height technique from the IAPWScorrelation (eq 2); blue ∗, previous height measurements16 (Praguesetup); red ○, counterpressure data set p-1; red □, counterpressure dataset p-2; blue ◊, height data set h-1; blue △, height data set h-2; - -,uncertainty range.
The Journal of Physical Chemistry B Article
DOI: 10.1021/acs.jpcb.5b00545J. Phys. Chem. B XXXX, XXX, XXX−XXX
G
■ CONCLUSIONSNew experimental data for the surface tension of metastablesupercooled water were measured in this study. A capillary risetechnique designed for measurement with supercooled liquidswas modified such that the liquid meniscus could be kept at afixed position within a vertical capillary tube by applying apreset counterpressure of helium. Keeping the meniscus atconstant height avoided the negative effect of a possible varyinginner diameter along the capillary tube length and reduced theequilibration time due to the flow of the highly viscoussupercooled water. In addition, the surface tension ofsupercooled water was measured with the classical capillaryrise method, with improved accuracy compared to previousmeasurements.16,29 The data obtained with the counterpressuretechnique and with the height method are in mutual agreementand support our previous measurements.16 No anomaly in thesurface tension of water was detected in the temperature rangebetween −26 and +30 °C. A small systematic offset of theexperimental data from the 1994 IAPWS correlation27 for thesurface tension of water extrapolated to subzero temperatureswas detected at temperatures below −17 °C. This deviation liesentirely within the uncertainty range for the absolute surfacetension. However, it can point to a slightly incorrect behavior ofthe IAPWS correlation extrapolated to such low temperatures.Consequently, the presented data sets are important from theperspective of the planned extension of the IAPWS standard forthe surface tension of ordinary water to the metastablesupercooled region.
■ ASSOCIATED CONTENT*S Supporting InformationA further description of the main components of theexperimental setup. This material is available free of chargevia the Internet at http://pubs.acs.org.
■ AUTHOR INFORMATIONCorresponding Author*Phone: +420 266 053 024. Fax: +420 286 584 695. E-mail:[email protected].
NotesThe authors declare no competing financial interest.
■ ACKNOWLEDGMENTS
The study was supported by Czech Science Foundation grantGJ15-07129Y, Ministry of Education CR grant LG13056, andinstitutional support RVO:61388998. The authors also thankProf. M. E. H. van Dongen and Dr. E. W. Lemmon for carefullyreading the manuscript and B. Smıd and posthumously Dr. J.Blaha for their technical support.
■ REFERENCES(1) Fransen, M. A. L. J.; Sachteleben, E.; Hruby, J.; Smeulders, D. M.J. On the Growth of Homogeneously Nucleated Water Droplets inNitrogen: An Experimental Study. Exp. Fluids 2014, 55, 1780-1−1780-17.(2) Earle, M. E.; Kuhn, T.; Khalizov, A. F.; Sloan, J. J. VolumeNucleation Rates for Homogeneous Freezing in Supercooled WaterMicrodroplets: Results from a Combined Experimental and ModellingApproach. Atmos. Chem. Phys. 2010, 10, 7945−7961.(3) Pruppacher, H. R., Klett, J. D. Microphysics of Clouds andPrecipitation, 1st ed.; Kluwer Group: Dordrecht, The Netherlands,1978.(4) Manka, A.; Pathak, H.; Tanimura, S.; Wolk, J.; Strey, R.;Wyslouzil, B. E. Freezing Water in No-Man’s Land. Phys. Chem. Chem.Phys. 2012, 14, 4505−4516.(5) Petit, J.; Bonaccurso, E. General Frost Growth Mechanism onSolid Substrates with Different Stiffness. Langmuir 2014, 30, 1160−1168.(6) Fernandez-Gonzalez, S.; Sanchez, J. L.; Gascon, E.; Lopez, L.;García-Ortega, E.; Merino, A. Weather Features Associated withAircraft Icing Conditions: A Case Study. Sci. World J. 2014, 279063-1−279063-18.(7) Wang, K.; Eisele, M.; Hwang, Y.; Radermacher, R. Review ofSecond Loop Refrigeration Systems. Int. J. Refrig. 2010, 33, 212−234.(8) Kanno, H.; Speedy, R. J.; Angell, C. A. Supercooling of Water to−92°C under Pressure. Science 1975, 189, 880−881.(9) Mishima, O.; Stanley, H. E. The Relationship between Liquid,Supercooled and Glassy Water. Nature 1998, 396, 329−335.(10) Mishima, O. Volume of Supercooled Water under Pressure andthe Liquid-Liquid Critical Point. J. Chem. Phys. 2010, 133, 144503-1−144503-6.(11) Holten, V.; Bertrand, C. E.; Anisimov, M. A.; Sengers, J. V.Thermodynamics of Supercooled Water. J. Chem. Phys. 2012, 136,094507-1−094507-18.(12) Holten, V.; Anisimov, A. Entropy Driven Liquid-LiquidSeparation in Supercooled Water. Sci. Rep. 2012, 2, 713-1−713-7.(13) Humphreys, W. J.; Mohler, J. F. Surface Tension of Water atTemperatures below Zero Degree Centigrade. Phys. Rev. 1895, 2,387−391.(14) Hacker, P. T. Experimental Values of the Surface Tension ofSupercooled Water, NACA TN 2510; 1951.(15) Hruby, J.; Holten, V. A Two-Structure Model of Thermody-namic Properties and Surface Tension of Supercooled Water.Proceedings of the 14th International Conference on the Properties ofWater and Steam, 2005; http://www.iapws.jp/proceedings.html.(16) Hruby, J.; Vins, V.; Mares, R.; Hykl, J.; Kalova, J. SurfaceTension of Supercooled Water: No Inflection Point down to −25°C. J.Phys. Chem. Lett. 2014, 5, 425−428.(17) Feeney, M. R.; Debenedetti, P. G. A Theoretical Study of theInterfacial Properties of Supercooled Water. Ind. Eng. Chem. Res. 2003,42, 6396−6405.(18) Lu, Y. J.; Wei, B. Second Inflection Point of Water SurfaceTension. Appl. Phys. Lett. 2006, 89, 164106-1−164106-3.(19) Chen, F.; Smith, P. E. Simulated Surface Tensions of CommonWater Models. J. Chem. Phys. 2007, 126, 221101-1−221101-3.
Figure 7. Deviation of the counterpressure data and the literature datafor the surface tension σ from the IAPWS correlation (eq 2). red ○,counterpressure data set p-1; red □, counterpressure data set p-2; ★,Humphreys and Mohler;13 gray ◀, Hacker;14 ▽, Floriano andAngell;24 gray ▶, Trinh and Ohsaka;26 −, linear extrapolation of theIAPWS standard27 from 0.01 °C.
The Journal of Physical Chemistry B Article
DOI: 10.1021/acs.jpcb.5b00545J. Phys. Chem. B XXXX, XXX, XXX−XXX
H
(20) Viererblova, L.; Kolafa, J. A Classical Polarizable Model forSimulations of Water and Ice. Phys. Chem. Chem. Phys. 2011, 13,19925−19935.(21) Franses, E. I.; Basaran, O. A.; Chang, C. H. Techniques toMeasure Dynamic Surface Tension. Curr. Opin. Colloid Interface Sci.1996, 1, 296−303.(22) Adamson, A. W.; Gast, A. P. Physical Chemistry of Surfaces, 6thed.; John Wiley & Sons: New York, 1997.(23) Sear, R. P. Estimation of the Scaling of the Nucleation Timewith Volume when the Nucleation Rate Does Not Exist. Cryst. GrowthDes. 2013, 13, 1329−1333.(24) Floriano, M. A.; Angell, C. A. Surface Tension and MolarSurface Free Energy and Entropy of Water to −27.2°C. J. Phys. Chem.1990, 94, 4199−4202.(25) Ferguson, A.; Kennedy, S. J. Notes on Surface-TensionMeasurement. Proc. Phys. Soc. 1932, 44, 511−520.(26) Trinh, E.; Ohsaka, K. Measurement of Density, Sound Velocity,Surface Tension, and Viscosity of Freely Suspended SupercooledLiquids. Int. J. Thermophys. 1995, 16, 545−555.(27) IAPWS Release on Surface Tension of Ordinary WaterSubstance, 1994; http://www.iapws.org/.(28) Vargaftik, N. B.; Volkov, B. N.; Voljak, L. D. InternationalTables of the Surface Tension of Water. J. Phys. Chem. Ref. Data 1983,12, 817−820.(29) Vins, V.; Hruby, J.; Hykl, J.; Blaha, J.; Smíd, B. Design of anExperimental Apparatus for Measurement of the Surface Tension ofMetastable Fluids. EPJ Web Conf. 2013, 45, 01094-1−01094-5.(30) Wiegand, G.; Franck, E. U. Interfacial Tension between Waterand Non-Polar Fluids up to 473 K and 2800 bar. Ber. Bunsen-Ges.1994, 98, 809−817.(31) Massoudi, R.; King J, A. D. Effect of Pressure on the SurfaceTension of Water: Adsorption of Low Molecular Weight Gases onWater at 25°. J. Phys. Chem. 1974, 78, 2262−2266.(32) Jho, C.; Nealon, D.; Shogbola, S.; King, A. D. Effect of Pressureon the Surface Tension of Water: Adsorption of Hydrocarbon Gasesand Carbon Dioxide on Water at Temperatures between 0 and 50 °C.J. Colloid Interface Sci. 1978, 65, 141−154.(33) Lord Rayleigh. On the Theory of the Capillary Tube. Proc. R.Soc. A 1916, 92, 184−195.(34) Wagner, W.; Pruss, A. The IAPWS Formulation 1995 for theThermodynamic Properties of Ordinary Water Substance for Generaland Scientific Use. J. Phys. Chem. Ref. Data 2002, 31, 387−535.(35) Stepanov, V. G.; Volyak, L. D.; Tarlakov, Y. V. Wetting ContactAngles of Certain Systems. J. Eng. Phys. Thermophys. 1977, 32, 646−648. Translated from Inzhenerno-Fizicheskii Zhurnal 1977, 32, 1000−1003.(36) Volyak, L. D.; Stepanov, V. G.; Tarlakov, Y. V. ExperimentalInvestigation of the Temperature Dependence of Wetting Angle ofWater (H2O and D2O) on Quartz and Sapphire. Zh. Fiz. Khim. 1975,49, 2931−2933.(37) Pallas, N. R.; Harrison, Y. An Automated Drop Shape Apparatusand the Surface Tension of Pure Water. Colloids Surf. 1990, 43, 169−194.(38) Wolk, J.; Strey, R. Homogeneous Nucleation of H2O and D2Oin Comparison: The Isotope Effect. J. Phys. Chem. B 2001, 105,11683−11701.(39) Holten, V.; Labetski, D. G.; van Dongen, M. E. H.Homogeneous Nucleation of Water Between 200 and 240 K: NewWave Tube Data and Estimation of the Tolman Length. J. Chem. Phys.2005, 123, 104505-1−104505-9.(40) Minutes from 2014 IAPWS Meeting, TPWS/SCSW WorkingGroup, 2014, Moscow; http://www.iapws.org.
The Journal of Physical Chemistry B Article
DOI: 10.1021/acs.jpcb.5b00545J. Phys. Chem. B XXXX, XXX, XXX−XXX
I


