Embed Size (px)
Citation preview

Available online at www.sciencedirect.com
www.elsevier.com/locate/gca
ScienceDirect
Geochimica et Cosmochimica Acta 141 (2014) 240–257
Surficial weathering of iron sulfide mine tailings undersemi-arid climate
Sarah M. Hayes 1, Robert A. Root, Nicolas Perdrial 2, Raina M. Maier,Jon Chorover ⇑
Department of Soil, Water and Environmental Science, University of Arizona, 1177 E 4th St, Shantz 429, Tucson, AZ 85721, United States
Received 17 September 2013; accepted in revised form 19 May 2014; Available online 5 June 2014
Abstract
Mine wastes introduce anthropogenic weathering profiles to the critical zone that often remain unvegetated for decadesafter mining cessation. As such, they are vulnerable to wind and water dispersion of particulate matter to adjacent ecosystemsand residential communities. In sulfide-rich ore tailings, propagation to depth of the oxidative weathering front controls thedepth-variation in speciation of major and trace elements. Despite the prevalence of surficial mine waste deposits in aridregions of the globe, few prior studies have been conducted to resolve the near-surface profile of sulfide ore tailings weatheredunder semi-arid climate. We investigated relations between gossan oxidative reaction-front propagation and the molecularspeciation of iron and sulfur in tailings subjected to weathering in a semi-arid climate at an EPA Superfund Site in centralArizona (USA). Here we report a multi-method data set combining wet chemical and synchrotron-based X-ray diffraction(XRD) and X-ray absorption near-edge spectroscopy (XANES) methods to resolve the tight coupling of iron (Fe) and sulfur(S) geochemical changes in the top 2 m of tailings. Despite nearly invariant Fe and S concentration with depth (130–140 and100–120 g kg�1, respectively), a sharp redox gradient and distinct morphological change was observed within the top 0.5 m,associated with a progressive oxidative alteration of ferrous sulfides to (oxyhydr)oxides and (hydroxy)sulfates. Transforma-tion is nearly complete in surficial samples. Trends in molecular-scale alteration were co-located with a decrease in pH from7.3 to 2.3, and shifts in Fe and S lability as measured via chemical extraction. Initial weathering products, ferrihydrite andgypsum, transform to schwertmannite, then jarosite-group minerals with an accompanying decrease in pH. Interestingly, ther-modynamically stable phases such as goethite and hematite were not detected in any samples, but ferrihydrite was observedeven in samples with the lowest pH, indicating its metastable persistence in these semiarid tailings. The resulting sharp geo-chemical speciation gradients in close proximity to the tailings surface have important implications for plant colonization, aswell as mobility and bioavailability of co-associated toxic metal(loid)s.� 2014 Elsevier Ltd. All rights reserved.
http://dx.doi.org/10.1016/j.gca.2014.05.030
0016-7037/� 2014 Elsevier Ltd. All rights reserved.
⇑ Corresponding author. Tel.: +1 520 626 5635; fax: +1 520 6261647.
E-mail addresses: [email protected] (S.M. Hayes), [email protected] (R.A. Root), [email protected] (N. Perdrial),[email protected] (J. Chorover).
1 Current address: Department of Chemistry & Biochemistry,University of Alaska Fairbanks, Fairbanks, AK 99775-6160,United States.
2 Current address: Department of Geology, University ofVermont, Burlington, VT 05405.
1. INTRODUCTION
Mine tailings,4 the fine-grained, uneconomical byprod-ucts of ore processing (crushing, grinding, milling, and
4 Abbreviations: XAS, X-ray absorption spectroscopy (bothXANES and post edge regions); XANES, X-ray absorption near-edge spectroscopy; SSE, selective sequential extraction; Q-XRD,Quantitative X-ray diffraction; IKMHSS, Iron King Mine andHumbolt Smelter Superfund site.
S.M. Hayes et al. / Geochimica et Cosmochimica Acta 141 (2014) 240–257 241
chemical leaching; Lottermoser, 2011) comprise the world’slargest industrial waste stream (Hudson-Edwards et al.,2011). Mine waste deposition at the Earth’s surface repre-sents a massive annual production of fresh parent materialfor incipient soil formation whose rate is of similar magni-tude to the naturally-occurring fresh rock reveal rate andthe top soil loss rate (ca. 21 Gt/yr; Wilkinson andMcElroy, 2007; Lottermoser, 2010).
1.1. Weathering of sulfide tailings
Tailings weathering begins with the oxidative dissolutionof pyrite-rich wastes and the release of sulfate (SO4
2�), met-als (Fe2+), and protons (H+) to solution (Nordstrom andAlpers, 1999). Production of Fe2+ and H+ further promotessurface reaction and dissolution of pyrite and gangue (e.g.,carbonate and silicate) minerals, and affects the geochemical(meta)stability of potential secondary phases (Blowes andJambor, 1990; Blowes et al., 2003). Secondary phases mayinitially include Fe(II) and Fe(II/III) sulfates such asmelanterite [FeSO4�7H2O], copiapite [FeIIFe4
III(SO4)6(OH)2�22H2O], and coquimbite [Fe2(SO4)3], followed by ferric andmixed valent (hydr)oxides such as ferrihydrite [5Fe2O3�9H2O], goethite [a-FeO(OH)], magnetite [Fe3O4], green rust[Fe4
IIFe2III(OH)12SO4�nH2O], schwertmannite [Fe8O8(OH)6
(SO4)�10H2O], and jarosite [KFe3(SO4)2(OH)6], listed inorder of increasing stability with decreasing pH (Bighamet al., 1996; Bigham and Nordstrom, 2000; Jambor et al.,2000). Several studies have examined the gossan oxidativereaction front of sulfide tailings as a function of depth lend-ing insight into the sequence and stability of secondaryphases in the weathering series (Bigham et al., 1990;Blowes and Jambor, 1990; Dold and Fontbote, 2001; Dillet al., 2002; Jamieson et al., 2005; Romero et al., 2007;Schuwirth et al., 2007; Courtin-Nomade et al., 2009;Hayes et al., 2009, 2012; Jamieson, 2011).
Few studies, however, have examined tailings weather-ing profiles in arid and semi-arid environments. Low waterthrough-flux and episodic wet–dry cycles in arid environ-ments are expected to promote the persistence of (i) acidityand sulfate that would be leached with acid mine drainage(AMD) at higher pore volume hydrologic flux, and (ii)near-surface accumulation of minerals that would be solu-ble at higher relative humidity (Hudson-Edwards et al.,1999). The few studies that have specifically examined minetailings in (semi-)arid regions suggest that the weatheringtrajectory and (meta)stability of secondary species in theseenvironments varies from the better studied humid environ-ments (Wray, 1998; Hudson-Edwards et al., 1999; Dold andFontbote, 2001; Navarro et al., 2004; Hayes et al., 2009).
1.2. Quantification of solid-phase speciation and element
lability across the weathering front
X-ray absorption near-edge structure (XANES) spec-troscopy probes the bound-state electronic transitions ofthe absorbing atom and has been widely applied to quantifythe oxidation state and coordination chemistry for both Feand S in porous media (Myneni, 2002; Wetherall et al.,2008; Couture et al., 2010). Sulfur XANES (or S NEXAFS)
enables quantification of sulfide and sulfate components ina mixture because the absorption peaks are spaced by�12 eV across the �2 to +6 oxidation states (Fleet,2005). Several excellent reviews on the application of SXANES to mineralogy and geochemistry represent thediversity of spectral structures deriving from distinct refer-ence materials, many of which are directly relevant to met-alliferous mine tailings (Myneni, 2000; Fleet, 2005). SulfurXANES has been used to examine the S speciation oforganic moieties in soils (e.g., Morra et al., 1997; Prietzelet al., 2003, 2009), sulfate species in aerosols (Takahashiet al., 2006), and S oxidation state in sediments(Neuhausler et al., 2003; Bostick et al., 2005), but it hasnot been extensively applied to study S speciation in minetailings (Solis-Dominguez et al., 2012).
The first-derivative Fe XANES spectra of iron bearingphases have sufficiently unique spectral structure to differ-entiate between Fe containing mineral groups, e.g., phyllo-silicates, carbonates, sulfides, oxides, sulfates, etc.(Waychunas et al., 1983; Combes et al., 1989; Zhao et al.,1994; Manceau and Gates, 1997; O’Day et al., 2004). Thisinformation can be used to identify Fe species and monitortemporal and spatial redox changes in field and laboratorystudies (Bajt et al., 1994; Zaw et al., 2002; Schmid et al.,2003; O’Day et al., 2004; Wilke et al., 2005; Root et al.,2007, 2009; Fittschen et al., 2008; Karlsson et al., 2008;Marcus et al., 2008; Mitsunobu et al., 2008).
Selective sequential extraction (SSE) of solids enablesthe quantification of lability of solid-phase bound elementsacross a range of aqueous geochemical conditions(Williams et al., 1967; Tessier et al., 1979; Pickering,1981; Dold and Fontbote, 2001, 2002; Dold, 2003b;Hayes et al., 2009). Although clearly operational (tech-nique-dependent), results from SSEs are also quantitativeand reproducible, with power to assess the changes in solidphase aqueous reactivity, particularly when applied across awell-characterized gradient in geochemistry, such as a reac-tion front. SSE is best utilized in conjunction with indepen-dent confirmation of solid phase speciation by, e.g., X-rayabsorption spectroscopy or X-ray diffraction (Ruttenburg,1992; La Force and Fendorf, 2000; Dold and Fontbote,2002; Caraballo et al., 2009; Hayes et al., 2009). Indeed,coupling SSEs with complementary sample analysis meth-ods is beneficial because of known potential artifactsincluding variable dissolution of both target and non-targetphases, unintended precipitation of secondary phases, etc.(Kheboian and Bauer, 1987; Hayes et al., 2009).
The principal objective of the present study was to exam-ine mineral transformation and speciation of major redoxactive elements, Fe and S, across a gossan-type oxidativeweathering front of sulfide-ore derived mine tailings in asemi-arid environment. Tailings were collected from a U.S.Environmental Protection Agency (EPA) Superfund site atthe Iron King Mine and Humboldt Smelter Site (IKMHSS).The site was listed with the Comprehensive EnvironmentalResponse, Compensation, and Liability Act (CERCLA) in2008 due to elevated levels of Pb and As (3.1 and 2.2 g kg�1,respectively in surficial tailings) and close proximity to resi-dential communities. Geochemical interrogation of the nearsurface (top two meters) of the tailings was conducted with

242 S.M. Hayes et al. / Geochimica et Cosmochimica Acta 141 (2014) 240–257
the goals of improving our basic understanding of oxidativesulfide weathering under semi-arid climate, facilitatingassessment of potential health risks associated with suchweathering, and providing a basis for remediation and pre-vention of off-site dispersion of metal-laden particles(Solis-Dominguez et al., 2012; Ramirez-Andreotta et al.,2013a,b). Samples in this study were examined through theconjunctive use of wet chemical extractions and synchro-tron-based mineralogical (XRD) and molecular-scale (Feand S XANES) methods. Elucidation of dominant redox-active element behavior is key in addressing contaminantmetal(loid) behavior, the subject of a current companionstudy.
2. SITE DESCRIPTION
Between 1906 and 1915, the IKMHSS (Dewey-Hum-boldt, Arizona, USA) was subject to mining of oxide oresof Au, Ag, and Cu (Creasey, 1952). Extraction began againduring World War I to exploit the underlying massive sulfidedeposit for base metals including Cu, Zn, and Pb and smalleramounts of precious metals Au and Ag (Fig. 1). During peakoperation in 1950, daily ore processing was approximately1000 metric tons (Creasey, 1952; Myrick, 2001; Rayleet al., 2008). The principal mineral sources for Cu, Zn, and
0
0 100
A
4700
4750
4700
47204750
TAILINGS
4650
feet
meters
N
400
Iron King Mine, AZ
A.A.
D.
E.
AZ H
Pit
Pit
47504700
4650
Appx. tailings surface
Original groundsurface circa 1858
A
Ele
v. (m
)
14301460
14001370
Fig. 1. Map and cross-section of Iron King Superfund site (Dewy-Humbpit to 55 cm, (C) cores to 185 cm, (D) site map and (E) cross section of
Pb were chalcopyrite (CuFeS2), sphalerite (ZnS), and galena(PbS). The massive sulfide deposit was part of a mineral beltin steeply plunging echelon fine-grained veins of sulfides heldtogether by a gangue of ankerite, quartz, sericite, and resid-ual chlorite in the pre-cambrian metamorphosed andesitictuffs that stretch tens of kilometers along the BradshawMountain range in central AZ (USA; Creasey, 1952). From1906 to 1947, Iron King produced 16,800 t Pb, 52,200 t Zn,1800 t Cu, 105 t Ag, and 3390 kg Au from ca. 1 million metrictons of ore. Until mine closure in 1969, wastes were hydrau-lically sluiced, without compaction, into a small topographicdepression covering approximately 620,000 m2 and piled tomaximum thickness of about 30 m, based on historical topo-graphic maps (Fig. 1). It is estimated that four million cubicmeters of tailings remain at the site.
During the half century since tailings deposition, meanannual precipitation and potential evapotranspiration atthe 1400 m elevation IKMHSS site were ca. 370 and1470 mm, respectively. The IKMHSS tailings containmetal(loid) contaminants (As, Pb, Zn) above remediationlimits and, meanwhile, tailings were subject to wind andwater erosion into adjacent landscape locations, therebyincreasing the environmental health risk to neighboringcommunities and ecosystems (Csavina et al., 2012;Ramirez-Andreotta et al., 2013a,b).
A’
AZ H
W 6
9
4650
4600
4720
4640
4680
road
Buildings
B.B.
0-92
cm
93-1
84cm
W 6
9
4600
47004800
46004500
Elev. (ft)
A’
C.
olt, AZ). (A) Aerial view of tailings pile (from Google Earthe), (B)waste pile containing ca. 3.9 Mm3 of tailings.

S.M. Hayes et al. / Geochimica et Cosmochimica Acta 141 (2014) 240–257 243
3. MATERIALS AND METHODS
3.1. Field sampling, sample preservation, and reference
material collection
The IKMHSS tailings weathering profile was collectedby excavating a pit to ca. 1 m to expose the redox boundarybetween oxic and sulfide-stable tailings. Samples were col-lected and composited across the pit faces for discrete depthintervals on the basis of morphological transitions (color,consistency, Fig. 1B). A core extending to 2 m depth wasextracted adjacent to the excavated pit to acquire deepertailings (Fig. 1C). Samples were double bagged in sealedlow O2 diffusion plastic bags and transported to the labora-tory on dry ice (�78 �C). Pit and core samples were sub-sec-tioned in an anaerobic chamber (Coy, MI) to obtain threerepresentative splits from each depth increment. Splits were(i) analyzed for moisture content and particle size; (ii)sieved (<2 mm), lyophilized at �80 �C and 130 mbar priorto chemical analysis; or (iii) kept field moist, frozen, andin darkness prior to sieving and grinding in preparationfor XRD and XAS analysis. Petrographic analysis and X-ray fluorescence maps were performed as described in theElectronic Annex Fig. EA-1. Isolated grains, termed “as-collected,” were visually distinguished and separated basedon color and texture (Tan, Red, and Blue).
Selected reference materials (ankerite, chlorite, gypsum,plumbojarosite, pyrite, and melanterite) were collectedfrom mineral source distributors, whereas others (schwert-mannite, 2-line ferrihydrite) were synthesized in accordancewith published methods (Bigham et al., 1990; Schwertmannand Cornell, 2000; Regenspurg and Peiffer, 2005) (seeTable EA-1 for details). All reagents used were ACS gradeor better. The identities of all references were confirmed byXRD.
3.2. Physical analyses
Wet and dry sediment color was determined using aMunsell soil color chart immediately after collection andalso after preservation by freeze-drying. Particle size distri-butions for the <2 mm size fractions were determined usinga laser diffractometer (Beckman Coulter LS 13 320) in theUniversity of Arizona Center for Environmental Physicsand Mineralogy (Tucson, AZ) and quantified as clay(<2 lm), silt (2–50 lm) and sand (50–2000 lm). Gravimetricwater content was determined by weighing the tailingsbefore and after drying at 105 �C for >24 h.
3.3. Chemical analyses
3.3.1. pH and electrical conductivity
Tailings pH was determined for replicate standardizedslurries following reaction of 5.0 g of field moist tailingswith 5.0 mL distilled deionized (DDI, 18.3 MX cm) waterat 25 �C for 1 h in an end-over-end rotator (McLean,1982). After centrifugation and removal of supernatant,the pH of the supernatant was measured using a glassAg–Ag electrode (Orion, epoxy semi-micro electrode) with
two-point calibration using standard buffer solutions andcalibration checks at pH 4, 7 and 10.
3.3.2. Total metals
All tailings were analyzed for total elemental composi-tion by inductively coupled plasma-optical emission spec-troscopy (ICP-OES) and inductively coupled plasma-massspectrometry (ICP-MS) following digestion or fusion. Cop-per, Zn, As, and Pb were measured by ICP-OES followingtotal digestion (HF, HNO3, HClO4, HCl), and all other ele-ments reported by ICP-MS, following fusion with LiBO2
and Li2B4O7 (Activation Labs, Ontario CA). Certified ref-erence materials were digested and analyzed along withthe tailings samples with an acceptance range of ±10% ofthe certified value to verify precision and accuracy in sam-ple preparation and analysis.
3.3.3. Selective sequential extraction (SSE)
A composite of the top 25 cm of tailings (material beingused in remedial plant growth trials; Solis-Dominguezet al., 2012), as well as samples generated from discretedepth increments were subjected to a replicated six stepSSE to quantify extractable solid phases, targeting solublesalts, adsorbed species, and poorly-crystalline as well ascrystalline sulfate and oxide minerals (see Table 1 anddetailed description in EA, modified after Dold (2003b)and Neaman et al. (2004). After the reaction time, suspen-sions were centrifuged and decanted and the supernatantwas filtered (0.45 lm nylon membrane filters) and acidifiedfor preservation before analysis by ICP-MS. Betweenextraction steps, sediments were washed (washed withDDI water steps 1–4, and with HAc from 5 to 6), washsolution was analyzed for elemental composition withICP-MS, and the concentration added to the relevant step.Averages are reported from extractions run in triplicate andcompared to total concentrations from the ICP-MS/OEStotal digestion of a split sample as described above. Anadditional replicate was sacrificed and preserved after eachstep in the SSE for analysis by XRD and XAS.
3.4. Spectroscopic analyses
3.4.1. X-ray diffraction
For X-ray diffraction analysis, approximately 0.05 g ofground and homogenized sediments were packed betweentwo layers of matte finish tape (Scotch Magice) to obtaina uniform thin layer sample. XRD data were collected atthe Stanford Synchrotron Radiation Lightsource (SSRL)on beam line 11-3 operating at �12735 eV (k = 0.976 A)in transmission mode with a focused spot size of 150 lm,using a 345 mm radius Mar detector image plate with aresolution of 100 lm2 pixels, and calibrated to a LaB6 stan-dard. Three scans were collected and summed for each sam-ple. Laue pattern images were integrated intodiffractograms using the Area Diffraction Machine software(Lande et al., 2007). The summed patterns were correctedfor residual quartz saturation, systematic displacementand converted to conventional Cu Ka wavelength. Thebackground was manually subtracted and the contributionsof amorphous phase(s) to the diffractograms were not

Table 1Selective sequential extraction steps for composite mine tailings (0–25 cm) used in plant growth trials.
Extractant Conc(M)
Solid:solution Time,temp.
Elementsreleaseda
Target phase References
1 H2ON2 sparged
18.2 MX cm
– 1:30 1 h,25 �C
Mg, Al,Ca, Fe, S
Soluble salts, e.g., efflorescent sulfatesalts
Dold (2003b)
2 NH4NO3
Ammonium nitratepH 7
1.0 1:30 2 h,25 �C
Na, Ca, S Mobile, easily exchangeable,bioaccessibleb
Merkel (1996)
3 AAcAmmonium acetatepH 4.5
0.2 1:30 2 h,25 �C
Fe Acid soluble carbonates and non-specifically sorbed
Dold (2003b)
4 NaH2PO4
Sodium phosphatepH 5.0
1.0 1:40 24 h,25 �C
Ti, Fe Specifically sorbed, e.g., inner-sphere Ascomplexed on ferric (hyr)oxide surfacesites
Keon et al. (2001)
5 AAOAmmonium oxalatepH 3, dark
0.2 1:40 2 h,25 �C
Al, Fe Reducible poorly crystalline Fe, Al andMn oxidesc
Jackson et al. (1986),Keon et al. (2001), Dold(2003b)
6 CBDCitrate-bicarbonate-dithionite, pH 3,dark
– 1:40 2 h,80 �C
Al, K, Fe Reducible crystalline Fe, Al and Mnoxides, e.g., including goethite andjarosite d
Jackson et al. (1986)
a More than 10% of total released; detailed in Table 3.b Operationally defined as plant available fraction in (Merkel, 1996).c E.g., schwertmannite and ferrihydrite, jarosite may partially dissolve.d E.g., jarosite and goethite; the dissolution of plumbo-and other substituted jarosite may not be complete with this sequence (Dold, 2003a).
244 S.M. Hayes et al. / Geochimica et Cosmochimica Acta 141 (2014) 240–257
included in the analysis. Quantitative phase analysis wasperformed using the Rietveld module included in the X’PertHighScore Plus software (PANalytical) as described previ-ously (Perdrial et al., 2011). All structural parameters forreference minerals were obtained from the AmericanMineralogist Crystal Structure Database (AMCSD) andthe diffractograms were from the International Centre forDiffraction Data Powder Diffraction File (ICDD PDF-2)database (Downs and Hall-Wallace, 2003; ICDD, 2005).
3.4.2. X-ray absorption spectroscopy
3.4.2.1. Sulfur XANES. Sulfur XANES spectra were col-lected on beam lines 6-2 and 4-3 at the Stanford SynchrotronRadiation Lightsource (SSRL). All S XANES measure-ments were conducted within a helium atmosphere usingan electron yield (EY) detector (to assess potential self-absorption and surface oxidation) or fluorescence detector(better S:N than EY), using a passivated implanted planarsilicon (PIPS) detector. Energy calibration was performedbetween each set of sample scans using the maximum ofthe first peak of sodium thiosulfate, assigned to 2472.0 eV.Samples were prepared in a glove box (Coy, 95% N2,5%H2 gas mix) by applying a thin layer (ca. 5 lm) of sampleon sulfur-free Mylar tape with a thin polypropylene cover toreduce oxidation. Samples were transported to the beam lineunder anoxic conditions and placed directly into the He envi-ronment at room temperature. Scans were collected over anenergy range of 2445–2575 eV.
All scans were processed (dead-time corrected, cali-brated, and averaged) using the SIXPACK software pack-age (Webb, 2005). Data were normalized and fit usinglinear combinations of reference minerals collected under
similar conditions from 2465 to 2515 eV. The number of ref-erence spectra in the final fits was determined based on PCAanalysis indicating that three components were adequate toreconstruct the dataset (not shown). Reference spectra forfinal fits were selected from a library of ca. 30 references(Table EA-1, Fig. EA-3) on the basis of visual inspectionand statistical comparisons of iterative fitting of differentcombinations of reference spectra. Plumbojarosite(representing jarosite-group minerals), gypsum, and pyritereference spectra consistently yielded the best fit statisticsand their presence in the tailings was confirmed by othermethods including XRD and Fe XANES. Errors arereported as v2, a statistical indicator of fit goodness calcu-lated from the sum of squared error divided by the degreesof freedom in the fit.
3.4.2.2. Iron XANES. Iron K-edge XANES data were col-lected on SSRL beam lines 11-2 and 4-1 with beam energyof 300 mA, a 30-element Ge array detector on BL 11-2 anda 13-element Ge array detector on BL 4-1, and a Si (220)phi = 90 double-crystal monochromator with 2 mm verticalbeam slits. Energy was calibrated with an Fe metal foil,with the energy of the inflection of the first-edge assignedto be 7112 eV. To limit beam damage, all data wererecorded at 7–15 K using an Oxford LHe cryostat. Sampleswere ground and homogenized in an anaerobic chamber(Coy, MI), mounted field moist in Teflon plates, sealed withKapton tape, transferred to the beam line under anoxicconditions, and placed in the cryostat He atmosphere.XAS data were acquired between 6860 and 7810 eV(k = 13.5) using 0.35 eV energy steps in the XANES region.Reference samples were collected in fluorescence and

150
175
200
+τenriched-τdepleted
SFe
0
25
50
75
-0.5 0.0 0.5
Dep
th (c
m b
gs)
Feext moles kg-1
C
BA
G
FED
0 2.51.51.00.5 2.0
TotalCBDAAO
AAcNaH2PO4
NH4NO3
H2O
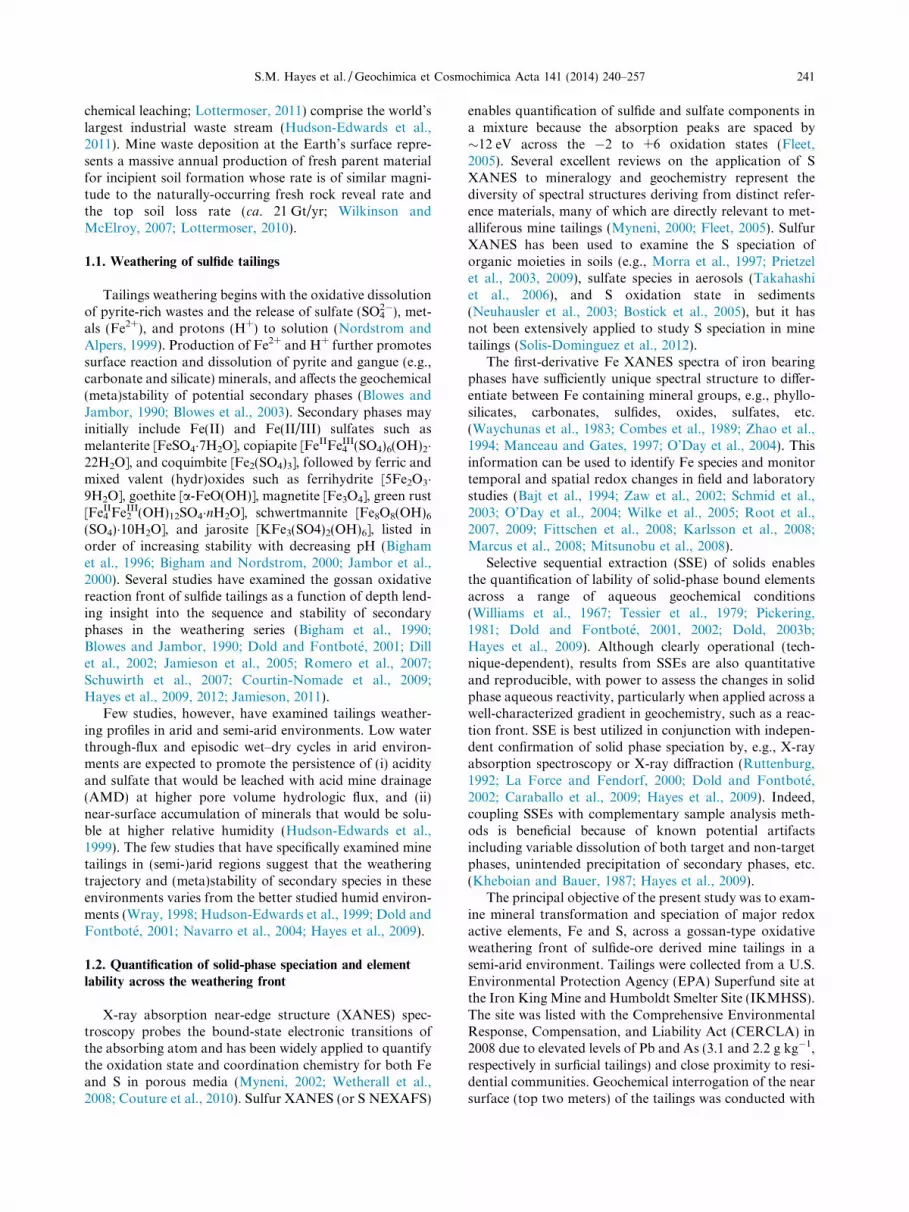
Fig. 2. (a) Chemical depletion/enrichment plot showing Ti nor-malized S (open) and Fe (closed) mass concentrations in theweathering profile relative to parent material taken as 180 cmsample (see Eq. (1)), the dashed line and shaded regions representthe redox boundary. (b) Sequential extraction results for iron as afunction of depth with error bars representing standard deviationof triplicate measurements.
S.M. Hayes et al. / Geochimica et Cosmochimica Acta 141 (2014) 240–257 245
transmission mode using the same procedures as for thetailings samples. Data collection and analysis of Fe refer-ence compounds are described in detail in O’Day et al.(2004).
All scans were energy calibrated, dead time corrected(fluorescence measurements only), and averaged using theSIXPACK software package (Webb, 2005). Spectra werethen background subtracted and normalized to the edge-step with EXAFSPAK software package (George andPickering, 2000). The first derivative of normalized FeXANES spectra were fit using linear combinations in theDATIT module of EXAFSPAK, (fit range 7105–7150 eV).Spectra were iteratively fit by trial-and-error with 1 to 4components from a reference library of �30 spectra (modelspectra in Fig. EA-4, Table EA-1). Fits were optimized byallowing small energy shifts (<1.0 eV) while fitting the com-ponent describing most of the spectral features and minimiz-ing energy shifts in subsequent fit component parameters.Goodness-of-fit is reported as a 99% confidence limit (threetimes the estimated standard deviation) derived from thevariance–covariance matrix in the DATFIT software(Pickering, 2001). The confidence limit is a measure of theprecision of a varied parameter but not necessarily the accu-racy of the fit, in that it does not account for appropriatenessof reference spectra, data quality, or differences in data col-lection (Pickering, 2001). Accuracy of linear combinationanalysis was previously investigated by O’Day et al.(2004), where it was shown that fits were within ±5% ofthe actual mole percentages using the edge region 7100–7150 eV; with a detection limit for minor constituents ofca. 5%. Additional Fe-XANES analysis of SSE residuals isdescribed in Electronic Annex (EA text and Fig. EA-5).
4. RESULTS
4.1. Physical and chemical characteristics
The deepest tailings sample collected (sample G, 180 cm)was apparently similar to the material initially deposited atthe site; it did not exhibit visual evidence of oxidative trans-formation (Table 2, Fig. EA-1) and is characterized by adark gray color and circum-neutral pH (pH = 7.3). Allother tailings exhibit visual evidence of progressive oxida-tive weathering, including lower pH (6.3–2.3; Table 2).The most notable indicator of changing redox conditionsis the dramatic color change from dark yellowish brownto greenish gray between samples D and E. The oxidizedsurface of the tailings profile (top ca. 25 cm), i.e., the gossanzone, had an orange color, acidic pH (pH = 2.3), andhigher clay content relative the lower portion (>ca.
25 cm) of the profile (Table 2).The mass concentrations of major elements Fe and S
exhibit small variation with depth (Table 2), suggesting thatmineralogical changes may occur locally in the profile withlittle translocation of Fe or S to depth or off site. However,to better constrain chemical depletion or enrichmentprofiles for Fe and S across the reaction front, elementalanalyses were normalized to Ti, which was expected to berelatively immobile in the redox transition zone. Enrich-ment (+s) or depletion (�s) of S and Fe are plotted as a
function of depth relative to the “parent material” (repre-sented here by the 180 cm sample) through the reactionfront (top 60 cm) of the tailings profile using Eq. (1)(Brimhall and Dietrich, 1987):
sTi;j ¼Cj;w
Cj;p� CTi;p
CTi;w� 1 ð1Þ
where sTi,j represents the chemical depletion (if negative) orenrichment (if positive) of element j (Fe or S) with respectto Ti in the weathering zone (w) as measured relative to par-ent material (p), and C represents solid phase mass concen-tration. The sT i values for S and Fe show similar trendswith moderate depletion in the oxic gossan zone, �0.35for S and �0.31 for Fe, and slight enrichment below theredox boundary (Fig. 2a).
4.2. Sequential selective extractions (SSE)
The results of the SSE from the top 25 cm compositesample (Table 3) reveal that water-soluble (including efflo-rescent) salts released during the initial step represented asignificant mass fraction of Ca (35%) and a smaller propor-tion of total Mg (8%). A comparable mass fraction of watersoluble Mn (13%) indicates that a portion of the total Mnmay be precipitated as Mn(II) salts. The second step (NH4-
NO3), targeting exchangeable ions, liberated most of thetotal Na (72%) and the second largest pool of Ca (30%).Elemental mass fractions were low overall during the third(AAc) step (which should include any residual carbonates),the highest being for Fe (7%). Large pools of Fe (24%) weresolubilized during oxalate-promoted dissolution targetingpoorly-crystalline Fe(III) and Al(III) bearing solids (step5). Most of the remaining Fe (41%) was removed duringdissolution targeting Fe(III) oxides/sulfates by citrate bicar-bonate dithionite (CBD). This reductive dissolution ofmore crystalline secondary Fe(III) [and Mn(IV)] solidsreleased the largest extractable fraction of K (17%, presum-

Table 2Near surface samples from Iron King mine tailings showing the variation in physical and chemical properties by depth.
Samplea Depthb
(cm)pHc Sandd
(%)Silte
(%)Clayf
(%)Colorg (dry) Colorg (wet) Feh
(%)Sh
(%)Majori
componentsMinorj components % Water
contentk
A 0–5 2.3 14.8 45.7 39.5 2.5Y 7/4 grayish yellow 2.5Y 6/8 olive yellow 12.9 9.7 qtz, gyp, jar, fh plag, chl, pyt 19B 5–15 2.3 38.4 40.4 21.2 10YR 6/6 brownish yellow 10YR 4/6 dark yellowish
brown12.7 10.4 qtz, gyp, fh, jar plag, chl, pyt 17
C 15–25 3.7 31.1 49.2 19.7 7.5YR 5/6 strong brown 7.5YR 3/4 dark brown 14.2 11.5 qtz, gyp, pyt, ill plag, chl, fh, schw 30D 25–35 5.5 40.4 47.9 11.6 10YR 4/6 dark yellowish
brown10YR 3/4 dark yellowishbrown
12.3 13.3 qtz, gyp, pyt plag, chl, ank, fh 18
E 35–38 6.3 5.05 75.5 19.4 10Y 5/2 greenish gray 5GY 3/2 very dark grayishgreen
13.8 10.6 qtz, gyp, ill, pyt plag, chl, fh, sid, ank 37
F 38–54 6.0 28.2 58.4 13.4 5GY 5/2 greenish gray 10Y 3/2 very dark greenishgray
13.6 12.4 qtz, pyt plag, chl, ill, gyp, sid,
ank7.0
G 180–183 7.3 11.2 67.0 21.8 5GY 5/2 grayish green 5GY 3/2 very dark grayishgreen
12.7 14.1 qtz, pyt chl, ank, cal 24
a Sample is the pit or core depth label referred to in the text.b Depth is the interval below the surface.c pH was measured on wet paste.d The size fractions are defined as sand = 50 lm–2 mm.e The size fractions are defined as silt = 2 lm–50 lm.f The size fractions are defined as clay < 2 lm.g Color is based on Munsell color chart.h Fe and S% are the wt% of each in the bulk tailings at each depth sampled.i Major components are those that make up >10% by XRD Rietveld fits.j Minor components determined by XRD and XANES. Phases present in order of estimated abundance (secondary minerals shown in italics): qtz = quartz, gyp = gypsum, jar = jarosite,
fh = ferrihydrite, plag = plagioclase, chl = chlorite, pyt = pyrite, ill = illite, ank = ankerite, schw = schwertmannite, formulae given in Table 7.k Percent moisture was determined gravimetrically as (mwet � mdry)/mdry � 100.
246S
.M.
Hayes
etal./
Geo
chim
icaet
Co
smo
chim
icaA
cta141
(2014)240–257

Table 3Results from sequential selective extraction (SSE) of composited IK mine tailings (0–25 cm).
DLa
(lmol kg�1)Totalb
(mmol kg�1)DI H2Oc
(lmol kg�1)NH4NO3
c
(lmol kg�1)AAcc
(lmol kg�1)NaH2PO4
c
(lmol kg�1)AAOc
(lmol kg�1)CBDc
(lmol kg�1)R(1�6)
d
(lmol kg�1)Labilee
(%)Residualf
(%)
Element Total Water soluble Plant available Acidsoluble
Specificallysorbed
Amorphous(oxyhydr)oxides
Crystalline(oxyhydr)oxides
Extractable Unextractable
Na 1.74 230(10)g 30(7) 1670(8)E2 19(4)E2 <DLh <DL <DL 169(1)E3 72.5 27.5Mg 3.29 510(21) 384(4)E2 9(1)E2 310(70) 250(20) 11(1)E2 1060(20) 421(7)E2 8.25 91.8Al 1.48 1520(30) 649(7)E2 9(2)E2 14(2)E2 910(50) 99(2)E2 10300(80) 88(1)E3 5.80 94.2K 1.02 93(1) 14(2) 24(3)E2 21(1)E2 44(4)E2 88(2)E2 163(2)E2 34(1)E3 36.4 63.6Ca 9.98 1240(25) 43(3)E4 37(4)E4 37(4)E2 13(1)E2 76(4)E2 7940(70) 82(6)E4 66.0 34.0Ti 0.0418 107(2) 4.3(4) 5.9(6) 7(1) <DL <DL <DL 17(2) 0.02 99.8Mn 0.0364 6.5(8) 1770(80) 100(9) 30(4) 49(4) 1010(20) 1270(60) 42(2)E2 64.5 35.5Fe 0.716 2020(80) 43(2)E3 280(60) 17(1)E3 20(1)E3 548(6)E3 94(1)E4 157(2)E4 77.6 22.4
a Detection limit (nmol kg�1) based on ICP-MS instrument detection limit and dilution factors used.b Total (mmol kg�1) composition determined by lithium borohydrite fusion followed by with ICP-MS/OES detection.c See details in Table 1.d Sum of extraction steps 1–6, represents the labile fraction.e Labile is the extractable percentage liberated in the SSE scheme.f Residual is the unextracted totals from the difference between the SSE steps 1–6 and the total.g Values in parenthesis are ± standard deviation of replicate measurements in scientific notation, where necessary (e.g., 230(10) = 230 ± 10 and 1670(8)E2 = 167000 ± 800).h <DL indicates less than the detection limit, i.e., the result was not quantifiable as significantly different from the calibration blank and where reported for Ti the result was not distinguishable
from the reagent blank.
S.M
.H
ayeset
al./G
eoch
imica
etC
osm
och
imica
Acta
141(2014)
240–257247

depth (cm)
Position o2θ (λ-Cu Kα)
Inte
nsity
(Arb
. uni
ts)
Ref
eren
ces
Fig. 3. X-ray diffraction data and fits. Synchrotron transmission XRD patterns (black lines) converted to Cu Ka scale of IKMHSS pitsamples at depths A–G and composite (0–25 cm) SSE samples, with corresponding Rietveld models (gray lines). Lower diffractogramsrepresent the simulated patterns of selected phases used in the Rietveld models. Data are normalized to quartz. All jarosite group minerals(e.g., plumbojarosite, hydronium jarosite, jarosite) are modeled here using jarosite. Quantitative results are displayed in Table 4.
248 S.M. Hayes et al. / Geochimica et Cosmochimica Acta 141 (2014) 240–257
ably from jarosite), and the second largest fraction of Mn(10%). The AAO and CBD steps are both known todissolve jarosite-group minerals (Dold, 2003a). Overall,these results indicate the presence of a large mass fractionof secondary Fe-bearing phases, as well as of soluble salts,in the top of portion of the profile. Since none of the SSEsteps target silicate or sulfide minerals, the large pool of“residual” Fe (31%) was attributed dominantly to silicatesand sulfides. Results of synchrotron analyses on selectedsolid phase residual samples are discussed below.
An identical SSE was conducted on the full set of depth-resolved samples to assess trends in iron fractionation andlability through the redox boundary (Fig. 2b). In the nearsurface 0–5 cm (sample A), the largest fraction of Fe(64%) is extracted in the CBD step, targeting crystallinepedogenic ferric oxides/sulfoxides, e.g., jarosites. The sec-ond largest pool of Fe (20%) was solubilized in the AAOstep targeting poorly crystalline ferric (hydr)oxides, e.g.,ferrihydrite. At 5–15 cm (sample B) the CBD-extractablefraction decreased to 38% and the AAO-extractable frac-tion increased to 26%, and there was also a significant waterextractable fraction (5.3%). At 15–25 cm (sample C) theCBD extractable Fe was decreased further (7.4%), while25% of the total Fe was extractable in AAO. From 25 cmto the deepest samples (180 cm) there was a small pool ofAAc extractable Fe, targeting carbonates (e.g., ankerite).Hence, there is a general increase in the ratio of CBD toAAO extractable Fe moving up from the redox boundaryto the surface that follows the trend of decreasing pH.Small but significant mass fractions of AAO-extractable
Fe persist below the visually apparent (from color) redoxboundary. On the basis of spectroscopic and diffractiondata presented below, we attribute this to dissolution ofpyritic fine particulates and/or post-sampling oxidation ofpyrite and precipitation of AAO extractable ferric (oxy-hydr)oxide phases either during the SSE or during samplestorage. Samples were kept frozen, isolated from oxygen,and analyzed as soon as possible by X-ray techniques,and while all spectroscopic techniques were carried out withgreat care to minimize post sampling oxidation, the SSEscheme was conducted in the open laboratory and wasnot isolated from molecular oxygen during the procedures.
Extractable S was released principally by the de-ionizedwater step, targeting soluble salts e.g., efflorescent salts andgypsum (10–27% through the sample depths, not shown).A smaller pool extracted by NH4NO3, targeting exchange-able ions, decreased with depth. Little S was solubilized withthe AAO extraction step, indicating that S was not occludedinto ferric (oxyhydr)oxides. Sulfur was not quantified in theCBD step due to high background S from dithionite, butbased on the Fe SSE the remaining S is attributable to jaro-site in the near surface and increasingly to pyrite with depth.
4.3. Bulk mineralogy
Bragg reflections from XRD were refined to quantifyseveral phases present in the tailings (Fig. 3, Table 4),including quartz, feldspars, clays, sulfides, sulfates, and car-bonates. In respect to Fe and S weathering, pyrite, presentin all samples, shows increasing depletion toward the

Tab
le4
Qu
anti
tati
veX
RD
resu
lts
of
the
crys
tall
ine
min
eral
ph
ases
inth
ep
itsa
mp
les
fro
mR
ietv
eld
sim
ula
tio
n.
Diff
ract
ion
pat
tern
ssh
ow
nin
Fig
.3.
Sam
ple
nam
eD
epth
Qu
artz
Pla
gio
clas
eIl
lite
“C
hlo
rite
”K
aoli
nit
eP
yrit
eG
yp
sum
H+
Jaro
site
Mel
ante
rite
Ank
erit
eS
ider
ite
Rxtl
v2
(cm
)S
iO2
(Ca,
Na)
(Al,
Si)
4O
8
K(A
l,M
g,F
e)2
(Si,
Al)
4O
10
[(O
H) 2
,(H
2O
)]14
AA
l 2S
i 2O
5
(OH
) 4
FeS
2C
aS
O4�2
H2O
(K
,H3O
)F
e 3(
SO
4)
2(
OH
)6
FeS
O4�7
H2O
Ca
Fe(
CO
3)
2F
eCO
3G
.O.F
a
A0–
541
.32.
80
4.8
2.9
21
5.9
30
.30
00
100
4.3
B5–
1549
.33.
30
8.7
3.8
1.4
19
.51
4.1
00
010
0.1
3.9
C15
–25
381.
36.
820
.43.
710
.81
70
2.1
00
100.
14.
3D
25–3
553
.69.
10
02.
921
.31
1.3
00
1.7
099
.92.
2E
35–3
835
.94.
28.
218
.61.
217
.41
1.6
00
1.6
1.3
100.
23.
8F
38–5
442
.73.
310
.47.
21.
218
.27
.20
07
.22
.810
0.2
7.2
G18
0–18
331
.42.
312
.121
.60.
518
.10
00
9.5
095
.50.
5
AA
Ob
0–25
55.3
8.1
014
.21.
23.
10
18
.20
00
100.
11.
8C
BD
c0–
2568
138.
28.
81.
60.
50
00
00
100.
12.
2
XR
DR
ietv
eld
fits
toin
itia
lga
ngu
em
iner
alan
dse
con
dar
yp
has
es(i
nit
alic
s).
Th
ere
fin
emen
td
oes
no
td
iffer
enti
ate
typ
eso
fja
rosi
tean
dd
oes
no
tin
clu
de
amo
rph
ou
so
rp
oo
rly
crys
tall
ine
ph
ases
incl
ud
ing
ferr
ihyd
rite
and
sch
wer
tman
nit
e,w
hic
his
sho
wn
toac
cou
nt
for
up
to8.
6%an
d5.
3%,
resp
ecti
vely
calc
ula
ted
fro
mth
eto
tal
Fe
and
Fe-
XA
NE
S.
av2
rep
rese
nt
the
goo
dn
ess
of
fit
(bet
wee
n4�
and
70�2
h)an
dco
rres
po
nd
tov2
=[R
i(I
ob
s�
I calc
) i2/r
2(I
ob
s)i]/
(n�
p);
wit
hI
the
inte
nsi
ty,r
(Io
bs)
the
esti
mat
eder
ror
of
the
mea
sure
(fixe
dto
10%
of
the
cou
nts
),n
isth
en
um
ber
of
po
ints
use
dfo
rsi
mu
lati
on
and
pth
en
um
ber
of
par
amet
ers
esti
mat
ed.
bA
fter
AA
Oex
trac
tio
no
f0–
25cm
com
po
site
sam
ple
.c
Aft
erC
BD
extr
acti
on
of
0–25
cmco
mp
osi
tesa
mp
le.
Nor
mal
ized
abs
orba
nce
(arb
. uni
ts)
FeAsS
Energy (eV)
F (38-54)
E (35-38)
D (25-35)
C (15-25)
B (5-15)
A (0-5)
2465 2485 2505
Sulfate
Sul
fide
Pyrite
Gypsum
(Pb)Jarosite
G(180-183)
depth (cm)
Fig. 4. Sulfur XANES. The S oxidation state was directly probedwith S K-edge XANES (fits shown as dashed lines). Fits (range2465–2515 eV) are tabulated in Table 5. Arrows indicate subtlesulfate features that differentiate gypsum and (Pb)jarosite.
S.M. Hayes et al. / Geochimica et Cosmochimica Acta 141 (2014) 240–257 249
surface, where jarosite-group minerals (e.g., plumbojaro-site, hydronium jarosite, jarosite, and natrojarosite) andgypsum were found to accumulate (Fig. 3, Table 4). Car-bonate phases, identified only at >25 cm depth, wherepH > 6 (samples D–G), were predominantly in the formof ankerite, with smaller quantities of siderite, whereas cal-cite was detected only in the deepest sample G.
4.4. X-ray absorption spectroscopy
Despite relatively constant total mass concentrations ofFe and S with depth (Table 2), sulfur XANES reveals a sys-tematic depth-dependency in S-containing minerals thatcan be quantified using linear combination fits to pyrite,gypsum, and jarosite-group (modeled using plumbojaro-site) references (Fig. 4, Table 5). Pyrite, present in all sam-ples, increases in mass fraction with depth (from 11% to95% of the total S). Gypsum, while present in all samples,has its maximum contribution to total S mass at intermedi-ate depth (sample D) and it decreases in prevalence bothwith increasing depth and toward the surface. The preva-lence of jarosites decreases with increasing depth from68% of total S in sample A (0–5 cm) to undetectable in sam-ple D (25–35 cm) and below.
Iron XANES data likewise indicate coherent depth-dependent trends in iron sulfide, carbonate, (oxyhydr)oxide,and (hydroxy)sulfate in the top meter of IKMHSS tailings

Table 5Results of sulfur XANES showing percent mineral phase components in bulk S from IKMHSS mine tailing. Spectra shown in Fig. 4, fit range:2465–2515 eV.
Sample Depth(cm)
S phases LC fita
Gypsum Jarositesb Pyritec Rsulf v2d
A 0–5 18 68 11 97 0.004B 5–15 31 53 14 98 0.004C 15–25 41 35 22 98 0.001D 25–35 60 – 40 1.00 0.0007E 35–38 40 – 60 1.00 0.0004F 38–54 31 – 67 98 0.0005G 180–183 5e – 95 1.00 0.001
a Linear combination fits were not normalized to unity.b The hydrosulfates were best fit with jarosite, differentiation of jarosites was not attempted and the reported value may be a mixture of
jarosites (e.g., hydronium-, natro-, plumbo-, jarosite) and schwertmannite.c The sulfide component was best fit with pyrite, but this fraction may contain other metal sulfides, e.g., ZnS, PbS.d v2 is the reduced chi squared statistical indicator, calculated from the sum of the error divided by the degrees of freedom in the fit, is a
goodness of fit parameter that is iteratively minimized with combinations of components, it does not indicate that the correct componentswere selected, but reports how well the selected components fit the data.
e The gypsum is a weathering product of pyrite and Ca-bearing carbonates or silicates in surficial tailings and at depth is likely a byproductof Zn processing by lime addition or post sampling oxidation.
7110 7130 71507110 7130 71507110 7130 7150
Pyrite
Ankerite
Schwert
Pb-jarosite
Ferrihydrite
Chlorite
Firs
t Der
ivat
ive
Abs
orba
nce
Firs
t Der
ivat
ive
Abs
orba
nce
Nor
mal
ized
Abs
orba
nce
Energy (eV)Energy (eV)Energy (eV)
A. B. C.Normalized 1st derivative1st derivative
F(38-54)
E(35-38)
D(25-35)
C(15-25)
B(5-15)
A(0-5)
G(180-183)
depth (cm)
F
E
D
C
B
A
G
Fig. 5. Iron XANES. (A) IKMHSS normalized XANES from the shallow pit (0–55 cm) and deeper core (to 180 cm) from mine tailings (fitscalculated from first-derivative fits shown in dashed lines), (B) IKMHSS first derivative sample spectra (fits shown in dashed lines), and (C) Fefirst-derivative XANES of reference minerals used in XANES linear combination fits. The Fe XANES show a gradual transition from ferricoxide to ferrous sulfide phases from the surface to deep tailings.
250 S.M. Hayes et al. / Geochimica et Cosmochimica Acta 141 (2014) 240–257
(Fig. 5, Table 6). Consistent with the S XANES and XRD,the prevalence of pyrite decreased from 71% at 180–183 cmto 2% at 0–5 cm. Ankerite was only detected in samples withpH P 5.5 (sample D), with maximum relative abundance of22% in sample F. The relative abundance of ankerite is 12%in the deepest sample, consistent with its presence as a sec-ondary phase precipitating during initial post-depositionalpyrite oxidation. Ferrihydrite was detected in all surficialsamples (samples A–E) with a maximum abundance in
sample B. Schwertmannite is detected only in sample Cwhere the bulk pH is intermediate (pH = 3.7). Jarosite-group minerals are present in the surficial samples A andB with abundance increasing toward the ground surfacealong with decreasing pH.
Detrital iron-bearing silicates, represented in the refer-ence set by ripidolite (CCa-2), an Fe rich chlorite-group,2:1 layer-type clay, with Fe (FeIII/FeII = 1.15; O’Dayet al., 2004) in octahedral coordination, was present in all

Table 6Iron first-derivative XANES fit results, showing percent components in bulk iron from IKMHSS mine tailings. Spectra shown in Fig. 5, fit range: 7100–7150 eV.
Section Depth(cm)
Fit DeV c.l.a Fit DeV c.l.a Fit DeV c.l.a Fit DeV c.l.a Fit DeV c.l.a Fit DeV c.l.a Rb
Intact pit Ferrihydritec Pb-jarosited Schwertmannitee Ankeritef Pyriteg Chloriteh Total
A 0–5 31 0.10 6 58 0.87 4 – – – – – – 2i 0.20 2 9 0.12 2 1.00B 5–15 47 0.02 5 32 0.33 4 – – – – – – 13 0.25 2 12 0.52 2 1.05C 15–25 25 0.10 28 – – – 25 0.1 25 – – – 29 0.15 5 21 0.10 3 0.99D 25–35 30 0.00 2 – – – – – – 5 0.52 2 49 0.18 3 16 0.40 2 1.00E 35–38 33 0.19 3 – – – – – – 6 0.06 2 43 0.15 2 16 0.30 2 0.98F 38–54 – – – – – – – – – 22 0.06 2 59 0.00 4 16 0.30 2 0.97G 180–183 – – – – – – – – – 12 0.02 2 71 0.73 2 25 0.03 1 1.07
Isolatesj
Tan 0–25 26 0.10 5 74 0.08 4 – – – – – – – – – 9 0.45 1 1.09Red 0–25 24 0.02 6 – – – 60 0.24 3 – – – – – – 15 0.09 3 0.99Blue 0–25 – – – – – – – – – 17 0.02 2 64 0.08 2 20 0.61 2 1.01SSE unrxk 0–25 59 0.29 6 22 0.00 5 – – – – – – 9 0.15 2 10 0.89 2 1.00AAOl 0–25 – – – 47 0.34 2 – – – – – – 30 0.37 2 16 0.53 2 0.93CBDm 0–25 – – – – – – – – – – – – 36 0.71 1 63 0.23 1 0.99
a Goodness-of-fit reported as 99% confidence limit (c.l.), which is three times the estimated standard deviation (Pickering, 2001), the estimated detection limit for Fe components fit by LCFXANES is 0.05 (O’Day et al., 2004).
b Fit components were not normalized.c Fit with synthetic 2-line ferrihydrite spectrum, prepared following (Cornell and Schwertmann, 2003).d Fit with synthetic plumbojarosite reported in (Hayes et al., 2012).e Fit with synthetic schwertmannite spectrum, prepared following (Cornell and Schwertmann, 2003).f Presence of ankerite confirmed with XRD and FTIR.g Fit with natural pyrite spectrum, confirmed with XRD, reference mineral previously analyzed by XAS (O’Day et al., 2004).h Fit with reference chlorite (CCa-2), Clay Minerals Society reference mineral previously analyzed by XAS (O’Day et al., 2004).i The 0.02 pyrite fraction was included because it was observed as a residual in sequential extraction and statistically significantly improved the LCF.j Isolates include: as-collected grains from the oxic tailings; separated based on color and sequential extraction splits.
k Composite tailings from 0 to 25 cm (Solis-Dominguez et al., 2012).l After SSE-AAO of composite sample (0–25 cm).
m After SSE-CBD of composite sample (0–25 cm).
S.M
.H
ayeset
al./G
eoch
imica
etC
osm
och
imica
Acta
141(2014)
240–257251
2.0
3.0
4.0
5.0
6.0
7.0
8.0
0.5
0
1.0
1.5
2.0
2.5
3.0
3.5
0 0.5 1.0 1.5 2.0 2.5 3.0 3.5PyriteFe (mol kg-1)
pH
Pyrit
e 2S (m
ol k
g-1)
A B
C
D
E F
G
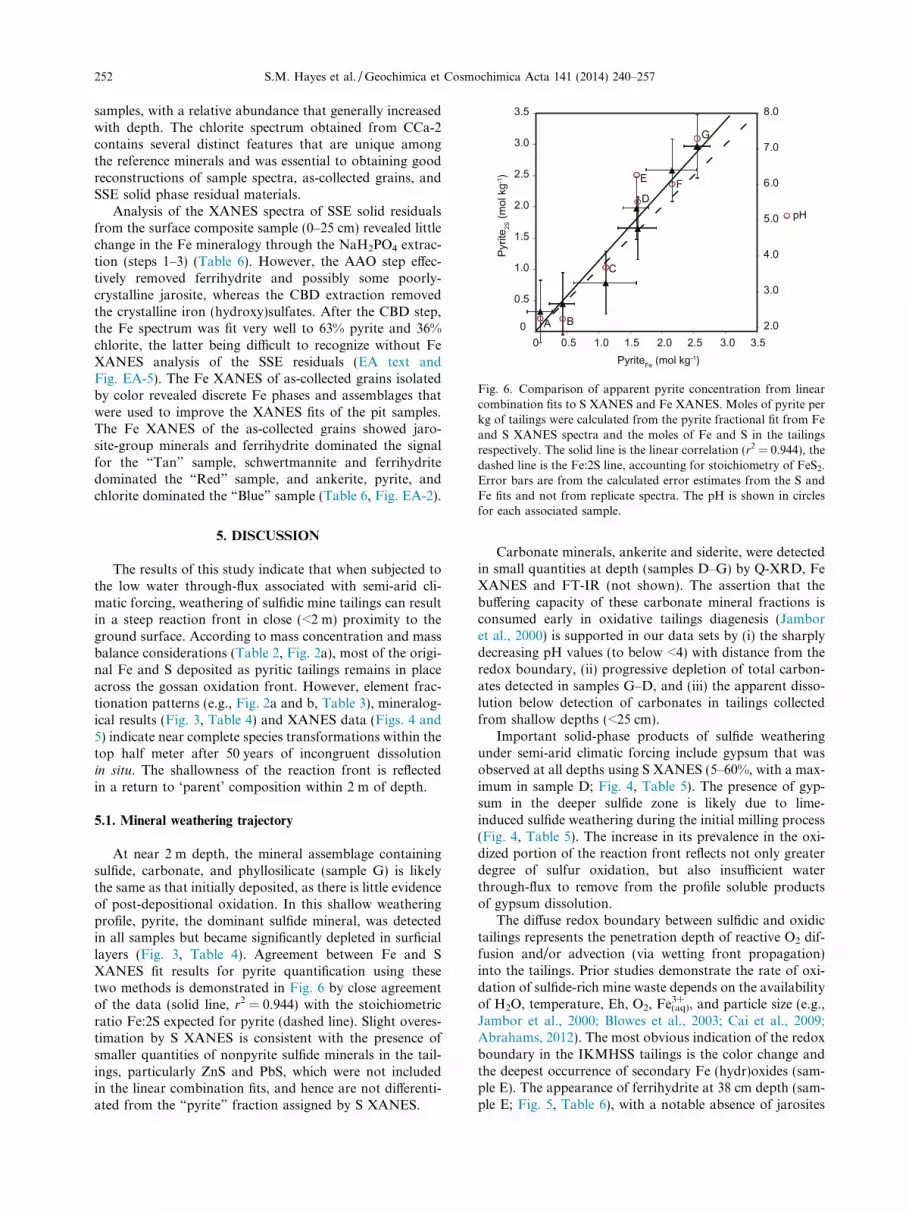
Fig. 6. Comparison of apparent pyrite concentration from linearcombination fits to S XANES and Fe XANES. Moles of pyrite perkg of tailings were calculated from the pyrite fractional fit from Feand S XANES spectra and the moles of Fe and S in the tailingsrespectively. The solid line is the linear correlation (r2 = 0.944), thedashed line is the Fe:2S line, accounting for stoichiometry of FeS2.Error bars are from the calculated error estimates from the S andFe fits and not from replicate spectra. The pH is shown in circles
252 S.M. Hayes et al. / Geochimica et Cosmochimica Acta 141 (2014) 240–257
samples, with a relative abundance that generally increasedwith depth. The chlorite spectrum obtained from CCa-2contains several distinct features that are unique amongthe reference minerals and was essential to obtaining goodreconstructions of sample spectra, as-collected grains, andSSE solid phase residual materials.
Analysis of the XANES spectra of SSE solid residualsfrom the surface composite sample (0–25 cm) revealed littlechange in the Fe mineralogy through the NaH2PO4 extrac-tion (steps 1–3) (Table 6). However, the AAO step effec-tively removed ferrihydrite and possibly some poorly-crystalline jarosite, whereas the CBD extraction removedthe crystalline iron (hydroxy)sulfates. After the CBD step,the Fe spectrum was fit very well to 63% pyrite and 36%chlorite, the latter being difficult to recognize without FeXANES analysis of the SSE residuals (EA text andFig. EA-5). The Fe XANES of as-collected grains isolatedby color revealed discrete Fe phases and assemblages thatwere used to improve the XANES fits of the pit samples.The Fe XANES of the as-collected grains showed jaro-site-group minerals and ferrihydrite dominated the signalfor the “Tan” sample, schwertmannite and ferrihydritedominated the “Red” sample, and ankerite, pyrite, andchlorite dominated the “Blue” sample (Table 6, Fig. EA-2).
for each associated sample.
5. DISCUSSION
The results of this study indicate that when subjected tothe low water through-flux associated with semi-arid cli-matic forcing, weathering of sulfidic mine tailings can resultin a steep reaction front in close (<2 m) proximity to theground surface. According to mass concentration and massbalance considerations (Table 2, Fig. 2a), most of the origi-nal Fe and S deposited as pyritic tailings remains in placeacross the gossan oxidation front. However, element frac-tionation patterns (e.g., Fig. 2a and b, Table 3), mineralog-ical results (Fig. 3, Table 4) and XANES data (Figs. 4 and5) indicate near complete species transformations within thetop half meter after 50 years of incongruent dissolutionin situ. The shallowness of the reaction front is reflectedin a return to ‘parent’ composition within 2 m of depth.
5.1. Mineral weathering trajectory
At near 2 m depth, the mineral assemblage containingsulfide, carbonate, and phyllosilicate (sample G) is likelythe same as that initially deposited, as there is little evidenceof post-depositional oxidation. In this shallow weatheringprofile, pyrite, the dominant sulfide mineral, was detectedin all samples but became significantly depleted in surficiallayers (Fig. 3, Table 4). Agreement between Fe and SXANES fit results for pyrite quantification using thesetwo methods is demonstrated in Fig. 6 by close agreementof the data (solid line, r2 = 0.944) with the stoichiometricratio Fe:2S expected for pyrite (dashed line). Slight overes-timation by S XANES is consistent with the presence ofsmaller quantities of nonpyrite sulfide minerals in the tail-ings, particularly ZnS and PbS, which were not includedin the linear combination fits, and hence are not differenti-ated from the “pyrite” fraction assigned by S XANES.
Carbonate minerals, ankerite and siderite, were detectedin small quantities at depth (samples D–G) by Q-XRD, FeXANES and FT-IR (not shown). The assertion that thebuffering capacity of these carbonate mineral fractions isconsumed early in oxidative tailings diagenesis (Jamboret al., 2000) is supported in our data sets by (i) the sharplydecreasing pH values (to below <4) with distance from theredox boundary, (ii) progressive depletion of total carbon-ates detected in samples G–D, and (iii) the apparent disso-lution below detection of carbonates in tailings collectedfrom shallow depths (<25 cm).
Important solid-phase products of sulfide weatheringunder semi-arid climatic forcing include gypsum that wasobserved at all depths using S XANES (5–60%, with a max-imum in sample D; Fig. 4, Table 5). The presence of gyp-sum in the deeper sulfide zone is likely due to lime-induced sulfide weathering during the initial milling process(Fig. 4, Table 5). The increase in its prevalence in the oxi-dized portion of the reaction front reflects not only greaterdegree of sulfur oxidation, but also insufficient waterthrough-flux to remove from the profile soluble productsof gypsum dissolution.
The diffuse redox boundary between sulfidic and oxidictailings represents the penetration depth of reactive O2 dif-fusion and/or advection (via wetting front propagation)into the tailings. Prior studies demonstrate the rate of oxi-dation of sulfide-rich mine waste depends on the availabilityof H2O, temperature, Eh, O2, Fe3+
(aq), and particle size (e.g.,Jambor et al., 2000; Blowes et al., 2003; Cai et al., 2009;Abrahams, 2012). The most obvious indication of the redoxboundary in the IKMHSS tailings is the color change andthe deepest occurrence of secondary Fe (hydr)oxides (sam-ple E). The appearance of ferrihydrite at 38 cm depth (sam-ple E; Fig. 5, Table 6), with a notable absence of jarosites

Ferrihydrite
Pyrite
Fe2+
Fe3+
0 2 4 6 8 10pH
-0.5
0
0.5
1.0
Eh (v
olts
)
log[Fe] = -3log[SO4] = -3log[K] = -525oC, 1 bar
Jaro
site
Schw
ertm
anni
te
O2/H2O
H2O/H2
Fig. 7. Activity–activity diagrams, shown with the energeticallyfavorable hematite and goethite suppressed to illustrate themetastable Fe and S phases. The Eh–pH diagram showsPb-jarosite, schwertmannite and ferrihydrite as the meta-stableiron phases in oxic-environments. The model was constrained byXANES and XRD, and elemental activities are given in inset.
S.M. Hayes et al. / Geochimica et Cosmochimica Acta 141 (2014) 240–257 253
and schwertmannite until 25 cm depth (sample C; Fig. 5,Table 6), suggests that ferrihydrite is the first metastableiron solid phase to form upon pyrite oxidation. Previousstudies have reported the ubiquitous presence of ferrihy-drite particularly in Fe- and S-rich mine-wastes atpH > 5.5–5.8 (Bigham et al., 1996; Williams et al., 2002).In an Eh-pH model of the IKMHSS tailings (Fig. 7), weplot a range of log Ksp values for ferrihydrite (e.g., logKsp = 3.0–5.66; Delany and Lundeen, 1990; Majzlanet al., 2004), and suppress thermodynamically-stable hema-tite, goethite, and magnetite to highlight the metastable iron
Table 7Identification of mineral and amorphous phases in the Iron King mine t
Minerala Formulae
Quartz SiO2
Plagioclase (Ca,Na)(Al,Si)4O8
Illite K(Al,Mg,Fe)2(Si,Al)4O10[(OHChlorite (Mg,Al,Fe)6(Si,Al,Fe)4O10(OKaolinite Al2Si2O5 (OH)4
Pyrite FeS2
Ankerite CaFe(CO3)2
Calcite CaCO3
Gypsum CaSO4�2H2OJarosite (K,H3O)Fe3(SO4)2(OH)6
Melanterite FeSO4�7H2OSiderite FeCO3
Schwertmannite Fe8O8(OH)6(SO4)Ferrihydrite (5Fe2O3�9H2O)Plumbo-jarosited (Pb)Fe6(SO4)4(OH)12
a Initial gangue minerals and secondary phases (in italics).b Positive identification by any method was sufficient evidence for thec The carbonate phase was identified with FT-IR and with further inved Plumbo-jarosite was not differentiated from other jarosites.
phases observed. Evidently, the observation of ferrihydritein samples E–A demonstrates its persistence far outside ofits predicted stability field, down to pH = 2.6.
When water activity is assumed to equal one, iron (oxy-hydr)oxide and (hydroxy)sulfate minerals are predicted totransform to goethite, a transformation generally thoughtto take months to years (Bigham et al., 1990; Murad andRojik, 2005). Bigham et al. (1996) reported the completetransformation of synthetic schwertmannite to goethite in543 days. Interestingly, we see no evidence of such transfor-mations in the IKMHSS tailings. The absence of XRDdetectable crystalline goethite or hematite indicates that thetransformation kinetics of ferrihydrite are retarded in thissulfate-rich, semi-arid environment. It is noteworthy, there-fore, that no goethite or hematite has been detected at this siteand metastable minerals appear to have persisted through ca.50 years of weathering. Indeed, ferrihydrite persists at thissite under much lower pH conditions than has previouslybeen reported (e.g., pH = 4.5–5; Murad and Rojik, 2005).
Melanterite and schwertmannite were observed to occurexclusively in sample C (pH 3.7), signaling a metastable tran-sition in the reaction front between ferrihydrite and jarosite.Melanterite was detected by XRD but not Fe XANES, likelybecause of the heterogeneity of the natural samples. Schw-ertmannite is metastable at lower pH conditions than fer-rihydrite (Fig. 7), and is most stable at pH 3–4 (Bighamet al., 1996). However, prior studies have reported the pres-ence of schwertmannite in systems with pH 2.5–6.5 (Winlandet al., 1991; Bigham et al., 1996; Murad and Rojik, 2005).
Jarosite-group minerals, along with ferrihydrite, weredetected in samples A–B by XRD and XANES (both Feand S) and account for the principle secondary iron phasespresent at the tailings surface. Jarosites are most stable atlow pH (<2.8) conditions (Bigham et al., 1990; Bighamand Nordstrom, 2000; Murad and Rojik, 2005) and cancontain a variety of cations, including protons, H3O+,Na+, NH4
+, and Pb2+ (Jambor et al., 2000).
ailings.
Detectionb
XRDXRD
)2(H2O)] XRDH)8 XRD, Fe XANES
XRDXRD, Fe XANES, S XANESXRD, Fe XANES, FT-IRc
XRDXRD, S XANESXRD, Fe XANES, S XANESXRDXRDFe XANESFe XANESFe XANES, XRD
presence of the phase, acknowledging the error in each technique.stigation of Fe XANES and Q-XRD was confirmed to be ankerite.

254 S.M. Hayes et al. / Geochimica et Cosmochimica Acta 141 (2014) 240–257
Low water through-flux in (semi-)arid environments areexpected to influence the rate and trajectory of mineral trans-formations and the formation and persistence of secondaryphases (Jambor et al., 2000; Dill et al., 2002, 2012). Previousstudies have reported the transformation of primary sili-cates, carbonates, and sulfides to secondary (oxyhydr)oxidesand sulfate minerals under a range of climatic forcings (e.g.,Hudson-Edwards et al., 1996; Murad and Rojik, 2005). Ourresults are generally consistent with previously reportedresults. We observe in the near-surface of the tailings profile(at the sub-meter scale) the incongruent weathering trajec-tory: pyrite, silicate minerals, and carbonates! ferrihydriteand gypsum! schwertmannite! jarosite-group minerals(Table 7).
However, the mineralogical sequence observed at thissite emphasizes the apparent persistence of metastable min-erals, such as ferrihydrite and schwertmannite, at timesunder conditions far from their predicted equilibrium sta-bility. The apparent persistence of these metastable phasesmay be largely due to (i) the retention against downwardleaching of sulfate in tailings pore waters, since this inhibitsthe transformation of ferrihydrite to more crystallinephases (Majzlan and Myneni, 2005) and (ii) low relativehumidity in semi-arid tailings (Majzlan, 2010). Hence,unlike mine tailings weathering processes in more humidenvironments, tailings diagenesis at IKHMSS is stronglycontrolled by low water activity and the fact that sulfateis not translocated to depth and out of the oxidative reac-tion front, a direct result of a semi-arid climate that imposeslow pore volume through-flux.
5.2. Depth of reaction front
Clearest indication of the redox boundary in theIKMHSS tailings is the deepest occurrence of secondaryFe (hydr)oxides (35–38 cm) since this presents a distinctlyorange color and dramatic change in mineralogy. However,evidence of oxidation in deeper samples is reflected in adecrease in pH and smaller percentage of calcite in sampleF relative to sample G, suggesting that penetration of oxy-gen to a depth of at least 55 cm may have resulted in thedissolution of calcite and the precipitation of small amountsof secondary carbonates, ankerite and siderite, not found inthe materials upon deposition (sample G).
Although there are few prior studies that report depth ofreaction front and oxidation in mine tailings, the IKMHSStailings present a depth that is among the shallowest, partic-ularly given the relatively long duration (>50 years) ofweathering. The best comparisons are perhaps porphyryCu tailings piles in Chile (although those tailings had lowertotal sulfide content at 1–6%) where oxidation was observedto a depth of 1.1–5 m depending on weathering time (20–40 years) and climate (alpine to hyper-arid; Dold andFontbote, 2001). Reports from more temperate climatesindicate a shallower penetration of O2 to a depth of 0.7 min sulfide-rich tailings in Rhineland-Palatinate, Germany(Schuwirth et al., 2007) and 0.2–1.2 m in sub-humid Taxcotailings, located in south-central Mexico (Romero et al.,2007). Shallower reaction front depths in some more humid
climates have been related to higher moisture content andsustained groundwater tables more proximal to the surfacein moist climates, since slower diffusion of O2 occurs inwater relative to air (Morth and Smith, 1996). Conversely,the shallow gossan front observed in the present study canbe attributed to low water leaching that confines the weath-ering zone to the near surface, where it is potentially suscep-tible to erosive removal during extreme climatic events.
6. CONCLUSIONS
Whereas the production of acid mine drainage duringwater-tailings interaction is well documented, the mineral-ogical and geochemical trends recorded in the residualsolid-phase weathering profile is less well known, particu-larly for arid systems. In this work, sulfide-ore derived tail-ings were collected across a weathering profile 50 yearsfollowing deposition to assess how mineral transformationis coupled to major element (iron and sulfur) speciationchange during oxidative weathering under semi-arid cli-mate. Sharp gradients in mineral assemblage, iron and sul-fur speciation, and element lability/fractionation wereobserved to occur at shallow depths (<1 m). Despite reten-tion of both Fe and S in a system where potential evapo-transpiration significantly exceeds precipitation on anannual basis, five decades of exposure to surficial conditions(O2 and H2O) has resulted in extensive mineral weatheringin the top 0.5 m, including the near complete depletion ofsulfides in surficial layers and the formation of a coherenttrend in complex secondary mineral assemblage and pHas a function of depth. Spatially-resolved sampling andanalysis within the surface two meters indicates the reactiontrajectory pyrite, silicate minerals and carbonates! fer-rihydrite and gypsum! schwertmannite! jarosite-groupminerals. Low water through-flux limits translocation ofsulfate through the tailings profile and contributes to thepersistence of metastable ferrihydrite and schwertmannite.The resulting shallow reaction front creates a gossan zonein the top 30 cm that is subject to potential off-site transportby wind and water erosion, which has important implica-tions for contaminant dispersion, the subject of a compan-ion study.
ACKNOWLEDGEMENTS
This research was supported by the National Institute of Envi-ronmental Health Sciences Grant numbers 2 P42 ES04940-11 and 1R01ES017079-01. Portions of this research were carried out at theStanford Synchrotron Radiation Laboratory, a National UserFacility operated by Stanford University on behalf of the U.S.Department of Energy, Office of Basic Energy Sciences. The SSRLStructural Molecular Biology Program is supported by the Depart-ment of Energy, Office of Biological and Environmental Research,and by the National Institutes of Health, National Center forResearch Resources, Biomedical Technology Program. We aregrateful to Mary Kay Amistadi, Scott White, Corin Hammond,Xiaodong Gao, Peggy O’Day, Dorie Beals, and Robert Downsfor assistance with sample analyses. The comments of AE Jan Wie-derhold and three anonymous reviewers greatly helped to improvethe earlier version of the manuscript.

S.M. Hayes et al. / Geochimica et Cosmochimica Acta 141 (2014) 240–257 255
APPENDIX A. SUPPLEMENTARY DATA
Supplementary data associated with this article can befound, in the online version, at http://dx.doi.org/10.1016/j.gca.2014.05.030.
REFERENCES
Abrahams P. W. (2012) Involuntary soil ingestion and geophagia: asource and sink of mineral nutrients and potentially harmfulelements to consumers of earth materials. Appl. Geochem. 27,954–968.
Bajt S., Sutton S. R. and Delaney J. S. (1994) X-ray microprobeanalysis of iron oxidation states in silicates and oxides using X-ray absorption near edge structure (XANES). Geochim. Cos-
mochim. Acta 58, 5209–5214.Bigham J. M. and Nordstrom D. K. (2000) Iron and aluminum
hydroxysulfates from acid sulfate waters. Rev. Mineral. Geo-
chem. 40, 351–403.Bigham J. M., Schwertmann U., Carlson L. and Murad E. (1990)
A poorly crystallized oxyhydroxysulfate of iron formed bybacterial oxidation of Fe(ii) in acid-mine waters. Geochim.
Cosmochim. Acta 54, 2743–2758.Bigham J. M., Schwertmann U., Traina S. J., Winland R. L. and
Wolf M. (1996) Schwertmannite and the chemical modeling ofiron in acid sulfate waters. Geochim. Cosmochim. Acta 60,2111–2121.
Blowes D. W. and Jambor J. L. (1990) The pore-water geochem-istry and the mineralogy of the vadose zone of sulfide tailings,Waite Amulet, Quebec, Canada. Appl. Geochem. 5, 327–346.
Blowes D. W., Ptacek C. J., Jambor J. L. and Weisener C. G.(2003) The geochemistry of acid mine drainage. In Treatise on
Geochemistry, vol. 9.05 (eds. D. H. Heinrich and K. T. Karl).Pergamon, Oxford, pp. 149–204.
Bostick B. C., Theissen K. M., Dunbar R. B. and VairavamurthyM. A. (2005) Record of redox status in laminated sedimentsfrom Lake Titicaca: a sulfur K-edge X-ray absorption near edgestructure (XANES) study. Chem. Geol. 219, 163–174.
Brimhall G. H. and Dietrich W. E. (1987) Constitutive massbalance relations between chemical composition, volume,density, porosity, and strain in metasomatic hydrochemicalsystems: results on weathering and pedogenesis. Geochim.
Cosmochim. Acta 51, 567–587.Cai Y., Pan Y., Xue J., Sun Q., Su G. and Li X. (2009)
Comparative XPS study between experimentally and naturallyweathered pyrites. Appl. Surf. Sci. 255, 8750–8760.
Caraballo M. A., Rotting T. S., Nieto J. M. and Ayora C. (2009)Sequential extraction and DXRD applicability to poorlycrystalline Fe- and Al-phase characterization from an acidmine water passive remediation system. Am. Mineral. 94, 1029–1038.
Combes J. M., Manceau A., Calas G. and Bottero J. Y. (1989)Formation of ferric oxides from aqueous-solutions – a polyhe-dral approach by X-ray absroption spectroscopy. 1. Hydrolysisand formation of ferric gels. Geochim. Cosmochim. Acta 53,583–594.
Courtin-Nomade A., Grosbois C., Marcus M. A., Fakra S. C.,Beny J.-M. and Foster A. L. (2009) The weathering of a sulfideorebody: speciation and fate of some potential contaminants.Can. Mineral. 47, 493–508.
Couture R.-M., Gobeil C. and Tessier A. (2010) Arsenic, iron andsulfur co-diagenesis in lake sediments. Geochim. Cosmochim.
Acta 74, 1238–1255.Creasey S. C. (1952) Geology of the Iron King Mine, Yavapai
County, Arizona. Econ. Geol. 47, 24–56.
Cornell R. M. and Schwertmann U. (2003) The Iron Oxides. JohnWiley & Sons, Weinheim.
Csavina J., Field J., Taylor M. P., Gao S., Landazuri A., BettertonE. A. and Saez A. E. (2012) A review on the importance ofmetals and metalloids in atmospheric dust and aerosol frommining operations. Sci. Total Environ. 433, 58–73.
Delany J. M. and Lundeen S. R. (1990) The LLNL Thermochemical
Database. Report UCRL-21658. Lawrence Livermore NationalLaboratory.
Dill H. G., Pollmann H., Bosecker K., Hahn L. and Mwiya S.(2002) Supergene mineralization in mining residues of theMatchless cupreous pyrite deposit (Namibia) – a clue to theorigin of modern and fossil duricrusts in semiarid climates. J.
Geochem. Explor. 75, 43–70.Dill H. G., Weber B. and Botz R. (2012) Metalliferous duricrusts –
markers of weathering: a climatic and geomorphologicalapproach to the origin of Pb–Zn–Cu–Sb–P-bearing chemicalresidues. J. Geochem. Explor. 112, 123–195.
Dold B. (2003a) Dissolution kinetics of schwertmannite andferrihydrite in oxidized mine samples and their detection bydifferential X-ray diffraction (DXRD). Appl. Geochem. 18,1531–1540.
Dold B. (2003b) Speciation of the most soluble phases in asequential extraction procedure adapted for geochemical stud-ies of copper sulfide mine waste. J. Geochem. Explor. 80, 55–68.
Dold B. and Fontbote L. (2001) Element cycling and secondarymineralogy in porphyry copper tailings as a function of climate,primary mineralogy, and mineral processing. J. Geochem.
Explor. 74, 3–55.Dold B. and Fontbote L. (2002) A mineralogical and geochemical
study of element mobility in sulfide mine tailings of Fe oxideCu–Au deposits from the Punta del Cobre belt, northern Chile.Chem. Geol. 189, 135–163.
Downs R. T. and Hall-Wallace M. (2003) The American miner-alogist crystal structure database. Am. Mineral. 88, 247–250.
Fittschen U. E. A., Meirer F., Streli C., Wobrauschek P., Thiele J.,Falkenberg G. and Pepponi G. (2008) Characterization ofatmospheric aerosols using Synchroton radiation total reflec-tion X-ray fluorescence and Fe K-edge total reflection X-rayfluorescence-X-ray absorption near-edge structure. Spectro-
chim. Acta B 63, 1489–1495.Fleet M. E. (2005) XANES spectroscopy of sulfur in earth
materials. Can. Mineral. 43, 1811–1838.George G. N. and Pickering I. J. (2000) EXAFSPAK: A Suite of
Computer Programs for Analysis of X-ray Absorption Spectra.Stanford Synchrotron Radiation Laboratory.
Hayes S. M., White S. A., Thompson T. L., Maier R. M. andChorover J. (2009) Changes in lead and zinc lability duringweathering-induced acidification of desert mine tailings: cou-pling chemical and micro-scale analyses. Appl. Geochem. 24,2234–2245.
Hayes S. M., Webb S. M., Bargar J. R., O’Day P. A., Maier R. M.and Chorover J. (2012) Geochemical weathering increases leadbioaccessibility in semi-arid mine tailings. Environ. Sci. Technol.
46, 5834–5841.Hudson-Edwards K. A., Macklin M. G., Curtis C. D. and
Vaughan D. J. (1996) Processes of formation and distributionof Pb-, Zn-, Cd-, and Cu-bearing minerals in the Tyne Basin,northeast England: implications for metal-contaminated riversystems. Environ. Sci. Technol. 30, 72–80.
Hudson-Edwards K. A., Schell C. and Macklin M. G. (1999)Mineralogy and geochemistry of alluvium contaminated bymetal mining in the Rio Tinto area, southwest Spain. Appl.
Geochem. 14, 1015–1030.Hudson-Edwards K. A., Jamieson H. E. and Lottermoser B. G.
(2011) Mine wastes: past, present, future. Elements 7, 375–379.

256 S.M. Hayes et al. / Geochimica et Cosmochimica Acta 141 (2014) 240–257
ICDD (2005) JCPDS Powder Diffraction File 2 Database. Interna-tional Centre for Diffraction Data, Newton Square, PA, USA.
Jackson M. L., Lim C. H. and Zelazny L. W. (1986) Oxides,hydroxides, and aluminosilicates. In Methods of Soil Analysis,
Part 1 Physical and Mineralogical Methods (ed. A. Klute).Amer. Soc. Agron. Inc.
Jambor J. L., Nordstrom D. K., Alpers C. N., Alpers C. N.,Jambor J. L. and Nordstrom D. K. (2000) Metal sulfate saltsfrom sulfide mineral oxidation. In Sulfate Minerals-Crystallog-
raphy, Geochemistry, and Environmental Significance (ed. P. H.Ribbe). Mineralogical Society of America, Washington, DC,USA, pp. 303–350.
Jamieson H. E. (2011) Mine wastes: geochemistry and mineralogyof solid mine waste: essential knowledge for predicting envi-ronmental impact. Elements 7, 381–386.
Jamieson H. E., Robinson C., Alpers C. N., Nordstrom D. K.,Poustovetov A. and Lowers H. A. (2005) The composition ofcoexisting jarosite-group minerals and water from the Rich-mond Mine, Iron Mountain, California. Can. Mineral. 43,1225–1242.
Karlsson T., Persson P., Skyllberg U., Morth C. M. and Giesler R.(2008) Characterization of iron(III) in organic soils usingextended X-ray absorption fine structure spectroscopy. Environ.
Sci. Technol. 42, 5449–5454.Keon N. E., Swartz C. H., Brabander D. J., Harvey C. and
Hemond H. F. (2001) Validation of an Arsenic SequentialExtraction Method for Evaluating Mobility in Sediments.Environ. Sci. Technol. 35, 2778–2784.
Kheboian C. and Bauer C. F. (1987) Accuracy of selectiveextraction procedures for metal speciation in model aquaticsediments. Anal. Chem. 59, 1417–1423.
La Force M. J. and Fendorf S. (2000) Solid-phase iron character-ization during common selective sequential extractions. Soil
Sci. Soc. Am. J. 64, 1608–1615.Lande J., Webb S. M. and Mehta A. (2007) Area Diffraction
Machine. <http://home.comcast.net/~sam_webb/adm.html>.Lottermoser B. G. (2010) Mine Wastes: Characterization, Treat-
ment and Environmental Impacts. Springer-Verlag, Berlin.Lottermoser B. G. (2011) Recycling, reuse and rehabilitation of
mine wastes. Elements 7, 405–410.Majzlan J. (2010) Advances and gaps in the knowledge of
thermodynamics and crystallography of acid mine drainagesulfate minerals. Chimia 64, 699–704.
Majzlan J. and Myneni S. C. B. (2005) Speciation of iron andsulfate in acid waters: aqueous clusters to mineral precipitates.Environ. Sci. Technol. 39, 188–194.
Majzlan J., Navrotsky A. and Schwertmann U. (2004) Thermody-namics of iron oxides. Part III. Enthalpies of formation andstability of ferrihydrite (Fe(OH)3), schwertmannite (FeO(OH)3/4
(SO4)1/8), and Fe2O3. Geochim. Cosmochim. Acta 68, 1049–1059.
Manceau A. and Gates W. P. (1997) Surface structural model forferrihydrite. Clays Clay Miner. 45, 448–460.
Marcus M. A., Westphal A. J. and Fakra S. C. (2008) Classifica-tion of Fe-bearing species from K-edge XANES data usingtwo-parameter correlation plots. J. Synchrotron Radiat. 15,463–468.
McLean E. O. (1982) Soil pH and lime requirement. In Methods of
Soil Analysis. Part 2. Chemical and Microbiological Properties
(eds. A. L. Page, R. H. Miller and D. R. Keeney). ASA andSSSA, Madison, WI.
Merkel D. (1996) Cadmium, copper, nickel, lead and zinc contentsof wheat grain and soils extracted with CaCl2/DTPA (CAD),CaCl2 and NH4NO3. Agrobiol. Res. 49, 30–37.
Mitsunobu S., Sakai Y. and Takahashi Y. (2008) Characterizationof Fe(III) (hydr)oxides in arsenic contaminated soil under
various redox conditions by XAFS and Mossbauer spectros-copies. Appl. Geochem. 23, 3236–3243.
Morra M. J., Fendorf S. E. and Brown P. D. (1997) Speciation ofsulfur in humic and fulvic acids using X-ray absorption near-edge structure (XANES) spectroscopy. Geochim. Cosmochim.
Acta 61, 683–688.Morth A. H. and Smith E. E. (1996) Kinetics of the sulfide-to-
sulfate reaction. Am. Chem. Soc. Div. Fuel Chem. 10, 83–92.Murad E. and Rojik P. (2005) Iron mineralogy of mine-drainage
precipitates as environmental indicators: review of currentconcepts and a case study from the Sokolov Basin, CzechRepublic. Clay Miner. 40, 427–440.
Myneni S. C. B. (2000) X-ray and vibrational spectroscopy ofsulfate in earth materials. In Sulfate Minerals: Crystallography,
Geochemistry, and Environmental Significance (eds. C. N.Alpers, J. L. Jambor and D. K. Nordstrom). MineralogicalSociety of America, Washington, DC, pp. 113–172.
Myneni S. C. B. (2002) Soft X-ray spectroscopy and spectromi-croscopy studies of organic molecules in the environment. Rev.
Mineral. Geochem. 49, 485–558.Myrick D. F. (2001) Santa Fe to Phoenix. Railroads of Arizona.
Signature Press, Berkeley, California.Navarro A., Collado D., Carbonell M. and Sanchez J. A. (2004)
Impact of mining activities on soils in a semi-arid environment:Sierra Almagrera district, SE Spain. Environ. Geochem. Health.
26, 383–393.Neaman A., Mouele F., Trolard F. and Bourrie G. (2004)
Improved methods for selective dissolution of Mn oxides:applications for studying trace element associations. Appl.
Geochem. 19, 973–979.Neuhausler U., Feng H. and Jones K. W. (2003) Characterization
of sulfur in New York New Jersey waterway sediment. J. Phys.
IV 104, 439–442.Nordstrom D. K. and Alpers C. N. (1999) Geochemistry of acid
mine waters. In Reviews in Economic Geology (eds. G. S.Plumlee and M. J. Logsdon). The Environmental Geochemistryof Mineral Deposits. Part A. Processes, Methods and HealthIssues. Soc. Econ. Geol., Littleton, CO, pp. 133–160.
O’Day P. A., Rivera N., Root R. and Carroll S. A. (2004) X-rayabsorption spectroscopic study of Fe reference compounds forthe analysis of natural sediments. Am. Mineral. 89, 572–585.
Perdrial N., Rivera N., Thompson A., O’Day P. A. and ChoroverJ. (2011) Trace contaminant concentration affects mineraltransformation and pollutant fate in hydroxide-weatheredHanford sediments. J. Hazard. Mater. 197, 119–127.
Pickering W. F. (1981) Selective chemical extractions of soilcomponents and bound metal species. Crit. Rev. Anal. Chem.
12, 233–266.Pickering I. J. (2001) Edge Fitting Analysis using EXAFSPAK: A
Tutorial. Stanford Synchrotron Radiation Laboratory.Prietzel J., Thieme J., Neuhausler U., Susini J. and Kogel-Knabner
I. (2003) Speciation of sulphur in soils and soil particles by X-ray spectromicroscopy. Eur. J. Soil Sci. 54, 423–433.
Prietzel J., Thieme J., Tyufekchieva N., Paterson D., Mcnulty I.and Kogel-Knabner I. (2009) Sulfur speciation in well-aeratedand wetland soils in a forested catchment assessed by sulfur K-edge X-ray absorption near-edge spectroscopy (XANES). J.
Plant Nutr. Soil Sci. 172, 393–403.Ramirez-Andreotta M. D., Brusseau M. L., Beamer P. and Maier
R. M. (2013a) Home gardening near a mining site in an arsenic-endemic region of Arizona: assessing arsenic exposure dose andrisk via ingestion of home garden vegetables, soils, and water.Sci. Total Environ. 454–455, 373–382.
Ramirez-Andreotta M. D., Brusseau M. L., Artiola J. F. andMaier R. M. (2013b) A greenhouse and field-based study todetermine the accumulation of arsenic in common homegrown

S.M. Hayes et al. / Geochimica et Cosmochimica Acta 141 (2014) 240–257 257
vegetables grown in mining-affected soils. Sci. Total Environ.
443, 299–306.Rayle C. E. Solliday S. and Vargas V. D. (2008) A cultural resource
and historic building survey for a remedial investigation/feasibility study at the Iron King Mine-Humboldt SmelterSuperfund site, Dewey-Humboldt, Yavapai County, Arizona.EP-W-06-004: Environmental Protection Agency. <http://yosemite.epa.gov/r9/sfund/r9sfdocw.nsf/688299b284b16e92882574260073faef/a5c1e8e6b65cce26882576fd0075b8ac!OpenDocument>.
Regenspurg S. and Peiffer S. (2005) Arsenate and chromateincorporation in schwertmannite. Appl. Geochem. 20, 1226–1239.
Romero F. M., Armienta M. A. and Gonzalez-Hernandez G.(2007) Solid-phase control on the mobility of potentially toxicelements in an abandoned lead/zinc mine tailings impound-ment, Taxco, Mexico. Appl. Geochem. 22, 109–127.
Root R. A., Dixit S., Campbell K. M., Jew A. D., Hering J. G. andO’Day P. A. (2007) Arsenic sequestration by sorption processesin high-iron sediments. Geochim. Cosmochim. Acta 71, 5782–5803.
Root R. A., Vlassopoulos D., Rivera N. A., Rafferty M. T.,Andrews C. and O’Day P. A. (2009) Speciation and naturalattenuation of arsenic and iron in a tidally influenced shallowaquifer. Geochim. Cosmochim. Acta 73, 5528–5553.
Ruttenburg K. C. (1992) Development of a sequential extractionmethod for different forms of phosphorus in marine sediments.Limnol. Oceanogr. 37, 1460–1482.
Schmid R., Wilke M., Oberhansli R., Janssens K., Falkenberg G.,Franz L. and Gaab A. (2003) Micro-XANES determination offerric iron and its application in thermobarometry. Lithos 70,381–392.
Schuwirth N., Voegelin A., Kretzschmar R. and Hofmann T.(2007) Vertical distribution and speciation of trace metals inweathering flotation residues of a zinc/lead sulfide mine. J.
Environ. Qual. 36, 61–69.Schwertmann U. and Cornell R. M. (2000) Iron Oxides in the
Laboratory: Preparation and Characterization. Wiley-VCH,Weinheim, NY.
Solis-Dominguez F. A., White S. A., Hutter T. B., Amistadi M. K.,Root R. A., Chorover J. and Maier R. M. (2012) Response ofkey soil parameters during compost-assisted phytostabilizationin extremely acidic tailings: effect of plant species. Environ. Sci.
Technol. 46, 1019–1027.Takahashi Y., Kanai Y., Kamioka H., Ohta A., Maruyama H.,
Song Z. and Shimizu H. (2006) Speciation of sulfate in size-
fractionated aerosol particles using sulfur K-edge X-rayabsorption near-edge structure. Environ. Sci. Technol. 40,5052–5057.
Tessier A., Campbell P. G. C. and Bisson M. (1979) Sequentialextraction procedure for the speciation of particulate tracemetals. Anal. Chem. 51, 844–851.
Waychunas G., Apted M. and Brown, Jr., G. (1983) X-ray K-edgeabsorption spectra of Fe minerals and model compounds: near-edge structure. Phys. Chem. Miner. 10, 1–9.
Webb S. M. (2005) Sixpack: a graphical user interface for XASanalysis using IFEFFIT. Phys. Scr. T115, 1011–1014.
Wetherall K. M., Moss R. M., Jones A. M., Smith A. D., SkinnerT., Pickup D. M., Goatham S. W., Chadwick A. V. andNewport R. J. (2008) Sulfur and iron speciation in recentlyrecovered timbers of the Mary Rose revealed via X-rayabsorption spectroscopy. J. Archaeol. Sci. 35, 1317–1328.
Wilke M., Partzsch G. M., Bernhardt R. and Lattard D. (2005)Determination of the iron oxidation state in basaltic glassesusing XANES at the K-edge. Chem. Geol. 220, 143–161.
Wilkinson B. H. and McElroy B. J. (2007) The impact of humanson continental erosion and sedimentation. Geol. Soc. Am. Bull.
119, 140–156.Williams J. D., Syers J. K. and Walker T. W. (1967) Fractionation
of soil inorganic phosphate by a modification of Chang andJackson’s procedure. Soil Sci. Soc. Am. J. 31, 736–739.
Williams D. J., Bigham J. M., Cravotta C. A., Traina S. J.,Anderson J. E. and Lyon J. G. (2002) Assessing mine drainagepH from the color and spectral reflectance of chemicalprecipitates. Appl. Geochem. 17, 1273–1286.
Winland R. L., Traina S. J. and Bigham J. M. (1991) Chemicalcomposition of ochreous precipitates from Ohio coal minedrainage. J. Environ. Qual. 20, 452–460.
Wray D. S. (1998) The impact of unconfined mine tailings andanthropogenic pollution on a semi-arid environment – an initialstudy of the Rodalquilar mining district, south east Spain.Environ. Geochem. Health 20, 29–38.
Zaw M., Szymczak R. and Twining J. (2002) Application ofsynchrotron radiation technique to analysis of environmentalsamples. Nucl. Instrum. Methods B 190, 856–859.
Zhao J. M., Huggins F. E., Feng Z. and Huffman G. P. (1994)Ferrihydrite – surface-structure and its effects on phase trans-formation. Clays Clay Miner. 42, 737–746.
Associate editor: Jan G. Wiederhold