Embed Size (px)
Citation preview

HAL Id: tel-01752266https://hal.univ-lorraine.fr/tel-01752266
Submitted on 29 Mar 2018
HAL is a multi-disciplinary open accessarchive for the deposit and dissemination of sci-entific research documents, whether they are pub-lished or not. The documents may come fromteaching and research institutions in France orabroad, or from public or private research centers.
L’archive ouverte pluridisciplinaire HAL, estdestinée au dépôt et à la diffusion de documentsscientifiques de niveau recherche, publiés ou non,émanant des établissements d’enseignement et derecherche français ou étrangers, des laboratoirespublics ou privés.
Sustainability assessment of biodiesel production inColombia
Sandra Cecilia Bautista Rodríguez
To cite this version:Sandra Cecilia Bautista Rodríguez. Sustainability assessment of biodiesel production in Colombia.Other. Université de Lorraine, 2015. English. �NNT : 2015LORR0307�. �tel-01752266�

AVERTISSEMENT
Ce document est le fruit d'un long travail approuvé par le jury de soutenance et mis à disposition de l'ensemble de la communauté universitaire élargie. Il est soumis à la propriété intellectuelle de l'auteur. Ceci implique une obligation de citation et de référencement lors de l’utilisation de ce document. D'autre part, toute contrefaçon, plagiat, reproduction illicite encourt une poursuite pénale. Contact : [email protected]
LIENS Code de la Propriété Intellectuelle. articles L 122. 4 Code de la Propriété Intellectuelle. articles L 335.2- L 335.10 http://www.cfcopies.com/V2/leg/leg_droi.php http://www.culture.gouv.fr/culture/infos-pratiques/droits/protection.htm

SUSTAINABILITY ASSESMENT OF BIODIESEL PRODUCTION
IN COLOMBIA
Sandra Cecilia Bautista Rodríguez
Universidad Nacional de Colombia
School of Engineering, Chemical and Environmental Engineering Department
Bogotá, D.C., Colombia
2015

SUSTAINABILITY ASSESMENT OF BIODIESEL
PRODUCTION IN COLOMBIA
Sandra Cecilia Bautista Rodríguez
Presented as a partial requirement to qualify for the degree of:
PhD in Engineering – Chemical Engineering
Directors:
PhD. Paulo César Narváez Rincón
PhD. Mauricio Camargo Pardo
Codirector:
PhD. Laure Morel
Universidad Nacional de Colombia
School of Engineering, Chemical and Environmental Engineering Department
Bogotá, D.C., Colombia
2015

This work was developed under doctoral supervision agreement with the
Ecole doctorale Sciences et Ingénierie des Ressources, Procédés, Produits, Environnement
and Laboratoire Equipe de Recherche sur les Processus Innovatifs (ERPI)
Presented as a partial requirement to qualify for the title of:
Doctorat en Génie des Systèmes Industriels
Universidad Nacional de Colombia
School of Engineering, Chemical and Environmental Engineering Department
Bogotá, D.C., Colombia
2015

I dedicate this thesis to the love of my life and light of my heart, my beloved husband
Vladimir.

Acknowledgments
First and above all, I praise Almighty God who provided me hope, courage, patience and
wisdom to carry out this thesis. My sincere thanks to:
Professor Paulo César Narváez Rincón not only for allowing me to work in this
interesting project, but also for his guidance, patience and support throughout the course
of my PhD studies.
Professor Mauricio Camargo Pardo, for his leadership of the joint supervision
agreement under which this doctoral thesis was developed, and for his huge
collaboration during my stay in France.
Professor Laure Morel for gave me the opportunity to learn from her great scientific
experience and her huge collaboration during my stay in France.
To all the Equipe de Recherche sur les Processus Innovatifs (ERPI), especially to my
colleagues and friends Daniel Galvez, Manon Enjolras, Andrea Espinoza.
I would like to thank to the program ECOS NC13P01 (Evaluation-orientation of the
Cooperation Scientific and university with Hispanic America), COLCIENCIAS
RC09002012 (Administrative Department of Science, Technology and Innovation of
Colombia), and Universidad Central for their support in this research.To my husband
for his patience, his love and his constant companion.
To my parents from heaven gave me their support, my brothers and my family in general
for their continued support.
To my friends Yulia and Angela, who encouraged me.
To whom that in one way or another contributed to the successful conclusion of this
project.

Abstract VI
RESUME
Évaluation de la durabilité de la production de biodiesel est un sujet d'importance croissante en
raison de l'intérêt des gouvernements à effectuer des stratégies de souveraineté, diversifier leur
matrice énergétique et mis en place l'impact de la production de biocarburants. Dans ce
contexte, ce travail propose un modèle dynamique du système pour évaluer la production de
biodiesel dans un contexte spécifique, basé sur une structure hiérarchique générale d'évaluation
de la durabilité qui intègre les dimensions du développement durable avec les principes, critères
et indicateurs (PC & I). Le cadre de l'évaluation de la production de biodiesel a été défini
d'après une ample état de la technique, ce qui entraîne une sélection et analyse de 113
documents, y compris les lois, directives et autres documents normatifs, les documents de
politique, les certificats et documents publiés dans des revues. Pour définir le cadre final, une
stratégie de validation basée sur les consultations d'experts enquête et une analyse statistique
descriptive a été réalisée. Ainsi, un cadre composé de cinq dimensions (sociales, économiques,
environnementale, politiques et technologiques), 13 principes et 31 critères a été proposé.
Par la suite, un modèle de dynamique de système (DS) a été développé et appliqué pour évaluer
la durabilité de la production du biodiesel en Colombie. Au départ, le modèle DS a été utilisé
pour simuler la production du biodiesel, compte tenu des conditions actuelles en Colombie, ce
qui permet de déterminer le niveau de référence (années 2008-2014). Par la suite, certains
indicateurs exogènes du scénario de référence ont été modifiés afin de générer une analyse de
sensibilité pour définir plusieurs conditions fondamentales vers la production de biodiesel
durable dans le contexte colombien. Une fois l'analyse de sensibilité a été réalisée, on a
déterminé les conditions qui favorisent ou découragent la production de biodiesel et, par
conséquent, des scénarios optimistes et pessimistes ont été proposées. Les résultats de l'analyse
des scénarios peuvent aider les institutions, les décideurs et les autres parte prenants associés à
établir les conditions à réaliser pour promouvoir une production durable du biodiesel.
Mots clés: Évaluation de la durabilité, Production du biodiesel, dynamique des systèmes

Abstract VII
ABSTRACT
Sustainability assessment of biodiesel production is a topic of increasing importance due to the
interest of governments to stablish sovereignty strategies, diversify their energy matrix and set
up the impact of biofuels production. In this context, this work proposes a system dynamic
model to assess biodiesel production in a specific context, based on a general hierarchical
structure of sustainability assessment that integrates dimensions of sustainable development
with principles, criteria and indicators (PC&I). The assessment framework of biodiesel
production was defined based on a comprehensive state of the art, resulting in a selection and
analysis of 113 documents, including laws, directives and other normative documents, policy
documents, certificates and papers published in peer-reviewed journals. To define the final
framework, a validation strategy based on expert survey consultations and a descriptive
statistical analysis was conducted. As a result, a framework composed of five dimensions
(social, economic, environmental, political and technological), 13 principles and 31 criteria was
proposed.
Subsequently, a System Dynamics (SD) model was developed and applied for assess the
sustainability biodiesel production in Colombia. Initially, the SD model was used to simulate
the biodiesel production considering the current conditions in Colombia, enabling to determine
the baseline (years 2008 to 2014). Subsequently, some exogenous indicators of the baseline
scenario were modified in order to generate a sensibility analysis to define several fundamental
conditions for the sustainable biodiesel production in the Colombian context. Once the
sensibility analysis was conducted, the conditions that promote or discourage biodiesel
production were determined and, consequently, optimistic and pessimistic scenarios were
proposed. The results of the analysis of the scenarios can help institutions, decision-makers and
other agents related to establish the conditions to be carried out to promote a sustainable
biodiesel production.
Keywords: Sustainability assessment, biodiesel production, system dynamics

TABLE OF CONTENTS Acknowledgments ...................................................................................................................... 5
RESUME .................................................................................................................................. VI
ABSTRACT ............................................................................................................................ VII
INTRODUCTION ................................................................................................................... VII
1. Chapter 1: Biodiesel-TBL+: A new hierarchical sustainability assessment framework of
PC&I for biodiesel production ................................................................................................. 27
Introduction .......................................................................................................................... 27
1.1 Insight from previous literature ................................................................................. 27
1.2 Methods ..................................................................................................................... 29
1.2.1 Search strategy of documents ............................................................................. 29
1.2.2 Descriptive document analysis and selection ..................................................... 31
1.3 Results from the literature review ............................................................................. 31
1.3.1 Descriptive analysis ............................................................................................ 31
1.3.2 Information Classification .................................................................................. 34
1.3.3 Sustainability assessment dimensions ................................................................ 37
1.3.4 Frameworks previously used for sustainability assessment of biofuels ............. 39
1.4 The Triple Bottom Line Extended (Biodiesel-TBL+), a new framework for biodiesel
sustainability assessment ...................................................................................................... 41
1.5 Application of the new assessment framework to biodiesel production ................... 43
1.6 Discussions ................................................................................................................ 46
Conclusions .......................................................................................................................... 49
2. Chapter 2: Principles and criteria validation for framework sustainability assessment of
biodiesel production ................................................................................................................. 51

Table of contents IX
Introduction .......................................................................................................................... 51
2.1 Hierarchical assessment framework .......................................................................... 52
2.2 Validation method of sustainability assessment principles and criteria for biodiesel
production ............................................................................................................................. 53
2.2.1 Expert identification ........................................................................................... 53
2.2.2 Survey design ..................................................................................................... 55
2.2.3 Survey application .............................................................................................. 56
2.2.4 Descriptive statistics analysis ............................................................................. 56
2.2.5 Selection of sustainability assessment principles and criteria for biodiesel
production ......................................................................................................................... 58
2.2.6 Data visualization of principles and criteria selected ......................................... 59
2.3 Results ....................................................................................................................... 59
2.3.1 Expert profile description ................................................................................... 59
2.3.2 Principles statistics analysis ............................................................................... 60
2.3.3 Criteria statistical analysis .................................................................................. 63
2.4 Selection of sustainability assessment principles and criteria ................................... 71
2.5 Analysis of the principles and criteria recommended ............................................... 73
2.6 Data visualization technique of principles and criteria ............................................. 74
Conclusions .......................................................................................................................... 76
3. Chapter 3: Definition and design of a system dynamic model for sustainability
assessment of biodiesel production in Colombian context ...................................................... 79
Introduction .......................................................................................................................... 79
3.1 Background of Colombian biodiesel production ....................................................... 79
3.2 System dynamics application in biofuels analysis .................................................... 80

X Table of contents
3.3 Systems dynamics methodology ............................................................................... 82
3.3.1. Problem formulation .......................................................................................... 82
3.3.2. Dynamic hypothesis formulation ....................................................................... 83
3.3.3. Description of the model boundary .................................................................... 84
3.3.4. Description of the model structure and the equation definition ......................... 84
3.3.5. Testing and analysis ........................................................................................... 85
3.4 Application of SD methodology in the biodiesel sustainability assessment ............. 86
3.4.1 Problem formulation .......................................................................................... 86
3.4.2 Dynamic hypothesis formulation in the biodiesel sustainability assessment –
Causal loop cycles ............................................................................................................ 87
3.4.3 Description of the model boundary .................................................................... 97
3.4.4 Description of the model structure and equations ............................................ 101
Biodiesel production sub-model .............................................................................. 102
Land and social sub-model ...................................................................................... 105
Net energy ratio sub-model ..................................................................................... 109
Water demanded sub-model .................................................................................... 112
Greenhouse gas emissions saving in life cycle of biodiesel sub-model .................. 113
Pollutant emission that affect air quality as a consequence of the use of biodiesel -
diesel blends as biofuel sub-model ................................................................................. 116
3.4.5 Testing and analysis ......................................................................................... 117
Conclusions ........................................................................................................................ 119
4 Chapter 4: System dynamic model of sustainability assessment of biodiesel production in
Colombian context - Results .................................................................................................. 121

Table of contents XI
Introduction ........................................................................................................................ 121
4.1 Baseline ................................................................................................................... 121
4.1.1 Economic dimension ........................................................................................ 122
4.1.2 Social dimension .............................................................................................. 124
4.1.3 Environmental dimension ................................................................................ 125
4.1.4 Political dimension ........................................................................................... 130
4.1.5 Technological dimension ................................................................................. 131
4.2 Sensitivity analysis .................................................................................................. 133
4.2.1 Oil price ............................................................................................................ 133
4.2.2 Diesel powered vehicles ................................................................................... 135
4.2.3 Factor of direct contracted employees in oil palm cultivation – FDCEPC ...... 136
4.2.4 Costs linked to biodiesel policy ....................................................................... 137
4.2.5 Factor of agrochemicals applied in land for palm cultivation – FAALPC ...... 139
4.2.6 Biodiesel-diesel blend (Mix ratio) .................................................................... 140
4.2.7 Technological efficiency factor of first generation biodiesel (palm-oil consumed
per biodiesel produced) .................................................................................................. 141
4.2.8 Factor of land use change of rain forest to oil palm cultivation - FLUCFP ..... 143
4.2.9 Sensitivity analysis summarized ...................................................................... 144
4.3 Scenario analysis ..................................................................................................... 144
4.3.1 Optimistic scenario ........................................................................................... 145
4.3.2. Pessimistic scenario .............................................................................................. 153
4.4 Scenario analysis discussion ......................................................................................... 161
4.4.1 Economic dimension ............................................................................................. 162

XII Table of contents
4.4.2 Social dimension ................................................................................................... 162
4.4.3 Environmental dimension ..................................................................................... 162
4.4.4 Political dimension ................................................................................................ 162
4.4.5 Technological dimension ...................................................................................... 163
Conclusions ........................................................................................................................ 163
5 Chapter 5: Conclusions and recommendations .............................................................. 165
5.1 Conclusions ............................................................................................................. 165
5.2 Limitations ............................................................................................................... 166
5.3 Recommendations ................................................................................................... 167
6 References ...................................................................................................................... 171
Appendix ........................................................................................................................ 183
Appendix 1. Document linked to principles, criteria and indicator. ...................................... 183
Appendix 2. Constant of equations model ............................................................................. 191
Appendix 3. Model indicator: statistics issues ....................................................................... 195
Appendix 4. Online survey ..................................................................................................... 215
Appendix 5 Technological description of Propanediol production (PDO) ............................ 221

Table of contents XIII
LIST OF TABLES
Table 1-1. Previous literature ................................................................................................... 28
Table 1-2 Classification of selected documents ....................................................................... 34
Table 1-3. Definitions of principles, criteria and indicators .................................................... 41
Table 2-1. Importance grading scale of principles and criteria ................................................ 55
Table 2-2. Grading averages of principles’ importance ........................................................... 61
Table 2-3. Average grading criteria for attribute ..................................................................... 63
Table 2-4. Correlation matrix between criteria attributes ........................................................ 65
Table 2-5. Characteristics of criteria groups ............................................................................ 68
Table 2-6. Sustainability assessment criteria recommended .................................................... 72
Table 3-1 Endogenous indicators ............................................................................................. 97
Table 3-2 Exogenous indicators ............................................................................................... 98
Table 3-3 Stock and flow equations by biodiesel production sub-model .............................. 102
Table 3-4 Output indicator from biodiesel production sub-model ......................................... 105
Table 3-5 Stock and flow equations by land and social sub-model ....................................... 106
Table 3-6 Input indicator used in land and social sub-model ................................................ 109
Table 3-7 Output indicator from land and social sub-model.................................................. 109
Table 3-8 Stock and flow equations by net energy ratio sub-model ...................................... 111
Table 3-9 Inputs indicators used in net energy ratio sub-model ............................................ 111
Table 3-10 Stock and flow equations by water demand sub-model....................................... 112
Table 3-11 Inputs indicators used in water sub-model........................................................... 113
Table 3-12 Stock and flow equations by GHG emissions saving in life cycle of biodiesel sub-model ...................................................................................................................................... 113
Table 3-13 Inputs indicators used in GHG emission saving in life cycle of biodiesel sub-model ................................................................................................................................................ 116
Table 3-14 Stock and flow equations by pollutant emission sub-model ................................ 116
Table 3-15 Inputs indicators used in pollutant emission that affect air quality: biodiesel blended by diesel sub-model ................................................................................................................ 117

XIV Table of contents
Table 3-16 Dynamic model validation using MAPE ............................................................. 118
Table 4-1 Input and output indicators in sensitive analyse .................................................... 133
Table 4-2 Summary of sensitivity analysis (sensitivity kind: no sensitive, law increment, high increment, law diminish, high diminish) ................................................................................ 144
Table 4-3 Optimistic scenario conditions ............................................................................... 145
Table 4-4 Pessimistic scenario conditions ............................................................................. 154

Table of contents XV
LIST OF FIGURES
Figure 1-1. Document temporal distribution ............................................................................ 32
Figure 1-2. Distribution of document in the information sources ............................................ 33
Figure 1-3. Documents by subject area .................................................................................... 33
Figure 1-4. Geographical distribution of documents ............................................................... 34
Figure 1-5. Percentages of document by classification group of documents. .......................... 36
Figure 1-6. Number of papers cited specifically by criterion................................................... 37
Figure 1-7. General frameworks employed to perform the sustainability assessment of biodiesel .................................................................................................................................................. 40
Figure 1-8. Biodiesel sustainability framework (Bautista et al. 2016). .................................... 43
Figure 1-9. Social dimension: principles and criteria.............................................................. 44
Figure 1-10. Political dimension: principles and criteria ........................................................ 44
Figure 1-11. Economic dimension: principles and criteria ..................................................... 45
Figure 1-12. Technological dimension: principles and criteria ............................................... 45
Figure 1-13. Environmental dimension: principles and criteria .............................................. 46
Figure 1-14. Number of principles and criteria by sustainable development dimensions TBL+ .................................................................................................................................................. 47
Figure 2-1. Validation Method of Sustainability Assessment Principles and Criteria for Biodiesel Production ................................................................................................................ 54
Figure 2-2. Algorithm of descriptive statistics analysis ........................................................... 57
Figure 2-3. Number of experts by geographic region .............................................................. 59
Figure 2-4. Percentage of experts by type of organization....................................................... 60
Figure 2-5. Proportion of the experts by expertise area ........................................................... 60
Figure 2-6. Principles importance, average and variation coefficient (Cv) ............................. 62
Figure 2-7. PCA loading plots concerning the type of organization ........................................ 62
Figure 2-8. Criteria importance, average and variation coefficient (Cv). ................................ 64
Figure 2-9. C:Scatter plot and box plot of correlation between criteria attributes (reliability and ease of measurement) ............................................................................................................... 66
Figure 2-10. PCA loading plot concerning the geographical sector of the experts.................. 66

XVI Table of contents
Figure 2-11. PCA loading plot concerning the experts’ fields of expertise ............................. 67
Figure 2-12. PCA loading plot concerning the type of organization ...................................... 68
Figure 2-13. Dendogram of the HAC concerning the criteria ................................................. 68
Figure 2-14. Point cloud of the social dimension ..................................................................... 69
Figure 2-15. Point cloud of the political dimension ................................................................. 70
Figure 2-16. Point cloud of the economical dimension ........................................................... 70
Figure 2-17. Point cloud of the technological dimension ........................................................ 71
Figure 2-18. Point cloud of the environmental dimension ....................................................... 71
Figure 2-19. Principles and criteria framework visualization .................................................. 76
Figure 3-1 System Dynamics methodology, based on (Lee et al. 2012b) and (Bérard 2010) . 82
Figure 3-2 Causal loop diagrams of the economic dimension ................................................. 88
Figure 3-3 Causal loop diagrams of the social dimension ....................................................... 90
Figure 3-4 Social, environmental and economic indicators. Based on DANE (2013), Fedebiocombustibles (2015) and MA (2013). ......................................................................... 91
Figure 3-5 Causal loop diagrams of the environmental dimension ......................................... 92
Figure 3-6. Causal loop diagrams of the technological dimension .......................................... 94
Figure 3-7 Causal loop diagrams of the political dimension ................................................... 95
Figure 3-8 Causal loop diagram integrated .............................................................................. 96
Figure 3-9. Biodiesel production sub-model .......................................................................... 104
Figure 3-10 Graphical function of cost linked to biodiesel politic in current situation ......... 105
Figure 3-11 Others Biodiesel Production Costs Independent of Biodiesel Production ......... 105
Figure 3-12 Graphical function of international production of biodiesel of second and third generation ............................................................................................................................... 105
Figure 3-13 Land and social sub-model ................................................................................. 108
Figure 3-14 Graphical function of oil price based on EIA (2015) ......................................... 108
Figure 3-15 Net energy ratio sub-model ................................................................................ 110
Figure 3-16 Water sub-model ................................................................................................ 113
Figure 3-17 GHG emissions saving in life cycle of biodiesel sub-model .............................. 115

Table of contents XVII
Figure 3-18 Pollutant emission that affect air quality: Biodiesel blended by diesel sub-model ................................................................................................................................................ 117
Figure 4-1 Graphical output of economic indicators of model in baseline ............................ 123
Figure 4-2 Graphical output of economic indicators of model in baseline ............................ 123
Figure 4-3 Graphical output of economic indicators of model in baseline ............................ 123
Figure 4-4 Graphical output of social indicators of model in baseline .................................. 124
Figure 4-5 Graphical output of social indicators of model in baseline .................................. 125
Figure 4-6 Graphical output of environmental indicators of model in baseline .................... 126
Figure 4-7 Graphical output of environmental indicators of model in baseline scenario ...... 126
Figure 4-8 Graphical output of environmental indicators of model in baseline scenario ...... 127
Figure 4-9 Graphical output of environmental indicators of model in baseline scenario ...... 127
Figure 4-10 Graphical output of environmental indicators in baseline scenario ................... 128
Figure 4-11 Graphical output of environmental indicators of model in baseline scenario .... 128
Figure 4-12 Graphical output of environmental indicators of model in baseline scenario .... 129
Figure 4-13 Graphical output of environmental indicators of model in baseline .................. 129
Figure 4-14 Graphical output of environmental indicators of model in baseline .................. 130
Figure 4-15 Graphical output of environmental indicators of model in baseline .................. 130
Figure 4-16 Graphical output of politics indicators of model in baseline .............................. 131
Figure 4-17 Graphical output of technological indicators of model in baseline .................... 132
Figure 4-18 Graphical output of technological indicators of model in baseline scenario ...... 132
Figure 4-19 Sensitivity analyse of Oil price on the output indicators .................................... 134
Figure 4-20 Sensitivity analyse of diesel vehicles on the output indicators .......................... 136
Figure 4-21 Sensitivity analyse of FDCEPC on the output indicators ................................... 137
Figure 4-22 Sensitivity analyse of cost linked to biodiesel politics on the output indicators 138
Figure 4-23 Sensitivity analyse of factor agrochemical applied in oil palm cultivation on the output indicators ..................................................................................................................... 140
Figure 4-24 Sensitivity analyse of mix ratio biodiesel -diesel on the output indicators ........ 141
Figure 4-25 Sensitivity analyse of efficiency factor technological on the output indicators . 143

XVIII Table of contents
Figure 4-26 Sensitivity analyse of factor of land use change of forest lands to oil palm cultivation on the output indicators ........................................................................................ 144
Figure 4-27 Graphical output of economic indicators of model in optimistic scenario ......... 146
Figure 4-28 Graphical output of economic indicators of model in optimistic scenario ......... 147
Figure 4-29 Graphical output of economic indicators of model in optimistic scenario ......... 147
Figure 4-30 Graphical output of social indicators of model in optimistic scenario ............... 148
Figure 4-31 Graphical output of social indicators of model in optimistic scenario ............... 148
Figure 4-32 Graphical output of environmental indicators of model in optimistic scenario . 149
Figure 4-33 Graphical output of environmental indicators of model in optimistic scenario . 149
Figure 4-34 Graphical output of environmental indicators of model in optimistic scenario . 149
Figure 4-35 Graphical output of environmental indicators of model in optimistic scenario . 150
Figure 4-36 Graphical output of environmental indicators of model in optimistic scenario . 150
Figure 4-37 Graphical output of environmental indicators of model in optimistic scenario . 151
Figure 4-38 Graphical output of environmental indicators of model in optimistic scenario . 151
Figure 4-39 Graphical output of environmental indicators of model in optimistic scenario . 151
Figure 4-40 Graphical output of environmental indicators of model in baseline scenario .... 152
Figure 4-41 Graphical output of politic indicators of model in optimistic scenario .............. 152
Figure 4-42 Graphical output of technological indicators of model in optimistic scenario ... 153
Figure 4-43 Graphical output of technological indicators of model in optimistic scenario ... 153
Figure 4-44 Graphical output of economic indicators of model in pessimistic scenario ....... 155
Figure 4-45 Graphical output of economic indicators of model in pessimistic scenario ....... 156
Figure 4-46 Graphical output of economic indicators of model in pessimistic scenario ....... 156
Figure 4-47 Graphical output of social indicators of model in pessimistic scenario ............. 157
Figure 4-48 Graphical output of social indicators of model in pessimistic scenario ............. 157
Figure 4-49 Graphical output of environmental indicators of model in pessimistic scenario 157
Figure 4-50 Graphical output of environmental indicators of model in pessimistic scenario 158
Figure 4-51 Graphical output of environmental indicators of model in pessimistic scenario 158

Table of contents XIX
Figure 4-52 Graphical output of environmental indicators of model in pessimistic scenario 159
Figure 4-53 Graphical output of environmental indicators of model in pessimistic scenario 159
Figure 4-54 Graphical output of environmental indicators of model in pessimistic scenario 159
Figure 4-55 Graphical output of environmental indicators of model in pessimistic scenario 160
Figure 4-56 Graphical output of politic indicators of model in pessimistic scenario ............ 160
Figure 4-57 Graphical output of technological indicators of model in pessimistic scenario . 161
Figure 4-58 Graphical output of technological indicators of model in pessimistic scenario . 161


INTRODUCTION
Global implications associated with the use of fossil fuels, such as variation in fuel prices, the
future limitation of their offer and governments’ concerns about energy security and
sovereignty, encourage the development of alternative renewable energy sources. This is the
case of biomass used as feedstock to produce bioenergy, biofuels and bio-based products.
Similarly, the growing demand for energy and the efforts of industrialized countries to reduce
their carbon emissions, especially in the transport sector, promote the production of renewable
biofuels (Edgard Gnansounou 2011).
Nowadays, one of the most commonly used biofuels is biodiesel. Initially, it was defined as a
mixture of mono-alkyl esters of fatty acids obtained from vegetable oils and fats (ASTM D6751
2011). However, regarding the new developments and needs of the biofuels sector, its definition
has evolved to include other types of biodiesel such as advanced biodiesel and biomass-based
diesel (Epa 2010). These new definitions include the former biodiesel (mono-alkyl esters), as
well as non-ester renewable diesel (covering cellulosic diesel), which composition is similar to
petroleum-derived diesel, and it could be obtained from biomass, including vegetable oils, fats
and cellulosic biomass (Epa 2010). Despite the previous fact, most common biodiesel produced
industrially is a mixture of mono-alkyl esters of fatty acids (FAME), obtained by methanolysis
of oils extracted from rapeseed, soybean and oil palm fruit.
Most industrial biodiesel production is performed by a conventional process, using a
homogeneous alkaline catalyst, usually sodium or potassium methoxides. Separation steps use
water as extracting agent for salts produced by catalyst neutralization, soaps, remaining free
glycerol and other undesirable compounds present in the biodiesel rich stream obtained after
the transesterification, settling and neutralization stages. Renewable non-ester biodiesel can be
produced from vegetable oils by pyrogenolysis or hydrotreating, although industrial production
is not fully developed yet. Despite the latter fact there is no doubt that renewable non-ester
biodiesel will play a leading role in the future of biofuels (Pavlivna 2012).

22 Introduction
The main arguments for promoting biofuels are their potential positive effects on
environmental, economic and social dimensions because they would help humankind to reduce
the negative impacts of burning fossil fuels and to extend non-renewable resource availability
while a sustainable feedstock for energy and chemical products is found (Hill et al. 2006). In
addition, employment generation, especially in rural areas of developing countries, would allow
the governments to implement policies to reduce poverty and inequality. Unfortunately,
negative effects of biofuel production on the dimensions previously mentioned gradually
changed the perception of this bioenergy and opened a debate about its sustainability. Some of
the negative effects include alteration of ecosystems, degradation and loss of soil and water,
changes in tenure and land use, impact on food security, the negative balance of greenhouse
gases in the life cycle of biofuels, and the economic viability of their production (Hill et al.
2006; Gnansounou 2011; Janssen and Rutz 2011).
Likewise, in the debate on the sustainability of biodiesel production, studies show conflicting
results on the same topic. For example, while Directive 28/2009 of the European Union (C. E.
EC and EP 2009) reports savings in greenhouse gas (GHG) of biodiesel obtained from
rapeseed, soybean and palm oils up to 45%, 40% and 36%, respectively, in comparison to the
fossil fuel replaced, other studies claimed that global GHG emissions increases due to changes
in land use. This is because farmers react to the increase in the price of vegetable oils converting
forests, peat-lands, savannahs or grasslands into further farmland to obtain the raw materials
for biofuels. At the same time, other farmers plant traditional crops which were replaced by raw
materials for biofuel crops (Fargione et al. 2008; Searchinger et al. 2008).
Another example of conflicting results about the impact of biodiesel production is the results
presented by Hill et al. (2006) and Frondel & Peters (2007). Hill et al (2006), who analyzed the
life cycle of biodiesel from soybean oil, reported that it produces about 93% more energy than
needed to be obtained, as well as reducing greenhouse gas by 41% compared to diesel it
replaces; it reduces several pollutants and has minimal impact on human health and the
environment through the release of N, P and pesticides. Frondel and Peters (2007) stated that
the use of biodiesel, instead of conventional diesel, contributes less than 100% of the fossil
energy contained in conventional diesel. Additionally, they reported the negative effects on the
environment during the biomass production stage (consumption of natural resources, increased
soil acidification and pollution of surface waters due to the dumping of pesticides) and burning
(increased NOx emissions).
Introduction 23
Otherwise, despite the social benefits associated with employment generation and
improvements in education, health, income and housing of the population closer to the lands
where biomass is grown, negative effects on food security and food prices, land use and tenure,
violence, forced displacement and low job quality should also be considered (Phalan 2009). It
was also observed that, in situations where biodiesel production is no longer economically
viable, or with lower short-term returns (Hoon and Gan 2010), governments must set up policies
related to tax exemptions and pricing schemes (Craven 2011). An artificial market which is too
reliant on support measures such as government policies, subsidies and tax exemptions would
collapse once these policies and incentives are withdrawn (Hoon and Gan 2010).
Regarding the previously mentioned context, emerging studies have implemented different
methodologies to establish probable future scenarios where sustainable production of biodiesel
could be achieved. Relevant examples include studies in South Africa (Josephine K. Musango
et al. 2011; Josephine K. Musango et al. 2012; Brent and Musango 2013), Brazil (Milazzo et
al. 2013), Chile (Iriarte, Rieradevall, and Gabarrell 2012), Latin America (Cepal 2011; Janssen
and Rutz 2011), China (Wang, Calderon, and Lu 2011), India (Schaldach, Priess, and Alcamo
2011), Europe (Ulgiati, Russi, and Raugei 2008; Malça and Freire 2011) and Malaysia (Lim
and Teong 2010), among others. Although results obtained answered some of the questions
related to sustainable biofuel production, they generated additional enquiries that should be
resolved. For example, there is no consensus on the dimensions to be considered to define in a
comprehensive manner the conditions defining sustainable production, nor on specific metrics
that would make it possible to measure the level of sustainability.
In the search for methods and tools to solve such issues, organizations and researchers have
proposed strategies such as certification schemes or voluntary standards to ensure sustainability
in an international market for bioenergy (Delzeit and Holm-Müller 2009), regulatory
frameworks associated with directives, standards and laws applicable to a particular country,
and frameworks or schemes related to control standards and indicators (Scarlat and Dallemand
2011). Examples of these include system certifications such as the Roundtable on Sustainable
Palm Oil, the Roundtable and Responsible Soy, carbon certificates, CEN (European Committee
for Standardization), standards for sustainable biomass production in bioenergy applications,
and the Roundtable for Sustainable Biofuels, among many others (FAO and BEFSCI 2011).
The most recognized regulatory frameworks are the renewable energy directive of the European
Parliament, the Renewable Fuel Standard in the United States, and the mandate of renewable
biomass in Germany. Among the control and command schemes for sustainable biofuels, those

24 Introduction
established by the Inter-American Development Bank and the control scheme of the World
Bank and World Wide Fund for Nature (WWF) deserve to be mentioned (Scarlat and
Dallemand 2011).
The certification and assessment strategies mentioned above have in common that they consider
the impact of biofuel production on sustainable development dimensions (traditionally the
social, environmental and economic dimensions), but with these strategies it is difficult to show
whether there are interdependencies or to measure the influence between impacts. Additionally,
the influence of technological changes (e.g. changes in raw materials or production routes),
political changes (international agreements, local regulatory standards), life quality of
communities, or economic variations such as changes in oil prices, food prices or cropland price
issues are weakly considered by the strategies of certification and evaluation.
Despite the efforts previously mentioned, there are still problems to overcome, as the lack of
metrics to evaluate some dimensions of biodiesel sustainability and, especially, the absence of
tools to determine effectively the relationships between them. There are five main reasons for
these problems: The first is biodiesel supply chain is a multistage process, involving from the
production of raw materials (mainly biomass), oil extraction, and biodiesel transformation, to
the storage, transportation blending and sell of the final product. The second reason is the
complex relationships between the geographical and cultural contexts of the biodiesel supply
chain. The third refers to the various actors and stakeholders involved (Awudu and Zhang
2012). The fourth is associated with achieving a set of dimensions sufficiently holistic and
comprehensive of sustainable development that embraces the relationships between social,
economic, political, technological and environmental variables, and finally, the fifth reason is
the difficulty of establishing an evaluation framework to assess these dimensions.
Considering the need for a sustainability assessment that addresses the problems mentioned
above, the general objective of this research is to define a framework that allows the actors and
stakeholders of biodiesel supply chain to assess the sustainability of biodiesel production
through the integration of the sustainability theory and the system dynamic modeling as a
methodological approach.
In this work a hierarchical framework of 13 principles, 31 criteria and 150 indicators was
proposed and validated for the sustainability assessment of biodiesel production. It integrates
the three traditional dimensions of sustainable development and two new dimensions: political

Introduction 25
and technological. After that, a system dynamics based model was designed and implemented
using Stella® software. It permits the visualization of the relationships inside a dimension and
between dimensions through causal loop diagrams (CLD), which despite of its simplicity, play
a central role in the conceptualization and communication of feedback structure (Lee et al.
2012a).
Finally, the CLD were integrated and converted into a quantitative model, called the stock and
flow diagram, used to simulate biodiesel production in the Colombian context under three
scenarios: baseline, optimistic and pessimistic. A sensitivity analysis was performed with the
aim to identify some conditions that will promote or discourage a sustainable biodiesel
production in 2030.
This thesis presents in five chapters the problem involved to assess the sustainability of
biodiesel production in the Colombian context, and the 2030 scenario. Chapter 1 shows the
method to stablish the sustainability assessment framework of biodiesel production, based on a
comprehensive state of the art, resulting in the selection and analysis of 113 documents,
including laws, directives and other normative documents, policy documents, certificates and
papers published in peer-reviewed journals. Chapter 2 describes the method to define the final
framework through a validation strategy based on expert survey consultations and a descriptive
statistical analysis. In order to elucidate the principles and criteria importance for sustainability
assessment of biodiesel, 62 experts answered an online survey. As a result, a framework
composed of five dimensions (social, economic, environmental, political and technological),
13 principles and 31 criteria that would be part of a sustainability assessment of biodiesel
production was developed.
Chapter 3 presents the System Dynamic (SD) model of the Colombian biodiesel production
system and analyzes the dimensions involved. A system dynamics based model is proposed to
enable decision-makers to understand the influences between the different variables that
describe the system and the impact of the biodiesel sustainability in Colombia. The primary
focus of that chapter is to establish the characteristics of each sustainability dimension for the
case of study and apply the system dynamics methodology with different types of validation.
Chapter 4 includes the simulation of the biodiesel production system in the Colombian context
considering, initially baseline conditions, that is to say the trends and functions between 1999
and 2013 will be the same up to 2030. After, selected indicators of the baseline scenario will be
modified in order to generate a sensibility analysis to define two scenarios: optimistic and

26 Introduction
pessimistic. Finally, research findings, contributions and conclusions are presented in Chapter
5, including the theoretical and practical implications and some recommendations for future
work.
As results of this work, a first article was published in Ecological Indicators - Journal, entitled
“Biodiesel -TBL+: A new hierarchical sustainability assessment framework of PC&I for
biodiesel production – Part I” (Bautista et al. 2016), and a second article was submitted to the
same journal concerning the validation of sustainability assessment framework proposed in the
first article. Furthermore, the results of this research were presented in three international
conferences: the Inter-American and Colombian Congress of Chemical Engineering (2014)-
Cartagena, Colombia, the Congress of Biorefineries for Food & Fuels Materials (2015) -
Montpellier, France, and the European Congress of Chemical Engineering (2015) in Nice,
France.

1. Chapter 1: Biodiesel-TBL+: A new hierarchical
sustainability assessment framework of PC&I for
biodiesel production
Introduction
Sustainability assessment of biodiesel production is a topic of increasing importance due to the
interest of governments to define sovereignty strategies and diversification of their energy
matrix, and to set up the impact of biofuels production. In this context, this work aims to propose
a hierarchical structure of sustainability assessment that integrates dimensions of sustainable
development with principles, criteria and indicators (PC&I). The method employed to stablish
the hierarchical structure was a comprehensive literature review, based on information search
strategy and classification. About 400 documents were reviewed and 113 documents were
finally selected, including laws, policy documents, certificates, directives and other normative
documents and papers published in peer-reviewed journals.
The first result of the analysis was the need to strengthen identification of the sustainable
development assessment, adding the political and technological dimensions to the three
traditional dimensions, social, economic and environmental, studied in this kind of evaluation.
The second result was the proposal of a hierarchical framework for the sustainability assessment
of biodiesel production. The framework comprises five dimensions associated with sustainable
development evaluation, 13 principles, 40 criteria and a set of indicators that describes each
criterion. Outcomes of this work provide a foundation for further discussion of sustainability
assessments for biodiesel production and its potential application in specific contexts.
1.1 Insight from previous literature
The purpose of this background on previous literature reviews is to help relevant documents
enable us to underline the main research questions of the present study. Table 1-1 summarizes
16 recent documents regarding research focus, author, and number of papers reviewed, time,
source and sustainable dimensions considered (social-S, economic-Ec, environmental-En,
political-P and technological-T). These studies are classified through a typology reflecting the

28 Sustainability assessment of biodiesel production in Colombia
research focus, such as: biodiesel supply chain studies, quantitative approaches (models and
metrics), sustainability frameworks of criteria and indicators for bioenergy and biofuels, and
sustainability initiatives (regulatory frameworks, voluntary standards/certification schemes,
scorecards). With regard to the biodiesel supply chain studies, the documents show that the
biomass sourcing network issues were often analysed (Van Cauwenbergh et al. 2007; Mekhilef,
Siga, and Saidur 2011). The literature also shows that most of the quantitative approaches were
linked to life cycle studies (Malça and Freire 2011; Cherubini and Strømman 2011) and to
footprint computation tools (Cucek and Kravanja 2012).
Table 1-1. Previous literature that it was considered
Research focus Author Number of
papers reviewed
Time Source Sustainable dimensions
S Ec E P T Biodiesel supply chain studies (Van Cauwenbergh et al. 2007) 25 1993-2006 EE x x x
(Mekhilef, Siga, and Saidur 2011) 30 2006-2010 RSER x x Quantitative approaches (Models and metrics)
(Malça and Freire 2011) 28 1992-2010 RSER x (Cherubini and Strømman 2011) 45 1997-2010 BTJ x x (Cucek and Kravanja 2012) 15 2005-2011 JCP x
Sustainability frameworks of criteria and indicators for bioenergy and biofuels
(Cramer et al. 2007a) 8 1995-2007 Report x x (Fao and Befsci 2007) 20 1995-2006 Report x x x (Buchholz, Luzadis, and Volk 2009)
12 1996-2008 JCP x x x
(Buytaert et al. 2011) 20 1991-2010 RSER x x x x (Josephine K. Musango and Brent 2011)
30 1995-2010 ESD x x x x
(Kurka and Blackwood 2013) 41 1999-2012 RSER x x x x (Mata et al. 2013) 49 2003-2012 SERA x x x (Florin, van de Ven, and van Ittersum 2013)
50 1996-2013 ESP x x x x
Sustainability Initiatives (regulatory frameworks, voluntary standards, certification schemes, scorecards)
(Fritsche et al. 2006) 35 1990-2006 Book x x (FAO and BEFSCI 2011) 26 1998-2011 Report x x x x (Scarlat and Dallemand 2011) 18 1999-2010 EP x x x x
RSER-Renewable and Sustainable Energy Reviews EE-Ecosystems and Environment SERA-Sustainable Energy Technologies and Assessments JCP-Journal of Cleaner Production
ESP-Environmental science and policy ESD-Energy of Sustainable Development EP-Energy Policy BTJ-Bioresource Technology journal
On the other hand, holistic approaches of sustainability frameworks of criteria and indicators
for bioenergy and biofuels were proposed by multiple research works; the earliest related
literature review was Cramer et al. (2007a), who proposed a set of sustainability criteria and
indicators about environmental and social themes. Kurka et al. (2013) also proposed criteria
and indicators for bioenergy development. Buchholz et al. (2009) considered only sustainability
criteria, and Musango et al. (2011) added a conceptual framework with a system dynamics
approach to technology sustainability assessment. Similarly, Mata et al. (2013) proposed a
sustainability analysis of biofuels through the supply chain using indicators and Florin et al.
(2013) presented an indicator assessment of biofuel production systems.
Concerning sustainability initiatives (regulatory frameworks, voluntary standards, certification
schemes, scorecards) proposals were linked to sustainability assessment of biofuels, including
goals, principles, criteria and indicators. FAO & BEFSCI (2011) proposed a set of tools that

Chapter 1 29
included classification, certification, standardization, and lifecycle assessments of biofuels.
Additionally, authors identified sustainability standards for bioenergy (Fritsche et al. 2006) and
a global overview about development of biofuels / bioenergy sustainability certification (Scarlat
& Dallemand 2011). The sustainability initiatives had in common their sustainability
objectives, but the assessment approach and metrics showed important differences, thus
comprehensive integration was difficult.
From the sustainability dimensions considered by the different types of documents, the
literature reviews reflect that social, economic and environmental dimensions were frequently
considered. The political dimension has been taken into account by sustainability initiatives
(regulatory frameworks, voluntary standards, certification schemes and scorecards). The
technological dimension is mostly included in sustainability frameworks of criteria and
indicators for bioenergy and biofuels.
Regarding the research focus in the previous literature reviews, and with the aim of proposing
a new hierarchical sustainability assessment framework of biodiesel production, the following
research questions were considered:
Which sustainability dimensions should be part of a sustainability assessment
framework?
How is the current sustainability assessment framework structured?
What components could be proposed for a sustainability assessment framework?
To provide an answer to these questions, this work developed a comprehensive state of the art,
following a search strategy of material collection and descriptive analysis, taking the previous
literature review (Table 1-1) as a starting point.
1.2 Methods
A systematic literature review method composed by a search strategy and analysis of the
collected documents has been deployed. This method is described as follows:
1.2.1 Search strategy of documents
To determine the state of the art required to perform the sustainability assessment of biodiesel
production, a search strategy considers: (1) defining the type of documents and keywords to

30 Sustainability assessment of biodiesel production in Colombia
perform the search in databases, (2) establishing the sources of information to be employed
(databases and organizations websites), and (3) delimiting the time interval to be explored.
(1) The type of documents to be considered includes:
Methods, structures, systems, certifications, standards and regulatory frameworks that
incorporate goals, objectives or principles, criteria and indicators, or verifiably assess
the sustainability of the biodiesel production.
Research reports, articles in journals, project reports and PhD memories about
sustainable biodiesel production. Those studies should at least consider the traditional
dimensions of sustainable development (social, economic and environmental).
Research reports, articles in journals, project reports and theses about one or more stages
of the biodiesel supply chain.
(2) The keywords considered for the search in databases and organizations’ websites were:
Biofuel certification, biofuels initiatives.
Biofuel sustainability criteria and indicator.
Biofuel standards, policies and scorecard.
Biofuel sustainability assessment framework.
The sources of information to be employed (databases and organizations’ websites):
Academic and research institution websites.
Websites of governmental and non-governmental institutions working on sustainability
assessment of biodiesel.
Scientific databases included in the Web of Science and Scopus, in particular the
following journals’ databases: American Chemical Society ACS, Science Direct,
Springer Journal, and Nature.com.
(3) The period of information searching: It begins in 2000 and finishes in 2014. This was
defined as the initial year of the period because a constant growth in biodiesel production at the
global level as well as higher market prices were observed since 2000 (OEDC and FAO 2014).

Chapter 1 31
1.2.2 Descriptive document analysis and selection
The descriptive analysis of the state of the art was made with the aim to know the temporal
distribution of documents determined by the set of keywords, as well as document distribution
by information sources, the subject area in information sources and the sustainability
assessment dimensions; also the keywords, the most recurrent by geographical regions.
Afterwards, the document selection was carried out through a deductive process, considering
the three research questions of this work and the search strategy. Initially, the document must
incorporate at least two of the following concepts: goals, objectives or principles, criteria,
indicators or verifiable facts. After that, the document should at least consider the traditional
dimensions of sustainable development (social, economic and environmental). Finally, the
document should take into account the sustainability assessment framework. If the identified
document in the search strategy complies with two or more previous conditions then the
document is selected.
1.3 Results from the literature review
The results of the method described above are first presented through a descriptive analysis.
Then the documents are selected and their classification by document type is proposed.
Subsequently, the implications of the results regarding the sustainability dimensions that were
defined in the present work are discussed. Finally, a discussion on the general frameworks
proposed by the literature is proposed.
1.3.1 Descriptive analysis
Overall, it could be indicated that the sustainability assessment of biofuel production is a
research topic that has been strongly developed in the last 10 years. This aspect is shown in
Figure 1-1; in total, 411 different documents were identified. From 2003 until 2009, the number
of documents increased by 50% per year. Then, from 2009 to 2014 the documents increased
approximately 40%, with a significant number of documents about biofuel policies in 2013.
The use of “biofuel and sustainability criteria” as a keyword presented constant growth until
2007, similar to the keyword “biofuel sustainable assessment framework”. The document’s
temporal distribution showed that the keyword “biofuel certification or biofuels initiatives”
(regulatory frameworks, voluntary standards/certification schemes, scorecards) was seen since
2003 and continued to be included as a keyword until 2014.

32 Sustainability assessment of biodiesel production in Colombia
Figure 1-1. Document temporal distribution
The information sources were highly diverse, with 159 different journals and approximately 50
websites of governmental and non-governmental institutions being identified. The information
sources with the most number of documents published are shown in Figure 1-2. The journal
Energy Policy and the institutions’ websites were highlighted regarding the keyword “biofuels
standards or biofuels policies”. The keyword “biofuels and sustainability criteria” also had a
significant number of documents published in the journal Biofuels, Bioproducts and
Biorefining. Furthermore, the institutional website show a high number of documents related
to models of biofuels’ certification and sustainable initiatives, because these institutions
promote and in some case grant certification adopted by biofuels supply chain stakeholders.
Regarding to energy, biofuels and policy journals, the keyword resulting in the highest number
of documents was biofuels standards. As a consequence, the influence of standards and policies
on the promotion of sustainable biofuels production has been extensively analyzed by peer
reviewed scientific documents.
Figure 1-3 shows the documents’ distribution by “subject area”. The subject areas applied in
this work were selected taking into account the abstract and citation database Scopus, which
has a coverage span of 27 subject areas. Thus, each identified document was linked to a subject
area, and the subject areas were associated with the sustainability dimensions used in previous
literature reviews for biofuel assessment (refer Table 1). The subject areas having the highest
number of related documents are those of the environmental dimension: energy, environmental
science, agricultural biological science, chemical engineering and engineering. Moreover, the
sustainability assessment dimensions with significant subject areas and documents published

Chapter 1 33
were environmental and technology dimensions, while a moderate number of subject areas and
documents were found for economic and social dimensions. The lowest number was found for
the political dimension. It is interesting to observe that the keywords biofuel standards or
biofuel policies obtained a high number of documents published in the subject areas energy and
environmental sciences.
Figure 1-2. Distribution of document in the information sources
Figure 1-3. Documents by subject area
To conclude, the geographical distribution of documents by region shows that Europe was the
region with the highest number of publications from 2003 to 2014. The most relevant keyword

34 Sustainability assessment of biodiesel production in Colombia
was “biofuels and sustainability criteria”. For the second region, North America (United States
and Canada), and the third region, Asia, the relevant keyword was “biofuels standards and
biofuels policies”. The fourth region was Latin America, with a similar number of documents
in the five keywords (refer Figure 1-4). It was highlighted that the European region and the
United States are the principal biofuel producers and consumers, and the Asian – Latin
American regions are the important potential expansion areas for biofuel production (EIA
2011).
Figure 1-4. Geographical distribution of documents
1.3.2 Information Classification
As a result of the selection process described in section 1.2.2, 113 documents met the selection
conditions and were classified in four groups according to the type of documents. The first
group includes biofuel certification standards and sustainability initiatives (regulatory
frameworks, voluntary standards/certification schemes, scorecards). The second group
corresponds to documents where biofuel sustainability criteria and indicators were presented.
The third group corresponds to biofuel standards and policies that aim at sustainability of the
biofuel production chain and its stakeholders. Finally, the fourth group contains documents
about biofuel testing frameworks and scorecards. The selected documents and their
classifications are shown in Table 1-2.
Table 1-2 Classification of selected documents
Groups Selected Documents
Certification and initiatives of sustainability
1. Bonsucro, Better Sugarcane Initiative. 2. FLO, Fair Trade, Fairtrade Labelling
Organizations International 3. GQA, Genesis Quality Assurance
20. SAN/RA, Sustainable Agriculture Network/Rainforest Alliance
21. Sustainability criteria and indicators for bioenergy developed by FBOMS

Chapter 1 35
Groups Selected Documents
criteria of biofuels
4. PEFC, Program for the Endorsement of Forest Certification schemes
5. RTRS, Roundtable for Responsible Soy Production
6. GGLS2, Green Gold Label 2. Agriculture Source Criteria
7. Nordic Eco-labelling of Fuels 8. UNCTAD Biofuels Initiative, 2006 9. Certification by the standardization institute
NEN and the Rotterdam Climate Initiative (RCI) to assess the sustainability requirements for solid, liquid and gaseous biomass for energy application and transport fuels, Netherlands, 2011
10. RTFC, Renewable Transport Fuel Certificate 11. BLE, Sustainable Biomass Production.
Germany 12. EcoLogoM, has criteria for renewable energy
sources with specific criteria for biomass and biogas, Canada, 1988
13. LEI, the Lembaga Ekolabel Indonesia, 2005 14. MTCC, the Malaysian Timber Certification
Council, 2005 15. RSPO, Roundtable on Sustainable Palm Oil,
2007 16. ELECTRABEL Label Green. Development
of ecological standards for biomass in the framework of green electricity labelling. Belgian regions, 2006.
17. EUGENE (EU), Project Focus on end part of chain. Actual label, adds extra principles for biomass in specific.
18. Social Fuel seal – Brazil 19. Southern African NGO position on Biofuels
22. Summary IATP Sustainable Biomass Production Principles & Practices
23. ACCS, Assured Combinable Crops Scheme 24. CSBP, Council on Sustainable Biomass
Production, the United States. 25. NTA 8080, Sustainable Production of
Biomass—The Netherlands 26. FSC, Forest Stewardship Council 27. GAP, Global Partnership for Good
Agricultural Practice 28. IFOAM, International Federation of Organic
Agriculture Movements 29. LEAF, Linking Environment and Farming 30. SAI, Social Accountability International 31. Sustainability 32. Guide in Biomass Production and Processing
in the Biofuel chain in Colombia 33. ISO 26000 – Responsibility social. 34. ISO 14040 - Life Cycle Assessment 35. GBEP, Global Bioenergy Partnership, 2005 36. UNEP, 2009. Towards Sustainable Production
and 37. Use of Resources: Assessing Biofuels 38. USAID, Biofuels in Asia: an analysis of
sustainability options. United States Agency for International Development.
39. RSB, Roundtable on Sustainable Biofuels, established by the Ecole Polytechnique Fédérale de Lausanne (EPFL) Energy Center in 2006
40. Pilot Testing of GBEP Sustainability Indicators for Bioenergy in Colombia (FAO 2014).
41. ISCC, International Sustainability and Carbon Certification
Biofuels standards and policies
1. RTFO, Renewable Transport Fuel Obligation – UK
2. CAP, Common Agricultural Policy 3. Directive 2009/28/EC of the European Union,
directive on renewable energy. 4. BLCAO, Biofuels life cycle assessment
ordinance Swiss Confederation 5. BioNa Dv, Biomass Sustainability order,
Germany 6. Biodiesel standard, ASTM D6751 and the
EU’s EN. 14214:2003
7. ASTM D6751 was drafted for Biodiesel fuel blends.
8. RFS2, Renewable Fuel Standard, the United States, 2010
9. WTO rules and principles (UN 2008) 10. LCFS, Low Carbon Fuel Standard (LCFS),
required by California, United States. 11. SBA, Sustainable Biodiesel Alliance, in the
United States, 2009 12. RFQD, Revised Fuel Quality Directive of the
European Union, 2008
Papers published in peer-reviewed journals
1. (Florin, van de Ven, and van Ittersum 2013)
2. (Brent and Musango 2013) ; 3. (Kurka and Blackwood 2013); 4. (Pesqueira and Glasbergen 2013); 5. (FAO 2013); 6. (Elibehri, Segerstedt, and Liu
2013); 7. (Mangoyana, Smith, and Simpson
2013); 8. (Milazzo et al. 2013); 9. (German and Schoneveld 2012); 10. (BID and MME 2012a) 11. (Josephine K. Musango et al.
2012); 12. (FAO & BEFSCI 2012) ; 13. (Scarlat and Dallemand 2011); 14. (Halog and Manik 2011); 15. (McBride et al. 2011)
22. (Gnansounou et al. 2009) 23. (Edgard Gnansounou 2011) 24. (Oviedo, S; Narvaez, P;
Camargo, M; Morel, L;Forradellas 2011)
25. (S. Zapata, Franco, and Dyner 2011)
26. (World Energy Council 2010) 27. (Boons and Mendoza 2010) 28. (Markevičius et al. 2010) 29. (Lendle and Schaus 2010) 30. (Hoon and Gan 2010) 31. (J. Van Dam, Junginger, and
Faaij 2010) 32. (Buchholz, Luzadis, and Volk
2009) 33. (Brent 2009) 34. (Delzeit and Holm-Müller
2009)
41. (EC and BTG 2008) 42. (Dehue et al.) 43. (Cramer et al. 2007a) 44. (FAO and BEFSCI
2007) 45. (Allen 2007) 46. (Van Cauwenbergh et
al. 2007) 47. (Bantz and Deaton
2006) 48. (Moret, Rodrigues, and
Ortiz 2006) 49. (Fritsche et al. 2006) 50. (Oehme 2006) 51. (Lewandowski and
Faaij 2006) 52. (Clark and Macquarrie
2002) 53. (Nrtee 1999)

36 Sustainability assessment of biodiesel production in Colombia
Groups Selected Documents
16. (FAO and BEFSCI 2011) 17. (Vaccaro et al. 2010) 18. (Amigun, Musango, and Brent
2011) 19. (Pruyt and Sitter 2008) 20. (Kim, Kim, and Dale 2009) 21. (Szarka et al. 2008)
35. (Franco and Flórez 2009) 36. (Groom, Gray, and Townsend
2008) 37. (Jinke van Dam et al. 2008) 38. (Nations 2008) 39. (Timilsina and Shrestha 2011) 40. (Cavalett and Ortega 2010)
54. (Mendoza et al. 1999) 55. (Bueren and Blom
1996) 56. (Timilsina and Shrestha
2011) 57. (Gudmundsson 2008)
Testing Framework & scorecard
1. Inter-American Development Bank Sustainability Scorecard 2. World Bank/WWF Biofuels environmental sustainability scorecard 3. Sustainability Assessment Framework (de Lange and Wolvekamp 2006)
As may be seen from Figure 1-5, the greatest number of studies corresponds to papers published
in peer-reviewed journals, 45% of these studies. The second proportion, 40%, was obtained by
certification and initiatives of sustainability criteria of biofuels. The third are biofuel standards
and policies, at 12% of the studies. The fourth, 3% of the studies, are testing frameworks and
biofuel scorecards carried out by governmental and non-governmental organizations.
Figure 1-5. Percentages of document by classification group of documents.
Comparing the document temporal distribution (Figure 1-1), the distribution of documents by
information source (Figure 1-2) and the document by subject area (Figure 1-3), it is observed
in Figure 1-5 that there is a parallel trend of research make by scientific community through
peer-reviewed journals (Figure 1-1 and 1-3) and the research application by means of
certification and voluntary initiatives of sustainable biofuels production promoted by
Government and non-governmental organizations or institutions (websites in Figure 1-2). This
trend is positive because the scientific research can strengthen the certification processes and
vice versa.
Regarding the 113 selected documents, a set of criteria and indicators was identified and a
number of documents were associated with each criterion (refer Appendix 1). The more cited
criteria are those of the environmental dimension, mainly associated with assessment of

Chapter 1 37
greenhouse gas emissions, air quality, water quality and quantity, and waste
management. Second, the criteria of the social dimension related to aspects of rural
development, compliance with labour laws, and food security. Taking third place in citations
are criteria of the political dimension in areas such as compliance with local laws, ethics and
transparency. Those criteria with lower levels of document citation were those associated with
economic aspects such as influence on the production volume of first-generation biodiesel
(from edible feedstock) of the oil market and advanced biodiesel. Criteria belonging to the
technological dimension are those that obtained the lower number of citations (refer Figure
1-6).
Figure 1-6. Number of papers cited specifically by criterion.
1.3.3 Sustainability assessment dimensions
The adoption of sustainability assessment should implement a holistic perspective by
comprehensively/simultaneously/equally considering the relevant/full range of ‘dimensions’,
since decision-makers and other stakeholders wish to be informed of the full spectrum of
impact. Associated with sustainability assessment, the environmental, social and economic
dimensions are sometimes referred to as the ‘three pillars’ of sustainability or the ‘triple bottom-
lines – TBL’ (Hacking and Guthrie 2008). The TBL is an approach which encompasses the
three dimensions of sustainability and is linked to the strong theoretical fit for measuring

38 Sustainability assessment of biodiesel production in Colombia
multidimensionality of sustainability. These dimensions should be treated differently but
eventually integrated. Sustainability can be achieved by a systematically linked “socio-
economic-environmental system” and not by a single component (Lee et al. 2012a).
According to the sustainability dimensions studied, 43% of the selected documents were related
to the environmental dimension, 29% to social dimensions and 16% to the economic dimension.
Additionally, 7% and 5% of the documents perform political or technological assessments,
respectively. Based on that behaviour, it deemed necessary to add the last two dimensions to
the traditional TBL sustainability assessment.
In particular for biodiesel production assessment, the political dimension is highly relevant
because the Government’s policies are essential to promote the biodiesel production, creating
economic conditions and favorable markets such as subsidies, tax exemptions, and biodiesel
compulsory consumption as a diesel mixture. Moreover, the technological dimension is also
relevant in the sustainability assessment of biodiesel, taking into account that emerging
technologies are competing with the first generation biodiesel. Furthermore, the incorporation
of political and technological dimension adds additional challenges to sustainability assessment
associated with maturity indicators. The political and technological indicators do not have the
similar maturity as the economic or environmental indicators, for this reason, the assessment
framework proposed in this work will be validated through expert consultation.
The inclusion of the political dimension in sustainability assessment, it makes it possible to
perform an analysis on the impact of the implementation of local or international regulatory
frameworks, mandatory or voluntary biofuel certification systems, and the impact on the social,
economic and environmental dimensions (Schade and Wiesenthal 2011). For example, the
manner in which direct policy controls, such as renewable fuel standards and mandatory
blending, increase the demand for biodiesel, which generates growth of biodiesel processors,
increasing the demand of cultivation land for raw materials, changes in the ownership of land,
impacts on rural employment and changes in the quality of life and living conditions of
communities associated with the biodiesel production system.
The inclusion of the technological dimension permits the analysis of the influence of new
technological developments on the sustainability of the biodiesel supply chain. Some examples
of new technological trends are the use of non-edible vegetable oils as raw materials, the
implementation of intensified production technologies, the production of non-ester biodiesel
and changes in the internal combustion engine (Mohr and Raman 2013; de Wit et al. 2010).

Chapter 1 39
Those aspects are fundamental for assessing the impact of implementing such technology trends
on environmental and social impacts. For example, including the technological dimension could
help answer questions about how new technologies could change the use of first generation
biofuels in the future, if it will have a positive impact on social and environmental dimensions.
This also takes into account that the use of food crops and oils for producing fuel was promoted,
the “food vs. fuel” conflict and concerns about the negative impacts of monocultures for first
generation biofuels on biodiversity and water conservation especially linked to the conversion
of natural terrestrial ecosystems, respectively.
This research proposes to integrate the political and technological dimensions into the three
traditional sustainability dimensions (environmental, social and economic), with the aim of
strengthening the multidimensional sustainability assessment. The approach covers five
dimensions and was named Triple Bottom Line Extended (TBL+).
1.3.4 Frameworks previously used for sustainability assessment of biofuels
According to the state of the art, three different types of frameworks to perform the
sustainability assessment of biodiesel have been identified. These frameworks are shown in
Figure 1-7. Scheme 1 shown a set of principles which are described by a number of criteria.
Each criterion has a set of indicators that are calculated using verifiers. Principles are ‘universal’
basic facts or attributes of a sustainable system (Florin, van de Ven, and van Ittersum 2013). A
criterion is a translation of the principle into concrete requirements that have to be met (Cramer
et al. 2007b). Indicators are the concrete and quantifiable aspects that will be used in the
evaluation procedure (Fao and Befsci 2007). The verifiers provide additional data or
information that enhances the specificity of the ease of assessment of an indicator (Buytaert et
al. 2011). Sometimes verifiers are defined to double-check the indicators (E. C. EC and BTG
2008) and are also needed for indicator assessment and the control of the fulfilment of
sustainability criteria (Lewandowski and Faaij 2006).
Scheme 2, in Figure 1-7, is commonly used in international certification systems and defines a
set of standards which are assessed by criteria; each criterion has a set of indicators (Jinke van
Dam et al. 2008). The standards are meant as basic principles for defining the “rules” which
sustainable bioenergy development should follow (Fritsche et al. 2006). At the same time, the
standards are a set of predetermined requirements that are assessed in certification processes

40 Sustainability assessment of biodiesel production in Colombia
(Scarlat 2011). The definition of criteria and indicators in Scheme 2 are the same as those
referred to above.
Figure 1-7. General frameworks employed to perform the sustainability assessment of biodiesel
Scheme 3 is generally used in life cycle assessment - LCA; initially the organizational set-up
needs to be established through goal and scope definitions, taking the stakeholders into account.
The goal and scope definition is the phase in which the initial choices which determine the
working plan of the entire LCA are made. The goal of the study is formulated in terms of the
exact question, target audience and intended application. The scope of the study is defined in
terms of temporal, geographical and technological coverage, and the level of sophistication of
the study in relation to its goal (Guinée and Tukker 2002). Each goal is described by principles
and the principles are described by a set of criteria, likewise the criteria by a number of
indicators. Each indicator is measured by verifiers, or judged through standards or references
called benchmarks (Jinke van Dam et al. 2008).
The three schemes described are mutually complimentary, as all of them are related to
principles, criteria and indicators (PC&I). However, some features of each scheme must be
highlighted in order to apply them to the biodiesel supply chain:
The first scheme allows proposing PC&I, to give a general framework of diagnostic and
analysis for a specific case. A comprehensive analysis must be carried out in order to
identify those criteria and indicators.
In the second scheme, certifications define standards as minimal requirements, and the
biofuels supply chain stakeholders fix the criteria and indicators that must be evaluated
based on those standards.
In third scheme, related to LCA analysis, it is required extensive and detailed
information (databases of indicators) to quantify the impact of biofuel production chain
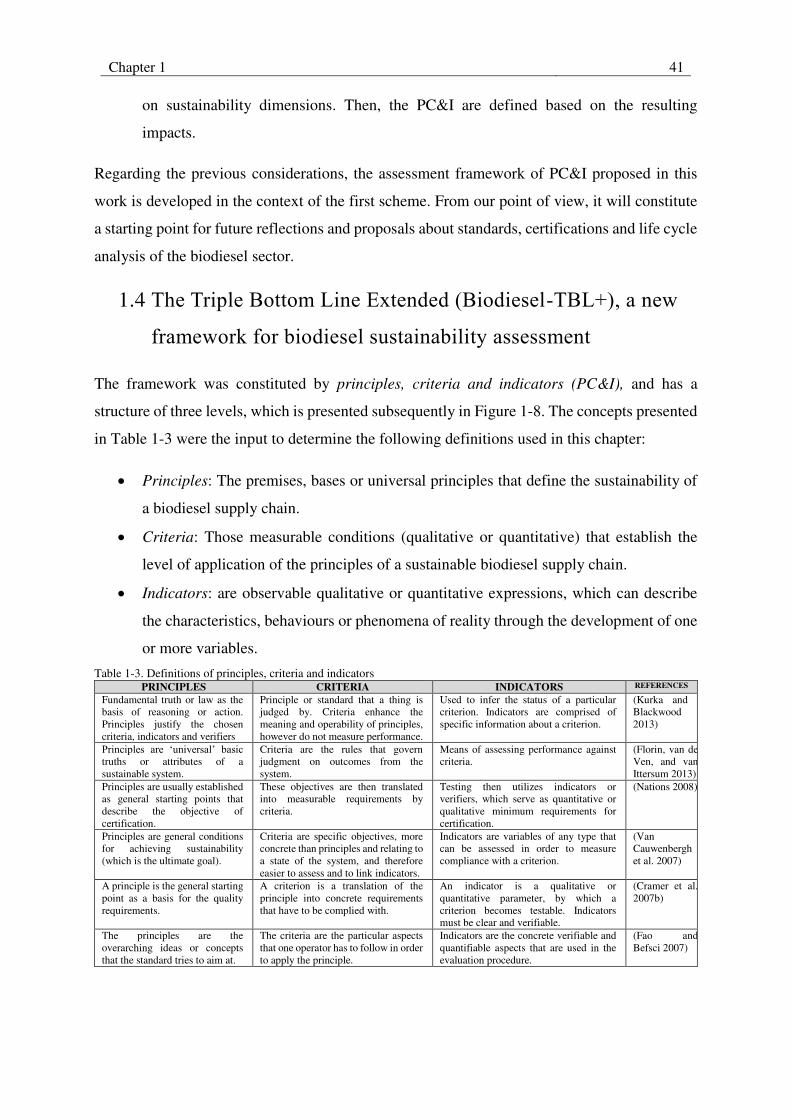
Chapter 1 41
on sustainability dimensions. Then, the PC&I are defined based on the resulting
impacts.
Regarding the previous considerations, the assessment framework of PC&I proposed in this
work is developed in the context of the first scheme. From our point of view, it will constitute
a starting point for future reflections and proposals about standards, certifications and life cycle
analysis of the biodiesel sector.
1.4 The Triple Bottom Line Extended (Biodiesel-TBL+), a new
framework for biodiesel sustainability assessment
The framework was constituted by principles, criteria and indicators (PC&I), and has a
structure of three levels, which is presented subsequently in Figure 1-8. The concepts presented
in Table 1-3 were the input to determine the following definitions used in this chapter:
Principles: The premises, bases or universal principles that define the sustainability of
a biodiesel supply chain.
Criteria: Those measurable conditions (qualitative or quantitative) that establish the
level of application of the principles of a sustainable biodiesel supply chain.
Indicators: are observable qualitative or quantitative expressions, which can describe
the characteristics, behaviours or phenomena of reality through the development of one
or more variables.
Table 1-3. Definitions of principles, criteria and indicators PRINCIPLES CRITERIA INDICATORS REFERENCES
Fundamental truth or law as the basis of reasoning or action. Principles justify the chosen criteria, indicators and verifiers
Principle or standard that a thing is judged by. Criteria enhance the meaning and operability of principles, however do not measure performance.
Used to infer the status of a particular criterion. Indicators are comprised of specific information about a criterion.
(Kurka and Blackwood 2013)
Principles are ‘universal’ basic truths or attributes of a sustainable system.
Criteria are the rules that govern judgment on outcomes from the system.
Means of assessing performance against criteria.
(Florin, van de Ven, and van Ittersum 2013)
Principles are usually established as general starting points that describe the objective of certification.
These objectives are then translated into measurable requirements by criteria.
Testing then utilizes indicators or verifiers, which serve as quantitative or qualitative minimum requirements for certification.
(Nations 2008)
Principles are general conditions for achieving sustainability (which is the ultimate goal).
Criteria are specific objectives, more concrete than principles and relating to a state of the system, and therefore easier to assess and to link indicators.
Indicators are variables of any type that can be assessed in order to measure compliance with a criterion.
(Van Cauwenbergh et al. 2007)
A principle is the general starting point as a basis for the quality requirements.
A criterion is a translation of the principle into concrete requirements that have to be complied with.
An indicator is a qualitative or quantitative parameter, by which a criterion becomes testable. Indicators must be clear and verifiable.
(Cramer et al. 2007b)
The principles are the overarching ideas or concepts that the standard tries to aim at.
The criteria are the particular aspects that one operator has to follow in order to apply the principle.
Indicators are the concrete verifiable and quantifiable aspects that are used in the evaluation procedure.
(Fao and Befsci 2007)

42 Sustainability assessment of biodiesel production in Colombia
PRINCIPLES CRITERIA INDICATORS REFERENCES
A fundamental truth or law as the basis of reasoning or action. They provide the justification for Criteria, Indicators and Verifiers.
A Criterion cans one that adds meaning and operationally to a principle without itself being a direct measure of performance.
An indicator is any variable or component of a system used to infer the status of a particular Criterion. Indicators should convey a ‘single meaningful message’. This ‘single message’ is termed information.
(Mendoza et al. 1999)
A principle is a fundamental law or rule, serving as a basis for reasoning and action. Principles are explicit elements of a goal.
A criterion is a state or aspect of the dynamic process of a system, which should be in place as a result of adherence to a principle.
An indicator is a quantitative or qualitative parameter, which can be assessed in relation to a criterion. It describes in an objectively verifiable and unambiguous way features of the system.
(Bueren and Blom 1996)
The first level in the framework was the interaction between the five dimensions of the
sustainability Triple Bottom Line extended (Biodiesel-TBL+) and the biodiesel supply chain
stages. In this interaction, the sustainability principles were defined. The principal stages of the
supply chain considered were: feedstock plantation, storage facilities, oil extraction plants,
biorefineries (feedstock transformation), biodiesel-diesel blending facilities and retail outlets
(RS 2008; Kumar and Nigmatullin 2011; Andersen et al. 2012; Avami 2012; Awudu and Zhang
2012; Mata et al. 2013).
The second level was made up of a set of sustainability assessment criteria linked to each
principle. These criteria were identified as a measurable condition (qualitative or quantitative)
aiming to assess how the sustainability principle was applied to the biodiesel supply chain. The
first and the second level in the framework were defined in order to make a general
sustainability assessment. Therefore, the principles and criteria can be applied regardless of the
economic, social, political or biogeographic context, the technological conditions or the raw
materials used, among other aspects.
Finally, in the third level, indicators were established to evaluate the characteristics or
behaviours of each criterion. Besides principles, and criteria, the indicators must refer to
particular conditions of the biodiesel production system, or the assessment scale (national,
regional, local). Therefore, the framework could be applicable to specific contexts. The new
framework was summarized in Figure 1-8.
As outlined earlier, the biodiesel sustainability framework proposed covers five dimensions
(Triple Bottom Line Extended-TBL+). The two additional sustainability dimensions (political
and technological) were included with the aim to increased level of granularity and visibility of
the principles, criteria and indicators (PC&I).
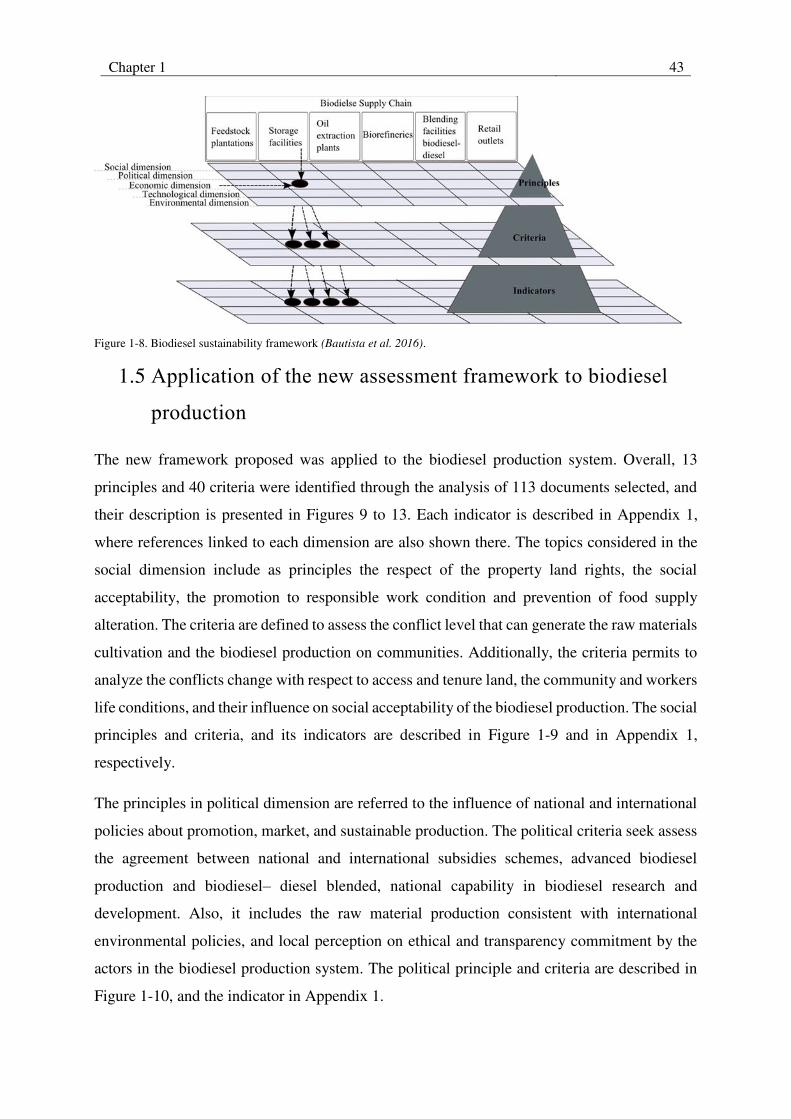
Chapter 1 43
Figure 1-8. Biodiesel sustainability framework (Bautista et al. 2016).
1.5 Application of the new assessment framework to biodiesel
production
The new framework proposed was applied to the biodiesel production system. Overall, 13
principles and 40 criteria were identified through the analysis of 113 documents selected, and
their description is presented in Figures 9 to 13. Each indicator is described in Appendix 1,
where references linked to each dimension are also shown there. The topics considered in the
social dimension include as principles the respect of the property land rights, the social
acceptability, the promotion to responsible work condition and prevention of food supply
alteration. The criteria are defined to assess the conflict level that can generate the raw materials
cultivation and the biodiesel production on communities. Additionally, the criteria permits to
analyze the conflicts change with respect to access and tenure land, the community and workers
life conditions, and their influence on social acceptability of the biodiesel production. The social
principles and criteria, and its indicators are described in Figure 1-9 and in Appendix 1,
respectively.
The principles in political dimension are referred to the influence of national and international
policies about promotion, market, and sustainable production. The political criteria seek assess
the agreement between national and international subsidies schemes, advanced biodiesel
production and biodiesel– diesel blended, national capability in biodiesel research and
development. Also, it includes the raw material production consistent with international
environmental policies, and local perception on ethical and transparency commitment by the
actors in the biodiesel production system. The political principle and criteria are described in
Figure 1-10, and the indicator in Appendix 1.

44 Sustainability assessment of biodiesel production in Colombia
Figure 1-9. Social dimension: principles and criteria
Figure 1-10. Political dimension: principles and criteria
Economic principle underline that the biodiesel production must be sustainable at both
macroeconomic and microeconomic level. The second level, economic criteria assess the
influence level of macroeconomic variables as oil market, diesel market, first, second and third

Chapter 1 45
generation biodiesel market, on microeconomic variables as vegetable oil price, biodiesel price
and glycerol price. The economic principle and criteria are described in Figure 1-11. The
indicators are presented in Appendix 1.
Figure 1-11. Economic dimension: principles and criteria
The technological principle is focused in the reduction of negative impact on environment and
the efficiency and cost reduction. The criteria taking into account the influence of emerging
technologies for first, second and third biodiesel production on the demand of natural resources,
pollution generation, and cost reduction. Also, the criteria consider the technological learning
in the first generation biodiesel linked to technological improvements and cost reduction. The
technologic principles and criteria are described in Figure 1-12.The indicators are described in
Annex 1.
Figure 1-12. Technological dimension: principles and criteria
The environmental principles consider issues as air, soil and water quality, waste and
wastewater management, balance of greenhouse gas, conservation and protection of
biodiversity and wildlife, and energy efficiency. In general, the environmental criteria assess
the influence of biodiesel supply chain on the environmental condition, the transformation of
natural ecosystem and the quality of natural resources. The environmental principle and criteria
are described in Figure 1-13. The indicators are presented in Appendix 1.

46 Sustainability assessment of biodiesel production in Colombia
Figure 1-13. Environmental dimension: principles and criteria
1.6 Discussions
When the new framework for biodiesel sustainability assessment was compared with other
similar studies (Bueren and Blom 1996; Mendoza et al. 1999; Fao and Befsci 2007; Cramer et
al. 2007a; Van Cauwenbergh et al. 2007; Florin, van de Ven, and van Ittersum 2013; Kurka and
Blackwood 2013), significant differences were found. First, the new framework considered five
dimensions in the sustainability assessment, in particular the technological dimension,
compared with the three traditional dimensions. Second, it was proposed the integration
between the sustainability assessment dimensions with the biodiesel supply chain. Third, the
relations between the levels of hierarchical structure, that is, each sustainability dimension was
assessed by way of a set of principles; likewise, each principle was assessed by a set of criteria
and each criterion by a set of indicators. Taking into account the points above, the new
framework was comprehensive at both the principle and criteria levels, while also being
adaptable to different contexts and biofuel supply chains at the indicator level.
The present research also compared the new framework with works about assessment tools for
sustainable biofuel production, such as the proposal by (Silva Lora et al. 2011; Buytaert et al.
2011; FAO and BEFSCI 2012; Cucek and Kravanja 2012). These works describe the
performance and applicability of an existing selection of tools that are potentially useful for
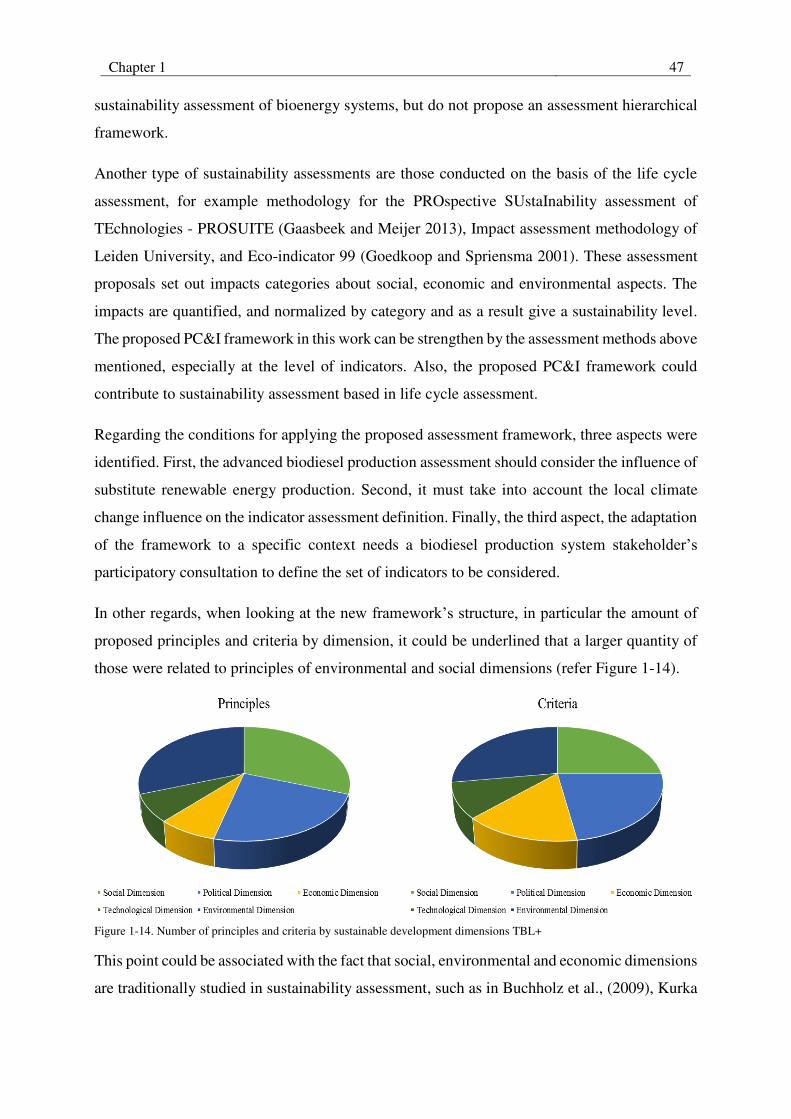
Chapter 1 47
sustainability assessment of bioenergy systems, but do not propose an assessment hierarchical
framework.
Another type of sustainability assessments are those conducted on the basis of the life cycle
assessment, for example methodology for the PROspective SUstaInability assessment of
TEchnologies - PROSUITE (Gaasbeek and Meijer 2013), Impact assessment methodology of
Leiden University, and Eco-indicator 99 (Goedkoop and Spriensma 2001). These assessment
proposals set out impacts categories about social, economic and environmental aspects. The
impacts are quantified, and normalized by category and as a result give a sustainability level.
The proposed PC&I framework in this work can be strengthen by the assessment methods above
mentioned, especially at the level of indicators. Also, the proposed PC&I framework could
contribute to sustainability assessment based in life cycle assessment.
Regarding the conditions for applying the proposed assessment framework, three aspects were
identified. First, the advanced biodiesel production assessment should consider the influence of
substitute renewable energy production. Second, it must take into account the local climate
change influence on the indicator assessment definition. Finally, the third aspect, the adaptation
of the framework to a specific context needs a biodiesel production system stakeholder’s
participatory consultation to define the set of indicators to be considered.
In other regards, when looking at the new framework’s structure, in particular the amount of
proposed principles and criteria by dimension, it could be underlined that a larger quantity of
those were related to principles of environmental and social dimensions (refer Figure 1-14).
Figure 1-14. Number of principles and criteria by sustainable development dimensions TBL+
This point could be associated with the fact that social, environmental and economic dimensions
are traditionally studied in sustainability assessment, such as in Buchholz et al., (2009), Kurka

48 Sustainability assessment of biodiesel production in Colombia
(2013) and Cramer et al., (2007b). In contrast, political and technological dimensions are less
linked to sustainability assessments, and in general, the political and technological principles
and criteria were associated with economic or social dimensions. In this context, it is suggested
that further research needs to be undertaken to define a larger set of assessment criteria related
to technological and political issues of biodiesel sustainability.
Another point of discussion regarding the state of the art is the manner in which academic and
research institutions, as well as governmental and non-governmental institutions, apply the
definition of principles and criteria to the environmental sustainability assessment of biodiesel.
In general, the social and political criteria do not exemplify or consider the method of
quantifying them. In addition, the political criteria do not show the influence of political
contexts (macro, meso, and micro) on the sustainability assessment. Also, political and social
criteria as traditionally proposed do not provide tools to analyse the level of reactivity, pro-
activity or adaptability that local policies have in regard to recent directives or trends in
biodiesel consuming countries. This work considers that the lack of quantification of political
and social criteria might make them less comprehensible. Additionally, the difficulty of
measuring political and social criteria is quite high due to the lack of formalization of links
between the well-being of communities and local and international political policies, as well as
economic, environmental and technological criteria.
In the case of the economic and environmental criteria, a relevant point is that these are usually
described using measurement units or quantifiable factors. As a weakness of the current
frameworks, it was not evident how the economic and environmental criteria are linked with
the influence of advanced technologies in biodiesel production or changes in raw materials.
Moreover, how the influence of governmental biofuel policies or social acceptability is on the
economic and environmental criteria has not been enough clarified. Regarding the
technological criteria, there are criteria associated with the efficiency of transformation
processes and the technical feasibility of technologies implemented, but a lack of criteria that
link the efficiency and the technical feasibility with the environmental and social impacts of the
biodiesel supply chain. Finally, the relationships and influences among stakeholders (socio-
technical system approach Greenwell et al. 2012) with the biodiesel supply chain was weakly
analysed.

Chapter 1 49
Conclusions
There is an unresolved debate on the sustainability of using biodiesel to replace fossil fuel as
part of a sustainable development strategy. Some countries continue fostering this industrial
sector whereas others are considering reversing this type of initiatives, at least for the first
generation of biodiesels.
The biodiesel supply chain is a complex system, as there is a wide range of raw materials
determining the supply chain structure, concerned stakeholders, and social or environmental
impacts in each country. So this “context dependency” needs comprehensive frameworks
integrating all the involved dimensions, but at the same time having the possibility to be adapted
to the conditions of each country.
The present chapter aims to contribute to the body of knowledge regarding sustainability
analysis based on a systematic literature review, and to propose a framework to evaluate the
biodiesel supply chain. This framework must then allow decision makers to dispose of more
compressive tools to evaluate the sustainability of biodiesel support policies.
In order to do this, a systematic literature review methodology was applied in order to identify
relevant documents of this work. Thereafter, a descriptive analysis of the results and the selected
documents and their classification was accomplished. Based on these results, a new
sustainability assessment framework for biodiesel, named Triple Bottom Line Extended
(TBL+), was proposed. Then the application of the new assessment framework was carried out
for biodiesel production.
The new proposed framework integrates the biodiesel supply chain, the sustainability
dimensions, the principles, the criteria and the indicators. This implies that a hierarchical
approach can provide the necessary guidance in understanding and assessing the biodiesel
production system.
The biodiesel production sustainability dimensions included in the (TBL+) work were: social,
economic, environmental, political and technological. With this proposal, this work aims to
strengthen and expand sustainability assessments using a multidimensional view.
13 principles and 40 criteria proposed contribute to general sustainability assessment; the next
step will be to define a set of indicators for each criterion. The indicators should make possible
to assess a specific context of biodiesel production.

50 Sustainability assessment of biodiesel production in Colombia
Finally, the principles, criteria an indicators (PC&I) framework methodology requires two
stages: the first one is the proposal, based on the literature review, of the PC&I identification
presented in this chapter. The second stage is validating the PC&I framework by means of
expert consultation, which will be presented in the next chapter.

2. Chapter 2: Principles and criteria validation for
framework sustainability assessment of biodiesel
production
Introduction
Once the new hierarchical sustainability assessment framework was proposed (Chapter 1), it is
necessary its validation. In this chapter, that task through expert consultation is performed.
Expert consultation was selected because it has been used in the validation of conceptual models
and complex issues (van der Sluijs et al. 2005; Augusiak, Van den Brink, and Grimm 2014).
For this, expert survey consultations and a descriptive statistical analysis were implemented. In
order to define the principles and criteria importance, 62 experts answered an online survey
assessing three attributes: relevance, ease of measurement and reliability. The first result of the
validation analysis was the definition of a framework composed of five dimensions (social,
economic, environmental, political and technological), 13 principles and 31 criteria that would
be part of a sustainability assessment of biodiesel production. The second result was the
identification of potential groups and relationship between principles-criteria and criterion-
criterion represented through data visualization techniques. The validated framework provides
the basis to define future studies about interdimensional principles and criteria. Also, the
proposed sustainability assessment framework could be adapted and applied to biodiesel
production in specific contexts.
This chapter is structured as follows: In the first section, the hierarchical assessment framework
is described. Then, the second section presents the validation method, which includes expert
identification, online survey design and application, and the description of the statistics tools
applied to survey answers (measures of central tendency, dispersion of data, principal
component analysis and hierarchical ascendant classification). The third section shows the
expert profile by geographic region of experts, organization type and expertise area. The fourth
section presents the results of the expert consultation, the general analysis of graded dispersion,
the potential correlation between importance attributes and the experts’ profile, the hierarchical
ascendant classification of criteria and the potential attribute correlation of criteria by
sustainability dimension. Finally, section five presents the principles and criteria recommended,
52 Sustainability assessment of biodiesel production in Colombia
the comparison of the framework proposed in this work with other similar approaches, and the
potential groups and relationships between principles and criteria of different dimensions.
2.1 Hierarchical assessment framework
As described in Chapter 1, the hierarchical assessment framework was defined based on
comprehensive analysis of the state of the art. About 400 documents were reviewed and 113
documents were ultimately selected (Bautista et al. 2016). The document selection was carried
out through a deductive process including documents that incorporate biofuel sustainability
criteria and indicators, biofuel standards and policies, and a biofuel testing framework and
scorecard. Also, a condition for selection was that the documents had to consider at least the
traditional dimensions of sustainable development (social, economic and environmental). The
information sources employed were academic and research institutions, governmental and non-
governmental institutions involved in sustainability assessment of biodiesel, scientific
databases like Web of Science and Scopus, particularly the following journal databases:
American Chemical Society ACS, Science Direct, Springer Journal, and Nature.com.
The proposed hierarchical sustainability assessment framework consists of three levels, as
shown in Figure 1-8. The framework is composed in first level by the interaction between the
five sustainability dimensions and the biodiesel supply chain stages, which helped to identify
the principles for biodiesel production. The second level was made up of a set of sustainability
assessment criteria linked to each principle. These criteria were identified as a measurable
condition (qualitative or quantitative) aiming to assess how the sustainability principle was
applied to the biodiesel supply chain. Finally, in the third level, the indicators were established
to assess the characteristics or behaviors of each criterion (refer Figure 1-8 and Appendix 1).
The principles and criteria were defined in order to be applied regardless of the economic,
social, political or biogeographic context, the technological conditions, or the raw materials
used, among other aspects. Furthermore, to assess specific contexts, particularly conditions of
the biodiesel production system or scale, a set of indicators for each criterion should be defined.
Considering that the principles are the basis for defining the sustainability aspects of the
biodiesel supply chain in each dimension, if the principles are validated, the dimensions linked
to each principle will be validated as well. With regards to criteria, these are the measurable
conditions that establish the level of application of the principles, and each criterion is evaluated
by a set of indicators; if the criteria are validated, each criterion will determine the indicators

Chapter 2 53
definition. Thus, the validation strategy focused on the principles and criteria that will make
part of the sustainability assessment framework of biodiesel production.
2.2 Validation method of sustainability assessment principles and
criteria for biodiesel production
Expert consultation was selected as the validation method of sustainability assessment
principles and criteria for biodiesel production, because of its applicability in the validation of
conceptual models and complex issues and the fact it is used by other authors in sustainability
biofuel assessment, presented in the validation of sustainability biofuel framework (Brent and
Musango 2013). As well as in the work to define the future biodiesel perspectives (Fiorese et
al. 2013; Tickner 2013; Barrett 2011), and to assess the environmental degradation linked to
biofuel production from stakeholder consultation (Vermeulen and Cotula 2010; Bisaro et al.
2014).
In order to validate the proposed framework, in which the five dimensions are composed by 13
principles and 40 criteria previously identified (refer Appendix 1 and Bautista, 2016), a
validation strategy was implemented following six steps: (1) expert identification, (2) survey
design, (3) survey application, (4) descriptive statistics analysis, (5) selection of sustainability
assessment principles and criteria for biodiesel production and (6) data visualization technique.
The validation process is shown in Figure 2-1, and subsequently each step is described.
2.2.1 Expert identification
Sources of expert identification
Experts were identified through a screening of the community involved in biodiesel production
and its sustainability assessment through the papers published in peer-reviewed journals,
conference participation lists, and members of institution and industry such as World Energy
Council, Green chemistry development institute, WIP Renewable Energies, or government
institutions of Brazil, Argentina, Colombia, Chile, India, among others. Each expert was
identified as having expertise with sustainability assessment of biodiesel production.
In this work four types of expert were identified according to the following definition. An
industrial expert is a person who has worked in industrial biodiesel production processes for a
period equal or longer than five years. A government expert is a person who has worked in

54 Sustainability assessment of biodiesel production in Colombia
governmental institutions that develop policies, laws or politics about biofuels. In the same way,
a non-governmental expert is a professional who has worked on biofuels related topics,
especially in areas linked to sustainable production. Governmental and non-governmental
experts are characterized by their participation as key-speaker in congress and other academic
events, and as international or national consultant. A university or research expert is a
professional who had published at least 5 papers in peer reviewed journal, and these papers had
been cited at least 10 times.
Figure 2-1. Validation Method of Sustainability Assessment Principles and Criteria for Biodiesel Production
Definition of expert profile
This work identified key areas to be taken into account about the expert profile, initially the
nationality and type of organization with which the expert was affiliated (from industry,
government, non-governmental institutions, universities or research centers). After this,

Chapter 2 55
expertise areas were identified for each professional (knowledge and experience), such as
social, economic, political, technological and environmental associated with sustainability
dimensions of biodiesel production.
2.2.2 Survey design
Attributes of the importance and classification range
Sustainability assessment importance was defined as the impact of each principle and criterion
on the assessment. The importance was the average value of three attributes: relevance, ease of
measurement and reliability. The grading scale was null (0), low (1), moderate (2) and high (3);
the attributes were defined as follows:
Relevance: Measures the level of significance and pertinence of the criterion in the
sustainability assessment of biodiesel.
Ease of measurement: Measures the level of accessibility to information and the ability
to perform the measurement of the criterion.
Reliability: Measures how credible or certain the results of the measurement for the
criterion are.
The importance was calculated using Equation 2-1. Subsequently, the principles and criteria
were classified, taking into account the computed value of importance and using the grading
scale shown in Table 2-1.
Equation 2-1. � � = ∑ � �+� �+� � � � ��
Where: “i ” is the principle or criteria. Table 2-1. Importance grading scale of principles and criteria
Importance Grading scale High 2.4-3.0
Moderate 1.8-2.3 Low 0.8-1.7 Null 0-0.7
Survey structure
The survey form was structured by multiple-choice questions about the level of importance
(relevance, ease of measurement and reliability) of each principle and criteria. Then, the
questions were written and translated into three languages (English, Spanish and French). The

56 Sustainability assessment of biodiesel production in Colombia
survey was sent together with a presentation letter to the experts, in which the goals, grading
scale of the principles and criteria of sustainable assessment of biodiesel production were
explained in detail. Finally, a pilot survey test was applied, enabling survey improvement.
2.2.3 Survey application
Surveys were e-mailed during July 2014 to 310 experts previously identified. A month later, a
survey reminder was sent. During the following two months, the survey answers were received
and tabulated.
2.2.4 Descriptive statistics analysis
A statistical analysis of the results of the survey answers was conducted. Initially, techniques
such as central tendency measures and variability or dispersion measures were used, and
subsequent multivariate data analyses were applied (Principal Components Analysis -PCA and
Hierarchical Ascendant Classification -HAC). The algorithm of descriptive statistical analysis
is shown in Figure 2-2 and the tools are described below.
Dispersion and correlation measurements
The dispersion and correlation techniques applied to the importance attributes graded
(relevance, ease of measurement and reliability) were the correlation matrix, scatter plot and
box plot. Initially it was applied the correlation matrix, which is a symmetric matrix where the
variables are horizontally and vertically equal. In this case, the variables are the importance
attributes. The matrix measures the level of corresponding correlation between each pair of
attributes through the coefficient called σ. The σ is expressed by a number ranging from 0 to 1,
a value of 0, indicates that no correlation is observed (Hastie, Tibshirani, and Friedman 2009).
Afterwards, a scatter plot was used because it can suggest different correlations between
importance attributes with a certain confidence interval. In addition, it is possible to show linear
and nonlinear relationships between attributes. The correlations may be positive (rising),
negative (falling), or null (uncorrelated). A line of best fit (alternatively called ‘tend-line’) can
be drawn in order to study the correlation between the variables. Finally, a box plot was applied,
which is a graph based on quartiles, whereby a data set is displayed. It consists of a rectangle,
the “box” and two arms, “whiskers” that provide information about the minimum and maximum

Chapter 2 57
values, the quartiles Q1, Q2 and Q3 or medium, and the existence of outliers and symmetry of
the distribution (Hastie, Tibshirani, and Friedman 2009).
Figure 2-2. Algorithm of descriptive statistics analysis
Multivariate data analysis
In the study of the answers given by the experts, two types of multivariate analysis data tools
were used. The first tool is a Principal Components Analysis (PCA), which delivers a graphical
representation of the data according to two principal axes (Syms 2008). PCA defines the
principal axes regarding different variables. In this case, it studied on one hand the relevance,
the ease of measurement and the reliability of the criteria considered and on the other hand, the
experts’ profile (nationality, area of expertise and organization type). The role of the PCA is at
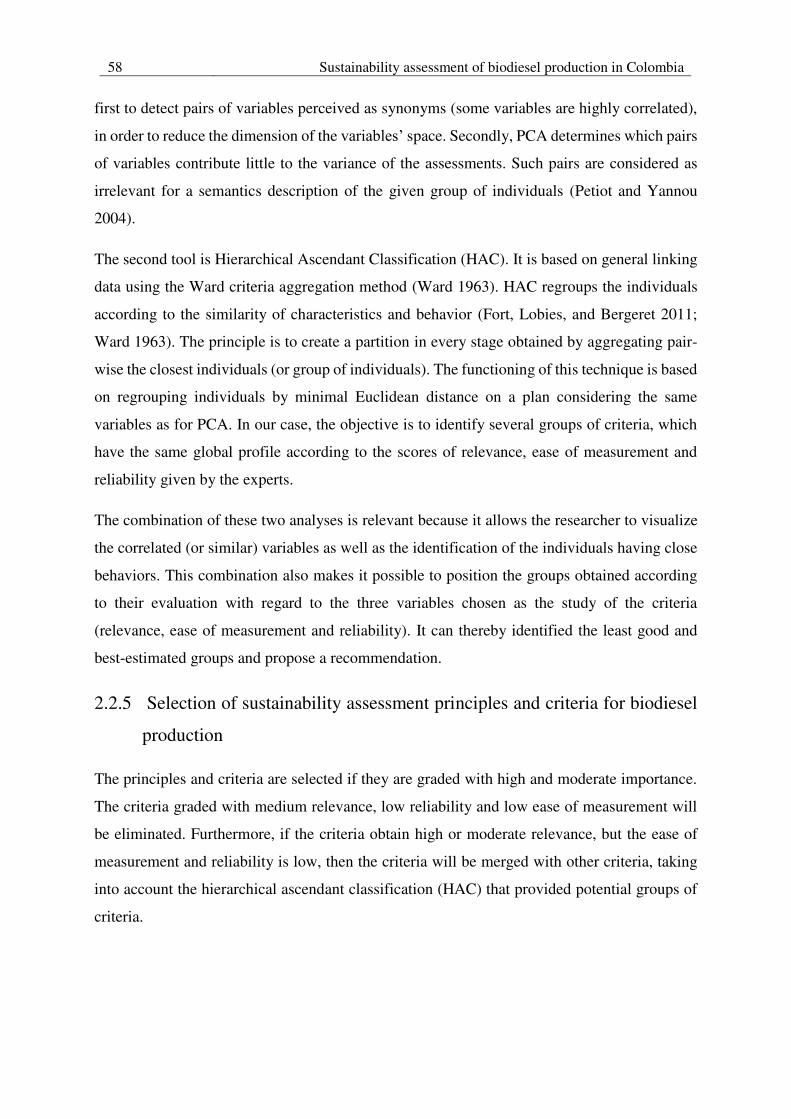
58 Sustainability assessment of biodiesel production in Colombia
first to detect pairs of variables perceived as synonyms (some variables are highly correlated),
in order to reduce the dimension of the variables’ space. Secondly, PCA determines which pairs
of variables contribute little to the variance of the assessments. Such pairs are considered as
irrelevant for a semantics description of the given group of individuals (Petiot and Yannou
2004).
The second tool is Hierarchical Ascendant Classification (HAC). It is based on general linking
data using the Ward criteria aggregation method (Ward 1963). HAC regroups the individuals
according to the similarity of characteristics and behavior (Fort, Lobies, and Bergeret 2011;
Ward 1963). The principle is to create a partition in every stage obtained by aggregating pair-
wise the closest individuals (or group of individuals). The functioning of this technique is based
on regrouping individuals by minimal Euclidean distance on a plan considering the same
variables as for PCA. In our case, the objective is to identify several groups of criteria, which
have the same global profile according to the scores of relevance, ease of measurement and
reliability given by the experts.
The combination of these two analyses is relevant because it allows the researcher to visualize
the correlated (or similar) variables as well as the identification of the individuals having close
behaviors. This combination also makes it possible to position the groups obtained according
to their evaluation with regard to the three variables chosen as the study of the criteria
(relevance, ease of measurement and reliability). It can thereby identified the least good and
best-estimated groups and propose a recommendation.
2.2.5 Selection of sustainability assessment principles and criteria for biodiesel
production
The principles and criteria are selected if they are graded with high and moderate importance.
The criteria graded with medium relevance, low reliability and low ease of measurement will
be eliminated. Furthermore, if the criteria obtain high or moderate relevance, but the ease of
measurement and reliability is low, then the criteria will be merged with other criteria, taking
into account the hierarchical ascendant classification (HAC) that provided potential groups of
criteria.

Chapter 2 59
2.2.6 Data visualization of principles and criteria selected
The data visualization techniques permit better comprehension of relationships and potential
correlations between the three levels of hierarchical sustainability assessment framework
proposed (dimensions, principles and criteria). Afterwards, it is possible to identify central
nodes in which it connects principles and criteria of different sustainability dimensions.
2.3 Results
2.3.1 Expert profile description
As a result of the expert consultation described in section 2.1, 310 experts accomplished the
profile defined. Although all the experts were contacted, 62 of them answered the survey. After
that, the analysis of the profile was conducted as explained in section 2.2.1.
Geographic region of the experts: The 62 experts that answered the survey are from 20
different countries and their nationalities were classified by region as shown in Figure
2-3. The largest number of experts belongs to the region of Latin America and the
Caribbean (68%), the second expert group belongs to the European region (21%), and
a small number of experts are from the regions of Asia, North America and Africa.
Figure 2-3. Number of experts by geographic region
Experts by organization type: As can be seen in Figure 2-4, most of the experts were in
connection with universities and research institutes (68%), followed by the experts
associated with government institutions and industries.

60 Sustainability assessment of biodiesel production in Colombia
Figure 2-4. Percentage of experts by type of organization
Experts by expertise area: As Figure 2-5 shows, a wide variety of combinations was
observed in the areas of expertise of the professionals consulted; 42% of the experts
were linked with one or more expertise areas. 24% of the experts were related to the
areas of environmental-technological, and 23% were only in the technological area.
11% of the specialists declared expertise in the five areas and 61% working in two or
more areas, while 39% were regarded as authorities in one area. The participation of
experts from multiple expertise areas was favorable for this research because it brings
multiple points of view.
Figure 2-5. Proportion of the experts by expertise area
2.3.2 Principles statistics analysis
The average value of the three attributes graded (relevance, ease of measurement and reliability)
for each principle and criterion was statistically significant based on the algorithm shown in
Figure 2-2.

Chapter 2 61
Principles - General analysis dispersion
The use of average values in the subsequent statistics analysis was possible. The attribute
grading of principles is shown in Table 2-2, the description of each principle is present in
Appendix 1. As explained in Table 2-1 the importance given by the experts to principles was
considered as high, if the average value was between 2.4 and 3.0. The principles with high
variation coefficients were the same principles that obtained moderate importance grades (P5-
Biodiesel promotion policy, P2-Social acceptability and P8-Economic viability). The principles
associated with technological and environmental dimensions presented lower variation
coefficients and graded with high importance, indicating a great deal of agreement in the grades
given by experts (refer Figure 2-6).
Table 2-2. Grading averages of principles’ importance
Sustainability
Dimension Principles
Importance
Grad
Nul
l
Low
Mod
.
Hig
h
Social
P1: Respect property and land tenure 2.7 P2: Social acceptability 2.4 P3: Promote responsible work conditions 2.7 P4: Prevent alteration to food supply 2.6
Political
P5: Relationship between national and international biodiesel promotion policies 2.1 P6: National biodiesel production in consistency with international environmental policies
2.6
P7: Promote commitment to ethics and transparency 2.8 Economic P8: Economic viability 2.6
Technological P9: Technology used promotes efficiency and reduction of negative environmental impact
2.8
Environmental
P10: Maintain or improve the air, soil and water quality 2.9 P11: Positive balance of greenhouse gas 2.7 P12: Promote the conservation and protection of biodiversity 2.8 P13: Energy efficiency and use of renewable energy 2.8

62 Sustainability assessment of biodiesel production in Colombia
Figure 2-6. Principles importance, average and variation coefficient (Cv)
Principles- Principal component analysis
The results of the Principal Component Analysis (PCA) set forth the potential correlation
between the principles’ importance and the expert profile and are shown in Figure 2-7. By
combining the loading plots1, it was possible to conclude that the principle importance grading
scale does not depend on the type of organization the expert works with. Indeed, according to
the PCA rules, all these variables are orthogonal, so there was no correlation between them.
Figure 2-7. PCA loading plots concerning the type of organization
1 The loading plot is a plot of the relationship between the original variables and the subspace dimension. It is used to interpret relationships between variables.

Chapter 2 63
2.3.3 Criteria statistical analysis
The average value of the three attributes graded (relevance, ease of measurement and reliability)
for each principle and criterion was statistically significant based on the algorithm shown in
Figure 2-2.
Criteria - General analysis dispersion
The average value of each attribute graded was used in the subsequent statistics analysis
because each average grading obtained an absolute error less than the maximum error absolute
with a statistical confidence level of 95% (refer statistical algorithm in Figure 2-2). The attribute
grading of principles is shown in Table 2-3, and the description of the criteria are presented in
Appendix 1.
Table 2-3. Average grading criteria for attribute
Criteria
Relevance Ease of measurement Reliability Importance
Gra
d
Nul
l
Low
Mo
d.
Hig
h
Gra
d
Nul
l
Low
Mod .
Hig
h
Gra
d
Nul
l
Low
Mo
Hig
h
Gra
d
Nul
l
Low
Mod
Hig
h
Soci
al D
imen
sion
C1-Rights of land access 2.7 1.9 1.7 2.1
C2-Land conflicts 2.6 1.5 1.6 1.9
C3-National energy security 2.5 2.0 2.0 2.2
C4-Environmental noise 1.9 2.0 1.8 1.9
C5-Changes in landscape - visual impacts 1.8 1.6 1.6 1.6
C6-Local prosperity 2.6 1.9 1.9 2.1
C7-Health & safety – employees 2.8 2.3 2.2 2.4
C8-Labor laws 2.9 2.2 2.2 2.4
C9-Food supply 2.6 1.9 1.8 2.1
C10-Biomass local uses 2.1 1.5 1.5 1.7
Pol
itic
al D
imen
sion
C11-Subsidy scheme 1.8 2.0 1.8 1.9
C12-Advanced biodiesel promotion 1.7 1.9 1.9 1.8
C13-Agreement biodiesel blend-diesel 1.7 2.3 2.1 2.0
C14-National capability in biodiesel research 2.2 1.9 1.9 2.0
C15-Biomass no edible for biodiesel 2.4 y 1.9 1.8 2.0
C16-National amount of land suitable 2.6 1.9 1.9 2.2
C17-Emision condition GHE 2.5 1.8 1.8 2.0
C18-Ethical commitment 2.4 1.4 1.5 1.7
C19-Compliance with local laws 2.3 1.3 1.4 1.7
Eco
nom
ic D
imen
sion
C20-Influence oil market/biodiesel 2.4 2.1 2.0 2.2
C21-Influence diesel market/biodiesel 2.5 2.3 2.1 2.3
C22-Production biodiesel 1a gen./biodiesel 2.2 2.4 2.3 2.3
C23-Influence vegetable oil market/biodiesel 2.6 2.2 2.2 2.3
C24- Influence glycerol market/biodiesel 2.1 2.2 2.1 2.1
C25-Influence advanced biodiesel Market/biodiesel
2.2
2.0
2.0
2.0
Tec
hnol
ogic
al
C26-Influence advanced biodiesel Market/veg. Oil
2.6
1.8
1.8
2.1
C27-Influence advanced biodiesel Techno/cost
2.4
1.9
1.9
2.1

64 Sustainability assessment of biodiesel production in Colombia
Criteria
Relevance Ease of measurement Reliability Importance
Gra
d
Nul
l
Low
Mo
d.
Hig
h
Gra
d
Nul
l
Low
Mod .
Hig
h
Gra
d
Nul
l
Low
Mo
Hig
h
Gra
d
Nul
l
Low
Mod
Hig
h
C28-Influence engin trends 2.3 2.1 2.1 2.2
C29-Influence technological learning/cost 2.3 1.8 1.8 2.0
Env
iron
men
tal D
imen
sion
C30-Air quality 2.8 2.2 2.0 2.3
C31-Efficient use of water 2.8 2.1 2.1 2.4
C32-Local water quality 2.9 2.3 2.2 2.4
C33-Wastes-managed responsibly 2.8 2.3 2.2 2.4
C34-Soil quality 2.8 2.0 1.9 2.2
C35-Greenhouse gas 2.6 1.8 1.8 2.1
C36-Transformation-natural ecosystems 2.6 1.8 1.8 2.1
C37-Influence fragile ecosystems 2.8 2.0 2.0 2.2
C38-Influence wildlife 2.8 1.9 1.9 2.2
C39-Energy used 2.4 2.0 2.0 2.1
C40-Energy savings 2.2 2.1 2.0 2.1
For criteria explanations, refer Appendix 1. A high average marking indicates more relevance, ease of measurement, reliability and finally importance criterion.
Overall, the criteria importance averages were between 1.6 and 2.4. The highest graded were in
environmental criteria, and the lowest marked were in political criteria. Regarding the variation
coefficient, the highest values are for social and political criteria, and the lowest for
environmental criteria. This behavior shows that there is major disagreement in what experts
graded about the importance of social and political criteria as shown in Figure 2-8.
Figure 2-8. Criteria importance, average and variation coefficient (Cv).
Correlation matrix (Table 2-4) showed that there was high correlation (0.97) between the
attributes ease of measurement and reliability, whereas the correlation was very low (0.23)
between relevance and reliability, as well as between ease of measurement and relevance (0.15).

Chapter 2 65
Table 2-4. Correlation matrix between criteria attributes Reliability Ease of measurement Relevance Reliability 1.0 Ease of measurement 0.97 1.0 Relevance 0.23 0.15 1.0
Figure 2-9 shows simultaneously the scatter plot and box plot. In the scatter plot, the data
distributions that shown higher asymmetry were those of the relationship between relevance-
reliability and relevance-ease for measurement (Figure 2-9, A and B); thus, the correlations
between relevance and these other two attributes were low. Furthermore, the data distribution
that shows lowest asymmetry was in the relationship between relevance-ease of measurement
(Figure 2-9, C), hence its correlation was high.
The box plot analysis is shown close to the axis in Figure 2-9. It was observed that by attribute,
the relevance obtained the highest mean values compared to the other two attributes.
Additionally, the box-plot analysis drew attention to the unusually low ease of measurement of
criterion 19. Criterion 19 was part of the political dimension and deals with the perception level
of the local community about the commitment to transparency and compliance with local laws.
Figure 2-9. A: Scatter plot and box plot of correlation between criteria attributes (relevance and reliability)
1.6 1.8 2.0 2.2
1.8
2.0
2.2
2.4
2.6
2.8
Reliability
Rele
vance
13
5
19
12
18
22
10
8
11
33
1.4 1.6 1.8 2.0 2.2
1.8
2.0
2.2
2.4
2.6
2.8
Ease.of.measurement
Rele
vance
13
19
5
18
12
2
10
11
22
8
1.4 1.6 1.8 2.0 2.2
1.6
1.8
2.0
2.2
Ease.of.measurement
Relia
bili
ty
19 18
13
11
2
1
10
22
21
8

66 Sustainability assessment of biodiesel production in Colombia
Figure 2-9. B: Scatter plot and box plot of correlation between criteria attributes (relevance and ease of measurement)
Figure 2-9. C:Scatter plot and box plot of correlation between criteria attributes (reliability and ease of measurement)
Criteria - Principal Component Analysis (PCA)
In order to analyze the criteria another PCA was conducted. The objective of this analysis was
to identify the potential correlations between the collected data. First, the expert profile was
analyzed. Figure 2-10 shows the PCA loading plots of the geographical areas of the experts
compared with the three attributes: relevance (R), ease of measure (EM) and reliability (Re).
In the first loading plot (Figure 2-10, A), it can be seen that geographical regions of Latin
America and the Caribbean, Europe, as well as the attributes reliability-R and ease of measure-
EM are well represented, since the spots indicating these variables were very close to the border
of the circle. The relevance-R attribute was also well represented but not as clearly as the two
other attributes. Therefore, Figure 2-10-A puts forward that the geographical regions of Latin
America and the Caribbean and Europe were not correlated with the three attributes (R, EM,
and Re) because they were orthogonal to each other. Another result was that the ease of
measurement attribute and the reliability attribute were very close on the loading plot, which
means the two attributes are correlated. In the second loading plot (Figure 2-10, B) one can see
that the Asia geographical region was also orthogonal to the attributes. However, the same
cannot be concluded about North America because this variable was not well represented. In
conclusion, the loading plots presented highlighting the experts’ geographical region did not
seem to be correlated with the attributes (R, EM and Re). In this sense, the grading done by the
experts does not depend on their geographical origin.
A. B.
Figure 2-10. PCA loading plot concerning the geographical sector of the experts
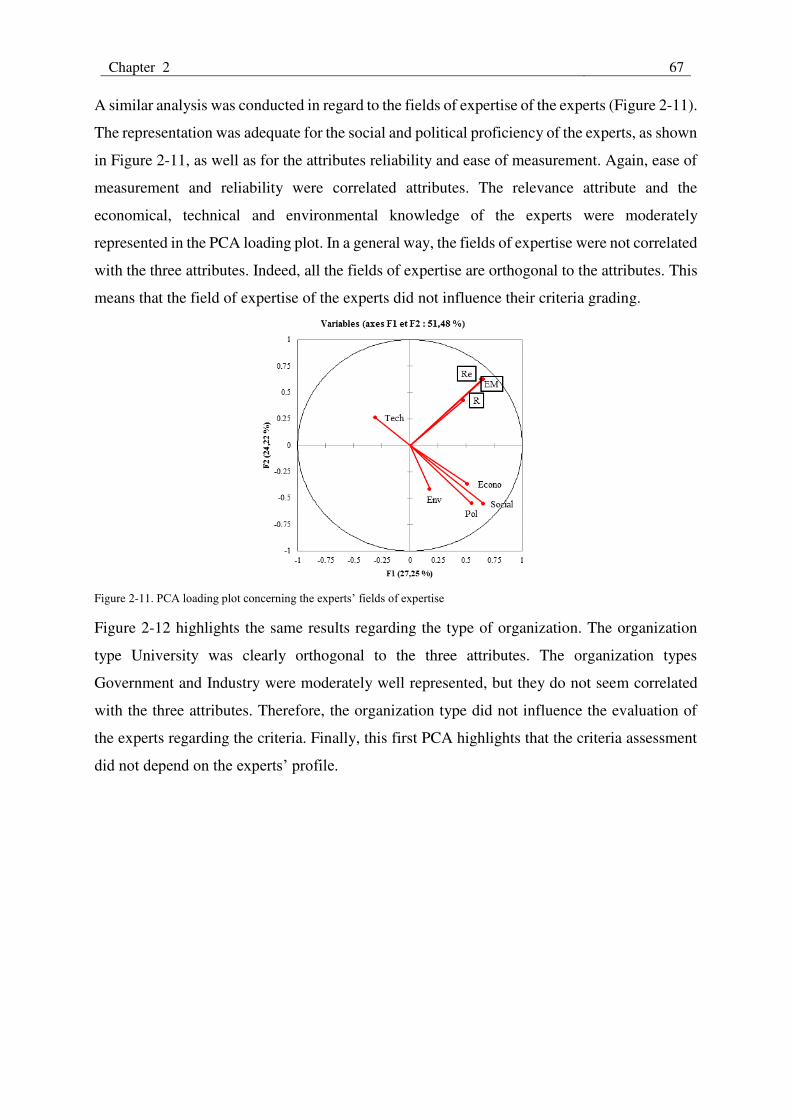
Chapter 2 67
A similar analysis was conducted in regard to the fields of expertise of the experts (Figure 2-11).
The representation was adequate for the social and political proficiency of the experts, as shown
in Figure 2-11, as well as for the attributes reliability and ease of measurement. Again, ease of
measurement and reliability were correlated attributes. The relevance attribute and the
economical, technical and environmental knowledge of the experts were moderately
represented in the PCA loading plot. In a general way, the fields of expertise were not correlated
with the three attributes. Indeed, all the fields of expertise are orthogonal to the attributes. This
means that the field of expertise of the experts did not influence their criteria grading.
Figure 2-11. PCA loading plot concerning the experts’ fields of expertise
Figure 2-12 highlights the same results regarding the type of organization. The organization
type University was clearly orthogonal to the three attributes. The organization types
Government and Industry were moderately well represented, but they do not seem correlated
with the three attributes. Therefore, the organization type did not influence the evaluation of
the experts regarding the criteria. Finally, this first PCA highlights that the criteria assessment
did not depend on the experts’ profile.

68 Sustainability assessment of biodiesel production in Colombia
Figure 2-12. PCA loading plot concerning the type of organization
Criteria: Hierarchical ascendant classification
Hierarchical Ascendant Classification (HAC) was carried out on all the criteria submitted to
grading. The classification objective was to highlight some potential groups of criteria. The
HAC dendogram is shown in Figure 2-13. Hierarchical ascendant classification permitted the
identification of seven criteria groups. The characteristics of each group are shown in Table
2-5; in general, six of seven criteria groups show high and moderate importance to be part of
the sustainability assessment framework.
Figure 2-13. Dendogram of the HAC concerning the criteria
Table 2-5. Characteristics of criteria groups Dimensions Criteria Relevance Ease of measurement Reliability

Chapter 2 69
Soc
ial
Pol
itic
al
Eco
nom
ic
Tec
hnol
ogic
al
Env
iron
men
tal groups
Nul
l
Low
Mod
.
Hig
h
Nul
l
Low
Mod
.
Hig
h
Nul
l
Low
Mod
.
Hig
h
Group 1 Group 2 Group 3 Group 4 Group 5 Group 6 Group 7
Criteria: potential attribute correlation by sustainability dimension
In order to obtain a higher level of precision, a PCA was conducted according to each
sustainability dimension. The objective of this PCA was to propose a criteria representation
belonging to one dimension in relation to the three attributes (relevance, ease of measure and
reliability).
The results of this analysis were reflected in a point cloud plot representing the criteria of the
considered dimension according to three axes representing the attributes. For all the
dimensions, the two attributes ease of measurement and reliability seem to be highly correlated.
Thus, they could be thought to represent a single axis.
Concerning the social dimension (Figure 2-14), the analysis makes possible to identify the
better and the worse criteria for each attribute. The most relevant criterion seems to be C1s
(rights of land access), and the less relevant is C5s (undesirable visual impacts). The most
reliable and easy to measure criteria were C7s, health and safety for employees, and C8s, respect
of labor laws, and the less reliable was C10s, prevent alteration to biomass production for
traditional local uses.
Figure 2-14. Point cloud of the social dimension
Regarding the political dimension (Figure 2-15), the most relevant criterion seems to be C16,
national amount of land suitable for biomass, and the less relevant was C12, advanced biodiesel

70 Sustainability assessment of biodiesel production in Colombia
promotion. The most reliable and easy to measure criterion was C13, agreement between
national and international biodiesel blend-diesel, and the least were C18, ethical commitment
and transparency, and C19, compliance with local laws. Concerning this dimension, it was
important to note that the most reliable and easy to measure criterion (C13) was part of the least
relevant criteria.
Figure 2-15. Point cloud of the political dimension
Concerning the economical dimension (Figure 2-16), the most relevant criterion was C23,
influence of vegetal oil production on biodiesel production, and the least relevant was C24
influence of glycerol market on biodiesel production. The most reliable and easy to measure
criterion was C22, annual production of first generation biodiesel, and the least reliable and
most difficult to measure was C25, influence of advanced biodiesel market on first generation
biodiesel production. In this dimension, the most reliable and easy to measure criterion (C22)
was also part of the least relevant criteria.
Figure 2-16. Point cloud of the economical dimension
With respect to the technological dimension (Figure 2-17), the most relevant criterion was C26,
influence of advanced biodiesel production on vegetable oil market, and the least relevant was
C29 development, and influence of technological learning on biodiesel production. The most
reliable and easy to measure criterion was C28, influence of technology trends engines on
biodiesel production, and the least reliable was C26. In this dimension, the most relevant

Chapter 2 71
criterion (C26) was also the least reliable and the least easy to measure. Criterion C29 was also
the least relevant criterion and was among the less reliable and less easy to measure.
Figure 2-17. Point cloud of the technological dimension
Finally, in the environmental dimension (Figure 2-18), many criteria were moderately relevant
but none was the most relevant. However, the least relevant criterion was C40 energy savings
in biodiesel production. The most reliable and easy to measure criteria were C32 local water
quality and C33 waste management responsibility and the most difficult to measure were C35
amount of greenhouse gas captured and C36 influence biodiesel production on transformation
natural ecosystems.
Figure 2-18. Point cloud of the environmental dimension
2.4 Selection of sustainability assessment principles and criteria
The average grading of sustainability assessment principles is shown in Table 2-2. 15% of the
principles were graded as moderate importance, and 85% as high importance. Thus, all
principles were recommended for the sustainability assessment framework. The higher
importance grade was obtained by environmental principle P10 (maintains or improves air, soil
and water quality), and the lowest importance grade was the political principle P5, relationship
between national and international biodiesel promotion policies.
Regarding the result in Table 2-3, 73% of the sustainability criteria obtained high relevance and
27% moderate relevance. Therefore, the criteria graded with medium relevance, low reliability

72 Sustainability assessment of biodiesel production in Colombia
and low ease of measure were eliminated: C4s-Environmental noise, C5s-Changes in landscape
generating undesirable visual impacts and C10s-prevent alteration to biomass production for
traditional local uses.
Furthermore, seven criteria obtained high or moderate relevance, but the ease of measurement
and reliability were low. Then, their use in sustainability assessment framework of biodiesel
production was not confirmed. The criteria in doubt were: C11p-Subsidy scheme, C12p-
Advanced biodiesel promotion, C18p-Ethical commitment, C2s-Conflicts over land use, C19p-
Compliance with local laws, C14p-National capability in biodiesel research. Therefore, these
criteria were merged with other criteria, taking into account the hierarchical ascendant
classification (HAC) that provided potential groups of criteria. In short, 13 principles and 31
criteria were recommended to become part of the sustainability assessment framework, as
shown in Table 2-6.
Table 2-6. Sustainability assessment criteria recommended
Dimension Principle Criteria
Social
P1: Respect property and land tenure
C1s-Rights of land access
P2: Social acceptability C3s-National energy security C6s-Local prosperity
P3: Promote responsible work conditions
C7s-Health & safety - employees C8s-Labor laws
P4: Prevent alteration to food supply
C9s-Food supply
Political
P5: Relationship between national and international biodiesel promotion policies
C13p-Agreement national/international biodiesel blend-diesel + C11p-Subsidy scheme + C12p-Advanced biodiesel promotion
P6: National biodiesel production consistent with international environmental policies
C15p-Biomass no edible for biodiesel production C16p-National amount of land suitable for biomass C17p-Emision condition GHE
P7: Promote commitment to ethics and transparency
Economic P8: Economic viability
C20ec-Influence oil market/biodiesel C21ec-Influence diesel market/biodiesel C22ec-Production biodiesel 1a gen./biodiesel + C18p-Ethical commitment + C2s-Land conflicts C19p-Compliance with local laws C23ec-Influence vegetable oil market/biodiesel C24ec-Influence glycerol market/biodiesel C25ec-Influence advanced biodiesel Market/biodiesel
Technological P9: Technology used promote efficiency and reduction of negative environmental impact
C26t-Influence advanced biodiesel Market/veg. Oil C27t-Influence advanced biodiesel Techno/cost C28t-influence technologie trends engins /biodiesel C29t-Influence technological learning/cost + C14p-National capability in biodiesel research
Environmental P10: Maintain or improve air, soil and water quality
C30en-Air quality C31en-Efficient use of water C32en-Local water quality C33en-Wastes-managed responsibly C34en-Soil quality
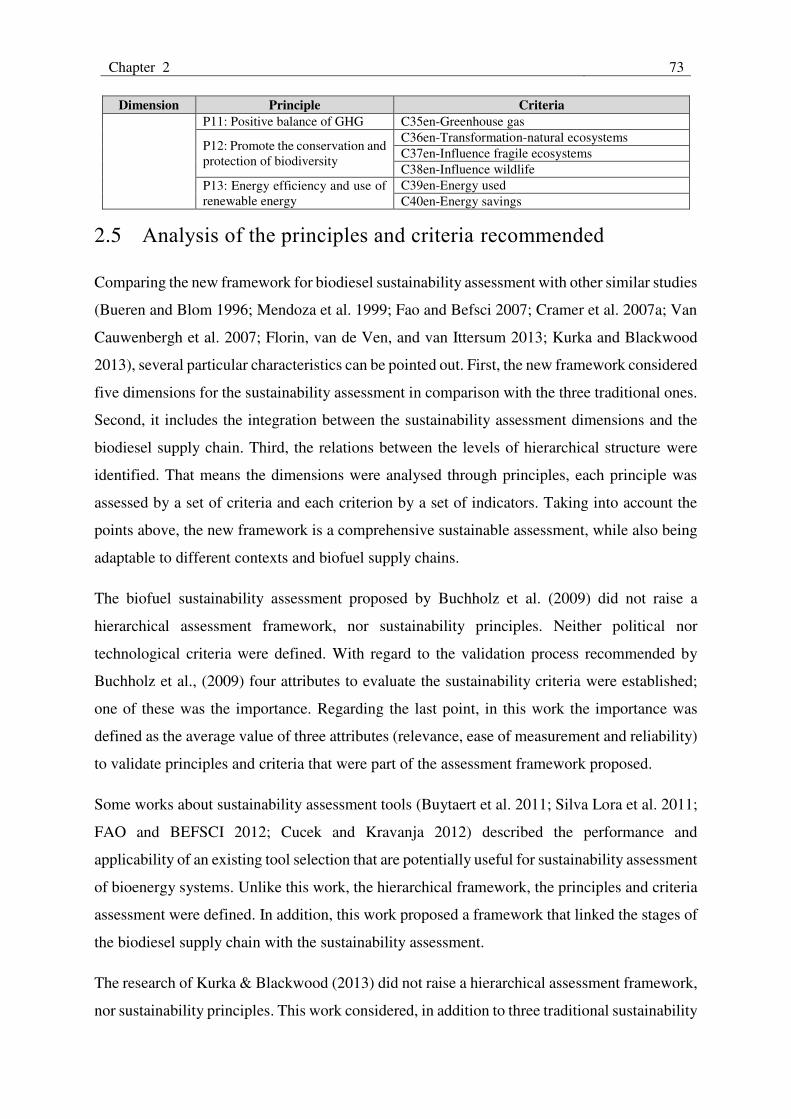
Chapter 2 73
Dimension Principle Criteria P11: Positive balance of GHG C35en-Greenhouse gas
P12: Promote the conservation and protection of biodiversity
C36en-Transformation-natural ecosystems C37en-Influence fragile ecosystems C38en-Influence wildlife
P13: Energy efficiency and use of renewable energy
C39en-Energy used C40en-Energy savings
2.5 Analysis of the principles and criteria recommended
Comparing the new framework for biodiesel sustainability assessment with other similar studies
(Bueren and Blom 1996; Mendoza et al. 1999; Fao and Befsci 2007; Cramer et al. 2007a; Van
Cauwenbergh et al. 2007; Florin, van de Ven, and van Ittersum 2013; Kurka and Blackwood
2013), several particular characteristics can be pointed out. First, the new framework considered
five dimensions for the sustainability assessment in comparison with the three traditional ones.
Second, it includes the integration between the sustainability assessment dimensions and the
biodiesel supply chain. Third, the relations between the levels of hierarchical structure were
identified. That means the dimensions were analysed through principles, each principle was
assessed by a set of criteria and each criterion by a set of indicators. Taking into account the
points above, the new framework is a comprehensive sustainable assessment, while also being
adaptable to different contexts and biofuel supply chains.
The biofuel sustainability assessment proposed by Buchholz et al. (2009) did not raise a
hierarchical assessment framework, nor sustainability principles. Neither political nor
technological criteria were defined. With regard to the validation process recommended by
Buchholz et al., (2009) four attributes to evaluate the sustainability criteria were established;
one of these was the importance. Regarding the last point, in this work the importance was
defined as the average value of three attributes (relevance, ease of measurement and reliability)
to validate principles and criteria that were part of the assessment framework proposed.
Some works about sustainability assessment tools (Buytaert et al. 2011; Silva Lora et al. 2011;
FAO and BEFSCI 2012; Cucek and Kravanja 2012) described the performance and
applicability of an existing tool selection that are potentially useful for sustainability assessment
of bioenergy systems. Unlike this work, the hierarchical framework, the principles and criteria
assessment were defined. In addition, this work proposed a framework that linked the stages of
the biodiesel supply chain with the sustainability assessment.
The research of Kurka & Blackwood (2013) did not raise a hierarchical assessment framework,
nor sustainability principles. This work considered, in addition to three traditional sustainability

74 Sustainability assessment of biodiesel production in Colombia
dimensions, the technical dimension. The focus of this document was to identify sustainability
criteria and indicators and their validation linked to a case study. Finally, Florin et al. (2013)
proposed sustainability principles and criteria to small farmers of biomass biodiesel production;
it was emphasized to indicate definition, and did not take into account the technological
dimension.
In the assessment framework definition of this work, the existence of a horizontal consistency
was considered. This means that principles or criteria appearing at the same level do not have
any overlap. Regarding the horizontal relationship between criteria, the Hierarchical Ascendant
Classification (HAC), seven potential groups of 40 criteria were identified (Figure 2-13); in
each group there were criteria linked to different sustainability dimensions. After applying the
validation strategy, 13 principles and 31 criteria were proposed (Table 2-6).
2.6 Data visualization technique of principles and criteria
With the aim to visualize the relationships between the five sustainable assessment dimensions,
the 13 sustainable principles and the 31 assessment criteria, a display of data in visualization
technique (graph drawing2) was applied (Figure 2-19). The graph drawing is a data visualization
technique that allows better representation of heterogeneous information, multi-dimensional
data, importance and correlation between data.
In the graph drawing, nodes represent principles and criteria, and edges represent relations
between nodes. The node size represented the importance average grading. A force-directed
algorithm was applied that combines a multilevel approach which overcomes local minimums,
with techniques such as approximates-short and long-range force (Hu 2005). In the network,
the nodes with more connections were located in central areas, and these central nodes tend to
have bigger influence on the other nodes. Furthermore, greater proximity between nodes was
indicative of similar or equal importance between nodes and, in turn, of node groups on the
network.
Three central nodes (CN) were identified whose visualization is shown in Figure 2-19. The first
central node (CN1) includes the political, social and technological principles and criteria, and
2 Graph drawing is an area of mathematics and computer science combining methods from geometric graph theory. The basic graph drawing is given a set of nodes with a set of edges (relations); calculate the position of the nodes and the curve to be drawn for each edge. It requires the definition of properties and classification of layout according to the types of graphs to which they can applied (Herman et al. 2000).

Chapter 2 75
only two environmental ones. In general, in this central node the importance grading was
between moderate and high. In addition, it was observed that the most central nodes were the
political criterion C17 about policy conditions by greenhouse gas emissions in the life cycle of
biodiesel production, and technological criterion C26 regarding the influence of the advanced
biodiesel market on the vegetable oil market. Furthermore, greater proximity between social
and environmental criteria nodes was identified, because such criteria obtained equal
importance grading.
The second central node (CN2) is related, mainly, to environmental principles and criteria.
However, two social criteria and two economic criteria are included. Overall, the highest
importance grading was given to the principles and criteria of this central node. It was identified
that the principle P10 about maintaining and improving air, soil and water quality, was the most
central node in this group, because it was graded with the highest importance, like their related
criteria.
Finally, the third central node (CN3) shows the highest heterogeneity, probably because it
includes economic, environmental, technological and social criteria, whose importance grading
was moderate. In addition, greater proximity between nodes is shown, indicating similar
importance.
In short, the three central nodes are conformed by interdimensional principles and criteria. For
example, in all groups the environmental criteria are present, and particularly, environmental
criteria are related to social and economic criteria. The forces-directed and approximate force
between criteria shown in Figure 2-19 calls attention to the possibility of evaluating two or
more sustainability dimensions through one criterion.

76 Sustainability assessment of biodiesel production in Colombia
Figure 2-19. Principles and criteria framework visualization
Conclusions
The present chapter showed the validation of principles and criteria through expert consultation,
a new validation methodological approach which integrates the technological and political
dimensions to the three traditional dimensions of the TBL for sustainability assessment (social,
economic and environmental) in biodiesel production. Likewise, it was possible to establish the
principles and criteria that permit the assessment of the sustainability of biodiesel production.
Finally, the relevance, reliability and ease of measurement of principles and criteria were
defined. This new methodological approach permits the integration of expert consultation,
descriptive statistics analysis and data visualization.
As a result, five dimensions, 13 principles and 31 criteria were validated and recommended to
become part of the sustainability assessment framework for biodiesel production. Furthermore,
CN 2
CN 3
CN 1

Chapter 2 77
three central nodes were identified, comprised by interdimensional principles and criteria that
permit the visualization of relationships between dimensions, principles and criteria.
The hierarchical sustainability assessment framework of PC&I for biodiesel production
proposed has the following limits: First, the framework applicability is to renewable energy
whose raw material is biomass. Second, it is necessary to define a set of indicators for each
criterion, for assessment of a specific context of biodiesel production. Third, most of the experts
belong to the geographical area of Latin America, the type of organization Universities and the
area of expertise Technological and Environmental, thus it is important to strengthen expert
consultation with experts in other geographical areas, organizations and expertise areas.
However, it is important to note that, according to the results of the Principal Component
Analysis followed in this work, the grades given by the experts to principles and criteria were
not correlated with their geographical origin, type of organization or expertise area.
Regarding the attributes of importance that were proposed (relevance, ease of measurement and
reliability) to grade the impact of each principle and criterion on the assessment framework, a
high correlation was identified between ease of measurement and reliability. For example, if it
is easing the measurement of a criterion, it is possible to repeat the measurement, verify the
measurement and increase reliability in regard to the criterion. Therefore, the attribute Ease of
Measurement can be eliminated and the importance grading can be performed through the
attributes Relevance and Reliability.
In the next chapter, a System Dynamics (SD) model will be designed and implemented in
Stella® software, in order to show the interactions between dimension through the principles,
criteria and indicators validated in this chapter.

78 Sustainability assessment of biodiesel production in Colombia

3. Chapter 3: Definition and design of a system
dynamic model for sustainability assessment of
biodiesel production in Colombian context
Introduction
This research has followed a stepwise design for a new hierarchical sustainability assessment
framework of PC&I (principles, criteria and indicators) for biodiesel production. The first stage
was to define such framework (Chapter 1). In the second stage, the PC&I were validated
through several mechanisms that included expert consultation (Chapter 2). In this chapter, a
system dynamics based model is designed as methodological tool oriented to display the
characteristics, interaction, and influences among the PC&I that compose the sustainability
assessment framework.
The system dynamics model was developed and applied to a particular case, assessing the
sustainability of biodiesel production in Colombia, following five stages: problem definition,
dynamic hypothesis formulation, description of the model boundary, description of the model
structure and the definition of the functions that will describe the selected indicators, and testing
of the model and result analysis. Following, each one of these stages is described.
3.1 Background of Colombian biodiesel production
Industrial production of biodiesel in Colombia started in 2009. Currently, it is produced in seven
process plants, most of them located close to oil palm cultures. The total installed capacity of
the country is 581,000 t / year. Production of biodiesel in 2014 was 518,042 t. In 2013, 503,337
t were produced from 458,772 t of palm oil that corresponds to 44% of the Colombian
production of that oil (Fedebiocombustibles 2015). African oil palm is growth in 546,696 ha,
82,3% in production and 17,7% under development (Fedebiocombustibles 2015). Compared to
2009, biodiesel production has growth 150%. Despite the technology implemented (Desmet –
Ballestra, CMB Bernardini, etc.), all the biodiesel is produced by transesterification using
alkaline homogeneous catalyst and implementing the wet process for biodiesel purification.
Further information about current biodiesel production technologies can be referred in

80 Sustainability assessment of biodiesel production in Colombia
bibliography references (Knothe, Gerpen, and Krahl 2005; Torres et al. 2008; Sivasamy et al.
2009; Oh et al. 2012; Santori et al. 2012; Abbaszaadeh et al. 2012).
While the law that promotes biofuels production and commercialization for diesel engines was
promulgated in 2004, only in 2008 a policy to produce biofuels in a sustainable way was
established (CONPES and DNP 2008). The law establishes tax exception for some cultures,
including oil palm, and for the blend biodiesel – diesel. Some of the objectives of that policy
are to increase the competitiveness of biofuels production, to generate employment, rural
development and society welfare, to promote Colombian biofuel exports, to diversify the
sources of energy and to guarantee the environmental sustainability of biofuels implementing
sustainability indicators to make decisions related to its supply chain (CONPES and DNP
2008). Since 2013, it is possible to establish mandatory blends of biodiesel and diesel higher
than B-10, depending on the developments in engine technologies and on the national
production of biodiesel (Minminas 2011). Diesel and biodiesel prices are established monthly
by the Ministry of Mines and Energy, considering the international price of crude oil,
production costs and taxes, among several factors.
3.2 System dynamics application in biofuels analysis
System theory is the transdisciplinary study of phenomena. It investigates the principles
common to all complex entities, and the (usually mathematical) models which can be used to
describe them. A system can be said to consist of four things. The first is objects – the parts,
elements, or variables within the system. These may be physical or abstract or both, depending
on the nature of the system. Second, a system consists of attributes – the qualities or properties
of the system and its objects. Third, a system has internal relationships among its objects.
Fourth, systems exist in an environment. A system, then, is a set of things that affect one another
within an environment and form a larger pattern that is different from any of the parts (UT
2010; Le Moigne 2006).
In the context of this work, biodiesel production is considered a complex system due that its
analysis is conducted through multilevel variables called principles, criteria and indicator –
PC&I. Their properties are linked to assessment dimension of sustainability (economic, social,
environmental, politic and technological). Furthermore, biodiesel production has relationships
among an environment related to supply chain in geographical contexts.

Chapter 3 81
The formalization of a model for biodiesel production system can be done from the modeling
of system dynamics (Bantz and Deaton 2006; Szarka et al. 2008; Pruyt and Sitter 2008; Franco
and Flórez 2009; Oviedo et al. 2011; Franco, Zapata, and Dyner 2015; Josephine K. Musango
et al. 2012), simulation based on agents (Halog and Manik 2011), with the use of techniques
such as multi criteria evaluation, fuzzy logic, structural analysis / method of scenarios and
technological evaluation (Edgard Gnansounou 2011; Beall, Cadoni, and Rossi 2012; Rose
2014).
System dynamics (SD) is a methodology that combines analysis and synthesis to establish and
to formalize relationships between different information flows and structures of a complex
system, which facilitates the distinction of feedback mechanisms (Forrester 2013). Thereby,
through system dynamics modeling it is possible to understand how the organizational
structure, policies and delays in decision-making interact and influence the success or failure
of a company or system (Forrester 2013).
Between the different applications of this methodology, SD has been recently used by several
studies that analyze the market of renewable energy sources. Bantz & Deaton (2006) modeled
the biodiesel market to understand the reasons why biodiesel production capacity growth
exponentially in the United States. Wit et al. (2010) applied and developed the “Biotrans” model
in Europe, to optimize costs along the supply chain of biofuels. Oviedo et al. (2010) explained
the production and consumption of alternative fuels, like biofuels, based on country’s policies,
environmental protection and agricultural development. A SD model representing the behavior
of the biodiesel industry worldwide, considering conflicting points of view about the use of
biofuels was proposed by Oviedo et al. (2011) for assessing biodiesel sustainability using a
reduced number of indicators and focused in market behavior. Musango et al. (2011) and
Musango et al. (2012) implemented SD using the Bioenergy Technology Sustainability
Assessment (BIOTSA) model to assess the effects of biodiesel development on selected
sustainability indicators for the Eastern Cape Province of South Africa. Barisa et al. (2015)
proposed a SD model for finding the most effective biodiesel policy strategies in Latvia. Franco
et al. (2015) performed a SD modeling to approach the understanding of biofuel market in
Colombia.
Although these studies provide a valuable contribution to sustainability analysis in the biofuels
sector, they do not consider the entire sustainability dimensions proposed in this work:
economic, social, political, environmental and technological. Moreover, these studies do not

82 Sustainability assessment of biodiesel production in Colombia
explain the data collection process and how the selection of mathematical relationships between
different variables was done.
3.3 Systems dynamics methodology
SD methodology has five general steps: problem definition, dynamic hypothesis formulation,
description of the model boundary, description of the model structure and definition of the
functions that will describe the selected indicators, and testing of the model and results analysis
(Bérard 2010; Josephine Kaviti Musango 2012; Lee et al. 2012b). The methodology steps are
shown in Figure 3-1.
Figure 3-1 System Dynamics methodology, based on (Lee et al. 2012b) and (Bérard 2010)
3.3.1. Problem formulation
Problem formulation is the identification of the purpose of the model and the focus problem.
To identify these two aspects of the system under study is fundamental to guide the modeler to

Chapter 3 83
define the boundary of the model, the research hypothesis and the time horizon (Sterman 2002;
Josephine Kaviti Musango 2012).
3.3.2. Dynamic hypothesis formulation
This step involves developing a working theory to explain the problem that is being considered,
which is usually called dynamic hypothesis, because it describes the dynamics of the behavior
of a system based on the underlying feedbacks and interactions between the different parts. The
dynamic hypothesis helps to develop an appreciation of the complexity of the system. This is
essentially accomplished using systems thinking approach as suggested by Ti-yan et al. (2008);
Lee et al. (2012) and Brent & Musango (2013). To formulate the dynamic hypothesis, causal
loop diagrams to explain the relationships between the variables of the models have to be
developed.
A causal loop diagram comprises connections of variables by causal links, which are denoted
by an arrow. The links usually have either a negative or positive polarity denoted by “+” and “-
” respectively. The negative polarity implies that, if the cause decreases (increases), the effect
increases (decreases). On the other hand, a positive polarity implies that, if the cause increases
(decreases) the effect increases (decreases). If a feedback loop has an even number of “-” signs,
it is a positive loop. If it has uneven number of “-” signs, it is a negative loop. A positive
feedback loop is also known as a reinforcing loop and it is normally marked with “R”. It is
known as a reinforcing loop because it is an amplifying or enhancing feedback loop. On the
other hand, a negative feedback loop is also known as a balancing loop and it is normally
marked with “B”. It is a balancing loop because it is a stabilizing, goal seeking and regulating
feedback loop (Sterman 2003; Josephine K. Musango and Brent 2011), a general diagram
notation in shown in Figure 3-2.
Figure 3-2. General diagram notation (Sussman 2012).
This polarity labelling is an important step of qualitative modelling in system dynamics and it
is an initial step towards developing the feedback structure described by stock and flow
diagrams and finally by equations.

84 Sustainability assessment of biodiesel production in Colombia
3.3.3. Description of the model boundary
The purpose of the model boundary definition is to identify the endogenous and exogenous
indicators that permit the best explanation of the problem (Sterman 2003). Endogenous
indicators are calculated using the model, while exogenous indicators are fed to the model. The
importance of the indicator (relevance, reliability and ease of measurement) is a selection
criteria for including it in the model (refer chapter 2). Then, indicators that most influence the
system will be included in the model. To decide if an indicator is endogenous or exogenous it
is necessary a clear definition of the problem (Josephine Kaviti Musango 2012).
3.3.4. Description of the model structure and the equation definition
Each indicator incorporated in a causals loop diagram should be represented in the dynamic
model using functions (equations or graphic functions) or parameters. The definition of
dynamic indicators of the model starts establishing if they have a pre-established and
demonstrated relation. If the relation between the variables is not pre-established, the equation
will be obtained from historical data by using least squares algorithms (Draper, Smith, and
Draper 1998). Transformations of some variables are made to linearize the set of candidate
functions, seeking the best fit with the original curve and the feasibility of the comparison
between functions. Validation and selection of the equations is performed using the statistical
R2, R2 adjusted, p-value, variance analysis and prediction of errors.
The selection process of the equations is performed as follows:
Calculate the regression and get the results for statistical “F-test” from the analysis of
variance and compare it with the value of Fisher established (F table [α; √1, √2]).
If − Analysis of Variance > �; √ , √ � = ,
the equation is significant, so it can be used to represent the relationship between the
variables. In addition, each variable must be significant (�) in the equation considering
the same approach.
The equation used in the dynamic model accomplishes the above criteria and has the
highest values of R2 and R2 adjusted. The value of R2 adjusted measures how the
equation and the data fit. However, to measure the predictive ability of the designed
model it is necessary to use the criterion of error indicators.
Chapter 3 85
A Cross-Validation of Regression Models would be conducted if all data are used in
equation definition (Comparison of Sparse and Jack-knife partial least squares
regression methods) (Karaman et al. 2013; Kleijnen 1995; Picard and Cook 2012;
Steyerberg et al. 2001)
Once the equations have been selected, they can be implemented to the SD model construction
using a suitable tool, for example Stella® or VENSIM®, for further simulation and validation.
It is important to note that the modeler will know how reasonable the conceptualized diagram
is, only after the model of the system has been finished and the simulation has been performed
with the selected equations (Albin 1997). As a consequence, only once the dynamic model is
finally completed is it possible to observe whether the model actually represents system reality
or some modification must be made to improve their behavior.
For identifying the variables classified as flows, stocks or external variables in the system, it is
necessary to determine which of them define their state (stock) and which define changes in
their state (flows). The variables not included in these two classifications are auxiliary variables
(Michael J. and Robert A. 1997). The following guideline may be useful to help to identify
stocks and flows:
Stocks usually represent nouns and flows usually represent verbs
Stocks do not disappear if time is stopped (if a snapshot were taken of the system).
Contrary, flows disappear in the same situation
Stocks send out signals (information about the state of the system) to the rest of the
system.
3.3.5. Testing and analysis
To validate the model and the system the tests described below must be carried out:
Informal validation: In general, informal criteria resort to expert opinion as a way to
assess the quality of the model. This can be done through interviews, panels of experts
and the Turing test (Godoy and Bartó 2002).
Objective criteria for validation: there are a variety of criteria to objectively validate the
result of a system dynamics model (Barlas 1989). These criteria are:
− Criteria correspondence between structures: Each element of the model must have
its counterpart in the real world.

86 Sustainability assessment of biodiesel production in Colombia
− Criteria correspondence between behaviors: If a model is based on time series
representing the evolution of the system, it is possible to establish indicators on
relationship with the behavior that the model predicts. If the initial conditions of the
model correspond to the state of the system being modeled, then the behavior of the
model should reflect the historical data.
− Criteria correspondence between phenomena: It is expected that the model can
represent both the phenomena observed permanently and exceptional situations in
the real world.
If the model meets these criteria it can be stated that it is valid and may represent the reality of
the modeled system. After the validation of the model, it is possible to analyze the forecast
obtained using the model as well as the behavior of different structures in order to perform a
sensitivity analysis by modifying values of several variables.
3.4 Application of SD methodology in the biodiesel sustainability
assessment
3.4.1 Problem formulation
The problem formulation was conducted using the sustainability assessment framework of
biodiesel production proposed in chapter 1 (refer Figure 1-8), which identifies dimensions,
principles, criteria and indicators -PC&I for developing a sustainable biodiesel production. The
focus of the problem is to define the causal loops between PC&I in order to promote sustainable
biodiesel production in the Colombian context.
A further aspect of the problem formulation is the time horizon of the model. Very important
works developed by institutions as the International Energy Agency (IEA), the Energy
Information Agency (EIA) of the United States and Unidad de Planeación Minero Energética
of Colombia, project energy production, consumption and demand according to the source
considering 2030, 2035 or 2050 scenarios (BP 2011; EIA 2011; IEA 2011a; Gonzalez et al.
2014; UPME and MME 2015). In the same way, sustainability assessment requires to predict
the behavior of the system for long periods, usually between 30 and 50 years (ICTSD 2008;
Bringezu, Brien, and Howarth 2009; Josephine K. Musango et al. 2011; Gerbens-Leenes et al.
2012; Kampman, Grinsven, and Croezen 2012). For this reason, this study considers the period
2013 – 2030 as the time horizon.

Chapter 3 87
3.4.2 Dynamic hypothesis formulation in the biodiesel sustainability assessment
– Causal loop cycles
The research hypothesis of this dynamic model is that the sustainability assessment framework
is suitable for assessing the sustainability of the biodiesel production, and SD is an appropriate
methodological approach. The assessment framework model would provide insights about the
effect of biodiesel production in Colombia on the selected sustainability indicators, enabling
the analysis of the outcomes through predicted scenarios.
The description of the dynamic behavior based on the underlying feedbacks and interactions
between selected indicators is shown through five causal loop diagrams linked to each
sustainable dimension. The aim of the causal loops is to provide an endogenous explanation of
biodiesel production in Colombia. The interaction and relationships was identified through
three strategies, first literature reviews, second historical data related selected indicator, and
third current condition in Colombian context.
Economic dimension
An overview of the economic dimension of biodiesel production in Colombia is presented in
Figure 3-2. It consists of two reinforcing loops (R1 and R2) and two balancing loops (B1 and
B2). From Figure 3-2, balancing loop B1 shows that increments in palm oil price increase
biodiesel production costs, decreasing biodiesel profitability. A decrease in biodiesel
profitability reduces biodiesel production, decreasing its sales. Finally, if biodiesel sales
diminish, palm oil price diminishes too.
In the reinforcing causal loop R1 the scenario when glycerol is valorized through 1,3-
Propanediol production (PDO) in Colombia is considered. This is a new technology, still under
development, and currently it is not implemented in Colombia but it is project to build a bio-
propanediol (1.3 PDO) production plant in Malaysia in 2017 (Bioplastics News 2014). This
country is one of the world largest producers of palm oil. The global 1,3-Propanediol market is
estimated to reach USD $621.2 million by 2021, with increment of 10.4% between 2014 and
2021(MM 2015). PDO is a feedstock employed for manufacture of many chemicals and
materials, and it has the potential to replace ethylene glycol in PET production (Posada et al.
2013). The reinforcing loop R1 shows that if glycerol is valorized through PDO production,

88 Sustainability assessment of biodiesel production in Colombia
biodiesel profitability will increase as well as biodiesel production (for further description about
technological indicator PDO refers to technological dimension and Appendix 3 and 5).
Furthermore, biodiesel profitability is influenced directly by biodiesel price, production costs
and valorization of glycerol by PDO production, and indirectly (in the causal loop) by diesel
price, biodiesel production, technological learning and palm oil price. The interaction of the
indicators mentioned before is shown in the reinforcing loop R2. It is observed that an increment
in biodiesel production reduces biodiesel production costs due to the scale factor and to the
technological learning about the process which indeed depends on biodiesel production. A
reduction in biodiesel production costs increases the profit and biodiesel production. Moreover,
an augment in diesel price, increases biodiesel price which, of course, benefits the biodiesel
profitability.
The balancing loop B2 shows that an increment in biodiesel production costs reduces the
interest of investors in develop new projects for biodiesel production plants and, as a
consequence, biodiesel production capacity will be constant which would reduce biodiesel
production. If biodiesel production decreases, biodiesel sales and palm oil price will decrease
too. Finally, if palm oil price diminishes, biodiesel production costs will reduce.
Figure 3-2 Causal loop diagrams of the economic dimension
Social dimension
The causal loop diagram of the social dimension consists in the relationships between social,
environmental and economic indicators. Figure 3-3 shows one balanced loop (B3) and four
reinforcing loops (R3, R4, R6, R7). In this research, the social indicator quality of employment
in palm cultivation, considers the number of unionized employees, subcontracted employees,
Biodiesel Production 1G
Diesel Price
Palm Oil Production
Palm Oil Price
Biodiesel Production Cost 1G
Biodiesel Price
Profit Biodiesel Production 1G
Diesel Consumed in Transport Sector
Diesel Vehicles
Biodiesel Production Capacity 1G Glycerine Production
Value Added PDO of Glycerine
Others BdPr Cost Independent of BdPr
Mix Ratio Biodiesel and Diesel
Biodiesel Sale 1G
+
-
-
+
+
+
- +
+
+
+ +
+
+
+
+ ++
-+
+
B1
R1
R2
B2
Technnological indicator
Economic indicator
Environmental indicator
Political indicator
Social indicator

Chapter 3 89
direct contract employees, number of accidents, occupational diseases, and child labour in palm
cultivation (for further description refer Appendix 3). The causal relation between the quality
of employment and lands for palm cultivation is represented in the balancing loop B3. The
increment in the quality of employment increases the amount of land for oil palm cultivation.
The contrary behavior is observed for the effect of land for palm cultivation and the quality of
employment. If land for palm cultivation increases the quality of employment will reduce.
Relationships have been observed between indirect and direct land use changes, social
indicators and palm oil production. In the palm regions in Colombia, the increment of palm oil
production promotes an increase of lands for palm cultivation. According to different studies,
new lands for palm cultivation come, in descending order of area, from agricultural, livestock
and forest and ecosystem lands (BID and MME 2012b; Romero et al. 2012; Castanheira,
Acevedo, and Freire 2014). The new lands for livestock come, mainly, from forest and
ecosystem lands and, to a lesser extent, from agricultural lands. In this way, the increment of
lands for palm cultivation has an indirect effect on the reduction of forest and ecosystem lands.
Regarding livestock lands, there are social and economic indicators that influence their
increment. An improvement in local economies promotes a reduction in poor population that,
in consequence, increases the consumption of the basic grocery products, including meat. That
has a positive influence on the livestock lands (DANE, 2013). Besides, in the local economies
the increment in palm cultivation and palm oil production, promotes the reduction of poor
population.
The relationships mentioned before are represented in the balancing loop B4, which shows that
increments in palm oil production reduce poor population. In turn, a reduction in poor
population increases livestock lands which consequently decrease forest and ecosystem lands.
Furthermore, if forest lands decrease and soil loss in palm cultivation increases, the crop yield
in palm cultivation will diminish which consequently will reduce the palm oil production.

90 Sustainability assessment of biodiesel production in Colombia
Figure 3-3 Causal loop diagrams of the social dimension
Reinforcing loop R3 in Figure 3-3 shows that the food security indicator, defined as the ratio
between agriculture lands and lands for palm cultivation (indicator proposed by FAO (2014)),
is directly proportional to both variables. According to the reinforcing loop R4, an increase in
lands used for palm cultivation decreases the population displaced by violence and vice versa.
Historical data in Colombia related to biodiesel production (Fedebiocombustibles, 2015) and
poor population (DANE, 2013) in the regions influenced by lands for palm cultivation show
that biodiesel production is increasing and poor population too (refer to reinforcing loop R6 and
Figure 3-4). At the same time livestock lands increase. The description of the reinforcing loop
R5 is shown in the environmental dimension causal loop.
According to reinforcing loop R7, the forest and ecosystem lands as well as the biodiversity
indicator are affected by the social indicator area influenced by palm cultivation and population
influenced by palm cultivation. The biodiversity indicator in the context of this research is the
relation between the forest and ecosystem lands, the area influenced by palm cultivation and
the number of species of flora and fauna. An increment in biodiversity indicator equally
increases the forest and ecosystem lands, which is also swayed by population influenced by
palm cultivation. In parallel, the land concentration Index-GINI analysis permits to identify that
increments in oil price, livestock lands, lands for palm cultivation and biodiesel production
augment its value.
Population Displaced by violence
Land for Palm Cultivation
Land Concentration Index: GINI
Biodiesel Production 1G
Livestock Land
Oil Price
Poor Population
Palm Oil Production
Crop Yield in Palm Cultivation
Quality of employment
in Palm Cultivation
Agricultural Land
Food Security Indicator
Soil Loss in Palm Cultivation
Forests and Ecosystems lands
Population influenced
by Palm Cultivation
Palm Oil Sales
Palm Oil Sales to other uses
Biodiversity indicator
Area influenced by
Palm Cultivation
-
-
+
-
++
+
+
-
+
+
-
-+
-
+
-
+
-
-
-
--
+
+
+
+
+
+
B3
R3
B4
R7
R4
R6
R5
Technnological indicator
Economic indicator
Environmental indicator
Political indicator
Social indicator

Chapter 3 91
Figure 3-4 Social, environmental and economic indicators. Based on DANE (2013), Fedebiocombustibles (2015) and MA (2013).
Environmental dimension
The dynamics of the environmental dimension of the biodiesel production is presented in Figure
3-5. This dimension consists of three balancing loops (B5, B6 and B7) and four reinforcing
loops (R5, R7, R8 and R9). In Colombia, crop yield in palm cultivation has changed from 4.1
tons of palm oil per hectare in 1999 to 3.2 in 2013 (Fedepalma 2013). Crop yield is affected,
among many others aspects, by agricultural practices, the use of agrochemicals and
conservation practices on soil and water (Cramer et al. 2007a; Silva Lora et al. 2011; DANE
2012). The relation between crop yield and the agricultural practices in palm cultivation are
displayed in the balancing loop B5. It shows that an increase in land for palm cultivation
increases the agrochemicals applied in lands for palm cultivation. This, in turn, increases the
crop yield in palm cultivation. An increase in crop yield in palm cultivation reduces the palm
cultivation requirement which in turn decreases the demand of new lands for palm cultivation.
Regarding the relations between indirect and direct land use change associated to palm
cultivation, mentioned in social dimension, the reinforcing loop R5 shows that an increase in
land for palm cultivation promotes a decrease in agricultural land and, indirectly, an increase
in livestock land. The increment in livestock land promotes the decrease in forests and
ecosystem lands. If the forest and ecosystem lands are reduced, there will be a reduction in the
biodiversity indicator (refer to reinforcing loop R7).

92 Sustainability assessment of biodiesel production in Colombia
The biodiversity and forest land promote soil conservation, thus a decrease in forest land
increase soil loss in palm cultivation. Additionally, if soil loss diminishes the crop yield in palm
cultivation will increase (Groom, Gray, and Townsend 2008; Galic et al. 2012). Consequently,
a decrease in crop yield increases the demand for land to satisfy the local requirement of palm
oil (refer reinforcing loop R5).
Figure 3-5 Causal loop diagrams of the environmental dimension
The greenhouse gas (GHG) balance during life cycle of biodiesel production includes the stages
in the supply chain that emit GHG and the GHG absorption in the palm cultivation. The
balancing loop B6 shows that an increase in biodiesel production increases the GHG by direct
and indirect land use change. The increment in GHG during the life cycle of biodiesel
disesteems to increase the mix ratio biodiesel - diesel (currently the mix ratio in Colombia is
about B10). If the mix ratio does not increase biodiesel production is disesteemed too. Likewise,
the balancing loop B7 shows that an increase in biodiesel production increases the GHG in the
entire life cycle of biodiesel.
Taking a look of the impact of biodiesel production on the water resource, the reinforcing loop
R8 in Figure 3-5 shows that an increment in the crop yield promotes the reduction of water
demand in the biodiesel supply chain. If water demand increases water supply will diminish
Land for Palm Cultivation
Biodiesel Production 1G
Livestock Land
Crop Yield in Palm CultivationSoil Loss in Palm Cultivation
Forests and Ecosystems lands
Agrochemicals applied in
land for Palm Cultivation
Efficiency FactorTec 1G
TonOilPalm vs TonBd
Diesel Consumed
in Transport Sector
Index of energy
diversity of Colombia
Biodiversity indicator
Greenhouse Gases Emissions
GGE in Life Cycle of Biodiesel
GGE by direct and indirect
change of land use
GGE by Biodiesel Production
and Supply Chain Transport
GGE Absortion
Pollutant Emissions that
affect air quality: Bd blend
Mix Ratio Biodiesel and Diesel
Biodiesel Energy Input
Biodiesel Energy Output
Net Energy Ration
Water Demand in
Biodiesel Supply Chine
Water Supply
Water Scarcity Index
+
-
-
-
+
+
-
+
-
+
+
+
+++
+
+
+
+
-
+
-
-
+
-
+
-
+-
-
--
R5
R7
B5
R8
R9
B6
B7
Technnological indicator
Economic indicator
Environmental indicator
Political indicator
Social indicator

Chapter 3 93
and, consequently, the water scarcity index will increase. An increment in the water scarcity
generates a reduction in the crop yield. Regarding the energy balance, reinforcing loop R9
shows that increments in the efficiency technological factor (tons of palm oil per tons of
biodiesel produced) and in crop yield, increase biodiesel energy output and decrease energy
input. If energy output increases and energy inputs decrease there will be an increment in net
energy ratio for biodiesel production.
Technological dimension
The causal loop diagrams of technological dimension are presented in Figure 3-6, which shows
that there are two balancing loops B1 and B2, previously identified in the economic dimension
related to the valorization of glycerol through PDO production, and one new balancing loop
(B8). The reinforcing loop R9 in Figure 3-6 is the same identified in the environmental
dimension.
Regarding the valorization of glycerol through PDO production additionally to the previous
description, it is considered that if the mix ratio biodiesel - diesel increase is higher than 12%,
the PDO production will be an attractive market for biodiesel producers. This assumption is
based on the reflection conducted in Bioenergy Technology 2030: Roadmap for Colombia
(Gonzalez et al. 2014). By including the valorization of glycerol in the technological dimension
is intended to underline the importance of develop alternatives to reuse and manage properly
biodiesel industry by-products on the biodiesel profit.
Within the technological dimension a promotion factor of second and third generation biodiesel
production in Colombia was defined. This factor considers the World production of second and
third generation biodiesel, the number of patents assigned and the number of articles published
in scientific journals about biodiesel production of second and third generation (Daim et al.
2006). Balancing loop B8 shows that an increase in the promotion factor increases biodiesel
production of second and third generation in Colombia, increasing the total biodiesel
production. Equally, an increase in first generation biodiesel production increases the total
biodiesel production which decreases the unsatisfied demand of biodiesel.
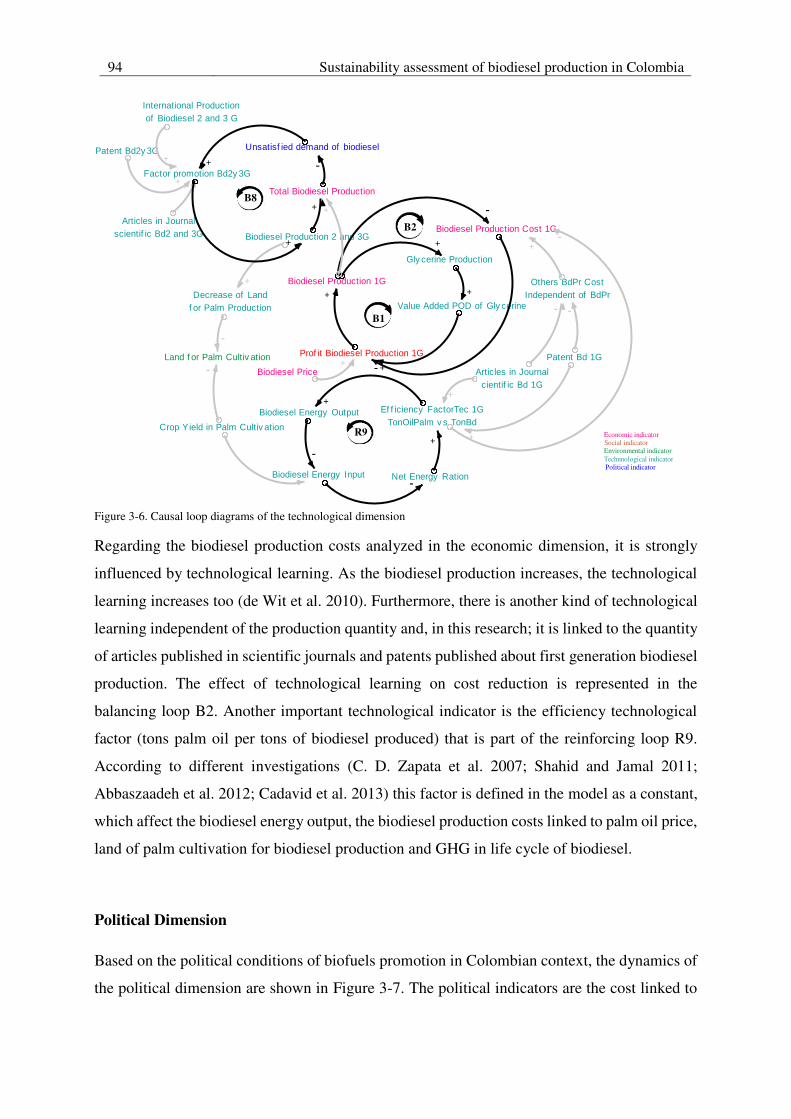
94 Sustainability assessment of biodiesel production in Colombia
Figure 3-6. Causal loop diagrams of the technological dimension
Regarding the biodiesel production costs analyzed in the economic dimension, it is strongly
influenced by technological learning. As the biodiesel production increases, the technological
learning increases too (de Wit et al. 2010). Furthermore, there is another kind of technological
learning independent of the production quantity and, in this research; it is linked to the quantity
of articles published in scientific journals and patents published about first generation biodiesel
production. The effect of technological learning on cost reduction is represented in the
balancing loop B2. Another important technological indicator is the efficiency technological
factor (tons palm oil per tons of biodiesel produced) that is part of the reinforcing loop R9.
According to different investigations (C. D. Zapata et al. 2007; Shahid and Jamal 2011;
Abbaszaadeh et al. 2012; Cadavid et al. 2013) this factor is defined in the model as a constant,
which affect the biodiesel energy output, the biodiesel production costs linked to palm oil price,
land of palm cultivation for biodiesel production and GHG in life cycle of biodiesel.
Political Dimension
Based on the political conditions of biofuels promotion in Colombian context, the dynamics of
the political dimension are shown in Figure 3-7. The political indicators are the cost linked to
Decrease of Land
f or Palm Production
Land f or Palm Cultiv ation Patent Bd 1G
Articles in Journal
cientif ic Bd 1G
Biodiesel Production 1G
Crop Yield in Palm Cultiv ation
Ef f iciency FactorTec 1G
TonOilPalm v s TonBd
Biodiesel Production Cost 1G
Biodiesel Price
Prof it Biodiesel Production 1G
Gly cerine Production
Value Added POD of Gly cerine
Others BdPr Cost
Independent of BdPr
Unsatisf ied demand of biodiesel
Total Biodiesel Production
Biodiesel Production 2 and 3G
Factor promotion Bd2y 3G
International Production
of Biodiesel 2 and 3 G
Patent Bd2y 3G
Articles in Journal
scientif ic Bd2 and 3G
Biodiesel Energy Input
Biodiesel Energy Output
Net Energy Ration
+
-
+
+
--
-
-
-+
+
+
+
-+
-
+
+
++
+
+
+
+
-
+
-
-
+R9
B8
B1
B2
Technnological indicator
Economic indicator
Environmental indicator
Political indicator
Social indicator

Chapter 3 95
biodiesel politic (based on UPME (2014)), the mix ratio biodiesel - diesel, and the biodiesel
price. The index of energy diversity of Colombia considers the influence of the biodiesel
production in the diversity of total primary and secondary energy supply (Herfindahi index)
(IEA 2011b).
The political indicators are displayed in balancing loops B6 and B7, described previously in
environmental dimension. It is important highlight that an increase in the support of the
Colombian government through the costs linked to biodiesel politic, corresponds to an
investment because it increases the biodiesel production capacity and its production.
Figure 3-7 Causal loop diagrams of the political dimension
Integrated causal loop diagram
The objective to define an integrated causal loop diagram in Figure 3-8 is shown the
interrelationships between the indicators linked to the five sustainable dimensions considered
in the assessment framework. The diagram integrates describes a general approach to the
complexity of the biodiesel production system in Colombia.
Furthermore, this integrated diagram permits to highlight that the most of causal loops are
composed of indicators of different sustainability dimensions. That is according to the
discussion exposed in Chapter 2, section 2.6, where interdimensional principles and criteria
were found, and attracted attention to the possibility of assessing two or more sustainability
dimensions through one criterion and theirs indicators associated.
Biodiesel Production 1G
Biodiesel Price
Profit Biodiesel Production 1G
Biodiesel Production Capacity 1G
Cost linked to Biodisel Politic
Index of energy
diversity of Colombia
Biodiesel Production 2 and 3G
Greenhouse Gases Emissions
GGE in Life Cycle of Biodiesel
Pollutant Emissions that
affect air quality: Bd blend
Mix Ratio Biodiesel and Diesel
+
-
++
+
+
+
+
+
-
+
B6
B7
Technnologic indicator
Ecnomic indicator
Enviromental indicator
Politic indicator
Social indicator
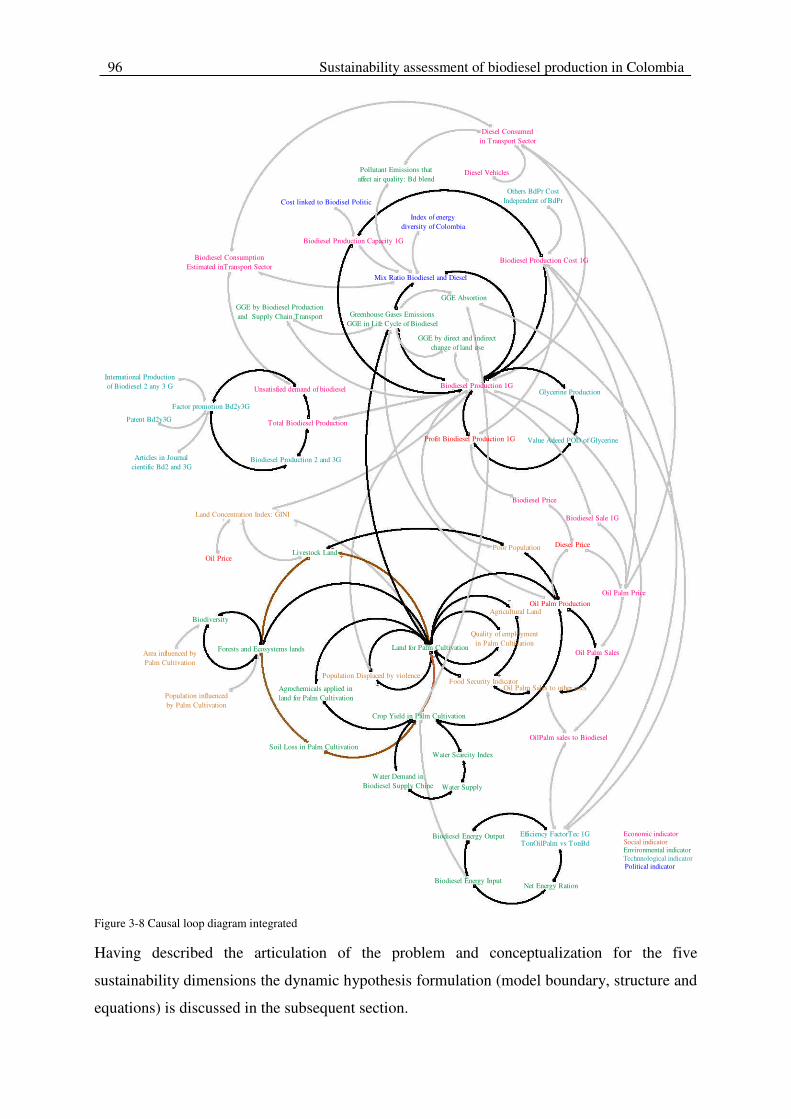
96 Sustainability assessment of biodiesel production in Colombia
Figure 3-8 Causal loop diagram integrated
Having described the articulation of the problem and conceptualization for the five
sustainability dimensions the dynamic hypothesis formulation (model boundary, structure and
equations) is discussed in the subsequent section.
Population Displaced by violence
Land for Palm Cultivation
Land Concentration Index: GINI
Biodiesel Production 1G
Livestock LandOil Price
Diesel PricePoor Population
Oil Palm Production
Crop Yield in Palm Cultivation
Quality of employment in Palm Cultivation
Agricultural Land
Food Security Indicator
Soil Loss in Palm Cultivation
Forests and Ecosystems lands
Agrochemicals applied in land for Palm CultivationPopulation influenced
by Palm Cultivation
OilPalm sales to Biodiesel
Oil Palm Sales
Oil Palm Price
Efficiency FactorTec 1G TonOilPalm vs TonBd
Oil Palm Sales to other uses
Biodiesel Production Cost 1G
Biodiesel Price
Profit Biodiesel Production 1G
Diesel Consumed in Transport Sector
Diesel Vehicles
Biodiesel Production Capacity 1G
Cost linked to Biodisel Politic
Index of energy diversity of Colombia
Glycerine Production
Value Adeed POD of Glycerine
Others BdPr Cost Independent of BdPr
Biodiesel Consumption Estimated inTransport Sector
Unsatisfied demand of biodiesel
Total Biodiesel Production
Biodiesel Production 2 and 3G
Factor promotion Bd2y3G
International Production of Biodiesel 2 any 3 G
Patent Bd2y3G
Articles in Journal cientific Bd2 and 3G
Biodiversity
Area influenced by Palm Cultivation
Greenhouse Gases Emissions GGE in Life Cycle of Biodiesel
GGE by direct and indirect change of land use
GGE by Biodiesel Production and Supply Chain Transport
GGE Absortion
Pollutant Emissions that affect air quality: Bd blend
Mix Ratio Biodiesel and Diesel
Biodiesel Energy Input
Biodiesel Energy Output
Net Energy Ration
Water Demand in Biodiesel Supply Chine Water Supply
Water Scarcity Index
Biodiesel Sale 1G
-
-
+--
+
+
-
-
+
-
Technnological indicator
Economic indicator
Environmental indicator
Political indicator
Social indicator

Chapter 3 97
3.4.3 Description of the model boundary
Colombian biodiesel production is principally developed in three geographical regions (north,
east and central), where the most of the land for palm cultivation is found. Considering this
geographical restriction, the impact of biodiesel production on sustainability is analyzed in
these three regions. In the Table 3-1 and Table 3-2 the endogenous and exogenous indicators
are described. They are part of dynamic hypothesis and show the model boundary.
Endogenous indicators are calculated through of equations (according to methodology
description in section 3.3.4), while exogenous indicators are defined by external conditions, and
they can be represented by constants, time-depend or graphical functions.
Table 3-1 Endogenous indicators # Endogenous Symbol 1 Biodiesel production of first generation in Colombia BdPr1G 2 Biodiesel Sale first generation in Colombia BdSale 3 Biodiesel production capacity first generation BdPrCap 4 Profit biodiesel production first generation ProfitBdPr 5 Biodiesel price BdPrice 6 Diesel price (price of diesel and biodiesel blended) Dprice 7 Biodiesel production costs first generation BdPrCosts 8 Others biodiesel production costs depend of biodiesel production OthBdPrCostsDepPr 9 Biodiesel production costs linked to Palm oil Price BdPrCostsPalmOilPrice 10 Palm oil price PalmOilPrice 11 Diesel consumed in transport sector DiConsTransp 12 Biodiesel consumption estimated in transport sector BdConsTransp 13 Valorization of glycerol by PDO PDOGly 14 Glycerol production GlyPr 15 Factor valorization PDO FactorValorizPDO 16 Total biodiesel production TotalBdPr 17 Biodiesel production second and third generation in Colombia Bd2&3G 18 Unsatisfied demand of biodiesel in Colombia - stock UnsDemandBd 19 Promotion factor biodiesel second and third generation in Colombia FactPromBd2&3G 20 Index of energy diversity of Colombia IndexEnDiv 21 Palm oil production PalmOilPr 22 Palm oil sales PalmOilS 23 Palm oil sales to other uses PalmOilSoth 24 Palm oil sales to biodiesel PalmOilStoBd 25 Crop yield in palm cultivation CrYieldPalm 26 Agrochemicals applied in land for palm cultivation AgrochemPalm 27 Soil loss in palm cultivation SoilLossPalm 28 Land for palm cultivation LandP 29 Variation of land for palm cultivation VarLandP 30 Decrease of land for palm cultivation DecreaseLandP 31 Agricultural lands AgrLand 32 Food security indicator FoodSecInd 33 Variation of agricultural lands VarAgrLand 34 Livestock land LivLand 35 Forest and ecosystems lands ForEcosLand 36 Variation of forest and ecosystems lands VarForEcosLand 37 Biodiversity indicator BiodivInd 38 Quality of employment in palm cultivation QualEmPalm 39 Better quality employment in palm cultivation BetterQEmPalm 40 Total Workers in Palm Cultivation TotEmPalm 41 Direct contracts employers in Palm Cultivation DirectEmPalm 42 Unionized employees in Palm Cultivation UnionizedEmPalm
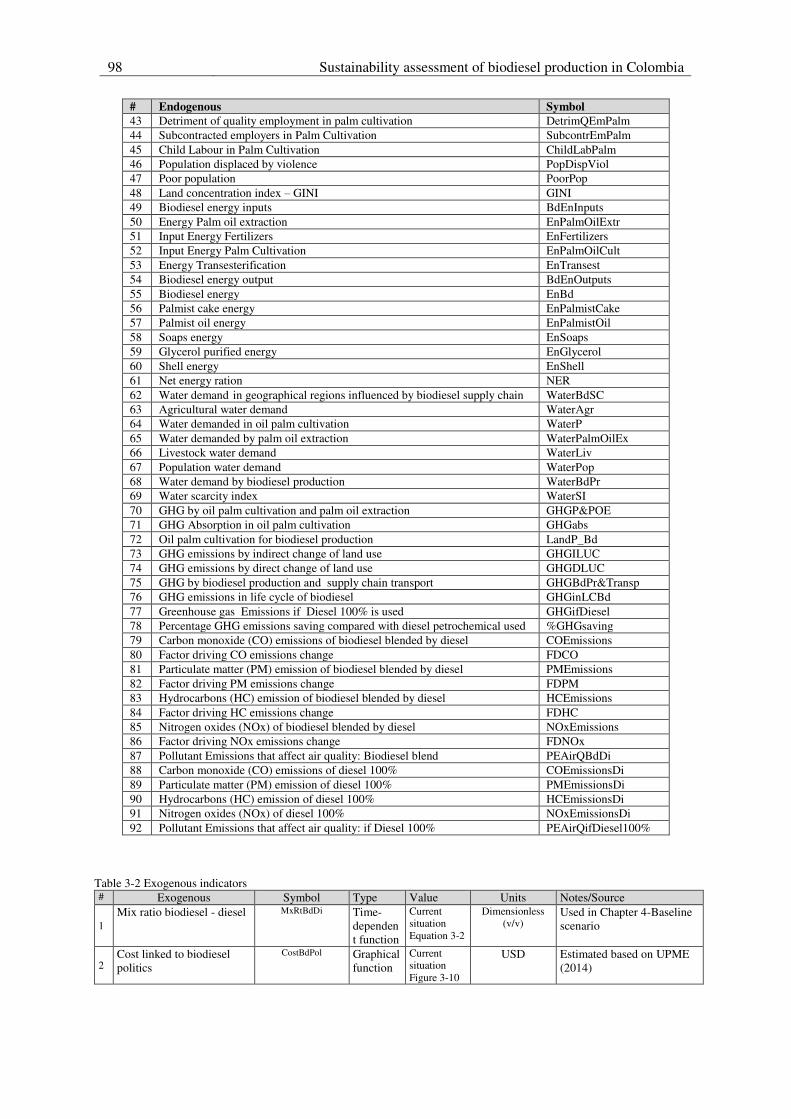
98 Sustainability assessment of biodiesel production in Colombia
# Endogenous Symbol 43 Detriment of quality employment in palm cultivation DetrimQEmPalm 44 Subcontracted employers in Palm Cultivation SubcontrEmPalm 45 Child Labour in Palm Cultivation ChildLabPalm 46 Population displaced by violence PopDispViol 47 Poor population PoorPop 48 Land concentration index – GINI GINI 49 Biodiesel energy inputs BdEnInputs 50 Energy Palm oil extraction EnPalmOilExtr 51 Input Energy Fertilizers EnFertilizers 52 Input Energy Palm Cultivation EnPalmOilCult 53 Energy Transesterification EnTransest 54 Biodiesel energy output BdEnOutputs 55 Biodiesel energy EnBd 56 Palmist cake energy EnPalmistCake 57 Palmist oil energy EnPalmistOil 58 Soaps energy EnSoaps 59 Glycerol purified energy EnGlycerol 60 Shell energy EnShell 61 Net energy ration NER 62 Water demand in geographical regions influenced by biodiesel supply chain WaterBdSC 63 Agricultural water demand WaterAgr 64 Water demanded in oil palm cultivation WaterP 65 Water demanded by palm oil extraction WaterPalmOilEx 66 Livestock water demand WaterLiv 67 Population water demand WaterPop 68 Water demand by biodiesel production WaterBdPr 69 Water scarcity index WaterSI 70 GHG by oil palm cultivation and palm oil extraction GHGP&POE 71 GHG Absorption in oil palm cultivation GHGabs 72 Oil palm cultivation for biodiesel production LandP_Bd 73 GHG emissions by indirect change of land use GHGILUC 74 GHG emissions by direct change of land use GHGDLUC 75 GHG by biodiesel production and supply chain transport GHGBdPr&Transp 76 GHG emissions in life cycle of biodiesel GHGinLCBd 77 Greenhouse gas Emissions if Diesel 100% is used GHGifDiesel 78 Percentage GHG emissions saving compared with diesel petrochemical used %GHGsaving 79 Carbon monoxide (CO) emissions of biodiesel blended by diesel COEmissions 80 Factor driving CO emissions change FDCO 81 Particulate matter (PM) emission of biodiesel blended by diesel PMEmissions 82 Factor driving PM emissions change FDPM 83 Hydrocarbons (HC) emission of biodiesel blended by diesel HCEmissions 84 Factor driving HC emissions change FDHC 85 Nitrogen oxides (NOx) of biodiesel blended by diesel NOxEmissions 86 Factor driving NOx emissions change FDNOx 87 Pollutant Emissions that affect air quality: Biodiesel blend PEAirQBdDi 88 Carbon monoxide (CO) emissions of diesel 100% COEmissionsDi 89 Particulate matter (PM) emission of diesel 100% PMEmissionsDi 90 Hydrocarbons (HC) emission of diesel 100% HCEmissionsDi 91 Nitrogen oxides (NOx) of diesel 100% NOxEmissionsDi 92 Pollutant Emissions that affect air quality: if Diesel 100% PEAirQifDiesel100%
Table 3-2 Exogenous indicators # Exogenous Symbol Type Value Units Notes/Source
1 Mix ratio biodiesel - diesel MxRtBdDi Time-
dependent function
Current situation Equation 3-2
Dimensionless (v/v)
Used in Chapter 4-Baseline scenario
2 Cost linked to biodiesel politics
CostBdPol Graphical function
Current situation Figure 3-10
USD Estimated based on UPME (2014)

Chapter 3 99
# Exogenous Symbol Type Value Units Notes/Source
3 Other biodiesel production costs independent of biodiesel production
OthBdPrCostIndPr Graphical function
Figure 3-11 USD
Estimated based on Equation 3-10
4
Efficiency Factor Technological biodiesel first generation tons palm oil per tons of biodiesel
EffFactTecPalmOilBd Constant 1.02 (t Palm Oil)/(t Biodiesel)
Estimated based on Oh et al. (2012); Cadavid et al. (2013)
5
Diesel vehicles Diesel_Vehicles Time-dependent function
Current situation Equation 3-14
Dimensionless Estimated based on MinTransporte (2014)
6 Technological Factor PDO TFPDO Constant 0.4 (Posada et al. 2013)
7 PDO profitability PDOprof Constant 0.677 (Posada et al. 2013)
8 International biodiesel production of second and third generation
IntBdPr2&3G Graphical function
Figure 3-12 t Estimated based on Biofuels (2014) and IEA (2011a)
9 Patent about second and third generation of biodiesel production
Patent_Bd2&3G Time-dependent function
Equation 3-21
Dimensionless Estimated based on patent database Orbit v1.9.4 (ORBIT 2015)
10 Articles in scientific journal about 2nd and 3rd generation of biodiesel production
Articles_Bd2&3G Time-dependent function
Equation 3-22
Dimensionless Estimated base on SCOPUS consultation (Elsevier 2015)
11 Factor Agrochemical applied in land for palm cultivation
FAAPC Constant 22 ℎ �ℎ (BID and MME 2012a)
12
Decrease factor of oil palm cultivation by second and third generation biodiesel production
FDBd2&3Gha Constant 1.0E-6 Dimensionless Estimated based on Technology roadmap (IEA 2011a)
13 Factor biodiversity FB Constant 11107 Species of flora and fauna
Estimated based of the amount of species reported in 2007 in a representative region in Colombia (Departamento del Meta) influenced by oil palm cultivation (Instituto Humboldt 2014)
14 Area influenced by oil palm cultivation
AreaInflPalm Constant 32304200 ha
Estimated based on Colombians political and administrative division that include lands for oil palm cultivations (IGAC 2013)
15 Factor Unionized employees in palm cultivation
FUE Constant 0.018 � �
Estimated in this study based on Ministerio de Agricultura de Colombia, (Fedesarrollo 2009), (Vargas 2012)
16 Factor subcontracted employers in palm cultivation
FSCE Constant 0.75
17 Factor of child labour in palm cultivation
FCLPC Constant 0.012 ℎ�
18 Factor Direct contracts employees in palm cultivation
FDCE Constant 0.25 �
19 Factor total employees in palm cultivation
FTEPC Constant 0.27 ℎ � �
20 Number of accidents and occupational diseases
Accid&disease Time-dependent function
Equation 3-51
Dimensionless
Estimated based on information on safety at work and health risks in the workplace (FASECOLDA and SGRP 2013).
21 Oil price OilPrice Graphical function
Figure 3-14 USD/t Based on EIA (2015)
22 Population influenced by palm cultivation
PopPalm Time-dependent function
Equation 3-43
Dimensionless (DANE 2014)
23 Irrigation water Energy Constant 2.65 GJ/ha (Yáñez Angarita et al. 2009) 24 Herbicide Energy Constant 0.56 GJ/ha (Yáñez Angarita et al. 2009)

100 Sustainability assessment of biodiesel production in Colombia
# Exogenous Symbol Type Value Units Notes/Source
25
Nitrogen Applied Constant 0.12 t Nitrogen/ha The central region in Colombia is the regions that use the most amounts of agrochemicals. This is the reason to use their fertilizers consumes (BID and MME 2012a)
26 Nitrogen Energy Constant 69.53 GJ/t Nitrogen (Yee et al. 2009)
27 Phosphate Energy Constant 7.7 GJ/t Phosphate
(P2O5) (Yee et al. 2009)
28 Phosphate Applied Constant 0.07 t Nitrogen/ha (BID and MME 2012a) 29 Boron Energy Constant 0.18 GJ/ha (de Souza et al. 2010)
30 Potassium Energy Constant 6.4 GJ/t Potassium
(K2O) (Yee et al. 2009)
31 Potassium applied Constant 0.30 t Nitrogen/Ha (BID and MME 2012a) 32 Magnesium Energy Constant 0.14 GJ/ha (de Souza et al. 2010) 33 Diesel for start up Constant 0.9 GJ/ha (de Souza et al. 2010) 34 Steam from power plant Constant 30.24 GJ/ha (Yáñez Angarita et al. 2009) 35 Electricity from grid Constant 0.02 GJ/ha (de Souza et al. 2010)
36 Electricity from power plant
Constant 2.26 GJ/ha (Yáñez Angarita et al. 2009)
37 Allocation Kernel oil Kernel cake glycerol coproduct: Energy input
Constant 35.5 GJ/ha (de Souza et al. 2010)
38 Energy by Transportation Constant 1.93 GJ/ha (Yáñez Angarita et al. 2009) 39 Steam in transesterification Constant 6.58 GJ/ha (Yáñez Angarita et al. 2009) 40 Methanol Constant 19.96 GJ/ha (Yáñez Angarita et al. 2009) 41 Catalyst NaOH Constant 0.79 GJ/ha (de Souza et al. 2010)
42 Electricity from grid in transesterification
Constant 0.85 GJ/ha (Yáñez Angarita et al. 2009)
43 Factor Glycerol purified energy
FGPE Constant 25.3 GJ/ t Palm oil (BID and MME 2012a)
44 Factor Soaps Energy FSE Constant 37 GJ/ t Palm oil (BID and MME 2012a) 45 Factor Biodiesel Energy FBdE Constant 37.2 GJ/t Biodiesel (BID and MME 2012a) 46 Factor Shell Energy FShE Constant 16.8 GJ/ t Palm oil (BID and MME 2012a) 47 Factor Palmist Oil Energy FPmE Constant 19.1 GJ/ t Palm oil (BID and MME 2012a)
48 Factor Palmist Cake Energy
FPcE Constant 19.1 GJ/ t Palm oil (BID and MME 2012a)
49 Factor water demand by palm cultivation
FWDPC Constant 3.9E-03 Mℎ (IDEAM 2014)
50 Factor Livestock water demand
FLWD Constant 4.1E-03 Mℎ (IDEAM 2014)
51 Factor Agricultural Water Demand
FAWD Constant 2.4E-03 Mℎ (IDEAM 2014)
52 Factor Population Water Demand
FPWD Constant 4.4E-05 Mℎ (IDEAM 2014)
53 Factor water demanded by palm oil extraction
FWDOPE Constant 2.2E-07 M
(BID and MME 2012a)
54 Factor water demand by biodiesel production
FWDBP Constant 2.7E-07 M
(BID and MME 2012a)
55 Water supply WaterSup Constant 6.1E09 M Estimated through Equation
3-78
56
Factor water supply FWS Constant 189216 Mℎ The original factor is 0.6Mm3/km2 s (FAO 2014) as water supply in average year in Colombia.
57 Ecological flows EcolFl Constant 6.1E08 M Estimated based on (IDEAM 2014) as 10% of water supply
58 Factor ecological flows FEF Constant 0.1 Dimensionless
59 Factor GHG in oil palm cultivation and palm oil extraction
FGHGP&POE Constant 0.55 − � (Castanheira, Acevedo, and Freire 2014)

Chapter 3 101
# Exogenous Symbol Type Value Units Notes/Source
60
GHG absorption factor FAGHG Constant 22.83 −ℎ Estimated based on the indicator oil palm fresh fruit bunches (FFB): and (BID and MME 2012a)
61 Land use change of forest to palm cultivation
LUCF Constant 0.23 Dimensionless Types of land palm is expands onto in the marginal producing in Colombia in 2020 (based on Winrock data for the US EPA(2010) reported in (Bauen et al. 2010))
62 Land use change of grass to palm cultivation
LUCG Constant 0.09 Dimensionless
63 Land use change of mix to palm cultivation
LUCM Constant 0.31 Dimensionless
64 Land use change of savannah to palm cultivation
LUCS Constant 0.18 Dimensionless
65 Land use change of shrub to palm cultivation
LUCSh Constant 0.08 Dimensionless
66 Land use change of wetland to palm cultivation
LUCW Constant 0.01 Dimensionless
67 Land use change of barren to palm cultivation
LUCB Constant 0.01 Dimensionless
68 GHG factor linked to LUC of forest to palm cultivation
GHGFF Constant 126 −ℎ GHG emissions by direct land use change to palm in Colombia (based on Winrock data for the US EPA(2010) reported in (Bauen et al. 2010)), considering 100 year emission factor.
69 GHG factor linked to LUC of grass to palm cultivation
GHGFG Constant -28 −ℎ
70 GHG factor linked to LUC of mix to palm cultivation
GHGFM Constant 10.7 −ℎ
71 GHG factor linked to LUC of savannah to palm cultivation
GHGFS Constant -22 −ℎ
72 GHG factor linked to LUC of shrub to palm cultivation
GHGFSh Constant -10 −ℎ
73 GHG factor linked to LUC of wetland to palm cultivation
GHGFW Constant -19 −ℎ
74 GHG factor linked to LUC of barren to palm cultivation
GHGFB Constant 0 −ℎ
75
GHG factor linked to indirect LUC
GHGFILUC Constant 0.04 − � � Estimated based on ILUC factor breakdown in Colombia (Bauen et al. 2010) and (BID and MME 2012a)
76
GHG factor in biodiesel production and supply chain transport
GHGFBdPr&Transp Constant 1.19 − � � Estimated based on ILUC factor breakdown in Colombia (Bauen et al. 2010) and (BID and MME 2012a)
77 GHG factor in life cycle of diesel in Colombia
GHGFLCD Constant 3.57 − � (BID and MME 2012a)
78 CO emission factor of diesel
FCODiesel Constant 0.017 � Estimate based on emission factor of the Colombian diesel production (BID & MMEC 2012)
79 PM emission factor of diesel
FPMDiesel Constant 5.5E-07 �
80 HC emission factor of diesel
FHCDiesel Constant 1.8E-03 �
81 NOx emission factor of diesel
FNOxDiesel Constant 6.3E-02 �
3.4.4 Description of the model structure and equations
The dynamic model was divided into six sub-models. These sub-models represent the
interactions between economic, social, environmental, politic and technological dimensions for

102 Sustainability assessment of biodiesel production in Colombia
the biodiesel production, according to the framework presented in Chapter 2. It is noted that the
names of sub-models not conform to sustainability dimensions. Due to the strong interactions
of dimensions (shows on data visualization in Figure 2-19), and also as a result of causal loop
diagram, consequently six main sub-models emerged. The sub-models are: biodiesel
production, land and social, net energy ratio, water demand, greenhouse gas emissions saving
in life cycle of biodiesel, and pollutant emission that affect air quality as a consequence of the
use of biodiesel - diesel blends as biofuel. Each sub-model and the equations of the selected
indicators are described in the subsequent sections.
Biodiesel production sub-model
This sub-model is composed of six stocks and flows (S&F): biodiesel production of first
generation (1G), biodiesel production capacity, profit of first generation biodiesel production,
valorization of glycerol by PDO, total biodiesel production, and unsatisfied demand of biodiesel
in Colombia. The equations that describe each S&F are shown in Table 3-3, Figure 3-10, Figure
3-11 and Figure 3-12. The graphical S&F is presented in Figure 3-9. The equation constants are
displayed in the Appendix 2 and the statistical issues of equations definition are described in
the Appendix 3. The endogenous and exogenous indicators used in each equation are described
in Table 3-1 and Table 3-2, respectively.
In Colombia, biodiesel production started in 2008, but the model includes the SD from 1999.
Then, the year for the model initial time (time zero) is 1999 and the biodiesel production begins
in time= 8.
Table 3-3 Stock and flow equations by biodiesel production sub-model
# S&F Equation Indicator 1 Biodiesel
production of first generation in Colombia
Equation 3-1 BdPr � = if time > then if A × Mx�tBdDi − A ×BdPrCosts < BdPrCap then A × Mx�tBdDi − A ×BdPrCosts else BdPrCap else
Endogenous
Equation 3-2 Mx�tBdDi = if time > then − A + A × time else Exogenous Equation 3-3 Bd�ale = A × BdPr � Endogenous
2 Biodiesel production capacity
Equation 3-4 = � > ℎ × Endogenous graphical function in Figure 3-10 Exogenous
3 Profit of first generation biodiesel production
Equation 3-5 ProfitBdPr = BdPrice − BdPrCosts + POD�ly Endogenous Equation 3-6 BdPrice = if time > then A + A × PalmOilPrice else Endogenous Equation 3-7 if time > then [BdPrCosts = OthBdPrCostIndPr +OthBdPrCostsDepPr + BdPrCostsPalmOilPrice] else[BdPrCosts = ] Endogenous
Equation 3-8 Dprice = A × BdPrice + A × OilPrice Endogenous OilPrice refer graphical function in Figure 3-14 Exogenous OthBdPrCostIndPr refer graphical function in Figure 3-11 Exogenous Equation 3-9 if time > then [OthBdPrCostDepPr = A × AccumPrBd− ] else [OthBdPrCostDepPr = ] Endogenous
(equation defined

Chapter 3 103
# S&F Equation Indicator Where AccumPrBd = AccumPrBd t − dt + BdPr � × dt INIT AccumPrBd = 22730 t Biodiesel INIT=Initial value is the Colombian biodiesel production in 2008
based on de Wit et al. (2010))
Assumption a minimal profit of biodiesel production of 0.1(BdPrice), then Equation 3-10 OthBdPrCostIndPr = ProfitBdPr − OthBdPrCostsDep�r −BdPrCostPalmOilPrice
Exogenous
Equation 3-11 If time > then [BdPrCostPalmOilPrice =Eff�act�ecPalmOilBd × PalmOilPrice] else [BdPrCostPalmOilPrice = ] Endogenous Eff�act�ecPalmOilBd = . Exogenous Equation 3-12 PalmOilPrice = A + A × OilPrice + A × PalmOil�toBd Endogenous PalmOilStoBd refer Equation 3-29 Endogenous Equation 3-13 DiCons�ransp = A × Diesel_Vehicles Endogenous Equation 3-14 Diesel_Vehicles = A + A × time Exogenous
4 Valorization of glycerol by PDO
Equation 3-15 PDO�ly = �lyPr × �actorValorizPDO × ��PDO × PODprof Endogenous Equation 3-16 �lyPr = A × BdPr � Endogenous Equation 3-17 If Mix�tBdDi > . then [�actorValorizPDO =Mix�tBdDi + Mix�tBdDi × . ]else[�actorValorizPDO = ] Endogenous ��PDO = . Exogenous PDOprof = . Exogenous
5 Total biodiesel production
Equation 3-18 = + & Endogenous Equation 3-19 I � >= ℎ [ & = × . +& ] [ & = ] Endogenous
Equation 3-20 �actPromBd & � = a _ &_ & × IntBdPr & � +a
Endogenous
Equation 3-21 Patent_Bd & � = A + −[ + x − ⁄ ] Exogenous
Equation 3-22 Articles_Bd & � = A + −[ + x time − AA ] Exogenous
IntBdPr2&3G refer graphical function in Figure 3-12 Exogenous 6 Unsatisfied
demand of biodiesel in Colombia
Equation 3-23 �k�nsDemandBd t = �k�nsDemandBd t − dt +�nsDemandBd × dt INI� �k�nsDemandBd =
Endogenous
Equation 3-24 �nsDemandBd = BdCons�ransp − �otalBdPr Endogenous
Equation 3-25 BdCons�ransp = a × x− x Endogenous
Equation 3-26 IndexEnDiv = −A × cos Mx�tBdDi + A + A ×cos A × Mx�tBdDi + A + A Endogenous
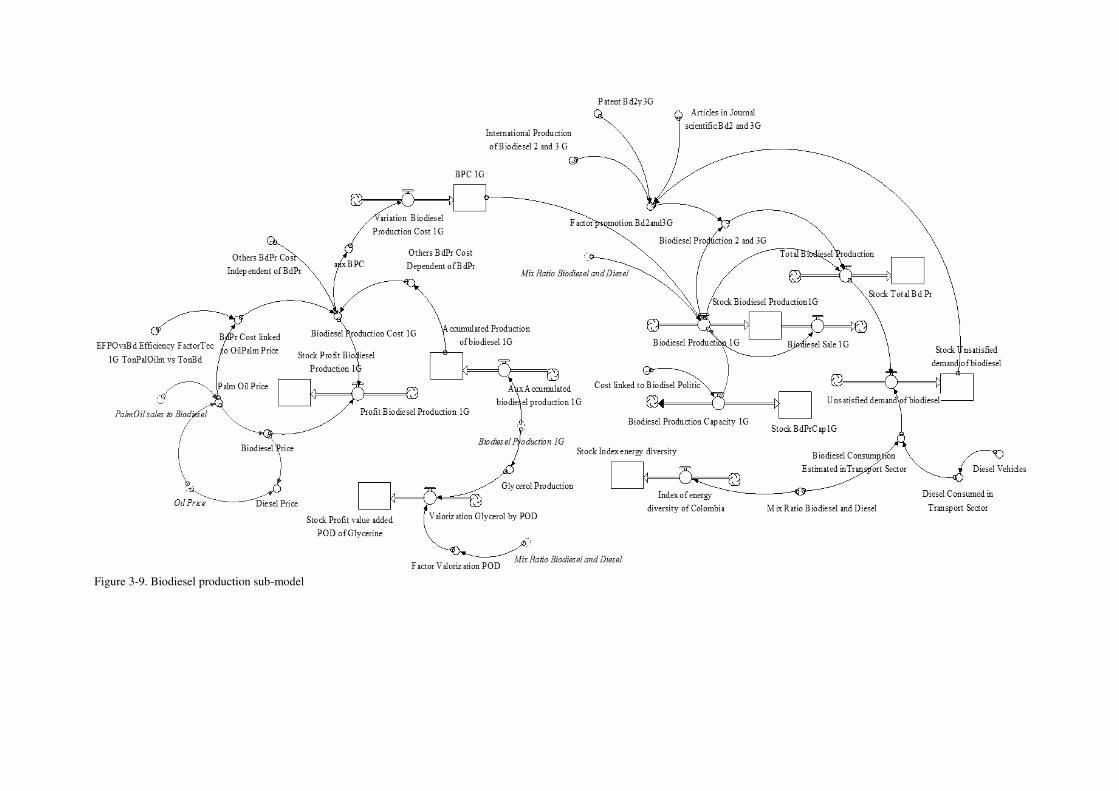
Figure 3-9. Biodiesel production sub-model

Figure 3-10 Graphical function of cost linked to biodiesel politic in current situation
Figure 3-11 Others Biodiesel Production Costs Independent of Biodiesel Production
Figure 3-12 Graphical function of international production of biodiesel of second and third generation
In biodiesel production sub-model there are endogenous indicators that could be used in other
sub-models, called output indicators. Their description and sub-models of destination are shown
in Table 3-4.
Table 3-4 Output indicator from biodiesel production sub-model Indicator Symbol Sub-model of destination Biodiesel production 1G BdPr1G Land and social sub-model
Greenhouse gas emission saving in life cycle of biodiesel sub-model Water demanded sub-model
Palm oil price PalmOilPrice Land and social sub-model Biodiesel consumption estimated in transport sector BdConsTransp Land and social sub-model Biodiesel production second and third generation Bd2&3G Land and social sub-model Diesel consumed in transport sector DiConsTransp Land and social sub-model
Pollutant emission that affect air quality as a consequence of the use of biodiesel - diesel blends as biofuel
Land and social sub-model
This sub-model is composed of ten S&F: palm oil production, crop yield in palm cultivation,
lands for palm cultivation, agricultural lands, livestock lands, forest and ecosystems lands,
Chapter 3 103

106 Sustainability assessment of biodiesel production in Colombia
employment quality in palm cultivation, population displaced by violence, poor population, and
land concentration index: GINI. The equations that describe each S&F are shown in Table 3-5
and Figure 3.14, while the graphical S&F is shown in Figure 3-13. The equation constants are
displayed in the Appendix 2 and the statistical issues of equation definitions are describe in the
Appendix 3. The endogenous and exogenous indicators used in each equation were described
in Table 3-1 and Table 3-2 respectively.
Table 3-5 Stock and flow equations by land and social sub-model
# S&F Equation Indicator 1 Palm oil
production Equation 3-27 PalmOilPr = if A × Cr�ieldPalm + A × DPrice <LandP × Cr�ieldPalm then A × Cr�ieldPalm + A ×DPrice else LandP × Cr�ieldPalm
Dprice refer Equation 3-8
Endogenous
Equation 3-28 PalmOil� = A × PalmOilPr Endogenous Equation 3-29 PalmOil�toBd = Eff�act�ecPalmOilBd × BdPr �
BdPr1G refer Equation 3-1, EffFactTecPalmOilBd refer Table 3-2
Endogenous
Equation 3-30 PalmOil�oth = PalmOil� − PalmOil�toBd Endogenous 2 Crop yield in
palm cultivation Equation 3-31 Cr�ieldPalm = A − A ×∗ �oilLossPalm + A ×AgrochemPalm
Endogenous
Equation 3-32 �oilLossPalm = A × AgrochemPalm − A ×�orEcosLands Endogenous
Equation 3-33 AgrochemPalm = LandP × �AAPC Endogenous FAAPC = 22 Exogenous
3 Lands for palm cultivation
Equation 3-34 LandP t = LandP t − dt + VarLandP −DecreaseLandP dt INIT LandP = 143115 ha Equation 3-35 = − × − ×�� + × − ×� � Equation 3-36 = & ℎ × &
Endogenous
�DBd & �ha = . − Exogenous 4 Agricultural
lands Equation 3-37 AgrLand t = AgrLand t − dt + −VarAgrLand dt INIT AgrLand = 2068915 ha Equation 3-38 = × − × � + ×
Endogenous
Equation 3-39 �ood�ecInd = aa Endogenous
5 Livestock lands Equation 3-40 LivLand = A − A × AgrLand − A × PoorPop + A ×VarLandP Endogenous
6 Forest and ecosystems lands
Equation 3-41 �orEcosLand t = �orEcosLand t − dt +−Var�orEcosLand dt INIT ForEcosLand = 13006622 ha Equation 3-42 Var�orEcosLand = −A + A × �orEcosLands − A ×LivLand + A × PopPalm
Endogenous
Equation 3-43 PopPalm = A + A × time Exogenous
Equation 3-44 BiodivInd = × aa a Endogenous
FB = 11107 Exogenous AreaInflPalm = 32304200 Exogenous
7 Employment quality in palm cultivation
Equation 3-45 �ualEmPalm = Better�EmPalm − Detrim�EmPalm
Endogenous
Equation 3-46 Better�EmPalm = DirectEmPalm + �nionizedEmPalm Endogenous Equation 3-47 �otEmPalm = ��EPC × LandP Endogenous

Chapter 3 107
# S&F Equation Indicator FTEPC = 0.27 Exogenous Equation 3-48 DirectEmPalm = �DCE × �otEmPalm Endogenous FDCE = 0.25 Exogenous Equation 3-49 �nionizedEmPalm = ��E × �otEmPalm Endogenous FUE = 0.018 Exogenous Equation 3-50 Detrim�EmPalm = Accid&diseases +�ubcontrEmPalm + ChildLabPalm
Endogenous
Equation 3-51 Accid&diseases = A × time^ − A × time^ + A ×time + A Exogenous
Equation 3-52 �ubcontrEmPalm = ��CE × �otEmPalm Endogenous FSCE = 0.75 Exogenous Equation 3-53 ChildLabPalm = �CLPC × �otEmPalm Endogenous FCLPC = 0.012 Exogenous
8 Population displaced by violence
Equation 3-54 PopDispViol = A − A × LandP Endogenous
9 Poor population Equation 3-55 PoorPop = A − A × LandP
Endogenous
10 Land concentration index: GINI
Equation 3-56 �INI = A − A × LivLand + A × LandP + A ×OilPrice − A × DiCons�ransp − A × BdPr � Endogenous
OilPrice graphical function in Figure 3-14 Exogenous
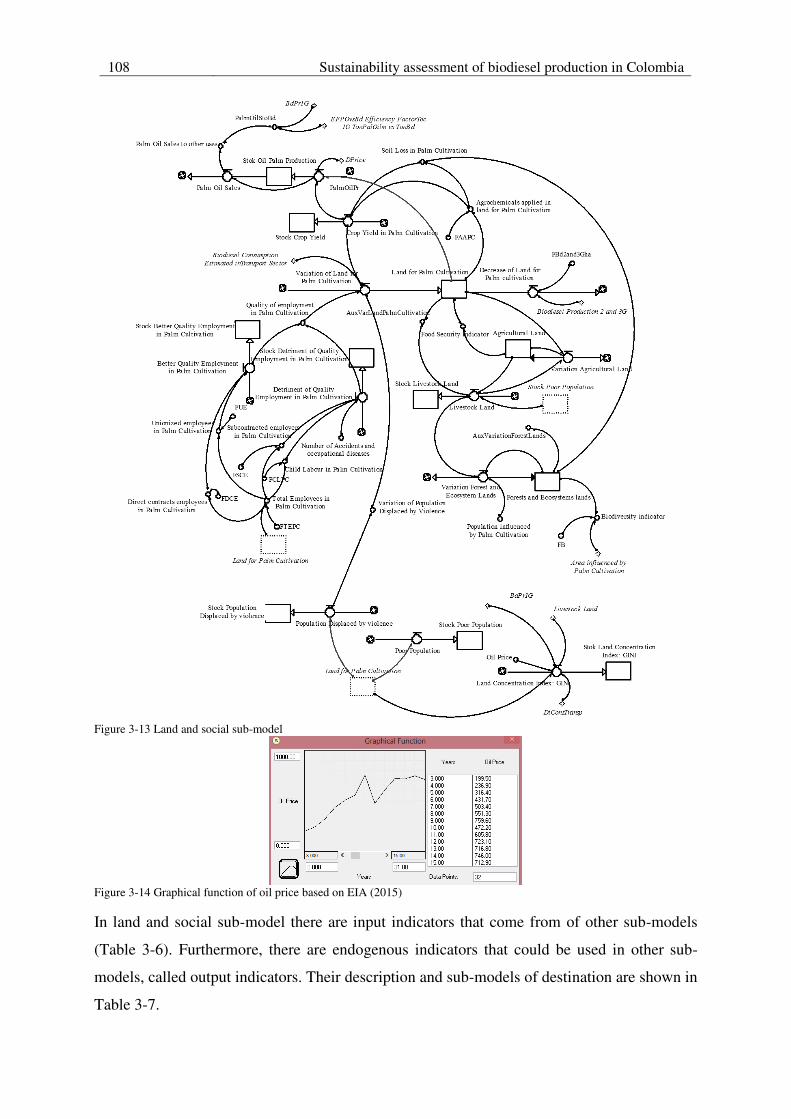
108 Sustainability assessment of biodiesel production in Colombia
Figure 3-13 Land and social sub-model
Figure 3-14 Graphical function of oil price based on EIA (2015)
In land and social sub-model there are input indicators that come from of other sub-models
(Table 3-6). Furthermore, there are endogenous indicators that could be used in other sub-
models, called output indicators. Their description and sub-models of destination are shown in
Table 3-7.

Chapter 3 109
Table 3-6 Input indicator used in land and social sub-model Indicator Symbol Sub-model of origin Biodiesel production 1G BdPr1G Biodiesel production sub-model Biodiesel consumption estimated in transport sector BdConsTransp Biodiesel production sub-model Diesel consumed in transport sector DiConsTransp Biodiesel production sub-model Oil price OilPrice Biodiesel production sub-model
Table 3-7 Output indicator from land and social sub-model Indicator Symbol Sub-model destination Crop yield in palm cultivation CrYieldPalm Greenhouse gas emission saving in life cycle of
biodiesel sub-model Net energy ratio sub-model
Livestock land LivLand Water demanded sub-model Palm oil production PalmOilPr Water demanded sub-model Land for palm cultivation LandP Water demanded sub-model Agricultural land AgrLand Water demanded sub-model
Net energy ratio sub-model
This sub-model is composed of eight S&F: input energy fertilizers, input energy palm
cultivation, energy palm oil extraction, input energy transportation, energy transesterification,
biodiesel energy input, biodiesel energy output, and net energy ratio. The equations that
describe each S&F are shown in Table 3-8, and the graphical S&F is shown in Figure 3-15. The
equation constants are displayed in the Appendix 2 and the statistical issues of equation
definitions are describe in the Appendix 3. The endogenous and exogenous indicators used in
each equation are described in Table 3-1 and Table 3-2 respectively.

Figure 3-15 Net energy ratio sub-model
Stock Energy Palm Cultivation
Input Energy Palm Cultivation
Allocation Kernel oil Kernel cake
glycerin coproduct:Energy inputNitrogen Energy
Phosphate Energy
SIEF
Nitrogen Applied
Potassium Energy
Input Energy Fertilizers
Magnesium Energy
Boron Energy
Herbicide Energy
Irrigation water Energy
Stock Energy Transportation
Input Energy TransportationEnergy by Transportation
Stock Energy Oil palm extractionEnergy Oil palm extractionElectricity from power plant
Electricity from grid
Steam from power plant
Diesel for start up
Stock Energy Transesterification
Energy Transesterification
Methanol
Catalyst NaOH
Electricity from grid2
Steam
Stock: Biodiesel Energy OutputBiodiesel Energy Output
Biodiesel Energy
Palmist oil Energy
Palmist cake Energy
NER RationStock NER Ration
FPmE
Crop Yield in Palm Cultivation
FBdE
FPcE
Soaps EnergyFSE
Crop Yield in Palm Cultivation
Gliceryn purified
FGPE
Shell
FTE
Stock: Biodiesel Energy Input
Biodiesel Energy Input
Phosphate Applied
Potassium Applied

Table 3-8 Stock and flow equations by net energy ratio sub-model # S&F Equation Indicator 1 Input energy
fertilizers Equation 3-57 � � = � _ � × � _ +ℎ ℎ _ � × ℎ ℎ _ + � _ ×� _ � + � _ + _
Endogenous
� _ � =0.12 Exogenous � _ =69.53 Exogenous ℎ ℎ _ � =0.07 Exogenous ℎ ℎ _ =7.7 Exogenous � _ =6.4 Exogenous � _ � =0.3 Exogenous � _ =0.14 Exogenous _ =0.18 Exogenous 2 Input energy palm
cultivation Equation 3-58 � = � � + � � +
Endogenous � � =0.56 Exogenous
=2.65 Exogenous 3 Energy palm oil
extraction Equation 3-59 � = � + � � � +� � +
� =0.9 Exogenous � � � =0.02 Exogenous � � =2.26 Exogenous =30.24 Exogenous
4 Input energy transportation
= . Exogenous
5 Energy transesterification
Equation 3-60 = _ +� � _ _ � + ℎ +
Endogenous _ = . Exogenous � � _ _ � = . Exogenous ℎ =19.96 Exogenous =6.58 Exogenous & � =35.5 Exogenous 6 Biodiesel energy
input Equation 3-61 = + � ++ + & �
Endogenous
7 Biodiesel energy output
Equation 3-62 = + � +� � + + + ℎ
Endogenous
Equation 3-63 = × �� Endogenous = . Exogenous Equation 3-64 � = × �� Endogenous = . Exogenous Equation 3-65 � � = × �� Endogenous = . Exogenous Equation 3-66 = × �� Endogenous = Exogenous Equation 3-67 = × �� Endogenous = . Exogenous Equation 3-68 ℎ = ℎ × �� Endogenous ℎ = . Exogenous
8 Net energy ratio Equation 3-69 = � Endogenous
In the net energy ratio sub-model there is one input indicator that come from of land and social
sub-model. It is shown in Table 3-9.
Table 3-9 Inputs indicators used in net energy ratio sub-model Indicator Symbol Sub-model of origin Crop yield in palm cultivation CrYieldPalm Land and social sub-model

112 Sustainability assessment of biodiesel production in Colombia
Water demanded sub-model
The water demanded sub-model is composed of two S&F: water demand in region influenced
by biodiesel supply chain and water scarcity index. The equations that describe each S&F are
shown in Table 3-10, and the graphical S&F is shown in Figure 3-16. The equation constants
are displayed in the Appendix 2 and the statistical issues of equation definitions are described
in the Appendix 3. The endogenous and exogenous indicators used in each equation are
described in Table 3-1 and Table 3-2 respectively.
Table 3-10 Stock and flow equations by water demand sub-model # S&F Equation Indicator 1 Water demand in
geographical regions influenced by biodiesel supply chain
Equation 3-70 �aterBd�C = �aterP + �aterPalmOilEx + �aterBdPr +�aterPop + �aterLiv + �aterAgr Endogenous
Equation 3-71 �aterP = LandP × ��DPC Endogenous ��DPC =3.9E-03 Exogenous Equation 3-72 �aterPalmOilEx = ��DOPE × PalmOilPr Endogenous ��DOPE =2.2E-07 Exogenous Equation 3-73 �aterBdPr = ��DBP × BdPr � Endogenous ��DBP =2.7E-07 Exogenous Equation 3-74 �aterPop = �P�D × PopPalm Endogenous �P�D =4.4E-05 Exogenous Equation 3-75 �aterLiv = �L�D × LivLand Endogenous �L�D =4.1E-03 Exogenous Equation 3-76 �aterAgr = AgrLand × �A�D Endogenous �A�D =2.4E-03 Exogenous
2 Water scarcity index
Equation 3-77 �ater�I = WaWa − Endogenous
Equation 3-78 �ater�up = ��� × AreaInflPalm Exogenous ��� =189216 Exogenous AreaInflPalm =32304200 Exogenous Equation 3-79 Ecol�l = �E� × �ater�up Exogenous �E� =0.1 Exogenous

Chapter 3 113
Figure 3-16 Water sub-model
The input indicators used in this sub- model that comes from of other sub-models are shown in
Table 3-11.
Table 3-11 Inputs indicators used in water sub-model Indicator Symbol Sub-model of origin Biodiesel production 1G BdPr1G Biodiesel production sub-model Livestock land LivLand Land and social sub-model Palm oil production PalmOilPr Land for palm cultivation LandP Agricultural land AgrLand
Greenhouse gas emissions saving in life cycle of biodiesel sub-model
This sub-model is composed of seven S&F: greenhouse gas emissions (GHG) by oil palm
cultivation and palm oil extraction, GHG absorption by palm cultivation, GHG by indirect
change of land use, GHG by direct change of land use, GHG by biodiesel production and supply
chain transport, GHG if Diesel 100% is used in Colombian transport sector, and GHG in life
cycle of biodiesel. Furthermore, this sub-model estimated the percentage of GHG saving
compared with diesel petrochemical used. The equations that describe each S&F are shown in
Table 3-12, and the graphical S&F is presented in Figure 3-17.
Table 3-12 Stock and flow equations by GHG emissions saving in life cycle of biodiesel sub-model # S&F Equation Indicator 1 GHG by oil palm cultivation
and palm oil extraction Equation 3-80 ���P&POE = BdPr � × ����P&POE ×Eff�act�ecPalmOilBd
Endogenous ����P&POE = . Exogenous EffFactTecPalmOilBd =1.02 Exogenous

114 Sustainability assessment of biodiesel production in Colombia
# S&F Equation Indicator 2 GHG absorption by palm
cultivation Equation 3-81 ���abs = LandP_Bd × �A��� Endogenous Equation 3-82 LandP_Bd = if BdPr � ×Eff�act�ecPalmOilBd /Crop�ieldPalm <LandP then BdPr � × Eff�act�ecPalmOilBd /Crop�ieldPalm else LandP
Endogenous
�A���=22.83 Exogenous 3 GHG by indirect change of
land use Equation 3-83 ���IL�C = ����IL�C × BdPr � Endogenous ����IL�C = . Exogenous
4 GHG by direct change of land use
Equation 3-84 ���DL�C = Landp_Bd × [L�C� × ����� + L�C� × ����� + L�CM × ����M + L�C� × ����� +L�C�h × �����h + L�C� × ����� + L�CB × ����B] Endogenous
L�C�=0.23 Exogenous �����=126 Exogenous L�C�=0.09 Exogenous ����� = -28 Exogenous L�CM = 0.31 Exogenous ����M=10.7 Exogenous L�C�=0.18 Exogenous ����� = -22 Exogenous L�C�h = 0.08 Exogenous �����h = -10 Exogenous L�C� = 0.01 Exogenous ����� = -19 Exogenous L�CB= 0.01 Exogenous ����B= 0 Exogenous 5 GHG by biodiesel production
and supply chain transport Equation 3-85 ���BdPr&�ransp = ����BdPr&�ransp ×BdPr �
Endogenous ����BdPr&�ransp=1.19 Exogenous 6 GHG if Diesel 100% is used
in Colombian transport sector Equation 3-86 ���ifDiesel = ����LCD × BdPr � Endogenous
GHGFLCD= 3.57 Exogenous 7 GHG in life cycle of
biodiesel Equation 3-87 ���inLCBd = ���P&POE + ���DL�C +���IL�C − ���abs
Endogenous
Equation 3-88 %���saving = − × Endogenous

Figure 3-17 GHG emissions saving in life cycle of biodiesel sub-model
Stock Greenhouse Gases Emissions in Life Cycle of Biodiesel
Greenhouse Gases Emissions in Life Cycle of Biodiesel
Stock Greenhouse Gases Emissions by Direct change of land use
Greenhouse Gases Emissions by Direct land use
GGE Factor by Exchange of Savannah to Palm Cultivation
GGE Absorption Factor
Stock GGE Absorption
GGE Absorption in palm cultivation
Biodiesel Production 1G
Land of palm cultivation for Biodiesel production
Biodiesel Production 1G
GGE Factor by Exchange of forest to Palm Cultivation
LUC of Savannah to Palm Cultivation
LUC of forest to Palm Cultivation
Stock Greenhouse Gases Emissions by indirect change of land use
Greenhouse Gases Emissions by indirec land use chanee
GGE Factor by Indirect Change of Land Use
Stock GGE by Biodiesel Production and Supply Chain Transport
GGE by Biodiesel Production and Supply Chain Transport
GGE Factor by Biodiesel Production and Supply Chain Transport
Stock GGE by Palm Cultivation and Oil Palm Extraction
GGE by Palm Cultivation and Oil Palm Extraction
GGE Factor by Palm Cultivation and Oil Palm Extraction
GGE Factor in Life Cycle of Diesel in Colombia
EFOPvsBd Efficiency FactorTec
1G TonOilPalm vs TonBd
EFOPvsBd Efficiency FactorTec
1G TonOilPalm vs TonBd
Crop Yield in Palm Cultivation
Percentage Avoided Emissions of Greenhouse Gases
Stock Greenhouse Gases Emissions if Diesel 100% is used
Greenhouse Gases Emissions if Diesel 100% is used

In GHG emissions saving in life cycle of biodiesel sub-model there are input indicators that
come from of other sub-models. They are shown in Table 3-13.
Table 3-13 Input indicators used in GHG emission saving in life cycle of biodiesel sub-model Indicator Symbol Sub-model of origin Biodiesel production 1G BdPr1G Biodiesel production sub-model Crop yield in palm cultivation CrYieldPalm Land and social sub-model Efficiency Factor Technological biodiesel first generation tons palm oil per tons of biodiesel
EffFactTecPalmOilBd Biodiesel production sub-model
Pollutant emission that affect air quality as a consequence of the use of
biodiesel - diesel blends as biofuel sub-model
This sub-model is composed of five S&F: carbon monoxide (CO) emissions, particulate matter
(PM) emission, hydrocarbons (HC) emission, nitrogen oxides (NOx) of biodiesel blended by
diesel, and pollutant emission that affect air quality as a consequence of biodiesel: diesel blend
as biofuel. Each S&F mentioned before to consider the percent change in emissions established
by the Environmental Protection Agency (EPA 2002). In this study the percent change in
emissions are called fraction driving of emissions change and it is a function of mix ratio
biodiesel – diesel. The equations that describe each S&F are shown in Table 3-14, and the
graphical S&F is presented in Figure 3-18. The equation constants are displayed in the
Appendix 2 and the statistical issues of equation definitions are describe in the Appendix 3. The
endogenous and exogenous indicators used in each equation are described in Table 3-1 and
Table 3-2 respectively.
Table 3-14 Stock and flow equations by pollutant emission sub-model # S&F Equation Indicator 1 Carbon monoxide
(CO) emissions Equation 3-89 If time > then [COEmissions = �CODiesel ×DiCons�ransp + �DCO × ( �CODiesel × DiCons�ransp −)] else [COEmissions = �CODiesel × DiCons�ransp]
Endogenous
Equation 3-90 �DCO = A − A × Mx�tBdDi + A × Mx�tBdDi Endogenous �CODiesel =0.017 Exogenous DiConsTransp refer to Equation 3-13 Endogenous
2 Particulate matter (PM) emission
Equation 3-91 If time > then [PMEmissions = �PMDiesel ×DiCons�ransp + �DPM × ( �PMDiesel × DiCons�ransp −)] else [PMEmissions = �PMDiesel × DiCons�ransp] Endogenous
�PMDiesel =5.5E-07 Exogenous Equation 3-92 �DPM = A − A × Mx�tBdDi + A × Mx�tBdDi Endogenous
3 Hydrocarbons (HC) emission
Equation 3-93 If time > then [�CEmissions = ��CDiesel ×DiCons�ransp + �D�C × ( ��CDiesel × DiCons�ransp −)] else [�CEmissions = ��CDiesel × DiCons�ransp] Endogenous
��CDiesel =1.8E-03 Exogenous Equation 3-94 �D�C = −A − A × Mx�tBdDi + A × Mx�tBdDi Endogenous
4 Nitrogen oxides (NOx)
Equation 3-95 If time > then [NOxEmissions = �NOxDiesel ×DiCons�ransp + �DNOx × ( �NOxDiesel × DiCons�ransp −)] else [NOxEmissions = �NOxDiesel × DiCons�ransp] Endogenous
Equation 3-96 �DNOx = A × Mx�tBdDi Endogenous �NOxDiesel =6.3E-02 Exogenous

Chapter 3 117
# S&F Equation Indicator 5 Pollutant emission that
affect air quality as a consequence of the use of biodiesel - diesel blends as biofuel
Equation 3-97 If time > then [PEAir�BdD = COEmissions +PMEmissions + �CEmissions + NOxEmissions] else [PEAir�BdD = ] Endogenous
Equation 3-98 PEAirQifDiesel100% = COEmissionsDi +PMEmissionsDi + �CEmissionsDi + NOxEmissionsDi Endogenous
Equation 3-99 COEmissionsDi = �CODiesel × DiCons�ransp Endogenous Equation 3-100 PMEmissionsDi = �PMDiesel × DiCons�ransp Endogenous Equation 3-101 �CEmissionsDi = ��CDiesel × DiCons�ransp Endogenous Equation 3-102 NOxEmissionsDi = �NOxDiesel × DiCons�ransp Endogenous
Figure 3-18 Pollutant emission that affect air quality: Biodiesel blended by diesel sub-model
In this sub-model there are input indicators that come from of other sub-models, as Table 3-15
shows.
Table 3-15 Inputs indicators used in pollutant emission that affect air quality: biodiesel blended by diesel sub-model Indicator Symbol Sub-model of origin Mix ratio biodiesel - diesel MxRtBdDi Biodiesel production Diesel consumed in transport sector DiConsTransp
3.4.5 Testing and analysis
Once the model was defined and its boundaries were established, the following step in the SD
methodology is the validation. To validate a SD model three validation criterion were defined.
Stok of Pollutant Emissions that affect air quality: Bd blend
Pollutant Emissions that affect air quality: Bd blend
Fraction driving NOx Emissions Change
Fraction driving PM Emissions Change
Fraction driving CO Emissions Change
Fraction driving HC Emissions Change
NOx Emission Factor of Diesel
PM Emission Factor of DieselCO Emission Factor of Diesel
HC Emission Factor of Diesel
Stock CO Emissions by Biodiesel blend
CO Emissions of Biodiesel blended by Diesel
Stock PM Emissions by Biodiesel blend
PM Emissions of Biodiesel blended by Diesel
Stock HC Emissions by Biodiesel blend
HC Emissions of Biodiesel blended by Diesel
Stock NOx Emissions by Biodiesel blend
NOx Emissions of Biodiesel blended by Diesel
Mix Ratio Biodiesel and Diesel
Mix Ratio Biodiesel and Diesel
Mix Ratio Biodiesel and Diesel
Mix Ratio Biodiesel and Diesel
Diesel Consumed in
Transport Sector

118 Sustainability assessment of biodiesel production in Colombia
The first criterion is the correspondence between structures, the second is the correspondence
between behaviors and the third is the correspondence between phenomena.
To validate the correspondence between structures, the integral causal diagram in Figure 3-8
was validated through expert consultation. It was validated by personal interviews with five
Colombian experts of biodiesel production, who confirmed the relationships established. The
correspondence between behaviors and phenomena are measured by the Mean Absolute
Percentage Error (MAPE), which calculates the accuracy of the model prediction, defining a
MAPE up to 30% as valid (Barlas 1989; Barlas 1994). To calculate MAPE, the model was used
to simulate behaviors and phenomena; the values generated by the model were compared
against the collected historical values between 1999 and 2013. The MAPEs of some indicators
(the most important for the SD model) are presented in Table 3-16, where it can be noted that
they are lower than 30%. Then, according to this validation criterion the causal relationships
and equations satisfied validation condition, and the SD model could represent adequately the
behavior of the sustainability assessment of biodiesel production in Colombia (Appendix 3
describes the statistics issues).
Table 3-16 Dynamic model validation using MAPE
Indicator MAPE 1999-2013 Agricultural land 10.04% Forest and ecosystems lands 2.85% Land for palm cultivation 2.62% Better Quality Employment in Palm Cultivation 4.70% Biodiesel production 1G 15.04% Biodiesel production capacity 1G 17.45% Crop yield in palm cultivation 5.31% Detriment of Quality Employment in Palm Cultivation 4.90% Index of energy diversity of Colombia 13% Land Concentration Index: GINI 0.20% Livestock land 1.34% NER – Net energy ratio 5.30% Palm oil production 5.68% Poor population 6.40% Population displaced by violence 21.70% Profit Biodiesel Production 1G 14% Biodiesel price 6.67% Biodiesel production costs 6.80% Diesel consumed in transport sector 7.90% Diesel price 4.07% Fraction driving CO Emissions Change 0.20% Fraction driving PM Emissions Change 0.10% Fraction driving HC Emissions Change 0.30% Fraction driving NOx Emissions Change 0.20% Mix ration biodiesel - diesel 0.90% Palm oil price 16.02% Others Biodiesel Production Costs Dependent of Biodiesel Production 3.50% Percentage GHG saving in life cycle of biodiesel production 4.02%

Chapter 3 119
Conclusions
Using system dynamics methodology, a model to assess the sustainability of biodiesel
production in Colombia was established and validated. It was based on the sustainability
assessment framework presented in Chapter 2, which includes principles, criteria and indicators
for the five sustainability dimensions defined in this work.
SD methodology enables the articulation of the problem and its conceptualization through
causal loop diagrams. These diagrams describe the complex relationships between dimensions
and indicators, as well as the polarity of the effects and the feedback structures of biodiesel
production, integrating the economic, social, environmental, political and technological
indicators. The SD model is defined by five sub-models: biodiesel production, land and social,
water, net energy ratio, greenhouse gas saving in the life cycle of biodiesel and pollutant
emissions that affect air quality: Biodiesel blended by diesel. The validation of the model
through MAPE test confirms the correspondence between structures and phenomena.

120 Sustainability assessment of biodiesel production in Colombia

4 Chapter 4: System dynamic model of sustainability
assessment of biodiesel production in Colombian
context - Results
Introduction
Conduct biodiesel production on sustainable principles is fundamental to ensuring an
appropriate local development (Silalertruksa and Gheewala 2012). The objective of the
definition and design of the system dynamic (SD) model described in Chapter 3 is to develop a
tool that allows the decision maker to predict the behavior of the biodiesel production system
in Colombian context considering different conditions for its development and, finally, to
establish which of these conditions will generate biodiesel production accomplishing
sustainable principles. In this chapter, the SD model presented in Chapter 3 and implemented
in software Stella® , is going to be used to simulate the biodiesel production in Colombian
context considering baseline conditions.
The baseline considers that current conditions for biodiesel production, represented by the
exogenous indicators, will be the same during all the period under analysis (from 2014 to 2030).
As a consequence, the trends and functions between 1999 and 2013 will be the same up to 2030.
After, some exogenous indicators of the baseline scenario will be modified in order to generate
a sensibility analysis to define several fundamental conditions for the sustainable biodiesel
production in the Colombian context. Once the sensibility analyses have been conducted, the
conditions that promote or discourage biodiesel production could be identified. Consequently,
optimistic and pessimistic scenarios are proposed.
The results of the analysis of the scenarios can help institutions, decision-makers and other
agents related to establish the conditions to be carried out to promote a sustainable biodiesel
production, in order to make more robust decisions about the management of this system.
4.1 Baseline
The baseline scenario considers that the current status of Colombian biodiesel production will
be constant during all the period under analysis (2014 to 2030). This scenario takes into account

122 Sustainability assessment of biodiesel production in Colombia
that the endogenous and exogenous indicators presented in Chapter 3, Table 3-1 and Table 3-2,
which represents the dynamics of the Colombian biodiesel system between 1999 and 2013, will
represent the behavior from 2014 to 2030. The specification to simulate the system is: Length
of simulation from 1999 (time 0) to 2030 (time 31), unit of time years, and Euler as integration
method. Simulation results classified according to each sustainability dimension are described
following.
4.1.1 Economic dimension
The economic indicators palm oil production, biodiesel production capacity and biodiesel
production predicted by the SD model are shown in Figure 4-1. They follow the same trend of
diesel consumed in the transport sector, which will increase during the period of analysis. This
trend is expected because biodiesel is blended with diesel and therefore if the diesel market
grows biodiesel market too. In the same way, palm oil production will increase from 488,000 t
in 1999 to 850,000 t in 2030, a growth of 42% in thirty years. At the same time, biodiesel
production will increase from 520,000 t in 2013 to 988,000 t in 2030, a growth of 52% during
the period of analysis. Biodiesel production capacity predicted will increase and will be higher
than biodiesel production up to 2017. Then, between 2018 and 2030 they will be equal. As a
consequence, production capacity will limit biodiesel production as can be seen in Figure 4-1.
Estimated biodiesel consumption in transport sector will increase to 450,000 t in 2018 until
3,000,000 t in 2030, considering that the increment in blend ratio biodiesel-diesel, predicted
0.05 in 2008 and 0.26 in 2030. On the other hand, biodiesel production in 2018 will be 830,000
t and 988,000 t in 2030 (Figure 4-1). This difference will lead to an unsatisfied demand of
biodiesel in Colombia. The principal limitation for the biodiesel production increase is the
biodiesel production capacity and high biodiesel production costs (Figure 4-2), which are
greatly influenced by governmental control and support.
Figure 4-2 shows the prediction for other economic indicators. For example, palm oil price, oil
price and diesel price predicted by the model will have a similar behaviour and a continuous
increment between 2014 and 2030, although the rate of change during this period will be higher
than between 2008 and 2013. As palm oil price will increase and the production costs of
biodiesel depend on it in a percentage close to 70%, the predicted behaviour of biodiesel
production costs is similar to palm oil price. Biodiesel price will increase at the same rate of the
previously mentioned variable.

Chapter 4 123
1: Palm Oil Production 2: Diesel Consumed in Transport Sector 3: Biodiesel Production
4: Biodiesel Production Capacity 1G 5: Estimated biodiesel consumption in transport sector Figure 4-1 Graphical output of economic indicators of model in baseline
1: Biodiesel Price 2: Biodiesel Production Costs 3: Diesel Price 4: Palm Oil Price 5: Oil Price
Figure 4-2 Graphical output of economic indicators of model in baseline
Colombian government supports biodiesel sector through tax exceptions and subsidies; this led
to an increase of costs linked to biodiesel policy as shown in Figure 4-3. Biodiesel profit margin
will remain around the same value over the period of analysis, showing fluctuations produced
by the biodiesel price change. This reflects the effect of Colombian government control on the
biodiesel and diesel market, to ensure biodiesel production profitability.
1: Biodiesel Production Costs 2: Profit Biodiesel Production 3: Cost linked to Biodiesel Politic
Figure 4-3 Graphical output of economic indicators of model in baseline

124 Sustainability assessment of biodiesel production in Colombia
4.1.2 Social dimension
The social indicators population displaced by violence, and poor population predicted by the
SD model are shown in Figure 4-4, they follow similar decrease. In the SD model both
indicators are inversely proportional to lands for oil palm cultivation. Then if oil palm
cultivation increases, population displaced and poor population will decrease. This behavior
can be explained because increments in oil palm cultivation, increment rural employment. Then
the former will contribute to local economies (Fedesarrollo 2009). In order to have a better
understanding of this phenomenon, it will be necessary to integrate other indicators to explain
that poverty and violence displaced diminish.
Figure 4-4 shows the prediction for other social indicators. Concerning land concentration index
(Gini) predicted by the SD model, this index varies depending on the changes in livestock lands,
oil palm cultivation, oil price, and biodiesel production. Gini index remains around of 0.76 to
0.77 over the period of analysis, which indicates a high concentration and inequality distribution
of land ownership. A high concentration of land is linked to poverty and violence condition in
Colombian context (Castiblanco, Etter, and Ramirez 2015). Regarding the food security
indicator predicted by the SD model (hectare of agricultural lands per hectare of palm-oil
cultivation), it shows an important reduction, from 14.5 in 1999 to 0.3 in 2030 (Figure 4-4),
especially because agricultural lands diminish too (Figure 4-5). Agricultural lands decrease in
inverse proportion to palm-oil cultivation and livestock lands. However, the effect of the latter
is greater than the influence of the former on agricultural land reduction. Furthermore, social
research identified that agricultural lands diminution could intensify poverty and violence
conditions in region influenced by oil palm cultivation (Mingorance 2006; FIAN 2009; Alvarez
R 2012).
1: Population influenced by Palm Cultivation 2 Population Displaced by violence 3: Land Concentration Index GINI 4: Poor Population 5: Food Security Indicator
Figure 4-4 Graphical output of social indicators of model in baseline

Chapter 4 125
In Colombia, palm oil is used to biodiesel production and other uses, such as foods and
oleochemical products. Other uses palm-oil sales will decrease from 2008 to 2030, as shown
in Figure 4-5. This trend is expected because more palm oil will be used for biodiesel
production. About 43% of oil palm cultivation will be used for biodiesel production in 2030.
Concerning to quality of employment in palm-oil cultivation, this indicator will diminished, but
this will not influence the amount of lands for palm-oil cultivation as shown in Figure 4-5. In
long-time, increment in oil palm cultivation will decrease the quality of employment.
1: Quality of employment in Palm Cultivation 2: Agricultural Land 3: Palm Oil Sales to other uses
4: Land for Palm Cultivation 5: Land of Palm Cultivation for Biodiesel Production Figure 4-5 Graphical output of social indicators of model in baseline
4.1.3 Environmental dimension
Environmental indicators related to pollutant emissions that affect air quality show a slight
decrease in the period of analysis as a consequence of the use of blends biodiesel – diesel as
fuel (Figure 4-6). This trend is expected because pollutant emissions are influenced by the blend
ratio. It is observed that if the blend ratio biodiesel – diesel increases, HC, CO and PM emissions
will diminish, but NOx emission will increment. The total reduction of pollutant emissions
predicted in 2030 is 2%, equivalent to 14,075 t, which is a positive but not significant impact
on air quality.

126 Sustainability assessment of biodiesel production in Colombia
1: Pollutant emission affect air quality: Biodiesel blended
2: Pollutant emission affect air quality: Diesel 100% 3: Blend Ratio Biodiesel - diesel Figure 4-6 Graphical output of environmental indicators of model in baseline
GHG emissions in the biodiesel production life cycle come from many sources as shown in
Figure 4-7 and Figure 4-8. GHG emissions by direct land use change are the largest contributor
of GHG in the life cycle, particularly in this case, due to land use change of forest and ecosystem
lands to palm-oil cultivation.
1: GHG Absorption in oil palm cultivation 2: GHG by biodiesel production and supply chain transport
3: GHG by oil palm cultivation and palm oil extraction 4: GHG by direct land use change Figure 4-7 Graphical output of environmental indicators of model in baseline scenario
Based on the indicator analysed in GHG emission sub-model, it is identified that if crop yield
in palm cultivation will decrease, and the efficiency factor (tons of palm oil consumed per tons
biodiesel produced) remains constant, the fraction of GHG emission saving predicted by SD

Chapter 4 127
model will decrease from 0.34 in 2008 to 0.24 in 2030 (Figure 4-8). If the fraction of GHG
emission saving is lower than 0.4, biodiesel produced in Colombia will be less competitive in
the international market (RFS2 2010).
1: GHG emissions by indirect land use change 2: GHG emissions if Diesel 100% is used
3: GHG emissions in life cycle of biodiesel 4: Fraction of GHG emission saving by biodiesel-diesel blended Figure 4-8 Graphical output of environmental indicators of model in baseline scenario
Figure 4-9 shows the prediction for the land use indicator. Regarding the prediction for
agricultural, forest and ecosystem lands, they will have a similar behaviour and a continuous
diminution between 1999 and 2030. On the other hand, livestock and oil palm lands will have
increments in the same period. In the case of agricultural lands, an important change is observed
from 2,000,000 ha in 1999 to 260,000 ha in 2030, a reduction of 87% in thirty years. In this SD
model the increment in palm-oil cultivation and livestock lands partially explains this
behaviour, but it is important conduct further research to clarify others factors that influence it.
1: Agricultural Land 2: Forest and Ecosystems lands 3: Land for Palm Cultivation,
4: Livestock Land 5: Biodiversity Indicator Figure 4-9 Graphical output of environmental indicators of model in baseline scenario
In Figure 4-10 is observed that agrochemicals applied and soil loss in oil palm cultivation will
increment in the period of analysis by the SD model. Crop yield in palm cultivation will
decrease from 4.1 in 1999 to 2.2 in 2030. Reduction of crop yield will influence the increment
of demand for new lands for oil palm cultivation to satisfy palm oil demand.

128 Sustainability assessment of biodiesel production in Colombia
1: Crop Yield in Oil Palm Cultivation 2: Agrochemical applied in land for Palm Cultivation,
3: Soil Loss in Palm Cultivation 4: Land for Palm Cultivation Figure 4-10 Graphical output of environmental indicators in baseline scenario
The prediction of water demanded by anthropic activities in the region influenced by oil palm
cultivation and biodiesel production, as shown in Figure 4-11 and Figure 4-12. Water demanded
predicted by livestock lands is the largest contributor of total demand. Concerning to water
scarcity index predicted has an increment of 1.81x10⁻⁸ in 1999 to 1.88×10⁻⁸ in 2030. Scarcity
index prediction is limited by the lack of annual data about water supply. Thus, in the SD model
water supply is considered constant in the period of analysis, as shown in Figure 4-12.
1: Water Demand in Biodiesel Supply Chain 2: Water Scarcity Index,
3: Agricultural Water Demand 4: Livestock Water Demand Figure 4-11 Graphical output of environmental indicators of model in baseline scenario

Chapter 4 129
1: Population Water Demand 2: Water Demand by Palm Cultivation,
3: Water Demanded by Palm Oil Extraction 4: Water Demand by Biodiesel Production 5: Water Supply Figure 4-12 Graphical output of environmental indicators of model in baseline scenario
Energy inputs in biodiesel supply chain are shown in Figure 4-13. The stages of the process that
contribute to energy inputs are: oil palm extraction, co-product treatments (kernel oil, kernel
cake and glycerol), transesterification, oil palm cultivation and transportation. In the SD model,
due they are considered constant in the period of analysis because of the scarcity of data.
Figure 4-13 Graphical output of environmental indicators of model in baseline
Figure 4-14 shows energy outputs, which are biodiesel energy, glycerol energy, palm kernel oil
energy, palm kernel cake energy and soaps energy. Net energy ratio (NER) predicted by the SD

130 Sustainability assessment of biodiesel production in Colombia
model, diminishes from 4.9 in 2008 to 2.9 in 2030. In the SD model the principal indicator that
influences NER is the crop yield in palm cultivation. Thus, the energy output follows the same
trend that variable, which will decrease during period of analysis as shown in Figure 4-18.
1: Biodiesel energy 2: Palm kernel cake energy 3: Palm kernel oil energy
4: Soaps energy 5: Glycerol energy Figure 4-14 Graphical output of environmental indicators of model in baseline
1: Net energy ration 2: Efficiency factor of palm oil tonne per biodiesel tonne 3: Crop yield in palm cultivation
Figure 4-15 Graphical output of environmental indicators of model in baseline
4.1.4 Political dimension
As mentioned previously, Colombian government supports biodiesel sector through tax
exceptions and subsidies, which in SD model are predicted through costs linked to biodiesel
policy. Figure 4-16 shows that these costs increase in the period of analysis. This condition
promotes the increment in blend ratio biodiesel-diesel, predicted 0.05 in 2008 and 0.26 in 2030.
Furthermore, in the SD model costs linked to biodiesel policy will increase, as well as biodiesel
production capacity. Taking into account that the predicted biodiesel profitability is low and
biodiesel production costs will increase, the investment in biodiesel capacity is discouraged, so
government support is necessary to promote growths in biodiesel production capacity. The

Chapter 4 131
political indicator about energy diversity index predicted by the SD model has a similar trend
than the biodiesel production.
It should be noted that if biodiesel costs increase, biodiesel profitability, net energy ratio, and
the fraction of GHG emissions saving in the life cycle of biodiesel diminish. So, it is very
important to establish what conditions justify the Colombian government support to the
biodiesel sector.
1: Mix Ratio Biodiesel and Diesel, 2: Cost linked to Biodiesel Politic,
3: Index of Energy diversity of Colombia, 4: Percentage Avoided Emissions of Greenhouse Gases Figure 4-16 Graphical output of politics indicators of model in baseline
4.1.5 Technological dimension
The technological indicators shown in Figure 4-17 and Figure 4-18 are related to the maturity
degree of first, second and third generation technologies through the evolution of the number
of patents and articles in scientific journals about these technologies, the national and
international biodiesel production, the technological efficiency factor (palm oil consumed per
biodiesel produced), the net energy ratio, the biodiesel profitability and the profit by
valorization of glycerol through PDO.
Patents and articles predicted by the SD model (published in scientific journals and data bases)
about biodiesel production of first generation are shown in Figure 4-17. They follow the same
trend of patents and articles about biodiesel production of second and third generation shown
in Figure 4-18. These trends can be linked to the technological maturity in biodiesel production.
As a consequence, the SD model predicts that valorization of glycerol is possible from 2016.
The profit by this valorization can be added to biodiesel profitability.

132 Sustainability assessment of biodiesel production in Colombia
1: Articles in Journal scientific about Biodiesel production 1G 2: Patents about Biodiesel production 1G 3: Profit of biodiesel production 4: Profit of valorization glycerol through PDO 5: Net energy ratio
Figure 4-17 Graphical output of technological indicators of model in baseline
Another possible result according to the prediction considering technological maturity is
Colombia will produce biodiesel of second and third generation. The SD model considers that
if unsatisfied biodiesel demand and international biodiesel production increase, the conditions
will be given for the ignition of Colombian second and third generation biodiesel production,
as shown in Figure 4-18. The SD model predicts that unsatisfied biodiesel demand will be high
in 2022. Thus, biodiesel production of second and third generation in Colombia will start around
this year. This production will be added to biodiesel production of first generation. Hence, with
the total biodiesel production it will be possible to satisfy biodiesel demand in the period 2022
to 2030, as is shown in Figure 4-18.
1: Patents about Biodiesel production 2G and 3G 2: Articles in journal scientific about Biodiesel production 2G and 3G
3: International Production of Biodiesel 2G and 3G 4: Colombian biodiesel production of 2G and 3G 5: Unsatisfied demand of biodiesel in transport sector
Figure 4-18 Graphical output of technological indicators of model in baseline scenario

Chapter 4 133
4.2 Sensitivity analysis
The sensitivity analysis enables to know how the SD model is sensitive to different
assumptions. The STELLA® software does provide a platform for carrying out sensitivity
simulations (Tao and Li 2007). The simulations performed in the sensitivity analysis predict
future values of selected output indicators (endogenous) through a five-replicated simulations
based on input indicators (exogenous). Simulation results are evaluated under a number of
“what if”. Each selected input indicator has an incremental variation in the established range
presented in Table 4.1. Each input indicator is simulated to know its effect on the six output
indicators. The input indicators are selected because they are linked to exogenous indicators
that are possible to be influenced by Colombian policy and governmental decisions.
Table 4-1 Input and output indicators in sensitive analyse Input indicators (exogenous) Units Range Output indicators (endogenous)
Oil price USD/t [150 - 850] 1 Biodiesel production first generation (1G)
2 Palm oil production 3 Profit biodiesel production first
generation 4 Quality of employment in palm
cultivation 5 Food security indicator
(agricultural lands per land for palm cultivation)
6 Percentage GHG emissions saving compared with diesel petrochemical used
7 Net energy ratio 8 Water scarcity index 9 Pollutant that affect air quality
by Biodiesel-diesel blended in transport sector
Diesel vehicles Dimensionless [605,000 – 2,300,000]
Factor of direct contrasts employees in palm cultivation
Dimensionless [0.25 – 0.85]
Costs linked to biodiesel politics USD [100 – 260,000]
Factor of agrochemicals applied in land for palm cultivation
t agrochemical / ha
[11 – 22]
Mix ratio biodiesel-diesel Dimensionless (v/v)
[0.08 – 0.35]
Efficiency factor technological biodiesel first generation tons palm oil per tons of biodiesel
Dimensionless [0.9 – 1.04]
Factor of land use change of forest lands to oil palm cultivation
Dimensionless [0 – 0.23]
4.2.1 Oil price
Figure 4-19 provides incremental ranges for the effect of the oil price on six output indicators
(endogenous). The results indicate that palm oil production and first generation biodiesel
production profitability are sensitive to oil price. The reason is that if oil price increases, palm
oil and biodiesel prices will increase because Colombian government must ensure a profit for
biodiesel producers. If biodiesel price increase biodiesel profitability will increase too. If palm
oil price increase, palm oil producers will lead to increment in palm-oil production. The other
output indicators are not sensitive to oil price increment.

134 Sustainability assessment of biodiesel production in Colombia
Oil price 1: 150 2: 325 3: 500 4: 675 5: 850
Biodiesel production first generation (1G)
Oil price 1: 150 2: 325 3: 500 4: 675 5: 850
Palm oil production
Oil price 1: 150 2: 325 3: 500 4: 675 5: 850
Profit biodiesel production first generation
Oil price 1: 150 2: 325 3: 500 4: 675 5: 850
Quality of employment in palm cultivation
Oil price 1: 150 2: 325 3: 500 4: 675 5: 850
Food security indicator (agricultural lands per land for palm cultivation)
Oil price 1: 150 2: 325 3: 500 4: 675 5: 850
Percentage GHG emissions saving compared with diesel petrochemical used
Oil price 1: 150 2: 325 3: 500 4: 675 5: 850
Net energy ratio
Oil price 1: 150 2: 325 3: 500 4: 675 5: 850
Water scarcity index
Oil price 1: 150 2: 325 3: 500 4: 675 5: 850
Pollutant that affect air quality by Biodiesel-diesel blended in transport sector Figure 4-19 Sensitivity analyse of Oil price on the output indicators

Chapter 4 135
4.2.2 Diesel powered vehicles
Figure 4-20 provides incremental ranges for the effect of the number of diesel powered vehicles
on six output indicators (endogenous). Results indicate that if the number of diesel powered
vehicles increase, the diesel consumption by the transport sector and the biodiesel demand will
increase. Moreover, the output indicators are not always sensitive to an increase in biodiesel
demand. This behavior is due to the fact that biodiesel production is not influenced by biodiesel
demand in Colombia.
Number of diesel powered vehicles 1: 500E3 2:1.163 3: 1.8E6 4:
2.4E6 5: 3.0E6 Biodiesel production first generation (1G)
Number of diesel powered vehicles 1: 500E3 2:1.163 3: 1.8E6 4:
2.4E6 5: 3.0E6 Palm oil production
Number of diesel powered vehicles 1: 500E3 2:1.163 3: 1.8E6 4:
2.4E6 5: 3.0E6 Profit biodiesel production first generation
Number of diesel powered vehicles 1: 500E3 2:1.163 3: 1.8E6 4:
2.4E6 5: 3.0E6 Quality of employment in palm cultivation
Number of diesel powered vehicles 1: 500E3 2:1.163 3: 1.8E6 4:
2.4E6 5: 3.0E6 Food security indicator (agricultural lands per land for palm
cultivation)
Number of diesel powered vehicles 1: 500E3 2:1.163 3: 1.8E6 4:
2.4E6 5: 3.0E6 Percentage GHG emissions saving compared with diesel
petrochemical used

136 Sustainability assessment of biodiesel production in Colombia
Number of diesel powered vehicles 1: 500E3 2:1.163 3: 1.8E6 4:
2.4E6 5: 3.0E6 Net energy ratio
Number of diesel powered vehicles 1: 500E3 2:1.163 3: 1.8E6 4:
2.4E6 5: 3.0E6 Water scarcity index
Diesel vehicles 1: 500E3 2:1.163 3: 1.8E6 4: 2.4E6 5: 3.0E6
Pollutant that affect air quality by Biodiesel-diesel blended in transport sector Figure 4-20 Sensitivity analyse of diesel vehicles on the output indicators
4.2.3 Factor of direct contracted employees in oil palm cultivation – FDCEPC
Figure 4-21 provides the incremental ranges for the effect of the FDCEPC on six output
indicators (endogenous). Results indicate that if FDCEPC increases, quality of employment in
palm cultivation will increase too. This improvement of the social indicator will encourage the
palm oil production, while the food security indicator will slightly increase as shown in Figure
4-21. Better quality of employment is linked to better quality of life and local development.
FDCEPC 1: 0.25 2:0.40 3: 0.55 4: 0.70 5: 0.85 Biodiesel production first generation (1G)
FDCEPC 1: 0.25 2:0.40 3: 0.55 4: 0.70 5: 0.85
Palm oil production
FDCEPC 1: 0.25 2:0.40 3: 0.55 4: 0.70 5: 0.85
FDCEPC 1: 0.25 2:0.40 3: 0.55 4: 0.70 5: 0.85

Chapter 4 137
Profit biodiesel production first generation Quality of employment in palm cultivation
FDCEPC 1: 0.25 2:0.40 3: 0.55 4: 0.70 5: 0.85
Food security indicator (agricultural lands per land for palm cultivation)
FDCEPC 1: 0.25 2:0.40 3: 0.55 4: 0.70 5: 0.85
Percentage GHG emissions saving compared with diesel petrochemical used
FDCEPC 1: 0.25 2:0.40 3: 0.55 4: 0.70 5: 0.85
Net energy ratio
FDCEPC 1: 0.25 2:0.40 3: 0.55 4: 0.70 5: 0.85
Water scarcity index
FDCEPC 1: 0.25 2:0.40 3: 0.55 4: 0.70 5: 0.85
Pollutant that affect air quality by Biodiesel-diesel blended in transport sector Figure 4-21 Sensitivity analyse of FDCEPC on the output indicators
4.2.4 Costs linked to biodiesel policy
Figure 4-22 provides the incremental range for the effect of costs linked to biodiesel politics on
six output indicators (endogenous). Results indicate that if Colombian government supports
biodiesel sector, the costs linked to biodiesel policy will increase. As a consequence, first
generation biodiesel production, palm-oil production and biodiesel profitability will increase
too. This behavior confirms the economic dimension analysis conducted in the SD model on
baseline condition. It reflects the effect of Colombian government control on biodiesel market,
to ensure biodiesel production profitability. The other output indicators are not sensitive to cost
linked to biodiesel policy.

138 Sustainability assessment of biodiesel production in Colombia
Costs linked to biodiesel politics 1:1 2:5.0E4 3:1.0E5 4:1.5E5 5:2.0E5
Biodiesel production first generation (1G)
Costs linked to biodiesel politics 1:1 2:5.0E4 3:1.0E5 4:1.5E5 5:2.0E5
Palm oil production
Costs linked to biodiesel politics 1:1 2:5.0E4 3:1.0E5 4:1.5E5 5:2.0E5
Profit biodiesel production first generation
Costs linked to biodiesel politics 1:1 2:5.0E4 3:1.0E5 4:1.5E5 5:2.0E5
Quality of employment in palm cultivation
Costs linked to biodiesel politics 1:1 2:5.0E4 3:1.0E5 4:1.5E5 5:2.0E5
Food security indicator (agricultural lands per land for palm cultivation)
Costs linked to biodiesel politics 1:1 2:5.0E4 3:1.0E5 4:1.5E5 5:2.0E5
Percentage GHG emissions saving compared with diesel petrochemical used
Costs linked to biodiesel politics 1:1 2:5.0E4 3:1.0E5 4:1.5E5 5:2.0E5
Net energy ratio
Costs linked to biodiesel politics 1:1 2:5.0E4 3:1.0E5 4:1.5E5 5:2.0E5
Water scarcity index
Costs linked to biodiesel politics 1:1 2:5.0E4 3:1.0E5 4:1.5E5 5:2.0E5
Pollutant that affect air quality by Biodiesel-diesel blended in transport sector Figure 4-22 Sensitivity analyse of cost linked to biodiesel politics on the output indicators

Chapter 4 139
4.2.5 Factor of agrochemicals applied in land for palm cultivation – FAALPC
Figure 4-23 provides the incremental range for the effect of FAALPC on six output indicators
(endogenous). Results indicate that if agrochemicals applied in land increase, the indicators
palm oil production, quality of employment, food security index and percentage of GHG
emission saving will decrease. This is due because if agrochemicals applied increase, soil loss
will rise and crop yield in palm cultivation will diminish. As a consequence, lands for palm
cultivation and palm oil production will diminish. On the other hand, these trends will have
positive effects on food security index and quality of employment.
FAALPC 1:11 2:14 3:17 4:20 5:22
Biodiesel production first generation (1G)
FAALPC 1:11 2:14 3:17 4:20 5:22
Palm oil production
FAALPC 1:11 2:14 3:17 4:20 5:22
Profit biodiesel production first generation
FAALPC 1:11 2:14 3:17 4:20 5:22
Quality of employment in palm cultivation
FAALPC 1:11 2:14 3:17 4:20 5:22
Food security indicator (agricultural lands per land for palm cultivation)
FAALPC 1:11 2:14 3:17 4:20 5:22
Percentage GHG emissions saving compared with diesel petrochemical used

140 Sustainability assessment of biodiesel production in Colombia
FAALPC 1:11 2:14 3:17 4:20 5:22
Net energy ratio
FAALPC 1:11 2:14 3:17 4:20 5:22
Water scarcity index
FAALPC 1:11 2:14 3:17 4:20 5:22
Pollutant that affect air quality by Biodiesel-diesel blended in transport sector
Figure 4-23 Sensitivity analyse of factor agrochemical applied in oil palm cultivation on the output indicators
4.2.6 Biodiesel-diesel blend (Mix ratio)
Figure 4-24 shows that if the biodiesel-diesel blend increases, the biodiesel production, palm
oil production and biodiesel production profitability will rise. On the other hand, food security
indicator, quality of employment and GHG emission saving will not be improved. Another
result is that an increment in the blend, higher than 0.22 (22%), does not generate sensitive
changes on the output indicators mentioned before. The blend is defined by Colombian
government and it does not respond to demand and supply laws.
Blend 1:0.08 2:0.15 3:0.22 4:29 5: 0.35
Biodiesel production first generation (1G)
Blend 1:0.08 2:0.15 3:0.22 4:29 5: 0.35
Palm oil production

Chapter 4 141
Blend 1:0.08 2:0.15 3:0.22 4:29 5: 0.35
Profit biodiesel production first generation
Blend 1:0.08 2:0.15 3:0.22 4:29 5: 0.35
Quality of employment in palm cultivation
Blend 1:0.08 2:0.15 3:0.22 4:29 5: 0.35
Food security indicator (agricultural lands per land for palm cultivation)
Blend 1:0.08 2:0.15 3:0.22 4:29 5: 0.35
Percentage GHG emissions saving compared with diesel petrochemical used
Blend 1:0.08 2:0.15 3:0.22 4:29 5: 0.35
Net energy ratio
Blend 1:0.08 2:0.15 3:0.22 4:29 5: 0.35
Water scarcity index
Mix ratio 1:0.08 2:0.15 3:0.22 4:29 5: 0.35
Pollutant that affect air quality by Biodiesel-diesel blended in transport sector Figure 4-24 Sensitivity analyse of mix ratio biodiesel -diesel on the output indicators
4.2.7 Technological efficiency factor of first generation biodiesel (palm-oil
consumed per biodiesel produced)
Figure 4-25 shows that if the technological efficiency factor decreases, which means that less
palm oil is required to produce the same quantity of biodiesel, biodiesel production profitability
and GHG emissions saving will increase. Biodiesel production profitability and biodiesel
production costs have a high dependency on palm oil price. Thus, if fewer raw materials are

142 Sustainability assessment of biodiesel production in Colombia
needed, production costs will decrease and biodiesel profitability will be higher. In the same
way, GHG emission saving will rise. Fewer raw materials are needed and less land for palm
cultivation are required. The other output indicators are not sensitive to technology efficiency
factor.
Technological efficiency factor 1:0.90 2:0.94 3:.0.97 4:1.01 5: 1.04
Biodiesel production first generation (1G)
Technological efficiency factor 1:0.90 2:0.94 3:.0.97 4:1.01 5: 1.04
Palm oil production
Technological efficiency factor 1:0.90 2:0.94 3:.0.97 4:1.01 5: 1.04
Profit biodiesel production first generation
Technological efficiency factor 1:0.90 2:0.94 3:.0.97 4:1.01 5: 1.04
Quality of employment in palm cultivation
Technological efficiency factor 1:0.90 2:0.94 3:.0.97 4:1.01 5: 1.04
Food security indicator (agricultural lands per land for palm cultivation)
Technological efficiency factor 1:0.90 2:0.94 3:.0.97 4:1.01 5: 1.04
Percentage GHG emissions saving compared with diesel petrochemical used
Technological efficiency factor 1:0.90 2:0.94 3:.0.97 4:1.01 5: 1.04
Net energy ratio
Technological efficiency factor 1:0.90 2:0.94 3:.0.97 4:1.01 5: 1.04
Water scarcity index
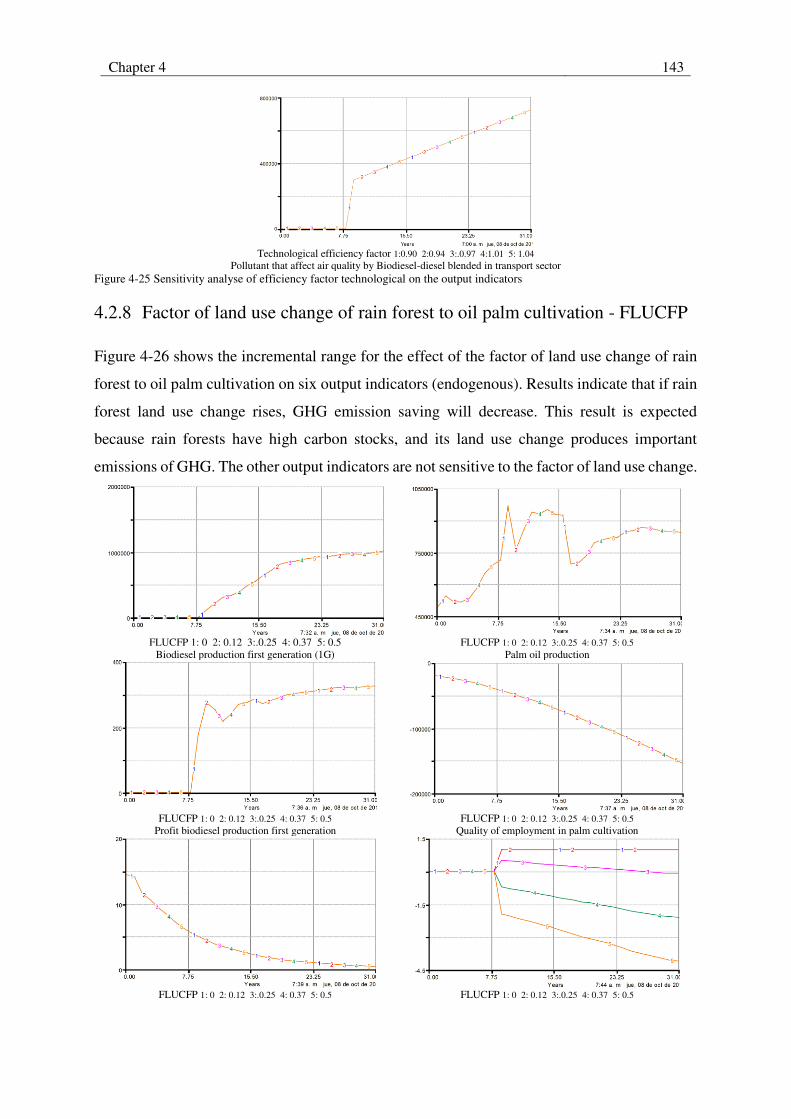
Chapter 4 143
Technological efficiency factor 1:0.90 2:0.94 3:.0.97 4:1.01 5: 1.04
Pollutant that affect air quality by Biodiesel-diesel blended in transport sector Figure 4-25 Sensitivity analyse of efficiency factor technological on the output indicators
4.2.8 Factor of land use change of rain forest to oil palm cultivation - FLUCFP
Figure 4-26 shows the incremental range for the effect of the factor of land use change of rain
forest to oil palm cultivation on six output indicators (endogenous). Results indicate that if rain
forest land use change rises, GHG emission saving will decrease. This result is expected
because rain forests have high carbon stocks, and its land use change produces important
emissions of GHG. The other output indicators are not sensitive to the factor of land use change.
FLUCFP 1: 0 2: 0.12 3:.0.25 4: 0.37 5: 0.5
Biodiesel production first generation (1G) FLUCFP 1: 0 2: 0.12 3:.0.25 4: 0.37 5: 0.5
Palm oil production
FLUCFP 1: 0 2: 0.12 3:.0.25 4: 0.37 5: 0.5
Profit biodiesel production first generation
FLUCFP 1: 0 2: 0.12 3:.0.25 4: 0.37 5: 0.5
Quality of employment in palm cultivation
FLUCFP 1: 0 2: 0.12 3:.0.25 4: 0.37 5: 0.5
FLUCFP 1: 0 2: 0.12 3:.0.25 4: 0.37 5: 0.5

144 Sustainability assessment of biodiesel production in Colombia
Food security indicator (agricultural lands per land for palm cultivation)
Percentage GHG emissions saving compared with diesel petrochemical used
FLUCFP 1: 0 2: 0.12 3:.0.25 4: 0.37 5: 0.5
Net energy ratio FLUCFP 1: 0 2: 0.12 3:.0.25 4: 0.37 5: 0.5
Water scarcity index
FLUCFP 1: 0 2: 0.12 3:.0.25 4: 0.37 5: 0.5
Pollutant that affect air quality by Biodiesel-diesel blended in transport sector Figure 4-26 Sensitivity analyse of factor of land use change of forest lands to oil palm cultivation on the output indicators
4.2.9 Sensitivity analysis summarized
With the objective to know if each input indicator will be increment what the effect on output
indicator sensitivity analysis is conducted. The sensitivity analyses results are summarised in
Table 4-2.
Table 4-2 Summary of sensitivity analysis (sensitivity kind: no sensitive, law increment, high increment, law diminish, high diminish)
Output Input
Biodiesel production
Palm oil production
Profit biodiesel
Quality of employment
Food security
GHG saving
NER Water scarcity
Pollution emission
Oil price No sensitive
high increment high increment
No sensitive No sensitive
No sensitive
No sensitive
No sensitive
No sensitive
Diesel vehicles
No sensitive Law increment
No sensitive Law increment
Law increment
Law increment
Law increment
high increment
high increment
Employment factor
No sensitive Law increment
No sensitive high increment
Law increment
Law increment
Law increment
Law increment
No sensitive
Cost linked biodiesel politics
high increment
high increment high increment
No sensitive No sensitive
No sensitive
No sensitive
No sensitive
No sensitive
Agrochemical factor
No sensitive high diminish No sensitive high
increment high
diminish high
increment high
diminish high
increment No sensitive
Mix ratio high increment
high increment Law increment
Law increment
Law increment
Law increment
Law increment
Law increment
Law diminish
Efficiency factor
No sensitive Law increment
high increment
No sensitive No sensitive
high increment
No sensitive
No sensitive
No sensitive
Land use change factor
No sensitive No sensitive No sensitive No sensitive No sensitive
high diminish
No sensitive
No sensitive
No sensitive
4.3 Scenario analysis
Based on sensibility analyses results, the input indicators conditions that promote or discourage
sustainable biodiesel production are identified (refer Table 4-1). Consequently, optimistic and

Chapter 4 145
pessimistic scenarios are proposed. The input indicators will be increased or reduced
simultaneously in each scenario and then, the SD model response will be analysed and
discussed.
4.3.1 Optimistic scenario
In this scenario the simulation condition that promotes a sustainable biodiesel production are
described (Table 4-3). Optimistic scenario considers the following conditions:
Economic dimension: oil price and the number of diesel powered vehicles will increment.
Social dimension: factor of direct contracted employees in palm cultivation will increase.
Environmental dimension: factor of agrochemicals applied in land for palm cultivation will
diminish as well as the factor of land use change of forest lands to oil palm cultivation.
Political dimension: costs linked to biodiesel policies and blend biodiesel-diesel will increase.
Technological dimension: the efficiency factor of first generation biodiesel will be improved,
valorization of glycerol by PDO will be implemented, and biodiesel production of second and
third generation in Colombia will be promoted. Table 4-3 Optimistic scenario conditions
Input indicators (exogenous) Units Range Oil price USD/t [150 - 850] Diesel vehicles Dimensionless [605,000 – 2,300,000] Factor of direct contrasts employees in palm cultivation
Dimensionless [0.25 – 0.85]
Costs linked to biodiesel politics USD
Factor of agrochemicals applied in land for palm cultivation
t agrochemical / ha
Mix ratio biodiesel-diesel Dimensionless [0.08 – 0.35]

146 Sustainability assessment of biodiesel production in Colombia
Input indicators (exogenous) Units Range
Technological efficiency factor of first generation biodiesel (tons palm oil per tons of biodiesel)
Dimensionless
Increase of 1.02 in 2008 to 0.9 in 2030
Factor of land use change of forest lands to oil palm cultivation
Dimensionless
There are valorization of glycerol by PDO There are biodiesel productions of second and third generation in Colombia. There are diminutions of oil palm cultivation as a consequence of biodiesel production of second and third generation in Colombia.
4.3.1.1 Economic dimension
Figure 4-27 shows the results of the optimistic scenario, in which biodiesel production will be
1,855,000 t in 2030 and biodiesel production capacity will be 2,190,000 t at the same year. In
baseline scenario both economic indicators in 2030 will increase up to 988,000 t. These
economic indicators are highly influenced by Colombia governmental support, described
through the increment in the costs linked to biodiesel policy and blend biodiesel-diesel.
1: Palm Oil Production 2: Diesel Consumed in Transport Sector 3: Biodiesel Production
4: Biodiesel Production Capacity 1G 5: Estimated biodiesel consumptions in transport sector Figure 4-27 Graphical output of economic indicators of model in optimistic scenario

Chapter 4 147
In optimistic scenario oil price will increase, so palm-oil price will increase too. As a
consequence, biodiesel production costs will increase, and Colombian government will have to
increase biodiesel price with the aim to ensure biodiesel profitability. Another effect if biodiesel
price rises is that diesel price might follow the same trend, which could result in higher
transportation costs.
1: Biodiesel Price 2: Biodiesel Production Costs 3: Diesel Price 4: Palm Oil Price 5: Oil Price
Figure 4-28 Graphical output of economic indicators of model in optimistic scenario
A relevant change in this optimistic scenario is related to increment in biodiesel profitability in
comparison to baseline scenario and the valorization of glycerol by PDO as shown in Figure
4-29. Valorization of glycerol can be added to biodiesel profitability and private investors could
be more interested in develop projects to increment biodiesel production capacity.
1: Biodiesel Production Costs 2: Profit Biodiesel Production 3: Cost linked to Biodiesel Politic
4: Valorization of glycerol by PDO Figure 4-29 Graphical output of economic indicators of model in optimistic scenario
4.3.1.2 Social dimension
Despite the increment of the Colombian governmental support to biodiesel sector, in this
scenario, characterized by increments in the oil price and in the blend biodiesel - diesel, social
indicators such as population displaced by violence, land concentration index, poor population

148 Sustainability assessment of biodiesel production in Colombia
and food security indicator, will have similar behaviors that in baseline scenario, as is shown in
Figure 4-30. Regarding palm-oil cultivation there will be a slight reduction at the end of the
period, as a consequence of the beginning of the production of second and third generation
biodiesel. However, significant positive changes will be observed in the quality of employment
as shown in Figure 4-31, due to better contract conditions of direct employees.
1: Population influenced by Palm Cultivation 2 Population Displaced by violence 3: Land Concentration Index GINI 4: Poor Population 5: Food Security Indicator
Figure 4-30 Graphical output of social indicators of model in optimistic scenario
1: Quality of employment in Palm Cultivation 2: Agricultural Land 3: Palm Oil Sales to other uses
4: Land for Palm Cultivation 5: Land of Palm Cultivation for Biodiesel Production Figure 4-31 Graphical output of social indicators of model in optimistic scenario
4.3.1.3 Environmental dimension
Regarding pollutant emissions effecting air quality by biodiesel and diesel blended, despite the
fact that the blend biodiesel- diesel will be increased, the content of air pollutants will not be
reduced in the long run, and it will have a similar trend than in the baseline scenario (Figure
4-32). The reason is the increment in the number of diesel powered vehicles.

Chapter 4 149
1: Pollutant emission affect quality air: Biodiesel blended
2: Pollutant emission affect quality air: Diesel 100% 3: Mix Ratio Biodiesel and diesel blended Figure 4-32 Graphical output of environmental indicators of model in optimistic scenario
With reference to GHG emissions along the life cycle of biodiesel production, in the optimistic
scenario they are linked to land use change and they will be reduced in comparison to the
baseline scenario. The reason is that land use change of rain forests to palm-oil cultivation will
diminish. Another positive effect of this diminution of land use change is that the percentage of
GHG emissions saving will be 100%, as shown in Figure 4-34. This means that all GHG
emission in life cycle of biodiesel production are saving.
1: GHG Absorption in oil palm cultivation 2: GHG by biodiesel production and supply chain transport
3: GHG by oil palm cultivation and palm oil extraction 4: GHG by direct land use change Figure 4-33 Graphical output of environmental indicators of model in optimistic scenario
Figure 4-34 Graphical output of environmental indicators of model in optimistic scenario
Moreover, despite biodiesel production will increase to 1,800,000 t in 2030 in the optimistic
scenario, lands for oil palm cultivation will increase in proportion similar to the predicted in the

150 Sustainability assessment of biodiesel production in Colombia
baseline conditions (Figure 4-35). This is an important result, explained by two conditions.
First, the technological efficiency factor of first generation biodiesel will improve, diminishing
the palm oil demand. Second, as a consequence, agrochemicals applied in oil palm cultivation
and soil loss will diminish, while crop yield will augment (4.1 tons of palm oil per hectare in
1999 to 3.2 in 2030 as shown in Figure 4-36, in comparison to 4.1 tons of palm oil per hectare
in 1999 to 2.1 in 2030 in the baseline scenario).
1: Agricultural Land 2: Forest and Ecosystems lands 3: Land for Palm Cultivation,
4: Livestock Land 5: Biodiversity Indicator Figure 4-35 Graphical output of environmental indicators of model in optimistic scenario
1: Crop Yield in Oil Palm Cultivation 2: Agrochemical applied in land for Palm Cultivation,
3: Soil Loss in Palm Cultivation 4: Land for Palm Cultivation Figure 4-36 Graphical output of environmental indicators of model in optimistic scenario
About the water scarcity index, it will slightly increase in the optimistic scenario as shown in
Figure 4-37. This behaviour is explained, principally, by the increment in water demand in
livestock lands (Figure 4-37). Also, palm oil extraction and biodiesel production will increment
water demand because biodiesel production will augment as shown in Figure 4-38. With respect
to energy output, it will sligtly rise in comparison to baseline scenario as shown in Figure 4-39.
The explanation is the same of the water scarcity index.

Chapter 4 151
1: Water Demand in Biodiesel Supply Chain 2: Water Scarcity Index,
3: Agricultural Water Demand 4: Livestock Water Demand Figure 4-37 Graphical output of environmental indicators of model in optimistic scenario
1: Population Water Demand 2: Water Demand by Palm Cultivation,
3: Water Demanded by Palm Oil Extraction 4: Water Demand by Biodiesel Production 5: Water Supply Figure 4-38 Graphical output of environmental indicators of model in optimistic scenario
With respect to energy output, it will sligtly rise in comparison to baseline scenario as shown
in Figure 4-39.
1: Biodiesel energy 2: Palmist cake energy 3: Palmist oil energy
4: Soaps energy 5: Glycerol purified Figure 4-39 Graphical output of environmental indicators of model in optimistic scenario
Under optimistic conditions it is observed a better result in the net energy ratio- NER (5.2 in
2008 to 4.3 in 2030, Figure 4-40) in comparison to baseline condition (4.9 in 2008 to 2.9 in
2030). Based on sensitivity analysis, net energy ratio improves if agrochemicals applied to

152 Sustainability assessment of biodiesel production in Colombia
palm-oil cultivation will diminish, which promotes that crop yield will increase. Further, if the
blend biodiesel - diesel rises, the NER will rise too.
1: Net energy ration 2: Efficiency factor of palm oil tone per biodiesel tone 3: Crop yield in palm cultivation
Figure 4-40 Graphical output of environmental indicators of model in baseline scenario
4.3.1.4 Political dimension
In baseline and optimist scenarios the blend biodiesel–diesel will increase from 0.08 in 2008 to
0.26 in 2030, duplicating the costs linked to biodiesel policy. With relation to biodiesel
production of second and third generation, three facts have effect on them: the governmental
support to local development, the increase in the biodiesel production and the international
production of biodiesel of the second and third generation. Then, Colombia will start the
production of these types of biodiesel by 2018. This fact will have a positive effect in
diminishing the land use change of rain forest and ecosystem to palm-oil cultivation. As a
consequence, the GHG savings will increase significantly. The behavior of the policy indicators
in the optimistic conditions are displayed in Figure 4-41.
1: Mix Ratio Biodiesel and Diesel, 2: Cost linked to Biodiesel Politic,
3: Index of Energy diversity of Colombia, 4: Percentage Avoided Emissions of Greenhouse Gases 5: Biodiesel production of second and third generation in Colombia
Figure 4-41 Graphical output of politic indicators of model in optimistic scenario

Chapter 4 153
4.3.1.5 Technological dimension
Technological indicators in optimistic scenario are shown in Figure 4-42 and Figure 4-43. The
main observed effect is related to the profitability of biodiesel production. Biodiesel
profitability will increase as a consequence of the oil price, the cost linked to biodiesel policy
and efficiency factor behavior, previously described. Similar to the baseline condition,
profitability by valorization of glycerol can be added to biodiesel profitability.
1: Articles in Journal scientific about Biodiesel production 1G 2: Patents about Biodiesel production 1G
3: Profit of biodiesel production 4: Net energy ratio 5: Profit of valorization glycerol through PDO Figure 4-42 Graphical output of technological indicators of model in optimistic scenario
The technological maturity trend related to patents and articles in scientific journals about
second and third generation biodiesel production shown in Figure 4-43, can be linked to
research and development investment. This condition promotes virtuous cycles improving
biodiesel profitability by by-products valorisations.
1: Patents about Biodiesel production 2G and 3G 2: Articles in journal scientific about Biodiesel production 2G and 3G
3: International Production of Biodiesel 2G and 3G 4: Colombian biodiesel production of 2G and 3G 5: Unsatisfied demand of biodiesel in transport sector
Figure 4-43 Graphical output of technological indicators of model in optimistic scenario
4.3.2. Pessimistic scenario
The simulation conditions that discourage a sustainable biodiesel production are described in
Figure 4-4 and are summarized as follows:

154 Sustainability assessment of biodiesel production in Colombia
Economic dimension: oil price and the number of diesel powered vehicles will diminish.
Social dimension: the factor of direct contracted employees in palm cultivation will increase.
Environmental dimension, the factor of agrochemicals applied in land for palm cultivation and
the factor of land use change of forest lands to oil palm cultivation will decrease.
Political dimension: costs linked to biodiesel politics will be reduced and mix ratio biodiesel-
diesel will keep constant in 0.10 from 2014 to 2030.
Technological dimension: the efficiency factor of first generation biodiesel will be constant
(1.04), there will not be valorization of glycerol nor biodiesel production of second and third
generation in Colombia. Table 4-4 Pessimistic scenario conditions
Input indicators (exogenous) Units Range Oil price USD/t [150 - 500] Diesel vehicles Dimensionless [605,000 – 1.500,000] Factor of direct contrasts employees in palm cultivation
Dimensionless [0.25 – 0.05]
Costs linked to biodiesel politics USD
Factor of agrochemicals applied in land for palm cultivation
t agrochemical / ha
Mix ratio biodiesel-diesel Dimensionless
Efficiency factor technological biodiesel first generation tons palm oil per tons of biodiesel
Dimensionless Constant = 1.04
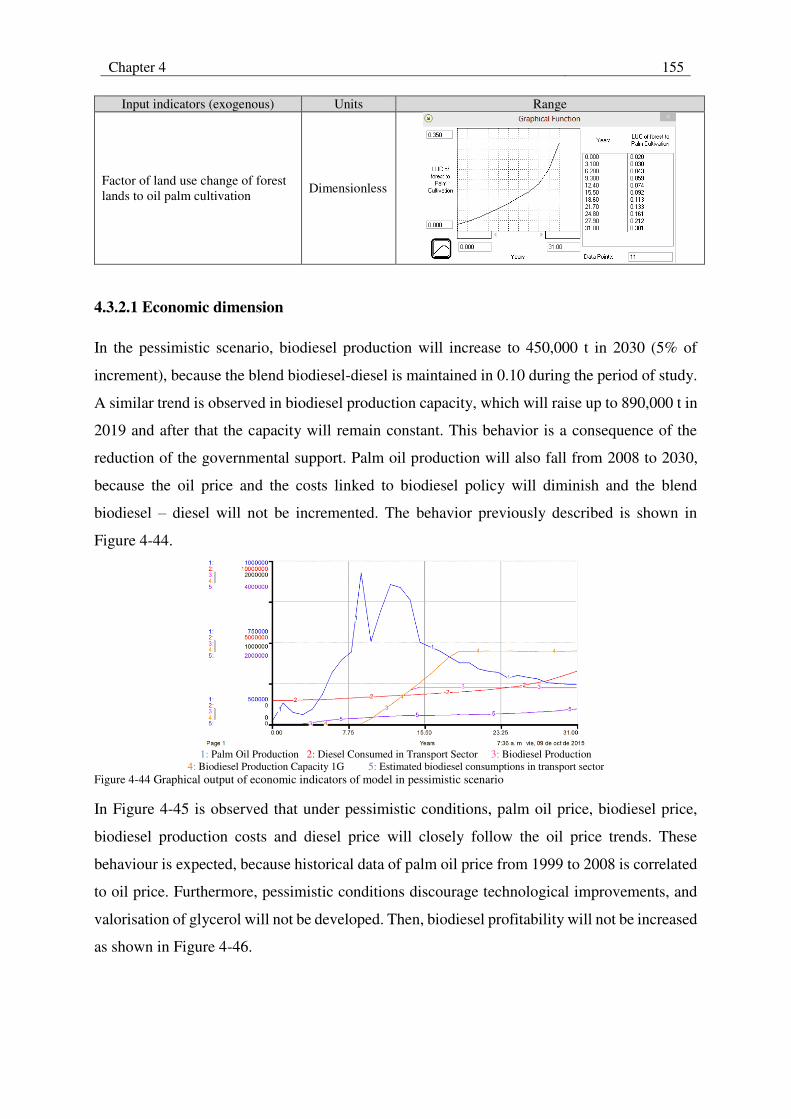
Chapter 4 155
Input indicators (exogenous) Units Range
Factor of land use change of forest lands to oil palm cultivation
Dimensionless
4.3.2.1 Economic dimension
In the pessimistic scenario, biodiesel production will increase to 450,000 t in 2030 (5% of
increment), because the blend biodiesel-diesel is maintained in 0.10 during the period of study.
A similar trend is observed in biodiesel production capacity, which will raise up to 890,000 t in
2019 and after that the capacity will remain constant. This behavior is a consequence of the
reduction of the governmental support. Palm oil production will also fall from 2008 to 2030,
because the oil price and the costs linked to biodiesel policy will diminish and the blend
biodiesel – diesel will not be incremented. The behavior previously described is shown in
Figure 4-44.
1: Palm Oil Production 2: Diesel Consumed in Transport Sector 3: Biodiesel Production
4: Biodiesel Production Capacity 1G 5: Estimated biodiesel consumptions in transport sector Figure 4-44 Graphical output of economic indicators of model in pessimistic scenario
In Figure 4-45 is observed that under pessimistic conditions, palm oil price, biodiesel price,
biodiesel production costs and diesel price will closely follow the oil price trends. These
behaviour is expected, because historical data of palm oil price from 1999 to 2008 is correlated
to oil price. Furthermore, pessimistic conditions discourage technological improvements, and
valorisation of glycerol will not be developed. Then, biodiesel profitability will not be increased
as shown in Figure 4-46.

156 Sustainability assessment of biodiesel production in Colombia
1: Biodiesel Price 2: Biodiesel Production Costs 3: Diesel Price 4: Palm Oil Price 5: Oil Price
Figure 4-45 Graphical output of economic indicators of model in pessimistic scenario
1: Biodiesel Production Costs 2: Profit Biodiesel Production 3: Valorization of glycerol by PDO
Figure 4-46 Graphical output of economic indicators of model in pessimistic scenario
4.3.2.2 Social dimension
Regarding to social indicators, pessimistic conditions influence poor population standards of
life, quality of employment and food security. In comparison with baseline scenario, poor
population will diminish between 1999 and 2020, but between 2021 and 2030 it will reach a
minimum before grow again, as shown in Figure 4-47. In the long term, under the conditions
of the pessimistic scenario, poor population will increase in comparison with the baseline
conditions. Considering that, in the SD model poor population is correlated to changes in land
for palm cultivation which will decrease as shown in Figure 4-48. However, the SD model
cannot explain all the complex conditions that influence poor population behavior.

Chapter 4 157
1: Population influenced by Palm Cultivation 2 Population Displaced by violence 3: Land Concentration Index GINI 4: Poor Population 5: Food Security Indicator
Figure 4-47 Graphical output of social indicators of model in pessimistic scenario
About quality of employment in palm-oil cultivation, it will be highly diminished because direct
employment will decrease. Agricultural lands will decrease, but from 2024 to 2030 they will
reach a steady level, similar to land for palm-oil cultivation in same period as shown in Figure
4-48. That behavior promotes that food security indicator will improve.
1: Quality of employment in Palm Cultivation 2: Agricultural Land 3: Palm Oil Sales to other uses
4: Land for Palm Cultivation 5: Land of Palm Cultivation for Biodiesel Production Figure 4-48 Graphical output of social indicators of model in pessimistic scenario
4.3.2.3 Environmental dimension
In pessimistic conditions pollutant emissions affecting air quality as a consequence of the use
of the biodiesel - diesel blend as biofuel in transportation will diminish as a consequence of the
reduction in the number of diesel powered vehicles. Based on pessimistic conditions, pollutant
emissions burning diesel will be less than pollutant emission burning biodiesel – blends, as
shown in Figure 4-49.
1: Pollutant emission affect quality air: Biodiesel blended
2: Pollutant emission effect quality air: Diesel 100% 3: Mix Ratio Biodiesel and diesel blended Figure 4-49 Graphical output of environmental indicators of model in pessimistic scenario

158 Sustainability assessment of biodiesel production in Colombia
As a consequence, lands for palm cultivation used for biodiesel production, GHG absorption in
palm oil cultivation and GHG emission by direct land use change will diminish, as shown in
Figure 4-50.
1: GHG Absorption in oil palm cultivation 2: GHG by biodiesel production and supply chain transport
3: GHG by oil palm cultivation and palm oil extraction 4: GHG by direct land use change Figure 4-50 Graphical output of environmental indicators of model in pessimistic scenario
Considering that land use change of forest lands to palm oil cultivation will increase in
pessimistic scenario, GHG emission in life cycle of biodiesel production will increase in
comparison to baseline conditions, as shown in Figure 4-51. In the same way, the fraction of
GHG emissions saving in life cycle of biodiesel will diminish.
1: GHG emissions by indirect land use change 2: GHG emissions if Diesel 100% is used
3: GHG emissions in life cycle of biodiesel 4: Fraction of GHG emission saving by biodiesel-diesel blended Figure 4-51 Graphical output of environmental indicators of model in pessimistic scenario
In the long term, as a consequence of higher poor population in pessimistic scenario compared
to baseline conditions, livestock lands will diminish in the same period, as shown in Figure
4-52, because in the SD model both indicators are correlated. It is necessary to conduct further
research to understand better the relation between poor population and livestock land use
change.

Chapter 4 159
1: Agricultural Land 2: Forest and Ecosystems lands 3: Land for Palm Cultivation,
4: Livestock Land 5: Biodiversity Indicator Figure 4-52 Graphical output of environmental indicators of model in pessimistic scenario
Due to the higher amounts of agrochemical products applied in land for palm cultivation, soil
loss will increase too. As a consequence crop yield in palm cultivation will have a critical
reduction (4.4 in 1999 to 1.7 in 2030). These behaviors are shown in Figure 4-53.
1: Crop Yield in Oil Palm Cultivation 2: Agrochemical applied in land for Palm Cultivation,
3: Soil Loss in Palm Cultivation 4: Land for Palm Cultivation Figure 4-53 Graphical output of environmental indicators of model in pessimistic scenario
Water demand will diminish in the pessimistic scenario (Figure 4-54). Water scarcity index will
diminish because water demanded by livestock lands will be lower too. Related to energy
outputs in biodiesel production, in general, all of them will diminish, due, principally, to crop
yield reduction (Figure 4-55).
1: Water Demand in Biodiesel Supply Chain 2: Water Scarcity Index,
3: Agricultural Water Demand 4: Livestock Water Demand Figure 4-54 Graphical output of environmental indicators of model in pessimistic scenario

160 Sustainability assessment of biodiesel production in Colombia
1: Biodiesel energy 2: Palmist cake energy 3: Palmist oil energy
4: Soaps energy 5: Glycerol purified Figure 4-55 Graphical output of environmental indicators of model in pessimistic scenario
4.3.2.4 Political dimension
Pessimistic scenario confirms that if costs linked to biodiesel policy will diminish and the blend
biodiesel - diesel is not increased, biodiesel production, palm oil production, biodiesel
profitability, the index of energy diversity and GHG emission saving in life cycle of biodiesel
will diminish too, as shown in Figure 4-56.
1: Mix Ratio Biodiesel and Diesel, 2: Index of Energy diversity of Colombia
3: Percentage GHG emission saving 4: Biodiesel production second and third generation Figure 4-56 Graphical output of politic indicators of model in pessimistic scenario
4.3.2.5 Technological dimension
As blend biodiesel – diesel will be kept constant between 2013 and 2030, valorization of
glycerol will not be developed, under the SD conditions, and the net energy ratio will diminish,
despite the technological maturity, as shown in Figure 4-57.
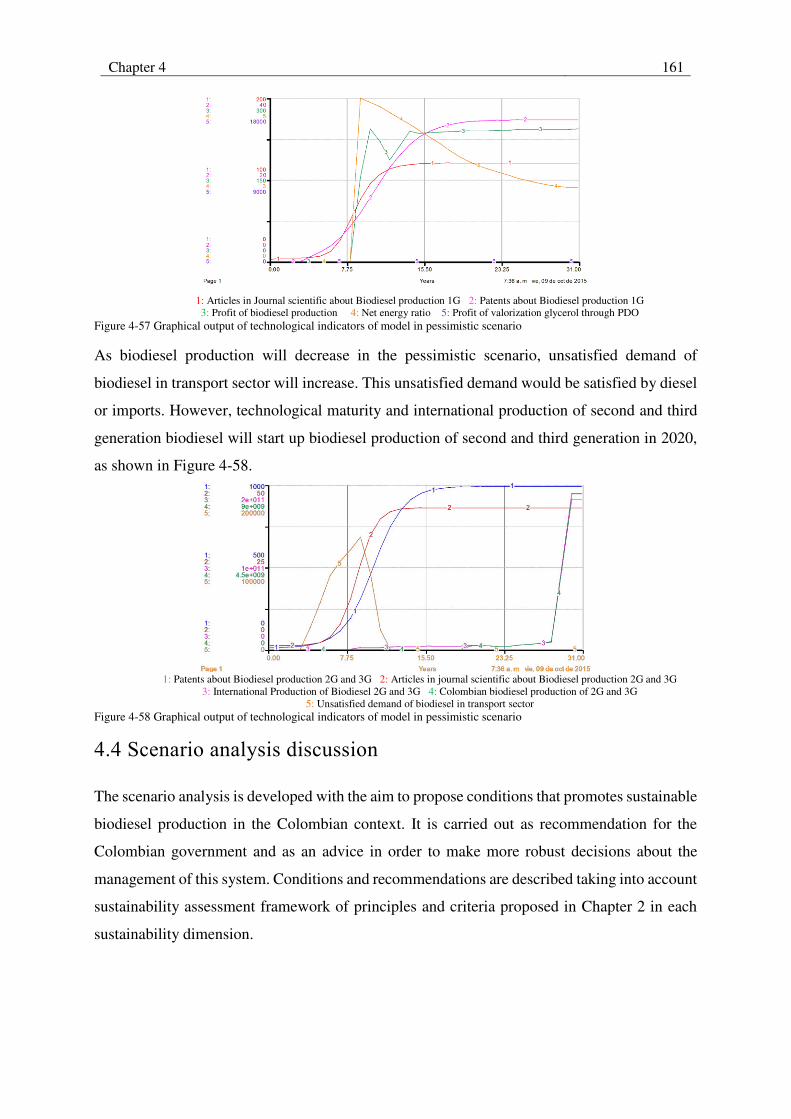
Chapter 4 161
1: Articles in Journal scientific about Biodiesel production 1G 2: Patents about Biodiesel production 1G 3: Profit of biodiesel production 4: Net energy ratio 5: Profit of valorization glycerol through PDO
Figure 4-57 Graphical output of technological indicators of model in pessimistic scenario
As biodiesel production will decrease in the pessimistic scenario, unsatisfied demand of
biodiesel in transport sector will increase. This unsatisfied demand would be satisfied by diesel
or imports. However, technological maturity and international production of second and third
generation biodiesel will start up biodiesel production of second and third generation in 2020,
as shown in Figure 4-58.
1: Patents about Biodiesel production 2G and 3G 2: Articles in journal scientific about Biodiesel production 2G and 3G
3: International Production of Biodiesel 2G and 3G 4: Colombian biodiesel production of 2G and 3G 5: Unsatisfied demand of biodiesel in transport sector
Figure 4-58 Graphical output of technological indicators of model in pessimistic scenario
4.4 Scenario analysis discussion
The scenario analysis is developed with the aim to propose conditions that promotes sustainable
biodiesel production in the Colombian context. It is carried out as recommendation for the
Colombian government and as an advice in order to make more robust decisions about the
management of this system. Conditions and recommendations are described taking into account
sustainability assessment framework of principles and criteria proposed in Chapter 2 in each
sustainability dimension.

162 Sustainability assessment of biodiesel production in Colombia
4.4.1 Economic dimension
Government policy should consider promote the increment of the blend biodiesel -
diesel up to 0.25 to 2030. However technical limitations of the engines vehicles should
be considered. Biodiesel policy and governmental subsidies should be focused to
technological improvement in biodiesel production to increase the process efficiency
and the net energy ratio, and to reduce the palm oil consumption and the water demand,
and to promote sub products valorization, especially glycerol.
4.4.2 Social dimension
Oil palm cultivation should be increased. However, it should be done improving the
quality of employment, leading to reducing displaced and poor population.
Land concentration should be diminished with the aim to reduce distribution inequality
of land ownership.
Agricultural lands should be increased due to its positive effect on food security.
According to the model prediction, if livestock lands diminish, agricultural lands will
increase. However, this behavior could be investigated in further detail.
4.4.3 Environmental dimension
Technological improvement oil palm cultivation will be conducted. Specially
looking for reduce soil loss, water demand and agrochemical use reduction.
Governmental policies should promote the reduction of forest land use change to oil
palm cultivation. This condition has important effects on GHG emission saving in
life cycle of biodiesel production.
4.4.4 Political dimension
Colombian biodiesel policy should promote technological improvement in oil palm
cultivation and biodiesel production of first, second and third generation.
Colombian government should promote strategies to enhance the added value of
biodiesel sector. The consequence will be, increase biodiesel profitability through
improving process efficiency, reduction biodiesel costs, and valorization of sub-
products.

Chapter 4 163
Private investors need benefits to develop projects to increase biodiesel production
capacity. It could be possible if biodiesel profitability increases implementing the
strategies previously mentioned. In this way, government support could be
progressively reduced.
Environmental policies should be conducted to minimize forest and ecosystem land use
change to, direct and indirect, oil palm cultivation. In this way, policies could promote
environmental or GHG emission certifications to access carbon credit market.
4.4.5 Technological dimension
Technological improvements in biodiesel production to increase process efficiency and
by-products valorization, especially glycerol, have an important effect on biodiesel
profitability and should be promoted.
Conclusions
In this chapter the SD model was used to establish a baseline scenario. A sensitivity analysis
was performed to define the conditions for an optimistic and a pessimistic scenario. Simulation
of the baseline scenario provided a consistent description of future biodiesel production in
Colombian context. The results obtained enabling to improve the understanding of the complex
relations within the biodiesel sector, the through the sustainable indicators that describe it.
It was determined that the SD model is sensitive to exogenous indicators that promote or
discourage a sustainable biodiesel production. Among the exogenous indicators is important to
mention the oil price, the number of diesel powered vehicles, the costs linked to biodiesel
policies, the agrochemicals applied in palm oil cultivation, the biodiesel-diesel blend, the
technological efficiency factor and the lands use change.
Baseline simulation, sensitivity analysis and scenario analysis show that there is no single
strategy capable of improving the sustainable biodiesel production in the five dimensions. Thus,
combined strategies such as government support hand in hand with technological
developments, food security, quality of employment increment, and reduction of forest and
ecosystem lands use change to palm oil production lands and others discussed in scenario
analysis will be promote a sustainable biodiesel production.
The SD model does not take into account all the variables and conditions to be considered in
sustainability assessment, due to the scarcity of data linked to a particular indicator. Thus, the

164 Sustainability assessment of biodiesel production in Colombia
SD model provides an appropriate tool to assess the key indicators that enable to identify
conditions and opportunities to improve biodiesel production.

5 Chapter 5: Conclusions and recommendations
5.1 Conclusions
This study contributes to the sustainability analysis knowledge by proposing a new framework,
named Triple Bottom Line Extended (TBL+), to assess biodiesel production. The framework
provides a multidimensional point of view, based on five dimensions: social, economic,
environmental, political and technological. It is comprised by 13 principles, 40 criteria, and 150
indicators, defined based on literature review. This new framework provides a hierarchical
approach to guide bioenergy assessing projects.
Principles and criteria were validated through a new methodology proposed, which permitted
the integration of expert consultation, descriptive statistical analysis and data visualization.
Expert consultation was conducted based on the following attributes of importance: relevance,
ease of measurement and reliability. These were used to grade the impact of each principle and
criterion on the assessment framework. A high correlation was identified between ease of
measurement and reliability.
The main result of the validation methodology applied was the selection of five dimensions, 13
principles and 31 criteria, recommended to perform the sustainability assessment framework
for biodiesel production. Furthermore, data visualization remarks the possibility of evaluating
two or more sustainability dimensions through one criterion.
The principles, criteria and indicators of the framework were used to design and implement in
Stella ® software a System Dynamics (SD) model. The characteristics, interaction, and
influences of the biodiesel production system were displayed in causal loops diagrams (CLD)
by each sustainability dimension. After, CLD were mathematically represented using functions
and parameters obtained from real data collected in the period 1999 – 2013.
The SD model was applied to predict the behavior in the period 2014 – 2030 for the biodiesel
production system in Colombia considering the current conditions (baseline scenario) and
conditions that promote (optimistic scenario) and discourage (pessimistic scenario) biodiesel
production. To establish the conditions of the optimistic and pessimistic scenarios, the results
obtained in the baseline simulation and a sensitivity analysis were used. The sensitivity analysis
allowed us to establish which exogenous indicators have the highest affect in the SD model.

166 Sustainability assessment of biodiesel production in Colombia
Among the exogenous indicators which have a greater influence on sustainability the most
important are: oil price, the number of diesel powered vehicles, the costs linked to biodiesel
policies, the agrochemicals applied in palm oil cultivation, the biodiesel-diesel blend, the
technological efficiency factor and the lands use change.
The scenario analysis process allowed us to generated recommendations for the decision makers
and stakeholders to make more robust decisions about the management of the Colombian
biodiesel system.
The results suggest that biodiesel policy and governmental subsidies should be focused on:
The increment of processes efficiency and net energy ratio, through technological
enhancement of the Colombian biodiesel supply chain.
The reduction of the forest lands use change to oil palm cultivation.
The reduction of palm oil consumption and water demand.
The promotion of by-products valorization, especially glycerol.
The enhancement of food security, quality of employment, technological improving in oil
palm cultivation linked to soil conservation and crop yield are recommended.
As a final thought, if biodiesel profitability increases implementing the strategies previously
mentioned, government support could be progressively reduced.
5.2 Limitations
The hierarchical sustainability assessment framework of PC&I for biodiesel production
proposed in this work has the following limitations:
First, the framework applicability is restricted to renewable energy sources whose raw
material is biomass.
Second, for assessing biodiesel production in other specific context, for example in other
country, it is necessary to define a new set of indicators for each criterion, and collect
new data to set the SD model to the new context.
Third, although the number of experts who validated the framework is significant (62),
most of them are immersed in the Latin American context, work for Universities and

Chapter 5 167
their area of expertise is Technological and Environment. Thus, it is important to
strength the validation process including experts from other geographical areas,
organizations and expertise domains. However, it is important to note that, according to
the results of the Principal Component Analysis developed in this work, the grades given
by the experts to principles and criteria were not correlated with their geographical
origin, type of organization or expertise area.
Regarding to the SD model, this does not take into account all the variables and conditions to
be considered in sustainability assessment, due to the scarcity of data linked to particular
indicators. Then, the SD model provides an appropriate tool to assess the key indicators that
enable to identify conditions and opportunities to improve biodiesel production.
Finally, the scenario analysis conducted in this study is based on academic interest and research
questions. The next step will be to propose new scenarios incorporating the points of view of
government, community, biodiesel producers and other stakeholders. After that, the results
obtained using the SD model can be communicated, diffused and confronted fed by the different
actors of the Colombian biodiesel system, making it more robust and closer to the real situation
of the system.
5.3 Recommendations
The new proposed framework implies that a hierarchical approach can provide the necessary
guidance for understanding and assessing the biodiesel production system. This work
strengthens sustainability assessments using a multidimensional view biodiesel including
social, economic, environmental, political and technological. Furthermore this work contributes
to methodological tools to validate the assessment framework, integrating expert consultation
with descriptive statistical analysis and data visualization.
The sustainability assessment for other kind of biofuels can be started with the definition of a
sustainability assessment framework based on the PC&I proposed in chapter 2. After that, it is
possible to conduct an expert validation involving community consultation. Later, it is possible
to define to design and implement the SD model, following the methodology presented in
Chapter 3.
168 Sustainability assessment of biodiesel production in Colombia
Regarding to the methodological approach used in this work, it can be generalized to another
bioenergy sources and can be summarized in the following steps:
To define a hierarchical framework of sustainability assessment that integrates
principles, criteria and indicators of sustainability based on literature review, expert
consultation and community sounding.
To define causals loops diagrams by each sustainability dimension to visualize
interrelationships of the principles, criteria, and indicator.
To convert causals loops into quantitative model, called the stock and flow diagram.
To validate a quantitative model in specific context
To identify the indicators to carry out a sensitivity analysis and to define the conditions
those promote or discourage a sustainable biofuel production in a time horizon.
This work is a starting point to assess the sustainability of biodiesel production, because several
aspects and conditions can be further considered if the historical data were available:
Promotion of commitment to ethics and transparency and compliance with local laws
Influence of engine trends in diesel powered vehicles.
Influence second and third generation biodiesel production first generation biodiesel
production, land use change, soil and water quality, and GHG emission saving in life
cycle.
Influence of national capability in biodiesel research.
Perform another sensitivity and scenario analysis on other exogenous indicators to know
the SD response.
Incorporate sustainable conditions relevant to different stakeholders in biodiesel system.
With the aim to strengthen the SD model, it is important to conduct investigations to clarify the
agricultural lands trends, and its relations with livestock lands, poor population, and other
population dynamics, as well as some employment conditions, for example the affiliation of
the employees to occupational health system. It would be interesting to analyze the influence
of costs linked to employment on biodiesel profitability, especially during palm oil cultivation.
In the economic dimension, the Colombian government will be interesting to analyze the
influence of some community organizations and workers unions on the growing of biodiesel
production.

Chapter 5 169
In technological dimension would be interesting to conduct a study about technological
substitution in biodiesel production, influence of non-edible raw materials, process
intensification, and strategies of technological transfer of scientific research to industrial
application.
The environmental indicators used in this work should be discussed with governmental
institutions related to, considering the lack of data information, especially about biodiversity
and water supply and quality, in areas influenced by palm cultivation. The SD model provides
a starting point of a future model for analyze synergistic and cumulative environmental impacts,
to medium and long term.
In the SD model a new innovative indicator was proposed related to biodiversity, quality of
employment, factor promotion of biodiesel production of second and third generation, among
others. This indicator can be studied in more detail with the aim to propose sustainability indices
in each dimension or interdimensional.

170 Sustainability assessment of biodiesel production in Colombia

6 References
Abbaszaadeh, Ahmad, Barat Ghobadian, Mohammad Reza Omidkhah, and Gholamhassan Najafi. 2012. “Current Biodiesel Production Technologies: A Comparative Review.” Energy Conversion and
Management 63: 138–148. doi:10.1016/j.enconman.2012.02.027. http://dx.doi.org/10.1016/j.enconman.2012.02.027.
Albin, Stephanie. 1997. “Building a System Dynamics Model Part 1: Conceptualization” (June): 34. Allen, David T. 2007. “Green Engineering. And the Design of Chemical Processes and Products.”
Alvarez R, Paula. 2012. Mercado de Tierras En Colombia: ¿ Acaparamiento O Soberanía? Instituto
Mayor Campesino.
Amigun, B., J.K. Musango, and a.C. Brent. 2011. “Community Perspectives on the Introduction of Biodiesel Production in the Eastern Cape Province of South Africa.” Energy 36 (5) (May): 2502–2508. doi:10.1016/j.energy.2011.01.042.
Andersen, F., F. Iturmendi, S. Espinosa, and M. S. Diaz. 2012. “Optimal Design and Planning of Biodiesel Supply Chain with Land Competition.” Computers and Chemical Engineering 47: 170–182. doi:10.1016/j.compchemeng.2012.06.044. http://dx.doi.org/10.1016/j.compchemeng.2012.06.044.
ASTM D6751. 2011. Standard Specification for Biodiesel Fuel Blend Stock ( B100 ) for Middle
Distillate. doi:10.1520/D6751-11B.2.
Augusiak, Jacqueline, Paul J. Van den Brink, and Volker Grimm. 2014. “Merging Validation and Evaluation of Ecological Models to ‘evaludation’: A Review of Terminology and a Practical Approach.” Ecological Modelling 280 (May): 117–128. doi:10.1016/j.ecolmodel.2013.11.009.
Avami, Akram. 2012. “A Model for Biodiesel Supply Chain: A Case Study in Iran.” Renewable and
Sustainable Energy Reviews 16 (6): 4196–4203. doi:10.1016/j.rser.2012.03.023. http://dx.doi.org/10.1016/j.rser.2012.03.023.
Awudu, Iddrisu, and Jun Zhang. 2012. “Uncertainties and Sustainability Concepts in Biofuel Supply Chain Management: A Review.” Renewable and Sustainable Energy Reviews 16 (2): 1359–1368. doi:10.1016/j.rser.2011.10.016. http://dx.doi.org/10.1016/j.rser.2011.10.016.
Bantz, Steven G, and Michael L Deaton. 2006. “Understanding U.S. Biodiesel Industry Growth Using System Dynamics Modeling.” IEEE Systems and Information Engineering Design Symposium: 156–161. doi:10.1109/SIEDS.2006.278731.
Barisa, Aiga, Francesco Romagnoli, Andra Blumberga, and Dagnija Blumberga. 2015. “Future Biodiesel Policy Designs and Consumption Patterns in Latvia: A System Dynamics Model.” Journal of Cleaner Production 88. Sustainable Development of Energy, Water and Environment Systems (February): 71–82. doi:10.1016/j.jclepro.2014.05.067.
Barlas, Yaman. 1989. “Multiple Tests for Validation of System Dynamics Type of Simulation Models.” European Journal of Operational Research 42 (1) (September): 59–87. doi:10.1016/0377-2217(89)90059-3.
———. 1994. “Model Validation in System Dynamics.” In International Systems Dynamics
Conference, 10. Stirling, Scotland.
Barrett, Steve. 2011. “European Expert Group Reports on Future Transport Fuels.” Fuel Cells Bulletin 2011 (2) (February): 12–16. doi:10.1016/S1464-2859(11)70096-7.
Bauen, a, C Chudziak, K Vad, and P Watson. 2010. “A Causal Descriptive Approach to Modelling the GHG Emissions Associated with the Indirect Land Use Impacts of Biofuels.” E4Tech (October):

172 Sustainability assessment of biodiesel production in Colombia
182. http://scholar.google.com/scholar?hl=en&btnG=Search&q=intitle:A+causal+descriptive+approach+to+modelling+the+GHG+emissions+associated+with+the+indirect+land+use+impacts+of+biofuels#0.
Bautista, Sandra, Paulo Narvaez, Mauricio Camargo, Olivier Chery, and Laure Morel. 2016. “Biodiesel -TBL+: A New Hierarchical Sustainability Assessment Framework of PC&I for Biodiesel Production- Part I.” Ecological Indicators 60: 84–107. doi:10.1016/j.ecolind.2015.06.020. http://dx.doi.org/10.1016/j.ecolind.2015.06.020.
Beall, Elizabeth, Paola Cadoni, and Andrea Rossi. 2012. Environment and Natural Resources
Management Working Paper. A Compilation of Tools and Methodologies to Assess the
Sustainability of Modern Bioenergy. Knowledge Creation Diffusion Utilization.
Bérard, Céline. 2010. “Group Model Building Using System Dynamics: An Analysis of Methodological Frameworks.” Electronic Journal of Business Research Methods 8 (1): 35.
BID, and Miniesterio De Minas Y Energía Colombia MME. 2012a. “Evaluación Del Ciclo de Vida de La Cadena de Producción de Biocombustibles En Colombia. Capitulo IV : Análisis de Sostenibilidad.”
———. 2012b. “Evaluación Del Ciclo de Vida de La Cadena de Producción de Biocombustibles En Colombia. Capitulo I : Introducción.”
———. 2012c. “Evaluación Del Ciclo de Vida de La Cadena de Producción de Biocombustibles En Colombia. Capitulo II : Estudio ACV – Impacto Ambiental.”
Biofuels, European. 2014. “Advanced Biofuels Research, Develpment and Demonstration in Europe.” Technology Platform. Accelerating Deployment of Advanced Biofuels in Europe. http://www.biofuelstp.eu/mapping.html.
Bioplastics News, WordPress.com. 2014. “METEX to Produce Bioplastic in Malaysia |.” http://bioplasticsnews.com/2014/03/06/metex-to-produce-bioplastics-in-malaysia/.
Bisaro, Alexander, Michael Kirk, Pandi Zdruli, and Willi Zimmermann. 2014. “Global Drivers Setting Desertification Research Priorities: Insights from a Stakeholder Consultation Forum.” Land
Degradation and Development 25 (1): 5–16. doi:10.1002/ldr.2220.
Boons, Frank, and Angelica Mendoza. 2010. “Constructing Sustainable Palm Oil: How Actors Define Sustainability.” Journal of Cleaner Production 18 (16-17): 1686–1695. doi:10.1016/j.jclepro.2010.07.003. http://dx.doi.org/10.1016/j.jclepro.2010.07.003.
BP. 2011. “Energy Outlook 2030.” Outlook. Vol. 0383. London. doi:10.5555/jan.010a.2013. www.eia.doe.gov/oiaf/aeo/.
Brent, Alan C. 2009. “The Principles of Sustainability Science To Assess Alternative Energy Technologies.” International Association for Management of Technology, IAMOT: 1– 15.
Brent, Alan C, and Josephine K Musango. 2013. “Application of a New Framework for Energy Technology Sustainability Assessment: Results from Survey.” 22nd Internationa Conference for
the International Association of Management of Thecnology IAMOT 2013 “Science, Technology and Innovation in the Emerging Market Economies”: 1–14.
Bringezu, Stefan, Meghan O Brien, and Robert W Howarth. 2009. Assessing Biofuels. UNEP, United
Nations Environment Programme. www.unep.fr.energy.
Buchholz, Thomas, Valerie a. Luzadis, and Timothy a. Volk. 2009. “Sustainability Criteria for Bioenergy Systems: Results from an Expert Survey.” Journal of Cleaner Production 17 (SUPPL. 1): S86–S98. doi:10.1016/j.jclepro.2009.04.015. http://dx.doi.org/10.1016/j.jclepro.2009.04.015.
Bueren, Erik Lammerts Van, and Esther Blom. 1996. “Hierarchical Framework for the Formulation of Sustainable Forest Management Standards:” 97.
Buytaert, V., B. Muys, N. Devriendt, L. Pelkmans, J. G. Kretzschmar, and R. Samson. 2011. “Towards Integrated Sustainability Assessment for Energetic Use of Biomass: A State of the Art Evaluation

References 173
of Assessment Tools.” Renewable and Sustainable Energy Reviews 15 (8): 3918–3933. doi:10.1016/j.rser.2011.07.036. http://dx.doi.org/10.1016/j.rser.2011.07.036.
Cadavid, J. G., R. D. Godoy-Silva, P. C. Narvaez, M. Camargo, and C. Fonteix. 2013. “Biodiesel Production in a Counter-Current Reactive Extraction Column: Modelling, Parametric Identification and Optimisation.” Chemical Engineering Journal 228: 717–723. doi:10.1016/j.cej.2013.05.040. http://dx.doi.org/10.1016/j.cej.2013.05.040.
Castanheira, Érica Geraldes, Helmer Acevedo, and Fausto Freire. 2014. “Greenhouse Gas Intensity of Palm Oil Produced in Colombia Addressing Alternative Land Use Change and Fertilization Scenarios.” Applied Energy 114: 958–967. doi:10.1016/j.apenergy.2013.09.010.
Castiblanco, Carmenza, Andrés Etter, and Alberto Ramirez. 2015. “Impacts of Oil Palm Expansion in Colombia: What Do Socioeconomic Indicators Show?” Land Use Policy 44: 31–43. doi:10.1016/j.landusepol.2014.10.007. http://linkinghub.elsevier.com/retrieve/pii/S0264837714002245.
Cavalett, Otávio, and Enrique Ortega. 2010. “Integrated Environmental Assessment of Biodiesel Production from Soybean in Brazil.” Journal of Cleaner Production 18 (1): 55–70. doi:10.1016/j.jclepro.2009.09.008.
Cepal. 2011. “Investigación Y Desarrollo E Innovación Para El Desarrollo de Los Biocombustibles En América Latina Y El Caribe.”
Cherubini, Francesco, and Anders Hammer Strømman. 2011. “Life Cycle Assessment of Bioenergy Systems: State of the Art and Future Challenges.” Bioresource Technology 102 (2): 437–451. doi:10.1016/j.biortech.2010.08.010. http://dx.doi.org/10.1016/j.biortech.2010.08.010.
Clark, James, and Duncan Macquarrie. 2002. Handbook of Green Chemistry & Technology. Edited by Balckwell Publishing.
CONPES, Consejo Nacional de Políticas Económica y Social, and Departamento Nacional de Planeación DNP. 2008. Lineamientos de Política Para Promover La Producción Sostenible de
Biocombustibles En Colombia. CONPES 3510. Colombia.
Cramer, Jacqueline, Erik Wissema, Mariska de Bruijne, Ella Lammers, Daan Dijk, Hans Jager, Sander van Dennekom, et al. 2007a. “Testing Framework for Sustainable Biomass (‘Cramer Criteria ’) - The Netherlands”: 1–16.
———. 2007b. “Testing Framework for Sustainable Biomass. Final Report from the Projecto Group ‘Sustainable Production of Biomass’:” 72.
Craven, Catherine. 2011. “The Honduran Palm Oil Industry: Employing Lessons from Malaysia in the Search for Economically and Environmentally Sustainable Energy Solutions.” Energy Policy 39 (11) (November): 6943–6950. doi:10.1016/j.enpol.2010.09.028.
Cucek, Lidija, and Zdravko Kravanja. 2012. “A Review of Footprint Analysis Tools for Monitoring Impacts on Sustainability” 34. doi:10.1016/j.jclepro.2012.02.036.
Daim, Tugrul U., Guillermo Rueda, Hilary Martin, and Pisek Gerdsri. 2006. “Forecasting Emerging Technologies: Use of Bibliometrics and Patent Analysis.” Technological Forecasting and Social
Change 73 (8): 981–1012. doi:10.1016/j.techfore.2006.04.004.
DANE, Departamento Administrativo Nacional de Estadística. 2012. “Cuenta Satélite Piloto de La Agroindustria de La Palma de Aceite En Colombia.” Vol. 3. doi:1. Departamento Administrativo Nacional de Estadística (DANE) [Internet]. [cited 2015 Mar 5]. Available from: http://www.dane.gov.co/index.php/poblacion-y-demografia/censos.
———. 2014. “Estimaciones de Población 1985 - 2005 Y Proyecciones de Población 2005 - 2020 Total Municipal.” Demografía Y Población. http://www.dane.gov.co/index.php/poblacion-y-demografia/proyecciones-de-poblacion.
de Souza, Simone Pereira, Sergio Pacca, Márcio Turra De Ávila, and José Luiz B Borges. 2010. “Greenhouse Gas Emissions and Energy Balance of Palm Oil Biofuel.” Renewable Energy 35 (11):
174 Sustainability assessment of biodiesel production in Colombia
2552–2561. doi:10.1016/j.renene.2010.03.028. http://dx.doi.org/10.1016/j.renene.2010.03.028.
de Wit, Marc, Martin Junginger, Sander Lensink, Marc Londo, and André Faaij. 2010. “Competition between Biofuels: Modeling Technological Learning and Cost Reductions over Time.” Biomass
and Bioenergy 34 (2): 203–217. doi:10.1016/j.biombioe.2009.07.012. http://dx.doi.org/10.1016/j.biombioe.2009.07.012.
Dehue, Bart, Carlo Hamelinck, Saskia De Lint, Richard Archer, and Esther Garcia. “Sustainability Reporting Within the Rtfo : Framework” (May 2007).
Delzeit, R., and K. Holm-Müller. 2009. “Steps to Discern Sustainability Criteria for a Certification Scheme of Bioethanol in Brazil: Approach and Difficulties.” Energy 34 (5): 662–668. doi:10.1016/j.energy.2008.09.007.
Draper, Norman R., H. Smith, and N. R. Draper. 1998. Applied Regression Analysis. Edición: R. New York: John Wiley & Sons.
EC, Consejo Europeo, and Parlamento Europeo EP. 2009. Relativa Al Fomento Del Uso de Energía
Procedente de Fuentes Renovables. Vol. 2008. Unión Europea.
EC, European Commision, and Biomass technology group BTG. 2008. “Sustainability Criteria & Certification Systems for Biomass Production Final Report.”
EIA, Energy Information Administration. 2011. Annual Energy Outlook 2011, with Projection to 2035. Vol. 0383. http://www.eia.gov/forecasts/aeo/.
———. 2015. “US Energy Prices.” http://www.eia.gov/forecasts/steo/tables/?tableNumber=8#.
Elibehri, Aziz, Anna Segerstedt, and Pascal Liu. 2013. “Biofuels and the Sustainability Challenge: A Global Assesment of Sustainability Issues, Trends and Policies for Biofuels and Related Feedstocks.” Rome.
Elsevier, B.V. 2015. “Scopus - Document Search.” http://www.scopus.com.ezproxy.unal.edu.co/search/form.url.
EPA, United States Environmental Protection Agency. 2002. “A Comprehensive Analysis of Biodiesel Impacts on Exhaust Emissions.” U.S. Environmental Protection Agency (October). doi:EPA420-P-02-001. www.epa.gov/.
Epa, United States Environmental Protection Agency. 2010. “Renewable Fuel Standard Program (RFS2) Summary and Analysis of Comments:” 1030.
FAO, and BEFSCI. 2011. “A Compilation of Bioenergy Sustainability Initiatives Overview.”
FAO, Food and Agriculture Organization of the United Nations. 2013. “Biofuels and the Sustainability Challenge: A Global Assessment of Policies for Biofuels and Related Feedstocks.”
———. 2014. “Pilot Testing of GBEP Sustainability Indicators for Bioenergy in Colombia.” 59. Environment and Natual Resources Management Working Paper. Energy. Rome.
Fao, Food and Agriculture Organization of the United Nations, and Bioenergy and Food Security Criteria and and Indicators Project Befsci. 2007. “Sustainability Criteria for Biomass and Biofuels:” 1–5. http://www.worldenergy.org/documents/annex8sustcritrgbelg.pdf.
FAO, Food and Agriculture Organization of the United Nations, and Bioenergy and Food Security Criteria and and Indicators project BEFSCI. 2007. “Classification , Certification and Standardization Including Lifecycle Assessments of Biofuels.”
———. 2012. “A Compilation of Tools and Methodologies to Assess the Sustainability of Modern Bioenergy.”
Fargione, Joseph, Jason Hill, David Tilman, Stephen Polasky, and Peter Hawthorne. 2008. “Land Clearing and the Biofuel Carbon Debt.” Science (New York, N.Y.) 319 (5867) (February): 1235–8. doi:10.1126/science.1152747.
FASECOLDA, Federación de Aseguradores Colombianos, and Sistema General de Riesgos Profesionales Colombia SGRP. 2013. “RLDatos - Riesgos Laborales.” Reporte Por Distribución

References 175
Geográfica. https://sistemas.fasecolda.com/rpDatos/Reportes/xGeografico.aspx.
Fedebiocombustibles, Federación Nacional de Biocombustibles Colombia. 2013. “Cifras Informativas Del Sector Biocombustibles.”
Fedepalma. 2013. “Sistema de Información Estadística Del Sector Palmero - SISPA.” http://sispaweb.fedepalma.org/SitePages/Home.aspx.
Fedesarrollo. 2009. “Estudio de Caracterización Del Empleo En El Sector Palmero Colombiano.” Bogotá.
FIAN, International. 2009. “Resultados de La Misión Internacional de Verificación Sobre Los Impactos de Los Agrocombustibles En Colombia Julio de 2009 Informe Regional Magdalena Medio.”
Fiorese, Giulia, Michela Catenacci, Elena Verdolini, and Valentina Bosetti. 2013. “Advanced Biofuels: Future Perspectives from an Expert Elicitation Survey.” Energy Policy 56: 293–311. doi:10.1016/j.enpol.2012.12.061.
Florin, M.J., G.W.J. van de Ven, and M.K. van Ittersum. 2013. “What Drives Sustainable Biofuels? A Review of Indicator Assessments of Biofuel Production Systems Involving Smallholder Farmers.” Environmental Science & Policy (October): 1–16. doi:10.1016/j.envsci.2013.09.012.
Forrester, Jay Wright. 2013. Industrial Dynamics. Martino Fine Books.
Fort, E., P. Lobies, and A. Bergeret. 2011. “Phénomène de Rupture Professionnelle Chez Des Salariés En Consultation En Service de Maladie Professionnelle. Analyse Factorielle et Classification.” Archives Des Maladies Professionnelles et de l’Environnement 72 (5) (October): 426–438. doi:10.1016/j.admp.2011.09.008.
Franco, Carlos J, and Ana M Flórez. 2009. “System Dynamics Approach to Biofuels in Colombia.” 27th
International Conference of the System Dynamics Society: 1–11.
Franco, Carlos J., Sebastian Zapata, and Isaac Dyner. 2015. “Simulation for Assessing the Liberalization of Biofuels.” Renewable and Sustainable Energy Reviews 41: 298–307. doi:10.1016/j.rser.2014.08.025. http://dx.doi.org/10.1016/j.rser.2014.08.025.
Fritsche, Uwe, Katja Hunecke, Andreas Hermann, Falk Schulze, and Kirsten Wiegmann. 2006. “Sustainability Standards for Bioenergy.” Frankfurt.
Frondel, Manuel, and Jörg Peters. 2007. “Biodiesel: A New Oildorado?” Energy Policy 35 (3): 1675–1684. doi:10.1016/j.enpol.2006.04.022.
Gaasbeek, Anne, and Ellen Meijer. 2013. “Handbook on a Novel Methodology for the Sustainability Impact Assessment of New Technologies.” Prosuite. Utrecht.
Galic, Nika, Amelie Schmolke, Valery Forbes, Hans Baveco, and Paul J. van den Brink. 2012. “The Role of Ecological Models in Linking Ecological Risk Assessment to Ecosystem Services in Agroecosystems.” Science of the Total Environment 415: 93–100. doi:10.1016/j.scitotenv.2011.05.065. http://dx.doi.org/10.1016/j.scitotenv.2011.05.065.
Gerbens-Leenes, P. W., a. R. van Lienden, a. Y. Hoekstra, and Th H. van der Meer. 2012. “Biofuel Scenarios in a Water Perspective: The Global Blue and Green Water Footprint of Road Transport in 2030.” Global Environmental Change 22 (3): 764–775. doi:10.1016/j.gloenvcha.2012.04.001. http://dx.doi.org/10.1016/j.gloenvcha.2012.04.001.
German, Laura, and George Schoneveld. 2012. “A Review of Social Sustainability Considerations among EU-Approved Voluntary Schemes for Biofuels, with Implications for Rural Livelihoods.” Energy Policy 51: 765–778. doi:10.1016/j.enpol.2012.09.022. http://dx.doi.org/10.1016/j.enpol.2012.09.022.
Gnansounou, E., a. Dauriat, J. Villegas, and L. Panichelli. 2009. “Life Cycle Assessment of Biofuels: Energy and Greenhouse Gas Balances.” Bioresource Technology 100 (21): 4919–4930. doi:10.1016/j.biortech.2009.05.067. http://dx.doi.org/10.1016/j.biortech.2009.05.067.
Gnansounou, Edgard. 2011. “Assessing the Sustainability of Biofuels: A Logic-Based Model.” Energy 36 (4): 2089–2096. doi:10.1016/j.energy.2010.04.027.

176 Sustainability assessment of biodiesel production in Colombia
http://dx.doi.org/10.1016/j.energy.2010.04.027.
Godoy, Luis, and Carlos Bartó. 2002. “Validación y valoración de modelos en la Dinámica de Sistemas” (5). Revista Argentina de Enseñanza de la Ingenieria (November): 31–47.
Goedkoop, Mark, and Renilde Spriensma. 2001. “The Eco-Indicator 99 A Damage Oriented Mothod for Life Cycle Impact Assessment.”
Gonzalez, Miguel, Mauro Venturini, Witold Pognietz, Matthias Finkenrath, Trevor Kisten, and Helmer Acevedo. 2014. Bioenergy Technology 2030. Roadmap for Colombia. Ferrara.
Greenwell, H. C., M. Lloyd-Evans, and C. Wenner. 2012. “Biofuels, Science and Society.” Interface
Focus 3 (1) (December): 20120093–20120093. doi:10.1098/rsfs.2012.0093.
Groom, Martha J., Elizabeth M. Gray, and Patricia a. Townsend. 2008. “Biofuels and Biodiversity: Principles for Creating Better Policies for Biofuel Production.” Conservation Biology 22 (3): 602–609. doi:10.1111/j.1523-1739.2007.00879.x.
Gudmundsson, Henrik. 2008. “10 European Transportation in the Greenhouse — System and Policy Indicators.” Climate Change and Energy Pathways for the Mediterranean.
Guinée, Jeroen, and Arnold Tukker. 2002. Handbook on Life Cycle Assessment. Kluwer Academic Publishers.
Hacking, Theo, and Peter Guthrie. 2008. “A Framework for Clarifying the Meaning of Triple Bottom-Line, Integrated, and Sustainability Assessment.” Environmental Impact Assessment Review 28 (2-3): 73–89. doi:10.1016/j.eiar.2007.03.002.
Halog, Anthony, and Yosef Manik. 2011. “Advancing Integrated Systems Modelling Framework for Life Cycle Sustainability Assessment.” Sustainability 3 (2): 469–499. doi:10.3390/su3020469.
Hastie, Trevor, Robert Tibshirani, and Jerome Friedman. 2009. “The Elements of Statistical Learning.” The Mathematical Intelligencer 27: 721. doi:10.1007/b94608.
Herman, Ivan, Ieee Computer Society, Guy Melanc, and M Scott Marshall. 2000. “Graph Visualization and Navigation in Information Visualization : A Survey.” IEEE Transactions on Visualization and
Computer Graphics 6 (1): 24–43. doi:1077-2626.
Hill, Jason, Erik Nelson, David Tilman, Stephen Polasky, and Douglas Tiffany. 2006. “Environmental, Economic, and Energetic Costs and Benefits of Biodiesel and Ethanol Biofuels.” Proceedings of
the National Academy of Sciences of the United States of America 103 (30): 11206–11210. doi:10.1073/pnas.0604600103.
Hoon, J, and S Gan. 2010. “Recent Trends in Policies , Socioeconomy and Future Directions of the Biodiesel Industry.” Clean Techn Environ Policy 12: 213–238. doi:10.1007/s10098-009-0235-2.
Hu, Yifan. 2005. “Efficient and High Quality Force-Directed Graph Drawing.” The Mathematica
Journal 10 (1): 37–71. doi:10.3888.
ICTSD, International Centre for Trade and Sustainable Development. 2008. Biofuel Production, Trade
and Sustainable Development. ICTSD Policy Discussion Paper. Geneva.
IDEAM. 2014. Estudio Nacional Del Agua 2014. Bogotá D.D.: Colombia.
IEA, International Energy Agency. 2011a. “Technology Roadmap - Biofuels for Transport.” Paris. doi:10.1787/9789264118461-en. papers2://publication/uuid/7E683CA3-E72A-439B-8C06-CDAADB021565.
———. 2011b. “The IEA Model of Short-Term Energy Security (MOSES) - Primary Energy Sources and Secondary Fuels.” doi:10.1787/5k9h0wd2ghlv-en. https://www.iea.org/publications/freepublications/publication/moses_paper.pdf.
IGAC, Instituto Geográfico Agustín Codazzi. 2013. “Mapas Físico Políticos 2012 Colombia.” http://www.igac.gov.co:10040/wps/portal/igac/raiz/iniciohome/MapasdeColombia/Mapas/Departamentales.
Instituto Humboldt, Instituto de investigación de recursos biologicos Alexander Von Humboldt
References 177
Colombia. 2014. “Total de Especies Por Departamento.” Estadísticas Para El Portal de Datos Del
SIB Colombia - Portal de Datos SIB Colombia. http://data.sibcolombia.net/stats.htm.
Iriarte, Alfredo, Joan Rieradevall, and Xavier Gabarrell. 2012. “Transition towards a More Environmentally Sustainable Biodiesel in South America: The Case of Chile.” Applied Energy 91 (1): 263–273. doi:10.1016/j.apenergy.2011.09.024. http://dx.doi.org/10.1016/j.apenergy.2011.09.024.
Janssen, Rainer, and Dominik Damian Rutz. 2011. “Sustainability of Biofuels in Latin America: Risks and Opportunities.” Energy Policy 39 (10): 5717–5725. doi:10.1016/j.enpol.2011.01.047. http://dx.doi.org/10.1016/j.enpol.2011.01.047.
Kampman, Bettina, Anouk Grinsven, and Ha Croezen. 2012. Sustainable Alternatives for Land-Based
Biofuels in the European Union Assessment of Options and Development of a Policy Strategy. Edited by CE Delft. Delft.
Karaman, İbrahim, El Mostafa Qannari, Harald Martens, Mette Skou Hedemann, Knud Erik Bach Knudsen, and Achim Kohler. 2013. “Comparison of Sparse and Jack-Knife Partial Least Squares Regression Methods for Variable Selection.” Chemometrics and Intelligent Laboratory Systems 122 (March): 65–77. doi:10.1016/j.chemolab.2012.12.005. http://www.sciencedirect.com/science/article/pii/S016974391200250X.
Kim, Hyungtae, Seungdo Kim, and Bruce E Dale. 2009. “Gas Emissions : Some Unexplored Variables Biofuels , Land Use Change , and Greenhouse Gas Emissions : Some Unexplored Variables.” Environmental Science & Technology: 1–23. doi:10.1021/es802681k.
Kleijnen, Jack P.C. 1995. “Verification and Validation of Simulation Models.” European Journal of
Operational Research 82 (1) (April): 145–162. doi:10.1016/0377-2217(94)00016-6. http://www.sciencedirect.com/science/article/pii/0377221794000166.
Knothe, Gerhard. 2010. “Biodiesel and Renewable Diesel: A Comparison.” Progress in Energy and
Combustion Science 36 (3): 364–373. doi:10.1016/j.pecs.2009.11.004. http://dx.doi.org/10.1016/j.pecs.2009.11.004.
Knothe, Gerhard, Jon Van Gerpen, and Jurgen Krahl. 2005. The Biodiesel Handbook Editors. Edited by AOCS. Illinois.
Kumar, Sameer, and Anvar Nigmatullin. 2011. “A System Dynamics Analysis of Food Supply Chains - Case Study with Non-Perishable Products.” Simulation Modelling Practice and Theory 19 (10): 2151–2168. doi:10.1016/j.simpat.2011.06.006. http://dx.doi.org/10.1016/j.simpat.2011.06.006.
Kurka, Thomas, and David Blackwood. 2013. “Participatory Selection of Sustainability Criteria and Indicators for Bioenergy Developments.” Renewable and Sustainable Energy Reviews 24: 92–102. doi:10.1016/j.rser.2013.03.062. http://dx.doi.org/10.1016/j.rser.2013.03.062.
Le Moigne, Jea-Louis. 2006. La Théorie Du Système Général: Théorie de La Modélisation. Edited by Mcxapc. 2nd ed. Marseille: Collection Les CLASSIQUES DU RESEAU INTELLIGENCE DE LA COMPLEXITE. [email protected].
Lee, Sora, Youngjung Geum, Hakyeon Lee, and Yongtae Park. 2012a. “Dynamic and Multidimensional Measurement of Product-Service System ( PSS ) Sustainability : A Triple Bottom Line ( TBL ) -Based System Dynamics Approach.” Journal of Cleaner Production 32: 173–182. doi:10.1016/j.jclepro.2012.03.032.
———. 2012b. “Dynamic and Multidimensional Measurement of Product-Service System (PSS) Sustainability: A Triple Bottom Line (TBL)-Based System Dynamics Approach.” Journal of
Cleaner Production 32: 173–182. doi:10.1016/j.jclepro.2012.03.032. http://dx.doi.org/10.1016/j.jclepro.2012.03.032.
Lendle, Andreas, and Malorie Schaus. 2010. “Sustainability Criteria in the EU Renewable Energy Directive: Consistent with WTO Rules ?” (June 2009): 1–16.
Lewandowski, I., and a. P C Faaij. 2006. “Steps towards the Development of a Certification System for Sustainable Bio-Energy Trade.” Biomass and Bioenergy 30 (2): 83–104.

178 Sustainability assessment of biodiesel production in Colombia
doi:10.1016/j.biombioe.2005.11.003.
Lim, Steven, and Lee Keat Teong. 2010. “Recent Trends, Opportunities and Challenges of Biodiesel in Malaysia: An Overview.” Renewable and Sustainable Energy Reviews 14 (3): 938–954. doi:10.1016/j.rser.2009.10.027.
MA, Ministerio de Agricultura de Colombia. 2013. “Sistema de Estadísticas Agropecuarias.” Encuesta
Nacional Agropecuaria - DANE. http://www.agronet.gov.co/agronetweb1/Estad%C3%ADsticas.aspx.
Malça, João, and Fausto Freire. 2011. “Life-Cycle Studies of Biodiesel in Europe: A Review Addressing the Variability of Results and Modeling Issues.” Renewable and Sustainable Energy Reviews 15 (1): 338–351. doi:10.1016/j.rser.2010.09.013.
Mangoyana, Robert B., Timothy F. Smith, and Rodney Simpson. 2013. “A Systems Approach to Evaluating Sustainability of Biofuel Systems.” Renewable and Sustainable Energy Reviews 25: 371–380. doi:10.1016/j.rser.2013.05.003. http://dx.doi.org/10.1016/j.rser.2013.05.003.
Markevičius, a., V. Katinas, E. Perednis, and M. Tamašauskienė. 2010. “Trends and Sustainability Criteria of the Production and Use of Liquid Biofuels.” Renewable and Sustainable Energy
Reviews 14 (9) (December): 3226–3231. doi:10.1016/j.rser.2010.07.015.
Mata, Teresa M., Nídia S. Caetano, Carlos a V Costa, Subhas K. Sikdar, and António a. Martins. 2013. “Sustainability Analysis of Biofuels through the Supply Chain Using Indicators.” Sustainable
Energy Technologies and Assessments 3: 53–60. doi:10.1016/j.seta.2013.06.001. http://dx.doi.org/10.1016/j.seta.2013.06.001.
McBride, Allen C., Virginia H. Dale, Latha M. Baskaran, Mark E. Downing, Laurence M. Eaton, Rebecca a. Efroymson, Charles T. Garten, et al. 2011. “Indicators to Support Environmental Sustainability of Bioenergy Systems.” Ecological Indicators 11 (5): 1277–1289. doi:10.1016/j.ecolind.2011.01.010. http://dx.doi.org/10.1016/j.ecolind.2011.01.010.
Mekhilef, S., S. Siga, and R. Saidur. 2011. “A Review on Palm Oil Biodiesel as a Source of Renewable Fuel.” Renewable and Sustainable Energy Reviews 15 (4): 1937–1949. doi:10.1016/j.rser.2010.12.012. http://dx.doi.org/10.1016/j.rser.2010.12.012.
Mendoza, Guillermo, Phil Macoun, Ravi Prabhu, Doddy Sukadri, Herry Puromo, and Herlina Hartanto. 1999. Guidelines for Applying Multi-Criteria Analysis to the Assessment of Criteria an D
Indicators. The Criteria & Indicator Toolbox Series. http://www.cifor.org/acm/methods/toolbox1.html.
Michael J., Radzicki, and Taylor Robert A. 1997. Introduction to System Dynamics. Adapted fr. Vol. 1. U.S. Department of Energy’s.
Milazzo, M. F., F. Spina, S. Cavallaro, and J. C J Bart. 2013. “Sustainable Soy Biodiesel.” Renewable
and Sustainable Energy Reviews 27: 806–852. doi:10.1016/j.rser.2013.07.031. http://dx.doi.org/10.1016/j.rser.2013.07.031.
Mingorance, Fidel. 2006. “Colombia - Bélgica / Europa.”
Minminas, Ministerio De Minas Y Energía República De Colombia. 2011. “Por El Cual Se Dictan Diposiciones Aplicalbes Al Uso de Alcoholes Carburantes Y Biocombustibles Para Vehículos Automotores:” 4. http://www.minminas.gov.co/minminas/kernel/usuario_externo_normatividad/form_consultar_normas.jsp?parametro=2668&site=18.
MinTransporte, Ministerio de Transporte de Colombia. 2014. “Anuario Transporte En Cifras - Esadísticas.” https://www.mintransporte.gov.co/Documentos/documentos_del_ministerio/Estadisticas.
MM, MarketsandMarkets. 2015. “1,3-Propanediol (PDO) Market by Applications & Geography - 2021 |.” http://www.marketsandmarkets.com/Market-Reports/1-3-propanediol-pdo-market-760.html.
Mohr, Alison, and Sujatha Raman. 2013. “Lessons from First Generation Biofuels and Implications for

References 179
the Sustainability Appraisal of Second Generation Biofuels.” Energy Policy 63: 114–122. doi:10.1016/j.enpol.2013.08.033. http://dx.doi.org/10.1016/j.enpol.2013.08.033.
Moret, Artur, Délcio Rodrigues, and Lúcia Ortiz. 2006. “Sust Ainability Criteria and Indicators for Bioenergy.” http://www.neema.ufc.br/Etanol14.pdf.
Musango, Josephine K., and Alan C. Brent. 2011. “A Conceptual Framework for Energy Technology Sustainability Assessment.” Energy for Sustainable Development 15 (1): 84–91. doi:10.1016/j.esd.2010.10.005. http://dx.doi.org/10.1016/j.esd.2010.10.005.
Musango, Josephine K., Alan C. Brent, Bamikole Amigun, Leon Pretorius, and Hans Müller. 2011. “Technology Sustainability Assessment of Biodiesel Development in South Africa: A System Dynamics Approach.” Energy 36 (12): 6922–6940. doi:10.1016/j.energy.2011.09.028. http://dx.doi.org/10.1016/j.energy.2011.09.028.
———. 2012. “A System Dynamics Approach to Technology Sustainability Assessment: The Case of Biodiesel Developments in South Africa.” Technovation 32 (11): 639–651. doi:10.1016/j.technovation.2012.06.003.
Musango, Josephine Kaviti. 2012. “Technology Assessment of Renewable Energy Sustainability in South Africa. A Dissertation.” Stellenbosch University.
Nations, United. 2008. “United Nations Conference on Trade and Development Making Certification Work for Sustainable Development : The Case of Biofuels.”
Nrtee, National Round Table on the Environment and the Economy. 1999. Measuring Eco-Efficiency in
Business: Feasibility of a Core Set of Indicators.
OEDC, Organization for Economic Co-operation and Development, and FAO. 2014. “OECD-FAO Agricultural Outlook 2011-2020.”
Oehme, Ines. 2006. “Development of Ecological Standards for Biomass in the Framework of Green Electricity Labelling” (February): 78.
Oh, Pin Pin, Harrison Lik Nang Lau, Junghui Chen, Mei Fong Chong, and Yuen May Choo. 2012. “A Review on Conventional Technologies and Emerging Process Intensification (PI) Methods for Biodiesel Production.” Renewable and Sustainable Energy Reviews 16 (7): 5131–5145. doi:10.1016/j.rser.2012.05.014. http://dx.doi.org/10.1016/j.rser.2012.05.014.
ORBIT. 2015. “Orbit.com.” Patent Database. https://www.orbit.com/index.html?locale=fr&skipautologin=true#WelcomePage.
Oviedo, Sandra, Mauricio Camargo, Paulo Narváez, Laure Morel, and R. Forradellas. 2010. “Contribución de la Dinámica de sistemas a la modelización de escenarios para la evaluación de la cadena de producción de biocombustibles.” Nancy, Francia.: Université de Lorraine.
Oviedo, Sandra, Paulo Narváez, Mauricio Camargo, Laure Morel, and Forradellas. 2011. “Forecasting of the World Production of Biodiésel: A System Dynamics Modeling Approach.” In , 12. Miami USA.
Oviedo, S; Narvaez, P; Camargo, M; Morel, L;Forradellas, R. 2011. “Forecasting of the World Production of Biodiesel: A System Dynamics Modelling Approach.” East Asia.
Pavlivna, PS. 2012. “GLOBAL TRENDS IN RENEWABLE ENERGY INVESTMENT.” Р а ці а ія. Frankfurt am Main.
Pesqueira, Luli, and Pieter Glasbergen. 2013. “Playing the Politics of Scale: Oxfam’s Intervention in the Roundtable on Sustainable Palm Oil.” Geoforum 45 (March): 296–304. doi:10.1016/j.geoforum.2012.11.017.
Petiot, Jean-François, and Bernard Yannou. 2004. “Measuring Consumer Perceptions for a Better Comprehension, Specification and Assessment of Product Semantics.” International Journal of
Industrial Ergonomics 33 (6) (June): 507–525. doi:10.1016/j.ergon.2003.12.004.
Phalan, Ben. 2009. “The Social and Environmental Impacts of Biofuels in Asia: An Overview.” Applied
Energy 86 (SUPPL. 1): S21–S29. doi:10.1016/j.apenergy.2009.04.046.

180 Sustainability assessment of biodiesel production in Colombia
http://dx.doi.org/10.1016/j.apenergy.2009.04.046.
Picard, Richard R., and R. Dennis Cook. 2012. “Cross-Validation of Regression Models.” Journal of
the American Statistical Association (March 12). http://www.tandfonline.com/doi/abs/10.1080/01621459.1984.10478083.
Posada, Ja, Ca Cardona, Jc Higuita, Ja Tamayo, and Yu a Pisarenko. 2013. “Design and Economic Analysis of the Technological Scheme for 1, 3-Propanediol Production from Raw Glycerol.” … of Chemical Engineering 47 (3): 239–253. doi:10.1134/S0040579513030093. http://www.scopus.com/inward/record.url?eid=2-s2.0-84879449247&partnerID=40&md5=66f59bbefec11c6700398c4576eb3f75\nhttp://link.springer.com/article/10.1134/S0040579513030093.
Pruyt, Erik, and Gert De Sitter. 2008. “‘ Food or Energy ?’ Is That the Question ?” In , 1–20.
Romero, M. H., S. G a Flantua, K. Tansey, and J. C. Berrio. 2012. “Landscape Transformations in Savannas of Northern South America: Land Use/cover Changes since 1987 in the Llanos Orientales of Colombia.” Applied Geography 32 (2): 766–776. doi:10.1016/j.apgeog.2011.08.010. http://dx.doi.org/10.1016/j.apgeog.2011.08.010.
Rose, Prof Karl. 2014. “The WEC World Energy Scenarios to 2050” (April). RS, The Royal Society. 2008. “Sustainable Biofuels : Prospects an Challenges.”
Santori, Giulio, Giovanni Di Nicola, Matteo Moglie, and Fabio Polonara. 2012. “A Review Analyzing the Industrial Biodiesel Production Practice Starting from Vegetable Oil Refining.” Applied
Energy 92: 109–132. doi:10.1016/j.apenergy.2011.10.031. http://dx.doi.org/10.1016/j.apenergy.2011.10.031.
Scarlat, Nicolae. 2011. “Recent Developments of Biofuels / Bioenergy Sustainability Certification : A Global Overview” 39: 1630–1646. doi:10.1016/j.enpol.2010.12.039.
Scarlat, Nicolae, and Jean-François Dallemand. 2011. “Recent Developments of Biofuels/bioenergy Sustainability Certification: A Global Overview.” Energy Policy 39 (3) (March): 1630–1646. doi:10.1016/j.enpol.2010.12.039.
Schade, Burkhard, and Tobias Wiesenthal. 2011. “Biofuels: A Model Based Assessment under Uncertainty Applying the Monte Carlo Method.” Journal of Policy Modeling 33 (1): 92–126. doi:10.1016/j.jpolmod.2010.10.008.
Schaldach, Rüdiger, Jörg a. Priess, and Joseph Alcamo. 2011. “Simulating the Impact of Biofuel Development on Country-Wide Land-Use Change in India.” Biomass and Bioenergy 35 (6): 2401–2410. doi:10.1016/j.biombioe.2010.08.048.
Searchinger, Timothy, Ralph Heimlich, R A Houghton, Fengxia Dong, Amani Elobeid, Jacinto Fabiosa, Simla Tokgoz, Dermot Hayes, and Tun-hsiang Yu. 2008. “Emissions from Land-Use Change” 423 (February): 1238–1240.
Shahid, Ejaz M., and Younis Jamal. 2011. “Production of Biodiesel: A Technical Review.” Renewable
and Sustainable Energy Reviews 15 (9): 4732–4745. doi:10.1016/j.rser.2011.07.079. http://dx.doi.org/10.1016/j.rser.2011.07.079.
Silalertruksa, Thapat, and Shabbir H. Gheewala. 2012. “Environmental Sustainability Assessment of Palm Biodiesel Production in Thailand.” Energy 43 (1): 306–314. doi:10.1016/j.energy.2012.04.025. http://dx.doi.org/10.1016/j.energy.2012.04.025.
Silva Lora, Electo E., José C. Escobar Palacio, Mateus H. Rocha, Maria L. Grillo Renó, Osvaldo J. Venturini, and Oscar Almazán del Olmo. 2011. “Issues to Consider, Existing Tools and Constraints in Biofuels Sustainability Assessments.” Energy 36 (4): 2097–2110. doi:10.1016/j.energy.2010.06.012. http://dx.doi.org/10.1016/j.energy.2010.06.012.
Sivasamy, Arumugam, Kien Yoo Cheah, Paolo Fornasiero, Francis Kemausuor, Sergey Zinoviev, and Stanislav Miertus. 2009. “Catalytic Applications in the Production of Biodiesel from Vegetable Oils.” ChemSusChem 2 (4): 278–300. doi:10.1002/cssc.200800253.

References 181
Sterman, John D. 2002. “System Dynamics: Systems Thinking And Modeling For A Complex World.” ESD-WP-2003-01.13-ESD Internal Symposium.
———. 2003. “Systems Thinking and Modeling for a Complex World.”
Steyerberg, Ewout W, Frank E Harrell, Gerard J.J.M Borsboom, M.J.C Eijkemans, Yvonne Vergouwe, and J.Dik F Habbema. 2001. “Internal Validation of Predictive Models.” Journal of Clinical
Epidemiology 54 (8) (August 8): 774–781. doi:10.1016/S0895-4356(01)00341-9. http://www.jclinepi.com/article/S0895435601003419/fulltext.
Sussman, Joe. 2012. “Introduction to Engineering Systems, ESD.00 System Dynamics.” Business.
Syms, C. 2008. “Principal Components Analysis.” In Encyclopedia of Ecology, edited by Sven Erik Jørgensen and Brian D. Fath, 2940–2949. Oxford: Academic Press.
Szarka, Nora, Orsolya Kakucs, Jürgen Wolfbauer, and Alberto Bezama. 2008. “Atmospheric Emissions Modeling of Energetic Biomass Alternatives Using System Dynamics Approach.” Atmospheric
Environment 42 (3): 403–414. doi:10.1016/j.atmosenv.2007.09.051.
Tao, Zaipu, and Mingyu Li. 2007. “What Is the Limit of Chinese Coal Supplies-A STELLA Model of Hubbert Peak.” Energy Policy 35 (6): 3145–3154. doi:10.1016/j.enpol.2006.11.011.
Tickner, Tony. 2013. “11th International Specialist Conference on Biofuels in Berlin: Expert Forums on ‘Biodiesel’, ‘Bioethanol’, ‘Biomethane’ and ‘Biomass Demand for Biofuel Production’ Give Insights into the Latest Developments.” Automotive Industries AI.
Timilsina, Govinda R., and Ashish Shrestha. 2011. “How Much Hope Should We Have for Biofuels?” Energy 36 (4): 2055–2069. doi:10.1016/j.energy.2010.08.023. http://dx.doi.org/10.1016/j.energy.2010.08.023.
Ti-yan, Shen, Wang Wei-dong, H O U Min, G U O Zhao-cheng, X U E Ling, and Yang Kai-zhong. 2007. “Study on Spatio-Temporal System Dynamic Models of Urban.” Systems Engineering -
Theory & Practice 27 (1): 10–17.
Torres, O J a, P O Y Suárez, R P C Narváez, and C F J Sánchez. 2008. “Sulfonación de ésteres Metílicos Derivados Del Aceite de Palma.” Revista Corpoica-Ciencia Y Tecnología Agropecuaria 9 (2): 77–87.
Ulgiati, Sergio, Daniela Russi, and Marco Raugei. 2008. “Biofuel Production in Italy and Europe: Benefits and Costs, in the Light of the Present European Union Biofuel Policy.” Biofuels, Solar
and Wind as Renewable Energy Systems: Benefits and Risks: 465–491. doi:10.1007/978-1-4020-8654-0_18.
UPME, Unidad de planeación minero energética de Colombia. 2014. “Costo Fiscal de Subsidios Y Exenciones Tributarias Al Consumo de Gasolina Y ACPM Subdirección de Hidrocarburos.” Bogotá. http://www1.upme.gov.co/sites/default/files/news/3807/files/precios_impuestos_version_final.pdf.
UPME, Unidad de planeación minero energética de Colombia, and Miniesterio De Minas Y Energía Colombia MME. 2015. “PLAN ENERGETICO NACIONAL COLOMBIA : IDEARIO ENERGÉTICO 2050.”
UT, University of Twente. 2010. “System Theory.” https://www.utwente.nl/cw/theorieenoverzicht/Theory clusters/Communication Processes/System_Theory/.
Vaccaro, Guilherme Luís Roehe, Christopher Pohlmann, André Cirne Lima, Manoela Silveira dos Santos, Cristina Botti de Souza, and Debora Azevedo. 2010. “Prospective Scenarios for the Biodiesel Chain of a Brazilian State.” Renewable and Sustainable Energy Reviews 14 (4): 1263–1272. doi:10.1016/j.rser.2009.12.008.
Van Cauwenbergh, N., K. Biala, C. Bielders, V. Brouckaert, L. Franchois, V. Garcia Cidad, M. Hermy, et al. 2007. “SAFE-A Hierarchical Framework for Assessing the Sustainability of Agricultural

182 Sustainability assessment of biodiesel production in Colombia
Systems.” Agriculture, Ecosystems and Environment 120 (2-4): 229–242. doi:10.1016/j.agee.2006.09.006.
Van Dam, J., M. Junginger, and a. P C Faaij. 2010. “From the Global Efforts on Certification of Bioenergy towards an Integrated Approach Based on Sustainable Land Use Planning.” Renewable
and Sustainable Energy Reviews 14 (9): 2445–2472. doi:10.1016/j.rser.2010.07.010. http://dx.doi.org/10.1016/j.rser.2010.07.010.
van Dam, Jinke, Martin Junginger, André Faaij, Ingmar Jürgens, Gustavo Best, and Uwe Fritsche. 2008. “Overview of Recent Developments in Sustainable Biomass Certification.” Biomass and
Bioenergy 32 (8): 749–780. doi:10.1016/j.biombioe.2008.01.018.
van der Sluijs, Jeroen P, Matthieu Craye, Silvio Funtowicz, Penny Kloprogge, Jerry Ravetz, and James Risbey. 2005. “Combining Quantitative and Qualitative Measures of Uncertainty in Model-Based Environmental Assessment: The NUSAP System.” Risk Analysis : An Official Publication of the
Society for Risk Analysis 25 (2) (April): 481–92. doi:10.1111/j.1539-6924.2005.00604.x.
Vargas, Rosa Ramírez. 2012. “Diagnóstico Sobre La Situación de Los Trabajadores de La Agroindustria de La Palma En El Magdalena Medio Y Meta.”
Vermeulen, Sonja, and Lorenzo Cotula. 2010. “Over the Heads of Local People: Consultation, Consent, and Recompense in Large-Scale Land Deals for Biofuels Projects in Africa.” Journal of Peasant
Studies 37 (4): 899–916. doi:10.1080/03066150.2010.512463.
Wang, Zanxin, Margaret M. Calderon, and Ying Lu. 2011. “Lifecycle Assessment of the Economic, Environmental and Energy Performance of Jatropha Curcas L. Biodiesel in China.” Biomass and
Bioenergy 35 (7): 2893–2902. doi:10.1016/j.biombioe.2011.03.031. http://dx.doi.org/10.1016/j.biombioe.2011.03.031.
Ward, Joe H. 1963. “Hierarchical Grouping to Optimize an Objective Function.” Journal of the
American Statistical Association 58 (301) (March): 236–244.
World Energy Council. 2010. “Biofuels : Policies, Standards and Technologies:” 1–152.
Yáñez Angarita, Edgar Eduardo, Electo Eduardo Silva Lora, Rosélis Ester da Costa, and Ednildo Andrade Torres. 2009. “The Energy Balance in the Palm Oil-Derived Methyl Ester (PME) Life Cycle for the Cases in Brazil and Colombia.” Renewable Energy 34 (12): 2905–2913. doi:10.1016/j.renene.2009.05.007.
Yee, Kian Fei, Kok Tat Tan, Ahmad Zuhairi Abdullah, and Keat Teong Lee. 2009. “Life Cycle Assessment of Palm Biodiesel: Revealing Facts and Benefits for Sustainability.” Applied Energy 86 (SUPPL. 1): S189–S196. doi:10.1016/j.apenergy.2009.04.014. http://dx.doi.org/10.1016/j.apenergy.2009.04.014.
Zapata, Carlos David, Iván Darío Martínez, Erika Arenas Castiblanco, and Carlos Andrés Henao Uribe. 2007. “Producción de Biodiesel a Partir de Aceite Crudo de palma:1. Diseño Y Simulación de Dos Procesos Continuos.” Dyna: 71–82.
Zapata, Sebastián, Carlos J Franco, and Isaac Dyner. 2011. “Una Aproximación Desde La Dinámica de Sistemas a La Liberación Del Mercado de Los Biocombustibles En.” 9° Encuentro Colombiano
de Dinámica de Sistemas: 8.
Zheng, Yuguo, Xiaolong Chen, and Yinchu Shen. 2010. “Commodity Chemicals Derived from Glycerol, an Important Biorefinery Feedstock.” Chemical Reviews 110 (3): 1807. doi:10.1021/cr100058u.
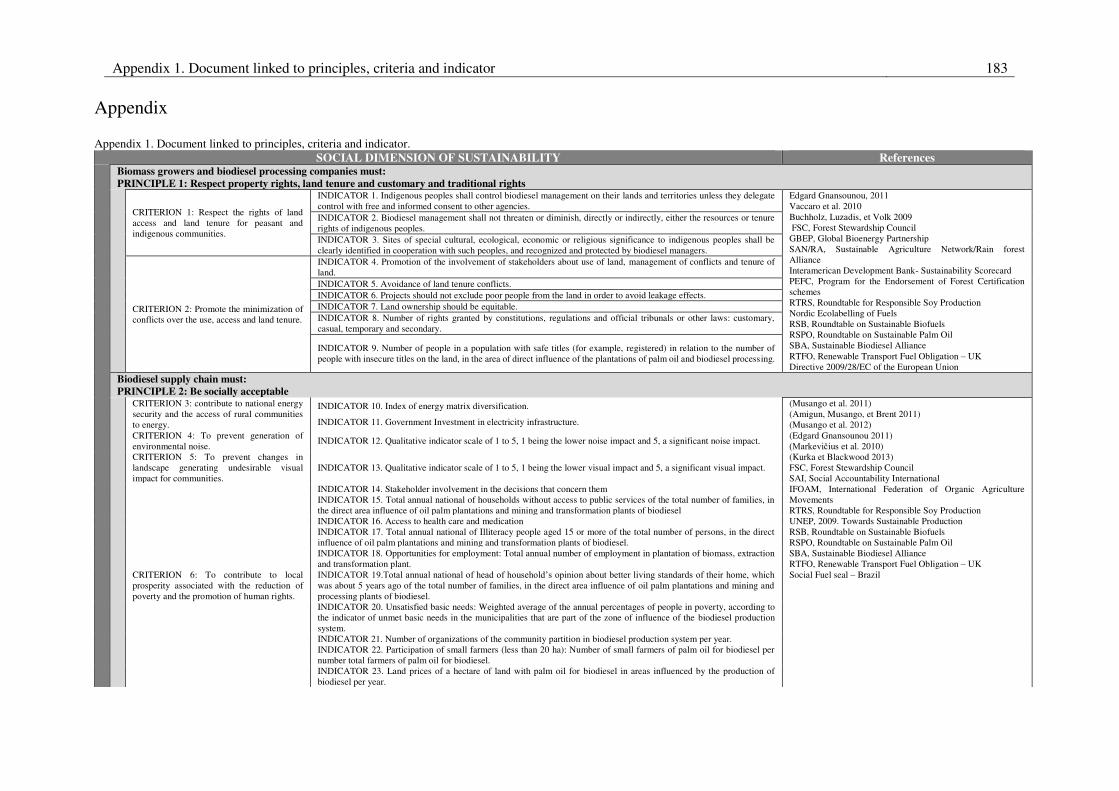
Appendix 1. Document linked to principles, criteria and indicator 183
Appendix
Appendix 1. Document linked to principles, criteria and indicator. SOCIAL DIMENSION OF SUSTAINABILITY References
Biomass growers and biodiesel processing companies must: PRINCIPLE 1: Respect property rights, land tenure and customary and traditional rights
CRITERION 1: Respect the rights of land access and land tenure for peasant and indigenous communities.
INDICATOR 1. Indigenous peoples shall control biodiesel management on their lands and territories unless they delegate control with free and informed consent to other agencies.
Edgard Gnansounou, 2011 Vaccaro et al. 2010 Buchholz, Luzadis, et Volk 2009 FSC, Forest Stewardship Council GBEP, Global Bioenergy Partnership SAN/RA, Sustainable Agriculture Network/Rain forest Alliance Interamerican Development Bank- Sustainability Scorecard PEFC, Program for the Endorsement of Forest Certification schemes RTRS, Roundtable for Responsible Soy Production Nordic Ecolabelling of Fuels RSB, Roundtable on Sustainable Biofuels RSPO, Roundtable on Sustainable Palm Oil SBA, Sustainable Biodiesel Alliance RTFO, Renewable Transport Fuel Obligation – UK Directive 2009/28/EC of the European Union
INDICATOR 2. Biodiesel management shall not threaten or diminish, directly or indirectly, either the resources or tenure rights of indigenous peoples. INDICATOR 3. Sites of special cultural, ecological, economic or religious significance to indigenous peoples shall be clearly identified in cooperation with such peoples, and recognized and protected by biodiesel managers.
CRITERION 2: Promote the minimization of conflicts over the use, access and land tenure.
INDICATOR 4. Promotion of the involvement of stakeholders about use of land, management of conflicts and tenure of land. INDICATOR 5. Avoidance of land tenure conflicts. INDICATOR 6. Projects should not exclude poor people from the land in order to avoid leakage effects. INDICATOR 7. Land ownership should be equitable. INDICATOR 8. Number of rights granted by constitutions, regulations and official tribunals or other laws: customary, casual, temporary and secondary.
INDICATOR 9. Number of people in a population with safe titles (for example, registered) in relation to the number of people with insecure titles on the land, in the area of direct influence of the plantations of palm oil and biodiesel processing.
Biodiesel supply chain must: PRINCIPLE 2: Be socially acceptable CRITERION 3: contribute to national energy
security and the access of rural communities to energy.
INDICATOR 10. Index of energy matrix diversification. (Musango et al. 2011) (Amigun, Musango, et Brent 2011) (Musango et al. 2012) (Edgard Gnansounou 2011) (Markevičius et al. 2010) (Kurka et Blackwood 2013) FSC, Forest Stewardship Council SAI, Social Accountability International IFOAM, International Federation of Organic Agriculture Movements RTRS, Roundtable for Responsible Soy Production UNEP, 2009. Towards Sustainable Production RSB, Roundtable on Sustainable Biofuels RSPO, Roundtable on Sustainable Palm Oil SBA, Sustainable Biodiesel Alliance RTFO, Renewable Transport Fuel Obligation – UK Social Fuel seal – Brazil
INDICATOR 11. Government Investment in electricity infrastructure.
CRITERION 4: To prevent generation of environmental noise.
INDICATOR 12. Qualitative indicator scale of 1 to 5, 1 being the lower noise impact and 5, a significant noise impact.
CRITERION 5: To prevent changes in landscape generating undesirable visual impact for communities.
INDICATOR 13. Qualitative indicator scale of 1 to 5, 1 being the lower visual impact and 5, a significant visual impact.
CRITERION 6: To contribute to local prosperity associated with the reduction of poverty and the promotion of human rights.
INDICATOR 14. Stakeholder involvement in the decisions that concern them INDICATOR 15. Total annual national of households without access to public services of the total number of families, in the direct area influence of oil palm plantations and mining and transformation plants of biodiesel INDICATOR 16. Access to health care and medication INDICATOR 17. Total annual national of Illiteracy people aged 15 or more of the total number of persons, in the direct influence of oil palm plantations and mining and transformation plants of biodiesel. INDICATOR 18. Opportunities for employment: Total annual number of employment in plantation of biomass, extraction and transformation plant. INDICATOR 19.Total annual national of head of household’s opinion about better living standards of their home, which was about 5 years ago of the total number of families, in the direct area influence of oil palm plantations and mining and processing plants of biodiesel. INDICATOR 20. Unsatisfied basic needs: Weighted average of the annual percentages of people in poverty, according to the indicator of unmet basic needs in the municipalities that are part of the zone of influence of the biodiesel production system. INDICATOR 21. Number of organizations of the community partition in biodiesel production system per year. INDICATOR 22. Participation of small farmers (less than 20 ha): Number of small farmers of palm oil for biodiesel per number total farmers of palm oil for biodiesel. INDICATOR 23. Land prices of a hectare of land with palm oil for biodiesel in areas influenced by the production of biodiesel per year.

184 Sustainability assessment of biodiesel production in Colombia
SOCIAL DIMENSION OF SUSTAINABILITY References INDICATOR 24. Total national of people displacement from areas affected by the number of persons received by displacement from other areas in the direct influence of oil palm plantations and mining and processing plants of biodiesel. INDICATOR 25. Total national estimated annual lands usurped hectares in areas of direct influence of the biodiesel production system. INDICATOR 26. Annual amount of conflict associated with guerrilla groups, drug trafficking, or common criminals who present in the direct influence of oil palm plantations and mining and processing plants of biodiesel.
Biodiesel supply chain must: PRINCIPLE 3: Promote responsible work conditions through all their activities
CRITERION 7: ensure that all their activities are carried out protecting health and promoting safety for employees.
INDICATOR 27. The Process Route Healthiness Index (PRHI) (Halog et Manik 2011) Edgard Gnansounou 2011) (Buchholz, Luzadis, et Volk 2009) NTA 8080, Sustainable Production of Biomass—The Netherlands CSBP, Council on Sustainable Biomass Production, the United States. ACCS, Assured Combinable Crops Scheme SAI, Social Accountability International Sustainability Guide in Biomass Production and Processing in the Biofuel chain in Colombia ISO 26000 – Responsibility social. GBEP, Global Bioenergy Partnership ISCC, International Sustainability and Carbon Certification SAN/RA, Sustainable Agriculture Network/Rain forest Alliance Bonsucro, Better Sugarcane Initiative FLO, Fairtrade Labelling Organizations International PEFC, Program for the Endorsement of Forest Certification schemes RTRS, Roundtable for Responsible Soy Production RSB, Roundtable on Sustainable Biofuels RSPO, Roundtable on Sustainable Palm Oil SBA, Sustainable Biodiesel Alliance RFS2, Renewable Fuel Standard, the United States,2010 RTFO, Renewable Transport Fuel Obligation – UK Directive 2009/28/EC of the European Union LCFS, Low Carbon Fuel Standard (LCFS), California, United States. Interamerican Development Bank- Sustainability Scorecard
INDICATOR 28. Affiliation of the employees to occupational hazards insurance INDICATOR 29. Hazardous Materials Protection: Employer provides and employeers use adequate protective clothing, appropriate safety equipment, and filtered air respirator systems and/or positive pressure cabs for workers handling highly toxic chemicals. INDICATOR 30. Number of work accidents and occupational sicknesses in the different stages of the biodiesel production system INDICATOR 31. Sanitation: Employer provides clean drinking water and clean latrines with hand-washing stations to workers. INDICATOR 32. Insurance against workplace injury: Employer provides workers compensation and disability insurance for all full time employees. INDICATOR 33. Environmental training of employees, Job instructions, on the job training INDICATOR 34. Fair Treatment of Workers
CRITERION 8: To guarantee the respect of labor laws (associated with forced child labor, discrimination, disciplinary practices, working hours, salaries, incidence of occupational accidents, illnesses and deaths, forced and compulsory labor, and unions).
INDICATOR 35. Number of workers with direct labor contracts with enterprises
INDICATOR 36. Number of workers employed through other forms of recruitment (associations, intermediary companies).
INDICATOR 37. Number of workers who belong to trade unions
INDICATOR 38. Number of workers under 18 years of age
Biomass cultivation and production of biodiesel must: PRINCIPLE 4: Prevent alteration to food supply or other local uses of biomass (e.g. energy production, as medicine raw material and as building material)
CRITERION 9: To prevent alteration to trade and food supply at the local level.
INDICATOR 39. The consumer price index (CPI) measures changes over time in the general level of prices of consumer goods and services that households acquire, use or pay for consumption.
FAO 2012) (Oviedo et al. 2011) (Timilsina et Shrestha 2011) (Pruyt et Sitter 2008) (Buchholz, Luzadis, et Volk 2009) (Markevičius et al. 2010) (Kurka et Blackwood 2013) GBEP, Global Bioenergy Partnership Interamerican Development Bank- Sustainability Scorecard NTA 8080, Sustainable Production of Biomass—The Netherlands CSBP, Council on Sustainable Biomass Production, the United States. GAP, Global Partnership for Good Agricultural Practice IFOAM, International
Federation of Organic Agriculture Movements Sustainability Guide in Biomass Production and Processing in the Biofuel chain in Colombia RTRS, Roundtable for Responsible Soy Production UNCTAD Biofuels Initiative RSB, Roundtable on Sustainable Biofuels RSPO, Roundtable on Sustainable Palm Oil RTFO, Renewable Transport Fuel Obligation – UK Social Fuel seal – Brazil Directive 2009/28/EC of the European Union Food security information network. http://www.fsincop.net/resource-centre/detail/en/c/178639/
INDICATOR 40. Undernourishment: Proportion of undernourished in the population (%). Annual number of undernourished people in the total population of the country INDICATOR 41. Amount of hectare of agricultural land and Livestock Research in active production relative to total land available with this vocation, per year. INDICATOR 42. Vulnerability Analysis and Mapping VAM, is network of food security experts who work closely with national governments, UN partners and NGOs to inform food insecurity and hunger related programs and policies.
CRITERION 10: To prevent alteration to biomass production for traditional local uses other than biodiesel (e.g. energy production, as medicine raw material and as building material).

Appendix 1. Document linked to principles, criteria and indicator 185
POLITICAL DIMENSION OF SUSTAINABILITY References PRINCIPLE 5: National promotion policies for the production and consumption of first generation biodiesel must be in accordance with international policies.
CRITERION 11: Level of agreement between the amount of biodiesel produced domestically under a subsidy scheme and the one produced internationally under similar schemes.
INDICATOR 43. Amount of USD incentive or tax in previous year less the incentive or tax in the current year with relationship the incentive or tax in the current year
(Musango et al. 2012) (Edgard Gnansounou 2011) (Vaccaro et al. 2010) (Franco et Flórez 2009) (Timilsina et Shrestha 2011) (Bantz et Deaton 2006) (Zapata, Franco, et Dyner 2011) (Markevičius et al. 2010) (Kurka et Blackwood 2013)
INDICATOR 44. Local price in USD of biodiesel in a scheme of biofuel price controls. CRITERION 12: Level of agreement between domestic “1st-gen./advanced” biodiesel production ratio.
INDICATOR 45. (production of first generation biodiesel)/(production of advanced biodiesel)} and international “1st-gen./advanced” ratios
CRITERION 13: Level of agreement between the percentages of national biodiesel blend – diesel and percentages of international blend.
INDICATOR 46. The percentages of national biodiesel blend – diesel and percentages of international blend.
CRITERION 14: Level of national capability in biodiesel research and development (first generation and advanced) regarding international capabilities.
INDICATOR 47. Fiscal costs of the implementation of the biodiesel promotion policy
INDICATOR 48. Research and development expenditure (% of GDP)
PRINCIPLE 6. National policies related to the promotion of biodiesel production should be consistent with international environmental policies on acceptable forms of biomass, suitable land for the cultivation of biomass and allowed thresholds of greenhouse gas emissions in the life cycle of biodiesel
CRITERION 15: Amount of biomass produced domestically in compliance with international standards (type of biomass that does not compete with food).
INDICATOR 49. Annual amount of raw material for the production of biodiesel produced compliance with the criteria of renewable biomass
FSC, Forest Stewardship Council NTA 8080, Sustainable Production of Biomass—The Netherlands CSBP, Council on Sustainable Biomass Production, the United States. Sustainability Guide in Biomass Production and Processing in the Biofuel chain in Colombia ISO 26000 – Responsibility social. ISCC, International Sustainability and Carbon Certification Interamerican Development Bank- Sustainability Scorecard PEFC, Program for the Endorsement of Forest Certification schemes RTRS, Roundtable for Responsible Soy Production RFS2 United States (Epa 2010) BLE, Suatainable Biomass Production. Germany RSB, Roundtable on Sustainable Biofuels RSPO, Roundtable on Sustainable Palm Oil Directive 2009/28/EC of the European Union FLO, Fairtrade Labelling Organizations International
CRITERION 16: National amount of land used for growing biomass for biodiesel production that meets the international requirements of land suitable for use (i.e. those that do not come from direct exchange of primary forests, exclusion areas with high biodiversity value, land with high carbon stocks and ecologically sensitive areas declared as protected).
INDICATOR 50. Amount of biodiesel produced under voluntary certification criteria (e.g. RSPO, ISCC, NTA 8080) relative to the total amount of biodiesel produced globally.
CRITERION 17: Amount of domestically produced biodiesel that meets international policy on minimum average or threshold of greenhouse gas emissions in their life cycle, including indirect changes in land use.
INDICATOR 51. Total global consumed tons of 1st generation biodiesel that are permitted by international policies
PRINCIPLE 7. The actors involved in biodiesel´s production chain should promote commitment to ethics, transparency and compliance with local laws
CRITERION 18: Level of perception of the local community about the degree of ethical commitment by the actors in biodiesel´s production chain.
INDICATOR 52. Define and communicate the standards of ethical behavior in the organization
RTRS, Roundtable for Responsible Soy Production RFS2 United States (Epa 2010) BLE, Suatainable Biomass Production. Germany RSB, Roundtable on Sustainable Biofuels RSPO, Roundtable on Sustainable Palm Oil RTFO, Renewable Transport Fuel Obligation – UK Directive 2009/28/EC of the European Union BLCAO, Biofuels life cycle assessment ordinance Swiss Confederation LCFS, Low Carbon Fuel Standard (LCFS), California, United States.
INDICATOR 53. Have you notified the relevant authorities, where appropriate, and completed an Environmental Impact Assessment (EIA) INDICATOR 54. Reporte de multas por incumplimiento legal en temas laborales, impuestos, ambientales, entre otros. INDICATOR 55. Awareness of responsibilities, according to applicable laws (environmental, fiscal, social and labor) can be demonstrated. INDICATOR 56. Adopt and implement the standards of ethical behavior. Establish mechanisms for monitoring and verification.
CRITERION 19: Level of perception of the local community about the commitment to transparency and compliance with local laws by the actors involved in biodiesel´s production chain.
INDICATOR 57. The organization must be transparent in its activities, which makes control over them, how to be making the decisions, and how their functions are defined. INDICATOR 58. The organization must be clear about the source of funds for their activities INDICATOR 59. The organization must know the likely effects of their decisions on stakeholders, society, economy and environment. INDICATOR 60. The organization inform to consumers about the environmental effects of products they are consuming and to raise environmental standards in the manufacturing of specific products INDICATOR 61. Production of any Genetically Modified Organisms must comply with legal requirements.

186 Sustainability assessment of biodiesel production in Colombia
ECONOMIC DIMENSION OF SUSTAINABILITY References
PRINCIPLE 8. Biodiesel production must be sustainable at both macroeconomic and microeconomic level FSC, Forest Stewardship Council UNCTAD Biofuels Initiative
CRITERION 20: Level of influence (international and domestic) of reserves, production, consumption and prices for oil on the production of first generation biodiesel.
INDICATOR 62. Global Petroleum reserves per year and per global tons of first generation biodiesel produced (Oviedo et al. 2011) INDICATOR 63. Global Petroleum production per year and biodiesel per global tons of first generation biodiesel produced INDICATOR 64. Global annual Petroleum consumption per global tons of first generation biodiesel produced INDICATOR 65. Global annual Prices of petroleum per global tons of first generation biodiesel produced INDICATOR 66. Local annual Petroleum reserves per local tons of first generation biodiesel produced INDICATOR 67. Local annual Petroleum production per local tons of first generation biodiesel produced INDICATOR 68. Local annual Petroleum consumption per local tons of first generation biodiesel produced INDICATOR 69. Local annual Prices of petroleum per local tons of first generation biodiesel produced
CRITERION 21: Level of influence (international and domestic) of production, consumption and prices for diesel on the production of first generation biodiesel.
INDICATOR 70. Global annual production quantity of diesel per global tons of first generation biodiesel produced (Cavalett et Ortega 2010) (Bantz et Deaton 2006) (Franco et Flórez 2009)
INDICATOR 71. Global annual consumption quantity of diesel per global tons of first generation biodiesel produced INDICATOR 72. Global annual prices of diesel per global tons of first generation biodiesel produced INDICATOR 73. Local annual production quantity of diesel per local tons of first generation biodiesel produced INDICATOR 74. Local annual consumption quantity of diesel per local tons of first generation biodiesel produced INDICATOR 75. Local annual prices of diesel per local ton of first generation biodiesel produced INDICATOR 76. Local annual quantity of Vehicle diesel per local tons of first generation biodiesel produced
CRITERION 22: Annual production (international and domestic) of first generation biodiesel.
INDICATOR 77. Global annual production quantity of biodiesel 1ª generation (Musango et al. 2011) (Musango et al. 2012) (Edgard Gnansounou 2011) (Wang, Calderon, et Lu 2011) (Oviedo et al. 2011) (Franco et Flórez 2009) (Timilsina et Shrestha 2011) (Bantz et Deaton 2006) (Wang, Calderon, et Lu 2011) (Zapata, Franco, et Dyner 2011) (Kurka et Blackwood 2013)
INDICATOR 78. Global annual consumption quantity of biodiesel 1ª generation per global tons of first generation biodiesel produced INDICATOR 79. Global annual prices of biodiesel 1ª generation per global tons of first generation biodiesel produced INDICATOR 80. Local annual production quantity of biodiesel 1ª generation INDICATOR 81. Local annual consumption quantity of biodiesel 1ª generation per local tons of first generation biodiesel produced INDICATOR 82. Local annual prices of biodiesel 1ª generation per local tons of first generation biodiesel produced INDICATOR 83. Local production capacity of the 1st generation biodiesel per local tons of first generation biodiesel produced INDICATOR 84. Local profitability of production of biodiesel 1a generation per local tons of first generation biodiesel produced INDICATOR 85.Annual balance energy costs in the biodiesel production per local tons of first generation biodiesel produced INDICATOR 86. Annual operational and pollution control cost in the biodiesel production per local tons of first generation biodiesel produced
CRITERION 23: Level of influence of production, consumption and prices (international and domestic) for vegetable oil on the production of first generation biodiesel.
INDICATOR 87. Global annual prices of palm oil per global tons of first generation biodiesel produced INDICATOR 88. Global total annual production of palm oil per global tons of first generation biodiesel produced INDICATOR 89. Global annual consumption for palm oil for production of biodiesel per global tons of first generation biodiesel produced INDICATOR 90. Global annual consumption for palm oil in different uses to biodiesel per global tons of first generation biodiesel produced INDICATOR 91.Local annual prices of palm oil per local tons of first generation biodiesel produced INDICATOR 92. Local total annual production of palm oil per local tons of first generation biodiesel produced INDICATOR 93. Local annual consumption for palm oil for production of biodiesel per local tons of first generation biodiesel produced INDICATOR 94. Local annual consumption for palm oil for human consumption per local tons of first generation biodiesel produced INDICATOR 95. Aboveground net primary productivity (at the stage of cultivation of oil palm) biodiesel per annual local tons of first generation biodiesel produced. Taking into account the effects of climate change
CRITERION 24: Level of influence of production, consumption and prices (international and domestic) for glycerol on the production of first generation biodiesel.
INDICATOR 96. Local annual price of byproduct glycerol per local tons of first generation biodiesel produced
INDICATOR 97. Local annual production of byproduct glycerol biodiesel per local tons of first generation biodiesel produced
INDICATOR 98. Local annual consumption of byproduct glycerol biodiesel per local tons of first generation biodiesel produced.
CRITERION 25: Level of influence of production, consumption and prices (international and domestic) for advanced biodiesel on first generation biodiesel.
INDICATOR 98. Global annual prices of advanced biodiesel per global tons of first generation biodiesel produced (Kurka et Blackwood 2013) UNCTAD Biofuels Initiative
INDICATOR 99. Global annual production of advanced biodiesel per global tons of first generation biodiesel produced
INDICATOR 100. Global annual consumption of advanced biodiesel per global tons of first generation biodiesel produced
TECHNOLOGICAL DIMENSION OF SUSTAINABILITY References
PRINCIPLE 9. Technology used in the biodiesel supply chain should promote the reduction of negative impacts on the environment, efficiency and cost reduction in processes over time
INDICATOR 101. Amount of hectares of land required for the production of raw materials for advanced biodiesel or second and third generation.
(Musango et Brent 2011) (Brent et Musango 2013)

Appendix 1. Document linked to principles, criteria and indicator 187
TECHNOLOGICAL DIMENSION OF SUSTAINABILITY References
CRITERION 26: Level of influence of production (international and domestic) of advanced biodiesel from non-edible feedstock on demand (international and domestic) of soil and water resources.
INDICATOR 103. Amount of water required for the production of raw materials and advanced biodiesel or second and third generation transformation.
(Vaccaro et al. 2010) (Timilsina et Shrestha 2011) (Bantz et Deaton 2006) (Kurka et Blackwood 2013) GBEP, Global Bioenergy Partnership UNCTAD Biofuels Initiative UNEP, 2009. Towards Sustainable Production RSB, Roundtable on Sustainable Biofuels
CRITERION 27: Level of influence of global and domestic production of advanced biodiesel based on non-conventional technologies on efficiency of processes and cost reduction.
INDICATOR 104. Reduction of production costs dependent on the production of advanced biodiesel technology apprenticeship
CRITERION 28: Level of influence of technology trends for engines on the production of first generation biodiesel.
INDICATOR 105. Demand for biodiesel according to the number of vehicles that do not use liquid fuels.
CRITERION 29. Level of influence of technological learning (global and domestic) in the production of first generation biodiesel on reducing costs over time
INDICATOR 106. Reducing costs of production by independent of production technological learning (associated with technological maturity that can be assessed indirectly by scientific articles and patents advanced biodiesel or second and third generation)
ENVIRONMENTAL DIMENSION OF SUSTAINABILITY References
The actors involved in the biodiesel supply chain must: PRINCIPLE 10. Ensure their activities maintain or improve the air, soil and water quality, as well as they do a proper management of solid waste and wastewater
CRITERION 30: To ensure that air quality is maintained or improved.
INDICATOR 107. Annual tons of nitrogen oxide gas emissions engine transport vehicles using biodiesel fuel blends (in the national capital).
(Edgard Gnansounou 2011) (Timilsina et Shrestha 2011) (McBride et al. 2011) (Kurka et Blackwood 2013) ISO 14040 – Life Cycle Assement GBEP, Global Bioenergy Partnership LCFS, Low Carbon Fuel Standard (LCFS), California, United States. ISO 26000 – Responsibility social. Bonsucro, Better Sugarcane Initiative
RFS2 United States (Epa 2010) RSB, Roundtable on Sustainable Biofuels RSPO, Roundtable on Sustainable Palm Oil SBA, Sustainable Biodiesel Alliance RTFO, Renewable Transport Fuel Obligation – UK Directive 2009/28/EC of the European Union BLCAO, Biofuels life cycle assessment ordinance Swiss Confederation BioNa Dv, Biomass Sustainability order, Germany
INDICATOR 108. Annual tons of particulate matter gas emissions engine transport vehicles using biodiesel fuel blends (in the national capital) INDICATOR 109. Annual tons of carbon monoxide gas emissions engine transport vehicles using biodiesel fuel blends (in the national capital)
INDICATOR 110. Annual tons of total hydrocarbons gas emissions engine transport vehicles using biodiesel fuel blends (in the national capital)
INDICATOR 111. Annual tons of total atmospheric acidification burden per unit mass, environmental burden is kg Sulphur dioxide equivalent product (in the national capital)
INDICATOR 112. Annual tons of total of persistent organic pollutants (POPs) and substances that deplete the ozone layer (in the national capital)
CRITERION 31: To promote the efficient use of water to minimize pressure on the local availability of the resource.
INDICATOR 113. Average cubic meters of water available per year in direct area of influence of biodiesel production system (taking into account the effects of climate change)
(BID et MMEC 2012) (FAO 2012) (Musango et al. 2011) (Edgard Gnansounou 2011) (Kurka et Blackwood 2013) CSBP, Council on Sustainable Biomass Production, the United States. ISO 14040 – Life Cycle Assement GBEP, Global Bioenergy Partnership SAN/RA, Sustainable Agriculture Network/Rain forest Alliance Interamerican Development Bank- Sustainability Scorecard Bonsucro, Better Sugarcane Initiative RTRS, Roundtable for Responsible Soy Production GGLS2, Green Gold Label 2.
Agriculture Source Criteria Nordic Ecolabelling of Fuels UNEP, 2009. Towards Sustainable Production RSB, Roundtable on Sustainable Biofuels RSPO, Roundtable on Sustainable Palm Oil SBA, Sustainable Biodiesel Alliance RTFO, Renewable Transport Fuel Obligation – UK Directive 2009/28/EC of the European Union BLCAO, Biofuels life cycle assessment ordinance Swiss Confederation BioNa Dv, Biomass Sustainability order, Germany
INDICATOR 114. Index linking shortage of water available (m3) with respect to water consumption (m3) in direct area of influence of biodiesel production system
INDICATOR 115. Water used in m3 by hectare of palm oil cultivation for biodiesel per year
INDICATOR 116. Water used annually in m3 for production of one tons of biodiesel in the step of transformation with in productive chain.
INDICATOR 117. Annual quantity of water utilized or recycled of the total water utilized in the biodiesel production.
INDICATOR 118. Annual ratio of the amount (m3) of water used for growing biomass and biodiesel production of all water used for human consumption and food crops in the area of direct influence (taking into account the effects of climate change)
CRITERION 32: To minimize the generation of contaminated effluents and treat such effluents in order to maintain or improve the local water quality
INDICATOR 119. Concentration annual average (mg/l) of suspended sediment in the principal stream (those that are used for human consumption) that are part of the direct influence area (watershed) of oil palm plantations.
(BID et MMEC 2012) (Edgard Gnansounou 2011) (Kurka et Blackwood 2013) NTA 8080, Sustainable Production of Biomass—The Netherlands CSBP, Council on Sustainable Biomass Production, the United States. ISO 14040 – Life Cycle Assement GBEP, Global Bioenergy Partnership
GGLS2, Green Gold Label 2. Agriculture Source Criteria Nordic Ecolabelling of Fuels UNEP, 2009. Towards Sustainable Production RSB, Roundtable on Sustainable Biofuels RSPO, Roundtable on Sustainable Palm Oil SBA, Sustainable Biodiesel Alliance RTFO, Renewable Transport Fuel Obligation – UK Directive 2009/28/EC of the European Union
INDICATOR 120. Concentration annual average (mg/l) of phosphorus (P) in the principal stream (those that are used for human consumption) that are part of the direct influence area (watershed) of oil palm plantations, as annual average. INDICATOR 121. Concentration annual average (mg/l) of nitrogen in the principal stream (those that are used for human consumption) that are part of the direct influence area (watershed) of oil palm plantations.

188 Sustainability assessment of biodiesel production in Colombia
ENVIRONMENTAL DIMENSION OF SUSTAINABILITY References INDICATOR 122. Concentration annual average (mg/l) of herbicide concentration in the principal stream (those that are used for human consumption) that are part of the direct influence area (watershed) of oil palm plantations.
ISCC, International Sustainability and Carbon Certification SAN/RA, Sustainable Agriculture Network/Rain forest Alliance Interamerican Development Bank- Sustainability Scorecard RTRS, Roundtable for Responsible Soy Production
BLCAO, Biofuels life cycle assessment ordinance Swiss Confederation BioNa Dv, Biomass Sustainability order, Germany
INDICATOR 123. Discharge rate (m3/year) of wastewater generated in the production of one tons of biodiesel in transformation industry per year
INDICATOR 124. Discharge in kg of nitrate per fresh fruit bunch in oil plantation biodiesel per year
INDICATOR 125. Discharge in kg of phosphorus per fresh fruit bunch in oil plantation biodiesel by year
CRITERION 33: To ensure that non-hazardous and hazardous wastes are managed responsibly (collection, storage, transportation, treatment and/or disposal) by promoting their minimization, reuse and/or recycling.
INDICATOR 126. Amount in tons of hazardous waste taken to a proper final disposal of all waste generated in the stages of cultivation, oil extraction and transformation into biodiesel per year.
(BID et MMEC 2012) (Buchholz, Luzadis, et Volk 2009) FSC, Forest Stewardship Council NTA 8080, Sustainable Production of Biomass—The Netherlands GAP, Global Partnership for Good Agricultural Practice IFOAM, International Federation of Organic Agriculture Movements Sustainability Guide in Biomass Production and Processing in the Biofuel chain in Colombia ISO 14040 – Life Cycle Assement ISCC, International Sustainability and Carbon Certification SAN/RA, Sustainable Agriculture Network/Rain forest Alliance Interamerican Development Bank- Sustainability Scorecard
GQA, Genesis Quality Assurance RTRS, Roundtable for Responsible Soy Production GGLS2, Green Gold Label 2. Agriculture Source Criteria Nordic Ecolabelling of Fuels RSB, Roundtable on Sustainable Biofuels RSPO, Roundtable on Sustainable Palm Oil SBA, Sustainable Biodiesel Alliance RFS2, Renewable Fuel Standard, the United States, 2010 RTFO, Renewable Transport Fuel Obligation – UK Directive 2009/28/EC of the European Union BLCAO, Biofuels life cycle assessment ordinance Swiss Confederation Bonsucro, Better Sugarcane Initiative
INDICATOR 127. Amount in tons of waste are reuse or recycle with relation of total waste generated in the stages of cultivation of palm oil per year.
INDICATOR 128. Amount in tons of waste are recovered or valued with relation of total waste generated in the stages of transformation of palm oil to biodiesel
INDICATOR 129. Total amount of non-hazardous waste generated annually per tons of biodiesel produced
CRITERION 34: The biomass cultivation activities for biodiesel must maintain or improve the soil quality (physical, chemical and biological properties) by establishing responsible practices of crop management, handling of agrochemicals and pest control.
INDICATOR 130. Amount in mg of total organic carbon (TOC) measured annually in a hectare of oil palm cultivation
(FAO 2012) (Musango et al. 2012) (Edgard Gnansounou 2011) (McBride et al. 2011) NTA 8080, Sustainable Production of Biomass—The Netherlands CSBP, Council on Sustainable Biomass Production, the United States. ACCS, Assured Combinable Crops Scheme GAP, Global Partnership for Good Agricultural Practice IFOAM, International Federation of Organic Agriculture Movements LEAF, Linking Environment and Farming GBEP, Global Bioenergy Partnership ISCC, International Sustainability and Carbon Certification SAN/RA, Sustainable Agriculture Network/Rain forest Alliance
Interamerican Development Bank- Sustainability Scorecard Bonsucro, Better Sugarcane Initiative GQA, Genesis Quality Assurance RTRS, Roundtable for Responsible Soy Production GGLS2, Green Gold Label 2. Agriculture Source Criteria RSB, Roundtable on Sustainable Biofuels RSPO, Roundtable on Sustainable Palm Oil SBA, Sustainable Biodiesel Alliance RTFO, Renewable Transport Fuel Obligation – UK Social Fuel seal – Brazil Directive 2009/28/EC of the European Union BLCAO, Biofuels life cycle assessment ordinance Swiss Confederation BioNa Dv, Biomass Sustainability order, Germany
INDICATOR 131. Amount in mg of total nitrogen measured annually in a hectare of oil palm cultivation INDICATOR 132. Amount in mg of extractable phosphorus measured annually in a hectare of oil palm cultivation
INDICATOR 133. Annual measure of bulk density in soils in g/cm3 used for growing oil palm
INDICATOR 134. Amount in tons of agrochemical (fertilizers minerals or organics and pesticides) used per hectare of cultivation of palm oil. In special, the agrochemicals prohibited in the Stockholm and Rotterdam Conventions
INDICATOR 135. Quantity annual of land, in region with influence of oil palm cultivation for biodiesel, those are degraded due to acidification and the salinization.
INDICATOR 136. Quantity (hectares per year) of eroded land in the direct influence of the production of biodiesel
INDICATOR 137. Existence of crop rotation plan / cycle. This plan will identify annual cropping for current year and the intentions for the future (over three years).
PRINCIPLE 11. Biodiesel supply chain must have a positive balance of greenhouse gas, and maintain or promote carbon sinks
CRITERION 35: The amount of greenhouse gas captured or stored in carbon sinks (biomass associated) must be greater than the amount of greenhouse gas emitted by the biodiesel supply chain.
INDICATOR 138. Tons equivalent CO2 emitted by direct change of use of one hectare of land, multiplied by the total annual number of hectares that suffered a direct change in the land use in the area of direct influence of the biodiesel production system.
(BID et MMEC 2012) (FAO 2012) (Musango et al. 2011) (Musango et al. 2012) (Edgard Gnansounou 2011) (E Gnansounou et al. 2009) (Wang, Calderon, et Lu 2011)
GBEP, Global Bioenergy Partnership ISCC, International Sustainability and Carbon Certification GGLS2, Green Gold Label 2. Agriculture Source Criteria UNCTAD Biofuels Initiative UNEP, 2009. Towards Sustainable Production
INDICATOR 139. Generated tons of nitrogen oxide associated with the use of chemical fertilizers and pest control on a hectare of palm oil for biodiesel production.

Appendix 1. Document linked to principles, criteria and indicator 189
ENVIRONMENTAL DIMENSION OF SUSTAINABILITY References
INDICATOR 140. Tons annual equivalent CO2 emitted by the extraction of oil and transformation plants of biodiesel in the production of one tons of biodiesel
(Oviedo et al. 2011) (Kim, Kim, et Dale 2009) (Timilsina et Shrestha 2011) (Szarka, Kakucs, et Bezama 2008) (Wang, Calderon, et Lu 2011) (McBride et al. 2011) (Gudmundsson 2012) (Buchholz, Luzadis, et Volk 2009) (Kurka et Blackwood 2013) NTA 8080, Sustainable Production of Biomass—The Netherlands CSBP, Council on Sustainable Biomass Production, the United States. Sustainability Guide in Biomass Production and Processing in the Biofuel chain in Colombia ISO 14040 – Life Cycle Assement Bonsucro, Better Sugarcane Initiative RTRS, Roundtable for Responsible Soy Production RFS2 United States (Epa 2010)
RTFC, Renewable Transport Fuel Certificates, UK BLE, Suatainable Biomass Production. Germany RSB, Roundtable on Sustainable Biofuels RSPO, Roundtable on Sustainable Palm Oil SBA, Sustainable Biodiesel Alliance RFS2, Renewable Fuel Standard, the United States, 2010 RTFO, Renewable Transport Fuel Obligation – UK Directive 2009/28/EC of the European Union BLCAO, Biofuels life cycle assessment ordinance Swiss Confederation BioNa Dv, Biomass Sustainability order, Germany LCFS, Low Carbon Fuel Standard (LCFS), California, United States.
INDICATOR 141. Annual tons of CO2 equivalent emitted by vehicle engines to use biodiesel in relation to the total annual tons of biodiesel consumed in the transport sector
INDICATOR 142. Tons equivalent CO2 emitted annually by indirect change of use of one hectare of land, multiplied by the total annual number of hectares that suffered an indirect change in the land use in the area of direct influence of the biodiesel production system
INDICATOR 143. Tons equivalent CO2 emitted by activities of logistic chain relationship with of biodiesel production system per tons of biodiesel produced.
INDICATOR 144. Tons of CO2 equivalent annually captured or maintained in carbon sinks PRINCIPLE 12. Biodiesel supply chain must promote the conservation and protection of biodiversity and wildlife.
CRITERION 36: Transformation of natural ecosystems and loss of native natural landscape should be avoided during biomass cultivation and biodiesel production.
INDICATOR 145. Land used (ha/year) for foods crops different to palm oil cultivation for biodiesel. (FAO 2012) (Edgard Gnansounou 2011) (Groom, Gray, et Townsend 2008) (Timilsina et Shrestha 2011) (McBride et al. 2011) (Buchholz, Luzadis, et Volk 2009) (Markevičius et al. 2010) FSC, Forest Stewardship Council NTA 8080, Sustainable Production of Biomass—The Netherlands CSBP, Council on Sustainable Biomass Production, the United States. ACCS, Assured Combinable Crops Scheme LEAF, Linking Environment and Farming Sustainability Guide in Biomass Production and Processing in the Biofuel chain in Colombia ISO 14040 – Life Cycle Assement Interamerican Development Bank- Sustainability Scorecard Bonsucro, Better Sugarcane Initiative GQA, Genesis Quality Assurance
PEFC, Program for the Endorsement of Forest Certification schemes RTRS, Roundtable for Responsible Soy Production GGLS2, Green Gold Label 2. Agriculture Source Criteria Nordic Ecolabelling of Fuels RSB, Roundtable on Sustainable Biofuels RSPO, Roundtable on Sustainable Palm Oil SBA, Sustainable Biodiesel Alliance RFS2, Renewable Fuel Standard, the United States, 2010 RTFO, Renewable Transport Fuel Obligation – UK Directive 2009/28/EC of the European Union BLCAO, Biofuels life cycle assessment ordinance Swiss Confederation BioNa Dv, Biomass Sustainability order, Germany SAN/RA, Sustainable Agriculture Network/Rain forest Alliance
INDICATOR 146. Amount annual of hectare land used for palm oil crop to be transformed in biodiesel INDICATOR 147. Conexant index Equivalent Area (ACE) for evaluating the connectivity ecosystem INDICATOR 148. Annual amount of biodiversity projects and promotion of local traditional knowledge, with the participation of communities INDICATOR 149. Annual amount of degraded land (e.g. erosion, salinization, acidification, or other causes) and areas of natural cover change, in areas directly affected by oil palm plantations or processors biodiesel.
CRITERION 37: Biodiesel supply chain must preserve areas with fragile ecosystems (both terrestrial and aquatic ecosystems) such as nature reserves defined by the national environmental legislation.
INDICATOR 150. Amount of land (ha) used for forests and natural ecosystems in direct area of influence of palm oil plantation and biodiesel transformation plant, per year INDICATOR 151. Average annual temperature of aquatic ecosystems (e.g. estuaries, rivers, lakes, wetlands) located in the area of direct influence of the oil palm plantations and transformation of biodiesel. INDICATOR 152. Aquatic oxygen demand of aquatic ecosystems (e.g. estuaries, rivers, lakes, wetlands) located in the area of direct influence of the oil palm plantations and transformation of biodiesel.
CRITERION 38: The number of species of wildlife listed as vulnerable or endangered should not be affected during biomass cultivation and processing of biodiesel.
INDICATOR 153. Number annual of species of fauna and flora, specifically those who are in danger or are considered of special conservation interest, for The International Union for Conservation of Nature (IUCN) and local research organizations.
INDICATOR 154. Areas established as wildlife reserves (e.g. national parks, reserves civil society or private reserve areas) located in the area of direct influence of the oil palm plantations and plants
PRINCIPLE 13. Energy efficiency and use of renewable energy should be promoted in the processes that are part of the biodiesel supply chain
CRITERION 39: Energy used in the biodiesel supply chain from renewable sources.
INDICATOR 155. Report total annual fuel consumption from renewable fuel sources in joules or multiples, including fuel types used
(Musango et al. 2011) (Edgard Gnansounou 2011) (Wang, Calderon, et Lu 2011) (McBride et al. 2011) (Buchholz, Luzadis, et Volk 2009) (Markevičius et al. 2010) (Kurka et Blackwood 2013) LEAF, Linking Environment and Farming ISO 14040 – Life Cycle Assement SBA, Sustainable Biodiesel Alliance
GBEP, Global Bioenergy Partnership SAN/RA, Sustainable Agriculture Network/Rain forest Alliance Interamerican Development Bank- Sustainability Scorecard Bonsucro, Better Sugarcane Initiative UNEP, 2009. Towards Sustainable Production RSB, Roundtable on Sustainable Biofuels RSPO, Roundtable on Sustainable Palm Oil
INDICATOR 156. Report total annual fuel consumption from non-renewable sources in joules or multiples, including fuel types used
CRITERION 40: Energy savings in the biodiesel supply chain with compared to the previous year.
INDICATOR 157. Amount of energy generated for a kg of biodiesel / Amount of energy consumed in the extraction stages and palm oil to biodiesel oil transformation per kilogram of biodiesel [∑(kJ Electricity+ kJ Fuel Oil +kJ Gas+ kJ Coal+ kJ Steam + kJ Other))/kg biodiesel]

190 Sustainability assessment of biodiesel production in Colombia

Appendix 2. Constant of equations model 191
Appendix 2. Constant of equations model
Equation A1 A2 A3 A4 A5 A6
Equation 3-1 10099512 344.4
Equation 3-2 3.7E-02 9.7E-3
Equation 3-3 1.04
Equation 3-4 3.85
Equation 3-5 -- -- -- -- -- --
Equation 3-6 417 1.14
Equation 3-7 -- -- -- -- -- --
Equation 3-8 0.2 1.36
Equation 3-9 395 1.6E-2
Equation 3-10 -- -- -- -- -- --
Equation 3-11 -- -- -- -- -- --
Equation 3-12 217 0.6 7.5E-04 --
Equation 3-13 2.12
Equation 3-14 605281 122712
Equation 3-15 -- -- -- -- -- --
Equation 3-16 0.11
Equation 3-17 -- -- -- -- -- --
Equation 3-18 -- -- -- -- -- --
Equation 3-19 -- -- -- -- -- --
Equation 3-20 -- -- -- -- -- --
Equation 3-21 43.1 1.1 43.2 8.7 0.9 --
Equation 3-22 992.9 7.6 992.9 10.3 1.5
Equation 3-23 -- -- -- -- -- --
Equation 3-24 -- -- -- -- -- --
Equation 3-25 -- -- -- -- -- --
Equation 3-26 -282.6 1.5 141.0 2 1.5 16.7
Equation 3-27 95081 483
Equation 3-28 0.9
Equation 3-29 -- -- -- -- -- --
Equation 3-30 -- -- -- -- -- --
Equation 3-31 3.7 6.5E-07 1.3E-06
Equation 3-32 2.2 0.1
Equation 3-33 -- -- -- -- -- --
Equation 3-34 -- -- -- -- -- --
Equation 3-35 370.4 29119.2 2197.5 5057.5
Equation 3-36 -- -- -- -- -- --
Equation 3-37 -- -- -- -- -- --
Equation 3-38 1.1 0.1 3.3
Equation 3-39 -- -- -- -- -- --
Equation 3-40 25158227 0.4 0.5 11.4
Equation 3-41 -- -- -- -- -- --
Equation 3-42 4909710 0.3 1.3E-02 0.3
Equation 3-43 4106272.2 67124.7
Equation 3-44 -- -- -- -- -- --
Equation 3-45 -- -- -- -- -- --

192 Sustainability assessment of biodiesel production in Colombia
Equation A1 A2 A3 A4 A5 A6
Equation 3-46 -- -- -- -- -- --
Equation 3-47 -- -- -- -- -- --
Equation 3-48 -- -- -- -- -- --
Equation 3-49 -- -- -- -- -- --
Equation 3-50 -- -- -- -- -- --
Equation 3-51 2.4 29.9 91.8 135.1
Equation 3-52 -- -- -- -- -- --
Equation 3-53 -- -- -- -- -- --
Equation 3-54 183582 0.3
Equation 3-55 2987016 2.2
Equation 3-56 0.9 4.4E-09 7.1E-0.8 1.9E-05 3.5E-09 2.7E-08
Equation 3-57 -- -- -- -- -- --
Equation 3-58 -- -- -- -- -- --
Equation 3-59 -- -- -- -- -- --
Equation 3-60 -- -- -- -- -- --
Equation 3-61 -- -- -- -- -- --
Equation 3-62 -- -- -- -- -- --
Equation 3-63 -- -- -- -- -- --
Equation 3-64 -- -- -- -- -- --
Equation 3-65 -- -- -- -- -- --
Equation 3-66 -- -- -- -- -- --
Equation 3-67 -- -- -- -- -- --
Equation 3-68 -- -- -- -- -- --
Equation 3-69 -- -- -- -- -- --
Equation 3-70 -- -- -- -- -- --
Equation 3-71 -- -- -- -- -- --
Equation 3-72 -- -- -- -- -- --
Equation 3-73 -- -- -- -- -- --
Equation 3-74 -- -- -- -- -- --
Equation 3-75 -- -- -- -- -- --
Equation 3-76 -- -- -- -- -- --
Equation 3-77 -- -- -- -- -- --
Equation 3-78 -- -- -- -- -- --
Equation 3-79 -- -- -- -- -- --
Equation 3-80 -- -- -- -- -- --
Equation 3-81 -- -- -- -- -- --
Equation 3-82 -- -- -- -- -- --
Equation 3-83 -- -- -- -- -- --
Equation 3-84 -- -- -- -- -- --
Equation 3-85 -- -- -- -- -- --
Equation 3-86 -- -- -- -- -- --
Equation 3-87 -- -- -- -- -- --
Equation 3-88 -- -- -- -- -- --
Equation 3-89 -- -- -- -- -- --
Equation 3-90 0.002168 0.7111 0.2484
Equation 3-91 -- -- -- -- -- --
Equation 3-92 0.002168 0.7111 0.2484
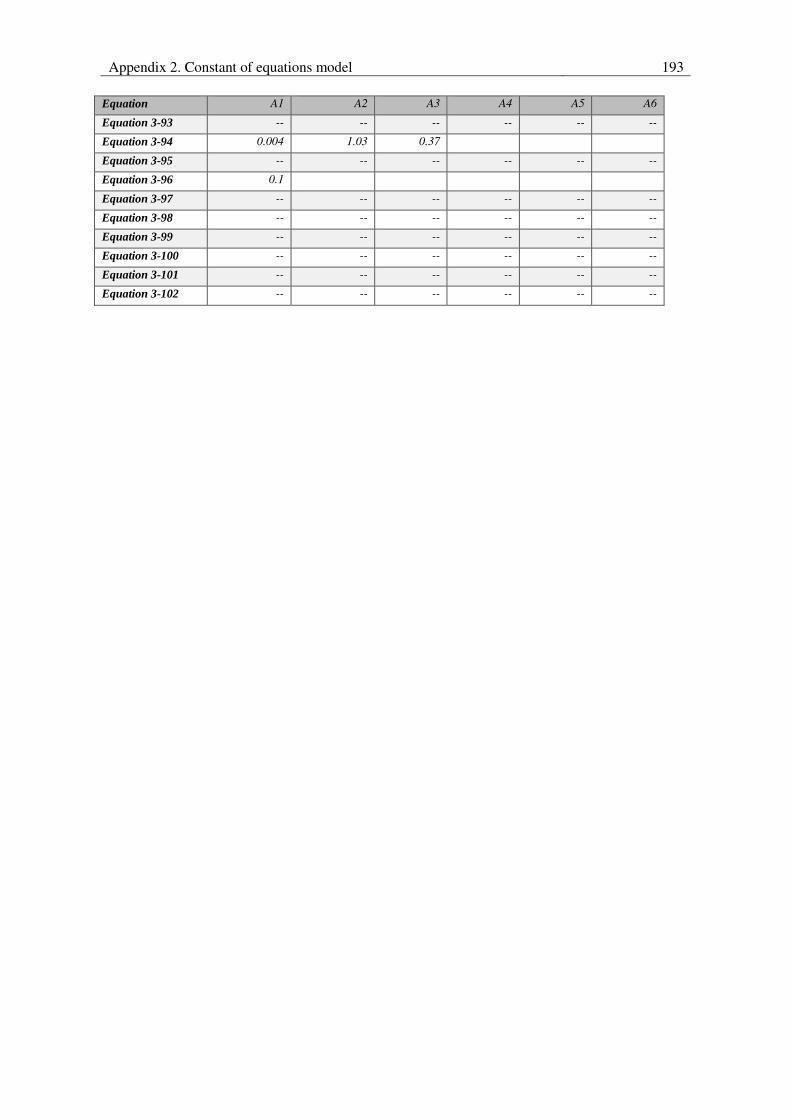
Appendix 2. Constant of equations model 193
Equation A1 A2 A3 A4 A5 A6
Equation 3-93 -- -- -- -- -- --
Equation 3-94 0.004 1.03 0.37
Equation 3-95 -- -- -- -- -- --
Equation 3-96 0.1
Equation 3-97 -- -- -- -- -- --
Equation 3-98 -- -- -- -- -- --
Equation 3-99 -- -- -- -- -- --
Equation 3-100 -- -- -- -- -- --
Equation 3-101 -- -- -- -- -- --
Equation 3-102 -- -- -- -- -- --

194 Sustainability assessment of biodiesel production in Colombia

Appendix 3. Model indicator: statistics issues 195
Appendix 3. Model indicator: statistics issues
SD model is defined based on current conditions of biodiesel production in Colombia. This appendix each endogenous indicator stablished in SD model is defined an equation and its statistical validation. The equations are defined through simulation of different variables and functions. The functions are proposed depend of time trend observed in historical data. The selection process of the equations is as follows:
Perform the regression and get the results for statistical “F-test” from the analysis of variance and compare it with the value of Fisher established (F table [α; √1, √2]). If: " − Analysis of Variance "> " �; √ , √ " � = , It agrees that the equation is significant, so it can be used to represent the relationship between the variables. In addition, each variable must be significant ( − ) in the equation considering the same approach � = , .
The equations that satisfy the constraints of the first criterion should be assessed in the data from which the regression was not performed. Additionally, the forecast errors must be calculated. The relationships that have less error in comparison with the others will be eligible. That is depend of amount of data.
The equation used in the dynamic model is one that complies with the above criteria and has the highest values of R2 and R2 adjusted. The value of R2 adjusted measures the fitness of the equation to the data, but it is necessary to use the criterion of error indicators to measure the predictive ability of a designed model.
For that, it is used statistic software Minitab®. Historical annual data from 1999 to 2013 are used in equation definition. In Table A2-1.
Table A2-1. Analysis of variance. Variation
source Degrees of
freedom Sum-of-squares
Average squares F
Due to the regression
= ⁄
Due to error − − = − −⁄
Total −
Due: = ∑ − ^= = ∑ ^ − ̅= = ∑ − ̅=
= Number of explanatory variables = Sample size
The following hypothesis can be tested using the analysis of variance table values: : = = ⋯ = : ≠ ≠ ⋯ ≠ In where Ho is rejected if the statistical F given by the table of analysis is more to the for ∝≤, . This condition requires that the selected relationships have a 90% confidence.

196 Sustainability assessment of biodiesel production in Colombia
= − −
The coefficient of determination R2 shows the percentage of variability of the response variable, which is explained by the relationship with the independent variables. =
This value increases to add explanatory variables, so it is advisable to use the statistical = = − − ∗ −− −
Then with the data generated by the SD model, is the calculation of the accuracy of the forecast with the data of the year 2011-2013 through the following indicator:
Absolute percentage error of the average (MAPE): = ∑ | − � � |=
Table A2-2 Endogenous indicators
# Endogenous indicators Symbol 1 Biodiesel production of first generation in Colombia BdPr1G
Year 1999 2000 2001 2002 2003 2004 2005 2006 2007 2008 2009 2010 2011 2012 2013 t 0 1 2 3 4 5 6 7 8 9 10 11 12 13 14
MxRtBdDi 0 0 0 0 0 0 0 0 0 0.05 0.06 0.07 0.08 0.09 0.098 Biodiesel production costs - BPC_1G 0 0 0 0 0 0 0 0 0 1185 1004 1225 1409 1205 1299
BdPr1G 0 0 0 0 0 0 0 0 0 22730 169411 337713 443037 489991 503337 Data utilized: 2008-2013 Regression Analysis: BdPr1G versus Mix_Ratio_Biodie, BPC_1G The regression equation is BdPr1G = 10101797 Mix_Ratio_Biodiesel_and_Diesel - 345 BPC_1G
Predictor Coef SE Coef T P Noconstant
Mix_Ratio_Biodiesel_and_Diesel 10101797 2625953 3.85 0.018 BPC_1G -344.6 163.7 -2.11 0.103
S = 90177.6
Analysis of Variance
Source DF SS MS F P
Regression 2 8.00460E+11 4.00230E+11 49.22 0.002 Residual Error 4 32527990657 8131997664
Total 6 8.32988E+11
Final equation : Finally, we must to restrict the production in base to production capacity: if time>8 then (if 10099512*Mix_Ratio_Biodiesel_and_Diesel-344.4*BPC_1G<BdPrCap then 10099512*Mix_Ratio_Biodiesel_and_Diesel-344.4*BPC_1G else BdPrCap) else 0
2 Biodiesel Sale first generation in Colombia BdSale
Year 1999 2000 2001 2002 2003 2004 2005 2006 2007 2008 2009 2010 2011 2012 2013 t 0 1 2 3 4 5 6 7 8 9 10 11 12 13 14
BdPr1G 0 0 0 0 0 0 0 0 0 22730 169411 337713 443037 489991 503337 BdSale 0 0 0 0 0 0 0 0 0 0 169065 337718 518794 488187 505710
Data utilized: 2008-2013 Regression Analysis: BdSale versus BdPr1G The regression equation is BdSale = 1.04 BdPr1G_1
Predictor Coef SE Coef T P
Noconstant BdPr1G_1 1.03998 0.03442 30.22 0.000
S = 31412.0

Appendix 3. Model indicator: statistics issues 197
Analysis of Variance
Source DF SS MS F P
Regression 1 9.00919E+11 9.00919E+11 913.05 0.000 Residual Error 5 4933557562 986711512
Total 6 9.05853E+11
Final equation : 1.03997663*BdPr1G
3 Biodiesel production capacity first generation BdPrCap
Year 1999 2000 2001 2002 2003 2004 2005 2006 2007 2008 2009 2010 2011 2012 2013 t 0 1 2 3 4 5 6 7 8 9 10 11 12 13 14
BdPrCap 0 0 0 0 0 0 0 0 0 180000 520000 520000 520000 520000 520000 CostBdPol 59512.4 80044.5 115409.9 135275.4 144596.8 162312. Data utilized: 2008-2013 Regression Analysis: BdPrCap versus Cost_linked_to_Biodisel_Politic The regression equation is
BdPrCap = 3.85 CostBdPol
Predictor Coef SE Coef T P Noconstant
Cost_linked_to_Biodisel_Politic 3.8536 0.3836 10.05 0.000
S = 114334
Analysis of Variance
Source DF SS MS F P Regression 1 1.31904E+12 1.31904E+12 100.90 0.000
Residual Error 5 65361246837 13072249367
Total 6 1.38440E+12
Final equation : if time>8 then (3.85* CostBdPol) else 0
4 Profit biodiesel production first generation ProfitBdPr ProfitBdPr = BdPrice - BdPrCosts
5 Biodiesel price BdPrice The price of biodiesel was obtained from the report submitted by the UPME. The original price was reported in pesos per gallon, changing units was made biodiesel with a density of 0.88 kg / l, and converted to dollars using an annual average exchange rate given by the Bank of the Republic of Colombia.
Year 1999 2000 2001 2002 2003 2004 2005 2006 2007 2008 2009 2010 2011 2012 2013 t 0 1 2 3 4 5 6 7 8 9 10 11 12 13 14
BdPrice 0 0 0 0 0 0 0 0 0 1209.38 1072.67 1267.4 1513.81 1422.86 1319.37 PalmOilPrice 377 261 238 357 410 435 368 417 719 634 644 809 966 845 764
Data utilized: 2008-2013 Regression Analysis: BdPrice versus PalmOilPrice The regression equation is BdPrice = 417 + 1.14 PalmOilPrice
Predictor Coef SE Coef T P
Constant 416.8 191.6 2.17 0.095
PalmOilPrice 1.1379 0.2440 4.66 0.010
S = 68.8619 R-Sq = 84.5% R-Sq(adj) = 80.6%
Analysis of Variance
Source DF SS MS F P Regression 1 103165 103165 21.76 0.010
Residual Error 4 18968 4742
Total 5 122133
Final equation : if time>8 then 417+1.14*PalmOilPrice else 0
6 Diesel price (price of diesel and biodiesel blended) Dprice

198 Sustainability assessment of biodiesel production in Colombia
The annual average prices were used in Colombia, including tax surcharge. Original source values were reported in pesos per gallon, changing units was performed with a density of diesel 0,845kg / l, and the price of Colombian pesos was transformed into US dollars using an annual average exchange rate given by Banco de la Republica de Colombia
Year 1999 2000 2001 2002 2003 2004 2005 2006 2007 2008 2009 2010 2011 2012 2013 t 0 1 2 3 4 5 6 7 8 9 10 11 12 13 14
DPrice 339 312 306 306 331 423 551 647 829 984 909 1143 1321 1313 1416 BdPrice 0 0 0 0 0 0 0 0 0 1209.38 1072.67 1267.4 1513.81 1422.86 1319.37 Oil_Price 147.4 231.5 198 199.5 236.9 316.4 431.7 503.4 551.3 759.6 472.2 605.8 723.1 716.8 746.4
Data utilized: 1999-2013 Regression Analysis: DPrice versus BdPrice, Oil_Price The regression equation is DPrice_1 = 0.208 BdPrice_1 + 1.36 Oil_Price
Predictor Coef SE Coef T P
Noconstant BdPrice_1 0.20843 0.06154 3.39 0.005
Oil_Price 1.3620 0.1010 13.48 0.000
S = 105.429
Analysis of Variance
Source DF SS MS F P Regression 2 10528033 5264016 473.59 0.000
Residual Error 13 144497 11115
Total 15 10672530
Final equation : 0.208*BdPrice+1.36*Oil_Price Units × , � × �,
×
×
�
7 Biodiesel production costs first generation BdPrCosts The cost of biodiesel production, from the point of view of technological learning, may arise in the following way: The following describes how was calculated each of the variables that make up the equation: • Cost of biodiesel production: are calculated annually as a variable cost depending on the price of palm oil and other costs on the basis of the selling price of biodiesel. To calculate the costs associated with the raw material, which in the case of Colombia is the palm oil, was established the stoichiometric ratio between the amount of palm oil needed to produce a ton of biodiesel, this relationship was 1.02 tPalmOil/t Biodiesel. Then the cost of palm oil to produce a ton of biodiesel will be the multiplication of 1.02 tPalmOil/t Biodiesel for the price of palm oil in the corresponding year. The second stage was to establish other production costs and their relationship the price of biodiesel. According to Ong (2012) and Acevedo (2015) other costs are between 170,6-310,6 USD/t Biodiesel, and finding the value average value that relate with the selling price of biodiesel in Colombia between 2008 and 2013, would be 20% of the selling price of biodiesel. Technological learning could only influence the other costs of production of biodiesel. Learning analysis production-dependent and independent of this as well: Variation of production costs by production-dependent technological learning: To determine the dependent production technological learning curves, is required to know the accumulated production of biodiesel, the initial costs of production and the rate of learning. With this information the following equations can be applied: Equation . = � ∗ ��
= Where: Cost = Cost of production at the moment t Cost = Initial production cost Production = Accumulated production of biodiesel for the moment t
Biodiesel production costs 1G
= Costs linked to raw
material (Palm Oil)
Variation of production costs by production-
dependent technological learning
+
Variation of production costs by independent
production technological learning
Others Costs

Appendix 3. Model indicator: statistics issues 199
P� = Learning rate b= Constant factor
According to Espinoza (2015) assumed b = - 0,0163. If this value is replaced in the equation (2) is obtained that:PR= 2-0,0163= 98,875%. This means that there is a reduction in costs of 1,125% every time you bend the accumulated production of biodiesel. The calculation of the cumulative production-dependent learning curve can be with this estimate of b. Applying equation (1) to consider that: � % = � �
The initial costs are costs defined in the first year of operation, which was in 2008.
It is important to remember that the total cost of producing biodiesel is divided into two parts, the first are the costs associated with Palm oil biodiesel production, and the second are other cost. It is on the other costs that can occur with a technological learning. Therefore the estimated cost of production-dependent technological learning is calculated using Equation 1. OTHER independent of the cumulative production of biodiesel estimated costs are calculated: BdPrCost = BdPrCosts − BdPrCosts It is gets the following table of costs estimated:
t BdPr1G Acumulated biodiesel production
BdPrCosts BdPrCost linked_to_ OilPalm_Price
BdPrCosts-Others Others_ BdPr_Cost Dependent_of_BdPr
Others BdPr_Cost_ Independent_of_BdPr
9 22730 22730 1185 800 385 385 0 10 169411 192141 1004 790 215 315,53 -101 11 337713 529854 1225 997 228 310,36 -82 12 443037 972891 1409 1137 272 307,30 -35 13 489991 1462882 1205 911 293 305,26 -12 14 503337 1966219 1335 1035 299 303,80 -4,3
The calculation of other independent of the cumulative production of biodiesel estimated costs, are those costs than other types of learning technology, external to the production of biodiesel, contributed to the reduction of costs. To explain this decrease in costs not associated with the production, discussed the relationship with the generation of patents and scientific papers globally on the production of first generation biodiesel if time>8 then (Others_BdPr_Cost_Independent_of_BdPr+Others_BdPr_Cost_Dependent_of_BdPr+BdPr_Cost_linked_to_OilPalm_Price) else 0
8 Others biodiesel production costs depend of biodiesel production OthBdPrCostsDepPr if time >8 then 385*Accumulated_Production_of_biodiesel_1G^-0.0163 else 0
9 Biodiesel production costs linked to Palm oil Price BdPrCostsPalmOilPrice if time>8 then EffFactTecPalmOilBd *PalmOilPrice else 0
10 Palm oil price PalmOilPrice
Year 1999 2000 2001 2002 2003 2004 2005 2006 2007 2008 2009 2010 2011 2012 2013
t 0 1 2 3 4 5 6 7 8 9 10 11 12 13 14
PalmOilPrice 377 261 238 357 410 435 368 417 719 634 644 809 966 845 764
PalmOilStoBd 0 0 0 0 0 0 0 0 0 24094 179576 357976 469619 519390 533537
Oil_Price 147 231 198 199 237 316 432 503 551 760 472 606 723 717 746
Data utilized: 1999-2009 Regression Analysis: PalmOilPrice_1 versus PalmOilStoBd_1, Oil_Price_2
The regression equation is
PalmOilPrice_1 = 217 + 0.000858 PalmOilStoBd_1 + 0.569 Oil_Price_2
Predictor Coef SE Coef T P
Constant 216.66 68.52 3.16 0.013 PalmOilStoBd_1 0.0008579 0.0006122 1.40 0.199
Oil_Price_2 0.5687 0.1728 3.29 0.011
S = 100.384 R-Sq = 67.4% R-Sq(adj) = 59.3%
Analysis of Variance
Source DF SS MS F P Regression 2 166783 83391 8.28 0.011
Residual Error 8 80615 10077
Total 10 247398
Final equation : 217+0.572*Oil_Price+0.000747*PalmOilStoBd
11 Diesel consumed in transport sector DiConsTransp Year 1999 2000 2001 2002 2003 2004 2005 2006 2007 2008 2009 2010 2011 2012 2013

200 Sustainability assessment of biodiesel production in Colombia
t 0 1 2 3 4 5 6 7 8 9 10 11 12 13 14 DiConsTransp 1434533.3 1763066.7 2525600 1766800 1983333.3 2579733.3 2863466.7 3309600 3332933.3 3513066.7 3770666.7 3767866.7 4714266.7 5010133.3 4659722.7
DieselVehicles 605282 727994 850706 973418 1096130 1218842 1341554 1458486 1580586 1744307 1843738 1912869 2056526 2230321 2323254.48
Data utilized: 1999-2013 Regression Analysis: DiConsTransp versus Diesel_Vehicles The regression equation is
DiConsTransp = 2.12 Diesel_Vehicles
Predictor Coef SE Coef T P Noconstant
Diesel_Vehicles 2.12350 0.04965 42.77 0.000
S = 299488
Analysis of Variance
Source DF SS MS F P
Regression 1 1.64056E+14 1.64056E+14 1829.08 0.000 Residual Error 14 1.25570E+12 89693035111
Total 15 1.65312E+14
Final equation : 2.12 *Diesel_Vehicles Units :
�ñ × ×
×
× �
× �
� = , �ñ
12 Biodiesel consumption estimated in transport sector BdConsTransp (DiConsTransp*MxRatBdDi)/(1-MxRatBdDi)
13 Valorization of glycerol by PDO PDOGly GlyPr* *0.4*0.677
14 Glycerol production GlyPr 0.11*BdPr1G
15 Factor valorization PDO FactorValorizPDO IF MxRtBdDi>0.12 THEN (MxRtBdDi+MxRtBdD*0.1) ELSE 0
16 Total biodiesel production TotalBdPr BdPr1G+ Bd2&3G
17 Biodiesel production second and third generation in Colombia Bd2&3G if TIME>=20 then BdPr1G*0.10+ FactPromBd2&3G else 0
18 Unsatisfied demand of biodiesel in Colombia - stock UnsDemandBd BdConsTransp -TotalBdPr
19 Promotion factor biodiesel second and third generation in Colombia FactPromBd2&3G & = ( _ &� _ & ) × & + ( )
20 Index of energy diversity of Colombia IndexEnDiv The information was based on kilotonnes of oil equivalent (ktoe) secondary energy sources (charcoal, coal, diesel, electricity, fuel oil, industrial gas, liquefied gas, gasoline engine, refinery gas, kerosene is considered and non-energy) and primary energy sources (hydropower, wood, bagasse, oil, coal, natural gas, industrial waste) in Colombia. From 2009 biodiesel and alcohol fuel is introduced secondary energies. According to The Global Energy Architecture Performance Index Report 2013 Diversity index of Total primary energy supply and secondary (Herfindahi index) it can be used to assess the energy diversity of a country; At higher values it lowers energy diversity.

Appendix 3. Model indicator: statistics issues 201
where "s" breaking the type of energy to the square of the n types of energy that compose
Year 2008 2009 2010 2011 2012 2013
t 9 10 11 12 13 14 IndDivEnergP 0.21 0.21 0.21 0.21 0.22 0.23 TM_1 0 0.05 0.06 0.07 0.08 0.09
Data utilized: 2008-2013
RAPPORT DÉTAILLÉ Statistiques de la régression Coefficient de détermination multiple 0.93 Coefficient de détermination R^2 0.87 Coefficient de détermination R^2 0.78 Erreur-type 0.00 Observations 6.00
Ftable 5.5 ANALYSE DE VARIANCE Ttable 2.4
Degré de
liberté
Somme
des
carrés
Moyenne
des carrés F
Valeur
critique de
F
Régression 2 0.00024 0.00012 9.8 0.04794
Résidus 3 0.00004 0.00001
Total 5 0.00028
Coefficients
Erreur-
type
Statistiqu
e t Probabilité
Limite
inférieur
e pour
seuil de
confianc
e = 95%
Limite
supérieur
e pour
seuil de
confiance
= 95%
Limite
inférieur
e pour
seuil de
confianc
e =
95,0%
Limite
supérieur
e pour
seuil de
confiance
= 95,0%
Constant 16.71 6.91 2.42 0.09 -5.27 38.69 -5.27 38.69 cos('TM_1' + 1,45397) -282.60 118.33 -2.39 0.10 -659.17 93.97 -659.17 93.97 cos(2 * 'TM_1' + 1,45397) 141.02 59.08 2.39 0.10 -47.01 329.05 -47.01 329.05
Final equation: -282.567 * cos(MxRtBdDi + 1.45397) + 141.001 * cos(2 * MxRtBdDi + 1.45397) + 16.707
21 Palm oil production PalmOilPr
Year 1999 2000 2001 2002 2003 2004 2005 2006 2007 2008 2009 2010 2011 2012 2013 t 0 1 2 3 4 5 6 7 8 9 10 11 12 13 14
PalmOilPr 492354 520465 543677 524871 525470 630016 660127 714307 733241 777509 804838 753039 945064 973770 1039785 CrYieldPalm 4.05 4.09 4.18 3.75 3.58 4.11 4.03 4.02 3.67 3.51 3.41 3 3.54 3.25 3.11 DPrice 339 312 306 306 331 423 551 647 829 984 909 1143 1321 1313 1416
Data utilized: 1999-2011 Regression Analysis: PalmOilPr versus Crop_Yield_in_Pa, DPrice
The regression equation is PalmOilPr = 95081 Crop_Yield_in_Palm_Cultivation + 483 DPrice
Predictor Coef SE Coef T P Noconstant
Crop_Yield_in_Palm_Cultivation 95081 5412 17.57 0.000 DPrice 487.03 35.15 13.86 0.000
S = 32053.2
Analysis of Variance
Source DF SS MS F P
Regression 2 4.48409E+12 2.24205E+12 2182.23 0.000 Residual Error 9 9246695203 1027410578
Total 11 4.49334E+12
Source DF Seq SS
Crop_Yield_in_Palm_Cultivation 1 4.28684E+12 DPrice 1 1.97248E+11
Final equation: if (95081* CrYieldPalm + 483*DPrice < LandP * CrYieldPalm) then (95081* CrYieldPalm + 483*DPrice) else (LandP * CrYieldPalm)
22 Palm oil sales PalmOilS

202 Sustainability assessment of biodiesel production in Colombia
Year 1999 2000 2001 2002 2003 2004 2005 2006 2007 2008 2009 2010 2011 2012 2013
t 0 1 2 3 4 5 6 7 8 9 10 11 12 13 14 PalmOilPr 492354 520465 543677 524871 525470 630016 660127 714307 733241 777509 804838 753039 945064 973770 1039785 PalmOilS 457555.1 545190.3 552047.3 522608 532673.7 623970.9 669084.3 705530.2 729454.8 774606.1 791841.5 751429.2 941836.6 975857.2 1042863 Data utilized: 1999-2013 Regression Analysis: PalmOilS_1 versus PalmOilPr_1 The regression equation is PalmOilS_1 = 0.998 PalmOilPr_1
Predictor Coef SE Coef T P
Noconstant PalmOilPr_1 0.998020 0.004566 218.56 0.000
S = 12901.9
Analysis of Variance
Source DF SS MS F P
Regression 1 7.95136E+12 7.95136E+12 47767.98 0.000 Residual Error 14 2330410383 166457884
Total 15 7.95369E+12
Final equation: 0.998*PalmOilPr
23 Palm oil sales to other uses PalmOilSoth PalmOilS-PalmOilStoBd
24 Palm oil sales to biodiesel PalmOilStoBd EffFactTecPalmOilBd*BdPr1G
25 Crop yield in palm cultivation CrYieldPalm
Year 1999 2000 2001 2002 2003 2004 2005 2006 2007 2008 2009 2010 2011 2012 2013
t 0 1 2 3 4 5 6 7 8 9 10 11 12 13 14 CrYieldPalm 4.05 4.09 4.18 3.75 3.58 4.11 4.03 4.02 3.67 3.51 3.41 3 3.54 3.25 3.11 SoilLossPalm 6038045.6 6331459 6839104.3 7494008.1 8629154.7 10078120.8 11333048.9 12373298.8 13346662.4 14897641.7 16307491.1 18080684.5 19226485.9 20357266.6 21490075.7
AgrochemPalm 3294830 3433518 3681612 3997136 4549622 5256394 5940594 6436540 6751338 7413032 7931795.1 8890286 9402096.3 9953570 10489204
Data utilized: 1999-2013 Regression Analysis: CrYieldPalm versus Soil_Loss_in, Agrochemical The regression equation is CrYieldPalm = 3.73 - 0.000001 SoilLossPalm
+ 0.000001 AgrochemPalm
Predictor Coef SE Coef T P Constant 3.7295 0.4237 8.80 0.000
SoilLossPalm -0.00000065 0.00000032 -2.02 0.066 AgrochemPalm 0.00000129 0.00000070 1.83 0.092
S = 0.204846 R-Sq = 75.9% R-Sq(adj) = 71.8%
Analysis of Variance
Source DF SS MS F P Regression 2 1.58239 0.79120 18.86 0.000
Residual Error 12 0.50354 0.04196
Total 14 2.08593
Final equation: 3.7302-0.00000065* SoilLossPalm +0.0000012803* AgrochemPalm
26 Agrochemicals applied in land for palm cultivation AgrochemPalm LandP *FAAPC
27 Soil loss in palm cultivation SoilLossPalm
Year 1999 2000 2001 2002 2003 2004 2005 2006 2007 2008 2009 2010 2011 2012 2013
t 0 1 2 3 4 5 6 7 8 9 10 11 12 13 14

Appendix 3. Model indicator: statistics issues 203
SoilLossPalm 6038045.6 6331459 6839104.3 7494008.1 8629154.7 10078120.8 11333048.9 12373298.8 13346662.4 14897641.7 16307491.1 18080684.5 19226485.9 20357266.6 21490075.7
AgrochemPalm 3294830 3433518 3681612 3997136 4549622 5256394 5940594 6436540 6751338 7413032 7931795.1 8890286 9402096.3 9953570 10489204
ForEcosLand 12949612.5 12892603 12824586.6 12756570.2 12688553.8 12620537.4 12552521 12484504.6 12416488.2 12348471.8 12280455.4 12215785.9 12181588.3 12147486.5 12121982
Data utilized: 1999-2013 Regression Analysis: SoilLossPalm versus Agrochemical, Forests_and_ The regression equation is SoilLossPalm = 2.16 AgrochemPalm
- 0.0922 ForEcosLand
Predictor Coef SE Coef T P Noconstant
AgrochemPalm 2.15672 0.01810 119.13 0.000 ForEcosLand -0.09221 0.01001 -9.21 0.000
S = 176139
Analysis of Variance
Source DF SS MS F P
Regression 2 2.87546E+15 1.43773E+15 46340.92 0.000 Residual Error 13 4.03326E+11 31025071528
Total 15 2.87586E+15
Final equation: 2.15672139* AgrochemPalm -0.0922105* ForEcosLand
28 Land for palm cultivation LandP LandP (t) = LandP (t - dt) + (VarLandP - DecreaseLandP) * dt INIT LandP = 143115
29 Variation of land for palm cultivation VarLandP
VarLandP 6304.0 11277.0 14342.0 25113.0 32126.0 31100.0 22543.0 14309.0 30077.0 23580.1 43567.8 23264.1 25067.0 24347.0 QualEmPalm -21009.5 -22513.6 -24426.5 -27776.1 -32061.1 -36209.2 -39216.0 -41124.5 -45136.2 -48861.3 -55022.4 -58792.3 -62530.8 -66358.2 CrYieldPalm 4.1 4.2 3.8 3.6 4.1 4.0 4.0 3.7 3.5 3.4 3.0 3.5 3.3 3.1 BdConsTransp 0.0 0.0 0.0 0.0 0.0 0.0 0.0 175417.5 184898.2 240680.9 283602.9 409936.2 495507.7 506267.0
VarPopDispViol 61308 13604 20094 -58189 -639 17697 -14326 2342 -8907 -53420 -16584 -49 340 3021 Data utilized: 1999-2013 Nonlinear Regression: VarLandP = a1 * cos(QualEmPalm) + ... Method Algorithm Gauss-Newton
Max iterations 200 Tolerance 0.00001
Starting Values for Parameters
Parameter Value a1 1
a2 1 a3 1
a4 1
Equation:
VarLandP = -370.376 * cos(QualEmPalm) - 29119.2 * cos(CrYieldPalm) + 2197.48 * cos(BdConsTransp) - 5057.52 * cos(VarPopDispViol)
Parameter Estimates
Parameter Estimate SE Estimate
a1 -370.4 3881.02 a2 -29119.2 3029.06
a3 2197.5 2648.32 a4 -5057.5 3451.44
VarLandP = a1 * cos(QualEmPalm) + a2 * cos(CrYieldPalm) + a3 *
cos(BdConsTransp) + a4 * cos(VarPopDispViol)
Summary Iterations 2
Final SSE 804074600 DFE 10
MSE 80407460

204 Sustainability assessment of biodiesel production in Colombia
S 8967.02
Final equation: VarLandP = -370.376*cos(QualEmPalm)-29119.2*cos(CrYieldPalm)+2197.48*cos(BdConsTransp)-5057.52*cos(VarPopDispViol)
30 Decrease of land for palm cultivation DecreaseLandP FBd2&3Gha*BdPr2&3G
31 Agricultural lands AgrLand AgrLand (t) = AgrLand (t - dt) + (-VarAgrLand) * dt INIT AgrLand = 2068915
32 Food security indicator FoodSecInd AgrLand/LandP
33 Variation of agricultural lands VarAgrLand
Year 1999 2000 2001 2002 2003 2004 2005 2006 2007 2008 2009 2010 2011 2012 2013 t 0 1 2 3 4 5 6 7 8 9 10 11 12 13 14
VarAgrLand -71901.1 44678.9 -427883.2 226292.2 -24688.3 -176641.4 -206819.5 130132.1 -107779.7 -121064.1 -46401.4 -74527.8 -5169.2 -226628.2 LandP 149765 156069 167346 181688 206801 238927 270027 292570 306879 336956 360536.1 404103.9 427368 452435 476782
AgrLand 2096137.5 2024236.4 2068915.4 1641032.1 1867324.3 1842636.1 1665994.6 1459175.2 1589307.2 1481527.5 1360463.4 1314062 1239534.2 1234365 1007736.8 LivLand 23176242.8 23235519 22947711 23283059 23259712 23579130 23861161 23757924 23785137 23985105 23830695 24068360 23268239 23756137.3 24073518.3
Data utilized: 1999-2013 Regression Analysis: VarAgrLand versus Land_for_Pal, Agricultural, ... The regression equation is VarAgrLand = 3.28 LandP + 1.13 AgricLand - 0.120 LivLand
Predictor Coef SE Coef T P
Noconstant LandP 3.2770 0.8670 3.78 0.003
AgricLand 1.1291 0.2736 4.13 0.002 LivLand -0.12010 0.02888 -4.16 0.002
S = 108719
Analysis of Variance
Source DF SS MS F P Regression 3 2.88328E+11 96109258290 8.13 0.004
Residual Error 11 1.30018E+11 11819843638
Total 14 4.18346E+11
Final equation: 1.13*AgricLand - 0.120*LivLand + 3.28*LandP
34 Livestock land LivLand
Year 2000 2001 2002 2003 2004 2005 2006 2007 2008 2009 2010 2011 2012 2013 t 1 2 3 4 5 6 7 8 9 10 11 12 13 14
LivLand 23235519.0 22947711.0 23283059.0 23259712.0 23579130.0 23861161.0 23757924.0 23785137.0 23985105.0 23830695.0 24068360.0 23268239.0 23756137.3 24073518.3 AgricLand 2024236.4 2068915.4 1641032.1 1867324.3 1842636.1 1665994.6 1459175.2 1589307.2 1481527.5 1360463.4 1314062.0 1239534.2 1234365.0 1007736.8
PooPop 2678981 2699966 2723175 2758452 2359167 2291640 2287760 2273035 1878043 1842059 2311804 2254761 2122471 2004001 VarLandP 6304.0 11277.0 14342.0 25113.0 32126.0 31100.0 22543.0 14309.0 30077.0 23580.1 43567.8 23264.1 25067.0 24347.0
Data utilized: 2000-2013
RAPPORT DÉTAILLÉ Statistiques de la régression
Coefficient de détermination multiple
Coefficient de détermination R^2 0.882 Coefficient de détermination R^2 0.842
Erreur-type 206708.39 Observations 13
Ftable 2.72767314 ANALYSE DE VARIANCE Ttable 1.81246112
Degré de liberté
Somme des
carrés
Moyenne des
carrés F Valeur critique de F Régression 3 1.2486E+12 4.1621E+11 22.38 0.00258725 Résidus 10 4.2728E+11 4.2728E+10 Total 13 1.6759E+12

Appendix 3. Model indicator: statistics issues 205
Coefficients Erreur-type Statistique t Probabilité
Limite inférieure
pour seuil de
confiance = 95%
Limite supérieure
pour seuil de
confiance = 95%
Limite inférieure
pour seuil de
confiance =
95,0%
Limite supérieure
pour seuil de
confiance =
95,0%
Constante 25158227 578157.594 62.82 1.0485E-12 23717432.4 26293863.2 23717432.36 26293863.2 AgricLands -0.4218 0.27729274 -2.04 0.06048401 -0.76780638 0.46788707 -0.767806384 0.46788707 PoorPop -0.4772 0.28748857 -2.35 0.05312925 -1.27082426 0.01030464 -1.270824264 0.01030464 VarLandP 11.402 6.80548168 2.42 0.07884099 -1.84592058 28.4811957 -1.845920583 28.4811957
Final equation: 25158227 - 0.422 *AgricLand- 0.477 *PoorPop+ 11.4 *VarLandP
35 Forest and ecosystems lands ForEcosLand ForEcosLand(t)= ForEcosLand(t-dt)+(-VarForEcosLand)dt INIT ForEcosLand = 13006622 ha
36 Variation of forest and ecosystems lands VarForEcosLand
Year 1999 2000 2001 2002 2003 2004 2005 2006 2007 2008 2009 2010 2011 2012 2013 t 0 1 2 3 4 5 6 7 8 9 10 11 12 13 14
VarForEcosLand -57009.5 -57009.5 -68016.4 -68016.4 -68016.4 -68016.4 -68016.4 -68016.4 -68016.4 -68016.4 -68016.4 -64669.5 -34197.6 -34101.8 -25504.5 ForEcosLand 12949612.5 12892603 12824586.6 12756570.2 12688553.8 12620537.4 12552521 12484504.6 12416488.2 12348471.8 12280455.4 12215785.9 12181588.3 12147486.5 12121982 LivLand 23176242.8 23235519 22947711 23283059 23259712 23579130 23861161 23757924 23785137 23985105 23830695 24068360 23268239 23756137.3 24073518.3
PopPalm 4141743 4181458 4237512 4298187 4366354 4434543 4488736 4556952 4639004 4707649 4776817 4846818 4917577 4988642 5060185
Data utilized: 1999-2013 Regression Analysis: VarForEcosLa versus Forests_and_, Livestock_La, ... The regression equation is VarForEcosLand = - 4909713 + 0.296 ForEcosLands- 0.0128 LivLand + 0.317 PopPalm
Predictor Coef SE Coef T P
Constant -4909713 705735 -6.96 0.000 ForEcosLands 0.29637 0.03948 7.51 0.000
LivLand -0.012846 0.005044 -2.55 0.027 PopPalm 0.31676 0.03548 8.93 0.000
S = 4420.18 R-Sq = 93.1% R-Sq(adj) = 91.3%
Analysis of Variance
Source DF SS MS F P
Regression 3 2913828040 971276013 49.71 0.000 Residual Error 11 214917881 19537989
Total 14 3128745921 Final equation: - 4909710 + 0.296*ForEcosLand - 0.0128*LivLand + 0.317*PopPalm
37 Biodiversity indicator BiodivInd � � = ×
38 Quality of employment in palm cultivation QualEmPalm = − � 39 Better quality employment in palm cultivation BetterQEmPalm = � + � � 40 Total Workers in Palm Cultivation TotEmPalm = × 41 Direct contracts employers in Palm Cultivation DirectEmPalm � = × 42 Unionized employees in Palm Cultivation UnionizedEmPalm � � = × 43 Detriment of quality employment in palm cultivation DetrimQEmPalm � = � & � + + ℎ� 44 Subcontracted employers in Palm Cultivation SubcontrEmPalm = ×
45 Child Labour in Palm Cultivation ChildLabPalm ℎ� = ×
46 Population displaced by violence PopDispViol
Year 1999 2000 2001 2002 2003 2004 2005 2006 2007 2008 2009 2010 2011 2012 2013 t 0 1 2 3 4 5 6 7 8 9 10 11 12 13 14

206 Sustainability assessment of biodiesel production in Colombia
PopDispViol 68452 129760 143364 163458 105269 104630 122327 108001 110343 101436 48016 31432 31383 31723 34744 LandP 149765 156069 167346 181688 206801 238927 270027 292570 306879 336956 360536 404103 427368 452435 476782
Data utilized: 1999-2013 Regression Analysis: PopDispViol versus LandP The regression equation is
PopDispViol = 183582 - 0.321 LandP
Predictor Coef SE Coef T P Constant 183582 20636 8.90 0.000
Land_for_Palm_Cultivation -0.32053 0.06565 -4.88 0.000
S = 27428.6 R-Sq = 64.7% R-Sq(adj) = 62.0%
Analysis of Variance Source DF SS MS F P
Regression 1 17931458264 17931458264 23.83 0.000
Residual Error 13 9780280454 752329266 Total 14 27711738718
Final equation: 183582-0.321*LandP
47 Poor population PoorPop
Year 1999 2000 2001 2002 2003 2004 2005 2006 2007 2008 2009 2010 2011 2012 2013 t 0 1 2 3 4 5 6 7 8 9 10 11 12 13 14
PoorPop 2652657 2678981 2699966 2723175 2758452 2359167 2291640 2287760 2273035 1878043 1842059 2311804 2254761 2122471 2004001
LandP 149765 156069 167346 181688 206801 238927 270027 292570 306879 336956 360536 404103 427368 452435 476782 Data utilized: 1999-2013 Regression Analysis: PoorPop versus Land_for_Palm_Cultivation_1 The regression equation is
PoorPop = 2987016 - 2.18 LandP
Predictor Coef SE Coef T P Constant 2987016 143325 20.84 0.000
LandP -2.1831 0.4560 -4.79 0.000
S = 190506 R-Sq = 63.8% R-Sq(adj) = 61.0%
Analysis of Variance Source DF SS MS F P
Regression 1 8.31808E+11 8.31808E+11 22.92 0.000 Residual Error 13 4.71803E+11 36292524857
Total 14 1.30361E+12 Final equation: 2987016-2.18*LandP
48 Land concentration index – GINI GINI
Year 2001 2002 2003 2004 2005 2006 2007 2008 2009 2010 2011 2012 2013 t 2 3 4 5 6 7 8 9 10 11 12 13 14
GINI 0.7659 0.7664 0.7686 0.7711 0.7704 0.7721 0.7750 0.7757 0.7802 0.7707 0.7720 0.7722 0.7711 LivLand 23235519.0 22947711.0 23283059.0 23259712.0 23579130.0 23861161.0 23757924.0 23785137.0 23985105.0 23830695.0 24068360.0 23268239.0 23756137.3 LandP 156069.0 167346.0 181688.0 206801.0 238927.0 270027.0 292570.0 306879.0 336956.0 360536.1 404103.9 427368.0 452435.0 OilPrice 231.5 198.0 199.5 236.9 316.4 431.7 503.4 551.3 759.6 472.2 605.8 723.1 716.8 DiCoSecTransp 1763066.7 2525600 1766800 1983333.3 2579733.3 2863466.7 3309600 3332933.3 3513066.7 3770666.7 3767866.7 4714266.7 5010133.3 BdPr1G 0 0 0 0 0 0 0 0 22730 169411 337713 443037 489991
Data utilized: 2001-2013 Regression Analysis: GINI versus LivLand, LandP, ... The regression equation is
GINI = 0.860 - 0.00000000438 LivLand + 0.000000070782 LandP + 0.00001889 OilPrice - 0.00000000354 DiConsTransp - 0.0000000274 BdPr1G
Predictor Coef SE Coef T P
Constant 0.85999 0.04601 18.69 0.000 LivLand -0.00000000 0.00000000 -2.13 0.070
LandP 0.00000007 0.00000002 3.01 0.020 OilPrice 0.00001889 0.00000433 4.36 0.003
DiConsTransp -0.00000000 0.00000000 -2.68 0.032 BdPr1G -0.00000003 0.00000001 -5.08 0.001

Appendix 3. Model indicator: statistics issues 207
S = 0.00100238 R-Sq = 95.9% R-Sq(adj) = 93.0%
Analysis of Variance Source DF SS MS F P
Regression 5 0.000166253 0.000033251 33.09 0.000 Residual Error 7 0.000007033 0.000001005
Total 12 0.000173287 Final equation: if (0.85999363-4.386E-9*LivLand+7.0782E-8*LandP+1.8892E-5*OilPrice-3.547E-9*DiConsTransp-2.746E-8*BdPr1G) <1 then 0.85999363-4.386E-9*LivLand+7.0782E-8*LandP+1.8892E-5*OilPrice-3.547E-9*DiConsTransp-2.746E-8*BdPr1G else 1 49 Biodiesel energy inputs BdEnInputs = + � + + + & � 50 Energy Palm oil extraction EnPalmOilExtr � = � + � � � + � � + 51 Input Energy Fertilizers EnFertilizers � � = � _ � × � _ + ℎ ℎ _ � × ℎ ℎ _ + � _× � _ � + � _ + _ 52 Input Energy Palm Cultivation EnPalmOilCult � = � � + � � + 53 Energy Transesterification EnTransest = _ + � � _ _ � + ℎ + 54 Biodiesel energy output BdEnOutputs = + � + � � + + + ℎ 55 Biodiesel energy EnBd = × �� 56 Palmist cake energy EnPalmistCake � = × �� 57 Palmist oil energy EnPalmistOil � � = × �� 58 Soaps energy EnSoaps = × �� 59 Glycerol purified energy EnGlycerol = × �� 60 Shell energy EnShell ℎ = ℎ × �� 61 Net energy ration NER =
62 Water demand in geographical regions influenced by biodiesel supply chain WaterBdSC = + � + + + � + 63 Agricultural water demand WaterAgr = × 64 Water demanded in oil palm cultivation WaterP = × 65 Water demanded by palm oil extraction WaterPalmOilEx � = × � 66 Livestock water demand WaterLiv � = × � 67 Population water demand WaterPop = × 68 Water demand by biodiesel production WaterBdPr = × 69 Water scarcity index WaterSI
= −
70 GHG by oil palm cultivation and palm oil extraction GHGP&POE & = × & × � 71 GHG Absorption in oil palm cultivation GHGabs = _ × 72 Oil palm cultivation for biodiesel production LandP_Bd if ((BdPr1G*EffFactTecPalmOilBd)/CropYieldPalm)<LandP then ((BdPr1G*EffFactTecPalmOilBd)/CropYieldPalm) else LandP 73 GHG emissions by indirect change of land use GHGILUC � = & + + − 74 GHG emissions by direct change of land use GHGDLUC = _ × [ × + × + × + × + ℎ × ℎ +× + × ] 75 GHG by biodiesel production and supply chain transport GHGBdPr&Transp & = & ×

208 Sustainability assessment of biodiesel production in Colombia
76 GHG emissions in life cycle of biodiesel GHGinLCBd � = & + + − 77 Greenhouse gas Emissions if Diesel 100% is used GHGifDiesel � � = × 78 Percentage GHG emissions saving compared with diesel petrochemical used %GHGsaving % � = � � − �� � ×
79 Carbon monoxide (CO) emissions of biodiesel blended by diesel COEmissions � > ℎ [ � �= � × � + × ( � × � − )] [ � �= � × � ] 80 Factor driving CO emissions change FDCO
FDCO 0.000 -0.065 -0.130 -0.185 -0.240 -0.295 -0.350 -0.375 -0.400 -0.435 -0.470 MxRtBdDi 0.0 0.1 0.2 0.3 0.4 0.5 0.6 0.7 0.8 0.9 1.0
Polynomial Regression Analysis: FDCO versus MxRtBdDi The regression equation is
FDCO = 0.002168 - 0.7111 MxRtBdDi + 0.2448 MxRtBdDi**2
S = 0.00692618 R-Sq = 99.8% R-Sq(adj) = 99.8%
Analysis of Variance Source DF SS MS F P
Regression 2 0.244384 0.122192 2547.16 0.000
Error 8 0.000384 0.000048 Total 10 0.244768
Sequential Analysis of Variance
Source DF SS F P Linear 1 0.239245 389.82 0.000
Quadratic 1 0.005140 107.14 0.000 Final equation: 0.002168- 0.7111* MxRtBdDi +0.2484* MxRtBdDi ^2
81 Particulate matter (PM) emission of biodiesel blended by diesel PMEmissions If time>8 then [PMEmissions=(FPMDiesel×DiConsTransp)+FDPM×((FPMDiesel×DiConsTransp)-1)] else [PMEmissions=FPMDiesel×DiConsTransp] 82 Factor driving PM emissions change FDPM
FDPM 0.000 -0.065 -0.130 -0.185 -0.240 -0.295 -0.350 -0.375 -0.400 -0.435 -0.470 MxRtBdDi 0.0 0.1 0.2 0.3 0.4 0.5 0.6 0.7 0.8 0.9 1.0
Polynomial Regression Analysis: FDCO versus MxRtBdDi The regression equation is
FDCO = 0.002168 - 0.7111 MxRtBdDi + 0.2448 MxRtBdDi**2
S = 0.00692618 R-Sq = 99.8% R-Sq(adj) = 99.8%
Analysis of Variance Source DF SS MS F P
Regression 2 0.244384 0.122192 2547.16 0.000 Error 8 0.000384 0.000048
Total 10 0.244768
Sequential Analysis of Variance Source DF SS F P
Linear 1 0.239245 389.82 0.000 Quadratic 1 0.005140 107.14 0.000 Final equation: 0.002168- 0.7111* MxRtBdDi +0.2484* MxRtBdDi ^2
83 Hydrocarbons (HC) emission of biodiesel blended by diesel HCEmissions If time>8 then [HCEmissions=(FHCDiesel×DiConsTransp)+FDHC×((FHCDiesel×DiConsTransp)-1)] else [HCEmissions=FHCDiesel×DiConsTransp] 84 Factor driving HC emissions change FDHC
FDHC 0.000 -0.100 -0.200 -0.280 -0.360 -0.425 -0.490 -0.535 -0.580 -0.625 -0.670 MxRtBdDi 0.0 0.1 0.2 0.3 0.4 0.5 0.6 0.7 0.8 0.9 1.0

Appendix 3. Model indicator: statistics issues 209
Polynomial Regression Analysis: FDHC versus MxRtBdDi
The regression equation is FDHC = - 0.003671 - 1.027 MxRtBdDi + 0.3695 MxRtBdDi**2
S = 0.00610323 R-Sq = 99.9% R-Sq(adj) = 99.9%
Analysis of Variance Source DF SS MS F P
Regression 2 0.486920 0.243460 6535.94 0.000 Error 8 0.000298 0.000037
Total 10 0.487218
Sequential Analysis of Variance Source DF SS F P
Linear 1 0.475208 356.11 0.000 Quadratic 1 0.011712 314.42 0.000
Final equation: - 0.003671 - 1.027 *MxRtBdDi + 0.3695 *MxRtBdDi2
85 Nitrogen oxides (NOx) of biodiesel blended by diesel NOxEmissions If time>8 then [NOxEmissions=(FNOxDiesel×DiConsTransp)+FDNOx×((FNOxDiesel×DiConsTransp)-1)] else [NOxEmissions=FNOxDiesel×DiConsTransp] 86 Factor driving NOx emissions change FDNOx
FDNOx 0.00 0.01 0.02 0.03 0.04 0.05 0.06 0.07 0.08 0.09 0.10 MxRtBdDi 0.0 0.1 0.2 0.3 0.4 0.5 0.6 0.7 0.8 0.9 1.0
Regression Analysis: FDNOx versus MxRtBdDi The regression equation is FDNOx = 0.000000 + 0.100 MxRtBdDi
Predictor Coef SE Coef T P
Constant 0.00000000 0.00000000 * * MxRtBdDi 0.100000 0.000000 * *
S = 0 R-Sq = 100.0% R-Sq(adj) = 100.0%
Final equation: 0.1*MxRtBdDi
87 Pollutant Emissions that affect air quality: Biodiesel blend PEAirQBdDi If time>8 then [PEAirQBdD=COEmissions+PMEmissions+HCEmissions+NOxEmissions] else [PEAirQBdD=0] 88 Carbon monoxide (CO) emissions of diesel 100% COEmissionsDi OEmissionsDi= FCODiesel×DiConsTransp 89 Particulate matter (PM) emission of diesel 100% PMEmissionsDi PMEmissionsDi=FPMDiesel×DiConsTransp 90 Hydrocarbons (HC) emission of diesel 100% HCEmissionsDi HCEmissionsDi=FHCDiesel×DiConsTransp 91 Nitrogen oxides (NOx) of diesel 100% NOxEmissionsDi NOxEmissionsDi=FNOxDiesel×DiConsTransp 92 Pollutant Emissions that affect air quality: if Diesel 100% PEAirQifDiesel100% PEAirQifDiesel100%=COEmissionsDi+PMEmissionsDi+HCEmissionsDi+NOxEmissionsDi
Table A2-3. Exogenous indicators – Time depend functions
1 Mix ratio biodiesel – diesel MxRtBdDi
Year 2008 2009 2010 2011 2012 2013 t 9 10 11 12 13 14
MxRtBdDi 0,05 0,06 0,07 0,08 0,09 0,098 Data utilized: 2008-2013 Regression Analysis: MxRtBdDi versus T The regression equation is
MxRtBdDi = - 0.0370 + 0.00971 T
Predictor Coef SE Coef T P Constant -0.037048 0.001918 -19.32 0.000
T 0.0097143 0.0001650 58.89 0.000
S = 0.000690066 R-Sq = 99.9% R-Sq(adj) = 99.9%

210 Sustainability assessment of biodiesel production in Colombia
Analysis of Variance
Source DF SS MS F P Regression 1 0.0016514 0.0016514 3468.00 0.000
Residual Error 4 0.0000019 0.0000005
Total 5 0.0016533 Final equation: MxRtBdDi=If (time>8)then (-0.0370+0.0097*time)else 0
Patents biodiesel production first generation
Year 1999 2000 2001 2002 2003 2004 2005 2006 2007 2008 2009 2010 2011 2012 2013 t 0 1 2 3 4 5 6 7 8 9 10 11 12 13 14
PatBd1G 0 0 0 1 1 1 2 7 4 16 19 20 17 26 31
Method Algorithm Gauss-Newton Max iterations 200 Tolerance 0,00001 Starting Values for Parameters Parameter Value Theta1 1 Theta2 1 Theta3 1 Theta4 1 Equation Parameter Estimates Parameter Estimate SE Estimate Theta1 34,7929 10,2192 Theta2 -1,0813 2,2649 Theta3 10,3406 1,4764 Theta4 2,3226 1,0188 PatBd1G_2 = Theta1 + (Theta2 - Theta1) / (1 + exp((t - Theta3) / Theta4))
Summary Iterations 50 Final SSE 98,6545 DFE 11 MSE 8,96859 S 2,99476
Final equation: EstPatBd1G= 34,7929 + (- 1,08126 - 34,7929) / (1 + exp((t - 10,3406) / 2,32259))
Articles of biodiesel production first generation
Year 1999 2000 2001 2002 2003 2004 2005 2006 2007 2008 2009 2010 2011 2012 2013 t 0 1 2 3 4 5 6 7 8 9 10 11 12 13 14
ArtCientifBd1G 2 1 1 3 5 14 8 32 40 78 102 117 96 102 128
Algorithm Gauss-Newton Max iterations 200 Tolerance 0,00001 Starting Values for Parameters Parameter Value Theta1 1 Theta2 1 Theta4 1 Theta3 1 Parameter Estimates Parameter Estimate SE Estimate
Theta1 120,842 6,41860 Theta2 3,789 4,42023 Theta4 7,588 1,75525
Theta3 8,471 0,29373 ArtCientifBd1G = Theta1 + (Theta2 - Theta1) / (1 + exp(Theta4 * ln('t_1' /Theta3))) Lack of Fit There are no replicates. Minitab cannot do the lack of fit test based on pure error.
14121086420
35
30
25
20
15
10
5
0
t
Pa
tBd
1G
_2
Fitted Line PlotPatBd1G_2 = 34,7929 + (- 1,08126 - 34,7929) / (1 + exp((t - 10,3406) / 2,32259))

Appendix 3. Model indicator: statistics issues 211
Summary Iterations 25 Final SSE 1036,15 DFE 11 MSE 94,1951 S 9,70542
Final equation: ArtCientifBd1G = 120,842 + (3,78856 - 120,842) / (1 + exp(7,58838 * ln('t_1' / 8,47082)))
CROSS-VALIDATION
The objective of cross validation is to know of if the regression equation structure is capable to
predict data that it was considered.
1 Biodiesel production first generation BdPr1G
Year 2008 2009 2010 2011 t 9 10 11 12
X1-MxRtBdDi 0.05 0.06 0.07 0.08 X2-Biodiesel production costs - BPC_1G 1185.00 1004.00 1225.00 1409.00 BdPr1G 22730.00 169411.00 337713.00 443037.00
Data used: 2008-2011 First equation: BdPr1G=-657859,77+14690851MxRt-44,6384614 BPC_1G Resumen
Estadísticas de la regresión
Coeficiente de correlación múltiple 0.99659405 Coeficiente de determinación R^2 0.99319969 R^2 ajustado 0.97959908 Error típico 26455.3097 Observaciones 4 ANÁLISIS DE VARIANZA
Grados de libertad Suma de cuadrados Promedio de los cuadrados F
Valor crítico de
F Regresión 2 1.0222E+11 5.111E+10 73.0260815 0.08246398 Residuos 1 699883409 699883409 Total 3 1.0292E+11
Coeficientes Error típico Estadístico t Probabilidad Inferior 95% Superior 95% Inferior 95,0% Superior 95,0%
Intercepción -657859.77 111631.512 -5.89313681 0.10700801 -2076272.61 760553.072 -2076272.61 760553.072 Variable X 1 14690851.5 1643005.6 8.94144941 0.07090408 -6185514.08 35567217 -6185514.08 35567217 Variable X 2 -44.6384614 127.664515 -0.34965442 0.78586217 -1666.76992 1577.493 -1666.76992 1577.493
Year BdPr1G BdPr1G Real Predicted Error 2012 489991.00 610527.5 24.6 2013 503337.00 723858.3 43.86 34.26
Year 2010 2011 2012 2013
t 11 12 13 14 MxRtBdDi 0.07 0.08 0.09 0.10 Biodiesel production costs - BPC_1G 1225.00 1409.00 1205.00 1299.00 BdPr1G 337713.00 443037.00 489991.00 503337.00
Data used: 2010-2013 Second equation: BdPr1G=-204209.699+5851503.33*MxRt+119.328274* BPC_1G
Estadísticas de la regresión Coeficiente de correlación múltiple 0.960375867 Coeficiente de determinación R^2 0.922321806 R^2 ajustado 0.766965418 Error típico 36267.38826 Observaciones 4 ANÁLISIS DE VARIANZA
Grados de
libertad
Suma de
cuadrados
Promedio de los
cuadrados F
Valor
crítico de F Regresión 2 15617658416 7808829208 5.936812882 0.27870808 Residuos 1 1315323451 1315323451
Total 3 16932981867
Coeficientes Error típico Estadístico t Probabilidad Inferior 95% Superior 95%
Inferior
95,0%
Superior
95,0%
Intercepción -204209.6995 323876.0728 -0.630518018 0.641864778 -4319445.389 3911025.99 -4319445.389 3911025.99
Variable X 1 5851503.33 1723398.691 3.39532771 0.182343125 -16046353.27 27749359.93 -16046353.27 27749359.93
Variable X 2 119.3282741 226.8369325 0.526053111 0.691702737 -2762.908231 3001.56478 -2762.908231 3001.56478
BdPr1G BdPr1G

212 Sustainability assessment of biodiesel production in Colombia
Year Real Predicted error 2008 22730.00 229769.4718 910.8643724 2009 169411.00 266686.0875 57.41958168
484.141977 Note: in 2008 biodiesel production was started, thus is an atypical biodiesel data. The error will be not considered in final error average
Year 2008 2009 2012 2013 t 9 10 13 14
MxRtBdDi 0.05 0.06 0.09 0.10 Biodiesel production costs - BPC_1G 1185.00 1004.00 1205.00 1299.00 BdPr1G 22730.00 169411.00 489991.00 503337.00
Data used: 2008-2009 and 2012-2013 Third equation: BdPr1G=-219471.692+11184368.1 MxRtBdDi -270.527578 BPC_1G
Estadísticas de la regresión Coeficiente de correlación múltiple 0.995805596 Coeficiente de determinación R^2 0.991628785 R^2 ajustado 0.974886354 Error típico 37870.46678
Observaciones 4 ANÁLISIS DE VARIANZA
Grados de libertad
Suma de
cuadrados
Promedio de los
cuadrados F
Valor crítico
de F
Regresión 2 1.69888E+11 84943847863 59.22848361 0.091494346 Residuos 1 1434172254 1434172254
Total 3 1.71322E+11
Coeficientes Error típico Estadístico t Probabilidad Inferior 95% Superior 95%
Inferior
95,0%
Superior
95,0%
Intercepción -219471.6924 226569.4518 -0.96867292 0.510129542 -3098309.534 2659366.149 -3098309.534 2659366.149
Variable X 1 11184368.1 1253993.853 8.918997543 0.071081091 -4749134.541 27117870.73 -4749134.541 27117870.73 Variable X 2 -270.5275779 235.1024361 -1.150679603 0.455470298 -3257.787265 2716.732109 -3257.787265 2716.732109
BdPr1G BdPr1G Year Real Predicted error 2010 337713.00 232037.8 31.3 2011 443037.00 294104.4 33.6
Error average of three simulations: 38.1 Conclusions:
Error average slightly high Equation structure are similar in the three simulation. So, equation structure is adequate to use in model and it is possible its
use in predicted scenarios. Used in the model BdPr1G=-10099512*MxRtBdDiesel-344.4*BPC_1G First simulation BdPr1G=-657859,77+14690851*MxRt-44,6384614* BPC_1G Second simulation BdPr1G=-204209.699+5851503.33*MxRt+119.328274* BPC_1G Third simulation BdPr1G=-219471.692+11184368.1* MxRtBdDi -270.6* BPC_1G
25 Crop Yield in Palm Cultivation CrYieldPalm
Year 1999 2000 2001 2002 2003 2004 2005 2006 2007 2008
t 0 1 2 3 4 5 6 7 8 9
CrYieldPalm 4.05 4.09 4.18 3.75 3.58 4.11 4.03 4.02 3.67 3.51
X1-SoilLossPalm 6038045.6 6331459 6839104.3 7494008.1 8629154.7 10078120.8 11333048.9 12373298.8 13346662.4 14897641.7
X2-AgrochemPalm 3294830 3433518 3681612 3997136 4549622 5256394 5940594 6436540 6751338 7413032
Data used: 199 – 2008 First equation: CrYielPalm = 3.46 – 9.07E-06*SoilLossPalm + 1.82E-06*AgrochemPalm
Estadísticas de la regresión Coeficiente de correlación múltiple 0.71 Coeficiente de determinación R^2 0.51
R^2 ajustado 0.37
Error típico 0.20
Observaciones 10.00
ANÁLISIS DE VARIANZA
Grados de
libertad
Suma de
cuadrado
s
Promedio de
los cuadrados F
Valor
crítico de
F

Appendix 3. Model indicator: statistics issues 213
Regresión 2 0.275 0.138 3.603 0.084
Residuos 7 0.267 0.038 Total 9 0.542
Coeficientes
Error
típico Estadístico t
Probabilida
d
Inferior
95%
Superior
95%
Inferior
95,0%
Superior
95,0%
Intercepción 3.463 0.491 7.053 0.000 2.302 4.624 2.302 4.624 Variable X 1 0.000 0.000 -1.945 0.093 0.000 0.000 0.000 0.000 Variable X 2 0.000 0.000 1.861 0.105 0.000 0.000 0.000 0.000
Year Real Predicted error 2009 3.41 3.15 7.51 2010 3.00 3.30 9.86 2011 3.54 3.19 9.86
2012 3.25 3.17 2.39
2013 3.11 3.12 0.41
Average= 6.01
Year 2004 2005 2006 2007 2008 2009 2010 2011 2012 2013
t 5 6 7 8 9 10 11 12 13 14
CrYieldPalm 4.11 4.03 4.02 3.67 3.51 3.41 3 3.54 3.25 3.11
SoilLossPalm 10078120.8 11333048.9 12373298.8 13346662.4 14897641.7 16307491.1 18080684.5 19226485.9 20357266.6 21490075.7
AgrochemPalm 5256394 5940594 6436540 6751338 7413032 7931795.1 8890286 9402096.3 9953570 10489204
Data used 2004-2013 Second equation: CrYieldPalm= 4.21 -5.18E-7*SoilLossPalm +9.58E-07*AgrochemPalm
Estadísticas de la regresión Coeficiente de correlación múltiple 0.91 Coeficiente de determinación R^2 0.83 R^2 ajustado 0.78 Error típico 0.19 Observaciones 10.00
ANÁLISIS DE VARIANZA
Grados de
libertad
Suma de
cuadrados
Promedio de
los cuadrados F
Valor
crítico de
F Regresión 2.00 1.14 0.57 16.61 0.00
Residuos 7.00 0.24 0.03
Total 9.00 1.38
Coeficientes
Error
típico Estadístico t
Probabilida
d
Inferior
95%
Superior
95%
Inferior
95,0%
Superior
95,0%
Intercepción 4.21 0.66 6.40 0.00 2.66 5.77 2.66 5.77 Variable X 1 0.00 0.00 -1.46 0.19 0.00 0.00 0.00 0.00 Variable X 2 0.00 0.00 1.21 0.27 0.00 0.00 0.00 0.00
Year Real Predicted error 1999 4.05 4.24 4.7 2000 4.09 4.22 3.2 2001 4.18 4.19 0.3 2002 3.75 4.16 10.9 2003 3.58 4.10 14.5
Average= 6.7
Year 1999 2000 2001 2002 2003 2009 2010 2011 2012 2013
t 0 1 2 3 4 10 11 12 13 14
CrYieldPalm 4.05 4.09 4.18 3.75 3.58 3.41 3 3.54 3.25 3.11
SoilLossPalm 6038045.6 6331459 6839104.3 7494008.1 8629154.7 16307491.1 18080684.5 19226485.9 20357266.6 21490075.7
AgrochemPalm 3294830 3433518 3681612 3997136 4549622 7931795.1 8890286 9402096.3 9953570 10489204
Data used: 199-2003 and 2010-2013 Third equation: CrYielPalm= 4.82 + 3.86E-07*SoilLossPalm -9.58E-07*AgrochemPalm
Estadísticas de la regresión Coeficiente de correlación múltiple 0.89 Coeficiente de determinación R^2 0.79 R^2 ajustado 0.72 Error típico 0.22

214 Sustainability assessment of biodiesel production in Colombia
Observaciones 10
ANÁLISIS DE VARIANZA
Grados de
libertad
Suma de
cuadrados
Promedio de
los cuadrados F
Valor
crítico de
F Regresión 2 1.227 0.613 12.7 0.00459 Residuos 7 0.33 0.048 Total 9 1.56
Coeficientes
Error
típico Estadístico t
Probabilida
d
Inferior
95%
Superior
95%
Inferior
95,0%
Superior
95,0%
Intercepción 4.83 0.81 5.94 0.00 2.90 6.75 2.90 6.75 Variable X 1 0.00 0.00 0.54 0.61 0.00 0.00 0.00 0.00 Variable X 2 0.00 0.00 -0.62 0.56 0.00 0.00 0.00 0.00
Year Real Predicted error
2004 4.11 3.69 10.3
2005 4.03 3.52 12.7
2006 4.02 3.44 14.3
2007 3.67 3.52 4.1
2008 3.51 3.48 0.7
Average= 8.5 Error average of three simulations: 7.05 Conclusions:
Satisfactory error average Equation structure are similar in the three simulation. So, equation structure is adequate to use in model and it is possible its use
in predicted scenarios. Used in the model CrYieldPalm= 3.7-6.5E-7* SoilLossPalm +1.28E-6* AgrochemPalm First simulation CrYielPalm = 3.46 – 9.07E-06*SoilLossPalm + 1.82E-06*AgrochemPalm Second simulation CrYieldPalm= 4.21 -5.18E-7*SoilLossPalm +9.58E-07*AgrochemPalm Third simulation CrYielPalm= 4.82 + 3.86E-07*SoilLossPalm -9.58E-07*AgrochemPalm

Appendix 4. Online survey 215
Appendix 4. Online survey
https://docs.google.com/forms/d/1dwBYYCBxfY7ZEp7qyA3bgx5joiYhM8PnHAPMHStVQGY/viewform
Importance of prmc1ples and criteria for assessing the sustainab1lity of b1odiesel
Introduction The obfectlw of this ,..., teh ls 10 evaJu.atelht ll.lttalnablity of blodl~. To .chltve lhlt, .,.... neecl lO lll.lbflth the r.iatlve lmpor1~M:I of the tUit~llty prlnclp+et and I MHIIMnt tritertl ,
Art txtutuslfve twature revfew wes tondue~ to ldentJfy undeftylng pt1nclplrls Md crltW ~ ln pm'klUsstuclies SUbs.qu.nùy, tM tl.lltalnebllrty vf&klo end a multkllmenslonal pwspectl .... or auttt!Mblt wtt devetopm.nt ~ ln ordtf to propoM • t'lltfarchk.tl ttruc:ture of prtnclpl" end c~ fol' t V-*uttlng ln. tutta'nlblllty of bloOieMI ci'\H'I production {Fig t )
Purpose of this survey
The p.trpOSed lhls uwylstotolect expert opnk:ln:s ~ 1he lrnpc:Nnce Of~ Md c.rMM for ~ usessment of~ production. ln .. ruuteh. 13 ptlndJMs and 40 crttaria usoc~ Wlth !hl sociAl. polltitaf . .conomk:, tee~ ana en'Â'OM\efl.tal svstainatllily dimension.....,.. ct.!!ned. BeiOw you dl'tnd k.-y deftrUtions tor som~ tompoMnta in ttM survoey:
· Pme~ Theyllt'epremfMs.~O.MSd~IOdtb1ht~of tiiOdiotMI produttion thWt
• cntllfia· n.y ,.... mnSI.nbM condiliolu (CF~.ar.M Of quantitative') 10 atablsh tM leY'M Of mplementnon Of the sus:taiNibaty Jri"Ciples in lhe biodteset prodUction Chein.
The ~·of pmcipin and tl1"..ert. il deftned as tM lewf of i'npK1 ot each ttttanon and pme.- in the evalua!Jon ot ~. tt ls obtlined by ._lg:l'â1g the retJnugî'tett by the~ io each crtt.erion ln *'M of lhW rWv.-.ce ' "" ot mMII.Ir.rMm anc1 reliabil!y. """*h , ,.. de'lined
• R.WVance. MtaS~.AS the lieV'III Of~e and~ of the criterion ln the sust.M\abMy assessment ot blochesef
• EaM of rMISUJ'tt'Mnl Menures 1he lt~ ot KC.ul*y to lnbma:icn Incl :he .ollity to perfom'l tne m .. sutWMnt ot IN em.mn.
Baud on the gtMn CS.ftnllions. Il: ta e:rpected ~~expert 'WII caustty the pMclpMs and cl"'!erla actOI'ding to he~ Kalr
• Null'np)l'tanel 0 · L.ow~. 1 • ~ttlmportlntl. 2 • Hlg?t mpotwK:e: 3
Expert Information
Name •
SUrJW~me •
Aru olexptn.lse •
NaUonallty •
Another naUonallty, pktase spec.lfy
Nanw of or~nizaUon you belong to •
"TYPI of org1niZ1Uon •
• ensgsi
Cononuo • ] - 16% completed
Importance of principles and critena for assessing the sustamability of biodiesel
SOCIAL DIMENSION OF SUSTAINABILITY
Biomass growers and blodlesel processing companies must :
II'RIN CIPL.E 1: Respect property rtghts, 11nd tenure and customary and tradttlonal rtghta • 11 PMclplt 1 ImpOrtant fot lM tult.l~ e......-nent of blocM~ ln the toeill climtntJon?
0 1 2 3
CRI 'T.:RK)N 1: Respect the rlghts of land accen and la.nd tenure tor pusant and lndlgenous communltMa. •
Nul! low ......... Hlgh
CRITERtoN 2: Promote the minimlzation of c:on11icts over the use, access and ilnd tenure. •
Rolovonco ...... moost.nmenl
NUII low
Biodiesel production chain must:
ptRJNCIPLE 2: Be s oclal ly acuptabk •
Hlgh
Js PnnQpie 2 ~"' fof the ~~ asses.smen~ of bto6le5ef 1n the soa.t dlrr'lensKin?
0 1 2 3
Nullmpottance
CRITERtoN 3: Contnbute to national eneJgy seçurtty • nd the ac:c:eu of NraJ communities to enefVY. •
Modenlte
0
CRI T'aRION 4; To prevent genereUon or env1ronmental nol ... •
N .. l Hlgh
EaMOf 0
CRITI.ItiON 5: To prevent chang•• ln l1ndac:a~ generatlng undeslreb._ vlsual knptcts tor communh1es •
Re...., ance
hM or
Hlgh
CRITEIUON 1: To contrtbute to local prosperlty assoclated wtth the reduction of poverty and the promotion of human rtghts. •
fiiiiiYII1CI
fiMOf mllt~l
R.U..bo\ty
""' low
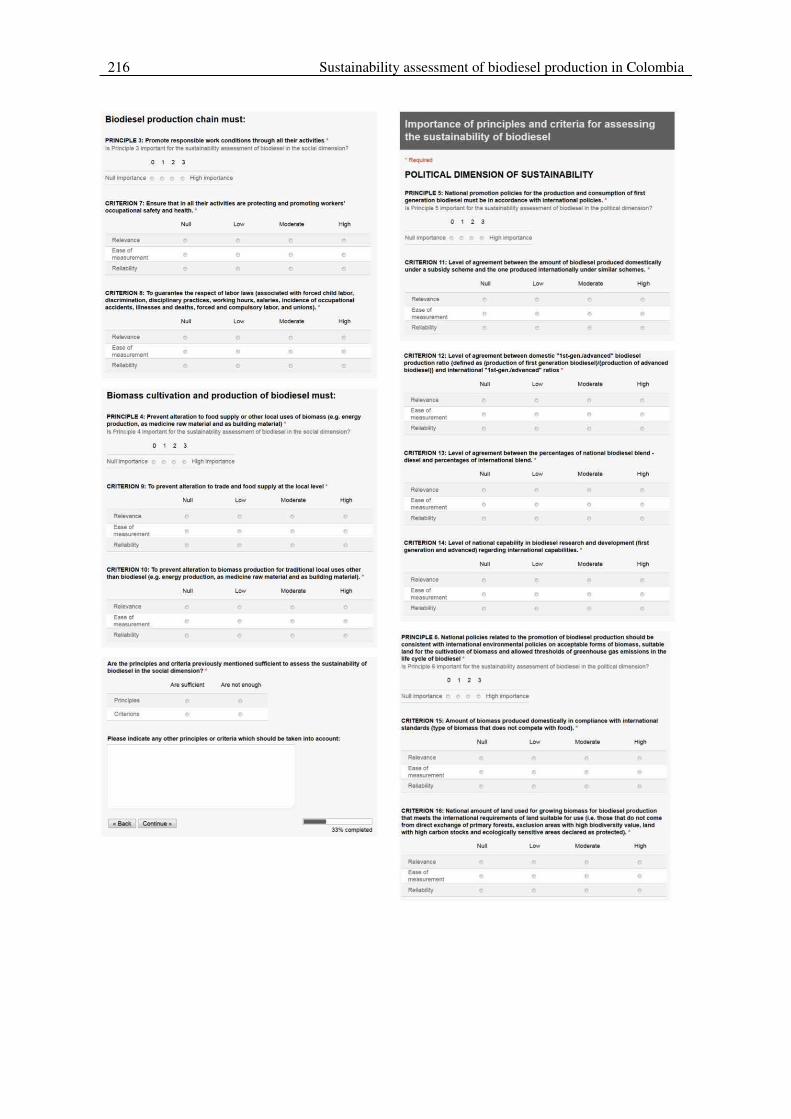
216 Sustainability assessment of biodiesel production in Colombia
Biodiesel production chain must:
PRINCIPLE 3: Promote rnpoMibt. work conditions through ali thelr acttYW.s • ts Pnnclple- llmportant tor the suste!Mbttty asseument oftNocMMI ~tM 10elal dlrnert$Q'I?
0 1 2 3
CRinRtoN 7: Ensure thal in ali thelr ecttvlUes are protecting and promotlng workers' cxcu~tionalsafety end hnlth. •
Nul Low Uoderata Hlgh
CRITEitiON 1: To guart~ntH the respect of labof laws (assoc:llted wlth forcee! chlld labot, dlscrtmlnation, disclpllnaty pracHces, woBing hours, salaries, Incidence of occupiitJonal accidents, lllnesses and duths, forced and compulsory labor, and unJons). •
Nul Low MCM»rate Hlgh
Biomass cultivation and production of biodiesel must:
PRINCIPLE 4: Prevent atterttion to food suppfy or othef toeal uses of tWomass ce.g. energy production, es mKk:lne raw mat..-leJ and as building mateNt) • tl Princlpie • Wnportal1t tor the suNJnllbilay assusment of btodtaelln the .oc~l cllmenslon?
0 1 2 3
Nulrnport.lnCI
CRITIRION 0: To prevent alteration to tracte and food suppty at m. local leval '
Null Low Modera te Hogn
CRJTERION 10: To prevent atter~Hon to blomns producUon for tTIIdltioNIIoc.llnes other than blodiesel (e.g. energy production, as medk:lne raw materlaland as buUdlng material) . ..
Null Low Moderate Htgn
Are the pttnc._,..s and eman. prevlously mentloned sutndent to assess the sustalnebHtty ot blodleselln the soc•J cUmenslon? •
Pause 1ndiclte any other ptineiptrls ot c:rtt.rut wtlk:h should tM t.ken lnto aec:ount:
- 33% cornpieted
Importance of principles and criteria for assessing the sustainability of biodiesel
. .._ POLITICAL DIMENSION OF SUSTAINABILITY
PRINCIPLE S: National promotion polk:iH tOf" the production and c:onsumptlon ot first ~tlon blodieMI must be ln aeeordanee 'Wfth fntematioNI poUc:les. • ls Pnnc:iple 5 irnpor\Wit b the sustaiMbli4y.....,.... 0( biodeMt ~ lhlt poll«aa ~?
0 1 2 3
CltiTEAION 11: Laval of agrMnMnt tMtwMn the amoont of blodlesal produeed domestkarty undet' • subskty sclwme and the one prOducad lntematlonA»y under slmllar schernes. •
Nul Low
C~I TEitiON 12: Leval of agrHment betwHn domestic " 1st-genJadvencltd" bkKfiesel production raUo {deflned as (production or flrst generatJon biodlasel)l(productJon of advanced blodlesal)} anc:llnter naUOnal " 1st-genJadvancltd" raUos •
NuH Low Moderata Hlgh
CRITERION 13: Level of agr .. ment betwHn the perc:antages or naUonal blodlesel btenddlueland percentages of lntemaUonal ble nd. ·
Relevanc•
Easeof
..,.......,."' RebbiOty
NuM Low Moderate Hlgh
CRITERlOH 14: Leval of national c:apabHtty ln blodlesal ruearch and devafopment (Rrat generaUon and advanced) regardlng lntemational c:apabtlltles. ~
R-"1\tence
Easeof .............
Nui Modera ta Hlgh
"
PRINC.,LE S. Natfonal poUc~s ralated to the promodon Of bk>diuel production Should tM consistent wtth lnternatJonal anvlrormenUII polkies on ac:c:~~ tonns or blomass, sult.abM a.nd for the c:ulttYaUOn of blomass and anowed ttwesholds of graenhouse gas emlss~ns ln th4t lite cycle of btodMsal • ts PMe~ 6 ~nib N sustll l'laoilllty a 'JMHtl"'eftt ofbiocNMt ~tM pollbe al ~?
0 1 2 3
Nul.._,....
C"-lnRION 15; Amount of biomass produt.ct domtsUc:ally tn c:omplianet wtth lnt.matfonal sUin48rds (ty~ of biomass thlt dots not c:om~tt wtth food). •
Nul Low
CRITEJtlON 18: Hltionalamount or land used tor grOW'Ing l)lormlu f~ bfodieMI produeUon that rnMts tM lnttmatloMI raqulrtm.nts of land suttabtt for use (I.e. thOsa tnat do not c:omt from dirtct .. chlngt of prtmaty rore.sts, txc:tus~ aren wlth hlgh biodlv.rslty nlut, land wttn hfgh carbon stockS and tc~ogkalty unslùYa artas dtc:lared as prot.etad). •
Re..venc:a
bseof -R-Nul Low Mode na ta

Appendix 4. Online survey 217
CRITERION 17: Amount of dom .. ucally producad blodlaul thlt mMts International pollcy on minimum average or thrtshold of gratnhoUst gu emissions ln thelr llfa cycle, lncluding Indirect changes ln land use. •
Rall11ant1
Easeol rneasurement
Null Low Modere ta
0
,.RINCIPLE 7. The actors tn\IOivtd ln Dlodlflal' s production chain should ptomota commttmant to athies, trJnsparancy and compllanca with loealtews •
Hlgh
e
ls Pnnclpla 7 imponant fof the .ustaloabtlrty usenment of blod•salln ttl a polrtl(al dJmtns100?
0 1 2 3
CRI T'ERlON 11: Laval of perception of the local communlty about the degrea or alhlcal commltmant by the actorsln blodltsars prodUction chain, •
Rehtvanta
Eua Of mtiiUftmtnl
Ralabllrty
""' Low Hlgh
e
CRI T'ERlON 11: Leval of pareapuon or the~~ communtty eboUt the c.ommltmlnt to b'antpwançy and comptlance wtth local ~ws by the Ktorslnvotved ln blodilsers production eh.lin. •
Are the pr1nclptes and crttana pf"lvlousfY mentionad sunklent to assen the sust.IIMbittty of blodWsalln thl poUtkal dimension? •
Ne not anough
Plana lndtcata beloW otMr prlnclpl .. or ertteru Whkh shOUkl be takan lnto ac.count:
• 8ack Conmue • - ..,.,amplolod
Importance of principles and criteria for assessing the sustainabihty of biodiesel
ECONOMIC DIMENSION OF SUSTAINABILITY
PRINCIPLE a. Blodlasal producUon must be sustalnabll at both macroeconomie and microaconomk laval • ts lhe Pnntlple SlmpOnam fol the austll~ try asseumen1 of btodiaselln tna econonuc: dlmeMIOn7
0 1 2 3
CRITEIUON 21 : laval of lnrluenca (lntarnitkM\1!1 and domastic) of ptodoetlon., eonsutnpdon and pt1<:as for cüesel on the production ot ftrs t ganar.tton biodlasal. •
LOW - Hl!lh
CRITEfttON 22: M nu.t p«Mtuctlon (lntematfonal and domestic) of t'vtt generation bk:ldlasel. ..
Low
CRITERIOH 23: laval of inftuanc. or produc:tion., consumptton and priees {lntlrnltlonaJ and domestk) lor V!191table oU on the production of ftrst generation blodiesel •
Hlgn
CRJTERtoN 24: la'i .. of tnnuanca of production. consumption and priees (lnW'Ntionaland domesdc:) for gtyc..tn on thl produc:Uon of ftrst ganarwdon blodiuel. •
Hlgn
e
CRITEfUON 25: Leval ol lnftuenc.e or prodUction, consumpUon and pncas (lntem~tton.land domasdc:} for advanced blodllsal on flrst gtt'lllf'aUon biodiesal. •
Hlgh
Are the prlnclpMs and crttar&l pravlousfY mantlonad sutndant to assau the sustaJnablllty of biodlesal tn the economie. dtmanston? •
Importance of principles and criteria for assessing the sustainability of biodiesel
TECHNOLOGICAL DIMENSION OF SUSTAINABILITY
PRINCIPLE 1. lKhnotogy usecf ln tha blod .. sel produdion c:Min should promette the redUction or negative im.,.cts on the envtronmant. amctancy and cost reduction ln procasses overüme • ts Pnnc:ipM 9 ~ ~IN ~ aueument of blodaHirl dM eecMo6oglc .. dlmenl.on?
CRITERION 20: L.aval or lnnuanca (International and domasUc) or reservas, production, 0 1 2 3 consumptlon and pf1cas tor oll on the ptoduetlon of nrst generatton blodlasal. •
Re~evance
Easeot m.uur.mant
R-oy
NUII
.,
Hlgh
CRtT~RfON 2t: Leval of lnnutnca of productJon (lntama&n.land dom .. tic) of edvanced biodiasat from non..ctible IMdstoekl on demand (lntematton.l and domastic) of soiland watar rasourc• • · • ... Hlgh

218 Sustainability assessment of biodiesel production in Colombia
CJIUTERION 27: L.evtl of lnftuenct of globill and domttUc: produetlon of tdVanc:td blodltsel blstd on non-c::onvtntJon-1 tuhnotoglts on ttnclency or ptoctuu end c:ost ...ctuetion. •
Null
CRITI.RION 28: LAvtl of lnnuenc:e of tec:hnotogy trends lor tnglnes on tht prodUction of ftnt generation bkxtle~. •
NUII
CRJTE.RION 21. Ltvtl of lnnutnc:t of tt<:hno~kal ttarnlng (gtObtland ctomtttk:) ln tnt produeUon of tnt generation blodltstl on r.ctuclng c:osts over lime. ·
CRITERION 29. Levtl of lnfttHtnc:t or ttchnologlcal ttamlng {global and domestJc) ln tht producUon of flrst genereUon blodlesel on r.ctuclng costs over Um.. •
N ... Moderate
"
Art tht prlnclples and er it..-ia prt vlousty mtntioned sutflc:Jent to asstss the sustaln.bllity of btodltselln tM tt<:hnofogl~l dimension? •
Nesumclent
"
«BKk Continue •
Importance of principles and criteria for assessing the sustainability of biodiesel
'R-
ENVIRONMENTAL DIMENSION OF SUSTAINABILITY
The actors involved in the biodiesel production chain must:
PRINCIPLE 10. Ensure thtlr .ctlvttJts malntaln or improve the air, solltnd water quaUty, as w.Q es they do a Pf"OPtf' man.gement of soüd wutt and wutt-.ttr • ts P'I'I'Klplt 10 rnponant tor lM: sustu'labllty ~ c:rftMocftntlln lht tmV'CWI'Iel'l:.l dlnwls;on?
0 1 2 3
CRITERtoN 30: To tnsurt that air ~ltty ts rrM~Intalntd Of knproved. •
-· Eo .... -R..._
NIAI
CR~l'ERION 31: To promote tht tf'ftcient use ofwatfl' to minlmlzt pressure on tht k>cal ava~lity of the raSOUTce. •
CRiTERtoN 32: To mlnlmlz.t tht gene...atlon of contamlnatad emu.nts end trtat sueh emu.nts ln ordtr to rnalnblln or lmprovt the Aocal water qualtty. •
NIAI Low
..
CRJTEfUON 33: To ensutt U\at non-h&ZMdous and hal.ardoUs wastas are man.agtd responslbty {collection, stonge, transportation, treatment andlor disposaJ} by promotJng thtlr mlnlmlution. rtus.t tndlor r.cydlng. •
NIAI
-CRITIJttoN 3-4: The bklmass cutttvaUon actlv!Ues for bfodit.sel must malntaln or lmprovt tht soH quallty (physkal, eMmlealtnd blotogktl propeftits) by tsblbUshlng responslbtt prKticts or crop ma~t. handllng or agrocMmic.ats and .,_, , control. •
NIAI
PRINCIPLE 1 t . llodit.sel prodUction chain must h:avt • posiUVt ba~net of grHnhOUH gasts, and malnt.lk'l or promott cerbon slnks • ls PmclpM t t irl'lpc)Mnl rcw lht ·~ as......,.,..ofbeodle:Mflnh~ -· 0 1 2 3
CRinRtoN 35: The amount or grHnl'lou" gases ~ptum or stor.ctln carbon slnka (blomass nsoc~ttd} must bt greattr thin t.ht emount of grMnhoust g.t'lts emttt.ct by t:ht btodltnl production chain. •
Low
PftiNCIPLE 12. l kx*stl produetion chain must promott the conHn"ation and protection of biodtversHy and wildltfe. • 1'1 the~ 121'np0f\ant JorN s~ asMSS1Mnt oft.ocitMIIn'-~ -· 0 1 2 3
CfUT'EittON 36: TtansfonnaUon of natural eeotytltft'lt end lou of nattve naturalitndseape shoukt bt av~ durlng bfomau cutttvatlon and bioditsel produedon. •
NIAI Low -·· ..
R..-.y
CRtnRK>N 37: ltoditstt producUon chtfn must preserve artts wtth lrtgilt eeosystems (both tlffTnb'YI and aqwtlc ecosyst.ms) sucl'l as n.ture rtstn'H dtftntd by tht n.tionel lnYirOM'\Intll &lglllatJon. 1
NIAI
0

Appendix 4. Online survey 219
CRI TER ION 38: The- number of specl .. of wildtrfe Nsted n vulnet~~ble or endange,-.d should not be atteetad duf1ng blomus cutttvadon and proeesslng of blodlesel. •
R-o ...... _.......
"-Low High
PRJNCIPLE 13. Energy emct.ncy and uu of renewable energy should be promoted ln the prœes.Hs that .,.. part of the b4odiesel produç:tion c.hljn • ts ~ 13 mportant for N austa~nat~My asseument of blociesef tn lhrt ~ -· 0 1 2 3
CRITERION 351: Energy used tn the blodiesel producUon dtaln from renewabfe sources. •
Low Hlgh
.. -C"-11'1."-ION 40: Energy HYings ln the btod6esel produc:UOn chain 'trith compwtd to the prewklus ynr. •
Nul Low
Are the prlnclp+n and c.rttert. prnlousty menUoned suf'Tkient to nses.s the sustalnablllty or ~odJtstlln thltnvlronmentJI dlmtnston? ~
No nol-cntonono
"'"se lncUc.ate betow other pr1nc:lpl .. or ett..n. Whkh si'IOutd be laken lnto .ccount:
Importance of principles and criteria for assessing the sustainability of biodiesel
General commenta or r.comrnendatlons:
Dear Expert, thank you very much for your participation and contributions .
• e nsgsl
100%~ Vou mao. Il

220 Sustainability assessment of biodiesel production in Colombia
Appendix 5 Technological description of Propanediol production (PDO) 221
Appendix 5 Technological description of Propanediol production (PDO)
1,3-propanediol (PDO) is a chemical compound belonging to the group of diols. It is used as
substrate in many types of synthesis, especially addition polymerization. PDO is traditionally
produced by chemical pathway from ethylene oxide in the presence of phosphine, water, carbon
monoxide, hydrogen and an acid, or by the catalytic solution phase hydration of acrolein
followed by reduction (Adkesson, 2012).
The PDO market in 2014 was $310.5MM, and it will grow at a compound annual growth rate
of 10.4 percent up to $621MM by 2021 (Markets and Markets, 2015). America dominates the
market both in terms of production and consumption. DuPont Tate & Lyle Bio Products
Company, LLC is the largest manufacturer of 1,3-PDO and has its plant at Loudon, Tennessee
in the U.S., with a production capacity of 63,500.0 tons. In Europe, Middle East and Africa it
is expected to grow at the highest growth rate, behaviour that can be attributed to the increasing
adoption of bio-based materials in Europe (Markets and Markets, 2015).
As biodiesel industry is rapidly expanding, a glut of crude glycerol is being created, because
there is excess of supply and relatively low demand. The price of crude glycerol is very
depressed and it is expected to remain low, making it an ideal feedstock for the bio-based
chemicals (Ciriminna, 2014). Some studies (Chiu et al., 2006; Knothe, 2010) stated that the
production cost of biodiesel was found to vary inversely and linearly with variations in the
market value of glycerol (Zheng et al., 2010).
Classical applications of glycerol include personal care products (soaps, cosmetics, hair care,
and toothpaste), pharmaceuticals, sweetener in candies and cakes. Additional applications must
be explored. These applications imply the production of glycerol esters, glycerol ethers, acetals
and ketals, epoxides, aldehydes, ketones, oxidation and dehydration products, as well as 1,2-
and 1,3-propanediol (PDO) (Knothe 2010) using glycerol as raw material.
Regarding 1,3-Propanediol, it is copolymerized with terephthalic acid to produce the polyester
known as SORONA from DuPont or CORTERRA from Shell. It used in the manufacture of
carpets and textile fibers exhibiting unique properties in terms of chemical resistance, light
stability, elastic recovery and dyeability (Zimmerman, 1974). Approximately 90%of the total
production of 1,3-Propanediol is employed in the production of polytrimethylene teraphthalate
(PTT), a polyester traditionally used in textiles. PTT applications have been expanded in recent
years to other industries, including consumer products, electronics, and automotive (Molel et
222 Sustainability assessment of biodiesel production in Colombia
al., 2015). Other polymers produced from PDO include polytrimethylene naphthalate (PTN),
polytrimethylene isophthalate (PTI), and thermoplastic polyester elastomer (Molel et al., 2015).
Currently, 1,3-propanediol is produced from petroleum derivatives such as ethylene oxide
(Shell route) or acrolein (Degussa-DuPont route) using chemical catalysts (Lam et al., 1997;
Arntz et al., 1991). However, it can be produced by alternative routes involving selective
dehydroxylation of glycerol through chemical hydrogenolysis or biocatalytic reduction (Zheng,
Chen, and Shen 2010).
Chemical catalysts routes
In the presence of metallic catalysts and hydrogen, glycerol can be hydrogenated to 1,2-
propanediol, 1,3-propanediol, or ethylene glycol.
Celanese patented the hydrogenolysis of glycerol water solution under 300 bar of syngas
at 200 °C in the presence of a homogeneous rhodium complex [Rh(CO)2(acac)] and
tungstenic acid. 1,3-Propanediol and 1,2-propanediol were produced with 20% and 23%
yield, respectively (Che, 1987).
Shell developed the use of homogeneous palladium complex in a water-sulfolane
mixture in the presence of methane sulfuric acid. After 10 h of reaction, 1-propanol, 1,2-
propanediol, and 1,3-propanediol were detected in a 47:22:31 ratio (Drent and Jager,
1999: Drent and Jager, 2000).
Schlaf et al., (2001) described the dehydroxylation of glycerol in sulfolane catalyzed by
a homogeneous complex of ruthenium. The reaction proceeded under milder conditions
(52 bar, 110 °C), but very low yields of 1,2-propanediol and 1,3-propanediol were
achieved (<5%).
Hydrogenolysis on solid catalysts was also attempted. The treatment of glycerol under
hydrogen atmosphere in the presence of copper-chromium-based catalysts yielded only
1,2-propanediol (Fleckenstein et al., 1994).
Montassier et al. (1989), reported that hydrogenolysis of glycerol under 300 bar of H2
at 260 °C in the presence of Raney nickel, Ru, Rh, and Ir catalysts yielded mainly
methane, but in the presence of Raney copper, 1,2- propanediol was the main reaction
product.

Appendix 5 Technological description of Propanediol production (PDO) 223
Werpy et al. (2002), patented the hydrogenolysis of glycerol and other polyols over
Ni/Re catalyst. After 4 h at 230 °C under 82 bar of H2, 44% of 1,2-propanediol and 5%
of 1,3-propanediol were obtained together with 13% of ethylene glycol.
Glycerol hydrogenolysis on heterogeneous catalysts under 80 bar of H2 at 180 °C was
investigated by Chaminand et al., (2004). Various metals (Cu, Pd, and Rh), supports
(ZnO, C, and Al2O3), solvents (H2O, sulfolane, and dioxane), and additives (H2WO4)
were tested to improve the reaction rate and selectivity. The best selectivity (100%) for
1,2-propanediol was obtained by hydrogenolysis of a water solution of glycerol in the
presence of CuO/ZnO catalysts.
Concerning glycerol hydrogenolysis using Ru/C and an ion- exchange resin
(Amberlyst) under mild reaction conditions (120 °C, 80 bar) (Furikado et al., 2007).
Hydrogenolysis of glycerol with various SiO2 supported noble metal catalysts has been
studied (Furikado et al., 2007). Rh/SiO2 is effective in the reaction of glycerol under H2
atmosphere. It was found that Rh/SiO2 exhibited higher activity and selectivity to
hydrogenolysis products in the reaction of glycerol than the conventional catalyst Ru/C.
In particular, under higher H2 pressure and higher concentration of glycerol, Rh/SiO2
was much more effective than Ru/C. The consecutive hydrogenolysis of propanediols
to propanols in the glycerol reaction can proceed mainly via 1,3-propanediol on Ru/C,
while the consecutive reactions can proceed mainly via 1,2-propanediol on Rh/SiO2.
Selective Dehydroxylation
Wang et al. (2003), reported a new approach to the production of 1,3-propanediol from glycerol
via selective dehydroxylation. The concrete process is to selectively transform the middle
hydroxyl group of glycerol into a tosyloxyl group and then remove the transformed group by
catalytic hydrogenolysis. The reaction consists of three steps: acetalization, tosylation, and
detosyloxylation. The aim is to selectively transform the second hydroxyl group of glycerol
into a tosyloxyl group (tosylation) and then remove the tosyloxyl group by catalytic
hydrogenolysis (detosyloxy- lation). As compared to the hydroxyl group, the tosyloxyl group
is a better leaving group and is easier to replace with a hydride ion.
The first step in the conversion of glycerol to 1,3- propanediol is to acetalize the glycerol with
benzaldehyde. The purpose is to protect the first and third hydroxyl groups of glycerol, so that
only the middle one can be tosylated in the second step and subsequently removed in the third
step. The condensation between glycerol and benzaldehyde is an equilibrium reaction, but it

224 Sustainability assessment of biodiesel production in Colombia
can be driven to completion by removing the water formed in the reaction. The second step of
the conversion is tosylation of the unprotected hydroxyl group of the acetalized glycerol, so as
to transform it into a good leaving group. This step is a fairly straightforward process. The final
step of the conversion is a detosyloxylation reaction preceded or followed by a hydrolysis
reaction. The detosyloxylation reaction removes the tosylated middle hydroxyl group, while the
hydrolysis reaction removes the protection on the first and third hydroxyl groups. According to
the proposed conversion approach, this reaction is to be done with molecular hydrogen in the
presence of a transition metal catalyst.
Biocatalysts
Microbial production of 1,3-propanediol has been widely researched and considered as a
competitor to the traditional petrochemical routes (Zheng et al., 2010). It is an example of a
socially beneficial method for obtaining bulk chemicals from renewable resources (Zheng et
al., 2010). Only a small number of microorganisms in nature are able to produce 1,3-
propanediol via glycerol fermentation, including Klebsiella pneumoniae (Petitdemange et al.,
1995; Mu et al., 2006; Cheng et al., 2006), Enterobacter agglomerans, Citrobacter freundii,
Clostridium acetobutylicum, Clostridium butyricum (Petitdemange et al., 1995; Zeng, 2006),
Clostridium pasteurianum, Lactobacillus breVis, and Lactobacillus buchneri (Talarico et al.,
1990; Veiga-da-Cunha et al., 1992). Among them, more attention has been directed at K.
pneumoniae, C. freundii, and C. butyricum because of their appreciable substrate tolerance,
yield, and productivity.
Biosynthesis of 1,3-propanediol under anaerobic conditions takes place via the following
biochemical reactions:
Some of the glycerol is oxidized to dihydroxyacetone by an NAD-dependent glycerol
dehydrogenase, while the remainder is dehydrated to 3-hydroxypropionaldhyde by a
vitamin B12-dependent dehydratase. The product of the dehydration reaction, 3-
hydroxypropionaldehyde, is reduced to 1,3-propanediol by an NAD-dependent
oxidoreductase. In this case, the final acceptor of the electrons is the 3-
hydroxypropionaldehyde. However, several studies found that 3-
hydroxypropionaldehyde would inhibit 1,3- propanediol synthesis (Schuetz et al., 1984;
Barbirato et al., 1998)

Appendix 5 Technological description of Propanediol production (PDO) 225
On the other hand, recovering and purification of 1,3-propanediol from the fermentation broth
is a complex task because of both its high hydrophilic character and its high boiling point
(Posada et al., 2013).
Discussion
Chemical synthesis of PDO has numerous disadvantages, including many byproducts, poor
selectivity, high temperature and pressures required for operation, expensive catalysts, and
cause the release of environmentally toxic intermediate compounds (Da Silva et al., 2009;Liu,
2013). The biocatalyst is a promissory process that uses a renewable source, glycerol, as
feedstock, prevent toxic byproducts. This process is used in industrial application, for example,
the joint venture between DuPont and Tate & Lyle commercialized the large-scale industrial
fermentation to produce bio-based PDO. Therefore, biocatalyst process is considering to be
applied in the valorisation of glycerol, due the glycerol production linked to Colombian
biodiesel production.
References
Adkesson. Purification of Biologically Produced 1,3-Propanediol. E.I. Du Pont De Nemours
and Company, Tate & Lyle Ingredients Americas LLC, assignee. Patent US 8,183,417 B2. 22
May 2012. Print.
Arntz, D.; Haas, T.; Muller, A.; Wiegand, N. Chem. Ing. Technol. 1991, 63, 733.
Barbirato, F.; Soucaille, P.; Camarasa, C.; Bories, A. Biotechnol. Bioeng. 1998, 58, 303.
Chaminand, J.; Djakovitch, L. A.; Gallezot, P.; Marion, P.; Pinel, C.; Rosier, C. Green Chem.
2004, 6, 359.
Che, T. M. Catalytic conversion of glycerol and synthesis gas to propanediols. U.S. Patent
4,642,394, 1987.
Cheng, K. K.; Zhang, J. A.; Liu, D. H.; Sun, Y.; Yang, M. D.; Xu, J. M. Biotechnol. Lett. 2006,
28, 1817.
Chiu, C. W.; Dasari, M. A.; Sutterlin, W. R.; Suppes, G. J. Ind. Eng. Chem. Res. 2006, 45, 791.
Ciriminna, Rosaria. "Understanding the glycerol market." European Journal of Lipid Science
and Technology 116.10 (2014): 1432-1439.
226 Sustainability assessment of biodiesel production in Colombia
Da Silva, G.P.; M. Mack, J. Contiero Glycerol: A promising and abundant carbon source for
industrial microbiology Biotechnol Adv, 27 (2009), pp. 30–39
http://dx.doi.org/10.1016/j.biotechadv.2008.07.006
Daniel, R.; Gottschalk, G. FEMS Microbiol. Lett. 1992, 100, 281.
Drent, E.; Jager, W. W. Process and catalysts for the hydrogenolysis of glycerol into 1,3-
propanediol and acrolein. U.S. Patent 6,080,898, 2000.
Drent, E.; Jager, W. W. Process and catalysts for the hydrogenolysis of glycerol into 1,3-
propanediol and acrolein. World Organization Patent 9905085, 1999.
Fleckenstein, T.; Ghosh, P.; Fagan, P. J.; Hauptman, E.; Bullock, R. M. Preparation of 1,2-
propanediol by glycerin hydrogenolysis. Denmark Patent 4,302,464, 1994.
Furikado, I.; Miyazawa, T.; Koso, S.; Shimao, A.; Kunimori, K.; Tomishige, K. Green Chem.
2007, 9, 582
Lam, K. T.; Powell, J. P.; Wieder, P. R. Preparing 1,3-propanediol. World Organization Patent
9716250, 1997.
Liu, Dehua. "Via fermentation; 1, 3-propanediol is important chemical raw material for things
such as polytrimethylene terephthalate." U.S. Patent No. 8,486,673. 16 Jul. 2013.
Markets and Markets. 1,3-Propanediol Market worth $621.2 Million by 2021. Markets and
Markets. Markets and Markets, n.d. Web. 05 Apr. 2015.
<http://www.marketsandmarkets.com/PressReleases/1-3-propanediol-pdo.asp>.
Montassier, C.; Giraud, D.; Barbier, J.; Boitiaux, J. P. Bull. Soc. Chim. Fr. 1989, 148.
Molel, Evans; Phillips, Hannah; Smith, Alexander. 1,3-Propanediol from Crude Glycerol.
University of Pennsylvania. Scholarly Commons. Senior Design Reports (CBE). 2015.
http://repository.upenn.edu/cgi/viewcontent.cgi?article=1070&context=cbe_sdr
Mu, Y.; Teng, H.; Zhang, D. J.; Wang, W.; Xiu, Z. L. Biotechnol. Lett. 2006, 28, 1755.
Posada, Ja, Ca Cardona, Jc Higuita, Ja Tamayo, and Yu a Pisarenko. 2013. “Design and
Economic Analysis of the Technological Scheme for 1, 3-Propanediol Production from Raw
Glycerol.” Chemical Engineering 47 (3): 239–253. Doi: 10.1134/S0040579513030093.

Appendix 5 Technological description of Propanediol production (PDO) 227
Petitdemange, E.; Durr, C.; Andaloussi, S. A.; Raval, G. J. Ind. Microbiol. 1995, 15, 498.
Saxena, R.K., Anand, P., Saran, S., and Isar, J., Microbial production of 1,3-propanediol: recent
developments and emerging opportunities, Biotechnol. Adv., 2009, vol. 27, p. 895.
Schlaf, M.; Ghosh, P.; Fagan, P. J.; Hauptman, E.; Bullock, R. M. Angew. Chem., Int. Ed. 2001,
40, 3887.
Schuetz, H.; Radler, F. Syst. Appl. Microbiol. 1984, 5, 169.
Talarico, T. L.; Axelsson, L. T.; Novotny, J.; Fiuzat, M.; Dobrogosz, W. J. Appl. EnViron.
Microbiol. 1990, 56, 943.
Tong, I. T.; Liao, H. H.; Cameron, D. C. Appl. EnViron. Microbiol. 1991, 57, 3541
Veiga-da-Cunha, M.; Foster, M. A. Appl. EnViron. Microbiol. 1992, 58, 2005.
Wang, K.; Hawley, M. C.; DeAthos, S. J. Ind. Eng. Chem. Res. 2003, 42, 2913
Werpy, T.; Frye, J.; Zacher, A.; Miller, D. Hydrogenolysis of 6-carbon sugars and other organic
compounds using multimetallic catalysts. World Organizaion Patent 03,035,582, 2002.
Zeng, A. P. Bioprocess Eng. 1996, 14, 169.
Zimmerman, D.; Isaacson, R. B. Polyalkylene terephthalate molding resin. U.S. Patent
3,814,725, 1974.
Zheng, Yuguo, Xiaolong Chen, and Yinchu Shen. 2010. “Commodity Chemicals Derived from
Glycerol, an Important Biorefinery Feedstock.” Chemical Reviews 110 (3): 1807.
doi:10.1021/cr100058u

228 Sustainability assessment of biodiesel production in Colombia
ÉVALUATION DE LA DURABILITÉ DE LA PRODUCTION DU BIODIESEL EN
COLOMBIE
Résumé
Évaluation de la durabilité de la production de biodiesel est un sujet d'importance croissante en
raison de l'intérêt des gouvernements à effectuer des stratégies de souveraineté, diversifier leur
matrice énergétique et mis en place l'impact de la production de biocarburants. Dans ce
contexte, ce travail propose un modèle dynamique du système pour évaluer la production de
biodiesel dans un contexte spécifique, basé sur une structure hiérarchique générale d'évaluation
de la durabilité qui intègre les dimensions du développement durable avec les principes, critères
et indicateurs (PC & I). Le cadre de l'évaluation de la production de biodiesel a été défini
d'après une ample état de la technique, ce qui entraîne une sélection et analyse de 113
documents, y compris les lois, directives et autres documents normatifs, les documents de
politique, les certificats et documents publiés dans des revues. Pour définir le cadre final, une
stratégie de validation basée sur les consultations d'experts enquête et une analyse statistique
descriptive a été réalisée. Ainsi, un cadre composé de cinq dimensions (sociales, économiques,
environnementale, politiques et technologiques), 13 principes et 31 critères a été proposé.
Par la suite, un modèle de dynamique de système (DS) a été développé et appliqué pour évaluer
la durabilité de la production du biodiesel en Colombie. Au départ, le modèle DS a été utilisé
pour simuler la production du biodiesel, compte tenu des conditions actuelles en Colombie, ce
qui permet de déterminer le niveau de référence (années 2008-2014). Par la suite, certains
indicateurs exogènes du scénario de référence ont été modifiés afin de générer une analyse de
sensibilité pour définir plusieurs conditions fondamentales vers la production de biodiesel
durable dans le contexte colombien. Une fois l'analyse de sensibilité a été réalisée, on a
déterminé les conditions qui favorisent ou découragent la production de biodiesel et, par
conséquent, des scénarios optimistes et pessimistes ont été proposées. Les résultats de l'analyse
des scénarios peuvent aider les institutions, les décideurs et les autres parte prenants associés à
établir les conditions à réaliser pour promouvoir une production durable du biodiesel.
Mots clés: Évaluation de la durabilité, Production du biodiesel, dynamique des systèmes

Appendix 5 Technological description of Propanediol production (PDO) 229
SUSTAINABILITY ASSESMENT OF BIODIESEL PRODUCTION IN COLOMBIA
ABSTRACT
Sustainability assessment of biodiesel production is a topic of increasing importance due to the
interest of governments to stablish sovereignty strategies, diversify their energy matrix and set
up the impact of biofuels production. In this context, this work proposes a system dynamic
model to assess biodiesel production in a specific context, based on a general hierarchical
structure of sustainability assessment that integrates dimensions of sustainable development
with principles, criteria and indicators (PC&I). The assessment framework of biodiesel
production was defined based on a comprehensive state of the art, resulting in a selection and
analysis of 113 documents, including laws, directives and other normative documents, policy
documents, certificates and papers published in peer-reviewed journals. To define the final
framework, a validation strategy based on expert survey consultations and a descriptive
statistical analysis was conducted. As a result, a framework composed of five dimensions
(social, economic, environmental, political and technological), 13 principles and 31 criteria was
proposed.
Subsequently, a System Dynamics (SD) model was developed and applied for assess the
sustainability biodiesel production in Colombia. Initially, the SD model was used to simulate
the biodiesel production considering the current conditions in Colombia, enabling to determine
the baseline (years 2008 to 2014). Subsequently, some exogenous indicators of the baseline
scenario were modified in order to generate a sensibility analysis to define several fundamental
conditions for the sustainable biodiesel production in the Colombian context. Once the
sensibility analysis was conducted, the conditions that promote or discourage biodiesel
production were determined and, consequently, optimistic and pessimistic scenarios were
proposed. The results of the analysis of the scenarios can help institutions, decision-makers and
other agents related to establish the conditions to be carried out to promote a sustainable
biodiesel production.
Keywords: Sustainability assessment, biodiesel production, system dynamics