Embed Size (px)
Citation preview

E L S E V I E R Applied Clay Science 11 (1996) 211-227
Swelling-shrinkage behavior of natural expansive clays
Adnan A. Basma a,*,l, Azm S. A1-Homoud b,2, Abdallah I. Husein Malkawi 8,3, Mohamed A. A1-Bashabsheh b,4
a College of Engineering Sultan Qaboos University, P.O. Box 33, Muscat 123, Oman b Jordan University of Science and Technology, Irbid 22110, Jordan
Received 23 August 1994; accepted 18 March 1996
Abstract
The swell-shrinkage behavior of expansive clays was investigated in four soils of different plasticity cyclic swelling. To simulate drying temperatures typical of site conditions, two shrinkage schemes were adopted, partial and full shrinkage. After each cycle, the expansive characteristics of the soils were assessed. Furthermore, the physical and microstructural changes due to cyclic swelling were also studied, respectively, through an ultra-sonic investigation and scanning electron microscope observations. The results showed that cyclic swelling and shrinkage has a marked influence on the expansive behavior of clays. Generally speaking, a decrease in the swelling ability of the clays, corresponding to a reduced water absorption capability, was observed when the soils were alternately wetted and partially shrunk. On the other hand, an increase in the swelling potential was noted when the soils were fully shrunk. In either case, equilibrium can be attained after several cycles. As the number of cycles increase, further destruction of large aggregates and disorientation of structural elements takes place. Approximately after the fifth cycle, the fabric becomes almost disoriented, consequently further changes in expansibility disappear. The scanning electron microscope analysis showed that for partial shrinkage the structural elements exist mainly as edge to face contacts with a tendency to form a turbulent flocculated system while a horizontal clay particle orientation was observed when the specimens were cyclicly wetted the fully shrunk. In parallel, the ultrasonic wave transmission velocity
* Corresponding author. Tel.: + 968-515334. Fax: + 968-513416. E-mail: [email protected] J Associate Professor of civil engineering. 2 Assistant Professor of civil engineering. 3 Assistant Professor of civil engineering. 4 Research assistant.
0169-1317/96/$15.00 Copyright © 1996 Elsevier Science B.V. All rights reserved. PII SO 169- 13 1 7(96)00009-9

212 A.A. Basma et al, /Applied Clay Science 11 (1996) 211-227
increased with the number of cycles in the first case, and decreased when transmitted through a fully shrunk soil sample.
1. Introduction
Expansive clays swell and shrink regularly when subjected to annual moisture changes. The terminology expansive soils not only implies the ability to increase in volume or swell when allowed free access of water, but also to decrease in volume or shrink when water is withdrawn. These clayey soils are available worldwide and are a continual source of concern causing substantial distresses to buildings. The basic reason expansive clays induce significant damages is because of their swell-shrink behavior. In regions of the world where there is a large seasonal variation in moisture and rainfall, such as arid and semi-arid areas, small building and highways constructed on expansive soils are subjected to periodic swelling and shrinkage cycles. This inevitable results is undesirable cracking and fatigue to structures. Consequently, the cyclic swelling/shrin- kage phenomenon involves clays that swell upon wetting, then dried to shrink (partially or fully), then wetted again to swell, dried once more and so on.
Many investigators have addressed the problem of cyclic swelling and shrinkage of clays. Some researchers (Chen, 1965; Chen et al., 1985; Chen and Ma, 1987; Subba Rao and Satyadas, 1987 and Dif and Bluemel, 1991), on one hand, inferred that when clays are repeatedly subjected to full swell then desiccate to their initial water content displayed sign of fatigue after each cycle thus exhibiting less expansion. On the other hand, Popesco (1980); Osipov et al. (1987); Day (1994) showed that the swelling potential increases with the number of wetting and drying cycles when the samples are allowed to fully shrink to a water content equal to or less than the shrinkage limit. All previously indicated studies, however, noted that expansion reaches an equilibrium state after about 3 to 5 cycles. In a related topic, Basma et al. (1994) indicated that the method of drying has a marked influence on the expansion characteristics of clays.
The objective of this research was to study the swell-shrink behavior of natural clays subjected to alternating wetting and drying. To simulate drying temperatures which are more representative of site conditions, two basic shrinkage schemes were adopted, partial and full shrinkage. After each cycle, the swell potential and swell pressure were assessed. Furthermore, the physical and microstructural changes due to cyclic swelling were also studied, respectively, through an ultra sound investigation and a scanning electron microscope analysis.
2. Description of test soils
To cover the widest possible range of clay plasticity, four expansive soils were selected. The specimens were first air-dried and then pulverized by a plastic hammer. Portion of the soils passing sieves No. 40 (0.42 mm) and No. 10 (2.00 mm) were placed in plastic bags and stored for later use. Laboratory test procedures, following ASTM standards, were performed in order to evaluate the physical properties of the selected soils. Additionally, the clay mineralogy was also assessed. A list of these properties along with the degree of expansion and soil classification are given in Table 1. From this
A.A. Basma et al./Applied Clay Science 11 (1996) 211-227 213
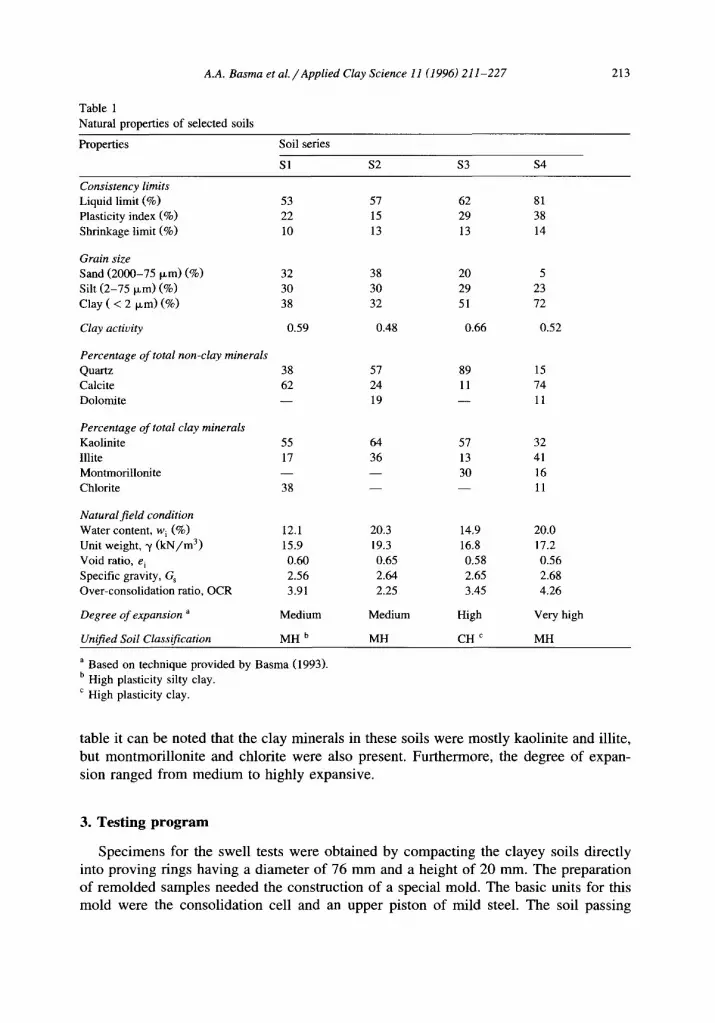
Table I Natural properties of selected soils
Properties Soil series
S 1 $2 $3 $4
Consistency limits Liquid limit (%) 53 57 62 81 Plasticity index (%) 22 15 29 38 Shrinkage limit (%) 10 13 13 14
Grain size Sand (2000-75 Ixm) (%) 32 38 20 5 Silt (2-75 p~m) (%) 30 30 29 23 Clay ( < 2 p.m) (%) 38 32 51 72
Clay activity 0.59 0.48 0,66 0.52
Percentage of total non-clay minerals Quartz 38 57 89 15 Calcite 62 24 11 74 Dolomite - - 19 - - 11
Percentage of total clay minerals Kaolinite 55 64 57 32 Illite 17 36 13 41 Montmorillonite - - - - 30 16 Chlorite 38 - - - - 11
Natural field condition Water content, w i (%) 12.1 20.3 14.9 20.0 Unit weight, 31 (kN/m 3) 15.9 19.3 16.8 17.2 Void ratio, e i 0.60 0.65 0.58 0.56 Specific gravity, G s 2.56 2.64 2.65 2.68 Over-consolidation ratio, OCR 3.91 2.25 3.45 4.26
Degree of expansion a Medium Medium High Very high
Unified Soil Classification MH b MH CH c MH
a Based on technique provided by Basma (1993). b High plasticity silty clay. c High plasticity clay.
table it can be no ted that the clay minera l s in these soils were mos t ly kaol ini te and illite,
but mon tmor i l l on i t e and chlor i te were also present . Fur thermore , the degree o f expan-
s ion ranged f r o m m e d i u m to h ighly expans ive .
3. Testing program
S p e c i m e n s for the swel l tests were ob ta ined by c o m p a c t i n g the c layey soils di rect ly
into p rov ing r ings hav ing a d iamete r o f 76 m m and a he igh t o f 20 mm. The prepara t ion
o f r e m o l d e d samples needed the cons t ruc t ion o f a specia l mold . The basic units for this
m o l d were the conso l ida t ion cell and an upper p is ton o f mi ld steel. The soil pass ing
214 A.A. Basma et al./Applied Clay Science 11 (1996) 211-227
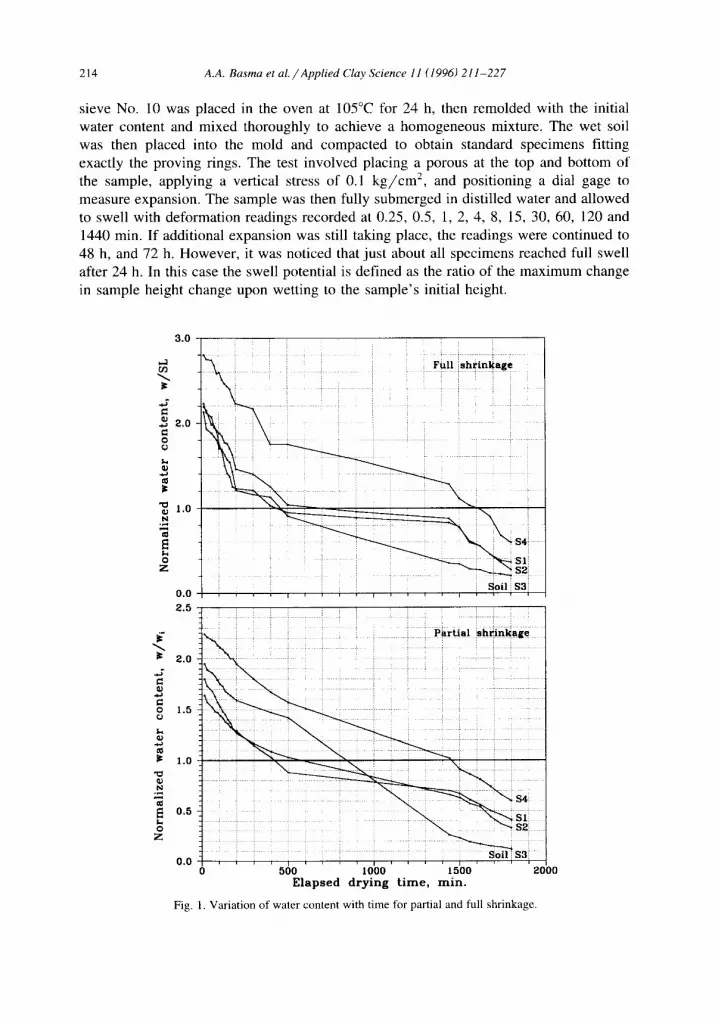
sieve No. 10 was placed in the oven at 105°C for 24 h, then remolded with the initial water content and mixed thoroughly to achieve a homogeneous mixture. The wet soil was then placed into the mold and compacted to obtain standard specimens fitting exactly the proving rings. The test involved placing a porous at the top and bottom of the sample, applying a vertical stress of 0.1 k g / c m 2, and positioning a dial gage to measure expansion. The sample was then fully submerged in distilled water and allowed to swell with deformation readings recorded at 0.25, 0.5, 1, 2, 4, 8, 15, 30, 60, 120 and 1440 min. If additional expansion was still taking place, the readings were continued to 48 h, and 72 h. However, it was noticed that just about all specimens reached full swell after 24 h. In this case the swell potential is defined as the ratio of the maximum change in sample height change upon wetting to the sample's initial height.
3.0
~'~ Full s h r i n k a g e
~ J
2.0
.N ~ k . s4 S I
Z " ~ " ~ S2
Soil $3 0 . 0 . . . . ~ . . ,
2.5
~- Partial sh r inkage
i¢ 2.0
o
1.0
~ 0.5
Z
0 . 0 , . i , . . 500 1000 1500 2000
E l a p s e d d r y i n g t i m e , r a i n .
Fig. 1. Variation of water content with time for partial and full shrinkage.

A.A. Basma et al. /Appl ied Clay Science 11 (1996) 211-227 215
In addition to swell potential, the swelling pressure for the selected soils was est imated by using zero swell test. In this test, the vertical deformation was prevented and the samples were kept at their initial void ratio by continuously adding loads at every vertical expansion of the samples placed on the consolidation frame. The loads were applied by using sand added to a plastic bag hanged off the loading arm. The loads were continually added until no deformation was observed. At this stage the swell pressure was calculated as the load required to retain zero swell divided by the specimen area.
After complet ion of the swell potential and swell pressure tests, the water from around the samples was removed and the consolidation mold dismantled. With the sample still within the proving ring, it was allowed to dry and shrink. For the purposes of this study, two drying schemes were adopted. In the first scheme, the samples were al lowed air dry to their initial water content thus shrinking to their initial height. This method is termed 'part ial shrinkage' and it was performed indoors at room temperature. The second scheme, on the other hand, entails drying the samples outdoors in the sunshine allowing them to shrink fully to or below their shrinkage limit. This scheme is denoted by 'full shrinkage' .
To evaluate the approximate time for the samples to revert to their initial water content (for partial shrinkage) or shrinkage limit (for full shrinkage), the specimens were weighed at regular intervals for about 1.5 days and the water contents were calculated. The results of this process are plotted in Fig. 1 in a form of water content versus time for the four soils. Temperature and humidity readings were also taken after every reading during this process. The temperature and humidity were within +2°C and + 2 % , respectively for indoor drying and about +4°C and + 5 % , respectively for outdoors drying. Since these variations are small, a single plot for each soil was assumed to suffice. Table 2 lists the average values of temperature and humidity which were measured during drying of each soil. Furthermore, this table lists the drying time required to attain partial and full shrinkage. As an additional precaution and in order to insure that the samples reverted to the desired water contents after the time indicated in the Table 2, the samples were weighed before commencing the testing procedure. After reverting to the designated shrinkage condition, samples were wetted again and allowed to fully swell then dried once more and so on. This procedure was repeated until both
Table 2 Summary information for the drying schemes
Soil Partial shrinkage Full shrinkage
Time required Average Average Time required Average Average to revert to temperature humidity to revert to temperature humidity w i (min) + 2 (°C) + 2 (%) SL or less (min) + 4 (°C) + 5 (%)
S 1 425 37 22 430 36 20 $2 575 33 22 700 30 2 l $3 690 24 21 460 28 26 $4 1440 21 18 1600 19 22

216 A.A. Basma et al. /Appl ied Clay Science 11 (1996) 211-227
the swell percent and swell pressure showed no significant difference between subse- quent cycles. It should noted here that specimens subjected to full shrinkage were al lowed to dry for at least 1.5 days. As the samples began to dry, they were observed to shrinkage in both the vertical and horizontal directions thus drying to a water content equal to or less than the shrinkage limit. Consequently, it was rather difficult to subject these specimens to one directional shrinkage. Any amount of shrinkage is unavoidable volumetric and thus indeterminantly three dimensional. However, it customary in this case to assume that the observed volumetric change in terms of A H incorporates both uni-axial and tri-axial deformations.
g.0 F, ull sl~rink~ge " ! : I: II : :
X Wa/er content ' 2B 8
~ ..... i - i '~7~0i i ii I iiii -! - - - -2e;3- i i i ' - i i
iii "~ 4.0 ill iii iiii 3.0 - ~ - o
2 0
-~ l.o
'~ 0.0
- z . o ? - ! ~ ,. ~ :
: 4 .2 : i 5 , 5 ~, :
-3.O 0 50 I00 150 200 250 300 350 400 450 500 550
T i m e ( h o u r s )
5.0
~ 4.0 ~ i Partial shrinkage
o~ 3 .0 r -~ ~ '~.~ ~ . i : ~ 5 i •
111.8 ! 11 ,4 11 .8 : 12.1 12.0 11 .8
-1.0 0 50 100 150 200 250 300 350
Time (hours)
Fig. 2. Axial deformation versus time for soil S I.

A.A. Basma et al. /Appl ied Clay Science 11 (1996) 211-227 2 1 7
4. Test results
4.1. Swelling potential results
Cycles of 2 days of wetting followed by drying periods required to revert the samples to the desired water contents (as indicated in Table 2) were repeated for the four soils. Plots of the vertical swell and shrinkage (measured by the axial deformations) as a function of time for the four soils and for the two shrinkage schemes are shown in Figs.
3 5 . 0
3 0 . 0 -! . . . . . ~ : . . . . . i . . . . 3 z ~ ! 37.51 _ ~ . 5 ,_ _3~,_5___i_~a
e~ 2 0 . 0
° i ~ 15 ,0
o ~ 10 .0
• "~ s . o
' ~ 0 .0
: 7.,I.', : ; I - 1 0 . 0 ' '
50 100 150 2 0 0 2 5 0 3 0 0 3 5 0 4 0 0 4 5 0 5 0 0 5 5 0 6 0 0 6 5 0 7 0 0 Time (ilour~)
2 3 . 0 ~ z . . . . . . . X Water content i i i ; i
21.019.0 I - ~ - - - i --:i . . . . . . i i -- i . . . . i ! P a r t ~ a i - s h r i n k a g e
o = i s . 0 . . . . ~ - i ~ . . . . . . ! - - - i ~ -i . . . . . i-
~ 9 . 0
"~ 7 .0
.~ 5 .0 N < 3.O
1.0
- 1 . 0 : 18;34 19.2 : 19.6 • -19;0 1t0.4- + 18.7 19.5 1 19.6
- 3 . 0 ' 0 50 100 150 2 0 0 2 5 0 3 0 0 3 5 0 4 0 0 4 5 0 5 0 0 5 5 0 6 0 0
Time (hours)
Fig . 3. A x i a l d e f o r m a t i o n v e r s u s t ime fo r soil $2 .

218 A.A. Basma et al. /Appl ied Clay Seience 11 (1996) 211-227
2 5 . 0 ~ . . . . . . . . . 1
l Fu,, , , ,r , , ,~, , ,~ ! i i i ! ! { 3 i i i a3"7 ~4.1 : ~4.0 3~.0 !
~1io :3,.o - i 15 .o i
,o.0 i - ! i
5.0 ~: i
~ / I / I :. /I u 11.,~ 1~,., i '.'.t' / I ~U : ,~.4 11,1 .v i 1
-I0.0 . . . . . . 0 50 100 150 200 250 300 350 400 450 500 550 600
Time ( h o u r s )
17.0 31!IX Wat/er cont~-nt : "
~ 1 3 . 0
i i i i l t . o ! 1 ~7.~ o i ~ 7 . 1 i ; i
9 . 0
~, 7.0 o
5.0
"~ 3 .0 x
1.0
- - l . O 14.7 1 4 , 2 l~.O 13.7 1 14.1 : 13~5 1 ~ 8
--3.0 0 50 100 150 200 250 300 350 400 450 500
T i m e ( h o u r s )
Fig. 4. Axia l de fo rma t ion versus t ime for soil $3 .
2-5 . The results of the maximum swell potential after each cycle are further summarized and presented in Fig. 6 and Fig. 7 for partial and full shrinkage, respectively. As can be noted, specific irregularities were observed. Nonetheless, some essential conclusion for all four soils can be drawn:
4.1.1. Partial shrinkage 1. The swelling potential decreases with increasing number of cycles. 2. Most reduction in swelling occurred after the first cycle. 3. The soils' ability to absorb water upon wetting is reduced with the number of cycles.

A.A. Basma et al. /Applied Clay Science 11 (1996) 211-227 219
4.1.2. Full shrinkage 1. As the number of cycles increase, there is a gradual increase of swelling potential as
indicated by the shifting of the curves upwards. 2. The amount of shrinkage for the first cycle was the largest and steadily decreased in
later cycles. 3. The water absorption capability of the soils increased with the number of cycles. 4. The water content beyond which no significant shrinkage takes place increases with
the number of cycles. This observation implies that there is an increase in the apparent shrinkage limit of the soils.
10.0
8.0 ---~-..~r coati .... 4 -r-~ LM! ; i i ..... 7.0 ---! i_~9:2~ .... _2"'5 i I i I Li____L I__!_l l____'l Ii ....
6.0
5.0 o
4.0
a.o
2 . 0
'~ l.O
~ o.o ~ -1 ,0
- 2 . 0 i _ . . • , s . 9
-3.0 -- ', I' 9 . 9 :- --I- ~ : I
l 6 . 8 --5.0 . . . . .
50 I00 150 200 250 300 350 400 450 500 550 600 650 700
T i m e ( h o u r s )
7.0
28~4 • Wat~er c o n t e n t 6.0 ~ ~ ~ ....... r- - - [ r Part ial , h r i n k a g e
5.o [ [ - - - :~ . , ! ! ~ - -~ - i - ! ! ~ 2 7 . 3 : : : : : :
: 2 7 I : 2 7 1 : i : 4.0
3.0
'~ 2.0
~ 1.0
0.0 , , : 2 0 . 0 ; 1 9 . 6 1 1 9 . 7 19.7; 1 9 . 8 2 0 . 2 2 0 . 4 2 9 . 9
- - l . O ' ' 0 50 100 150 200 250 300 350 400 450 500
T i m e ( h o u r s )
Fig. 5. Axial deformation versus time for soil $4.

220 A.A. Basma et al. / Applied Clay Science 11 (1996) 211-227
Generally speaking, however, the maximum swelling potential seems to level off after about 4 to 5 cycles for both shrinking schemes. Furthermore, the absolute percent reduction in swelling caused by partial shrinkage appears to be greater than the percent increase due to full shrinkage (see Fig. 6 and Fig. 7).
4.2. Swell pressure results
The results of the swelling pressure tests values are presented in Fig. 8 and Fig. 9. An examination of the plots in these figures clearly shows that the variation in swelling
0.0
~ - l O . O
o e~
- 2 0 . 0
~ -30.0
~ s2 ~ -4o.0
s l
i -50.0 $3
D.
$4
- 60 .0 , ~ , r q , ,
25.0
_ 20.0
0
= '15 .0
Io
~10.0 . . Soft $4
"" - ~. ~ .S3
5.O
" ~ c o o o S l
0.0 o i ~- ~ ,i ~ ~ + ~ 9
N u m b e r o f w e t t i n g a n d p a r t i a l s h r i n k a g e c y c l e s
Fig. 6. Maximum swell potential and percent reduction in swell potential with number of cycles for partial shrinkage.

A.A. Basma et aL / Applied Clay Science 11 (1996) 211-227 221
pressures corresponding to the number of cycles follow similar trends as those observed in the swelling potential. For partial shrinkage a decrease in swell pressure was observed as the number of cycles increase while an increase was noted for full shrinkage. In both shrinking schemes, the swelling pressure at the last cycle is notably different than that at the first cycle. It is important however to point out that, for partial shrinkage and for each of the soils studied, the decrease in swell pressure after the first cycle is significantly greater than that for subsequent cycles while the increase in full shrinkage seems to be gradual. This indicates that upon partial shrinkage and after the first cycle,
40.0 / = = Soil= $4
/ ~30.0 $3 -- SI
m
"'-' 20.0
E S2
~ 10.0 P
0.0 30.0
Soil $4
25.0
~. 20.0 f - = -:- - sa
=
15.0
g "~ 10 .0 ¢o
. . e - - - - - - e - ~ o o c c c S 2 . . -o c o : S l
5.0 e----"
0.0
N u m b e r of wet t ing and ful l s h r i n k a g e cyc les
Fig. 7. Maximum swell potential and percent increase in swell potential with number of cycles for full shrinkage.

222 A.A. Basma et a l . / Applied Clay Science I 1 (1996)211-227
the change in the clay structure is altered more than the subsequent cycles. Therefore, soils at the first cycle would need a lower pressure to remove the water between the lattice compared with the subsequent cycles. Yet for both shrinking schemes it is clear that the change in swell pressure differs from soil to soil. This may be attributed to the nature of the soil, it's initial composition and the clay minerals present.
Based on the results and argument just presented, it is evident that cyclic wetting and shrinking of clays have a marked influence of their expansion behavior. Comparatively, the findings presented herein for partial shrinkage are in agreement with the results
0.0
~.-2o.o
~ -40.0
~ -60.0
-80.0 ~ ~ ~ ~ ~ ~ j ~
4000
2000. ~
o o o $4
~ O O Soil $3
200 .
lO0- o ~ S2
50- Soil SI
0
Number of wetting and partial shrinkage cycles
Fig. 8. Swell pressure and percent reduction in swell pressure with number of cycles lor partial shrinkage.

A.A. Basma et al. /Applied Clay Science 11 (1996) 211-227 223
reported by Chen (1965); Dif and Bluemel (1991) where they allowed their soils to dry to their initial water content i.e. samples were partially shrunk to about their initial height. Furthermore, the experimental data obtained for the full shrinkage scheme are consistent with the works of Osipov et al. (1987); Day (1994) in which they observed an increase in swelling potential when the soils were permitted to fully shrink well below their initial height to a much lower water content close to the shrinkage limit. In either shrinking schemes, it is inevitable that cyclic swelling causes specific micro-structural
5 0 . 0 $1 - " $3
$2 ~ 4 0 . 0
• $4
~ 3 0 . 0 ..=
~10.0 ~L
0 . 0 , , , t ,
6 0 0 0
~ . . . . . . . . ~ - ~ = ~ :: $4
4 0 0 0
2000 - '~"" 'a"- '~S oiI ~3
E 300 eL
250 ~ v o $2
2 0 0 o o Soil Sl
150
100 o ~. ~ ~ ,~ ~ ~ + ~ 9
N u m b e r o f w e t t i n g a n d f u l l s h r i n k a g e c y c l e s
Fig. 9. Swell pressure and percent increase in swell pressure with number of cycles for full shrinkage.

224 A.A. Basma et al. / Applied Clay Science l l (1996) 211-227
and physical changes to the soil. These changes continue to occur as the number of cycles increase and gradually lull then eventually cease after a certain number of cycles thus causing no further variations in both the swelling potential and swell pressure. This cycle will be termed equilibrium cycle. Seemingly, the equilibrium cycle depends on the soil composition, clay minerals percent, and type of contacts between the particles. However, the obtained results indicate that for the tested soils and for both shrinking schemes considered, the equilibrium cycle is generally between 4 and 5.
1.10 - - Par t ia l Shrinkage
1.00 . . . . F u l ~
~ 0.90 Soil
E $3 ~ -"
"~ 0 .60 ~ "~ " " °
o.vo ¢= ==
o.so Sl~-~--~_ ~ . ~ ...--e---~
0 ,50 = i i i i i i i
1 .IO
Par t i a l Shrinkage . . . . Full Shrinkage
1 .OO
2 /
o 0 . 9 0 S o i l $ 4 _ - x " . n -
=~ 0.60
$2
Q Q Q 0 .70 _ - o - - - 6 - - - . e - - - - ~ = -
S I . . . . , - e ~ - - e o o o o
0 .60
o i ~ ~ ~; g 6 + 6 Number of wetting and shrinkage cycles
Fig. 10. Change of ultra sonic wave velocity and void ratio with number of cycles for partial and full shrinkage.

A.A. Basma et al. / Applied Clay Science 11 (1996) 211-227 225
5. Physical and microstructural changes in clay due to cyclic swelling
5.1. Ultra sound investigations
Changes in the physical state of the soils after each wetting-shrinking cycle were investigated by using a Portable Ultrasonic Non-destructive Digital Indicator Tester (Ptmlgrr). This instrument utilized ultrasonic pulses travelling in materials (soil sample in this case). Four transducer locations on the specimen were selected, three on the outside and one in the middle. The average transit time, for the four positions, was used to calculate the average pulse velocity.
To effectively utilize the ultrasonic equipment with the specimens, a thin layer of grease was used to cover the two surfaces of the sample to create a smooth area. After calibrating the machine, the sample was placed between two dipoles and an approximate stabilized reading was recorded from different points on the surface and after each cycle. Additionally, the average specimen height was recorded. For each test, the average velocity of sound waves passing through the specimens were calculated along with void ratio for all cycles and for the four tested soils. These results are given in Fig. 10. Suffice it to point out that for partial shrinkage, the void ratio of the samples decreased with the number of cycles. This is associated with an increase in the wave velocities. On the other hand, full shrinkage, increases the void ratio and correspondingly reduces the wave velocity. These results are consistent with those presented earlier in that as the sample is allowed to shrink, air is entrapped within them creating a negative pore pressure. After partial shrinkage, the voids are reduced thus decreasing the soils ability to attain further water upon rewetting causing a reduction in the potential expansiveness of the clays. However, if the samples dried further at a faster rate, as the case with full shrinkage, most of the free water will evaporate. As the water is removed, it pushes the clay particles apart and increases the apparent voids. This in turn creates more pores to be filled with water when the samples are rewetted, consequently, the swelling potential increases.
5.2. Scanning electron microscope (SEM) analysis
The clay microstructure changes was examined under the scanning electron micro- scope (SEM) before and after cyclic swelling. Though each of the clays considered in this study has its own characteristics, they all share the same origin and with almost common trends of microstructural formation. For brevity and space limitation, soil $4 is considered here. The initial undisturbed sample of soil $4 (shown on the left in Fig. 11) has a rather smooth fabric characterized by a low degree of micro-aggregate orientation. As this soil is remolded and repeatedly allowed to swell then partially shrink, the clay microstructure is reconstructed. After the fifth cycle (see center picture of Fig. 11) the microstructure becomes more turbulent in nature thus insuring lesser water absorption resulting in lesser swell. On the other hand, if the soil is permitted to fully shrink at a faster rate, the plate-shaped particles tend to prefer a horizontal orientation (on the right in Fig. 11). Upon wetting, this staked-like formation results in greater forces of repulsion between particles. As a result, the visible combined swelling behavior increases.

226 A.A. Basma et al./Applied Clay Science 11 (1996) 211-227
6. Conclusions
The results of this study have shown that cyclic swelling process leads to a gradual destruction of the contacts in the clay structure. At the same time, it leads to a reconstruction and reorientation of the structure of the large micro-aggregates by disorientation of structural elements. All these phenomena result in a change in expansion behavior with increasing number of swelling-shrinking cycles. The character and the magnitude of the changes in each clay have their own peculiarities and depend on the initial microstructure and on the character of the structural bonds. After the first swelling-shrinking cycle of each type of soil studied, the destruction and associated break down in the structure is relatively fast and occurs in great magnitude. Addition- ally, after the first cycle the clay system does not reach equilibrium. However, equilibrium can be attained after several cycles of swelling and shrinking, especially when destruction and disorientation of the structural elements, accompanied by maxi- mum change in the volume of the system, occurs. As the cycles increase in number, further destruction of large aggregates and disorientation of structural elements takes place. Approximately after the fourth or fifth cycle, the fabric becomes almost disori- ented, consequently further change in expansibility disappears.
Generally speaking, a decrease in the expansive behavior, corresponding to a reduced water absorption capability, was observed when the soils were alternately wetted and partially shrunk. In this case, the structural elements exist mainly as edge to face contacts with a tendency to form a turbulent flocculated system with coagulation contacts. On the other hand, a horizontal clay particle orientation was noted when the specimens were cyclicly wetted the fully shrunk. This, in turn, resulted in an increase in the swelling characteristics of the soils. The ultra sonic investigation showed that the wave velocity, passing through the specimen that has partially shrunk, increased with the number of cycles while decreasing when transmitted through a fully shrunk soil sample.
Initial Specimen After 5 cycles After 5 cycles (Undisturbed) of partial shrinkage of full shrinkage
Fig. 11. Scanning electron micrographs of soil $4 before and after cyclic swelling.

A.A. Basma et al. / Applied Clay Science 11 (1996) 211-227 227
Th i s was r e spec t ive ly a s soc ia t ed w i th a dec rease and an inc rease in the appa ren t vo ids in
the soils due to par t ia l and ful l sh r inkage .
References
Basma, A.A,, 1993. Prediction of expansion degree for natural compacted clays. Geotechn, Test. J., 16(4): 542-549.
Basma, A.A., A1-Homoud A.S. and A1-Tabari E.Y., 1994. Effects of the method of drying on the engineering behavior of clays. Appl. Clay Sci., 9(3): 151-164.
Chert, F.H., 1965. The use of piers to prevent uplifting of lightly loaded structures founded on expansive soils. Proc. Engineering Effects of Moisture Changes in Soils, Int. Res. Eng. Conf. Expansive Clay Soils, Texas. A & M Press, College Station, TX.
Chen, X.Q., Lu, Z.W. and He, X.F., 1985. Moisture movement and deformation of expansive soils. 1 lth Int. Conf. Soil Mech. Found. Eng., 4. San Francisco, CA, pp. 2389-2392.
Chen, F.H. and Ma, G.S., 1987. Swelling and shrinkage behavior of expansive clays. 6th Int. Conf. Expansive Soils, 1, New Delhi, pp. 127-129.
Day, R.W., 1994. Swell--shrink behavior of compacted clay. ASCE J. Geotech. Eng. Div., 120(3): 618-623. Dif, A.E. and Bluemel, W.F., 1991. Expansive soils under cyclic drying and wetting. Geotechn. Test. J., 14(1):
96-102. Osipov, V.I, Bik, N.N. and Rumjantseva, N.A., 1987. Cyclic swelling of clays. Appl. Clay Sci., 2(7):
363-374. Popesco, M., 1980. Behavior of expansive soils with crumb structure. 4th Int. Conf. Expansive Soils, 1,
Denver, CO, pp. 158-171. Subba Rao, K.S. and Satyadas, G.G., 1987. Swelling potential with cycles of swelling and partial shrinkage.
6th Int. Conf. Expansive Soils, 1, New Delhi, pp. 137-142.


