Embed Size (px)
Citation preview
GENERAL FISHERIES COMMISSION FOR THE MEDITERRANEAN
STUDIES AND REVIEWS
No. 88 2010
SYNTHESIS OF MEDITERRANEAN MARINE FINFISH AQUACULTURE - A MARKETING AND PROMOTION STRATEGY
ISS
N 1020-9549

Cover photos and design:
Front pictures left to right: gilthead sea breams (©FAO/R.Rorandelli); fish market in Cairo, Egypt (©FAO/L.Spaventa); meagre fillets (courtesy Hatko Aquaculture, Turkey); floating culture cages (courtesy F. De Rossi) Cover design by F. De Rossi

Cover photos and design:
Front pictures left to right: gilthead sea breams (©FAO/R.Rorandelli); fish market in Cairo, Egypt (©FAO/L.Spaventa); meagre fillets (courtesy Hatko Aquaculture, Turkey); floating culture cages (courtesy F. De Rossi) Cover design by F. De Rossi
STUDIES AND REVIEWS No. 88 GENERAL FISHERIES COMMISSION FOR THE MEDITERRANEAN
SYNTHESIS OF MEDITERRANEAN MARINE FINFISH AQUACULTURE – A MARKETING AND PROMOTION STRATEGY
by
Lara Barazi-Yeroulanos
FAO Consultant
FOOD AND AGRICULTURE ORGANIZATION OF THE UNITED NATIONS Rome, 2010

The designations employed and the presentation of material in this information product do not imply the expression of any opinion whatsoever on the part of the Food and Agriculture Organization of the United Nations (FAO) concerning the legal or development status of any country, territory, city or area or of its authorities, or concerning the delimitation of its frontiers or boundaries. The mention of specific companies or products of manufacturers, whether or not these have been patented, does not imply that these have been endorsed or recommended by FAO in preference to others of a similar nature that are not mentioned. The views expressed in this information product are those of the authors and do not necessarily reflect the views of FAO. ISBN 978-92-5-106617-1 All rights reserved. FAO encourages reproduction and dissemination of material in this information product. Non-commercial uses will be authorized free of charge. Reproduction for resale or other commercial purposes, including educational purposes, may incur fees. Applications for permission to reproduce or disseminate FAO copyright materials and all other queries on rights and licences, should be addressed by e-mail to [email protected] or to the Chief, Publishing Policy and Support Branch, Office of Knowledge Exchange, Research and Extension, FAO, Viale delle Terme di Caracalla, 00153 Rome, Italy. © FAO 2010
iii
PREPARATION OF THIS DOCUMENT This document is an output of the projet entitled “Support to the General Fisheries Commission for the Mediterranean (GFCM) Working Group on Marketing of Aquaculture Products: Development of a Strategy for Marketing and Promotion of Mediterranean Aquaculture (MedAquaMarket)” funded by the Government of Spain, Secretaria General de Pesca of the Ministerio de Agricultura, Pesca y Alimentación. The advance copy of this document was first presented to the CAQ Coordinating Meeting of the Working Groups (CMWG) in Rome, Italy, 24-26 February 2010, and was circulated during the 34th Session of the GFCM in Athens, Greece, 14-17 April 2010. Furthermore it was made available on the GCFM web site under the title “Regional synthesis of the Mediterranean marine finfish aquaculture sector and development of a strategy for marketing and promotion of Mediterranean aquaculture (MedAquaMarket)”. The purpose of this report is to provide an overview of the marine aquaculture industry in the Mediterranean and its markets based on national country reports submitted by national experts selected in the Mediterranean countries. All data submitted in the national reports have been used and collated to allow a comparison across countries. Examples from individual countries, where available, have been included to illustrate or explain a certain point or trend. Some data obtained from outside sources have also been used when the relevant information was not available from the national reports. Sources are referenced in the attached bibliography. Additional insight obtained through interviews of industry professionals, members of the scientific and academic community and the author’s own experience has also been used throughout the document. The experience of this project has clearly illustrated the problem of consistent and reliable data collection for the industry. Informal, experience-based information was often proved to provide a more accurate picture of the state of the industry than official figures, with a discrepancy of more than thirty percent in some countries. However, in comparison with past surveys, it is clear that official data collection systems are becoming more accurate and the hope is that the next survey on the same topics will present a much more consistent and accurate picture.
ACKNOWLEDGEMENTS Special thanks are due to Fabio Massa, Ferit Rad and Maria Cozzolino for their comments and support to this publication. Their insight and contribution has been invaluable. Thanks are also due to Phillipos Papageorgiou, Yannis Pelekanakis and Nathalie Gamain for their kind assistance in the completion of this document. This document could not have been completed without the cooperation and contribution of the national marketing experts from the Mediterranean Region. The timely and periodic collation of production and market data is a precious tool for the correct development of this promising industry and it is to be hoped that such collaboration will continue in the future. Thanks are also due to the colleagues in the Mediterranean aquaculture sector; Thanasis Frentzos, Panos Kolios, Pavlina Pavlidou, John Stefanis, Marco Gilmozzi, Philipe Riera, Gustavo Larrazabal and Javier Piles for information, insight and inputs without which the compilation of this report would not have been possible. The Secretariat of the GFCM is acknowledged for the contribution given in the collection and updating of information from the Mediterranean region and for the editing of the manuscript.
iv
Barazi-Yeroulanos, L. Synthesis of Mediterranean marine finfish aquaculture – a marketing and promotion strategy. Studies and Reviews. General Fisheries Commission for the Mediterranean. No. 88 Rome, FAO. 2010: 198p.
ABSTRACT
This document is a follow-up study of the MedAquaMarket project in support to the activities of the General Fisheries Commission for the Mediterranean (GFCM) –Committee on Aquaculture (CAQ)– Working Group on Marketing on Aquaculture (WGMA). The MedAquaMarket project was funded by the Government of Spain (Secretaria General de Pesca, Ministerio de Agricultura, Pesca y Alimentación). Based on fifteen national country reports and other relevant sources of information, it provides an overview of the status and trends of the marine aquaculture industry in the Mediterranean region and its markets. The production and market data availability and data collection as well as the importance of having a common data system are indicated as relevant for assessing marine aquaculture production, for making a comparison across countries and for identifying market trends. The market characteristics of Mediterranean aquaculture products including consumption patterns, distribution channels, the image of the industry and the organic aquaculture market are described. The information gathered and analyzed at the regional and national levels on the state of the industry from a production perspective (juveniles’ production, country market share, product mix, price evolution at national and regional level analysis of industry structure and of costs of production as well as the legal and regulatory framework) permitted a quantitative and qualitative analysis and assessment of the Mediterranean finfish marine aquaculture market and production. These were also useful in formulating a better understanding of the present situation with particular attention to the market and to an industry characterized by a strong cyclicality with uneven periods of production growth and retrenchment. Stabilizing measures are indicated as essential to help smooth out the sharp boom and bust cycles of the industry, such as the provision of timely production and market data, market studies in order to better understand the demand potential of consuming markets and promotion tools to improve the image of Mediterranean aquaculture products. Competition for space, simplification of the licensing procedure, simplification of legislation improving the industry’s competitiveness and productivity, competition with imports and high costs associated with compliance to stringent regulations are considered as the main common problems addressing the future of aquaculture growth in the Mediterranean. Initiatives which facilitate the legal and spatial framework for growth and initiatives which improve cost competitiveness are indicated as the two basic priorities to ensure the future viable growth of the industry. The document includes also the results of the final MedAquaMarket Workshop on “Development of a strategy for marketing and promotion of Mediterranean Aquaculture”, held in Morocco, 29-30 October 2009, including the discussion on the main findings of the MedAquaMarket project in relation to the main strategies for promoting markets and marketing of Mediterranean aquaculture products. Market data collection schemes, information networks, functionality of producer organizations, image of aquaculture and sustainable development were among the issues that were identified as priorities for the WGMA future activities.
v
CONTENTS PREPARATION OF THIS DOCUMENT ...................................................................................... iii ACKNOWLEDGMENTS .............................................................................................................. iii ABSTRACT ................................................................................................................................... iv TABLES........................................................................................................................................... vii FIGURES ........................................................................................................................................ ix ABBREVIATIONS AND ACRONYMS ....................................................................................... xi 1. INTRODUCTION ....................................................................................................................... 1 1.1 Background ........................................................................................................................... 1 1.2 Overview of world fisheries ................................................................................................. 2 2. THE AQUACULTURE INDUSTRY IN THE MEDITERRANEAN AREA ............................ 6 2.1 History and evolution of the industry ................................................................................... 7 2.2 Overview of main producing countries ................................................................................ 8 3. PRODUCTION TRENDS 2003–2007 ....................................................................................... 27 3.1 Juvenile production ............................................................................................................ 27 3.1.1 Foreign trade ......................................................................................................... 35 3.1.2 Use ......................................................................................................................... 35 3.2 Ongrowing production .......................................................................................................... 39 3.3 Comparisons of official to estimated or actual production data ........................................... 45 3.4 Capture fisheries production of European seabass and gilthead seabream .......................... 49 4. STRUCTURE OF THE AQUACULTURE INDUSTRY............................................................ 55 4.1 System type .......................................................................................................................... 55 4.2 Size of enterprises ................................................................................................................ 58 4.3Analysis of production by size grade .................................................................................... 61 5. COSTS OF PRODUCTION ........................................................................................................ 61 5.1 Production costs reported from different countries .............................................................. 61 5.2 Production cost variations .................................................................................................... 73 5.3 Scope for reducing production costs .................................................................................... 74 5.3.1 Farm productivity .................................................................................................. 74 5.3.2 Automation ............................................................................................................ 74 5.3.3 Research and Development (R&D) ...................................................................... 74 5.3.4 Information systems ............................................................................................... 75 6. REGULATORY AND STRUCTURAL CONTEXTS ................................................................ 76 6.1 Laws and regulations ............................................................................................................ 76 6.2 Role and power of producer’s organization and collective action ....................................... 79 7. STATE FUNDING AND SUBSIDIES ....................................................................................... 81 7.1 Funding and subsidies in EU-Member States ...................................................................... 81 7.2 Funding and subsidies in non-EU States .............................................................................. 83 8. POTENTIAL FOR DEVELOPMENT ......................................................................................... 84 8.1 Likely future development of the industry ............................................................................ 84 8.2 Forecast production .............................................................................................................. 86 9. SEAFOOD MARKETS AND CONSUMPTION IN GFCM COUNTRIES............................... 87 9.1 General characteristics, consumer demographics .............................................................. 87 9.2 Consumption of capture fisheries products ......................................................................... 91 9.3 Market aspects of farmed fish ............................................................................................. 93 9.3.1 Domestic consumption, seasonality of consumption ........................................... 93 9.3.2 Consumption of European seabass and gilthead seabream .................................. 96 9.3.3 International trade in European seabass and gilthead seabream .......................... 104
vi
9.3.4 Distribution and retailing of farmed fish ............................................................... 108 9.3.5 Current product forms in each sector .................................................................... 115 9.3.6 Costs and margins in the distribution chain .......................................................... 116 9.3.7 Interaction between farmed and wild caught European seabass and
gilthead seabream ................................................................................................. 116 9.4 Marketing aquaculture products ........................................................................................... 117 9.4.1 The image of aquaculture and its products ........................................................... 117 9.4.2 Marketing activities for European seabass and gilthead seabream ....................... 118 9.4.3 Traceability, labelling and certification ................................................................. 123 9.5 Niche markets: organic aquaculture .............................................................................. 124 9.6 Future of the market for aquaculture products ...................................................................... 132 9.6.1 New product forms and species ............................................................................. 132 9.6.2 Strategic options .................................................................................................... 135 9.6.3 Actual or potential trade barriers ........................................................................... 137 9.6.4 Potential demand 2010–2015 ................................................................................ 138 10. PRICE EVOLUTIONS ...................................................................................................... 142 10.1 Introduction ......................................................................................................................... 143 10.2 Evidence for the crisis ......................................................................................................... 144 10.3 Causes and impacts in different countries .......................................................................... 147 10.4 Was the price crisis caused by over production? ................................................................ 149 10.5 Concluding remarks: price evolutions and supply and demand analysis............................ 150 11. SWOT ANALYSES (Strengths, Weaknesses, Opportunities and Threats)............................... 152 12. CONCLUSIONS ....................................................................................................................... 154 12.1 Production .......................................................................................................................... 156 12.2 Research and technology .................................................................................................... 157 12.3 Codes of Conduct ............................................................................................................... 157 12.4 The market .......................................................................................................................... 158 12.5 Information ......................................................................................................................... 158 12.6 Price observatory ................................................................................................................ 159 12.7 Collective actions and interbranch organizations ............................................................... 160 12.8 Future scenarios .................................................................................................................. 160 13. RECOMMENDATIONS (Development of a Strategy for Marketing and Promotion of
Mediterranean Aquaculture) .................................................................................................... 161 14. REFERENCES .......................................................................................................................... 163 Appendix 1: The pangasius phenomenon ....................................................................................... 167 Appendix 2: Organic market stakeholders ...................................................................................... 171 Appendix 3: EU organic regulations ............................................................................................... 175 Appendix 4: Organic issues ............................................................................................................. 177 Appendix 5: List of participants to the GFCM/CAQ Technical Meeting of the Working Group
on Marketing, Malabata – Tangier (Morocco), 26-27 October 2009 ......................... 179 Appendix 6: Aquaculture legislation – Greece ................................................................................ 183
vii
TABLES
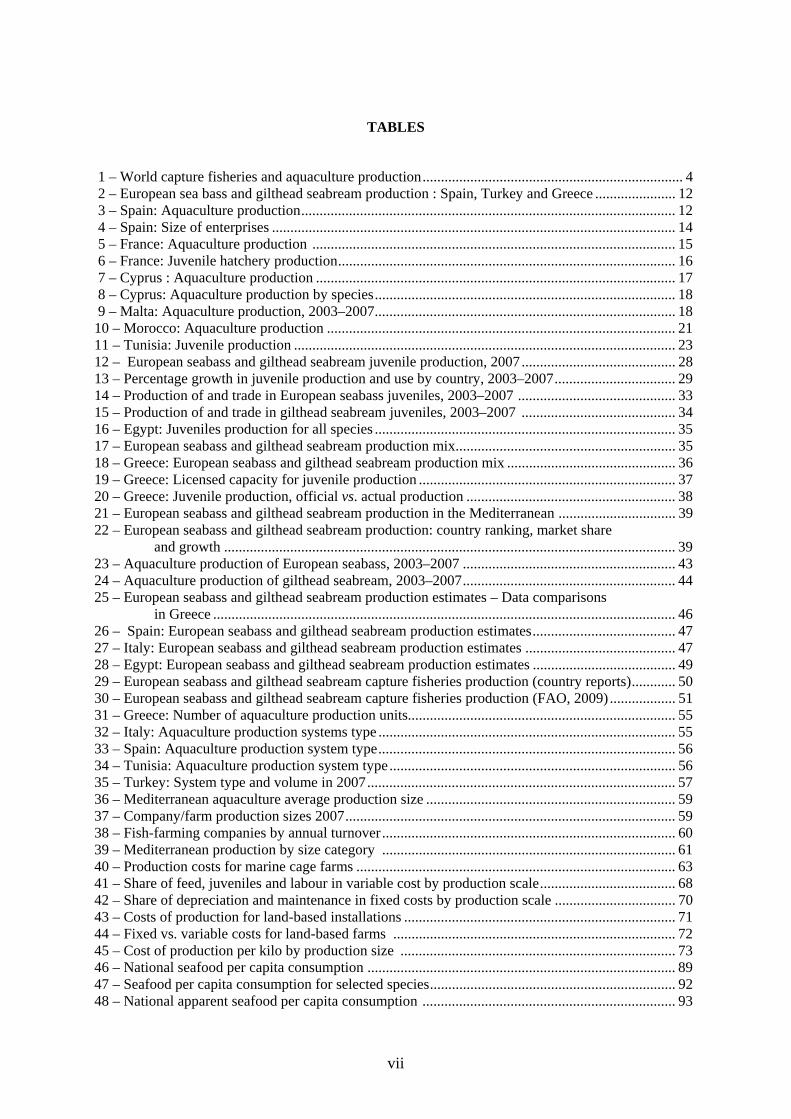
1 – World capture fisheries and aquaculture production....................................................................... 4 2 – European sea bass and gilthead seabream production : Spain, Turkey and Greece ...................... 12 3 – Spain: Aquaculture production...................................................................................................... 12 4 – Spain: Size of enterprises .............................................................................................................. 14 5 – France: Aquaculture production ................................................................................................... 15 6 – France: Juvenile hatchery production............................................................................................ 16 7 – Cyprus : Aquaculture production .................................................................................................. 17 8 – Cyprus: Aquaculture production by species.................................................................................. 18 9 – Malta: Aquaculture production, 2003–2007.................................................................................. 18 10 – Morocco: Aquaculture production ............................................................................................... 21 11 – Tunisia: Juvenile production ........................................................................................................ 23 12 – European seabass and gilthead seabream juvenile production, 2007.......................................... 28 13 – Percentage growth in juvenile production and use by country, 2003–2007................................. 29 14 – Production of and trade in European seabass juveniles, 2003–2007 ........................................... 33 15 – Production of and trade in gilthead seabream juveniles, 2003–2007 .......................................... 34 16 – Egypt: Juveniles production for all species .................................................................................. 35 17 – European seabass and gilthead seabream production mix............................................................ 35 18 – Greece: European seabass and gilthead seabream production mix .............................................. 36 19 – Greece: Licensed capacity for juvenile production ...................................................................... 37 20 – Greece: Juvenile production, official vs. actual production ......................................................... 38 21 – European seabass and gilthead seabream production in the Mediterranean ................................ 39 22 – European seabass and gilthead seabream production: country ranking, market share
and growth ........................................................................................................................... 39 23 – Aquaculture production of European seabass, 2003–2007 .......................................................... 43 24 – Aquaculture production of gilthead seabream, 2003–2007.......................................................... 44 25 – European seabass and gilthead seabream production estimates – Data comparisons
in Greece .............................................................................................................................. 46 26 – Spain: European seabass and gilthead seabream production estimates....................................... 47 27 – Italy: European seabass and gilthead seabream production estimates ......................................... 47 28 – Egypt: European seabass and gilthead seabream production estimates ....................................... 49 29 – European seabass and gilthead seabream capture fisheries production (country reports)............ 50 30 – European seabass and gilthead seabream capture fisheries production (FAO, 2009) .................. 51 31 – Greece: Number of aquaculture production units......................................................................... 55 32 – Italy: Aquaculture production systems type ................................................................................. 55 33 – Spain: Aquaculture production system type................................................................................. 56 34 – Tunisia: Aquaculture production system type.............................................................................. 56 35 – Turkey: System type and volume in 2007.................................................................................... 57 36 – Mediterranean aquaculture average production size .................................................................... 59 37 – Company/farm production sizes 2007.......................................................................................... 59 38 – Fish-farming companies by annual turnover................................................................................ 60 39 – Mediterranean production by size category ................................................................................ 61 40 – Production costs for marine cage farms ....................................................................................... 63 41 – Share of feed, juveniles and labour in variable cost by production scale..................................... 68 42 – Share of depreciation and maintenance in fixed costs by production scale ................................. 70 43 – Costs of production for land-based installations .......................................................................... 71 44 – Fixed vs. variable costs for land-based farms ............................................................................. 72 45 – Cost of production per kilo by production size ........................................................................... 73 46 – National seafood per capita consumption .................................................................................... 89 47 – Seafood per capita consumption for selected species................................................................... 92 48 – National apparent seafood per capita consumption ..................................................................... 93
viii
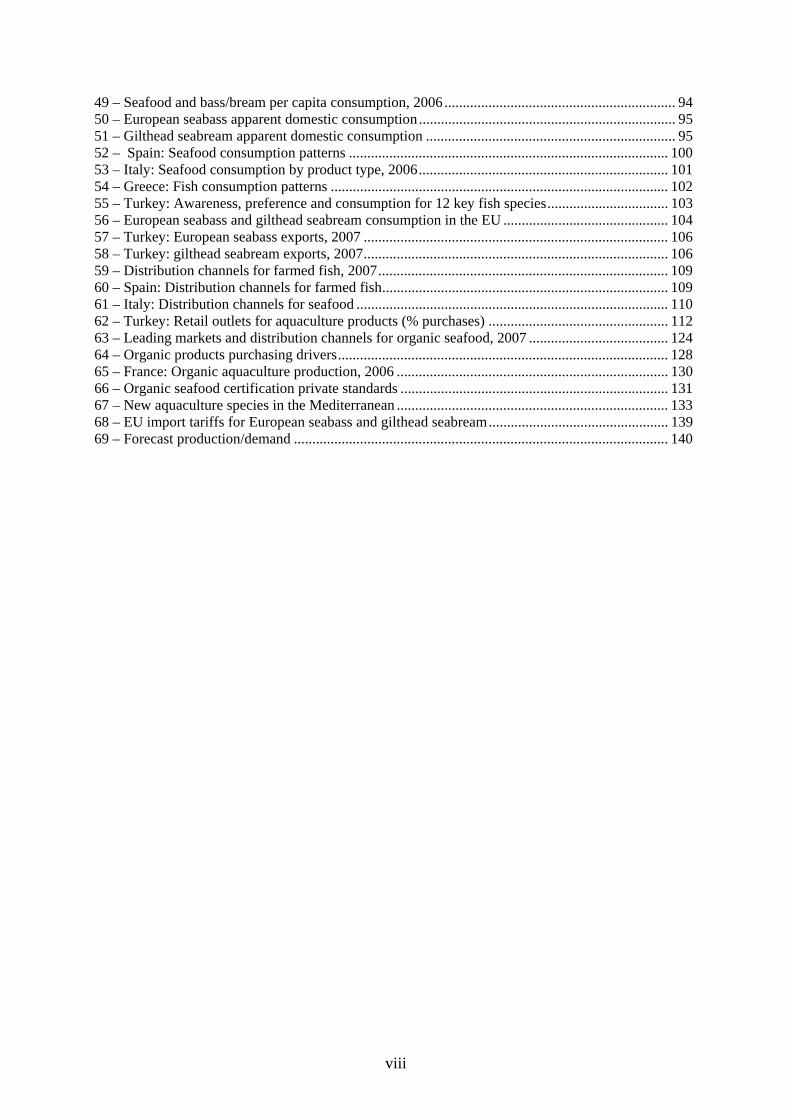
49 – Seafood and bass/bream per capita consumption, 2006 ............................................................... 94 50 – European seabass apparent domestic consumption...................................................................... 95 51 – Gilthead seabream apparent domestic consumption .................................................................... 95 52 – Spain: Seafood consumption patterns ....................................................................................... 100 53 – Italy: Seafood consumption by product type, 2006.................................................................... 101 54 – Greece: Fish consumption patterns ............................................................................................ 102 55 – Turkey: Awareness, preference and consumption for 12 key fish species................................. 103 56 – European seabass and gilthead seabream consumption in the EU ............................................. 104 57 – Turkey: European seabass exports, 2007 ................................................................................... 106 58 – Turkey: gilthead seabream exports, 2007................................................................................... 106 59 – Distribution channels for farmed fish, 2007............................................................................... 109 60 – Spain: Distribution channels for farmed fish.............................................................................. 109 61 – Italy: Distribution channels for seafood ..................................................................................... 110 62 – Turkey: Retail outlets for aquaculture products (% purchases) ................................................. 112 63 – Leading markets and distribution channels for organic seafood, 2007 ...................................... 124 64 – Organic products purchasing drivers.......................................................................................... 128 65 – France: Organic aquaculture production, 2006 .......................................................................... 130 66 – Organic seafood certification private standards ......................................................................... 131 67 – New aquaculture species in the Mediterranean .......................................................................... 133 68 – EU import tariffs for European seabass and gilthead seabream................................................. 139 69 – Forecast production/demand ...................................................................................................... 140
ix
FIGURES
1 – Total world capture fisheries and aquaculture production 1950–2006 ........................................... 3 2 - World capture fisheries and aquaculture production by environment - 2007 .................................. 3 3 – World capture fisheries and aquaculture production by major species group, 2007....................... 4 4 – World aquaculture production by volume for major species group ................................................ 5 6 – Greece: Marine aquaculture production, 1985–2008 ...................................................................... 8 7 – Greece: Aquaculture production by main species group, 2007....................................................... 9 8 – Turkey: Distribution of aquaculture production for main species (volume), 2007 ....................... 10 9 – Turkey: Distribution of aquaculture production by main species group (value), 2007................. 10 10 – Turkey: Aquaculture production, 1994–2007 .............................................................................. 11 11 – Spain: Aquaculture production evolution, 2003–2007................................................................. 13 12 – Spain: Mussels aquaculture production, 2003–2007.................................................................... 13 13 – Spain: Freshwater aquaculture production, 2003–2007 ............................................................... 13 14 – Spain: Marine aquaculture production ......................................................................................... 14 15 – Italy: Aquaculture production ...................................................................................................... 16 16 – Egypt: Total aquaculture production ............................................................................................ 19 17 – Egypt:Aquaculture production for major species......................................................................... 20 18 – Morocco: Aquaculture production by species .............................................................................. 21 19 – Morocco: Export vs. domestic market prices ............................................................................... 22 21 – Albania: Aquaculture production by main species groups........................................................... 24 22 – Montenegro: Aquaculture production by main species group...................................................... 25 23 – Croatia: Aquaculture production by main species group ............................................................. 26 24 – Israel: Aquaculture production by main species group ................................................................ 27 25 –Mediterranean juvenile production ................................................................................................28 26 – Mean juvenile production per hatchery, 2003–2007.................................................................... 29 27 – Number and size category of hatcheries, 2009............................................................................. 30 28 – European seabass and gilthead seabream juvenile production, 2003–2007 ................................. 30 29 – European seabass: juveniles production and price evolution ....................................................... 31 30 – Gilthead seabream: juveniles production and price evolution...................................................... 31 31 – Juveniles price evolution by country, 2005–2008........................................................................ 32 32 – European seabass juveniles apparent usage ................................................................................. 36 33 – Gilthead seabream juveniles apparent usage................................................................................ 37 34 – Mediterranean European seabass production, 1985–2008 ........................................................... 40 35 – Mediterranean gilthead seabream production, 1985–2008........................................................... 41 36 – Gilthead seabream: production and price evolution ..................................................................... 42 37 – European seabass: production and price evolution ...................................................................... 42 38 – European seabass: aquaculture and capture fisheries production................................................. 49 39 – Gilthead seabream: aquaculture and capture fisheries production ............................................... 50 40 – Mediterranean European seabass capture fisheries by country, 1997–2007 ................................ 52 41 – Mediterranean gilthead seabream capture fisheries by country, 1997–2007 ............................... 53 42 – European seabass: prices of capture fisheries vs. aquaculture production ................................... 54 43 – Gilthead seabream: prices of capture fisheries vs. aquaculture production.................................. 54 44 – Distribution of marine fish farms regarding the culture systems ................................................ 58 45 – Distribution of marine fish farms regarding the culture systems ................................................ 58 46 – Fixed vs. variable costs for marine cage farms ............................................................................ 66 47 – Variable production cost breakdown for large-scale production.................................................. 67 48 – Variable production cost breakdown for small-scale production................................................. 68 49 – Variable production cost breakdown for medium-scale production ............................................ 69 50 – Fixed production cost breakdown for large-scale production ...................................................... 69 51 – Fixed production cost breakdown for small-scale production...................................................... 70 52 – Fixed vs. variable costs for small-scale land-based installations ................................................. 72
x
53 – Fixed vs. variable costs for medium-scale land-based installations ............................................. 73 54 – Licensing procedure for Greece ................................................................................................... 76 55 – Spain: European seabass aquaculture and capture fisheries production....................................... 84 56 – Spain: gilthead seabream aquaculture and capture fisheries production ...................................... 85 57 – Number of hatcheries per country, 2004–2009 ............................................................................ 86 58 – Mean juvenile production per hatchery, 2004–2009.................................................................... 87 59 – EU average annual per capita seafood consumption .................................................................... 88 60 – EU seafood market size by country.............................................................................................. 96 61 – France: Seafood purchase for home consumption (volume) ........................................................ 97 62 – France: Seafood purchase for home consumption (value) ........................................................... 97 63 – France: Fresh seafood consumption ............................................................................................. 98 64 – France: Independent restaurants seafood purchases..................................................................... 98 65 – France: Restaurant chains seafood purchases............................................................................... 99 66 – Export markets for Greek European seabass and gilthead seabream, 2007 ............................... 104 67 – Greece: European seabass exports, 2007.................................................................................... 105 68 – Greece: gilthead seabream exports, 2007................................................................................... 105 69 – Turkey: European seabass exports per country, 2007 ................................................................ 107 70 – Turkey gilthead seabream exports per country 2007.................................................................. 107 71 – European seabass and gilthead seabream trade flows, 2007 ...................................................... 108 72 – Spain: European seabass and gilthead seabream distribution channels ..................................... 110 73 – Italy: European seabass and gilthead seabream distribution channels – Italy ............................ 111 74 – Turkey: Fish distribution channels ............................................................................................. 112 75 – Greece: Distribution network for seafood .................................................................................. 113 76 – Export network of the Greek aquaculture industry .................................................................... 114 77 – European seabass aquaculture and capture fisheries prices........................................................ 117 78 – Turkey: Aquaculture promotion brochure.................................................................................. 120 79 – Europe organic seafood production estimate, 2007.................................................................... 127 80 – New species juveniles production in the Mediterranean, 2007 .................................................. 134 81 – Italy: European seabass forecast production .............................................................................. 141 82 – Italy: Gilthead seabream forecast production............................................................................. 141 83 – European seabass and gilthead seabream average price evolutions, 1990–2009 ....................... 142 84 – European seabass and gilthead seabream production evolution by country............................... 143 85 – European seabass and gilthead seabream juveniles production evolution by country ............... 144 86 – Gilthead seabream production and market prices, 1996–2008................................................... 145 87 – Average European seabass prices per size category................................................................... 145 88 – Average gilthead seabream prices per size category .................................................................. 146 89 – Greece: European seabass and gilthead seabream production, 1998–2008 ............................. 147 90 – Number of hatcheries, 2004–2009 ............................................................................................. 148 91 – Mean juvenile production per hatchery, 2003–2009.................................................................. 148 92 – Gilthead seabream sales and volumes correlation, MercaMadrid, 2003–2009 .......................... 151 93 – Turkey: Institutional structure of the seafood sector .................................................................. 157
xi
ABBREVIATIONS AND ACRONYMS
AGROCERT Organization for Certification and Inspection of Agricultural Products of the Hellenic Ministry of Rural Development and Food
AMA Association marocaine de l’aquaculture API Associazione Piscicoltori Italiani APROMAR Federation of Spanish Aquaculture Producers ARS Aquaculture Registration System BSE bovine spongiform encephalopathy CAQ Committee on Aquaculture CMWG CAQ Coordinating Meeting of the Working Groups COM Common Organizations of Markets CPI Consumer Price Index DFMR Department of Fisheries and Marine Research (Cyprus) DG Directorate General DYLCAN Doradas y Lubinas de Canarias EC European Commission EMS Environmental Management System EU European Union EIA Environmental Impact Assessment FAO Food and Agriculture Organization FAC Fisheries Acquis Centre FCR Food Conversion Ratio FEAP Federation of European Aquaculture Producers FFA French Aquaculture Federation FGM Federation of Greek Maricultures FIPS Statistics and Information Service, FAO Fisheries and Aquaculture
Department FISHSTAT Computer System for Global Catches FROM Fondo de Regulación y Promoción de los Mercados de la Pesca y la
Acuicultura FTE full-time equivalent GAFRD General Authority for Fish Resources Development (Egypt) GAP South-eastern Anatolia Project GATT General Agreement on Tariffs GDP Gross Domestic Product GFCM General Fisheries Commission for the Mediterranean HACCP Hazard Analysis and Critical Control Point (System) HDPE High Density Polyethylene ICCAT International Commission for the Conservation of Atlantic Tunas ICZM Integrated Coastal Zone Management IFREMER French Research Institute for Exploitation of the Sea INRH Institut National de Recherche Halieutique du Maroc ISEAL International Social and Environmental Accreditation and Labelling Alliance ISO International Organization for Standardization
xii
ISTAT Italian Statistics Office IUCN World Conservation Union LFPR Labour Force Participation Rate MARA Ministry of Agriculture and Rural Affairs MERCAMADRID Madrid Central Market MiPAAF Ministry of Agriculture, Food and Forestry (Italy) MRDF Ministry of Rural Development and Food t tonnes NSSG National Statistical Service of Greece NUTS Nomenclature of Territorial Units for Statistics OECD Organization for Economic Co-operation and Development PO Producer Organization QA Quality Assurance R&D Research and Development SIPAM Information System for the Promotion of Aquaculture SMEs Small Medium Enterprises SUFED Federation of Turkish Aquaculture and Fisheries SWOT Strengths, Weaknesses, Opportunities and Threats TARIC Tariff Regime International Code TUBITAK Scientific and Technological Research Council of Turkey TURKSTAT Turkish Statistical Institute UK United Kingdom USA United States of America UTAP Tunisian Union of Agriculture and Fishery VAT Value added tax WGFMA Working Group on Marketing of Aquaculture WTO World Trade Organization WWF World Wide Fund for Nature
1
1. INTRODUCTION
1.1 Background At its fifth session held in Spain in June 2006, the Committee on Aquaculture (CAQ) established a Working Group on Marketing of Aquaculture (WGMA), taking into account the outputs of a CAQ workshop on European seabass (Dicentrarchus labrax) and gilthead seabream (Sparus aurata) markets held in May 2006. The workshop identified a number of constraints on the development of the Mediterranean aquaculture sector such as: poor data on the marketing situation; environmental concerns affecting the public image of aquaculture products; limited government support for addressing marketing issues; low competitiveness of European seabass and gilthead seabream in comparison to other aquaculture products as well as constraints on its potential further expansion. The workshop identified a series of priorities in support of a strategy for Mediterranean aquaculture products. The General Fisheries Commission for the Mediterranean (GFCM) acknowledged these challenges and established a Working Group on Marketing as a CAQ subsidiary body.
In November 2006 during the CAQ Coordinating Meeting of the Working Groups (CMWG), a project in support to the activities of the WGMA was prepared and endorsed by the GFCM at its thirty-first session (January 2007), as part of the short-medium term CAQ work programme. The Spanish Government offered its support in financing the project.
The project to “Support to the GFCM Working Group on Marketing of Aquaculture Products: Development of a Strategy for Marketing and Promotion of Mediterranean Aquaculture (MedAquaMarket)” was finalized by the GFCM Secretariat in fall 2007 and became operational in April 2008. It is funded by the Government of Spain (Secretaria General de Pesca, Ministerio de Agricultura, Pesca y Alimentación).
Planning and formulation of development strategies for the promotion of a market-oriented, competitive and proactive aquaculture industry in the Mediterranean region requires a clear understanding of the present situation based on quantitative market data, qualitative assessments of comparative advantages and constraints. MedAquaMarket aims at increasing understanding of the present situation of marketing of aquaculture products in the Mediterranean and to support the GFCM member countries in implementing a strategy for the development of the marketing of aquaculture products.
The project supports the Working Group to:
1) increase understanding of the present situation in Mediterranean aquaculture through the provision of quantitative market data and qualitative assessments of comparative advantages and constraints based on national surveys;
2) prepare a common methodology and template for collection of market information in the Mediterranean region to monitor major trends and establish accordingly a database to be managed in the future by the CAQ information system for the promotion of aquaculture in the Mediterranean;
3) formulate market recommendations for the development of Mediterranean aquaculture industry and for the promotion of Mediterranean aquaculture images, as part of a framework strategy for Marketing and Promotion of Mediterranean Aquaculture Product to be implemented through a medium-term aquaculture marketing programme.
It aims also to answer some of the pressing questions facing the industry today:
What is the current state of the bass and bream market? Does it make financial and commercial sense to focus investments in additional
European seabass/gilthead seabream farming in the southern Mediterranean if the domestic markets are not developed and potential export markets maturing?
How can the southern Mediterranean countries become competitive for aquaculture exports to the EU?
What are the current constraints in the GFCM countries that must be overcome in order to build a commercially and environmentally sound aquaculture industry?
2
How can domestic markets for aquaculture products be developed in the GFCM countries?
In particular during the implementation period of MedAquaMarket, the GFCM/CAQ has envisaged a series of activities including among others the preparation of MedAquaMarket National Aquaculture Reports of the Mediterranean Countries based on the Standard National Market Report Template discussed and prepared within the activities of the WGMA draft document entitled Regional Synthesis of the Mediterranean Aquaculture Sector and Development of a Strategy for Marketing and Promotion of Mediterranean Aquaculture. Within the activities of MedAquaMarket the preparation of the draft Market Data Scheme for inclusion within the Information System for the Promotion of Aquaculture (SIPAM); and the draft report “Mediterranean Market for Emerging Species: Meagre (Argyrosomus regius) – Present Situation and Prospects” that represents currently one of the most evident new marketable Mediterranean marine aquaculture species. The main achievement and results of the MedAquaMarket project were presented during the technical meeting of the GFCM/CAQ Working Group on Marketing held at the Centre régional de l’Institut National de Recherche Halieutique (INRH) held in Tangiers, Morocco, from 26 to 27 October 2009.
The meeting was attended by experts and stakeholders (scientists, farmers, administration) from different Mediterranean countries and was based on the quantitative market data and qualitative assessments of comparative advantages and constraints after national surveys. The participants (Appendix 4), among other discussed the key issues on the marketing status of Mediterranean aquaculture species and concurred in the finalization of the Strengths, Weaknesses, Opportunities and Threats (SWOT) analysis towards the definition of and agreement on the priorities to be addressed to formulate market recommendations for the future development of Mediterranean aquaculture.
It has become clear that the long-term sustainability of the industry has turned out to be an issue of concern, not only in an environmental/ecological sense but from an economic sense. Ecological and environmental sustainability issues can and are being addressed through research into sustainable feeds, the production of herbivorous species, environmental legislation and strict monitoring of environmental parameters and coastal zoning. However, the issue of economic sustainability is of paramount importance as it is the basic precondition for an environmentally sustainable and responsible industry. An industry plagued by cycles of “boom and bust” becomes an industry that merely reacts to the short-term and is unable to plan and invest for the long-term. Apart from the economic difficulties that make it impossible for a company to invest in research, innovation, marketing and data gathering, it also makes it difficult for the same company to invest in environmental monitoring. The lack of social acceptability and weak governance mechanisms both at the industry and state level, also hinder the long-term sustainability of the industry.
The main problems facing the Mediterranean aquaculture industry today are relative stagnation in growth compared to global production and consumption trends and a lack of marketing and communication. The common thread is the lack of timely and reliable data on production but also on the markets, decreasing profit margins, decreasing negotiating power in the market and on some cases a negative image of the sector.
It is also important to note that although the scope of the project aims to address the issues of Mediterranean aquaculture in general, the industry today revolves mostly around the production of European seabass and gilthead seabream. The problems facing the industry with regards to the markets are inevitably tied to the anarchic production increases in the production of these two species without the required market analysis and promotion. In addition, the lack of form and species diversification have only added to the marketing problems of the industry.
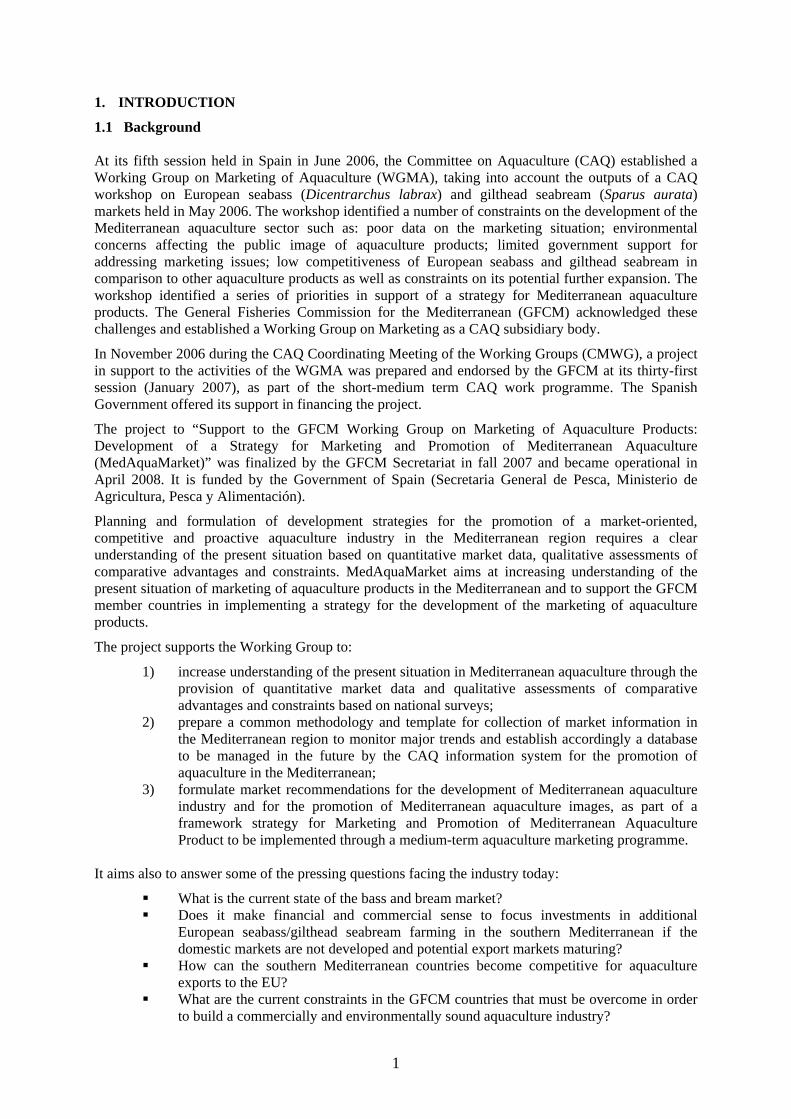
1.2 Overview of world fisheries The total world seafood production in 2007 reached 156 million tonnes representing a 21 percent increase over the last decade. The global per capita consumption of seafood has increased from an average of 14.4 kg in the 1990s to an estimated 16.7 kg in 2007. This increase in production was
3
entirely due to the 90 percent increase in aquaculture production, as capture fisheries declined in the same period by almost 3 percent.
Figure 1 – Total world capture fisheries and aquaculture production, 1950–2006 1950
1952
1954
1956
1958
1960
1962
1964
1966
1968
1970
1972
1974
1976
1978
1980
1982
1984
1986
1988
1990
1992
1994
1996
1998
2000
2002
2004
2006
Capture Fisheries
Aquaculture
0
10
20
30
40
50
60
70
80
90
100
Global Seafood Production (million tons)
Source: FAO (2008), elaborated by APROMAR
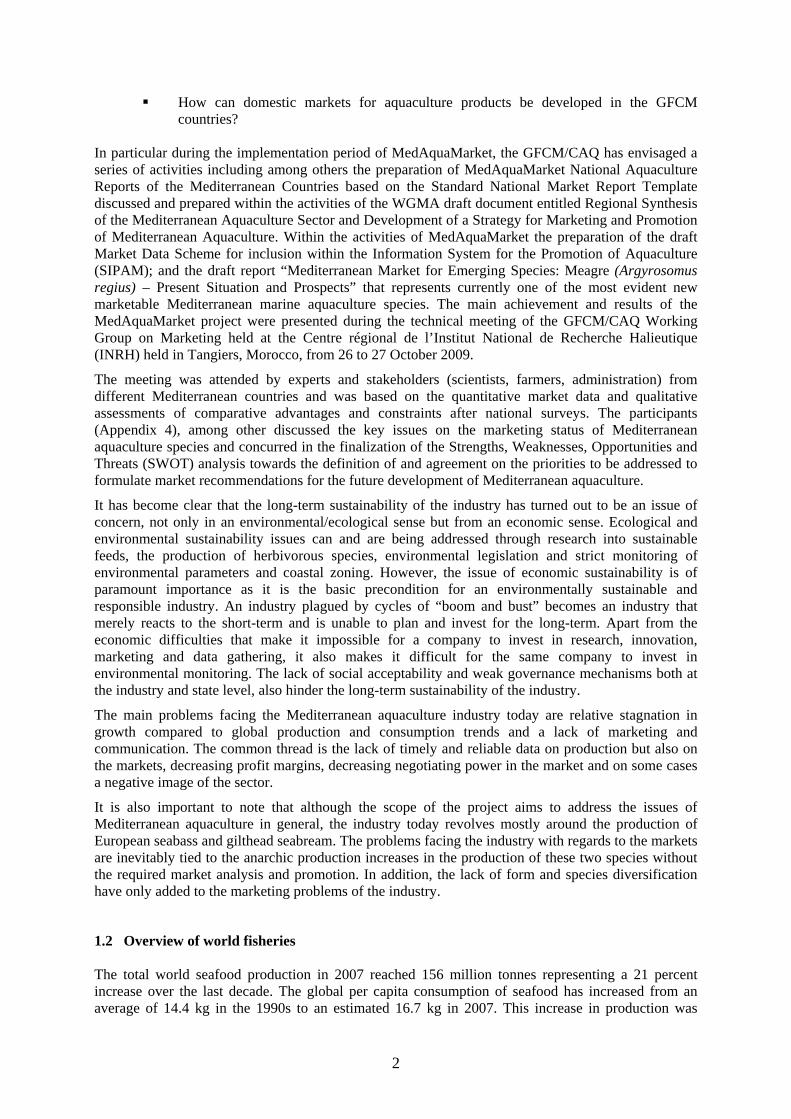
The share of aquaculture as a whole can be seen by looking at the segmentation of production according to environment: the share of production of freshwater environments is almost as important as marine environments.
Figure 2 - World capture fisheries and aquaculture production by environment, 2007
Source: FAO (2008), elaborated by APROMAR
World seafood production by environment (volume) 2007
Marine 48.1%
Freshwater 44.6%
Brackish7.3%
4
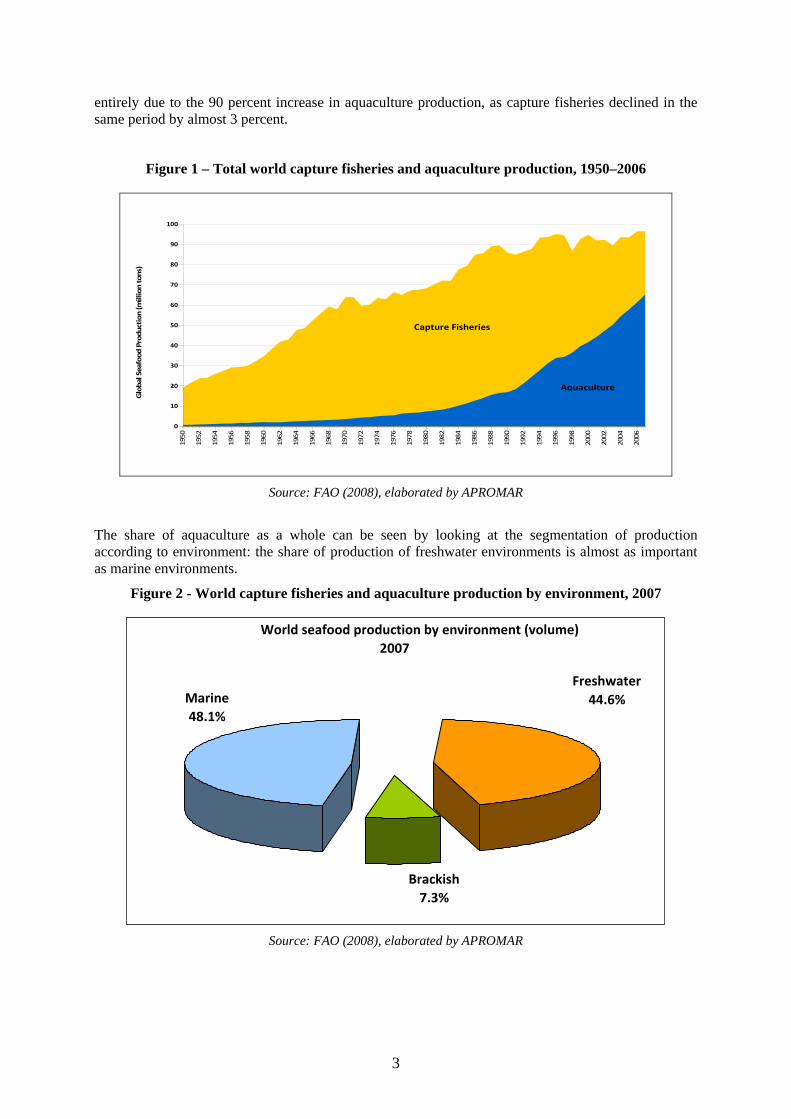
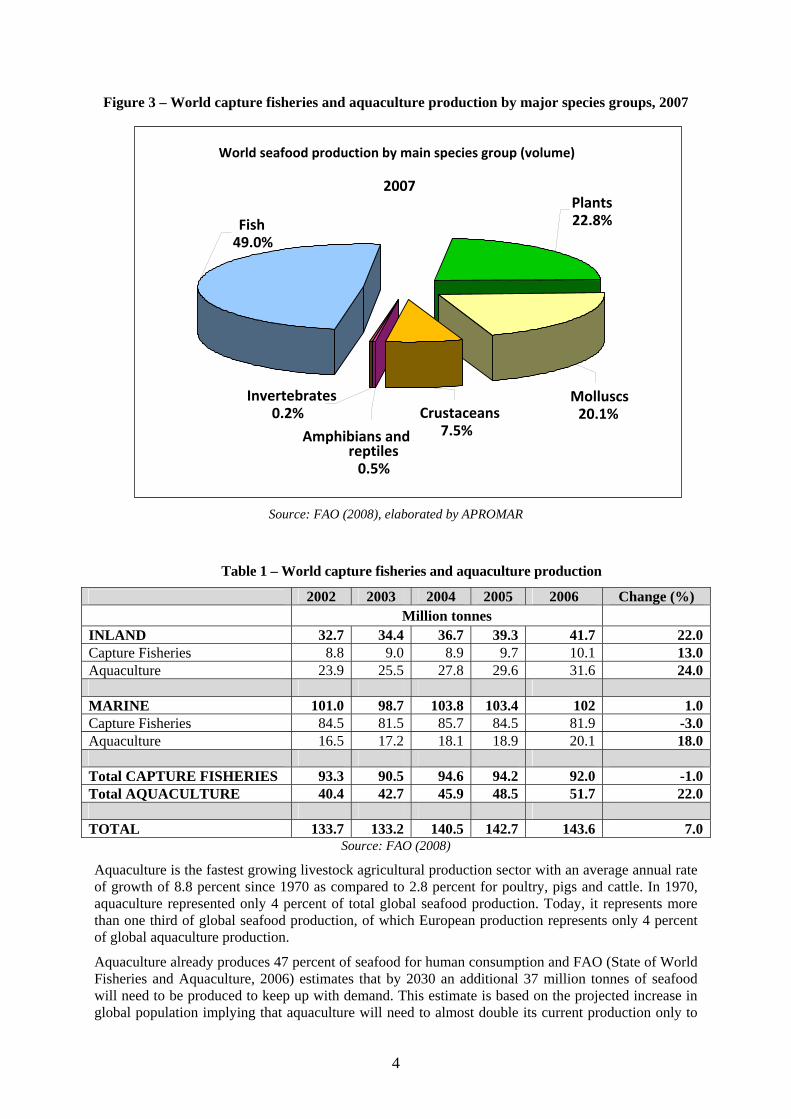
Figure 3 – World capture fisheries and aquaculture production by major species groups, 2007
Source: FAO (2008), elaborated by APROMAR
Table 1 – World capture fisheries and aquaculture production
2002 2003 2004 2005 2006 Change (%) Million tonnes
INLAND 32.7 34.4 36.7 39.3 41.7 22.0Capture Fisheries 8.8 9.0 8.9 9.7 10.1 13.0Aquaculture 23.9 25.5 27.8 29.6 31.6 24.0 MARINE 101.0 98.7 103.8 103.4 102 1.0Capture Fisheries 84.5 81.5 85.7 84.5 81.9 -3.0Aquaculture 16.5 17.2 18.1 18.9 20.1 18.0 Total CAPTURE FISHERIES 93.3 90.5 94.6 94.2 92.0 -1.0Total AQUACULTURE 40.4 42.7 45.9 48.5 51.7 22.0 TOTAL 133.7 133.2 140.5 142.7 143.6 7.0
Source: FAO (2008)
Aquaculture is the fastest growing livestock agricultural production sector with an average annual rate of growth of 8.8 percent since 1970 as compared to 2.8 percent for poultry, pigs and cattle. In 1970, aquaculture represented only 4 percent of total global seafood production. Today, it represents more than one third of global seafood production, of which European production represents only 4 percent of global aquaculture production.
Aquaculture already produces 47 percent of seafood for human consumption and FAO (State of World Fisheries and Aquaculture, 2006) estimates that by 2030 an additional 37 million tonnes of seafood will need to be produced to keep up with demand. This estimate is based on the projected increase in global population implying that aquaculture will need to almost double its current production only to
World seafood production by main species group (volume)
2007
Fish 49.0%
Plants 22.8%
Molluscs 20.1% Crustaceans
7.5%Amphibians and reptiles0.5%
Invertebrates0.2%
5
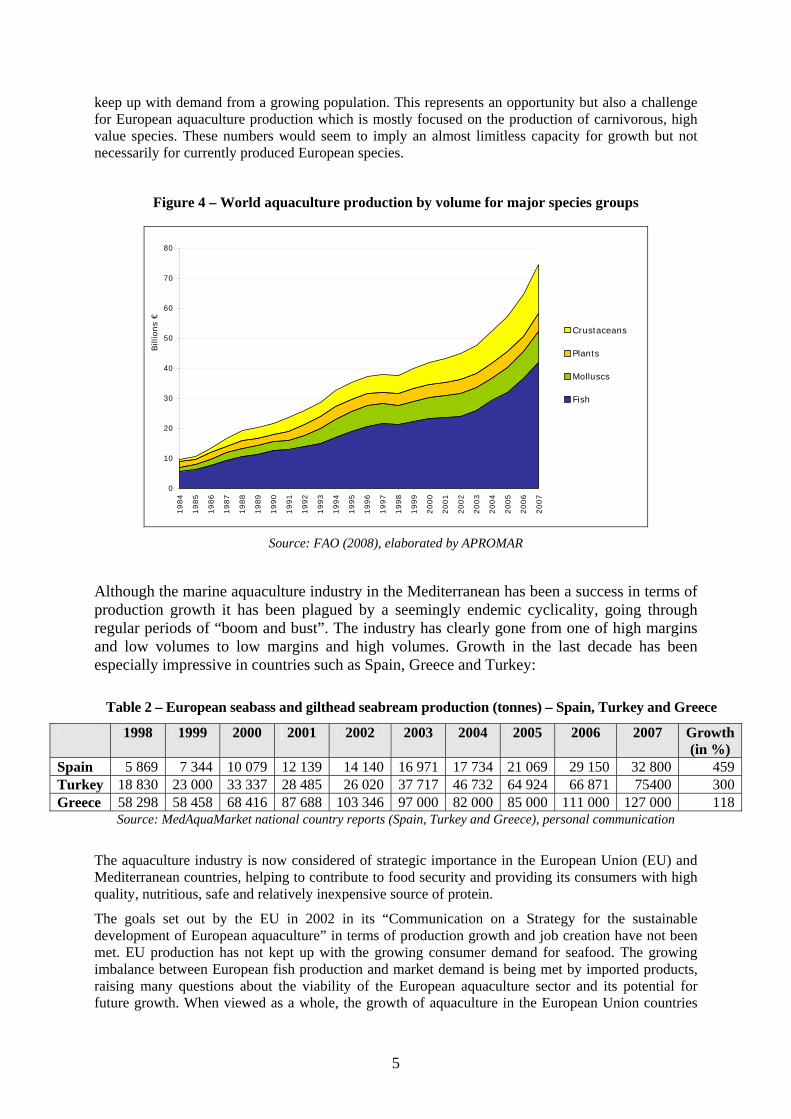
keep up with demand from a growing population. This represents an opportunity but also a challenge for European aquaculture production which is mostly focused on the production of carnivorous, high value species. These numbers would seem to imply an almost limitless capacity for growth but not necessarily for currently produced European species.
Figure 4 – World aquaculture production by volume for major species groups
0
10
20
30
40
50
60
70
80
1984
1985
1986
1987
1988
1989
1990
1991
1992
1993
1994
1995
1996
1997
1998
1999
2000
2001
2002
2003
2004
2005
2006
2007
Bill
ions
€
Crustaceans
Plants
Molluscs
Fish
Source: FAO (2008), elaborated by APROMAR
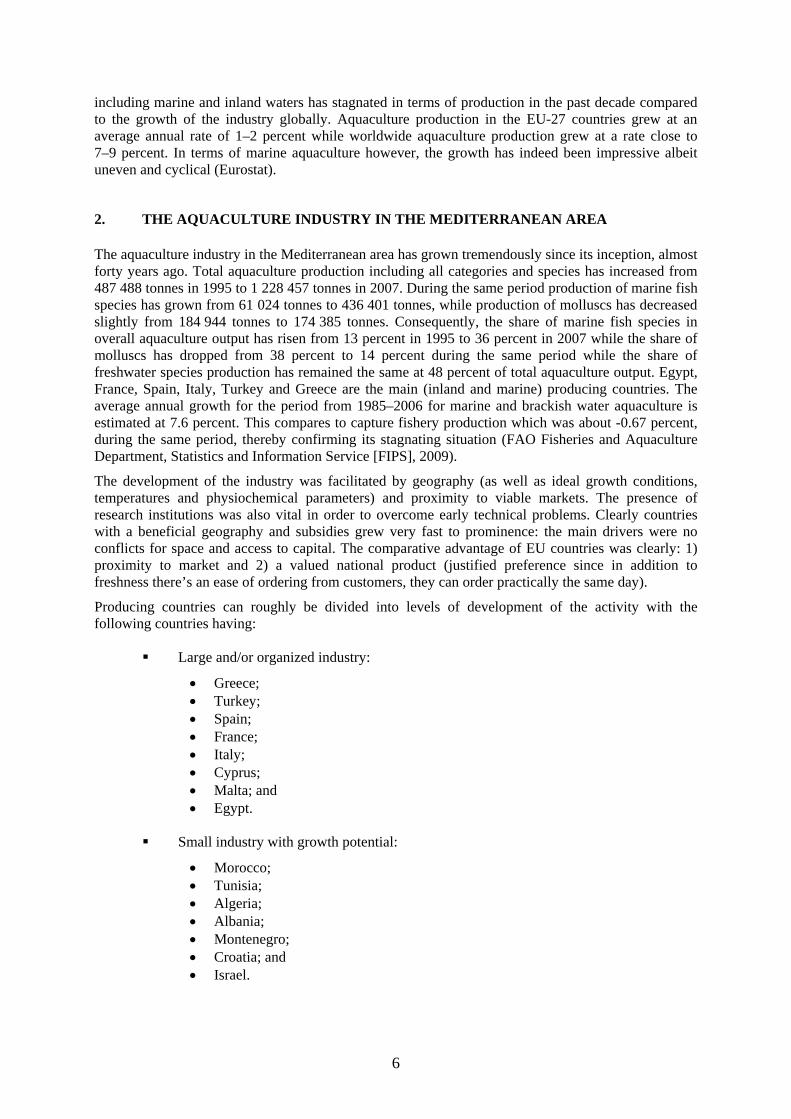
Although the marine aquaculture industry in the Mediterranean has been a success in terms of production growth it has been plagued by a seemingly endemic cyclicality, going through regular periods of “boom and bust”. The industry has clearly gone from one of high margins and low volumes to low margins and high volumes. Growth in the last decade has been especially impressive in countries such as Spain, Greece and Turkey:
Table 2 – European seabass and gilthead seabream production (tonnes) – Spain, Turkey and Greece
1998 1999 2000 2001 2002 2003 2004 2005 2006 2007 Growth(in %)
Spain 5 869 7 344 10 079 12 139 14 140 16 971 17 734 21 069 29 150 32 800 459Turkey 18 830 23 000 33 337 28 485 26 020 37 717 46 732 64 924 66 871 75400 300Greece 58 298 58 458 68 416 87 688 103 346 97 000 82 000 85 000 111 000 127 000 118
Source: MedAquaMarket national country reports (Spain, Turkey and Greece), personal communication
The aquaculture industry is now considered of strategic importance in the European Union (EU) and Mediterranean countries, helping to contribute to food security and providing its consumers with high quality, nutritious, safe and relatively inexpensive source of protein.
The goals set out by the EU in 2002 in its “Communication on a Strategy for the sustainable development of European aquaculture” in terms of production growth and job creation have not been met. EU production has not kept up with the growing consumer demand for seafood. The growing imbalance between European fish production and market demand is being met by imported products, raising many questions about the viability of the European aquaculture sector and its potential for future growth. When viewed as a whole, the growth of aquaculture in the European Union countries
6
including marine and inland waters has stagnated in terms of production in the past decade compared to the growth of the industry globally. Aquaculture production in the EU-27 countries grew at an average annual rate of 1–2 percent while worldwide aquaculture production grew at a rate close to 7–9 percent. In terms of marine aquaculture however, the growth has indeed been impressive albeit uneven and cyclical (Eurostat).
2. THE AQUACULTURE INDUSTRY IN THE MEDITERRANEAN AREA The aquaculture industry in the Mediterranean area has grown tremendously since its inception, almost forty years ago. Total aquaculture production including all categories and species has increased from 487 488 tonnes in 1995 to 1 228 457 tonnes in 2007. During the same period production of marine fish species has grown from 61 024 tonnes to 436 401 tonnes, while production of molluscs has decreased slightly from 184 944 tonnes to 174 385 tonnes. Consequently, the share of marine fish species in overall aquaculture output has risen from 13 percent in 1995 to 36 percent in 2007 while the share of molluscs has dropped from 38 percent to 14 percent during the same period while the share of freshwater species production has remained the same at 48 percent of total aquaculture output. Egypt, France, Spain, Italy, Turkey and Greece are the main (inland and marine) producing countries. The average annual growth for the period from 1985–2006 for marine and brackish water aquaculture is estimated at 7.6 percent. This compares to capture fishery production which was about -0.67 percent, during the same period, thereby confirming its stagnating situation (FAO Fisheries and Aquaculture Department, Statistics and Information Service [FIPS], 2009).
The development of the industry was facilitated by geography (as well as ideal growth conditions, temperatures and physiochemical parameters) and proximity to viable markets. The presence of research institutions was also vital in order to overcome early technical problems. Clearly countries with a beneficial geography and subsidies grew very fast to prominence: the main drivers were no conflicts for space and access to capital. The comparative advantage of EU countries was clearly: 1) proximity to market and 2) a valued national product (justified preference since in addition to freshness there’s an ease of ordering from customers, they can order practically the same day).
Producing countries can roughly be divided into levels of development of the activity with the following countries having:
Large and/or organized industry:
• Greece; • Turkey; • Spain; • France; • Italy; • Cyprus; • Malta; and • Egypt.
Small industry with growth potential:
• Morocco; • Tunisia; • Algeria; • Albania; • Montenegro; • Croatia; and • Israel.
7
No significant marine aquaculture to date:
• Lebanon; • Syrian Arab Republic; and • Libyan Arab Jamahiriya.
2.1 History and evolution of the industry Aquaculture in the Mediterranean has a long history. Evidence of fish capture and on-growing in ponds and lagoons date back to more than 2 000 years ago while friezes from ancient Egyptian tombs (tomb of Aktihep) show tilapia being harvested from ponds as far back as 2500 BC. There is evidence of extensive marine farms in the sixth century BC in Etruscan culture and in Roman times European seabass, gilthead seabream, mullets and oysters were cultivated in ponds and lagoons in Italy. In the twelfth century a resurgence of freshwater aquaculture was seen in central Europe. In the fifteenth century extensive, large-scale aquaculture (vallicultura) was practiced in the coastal lagoons of the Adriatic, a tradition that remains to this day and is a precursor to modern marine Mediterranean aquaculture.
The first successful artificial fertilizations of salmonids are attributed to Jacobi in 1773. The first “marine fish factories” were created in 1878 in the United States of America and in 1883 in Norway and work on the artificial reproduction and fertilization of turbot were done as early as 1894 in England. At the end of the nineteenth and beginning of the twentieth century, great efforts were made in transferring salmon populations between regions throughout the world (1875: California to New Zealand) and at the same time, trout farming started in Denmark. The industry grew considerably at the end of the 1960s with the formulation of commercial, pellet fish feed. Marine aquaculture started at this time with the production of Amberjack tuna (Seriola) in Japan and trout and salmon in Norway (IFREMER).
Initial research for the breeding of European seabass and gilthead seabream took place in the late 1970s and early 1980s, in state research institutes of France and Italy. Early research efforts were focused on the controlled on-growing production phase which was carried out in land-based systems using pumped seawater. As the sector developed, on growing production moved into the sea, following technology developed for the farming of salmon and other species in Norway and Japan. Production remained low until the mid 1980s, but then started to grow rapidly, through semi-intensive and intensive culture systems, expanding from 374 tonnes in 1985 to 3 876 tonnes within only five years (FAO, 2008). By that time (1990), Greece was already the leading producer (42 percent), with Italy (23 percent) and Turkey (12 percent), respectively second and third largest.
Modern industrial marine aquaculture was made possible only after technical difficulties in reproduction, larval culture, feeds and cage and basin technology were overcome in the late 1980s. With the main technical barriers to large-scale hatchery production removed, the increase in production during the 1990s was beyond the most optimistic expectations. Sheltered coastlines, along with the favourable climatic and environmental conditions of the Eastern Mediterranean, provided the medium for the industry’s rapid development, while national and EU financial assistance acted as catalysts for its boost. By 1998, the combined production of European seabass and gilthead seabream had surpassed the 100 000 tonnes level (108 800 tonnes), reaching just over 181 000 tonnes in 2002. Production was particularly rapid in Greece, which by 2002 had surpassed the 100 000 tonnes, accounting for 57 percent of the total European seabass and gilthead seabream aquaculture production (European Commission, 2004; Hellenic Ministry of Rural Development and Food, 2004).
Nowadays, the Mediterranean aquaculture industry consists of various segments, depending on the species produced. There is the long-established and rather traditional culture of shellfish (mussels and oysters), the culture of trout, and the culture of marine fish species. Although much research into the induced spawning and on growing methods of numerous other species was undertaken in the early years, production became focused almost exclusively on high value, high demand species such as turbot, gilthead seabream and European seabass. In fact, it is the commercial culture of the latter species that has provided the big ‘boost’ of the industry over the last two decades.
8
2.2 Overview of main producing countries 2.2.1 Large and/or organized industry
Greece
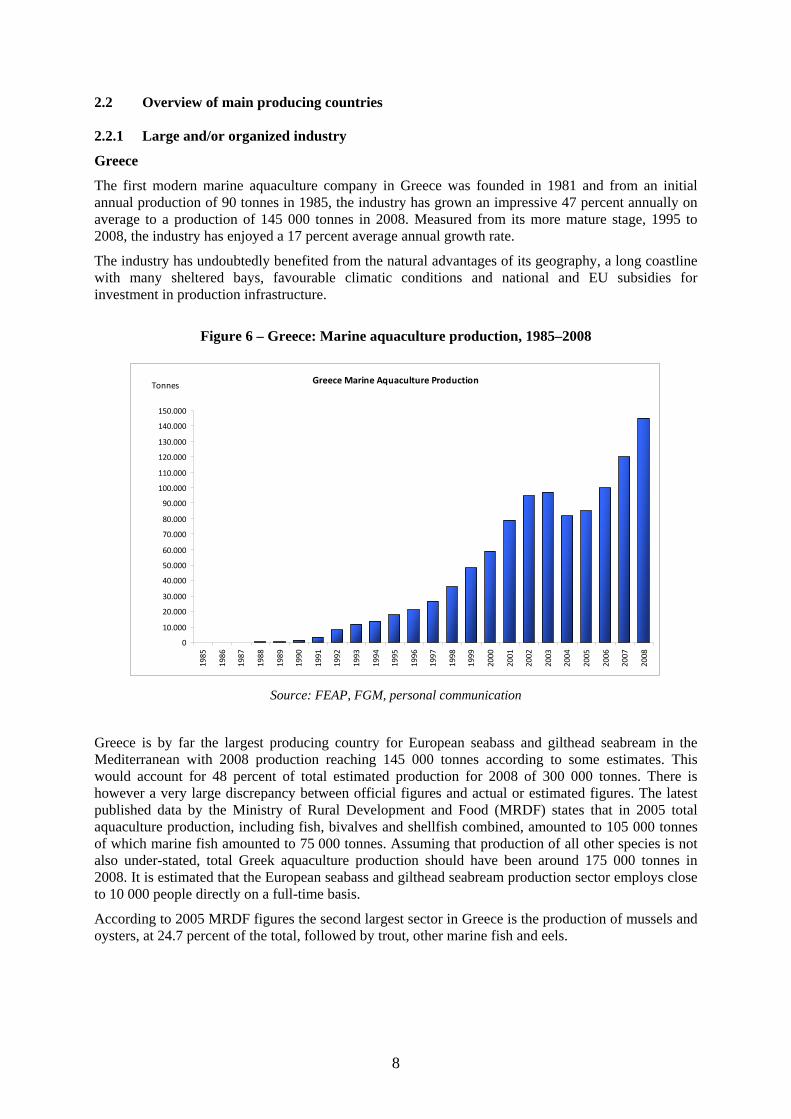
The first modern marine aquaculture company in Greece was founded in 1981 and from an initial annual production of 90 tonnes in 1985, the industry has grown an impressive 47 percent annually on average to a production of 145 000 tonnes in 2008. Measured from its more mature stage, 1995 to 2008, the industry has enjoyed a 17 percent average annual growth rate.
The industry has undoubtedly benefited from the natural advantages of its geography, a long coastline with many sheltered bays, favourable climatic conditions and national and EU subsidies for investment in production infrastructure.
Figure 6 – Greece: Marine aquaculture production, 1985–2008
Greece Marine Aquaculture Production
0
10.000
20.000
30.000
40.000
50.000
60.000
70.000
80.000
90.000
100.000
110.000
120.000
130.000
140.000
150.000
1985
1986
1987
1988
1989
1990
1991
1992
1993
1994
1995
1996
1997
1998
1999
2000
2001
2002
2003
2004
2005
2006
2007
2008
Tonnes
Source: FEAP, FGM, personal communication
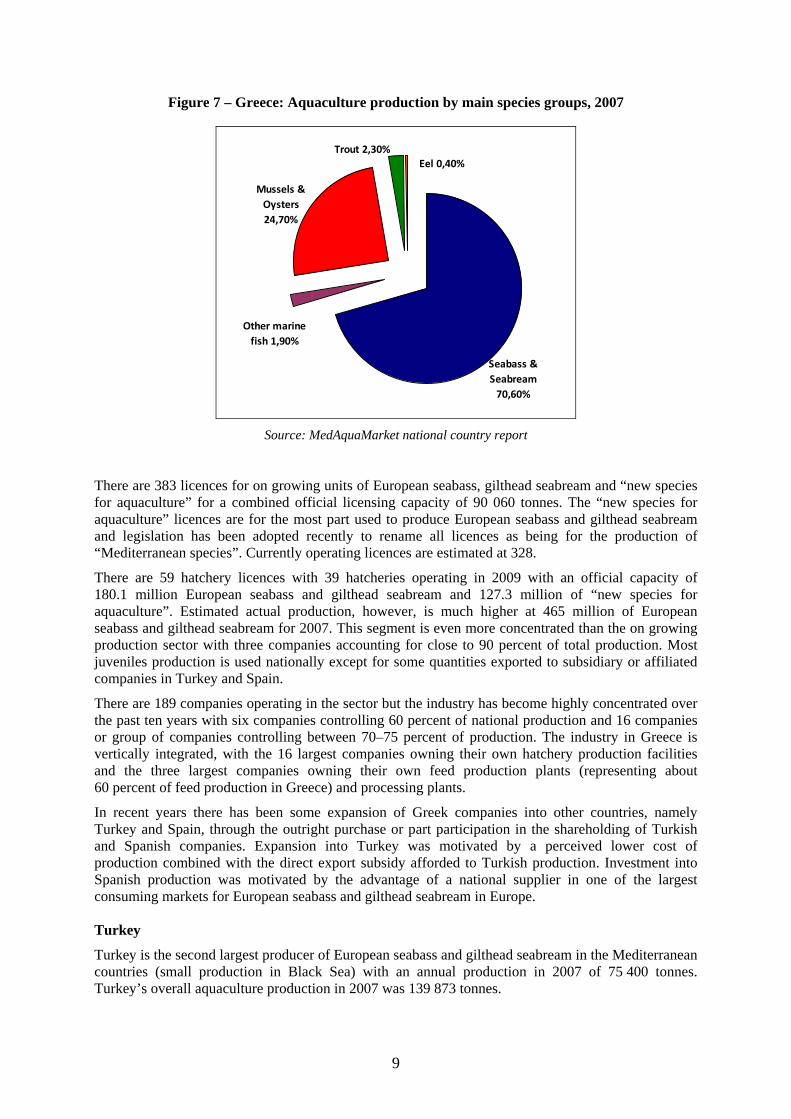
Greece is by far the largest producing country for European seabass and gilthead seabream in the Mediterranean with 2008 production reaching 145 000 tonnes according to some estimates. This would account for 48 percent of total estimated production for 2008 of 300 000 tonnes. There is however a very large discrepancy between official figures and actual or estimated figures. The latest published data by the Ministry of Rural Development and Food (MRDF) states that in 2005 total aquaculture production, including fish, bivalves and shellfish combined, amounted to 105 000 tonnes of which marine fish amounted to 75 000 tonnes. Assuming that production of all other species is not also under-stated, total Greek aquaculture production should have been around 175 000 tonnes in 2008. It is estimated that the European seabass and gilthead seabream production sector employs close to 10 000 people directly on a full-time basis.
According to 2005 MRDF figures the second largest sector in Greece is the production of mussels and oysters, at 24.7 percent of the total, followed by trout, other marine fish and eels.
9
Figure 7 – Greece: Aquaculture production by main species groups, 2007
Other marine fish 1,90%
Seabass & Seabream 70,60%
Mussels & Oysters 24,70%
Eel 0,40%Trout 2,30%
Source: MedAquaMarket national country report
There are 383 licences for on growing units of European seabass, gilthead seabream and “new species for aquaculture” for a combined official licensing capacity of 90 060 tonnes. The “new species for aquaculture” licences are for the most part used to produce European seabass and gilthead seabream and legislation has been adopted recently to rename all licences as being for the production of “Mediterranean species”. Currently operating licences are estimated at 328.
There are 59 hatchery licences with 39 hatcheries operating in 2009 with an official capacity of 180.1 million European seabass and gilthead seabream and 127.3 million of “new species for aquaculture”. Estimated actual production, however, is much higher at 465 million of European seabass and gilthead seabream for 2007. This segment is even more concentrated than the on growing production sector with three companies accounting for close to 90 percent of total production. Most juveniles production is used nationally except for some quantities exported to subsidiary or affiliated companies in Turkey and Spain.
There are 189 companies operating in the sector but the industry has become highly concentrated over the past ten years with six companies controlling 60 percent of national production and 16 companies or group of companies controlling between 70–75 percent of production. The industry in Greece is vertically integrated, with the 16 largest companies owning their own hatchery production facilities and the three largest companies owning their own feed production plants (representing about 60 percent of feed production in Greece) and processing plants.
In recent years there has been some expansion of Greek companies into other countries, namely Turkey and Spain, through the outright purchase or part participation in the shareholding of Turkish and Spanish companies. Expansion into Turkey was motivated by a perceived lower cost of production combined with the direct export subsidy afforded to Turkish production. Investment into Spanish production was motivated by the advantage of a national supplier in one of the largest consuming markets for European seabass and gilthead seabream in Europe. Turkey
Turkey is the second largest producer of European seabass and gilthead seabream in the Mediterranean countries (small production in Black Sea) with an annual production in 2007 of 75 400 tonnes. Turkey’s overall aquaculture production in 2007 was 139 873 tonnes.
10
The first aquaculture farm in Turkey, in inland waters for the culture of rainbow trout, was started in 1971 and today there are 1 715 operating farms with a production capacity of 199 360 tonnes per year of which 350 are marine farms with a production capacity of 110 840 tonnes. Marine aquaculture did not get started however until 1985 and the aquaculture sector as a whole developed mainly in the 1990s with the production of European seabass and gilthead seabream in the Mediterranean; rainbow trout, Atlantic salmon and European seabass in the Black Sea; mussels in the northern Aegean and the Sea of Marmara; and recently turbot in the Black Sea. It is estimated that the aquaculture sector in Turkey provides employment (direct and indirect) for about 25 000 people in mostly rural areas.
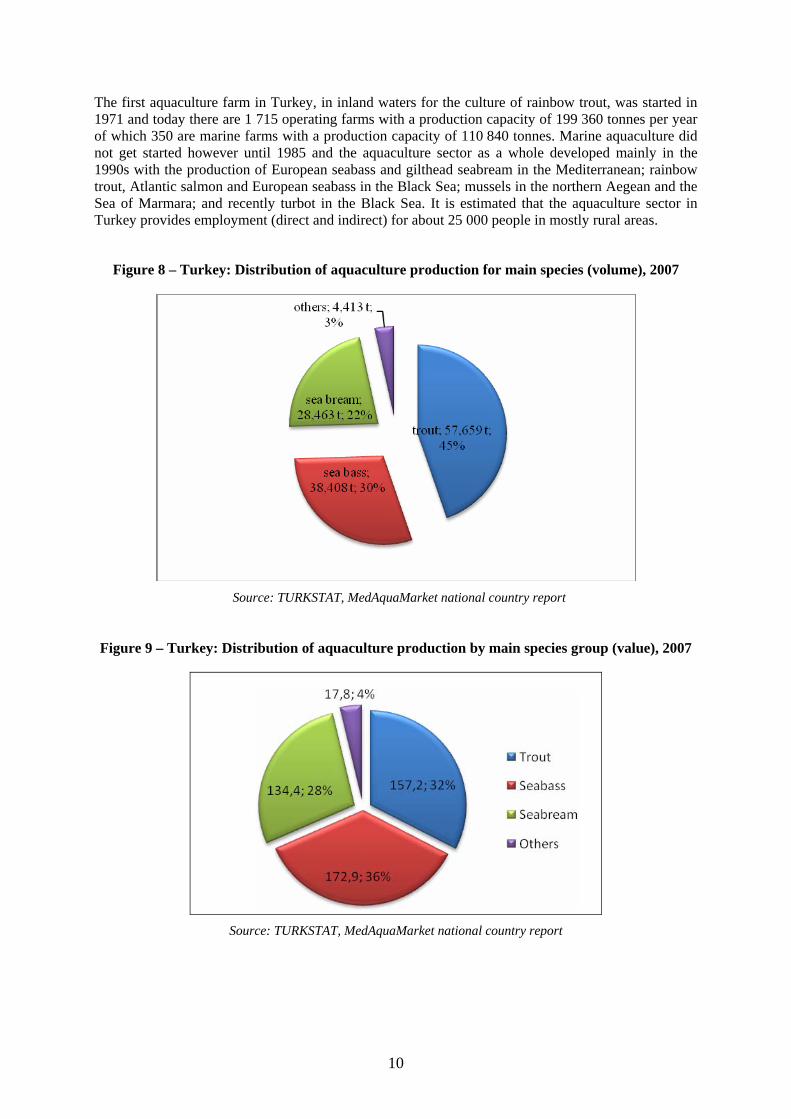
Figure 8 – Turkey: Distribution of aquaculture production for main species (volume), 2007
Source: TURKSTAT, MedAquaMarket national country report
Figure 9 – Turkey: Distribution of aquaculture production by main species group (value), 2007
Source: TURKSTAT, MedAquaMarket national country report
11
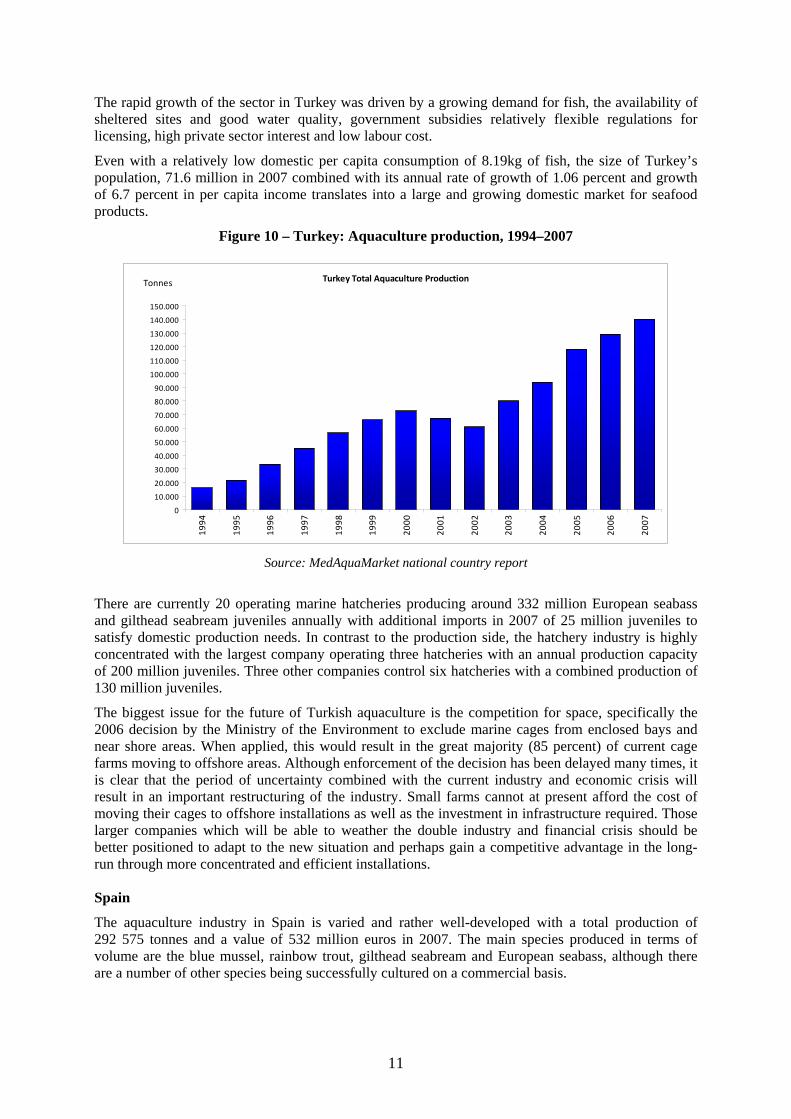
The rapid growth of the sector in Turkey was driven by a growing demand for fish, the availability of sheltered sites and good water quality, government subsidies relatively flexible regulations for licensing, high private sector interest and low labour cost.
Even with a relatively low domestic per capita consumption of 8.19kg of fish, the size of Turkey’s population, 71.6 million in 2007 combined with its annual rate of growth of 1.06 percent and growth of 6.7 percent in per capita income translates into a large and growing domestic market for seafood products.
Figure 10 – Turkey: Aquaculture production, 1994–2007
Turkey Total Aquaculture Production
0
10.000
20.000
30.000
40.000
50.000
60.000
70.000
80.000
90.000
100.000
110.000
120.000
130.000
140.000
150.000
1994
1995
1996
1997
1998
1999
2000
2001
2002
2003
2004
2005
2006
2007
Tonnes
Source: MedAquaMarket national country report
There are currently 20 operating marine hatcheries producing around 332 million European seabass and gilthead seabream juveniles annually with additional imports in 2007 of 25 million juveniles to satisfy domestic production needs. In contrast to the production side, the hatchery industry is highly concentrated with the largest company operating three hatcheries with an annual production capacity of 200 million juveniles. Three other companies control six hatcheries with a combined production of 130 million juveniles.
The biggest issue for the future of Turkish aquaculture is the competition for space, specifically the 2006 decision by the Ministry of the Environment to exclude marine cages from enclosed bays and near shore areas. When applied, this would result in the great majority (85 percent) of current cage farms moving to offshore areas. Although enforcement of the decision has been delayed many times, it is clear that the period of uncertainty combined with the current industry and economic crisis will result in an important restructuring of the industry. Small farms cannot at present afford the cost of moving their cages to offshore installations as well as the investment in infrastructure required. Those larger companies which will be able to weather the double industry and financial crisis should be better positioned to adapt to the new situation and perhaps gain a competitive advantage in the long-run through more concentrated and efficient installations. Spain
The aquaculture industry in Spain is varied and rather well-developed with a total production of 292 575 tonnes and a value of 532 million euros in 2007. The main species produced in terms of volume are the blue mussel, rainbow trout, gilthead seabream and European seabass, although there are a number of other species being successfully cultured on a commercial basis.
12
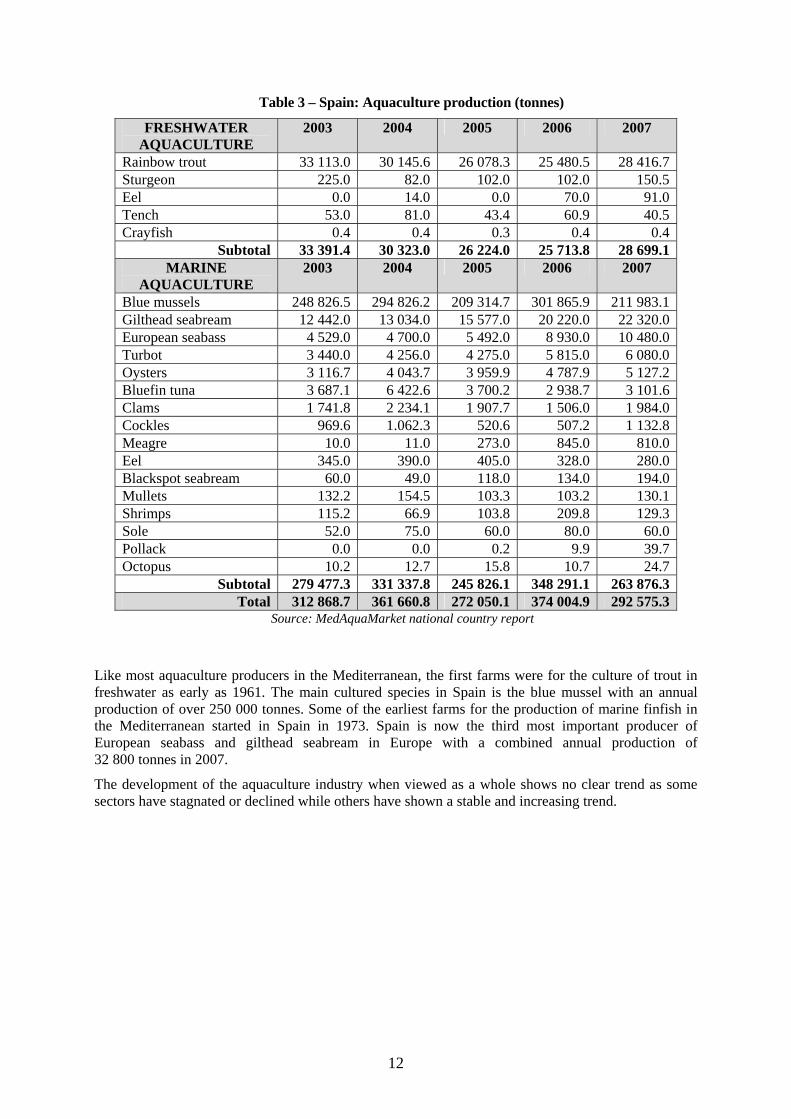
Table 3 – Spain: Aquaculture production (tonnes)
FRESHWATER AQUACULTURE
2003 2004 2005 2006 2007
Rainbow trout 33 113.0 30 145.6 26 078.3 25 480.5 28 416.7Sturgeon 225.0 82.0 102.0 102.0 150.5Eel 0.0 14.0 0.0 70.0 91.0Tench 53.0 81.0 43.4 60.9 40.5Crayfish 0.4 0.4 0.3 0.4 0.4
Subtotal 33 391.4 30 323.0 26 224.0 25 713.8 28 699.1MARINE
AQUACULTURE 2003 2004 2005 2006 2007
Blue mussels 248 826.5 294 826.2 209 314.7 301 865.9 211 983.1Gilthead seabream 12 442.0 13 034.0 15 577.0 20 220.0 22 320.0European seabass 4 529.0 4 700.0 5 492.0 8 930.0 10 480.0Turbot 3 440.0 4 256.0 4 275.0 5 815.0 6 080.0Oysters 3 116.7 4 043.7 3 959.9 4 787.9 5 127.2Bluefin tuna 3 687.1 6 422.6 3 700.2 2 938.7 3 101.6Clams 1 741.8 2 234.1 1 907.7 1 506.0 1 984.0Cockles 969.6 1.062.3 520.6 507.2 1 132.8Meagre 10.0 11.0 273.0 845.0 810.0Eel 345.0 390.0 405.0 328.0 280.0Blackspot seabream 60.0 49.0 118.0 134.0 194.0Mullets 132.2 154.5 103.3 103.2 130.1Shrimps 115.2 66.9 103.8 209.8 129.3Sole 52.0 75.0 60.0 80.0 60.0Pollack 0.0 0.0 0.2 9.9 39.7Octopus 10.2 12.7 15.8 10.7 24.7
Subtotal 279 477.3 331 337.8 245 826.1 348 291.1 263 876.3Total 312 868.7 361 660.8 272 050.1 374 004.9 292 575.3
Source: MedAquaMarket national country report
Like most aquaculture producers in the Mediterranean, the first farms were for the culture of trout in freshwater as early as 1961. The main cultured species in Spain is the blue mussel with an annual production of over 250 000 tonnes. Some of the earliest farms for the production of marine finfish in the Mediterranean started in Spain in 1973. Spain is now the third most important producer of European seabass and gilthead seabream in Europe with a combined annual production of 32 800 tonnes in 2007.
The development of the aquaculture industry when viewed as a whole shows no clear trend as some sectors have stagnated or declined while others have shown a stable and increasing trend.
13
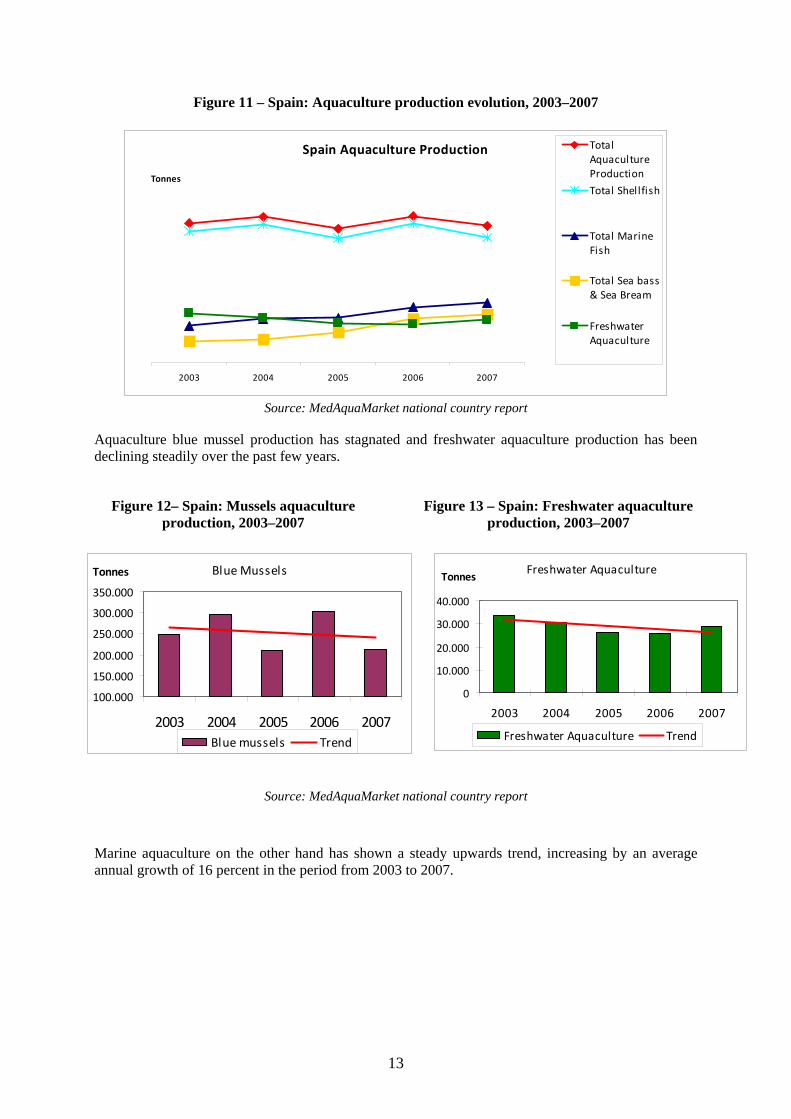
Figure 11 – Spain: Aquaculture production evolution, 2003–2007
Spain Aquaculture Production
2003 2004 2005 2006 2007
Tonnes
TotalAquacultureProduction
Total Shellfish
Total MarineFish
Total Sea bass& Sea Bream
FreshwaterAquaculture
Source: MedAquaMarket national country report
Aquaculture blue mussel production has stagnated and freshwater aquaculture production has been declining steadily over the past few years.
Figure 12– Spain: Mussels aquaculture production, 2003–2007
Figure 13 – Spain: Freshwater aquaculture production, 2003–2007
Source: MedAquaMarket national country report
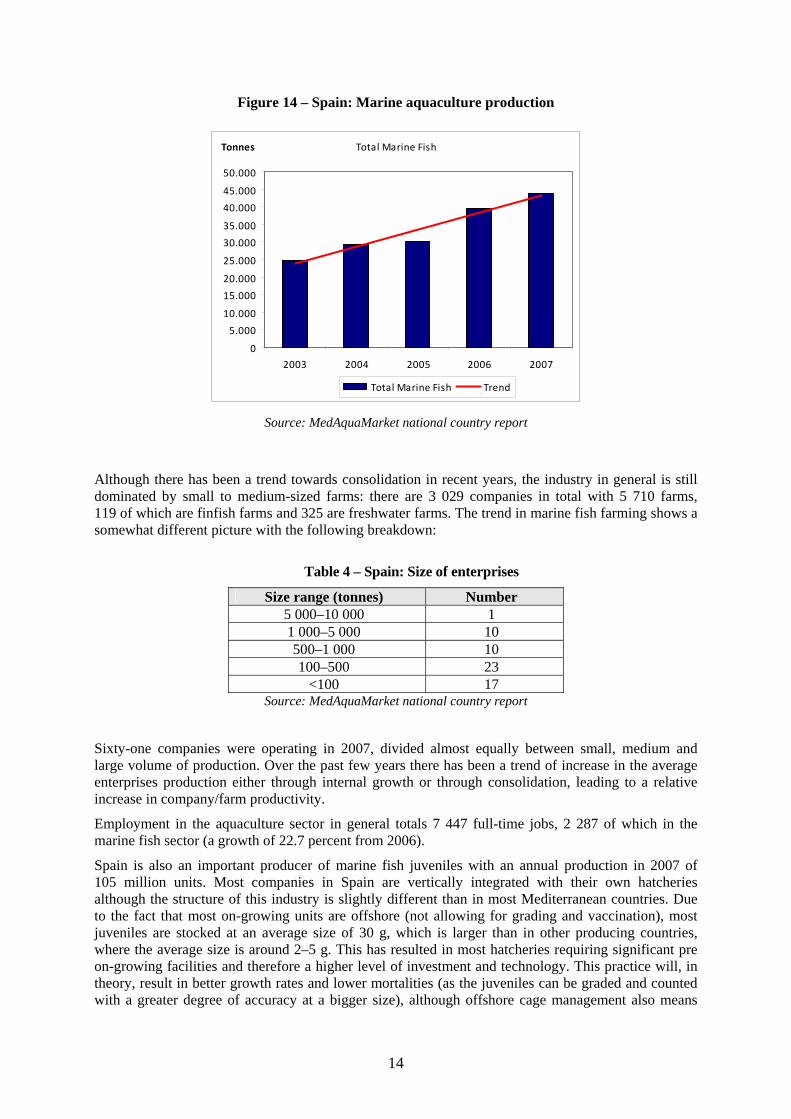
Marine aquaculture on the other hand has shown a steady upwards trend, increasing by an average annual growth of 16 percent in the period from 2003 to 2007.
Freshwater Aquaculture
0
10.000
20.000
30.000
40.000
2003 2004 2005 2006 2007
Tonnes
Freshwater Aquaculture Trend
Blue Mussels
100.000
150.000
200.000
250.000
300.000
350.000
2003 2004 2005 2006 2007
Tonnes
Blue mussels Trend
14
Figure 14 – Spain: Marine aquaculture production
Total Marine Fish
0
5.000
10.000
15.000
20.000
25.000
30.000
35.000
40.000
45.000
50.000
2003 2004 2005 2006 2007
Tonnes
Total Marine Fish Trend
Source: MedAquaMarket national country report
Although there has been a trend towards consolidation in recent years, the industry in general is still dominated by small to medium-sized farms: there are 3 029 companies in total with 5 710 farms, 119 of which are finfish farms and 325 are freshwater farms. The trend in marine fish farming shows a somewhat different picture with the following breakdown:
Table 4 – Spain: Size of enterprises
Size range (tonnes) Number 5 000–10 000 1 1 000–5 000 10 500–1 000 10 100–500 23
<100 17 Source: MedAquaMarket national country report
Sixty-one companies were operating in 2007, divided almost equally between small, medium and large volume of production. Over the past few years there has been a trend of increase in the average enterprises production either through internal growth or through consolidation, leading to a relative increase in company/farm productivity.
Employment in the aquaculture sector in general totals 7 447 full-time jobs, 2 287 of which in the marine fish sector (a growth of 22.7 percent from 2006).
Spain is also an important producer of marine fish juveniles with an annual production in 2007 of 105 million units. Most companies in Spain are vertically integrated with their own hatcheries although the structure of this industry is slightly different than in most Mediterranean countries. Due to the fact that most on-growing units are offshore (not allowing for grading and vaccination), most juveniles are stocked at an average size of 30 g, which is larger than in other producing countries, where the average size is around 2–5 g. This has resulted in most hatcheries requiring significant pre on-growing facilities and therefore a higher level of investment and technology. This practice will, in theory, result in better growth rates and lower mortalities (as the juveniles can be graded and counted with a greater degree of accuracy at a bigger size), although offshore cage management also means
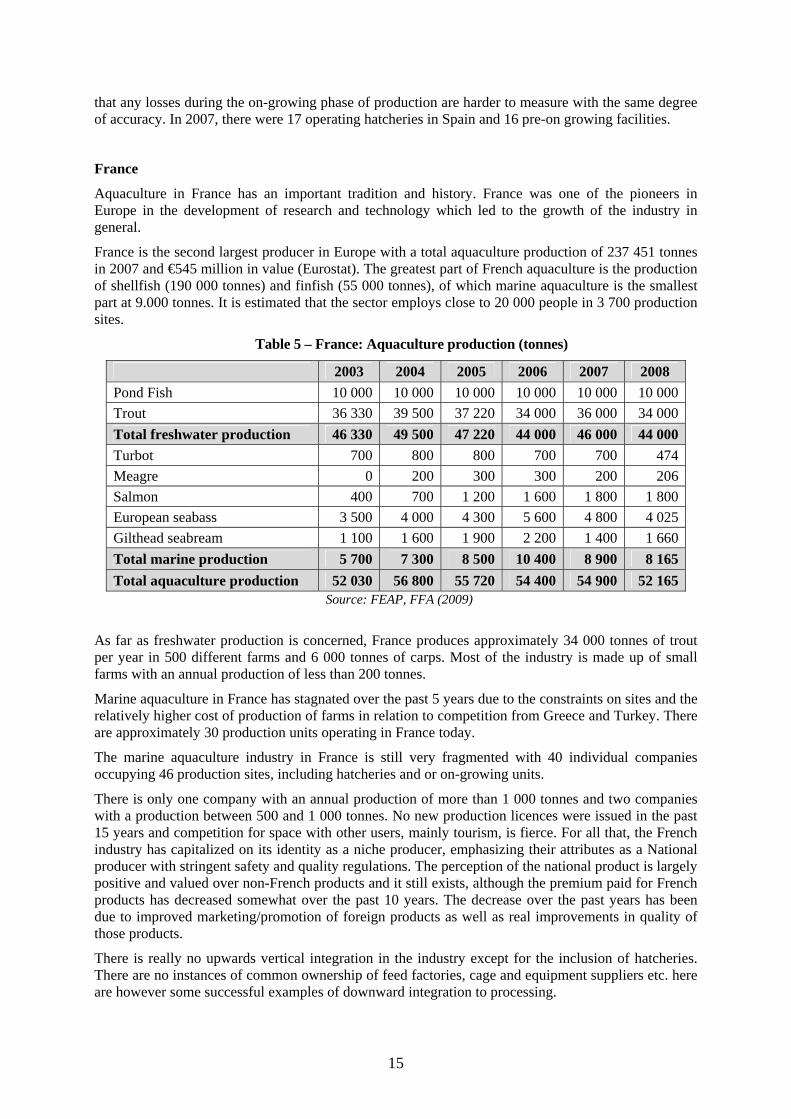
15
that any losses during the on-growing phase of production are harder to measure with the same degree of accuracy. In 2007, there were 17 operating hatcheries in Spain and 16 pre-on growing facilities.
France
Aquaculture in France has an important tradition and history. France was one of the pioneers in Europe in the development of research and technology which led to the growth of the industry in general.
France is the second largest producer in Europe with a total aquaculture production of 237 451 tonnes in 2007 and €545 million in value (Eurostat). The greatest part of French aquaculture is the production of shellfish (190 000 tonnes) and finfish (55 000 tonnes), of which marine aquaculture is the smallest part at 9.000 tonnes. It is estimated that the sector employs close to 20 000 people in 3 700 production sites.
Table 5 – France: Aquaculture production (tonnes)
2003 2004 2005 2006 2007 2008 Pond Fish 10 000 10 000 10 000 10 000 10 000 10 000Trout 36 330 39 500 37 220 34 000 36 000 34 000Total freshwater production 46 330 49 500 47 220 44 000 46 000 44 000Turbot 700 800 800 700 700 474Meagre 0 200 300 300 200 206Salmon 400 700 1 200 1 600 1 800 1 800European seabass 3 500 4 000 4 300 5 600 4 800 4 025Gilthead seabream 1 100 1 600 1 900 2 200 1 400 1 660Total marine production 5 700 7 300 8 500 10 400 8 900 8 165Total aquaculture production 52 030 56 800 55 720 54 400 54 900 52 165
Source: FEAP, FFA (2009)
As far as freshwater production is concerned, France produces approximately 34 000 tonnes of trout per year in 500 different farms and 6 000 tonnes of carps. Most of the industry is made up of small farms with an annual production of less than 200 tonnes.
Marine aquaculture in France has stagnated over the past 5 years due to the constraints on sites and the relatively higher cost of production of farms in relation to competition from Greece and Turkey. There are approximately 30 production units operating in France today.
The marine aquaculture industry in France is still very fragmented with 40 individual companies occupying 46 production sites, including hatcheries and or on-growing units.
There is only one company with an annual production of more than 1 000 tonnes and two companies with a production between 500 and 1 000 tonnes. No new production licences were issued in the past 15 years and competition for space with other users, mainly tourism, is fierce. For all that, the French industry has capitalized on its identity as a niche producer, emphasizing their attributes as a National producer with stringent safety and quality regulations. The perception of the national product is largely positive and valued over non-French products and it still exists, although the premium paid for French products has decreased somewhat over the past 10 years. The decrease over the past years has been due to improved marketing/promotion of foreign products as well as real improvements in quality of those products.
There is really no upwards vertical integration in the industry except for the inclusion of hatcheries. There are no instances of common ownership of feed factories, cage and equipment suppliers etc. here are however some successful examples of downward integration to processing.
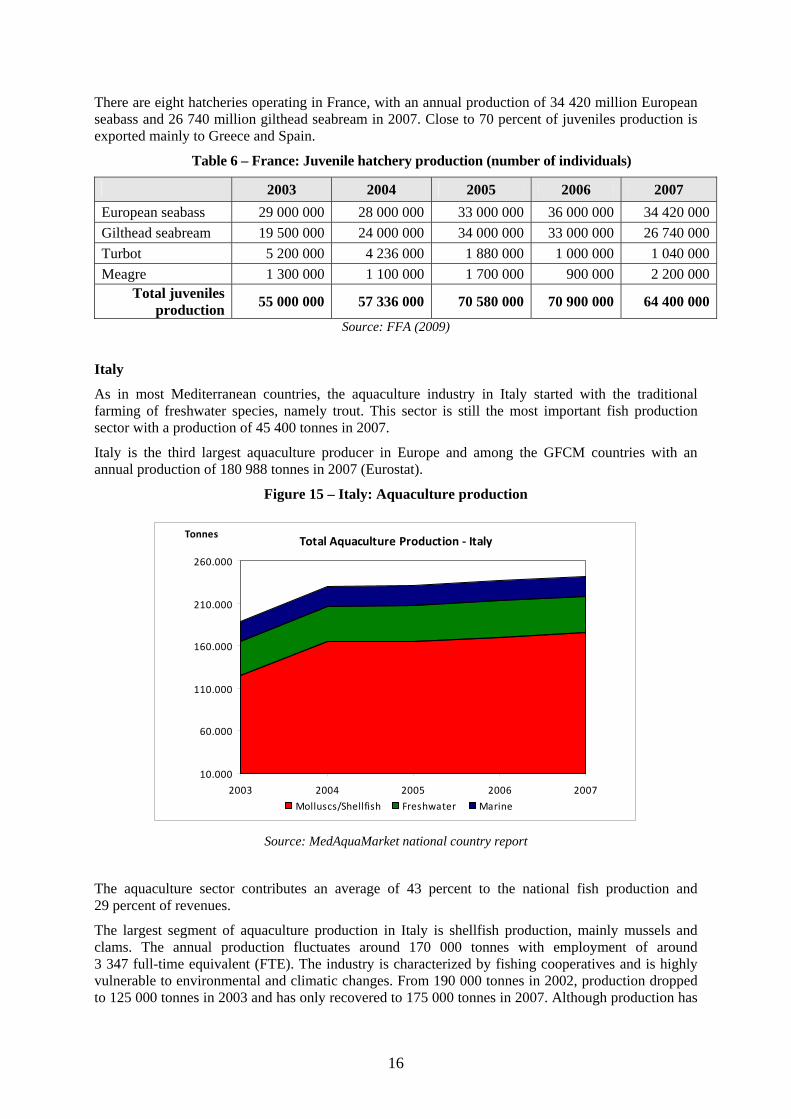
16
There are eight hatcheries operating in France, with an annual production of 34 420 million European seabass and 26 740 million gilthead seabream in 2007. Close to 70 percent of juveniles production is exported mainly to Greece and Spain.
Table 6 – France: Juvenile hatchery production (number of individuals)
2003 2004 2005 2006 2007 European seabass 29 000 000 28 000 000 33 000 000 36 000 000 34 420 000Gilthead seabream 19 500 000 24 000 000 34 000 000 33 000 000 26 740 000Turbot 5 200 000 4 236 000 1 880 000 1 000 000 1 040 000Meagre 1 300 000 1 100 000 1 700 000 900 000 2 200 000
Total juveniles production 55 000 000 57 336 000 70 580 000 70 900 000 64 400 000
Source: FFA (2009)
Italy
As in most Mediterranean countries, the aquaculture industry in Italy started with the traditional farming of freshwater species, namely trout. This sector is still the most important fish production sector with a production of 45 400 tonnes in 2007.
Italy is the third largest aquaculture producer in Europe and among the GFCM countries with an annual production of 180 988 tonnes in 2007 (Eurostat).
Figure 15 – Italy: Aquaculture production
Total Aquaculture Production ‐ Italy
10.000
60.000
110.000
160.000
210.000
260.000
2003 2004 2005 2006 2007
Tonnes
Molluscs/Shellfish Freshwater Marine
Source: MedAquaMarket national country report
The aquaculture sector contributes an average of 43 percent to the national fish production and 29 percent of revenues.
The largest segment of aquaculture production in Italy is shellfish production, mainly mussels and clams. The annual production fluctuates around 170 000 tonnes with employment of around 3 347 full-time equivalent (FTE). The industry is characterized by fishing cooperatives and is highly vulnerable to environmental and climatic changes. From 190 000 tonnes in 2002, production dropped to 125 000 tonnes in 2003 and has only recovered to 175 000 tonnes in 2007. Although production has
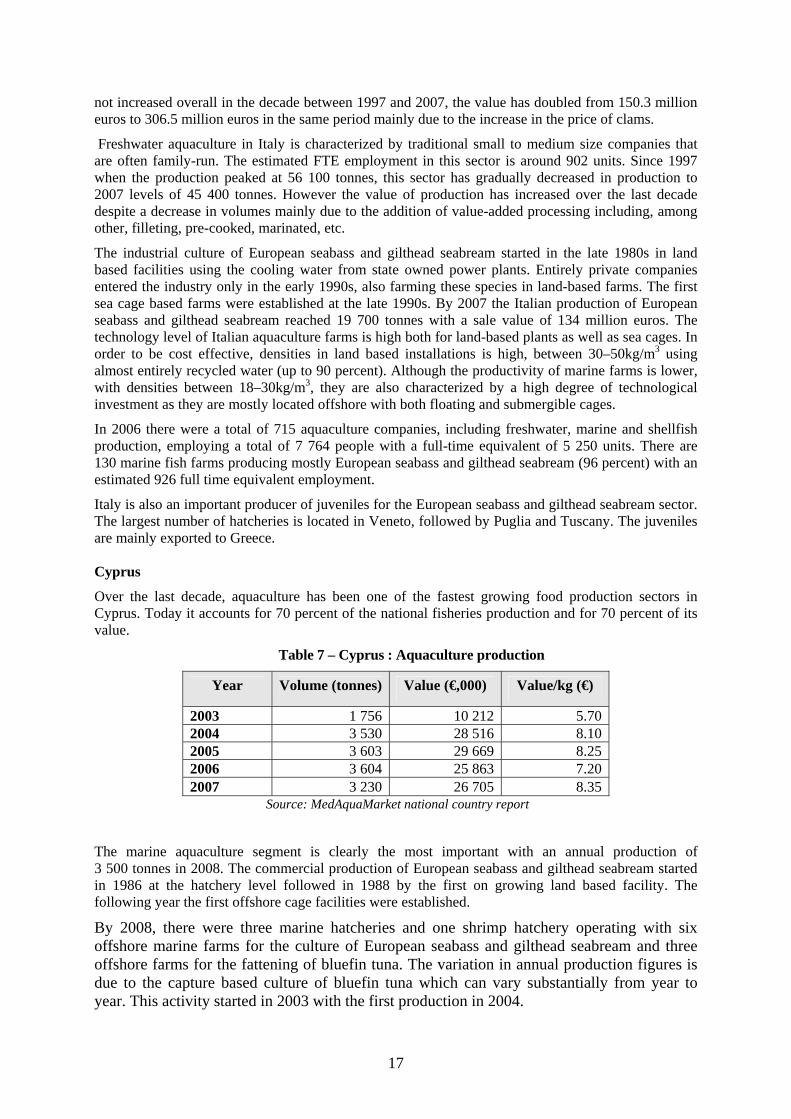
17
not increased overall in the decade between 1997 and 2007, the value has doubled from 150.3 million euros to 306.5 million euros in the same period mainly due to the increase in the price of clams.
Freshwater aquaculture in Italy is characterized by traditional small to medium size companies that are often family-run. The estimated FTE employment in this sector is around 902 units. Since 1997 when the production peaked at 56 100 tonnes, this sector has gradually decreased in production to 2007 levels of 45 400 tonnes. However the value of production has increased over the last decade despite a decrease in volumes mainly due to the addition of value-added processing including, among other, filleting, pre-cooked, marinated, etc.
The industrial culture of European seabass and gilthead seabream started in the late 1980s in land based facilities using the cooling water from state owned power plants. Entirely private companies entered the industry only in the early 1990s, also farming these species in land-based farms. The first sea cage based farms were established at the late 1990s. By 2007 the Italian production of European seabass and gilthead seabream reached 19 700 tonnes with a sale value of 134 million euros. The technology level of Italian aquaculture farms is high both for land-based plants as well as sea cages. In order to be cost effective, densities in land based installations is high, between 30–50kg/m3 using almost entirely recycled water (up to 90 percent). Although the productivity of marine farms is lower, with densities between 18–30kg/m3, they are also characterized by a high degree of technological investment as they are mostly located offshore with both floating and submergible cages.
In 2006 there were a total of 715 aquaculture companies, including freshwater, marine and shellfish production, employing a total of 7 764 people with a full-time equivalent of 5 250 units. There are 130 marine fish farms producing mostly European seabass and gilthead seabream (96 percent) with an estimated 926 full time equivalent employment.
Italy is also an important producer of juveniles for the European seabass and gilthead seabream sector. The largest number of hatcheries is located in Veneto, followed by Puglia and Tuscany. The juveniles are mainly exported to Greece. Cyprus
Over the last decade, aquaculture has been one of the fastest growing food production sectors in Cyprus. Today it accounts for 70 percent of the national fisheries production and for 70 percent of its value.
Table 7 – Cyprus : Aquaculture production
Year Volume (tonnes) Value (€,000) Value/kg (€)
2003 1 756 10 212 5.70 2004 3 530 28 516 8.10 2005 3 603 29 669 8.25 2006 3 604 25 863 7.20 2007 3 230 26 705 8.35
Source: MedAquaMarket national country report
The marine aquaculture segment is clearly the most important with an annual production of 3 500 tonnes in 2008. The commercial production of European seabass and gilthead seabream started in 1986 at the hatchery level followed in 1988 by the first on growing land based facility. The following year the first offshore cage facilities were established.
By 2008, there were three marine hatcheries and one shrimp hatchery operating with six offshore marine farms for the culture of European seabass and gilthead seabream and three offshore farms for the fattening of bluefin tuna. The variation in annual production figures is due to the capture based culture of bluefin tuna which can vary substantially from year to year. This activity started in 2003 with the first production in 2004.
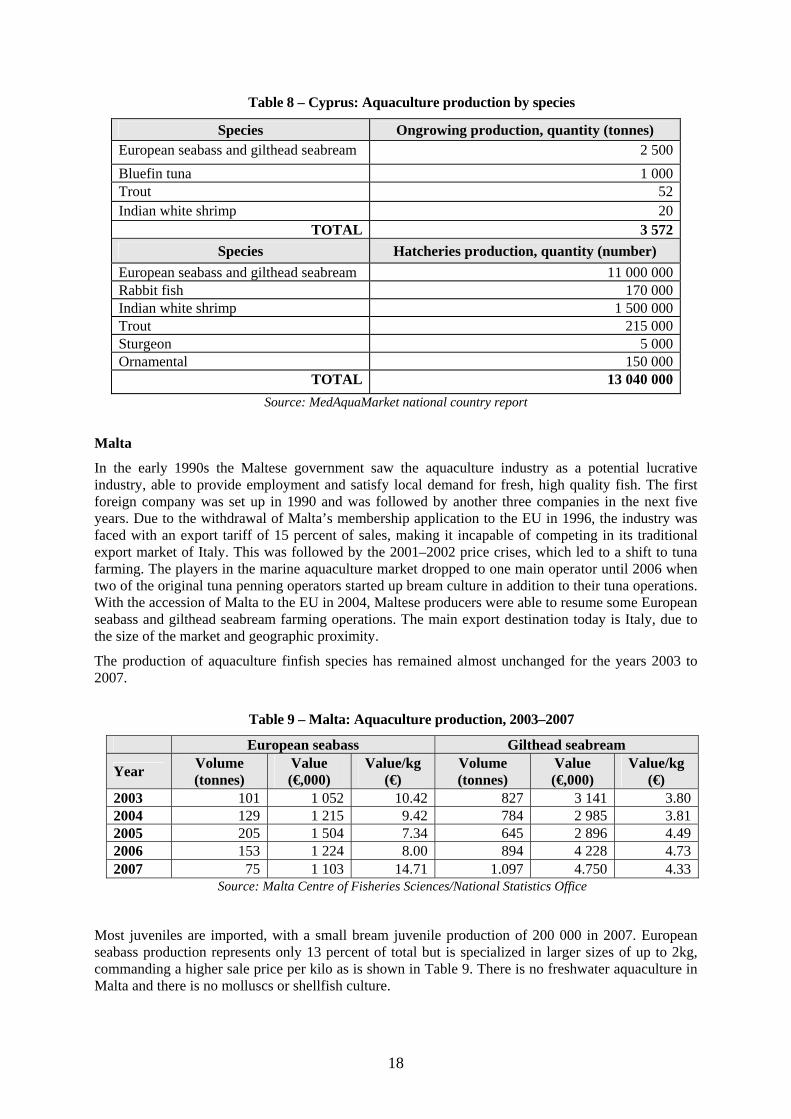
18
Table 8 – Cyprus: Aquaculture production by species
Species Ongrowing production, quantity (tonnes) European seabass and gilthead seabream 2 500Bluefin tuna 1 000Trout 52Indian white shrimp 20
TOTAL 3 572Species Hatcheries production, quantity (number)
European seabass and gilthead seabream 11 000 000Rabbit fish 170 000Indian white shrimp 1 500 000Trout 215 000Sturgeon 5 000Ornamental 150 000
TOTAL 13 040 000Source: MedAquaMarket national country report
Malta
In the early 1990s the Maltese government saw the aquaculture industry as a potential lucrative industry, able to provide employment and satisfy local demand for fresh, high quality fish. The first foreign company was set up in 1990 and was followed by another three companies in the next five years. Due to the withdrawal of Malta’s membership application to the EU in 1996, the industry was faced with an export tariff of 15 percent of sales, making it incapable of competing in its traditional export market of Italy. This was followed by the 2001–2002 price crises, which led to a shift to tuna farming. The players in the marine aquaculture market dropped to one main operator until 2006 when two of the original tuna penning operators started up bream culture in addition to their tuna operations. With the accession of Malta to the EU in 2004, Maltese producers were able to resume some European seabass and gilthead seabream farming operations. The main export destination today is Italy, due to the size of the market and geographic proximity.
The production of aquaculture finfish species has remained almost unchanged for the years 2003 to 2007.
Table 9 – Malta: Aquaculture production, 2003–2007
European seabass Gilthead seabream
Year Volume (tonnes)
Value (€,000)
Value/kg (€)
Volume (tonnes)
Value (€,000)
Value/kg (€)
2003 101 1 052 10.42 827 3 141 3.802004 129 1 215 9.42 784 2 985 3.812005 205 1 504 7.34 645 2 896 4.492006 153 1 224 8.00 894 4 228 4.732007 75 1 103 14.71 1.097 4.750 4.33
Source: Malta Centre of Fisheries Sciences/National Statistics Office
Most juveniles are imported, with a small bream juvenile production of 200 000 in 2007. European seabass production represents only 13 percent of total but is specialized in larger sizes of up to 2kg, commanding a higher sale price per kilo as is shown in Table 9. There is no freshwater aquaculture in Malta and there is no molluscs or shellfish culture.
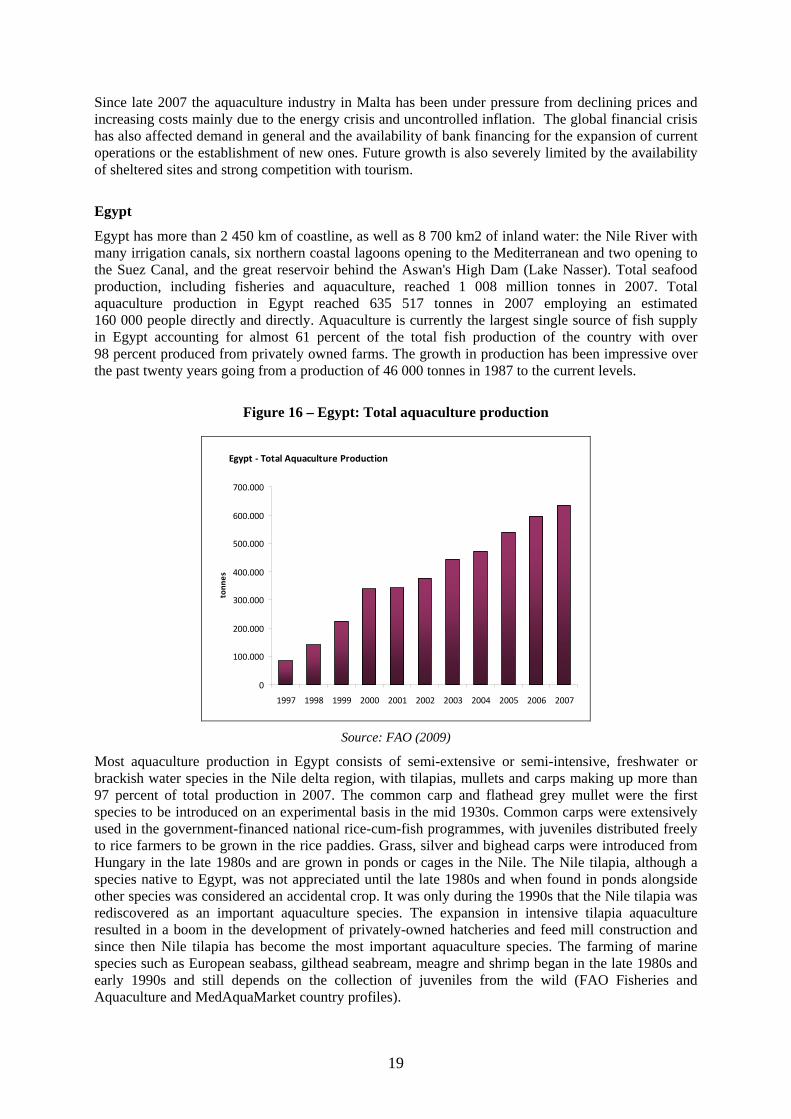
19
Since late 2007 the aquaculture industry in Malta has been under pressure from declining prices and increasing costs mainly due to the energy crisis and uncontrolled inflation. The global financial crisis has also affected demand in general and the availability of bank financing for the expansion of current operations or the establishment of new ones. Future growth is also severely limited by the availability of sheltered sites and strong competition with tourism.
Egypt
Egypt has more than 2 450 km of coastline, as well as 8 700 km2 of inland water: the Nile River with many irrigation canals, six northern coastal lagoons opening to the Mediterranean and two opening to the Suez Canal, and the great reservoir behind the Aswan's High Dam (Lake Nasser). Total seafood production, including fisheries and aquaculture, reached 1 008 million tonnes in 2007. Total aquaculture production in Egypt reached 635 517 tonnes in 2007 employing an estimated 160 000 people directly and directly. Aquaculture is currently the largest single source of fish supply in Egypt accounting for almost 61 percent of the total fish production of the country with over 98 percent produced from privately owned farms. The growth in production has been impressive over the past twenty years going from a production of 46 000 tonnes in 1987 to the current levels.
Figure 16 – Egypt: Total aquaculture production
Egypt ‐ Total Aquaculture Production
0
100.000
200.000
300.000
400.000
500.000
600.000
700.000
1997 1998 1999 2000 2001 2002 2003 2004 2005 2006 2007
tonn
es
Source: FAO (2009)
Most aquaculture production in Egypt consists of semi-extensive or semi-intensive, freshwater or brackish water species in the Nile delta region, with tilapias, mullets and carps making up more than 97 percent of total production in 2007. The common carp and flathead grey mullet were the first species to be introduced on an experimental basis in the mid 1930s. Common carps were extensively used in the government-financed national rice-cum-fish programmes, with juveniles distributed freely to rice farmers to be grown in the rice paddies. Grass, silver and bighead carps were introduced from Hungary in the late 1980s and are grown in ponds or cages in the Nile. The Nile tilapia, although a species native to Egypt, was not appreciated until the late 1980s and when found in ponds alongside other species was considered an accidental crop. It was only during the 1990s that the Nile tilapia was rediscovered as an important aquaculture species. The expansion in intensive tilapia aquaculture resulted in a boom in the development of privately-owned hatcheries and feed mill construction and since then Nile tilapia has become the most important aquaculture species. The farming of marine species such as European seabass, gilthead seabream, meagre and shrimp began in the late 1980s and early 1990s and still depends on the collection of juveniles from the wild (FAO Fisheries and Aquaculture and MedAquaMarket country profiles).
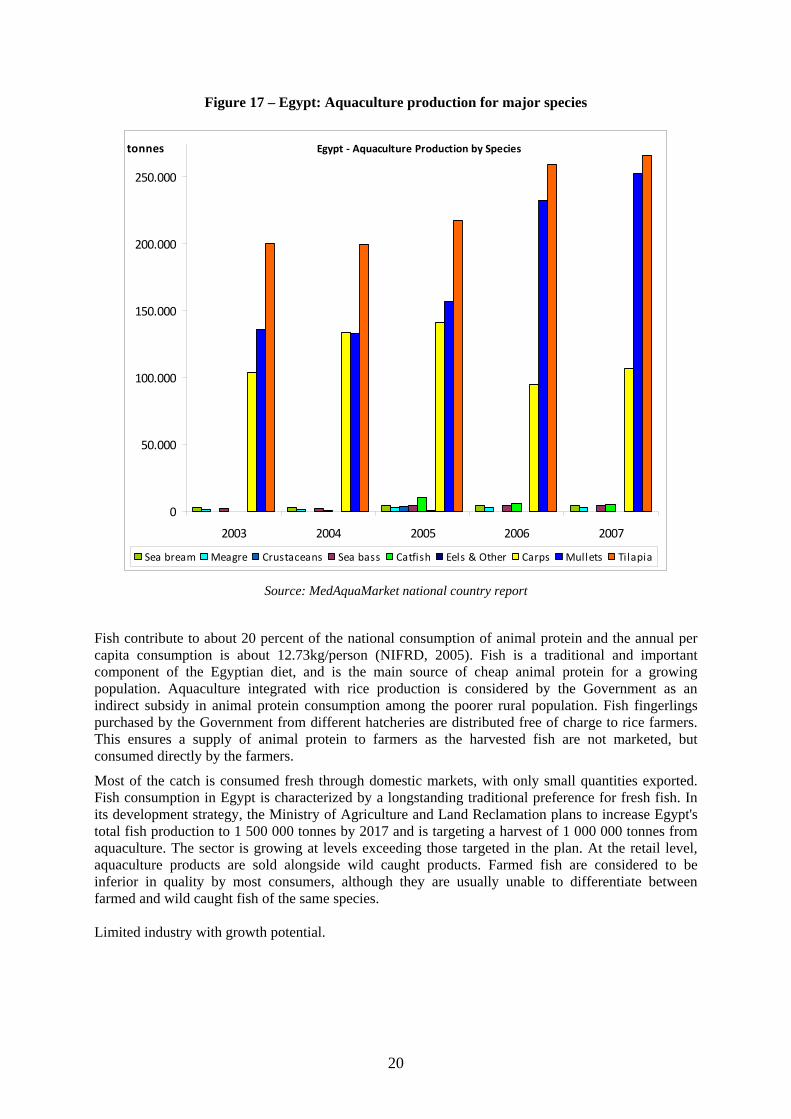
20
Figure 17 – Egypt: Aquaculture production for major species
Egypt ‐ Aquaculture Production by Species
0
50.000
100.000
150.000
200.000
250.000
2003 2004 2005 2006 2007
tonnes
Sea bream Meagre Crustaceans Sea bass Catfish Eels & Other Carps Mullets Tilapia
Source: MedAquaMarket national country report
Fish contribute to about 20 percent of the national consumption of animal protein and the annual per capita consumption is about 12.73kg/person (NIFRD, 2005). Fish is a traditional and important component of the Egyptian diet, and is the main source of cheap animal protein for a growing population. Aquaculture integrated with rice production is considered by the Government as an indirect subsidy in animal protein consumption among the poorer rural population. Fish fingerlings purchased by the Government from different hatcheries are distributed free of charge to rice farmers. This ensures a supply of animal protein to farmers as the harvested fish are not marketed, but consumed directly by the farmers.
Most of the catch is consumed fresh through domestic markets, with only small quantities exported. Fish consumption in Egypt is characterized by a longstanding traditional preference for fresh fish. In its development strategy, the Ministry of Agriculture and Land Reclamation plans to increase Egypt's total fish production to 1 500 000 tonnes by 2017 and is targeting a harvest of 1 000 000 tonnes from aquaculture. The sector is growing at levels exceeding those targeted in the plan. At the retail level, aquaculture products are sold alongside wild caught products. Farmed fish are considered to be inferior in quality by most consumers, although they are usually unable to differentiate between farmed and wild caught fish of the same species. Limited industry with growth potential.
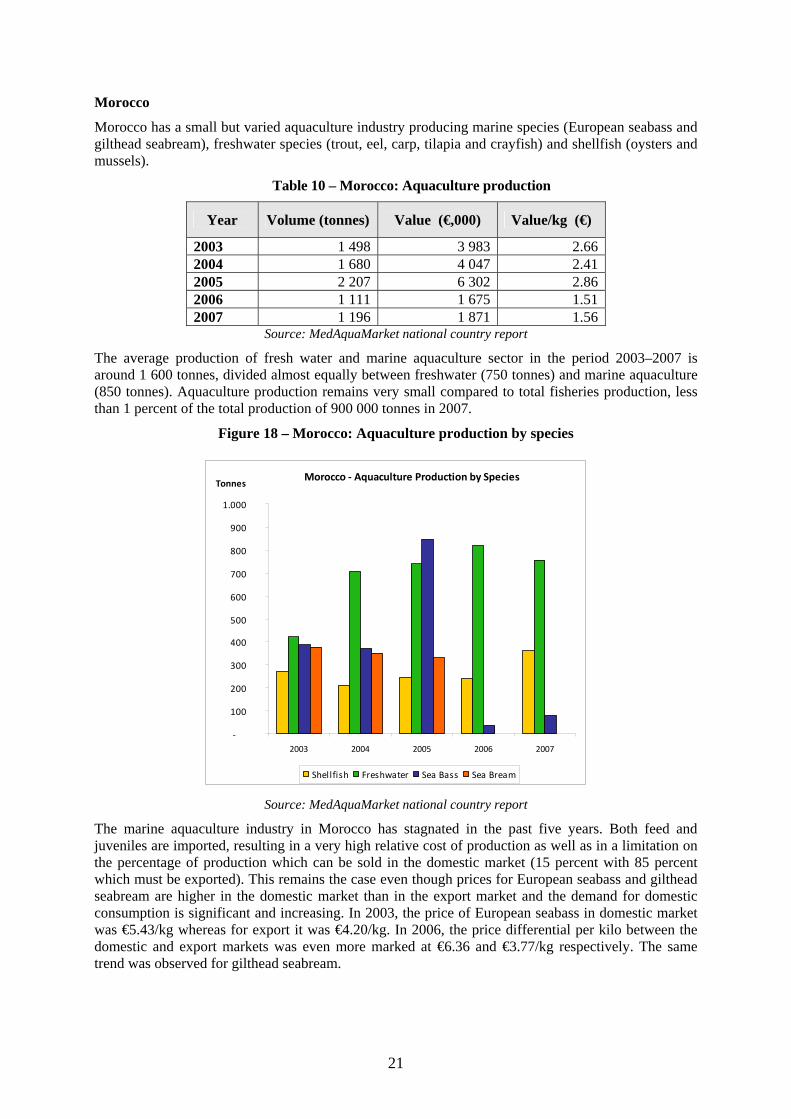
21
Morocco
Morocco has a small but varied aquaculture industry producing marine species (European seabass and gilthead seabream), freshwater species (trout, eel, carp, tilapia and crayfish) and shellfish (oysters and mussels).
Table 10 – Morocco: Aquaculture production
Year Volume (tonnes) Value (€,000) Value/kg (€)
2003 1 498 3 983 2.66 2004 1 680 4 047 2.41 2005 2 207 6 302 2.86 2006 1 111 1 675 1.51 2007 1 196 1 871 1.56
Source: MedAquaMarket national country report
The average production of fresh water and marine aquaculture sector in the period 2003–2007 is around 1 600 tonnes, divided almost equally between freshwater (750 tonnes) and marine aquaculture (850 tonnes). Aquaculture production remains very small compared to total fisheries production, less than 1 percent of the total production of 900 000 tonnes in 2007.
Figure 18 – Morocco: Aquaculture production by species
Morocco ‐ Aquaculture Production by Species
‐
100
200
300
400
500
600
700
800
900
1.000
2003 2004 2005 2006 2007
Tonnes
Shellfish Freshwater Sea Bass Sea Bream
Source: MedAquaMarket national country report
The marine aquaculture industry in Morocco has stagnated in the past five years. Both feed and juveniles are imported, resulting in a very high relative cost of production as well as in a limitation on the percentage of production which can be sold in the domestic market (15 percent with 85 percent which must be exported). This remains the case even though prices for European seabass and gilthead seabream are higher in the domestic market than in the export market and the demand for domestic consumption is significant and increasing. In 2003, the price of European seabass in domestic market was €5.43/kg whereas for export it was €4.20/kg. In 2006, the price differential per kilo between the domestic and export markets was even more marked at €6.36 and €3.77/kg respectively. The same trend was observed for gilthead seabream.
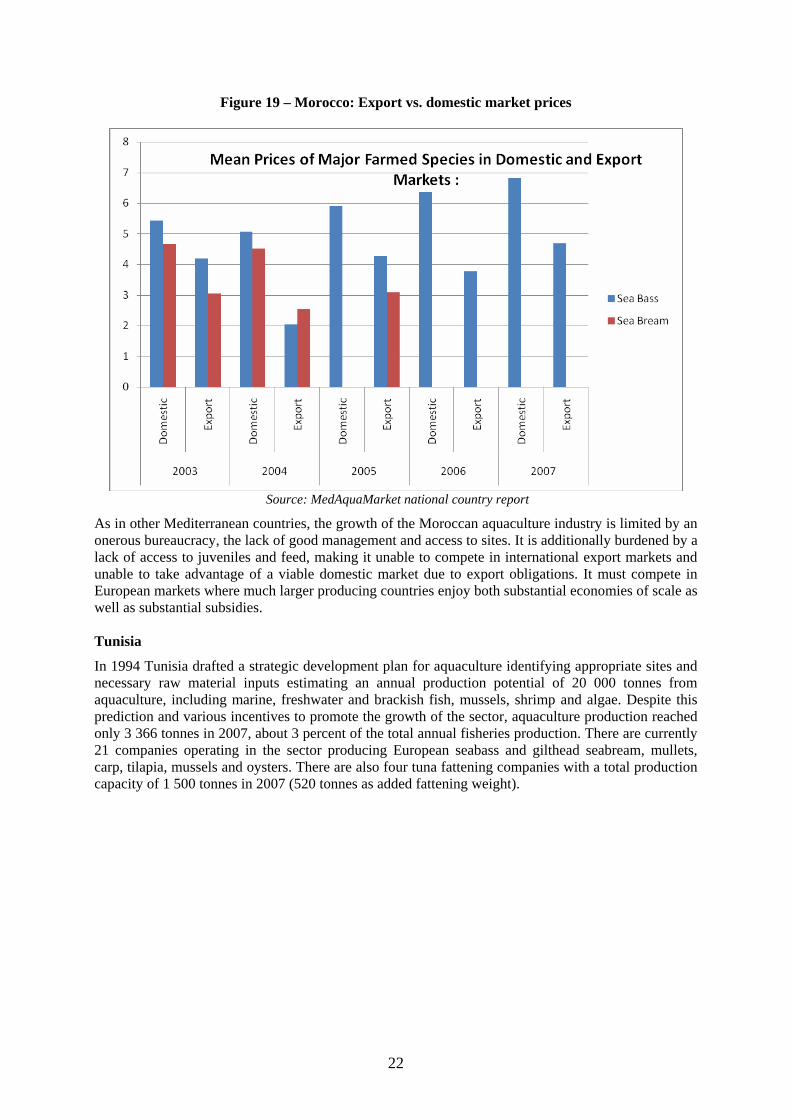
22
Figure 19 – Morocco: Export vs. domestic market prices
Source: MedAquaMarket national country report
As in other Mediterranean countries, the growth of the Moroccan aquaculture industry is limited by an onerous bureaucracy, the lack of good management and access to sites. It is additionally burdened by a lack of access to juveniles and feed, making it unable to compete in international export markets and unable to take advantage of a viable domestic market due to export obligations. It must compete in European markets where much larger producing countries enjoy both substantial economies of scale as well as substantial subsidies. Tunisia
In 1994 Tunisia drafted a strategic development plan for aquaculture identifying appropriate sites and necessary raw material inputs estimating an annual production potential of 20 000 tonnes from aquaculture, including marine, freshwater and brackish fish, mussels, shrimp and algae. Despite this prediction and various incentives to promote the growth of the sector, aquaculture production reached only 3 366 tonnes in 2007, about 3 percent of the total annual fisheries production. There are currently 21 companies operating in the sector producing European seabass and gilthead seabream, mullets, carp, tilapia, mussels and oysters. There are also four tuna fattening companies with a total production capacity of 1 500 tonnes in 2007 (520 tonnes as added fattening weight).
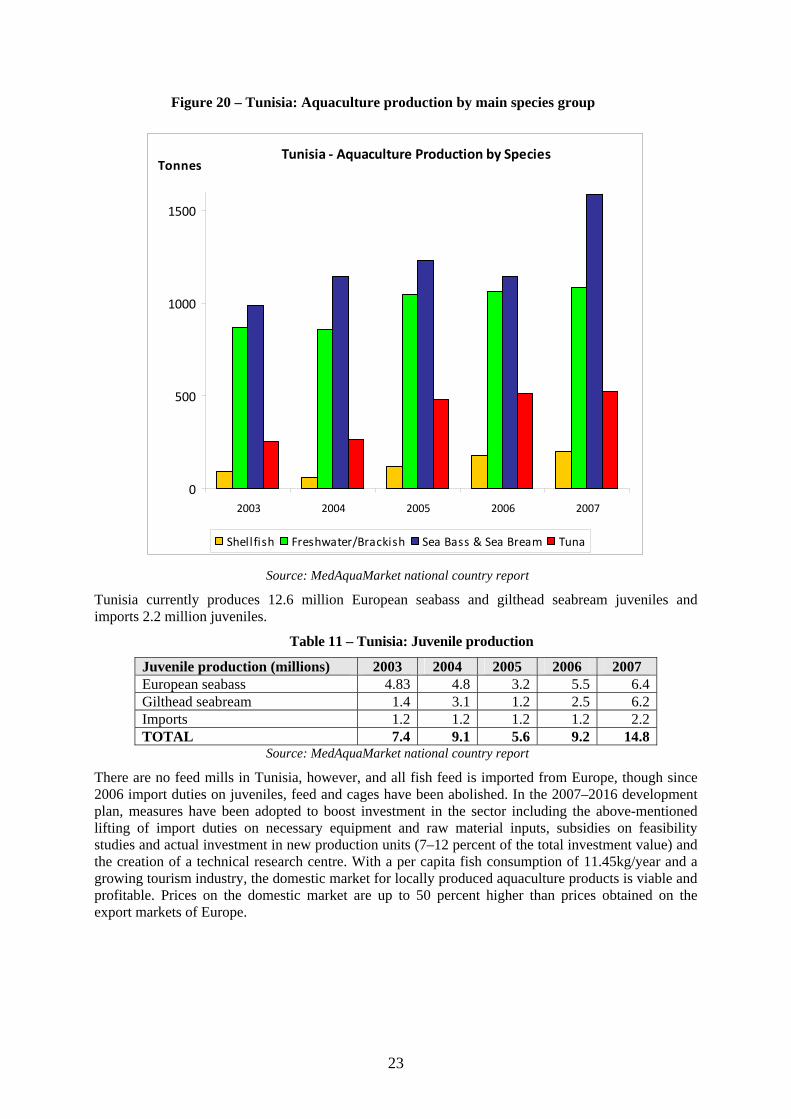
23
Figure 20 – Tunisia: Aquaculture production by main species group
Tunisia ‐ Aquaculture Production by Species
0
500
1000
1500
2003 2004 2005 2006 2007
Tonnes
Shellfish Freshwater/Brackish Sea Bass & Sea Bream Tuna
Source: MedAquaMarket national country report
Tunisia currently produces 12.6 million European seabass and gilthead seabream juveniles and imports 2.2 million juveniles.
Table 11 – Tunisia: Juvenile production
Juvenile production (millions) 2003 2004 2005 2006 2007 European seabass 4.83 4.8 3.2 5.5 6.4 Gilthead seabream 1.4 3.1 1.2 2.5 6.2 Imports 1.2 1.2 1.2 1.2 2.2 TOTAL 7.4 9.1 5.6 9.2 14.8
Source: MedAquaMarket national country report
There are no feed mills in Tunisia, however, and all fish feed is imported from Europe, though since 2006 import duties on juveniles, feed and cages have been abolished. In the 2007–2016 development plan, measures have been adopted to boost investment in the sector including the above-mentioned lifting of import duties on necessary equipment and raw material inputs, subsidies on feasibility studies and actual investment in new production units (7–12 percent of the total investment value) and the creation of a technical research centre. With a per capita fish consumption of 11.45kg/year and a growing tourism industry, the domestic market for locally produced aquaculture products is viable and profitable. Prices on the domestic market are up to 50 percent higher than prices obtained on the export markets of Europe.
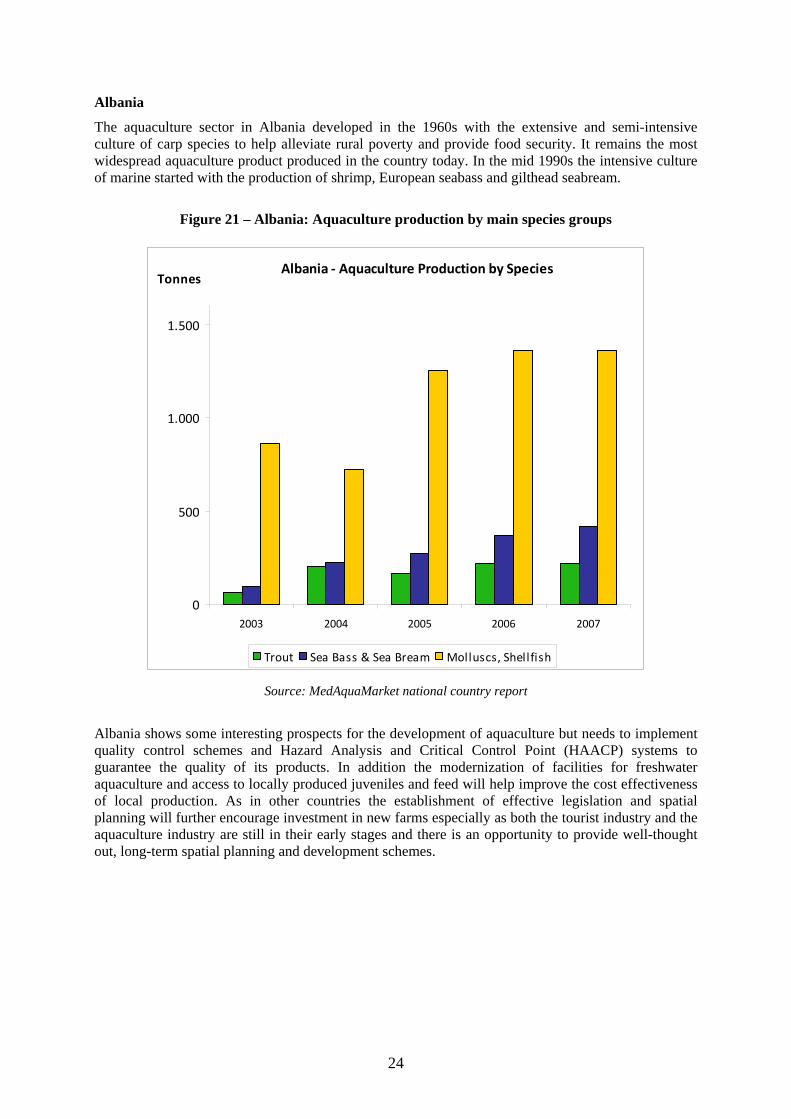
24
Albania
The aquaculture sector in Albania developed in the 1960s with the extensive and semi-intensive culture of carp species to help alleviate rural poverty and provide food security. It remains the most widespread aquaculture product produced in the country today. In the mid 1990s the intensive culture of marine started with the production of shrimp, European seabass and gilthead seabream.
Figure 21 – Albania: Aquaculture production by main species groups
Albania ‐ Aquaculture Production by Species
0
500
1.000
1.500
2003 2004 2005 2006 2007
Tonnes
Trout Sea Bass & Sea Bream Molluscs, Shellfish
Source: MedAquaMarket national country report
Albania shows some interesting prospects for the development of aquaculture but needs to implement quality control schemes and Hazard Analysis and Critical Control Point (HAACP) systems to guarantee the quality of its products. In addition the modernization of facilities for freshwater aquaculture and access to locally produced juveniles and feed will help improve the cost effectiveness of local production. As in other countries the establishment of effective legislation and spatial planning will further encourage investment in new farms especially as both the tourist industry and the aquaculture industry are still in their early stages and there is an opportunity to provide well-thought out, long-term spatial planning and development schemes.
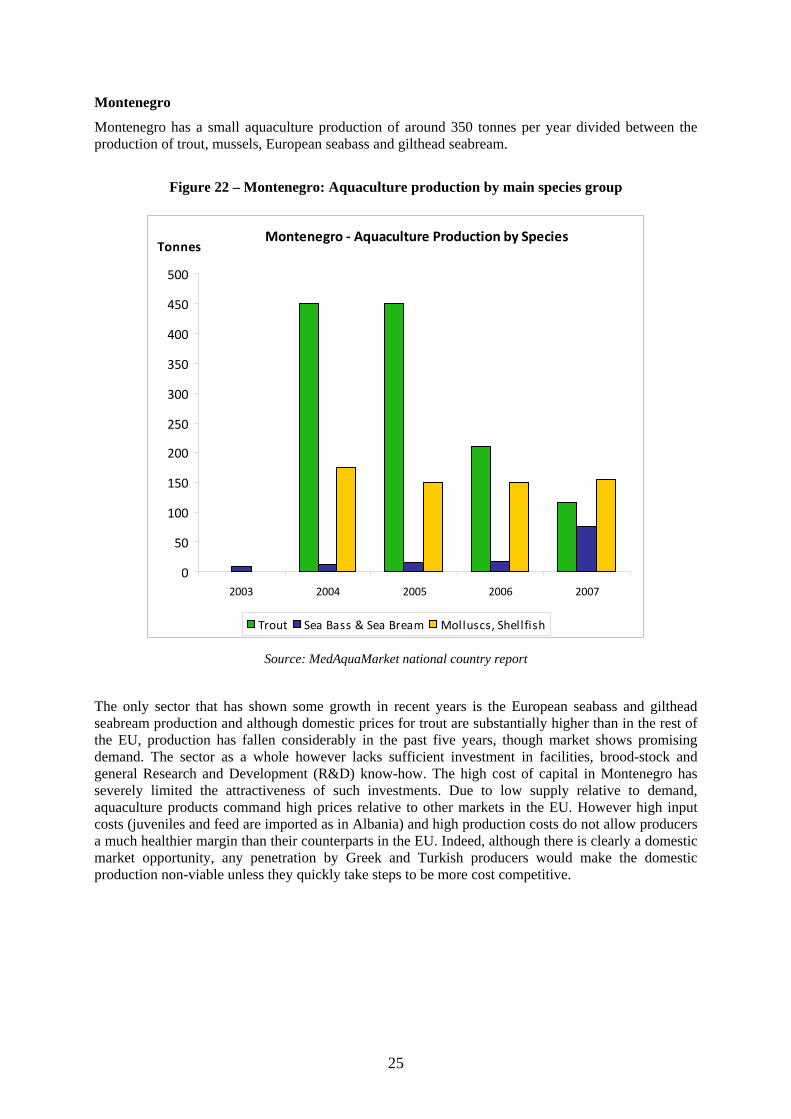
25
Montenegro
Montenegro has a small aquaculture production of around 350 tonnes per year divided between the production of trout, mussels, European seabass and gilthead seabream.
Figure 22 – Montenegro: Aquaculture production by main species group
Montenegro ‐ Aquaculture Production by Species
0
50
100
150
200
250
300
350
400
450
500
2003 2004 2005 2006 2007
Tonnes
Trout Sea Bass & Sea Bream Molluscs, Shellfish
Source: MedAquaMarket national country report
The only sector that has shown some growth in recent years is the European seabass and gilthead seabream production and although domestic prices for trout are substantially higher than in the rest of the EU, production has fallen considerably in the past five years, though market shows promising demand. The sector as a whole however lacks sufficient investment in facilities, brood-stock and general Research and Development (R&D) know-how. The high cost of capital in Montenegro has severely limited the attractiveness of such investments. Due to low supply relative to demand, aquaculture products command high prices relative to other markets in the EU. However high input costs (juveniles and feed are imported as in Albania) and high production costs do not allow producers a much healthier margin than their counterparts in the EU. Indeed, although there is clearly a domestic market opportunity, any penetration by Greek and Turkish producers would make the domestic production non-viable unless they quickly take steps to be more cost competitive.
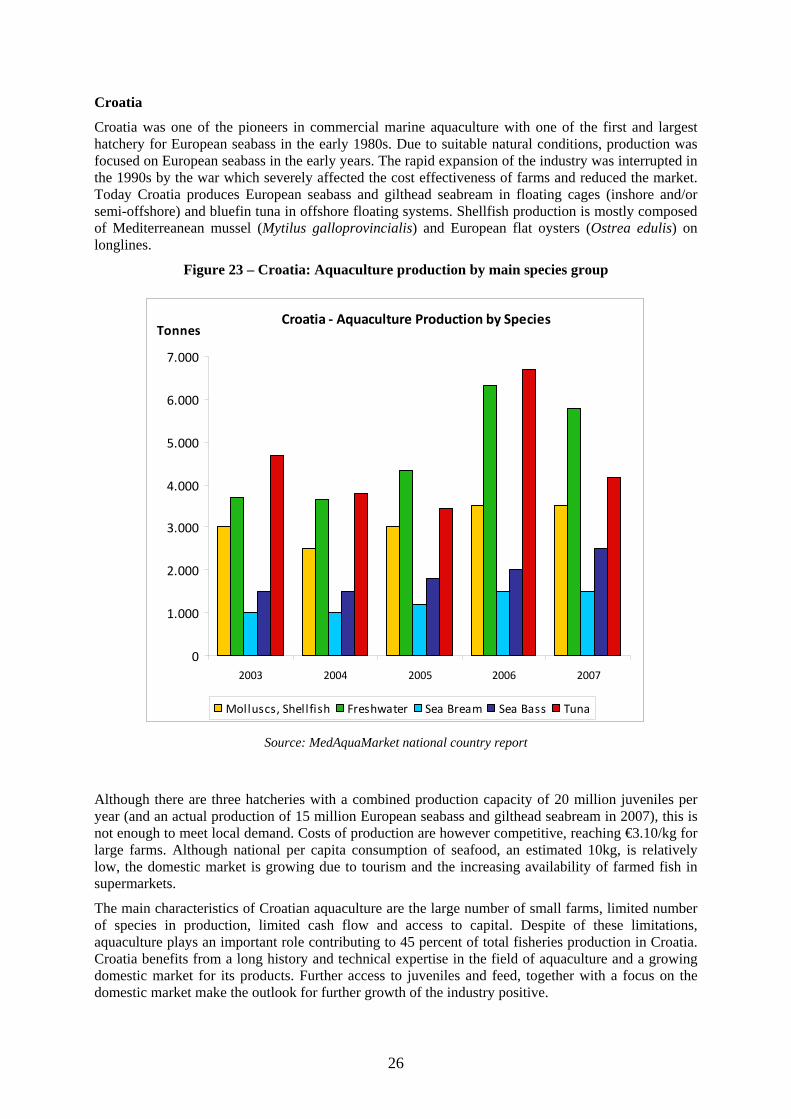
26
Croatia
Croatia was one of the pioneers in commercial marine aquaculture with one of the first and largest hatchery for European seabass in the early 1980s. Due to suitable natural conditions, production was focused on European seabass in the early years. The rapid expansion of the industry was interrupted in the 1990s by the war which severely affected the cost effectiveness of farms and reduced the market. Today Croatia produces European seabass and gilthead seabream in floating cages (inshore and/or semi-offshore) and bluefin tuna in offshore floating systems. Shellfish production is mostly composed of Mediterreanean mussel (Mytilus galloprovincialis) and European flat oysters (Ostrea edulis) on longlines.
Figure 23 – Croatia: Aquaculture production by main species group
Croatia ‐ Aquaculture Production by Species
0
1.000
2.000
3.000
4.000
5.000
6.000
7.000
2003 2004 2005 2006 2007
Tonnes
Molluscs, Shellfish Freshwater Sea Bream Sea Bass Tuna
Source: MedAquaMarket national country report
Although there are three hatcheries with a combined production capacity of 20 million juveniles per year (and an actual production of 15 million European seabass and gilthead seabream in 2007), this is not enough to meet local demand. Costs of production are however competitive, reaching €3.10/kg for large farms. Although national per capita consumption of seafood, an estimated 10kg, is relatively low, the domestic market is growing due to tourism and the increasing availability of farmed fish in supermarkets.
The main characteristics of Croatian aquaculture are the large number of small farms, limited number of species in production, limited cash flow and access to capital. Despite of these limitations, aquaculture plays an important role contributing to 45 percent of total fisheries production in Croatia. Croatia benefits from a long history and technical expertise in the field of aquaculture and a growing domestic market for its products. Further access to juveniles and feed, together with a focus on the domestic market make the outlook for further growth of the industry positive.
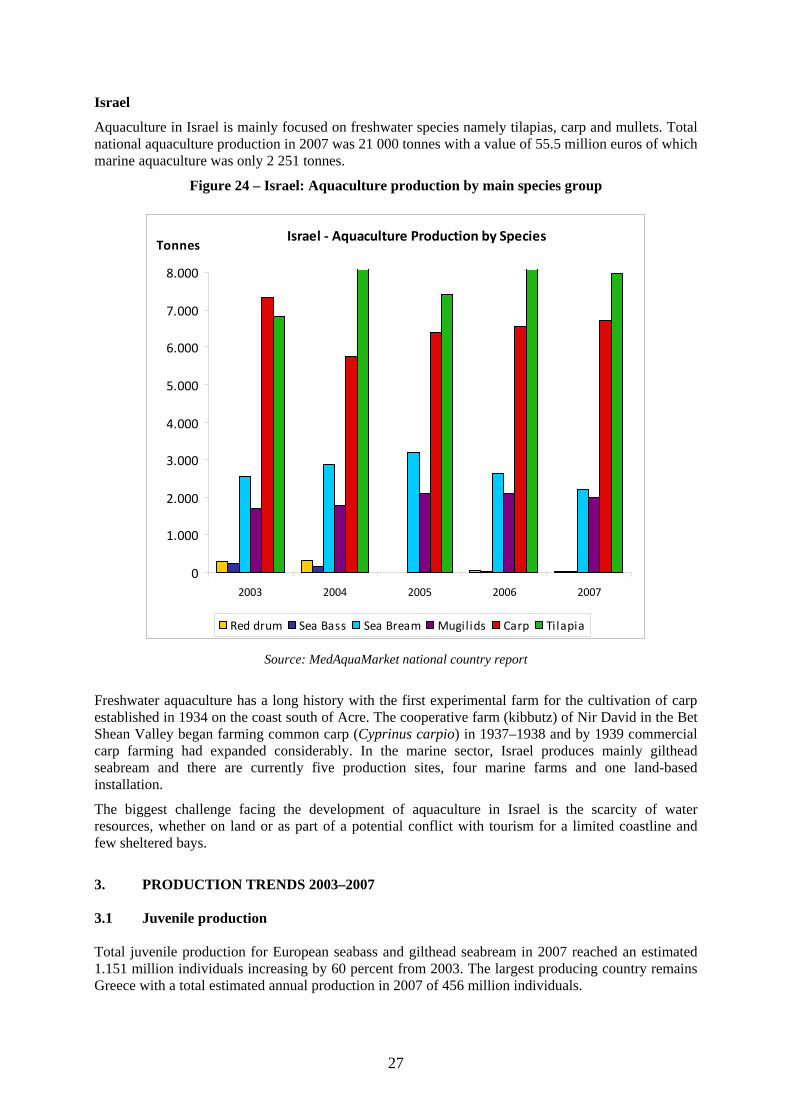
27
Israel
Aquaculture in Israel is mainly focused on freshwater species namely tilapias, carp and mullets. Total national aquaculture production in 2007 was 21 000 tonnes with a value of 55.5 million euros of which marine aquaculture was only 2 251 tonnes.
Figure 24 – Israel: Aquaculture production by main species group
Israel ‐ Aquaculture Production by Species
0
1.000
2.000
3.000
4.000
5.000
6.000
7.000
8.000
2003 2004 2005 2006 2007
Tonnes
Red drum Sea Bass Sea Bream Mugilids Carp Tilapia
Source: MedAquaMarket national country report
Freshwater aquaculture has a long history with the first experimental farm for the cultivation of carp established in 1934 on the coast south of Acre. The cooperative farm (kibbutz) of Nir David in the Bet Shean Valley began farming common carp (Cyprinus carpio) in 1937–1938 and by 1939 commercial carp farming had expanded considerably. In the marine sector, Israel produces mainly gilthead seabream and there are currently five production sites, four marine farms and one land-based installation.
The biggest challenge facing the development of aquaculture in Israel is the scarcity of water resources, whether on land or as part of a potential conflict with tourism for a limited coastline and few sheltered bays.
3. PRODUCTION TRENDS 2003–2007 3.1 Juvenile production Total juvenile production for European seabass and gilthead seabream in 2007 reached an estimated 1.151 million individuals increasing by 60 percent from 2003. The largest producing country remains Greece with a total estimated annual production in 2007 of 456 million individuals.
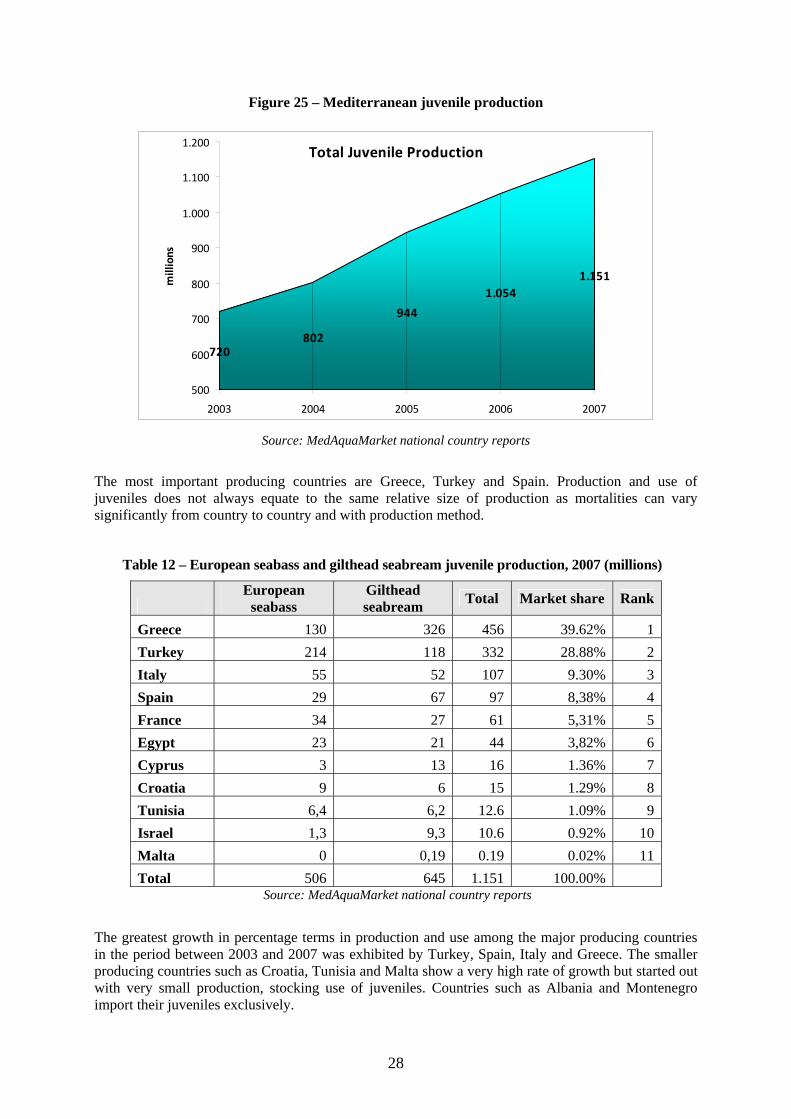
28
Figure 25 – Mediterranean juvenile production
Total Juvenile Production
720802
944
1.0541.151
500
600
700
800
900
1.000
1.100
1.200
2003 2004 2005 2006 2007
millions
Source: MedAquaMarket national country reports
The most important producing countries are Greece, Turkey and Spain. Production and use of juveniles does not always equate to the same relative size of production as mortalities can vary significantly from country to country and with production method.
Table 12 – European seabass and gilthead seabream juvenile production, 2007 (millions)
European
seabass Gilthead seabream Total Market share Rank
Greece 130 326 456 39.62% 1Turkey 214 118 332 28.88% 2Italy 55 52 107 9.30% 3Spain 29 67 97 8,38% 4France 34 27 61 5,31% 5Egypt 23 21 44 3,82% 6Cyprus 3 13 16 1.36% 7Croatia 9 6 15 1.29% 8Tunisia 6,4 6,2 12.6 1.09% 9Israel 1,3 9,3 10.6 0.92% 10Malta 0 0,19 0.19 0.02% 11Total 506 645 1.151 100.00%
Source: MedAquaMarket national country reports
The greatest growth in percentage terms in production and use among the major producing countries in the period between 2003 and 2007 was exhibited by Turkey, Spain, Italy and Greece. The smaller producing countries such as Croatia, Tunisia and Malta show a very high rate of growth but started out with very small production, stocking use of juveniles. Countries such as Albania and Montenegro import their juveniles exclusively.
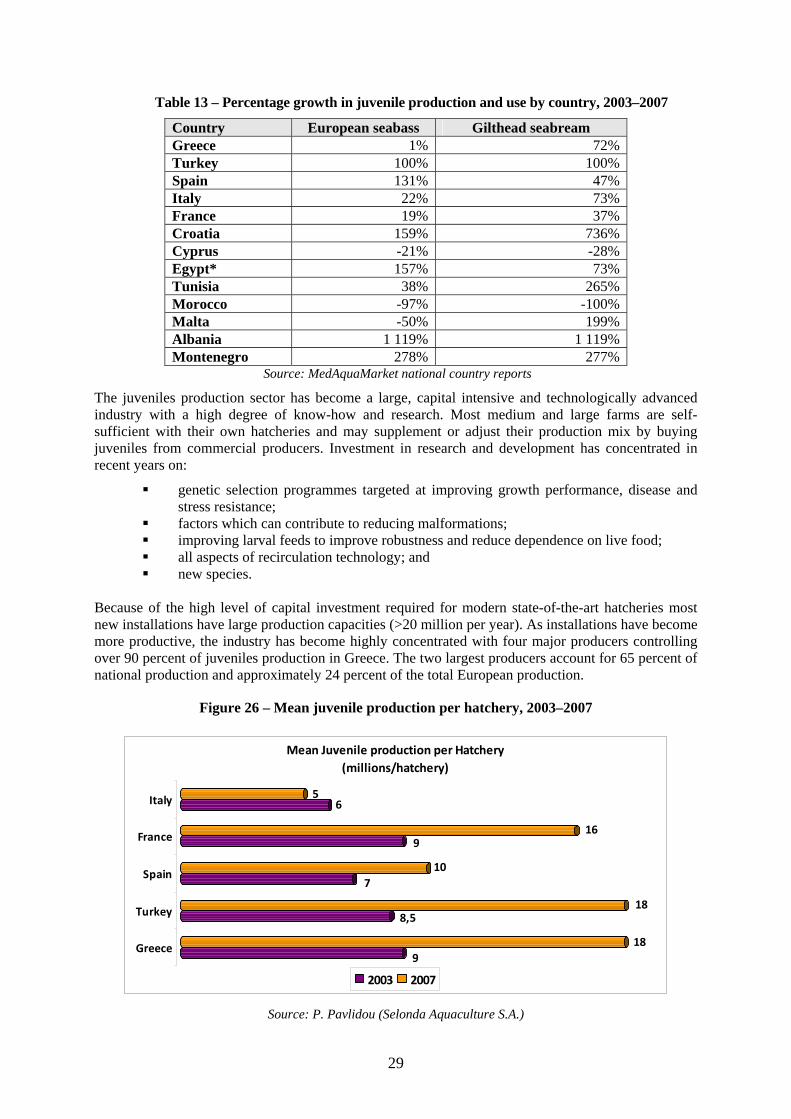
29
Table 13 – Percentage growth in juvenile production and use by country, 2003–2007
Country European seabass Gilthead seabream Greece 1% 72% Turkey 100% 100% Spain 131% 47% Italy 22% 73% France 19% 37% Croatia 159% 736% Cyprus -21% -28% Egypt* 157% 73% Tunisia 38% 265% Morocco -97% -100% Malta -50% 199% Albania 1 119% 1 119% Montenegro 278% 277%
Source: MedAquaMarket national country reports
The juveniles production sector has become a large, capital intensive and technologically advanced industry with a high degree of know-how and research. Most medium and large farms are self-sufficient with their own hatcheries and may supplement or adjust their production mix by buying juveniles from commercial producers. Investment in research and development has concentrated in recent years on:
genetic selection programmes targeted at improving growth performance, disease and stress resistance;
factors which can contribute to reducing malformations; improving larval feeds to improve robustness and reduce dependence on live food; all aspects of recirculation technology; and new species.
Because of the high level of capital investment required for modern state-of-the-art hatcheries most new installations have large production capacities (>20 million per year). As installations have become more productive, the industry has become highly concentrated with four major producers controlling over 90 percent of juveniles production in Greece. The two largest producers account for 65 percent of national production and approximately 24 percent of the total European production.
Figure 26 – Mean juvenile production per hatchery, 2003–2007
918
8,518
710
916
65
Greece
Turkey
Spain
France
Italy
Mean Juvenile production per Hatchery(millions/hatchery)
2003 2007
Source: P. Pavlidou (Selonda Aquaculture S.A.)
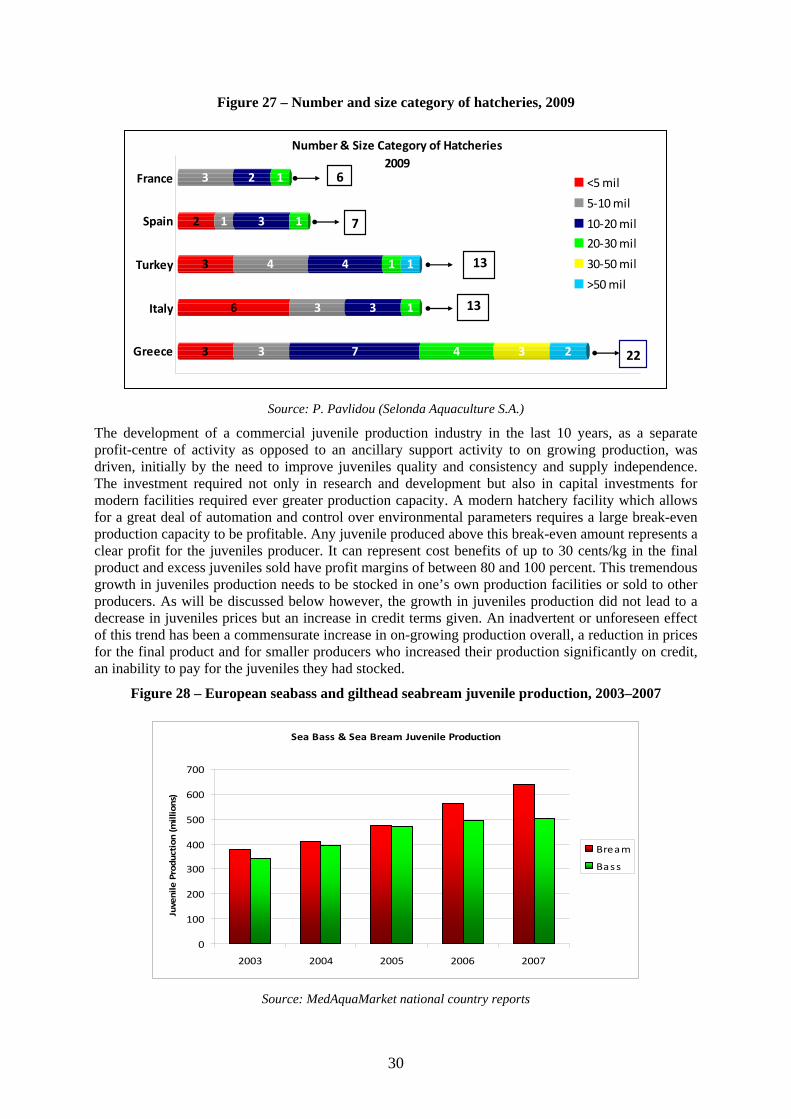
30
Figure 27 – Number and size category of hatcheries, 2009
3 3 7 4 3 2
6 3 3 1
3 4 4 1 1
2 1 3 1
3 2 1
Greece
Italy
Turkey
Spain
France
Number & Size Category of Hatcheries2009
<5 mil
5‐10 mil
10‐20 mil
20‐30 mil
30‐50 mil
>50 mil
6
7
13
22
13
Source: P. Pavlidou (Selonda Aquaculture S.A.)
The development of a commercial juvenile production industry in the last 10 years, as a separate profit-centre of activity as opposed to an ancillary support activity to on growing production, was driven, initially by the need to improve juveniles quality and consistency and supply independence. The investment required not only in research and development but also in capital investments for modern facilities required ever greater production capacity. A modern hatchery facility which allows for a great deal of automation and control over environmental parameters requires a large break-even production capacity to be profitable. Any juvenile produced above this break-even amount represents a clear profit for the juveniles producer. It can represent cost benefits of up to 30 cents/kg in the final product and excess juveniles sold have profit margins of between 80 and 100 percent. This tremendous growth in juveniles production needs to be stocked in one’s own production facilities or sold to other producers. As will be discussed below however, the growth in juveniles production did not lead to a decrease in juveniles prices but an increase in credit terms given. An inadvertent or unforeseen effect of this trend has been a commensurate increase in on-growing production overall, a reduction in prices for the final product and for smaller producers who increased their production significantly on credit, an inability to pay for the juveniles they had stocked.
Figure 28 – European seabass and gilthead seabream juvenile production, 2003–2007
Sea Bass & Sea Bream Juvenile Production
0
100
200
300
400
500
600
700
2003 2004 2005 2006 2007
Juvenile Production (millions)
Bream
Bass
Source: MedAquaMarket national country reports
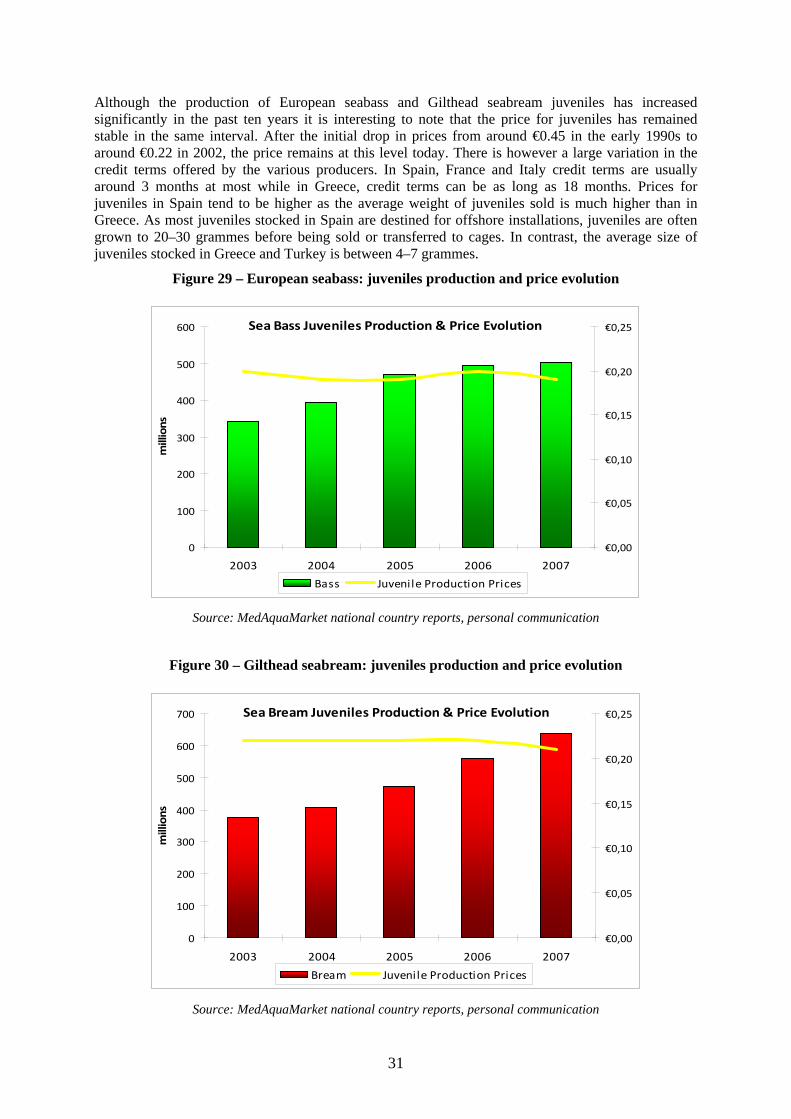
31
Although the production of European seabass and Gilthead seabream juveniles has increased significantly in the past ten years it is interesting to note that the price for juveniles has remained stable in the same interval. After the initial drop in prices from around €0.45 in the early 1990s to around €0.22 in 2002, the price remains at this level today. There is however a large variation in the credit terms offered by the various producers. In Spain, France and Italy credit terms are usually around 3 months at most while in Greece, credit terms can be as long as 18 months. Prices for juveniles in Spain tend to be higher as the average weight of juveniles sold is much higher than in Greece. As most juveniles stocked in Spain are destined for offshore installations, juveniles are often grown to 20–30 grammes before being sold or transferred to cages. In contrast, the average size of juveniles stocked in Greece and Turkey is between 4–7 grammes.
Figure 29 – European seabass: juveniles production and price evolution
Sea Bass Juveniles Production & Price Evolution
0
100
200
300
400
500
600
2003 2004 2005 2006 2007
millions
€0,00
€0,05
€0,10
€0,15
€0,20
€0,25
Bass Juvenile Production Prices
Source: MedAquaMarket national country reports, personal communication
Figure 30 – Gilthead seabream: juveniles production and price evolution
Sea Bream Juveniles Production & Price Evolution
0
100
200
300
400
500
600
700
2003 2004 2005 2006 2007
millions
€0,00
€0,05
€0,10
€0,15
€0,20
€0,25
Bream Juvenile Production Prices
Source: MedAquaMarket national country reports, personal communication
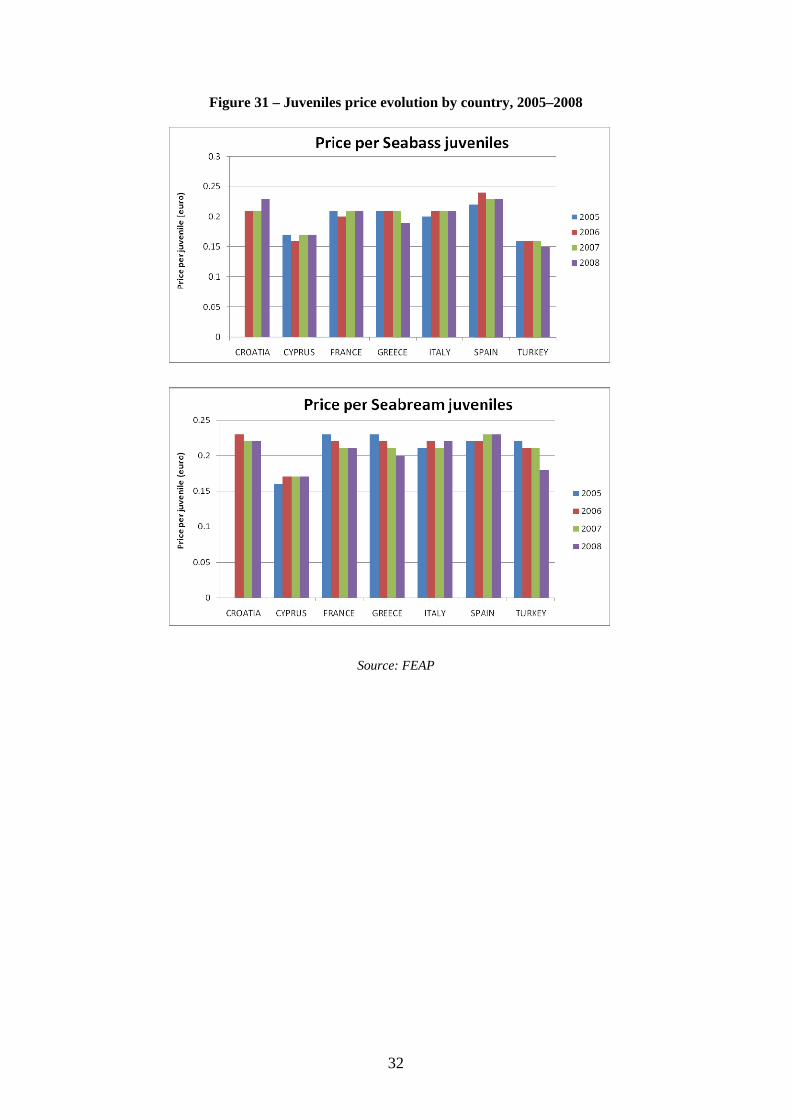
32
Figure 31 – Juveniles price evolution by country, 2005–2008
Source: FEAP
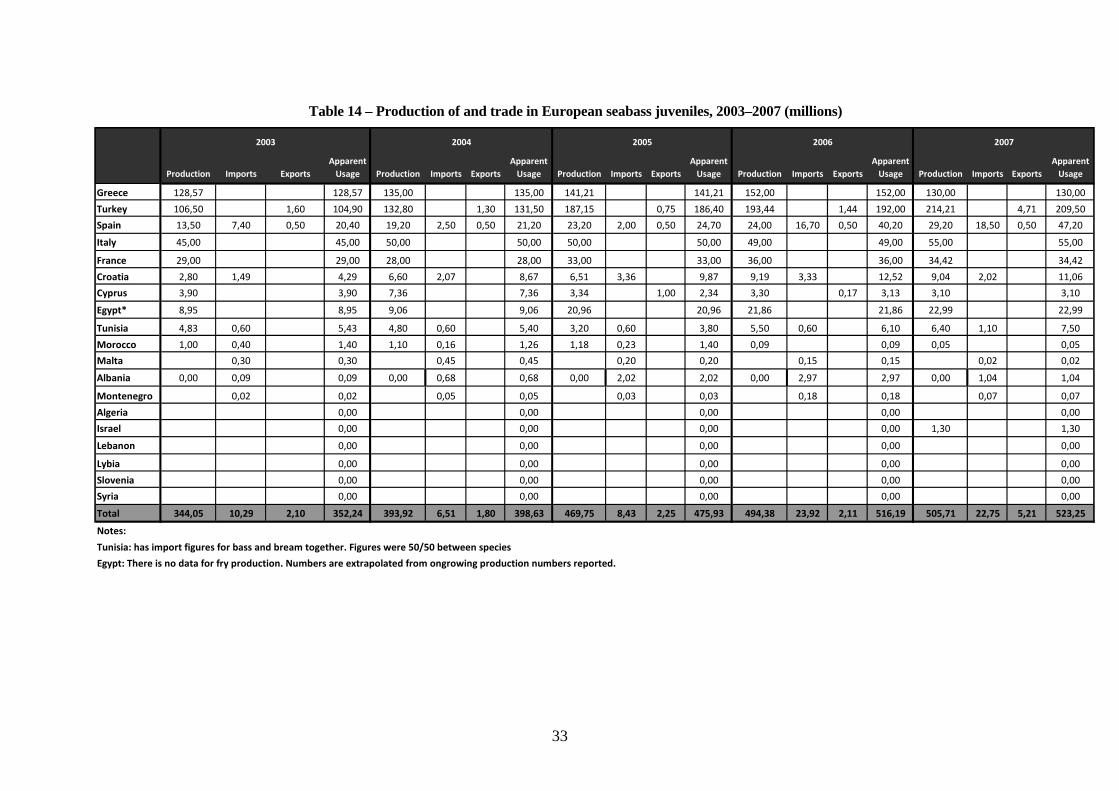
33
Table 14 – Production of and trade in European seabass juveniles, 2003–2007 (millions)
Production Imports ExportsApparent Usage Production Imports Exports
Apparent Usage Production Imports Exports
Apparent Usage Production Imports Exports
Apparent Usage Production Imports Exports
Apparent Usage
Greece 128,57 128,57 135,00 135,00 141,21 141,21 152,00 152,00 130,00 130,00
Turkey 106,50 1,60 104,90 132,80 1,30 131,50 187,15 0,75 186,40 193,44 1,44 192,00 214,21 4,71 209,50
Spain 13,50 7,40 0,50 20,40 19,20 2,50 0,50 21,20 23,20 2,00 0,50 24,70 24,00 16,70 0,50 40,20 29,20 18,50 0,50 47,20
Italy 45,00 45,00 50,00 50,00 50,00 50,00 49,00 49,00 55,00 55,00
France 29,00 29,00 28,00 28,00 33,00 33,00 36,00 36,00 34,42 34,42
Croatia 2,80 1,49 4,29 6,60 2,07 8,67 6,51 3,36 9,87 9,19 3,33 12,52 9,04 2,02 11,06
Cyprus 3,90 3,90 7,36 7,36 3,34 1,00 2,34 3,30 0,17 3,13 3,10 3,10
Egypt* 8,95 8,95 9,06 9,06 20,96 20,96 21,86 21,86 22,99 22,99
Tunisia 4,83 0,60 5,43 4,80 0,60 5,40 3,20 0,60 3,80 5,50 0,60 6,10 6,40 1,10 7,50
Morocco 1,00 0,40 1,40 1,10 0,16 1,26 1,18 0,23 1,40 0,09 0,09 0,05 0,05
Malta 0,30 0,30 0,45 0,45 0,20 0,20 0,15 0,15 0,02 0,02
Albania 0,00 0,09 0,09 0,00 0,68 0,68 0,00 2,02 2,02 0,00 2,97 2,97 0,00 1,04 1,04
Montenegro 0,02 0,02 0,05 0,05 0,03 0,03 0,18 0,18 0,07 0,07
Algeria 0,00 0,00 0,00 0,00 0,00
Israel 0,00 0,00 0,00 0,00 1,30 1,30
Lebanon 0,00 0,00 0,00 0,00 0,00
Lybia 0,00 0,00 0,00 0,00 0,00
Slovenia 0,00 0,00 0,00 0,00 0,00
Syria 0,00 0,00 0,00 0,00 0,00
Total 344,05 10,29 2,10 352,24 393,92 6,51 1,80 398,63 469,75 8,43 2,25 475,93 494,38 23,92 2,11 516,19 505,71 22,75 5,21 523,25
Notes:
Tunisia: has import figures for bass and bream together. Figures were 50/50 between species
Egypt: There is no data for fry production. Numbers are extrapolated from ongrowing production numbers reported.
2006 20072003 2004 2005
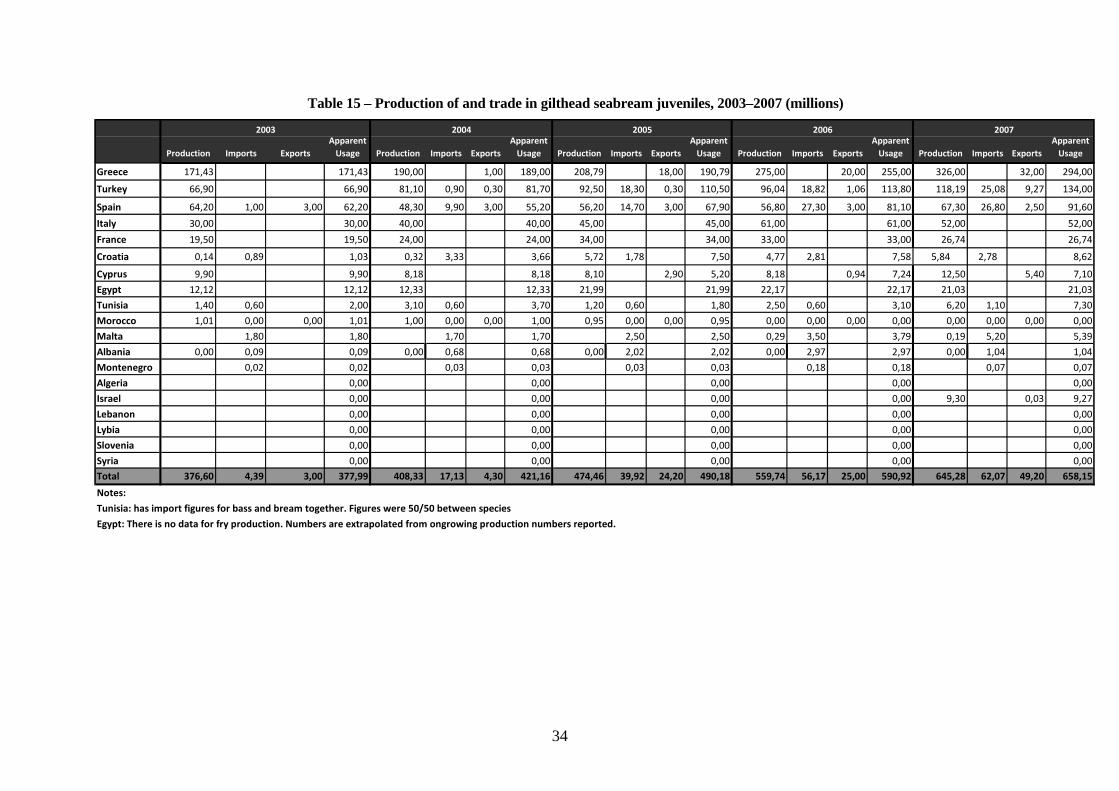
34
Table 15 – Production of and trade in gilthead seabream juveniles, 2003–2007 (millions)
Production Imports ExportsApparent Usage Production Imports Exports
Apparent Usage Production Imports Exports
Apparent Usage Production Imports Exports
Apparent Usage Production Imports Exports
Apparent Usage
Greece 171,43 171,43 190,00 1,00 189,00 208,79 18,00 190,79 275,00 20,00 255,00 326,00 32,00 294,00
Turkey 66,90 66,90 81,10 0,90 0,30 81,70 92,50 18,30 0,30 110,50 96,04 18,82 1,06 113,80 118,19 25,08 9,27 134,00
Spain 64,20 1,00 3,00 62,20 48,30 9,90 3,00 55,20 56,20 14,70 3,00 67,90 56,80 27,30 3,00 81,10 67,30 26,80 2,50 91,60
Italy 30,00 30,00 40,00 40,00 45,00 45,00 61,00 61,00 52,00 52,00
France 19,50 19,50 24,00 24,00 34,00 34,00 33,00 33,00 26,74 26,74
Croatia 0,14 0,89 1,03 0,32 3,33 3,66 5,72 1,78 7,50 4,77 2,81 7,58 5,84 2,78 8,62
Cyprus 9,90 9,90 8,18 8,18 8,10 2,90 5,20 8,18 0,94 7,24 12,50 5,40 7,10
Egypt 12,12 12,12 12,33 12,33 21,99 21,99 22,17 22,17 21,03 21,03
Tunisia 1,40 0,60 2,00 3,10 0,60 3,70 1,20 0,60 1,80 2,50 0,60 3,10 6,20 1,10 7,30
Morocco 1,01 0,00 0,00 1,01 1,00 0,00 0,00 1,00 0,95 0,00 0,00 0,95 0,00 0,00 0,00 0,00 0,00 0,00 0,00 0,00
Malta 1,80 1,80 1,70 1,70 2,50 2,50 0,29 3,50 3,79 0,19 5,20 5,39
Albania 0,00 0,09 0,09 0,00 0,68 0,68 0,00 2,02 2,02 0,00 2,97 2,97 0,00 1,04 1,04
Montenegro 0,02 0,02 0,03 0,03 0,03 0,03 0,18 0,18 0,07 0,07
Algeria 0,00 0,00 0,00 0,00 0,00
Israel 0,00 0,00 0,00 0,00 9,30 0,03 9,27
Lebanon 0,00 0,00 0,00 0,00 0,00
Lybia 0,00 0,00 0,00 0,00 0,00
Slovenia 0,00 0,00 0,00 0,00 0,00
Syria 0,00 0,00 0,00 0,00 0,00
Total 376,60 4,39 3,00 377,99 408,33 17,13 4,30 421,16 474,46 39,92 24,20 490,18 559,74 56,17 25,00 590,92 645,28 62,07 49,20 658,15
Notes:
Tunisia: has import figures for bass and bream together. Figures were 50/50 between species
Egypt: There is no data for fry production. Numbers are extrapolated from ongrowing production numbers reported.
2006 20072003 2004 2005
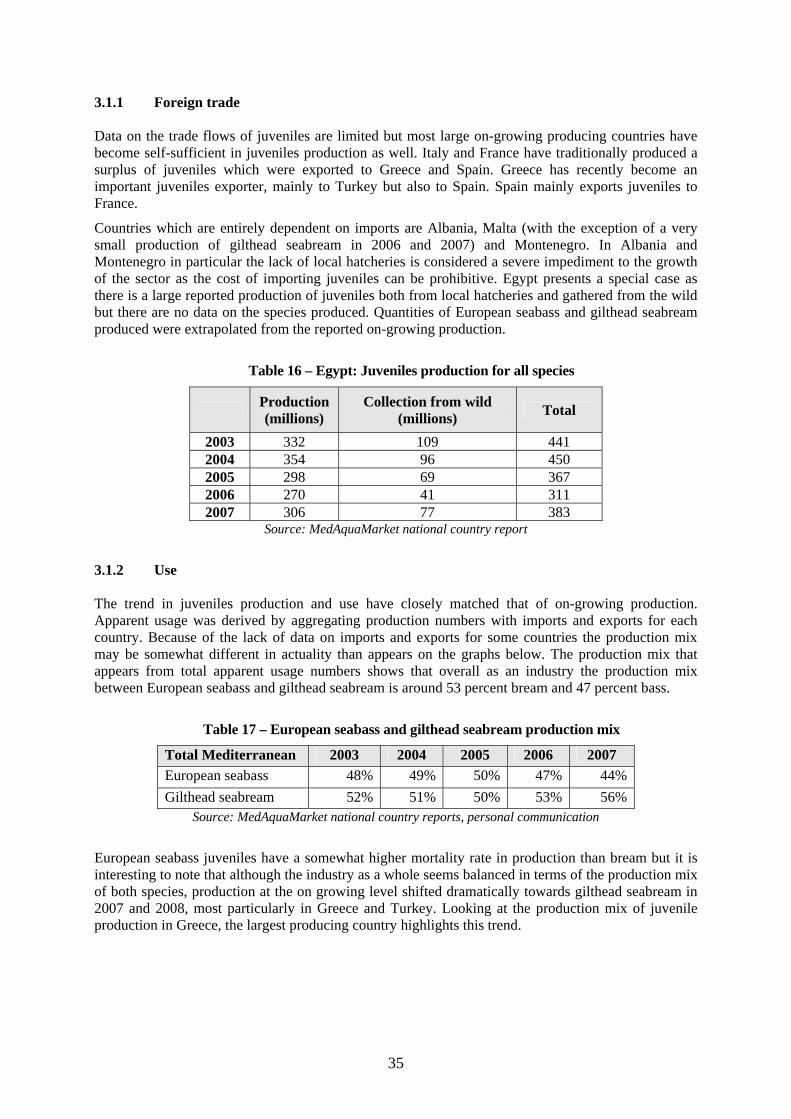
35
3.1.1 Foreign trade Data on the trade flows of juveniles are limited but most large on-growing producing countries have become self-sufficient in juveniles production as well. Italy and France have traditionally produced a surplus of juveniles which were exported to Greece and Spain. Greece has recently become an important juveniles exporter, mainly to Turkey but also to Spain. Spain mainly exports juveniles to France.
Countries which are entirely dependent on imports are Albania, Malta (with the exception of a very small production of gilthead seabream in 2006 and 2007) and Montenegro. In Albania and Montenegro in particular the lack of local hatcheries is considered a severe impediment to the growth of the sector as the cost of importing juveniles can be prohibitive. Egypt presents a special case as there is a large reported production of juveniles both from local hatcheries and gathered from the wild but there are no data on the species produced. Quantities of European seabass and gilthead seabream produced were extrapolated from the reported on-growing production.
Table 16 – Egypt: Juveniles production for all species
Production (millions)
Collection from wild (millions) Total
2003 332 109 441 2004 354 96 450 2005 298 69 367 2006 270 41 311 2007 306 77 383
Source: MedAquaMarket national country report
3.1.2 Use The trend in juveniles production and use have closely matched that of on-growing production. Apparent usage was derived by aggregating production numbers with imports and exports for each country. Because of the lack of data on imports and exports for some countries the production mix may be somewhat different in actuality than appears on the graphs below. The production mix that appears from total apparent usage numbers shows that overall as an industry the production mix between European seabass and gilthead seabream is around 53 percent bream and 47 percent bass.
Table 17 – European seabass and gilthead seabream production mix
Total Mediterranean 2003 2004 2005 2006 2007 European seabass 48% 49% 50% 47% 44% Gilthead seabream 52% 51% 50% 53% 56%
Source: MedAquaMarket national country reports, personal communication
European seabass juveniles have a somewhat higher mortality rate in production than bream but it is interesting to note that although the industry as a whole seems balanced in terms of the production mix of both species, production at the on growing level shifted dramatically towards gilthead seabream in 2007 and 2008, most particularly in Greece and Turkey. Looking at the production mix of juvenile production in Greece, the largest producing country highlights this trend.
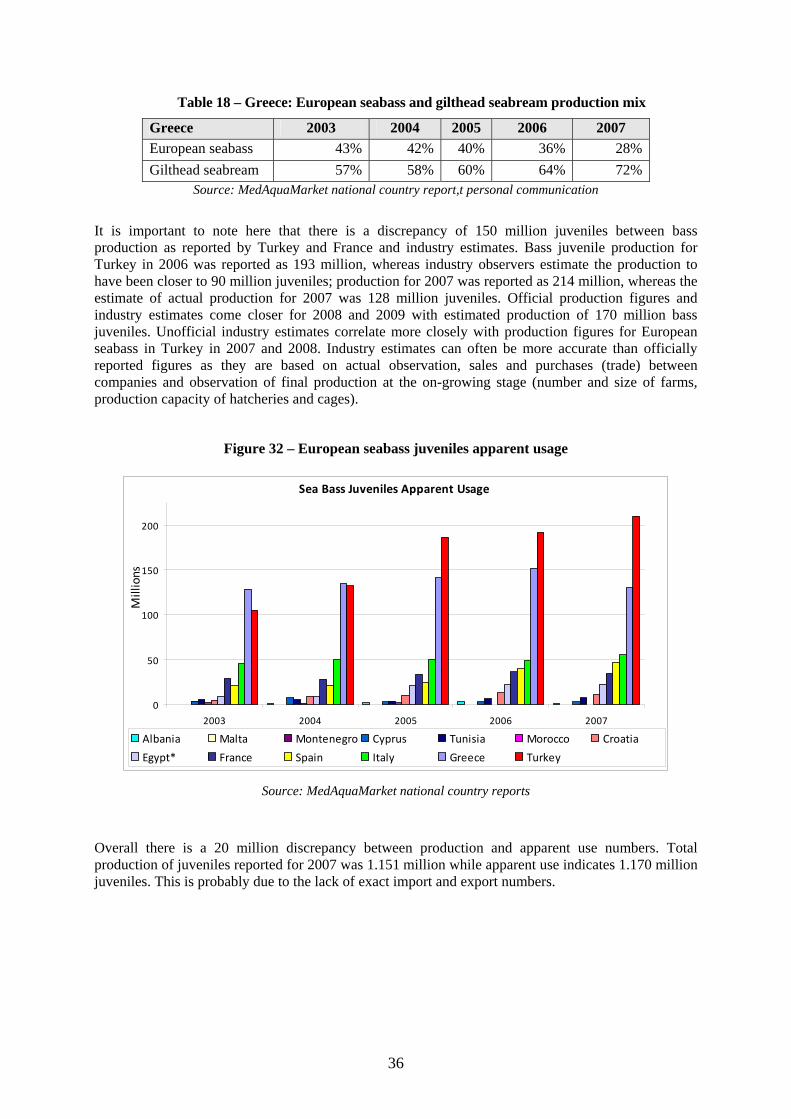
36
Table 18 – Greece: European seabass and gilthead seabream production mix
Greece 2003 2004 2005 2006 2007 European seabass 43% 42% 40% 36% 28% Gilthead seabream 57% 58% 60% 64% 72%
Source: MedAquaMarket national country report,t personal communication
It is important to note here that there is a discrepancy of 150 million juveniles between bass production as reported by Turkey and France and industry estimates. Bass juvenile production for Turkey in 2006 was reported as 193 million, whereas industry observers estimate the production to have been closer to 90 million juveniles; production for 2007 was reported as 214 million, whereas the estimate of actual production for 2007 was 128 million juveniles. Official production figures and industry estimates come closer for 2008 and 2009 with estimated production of 170 million bass juveniles. Unofficial industry estimates correlate more closely with production figures for European seabass in Turkey in 2007 and 2008. Industry estimates can often be more accurate than officially reported figures as they are based on actual observation, sales and purchases (trade) between companies and observation of final production at the on-growing stage (number and size of farms, production capacity of hatcheries and cages).
Figure 32 – European seabass juveniles apparent usage
Sea Bass Juveniles Apparent Usage
0
50
100
150
200
2003 2004 2005 2006 2007
Millions
Albania Malta Montenegro Cyprus Tunisia Morocco Croatia
Egypt* France Spain Italy Greece Turkey
Source: MedAquaMarket national country reports
Overall there is a 20 million discrepancy between production and apparent use numbers. Total production of juveniles reported for 2007 was 1.151 million while apparent use indicates 1.170 million juveniles. This is probably due to the lack of exact import and export numbers.
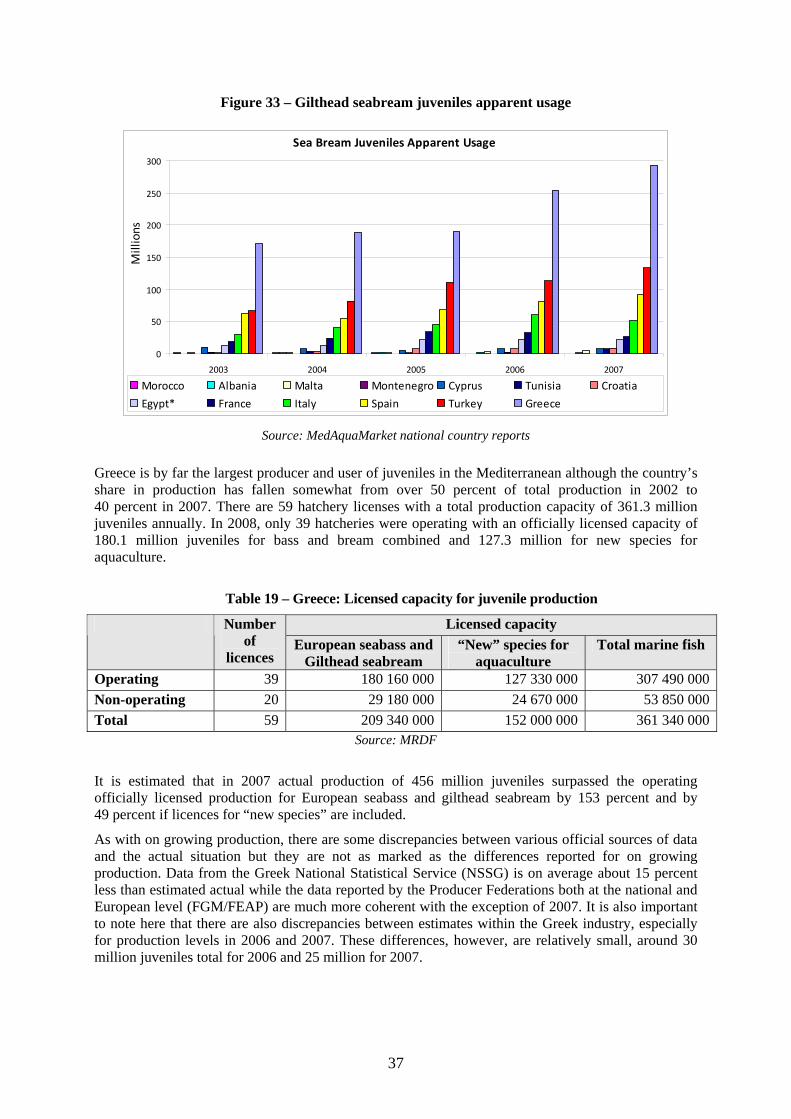
37
Figure 33 – Gilthead seabream juveniles apparent usage
Sea Bream Juveniles Apparent Usage
0
50
100
150
200
250
300
2003 2004 2005 2006 2007
Millions
Morocco Albania Malta Montenegro Cyprus Tunisia Croatia
Egypt* France Italy Spain Turkey Greece
Source: MedAquaMarket national country reports Greece is by far the largest producer and user of juveniles in the Mediterranean although the country’s share in production has fallen somewhat from over 50 percent of total production in 2002 to 40 percent in 2007. There are 59 hatchery licenses with a total production capacity of 361.3 million juveniles annually. In 2008, only 39 hatcheries were operating with an officially licensed capacity of 180.1 million juveniles for bass and bream combined and 127.3 million for new species for aquaculture.
Table 19 – Greece: Licensed capacity for juvenile production
Licensed capacity Number of
licences European seabass and
Gilthead seabream “New” species for
aquaculture Total marine fish
Operating 39 180 160 000 127 330 000 307 490 000Non-operating 20 29 180 000 24 670 000 53 850 000Total 59 209 340 000 152 000 000 361 340 000
Source: MRDF
It is estimated that in 2007 actual production of 456 million juveniles surpassed the operating officially licensed production for European seabass and gilthead seabream by 153 percent and by 49 percent if licences for “new species” are included.
As with on growing production, there are some discrepancies between various official sources of data and the actual situation but they are not as marked as the differences reported for on growing production. Data from the Greek National Statistical Service (NSSG) is on average about 15 percent less than estimated actual while the data reported by the Producer Federations both at the national and European level (FGM/FEAP) are much more coherent with the exception of 2007. It is also important to note here that there are also discrepancies between estimates within the Greek industry, especially for production levels in 2006 and 2007. These differences, however, are relatively small, around 30 million juveniles total for 2006 and 25 million for 2007.
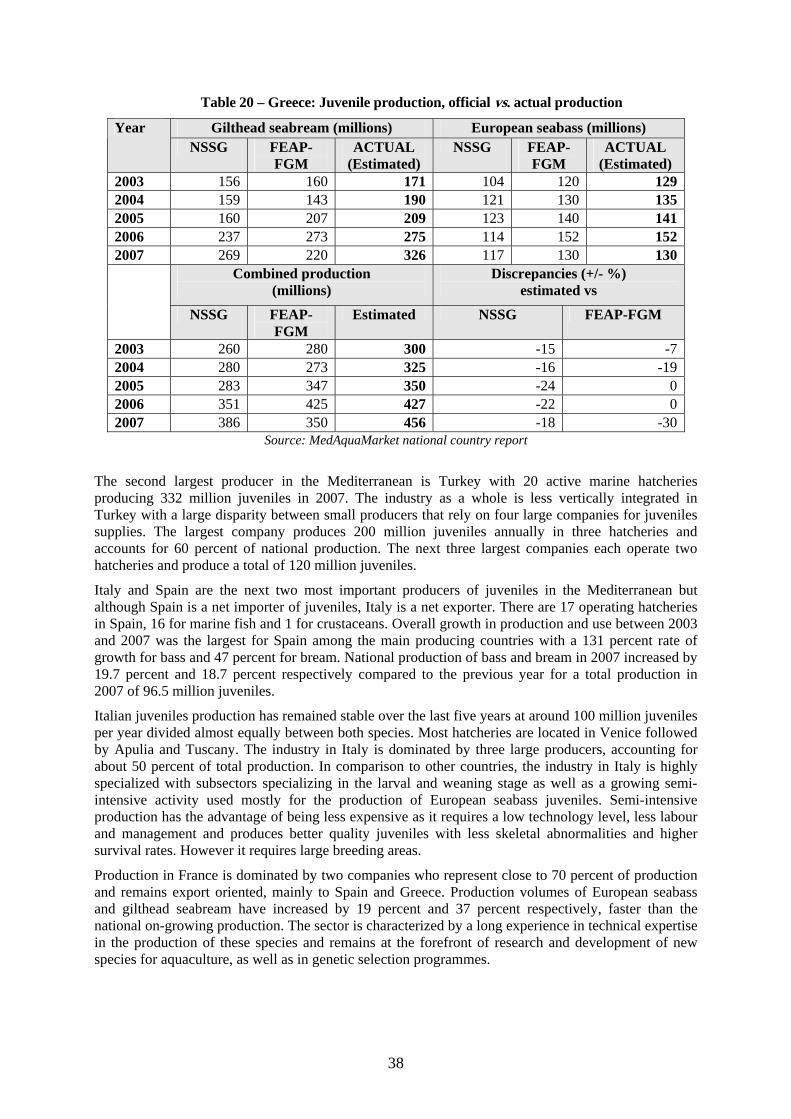
38
Table 20 – Greece: Juvenile production, official vs. actual production
Gilthead seabream (millions) European seabass (millions) Year NSSG FEAP-
FGM ACTUAL
(Estimated) NSSG FEAP-
FGM ACTUAL
(Estimated) 2003 156 160 171 104 120 1292004 159 143 190 121 130 1352005 160 207 209 123 140 1412006 237 273 275 114 152 1522007 269 220 326 117 130 130
Combined production (millions)
Discrepancies (+/- %) estimated vs
NSSG FEAP-FGM
Estimated NSSG FEAP-FGM
2003 260 280 300 -15 -72004 280 273 325 -16 -192005 283 347 350 -24 02006 351 425 427 -22 02007 386 350 456 -18 -30
Source: MedAquaMarket national country report
The second largest producer in the Mediterranean is Turkey with 20 active marine hatcheries producing 332 million juveniles in 2007. The industry as a whole is less vertically integrated in Turkey with a large disparity between small producers that rely on four large companies for juveniles supplies. The largest company produces 200 million juveniles annually in three hatcheries and accounts for 60 percent of national production. The next three largest companies each operate two hatcheries and produce a total of 120 million juveniles.
Italy and Spain are the next two most important producers of juveniles in the Mediterranean but although Spain is a net importer of juveniles, Italy is a net exporter. There are 17 operating hatcheries in Spain, 16 for marine fish and 1 for crustaceans. Overall growth in production and use between 2003 and 2007 was the largest for Spain among the main producing countries with a 131 percent rate of growth for bass and 47 percent for bream. National production of bass and bream in 2007 increased by 19.7 percent and 18.7 percent respectively compared to the previous year for a total production in 2007 of 96.5 million juveniles.
Italian juveniles production has remained stable over the last five years at around 100 million juveniles per year divided almost equally between both species. Most hatcheries are located in Venice followed by Apulia and Tuscany. The industry in Italy is dominated by three large producers, accounting for about 50 percent of total production. In comparison to other countries, the industry in Italy is highly specialized with subsectors specializing in the larval and weaning stage as well as a growing semi-intensive activity used mostly for the production of European seabass juveniles. Semi-intensive production has the advantage of being less expensive as it requires a low technology level, less labour and management and produces better quality juveniles with less skeletal abnormalities and higher survival rates. However it requires large breeding areas.
Production in France is dominated by two companies who represent close to 70 percent of production and remains export oriented, mainly to Spain and Greece. Production volumes of European seabass and gilthead seabream have increased by 19 percent and 37 percent respectively, faster than the national on-growing production. The sector is characterized by a long experience in technical expertise in the production of these species and remains at the forefront of research and development of new species for aquaculture, as well as in genetic selection programmes.
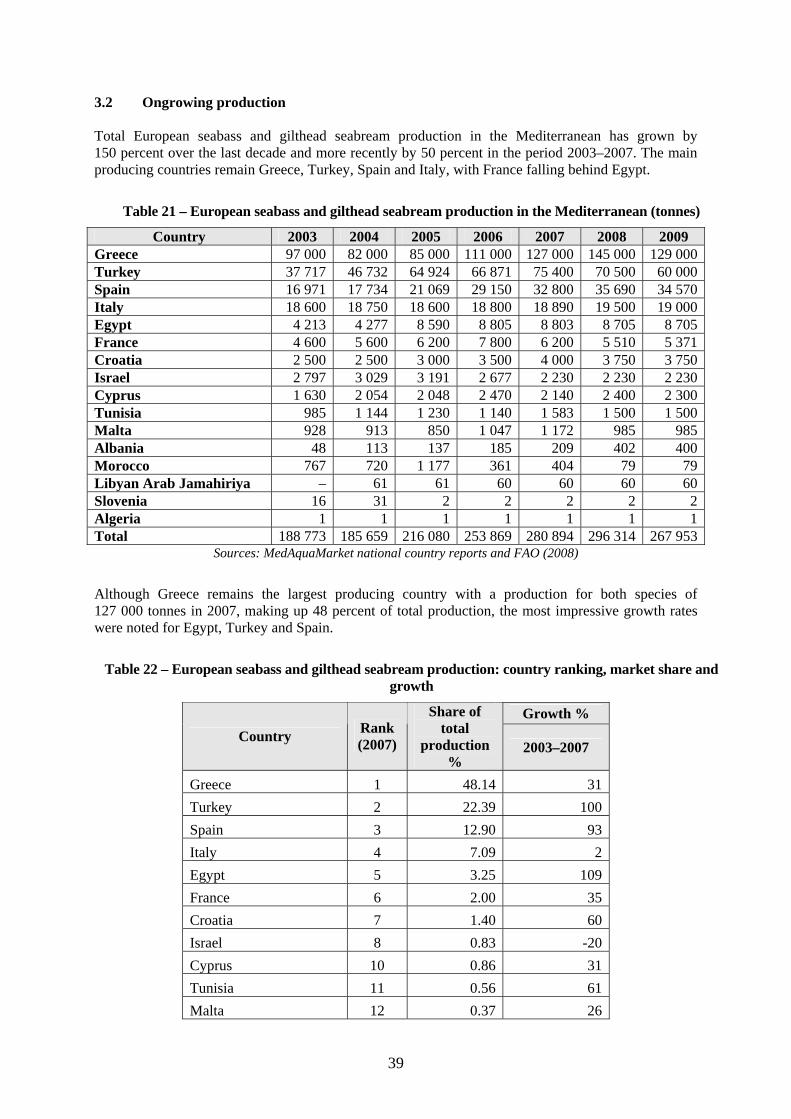
39
3.2 Ongrowing production Total European seabass and gilthead seabream production in the Mediterranean has grown by 150 percent over the last decade and more recently by 50 percent in the period 2003–2007. The main producing countries remain Greece, Turkey, Spain and Italy, with France falling behind Egypt.
Table 21 – European seabass and gilthead seabream production in the Mediterranean (tonnes)
Country 2003 2004 2005 2006 2007 2008 2009 Greece 97 000 82 000 85 000 111 000 127 000 145 000 129 000Turkey 37 717 46 732 64 924 66 871 75 400 70 500 60 000Spain 16 971 17 734 21 069 29 150 32 800 35 690 34 570Italy 18 600 18 750 18 600 18 800 18 890 19 500 19 000Egypt 4 213 4 277 8 590 8 805 8 803 8 705 8 705France 4 600 5 600 6 200 7 800 6 200 5 510 5 371Croatia 2 500 2 500 3 000 3 500 4 000 3 750 3 750Israel 2 797 3 029 3 191 2 677 2 230 2 230 2 230Cyprus 1 630 2 054 2 048 2 470 2 140 2 400 2 300Tunisia 985 1 144 1 230 1 140 1 583 1 500 1 500Malta 928 913 850 1 047 1 172 985 985Albania 48 113 137 185 209 402 400Morocco 767 720 1 177 361 404 79 79Libyan Arab Jamahiriya – 61 61 60 60 60 60Slovenia 16 31 2 2 2 2 2Algeria 1 1 1 1 1 1 1Total 188 773 185 659 216 080 253 869 280 894 296 314 267 953
Sources: MedAquaMarket national country reports and FAO (2008)
Although Greece remains the largest producing country with a production for both species of 127 000 tonnes in 2007, making up 48 percent of total production, the most impressive growth rates were noted for Egypt, Turkey and Spain.
Table 22 – European seabass and gilthead seabream production: country ranking, market share and growth
Growth % Country Rank
(2007)
Share of total
production %
2003–2007
Greece 1 48.14 31 Turkey 2 22.39 100 Spain 3 12.90 93 Italy 4 7.09 2 Egypt 5 3.25 109 France 6 2.00 35 Croatia 7 1.40 60 Israel 8 0.83 -20 Cyprus 10 0.86 31 Tunisia 11 0.56 61 Malta 12 0.37 26
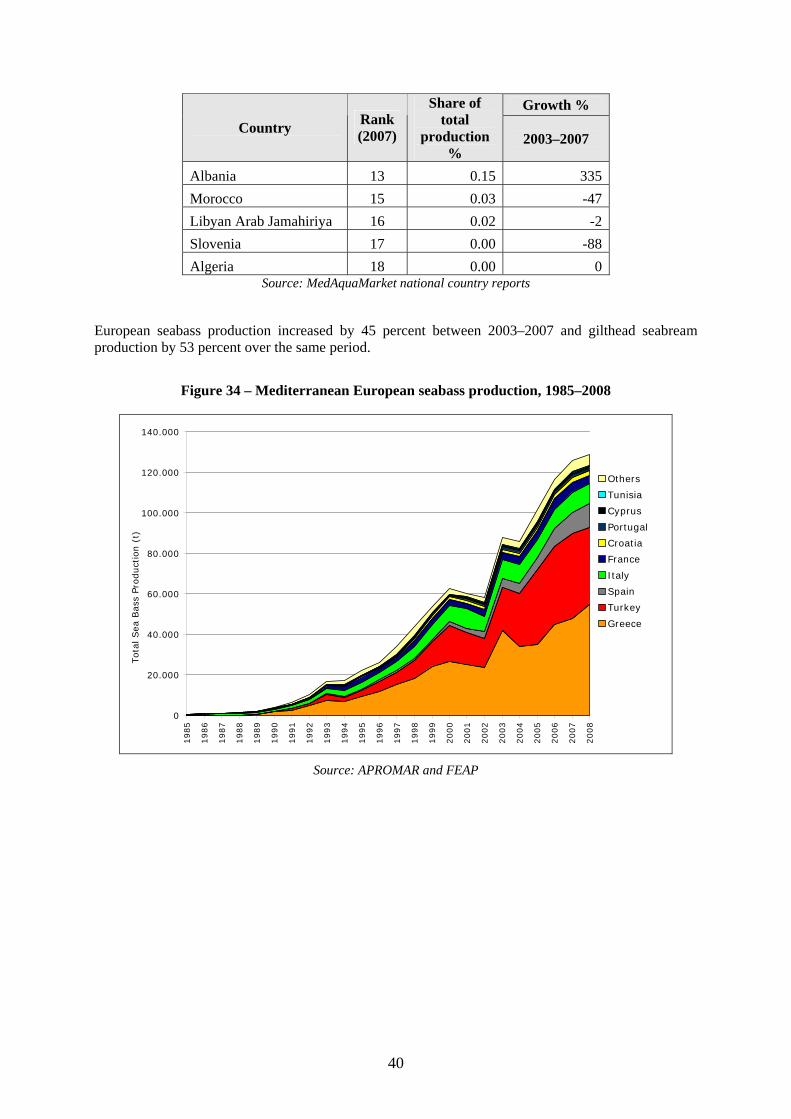
40
Growth % Country Rank
(2007)
Share of total
production %
2003–2007
Albania 13 0.15 335 Morocco 15 0.03 -47 Libyan Arab Jamahiriya 16 0.02 -2 Slovenia 17 0.00 -88 Algeria 18 0.00 0
Source: MedAquaMarket national country reports
European seabass production increased by 45 percent between 2003–2007 and gilthead seabream production by 53 percent over the same period.
Figure 34 – Mediterranean European seabass production, 1985–2008
0
20.000
40.000
60.000
80.000
100.000
120.000
140.000
1985
1986
1987
1988
1989
1990
1991
1992
1993
1994
1995
1996
1997
1998
1999
2000
2001
2002
2003
2004
2005
2006
2007
2008
Tota
l Sea
Bas
s Pro
duct
ion (
t)
Others
Tunisia
Cyprus
Portugal
Croatia
France
Italy
Spain
Turkey
Greece
Source: APROMAR and FEAP
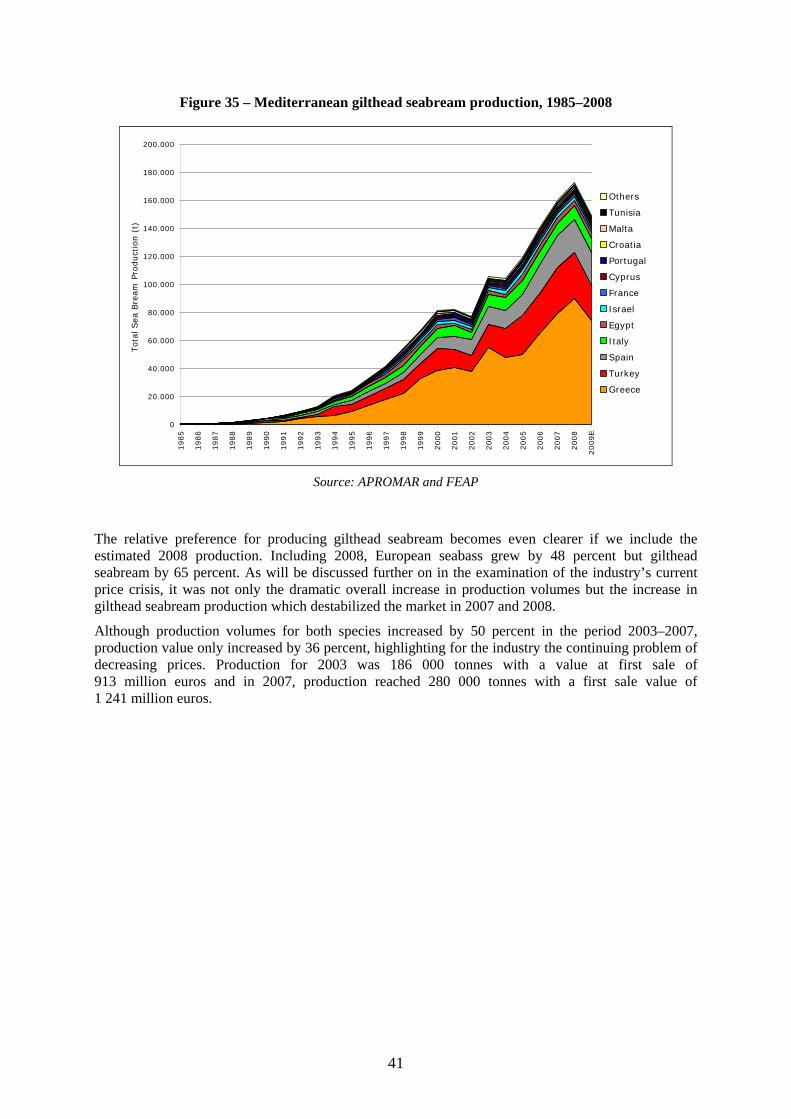
41
Figure 35 – Mediterranean gilthead seabream production, 1985–2008
0
20.000
40.000
60.000
80.000
100.000
120.000
140.000
160.000
180.000
200.000
1985
1986
1987
1988
1989
1990
1991
1992
1993
1994
1995
1996
1997
1998
1999
2000
2001
2002
2003
2004
2005
2006
2007
2008
2009E
Tota
l Sea
Bre
am
Pro
duct
ion (
t)
Others
Tunisia
Malta
Croatia
Portugal
Cyprus
France
Israel
Egypt
Italy
Spain
Turkey
Greece
Source: APROMAR and FEAP
The relative preference for producing gilthead seabream becomes even clearer if we include the estimated 2008 production. Including 2008, European seabass grew by 48 percent but gilthead seabream by 65 percent. As will be discussed further on in the examination of the industry’s current price crisis, it was not only the dramatic overall increase in production volumes but the increase in gilthead seabream production which destabilized the market in 2007 and 2008.
Although production volumes for both species increased by 50 percent in the period 2003–2007, production value only increased by 36 percent, highlighting for the industry the continuing problem of decreasing prices. Production for 2003 was 186 000 tonnes with a value at first sale of 913 million euros and in 2007, production reached 280 000 tonnes with a first sale value of 1 241 million euros.
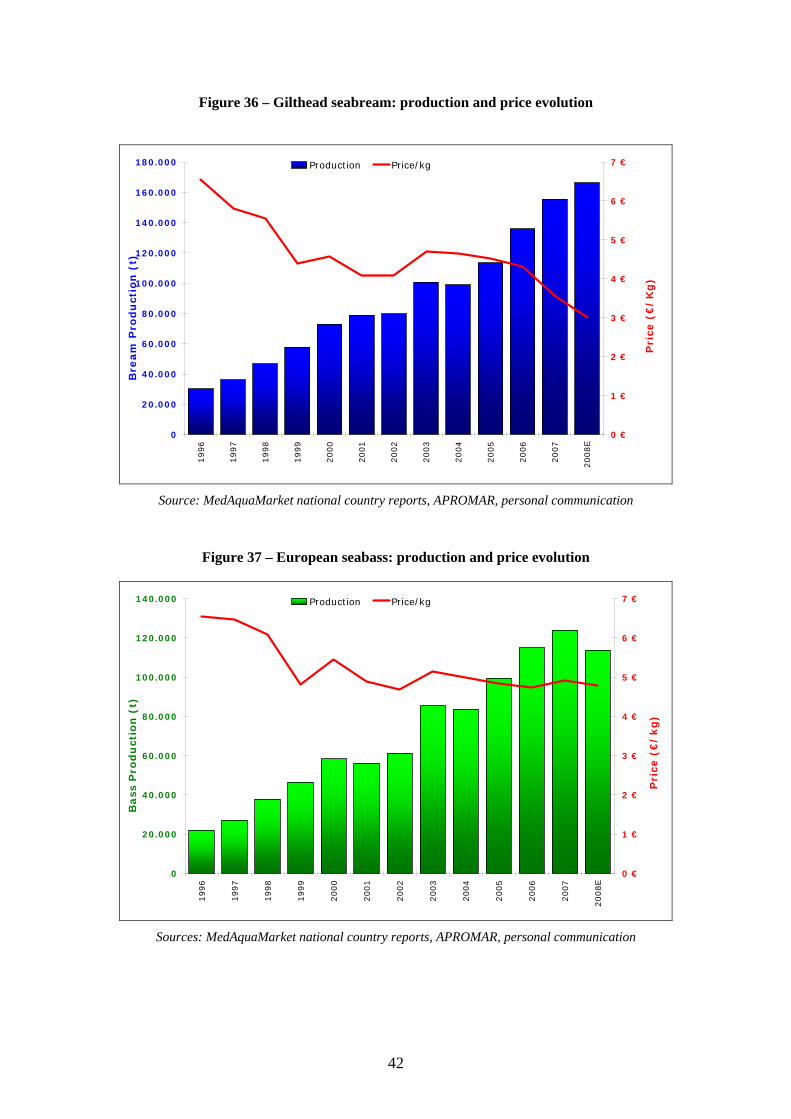
42
Figure 36 – Gilthead seabream: production and price evolution
0
20.000
40.000
60.000
80.000
100.000
120.000
140.000
160.000
180.000
1996
1997
1998
1999
2000
2001
2002
2003
2004
2005
2006
2007
2008E
Bre
am
Pro
du
ctio
n (
t)
0 €
1 €
2 €
3 €
4 €
5 €
6 €
7 €
Pri
ce (
€/
Kg
)
Production Price/kg
Source: MedAquaMarket national country reports, APROMAR, personal communication
Figure 37 – European seabass: production and price evolution
0
20.000
40.000
60.000
80.000
100.000
120.000
140.000
1996
1997
1998
1999
2000
2001
2002
2003
2004
2005
2006
2007
2008E
Bass
Pro
du
ctio
n (
t)
0 €
1 €
2 €
3 €
4 €
5 €
6 €
7 €
Pri
ce (
€/
kg
)
Production Price/kg
Sources: MedAquaMarket national country reports, APROMAR, personal communication
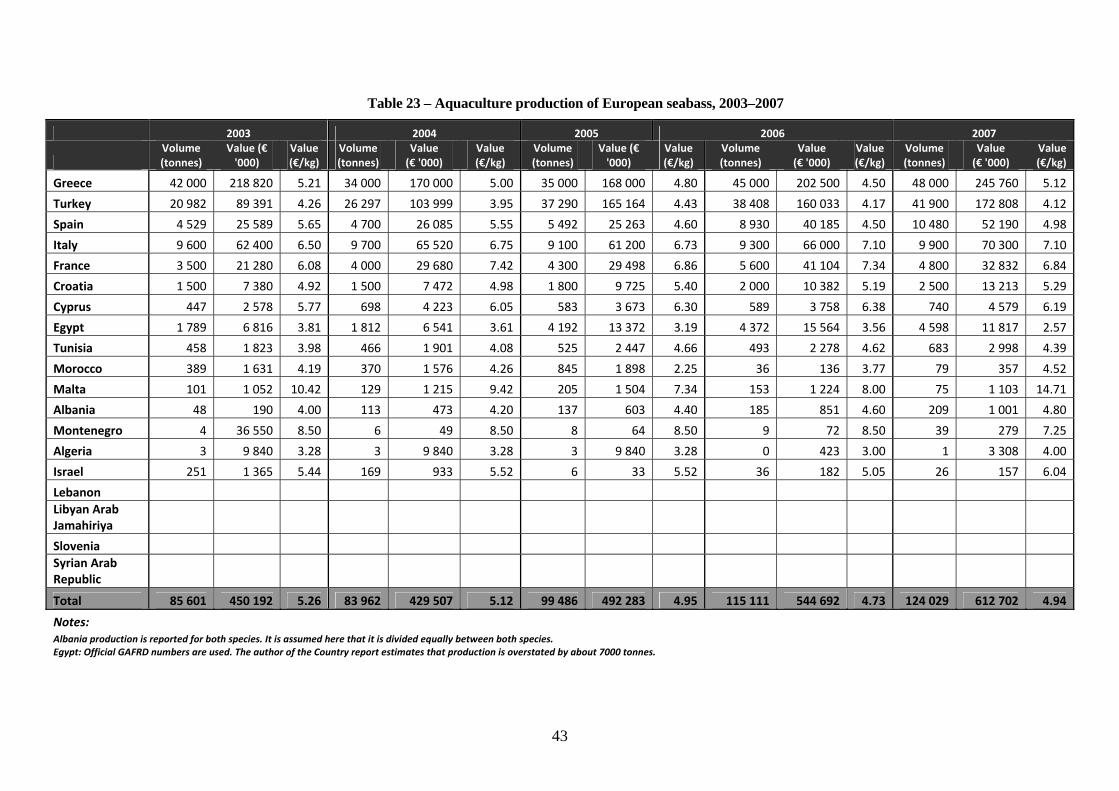
43
Table 23 – Aquaculture production of European seabass, 2003–2007
2003 2004 2005 2006 2007
Volume (tonnes)
Value (€ '000)
Value (€/kg)
Volume (tonnes)
Value (€ '000)
Value (€/kg)
Volume (tonnes)
Value (€ '000)
Value (€/kg)
Volume (tonnes)
Value (€ '000)
Value (€/kg)
Volume (tonnes)
Value (€ '000)
Value (€/kg)
Greece 42 000 218 820 5.21 34 000 170 000 5.00 35 000 168 000 4.80 45 000 202 500 4.50 48 000 245 760 5.12
Turkey 20 982 89 391 4.26 26 297 103 999 3.95 37 290 165 164 4.43 38 408 160 033 4.17 41 900 172 808 4.12
Spain 4 529 25 589 5.65 4 700 26 085 5.55 5 492 25 263 4.60 8 930 40 185 4.50 10 480 52 190 4.98
Italy 9 600 62 400 6.50 9 700 65 520 6.75 9 100 61 200 6.73 9 300 66 000 7.10 9 900 70 300 7.10
France 3 500 21 280 6.08 4 000 29 680 7.42 4 300 29 498 6.86 5 600 41 104 7.34 4 800 32 832 6.84
Croatia 1 500 7 380 4.92 1 500 7 472 4.98 1 800 9 725 5.40 2 000 10 382 5.19 2 500 13 213 5.29
Cyprus 447 2 578 5.77 698 4 223 6.05 583 3 673 6.30 589 3 758 6.38 740 4 579 6.19
Egypt 1 789 6 816 3.81 1 812 6 541 3.61 4 192 13 372 3.19 4 372 15 564 3.56 4 598 11 817 2.57
Tunisia 458 1 823 3.98 466 1 901 4.08 525 2 447 4.66 493 2 278 4.62 683 2 998 4.39
Morocco 389 1 631 4.19 370 1 576 4.26 845 1 898 2.25 36 136 3.77 79 357 4.52
Malta 101 1 052 10.42 129 1 215 9.42 205 1 504 7.34 153 1 224 8.00 75 1 103 14.71
Albania 48 190 4.00 113 473 4.20 137 603 4.40 185 851 4.60 209 1 001 4.80
Montenegro 4 36 550 8.50 6 49 8.50 8 64 8.50 9 72 8.50 39 279 7.25
Algeria 3 9 840 3.28 3 9 840 3.28 3 9 840 3.28 0 423 3.00 1 3 308 4.00
Israel 251 1 365 5.44 169 933 5.52 6 33 5.52 36 182 5.05 26 157 6.04
Lebanon Libyan Arab Jamahiriya
Slovenia Syrian Arab Republic
Total 85 601 450 192 5.26 83 962 429 507 5.12 99 486 492 283 4.95 115 111 544 692 4.73 124 029 612 702 4.94
Notes: Albania production is reported for both species. It is assumed here that it is divided equally between both species. Egypt: Official GAFRD numbers are used. The author of the Country report estimates that production is overstated by about 7000 tonnes.
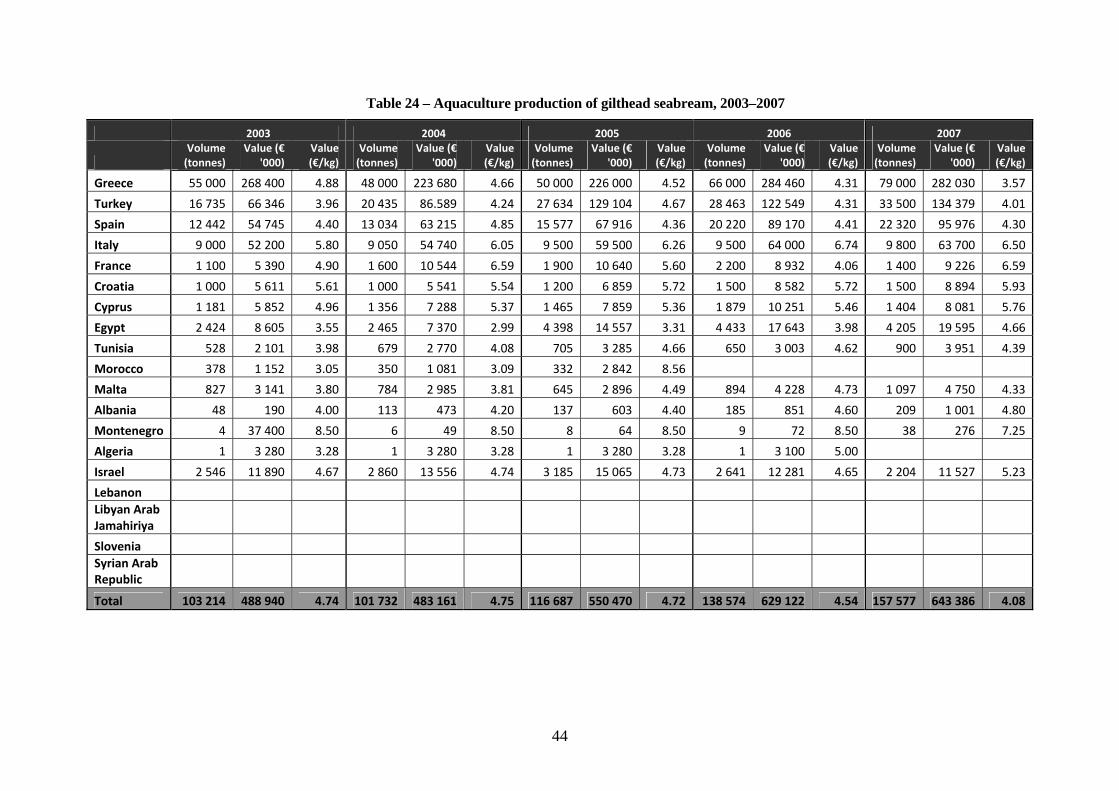
44
Table 24 – Aquaculture production of gilthead seabream, 2003–2007
2003 2004 2005 2006 2007
Volume (tonnes)
Value (€ '000)
Value (€/kg)
Volume (tonnes)
Value (€ '000)
Value (€/kg)
Volume (tonnes)
Value (€ '000)
Value (€/kg)
Volume (tonnes)
Value (€ '000)
Value (€/kg)
Volume (tonnes)
Value (€ '000)
Value (€/kg)
Greece 55 000 268 400 4.88 48 000 223 680 4.66 50 000 226 000 4.52 66 000 284 460 4.31 79 000 282 030 3.57
Turkey 16 735 66 346 3.96 20 435 86.589 4.24 27 634 129 104 4.67 28 463 122 549 4.31 33 500 134 379 4.01
Spain 12 442 54 745 4.40 13 034 63 215 4.85 15 577 67 916 4.36 20 220 89 170 4.41 22 320 95 976 4.30
Italy 9 000 52 200 5.80 9 050 54 740 6.05 9 500 59 500 6.26 9 500 64 000 6.74 9 800 63 700 6.50
France 1 100 5 390 4.90 1 600 10 544 6.59 1 900 10 640 5.60 2 200 8 932 4.06 1 400 9 226 6.59
Croatia 1 000 5 611 5.61 1 000 5 541 5.54 1 200 6 859 5.72 1 500 8 582 5.72 1 500 8 894 5.93
Cyprus 1 181 5 852 4.96 1 356 7 288 5.37 1 465 7 859 5.36 1 879 10 251 5.46 1 404 8 081 5.76
Egypt 2 424 8 605 3.55 2 465 7 370 2.99 4 398 14 557 3.31 4 433 17 643 3.98 4 205 19 595 4.66
Tunisia 528 2 101 3.98 679 2 770 4.08 705 3 285 4.66 650 3 003 4.62 900 3 951 4.39
Morocco 378 1 152 3.05 350 1 081 3.09 332 2 842 8.56
Malta 827 3 141 3.80 784 2 985 3.81 645 2 896 4.49 894 4 228 4.73 1 097 4 750 4.33
Albania 48 190 4.00 113 473 4.20 137 603 4.40 185 851 4.60 209 1 001 4.80
Montenegro 4 37 400 8.50 6 49 8.50 8 64 8.50 9 72 8.50 38 276 7.25
Algeria 1 3 280 3.28 1 3 280 3.28 1 3 280 3.28 1 3 100 5.00
Israel 2 546 11 890 4.67 2 860 13 556 4.74 3 185 15 065 4.73 2 641 12 281 4.65 2 204 11 527 5.23
Lebanon Libyan Arab Jamahiriya
Slovenia Syrian Arab Republic
Total 103 214 488 940 4.74 101 732 483 161 4.75 116 687 550 470 4.72 138 574 629 122 4.54 157 577 643 386 4.08
45
3.3 Comparisons of official to estimated or actual production data As has been stated in many other studies, there is a very important problem in obtaining correct data for aquaculture production in the Mediterranean. Official government sources, official industry sources and actual production can have significant differences between them. In countries where the production is not relevant or the industry is still small, there is often a lack of expertise or no established mechanism for official data collection. That said the situation in most countries has improved over the past five years among significant producer countries with the exception of Greece. The problem in Greece is especially significant as it is such a large producing country. The lack of reliable data on production even at the industry level makes production planning very difficult for the producers themselves as has been demonstrated in the most ongoing recent price crisis. The reluctance on behalf of producers to given accurate data stems mostly from the discrepancy between licensed and unlicensed production and it is important to note that it is the only country in the Mediterranean, with the exception of Egypt, where the unlicensed and unregulated production is so significant in percentage and absolute terms. In most cases industry estimates are more reliable than official figures as they are based on companies sales, trade of juveniles and final product between companies, and observation of facilities (installations and cages). It is clear that it has become absolutely necessary to provide both positive and negative incentives for producers to adhere to their licensed capacity and submit accurate data on their production as it is such a significant producer in size for the Mediterranean. Greece
Data collection in Greece is performed by three organizations:
1. Industry – Federation of Greek Maricultures (FGM) at national level and the Federation of European Aquaculture Producers (FEAP) at European level;
2. National Statistical Service of Greece (NSSG); and 3. Ministry of Rural Development and Food, Directorate for Aquaculture and Inland Waters
(MRDF).
Data collected and presented at the industry level is not done on a regular or systematic basis but mostly when requested from the FEAP. Even then it is mostly based on personal estimates by the management of the Greek Federation or members of its board. Although not all industry companies are members of the federation, the great majority are represented and the most important ones in terms of production volumes are members. The problem of data collection exists on two levels: 1) companies are reluctant to give production figures either because they produce in excess of their licensed capacity or for fear of giving their competitors any information at all, and 2) they often do not have reliable data on their own production. For small producing companies an error of 10 percent on a production of 1 000 tonnes is not problematic. However for a large producer, a 10 percent error on a production of 20 000 tonnes can lead to a discrepancy of 2 000 tonnes. Multiplied by three (the number of companies in Greece producing in excess of 20 000 tonnes each), the discrepancy becomes very significant (6 000 tonnes). Over an estimated total national production of 145 000 tonnes in 2008, an unknown factor of 10–20 percent can be very significant indeed, the size of the entire Spanish production.
The NSSG collects information on aquaculture production through a mechanism whereas regional correspondents at each prefecture – often supported by researchers – visit aquaculture companies and record production based on the information provided to them. Data collected and reported by NSSG is forwarded to EUROSTAT, which under the PRODCOM categorization uses code 03026994 for gilthead seabream and 03026995 for European seabass, while many of the so-called “new” species are coded as 03026961. As almost 50 percent of licenses in Greece have been issued for “new species for aquaculture” but are used for the production of bass and bream, this can cause a great deal of confusion.
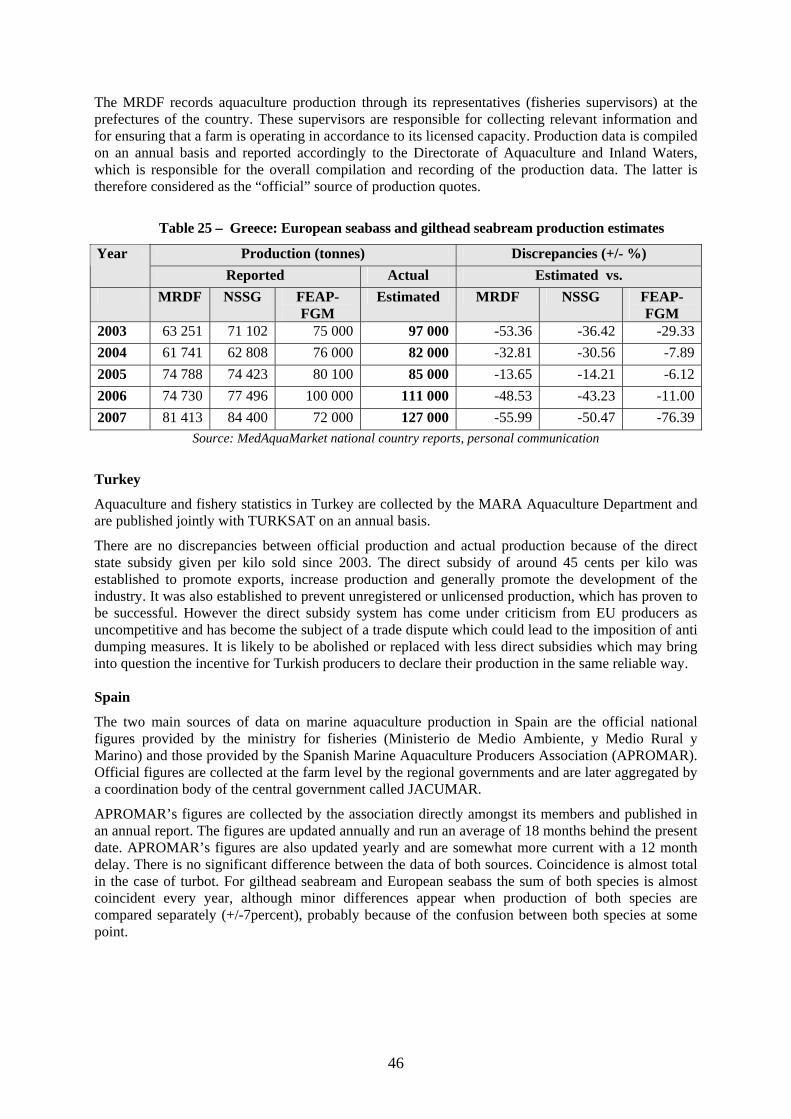
46
The MRDF records aquaculture production through its representatives (fisheries supervisors) at the prefectures of the country. These supervisors are responsible for collecting relevant information and for ensuring that a farm is operating in accordance to its licensed capacity. Production data is compiled on an annual basis and reported accordingly to the Directorate of Aquaculture and Inland Waters, which is responsible for the overall compilation and recording of the production data. The latter is therefore considered as the “official” source of production quotes.
Table 25 – Greece: European seabass and gilthead seabream production estimates
Production (tonnes) Discrepancies (+/- %) Year Reported Actual Estimated vs.
MRDF NSSG FEAP-FGM
Estimated MRDF NSSG FEAP-FGM
2003 63 251 71 102 75 000 97 000 -53.36 -36.42 -29.33 2004 61 741 62 808 76 000 82 000 -32.81 -30.56 -7.89 2005 74 788 74 423 80 100 85 000 -13.65 -14.21 -6.12 2006 74 730 77 496 100 000 111 000 -48.53 -43.23 -11.00 2007 81 413 84 400 72 000 127 000 -55.99 -50.47 -76.39
Source: MedAquaMarket national country reports, personal communication
Turkey
Aquaculture and fishery statistics in Turkey are collected by the MARA Aquaculture Department and are published jointly with TURKSAT on an annual basis.
There are no discrepancies between official production and actual production because of the direct state subsidy given per kilo sold since 2003. The direct subsidy of around 45 cents per kilo was established to promote exports, increase production and generally promote the development of the industry. It was also established to prevent unregistered or unlicensed production, which has proven to be successful. However the direct subsidy system has come under criticism from EU producers as uncompetitive and has become the subject of a trade dispute which could lead to the imposition of anti dumping measures. It is likely to be abolished or replaced with less direct subsidies which may bring into question the incentive for Turkish producers to declare their production in the same reliable way. Spain
The two main sources of data on marine aquaculture production in Spain are the official national figures provided by the ministry for fisheries (Ministerio de Medio Ambiente, y Medio Rural y Marino) and those provided by the Spanish Marine Aquaculture Producers Association (APROMAR). Official figures are collected at the farm level by the regional governments and are later aggregated by a coordination body of the central government called JACUMAR.
APROMAR’s figures are collected by the association directly amongst its members and published in an annual report. The figures are updated annually and run an average of 18 months behind the present date. APROMAR’s figures are also updated yearly and are somewhat more current with a 12 month delay. There is no significant difference between the data of both sources. Coincidence is almost total in the case of turbot. For gilthead seabream and European seabass the sum of both species is almost coincident every year, although minor differences appear when production of both species are compared separately (+/-7percent), probably because of the confusion between both species at some point.
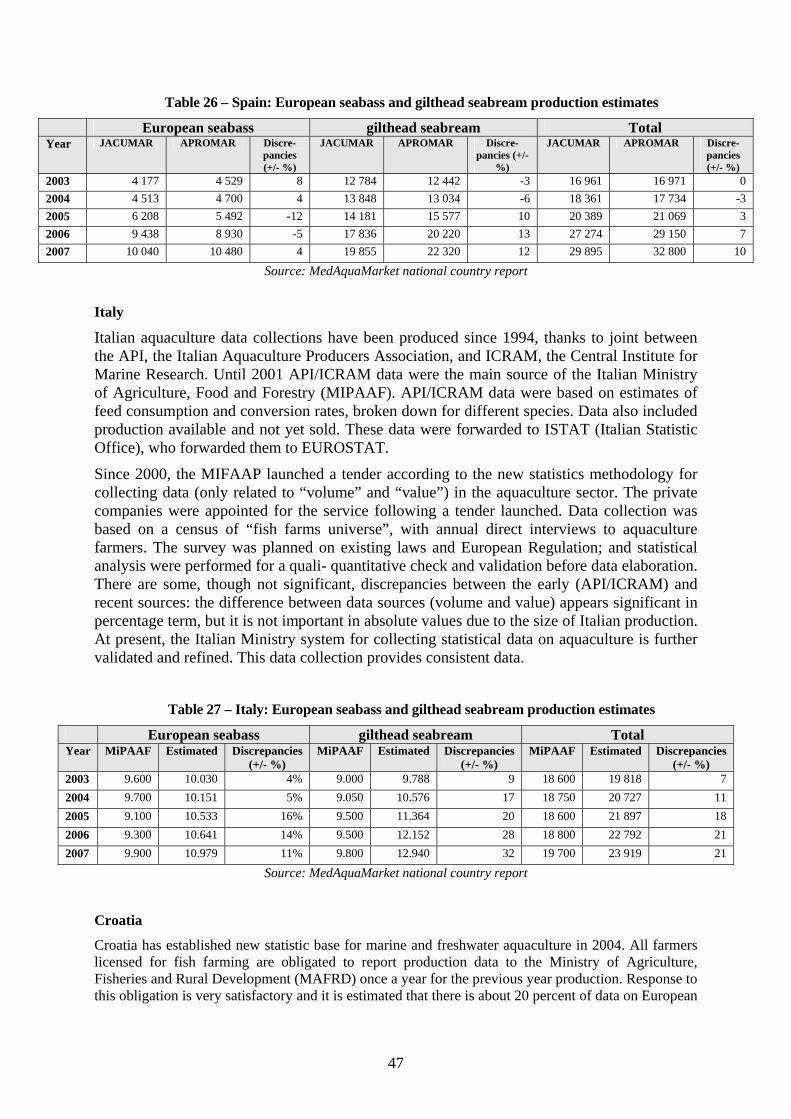
47
Table 26 – Spain: European seabass and gilthead seabream production estimates European seabass gilthead seabream Total Year JACUMAR APROMAR Discre-
pancies (+/- %)
JACUMAR APROMAR Discre-pancies (+/-
%)
JACUMAR APROMAR Discre-pancies (+/- %)
2003 4 177 4 529 8 12 784 12 442 -3 16 961 16 971 0 2004 4 513 4 700 4 13 848 13 034 -6 18 361 17 734 -3 2005 6 208 5 492 -12 14 181 15 577 10 20 389 21 069 3 2006 9 438 8 930 -5 17 836 20 220 13 27 274 29 150 7 2007 10 040 10 480 4 19 855 22 320 12 29 895 32 800 10
Source: MedAquaMarket national country report
Italy
Italian aquaculture data collections have been produced since 1994, thanks to joint between the API, the Italian Aquaculture Producers Association, and ICRAM, the Central Institute for Marine Research. Until 2001 API/ICRAM data were the main source of the Italian Ministry of Agriculture, Food and Forestry (MIPAAF). API/ICRAM data were based on estimates of feed consumption and conversion rates, broken down for different species. Data also included production available and not yet sold. These data were forwarded to ISTAT (Italian Statistic Office), who forwarded them to EUROSTAT.
Since 2000, the MIFAAP launched a tender according to the new statistics methodology for collecting data (only related to “volume” and “value”) in the aquaculture sector. The private companies were appointed for the service following a tender launched. Data collection was based on a census of “fish farms universe”, with annual direct interviews to aquaculture farmers. The survey was planned on existing laws and European Regulation; and statistical analysis were performed for a quali- quantitative check and validation before data elaboration. There are some, though not significant, discrepancies between the early (API/ICRAM) and recent sources: the difference between data sources (volume and value) appears significant in percentage term, but it is not important in absolute values due to the size of Italian production. At present, the Italian Ministry system for collecting statistical data on aquaculture is further validated and refined. This data collection provides consistent data.
Table 27 – Italy: European seabass and gilthead seabream production estimates
European seabass gilthead seabream Total Year MiPAAF Estimated Discrepancies
(+/- %) MiPAAF Estimated Discrepancies
(+/- %) MiPAAF Estimated Discrepancies
(+/- %) 2003 9.600 10.030 4% 9.000 9.788 9 18 600 19 818 7 2004 9.700 10.151 5% 9.050 10.576 17 18 750 20 727 11 2005 9.100 10.533 16% 9.500 11.364 20 18 600 21 897 18 2006 9.300 10.641 14% 9.500 12.152 28 18 800 22 792 21 2007 9.900 10.979 11% 9.800 12.940 32 19 700 23 919 21
Source: MedAquaMarket national country report
Croatia
Croatia has established new statistic base for marine and freshwater aquaculture in 2004. All farmers licensed for fish farming are obligated to report production data to the Ministry of Agriculture, Fisheries and Rural Development (MAFRD) once a year for the previous year production. Response to this obligation is very satisfactory and it is estimated that there is about 20 percent of data on European
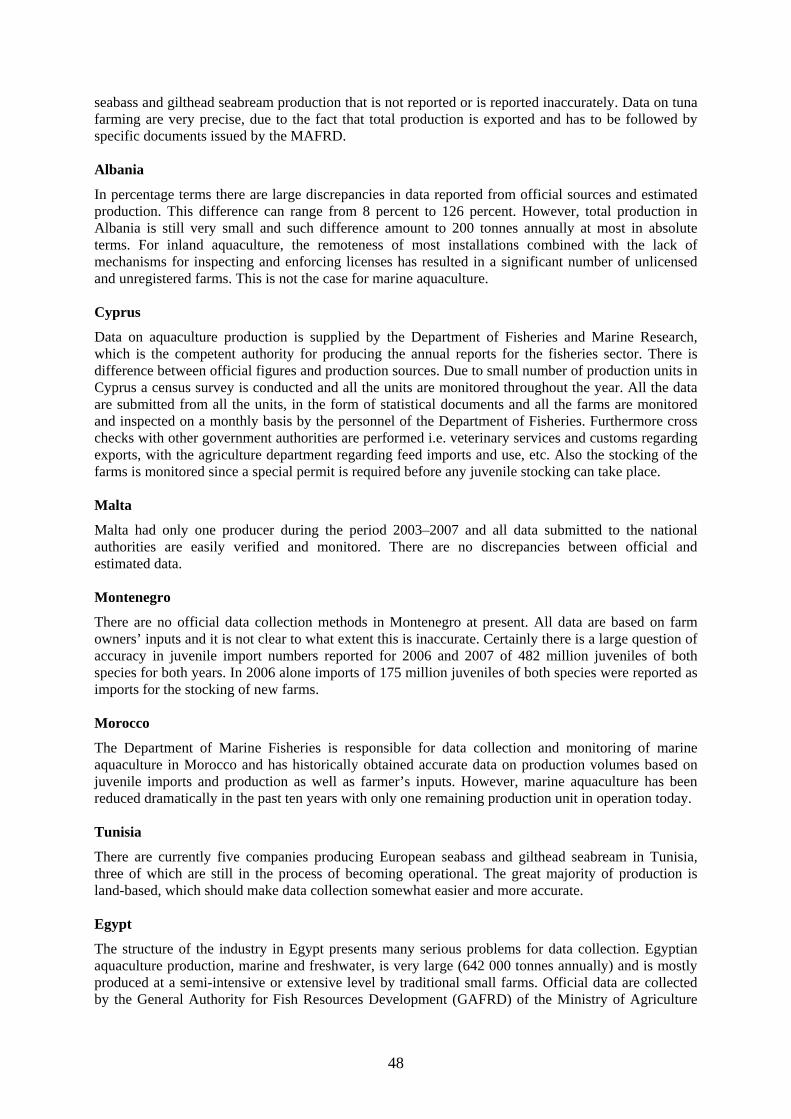
48
seabass and gilthead seabream production that is not reported or is reported inaccurately. Data on tuna farming are very precise, due to the fact that total production is exported and has to be followed by specific documents issued by the MAFRD. Albania
In percentage terms there are large discrepancies in data reported from official sources and estimated production. This difference can range from 8 percent to 126 percent. However, total production in Albania is still very small and such difference amount to 200 tonnes annually at most in absolute terms. For inland aquaculture, the remoteness of most installations combined with the lack of mechanisms for inspecting and enforcing licenses has resulted in a significant number of unlicensed and unregistered farms. This is not the case for marine aquaculture. Cyprus
Data on aquaculture production is supplied by the Department of Fisheries and Marine Research, which is the competent authority for producing the annual reports for the fisheries sector. There is difference between official figures and production sources. Due to small number of production units in Cyprus a census survey is conducted and all the units are monitored throughout the year. All the data are submitted from all the units, in the form of statistical documents and all the farms are monitored and inspected on a monthly basis by the personnel of the Department of Fisheries. Furthermore cross checks with other government authorities are performed i.e. veterinary services and customs regarding exports, with the agriculture department regarding feed imports and use, etc. Also the stocking of the farms is monitored since a special permit is required before any juvenile stocking can take place. Malta
Malta had only one producer during the period 2003–2007 and all data submitted to the national authorities are easily verified and monitored. There are no discrepancies between official and estimated data. Montenegro
There are no official data collection methods in Montenegro at present. All data are based on farm owners’ inputs and it is not clear to what extent this is inaccurate. Certainly there is a large question of accuracy in juvenile import numbers reported for 2006 and 2007 of 482 million juveniles of both species for both years. In 2006 alone imports of 175 million juveniles of both species were reported as imports for the stocking of new farms. Morocco
The Department of Marine Fisheries is responsible for data collection and monitoring of marine aquaculture in Morocco and has historically obtained accurate data on production volumes based on juvenile imports and production as well as farmer’s inputs. However, marine aquaculture has been reduced dramatically in the past ten years with only one remaining production unit in operation today. Tunisia
There are currently five companies producing European seabass and gilthead seabream in Tunisia, three of which are still in the process of becoming operational. The great majority of production is land-based, which should make data collection somewhat easier and more accurate. Egypt
The structure of the industry in Egypt presents many serious problems for data collection. Egyptian aquaculture production, marine and freshwater, is very large (642 000 tonnes annually) and is mostly produced at a semi-intensive or extensive level by traditional small farms. Official data are collected by the General Authority for Fish Resources Development (GAFRD) of the Ministry of Agriculture
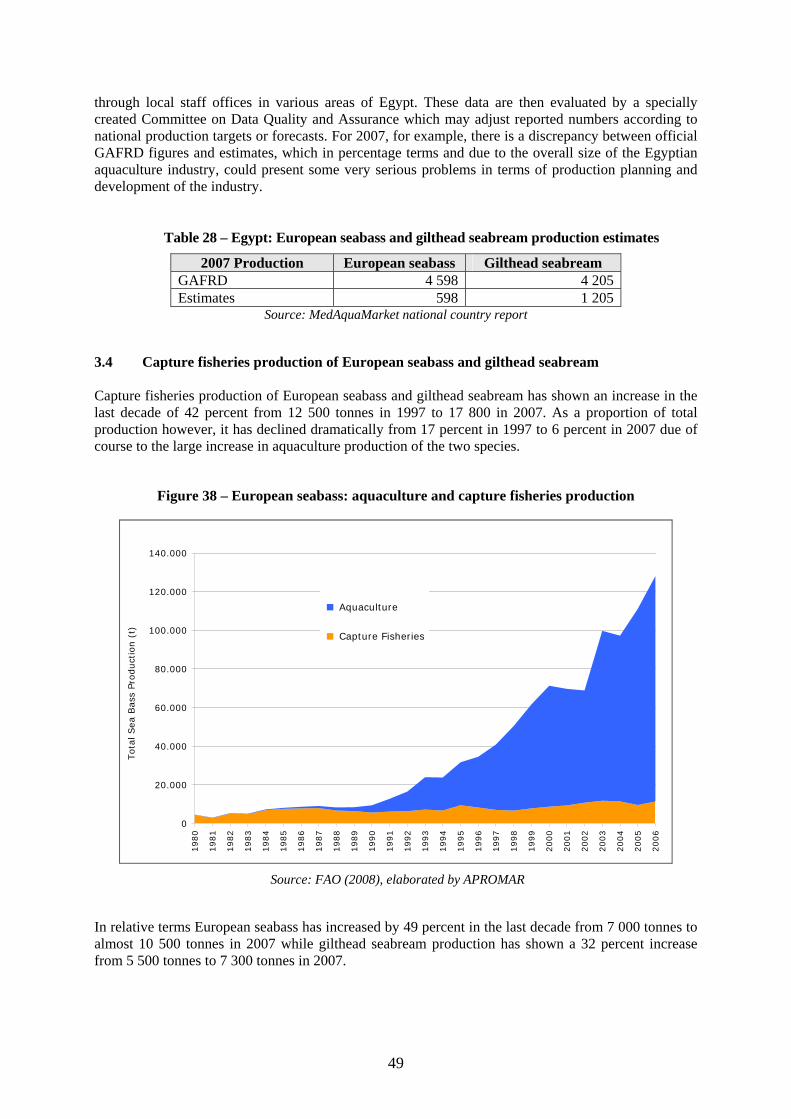
49
through local staff offices in various areas of Egypt. These data are then evaluated by a specially created Committee on Data Quality and Assurance which may adjust reported numbers according to national production targets or forecasts. For 2007, for example, there is a discrepancy between official GAFRD figures and estimates, which in percentage terms and due to the overall size of the Egyptian aquaculture industry, could present some very serious problems in terms of production planning and development of the industry.
Table 28 – Egypt: European seabass and gilthead seabream production estimates
2007 Production European seabass Gilthead seabream GAFRD 4 598 4 205 Estimates 598 1 205
Source: MedAquaMarket national country report
3.4 Capture fisheries production of European seabass and gilthead seabream Capture fisheries production of European seabass and gilthead seabream has shown an increase in the last decade of 42 percent from 12 500 tonnes in 1997 to 17 800 in 2007. As a proportion of total production however, it has declined dramatically from 17 percent in 1997 to 6 percent in 2007 due of course to the large increase in aquaculture production of the two species.
Figure 38 – European seabass: aquaculture and capture fisheries production
0
20.000
40.000
60.000
80.000
100.000
120.000
140.000
1980
1981
1982
1983
1984
1985
1986
1987
1988
1989
1990
1991
1992
1993
1994
1995
1996
1997
1998
1999
2000
2001
2002
2003
2004
2005
2006
Tota
l Sea
Bas
s Pr
oduct
ion (
t)
Aquaculture
Capture Fisheries
Source: FAO (2008), elaborated by APROMAR
In relative terms European seabass has increased by 49 percent in the last decade from 7 000 tonnes to almost 10 500 tonnes in 2007 while gilthead seabream production has shown a 32 percent increase from 5 500 tonnes to 7 300 tonnes in 2007.
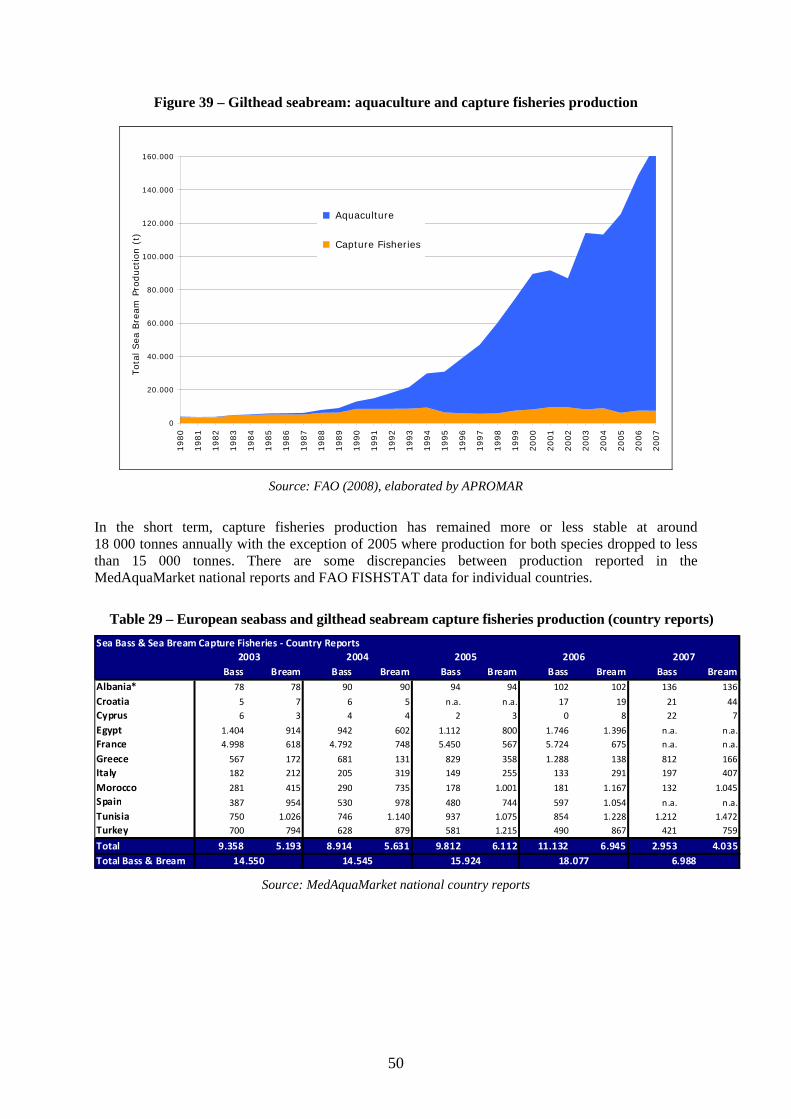
50
Figure 39 – Gilthead seabream: aquaculture and capture fisheries production
0
20.000
40.000
60.000
80.000
100.000
120.000
140.000
160.000
1980
1981
1982
1983
1984
1985
1986
1987
1988
1989
1990
1991
1992
1993
1994
1995
1996
1997
1998
1999
2000
2001
2002
2003
2004
2005
2006
2007
Tota
l Sea
Bre
am P
roduct
ion (
t)
Aquaculture
Capture Fisheries
Source: FAO (2008), elaborated by APROMAR
In the short term, capture fisheries production has remained more or less stable at around 18 000 tonnes annually with the exception of 2005 where production for both species dropped to less than 15 000 tonnes. There are some discrepancies between production reported in the MedAquaMarket national reports and FAO FISHSTAT data for individual countries.
Table 29 – European seabass and gilthead seabream capture fisheries production (country reports) Sea Bass & Sea Bream Capture Fisheries ‐ Country Reports
Bass Bream Bass Bream Bass Bream Bass Bream Bass BreamAlbania* 78 78 90 90 94 94 102 102 136 136
Croatia 5 7 6 5 n.a. n.a. 17 19 21 44Cyprus 6 3 4 4 2 3 0 8 22 7
Egypt 1.404 914 942 602 1.112 800 1.746 1.396 n.a. n.a.France 4.998 618 4.792 748 5.450 567 5.724 675 n.a. n.a.
Greece 567 172 681 131 829 358 1.288 138 812 166Italy 182 212 205 319 149 255 133 291 197 407
Morocco 281 415 290 735 178 1.001 181 1.167 132 1.045Spain 387 954 530 978 480 744 597 1.054 n.a. n.a.Tunisia 750 1.026 746 1.140 937 1.075 854 1.228 1.212 1.472Turkey 700 794 628 879 581 1.215 490 867 421 759
Total 9.358 5.193 8.914 5.631 9.812 6.112 11.132 6.945 2.953 4.035Total Bass & Bream
20072006200520042003
14.550 14.545 15.924 18.077 6.988 Source: MedAquaMarket national country reports
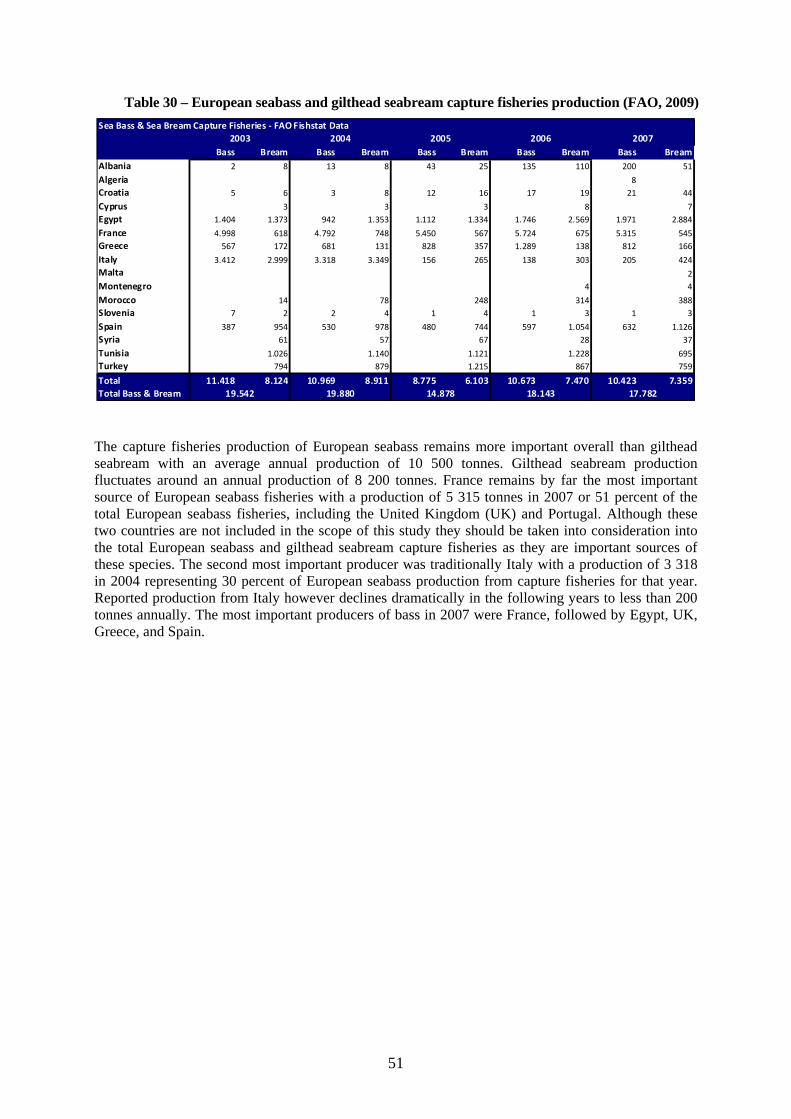
51
Table 30 – European seabass and gilthead seabream capture fisheries production (FAO, 2009) Sea Bass & Sea Bream Capture Fisheries ‐ FAO Fishstat Data
Bass Bream Bass Bream Bass Bream Bass Bream Bass BreamAlbania 2 8 13 8 43 25 135 110 200 51
Algeria 8Croatia 5 6 3 8 12 16 17 19 21 44
Cyprus 3 3 3 8 7Egypt 1.404 1.373 942 1.353 1.112 1.334 1.746 2.569 1.971 2.884
France 4.998 618 4.792 748 5.450 567 5.724 675 5.315 545Greece 567 172 681 131 828 357 1.289 138 812 166
Italy 3.412 2.999 3.318 3.349 156 265 138 303 205 424Malta 2Montenegro 4 4
Morocco 14 78 248 314 388Slovenia 7 2 2 4 1 4 1 3 1 3
Spain 387 954 530 978 480 744 597 1.054 632 1.126Syria 61 57 67 28 37
Tunisia 1.026 1.140 1.121 1.228 695Turkey 794 879 1.215 867 759
Total 11.418 8.124 10.969 8.911 8.775 6.103 10.673 7.470 10.423 7.359Total Bass & Bream
2003 2004 2005 2006 2007
19.542 19.880 14.878 18.143 17.782 The capture fisheries production of European seabass remains more important overall than gilthead seabream with an average annual production of 10 500 tonnes. Gilthead seabream production fluctuates around an annual production of 8 200 tonnes. France remains by far the most important source of European seabass fisheries with a production of 5 315 tonnes in 2007 or 51 percent of the total European seabass fisheries, including the United Kingdom (UK) and Portugal. Although these two countries are not included in the scope of this study they should be taken into consideration into the total European seabass and gilthead seabream capture fisheries as they are important sources of these species. The second most important producer was traditionally Italy with a production of 3 318 in 2004 representing 30 percent of European seabass production from capture fisheries for that year. Reported production from Italy however declines dramatically in the following years to less than 200 tonnes annually. The most important producers of bass in 2007 were France, followed by Egypt, UK, Greece, and Spain.
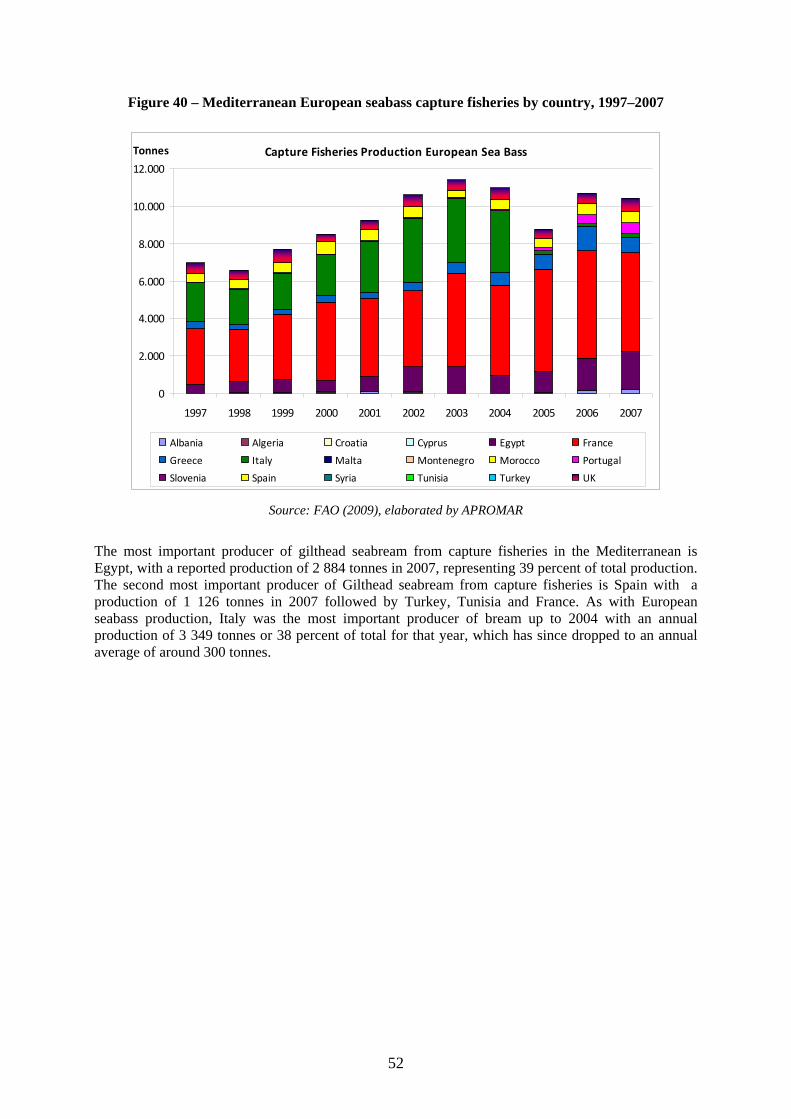
52
Figure 40 – Mediterranean European seabass capture fisheries by country, 1997–2007
Capture Fisheries Production European Sea Bass
0
2.000
4.000
6.000
8.000
10.000
12.000
1997 1998 1999 2000 2001 2002 2003 2004 2005 2006 2007
Tonnes
Albania Algeria Croatia Cyprus Egypt France
Greece Italy Malta Montenegro Morocco Portugal
Slovenia Spain Syria Tunisia Turkey UK
Source: FAO (2009), elaborated by APROMAR
The most important producer of gilthead seabream from capture fisheries in the Mediterranean is Egypt, with a reported production of 2 884 tonnes in 2007, representing 39 percent of total production. The second most important producer of Gilthead seabream from capture fisheries is Spain with a production of 1 126 tonnes in 2007 followed by Turkey, Tunisia and France. As with European seabass production, Italy was the most important producer of bream up to 2004 with an annual production of 3 349 tonnes or 38 percent of total for that year, which has since dropped to an annual average of around 300 tonnes.
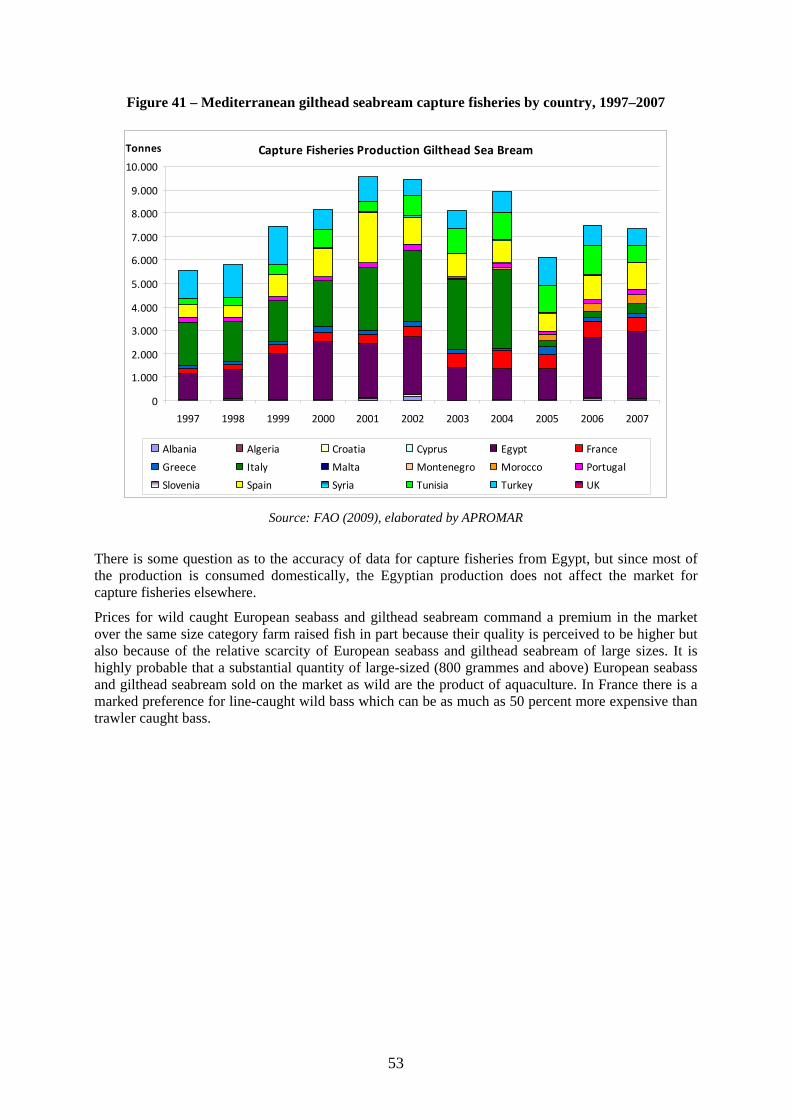
53
Figure 41 – Mediterranean gilthead seabream capture fisheries by country, 1997–2007
Capture Fisheries Production Gilthead Sea Bream
0
1.000
2.000
3.000
4.000
5.000
6.000
7.000
8.000
9.000
10.000
1997 1998 1999 2000 2001 2002 2003 2004 2005 2006 2007
Tonnes
Albania Algeria Croatia Cyprus Egypt France
Greece Italy Malta Montenegro Morocco Portugal
Slovenia Spain Syria Tunisia Turkey UK
Source: FAO (2009), elaborated by APROMAR
There is some question as to the accuracy of data for capture fisheries from Egypt, but since most of the production is consumed domestically, the Egyptian production does not affect the market for capture fisheries elsewhere.
Prices for wild caught European seabass and gilthead seabream command a premium in the market over the same size category farm raised fish in part because their quality is perceived to be higher but also because of the relative scarcity of European seabass and gilthead seabream of large sizes. It is highly probable that a substantial quantity of large-sized (800 grammes and above) European seabass and gilthead seabream sold on the market as wild are the product of aquaculture. In France there is a marked preference for line-caught wild bass which can be as much as 50 percent more expensive than trawler caught bass.
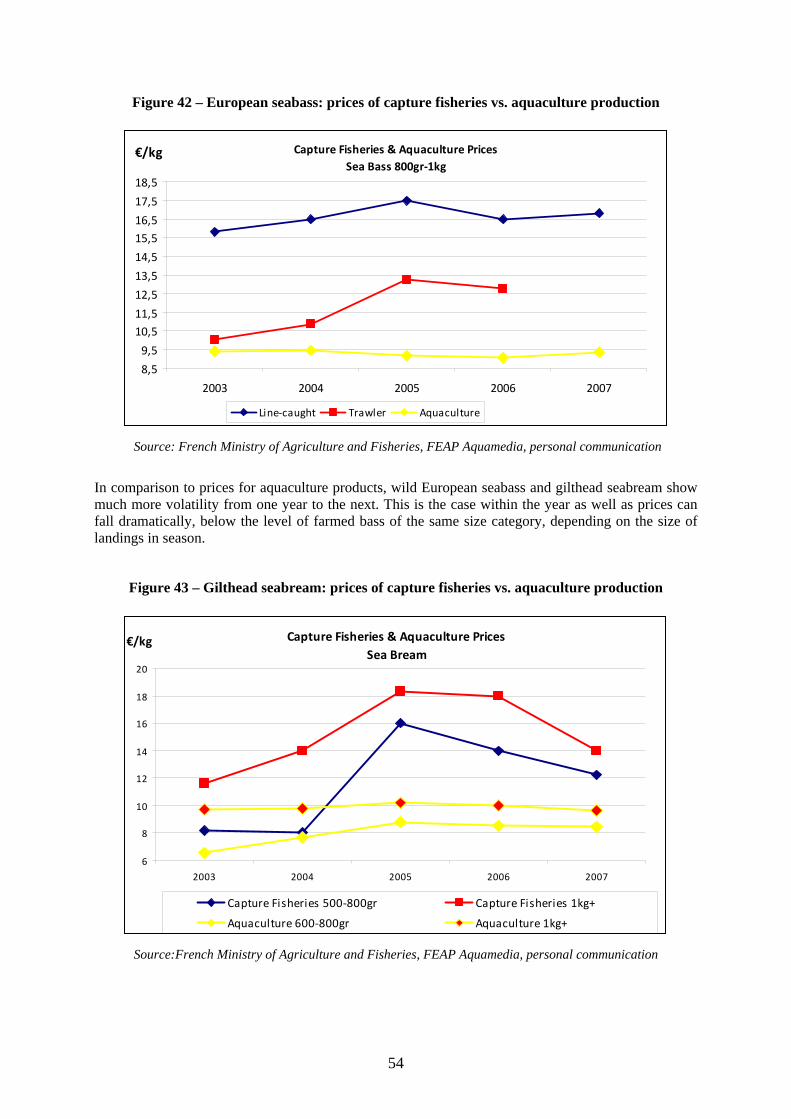
54
Figure 42 – European seabass: prices of capture fisheries vs. aquaculture production
Capture Fisheries & Aquaculture PricesSea Bass 800gr‐1kg
8,5
9,5
10,511,5
12,5
13,5
14,5
15,516,5
17,5
18,5
2003 2004 2005 2006 2007
€/kg
Line‐caught Trawler Aquaculture
Source: French Ministry of Agriculture and Fisheries, FEAP Aquamedia, personal communication
In comparison to prices for aquaculture products, wild European seabass and gilthead seabream show much more volatility from one year to the next. This is the case within the year as well as prices can fall dramatically, below the level of farmed bass of the same size category, depending on the size of landings in season.
Figure 43 – Gilthead seabream: prices of capture fisheries vs. aquaculture production
Capture Fisheries & Aquaculture PricesSea Bream
6
8
10
12
14
16
18
20
2003 2004 2005 2006 2007
€/kg
Capture Fisheries 500‐800gr Capture Fisheries 1kg+
Aquaculture 600‐800gr Aquaculture 1kg+
Source:French Ministry of Agriculture and Fisheries, FEAP Aquamedia, personal communication
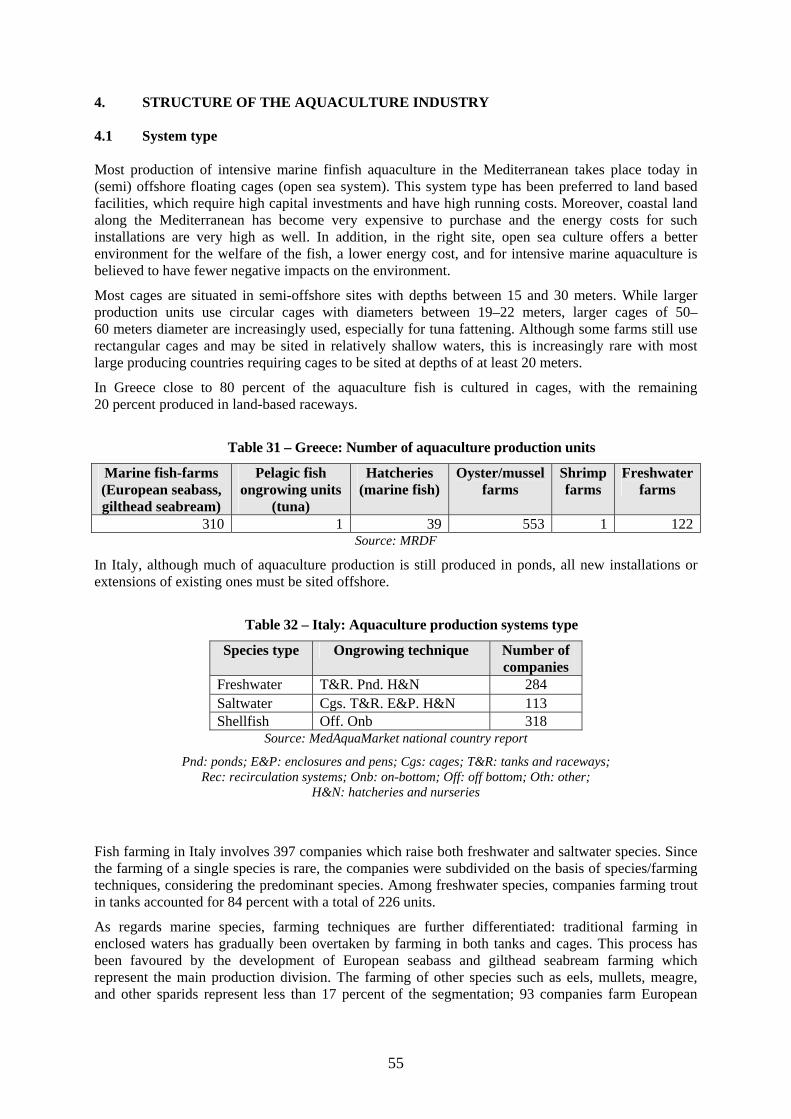
55
4. STRUCTURE OF THE AQUACULTURE INDUSTRY 4.1 System type Most production of intensive marine finfish aquaculture in the Mediterranean takes place today in (semi) offshore floating cages (open sea system). This system type has been preferred to land based facilities, which require high capital investments and have high running costs. Moreover, coastal land along the Mediterranean has become very expensive to purchase and the energy costs for such installations are very high as well. In addition, in the right site, open sea culture offers a better environment for the welfare of the fish, a lower energy cost, and for intensive marine aquaculture is believed to have fewer negative impacts on the environment.
Most cages are situated in semi-offshore sites with depths between 15 and 30 meters. While larger production units use circular cages with diameters between 19–22 meters, larger cages of 50– 60 meters diameter are increasingly used, especially for tuna fattening. Although some farms still use rectangular cages and may be sited in relatively shallow waters, this is increasingly rare with most large producing countries requiring cages to be sited at depths of at least 20 meters.
In Greece close to 80 percent of the aquaculture fish is cultured in cages, with the remaining 20 percent produced in land-based raceways.
Table 31 – Greece: Number of aquaculture production units
Marine fish-farms (European seabass, gilthead seabream)
Pelagic fish ongrowing units
(tuna)
Hatcheries (marine fish)
Oyster/mussel farms
Shrimp farms
Freshwater farms
310 1 39 553 1 122Source: MRDF
In Italy, although much of aquaculture production is still produced in ponds, all new installations or extensions of existing ones must be sited offshore.
Table 32 – Italy: Aquaculture production systems type
Species type Ongrowing technique Number of companies
Freshwater T&R. Pnd. H&N 284 Saltwater Cgs. T&R. E&P. H&N 113 Shellfish Off. Onb 318
Source: MedAquaMarket national country report
Pnd: ponds; E&P: enclosures and pens; Cgs: cages; T&R: tanks and raceways; Rec: recirculation systems; Onb: on-bottom; Off: off bottom; Oth: other;
H&N: hatcheries and nurseries
Fish farming in Italy involves 397 companies which raise both freshwater and saltwater species. Since the farming of a single species is rare, the companies were subdivided on the basis of species/farming techniques, considering the predominant species. Among freshwater species, companies farming trout in tanks accounted for 84 percent with a total of 226 units.
As regards marine species, farming techniques are further differentiated: traditional farming in enclosed waters has gradually been overtaken by farming in both tanks and cages. This process has been favoured by the development of European seabass and gilthead seabream farming which represent the main production division. The farming of other species such as eels, mullets, meagre, and other sparids represent less than 17 percent of the segmentation; 93 companies farm European
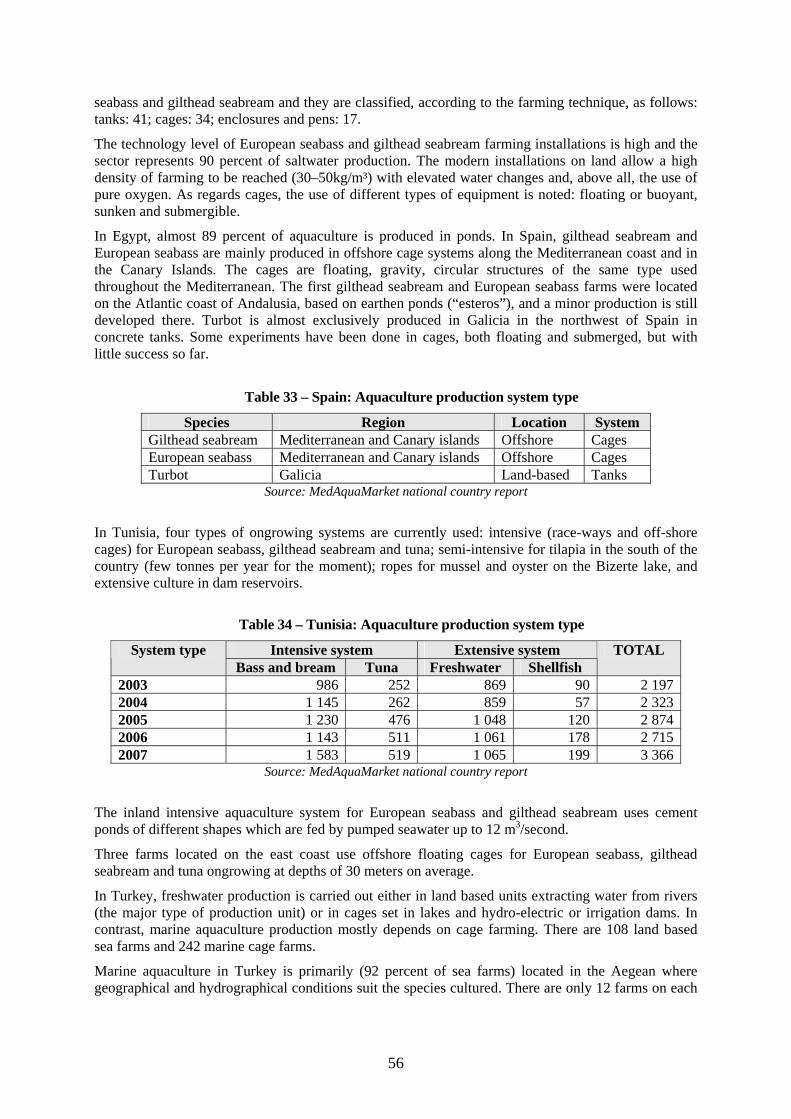
56
seabass and gilthead seabream and they are classified, according to the farming technique, as follows: tanks: 41; cages: 34; enclosures and pens: 17.
The technology level of European seabass and gilthead seabream farming installations is high and the sector represents 90 percent of saltwater production. The modern installations on land allow a high density of farming to be reached (30–50kg/m³) with elevated water changes and, above all, the use of pure oxygen. As regards cages, the use of different types of equipment is noted: floating or buoyant, sunken and submergible.
In Egypt, almost 89 percent of aquaculture is produced in ponds. In Spain, gilthead seabream and European seabass are mainly produced in offshore cage systems along the Mediterranean coast and in the Canary Islands. The cages are floating, gravity, circular structures of the same type used throughout the Mediterranean. The first gilthead seabream and European seabass farms were located on the Atlantic coast of Andalusia, based on earthen ponds (“esteros”), and a minor production is still developed there. Turbot is almost exclusively produced in Galicia in the northwest of Spain in concrete tanks. Some experiments have been done in cages, both floating and submerged, but with little success so far.
Table 33 – Spain: Aquaculture production system type
Species Region Location System Gilthead seabream Mediterranean and Canary islands Offshore Cages European seabass Mediterranean and Canary islands Offshore Cages Turbot Galicia Land-based Tanks
Source: MedAquaMarket national country report
In Tunisia, four types of ongrowing systems are currently used: intensive (race-ways and off-shore cages) for European seabass, gilthead seabream and tuna; semi-intensive for tilapia in the south of the country (few tonnes per year for the moment); ropes for mussel and oyster on the Bizerte lake, and extensive culture in dam reservoirs.
Table 34 – Tunisia: Aquaculture production system type
Intensive system Extensive system System type Bass and bream Tuna Freshwater Shellfish
TOTAL
2003 986 252 869 90 2 1972004 1 145 262 859 57 2 3232005 1 230 476 1 048 120 2 8742006 1 143 511 1 061 178 2 7152007 1 583 519 1 065 199 3 366
Source: MedAquaMarket national country report
The inland intensive aquaculture system for European seabass and gilthead seabream uses cement ponds of different shapes which are fed by pumped seawater up to 12 m3/second.
Three farms located on the east coast use offshore floating cages for European seabass, gilthead seabream and tuna ongrowing at depths of 30 meters on average.
In Turkey, freshwater production is carried out either in land based units extracting water from rivers (the major type of production unit) or in cages set in lakes and hydro-electric or irrigation dams. In contrast, marine aquaculture production mostly depends on cage farming. There are 108 land based sea farms and 242 marine cage farms.
Marine aquaculture in Turkey is primarily (92 percent of sea farms) located in the Aegean where geographical and hydrographical conditions suit the species cultured. There are only 12 farms on each
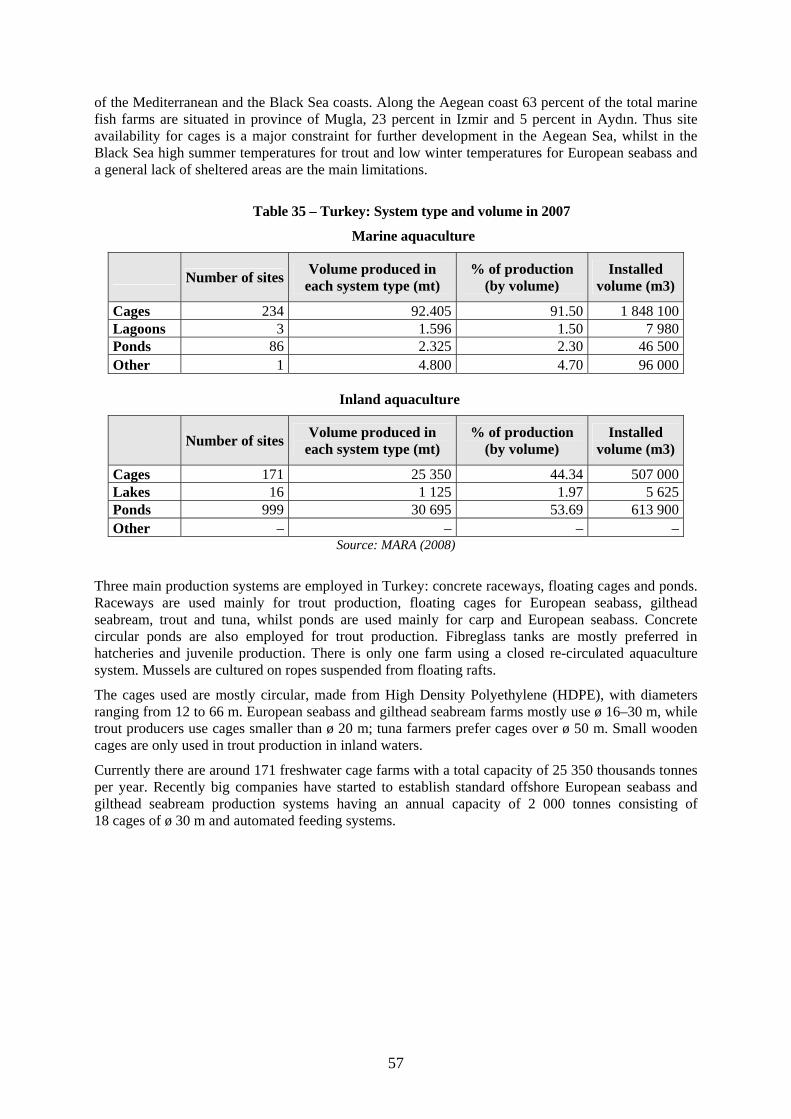
57
of the Mediterranean and the Black Sea coasts. Along the Aegean coast 63 percent of the total marine fish farms are situated in province of Mugla, 23 percent in Izmir and 5 percent in Aydın. Thus site availability for cages is a major constraint for further development in the Aegean Sea, whilst in the Black Sea high summer temperatures for trout and low winter temperatures for European seabass and a general lack of sheltered areas are the main limitations.
Table 35 – Turkey: System type and volume in 2007
Marine aquaculture
Number of sites Volume produced in
each system type (mt) % of production
(by volume) Installed
volume (m3)
Cages 234 92.405 91.50 1 848 100Lagoons 3 1.596 1.50 7 980Ponds 86 2.325 2.30 46 500Other 1 4.800 4.70 96 000
Inland aquaculture
Number of sites Volume produced in each system type (mt)
% of production (by volume)
Installed volume (m3)
Cages 171 25 350 44.34 507 000Lakes 16 1 125 1.97 5 625Ponds 999 30 695 53.69 613 900Other – – – –
Source: MARA (2008)
Three main production systems are employed in Turkey: concrete raceways, floating cages and ponds. Raceways are used mainly for trout production, floating cages for European seabass, gilthead seabream, trout and tuna, whilst ponds are used mainly for carp and European seabass. Concrete circular ponds are also employed for trout production. Fibreglass tanks are mostly preferred in hatcheries and juvenile production. There is only one farm using a closed re-circulated aquaculture system. Mussels are cultured on ropes suspended from floating rafts.
The cages used are mostly circular, made from High Density Polyethylene (HDPE), with diameters ranging from 12 to 66 m. European seabass and gilthead seabream farms mostly use ø 16–30 m, while trout producers use cages smaller than ø 20 m; tuna farmers prefer cages over ø 50 m. Small wooden cages are only used in trout production in inland waters.
Currently there are around 171 freshwater cage farms with a total capacity of 25 350 thousands tonnes per year. Recently big companies have started to establish standard offshore European seabass and gilthead seabream production systems having an annual capacity of 2 000 tonnes consisting of 18 cages of ø 30 m and automated feeding systems.
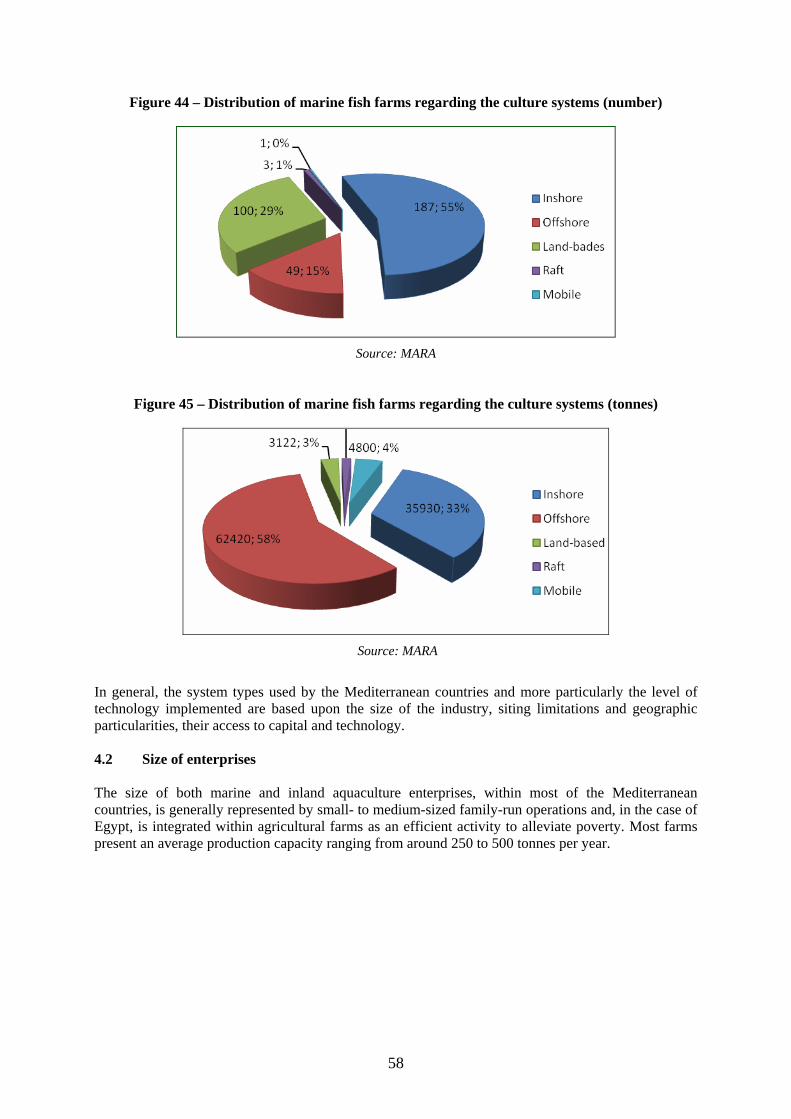
58
Figure 44 – Distribution of marine fish farms regarding the culture systems (number)
Source: MARA
Figure 45 – Distribution of marine fish farms regarding the culture systems (tonnes)
Source: MARA
In general, the system types used by the Mediterranean countries and more particularly the level of technology implemented are based upon the size of the industry, siting limitations and geographic particularities, their access to capital and technology. 4.2 Size of enterprises The size of both marine and inland aquaculture enterprises, within most of the Mediterranean countries, is generally represented by small- to medium-sized family-run operations and, in the case of Egypt, is integrated within agricultural farms as an efficient activity to alleviate poverty. Most farms present an average production capacity ranging from around 250 to 500 tonnes per year.
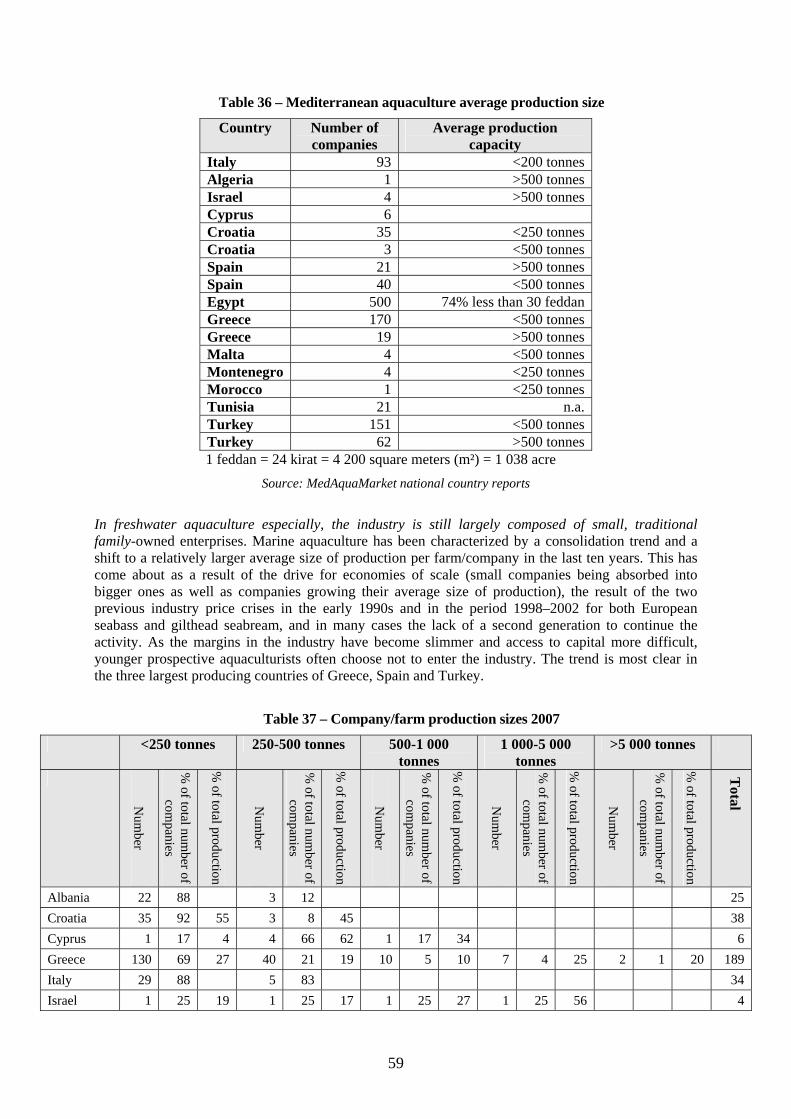
59
Table 36 – Mediterranean aquaculture average production size
Country Number of companies
Average production capacity
Italy 93 <200 tonnes Algeria 1 >500 tonnes Israel 4 >500 tonnes Cyprus 6 Croatia 35 <250 tonnes Croatia 3 <500 tonnes Spain 21 >500 tonnes Spain 40 <500 tonnes Egypt 500 74% less than 30 feddan Greece 170 <500 tonnes Greece 19 >500 tonnes Malta 4 <500 tonnes Montenegro 4 <250 tonnes Morocco 1 <250 tonnes Tunisia 21 n.a. Turkey 151 <500 tonnes Turkey 62 >500 tonnes
1 feddan = 24 kirat = 4 200 square meters (m²) = 1 038 acre Source: MedAquaMarket national country reports
In freshwater aquaculture especially, the industry is still largely composed of small, traditional family-owned enterprises. Marine aquaculture has been characterized by a consolidation trend and a shift to a relatively larger average size of production per farm/company in the last ten years. This has come about as a result of the drive for economies of scale (small companies being absorbed into bigger ones as well as companies growing their average size of production), the result of the two previous industry price crises in the early 1990s and in the period 1998–2002 for both European seabass and gilthead seabream, and in many cases the lack of a second generation to continue the activity. As the margins in the industry have become slimmer and access to capital more difficult, younger prospective aquaculturists often choose not to enter the industry. The trend is most clear in the three largest producing countries of Greece, Spain and Turkey.
Table 37 – Company/farm production sizes 2007
<250 tonnes 250-500 tonnes 500-1 000 tonnes
1 000-5 000 tonnes
>5 000 tonnes
Num
ber
% of total num
ber of com
panies
% of total production
Num
ber
% of total num
ber of com
panies
% of total production
Num
ber
% of total num
ber of com
panies
% of total production
Num
ber
% of total num
ber of com
panies
% of total production
Num
ber
% of total num
ber of com
panies
% of total production
Total
Albania 22 88 3 12 25 Croatia 35 92 55 3 8 45 38 Cyprus 1 17 4 4 66 62 1 17 34 6 Greece 130 69 27 40 21 19 10 5 10 7 4 25 2 1 20 189 Italy 29 88 5 83 34 Israel 1 25 19 1 25 17 1 25 27 1 25 56 4
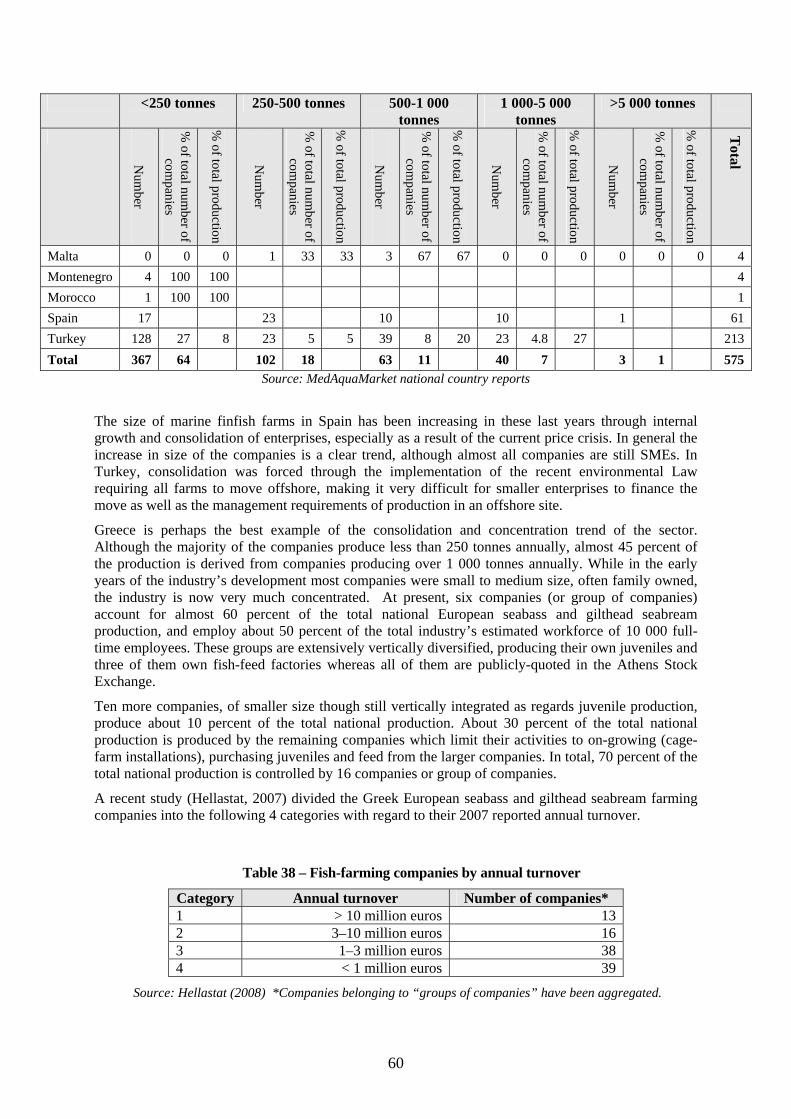
60
<250 tonnes 250-500 tonnes 500-1 000 tonnes
1 000-5 000 tonnes
>5 000 tonnes
Num
ber
% of total num
ber of com
panies
% of total production
Num
ber
% of total num
ber of com
panies
% of total production
Num
ber
% of total num
ber of com
panies
% of total production
Num
ber
% of total num
ber of com
panies
% of total production
Num
ber
% of total num
ber of com
panies
% of total production
Total
Malta 0 0 0 1 33 33 3 67 67 0 0 0 0 0 0 4 Montenegro 4 100 100 4 Morocco 1 100 100 1 Spain 17 23 10 10 1 61 Turkey 128 27 8 23 5 5 39 8 20 23 4.8 27 213 Total 367 64 102 18 63 11 40 7 3 1 575
Source: MedAquaMarket national country reports
The size of marine finfish farms in Spain has been increasing in these last years through internal growth and consolidation of enterprises, especially as a result of the current price crisis. In general the increase in size of the companies is a clear trend, although almost all companies are still SMEs. In Turkey, consolidation was forced through the implementation of the recent environmental Law requiring all farms to move offshore, making it very difficult for smaller enterprises to finance the move as well as the management requirements of production in an offshore site.
Greece is perhaps the best example of the consolidation and concentration trend of the sector. Although the majority of the companies produce less than 250 tonnes annually, almost 45 percent of the production is derived from companies producing over 1 000 tonnes annually. While in the early years of the industry’s development most companies were small to medium size, often family owned, the industry is now very much concentrated. At present, six companies (or group of companies) account for almost 60 percent of the total national European seabass and gilthead seabream production, and employ about 50 percent of the total industry’s estimated workforce of 10 000 full-time employees. These groups are extensively vertically diversified, producing their own juveniles and three of them own fish-feed factories whereas all of them are publicly-quoted in the Athens Stock Exchange.
Ten more companies, of smaller size though still vertically integrated as regards juvenile production, produce about 10 percent of the total national production. About 30 percent of the total national production is produced by the remaining companies which limit their activities to on-growing (cage-farm installations), purchasing juveniles and feed from the larger companies. In total, 70 percent of the total national production is controlled by 16 companies or group of companies.
A recent study (Hellastat, 2007) divided the Greek European seabass and gilthead seabream farming companies into the following 4 categories with regard to their 2007 reported annual turnover.
Table 38 – Fish-farming companies by annual turnover
Category Annual turnover Number of companies* 1 > 10 million euros 13 2 3–10 million euros 16 3 1–3 million euros 38 4 < 1 million euros 39
Source: Hellastat (2008) *Companies belonging to “groups of companies” have been aggregated.
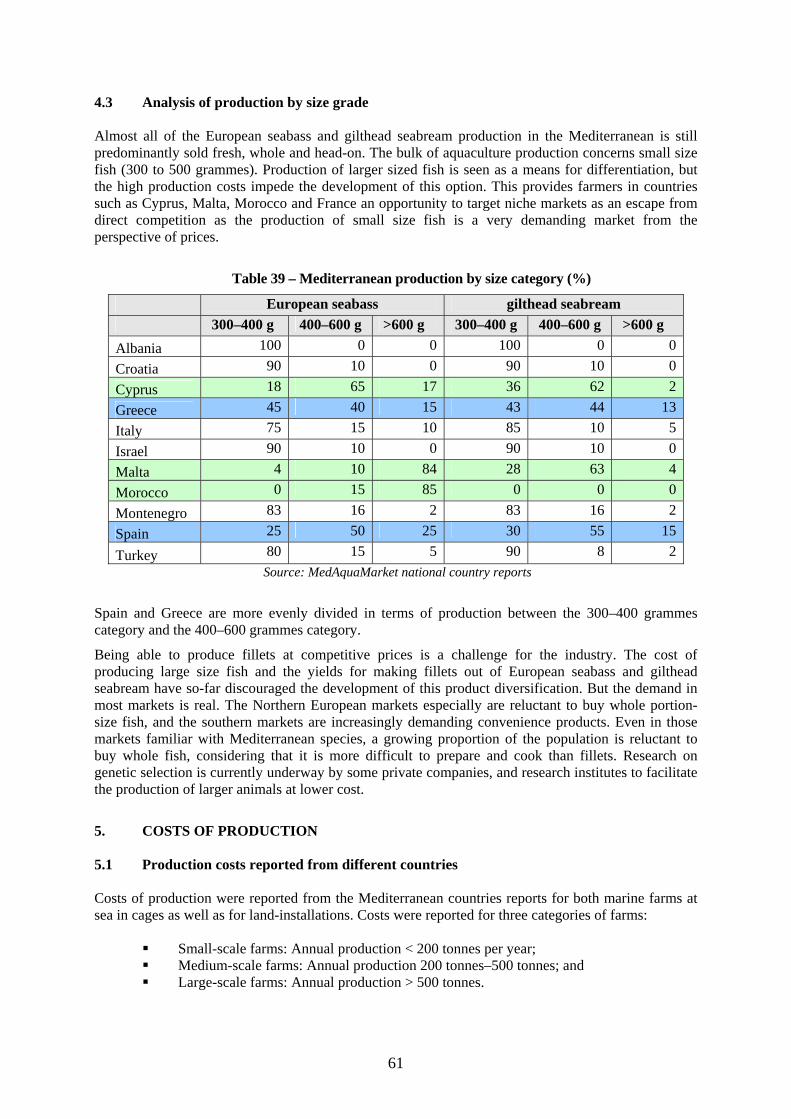
61
4.3 Analysis of production by size grade Almost all of the European seabass and gilthead seabream production in the Mediterranean is still predominantly sold fresh, whole and head-on. The bulk of aquaculture production concerns small size fish (300 to 500 grammes). Production of larger sized fish is seen as a means for differentiation, but the high production costs impede the development of this option. This provides farmers in countries such as Cyprus, Malta, Morocco and France an opportunity to target niche markets as an escape from direct competition as the production of small size fish is a very demanding market from the perspective of prices.
Table 39 – Mediterranean production by size category (%)
European seabass gilthead seabream 300–400 g 400–600 g >600 g 300–400 g 400–600 g >600 g Albania 100 0 0 100 0 0Croatia 90 10 0 90 10 0Cyprus 18 65 17 36 62 2Greece 45 40 15 43 44 13Italy 75 15 10 85 10 5Israel 90 10 0 90 10 0Malta 4 10 84 28 63 4Morocco 0 15 85 0 0 0Montenegro 83 16 2 83 16 2Spain 25 50 25 30 55 15
Turkey 80 15 5 90 8 2 Source: MedAquaMarket national country reports
Spain and Greece are more evenly divided in terms of production between the 300–400 grammes category and the 400–600 grammes category.
Being able to produce fillets at competitive prices is a challenge for the industry. The cost of producing large size fish and the yields for making fillets out of European seabass and gilthead seabream have so-far discouraged the development of this product diversification. But the demand in most markets is real. The Northern European markets especially are reluctant to buy whole portion-size fish, and the southern markets are increasingly demanding convenience products. Even in those markets familiar with Mediterranean species, a growing proportion of the population is reluctant to buy whole fish, considering that it is more difficult to prepare and cook than fillets. Research on genetic selection is currently underway by some private companies, and research institutes to facilitate the production of larger animals at lower cost.
5. COSTS OF PRODUCTION 5.1 Production costs reported from different countries Costs of production were reported from the Mediterranean countries reports for both marine farms at sea in cages as well as for land-installations. Costs were reported for three categories of farms:
Small-scale farms: Annual production < 200 tonnes per year; Medium-scale farms: Annual production 200 tonnes–500 tonnes; and Large-scale farms: Annual production > 500 tonnes.
62
Depending on the size of the industry some of the categories referred to slightly different production sizes, for example a large-scale farm was defined in Greece and Turkey as being > 1 000 tonnes. Other countries reported differences based on the level of vertical integration, related to size of production, such as whether the farms had their own hatchery or feed mill.
In order to get a picture of the significance of economies of scale, costs were divided into fixed and flexible:
Variable costs:
feed; juveniles; labour; energy; marketing (including packing); medicines and vet. ser.; and other.
Fixed costs:
management; depreciation; financial (interest on capital investment); maintenance; fees and rents; and other.
All costs are presented as a percentage of total cost for comparison across categories and countries to be relevant. The assumption is that the cost of production is calculated for a portion size product, 300–500 grammes, with an 80 percent survival rate, 3.2 juveniles used for a kilo of portion size fish, and a feed conversion rate of 2:1. European seabass and gilthead seabream are most often produced together and although they have differences in both growth rates, food conversion ratio (FCR) and handling, their production costs are calculated together, on a farm or cage group basis.
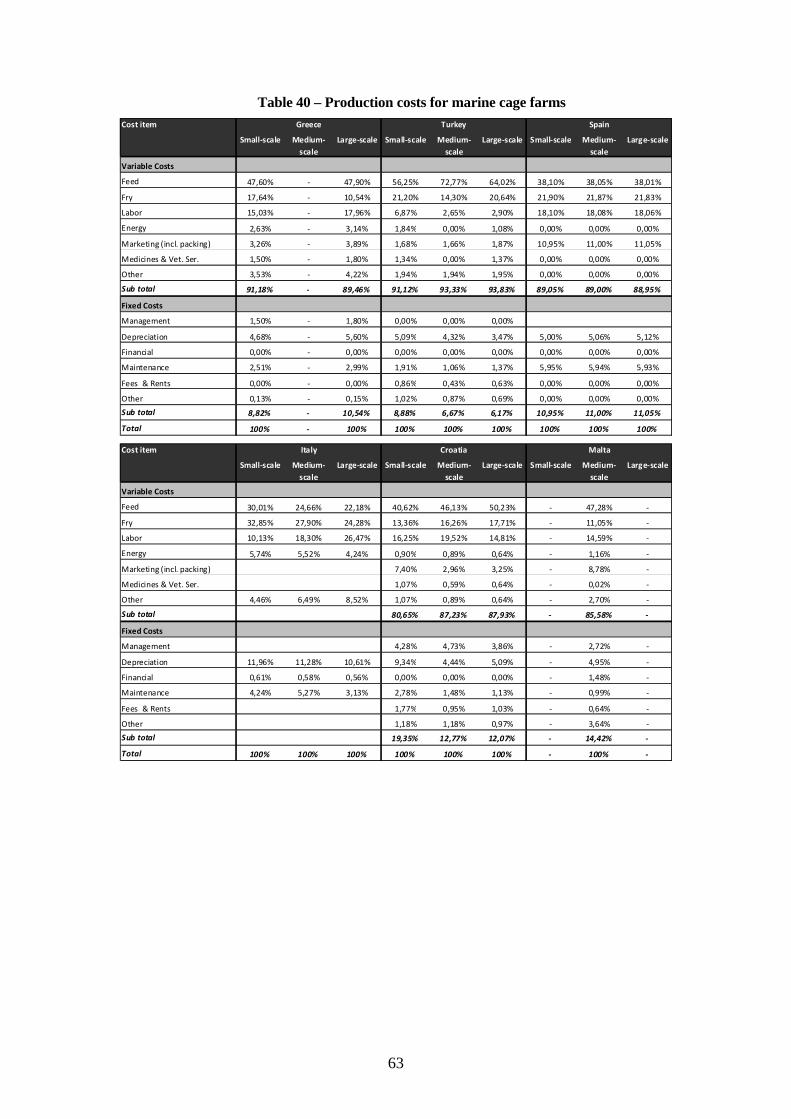
63
Table 40 – Production costs for marine cage farms Cost item
Small‐scale Medium‐scale
Large‐scale Small‐scale Medium‐scale
Large‐scale Small‐scale Medium‐scale
Large‐scale
Variable Costs
Feed 47,60% ‐ 47,90% 56,25% 72,77% 64,02% 38,10% 38,05% 38,01%
Fry 17,64% ‐ 10,54% 21,20% 14,30% 20,64% 21,90% 21,87% 21,83%
Labor 15,03% ‐ 17,96% 6,87% 2,65% 2,90% 18,10% 18,08% 18,06%
Energy 2,63% ‐ 3,14% 1,84% 0,00% 1,08% 0,00% 0,00% 0,00%
Marketing (incl. packing) 3,26% ‐ 3,89% 1,68% 1,66% 1,87% 10,95% 11,00% 11,05%
Medicines & Vet. Ser. 1,50% ‐ 1,80% 1,34% 0,00% 1,37% 0,00% 0,00% 0,00%
Other 3,53% ‐ 4,22% 1,94% 1,94% 1,95% 0,00% 0,00% 0,00%
Sub total 91,18% ‐ 89,46% 91,12% 93,33% 93,83% 89,05% 89,00% 88,95%
Fixed Costs
Management 1,50% ‐ 1,80% 0,00% 0,00% 0,00%
Depreciation 4,68% ‐ 5,60% 5,09% 4,32% 3,47% 5,00% 5,06% 5,12%
Financial 0,00% ‐ 0,00% 0,00% 0,00% 0,00% 0,00% 0,00% 0,00%
Maintenance 2,51% ‐ 2,99% 1,91% 1,06% 1,37% 5,95% 5,94% 5,93%
Fees & Rents 0,00% ‐ 0,00% 0,86% 0,43% 0,63% 0,00% 0,00% 0,00%
Other 0,13% ‐ 0,15% 1,02% 0,87% 0,69% 0,00% 0,00% 0,00%
Sub total 8,82% ‐ 10,54% 8,88% 6,67% 6,17% 10,95% 11,00% 11,05%
Total 100% ‐ 100% 100% 100% 100% 100% 100% 100%
TurkeyGreece Spain
Cost item
Small‐scale Medium‐scale
Large‐scale Small‐scale Medium‐scale
Large‐scale Small‐scale Medium‐scale
Large‐scale
Variable Costs
Feed 30,01% 24,66% 22,18% 40,62% 46,13% 50,23% ‐ 47,28% ‐
Fry 32,85% 27,90% 24,28% 13,36% 16,26% 17,71% ‐ 11,05% ‐
Labor 10,13% 18,30% 26,47% 16,25% 19,52% 14,81% ‐ 14,59% ‐
Energy 5,74% 5,52% 4,24% 0,90% 0,89% 0,64% ‐ 1,16% ‐
Marketing (incl. packing) 7,40% 2,96% 3,25% ‐ 8,78% ‐
Medicines & Vet. Ser. 1,07% 0,59% 0,64% ‐ 0,02% ‐
Other 4,46% 6,49% 8,52% 1,07% 0,89% 0,64% ‐ 2,70% ‐
Sub total 80,65% 87,23% 87,93% ‐ 85,58% ‐
Fixed Costs
Management 4,28% 4,73% 3,86% ‐ 2,72% ‐
Depreciation 11,96% 11,28% 10,61% 9,34% 4,44% 5,09% ‐ 4,95% ‐
Financial 0,61% 0,58% 0,56% 0,00% 0,00% 0,00% ‐ 1,48% ‐
Maintenance 4,24% 5,27% 3,13% 2,78% 1,48% 1,13% ‐ 0,99% ‐
Fees & Rents 1,77% 0,95% 1,03% ‐ 0,64% ‐
Other 1,18% 1,18% 0,97% ‐ 3,64% ‐
Sub total 19,35% 12,77% 12,07% ‐ 14,42% ‐
Total 100% 100% 100% 100% 100% 100% ‐ 100% ‐
Italy MaltaCroatia
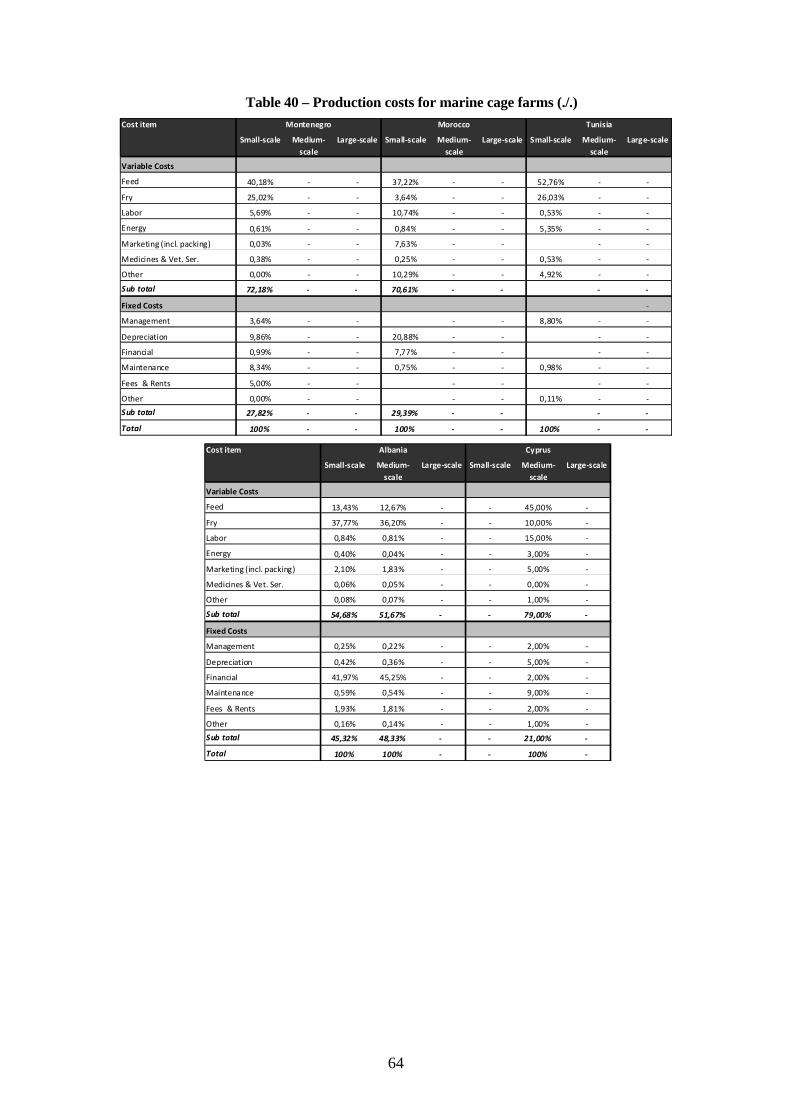
64
Table 40 – Production costs for marine cage farms (./.) Cost item
Small‐scale Medium‐scale
Large‐scale Small‐scale Medium‐scale
Large‐scale Small‐scale Medium‐scale
Large‐scale
Variable Costs
Feed 40,18% ‐ ‐ 37,22% ‐ ‐ 52,76% ‐ ‐
Fry 25,02% ‐ ‐ 3,64% ‐ ‐ 26,03% ‐ ‐
Labor 5,69% ‐ ‐ 10,74% ‐ ‐ 0,53% ‐ ‐
Energy 0,61% ‐ ‐ 0,84% ‐ ‐ 5,35% ‐ ‐
Marketing (incl. packing) 0,03% ‐ ‐ 7,63% ‐ ‐ ‐ ‐
Medicines & Vet. Ser. 0,38% ‐ ‐ 0,25% ‐ ‐ 0,53% ‐ ‐
Other 0,00% ‐ ‐ 10,29% ‐ ‐ 4,92% ‐ ‐
Sub total 72,18% ‐ ‐ 70,61% ‐ ‐ ‐ ‐
Fixed Costs ‐
Management 3,64% ‐ ‐ ‐ ‐ 8,80% ‐ ‐
Depreciation 9,86% ‐ ‐ 20,88% ‐ ‐ ‐ ‐
Financial 0,99% ‐ ‐ 7,77% ‐ ‐ ‐ ‐
Maintenance 8,34% ‐ ‐ 0,75% ‐ ‐ 0,98% ‐ ‐
Fees & Rents 5,00% ‐ ‐ ‐ ‐ ‐ ‐
Other 0,00% ‐ ‐ ‐ ‐ 0,11% ‐ ‐
Sub total 27,82% ‐ ‐ 29,39% ‐ ‐ ‐ ‐
Total 100% ‐ ‐ 100% ‐ ‐ 100% ‐ ‐
Montenegro Morocco Tunisia
Cost item
Small‐scale Medium‐scale
Large‐scale Small‐scale Medium‐scale
Large‐scale
Variable Costs
Feed 13,43% 12,67% ‐ ‐ 45,00% ‐
Fry 37,77% 36,20% ‐ ‐ 10,00% ‐
Labor 0,84% 0,81% ‐ ‐ 15,00% ‐
Energy 0,40% 0,04% ‐ ‐ 3,00% ‐
Marketing (incl. packing) 2,10% 1,83% ‐ ‐ 5,00% ‐
Medicines & Vet. Ser. 0,06% 0,05% ‐ ‐ 0,00% ‐
Other 0,08% 0,07% ‐ ‐ 1,00% ‐
Sub total 54,68% 51,67% ‐ ‐ 79,00% ‐
Fixed Costs
Management 0,25% 0,22% ‐ ‐ 2,00% ‐
Depreciation 0,42% 0,36% ‐ ‐ 5,00% ‐
Financial 41,97% 45,25% ‐ ‐ 2,00% ‐
Maintenance 0,59% 0,54% ‐ ‐ 9,00% ‐
Fees & Rents 1,93% 1,81% ‐ ‐ 2,00% ‐
Other 0,16% 0,14% ‐ ‐ 1,00% ‐
Sub total 45,32% 48,33% ‐ ‐ 21,00% ‐
Total 100% 100% ‐ ‐ 100% ‐
CyprusAlbania
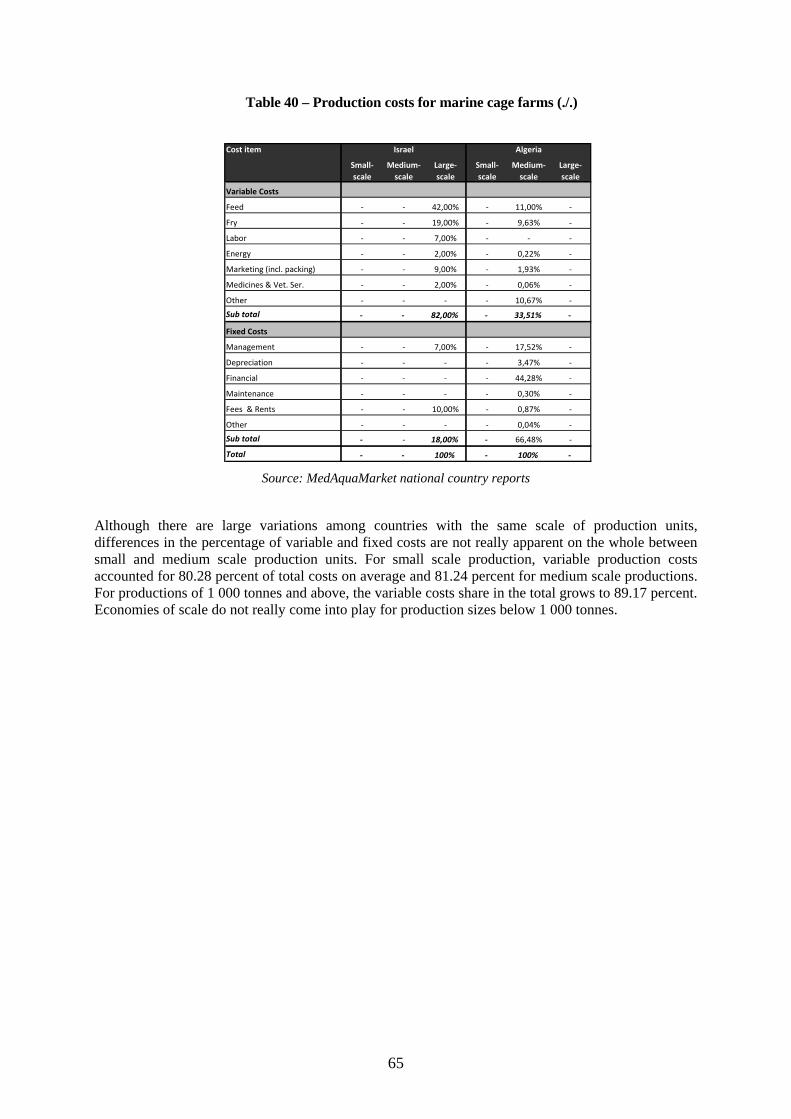
65
Table 40 – Production costs for marine cage farms (./.)
Cost item
Small‐scale
Medium‐scale
Large‐scale
Small‐scale
Medium‐scale
Large‐scale
Variable Costs
Feed ‐ ‐ 42,00% ‐ 11,00% ‐
Fry ‐ ‐ 19,00% ‐ 9,63% ‐
Labor ‐ ‐ 7,00% ‐ ‐ ‐
Energy ‐ ‐ 2,00% ‐ 0,22% ‐
Marketing (incl. packing) ‐ ‐ 9,00% ‐ 1,93% ‐
Medicines & Vet. Ser. ‐ ‐ 2,00% ‐ 0,06% ‐
Other ‐ ‐ ‐ ‐ 10,67% ‐
Sub total ‐ ‐ 82,00% ‐ 33,51% ‐
Fixed Costs
Management ‐ ‐ 7,00% ‐ 17,52% ‐
Depreciation ‐ ‐ ‐ ‐ 3,47% ‐
Financial ‐ ‐ ‐ ‐ 44,28% ‐
Maintenance ‐ ‐ ‐ ‐ 0,30% ‐
Fees & Rents ‐ ‐ 10,00% ‐ 0,87% ‐
Other ‐ ‐ ‐ ‐ 0,04% ‐
Sub total ‐ ‐ 18,00% ‐ 66,48% ‐
Total ‐ ‐ 100% ‐ 100% ‐
Israel Algeria
Source: MedAquaMarket national country reports
Although there are large variations among countries with the same scale of production units, differences in the percentage of variable and fixed costs are not really apparent on the whole between small and medium scale production units. For small scale production, variable production costs accounted for 80.28 percent of total costs on average and 81.24 percent for medium scale productions. For productions of 1 000 tonnes and above, the variable costs share in the total grows to 89.17 percent. Economies of scale do not really come into play for production sizes below 1 000 tonnes.
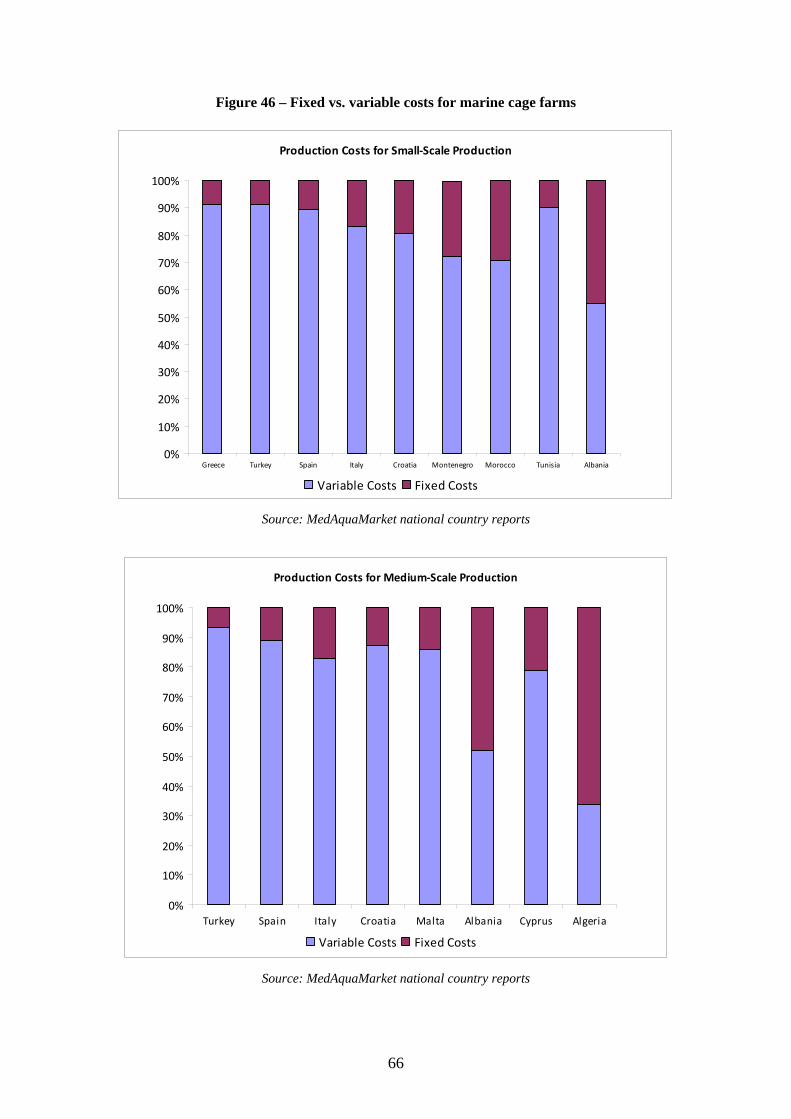
66
Figure 46 – Fixed vs. variable costs for marine cage farms
Production Costs for Small‐Scale Production
0%
10%
20%
30%
40%
50%
60%
70%
80%
90%
100%
Greece Turkey Spain Italy Croatia Montenegro Morocco Tunisia Albania
Variable Costs Fixed Costs
Source: MedAquaMarket national country reports
Production Costs for Medium‐Scale Production
0%
10%
20%
30%
40%
50%
60%
70%
80%
90%
100%
Turkey Spain Italy Croatia Malta Albania Cyprus Algeria
Variable Costs Fixed Costs
Source: MedAquaMarket national country reports
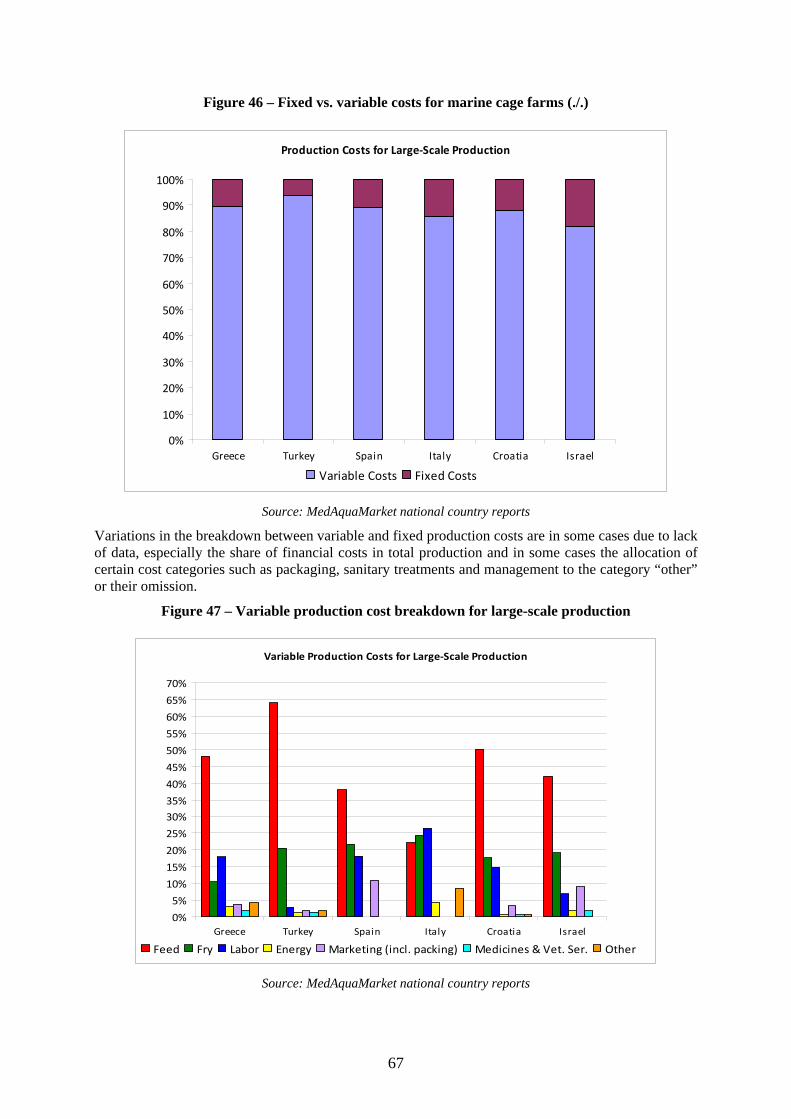
67
Figure 46 – Fixed vs. variable costs for marine cage farms (./.)
Production Costs for Large‐Scale Production
0%
10%
20%
30%
40%
50%
60%
70%
80%
90%
100%
Greece Turkey Spain Italy Croatia Israel
Variable Costs Fixed Costs
Source: MedAquaMarket national country reports
Variations in the breakdown between variable and fixed production costs are in some cases due to lack of data, especially the share of financial costs in total production and in some cases the allocation of certain cost categories such as packaging, sanitary treatments and management to the category “other” or their omission.
Figure 47 – Variable production cost breakdown for large-scale production
Variable Production Costs for Large‐Scale Production
0%
5%
10%
15%
20%
25%
30%35%
40%
45%
50%
55%
60%
65%
70%
Greece Turkey Spain Italy Croatia Israel
Feed Fry Labor Energy Marketing (incl. packing) Medicines & Vet. Ser. Other
Source: MedAquaMarket national country reports
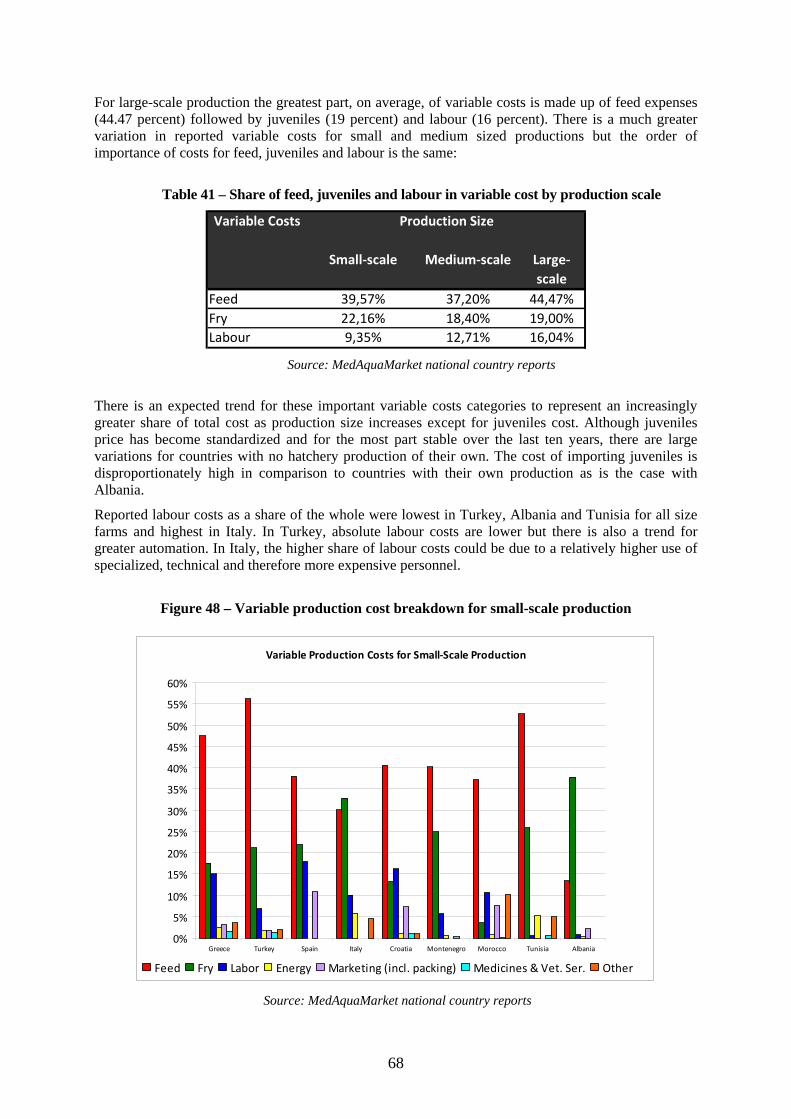
68
For large-scale production the greatest part, on average, of variable costs is made up of feed expenses (44.47 percent) followed by juveniles (19 percent) and labour (16 percent). There is a much greater variation in reported variable costs for small and medium sized productions but the order of importance of costs for feed, juveniles and labour is the same:
Table 41 – Share of feed, juveniles and labour in variable cost by production scale
Variable Costs
Small‐scale Medium‐scale Large‐scale
Feed 39,57% 37,20% 44,47%Fry 22,16% 18,40% 19,00%Labour 9,35% 12,71% 16,04%
Production Size
Source: MedAquaMarket national country reports
There is an expected trend for these important variable costs categories to represent an increasingly greater share of total cost as production size increases except for juveniles cost. Although juveniles price has become standardized and for the most part stable over the last ten years, there are large variations for countries with no hatchery production of their own. The cost of importing juveniles is disproportionately high in comparison to countries with their own production as is the case with Albania.
Reported labour costs as a share of the whole were lowest in Turkey, Albania and Tunisia for all size farms and highest in Italy. In Turkey, absolute labour costs are lower but there is also a trend for greater automation. In Italy, the higher share of labour costs could be due to a relatively higher use of specialized, technical and therefore more expensive personnel.
Figure 48 – Variable production cost breakdown for small-scale production
Variable Production Costs for Small‐Scale Production
0%
5%
10%
15%
20%
25%
30%
35%
40%
45%
50%
55%
60%
Greece Turkey Spain Italy Croatia Montenegro Morocco Tunisia Albania
Feed Fry Labor Energy Marketing (incl. packing) Medicines & Vet. Ser. Other
Source: MedAquaMarket national country reports
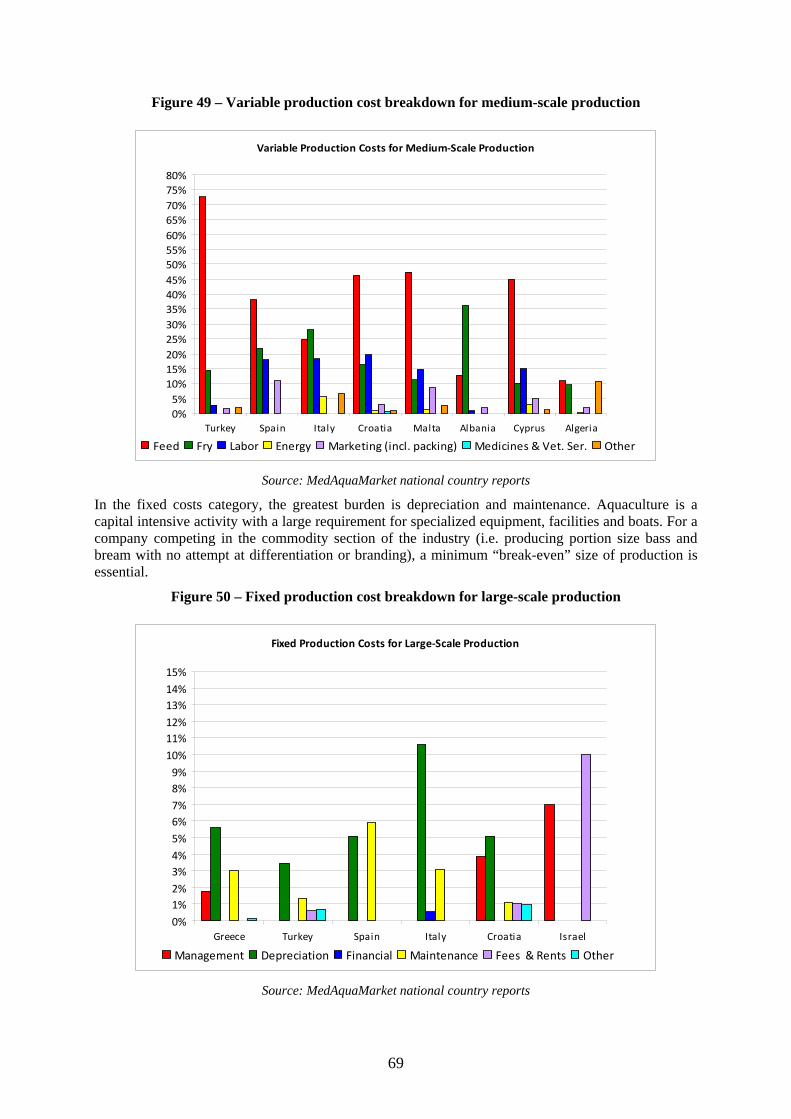
69
Figure 49 – Variable production cost breakdown for medium-scale production
Variable Production Costs for Medium‐Scale Production
0%5%10%15%20%25%30%35%40%45%50%55%60%65%70%75%80%
Turkey Spain Italy Croatia Malta Albania Cyprus Algeria
Feed Fry Labor Energy Marketing (incl. packing) Medicines & Vet. Ser. Other
Source: MedAquaMarket national country reports
In the fixed costs category, the greatest burden is depreciation and maintenance. Aquaculture is a capital intensive activity with a large requirement for specialized equipment, facilities and boats. For a company competing in the commodity section of the industry (i.e. producing portion size bass and bream with no attempt at differentiation or branding), a minimum “break-even” size of production is essential.
Figure 50 – Fixed production cost breakdown for large-scale production
Fixed Production Costs for Large‐Scale Production
0%1%2%3%4%5%6%7%8%9%10%11%12%13%14%15%
Greece Turkey Spain Italy Croatia Israel
Management Depreciation Financial Maintenance Fees & Rents Other
Source: MedAquaMarket national country reports
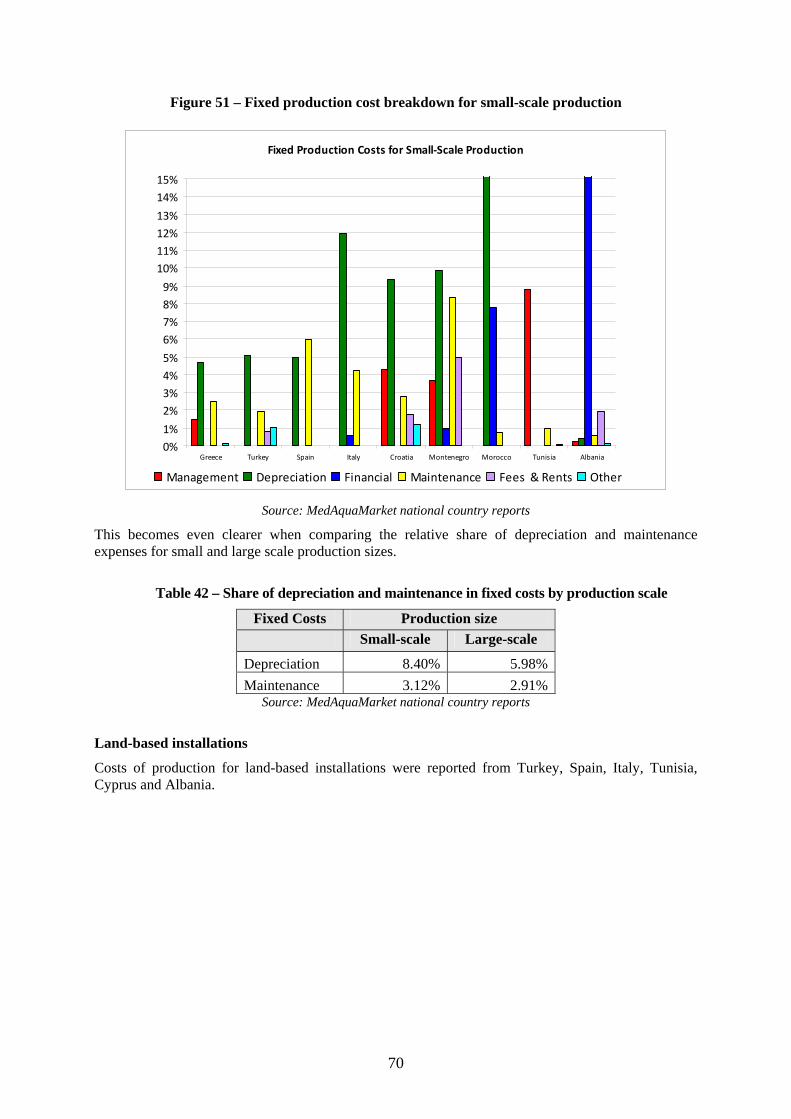
70
Figure 51 – Fixed production cost breakdown for small-scale production
Fixed Production Costs for Small‐Scale Production
0%1%
2%3%4%
5%
6%7%8%9%
10%11%12%13%
14%15%
Greece Turkey Spain Italy Croatia Montenegro Morocco Tunisia Albania
Management Depreciation Financial Maintenance Fees & Rents Other
Source: MedAquaMarket national country reports
This becomes even clearer when comparing the relative share of depreciation and maintenance expenses for small and large scale production sizes.
Table 42 – Share of depreciation and maintenance in fixed costs by production scale
Fixed Costs Production size Small-scale Large-scale
Depreciation 8.40% 5.98%Maintenance 3.12% 2.91%
Source: MedAquaMarket national country reports
Land-based installations
Costs of production for land-based installations were reported from Turkey, Spain, Italy, Tunisia, Cyprus and Albania.
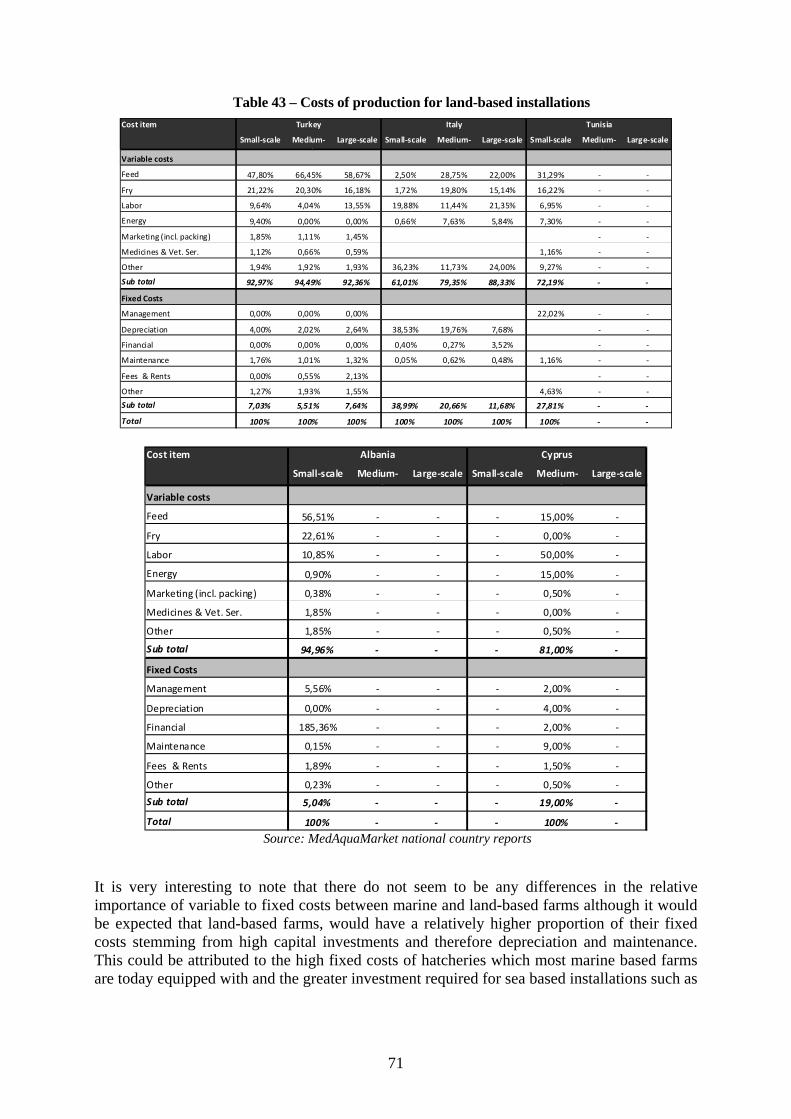
71
Table 43 – Costs of production for land-based installations Cost item
Small‐scale Medium‐l
Large‐scale Small‐scale Medium‐l
Large‐scale Small‐scale Medium‐l
Large‐scale
Variable costs
Feed 47,80% 66,45% 58,67% 2,50% 28,75% 22,00% 31,29% ‐ ‐
Fry 21,22% 20,30% 16,18% 1,72% 19,80% 15,14% 16,22% ‐ ‐
Labor 9,64% 4,04% 13,55% 19,88% 11,44% 21,35% 6,95% ‐ ‐
Energy 9,40% 0,00% 0,00% 0,66% 7,63% 5,84% 7,30% ‐ ‐
Marketing (incl. packing) 1,85% 1,11% 1,45% ‐ ‐
Medicines & Vet. Ser. 1,12% 0,66% 0,59% 1,16% ‐ ‐
Other 1,94% 1,92% 1,93% 36,23% 11,73% 24,00% 9,27% ‐ ‐
Sub total 92,97% 94,49% 92,36% 61,01% 79,35% 88,33% 72,19% ‐ ‐
Fixed Costs
Management 0,00% 0,00% 0,00% 22,02% ‐ ‐
Depreciation 4,00% 2,02% 2,64% 38,53% 19,76% 7,68% ‐ ‐
Financial 0,00% 0,00% 0,00% 0,40% 0,27% 3,52% ‐ ‐
Maintenance 1,76% 1,01% 1,32% 0,05% 0,62% 0,48% 1,16% ‐ ‐
Fees & Rents 0,00% 0,55% 2,13% ‐ ‐
Other 1,27% 1,93% 1,55% 4,63% ‐ ‐
Sub total 7,03% 5,51% 7,64% 38,99% 20,66% 11,68% 27,81% ‐ ‐
Total 100% 100% 100% 100% 100% 100% 100% ‐ ‐
TunisiaTurkey Italy
Cost item
Small‐scale Medium‐l
Large‐scale Small‐scale Medium‐l
Large‐scale
Variable costs
Feed 56,51% ‐ ‐ ‐ 15,00% ‐
Fry 22,61% ‐ ‐ ‐ 0,00% ‐
Labor 10,85% ‐ ‐ ‐ 50,00% ‐
Energy 0,90% ‐ ‐ ‐ 15,00% ‐
Marketing (incl. packing) 0,38% ‐ ‐ ‐ 0,50% ‐
Medicines & Vet. Ser. 1,85% ‐ ‐ ‐ 0,00% ‐
Other 1,85% ‐ ‐ ‐ 0,50% ‐
Sub total 94,96% ‐ ‐ ‐ 81,00% ‐
Fixed Costs
Management 5,56% ‐ ‐ ‐ 2,00% ‐
Depreciation 0,00% ‐ ‐ ‐ 4,00% ‐
Financial 185,36% ‐ ‐ ‐ 2,00% ‐
Maintenance 0,15% ‐ ‐ ‐ 9,00% ‐
Fees & Rents 1,89% ‐ ‐ ‐ 1,50% ‐
Other 0,23% ‐ ‐ ‐ 0,50% ‐
Sub total 5,04% ‐ ‐ ‐ 19,00% ‐
Total 100% ‐ ‐ ‐ 100% ‐
CyprusAlbania
Source: MedAquaMarket national country reports
It is very interesting to note that there do not seem to be any differences in the relative importance of variable to fixed costs between marine and land-based farms although it would be expected that land-based farms, would have a relatively higher proportion of their fixed costs stemming from high capital investments and therefore depreciation and maintenance. This could be attributed to the high fixed costs of hatcheries which most marine based farms are today equipped with and the greater investment required for sea based installations such as
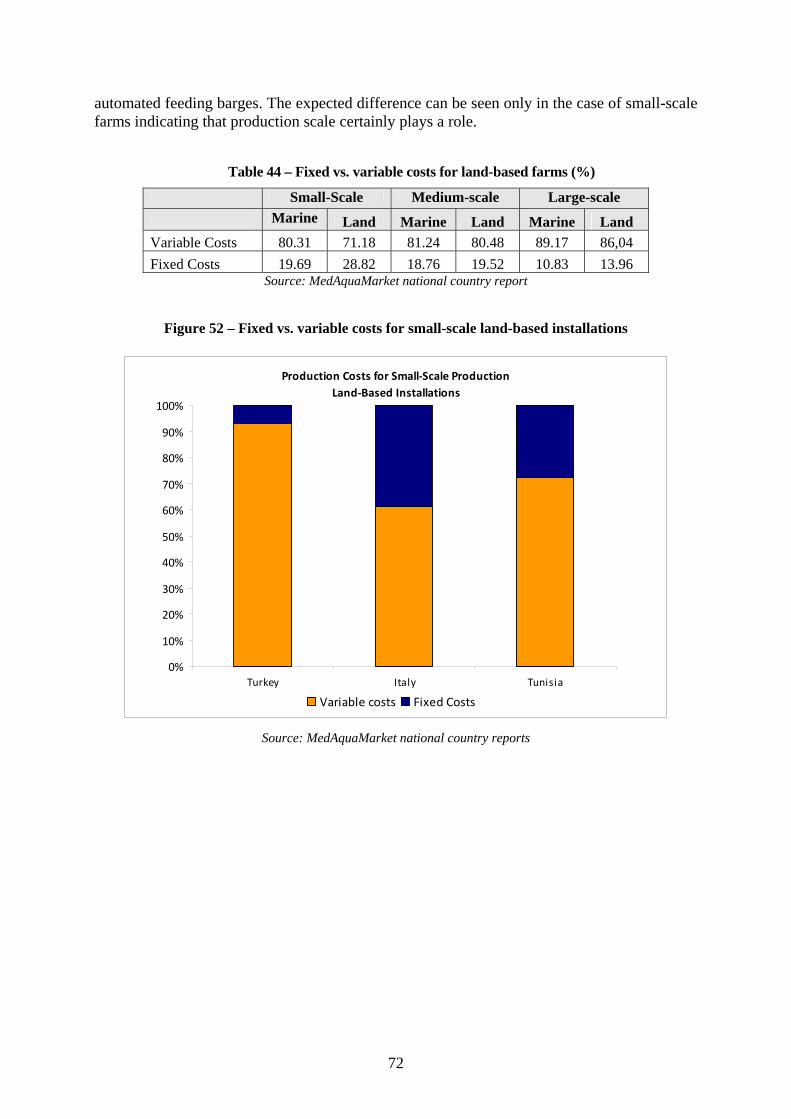
72
automated feeding barges. The expected difference can be seen only in the case of small-scale farms indicating that production scale certainly plays a role.
Table 44 – Fixed vs. variable costs for land-based farms (%)
Small-Scale Medium-scale Large-scale Marine Land Marine Land Marine Land Variable Costs 80.31 71.18 81.24 80.48 89.17 86,04 Fixed Costs 19.69 28.82 18.76 19.52 10.83 13.96
Source: MedAquaMarket national country report
Figure 52 – Fixed vs. variable costs for small-scale land-based installations
Production Costs for Small‐Scale ProductionLand‐Based Installations
0%
10%
20%
30%
40%
50%
60%
70%
80%
90%
100%
Turkey Italy Tunisia
Variable costs Fixed Costs
Source: MedAquaMarket national country reports
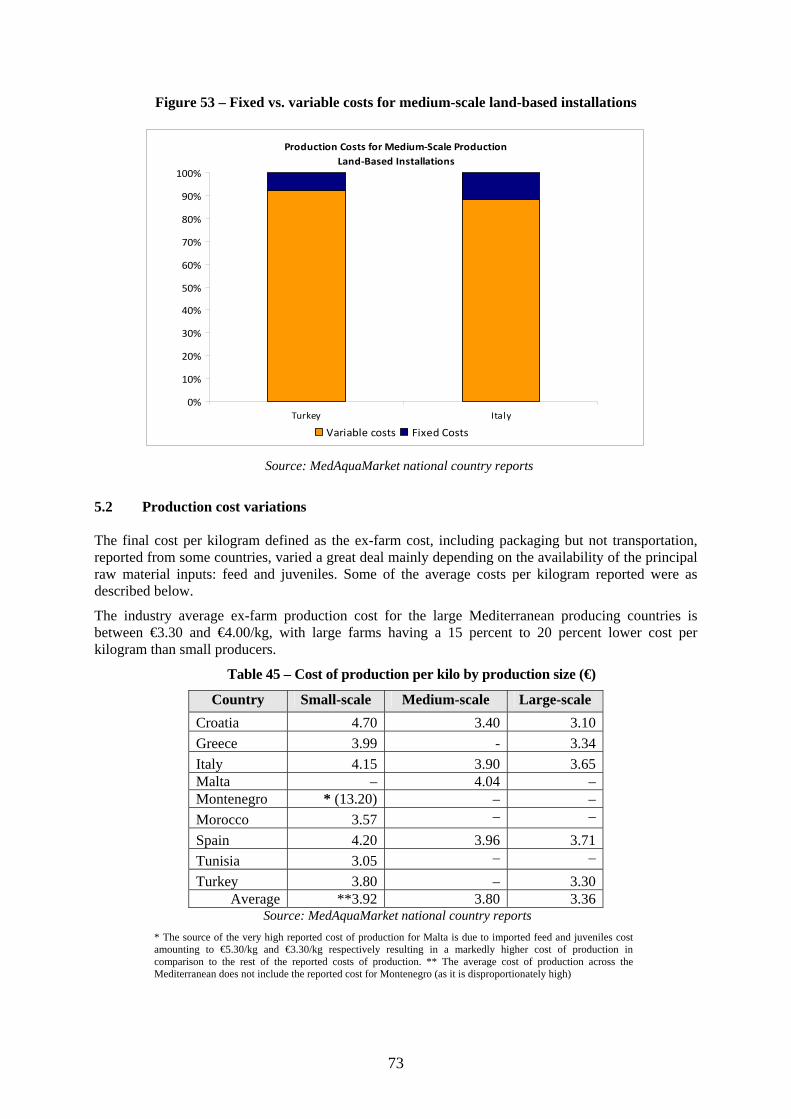
73
Figure 53 – Fixed vs. variable costs for medium-scale land-based installations
Production Costs for Medium‐Scale ProductionLand‐Based Installations
0%
10%
20%
30%
40%
50%
60%
70%
80%
90%
100%
Turkey Italy
Variable costs Fixed Costs
Source: MedAquaMarket national country reports
5.2 Production cost variations The final cost per kilogram defined as the ex-farm cost, including packaging but not transportation, reported from some countries, varied a great deal mainly depending on the availability of the principal raw material inputs: feed and juveniles. Some of the average costs per kilogram reported were as described below.
The industry average ex-farm production cost for the large Mediterranean producing countries is between €3.30 and €4.00/kg, with large farms having a 15 percent to 20 percent lower cost per kilogram than small producers.
Table 45 – Cost of production per kilo by production size (€)
Country Small-scale Medium-scale Large-scale Croatia 4.70 3.40 3.10 Greece 3.99 - 3.34 Italy 4.15 3.90 3.65 Malta – 4.04 – Montenegro * (13.20) – – Morocco 3.57 – – Spain 4.20 3.96 3.71 Tunisia 3.05 – – Turkey 3.80 – 3.30
Average **3.92 3.80 3.36 Source: MedAquaMarket national country reports
* The source of the very high reported cost of production for Malta is due to imported feed and juveniles cost amounting to €5.30/kg and €3.30/kg respectively resulting in a markedly higher cost of production in comparison to the rest of the reported costs of production. ** The average cost of production across the Mediterranean does not include the reported cost for Montenegro (as it is disproportionately high)
74
The lowest production costs were reported for Tunisia and Croatia, although Tunisia did not include depreciation. 5.3 Scope for reducing production costs Reducing production costs requires increasing the intensity, efficiency and control of production mode. Intensity or productivity is a measure of the degree of optimization of production per unit of space and time as measured by capital cost. Efficiency of production can be measured through the inputs required per unit produced. Neither of these objectives can be measured much less attained without control: through investment in information systems, management and skilled personnel. Clearly, increasing growth rates, the quality of juveniles, reducing mortalities and improving feed conversion rates are central to these objectives. 5.3.1 Farm productivity Land based farms allow for greater on-growing densities in relation to sea based cage farms with densities often reaching as high as 30–50kg/m3. Depending on the marine environment (temperatures, current and depth), densities in cages can rarely be higher than 30kg/m3 with the average being around 18kg/m3. Higher densities in basins can only be achieved through strict control of water flow and quality, but most importantly through the addition of pure oxygen. Higher densities result in higher productivity per m3 of water used or occupied and as such would seem to be a desirable production method especially in the context of “conflict for space issues”. However, this must be weighed against issues of animal welfare, animal stress levels and diseases which tend to increase with stress levels. There are currently no agreed upon, scientifically-based “optimal” densities for these species and most farmers base their techniques on experience with their own particular environment together with other husbandry practices (such as feed formulas, the use of vaccinations, etc.). It can certainly be argued that from a space and volume optimization perspective, the least productive mode is caged-based, in shallow waters, enclosed bays with little current. In other words those conditions requiring relatively low densities. 5.3.2 Automation Looking at salmon farming, which is older than the European seabass and gilthead seabream sector but with similar production techniques, a clear trend towards greater automation and average size of production unit can be seen. Labour cost in Norway clearly gave the initial incentive towards greater automation as the degree of automation in salmon farms in Chile, where labour cost is cheaper, is much lower. Automation, however, becomes cost effective only when economies of scale are achieved, i.e. with greater production in a given site. The use of automated feeders, graders and well-boats are hardly economic if they serve holdings smaller than 1 000 tonnes. The use of automated feeders and graders has become more widespread with the increase in production site size, especially with the move to more offshore sites where workers can often not go in bad weather. The use of well-boats and floating grading and packaging stations however requires harvesting much larger quantities at a time than is presently the norm. 5.3.3 Research and Development (R&D) The issue of greater and more focused research and innovation in the industry is very important to its future development. While it is not in the scope of this document to discuss all of the areas which would benefit from greater R&D efforts, there areas that can directly affect competitiveness and improve the product marketing prospects. They can roughly be divided into two categories: 1) advances which lead to a lower production cost, and 2) innovations which can make the product more attractive and competitive in the market.
1) As has been mentioned above, the two most inelastic parts of the cost equation are the cost of raw material inputs, namely juveniles and feed. Juveniles production requires a substantial fixed
75
investment in capital and technology to control water quality, temperature and the hatchery environment in general. Improving survival rates, minimizing malformations and generally improving juveniles quality and consistency can reduce the cost of production at the hatchery level. Genetic selection programmes for growth, resistance to disease and general quality attributes would improve the juveniles performance at the on growing stage of production.
Because feed cost is an important item of the total cost, appropriate feed management as well as the choice of the right feed are important factors to consider. An optimal feed conversion rate (FCR) is not always simply the lowest, the cheapest or the one resulting in the most rapid growth. The optimal FCR for a farm depends very much on its corporate and market strategy and achieving the desired results either in terms of quality of product, size category, timing in harvesting to market, capital cost and availability, and feed cost and availability in that country.
Factors which affect the feed quality include:
the digestible fraction of the diet; the optimal ratio of protein to fat which will maximize the retention of the digestible
protein fraction; the quality of the digestible protein fraction; palatability; the use of health and immuno-stimulant promoting diets; and the addition of essential nutrients such as amino acids, phospholipids and anti-oxidants.
In addition to feed quality and composition, adapting feeding regimens to the specific conditions of an on growing environment, not only in terms of temperature and the age of the fish but also in terms of juveniles quality, the particularities of each batch, and the result desired from a sales perspectives. The micromanagement of feeding at the on growing stage can yield substantial production cost improvements especially when taken together with achieving the desired results in terms of obtaining the right sales mix at the right time of year.
2) The second category of research has to do with improving the products attributes for the market which may not lead to cost improvements per se but can certainly affect the price obtained and general competitiveness of the product. These can include improving the nutritional and compositional qualities (functional foods), the taste and appearance of the fish. Equally important is achieving innovation in preserving the freshness and quality of the product through packaging and icing. 5.3.4 Information systems One of the “hidden costs” of the industry is the result of the lack of accurate and updated information on production. This includes the exact number of fish in each cage, mortalities and average sizes. Fish are graded and counted at the moment they leave the hatchery and are stocked in cages. From then on updates are provided by regular checks by divers for mortalities, escapes due to damaged cages or loose nets as well as periodic sampling to verify the average weight of a cage. Feed is administered according to feeding tables provided by the feed supplier or developed in-house based on commercially available growth models, the farmer’s experience or any combination of the above.
In offshore facilities it can be difficult to estimate mortalities or losses due to damaged cages and nets and sampling is often impossible. In sites that are closer to shore, these procedures can be expensive due to the labour required as well as the expertise of on-growing managers which is often not available for all sites. As has been mentioned elsewhere, concentration in the industry, companies with large productions, has not really resulted in economies of scale in production as such companies are most often a conglomeration of relatively small, geographically widely dispersed sites.
Underwater cameras and sensors used to calculate the number and average size of fish in a cage are still rather inaccurate and are certainly expensive to use on a wide-scale. However, detailed knowledge of production, cage by cage is essential to reducing costs and improving efficiency with regard to
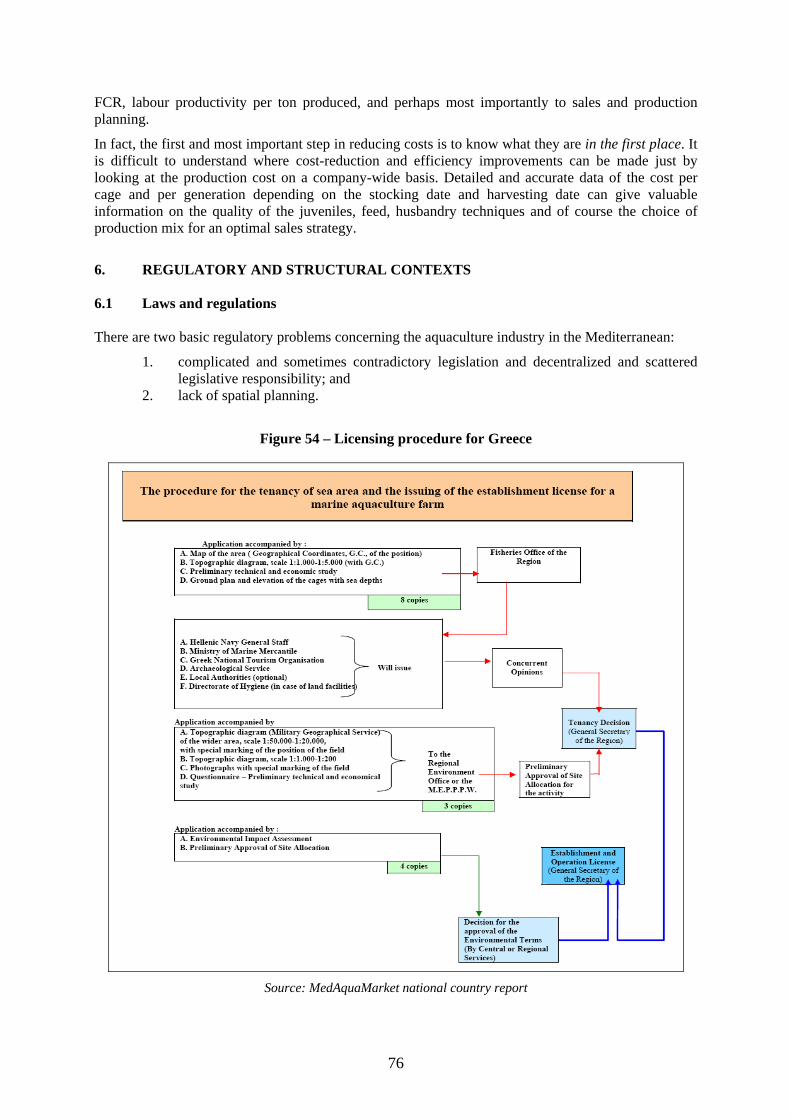
76
FCR, labour productivity per ton produced, and perhaps most importantly to sales and production planning.
In fact, the first and most important step in reducing costs is to know what they are in the first place. It is difficult to understand where cost-reduction and efficiency improvements can be made just by looking at the production cost on a company-wide basis. Detailed and accurate data of the cost per cage and per generation depending on the stocking date and harvesting date can give valuable information on the quality of the juveniles, feed, husbandry techniques and of course the choice of production mix for an optimal sales strategy.
6. REGULATORY AND STRUCTURAL CONTEXTS 6.1 Laws and regulations There are two basic regulatory problems concerning the aquaculture industry in the Mediterranean:
1. complicated and sometimes contradictory legislation and decentralized and scattered legislative responsibility; and
2. lack of spatial planning.
Figure 54 – Licensing procedure for Greece
Source: MedAquaMarket national country report
77
In order to optimize the trade of aquaculture products, most Mediterranean countries have developed their own national regulations affecting the trade market of aquaculture products. These regulations cover traceability, quality and other aspects – based upon the fact that legislation on both food safety and quality has been transferred from the EU to national legislation – even if they have not yet been completely applied within all EU member states.
Traceability and HACCP systems are mandatory for all EU countries and similar regulations exist in countries such as Croatia and Turkey especially as far as exports to the EU are concerned. Enforcement and control can sometimes be a problem especially in countries such as Albania and Egypt where no such regulations exist yet. All fish farms follow a protocol, when harvesting the fish with emphasis given to low temperature, quick fish death and to maintaining a clean work environment.
All the fish packaging and processing factories have to receive the relevant approval by the competent authority, the Veterinary Services in most cases. After the initial stages of approval, several onsite inspections and samplings are performed in order to ensure that the operations of these factories meet the terms and conditions of the approval regarding all the quality aspects and checks that need to be performed during their operation.
Additionally, all fishery and aquaculture products placed in the EU market -intended for human consumption – need to comply with the relevant EU legislation related to food and feed safety. In Greece, as in each Member State, various competent authorities control the correct application of EU legislation, and its implementation by food business operators. In regards to imports, it is essential that any third country (exporter) have public health legislation and control procedures equivalent to EU legislation, checked by the European Commission. Third country companies fulfilling EU requirements must obtain a certificate of conformity from their national competent authorities if they want to export fisheries products to EU.
If no specific laws exist which cover aquaculture activities, such as in Egypt or Morocco, the sector refers to the existing agriculture and/or fisheries legislations.
Most aquaculture entities also have to comply with regulations affecting their establishment and operation.
The EU Member State’s national government, as is the case in Spain, acts only as a coordinating body on aquaculture and as a link with the European Commission (EC). There is only one exception to this distribution of competences: the granting of concessions on public domain waters, which depends exclusively of the Ministry of Environment of the National Government.
Indeed in most cases, such as in Cyprus for instance, strict laws and regulations apply to the granting of permits and the operation of all fish farms. All permits are granted after submission, analysis and approval of an environmental impact assessment study (EIA). During operation, marine farms are further obliged by law to submit an environmental monitoring report, which is requested in Cyprus every six (6) months (winter and summer).
Most Mediterranean countries have to comply with a full list of various legislations. The complicated, overlapping and sometimes contradictory legislation that governs the aquaculture activity is a serious obstacle to the development of the sector and can be very costly to implement. An average aquaculture company in Greece is subject to 174 pieces of legislation which it often knows nothing about and is very likely to be in violation of (See Appendix V). The aquaculture facilities in Cyprus for example have to comply with the following national legislations:
Aquaculture Law 2000, amended in 2002; Aquaculture (General) Regulations 2002 amended in 2003; Fisheries Control Law and Regulations amended in 2005; Law 140 (I) 2002 regarding environmental impact requiring mandatory environmental
impact assessment studies for aquaculture projects before any license is granted; Laws, regarding the recognition of producers' organizations in the fisheries sector; and
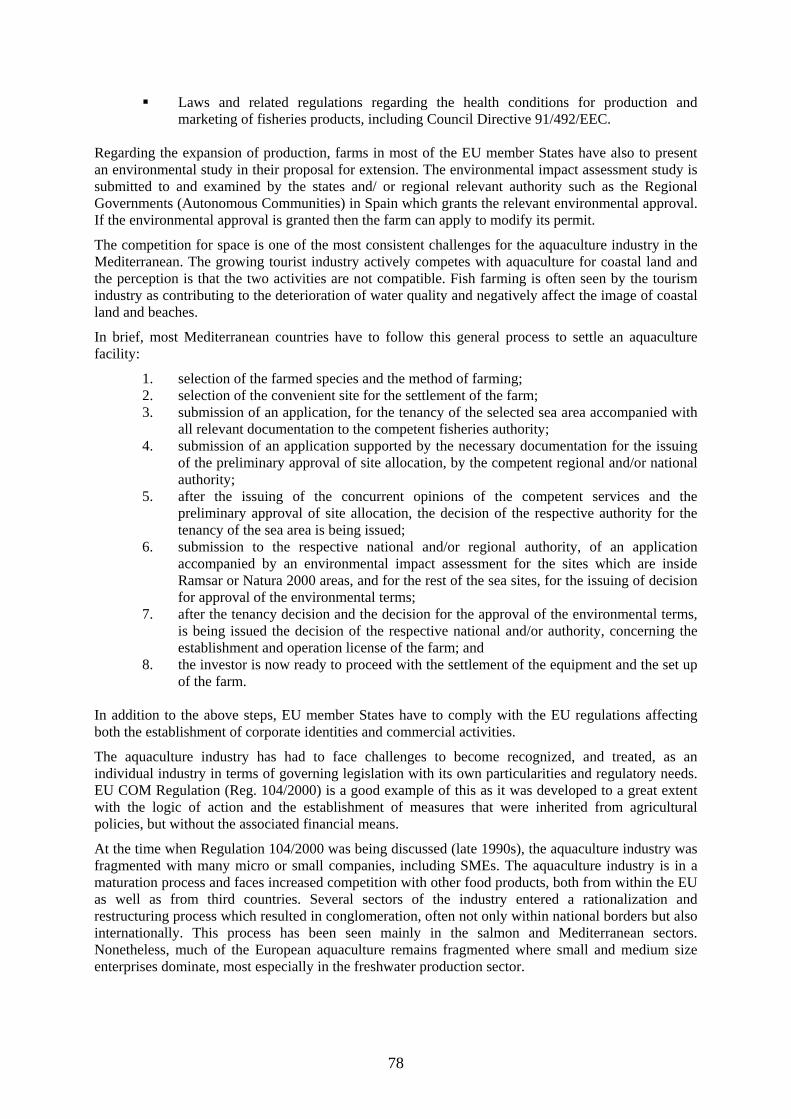
78
Laws and related regulations regarding the health conditions for production and marketing of fisheries products, including Council Directive 91/492/EEC.
Regarding the expansion of production, farms in most of the EU member States have also to present an environmental study in their proposal for extension. The environmental impact assessment study is submitted to and examined by the states and/ or regional relevant authority such as the Regional Governments (Autonomous Communities) in Spain which grants the relevant environmental approval. If the environmental approval is granted then the farm can apply to modify its permit.
The competition for space is one of the most consistent challenges for the aquaculture industry in the Mediterranean. The growing tourist industry actively competes with aquaculture for coastal land and the perception is that the two activities are not compatible. Fish farming is often seen by the tourism industry as contributing to the deterioration of water quality and negatively affect the image of coastal land and beaches.
In brief, most Mediterranean countries have to follow this general process to settle an aquaculture facility:
1. selection of the farmed species and the method of farming; 2. selection of the convenient site for the settlement of the farm; 3. submission of an application, for the tenancy of the selected sea area accompanied with
all relevant documentation to the competent fisheries authority; 4. submission of an application supported by the necessary documentation for the issuing
of the preliminary approval of site allocation, by the competent regional and/or national authority;
5. after the issuing of the concurrent opinions of the competent services and the preliminary approval of site allocation, the decision of the respective authority for the tenancy of the sea area is being issued;
6. submission to the respective national and/or regional authority, of an application accompanied by an environmental impact assessment for the sites which are inside Ramsar or Natura 2000 areas, and for the rest of the sea sites, for the issuing of decision for approval of the environmental terms;
7. after the tenancy decision and the decision for the approval of the environmental terms, is being issued the decision of the respective national and/or authority, concerning the establishment and operation license of the farm; and
8. the investor is now ready to proceed with the settlement of the equipment and the set up of the farm.
In addition to the above steps, EU member States have to comply with the EU regulations affecting both the establishment of corporate identities and commercial activities.
The aquaculture industry has had to face challenges to become recognized, and treated, as an individual industry in terms of governing legislation with its own particularities and regulatory needs. EU COM Regulation (Reg. 104/2000) is a good example of this as it was developed to a great extent with the logic of action and the establishment of measures that were inherited from agricultural policies, but without the associated financial means.
At the time when Regulation 104/2000 was being discussed (late 1990s), the aquaculture industry was fragmented with many micro or small companies, including SMEs. The aquaculture industry is in a maturation process and faces increased competition with other food products, both from within the EU as well as from third countries. Several sectors of the industry entered a rationalization and restructuring process which resulted in conglomeration, often not only within national borders but also internationally. This process has been seen mainly in the salmon and Mediterranean sectors. Nonetheless, much of the European aquaculture remains fragmented where small and medium size enterprises dominate, most especially in the freshwater production sector.
79
Finally, all Mediterranean aquaculture producers exporting to Europe need to have full EU approval to do so. The legislation covering these permits is 94/356/EC of 1994 giving rules on the application of Council Directive 91/493/EEC. This covers all checks required on fishery products. Subsidiary local legislation is LN 255 of 2000 and deals with fish packing regulations. 6.2 Role and power of producer’s organization and collective actions A Producer Organization (POs) is a cooperative that controls production and marketing by its members. The POs can increase members’ negotiating power and provide advice not only on marketing but also on technical aspects of production.
There are now more than 160 producers’ organizations within the EU, and slightly more within the Mediterranean countries. These are voluntary organizations set up by fishers or fish farmers to assist in selling their product. Their members must comply with the PO internal rules, mission and objectives.
For instance, in the case of fisheries, organizations are required to develop plans to adjust fish catches to market demand. They may require non-members fishing in the same areas to follow the same restrictions as members. They are empowered to take products out of the market if prices fall below levels set by the Council of Ministers and receive compensation from the Community. Compensation levels are set such that price falls as the amount of fish involved increases. Fish stocks may be stored and later returned to the market, or sold for animal feeds. Buying up of stocks is mostly to cover occasional surpluses. Tuna fishermen have a scheme where surplus stock is not bought up, but fishermen receive direct compensation if their income falls.
Aside from POs, the Fisheries Common Organizations of Markets (COM) was established in the 1970s, whose role and power gained strength through the years. The COM’s objective, reformed in late 1999, is to bring about the rational organization of the market and enhancement of the value of community products, contribute to a sustainable management of resources, and strengthen the competitiveness of the community processing sector. Its principal tools are consumer information, the structuring of the sector through producers’ organizations and recognized trade associations, and the market intervention regime. However the intent and focus of the instrument was aimed at capture fisheries which is structurally quite different from aquaculture. It failed to address most of the most important issues of aquaculture in the markets and is currently under review to incorporate tools more applicable to the industry.
The COM was designed to:
promote the stabilization of markets; facilitate the concentration of the offer; improve and standardize quality norms; and safeguard the income of producers.
In order to come closer to achieving these goals the COM reform must:
1) decouple capture fisheries and aquaculture;
2) provide appropriate intervention mechanisms for aquaculture;
3) provide for the uniform and strict application of labelling rules, including imports;
4) encourage the formation of interbranch alliances whether among producers or vertically downwards with distributors and retailers; and
5) facilitate the provision of accurate and timely information on:
production volumes; trade movements; socio-economic issues; market trends; and consumer preferences.
80
Producer’s Organizations appropriate to the aquaculture industry can allow small to medium-sized farmers to:
jointly promote their products; establish a quality brand or label of origin; invest in the joint production of added-value products; gather market data for better production planning; and pool sales and input purchases.
Farmers could then better plan their production and achieve concentration of the offer without financial consolidation, allowing smaller, family owned farms to retain their independence. In an era where food production and distribution is increasingly dominated by a few, very large companies, there is a strong argument in favour of small farmers:
diversity of product; traditional way of life; and tied to their product and their environment/community.
Within the Mediterranean countries, the large producing countries do have representative organizations but none which function as true producers’ organizations.
Federation of Greek Maricultures (FGM), where the majority of Greek European seabass and Gilthead seabream producers are represented.
Italian Association of Pisciculture (API – Associazione Piscicoltori Italiani). API represents around 95 percent of freshwater producers and around 80 percent of marine-farmers. API promotes collective actions and campaigns for educational training (Guidelines for the implementation of ISO 9001 or 14001, implementation of quality and traceability systems, hygiene and safety, veterinary issues, etc) marketing, promotion and information campaigns (in schools or with the medical doctors about health benefits).
APROMAR (Asociación Empresarial de Productores de Cultivos Marinos de España) in Spain which sets common rules for its members and pursues much the same kinds of activities as API (education and training, marketing, promotion and information campaigns).
Moroccan Association for Aquaculture (Association Marocaine de l'Aquaculture – AMA).
Tunisian Union of Agriculture and Fishery (UTAP).
Central Associations of Fishery Cooperatives (SUR-KOOP), Central and Regional Fishery Advisory Committees; and Turkish Fish Promotion Association.
In some countries, such as in Montenegro, where no producers’ organizations exist, the government provides financial support as part of a policy to strengthen representative organizations and promote their establishment.
In brief, POs are vital in order to provide:
incentives for cooperation between producers, processors and retailers/trading/distribution companies (Interbranch Organizations);
promotion of partnership projects of shared interest: advertising, promotion, public service communication;
market surveys and research; make aquaculture products eligible for independent carry-overs (withdrawals do not
really apply); a withdrawal price; and decouple social and commercial objectives.
81
7. STATE FUNDING AND SUBSIDIES 7.1 Funding and subsidies in EU-Member States Through time, the EU member States aquaculture sector have benefited from funding and subsidies from the EU in order to promote its development, and ensure a sustainable and viable sector, in competition with other aquaculture products of the world. Several programming periods have marked the EU history of the aquaculture sector, which have provided several funding opportunities to the sector.
Under Council Regulation (EEC) No 3760/92, and in particular through the relevant National Operational Program “Fisheries 1994–1996”, the aquaculture sector benefited from 1994 of €116.5 million allocated to aquaculture related projects in Greece. At the end of the Programming Period, under Measure 3.1 dedicated to aquaculture production capacity increase, 162 investment projects had been financed in Greece with a total of €84 302.3432 (all species included). The latter funding, increased European seabass and gilthead seabream farming capacity by 8 754 tonnes (4 341 tonnes for European seabass and 4 413 tonnes for gilthead seabream), and juveniles production capacity by 16.3 million fingerlings. Moreover, under Measure 3.2, which was dedicated towards improvement without capacity increase, it financed the improvement (hygiene, safety, environmental) of 49 units in Greece with a total of €16 983 131.
Under Council Regulation (EC) No 2792/1999, for programming period 2000–2006, about €120 million was allocated for aquaculture related projects, accounting for almost 40 percent of the total funding available by the National Operational Program “Fisheries 2000–2006”. The Program is still in progress. It is expected to be finished by the end of 2009 and hopes to serve several purposes according to the need of the respective member states.
For instance, under Measure 3.2 dedicated to aquaculture, 270 projects, covering the total of the available budget, have been selected and approved for financing in Greece so far (December 2008 data). Ninety-six of these projects, with a total budget of € 48 039 269 – of which € 21 617 671 was public expenditure – are related to production capacity increases. In particular, these projects are expected to increase the annual production by 10 389 tones of marine fish, by 936 tonnes of freshwater fish, by 4 531 tonnes of bivalve oysters and by a total of 60 million fingerlings. Moreover, still in Greece, 175 farms (marine and fresh water fish, seven shellfish) have been selected and approved for financing under the action “modernization of existing units without increasing production capacity” with a total of € 32 715 457 (public expenditure), out of a total cost of € 72 445 683.
The Commission had requested that no more funding should be directed for any increases of the production capacity for European seabass and gilthead seabream after the end of 2002 via the FIFG and through the Operational Program Fisheries 2000–2006. This was in large part due to the fact that Greece was producing European seabass and gilthead seabream at volumes higher than permitted by the farm capacity-licenses and consequently higher than the volumes officially declared. Most of all however, because of the evident repercussions of this notion on the markets, which had suffered a price collapse for the two above species. However, a 2004 European Commission study, contracted to the University of Stirling, revealed that actual production was indeed much higher than officially reported but that there was no over-production of European seabass and gilthead seabream, but merely under-marketing of it. The Commission then revoked its previous decision, and allowed the financing of projects concerning production capacity increases. This suggested however that emphasis should be given towards the financing of projects that concern the marketing and promotion of the industry and its products.
In addition to Measure 3.2, which concerns the direct financing of aquaculture projects, an additional Measure of Operational Program Fisheries 2000–2006 (Measure 4.3) was anticipated to have a positive impact by encouraging marketing promotion. The latter measure had an initial budget of €15 118 700. However, for various reasons, mainly related to deficiencies of the administrative services, as well as lack of a state devised strategic plan for the industry’s development, funding opportunities were grossly under-utilized. Only in 2007 a project for the promotion of European
82
seabass and gilthead seabream was approved and funded in Greece, at a cost of €3 million for a 15-month duration. The overall planning and execution of this project has been strongly debated, as the outcome of it did not seem to achieve any of the initial objectives.
In Cyprus, the main objective of the measure was the sustainable and balanced development of aquaculture helping to maximize its contribution to the domestic fisheries production, according to the needs of the market. Within 2004-2006, eleven (11) projects were co-funded which included: construction of new aquaculture units (3) and modernization of existing farms (6). The total budget was 4.25 million euros of which forty percent (40 percent) was funded. These funding efforts created fifty (50) new employment positions and helped to sustain the two hundred (200) existing employment positions.
Since 1 January 2007 the European Fisheries Fund replaced the Financial Instrument for Fisheries Guidance, with a budget of € 39.5 million.
Under Council Regulation (EC) No 1198/2006 of the programming period 2007–2013, the European Fisheries Fund, financial assistance may be granted to the aquaculture industry through a number of direct and indirect measures, as defined in Chapter II, Article 28, of the latter. Directly, support may be granted for the following:
measures for productive investments; aqua-environmental measures; public health measures; and animal health measures. indirect support may be granted for:
• investments in processing and marketing; and • eligible measures in processing and marketing.
According the relevant National Operational Plan “Fisheries 2007–2013” (NOP “Fisheries”) all such measures fall under “Priority axis 2: aquaculture, inland fishing, processing and marketing of fishery and aquaculture products”. Overall, Priority axis 2 has an initial budget of € 80.6 million (public expenditure), accounting for 30 percent of the total Public Expenditure of the respective NOP.
In this programming period, under Measure 3.4 the respective NOP provides adequate funding for the development of new markets and promotional campaigns, through which projects falling in the following categories could be funded:
regional, national or transnational promotion campaigns for aquaculture products; promotion of products obtained using methods with low impact on the environment (i.e.
organic aquaculture); campaigns to improve the image of aquaculture products; and implementation of market surveys.
For instance in Italy 75 percent of the funds will be allocated to Regions covered by the convergence, these Regions are: Calabria, Campania, Apulia, Sicily and Basilicata (phasing out).
In Cyprus, about 6.5 million euros will be granted to the priority axis 2: aquaculture, inland fishing, processing and marketing of fishery and aquaculture products. These funds target productive investments made in the aquaculture industry (infrastructure issues such as construction, expansion of production and facilities, equipment maintenance and updating) aqua-environmental measures such as organic aquaculture, processing and packaging of fish (the construction for a few processing units has been funded) marketing of fisheries and aquaculture products. All fish farms may receive 40 percent funding to all their investments that target the above issues, while the remaining 60 percent has to be covered by the private sector.
In Spain, the European subsidies will be used to finance fixed assets for new fish farms or for expanding existing farms. Depending on the region in Spain these subventions could represent up to 60 percent of the investment. Today Spain has become a European Union Member State with a GDP
83
above the European average. Only two coastal regions (Galicia and Andalusia) are considered Convergence Regions (subject to more aid) that can apply for the highest percentages of subventions (40 to 50 percent). In most regions of Spain these subventions can only reach 15 to 20 percent of the investment. At present most aquaculture companies in Spain can only obtain financial support for investments that incorporate some type of technological innovation or for improving aquaculture environmental practices. In Spain investments in innovation can apply for tax exemptions.
In Malta, the measure aimed at the modernization and improvement of processing facilities of existing aquaculture units, the maintenance of employment; in particular the improvement of sanitary and environmental conditions and technology, together with the positive improvement of safety at work. FIFG funds available were a maximum of 40 percent of the value of the investment. The overall goal is to improve the quality of the product and encourage the growth of the industry. Structural funds will be available for the period 2007 to 2013 based on the same criteria.
For Greece however, the largest producing country and the one perhaps most in need of investment in promotion and marketing, it is important to note that while the NOP was approved by the Commission in December 2007, its initiation is still pending. The relevant state authorities have not yet put in place the administrative mechanisms nor have they issued the respective implementing rules and regulations. Unfortunately, based on past experience, and on the pace which the issue is progressing, if one wants to attempt a pragmatic forecast, the actual initiation of the relevant aquaculture-supporting measures should not be expected any time before the end of summer 2010. This means that it will be almost three years from the start of the seven-year programming period, before any aquaculture-related project is actually financed.
In brief, national and EU financing of infrastructures largely contributed to the technological optimization of existing plants as well as to the start-up of new facilities within EU member States. For intensive farming, traditionally land based, limiting factors related to environmental impact reduction and lack of lands due to intensive use of coastal areas stimulated the development of offshore systems.
In some countries such as in Italy, the sector has not completely utilized development opportunities, due to a lack of a European investment planning in relation to market dynamics. In addition to the structural funds disbursed directly by DG Fishery and Italian Fishery Directorate, there are European funds, such as Natura 2000 and Life plus. Funding cross-cutting can also involve other aspects of the aquaculture sector, such as technological innovations for the products themselves: for example technologies that improve the shelf life, appearance and taste or nutritional value of the fish. 7.2 Funding and subsidies in non-EU States
Non-EU member States do not have access in most cases to EU funds, but can gain benefits from twinning projects with the EU as it has been the case this past decade with Turkey for instance or other related projects funds.
In the case of Turkey, since 2002 the EU has developed sixty-s twinning projects in different economic areas. The TR-03-AG-01 (Alignment on EU acquis in terms of fishery policy) Twinning Project is financed by the Pre-accession Program which aims to assist Turkey in meeting the criteria for EU membership through bilateral co-operation projects focusing on the transfer, implementation and enforcement of European legislation. The Fisheries Twinning Program supports Turkey’s legal and institutional alignment to the EU acquis in terms of fisheries policy. The overall objective of this project is to enhance the sustainable contribution of the fisheries sector to the national economy and prepare the sector for Turkey’s accession to the European Union.
Aside from subsidies from the EU, the non-member States also attempt to receive funding supports from the Fishery Development Project of the World Bank to support their aquaculture sector activities and sustainability.
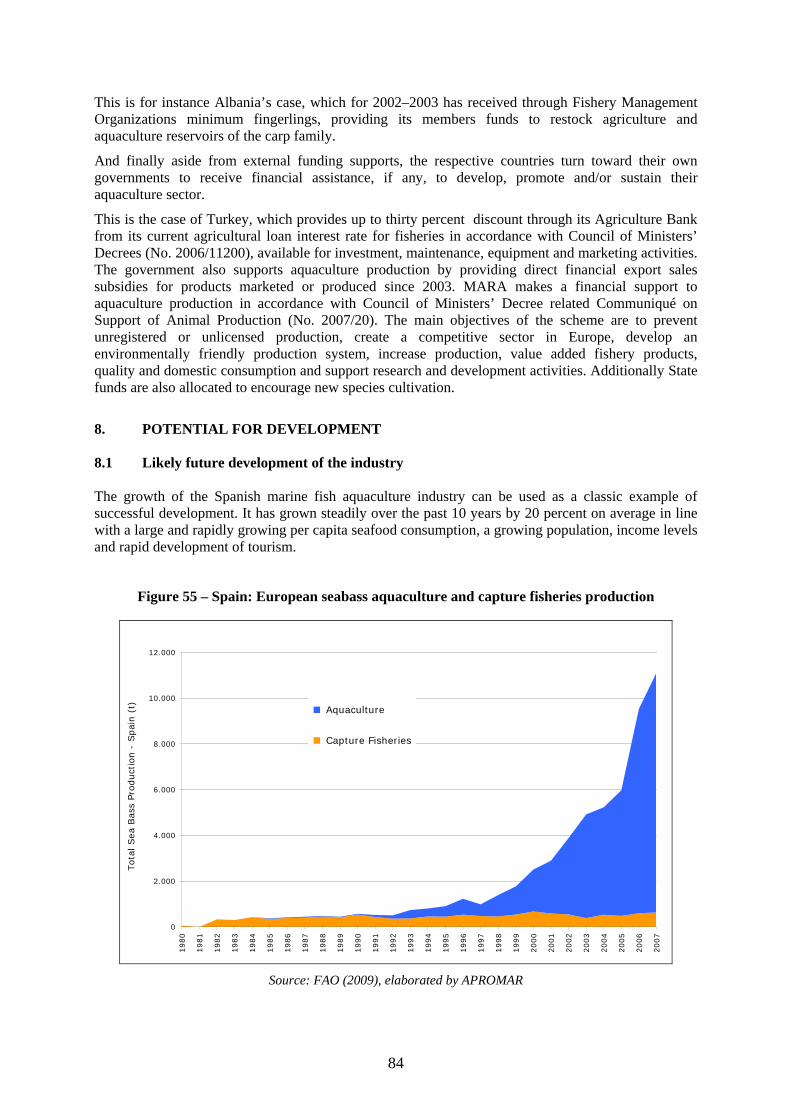
84
This is for instance Albania’s case, which for 2002–2003 has received through Fishery Management Organizations minimum fingerlings, providing its members funds to restock agriculture and aquaculture reservoirs of the carp family.
And finally aside from external funding supports, the respective countries turn toward their own governments to receive financial assistance, if any, to develop, promote and/or sustain their aquaculture sector.
This is the case of Turkey, which provides up to thirty percent discount through its Agriculture Bank from its current agricultural loan interest rate for fisheries in accordance with Council of Ministers’ Decrees (No. 2006/11200), available for investment, maintenance, equipment and marketing activities. The government also supports aquaculture production by providing direct financial export sales subsidies for products marketed or produced since 2003. MARA makes a financial support to aquaculture production in accordance with Council of Ministers’ Decree related Communiqué on Support of Animal Production (No. 2007/20). The main objectives of the scheme are to prevent unregistered or unlicensed production, create a competitive sector in Europe, develop an environmentally friendly production system, increase production, value added fishery products, quality and domestic consumption and support research and development activities. Additionally State funds are also allocated to encourage new species cultivation.
8. POTENTIAL FOR DEVELOPMENT 8.1 Likely future development of the industry The growth of the Spanish marine fish aquaculture industry can be used as a classic example of successful development. It has grown steadily over the past 10 years by 20 percent on average in line with a large and rapidly growing per capita seafood consumption, a growing population, income levels and rapid development of tourism.
Figure 55 – Spain: European seabass aquaculture and capture fisheries production
0
2.000
4.000
6.000
8.000
10.000
12.000
1980
1981
1982
1983
1984
1985
1986
1987
1988
1989
1990
1991
1992
1993
1994
1995
1996
1997
1998
1999
2000
2001
2002
2003
2004
2005
2006
2007
Tota
l Sea
Bas
s Pro
duct
ion -
Spai
n (
t) Aquaculture
Capture Fisheries
Source: FAO (2009), elaborated by APROMAR
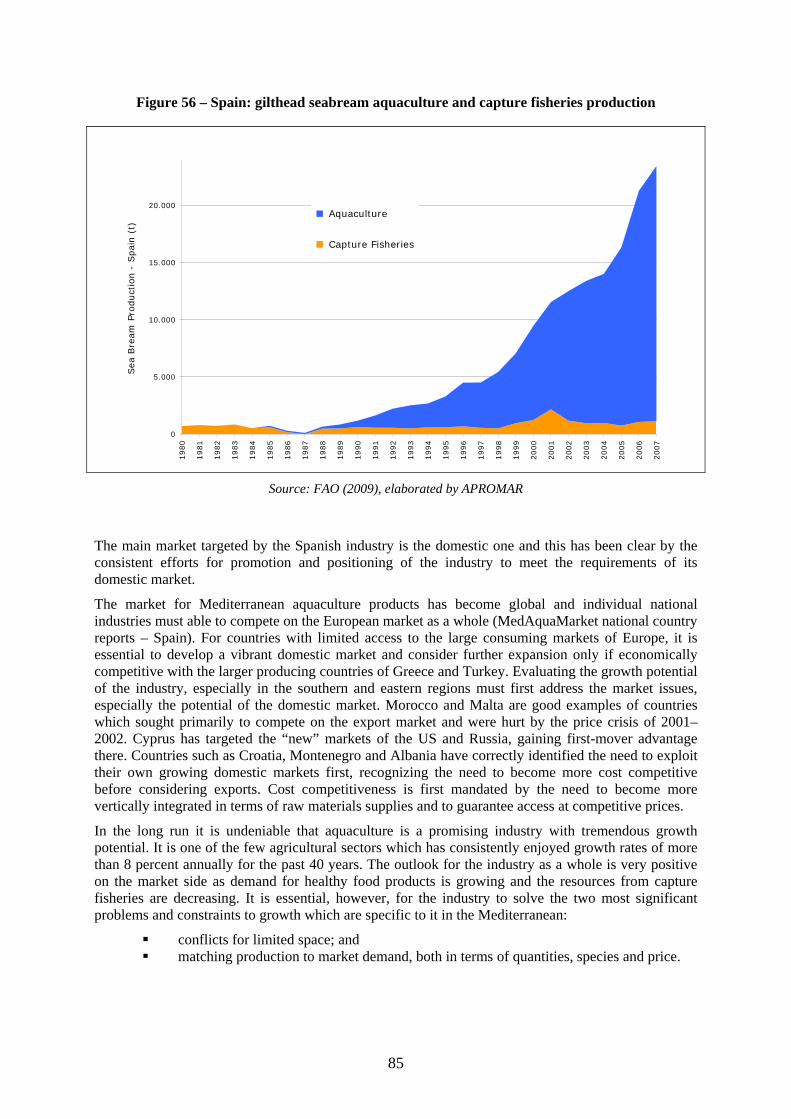
85
Figure 56 – Spain: gilthead seabream aquaculture and capture fisheries production
0
5.000
10.000
15.000
20.000
1980
1981
1982
1983
1984
1985
1986
1987
1988
1989
1990
1991
1992
1993
1994
1995
1996
1997
1998
1999
2000
2001
2002
2003
2004
2005
2006
2007
Sea
Bre
am P
roduct
ion -
Spai
n (
t)
Aquaculture
Capture Fisheries
Source: FAO (2009), elaborated by APROMAR
The main market targeted by the Spanish industry is the domestic one and this has been clear by the consistent efforts for promotion and positioning of the industry to meet the requirements of its domestic market.
The market for Mediterranean aquaculture products has become global and individual national industries must able to compete on the European market as a whole (MedAquaMarket national country reports – Spain). For countries with limited access to the large consuming markets of Europe, it is essential to develop a vibrant domestic market and consider further expansion only if economically competitive with the larger producing countries of Greece and Turkey. Evaluating the growth potential of the industry, especially in the southern and eastern regions must first address the market issues, especially the potential of the domestic market. Morocco and Malta are good examples of countries which sought primarily to compete on the export market and were hurt by the price crisis of 2001–2002. Cyprus has targeted the “new” markets of the US and Russia, gaining first-mover advantage there. Countries such as Croatia, Montenegro and Albania have correctly identified the need to exploit their own growing domestic markets first, recognizing the need to become more cost competitive before considering exports. Cost competitiveness is first mandated by the need to become more vertically integrated in terms of raw materials supplies and to guarantee access at competitive prices.
In the long run it is undeniable that aquaculture is a promising industry with tremendous growth potential. It is one of the few agricultural sectors which has consistently enjoyed growth rates of more than 8 percent annually for the past 40 years. The outlook for the industry as a whole is very positive on the market side as demand for healthy food products is growing and the resources from capture fisheries are decreasing. It is essential, however, for the industry to solve the two most significant problems and constraints to growth which are specific to it in the Mediterranean:
conflicts for limited space; and matching production to market demand, both in terms of quantities, species and price.
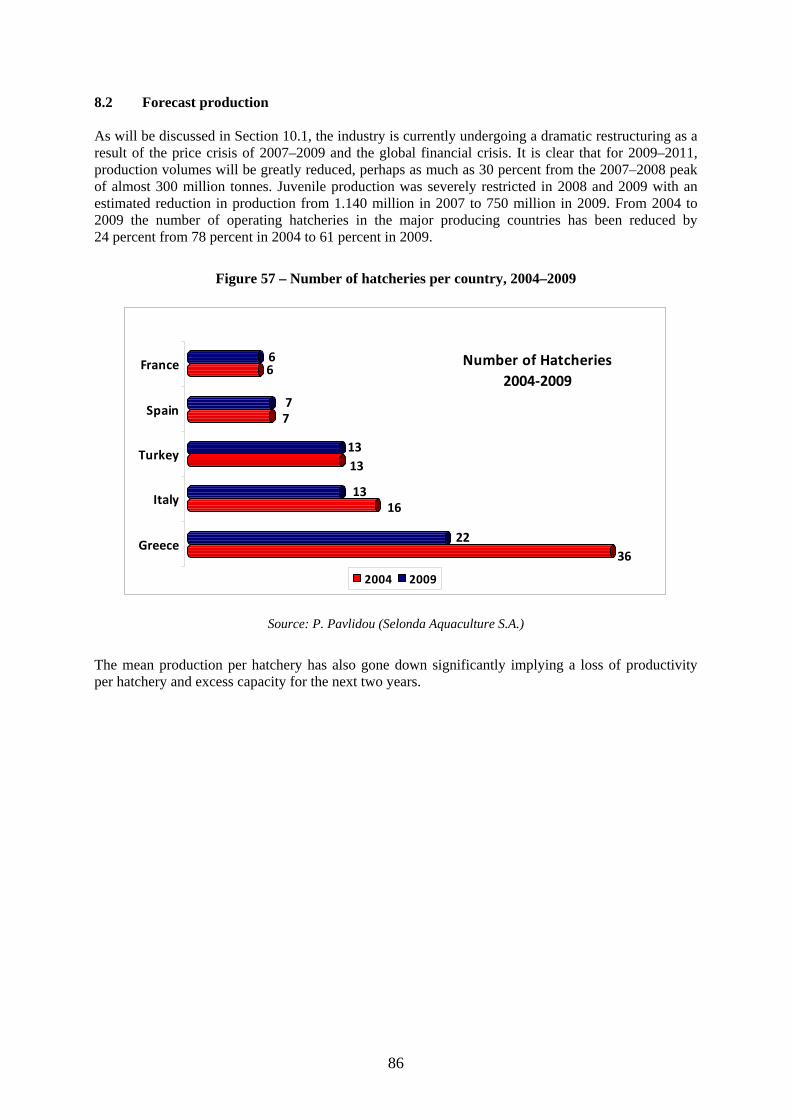
86
8.2 Forecast production As will be discussed in Section 10.1, the industry is currently undergoing a dramatic restructuring as a result of the price crisis of 2007–2009 and the global financial crisis. It is clear that for 2009–2011, production volumes will be greatly reduced, perhaps as much as 30 percent from the 2007–2008 peak of almost 300 million tonnes. Juvenile production was severely restricted in 2008 and 2009 with an estimated reduction in production from 1.140 million in 2007 to 750 million in 2009. From 2004 to 2009 the number of operating hatcheries in the major producing countries has been reduced by 24 percent from 78 percent in 2004 to 61 percent in 2009.
Figure 57 – Number of hatcheries per country, 2004–2009
3622
1613
1313
77
66
Greece
Italy
Turkey
Spain
France Number of Hatcheries2004‐2009
2004 2009
Source: P. Pavlidou (Selonda Aquaculture S.A.)
The mean production per hatchery has also gone down significantly implying a loss of productivity per hatchery and excess capacity for the next two years.
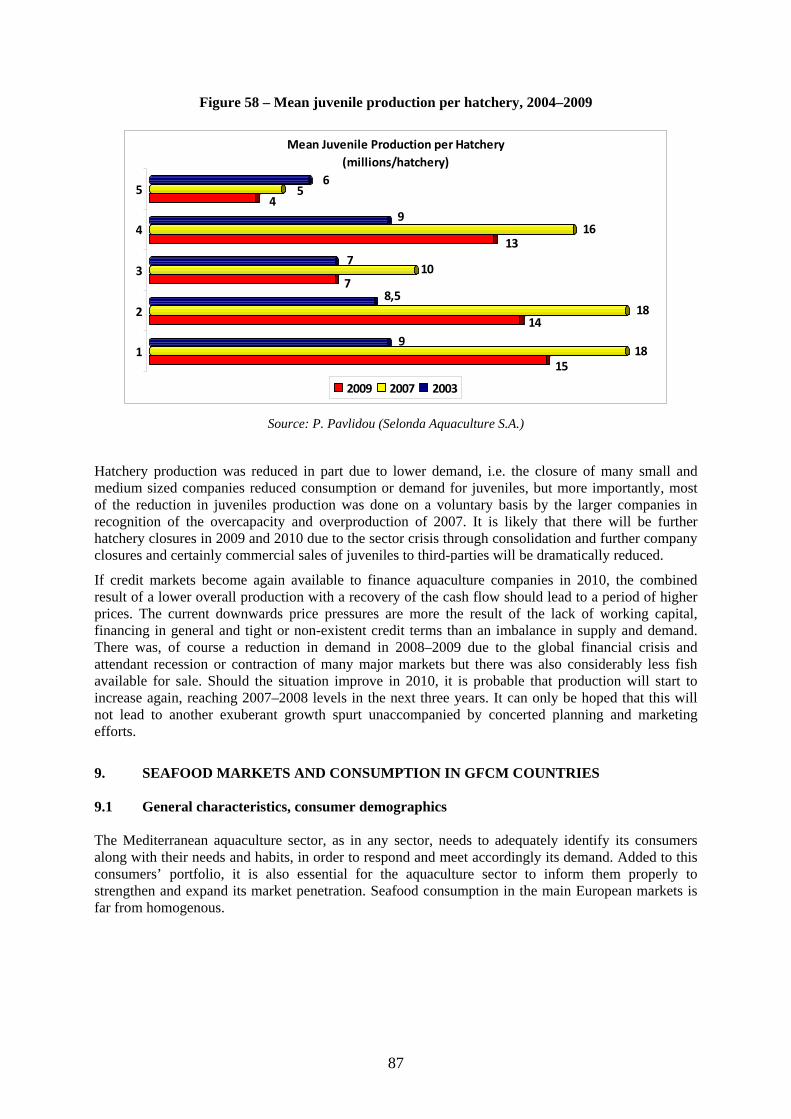
87
Figure 58 – Mean juvenile production per hatchery, 2004–2009
1518
914
188,5
710
713
169
45
6
1
2
3
4
5
Mean Juvenile Production per Hatchery(millions/hatchery)
2009 2007 2003
Source: P. Pavlidou (Selonda Aquaculture S.A.)
Hatchery production was reduced in part due to lower demand, i.e. the closure of many small and medium sized companies reduced consumption or demand for juveniles, but more importantly, most of the reduction in juveniles production was done on a voluntary basis by the larger companies in recognition of the overcapacity and overproduction of 2007. It is likely that there will be further hatchery closures in 2009 and 2010 due to the sector crisis through consolidation and further company closures and certainly commercial sales of juveniles to third-parties will be dramatically reduced.
If credit markets become again available to finance aquaculture companies in 2010, the combined result of a lower overall production with a recovery of the cash flow should lead to a period of higher prices. The current downwards price pressures are more the result of the lack of working capital, financing in general and tight or non-existent credit terms than an imbalance in supply and demand. There was, of course a reduction in demand in 2008–2009 due to the global financial crisis and attendant recession or contraction of many major markets but there was also considerably less fish available for sale. Should the situation improve in 2010, it is probable that production will start to increase again, reaching 2007–2008 levels in the next three years. It can only be hoped that this will not lead to another exuberant growth spurt unaccompanied by concerted planning and marketing efforts.
9. SEAFOOD MARKETS AND CONSUMPTION IN GFCM COUNTRIES 9.1 General characteristics, consumer demographics The Mediterranean aquaculture sector, as in any sector, needs to adequately identify its consumers along with their needs and habits, in order to respond and meet accordingly its demand. Added to this consumers’ portfolio, it is also essential for the aquaculture sector to inform them properly to strengthen and expand its market penetration. Seafood consumption in the main European markets is far from homogenous.
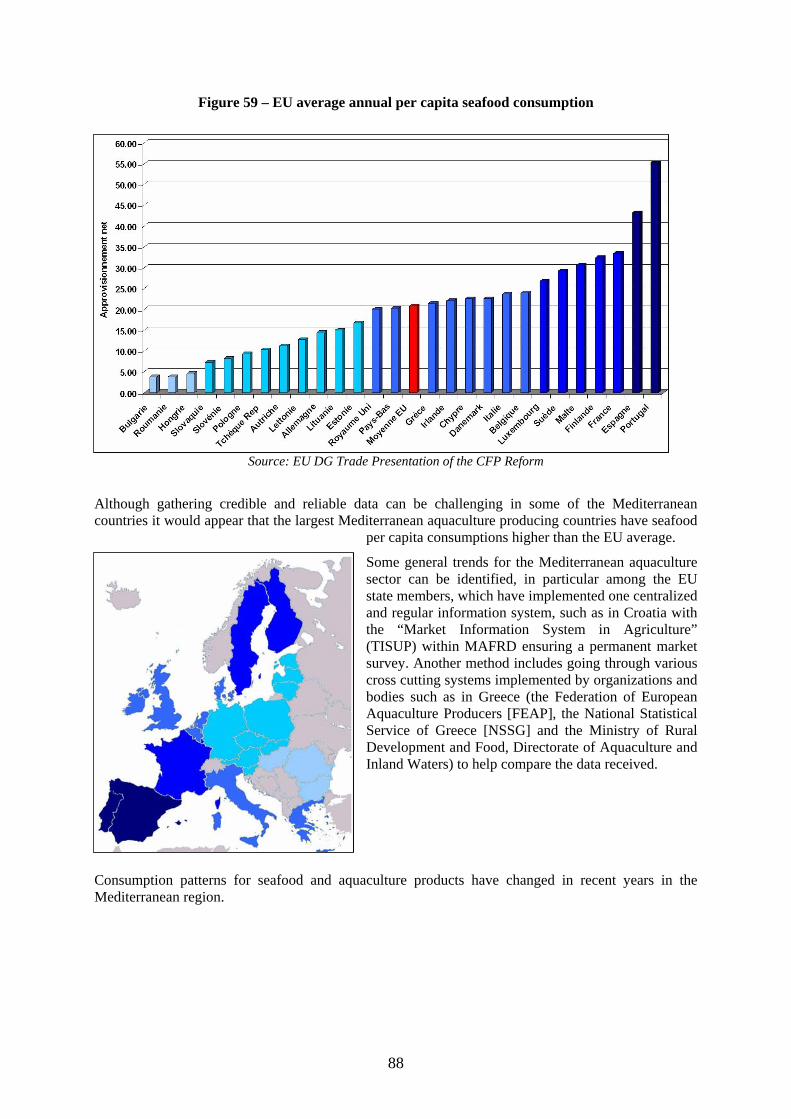
88
Figure 59 – EU average annual per capita seafood consumption
Source: EU DG Trade Presentation of the CFP Reform
Although gathering credible and reliable data can be challenging in some of the Mediterranean countries it would appear that the largest Mediterranean aquaculture producing countries have seafood
per capita consumptions higher than the EU average.
Some general trends for the Mediterranean aquaculture sector can be identified, in particular among the EU state members, which have implemented one centralized and regular information system, such as in Croatia with the “Market Information System in Agriculture” (TISUP) within MAFRD ensuring a permanent market survey. Another method includes going through various cross cutting systems implemented by organizations and bodies such as in Greece (the Federation of European Aquaculture Producers [FEAP], the National Statistical Service of Greece [NSSG] and the Ministry of Rural Development and Food, Directorate of Aquaculture and Inland Waters) to help compare the data received.
Consumption patterns for seafood and aquaculture products have changed in recent years in the Mediterranean region.
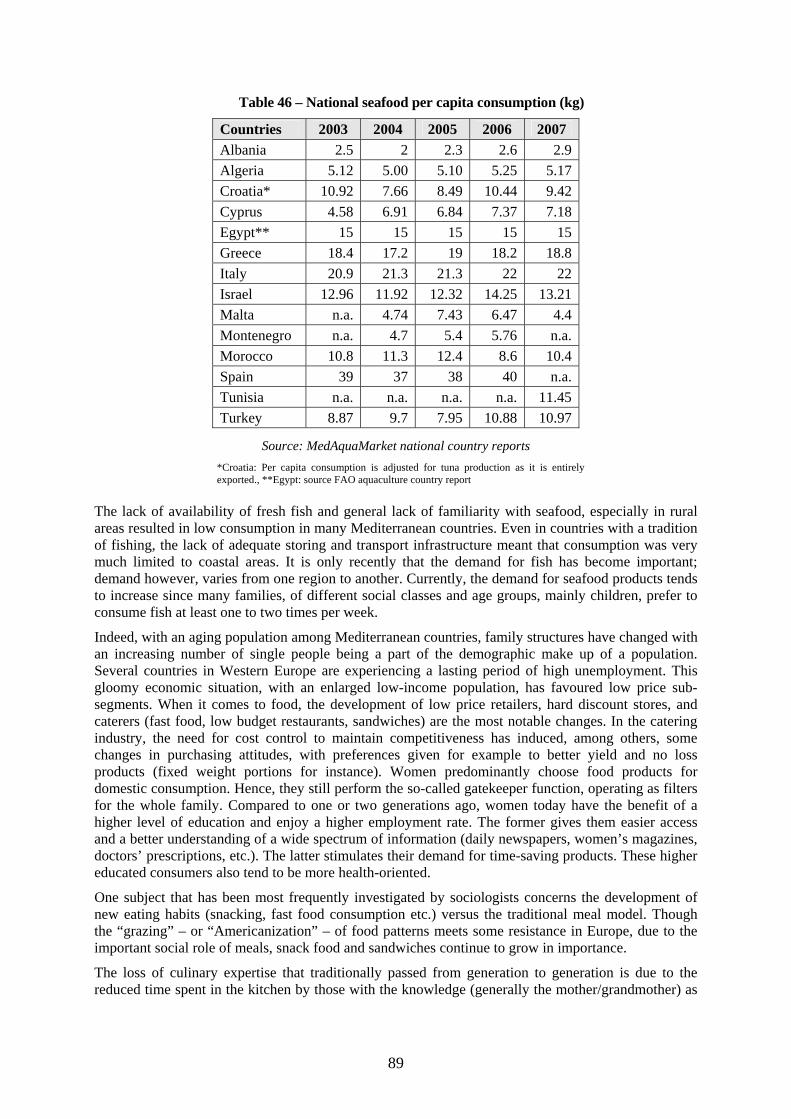
89
Table 46 – National seafood per capita consumption (kg)
Source: MedAquaMarket national country reports *Croatia: Per capita consumption is adjusted for tuna production as it is entirely exported., **Egypt: source FAO aquaculture country report
The lack of availability of fresh fish and general lack of familiarity with seafood, especially in rural areas resulted in low consumption in many Mediterranean countries. Even in countries with a tradition of fishing, the lack of adequate storing and transport infrastructure meant that consumption was very much limited to coastal areas. It is only recently that the demand for fish has become important; demand however, varies from one region to another. Currently, the demand for seafood products tends to increase since many families, of different social classes and age groups, mainly children, prefer to consume fish at least one to two times per week.
Indeed, with an aging population among Mediterranean countries, family structures have changed with an increasing number of single people being a part of the demographic make up of a population. Several countries in Western Europe are experiencing a lasting period of high unemployment. This gloomy economic situation, with an enlarged low-income population, has favoured low price sub-segments. When it comes to food, the development of low price retailers, hard discount stores, and caterers (fast food, low budget restaurants, sandwiches) are the most notable changes. In the catering industry, the need for cost control to maintain competitiveness has induced, among others, some changes in purchasing attitudes, with preferences given for example to better yield and no loss products (fixed weight portions for instance). Women predominantly choose food products for domestic consumption. Hence, they still perform the so-called gatekeeper function, operating as filters for the whole family. Compared to one or two generations ago, women today have the benefit of a higher level of education and enjoy a higher employment rate. The former gives them easier access and a better understanding of a wide spectrum of information (daily newspapers, women’s magazines, doctors’ prescriptions, etc.). The latter stimulates their demand for time-saving products. These higher educated consumers also tend to be more health-oriented.
One subject that has been most frequently investigated by sociologists concerns the development of new eating habits (snacking, fast food consumption etc.) versus the traditional meal model. Though the “grazing” – or “Americanization” – of food patterns meets some resistance in Europe, due to the important social role of meals, snack food and sandwiches continue to grow in importance.
The loss of culinary expertise that traditionally passed from generation to generation is due to the reduced time spent in the kitchen by those with the knowledge (generally the mother/grandmother) as
Countries 2003 2004 2005 2006 2007 Albania 2.5 2 2.3 2.6 2.9 Algeria 5.12 5.00 5.10 5.25 5.17 Croatia* 10.92 7.66 8.49 10.44 9.42 Cyprus 4.58 6.91 6.84 7.37 7.18 Egypt** 15 15 15 15 15 Greece 18.4 17.2 19 18.2 18.8 Italy 20.9 21.3 21.3 22 22 Israel 12.96 11.92 12.32 14.25 13.21 Malta n.a. 4.74 7.43 6.47 4.4 Montenegro n.a. 4.7 5.4 5.76 n.a. Morocco 10.8 11.3 12.4 8.6 10.4 Spain 39 37 38 40 n.a. Tunisia n.a. n.a. n.a. n.a. 11.45 Turkey 8.87 9.7 7.95 10.88 10.97
90
well as by those learning (children/young adults) and possibly due to lack of interest. This phenomenon has stimulated the demand for already made products, for all dishes (starters, main dishes, desserts).
The growing need for time-saving products of householders and catering chefs and the impact on the seafood industry have been demonstrated earlier. Cleaning, cutting into portions, pre-cooking, assembling is performed increasingly by industrialists, but less and less by end-users. Not only do consumers yearn for pre-processed products at competitive prices, they tend to give their preference to items that carry “positive” values.
Nevertheless, these consumption habits vary from one region to another, according to the local cooking traditions. For instance, Egyptians prepare the fish in different ways such as boiled, fried, grilled or cooked with vegetables. Seafood shrimps and lobsters are usually the main soup contents, as being considered the special dish in most of the famous hotels and restaurants of the country.
It seems that the southern Mediterranean countries have in this sense a different set of culinary and cooking traditions which continues to lead its populations overall seafood consumption.
Most aquaculture activities are developed near the coast, lakes (such as in Albania), if not offshore. Locals at local and regional markets near these production locations are purchasing most of the seafood products consumed. This is particularly the case in the southern regions of Mediterranean such as in Tunisia with its Tunis, Sfax and Sousse markets or in Egypt with its El-Abour, Six of October, and Kafr El-Shikh markets where auctions are organized at sunrise and sunset.
Most of the population living in large cities, in particular in coastal areas, prefers to purchase fish as a healthy product rather than red or white meat. For instance, in Morocco, fish consumption among the urban population is twice as high as in rural areas. This can be well illustrated by a recent study realized by the Technological Institute of Thessaloniki in Greece that revealed that about ten percent of the sample (national, stratified) population stated that they do not consume aquatic food products. This share was higher for women living in Athens and Thessaloniki, but lower for women living in other parts of Greece. Moreover, this study also revealed that about a quarter of single-person households do not consume aquatic food products. As the number of persons per household increases, so does consumption of such products, with only 3.2 percent of a household of 4 percent people or more stating no consumption of aquatic-food products.
From a regional perspective, in the southern regions of Mediterranean, fish is still seen in general as expensive, such as for a Moroccan consumer with an average income; even if expenditure for fish purchase represents three point seven percent 3.7 percent of the total food expenditure against two point seven percent 2.7 percent in 2001 for this country.
In the northern region of the Mediterranean, the changes in the composition of the population have created new segments of consumers who are profoundly changing their food consumption habits. The most important segment of new consumers are the elderly, young, single adults and immigrants. The main consequences of these changes on the consumption of fish are to be found in increasing the motivation of consumption-type diet/health, the elderly population is typically a population close to the personal care and use. An aging population can have many consequences for the modifications of the structure and composition of consumption. There are two key elements:
the first is the low purchasing power of people to higher bands of age (the Istat and Censis analysis in this regard are self explaining: the new, growing segment of poverty is mainly concentrated within these interest groups); and
the second is that, almost by definition, older people have more traditional lifestyles and are poorly permeable to innovative models of consumption.
Moreover, significant increases in frozen product consumption were recorded for this region, as for instance in Italy where its Southern region encountered a raise of about nine percent (9 percent) and its North-East of over thirteen percent (13 percent). On average, households in Italy consume in between 20 kilogrammes to 26 kilogrammes of seafood in a year, according to their respective location.
91
The purchasing habits have also evolved in the northern region of Mediterranean, where the modern distribution retail channels have found a unique market share focusing their product’s added value on quality, price, service content, range and freshness of products.
Among the factors that have contributed to the rapid increase in market share by the modern distribution channels are price competitiveness, service, convenience, large product ranges and quality assurance.
Even if most of the Mediterranean region sees an increase in overall seafood consumption, some countries do not follow this pattern. For instance in Montenegro, where seafood consumption is relatively low at an annual per capita consumption of 5.3 kg, several reasons have been identified to explain this pattern:
the low level and irregular collection of fish and then both its distribution and promotion constraints (outlets limits and its high cost of distribution and sales);
the culinary and consumption traditions privileging meat over fish products; and; consumers being poorly aware of the benefits of fish consumption.
In brief, several patterns have to be taken into consideration when studying the general characteristics of seafood consumption among the Mediterranean countries. For example, the culinary and cooking traditions, the transformation of the population’s demographics and profile, along with its access to knowledge (benefits of seafood products), its access to local and regional seafood markets and/or stores and seafood production sites.
All of these patterns provide a colourful map of the various habits of consumption of seafood in the Mediterranean region. 9.2 Consumption of capture fisheries products Seafood consumption is on a positive trend in most Mediterranean countries as explained in the section 9.1. In the context of wild fish shortage, due to both high demand and declining available fisheries resources, market circumstances look favourable to farmed fish. Yet, commercial success depends upon the sellers’ ability to be price competitive (compared to other same species producers, compared to other farmed species) and to comply with buyers’ specifications.
Consumers tend to favour the species they know, unless something attractive catches their attention. Price is probably the number one enticing factor. Price was for instance a major reason for the success of Nile perch and explains the recent boom in pangasius sales. European seabass and gilthead seabream are extensively sold as fresh head-on, round or gutted small size fish. Despite a potential demand, industrial production of fillets is marginal. The production cost of large size fish is high and does not allow the production of fillets with relatively low yields of competitive prices. For similar reasons, no other value added items are available on the market.
The major markets for European seabass and gilthead seabream are located in southern Europe, where both species belong to fishing and culinary traditions, where domestic production does not cover the appetite of the population for the species.
Italy is the largest market for European seabass and gilthead seabream, followed by Spain and France. In Italy, imports of fresh European seabass boomed from 4 200 tonnes in 1996 to 16 800 tonnes in 2004. For Spain, 570 tonnes to 6 800 tonnes were imported in the same period. Over the same period, imports of gilthead seabream developed from 2 500 to 12 700 tonnes in Italy, from 70 tonnes to 2 200 tonnes in Portugal; for France, from 2 tonnes to 12 700 tonnes (Eurostat). The double digits annual growth in those traditional markets is now slowing down to a few percentages per annum. European seabass is slightly more widely distributed than gilthead seabream, with a reputation that goes up to the Baltic Sea, whereas gilthead seabream is better known the further south you go. In Germany, the United Kingdom and the Netherlands, gilthead seabream is clearly perceived as an “exotic” species. After 15 years of intensive aquaculture, growing production and declining prices, some markets are naturally open to these species and are getting close to saturation for the traditional whole fresh form.
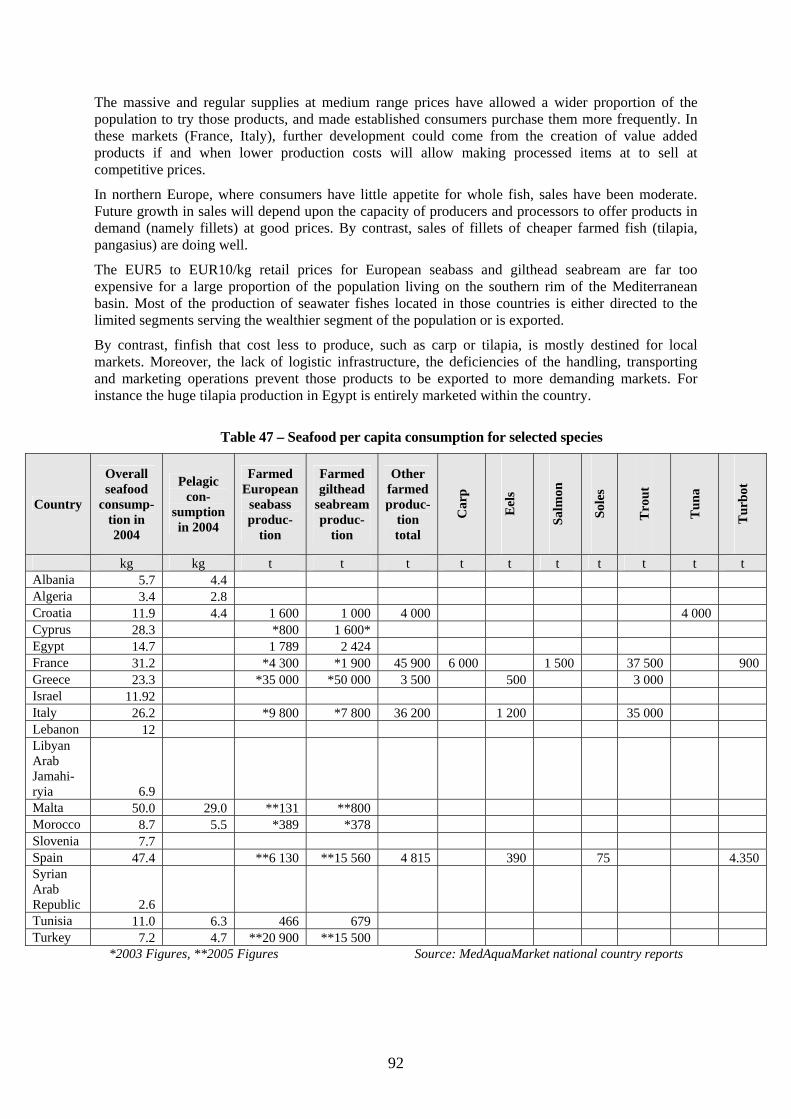
92
The massive and regular supplies at medium range prices have allowed a wider proportion of the population to try those products, and made established consumers purchase them more frequently. In these markets (France, Italy), further development could come from the creation of value added products if and when lower production costs will allow making processed items at to sell at competitive prices.
In northern Europe, where consumers have little appetite for whole fish, sales have been moderate. Future growth in sales will depend upon the capacity of producers and processors to offer products in demand (namely fillets) at good prices. By contrast, sales of fillets of cheaper farmed fish (tilapia, pangasius) are doing well.
The EUR5 to EUR10/kg retail prices for European seabass and gilthead seabream are far too expensive for a large proportion of the population living on the southern rim of the Mediterranean basin. Most of the production of seawater fishes located in those countries is either directed to the limited segments serving the wealthier segment of the population or is exported.
By contrast, finfish that cost less to produce, such as carp or tilapia, is mostly destined for local markets. Moreover, the lack of logistic infrastructure, the deficiencies of the handling, transporting and marketing operations prevent those products to be exported to more demanding markets. For instance the huge tilapia production in Egypt is entirely marketed within the country.
Table 47 – Seafood per capita consumption for selected species
Country
Overall seafood
consump-tion in 2004
Pelagic con-
sumption in 2004
Farmed European
seabass produc-
tion
Farmed gilthead
seabream produc-
tion
Other farmed produc-
tion total
Car
p
Eel
s
Salm
on
Sole
s
Tro
ut
Tun
a
Tur
bot
kg kg t t t t t t t t t t Albania 5.7 4.4 Algeria 3.4 2.8 Croatia 11.9 4.4 1 600 1 000 4 000 4 000 Cyprus 28.3 *800 1 600* Egypt 14.7 1 789 2 424 France 31.2 *4 300 *1 900 45 900 6 000 1 500 37 500 900 Greece 23.3 *35 000 *50 000 3 500 500 3 000 Israel 11.92 Italy 26.2 *9 800 *7 800 36 200 1 200 35 000 Lebanon 12 Libyan Arab Jamahi-ryia 6.9 Malta 50.0 29.0 **131 **800 Morocco 8.7 5.5 *389 *378 Slovenia 7.7 Spain 47.4 **6 130 **15 560 4 815 390 75 4.350 Syrian Arab Republic 2.6 Tunisia 11.0 6.3 466 679 Turkey 7.2 4.7 **20 900 **15 500
*2003 Figures, **2005 Figures Source: MedAquaMarket national country reports
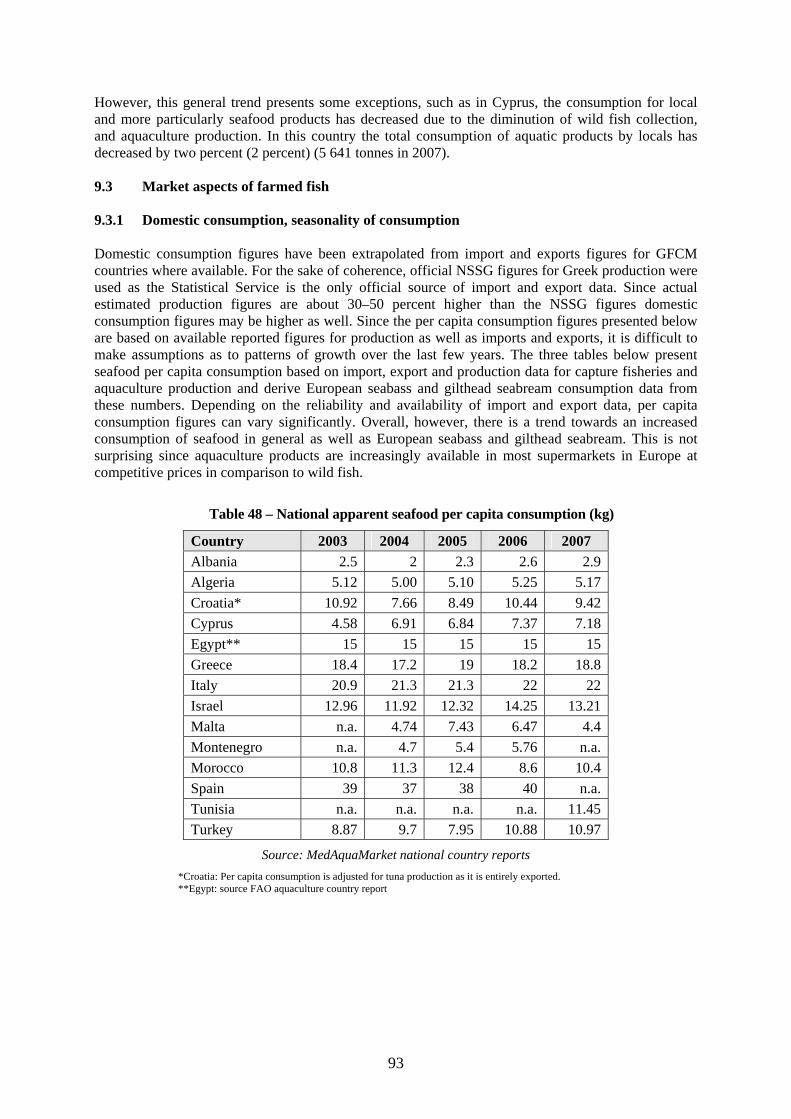
93
However, this general trend presents some exceptions, such as in Cyprus, the consumption for local and more particularly seafood products has decreased due to the diminution of wild fish collection, and aquaculture production. In this country the total consumption of aquatic products by locals has decreased by two percent (2 percent) (5 641 tonnes in 2007). 9.3 Market aspects of farmed fish 9.3.1 Domestic consumption, seasonality of consumption Domestic consumption figures have been extrapolated from import and exports figures for GFCM countries where available. For the sake of coherence, official NSSG figures for Greek production were used as the Statistical Service is the only official source of import and export data. Since actual estimated production figures are about 30–50 percent higher than the NSSG figures domestic consumption figures may be higher as well. Since the per capita consumption figures presented below are based on available reported figures for production as well as imports and exports, it is difficult to make assumptions as to patterns of growth over the last few years. The three tables below present seafood per capita consumption based on import, export and production data for capture fisheries and aquaculture production and derive European seabass and gilthead seabream consumption data from these numbers. Depending on the reliability and availability of import and export data, per capita consumption figures can vary significantly. Overall, however, there is a trend towards an increased consumption of seafood in general as well as European seabass and gilthead seabream. This is not surprising since aquaculture products are increasingly available in most supermarkets in Europe at competitive prices in comparison to wild fish.
Table 48 – National apparent seafood per capita consumption (kg)
Source: MedAquaMarket national country reports *Croatia: Per capita consumption is adjusted for tuna production as it is entirely exported. **Egypt: source FAO aquaculture country report
Country 2003 2004 2005 2006 2007 Albania 2.5 2 2.3 2.6 2.9 Algeria 5.12 5.00 5.10 5.25 5.17 Croatia* 10.92 7.66 8.49 10.44 9.42 Cyprus 4.58 6.91 6.84 7.37 7.18 Egypt** 15 15 15 15 15 Greece 18.4 17.2 19 18.2 18.8 Italy 20.9 21.3 21.3 22 22 Israel 12.96 11.92 12.32 14.25 13.21 Malta n.a. 4.74 7.43 6.47 4.4 Montenegro n.a. 4.7 5.4 5.76 n.a. Morocco 10.8 11.3 12.4 8.6 10.4 Spain 39 37 38 40 n.a. Tunisia n.a. n.a. n.a. n.a. 11.45 Turkey 8.87 9.7 7.95 10.88 10.97
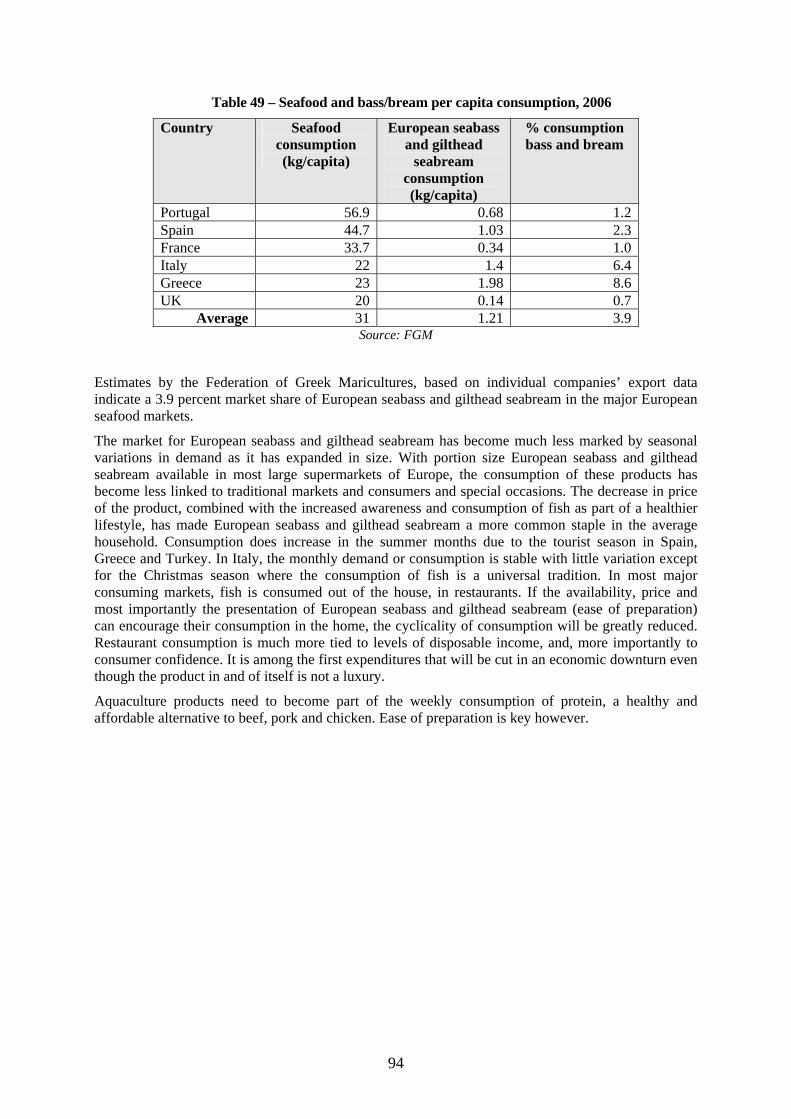
94
Table 49 – Seafood and bass/bream per capita consumption, 2006
Country Seafood consumption (kg/capita)
European seabass and gilthead
seabream consumption (kg/capita)
% consumption bass and bream
Portugal 56.9 0.68 1.2 Spain 44.7 1.03 2.3 France 33.7 0.34 1.0 Italy 22 1.4 6.4 Greece 23 1.98 8.6 UK 20 0.14 0.7
Average 31 1.21 3.9 Source: FGM
Estimates by the Federation of Greek Maricultures, based on individual companies’ export data indicate a 3.9 percent market share of European seabass and gilthead seabream in the major European seafood markets.
The market for European seabass and gilthead seabream has become much less marked by seasonal variations in demand as it has expanded in size. With portion size European seabass and gilthead seabream available in most large supermarkets of Europe, the consumption of these products has become less linked to traditional markets and consumers and special occasions. The decrease in price of the product, combined with the increased awareness and consumption of fish as part of a healthier lifestyle, has made European seabass and gilthead seabream a more common staple in the average household. Consumption does increase in the summer months due to the tourist season in Spain, Greece and Turkey. In Italy, the monthly demand or consumption is stable with little variation except for the Christmas season where the consumption of fish is a universal tradition. In most major consuming markets, fish is consumed out of the house, in restaurants. If the availability, price and most importantly the presentation of European seabass and gilthead seabream (ease of preparation) can encourage their consumption in the home, the cyclicality of consumption will be greatly reduced. Restaurant consumption is much more tied to levels of disposable income, and, more importantly to consumer confidence. It is among the first expenditures that will be cut in an economic downturn even though the product in and of itself is not a luxury.
Aquaculture products need to become part of the weekly consumption of protein, a healthy and affordable alternative to beef, pork and chicken. Ease of preparation is key however.
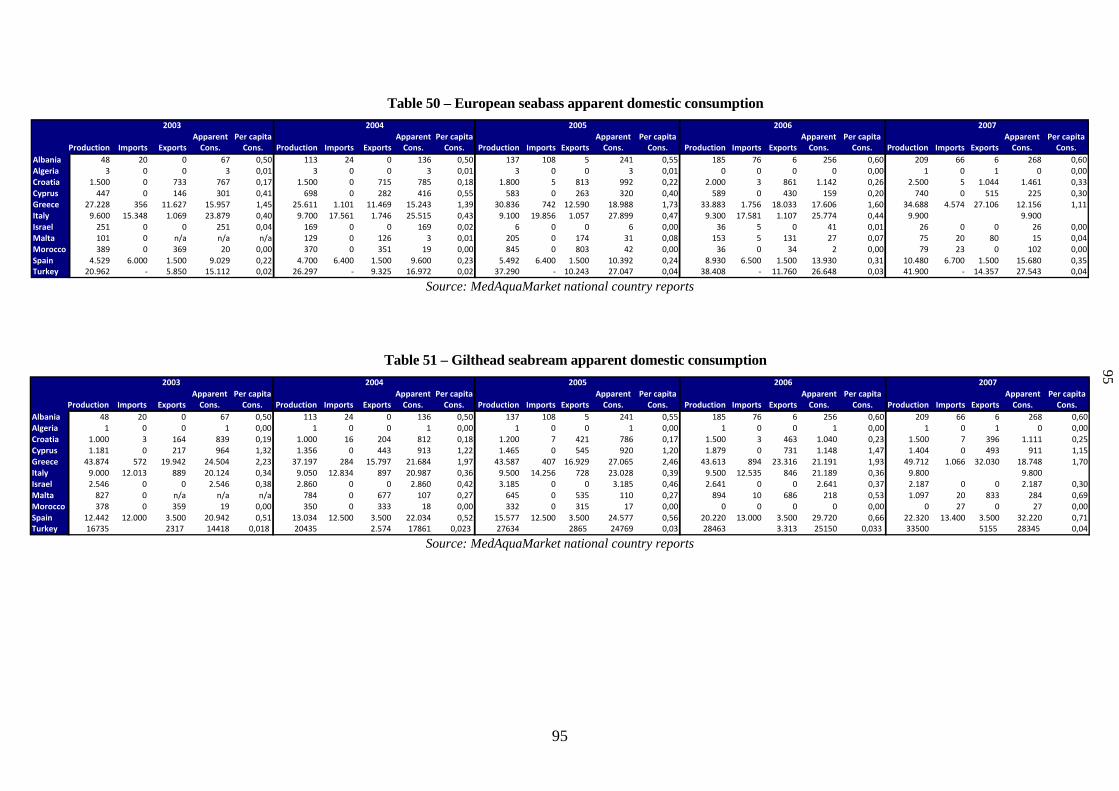
95
95
Table 50 – European seabass apparent domestic consumption
Source: MedAquaMarket national country reports
Table 51 – Gilthead seabream apparent domestic consumption
Source: MedAquaMarket national country reports
Apparent Per capita Apparent Per capita Apparent Per capita Apparent Per capita Apparent Per capitaProduction Imports Exports Cons. Cons. Production Imports Exports Cons. Cons. Production Imports Exports Cons. Cons. Production Imports Exports Cons. Cons. Production Imports Exports Cons. Cons.
Albania 48 20 0 67 0,50 113 24 0 136 0,50 137 108 5 241 0,55 185 76 6 256 0,60 209 66 6 268 0,60Algeria 3 0 0 3 0,01 3 0 0 3 0,01 3 0 0 3 0,01 0 0 0 0 0,00 1 0 1 0 0,00Croatia 1.500 0 733 767 0,17 1.500 0 715 785 0,18 1.800 5 813 992 0,22 2.000 3 861 1.142 0,26 2.500 5 1.044 1.461 0,33Cyprus 447 0 146 301 0,41 698 0 282 416 0,55 583 0 263 320 0,40 589 0 430 159 0,20 740 0 515 225 0,30Greece 27.228 356 11.627 15.957 1,45 25.611 1.101 11.469 15.243 1,39 30.836 742 12.590 18.988 1,73 33.883 1.756 18.033 17.606 1,60 34.688 4.574 27.106 12.156 1,11Italy 9.600 15.348 1.069 23.879 0,40 9.700 17.561 1.746 25.515 0,43 9.100 19.856 1.057 27.899 0,47 9.300 17.581 1.107 25.774 0,44 9.900 9.900Israel 251 0 0 251 0,04 169 0 0 169 0,02 6 0 0 6 0,00 36 5 0 41 0,01 26 0 0 26 0,00Malta 101 0 n/a n/a n/a 129 0 126 3 0,01 205 0 174 31 0,08 153 5 131 27 0,07 75 20 80 15 0,04Morocco 389 0 369 20 0,00 370 0 351 19 0,00 845 0 803 42 0,00 36 0 34 2 0,00 79 23 0 102 0,00Spain 4.529 6.000 1.500 9.029 0,22 4.700 6.400 1.500 9.600 0,23 5.492 6.400 1.500 10.392 0,24 8.930 6.500 1.500 13.930 0,31 10.480 6.700 1.500 15.680 0,35Turkey 20.962 ‐ 5.850 15.112 0,02 26.297 ‐ 9.325 16.972 0,02 37.290 ‐ 10.243 27.047 0,04 38.408 ‐ 11.760 26.648 0,03 41.900 ‐ 14.357 27.543 0,04
20072003 2004 2005 2006
Apparent Per capita Apparent Per capita Apparent Per capita Apparent Per capita Apparent Per capitaProduction Imports Exports Cons. Cons. Production Imports Exports Cons. Cons. Production Imports Exports Cons. Cons. Production Imports Exports Cons. Cons. Production Imports Exports Cons. Cons.
Albania 48 20 0 67 0,50 113 24 0 136 0,50 137 108 5 241 0,55 185 76 6 256 0,60 209 66 6 268 0,60Algeria 1 0 0 1 0,00 1 0 0 1 0,00 1 0 0 1 0,00 1 0 0 1 0,00 1 0 1 0 0,00Croatia 1.000 3 164 839 0,19 1.000 16 204 812 0,18 1.200 7 421 786 0,17 1.500 3 463 1.040 0,23 1.500 7 396 1.111 0,25Cyprus 1.181 0 217 964 1,32 1.356 0 443 913 1,22 1.465 0 545 920 1,20 1.879 0 731 1.148 1,47 1.404 0 493 911 1,15Greece 43.874 572 19.942 24.504 2,23 37.197 284 15.797 21.684 1,97 43.587 407 16.929 27.065 2,46 43.613 894 23.316 21.191 1,93 49.712 1.066 32.030 18.748 1,70Italy 9.000 12.013 889 20.124 0,34 9.050 12.834 897 20.987 0,36 9.500 14.256 728 23.028 0,39 9.500 12.535 846 21.189 0,36 9.800 9.800Israel 2.546 0 0 2.546 0,38 2.860 0 0 2.860 0,42 3.185 0 0 3.185 0,46 2.641 0 0 2.641 0,37 2.187 0 0 2.187 0,30Malta 827 0 n/a n/a n/a 784 0 677 107 0,27 645 0 535 110 0,27 894 10 686 218 0,53 1.097 20 833 284 0,69Morocco 378 0 359 19 0,00 350 0 333 18 0,00 332 0 315 17 0,00 0 0 0 0 0,00 0 27 0 27 0,00Spain 12.442 12.000 3.500 20.942 0,51 13.034 12.500 3.500 22.034 0,52 15.577 12.500 3.500 24.577 0,56 20.220 13.000 3.500 29.720 0,66 22.320 13.400 3.500 32.220 0,71Turkey 16735 2317 14418 0,018 20435 2.574 17861 0,023 27634 2865 24769 0,03 28463 3.313 25150 0,033 33500 5155 28345 0,04
2003 2004 2005 2006 2007
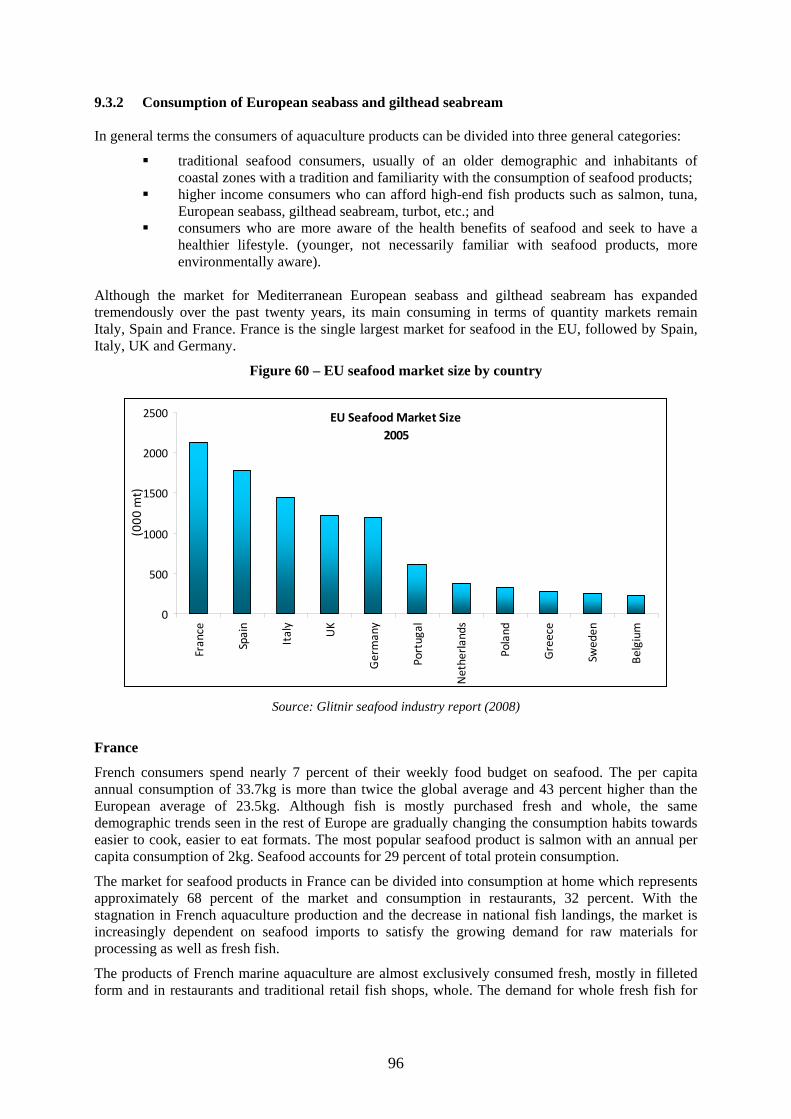
96
9.3.2 Consumption of European seabass and gilthead seabream In general terms the consumers of aquaculture products can be divided into three general categories:
traditional seafood consumers, usually of an older demographic and inhabitants of coastal zones with a tradition and familiarity with the consumption of seafood products;
higher income consumers who can afford high-end fish products such as salmon, tuna, European seabass, gilthead seabream, turbot, etc.; and
consumers who are more aware of the health benefits of seafood and seek to have a healthier lifestyle. (younger, not necessarily familiar with seafood products, more environmentally aware).
Although the market for Mediterranean European seabass and gilthead seabream has expanded tremendously over the past twenty years, its main consuming in terms of quantity markets remain Italy, Spain and France. France is the single largest market for seafood in the EU, followed by Spain, Italy, UK and Germany.
Figure 60 – EU seafood market size by country
EU Seafood Market Size 2005
0
500
1000
1500
2000
2500
France
Spain
Italy
UK
Germany
Portugal
Netherlands
Poland
Greece
Sweden
Belgium
(000
mt)
Source: Glitnir seafood industry report (2008)
France
French consumers spend nearly 7 percent of their weekly food budget on seafood. The per capita annual consumption of 33.7kg is more than twice the global average and 43 percent higher than the European average of 23.5kg. Although fish is mostly purchased fresh and whole, the same demographic trends seen in the rest of Europe are gradually changing the consumption habits towards easier to cook, easier to eat formats. The most popular seafood product is salmon with an annual per capita consumption of 2kg. Seafood accounts for 29 percent of total protein consumption.
The market for seafood products in France can be divided into consumption at home which represents approximately 68 percent of the market and consumption in restaurants, 32 percent. With the stagnation in French aquaculture production and the decrease in national fish landings, the market is increasingly dependent on seafood imports to satisfy the growing demand for raw materials for processing as well as fresh fish.
The products of French marine aquaculture are almost exclusively consumed fresh, mostly in filleted form and in restaurants and traditional retail fish shops, whole. The demand for whole fresh fish for
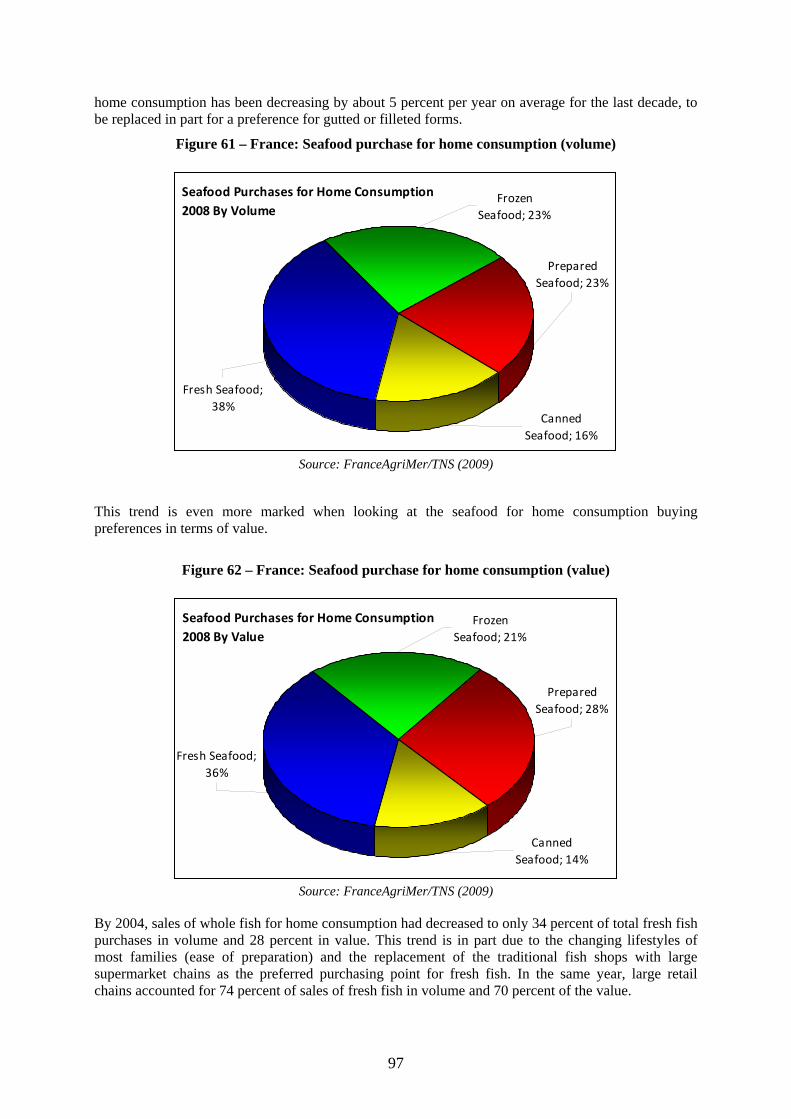
97
home consumption has been decreasing by about 5 percent per year on average for the last decade, to be replaced in part for a preference for gutted or filleted forms.
Figure 61 – France: Seafood purchase for home consumption (volume)
Seafood Purchases for Home Consumption2008 By Volume
Fresh Seafood; 38%
Frozen Seafood; 23%
Prepared Seafood; 23%
Canned Seafood; 16%
Source: FranceAgriMer/TNS (2009)
This trend is even more marked when looking at the seafood for home consumption buying preferences in terms of value.
Figure 62 – France: Seafood purchase for home consumption (value)
Seafood Purchases for Home Consumption2008 By Value
Fresh Seafood; 36%
Frozen Seafood; 21%
Prepared Seafood; 28%
Canned Seafood; 14%
Source: FranceAgriMer/TNS (2009)
By 2004, sales of whole fish for home consumption had decreased to only 34 percent of total fresh fish purchases in volume and 28 percent in value. This trend is in part due to the changing lifestyles of most families (ease of preparation) and the replacement of the traditional fish shops with large supermarket chains as the preferred purchasing point for fresh fish. In the same year, large retail chains accounted for 74 percent of sales of fresh fish in volume and 70 percent of the value.
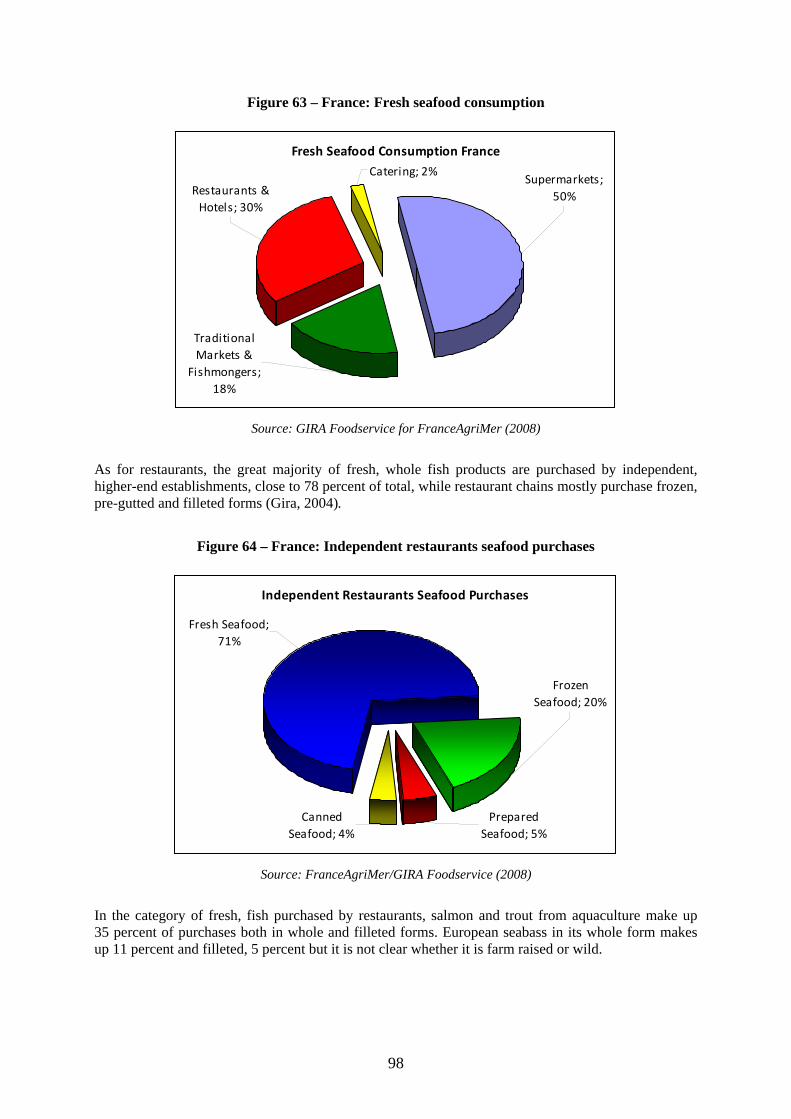
98
Figure 63 – France: Fresh seafood consumption
Fresh Seafood Consumption France
Supermarkets; 50%
Traditional Markets &
Fishmongers; 18%
Restaurants & Hotels; 30%
Catering; 2%
Source: GIRA Foodservice for FranceAgriMer (2008)
As for restaurants, the great majority of fresh, whole fish products are purchased by independent, higher-end establishments, close to 78 percent of total, while restaurant chains mostly purchase frozen, pre-gutted and filleted forms (Gira, 2004).
Figure 64 – France: Independent restaurants seafood purchases
Independent Restaurants Seafood Purchases
Fresh Seafood; 71%
Frozen Seafood; 20%
Prepared Seafood; 5%
Canned Seafood; 4%
Source: FranceAgriMer/GIRA Foodservice (2008)
In the category of fresh, fish purchased by restaurants, salmon and trout from aquaculture make up 35 percent of purchases both in whole and filleted forms. European seabass in its whole form makes up 11 percent and filleted, 5 percent but it is not clear whether it is farm raised or wild.
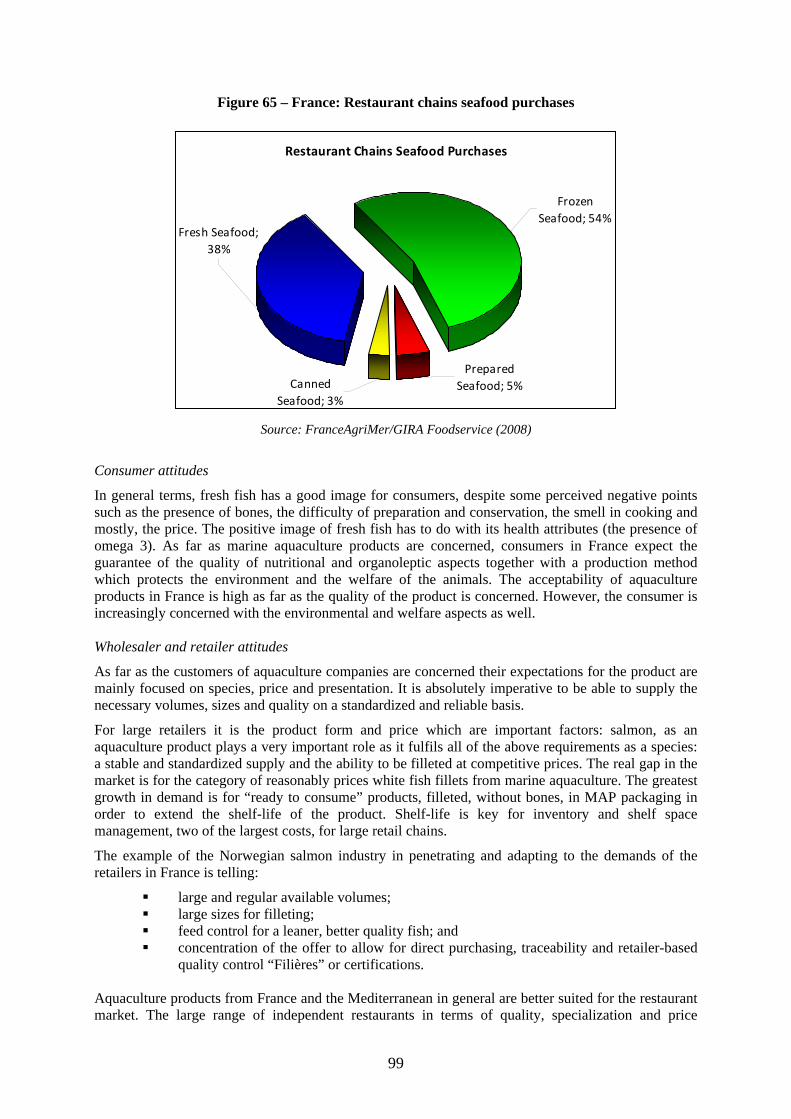
99
Figure 65 – France: Restaurant chains seafood purchases
Restaurant Chains Seafood Purchases
Canned Seafood; 3%
Prepared Seafood; 5%
Frozen Seafood; 54%
Fresh Seafood; 38%
Source: FranceAgriMer/GIRA Foodservice (2008)
Consumer attitudes
In general terms, fresh fish has a good image for consumers, despite some perceived negative points such as the presence of bones, the difficulty of preparation and conservation, the smell in cooking and mostly, the price. The positive image of fresh fish has to do with its health attributes (the presence of omega 3). As far as marine aquaculture products are concerned, consumers in France expect the guarantee of the quality of nutritional and organoleptic aspects together with a production method which protects the environment and the welfare of the animals. The acceptability of aquaculture products in France is high as far as the quality of the product is concerned. However, the consumer is increasingly concerned with the environmental and welfare aspects as well. Wholesaler and retailer attitudes
As far as the customers of aquaculture companies are concerned their expectations for the product are mainly focused on species, price and presentation. It is absolutely imperative to be able to supply the necessary volumes, sizes and quality on a standardized and reliable basis.
For large retailers it is the product form and price which are important factors: salmon, as an aquaculture product plays a very important role as it fulfils all of the above requirements as a species: a stable and standardized supply and the ability to be filleted at competitive prices. The real gap in the market is for the category of reasonably prices white fish fillets from marine aquaculture. The greatest growth in demand is for “ready to consume” products, filleted, without bones, in MAP packaging in order to extend the shelf-life of the product. Shelf-life is key for inventory and shelf space management, two of the largest costs, for large retail chains.
The example of the Norwegian salmon industry in penetrating and adapting to the demands of the retailers in France is telling:
large and regular available volumes; large sizes for filleting; feed control for a leaner, better quality fish; and concentration of the offer to allow for direct purchasing, traceability and retailer-based
quality control “Filières” or certifications. Aquaculture products from France and the Mediterranean in general are better suited for the restaurant market. The large range of independent restaurants in terms of quality, specialization and price
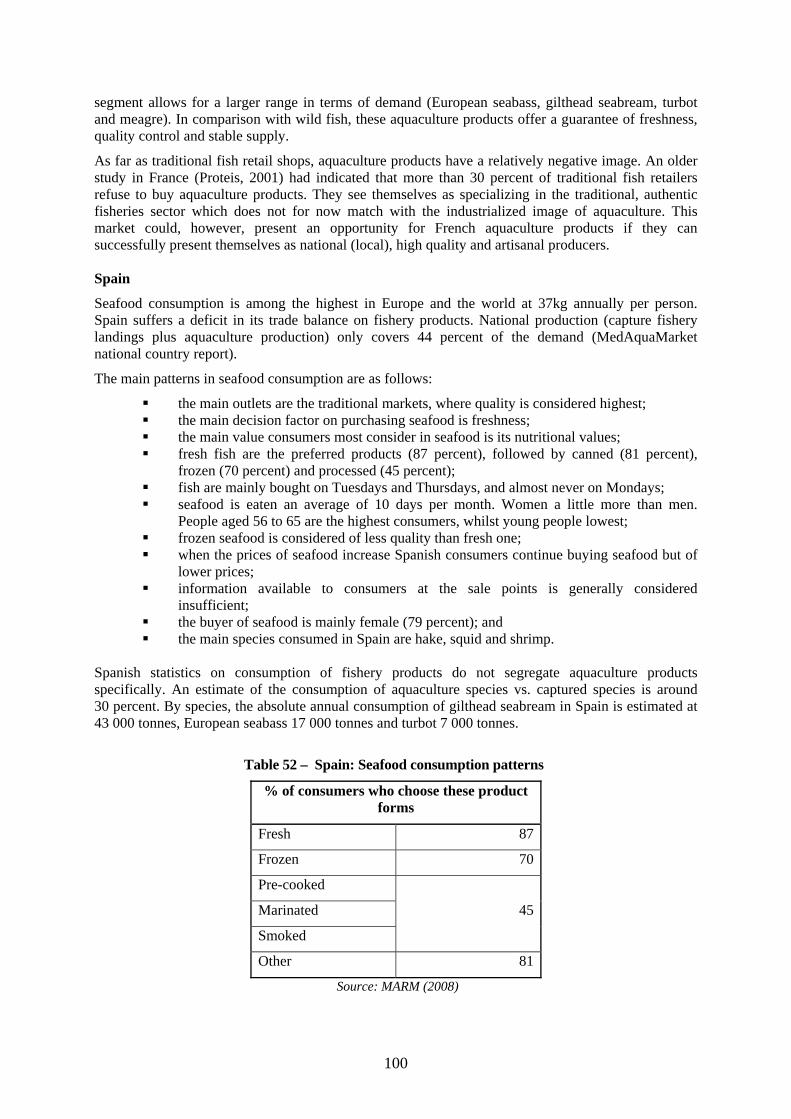
100
segment allows for a larger range in terms of demand (European seabass, gilthead seabream, turbot and meagre). In comparison with wild fish, these aquaculture products offer a guarantee of freshness, quality control and stable supply.
As far as traditional fish retail shops, aquaculture products have a relatively negative image. An older study in France (Proteis, 2001) had indicated that more than 30 percent of traditional fish retailers refuse to buy aquaculture products. They see themselves as specializing in the traditional, authentic fisheries sector which does not for now match with the industrialized image of aquaculture. This market could, however, present an opportunity for French aquaculture products if they can successfully present themselves as national (local), high quality and artisanal producers. Spain
Seafood consumption is among the highest in Europe and the world at 37kg annually per person. Spain suffers a deficit in its trade balance on fishery products. National production (capture fishery landings plus aquaculture production) only covers 44 percent of the demand (MedAquaMarket national country report).
The main patterns in seafood consumption are as follows:
the main outlets are the traditional markets, where quality is considered highest; the main decision factor on purchasing seafood is freshness; the main value consumers most consider in seafood is its nutritional values; fresh fish are the preferred products (87 percent), followed by canned (81 percent),
frozen (70 percent) and processed (45 percent); fish are mainly bought on Tuesdays and Thursdays, and almost never on Mondays; seafood is eaten an average of 10 days per month. Women a little more than men.
People aged 56 to 65 are the highest consumers, whilst young people lowest; frozen seafood is considered of less quality than fresh one; when the prices of seafood increase Spanish consumers continue buying seafood but of
lower prices; information available to consumers at the sale points is generally considered
insufficient; the buyer of seafood is mainly female (79 percent); and the main species consumed in Spain are hake, squid and shrimp.
Spanish statistics on consumption of fishery products do not segregate aquaculture products specifically. An estimate of the consumption of aquaculture species vs. captured species is around 30 percent. By species, the absolute annual consumption of gilthead seabream in Spain is estimated at 43 000 tonnes, European seabass 17 000 tonnes and turbot 7 000 tonnes.
Table 52 – Spain: Seafood consumption patterns
% of consumers who choose these product forms
Fresh 87
Frozen 70
Pre-cooked
Marinated 45
Smoked
Other 81
Source: MARM (2008)
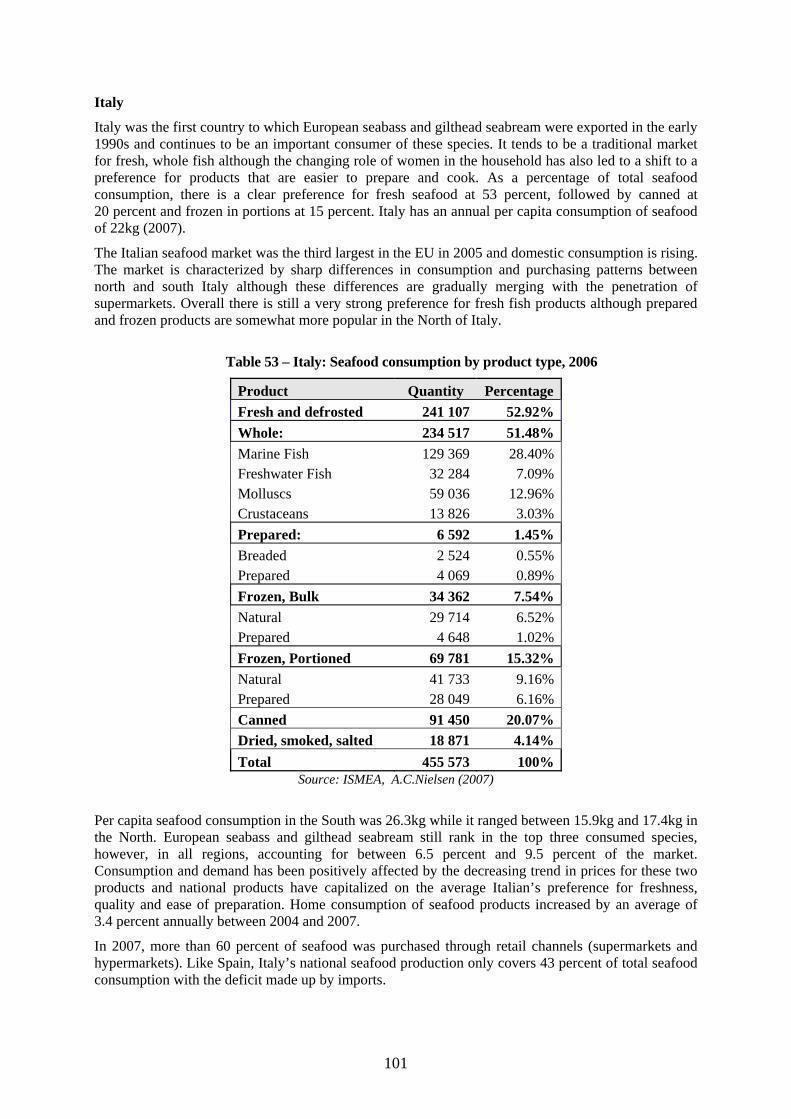
101
Italy
Italy was the first country to which European seabass and gilthead seabream were exported in the early 1990s and continues to be an important consumer of these species. It tends to be a traditional market for fresh, whole fish although the changing role of women in the household has also led to a shift to a preference for products that are easier to prepare and cook. As a percentage of total seafood consumption, there is a clear preference for fresh seafood at 53 percent, followed by canned at 20 percent and frozen in portions at 15 percent. Italy has an annual per capita consumption of seafood of 22kg (2007).
The Italian seafood market was the third largest in the EU in 2005 and domestic consumption is rising. The market is characterized by sharp differences in consumption and purchasing patterns between north and south Italy although these differences are gradually merging with the penetration of supermarkets. Overall there is still a very strong preference for fresh fish products although prepared and frozen products are somewhat more popular in the North of Italy.
Table 53 – Italy: Seafood consumption by product type, 2006
Product Quantity PercentageFresh and defrosted 241 107 52.92%Whole: 234 517 51.48%Marine Fish 129 369 28.40%Freshwater Fish 32 284 7.09%Molluscs 59 036 12.96%Crustaceans 13 826 3.03%Prepared: 6 592 1.45%Breaded 2 524 0.55%Prepared 4 069 0.89%Frozen, Bulk 34 362 7.54%Natural 29 714 6.52%Prepared 4 648 1.02%Frozen, Portioned 69 781 15.32%Natural 41 733 9.16%Prepared 28 049 6.16%Canned 91 450 20.07%Dried, smoked, salted 18 871 4.14%Total 455 573 100%
Source: ISMEA, A.C.Nielsen (2007)
Per capita seafood consumption in the South was 26.3kg while it ranged between 15.9kg and 17.4kg in the North. European seabass and gilthead seabream still rank in the top three consumed species, however, in all regions, accounting for between 6.5 percent and 9.5 percent of the market. Consumption and demand has been positively affected by the decreasing trend in prices for these two products and national products have capitalized on the average Italian’s preference for freshness, quality and ease of preparation. Home consumption of seafood products increased by an average of 3.4 percent annually between 2004 and 2007.
In 2007, more than 60 percent of seafood was purchased through retail channels (supermarkets and hypermarkets). Like Spain, Italy’s national seafood production only covers 43 percent of total seafood consumption with the deficit made up by imports.
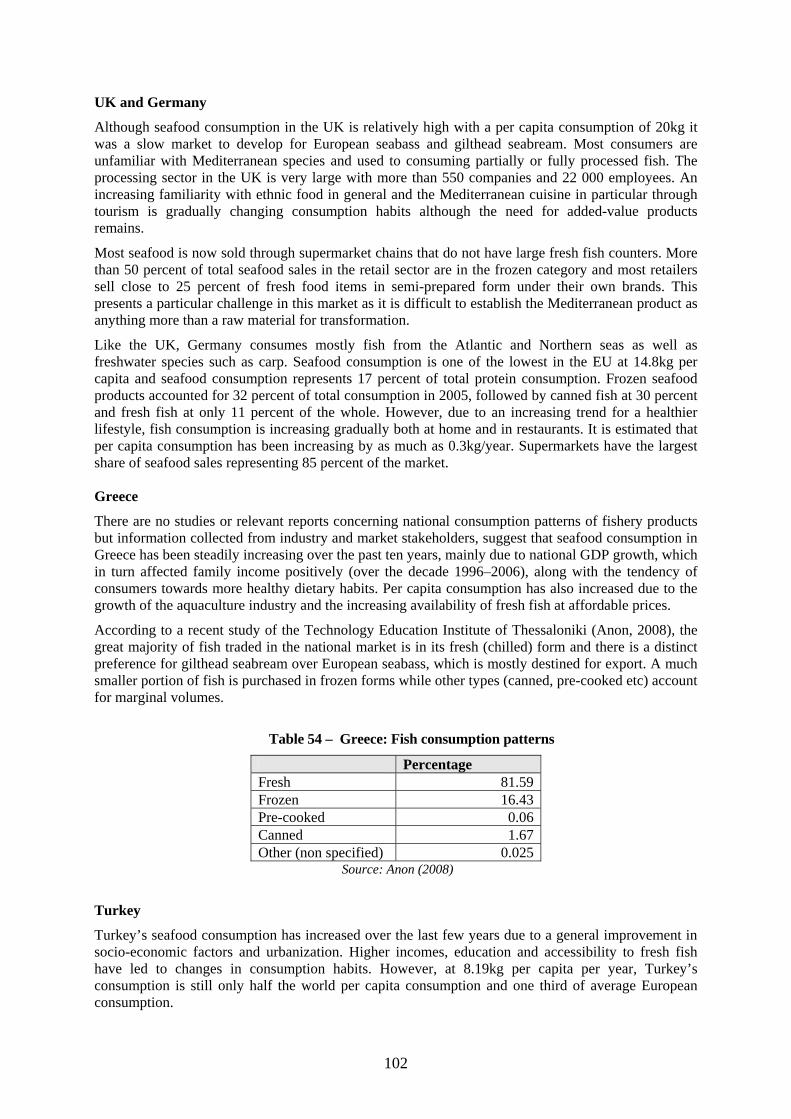
102
UK and Germany
Although seafood consumption in the UK is relatively high with a per capita consumption of 20kg it was a slow market to develop for European seabass and gilthead seabream. Most consumers are unfamiliar with Mediterranean species and used to consuming partially or fully processed fish. The processing sector in the UK is very large with more than 550 companies and 22 000 employees. An increasing familiarity with ethnic food in general and the Mediterranean cuisine in particular through tourism is gradually changing consumption habits although the need for added-value products remains.
Most seafood is now sold through supermarket chains that do not have large fresh fish counters. More than 50 percent of total seafood sales in the retail sector are in the frozen category and most retailers sell close to 25 percent of fresh food items in semi-prepared form under their own brands. This presents a particular challenge in this market as it is difficult to establish the Mediterranean product as anything more than a raw material for transformation.
Like the UK, Germany consumes mostly fish from the Atlantic and Northern seas as well as freshwater species such as carp. Seafood consumption is one of the lowest in the EU at 14.8kg per capita and seafood consumption represents 17 percent of total protein consumption. Frozen seafood products accounted for 32 percent of total consumption in 2005, followed by canned fish at 30 percent and fresh fish at only 11 percent of the whole. However, due to an increasing trend for a healthier lifestyle, fish consumption is increasing gradually both at home and in restaurants. It is estimated that per capita consumption has been increasing by as much as 0.3kg/year. Supermarkets have the largest share of seafood sales representing 85 percent of the market. Greece
There are no studies or relevant reports concerning national consumption patterns of fishery products but information collected from industry and market stakeholders, suggest that seafood consumption in Greece has been steadily increasing over the past ten years, mainly due to national GDP growth, which in turn affected family income positively (over the decade 1996–2006), along with the tendency of consumers towards more healthy dietary habits. Per capita consumption has also increased due to the growth of the aquaculture industry and the increasing availability of fresh fish at affordable prices.
According to a recent study of the Technology Education Institute of Thessaloniki (Anon, 2008), the great majority of fish traded in the national market is in its fresh (chilled) form and there is a distinct preference for gilthead seabream over European seabass, which is mostly destined for export. A much smaller portion of fish is purchased in frozen forms while other types (canned, pre-cooked etc) account for marginal volumes.
Table 54 – Greece: Fish consumption patterns
Percentage Fresh 81.59Frozen 16.43Pre-cooked 0.06Canned 1.67Other (non specified) 0.025
Source: Anon (2008)
Turkey
Turkey’s seafood consumption has increased over the last few years due to a general improvement in socio-economic factors and urbanization. Higher incomes, education and accessibility to fresh fish have led to changes in consumption habits. However, at 8.19kg per capita per year, Turkey’s consumption is still only half the world per capita consumption and one third of average European consumption.
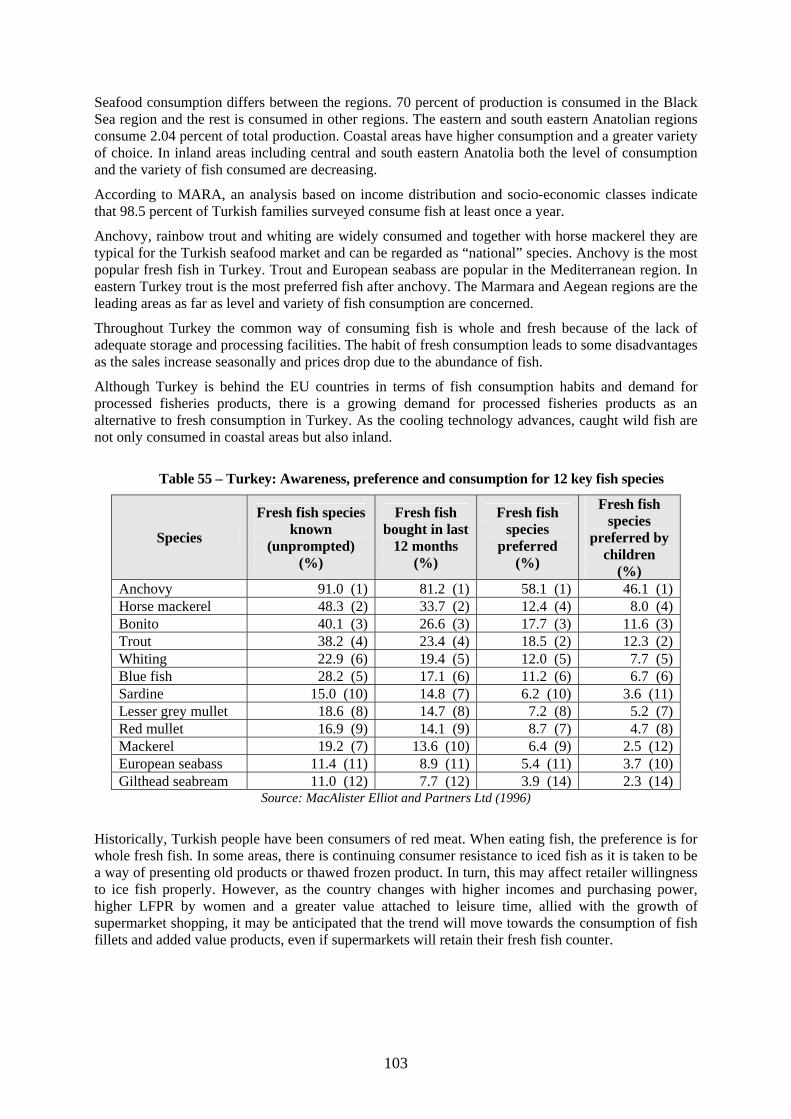
103
Seafood consumption differs between the regions. 70 percent of production is consumed in the Black Sea region and the rest is consumed in other regions. The eastern and south eastern Anatolian regions consume 2.04 percent of total production. Coastal areas have higher consumption and a greater variety of choice. In inland areas including central and south eastern Anatolia both the level of consumption and the variety of fish consumed are decreasing.
According to MARA, an analysis based on income distribution and socio-economic classes indicate that 98.5 percent of Turkish families surveyed consume fish at least once a year.
Anchovy, rainbow trout and whiting are widely consumed and together with horse mackerel they are typical for the Turkish seafood market and can be regarded as “national” species. Anchovy is the most popular fresh fish in Turkey. Trout and European seabass are popular in the Mediterranean region. In eastern Turkey trout is the most preferred fish after anchovy. The Marmara and Aegean regions are the leading areas as far as level and variety of fish consumption are concerned.
Throughout Turkey the common way of consuming fish is whole and fresh because of the lack of adequate storage and processing facilities. The habit of fresh consumption leads to some disadvantages as the sales increase seasonally and prices drop due to the abundance of fish.
Although Turkey is behind the EU countries in terms of fish consumption habits and demand for processed fisheries products, there is a growing demand for processed fisheries products as an alternative to fresh consumption in Turkey. As the cooling technology advances, caught wild fish are not only consumed in coastal areas but also inland.
Table 55 – Turkey: Awareness, preference and consumption for 12 key fish species
Species
Fresh fish species known
(unprompted) (%)
Fresh fish bought in last
12 months (%)
Fresh fish species
preferred (%)
Fresh fish species
preferred by children
(%) Anchovy 91.0 (1) 81.2 (1) 58.1 (1) 46.1 (1)Horse mackerel 48.3 (2) 33.7 (2) 12.4 (4) 8.0 (4)Bonito 40.1 (3) 26.6 (3) 17.7 (3) 11.6 (3)Trout 38.2 (4) 23.4 (4) 18.5 (2) 12.3 (2)Whiting 22.9 (6) 19.4 (5) 12.0 (5) 7.7 (5)Blue fish 28.2 (5) 17.1 (6) 11.2 (6) 6.7 (6)Sardine 15.0 (10) 14.8 (7) 6.2 (10) 3.6 (11)Lesser grey mullet 18.6 (8) 14.7 (8) 7.2 (8) 5.2 (7)Red mullet 16.9 (9) 14.1 (9) 8.7 (7) 4.7 (8)Mackerel 19.2 (7) 13.6 (10) 6.4 (9) 2.5 (12)European seabass 11.4 (11) 8.9 (11) 5.4 (11) 3.7 (10)Gilthead seabream 11.0 (12) 7.7 (12) 3.9 (14) 2.3 (14)
Source: MacAlister Elliot and Partners Ltd (1996)
Historically, Turkish people have been consumers of red meat. When eating fish, the preference is for whole fresh fish. In some areas, there is continuing consumer resistance to iced fish as it is taken to be a way of presenting old products or thawed frozen product. In turn, this may affect retailer willingness to ice fish properly. However, as the country changes with higher incomes and purchasing power, higher LFPR by women and a greater value attached to leisure time, allied with the growth of supermarket shopping, it may be anticipated that the trend will move towards the consumption of fish fillets and added value products, even if supermarkets will retain their fresh fish counter.
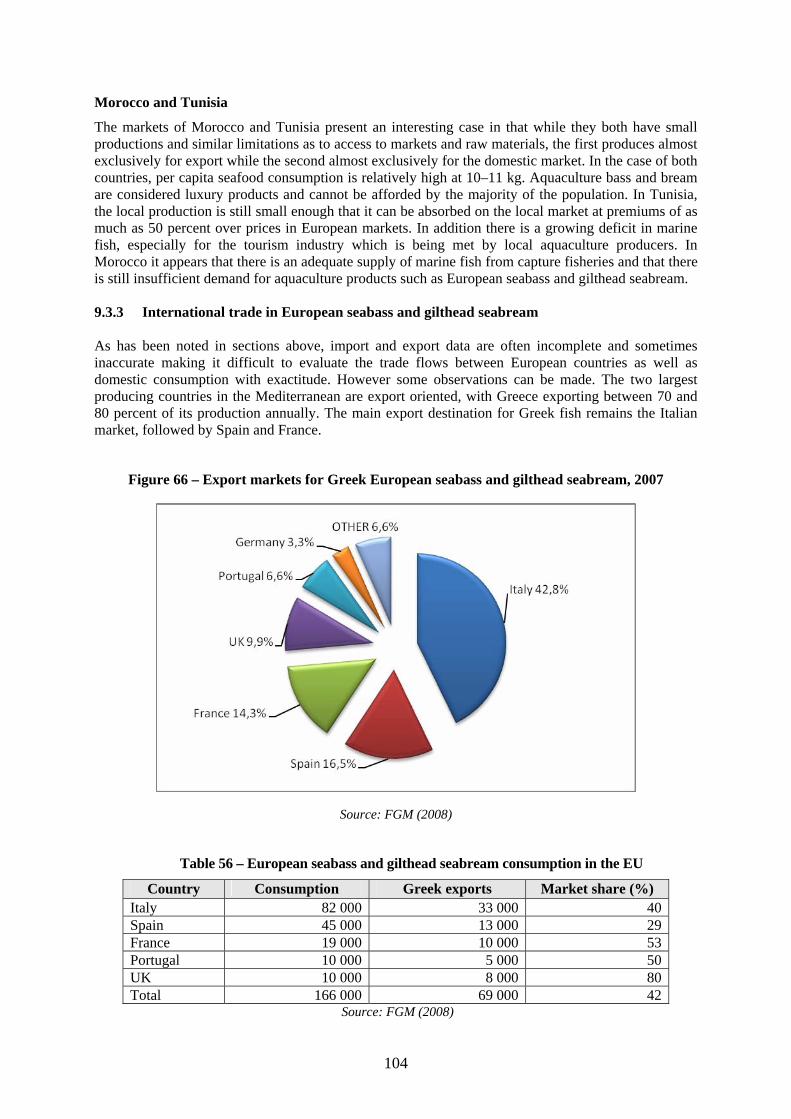
104
Morocco and Tunisia
The markets of Morocco and Tunisia present an interesting case in that while they both have small productions and similar limitations as to access to markets and raw materials, the first produces almost exclusively for export while the second almost exclusively for the domestic market. In the case of both countries, per capita seafood consumption is relatively high at 10–11 kg. Aquaculture bass and bream are considered luxury products and cannot be afforded by the majority of the population. In Tunisia, the local production is still small enough that it can be absorbed on the local market at premiums of as much as 50 percent over prices in European markets. In addition there is a growing deficit in marine fish, especially for the tourism industry which is being met by local aquaculture producers. In Morocco it appears that there is an adequate supply of marine fish from capture fisheries and that there is still insufficient demand for aquaculture products such as European seabass and gilthead seabream. 9.3.3 International trade in European seabass and gilthead seabream As has been noted in sections above, import and export data are often incomplete and sometimes inaccurate making it difficult to evaluate the trade flows between European countries as well as domestic consumption with exactitude. However some observations can be made. The two largest producing countries in the Mediterranean are export oriented, with Greece exporting between 70 and 80 percent of its production annually. The main export destination for Greek fish remains the Italian market, followed by Spain and France.
Figure 66 – Export markets for Greek European seabass and gilthead seabream, 2007
Source: FGM (2008)
Table 56 – European seabass and gilthead seabream consumption in the EU
Country Consumption Greek exports Market share (%) Italy 82 000 33 000 40Spain 45 000 13 000 29France 19 000 10 000 53Portugal 10 000 5 000 50UK 10 000 8 000 80Total 166 000 69 000 42
Source: FGM (2008)
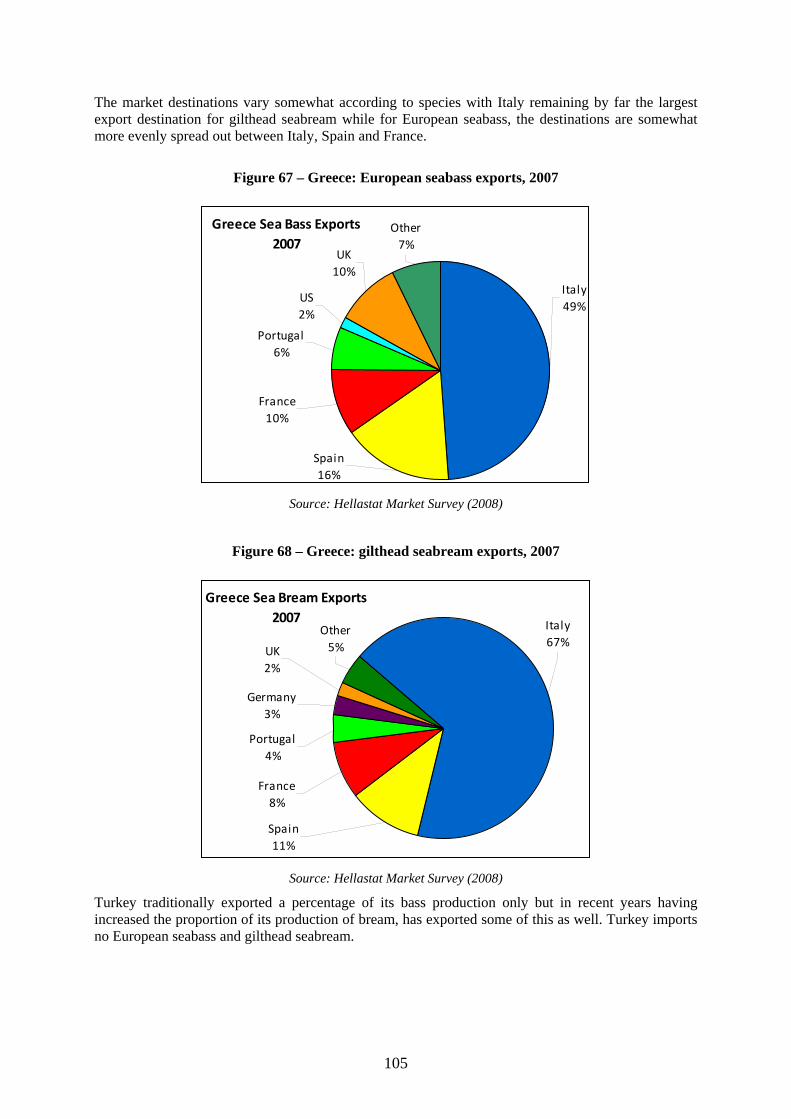
105
The market destinations vary somewhat according to species with Italy remaining by far the largest export destination for gilthead seabream while for European seabass, the destinations are somewhat more evenly spread out between Italy, Spain and France.
Figure 67 – Greece: European seabass exports, 2007
Greece Sea Bass Exports2007
Italy49%
Spain16%
France10%
Portugal6%
US2%
UK10%
Other7%
Source: Hellastat Market Survey (2008)
Figure 68 – Greece: gilthead seabream exports, 2007
Greece Sea Bream Exports2007
Other5%UK
2%
Germany3%
Portugal4%
France8%
Spain11%
Italy67%
Source: Hellastat Market Survey (2008)
Turkey traditionally exported a percentage of its bass production only but in recent years having increased the proportion of its production of bream, has exported some of this as well. Turkey imports no European seabass and gilthead seabream.
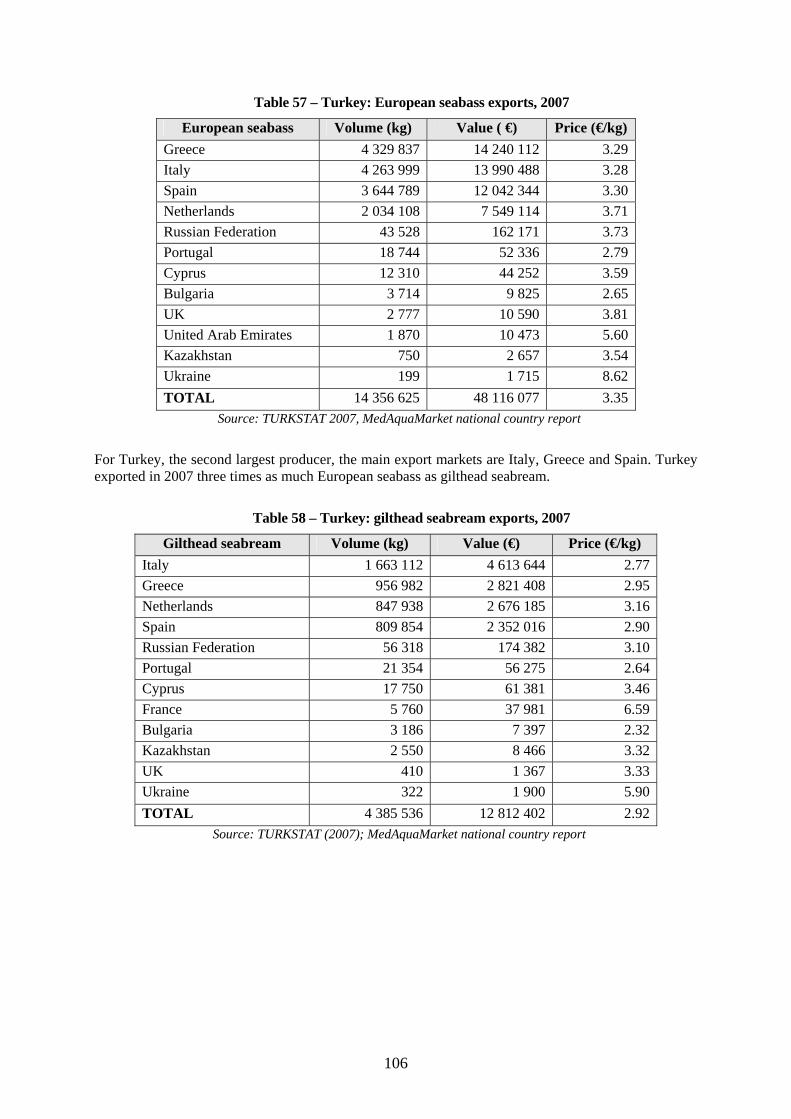
106
Table 57 – Turkey: European seabass exports, 2007
European seabass Volume (kg) Value ( €) Price (€/kg) Greece 4 329 837 14 240 112 3.29 Italy 4 263 999 13 990 488 3.28 Spain 3 644 789 12 042 344 3.30 Netherlands 2 034 108 7 549 114 3.71 Russian Federation 43 528 162 171 3.73 Portugal 18 744 52 336 2.79 Cyprus 12 310 44 252 3.59 Bulgaria 3 714 9 825 2.65 UK 2 777 10 590 3.81 United Arab Emirates 1 870 10 473 5.60 Kazakhstan 750 2 657 3.54 Ukraine 199 1 715 8.62 TOTAL 14 356 625 48 116 077 3.35
Source: TURKSTAT 2007, MedAquaMarket national country report
For Turkey, the second largest producer, the main export markets are Italy, Greece and Spain. Turkey exported in 2007 three times as much European seabass as gilthead seabream.
Table 58 – Turkey: gilthead seabream exports, 2007
Gilthead seabream Volume (kg) Value (€) Price (€/kg) Italy 1 663 112 4 613 644 2.77 Greece 956 982 2 821 408 2.95 Netherlands 847 938 2 676 185 3.16 Spain 809 854 2 352 016 2.90 Russian Federation 56 318 174 382 3.10 Portugal 21 354 56 275 2.64 Cyprus 17 750 61 381 3.46 France 5 760 37 981 6.59 Bulgaria 3 186 7 397 2.32 Kazakhstan 2 550 8 466 3.32 UK 410 1 367 3.33 Ukraine 322 1 900 5.90 TOTAL 4 385 536 12 812 402 2.92
Source: TURKSTAT (2007); MedAquaMarket national country report
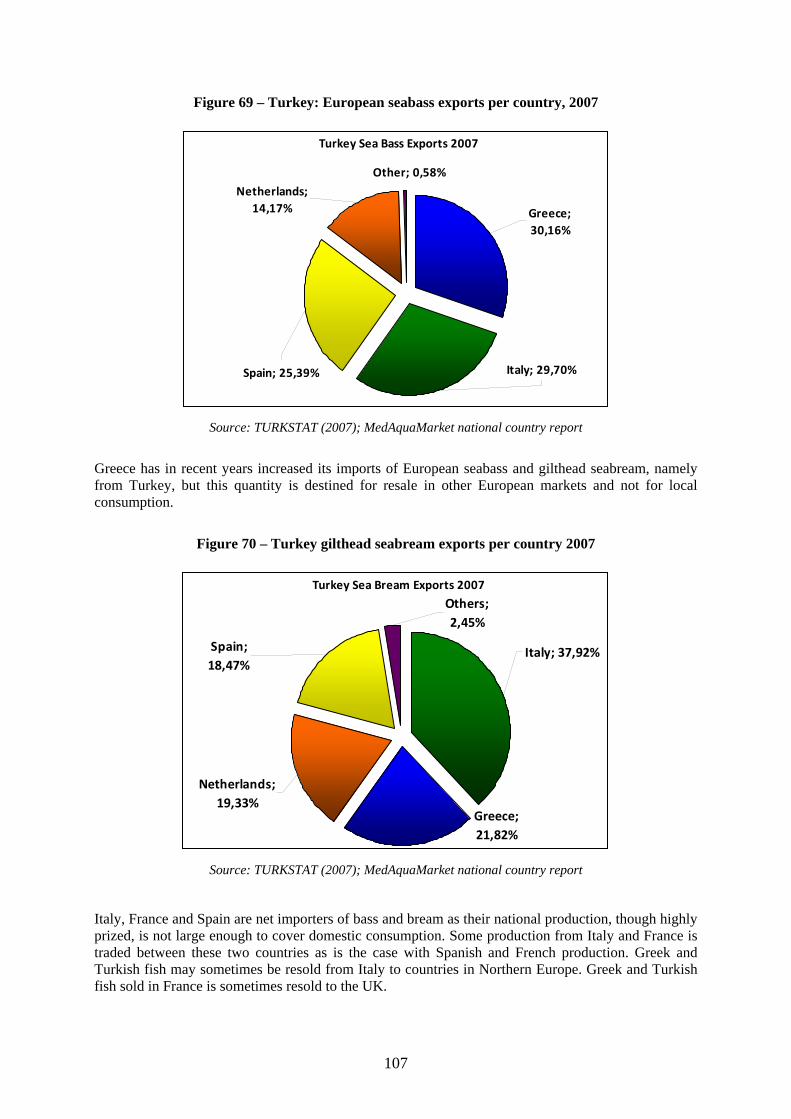
107
Figure 69 – Turkey: European seabass exports per country, 2007
Turkey Sea Bass Exports 2007
Greece; 30,16%
Other; 0,58%
Netherlands; 14,17%
Spain; 25,39% Italy; 29,70%
Source: TURKSTAT (2007); MedAquaMarket national country report
Greece has in recent years increased its imports of European seabass and gilthead seabream, namely from Turkey, but this quantity is destined for resale in other European markets and not for local consumption.
Figure 70 – Turkey gilthead seabream exports per country 2007
Turkey Sea Bream Exports 2007
Italy; 37,92%
Others; 2,45%
Spain; 18,47%
Netherlands; 19,33%
Greece; 21,82%
Source: TURKSTAT (2007); MedAquaMarket national country report
Italy, France and Spain are net importers of bass and bream as their national production, though highly prized, is not large enough to cover domestic consumption. Some production from Italy and France is traded between these two countries as is the case with Spanish and French production. Greek and Turkish fish may sometimes be resold from Italy to countries in Northern Europe. Greek and Turkish fish sold in France is sometimes resold to the UK.
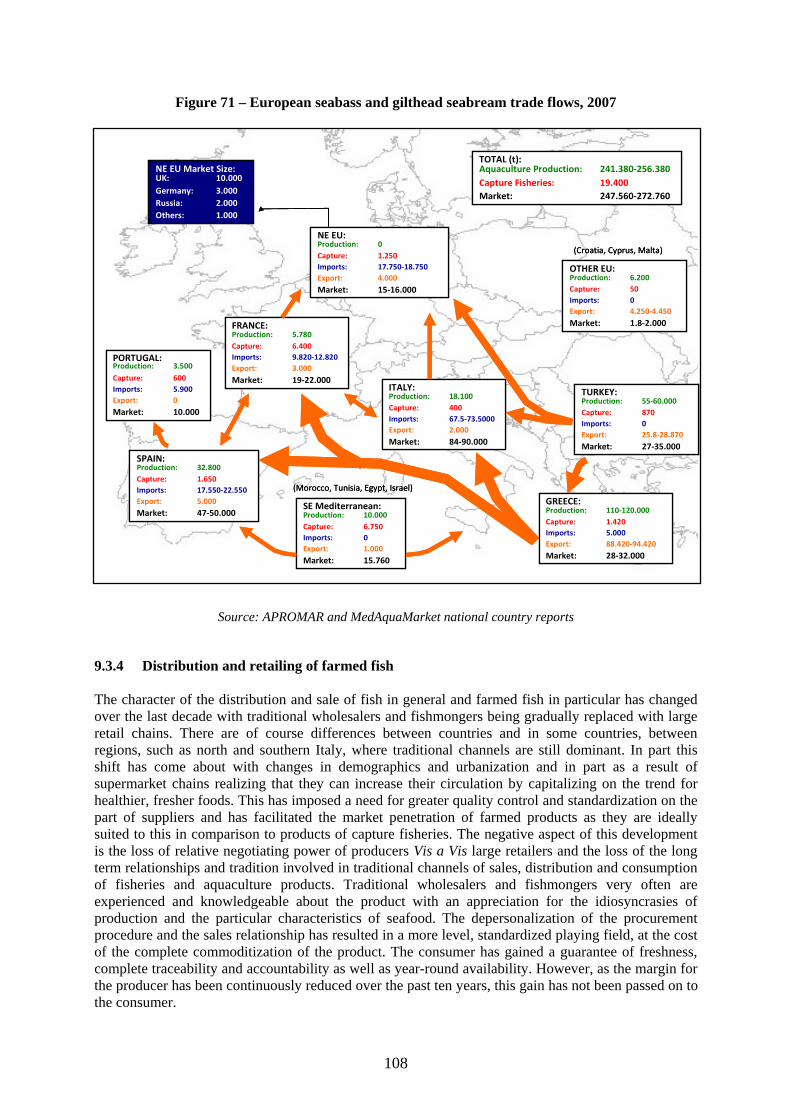
108
Figure 71 – European seabass and gilthead seabream trade flows, 2007
Source: APROMAR and MedAquaMarket national country reports
9.3.4 Distribution and retailing of farmed fish The character of the distribution and sale of fish in general and farmed fish in particular has changed over the last decade with traditional wholesalers and fishmongers being gradually replaced with large retail chains. There are of course differences between countries and in some countries, between regions, such as north and southern Italy, where traditional channels are still dominant. In part this shift has come about with changes in demographics and urbanization and in part as a result of supermarket chains realizing that they can increase their circulation by capitalizing on the trend for healthier, fresher foods. This has imposed a need for greater quality control and standardization on the part of suppliers and has facilitated the market penetration of farmed products as they are ideally suited to this in comparison to products of capture fisheries. The negative aspect of this development is the loss of relative negotiating power of producers Vis a Vis large retailers and the loss of the long term relationships and tradition involved in traditional channels of sales, distribution and consumption of fisheries and aquaculture products. Traditional wholesalers and fishmongers very often are experienced and knowledgeable about the product with an appreciation for the idiosyncrasies of production and the particular characteristics of seafood. The depersonalization of the procurement procedure and the sales relationship has resulted in a more level, standardized playing field, at the cost of the complete commoditization of the product. The consumer has gained a guarantee of freshness, complete traceability and accountability as well as year-round availability. However, as the margin for the producer has been continuously reduced over the past ten years, this gain has not been passed on to the consumer.
OTHER EU:Production: 6.200Capture: 50Imports: 0Export: 4.250‐4.450
Market: 1.8‐2.000
(Morocco, Tunisia, Egypt, Israel)
FRANCE:Production: 5.780Capture: 6.400Imports: 9.820‐12.820Export: 3.000
Market: 19‐22.000
SPAIN:Production: 32.800Capture: 1.650Imports: 17.550‐22.550Export: 5.000
Market: 47‐50.000
PORTUGAL:Production: 3.500
Capture: 600Imports: 5.900Export: 0
Market: 10.000
SE Mediterranean:Production: 10.000Capture: 6.750Imports: 0Export: 1.000
Market: 15.760
(Croatia, Cyprus, Malta)
NE EU:Production: 0Capture: 1.250Imports: 17.750‐18.750Export: 4.000
Market: 15‐16.000
NE EU Market Size:UK: 10.000Germany: 3.000Russia: 2.000Others: 1.000
TOTAL (t):Aquaculture Production: 241.380‐256.380Capture Fisheries: 19.400Market: 247.560‐272.760
ITALY:Production: 18.100Capture: 400Imports: 67.5‐73.5000Export: 2.000
Market: 84‐90.000
GREECE:Production: 110‐120.000Capture: 1.420Imports: 5.000Export: 88.420‐94.420
Market: 28‐32.000
TURKEY:Production: 55‐60.000Capture: 870Imports: 0Export: 25.8‐28.870
Market: 27‐35.000
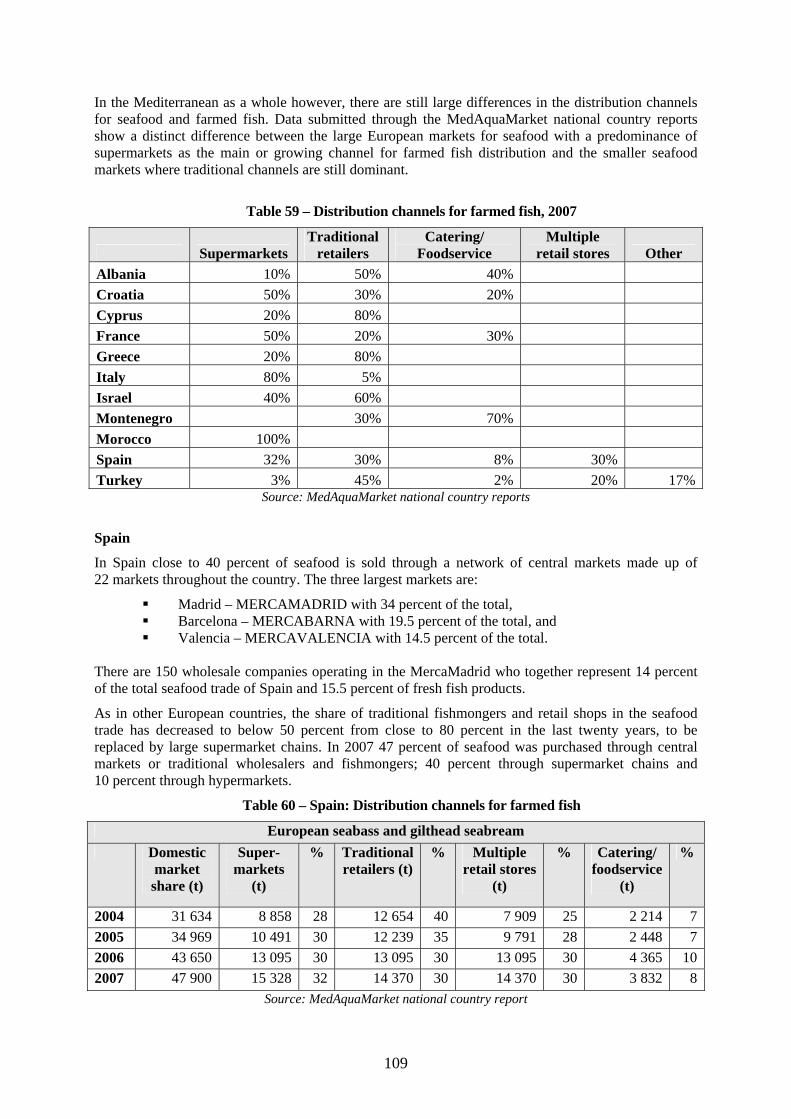
109
In the Mediterranean as a whole however, there are still large differences in the distribution channels for seafood and farmed fish. Data submitted through the MedAquaMarket national country reports show a distinct difference between the large European markets for seafood with a predominance of supermarkets as the main or growing channel for farmed fish distribution and the smaller seafood markets where traditional channels are still dominant.
Table 59 – Distribution channels for farmed fish, 2007
Supermarkets Traditional
retailers Catering/
Foodservice Multiple
retail stores Other Albania 10% 50% 40% Croatia 50% 30% 20% Cyprus 20% 80% France 50% 20% 30% Greece 20% 80% Italy 80% 5% Israel 40% 60% Montenegro 30% 70% Morocco 100% Spain 32% 30% 8% 30% Turkey 3% 45% 2% 20% 17%
Source: MedAquaMarket national country reports
Spain
In Spain close to 40 percent of seafood is sold through a network of central markets made up of 22 markets throughout the country. The three largest markets are:
Madrid – MERCAMADRID with 34 percent of the total, Barcelona – MERCABARNA with 19.5 percent of the total, and Valencia – MERCAVALENCIA with 14.5 percent of the total.
There are 150 wholesale companies operating in the MercaMadrid who together represent 14 percent of the total seafood trade of Spain and 15.5 percent of fresh fish products.
As in other European countries, the share of traditional fishmongers and retail shops in the seafood trade has decreased to below 50 percent from close to 80 percent in the last twenty years, to be replaced by large supermarket chains. In 2007 47 percent of seafood was purchased through central markets or traditional wholesalers and fishmongers; 40 percent through supermarket chains and 10 percent through hypermarkets.
Table 60 – Spain: Distribution channels for farmed fish
European seabass and gilthead seabream Domestic
market share (t)
Super- markets
(t)
% Traditional retailers (t)
% Multiple retail stores
(t)
% Catering/ foodservice
(t)
%
2004 31 634 8 858 28 12 654 40 7 909 25 2 214 72005 34 969 10 491 30 12 239 35 9 791 28 2 448 72006 43 650 13 095 30 13 095 30 13 095 30 4 365 102007 47 900 15 328 32 14 370 30 14 370 30 3 832 8
Source: MedAquaMarket national country report
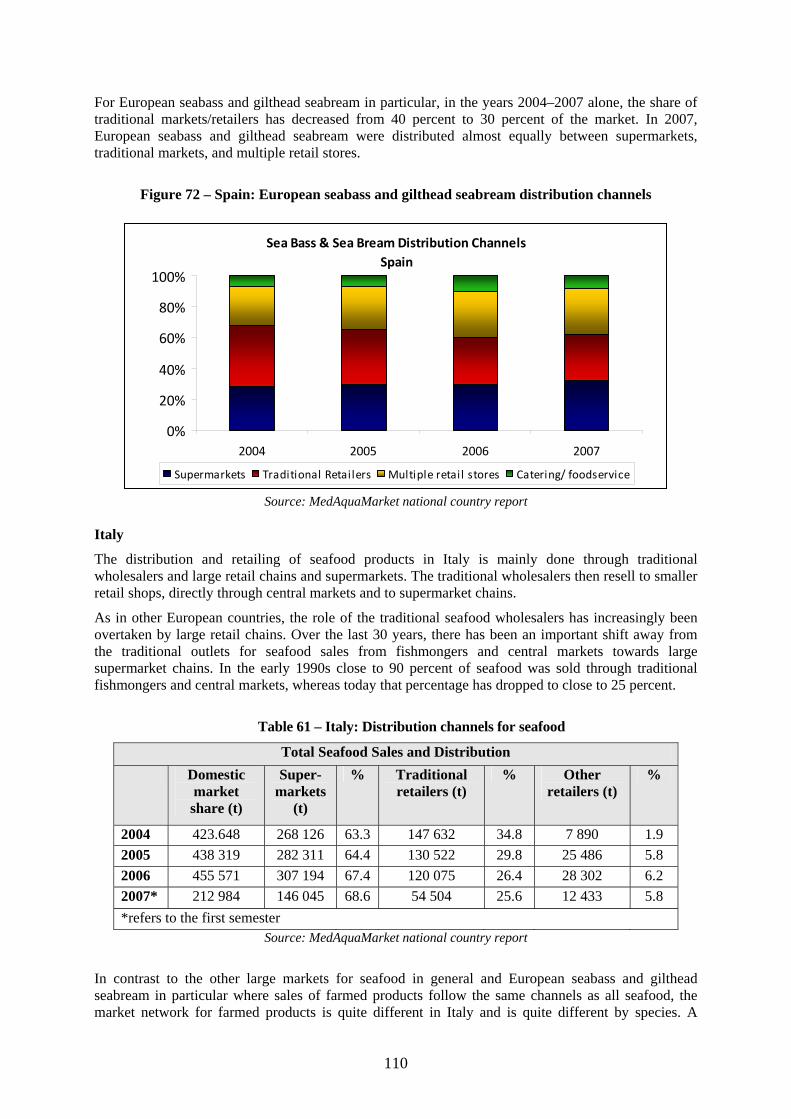
110
For European seabass and gilthead seabream in particular, in the years 2004–2007 alone, the share of traditional markets/retailers has decreased from 40 percent to 30 percent of the market. In 2007, European seabass and gilthead seabream were distributed almost equally between supermarkets, traditional markets, and multiple retail stores.
Figure 72 – Spain: European seabass and gilthead seabream distribution channels
Sea Bass & Sea Bream Distribution ChannelsSpain
0%
20%
40%
60%
80%
100%
2004 2005 2006 2007
Supermarkets Traditional Retailers Multiple retail stores Catering/ foodservice
Source: MedAquaMarket national country report Italy
The distribution and retailing of seafood products in Italy is mainly done through traditional wholesalers and large retail chains and supermarkets. The traditional wholesalers then resell to smaller retail shops, directly through central markets and to supermarket chains.
As in other European countries, the role of the traditional seafood wholesalers has increasingly been overtaken by large retail chains. Over the last 30 years, there has been an important shift away from the traditional outlets for seafood sales from fishmongers and central markets towards large supermarket chains. In the early 1990s close to 90 percent of seafood was sold through traditional fishmongers and central markets, whereas today that percentage has dropped to close to 25 percent.
Table 61 – Italy: Distribution channels for seafood
Total Seafood Sales and Distribution Domestic
market share (t)
Super- markets
(t)
% Traditional retailers (t)
% Other retailers (t)
%
2004 423.648 268 126 63.3 147 632 34.8 7 890 1.9 2005 438 319 282 311 64.4 130 522 29.8 25 486 5.8 2006 455 571 307 194 67.4 120 075 26.4 28 302 6.2 2007* 212 984 146 045 68.6 54 504 25.6 12 433 5.8 *refers to the first semester
Source: MedAquaMarket national country report
In contrast to the other large markets for seafood in general and European seabass and gilthead seabream in particular where sales of farmed products follow the same channels as all seafood, the market network for farmed products is quite different in Italy and is quite different by species. A
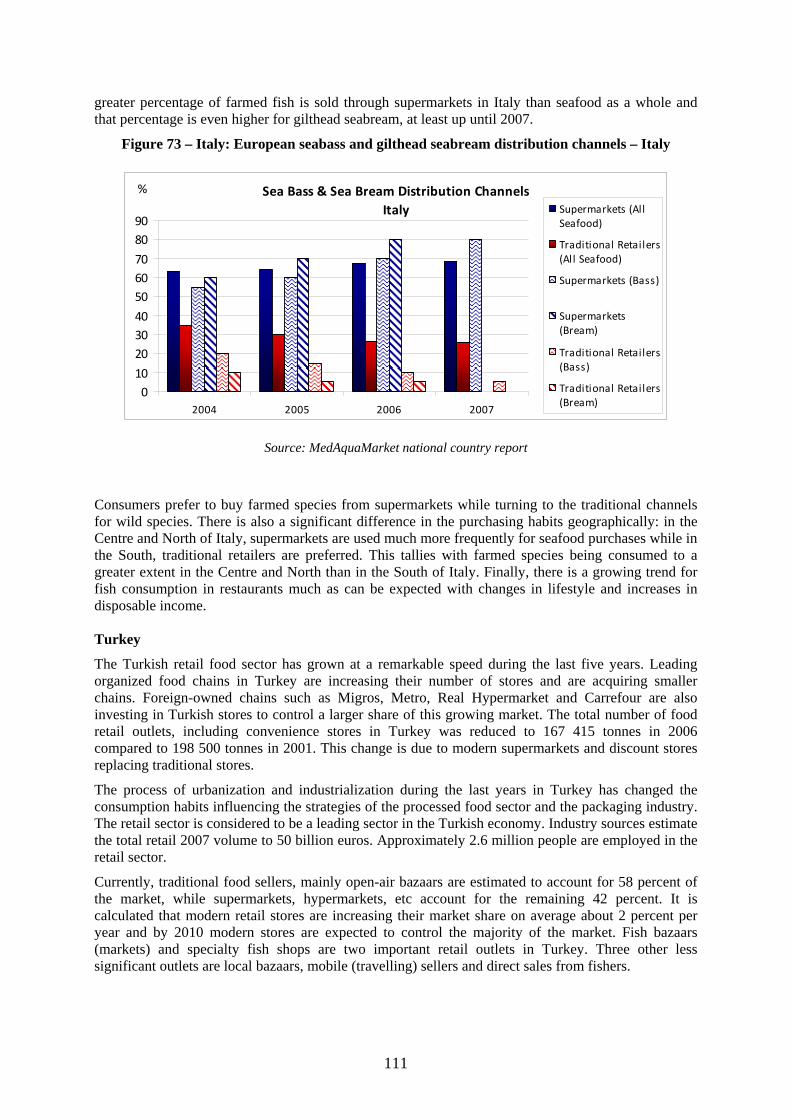
111
greater percentage of farmed fish is sold through supermarkets in Italy than seafood as a whole and that percentage is even higher for gilthead seabream, at least up until 2007.
Figure 73 – Italy: European seabass and gilthead seabream distribution channels – Italy
Sea Bass & Sea Bream Distribution ChannelsItaly
010
203040
506070
8090
2004 2005 2006 2007
Supermarkets (AllSeafood)
Traditional Retailers(All Seafood)
Supermarkets (Bass)
Supermarkets(Bream)
Traditional Retailers(Bass)
Traditional Retailers(Bream)
%
Source: MedAquaMarket national country report
Consumers prefer to buy farmed species from supermarkets while turning to the traditional channels for wild species. There is also a significant difference in the purchasing habits geographically: in the Centre and North of Italy, supermarkets are used much more frequently for seafood purchases while in the South, traditional retailers are preferred. This tallies with farmed species being consumed to a greater extent in the Centre and North than in the South of Italy. Finally, there is a growing trend for fish consumption in restaurants much as can be expected with changes in lifestyle and increases in disposable income. Turkey
The Turkish retail food sector has grown at a remarkable speed during the last five years. Leading organized food chains in Turkey are increasing their number of stores and are acquiring smaller chains. Foreign-owned chains such as Migros, Metro, Real Hypermarket and Carrefour are also investing in Turkish stores to control a larger share of this growing market. The total number of food retail outlets, including convenience stores in Turkey was reduced to 167 415 tonnes in 2006 compared to 198 500 tonnes in 2001. This change is due to modern supermarkets and discount stores replacing traditional stores.
The process of urbanization and industrialization during the last years in Turkey has changed the consumption habits influencing the strategies of the processed food sector and the packaging industry. The retail sector is considered to be a leading sector in the Turkish economy. Industry sources estimate the total retail 2007 volume to 50 billion euros. Approximately 2.6 million people are employed in the retail sector.
Currently, traditional food sellers, mainly open-air bazaars are estimated to account for 58 percent of the market, while supermarkets, hypermarkets, etc account for the remaining 42 percent. It is calculated that modern retail stores are increasing their market share on average about 2 percent per year and by 2010 modern stores are expected to control the majority of the market. Fish bazaars (markets) and specialty fish shops are two important retail outlets in Turkey. Three other less significant outlets are local bazaars, mobile (travelling) sellers and direct sales from fishers.
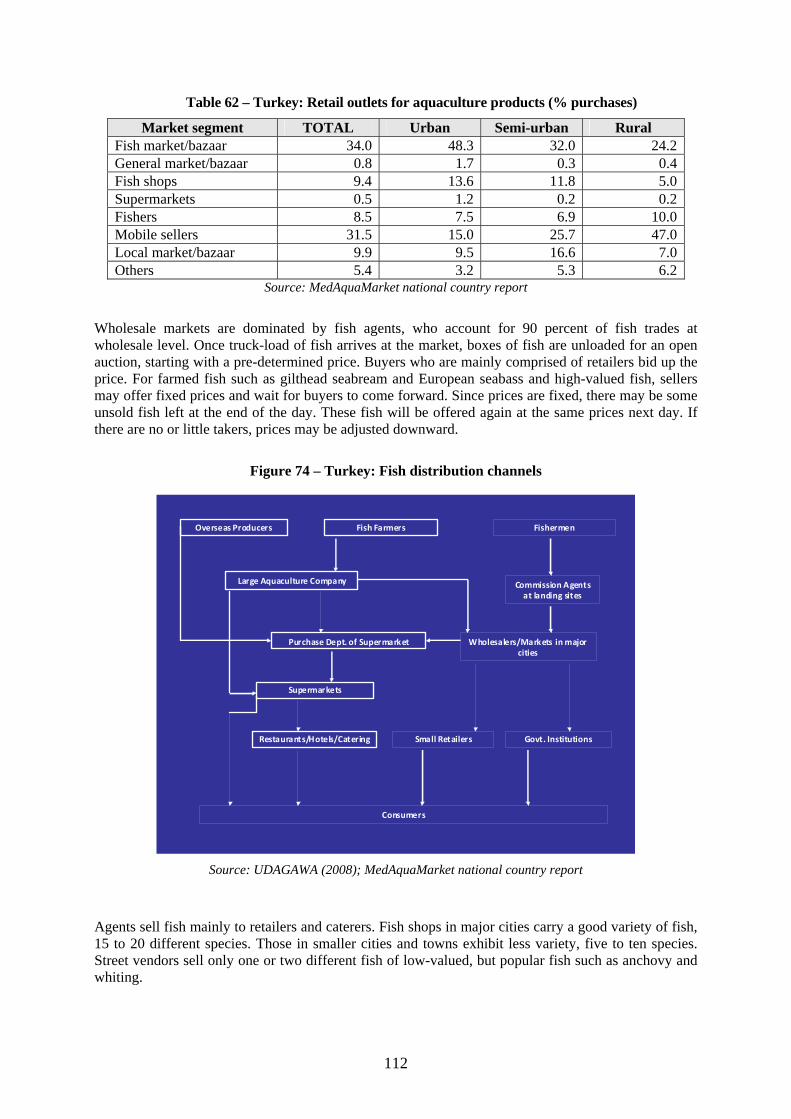
112
Table 62 – Turkey: Retail outlets for aquaculture products (% purchases)
Market segment TOTAL Urban Semi-urban Rural Fish market/bazaar 34.0 48.3 32.0 24.2General market/bazaar 0.8 1.7 0.3 0.4Fish shops 9.4 13.6 11.8 5.0Supermarkets 0.5 1.2 0.2 0.2Fishers 8.5 7.5 6.9 10.0Mobile sellers 31.5 15.0 25.7 47.0Local market/bazaar 9.9 9.5 16.6 7.0Others 5.4 3.2 5.3 6.2
Source: MedAquaMarket national country report
Wholesale markets are dominated by fish agents, who account for 90 percent of fish trades at wholesale level. Once truck-load of fish arrives at the market, boxes of fish are unloaded for an open auction, starting with a pre-determined price. Buyers who are mainly comprised of retailers bid up the price. For farmed fish such as gilthead seabream and European seabass and high-valued fish, sellers may offer fixed prices and wait for buyers to come forward. Since prices are fixed, there may be some unsold fish left at the end of the day. These fish will be offered again at the same prices next day. If there are no or little takers, prices may be adjusted downward.
Figure 74 – Turkey: Fish distribution channels
Overseas Producers
Large Aquaculture Company
Fish Farmers Fishermen
Commission Agents at landing sites
Purchase Dept. of Supermarket Wholesalers/Markets in major cities
Govt. InstitutionsRestaurants/Hotels/Catering
Consumers
Supermarkets
Small Retailers
Source: UDAGAWA (2008); MedAquaMarket national country report
Agents sell fish mainly to retailers and caterers. Fish shops in major cities carry a good variety of fish, 15 to 20 different species. Those in smaller cities and towns exhibit less variety, five to ten species. Street vendors sell only one or two different fish of low-valued, but popular fish such as anchovy and whiting.
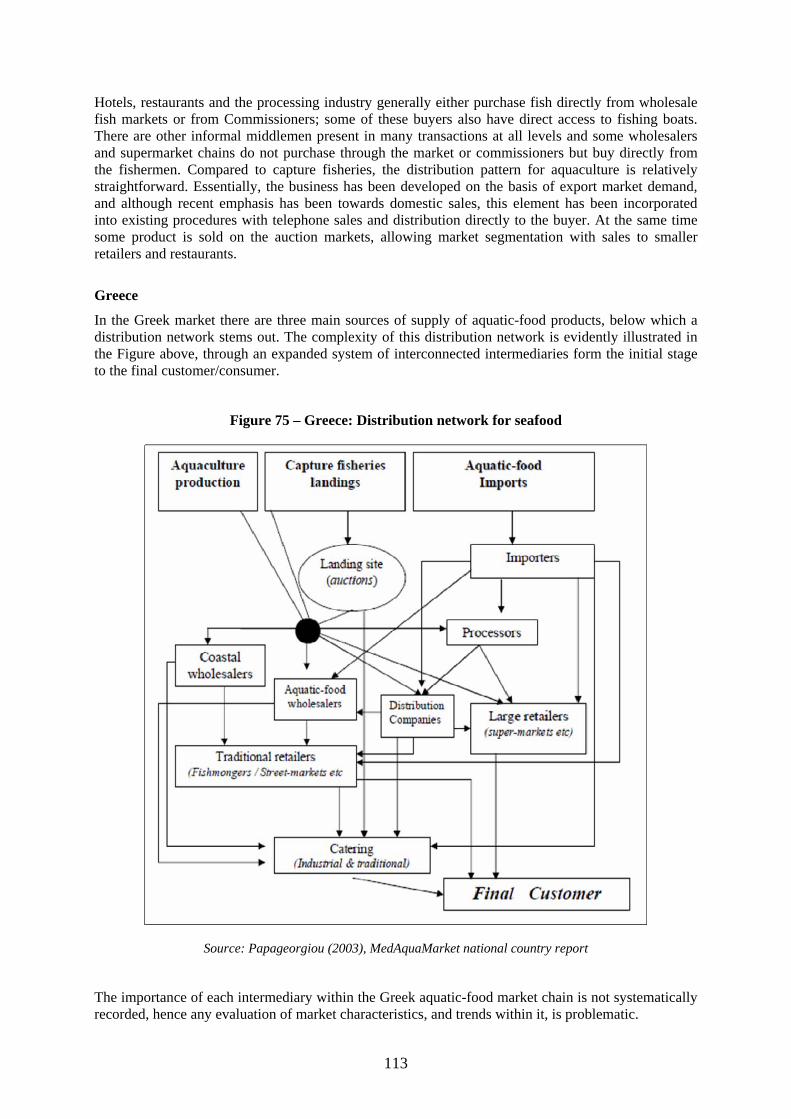
113
Hotels, restaurants and the processing industry generally either purchase fish directly from wholesale fish markets or from Commissioners; some of these buyers also have direct access to fishing boats. There are other informal middlemen present in many transactions at all levels and some wholesalers and supermarket chains do not purchase through the market or commissioners but buy directly from the fishermen. Compared to capture fisheries, the distribution pattern for aquaculture is relatively straightforward. Essentially, the business has been developed on the basis of export market demand, and although recent emphasis has been towards domestic sales, this element has been incorporated into existing procedures with telephone sales and distribution directly to the buyer. At the same time some product is sold on the auction markets, allowing market segmentation with sales to smaller retailers and restaurants.
Greece
In the Greek market there are three main sources of supply of aquatic-food products, below which a distribution network stems out. The complexity of this distribution network is evidently illustrated in the Figure above, through an expanded system of interconnected intermediaries form the initial stage to the final customer/consumer.
Figure 75 – Greece: Distribution network for seafood
Source: Papageorgiou (2003), MedAquaMarket national country report
The importance of each intermediary within the Greek aquatic-food market chain is not systematically recorded, hence any evaluation of market characteristics, and trends within it, is problematic.
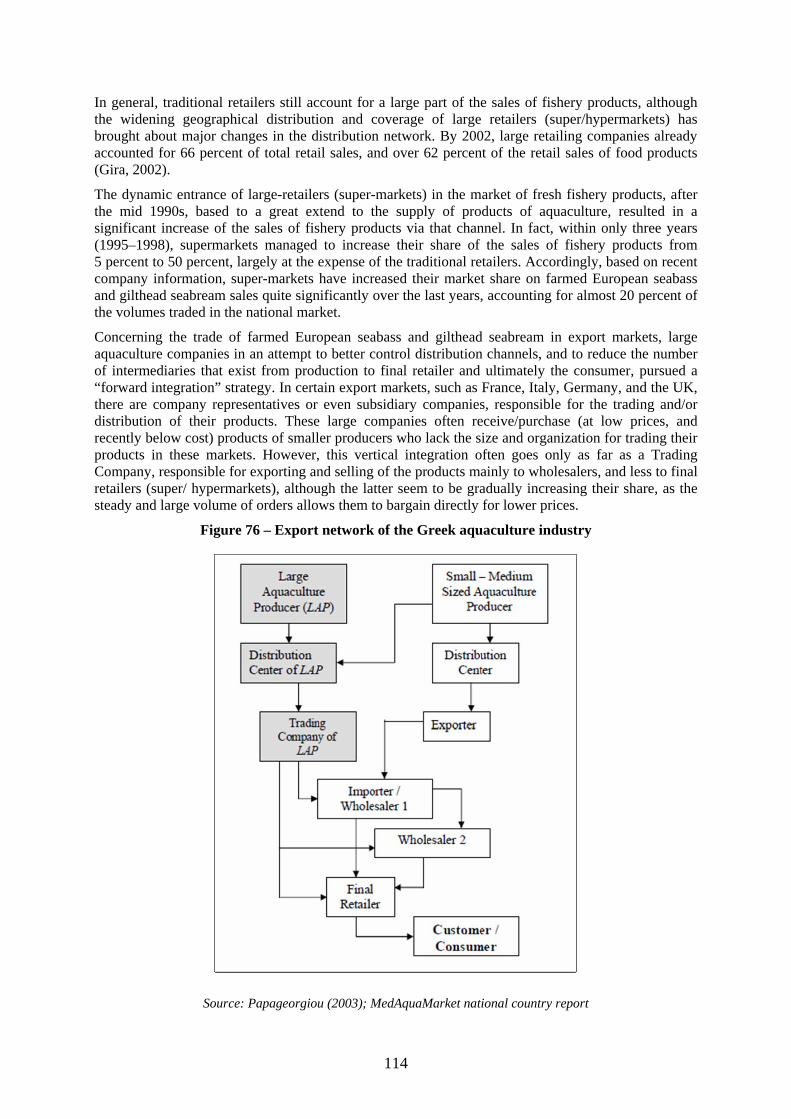
114
In general, traditional retailers still account for a large part of the sales of fishery products, although the widening geographical distribution and coverage of large retailers (super/hypermarkets) has brought about major changes in the distribution network. By 2002, large retailing companies already accounted for 66 percent of total retail sales, and over 62 percent of the retail sales of food products (Gira, 2002).
The dynamic entrance of large-retailers (super-markets) in the market of fresh fishery products, after the mid 1990s, based to a great extend to the supply of products of aquaculture, resulted in a significant increase of the sales of fishery products via that channel. In fact, within only three years (1995–1998), supermarkets managed to increase their share of the sales of fishery products from 5 percent to 50 percent, largely at the expense of the traditional retailers. Accordingly, based on recent company information, super-markets have increased their market share on farmed European seabass and gilthead seabream sales quite significantly over the last years, accounting for almost 20 percent of the volumes traded in the national market.
Concerning the trade of farmed European seabass and gilthead seabream in export markets, large aquaculture companies in an attempt to better control distribution channels, and to reduce the number of intermediaries that exist from production to final retailer and ultimately the consumer, pursued a “forward integration” strategy. In certain export markets, such as France, Italy, Germany, and the UK, there are company representatives or even subsidiary companies, responsible for the trading and/or distribution of their products. These large companies often receive/purchase (at low prices, and recently below cost) products of smaller producers who lack the size and organization for trading their products in these markets. However, this vertical integration often goes only as far as a Trading Company, responsible for exporting and selling of the products mainly to wholesalers, and less to final retailers (super/ hypermarkets), although the latter seem to be gradually increasing their share, as the steady and large volume of orders allows them to bargain directly for lower prices.
Figure 76 – Export network of the Greek aquaculture industry
Source: Papageorgiou (2003); MedAquaMarket national country report
115
Egypt
Although farmed fish are generally perceived to be lower in quality than wild fish in Egypt, there is no way to differentiate them as there are no labelling requirements yet as to the origin and method of production (farmed or wild) for retailers.
The distribution and sale of fish, wild or farmed, occurs in Egypt in much the same way as in other countries of the Mediterranean: the great majority is distributed through a few, large wholesalers who determine the price according to supply and demand. Some wholesalers may have more long term relationships with some farms, financing their production and buying the entire harvest directly at a pre-agreed price. The fish can then be sold directly to consumers in wholesale markets or to retailers. Larger, more organized farms also sell their product directly to retailers as is increasingly the case in northern Mediterranean countries. Almost all of Egypt’s aquaculture production is consumed domestically. 9.3.5 Current product forms in each sector The situation in the industry remains much the same as described in the 2004 “Study of the market for aquaculture produced European seabass and gilthead seabream species” by the University of Stirling. The great majority of the product is still sold whole, fresh on ice with little attempt at differentiation or added-value. There have been successful efforts at establishing more uniform quality standards and with a few exceptions, the quality standards of farmed fish, including the product itself, packaging and grading have become more standardized. Although there is a growing demand for fillets, frozen and fresh, it is estimated that no more than 1–2 percent of production is sold in this manner by the producers. Farther along the distribution chain, the product has often been transformed by other actors, wholesalers and retailers, for further packaging or sale to the HORECA sector. Because of the relatively low fillet yield and the relatively high raw material price, filleting is not a profitable activity for the producers unless they can capture an added-value premium from attractive or innovative packaging, presentation or marketing. Today, this premium is captured by the retailers, large or small, who have access to the final consumer and necessary experience. Unfortunately for the industry, most retail chains are moving away from independent brands towards their own brand. Because of the very high value of shelf space in a supermarket, retailers are reluctant to give it up to a new brand without extensive marketing support which is often prohibitively expensive for even the largest aquaculture companies. In addition, most large retailers want to invest in and reinforce their own brand, in order to build customer loyalty, capture the branded added-value and retain negotiating dominance over suppliers.
Two additional factors have limited the ability of producers to successfully enter the value-added market: transformation has been used by the first large entrants into the market, not as a way to add value to the product or penetrate new markets but simply as another way to sell overproduction. Most filleted bass and bream sold today is sold at cost or even at a loss as a justification for amortizing the investment cost of processing. The filleted product is sold in bulk, in plastic bags of 10–20 fillets packaged in cardboard boxes of 3kg weight with absolutely no brand, label or other differentiating characteristics. It is in fact a commodity. The second limiting factor to the growth of this sector is the tremendous growth of imported pangasius fillets from Vietnam in the past five years. The pangasius fillet is attractive, white, and very inexpensive, thus setting the standard against which a product without any marketing or information must compete (Appendix 1).
Most European seabass and gilthead seabream produced today is marketed and sold as a commodity product but it is produced as a high-end, high value product. Except for the case of Spain, France and Italy where the product is successfully marketed and perceived by the domestic market as a traditional but high value and high quality product, the great majority of production, which is from Greece and Turkey, is sold as a commodity. These producing countries must revise their strategy, either by becoming cost competitive with other commodity products and expanding into processing and other product forms in bulk or by understanding the “niche” nature of the product as it is produced today. From a cost competitiveness perspective, the ex-farm cost per kilogram of production would need to
116
be reduced by more than 50 percent for the raw material cost to be competitive with other seafood commodities. Certainly adding-value is not limited to transformation. It can include the physical properties of the fish, colour, taste, fat content as well as packaging, labelling, the addition of flavourings (spices, simple sauces and condiments) and recipes. Even, the simple addition of cooking instructions or information on nutritional characteristics would be a significant innovation. 9.3.6 Costs and margins in the distribution chain There are large differences in the apparent margins of wholesalers and retailers, both nationally as well as between retailers in the same country. On average, the mark-up between the producer’s CIF price and the retail price (for wholesalers or supermarkets) is around 40–50 percent. The margin can be as high as 200 percent in small retailers and fishmongers or much higher if the farmed fish is sold as wild. The CIF price is mentioned because the inventory and distribution costs of the retailers are most often passed on to the producers today. The producer may deliver to a few central distribution platforms but they are charged with the retailer’s cost of further distribution to individual stores. The additional cost can vary between 2–14 percent of the price and is defined as distribution costs, promotion costs and sometimes simply the premium the producer must pay for the privilege of being a supplier. In addition to seasonal promotions, many large retail chains have recently adopted a policy of using aquaculture produced gilthead seabream as a “loss-leader”. By advertising and selling bream at prices as low as €1.99/kg, the retailer can increase overall store sales by as much as 30 percent. In these cases, the retailer is actually selling the product below cost, temporarily, in order to boost circulation overall. This practice is for obvious reasons catastrophic for the image of the product as it can increasingly be set in the consumer’s mind as a cheap and therefore perhaps inferior product. 9.3.7 Interaction between farmed and wild caught European seabass and gilthead seabream The capture fisheries production of European seabass and gilthead seabream remains a very small percentage of total European seabass and gilthead seabream sold in most European markets. In 2007, wild bass and bream made up only 6 percent of total production. In general wild species are viewed as superior to farmed species, more “natural” and of higher quality. In practice, however, the only real method of differentiation tends to be in sizes. Most portion-sized (300–500 grammes) bass and bream are farmed even though they can sometimes be sold as wild. The larger (800 grammes and above) sizes in farmed production are a very small percentage of total, no more than 5 percent, and do compete with wild caught fish. There is certainly a preference for wild fish especially line-caught European seabass which is reflected in a price premium which can be as high as 50 percent for the same size category.
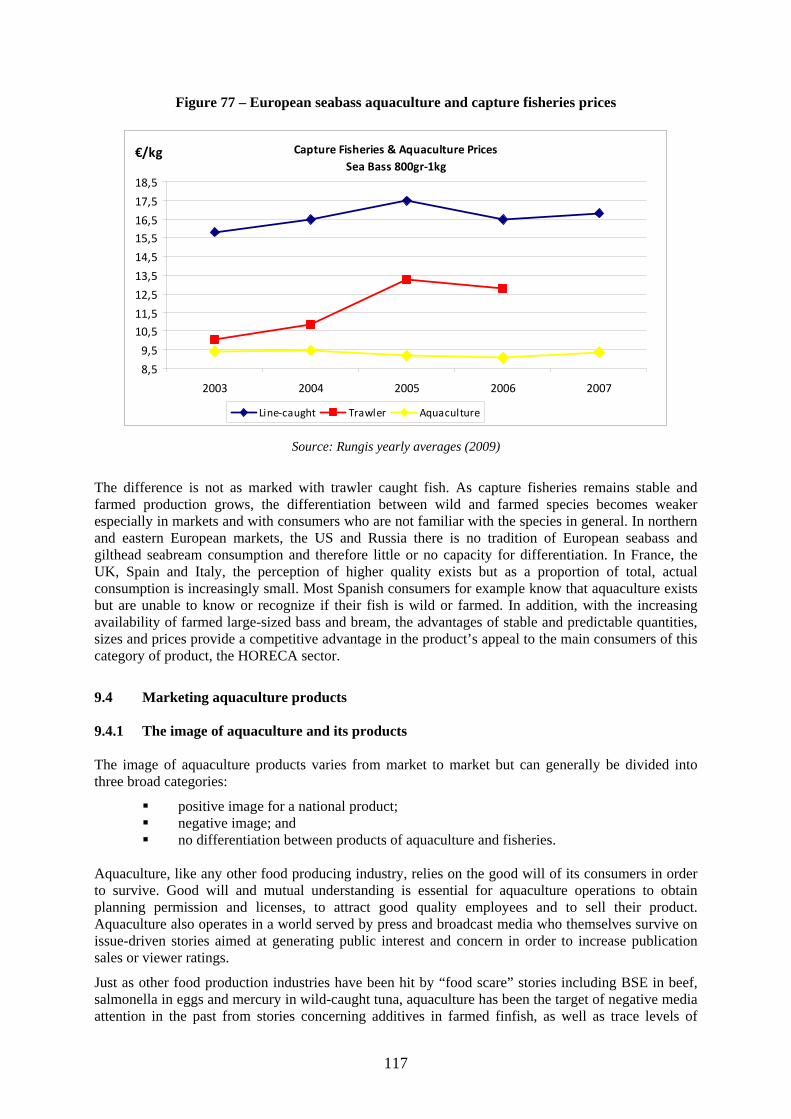
117
Figure 77 – European seabass aquaculture and capture fisheries prices
Capture Fisheries & Aquaculture PricesSea Bass 800gr‐1kg
8,5
9,5
10,511,5
12,5
13,5
14,5
15,516,5
17,5
18,5
2003 2004 2005 2006 2007
€/kg
Line‐caught Trawler Aquaculture
Source: Rungis yearly averages (2009)
The difference is not as marked with trawler caught fish. As capture fisheries remains stable and farmed production grows, the differentiation between wild and farmed species becomes weaker especially in markets and with consumers who are not familiar with the species in general. In northern and eastern European markets, the US and Russia there is no tradition of European seabass and gilthead seabream consumption and therefore little or no capacity for differentiation. In France, the UK, Spain and Italy, the perception of higher quality exists but as a proportion of total, actual consumption is increasingly small. Most Spanish consumers for example know that aquaculture exists but are unable to know or recognize if their fish is wild or farmed. In addition, with the increasing availability of farmed large-sized bass and bream, the advantages of stable and predictable quantities, sizes and prices provide a competitive advantage in the product’s appeal to the main consumers of this category of product, the HORECA sector.
9.4 Marketing aquaculture products 9.4.1 The image of aquaculture and its products The image of aquaculture products varies from market to market but can generally be divided into three broad categories:
positive image for a national product; negative image; and no differentiation between products of aquaculture and fisheries.
Aquaculture, like any other food producing industry, relies on the good will of its consumers in order to survive. Good will and mutual understanding is essential for aquaculture operations to obtain planning permission and licenses, to attract good quality employees and to sell their product. Aquaculture also operates in a world served by press and broadcast media who themselves survive on issue-driven stories aimed at generating public interest and concern in order to increase publication sales or viewer ratings.
Just as other food production industries have been hit by “food scare” stories including BSE in beef, salmonella in eggs and mercury in wild-caught tuna, aquaculture has been the target of negative media attention in the past from stories concerning additives in farmed finfish, as well as trace levels of
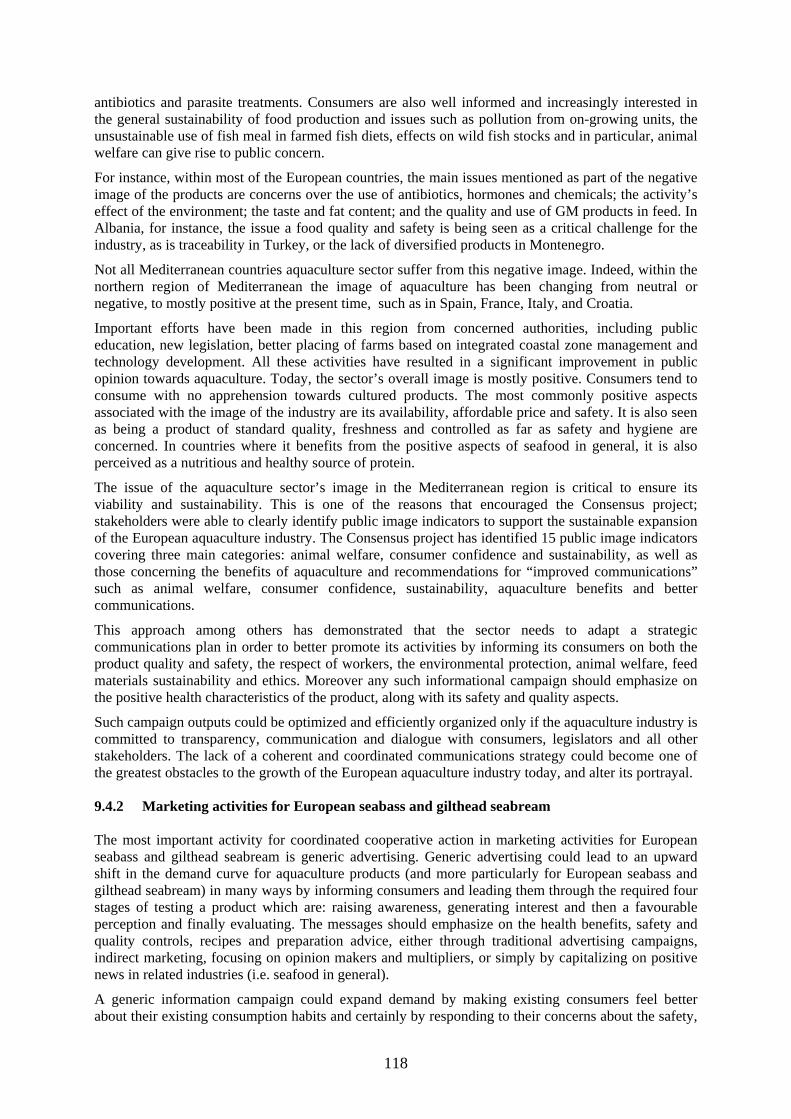
118
antibiotics and parasite treatments. Consumers are also well informed and increasingly interested in the general sustainability of food production and issues such as pollution from on-growing units, the unsustainable use of fish meal in farmed fish diets, effects on wild fish stocks and in particular, animal welfare can give rise to public concern.
For instance, within most of the European countries, the main issues mentioned as part of the negative image of the products are concerns over the use of antibiotics, hormones and chemicals; the activity’s effect of the environment; the taste and fat content; and the quality and use of GM products in feed. In Albania, for instance, the issue a food quality and safety is being seen as a critical challenge for the industry, as is traceability in Turkey, or the lack of diversified products in Montenegro.
Not all Mediterranean countries aquaculture sector suffer from this negative image. Indeed, within the northern region of Mediterranean the image of aquaculture has been changing from neutral or negative, to mostly positive at the present time, such as in Spain, France, Italy, and Croatia.
Important efforts have been made in this region from concerned authorities, including public education, new legislation, better placing of farms based on integrated coastal zone management and technology development. All these activities have resulted in a significant improvement in public opinion towards aquaculture. Today, the sector’s overall image is mostly positive. Consumers tend to consume with no apprehension towards cultured products. The most commonly positive aspects associated with the image of the industry are its availability, affordable price and safety. It is also seen as being a product of standard quality, freshness and controlled as far as safety and hygiene are concerned. In countries where it benefits from the positive aspects of seafood in general, it is also perceived as a nutritious and healthy source of protein.
The issue of the aquaculture sector’s image in the Mediterranean region is critical to ensure its viability and sustainability. This is one of the reasons that encouraged the Consensus project; stakeholders were able to clearly identify public image indicators to support the sustainable expansion of the European aquaculture industry. The Consensus project has identified 15 public image indicators covering three main categories: animal welfare, consumer confidence and sustainability, as well as those concerning the benefits of aquaculture and recommendations for “improved communications” such as animal welfare, consumer confidence, sustainability, aquaculture benefits and better communications.
This approach among others has demonstrated that the sector needs to adapt a strategic communications plan in order to better promote its activities by informing its consumers on both the product quality and safety, the respect of workers, the environmental protection, animal welfare, feed materials sustainability and ethics. Moreover any such informational campaign should emphasize on the positive health characteristics of the product, along with its safety and quality aspects.
Such campaign outputs could be optimized and efficiently organized only if the aquaculture industry is committed to transparency, communication and dialogue with consumers, legislators and all other stakeholders. The lack of a coherent and coordinated communications strategy could become one of the greatest obstacles to the growth of the European aquaculture industry today, and alter its portrayal. 9.4.2 Marketing activities for European seabass and gilthead seabream The most important activity for coordinated cooperative action in marketing activities for European seabass and gilthead seabream is generic advertising. Generic advertising could lead to an upward shift in the demand curve for aquaculture products (and more particularly for European seabass and gilthead seabream) in many ways by informing consumers and leading them through the required four stages of testing a product which are: raising awareness, generating interest and then a favourable perception and finally evaluating. The messages should emphasize on the health benefits, safety and quality controls, recipes and preparation advice, either through traditional advertising campaigns, indirect marketing, focusing on opinion makers and multipliers, or simply by capitalizing on positive news in related industries (i.e. seafood in general).
A generic information campaign could expand demand by making existing consumers feel better about their existing consumption habits and certainly by responding to their concerns about the safety,
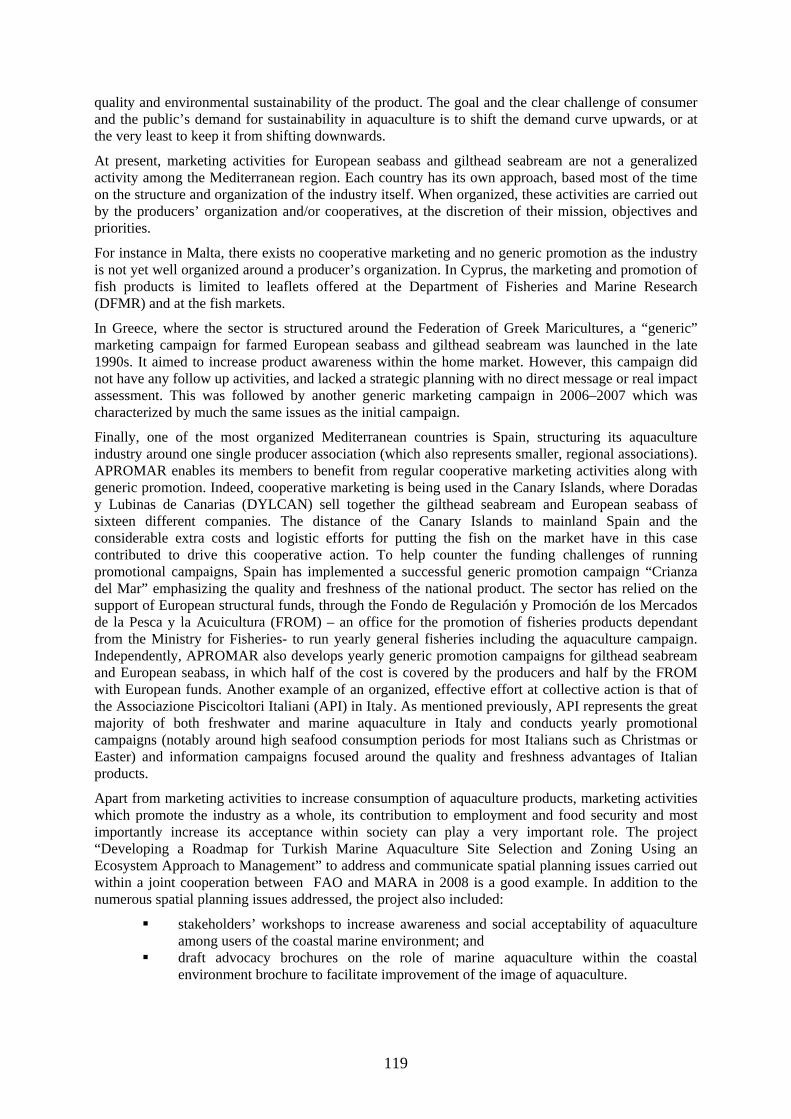
119
quality and environmental sustainability of the product. The goal and the clear challenge of consumer and the public’s demand for sustainability in aquaculture is to shift the demand curve upwards, or at the very least to keep it from shifting downwards.
At present, marketing activities for European seabass and gilthead seabream are not a generalized activity among the Mediterranean region. Each country has its own approach, based most of the time on the structure and organization of the industry itself. When organized, these activities are carried out by the producers’ organization and/or cooperatives, at the discretion of their mission, objectives and priorities.
For instance in Malta, there exists no cooperative marketing and no generic promotion as the industry is not yet well organized around a producer’s organization. In Cyprus, the marketing and promotion of fish products is limited to leaflets offered at the Department of Fisheries and Marine Research (DFMR) and at the fish markets.
In Greece, where the sector is structured around the Federation of Greek Maricultures, a “generic” marketing campaign for farmed European seabass and gilthead seabream was launched in the late 1990s. It aimed to increase product awareness within the home market. However, this campaign did not have any follow up activities, and lacked a strategic planning with no direct message or real impact assessment. This was followed by another generic marketing campaign in 2006–2007 which was characterized by much the same issues as the initial campaign.
Finally, one of the most organized Mediterranean countries is Spain, structuring its aquaculture industry around one single producer association (which also represents smaller, regional associations). APROMAR enables its members to benefit from regular cooperative marketing activities along with generic promotion. Indeed, cooperative marketing is being used in the Canary Islands, where Doradas y Lubinas de Canarias (DYLCAN) sell together the gilthead seabream and European seabass of sixteen different companies. The distance of the Canary Islands to mainland Spain and the considerable extra costs and logistic efforts for putting the fish on the market have in this case contributed to drive this cooperative action. To help counter the funding challenges of running promotional campaigns, Spain has implemented a successful generic promotion campaign “Crianza del Mar” emphasizing the quality and freshness of the national product. The sector has relied on the support of European structural funds, through the Fondo de Regulación y Promoción de los Mercados de la Pesca y la Acuicultura (FROM) – an office for the promotion of fisheries products dependant from the Ministry for Fisheries- to run yearly general fisheries including the aquaculture campaign. Independently, APROMAR also develops yearly generic promotion campaigns for gilthead seabream and European seabass, in which half of the cost is covered by the producers and half by the FROM with European funds. Another example of an organized, effective effort at collective action is that of the Associazione Piscicoltori Italiani (API) in Italy. As mentioned previously, API represents the great majority of both freshwater and marine aquaculture in Italy and conducts yearly promotional campaigns (notably around high seafood consumption periods for most Italians such as Christmas or Easter) and information campaigns focused around the quality and freshness advantages of Italian products.
Apart from marketing activities to increase consumption of aquaculture products, marketing activities which promote the industry as a whole, its contribution to employment and food security and most importantly increase its acceptance within society can play a very important role. The project “Developing a Roadmap for Turkish Marine Aquaculture Site Selection and Zoning Using an Ecosystem Approach to Management” to address and communicate spatial planning issues carried out within a joint cooperation between FAO and MARA in 2008 is a good example. In addition to the numerous spatial planning issues addressed, the project also included:
stakeholders’ workshops to increase awareness and social acceptability of aquaculture among users of the coastal marine environment; and
draft advocacy brochures on the role of marine aquaculture within the coastal environment brochure to facilitate improvement of the image of aquaculture.
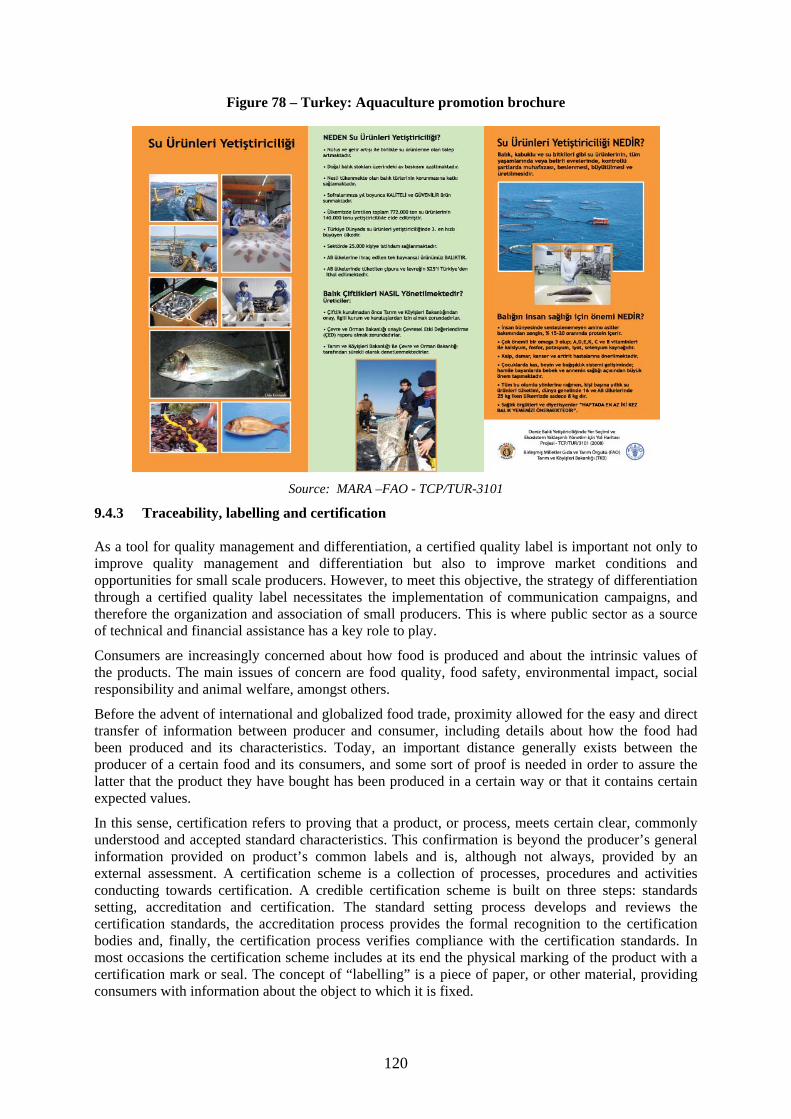
120
Figure 78 – Turkey: Aquaculture promotion brochure
Source: MARA –FAO - TCP/TUR-3101
9.4.3 Traceability, labelling and certification As a tool for quality management and differentiation, a certified quality label is important not only to improve quality management and differentiation but also to improve market conditions and opportunities for small scale producers. However, to meet this objective, the strategy of differentiation through a certified quality label necessitates the implementation of communication campaigns, and therefore the organization and association of small producers. This is where public sector as a source of technical and financial assistance has a key role to play.
Consumers are increasingly concerned about how food is produced and about the intrinsic values of the products. The main issues of concern are food quality, food safety, environmental impact, social responsibility and animal welfare, amongst others.
Before the advent of international and globalized food trade, proximity allowed for the easy and direct transfer of information between producer and consumer, including details about how the food had been produced and its characteristics. Today, an important distance generally exists between the producer of a certain food and its consumers, and some sort of proof is needed in order to assure the latter that the product they have bought has been produced in a certain way or that it contains certain expected values.
In this sense, certification refers to proving that a product, or process, meets certain clear, commonly understood and accepted standard characteristics. This confirmation is beyond the producer’s general information provided on product’s common labels and is, although not always, provided by an external assessment. A certification scheme is a collection of processes, procedures and activities conducting towards certification. A credible certification scheme is built on three steps: standards setting, accreditation and certification. The standard setting process develops and reviews the certification standards, the accreditation process provides the formal recognition to the certification bodies and, finally, the certification process verifies compliance with the certification standards. In most occasions the certification scheme includes at its end the physical marking of the product with a certification mark or seal. The concept of “labelling” is a piece of paper, or other material, providing consumers with information about the object to which it is fixed.
121
Certification schemes are in many cases designed as marketing tools, with the objective to differentiate in the marketplace some products from the rest and convince consumers that they will satisfy their expectations, as it is the case these days in most of the northern Mediterranean countries such as in Italy and France. But at the same time certification schemes can encourage better management practices on the producer’s side by obtaining economic advantage based on the feedback from consumers’ selection of products.
The establishment of certification schemes is usually carried out by private industry or its associations, by non-governmental, by public organizations or through agreements between them.
Regarding the geographical scope of certification schemes, these are regional, national or international. Because of the use of certification schemes as marketing tools aiming at consumers, their design and application are determined by the requirements and conditions applicable at the country of residence of the consumers, and not of the producers. However, in the case of the Mediterranean aquaculture, the location of the production and the one of the market can be the same and thus creates a unique base for certification schemes. This situation also applies to compliance with laws and regulations, referring to conformity with producer’s local laws that the production process must follow, but also with international regulations on trade, and with compliance with the national laws in the target market were the product is anticipated to be sold.
The values offered by certified products can not deliver less than the established legal obligations, especially on food safety issues. Therefore certification requirements are generally more stringent than legal obligations in all of its principles.
Certification schemes have been accused of causing disruptions to free trade, for this reason relevant international organizations, such as the World Trade Organization (WTO), have worked to create rules to ensure fair practices for international commerce and facilitate market access. In particular, WTO has produced its “Agreement on Technical Barriers to Trade” and its “Agreement on the Application of Sanitary and Phytosanitary Measures” to prevent the deliberate creation of trade barriers.
Because of the increasing movement of products around the world and the need for certification schemes to be internationally accepted, a certain degree of standardization in the design and structure of the schemes is already available. The main organizations involved in setting common standards for certification are the International Organization for Standardization (ISO) and the International Social and Environmental Accreditation and Labelling Alliance (ISEAL).
One of the basic structural elements of any certification scheme is traceability, often considered as the backbone of the certification system. Traceability is the possibility to find and follow the trace of a food or feed throughout all the stages of production, processing and distribution. It is based on appropriate data collection. Traceability allows targeting market withdrawals, by enabling authorities to trace back a food risk case to the source of the problem, isolate it and prevent it from reaching the consumers. It minimizes trade disruptions to a whole family of food products in case of safety problems with just a particular product. Traceability does not by itself make food safe but it is rather a risk management tool.
Traceability of food products is compulsory in many countries around the world. In the European Union, Regulation 178/2002 of the European Parliament and of the Council lays down the general principles and requirements of food law in the European Union, in which article 18 is dedicated to traceability. Added to this regulation, most EU member states have endorsed additional traceability criteria. This is the case for Italy, where all fish farmers have adopted an internal system for traceability of stock. Some farmers who have chosen to implement the procedures ISO 9001:2008 and/or ISO 14001:2004 have further strengthened and improved its system of mandatory traceability.
In Croatia, all aquaculture facilities are obliged to fully apply HACCP system starting with January 2009. Total implementation could be prolonged by the end of 2009, but only for products that are placed on domestic market. All fisheries products have to be accompanied by a specific form giving all traceability data, like: data about the fishermen/aquaculture producer, data about the aquaculture farming facilities (registration number, location), data about the product (species, quantity, harvesting area), data about transport and data about the buyer. Shellfish products are requiring additional data
122
about specific harvesting zones and about the centre for distribution/purification. All fisheries products that are exported are followed by a specific national certificate proving that this product is coming from registered object with fully applied HACCP system. All fisheries products are obliged to be labelled by specific label showing all necessary data about the product (legislation transposed from EU) showing clearly the source of fisheries products (fisheries or aquaculture).
Certification schemes assure the traceability of their products and processes. This traceability favours continuous and measurable improvements in performance of the system, and establishes clear accountability for all involved parties, including the owners of the certification schemes, the auditors and the certification bodies. Modern information technologies allow for the collection and analysis of huge quantities of data.
The most modern food paradigm is often described as from the “farm to plate”. This means that the certification of products doesn’t end with the conformity assessment of the products but that measures are in place to track the certified aquaculture products during the stages of processing, distribution and marketing. This second step is known as chain of custody. Not all certification schemes include the chain of custody because of the added complexity, but for full traceability some control on it is required.
In order for certification schemes to be effective, they must provide credible information on product characteristics and quality, widespread acceptance and traceability. One barrier to this objective is that often, the use of certification schemes are seen as mere marketing tools and this has led to the proliferation of them. Although the abundance of certification schemes is positive because it provides consumers with more information, it is on the other hand causing confusion to consumers and producers not only because of the overwhelming profusion of them, but also because of the use of misleading names and because of the lack of clear boundaries between them. Some certification schemes exist that even offer no special added value to products. This confusing situation also demands more work on harmonization between equivalent certification schemes.
The implementation of certification schemes should be an added value for producers, but is now evolving towards an obligation for many food producers without reporting direct benefits to them. The development and implementation of certification schemes should help to increase confidence in the certified product and lead to achieving improved production practices.
The main trends in aquaculture certification are that there are an increasing number of schemes, an increase in the number of commodities covered by schemes, and increases in the scope of standards (social, environment, food safety, animal health and welfare, trade) all of which are driven by a standing demand for certified products.
Certain types of certification created by non governmental organizations and the wider civil society tend to focus more generally on environmental and social issues compared to the ones created by the industry usually addressing issues such as food safety and quality, demonstrating compliance within the industry and the market partners.
Most of the work done on certification within the aquaculture sector has mainly been done on salmon and shrimp. But due to the increasing role and production of aquaculture products there has been a growing interest in applying these certification’s types to a wider range of aquaculture commodities. However, due to the increasing amount of certification’s types worldwide, which often leads to duplication, the risk of confusion between consumers, producers and other stakeholders is high. This is already quite clear with regards to eco-labels, organic labels, sustainability certifications and other “green” schemes.
The types of certification could be categorized according to the following approaches, which include: quality, business to business, environmental, social, and consumer; even if some of them overlap.
From an environmental point of view at the very least, it would certainly be logical for the aquaculture industry in the Mediterranean to consider a common approach covering traceability, labelling and certification issues. The World Conservation Union (IUCN) has developed in this scope a discussion paper for the sustainable development of Mediterranean aquaculture dedicated to “responsible aquaculture practices and certification”.
123
9.4.4 Quality schemes for European seabass and gilthead seabream Quality assurance schemes are increasingly required by the market. These factors are also integral to verification of sustainability. Monitoring of schemes is carried out by both producers and buyers. Schemes should be independently audited on a regular basis, so it ought to be easy to know the percentage of production covered by quality assurance; even if the main challenge remains the collection of reliable data.
There are two ways to study the quality schemes applied to European seabass and gilthead seabream production among the aquaculture sector in the Mediterranean countries: at the producer level and at the distribution one.
At the producer level, quality schemes are increasingly being adopted by the aquaculture sector on a per country basis. Indeed, the ISO 9000 standard is gradually being widely adopted by producers to tackle quality management issues. This type of certification is still voluntary and thus its level of implementation still brings a lot of questions. This is the reason some countries have developed economic incentives to encourage the industry to adhere to them. This is the case of Spain, which encourages better environmental practices in aquaculture farms by granting a significant reduction in the tax on concessions of public domain waters to aquaculture companies that implement officially recognized environmental management certification schemes such as the Eco-Management and Audit Scheme (EMAS) or ISO 14000. This law was passed in 2007 and provides discounts of up to forty percent (40 percent) on this expensive levy for aquaculture farms, improving their environmental performance through EMAS or ISO 14000.
In Cyprus, the most commonly used scheme, is ISO 22000 which incorporates hazard analysis as an effective food safety management system. Another state approach given to the quality scheme covering European seabass and gilthead seabream is Greece. Through the Organization for Certification and Inspection of Agricultural Products of the Hellenic Ministry of Rural Development and Food (AGROCERT) – the established national authority for standardization and certification of agricultural products- introduced the first two mariculture related standards: AGRO 4-1 dedicated to the management system for the quality assurance of mariculture products and the specification of farming management - quality control of the product, and AGRO 4-2 management system for the quality assurance of mariculture products with the specification of packaging establishment operation. The AGROCERT scheme was certainly an important step for addressing the challenges of quality certification and labelling. However, mainly due to financial problems, very few companies applied for a certification under this scheme. In any case, the overall effect and contribution of this scheme remains questionable considering that this quality certification system was never adequately communicated and promoted to the main buyers of Greek aquaculture products: wholesalers, retailers and final consumers in Italy, Spain, France and other European countries. The cost of certification under the AGROCERT scheme has been estimated at about €0.80/kg, a cost which under the current conditions is “forbidding” for most, if not all companies, especially as the effects of this certification remain questionable.
When no state or industry-driven quality initiatives exist, producers often apply fisheries-based quality certification schemes such as in Turkey. And when no schemes exist at all, such as in Albania, or when no specific aquaculture quality schemes exist, some companies develop their own. This is the case for instance of Kılıç, Pinar, Akuvatur and Bagci in Turkey that have their own quality label with identification of each fish. The private quality labels are not, however used on all their products.
Aside from the quality schemes implemented at the producer level, the packaging, processing and distribution are some of the steps covered by some specific quality schemes. This is the case for retail store own-labels which cover the certification of quality standards and traceability systems for European seabass and gilthead seabream, such as in Italy and France with Carrefour, Metro, GS, Coop, Esselunga, and Auchan.
There are several additional issues which have to be considered, as the Consensus project highlighted, when considering a quality scheme for European seabass and gilthead seabream such as:
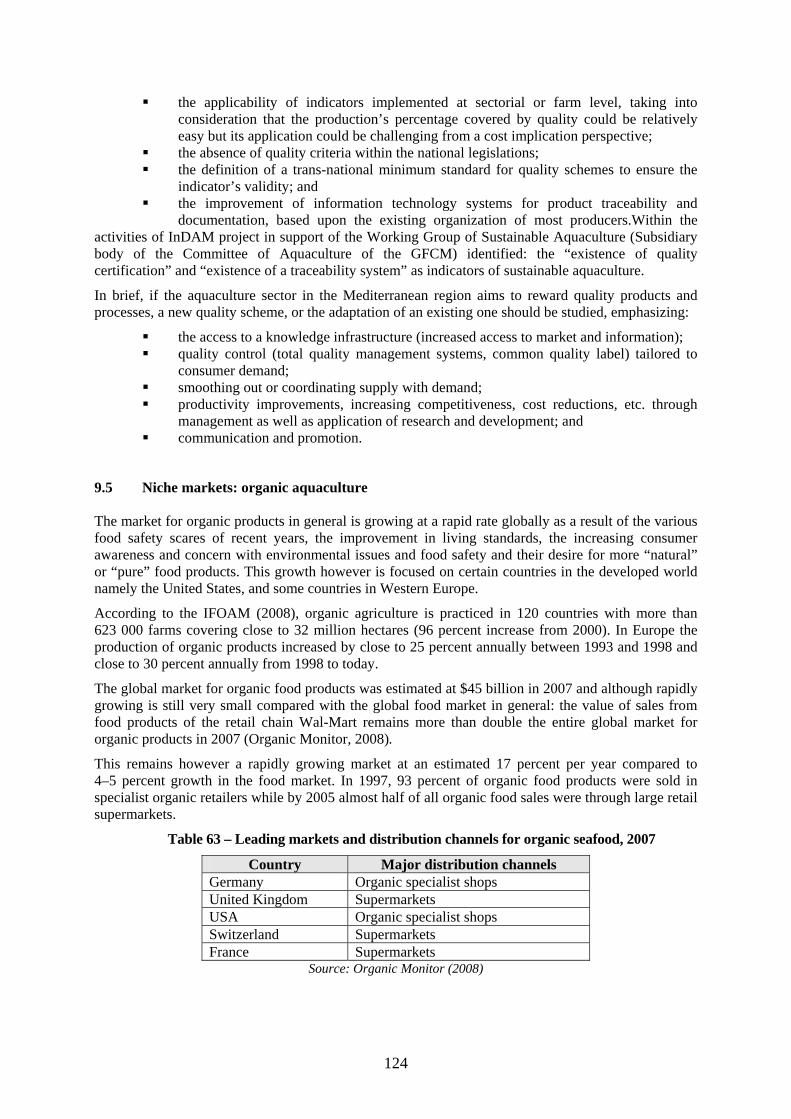
124
the applicability of indicators implemented at sectorial or farm level, taking into consideration that the production’s percentage covered by quality could be relatively easy but its application could be challenging from a cost implication perspective;
the absence of quality criteria within the national legislations; the definition of a trans-national minimum standard for quality schemes to ensure the
indicator’s validity; and the improvement of information technology systems for product traceability and
documentation, based upon the existing organization of most producers.Within the activities of InDAM project in support of the Working Group of Sustainable Aquaculture (Subsidiary body of the Committee of Aquaculture of the GFCM) identified: the “existence of quality certification” and “existence of a traceability system” as indicators of sustainable aquaculture.
In brief, if the aquaculture sector in the Mediterranean region aims to reward quality products and processes, a new quality scheme, or the adaptation of an existing one should be studied, emphasizing:
the access to a knowledge infrastructure (increased access to market and information); quality control (total quality management systems, common quality label) tailored to
consumer demand; smoothing out or coordinating supply with demand; productivity improvements, increasing competitiveness, cost reductions, etc. through
management as well as application of research and development; and communication and promotion.
9.5 Niche markets: organic aquaculture The market for organic products in general is growing at a rapid rate globally as a result of the various food safety scares of recent years, the improvement in living standards, the increasing consumer awareness and concern with environmental issues and food safety and their desire for more “natural” or “pure” food products. This growth however is focused on certain countries in the developed world namely the United States, and some countries in Western Europe.
According to the IFOAM (2008), organic agriculture is practiced in 120 countries with more than 623 000 farms covering close to 32 million hectares (96 percent increase from 2000). In Europe the production of organic products increased by close to 25 percent annually between 1993 and 1998 and close to 30 percent annually from 1998 to today.
The global market for organic food products was estimated at $45 billion in 2007 and although rapidly growing is still very small compared with the global food market in general: the value of sales from food products of the retail chain Wal-Mart remains more than double the entire global market for organic products in 2007 (Organic Monitor, 2008).
This remains however a rapidly growing market at an estimated 17 percent per year compared to 4–5 percent growth in the food market. In 1997, 93 percent of organic food products were sold in specialist organic retailers while by 2005 almost half of all organic food sales were through large retail supermarkets.
Table 63 – Leading markets and distribution channels for organic seafood, 2007
Country Major distribution channels Germany Organic specialist shops United Kingdom Supermarkets USA Organic specialist shops Switzerland Supermarkets France Supermarkets
Source: Organic Monitor (2008)
125
Most organic seafood sales are in the EU, 65 percent followed by the USA 17 percent and other countries such as Japan, Australia and New Zealand. There is much confusion as to what exactly constitutes organic aquaculture. There are several significant differences in interpretation depending on the country:. In some cases, organic fish is perceived to be more “natural” and therefore healthier, sometimes it is perceived as being tastier, in other regions there is an emphasis on local production (in part to reduce food miles but also to support regional/national farmers) and in yet others, organic aquaculture is the province of small, traditional farms only (in France organic aquaculture certification is limited to 100 tonnes per site). In other areas there is an emphasis on the “Fair Trade” and human and labour rights issues in agricultural production. There is a lack of regulation and uniform standards with interpretation varying from country to country even within the EU. Independent certifying agencies often use differing standards as a way of keeping competition out, resulting in the need to be certified in almost every different country in order to be able to sell organic aquaculture products.
Organic Aquaculture in the Mediterranean is still in its infancy with a total of five farms certified for organic production as of 2008. The total certified production for European seabass and gilthead seabream is around 1 200 tonnes, divided almost evenly among species but it is estimated that sales have not exceeded 800–1 000 tonnes for 2008.
As with organic agriculture, there is a need for a common EU Regulation on organic aquaculture production to minimize differences in organic standards, to reduce confusion for the consumer and eliminate obstacles to trade. This view is not shared by all actors in the organic sector, in particular the private label organizations. The argument is that private labels are necessary to respond to the perceptions and requirements of consumers in different countries, to differentiate organic standards for the sake of competition and development of the organic market.
At the international level only the IFOAM Basic Standards have rules on aquaculture.
Many national standards have specific rules on aquaculture, at least for some fish species (AT Bio Austria, CZ KEZ, CH Bio Suisse, DE Bioland, DE Naturland, DK Governmental regulation, FR Governmental regulation, NO DEBIO, SE KRAV, SI Rules, SP CAAE, and UK Soil Association).
AB BIO:
Atlantic salmon (Salmo salar) Arctic char (Salvelinus alpinus) Carp (Cyprinus carpio) European seabass (Dicentrarchus labrax) Gilthead seabream (Sparus auratus) Rainbow trout (Oncorhynchus myykiss) Tiger prawn (Penaeus monodon)
Debio:
Atlantic salmon (Salmo salar) Atlantic cod (Gadus morhua) Rainbow trout (Oncorhynchus mykiss)
Organic Food Federation:
Atlantic cod (Gadus morhua) Rainbow trout (Oncorhynchus mykiss) Atlantic salmon (Salmo salar)
126
Soil Association:
Atlantic salmon (Salmo salar) Arctic char (Salvelinus alpinus) Tiger prawn (Penaeus monodon) Carp (Cyprinus carpio) White shrimp (Penaeus vannamei) Rainbow trout (Oncorhynchus mykiss)
Bioland:
Carp (Cyprinus carpio)
Naturland: Atlantic salmon (Salmo salar) Atlantic cod (Gadus morhua) Arctic char (Salvelinus alpinus) Tiger prawn (Penaeus monodon) Carp (Cyprinus carpio) European seabass (Dicentrarchus labrax) Gilthead seabream (Sparus auratus) Pangasius (Pangasius hypophthalamus) White shrimp (Penaeus vannamei) Rainbow trout (Oncorhynchus mykiss) Tilapia (Oreochromis spp.)
Most of the aquaculture standards cover areas, such as the origin of the fish and other aquatic animals grown in aquaculture, stocking density, the handling and breeding of fish, feeding, health protection, processing, transport and slaughter. All forms of modification, including genetic modification of the fish species are prohibited and conservation of the water environment and the surrounding aquatic and terrestrial ecosystem is required. There are several standards which have a strong focus on the environmental issues. Most national standards have different rules for different specific species, such as carp, perch, trout, salmon and other salmonids, mussels, shrimps, etc.
Organic food production worldwide has grown at an annual rate of 17–20 percent since the early 1990s far outpacing the rest of the food industry. Estimates for future growth range from 10 to 50 percent annually depending on the country until it reaches 5–10 percent of the overall food market. However the market for organic products is still a niche market representing 1–2 percent of the whole in 2008. Similarly it is estimated by FAO (2008) that global organic production is less than 1 percent of total aquaculture production.
In 2007, the global production from organic aquaculture totalled 60 000 tonnes. From 2008, the anticipated growth in the global production of organic seafood is 15–25 percent. Organic seafood products account for less than 0.1 percent of the world's total seafood production (Organic Monitor, 2008).
Estimates by FAO in 2004 indicated that global organic aquaculture production could reach 70 000 tonnes by 2010 and more than 1 million tonnes by 2030 (Lem, 2004). At 60 000 tonnes in 2007, it can be argued that these estimates are conservative.
The largest part of organic fish production is in Europe with an estimated production of organic salmon and trout of 17 000 tonnes and a value of 90 million euros. It is estimated that the certified organic production of European seabass and gilthead seabream was around 1 500 tonnes in 2008, which represents close to a ten-fold increase from 2004. It is estimated that the European market can absorb around 4 000 to 6 000 tonnes annually at present or between 1–2 percent of current total conventional Mediterranean production.
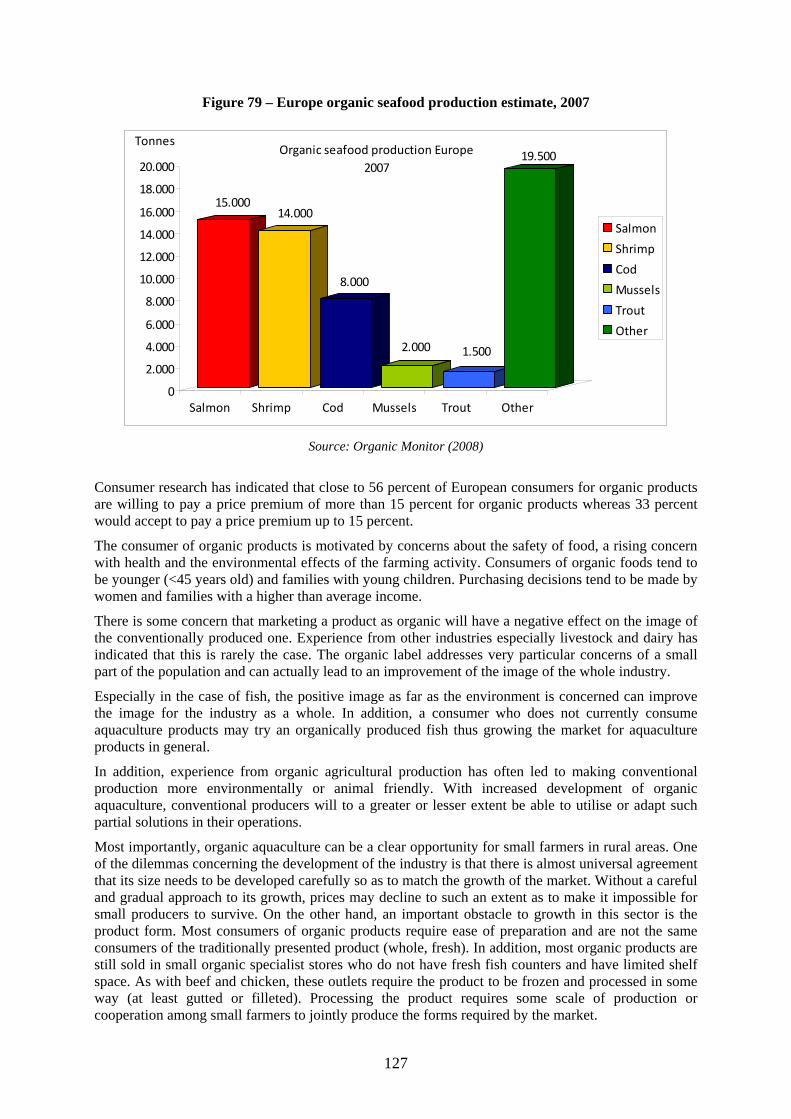
127
Figure 79 – Europe organic seafood production estimate, 2007
15.00014.000
8.000
2.000 1.500
19.500
0
2.000
4.000
6.000
8.000
10.000
12.000
14.000
16.000
18.000
20.000
Salmon Shrimp Cod Mussels Trout Other
Salmon
Shrimp
Cod
Mussels
Trout
Other
TonnesOrganic seafood production Europe
2007
Source: Organic Monitor (2008)
Consumer research has indicated that close to 56 percent of European consumers for organic products are willing to pay a price premium of more than 15 percent for organic products whereas 33 percent would accept to pay a price premium up to 15 percent.
The consumer of organic products is motivated by concerns about the safety of food, a rising concern with health and the environmental effects of the farming activity. Consumers of organic foods tend to be younger (<45 years old) and families with young children. Purchasing decisions tend to be made by women and families with a higher than average income.
There is some concern that marketing a product as organic will have a negative effect on the image of the conventionally produced one. Experience from other industries especially livestock and dairy has indicated that this is rarely the case. The organic label addresses very particular concerns of a small part of the population and can actually lead to an improvement of the image of the whole industry.
Especially in the case of fish, the positive image as far as the environment is concerned can improve the image for the industry as a whole. In addition, a consumer who does not currently consume aquaculture products may try an organically produced fish thus growing the market for aquaculture products in general.
In addition, experience from organic agricultural production has often led to making conventional production more environmentally or animal friendly. With increased development of organic aquaculture, conventional producers will to a greater or lesser extent be able to utilise or adapt such partial solutions in their operations.
Most importantly, organic aquaculture can be a clear opportunity for small farmers in rural areas. One of the dilemmas concerning the development of the industry is that there is almost universal agreement that its size needs to be developed carefully so as to match the growth of the market. Without a careful and gradual approach to its growth, prices may decline to such an extent as to make it impossible for small producers to survive. On the other hand, an important obstacle to growth in this sector is the product form. Most consumers of organic products require ease of preparation and are not the same consumers of the traditionally presented product (whole, fresh). In addition, most organic products are still sold in small organic specialist stores who do not have fresh fish counters and have limited shelf space. As with beef and chicken, these outlets require the product to be frozen and processed in some way (at least gutted or filleted). Processing the product requires some scale of production or cooperation among small farmers to jointly produce the forms required by the market.
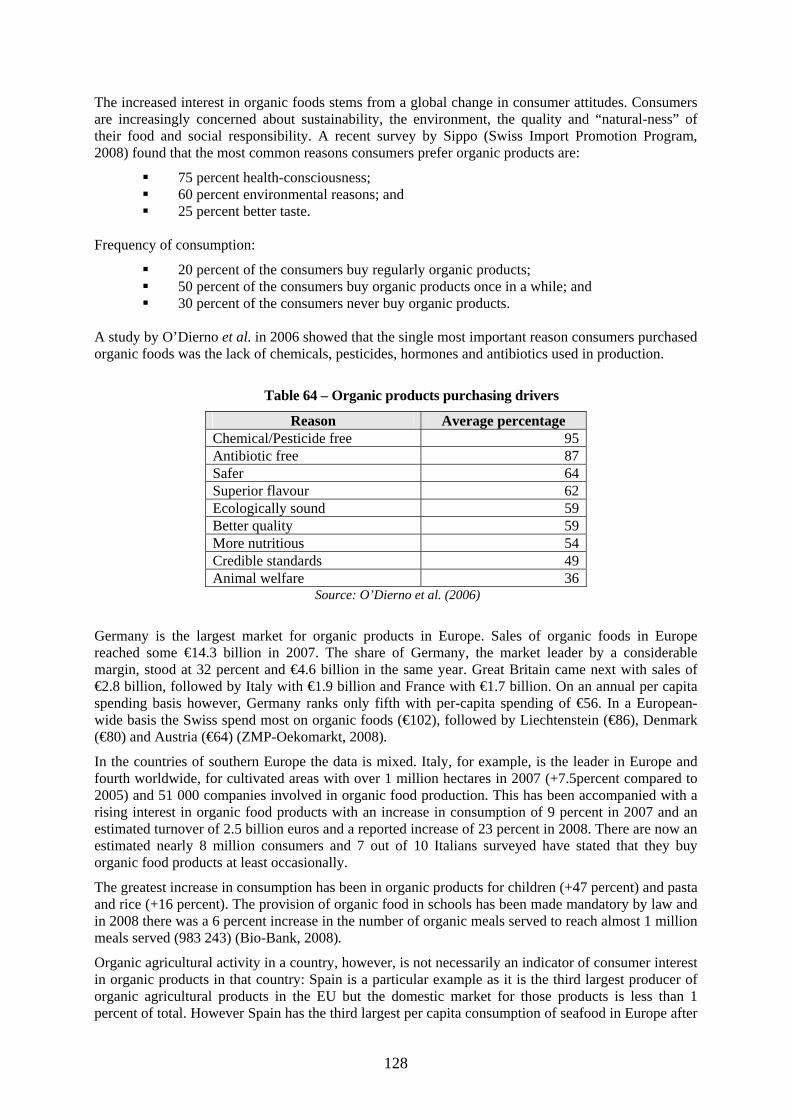
128
The increased interest in organic foods stems from a global change in consumer attitudes. Consumers are increasingly concerned about sustainability, the environment, the quality and “natural-ness” of their food and social responsibility. A recent survey by Sippo (Swiss Import Promotion Program, 2008) found that the most common reasons consumers prefer organic products are:
75 percent health-consciousness; 60 percent environmental reasons; and 25 percent better taste.
Frequency of consumption:
20 percent of the consumers buy regularly organic products; 50 percent of the consumers buy organic products once in a while; and 30 percent of the consumers never buy organic products.
A study by O’Dierno et al. in 2006 showed that the single most important reason consumers purchased organic foods was the lack of chemicals, pesticides, hormones and antibiotics used in production.
Table 64 – Organic products purchasing drivers
Reason Average percentage Chemical/Pesticide free 95 Antibiotic free 87 Safer 64 Superior flavour 62 Ecologically sound 59 Better quality 59 More nutritious 54 Credible standards 49 Animal welfare 36
Source: O’Dierno et al. (2006)
Germany is the largest market for organic products in Europe. Sales of organic foods in Europe reached some €14.3 billion in 2007. The share of Germany, the market leader by a considerable margin, stood at 32 percent and €4.6 billion in the same year. Great Britain came next with sales of €2.8 billion, followed by Italy with €1.9 billion and France with €1.7 billion. On an annual per capita spending basis however, Germany ranks only fifth with per-capita spending of €56. In a European-wide basis the Swiss spend most on organic foods (€102), followed by Liechtenstein (€86), Denmark (€80) and Austria (€64) (ZMP-Oekomarkt, 2008).
In the countries of southern Europe the data is mixed. Italy, for example, is the leader in Europe and fourth worldwide, for cultivated areas with over 1 million hectares in 2007 (+7.5percent compared to 2005) and 51 000 companies involved in organic food production. This has been accompanied with a rising interest in organic food products with an increase in consumption of 9 percent in 2007 and an estimated turnover of 2.5 billion euros and a reported increase of 23 percent in 2008. There are now an estimated nearly 8 million consumers and 7 out of 10 Italians surveyed have stated that they buy organic food products at least occasionally.
The greatest increase in consumption has been in organic products for children (+47 percent) and pasta and rice (+16 percent). The provision of organic food in schools has been made mandatory by law and in 2008 there was a 6 percent increase in the number of organic meals served to reach almost 1 million meals served (983 243) (Bio-Bank, 2008).
Organic agricultural activity in a country, however, is not necessarily an indicator of consumer interest in organic products in that country: Spain is a particular example as it is the third largest producer of organic agricultural products in the EU but the domestic market for those products is less than 1 percent of total. However Spain has the third largest per capita consumption of seafood in Europe after
129
Portugal and Lithuania at 40.5kg annually. Both industry and state authorities have expressed interest in this growing market and significant funds have been earmarked in the 2007–2013 Operational Program for the promotion of organic and environmentally friendly aquaculture.
In order to have some sense of the future direction of this market in the long-term, it is useful to look at the reasons for which consumers do not want to buy organic seafood. The most commonly listed reasons are price, confusion about standards and labels, differing consumer perceptions about what organic is, and perhaps most importantly the preference for wild seafood of the target market. The constant improvement in quality and environmental standards for conventional aquaculture may make eventually price organic seafood out of the market. In addition, organically grown fish is not as productive as conventional, uses more resources and may not, in fact, be sustainable. In a world with decreasing resources it would perhaps not be unexpected that such an activity, especially for carnivorous species, which really produces a luxury product, would come to be viewed as unethical or wasteful. Although organic aquaculture can present some good opportunities for small rural producers in less developed countries, the perception that there is a lack of credible inspection systems in those countries combined with the issue of food miles (long transportation to target organic markets) may be obstacles to the development of such industries. In the short to medium term the organic seafood market will certainly grow at a dynamic rate but may reach a set point in the long-term where it will remain a niche market. Germany
Germany is the largest market for organic products in Europe. Sales of organic foods in Europe reached some €14.3 billion in 2007. The share of Germany, the market leader by a considerable margin, stood at 32 percent and €4.6 billion in the same year. Close to 5 percent of its agricultural production is now organic certified. Organic foods now represent 3 percent of total food sales in Germany and the rate of growth of this market is estimated to be around 10–15 percent per year for the next 3–5 years (Okologisch Μαrkte Εrschliessen, 2005).
Organic products in Germany are sold both through large retail chains (36 percent) as well as specialized organic retail shops (34 percent) which number close to 3 000 throughout Germany. Although it is a large and growing market for organic products in general, and German private certifications such as Naturland and Bioland are widely known and trusted, the consumption of seafood products in general is relatively low. This is especially true for lesser known Mediterranean species. As in the UK, Mediterranean organic fish needs to be presented in such a way as to facilitate consumption (fillets, individual packs, pre-cooked, etc.) and would benefit from efforts to promote these species in general. UK
The market for organic products in the U.K. is the largest in Europe after Germany and Italy. Sales of organic products in 2005 were 1.6 billion pounds, with a 30 percent increase from 2004.
The organic movement in England is very much oriented toward locally grown products, especially as far as produce and meat is concerned, with 66 percent of organic products sold in 2005 being produced locally. There are around 550 organic farmers markets in England with estimated sales of 220 million pounds and direct sales from organic farms were around 125 million pounds in 2005. The greatest share of the organic market remains with supermarket retail chains with sales of 1.2 billion pounds in 2005. The preference for locally grown organic products is in part due to concern with food miles and in part to the trend for supporting traditional farmers, the way of life in the English countryside. This trend also applies to consuming products only in season.
The market for organic products in the UK is a dynamic and growing one, with consumer interest for these products all across the socio-economic spectrum. It is driven by a desire for a healthier lifestyle, fresh, home-grown products and concern for the environment. There is interest for organic aquaculture products as well with two large companies producing organic trout at a premium of 30 percent over the conventional product. Depending on the product, point of sale and time of the year, this premium can vary between 30 percent and 100 percent. Organic aquaculture products are sold in a variety of
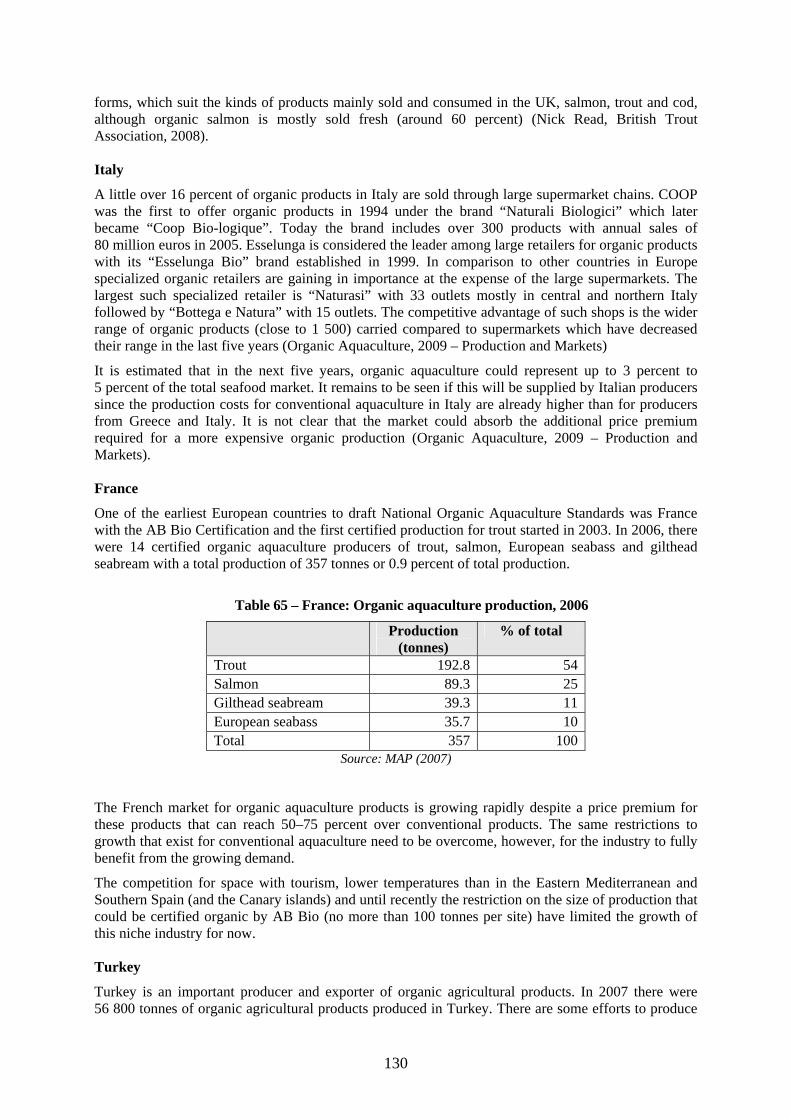
130
forms, which suit the kinds of products mainly sold and consumed in the UK, salmon, trout and cod, although organic salmon is mostly sold fresh (around 60 percent) (Nick Read, British Trout Association, 2008). Italy
A little over 16 percent of organic products in Italy are sold through large supermarket chains. COOP was the first to offer organic products in 1994 under the brand “Naturali Biologici” which later became “Coop Bio-logique”. Today the brand includes over 300 products with annual sales of 80 million euros in 2005. Esselunga is considered the leader among large retailers for organic products with its “Esselunga Bio” brand established in 1999. In comparison to other countries in Europe specialized organic retailers are gaining in importance at the expense of the large supermarkets. The largest such specialized retailer is “Naturasi” with 33 outlets mostly in central and northern Italy followed by “Bottega e Natura” with 15 outlets. The competitive advantage of such shops is the wider range of organic products (close to 1 500) carried compared to supermarkets which have decreased their range in the last five years (Organic Aquaculture, 2009 – Production and Markets)
It is estimated that in the next five years, organic aquaculture could represent up to 3 percent to 5 percent of the total seafood market. It remains to be seen if this will be supplied by Italian producers since the production costs for conventional aquaculture in Italy are already higher than for producers from Greece and Italy. It is not clear that the market could absorb the additional price premium required for a more expensive organic production (Organic Aquaculture, 2009 – Production and Markets). France
One of the earliest European countries to draft National Organic Aquaculture Standards was France with the AB Bio Certification and the first certified production for trout started in 2003. In 2006, there were 14 certified organic aquaculture producers of trout, salmon, European seabass and gilthead seabream with a total production of 357 tonnes or 0.9 percent of total production.
Table 65 – France: Organic aquaculture production, 2006
Production (tonnes)
% of total
Trout 192.8 54 Salmon 89.3 25 Gilthead seabream 39.3 11 European seabass 35.7 10 Total 357 100
Source: MAP (2007)
The French market for organic aquaculture products is growing rapidly despite a price premium for these products that can reach 50–75 percent over conventional products. The same restrictions to growth that exist for conventional aquaculture need to be overcome, however, for the industry to fully benefit from the growing demand.
The competition for space with tourism, lower temperatures than in the Eastern Mediterranean and Southern Spain (and the Canary islands) and until recently the restriction on the size of production that could be certified organic by AB Bio (no more than 100 tonnes per site) have limited the growth of this niche industry for now. Turkey
Turkey is an important producer and exporter of organic agricultural products. In 2007 there were 56 800 tonnes of organic agricultural products produced in Turkey. There are some efforts to produce
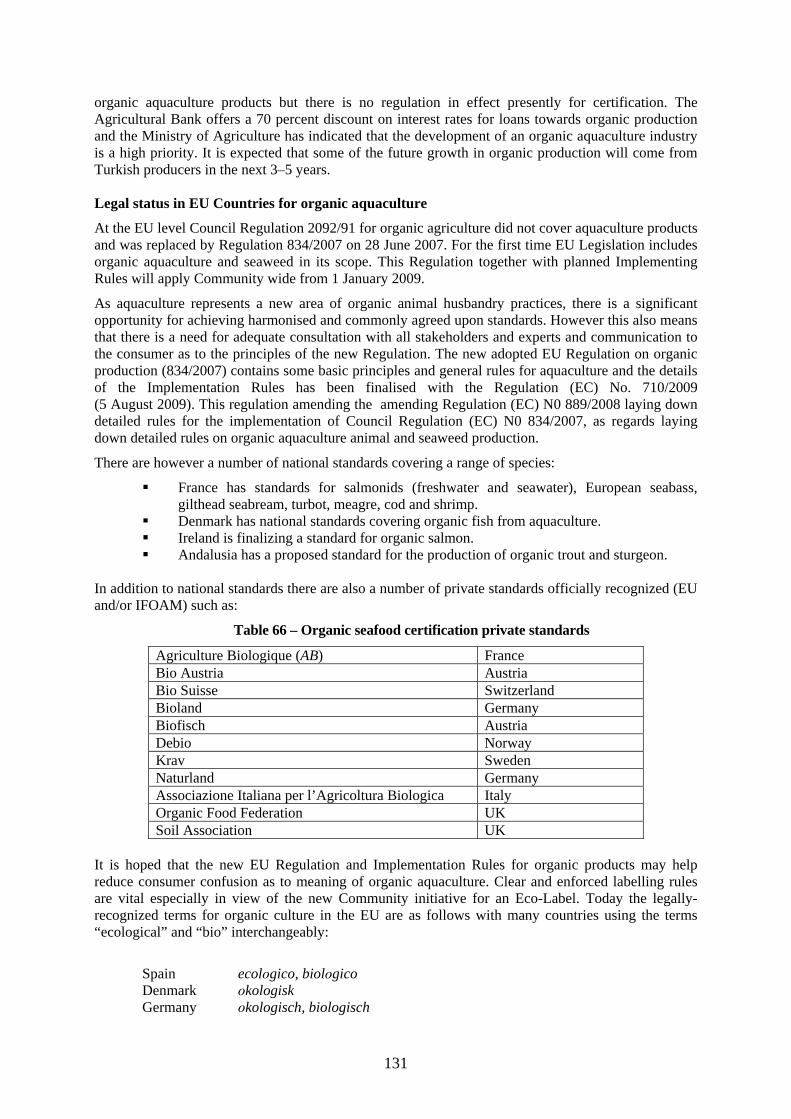
131
organic aquaculture products but there is no regulation in effect presently for certification. The Agricultural Bank offers a 70 percent discount on interest rates for loans towards organic production and the Ministry of Agriculture has indicated that the development of an organic aquaculture industry is a high priority. It is expected that some of the future growth in organic production will come from Turkish producers in the next 3–5 years. Legal status in EU Countries for organic aquaculture
At the EU level Council Regulation 2092/91 for organic agriculture did not cover aquaculture products and was replaced by Regulation 834/2007 on 28 June 2007. For the first time EU Legislation includes organic aquaculture and seaweed in its scope. This Regulation together with planned Implementing Rules will apply Community wide from 1 January 2009.
As aquaculture represents a new area of organic animal husbandry practices, there is a significant opportunity for achieving harmonised and commonly agreed upon standards. However this also means that there is a need for adequate consultation with all stakeholders and experts and communication to the consumer as to the principles of the new Regulation. The new adopted EU Regulation on organic production (834/2007) contains some basic principles and general rules for aquaculture and the details of the Implementation Rules has been finalised with the Regulation (EC) No. 710/2009 (5 August 2009). This regulation amending the amending Regulation (EC) N0 889/2008 laying down detailed rules for the implementation of Council Regulation (EC) N0 834/2007, as regards laying down detailed rules on organic aquaculture animal and seaweed production.
There are however a number of national standards covering a range of species:
France has standards for salmonids (freshwater and seawater), European seabass, gilthead seabream, turbot, meagre, cod and shrimp.
Denmark has national standards covering organic fish from aquaculture. Ireland is finalizing a standard for organic salmon. Andalusia has a proposed standard for the production of organic trout and sturgeon.
In addition to national standards there are also a number of private standards officially recognized (EU and/or IFOAM) such as:
Table 66 – Organic seafood certification private standards
Agriculture Biologique (AB) France Bio Austria Austria Bio Suisse Switzerland Bioland Germany Biofisch Austria Debio Norway Krav Sweden Naturland Germany Associazione Italiana per l’Agricoltura Biologica Italy Organic Food Federation UK Soil Association UK
It is hoped that the new EU Regulation and Implementation Rules for organic products may help reduce consumer confusion as to meaning of organic aquaculture. Clear and enforced labelling rules are vital especially in view of the new Community initiative for an Eco-Label. Today the legally-recognized terms for organic culture in the EU are as follows with many countries using the terms “ecological” and “bio” interchangeably:
Spain ecolοgico, biolοgico Denmark οkologisk Germany οkologisch, biologisch
132
Greece βιολογικό UK organic France biologique Italy biologico Holland biologisch Portugal biolοgico Finland luonnonmukainen Sweden ekologisk
Obstacles to growth:
no harmonized regulations or standards; consumer confusion as to the meaning of organic aquaculture; cultural/national differences in interpretation of organic principles; high cost of production and certification – price to consumers; and product form.
Opportunities for growth:
high growth sector; response to growing consumer preference for healthy and natural products; response to consumer concerns about the environment and sustainability of the industry;
and good market opportunity for small farms.
9.6 Future of the market for aquaculture products 9.6.1 New product forms and species New product forms Although for many years European seabass and gilthead seabream has been sold gutted, in vacuum packaging or filleted in retail shops or supermarket shelves, this transformation has been done on a small scale according to demand by the wholesalers, the retailer or supermarkets themselves. More recently the larger companies in the industry have invested in processing plants and in order to be able to provide these products directly. It is estimated that not more than 5 percent of the total Mediterranean production is sold in these forms and it is almost entirely sold in bulk with no branding or innovative presentations. The most common forms are either in fresh fillets sold in bulk in 3–5 kg polystyrene boxes or frozen fillets, packaged 5–10 fillets to a plastic bag in 5kg cardboard boxes. The customer can then either sell the fillets by the piece, repackage them with his own brand or sell them in batches to restaurants and caterers. Some producers sell their product fresh, gutted and scaled or filleted in individual trays in modified atmosphere packaging (MAP). New species for aquaculture Most Mediterranean countries are limited as to the diversity of commercially viable cultured species. Most producing countries are focused on the farming of:
Rainbow trout (Oncorhynchus mykiss); European seabass (Dicentrarchus labrax); Gilthead seabream (Sparus aurata); Carp (Cyprinus carpio); Bluefin tuna (Thunnus thynnus); Mediterranean mussel (Mytilus galloprovinciialis); and Meagre (Argyrosomus regius).
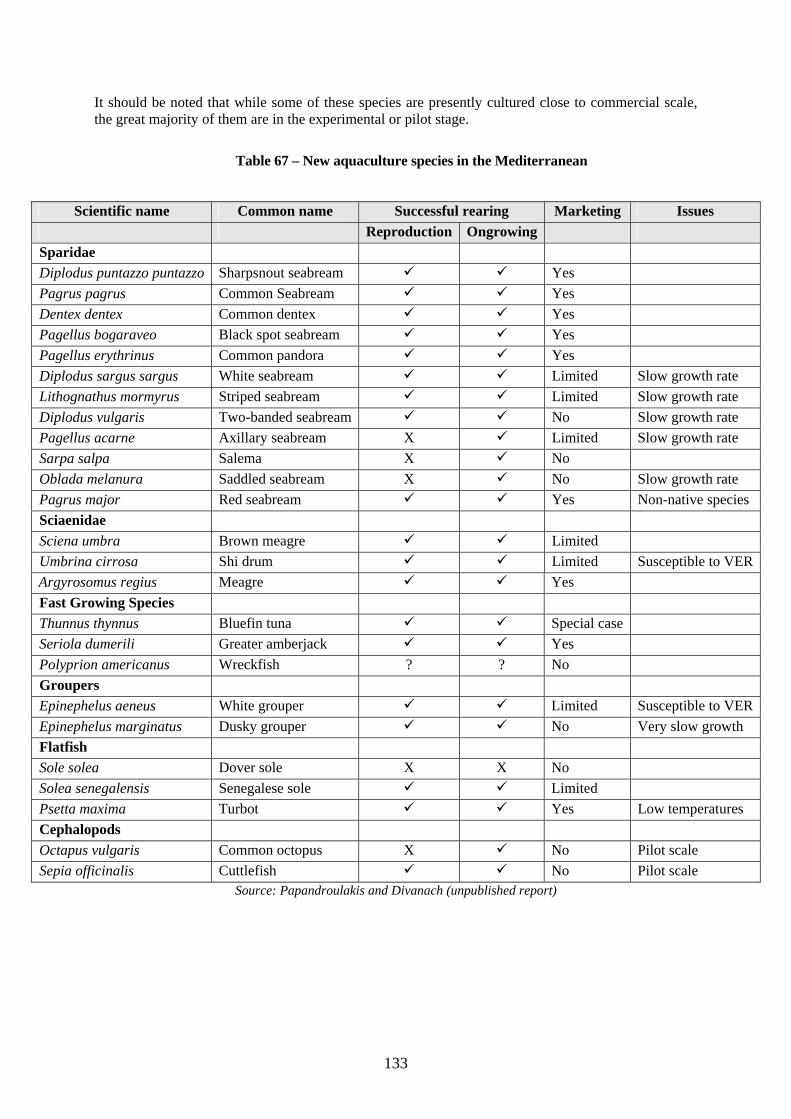
133
It should be noted that while some of these species are presently cultured close to commercial scale, the great majority of them are in the experimental or pilot stage.
Table 67 – New aquaculture species in the Mediterranean
Scientific name Common name Successful rearing Marketing Issues Reproduction Ongrowing Sparidae Diplodus puntazzo puntazzo Sharpsnout seabream Yes Pagrus pagrus Common Seabream Yes Dentex dentex Common dentex Yes Pagellus bogaraveo Black spot seabream Yes Pagellus erythrinus Common pandora Yes Diplodus sargus sargus White seabream Limited Slow growth rate Lithognathus mormyrus Striped seabream Limited Slow growth rate Diplodus vulgaris Two-banded seabream No Slow growth rate Pagellus acarne Axillary seabream X Limited Slow growth rate Sarpa salpa Salema X No Oblada melanura Saddled seabream X No Slow growth rate Pagrus major Red seabream Yes Non-native species Sciaenidae Sciena umbra Brown meagre Limited Umbrina cirrosa Shi drum Limited Susceptible to VERArgyrosomus regius Meagre Yes Fast Growing Species Thunnus thynnus Bluefin tuna Special case Seriola dumerili Greater amberjack Yes Polyprion americanus Wreckfish ? ? No Groupers Epinephelus aeneus White grouper Limited Susceptible to VEREpinephelus marginatus Dusky grouper No Very slow growth Flatfish Sole solea Dover sole X X No Solea senegalensis Senegalese sole Limited Psetta maxima Turbot Yes Low temperatures Cephalopods Octapus vulgaris Common octopus X No Pilot scale Sepia officinalis Cuttlefish No Pilot scale
Source: Papandroulakis and Divanach (unpublished report)
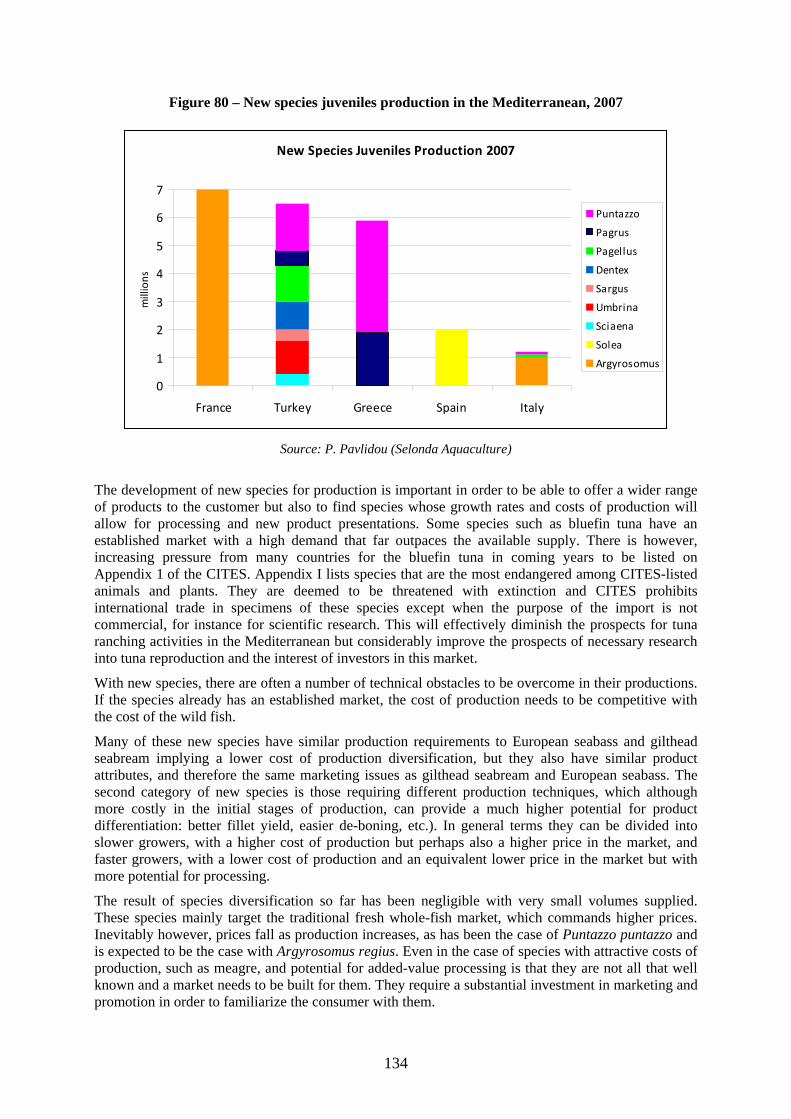
134
Figure 80 – New species juveniles production in the Mediterranean, 2007
New Species Juveniles Production 2007
0
1
2
3
4
5
6
7
France Turkey Greece Spain Italy
millions
Puntazzo
Pagrus
Pagellus
Dentex
Sargus
Umbrina
Sciaena
Solea
Argyrosomus
Source: P. Pavlidou (Selonda Aquaculture)
The development of new species for production is important in order to be able to offer a wider range of products to the customer but also to find species whose growth rates and costs of production will allow for processing and new product presentations. Some species such as bluefin tuna have an established market with a high demand that far outpaces the available supply. There is however, increasing pressure from many countries for the bluefin tuna in coming years to be listed on Appendix 1 of the CITES. Appendix I lists species that are the most endangered among CITES-listed animals and plants. They are deemed to be threatened with extinction and CITES prohibits international trade in specimens of these species except when the purpose of the import is not commercial, for instance for scientific research. This will effectively diminish the prospects for tuna ranching activities in the Mediterranean but considerably improve the prospects of necessary research into tuna reproduction and the interest of investors in this market.
With new species, there are often a number of technical obstacles to be overcome in their productions. If the species already has an established market, the cost of production needs to be competitive with the cost of the wild fish.
Many of these new species have similar production requirements to European seabass and gilthead seabream implying a lower cost of production diversification, but they also have similar product attributes, and therefore the same marketing issues as gilthead seabream and European seabass. The second category of new species is those requiring different production techniques, which although more costly in the initial stages of production, can provide a much higher potential for product differentiation: better fillet yield, easier de-boning, etc.). In general terms they can be divided into slower growers, with a higher cost of production but perhaps also a higher price in the market, and faster growers, with a lower cost of production and an equivalent lower price in the market but with more potential for processing.
The result of species diversification so far has been negligible with very small volumes supplied. These species mainly target the traditional fresh whole-fish market, which commands higher prices. Inevitably however, prices fall as production increases, as has been the case of Puntazzo puntazzo and is expected to be the case with Argyrosomus regius. Even in the case of species with attractive costs of production, such as meagre, and potential for added-value processing is that they are not all that well known and a market needs to be built for them. They require a substantial investment in marketing and promotion in order to familiarize the consumer with them.
135
9.6.2 Strategic options Small farms
There are essentially three strategic options for small-sized farms:
1) Reducing all costs as much as possible and selling to bigger farms with organized sales networks. Small farms, with less than 500 tonnes of production, can have the lowest cost of production in the industry if they have no or little debt. They do not have the added expense of sales and distribution networks, hatchery production and management. They tend to have the most efficient cost of production for a commodity product, i.e. raw materials account for close to 70 percent of their total cost. However, they have no contact with the consumer, and they don’t have any negotiating power over the price of their raw materials, feed and juveniles, or the price they can obtain for their product. They are often at the mercy of large producers who supply them with juveniles, with feed and after two years will buy their product at market price. Large producers tend to be vertically integrated and produce juveniles commercially as well as, more recently, feed. It is interesting to note that while the expansion of the industry, the growth of production and increase in competition, has resulted in the drop in the price of bass and bream over time, there has been no such trend in the price of juveniles or feed. What has happened instead is the gradual increase in payment terms to 6–9 months for feed and over 12 months for juveniles. While it is true that the long payment terms are partially the result of the long production cycle in the industry (with the lack of availability of financing, a farmer has to wait 14 to 18 months to start selling his product), it is telling that hatchery production in the large producing countries is very concentrated. The growth of the juveniles production sector has therefore not really resulted in competition: better prices, better quality of juveniles and better service.
This strategy is the one most often followed by smaller farms and which has resulted in the great majority of cases in them going out of business or being absorbed by larger farms in time of crisis.
2) The second option is for small farms to band together in collective groups, whether as producer’s organizations, or more informal alliances to improve their negotiating power vis-à-vis their suppliers, their customers and to allow them some economies of scale. They can opt for common investments in a hatchery, packaging plant, a sales and distribution network and even in a feed factory. It is also possible to establish a joint brand or label for quality or origin of production. There have been examples of such attempts in the Mediterranean, some more successful than others. The success of such schemes seems to be dependent on the participants having a common vision for their endeavour, trust, a transparent and fair decision-making process and a commitment to collective action and decision-making. The competence of the manager of such a scheme is of course also a deciding factor. Finally, the ability to deal with crises, to have a mechanism for supporting the members of the cooperative in difficult times is essential.
3) Niche markets are a very good option for smaller sized farms. This includes organic certification, region of origin labelling, and capitalizing on the growing trend for deliveries “fresh from the farm”. This trend has grown tremendously in recent years, as it is perceived that by buying directly from the farm, the consumer can know exactly how fresh the product is, and how it was farmed and harvested. This requires proximity to local markets of course and the ability to build and manage a distribution and collection system that can be complicated and expensive. The advantage of course is that by selling directly to the consumer, the farmer can eliminate the middle men and obtain a better price for the product. This is possible for very small farms as the logistics of harvesting small quantities at a time are difficult. Another option is to supply directly a fish retailer or distributor who has a larger product range and can supply his customers with “straight from the farm” fish as well as wild fish. Due to the recent spate of food scandals, this trend has been increasing for beef and poultry as well. Medium-size farms
Although the definition of a medium and large sized farm varies from country to country, it here meant to include farms with a production between approximately 500 and 2 000 tonnes. These farms encounter much the same problems as small farms with the added costs of hatcheries, management and sales and distribution costs. It is much more difficult for them to reduce their overheads or
136
minimum required capital investments but much of the financing available to smaller enterprises does not apply to them. Of course much of the same strategic options available to small farms are open to medium sized farms as well. Most of these farms have opted to try and build their own sales network but are often not able to compete with large companies in periods of fierce competition on prices.
Large-size farms
The trend in the industry has clearly been towards ever increasing concentration of production into large companies. There are currently four companies in the Mediterranean with productions between 20 000 and 30 000 tonnes of production each. These are vertically integrated with commercial hatcheries, packaging and processing facilities and feed mills. Some of them have expanded their activities across borders, owning farms or participating as shareholders or through joint ventures in farms in other countries.
The competitive advantages of size are obvious, as they are in any industry: better negotiating power for raw materials and supplies, the ability to obtain financing from the capital markets with more favourable terms than smaller companies, economies of scale for management structures and sales and distribution networks and in theory better negotiating power in the market.
The question of economies of scale in production in the Mediterranean aquaculture industry is not so clear however. In reality, the structure of the industry today with regards to siting and license size do not allow for economies of scale in production. In comparison with the salmon industry where the average site size is 5 000 tonnes, the average site size in the Mediterranean is 500–700 tonnes. This has in part to do with the species produced, the average size of the product and the fact that close to 75 percent of salmon is processed in some form. However, the automation and consolidation of production which would yield true economies of scale are most productive for sites with a much larger production in one place. Large companies in the European seabass and gilthead seabream industry are really a conglomeration of many, geographically dispersed, small farms/production sites. Economies of scale in agricultural production requires a high degree of automation, centralization of management and control systems, and perhaps most importantly a different sales strategy.
The problem of small holdings can be solved through changes in regulations regarding siting and licensing, the move to offshore facilities with the application of existing or developing offshore technology. The application of greater automation in feeding, larger cage sizes, minimizing handling at offshore sites, and the use of well boats for harvesting and packaging, either at sea or with automated packaging plants requires a shift to sales at a more industrial level: the ability to harvest and sell much larger quantities at a one time. Currently, a large company may sell 300–400 tonnes per week, but harvesting occurs much as it does in smaller companies: boats will harvest 20–30 tonnes at a time, often from geographically dispersed sites with the same cost duplicated for each 20 ton batch. They are then often transported to one or more central packaging and processing facilities where the sorting and fulfilling of orders takes place.
Large companies do not have different sales strategies or clients from most medium sized or even small companies and therefore do not take advantage of their size as far as sales are concerned. This is in great part due to 1) the nature of the product and 2) the traditional market for it.
1) European seabass and gilthead seabream is still mostly sold in portion size 300–500 grammes, whole and fresh. Although the market for processed and added-value products is the fastest growing segment in the seafood industry, there is tremendous competition from much cheaper, imported fillets, especially pangasius. The cost expectations of consumers have already been established by these species, even though they should not be direct competitors in terms of the nutritional, freshness and quality attributes of Mediterranean fish. That is not to say, however, that with reductions in the cost of production and strong promotional and informational campaigns, the market could not be successfully developed.
2) The traditional market for Mediterranean species is still in large part characterized by wholesalers and small retailers who often require the provision of both species in a range of sizes in their orders. The few large wholesalers and retail chains whose orders are more standardized and larger are the
137
subject of fierce competition from the industry’s large producers. This is not surprising since they are the clients who provide the most cost efficient orders for large producers. They are also however, the price setters. 9.6.3 Actual or potential trade barriers Within the EU there are harmonized regulations regarding health, quality control, environmental aspects and labelling of fisheries and aquaculture products. Regulation 2065/2001 lays down specific requirements regarding labelling. All products offered for retail sale in the EU must be properly labelled with the following information:
1. Species commercial name;
2. Production method used: “caught in…” for wild fish, “farmed” or “cultivated”, for aquaculture products;
3. Catch area must be listed: for products caught at sea a reference to areas (FAO zones), for products caught in freshwater a reference to the country of origin, for farmed products a reference to the country in which the product undergoes the final development stage. Quality standards:
While quality standards can be seen as non-tariff barriers to the EU, it is unreasonable to expect European consumers to have lower expectations for imported products that they have for European products. The establishment and respect of quality and hygiene standards are essential for the protection of all consumers whether in Europe or not. Health and environmental regulations:
The same principle of ensuring consumer protection applies to health regulations. Environmental standards can be stricter in some countries than others and the question of human welfare, i.e. economic development, vs. the protection of the environment and animal welfare is a complicated one. There is certainly an argument to be made that there is an order of priority when limited resources are available. The case of Vietnamese pangasius is a good one: the development of the industry has greatly contributed to alleviating crushing poverty in rural Vietnam and import barriers established in some developing countries can be seen as simply an excuse to protect local producers. However, it is also clear that development at the expense of the environment can only be short-term. Encouraging a level-playing field on a global level will benefit all producers and consumers in the long-run: allowing free trade while ensuring that strict norms on environmental protection, worker’s rights and animal welfare are adopted and respected. Labelling and nomenclature
Correct labelling and name use is a guarantee of consumer protection as it allows for traceability and protects against misrepresentation. The sale by retailers of defrosted products as fresh could pose health hazards which would only serve to hurt the industry in question, most often Vietnamese pangasius. Mislabelling is most often done by wholesalers and retailers, and not by producers, to add value to the product: selling defrosted products as fresh, selling farmed fish as wild, or misrepresenting the provenance and freshness of the fish. In the EU, the scientific name of the species is optional on the label but must at least be available on accompanying documents, such as the invoice. The commercial name must be on the approved list of the Member State in which the products are sold. Recent regulations on obligatory traceability requirements cannot be considered barriers to trade as, although they may pose some difficulty in implementation in the beginning, are really intended to protect both the consumer and the producer in the case of food scares.
138
Tariffs and subsidies
Tariffs and subsidies are two practices that are barriers to trade and can create unfair competitive advantages/disadvantages for producers. There are a number of import tariffs imposed by the EU on imports of aquaculture products from non-EU Mediterranean countries:
Tariffs on imports and offsetting export obligations of the kind imposed in Morocco and Tunisia have the effect of making the local industry non-competitive, in effect restricting access to a more profitable domestic market. These industries are doubly penalized as they have higher import costs of raw materials (juveniles and feed) and must compete in European markets where raw materials are readily available and cheaper. Subsidies in the EU encouraged the development of the industry and led to its tremendous expansion, most notably in Greece. However it can be argued that it distorted the industry, leading it to be production oriented and not market driven. The availability of “cheap and easy” money distorted the real costs of production establishing a less than rigorous mentality towards cost accounting and control. Direct sales subsidies of the kind available to the Turkish industry have encouraged farmers to declare their real production numbers but have created an unfair advantage in their exports markets allowing them in effect to sell at prices 45–55 cents (the size of the subsidy) lower than their counterparts in other countries.
9.6.4 Potential demand 2010–2015 In the preparation of different MedAquaMarket national country reports, it was asked to forecast demand for the period 2010–2015. The forecasts from different countries were very much tied to their current production levels. In the cases where the industry was relatively small with an undersupplied domestic market, there is optimism about the future prospects of production. In large producing countries which mainly compete in the large markets of the EU for sales, there appears to be consensus that production will probably be reduced in the coming years. This is due to the slow-down in demand and consumption experienced in 2008–2009 for seafood in general due to the economic crisis, the current over-supply of bass and bream, production reductions due to company closures or retrenchment and issues of available space and conflicts with other users such as tourism. There is also the perception that the loss of negotiating power vis-à-vis large retail chains, as well as competition, has pushed profit margins in the sector to an unsustainable level. Many countries predict a shift to more profitable species such as bluefin tuna and in some cases a steady decrease in the farming of bass and bream.
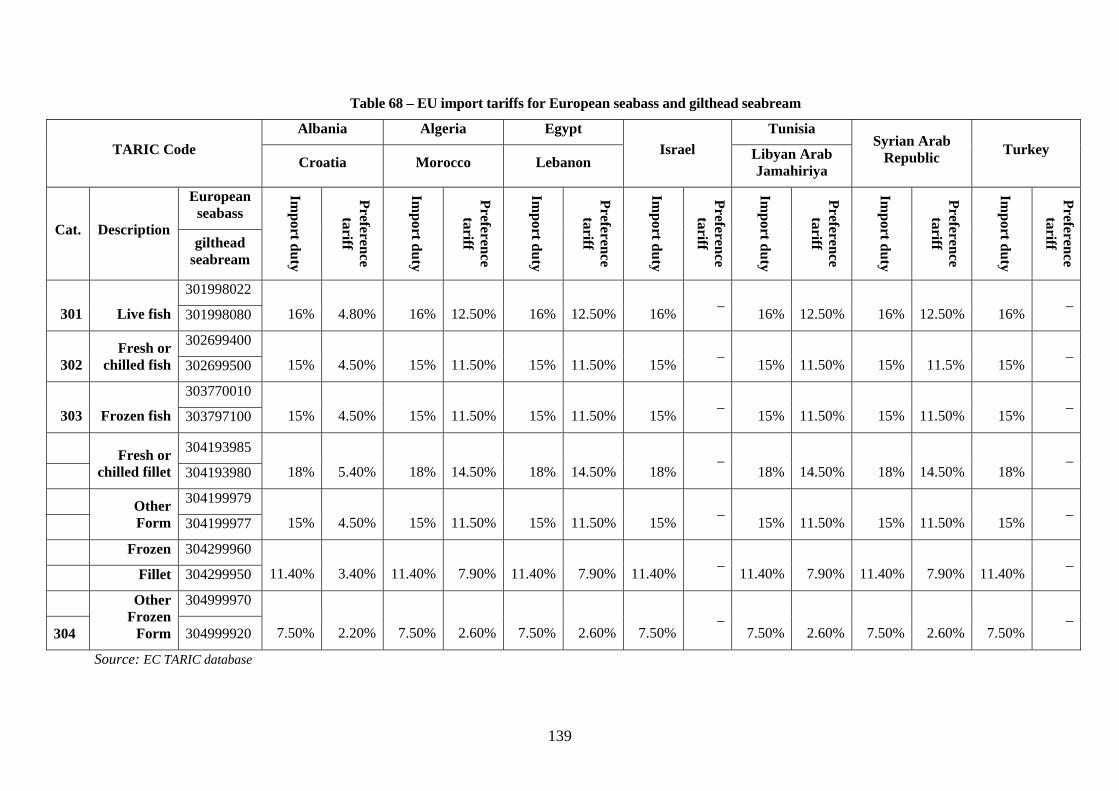
139
Table 68 – EU import tariffs for European seabass and gilthead seabream
Albania Algeria Egypt Tunisia TARIC Code
Croatia Morocco Lebanon Israel Libyan Arab
Jamahiriya
Syrian Arab Republic Turkey
European seabass
Cat. Description gilthead
seabream
Import duty
Preference tariff
Import duty
Preference tariff
Import duty
Preference tariff
Import duty
Preference tariff
Import duty
Preference tariff
Import duty
Preference tariff
Import duty
Preference tariff
301998022
301 Live fish 301998080 16% 4.80% 16% 12.50% 16% 12.50% 16% – 16% 12.50% 16% 12.50% 16% –
302699400
302 Fresh or
chilled fish 302699500 15% 4.50% 15% 11.50% 15% 11.50% 15% – 15% 11.50% 15% 11.5% 15% –
303770010
303 Frozen fish 303797100 15% 4.50% 15% 11.50% 15% 11.50% 15% – 15% 11.50% 15% 11.50% 15% –
304193985
Fresh or
chilled fillet 304193980 18% 5.40% 18% 14.50% 18% 14.50% 18%–
18% 14.50% 18% 14.50% 18% –
304199979
Other Form 304199977 15% 4.50% 15% 11.50% 15% 11.50% 15% – 15% 11.50% 15% 11.50% 15% –
Frozen 304299960
Fillet 304299950 11.40% 3.40% 11.40% 7.90% 11.40% 7.90% 11.40% – 11.40% 7.90% 11.40% 7.90% 11.40% –
304999970
304
Other Frozen
Form 304999920 7.50% 2.20% 7.50% 2.60% 7.50% 2.60% 7.50%–
7.50% 2.60% 7.50% 2.60% 7.50% –
Source: EC TARIC database
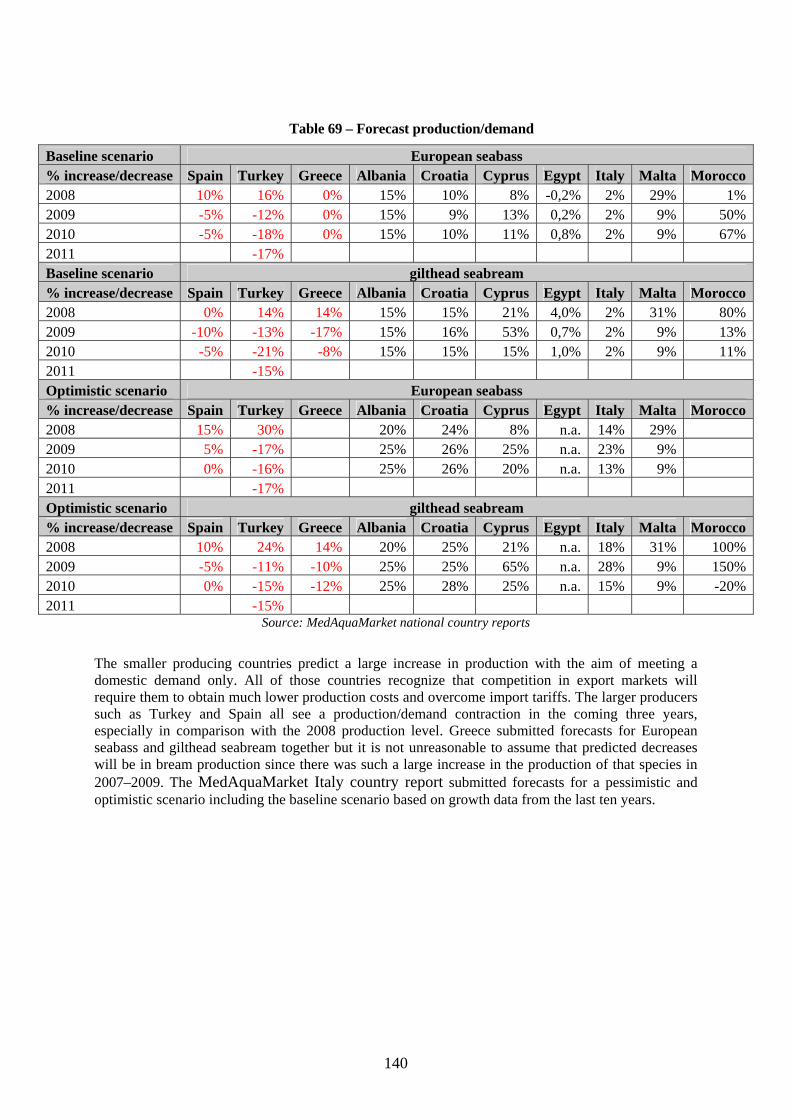
140
Table 69 – Forecast production/demand
Baseline scenario European seabass % increase/decrease Spain Turkey Greece Albania Croatia Cyprus Egypt Italy Malta Morocco2008 10% 16% 0% 15% 10% 8% -0,2% 2% 29% 1%2009 -5% -12% 0% 15% 9% 13% 0,2% 2% 9% 50%2010 -5% -18% 0% 15% 10% 11% 0,8% 2% 9% 67%2011 -17% Baseline scenario gilthead seabream % increase/decrease Spain Turkey Greece Albania Croatia Cyprus Egypt Italy Malta Morocco2008 0% 14% 14% 15% 15% 21% 4,0% 2% 31% 80%2009 -10% -13% -17% 15% 16% 53% 0,7% 2% 9% 13%2010 -5% -21% -8% 15% 15% 15% 1,0% 2% 9% 11%2011 -15% Optimistic scenario European seabass % increase/decrease Spain Turkey Greece Albania Croatia Cyprus Egypt Italy Malta Morocco2008 15% 30% 20% 24% 8% n.a. 14% 29%2009 5% -17% 25% 26% 25% n.a. 23% 9%2010 0% -16% 25% 26% 20% n.a. 13% 9%2011 -17% Optimistic scenario gilthead seabream % increase/decrease Spain Turkey Greece Albania Croatia Cyprus Egypt Italy Malta Morocco2008 10% 24% 14% 20% 25% 21% n.a. 18% 31% 100%2009 -5% -11% -10% 25% 25% 65% n.a. 28% 9% 150%2010 0% -15% -12% 25% 28% 25% n.a. 15% 9% -20%2011 -15%
Source: MedAquaMarket national country reports
The smaller producing countries predict a large increase in production with the aim of meeting a domestic demand only. All of those countries recognize that competition in export markets will require them to obtain much lower production costs and overcome import tariffs. The larger producers such as Turkey and Spain all see a production/demand contraction in the coming three years, especially in comparison with the 2008 production level. Greece submitted forecasts for European seabass and gilthead seabream together but it is not unreasonable to assume that predicted decreases will be in bream production since there was such a large increase in the production of that species in 2007–2009. The MedAquaMarket Italy country report submitted forecasts for a pessimistic and optimistic scenario including the baseline scenario based on growth data from the last ten years.
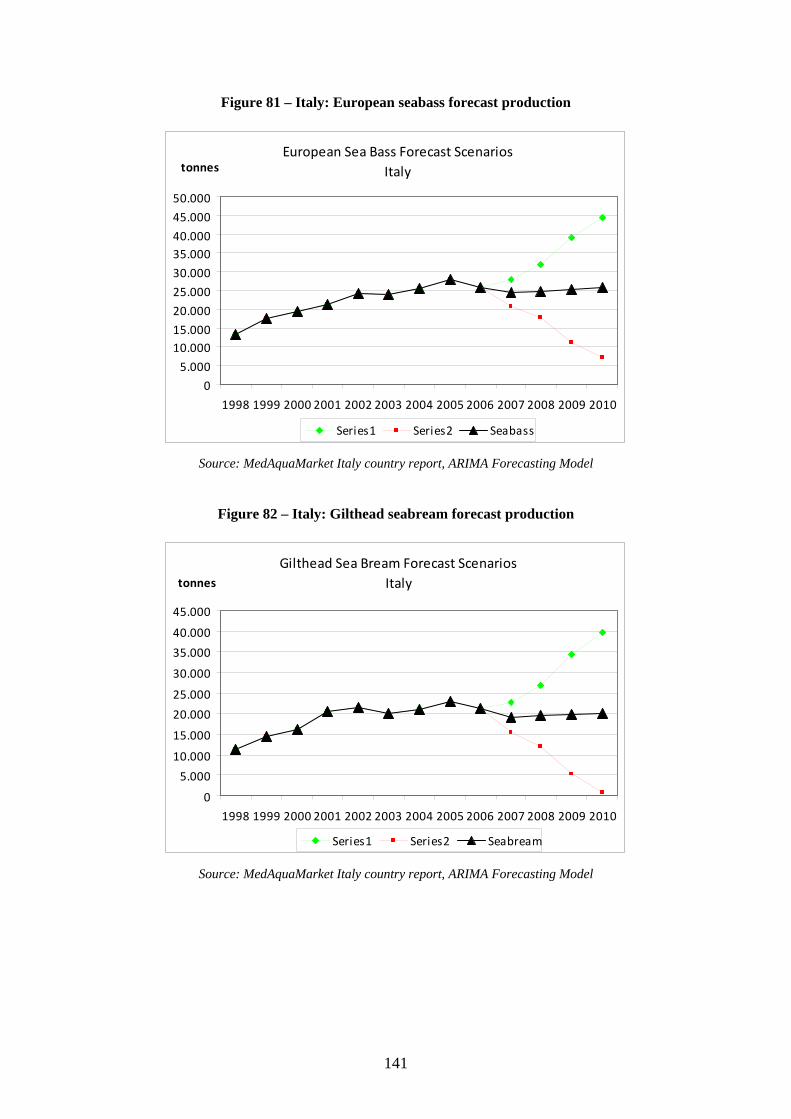
141
Figure 81 – Italy: European seabass forecast production
European Sea Bass Forecast ScenariosItaly
0
5.000
10.00015.000
20.000
25.000
30.000
35.00040.000
45.000
50.000
1998 1999 2000 2001 2002 2003 2004 2005 2006 2007 2008 2009 2010
Series1 Series2 Seabass
tonnes
Source: MedAquaMarket Italy country report, ARIMA Forecasting Model
Figure 82 – Italy: Gilthead seabream forecast production
Gilthead Sea Bream Forecast ScenariosItaly
0
5.000
10.000
15.000
20.000
25.000
30.000
35.000
40.000
45.000
1998 1999 2000 2001 2002 2003 2004 2005 2006 2007 2008 2009 2010
Series1 Series2 Seabream
tonnes
Source: MedAquaMarket Italy country report, ARIMA Forecasting Model
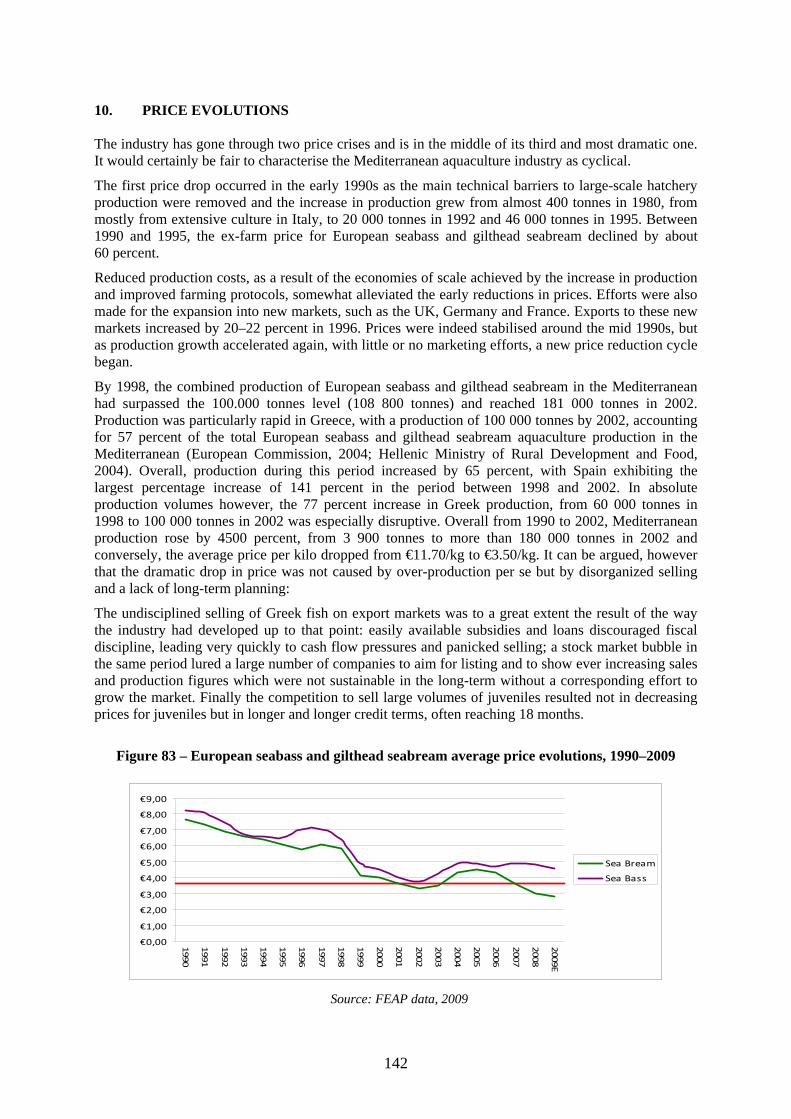
142
10. PRICE EVOLUTIONS The industry has gone through two price crises and is in the middle of its third and most dramatic one. It would certainly be fair to characterise the Mediterranean aquaculture industry as cyclical.
The first price drop occurred in the early 1990s as the main technical barriers to large-scale hatchery production were removed and the increase in production grew from almost 400 tonnes in 1980, from mostly from extensive culture in Italy, to 20 000 tonnes in 1992 and 46 000 tonnes in 1995. Between 1990 and 1995, the ex-farm price for European seabass and gilthead seabream declined by about 60 percent.
Reduced production costs, as a result of the economies of scale achieved by the increase in production and improved farming protocols, somewhat alleviated the early reductions in prices. Efforts were also made for the expansion into new markets, such as the UK, Germany and France. Exports to these new markets increased by 20–22 percent in 1996. Prices were indeed stabilised around the mid 1990s, but as production growth accelerated again, with little or no marketing efforts, a new price reduction cycle began.
By 1998, the combined production of European seabass and gilthead seabream in the Mediterranean had surpassed the 100.000 tonnes level (108 800 tonnes) and reached 181 000 tonnes in 2002. Production was particularly rapid in Greece, with a production of 100 000 tonnes by 2002, accounting for 57 percent of the total European seabass and gilthead seabream aquaculture production in the Mediterranean (European Commission, 2004; Hellenic Ministry of Rural Development and Food, 2004). Overall, production during this period increased by 65 percent, with Spain exhibiting the largest percentage increase of 141 percent in the period between 1998 and 2002. In absolute production volumes however, the 77 percent increase in Greek production, from 60 000 tonnes in 1998 to 100 000 tonnes in 2002 was especially disruptive. Overall from 1990 to 2002, Mediterranean production rose by 4500 percent, from 3 900 tonnes to more than 180 000 tonnes in 2002 and conversely, the average price per kilo dropped from €11.70/kg to €3.50/kg. It can be argued, however that the dramatic drop in price was not caused by over-production per se but by disorganized selling and a lack of long-term planning:
The undisciplined selling of Greek fish on export markets was to a great extent the result of the way the industry had developed up to that point: easily available subsidies and loans discouraged fiscal discipline, leading very quickly to cash flow pressures and panicked selling; a stock market bubble in the same period lured a large number of companies to aim for listing and to show ever increasing sales and production figures which were not sustainable in the long-term without a corresponding effort to grow the market. Finally the competition to sell large volumes of juveniles resulted not in decreasing prices for juveniles but in longer and longer credit terms, often reaching 18 months.
Figure 83 – European seabass and gilthead seabream average price evolutions, 1990–2009
€0,00
€1,00
€2,00
€3,00
€4,00
€5,00
€6,00
€7,00
€8,00
€9,00
1990
1991
1992
1993
1994
1995
1996
1997
1998
1999
2000
2001
2002
2003
2004
2005
2006
2007
2008
2009E
Sea Bream
Sea Bass
Source: FEAP data, 2009
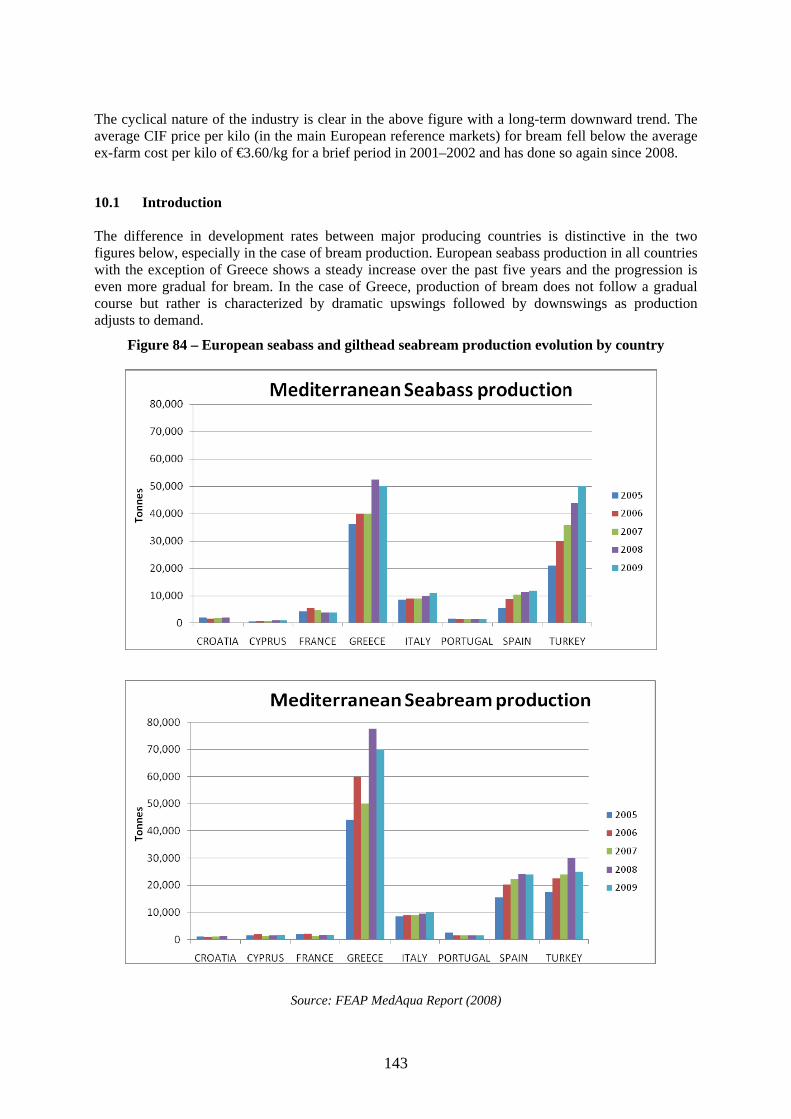
143
The cyclical nature of the industry is clear in the above figure with a long-term downward trend. The average CIF price per kilo (in the main European reference markets) for bream fell below the average ex-farm cost per kilo of €3.60/kg for a brief period in 2001–2002 and has done so again since 2008.
10.1 Introduction The difference in development rates between major producing countries is distinctive in the two figures below, especially in the case of bream production. European seabass production in all countries with the exception of Greece shows a steady increase over the past five years and the progression is even more gradual for bream. In the case of Greece, production of bream does not follow a gradual course but rather is characterized by dramatic upswings followed by downswings as production adjusts to demand.
Figure 84 – European seabass and gilthead seabream production evolution by country
Source: FEAP MedAqua Report (2008)
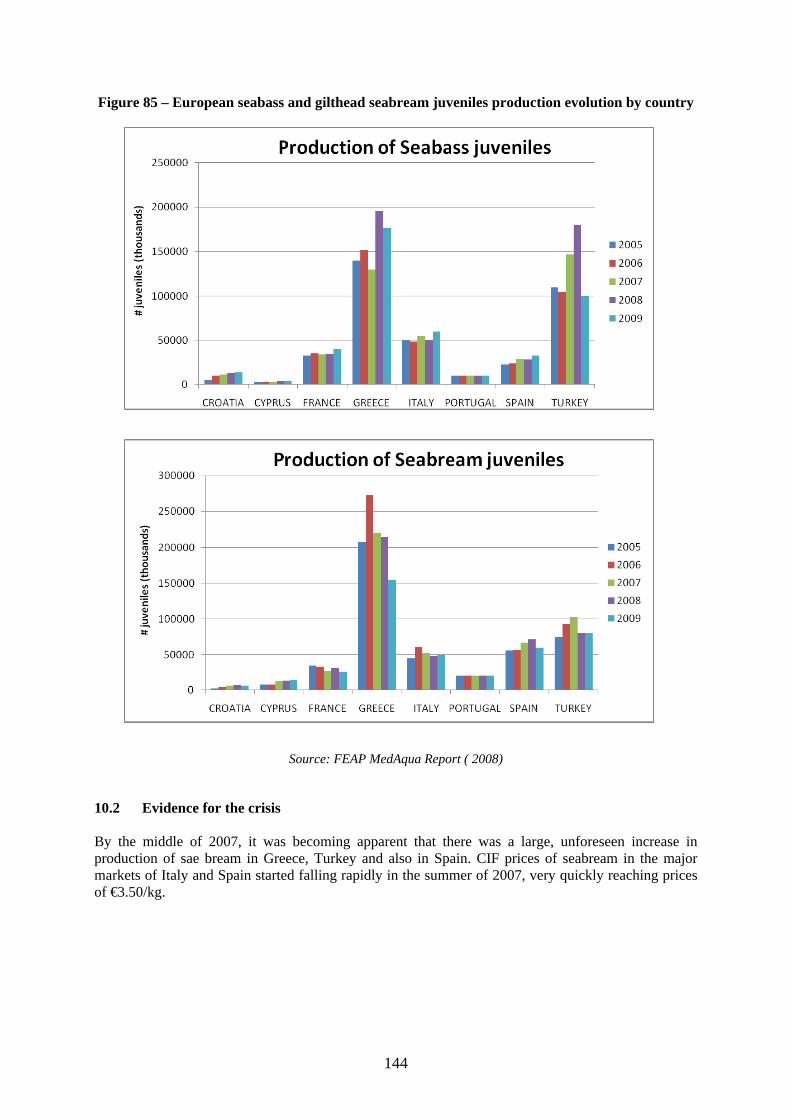
144
Figure 85 – European seabass and gilthead seabream juveniles production evolution by country
Source: FEAP MedAqua Report ( 2008)
10.2 Evidence for the crisis By the middle of 2007, it was becoming apparent that there was a large, unforeseen increase in production of sae bream in Greece, Turkey and also in Spain. CIF prices of seabream in the major markets of Italy and Spain started falling rapidly in the summer of 2007, very quickly reaching prices of €3.50/kg.
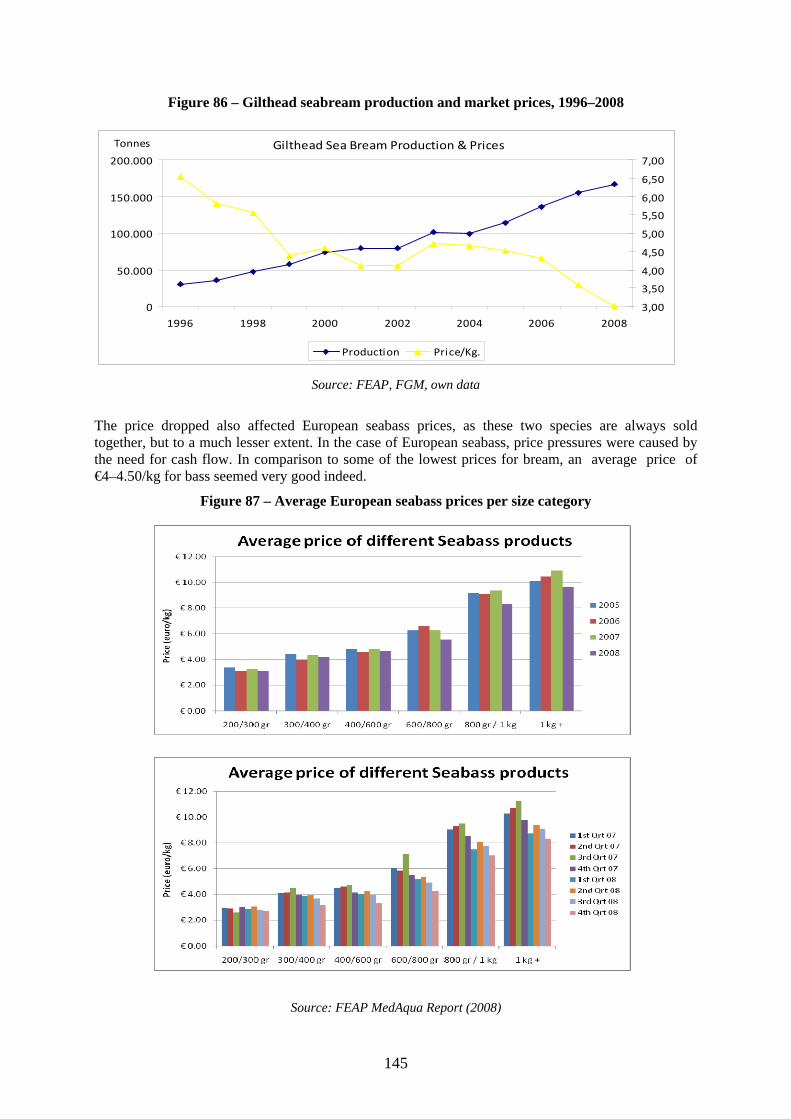
145
Figure 86 – Gilthead seabream production and market prices, 1996–2008
Gilthead Sea Bream Production & Prices
0
50.000
100.000
150.000
200.000
1996 1998 2000 2002 2004 2006 2008
3,00
3,50
4,00
4,50
5,00
5,50
6,00
6,50
7,00
Production Price/Kg.
Tonnes
Source: FEAP, FGM, own data
The price dropped also affected European seabass prices, as these two species are always sold together, but to a much lesser extent. In the case of European seabass, price pressures were caused by the need for cash flow. In comparison to some of the lowest prices for bream, an average price of €4–4.50/kg for bass seemed very good indeed.
Figure 87 – Average European seabass prices per size category
Source: FEAP MedAqua Report (2008)
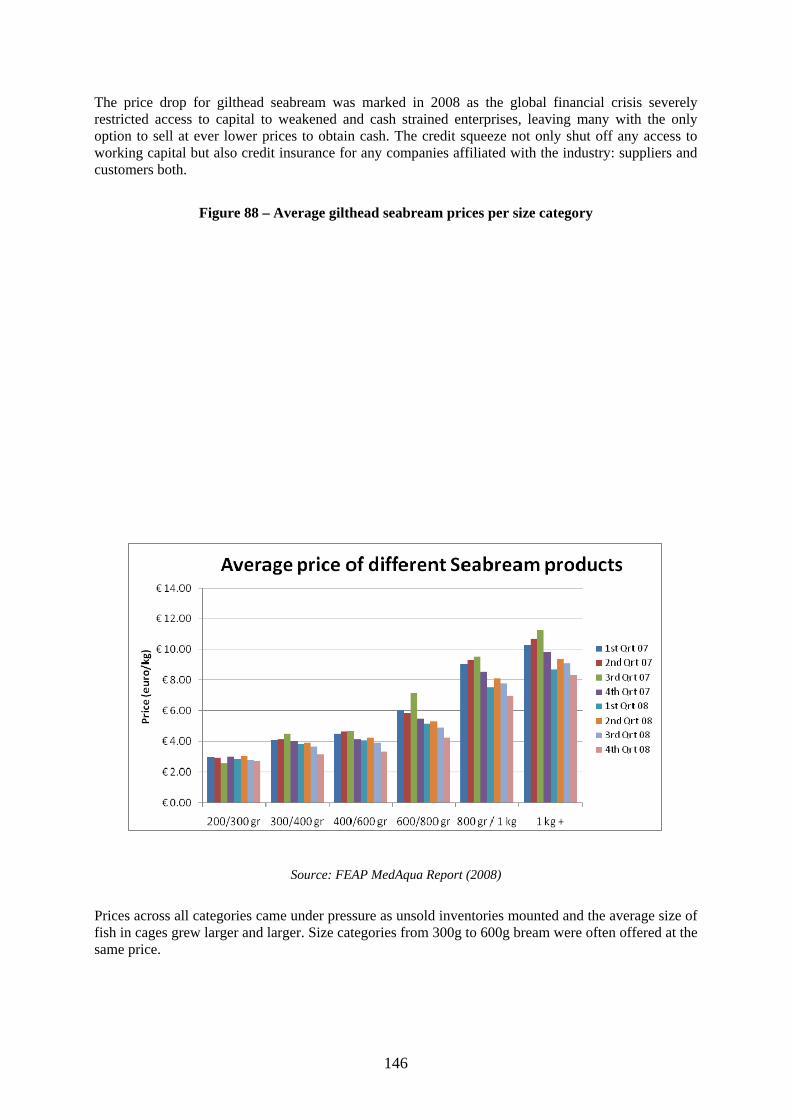
146
The price drop for gilthead seabream was marked in 2008 as the global financial crisis severely restricted access to capital to weakened and cash strained enterprises, leaving many with the only option to sell at ever lower prices to obtain cash. The credit squeeze not only shut off any access to working capital but also credit insurance for any companies affiliated with the industry: suppliers and customers both.
Figure 88 – Average gilthead seabream prices per size category
Source: FEAP MedAqua Report (2008)
Prices across all categories came under pressure as unsold inventories mounted and the average size of fish in cages grew larger and larger. Size categories from 300g to 600g bream were often offered at the same price.
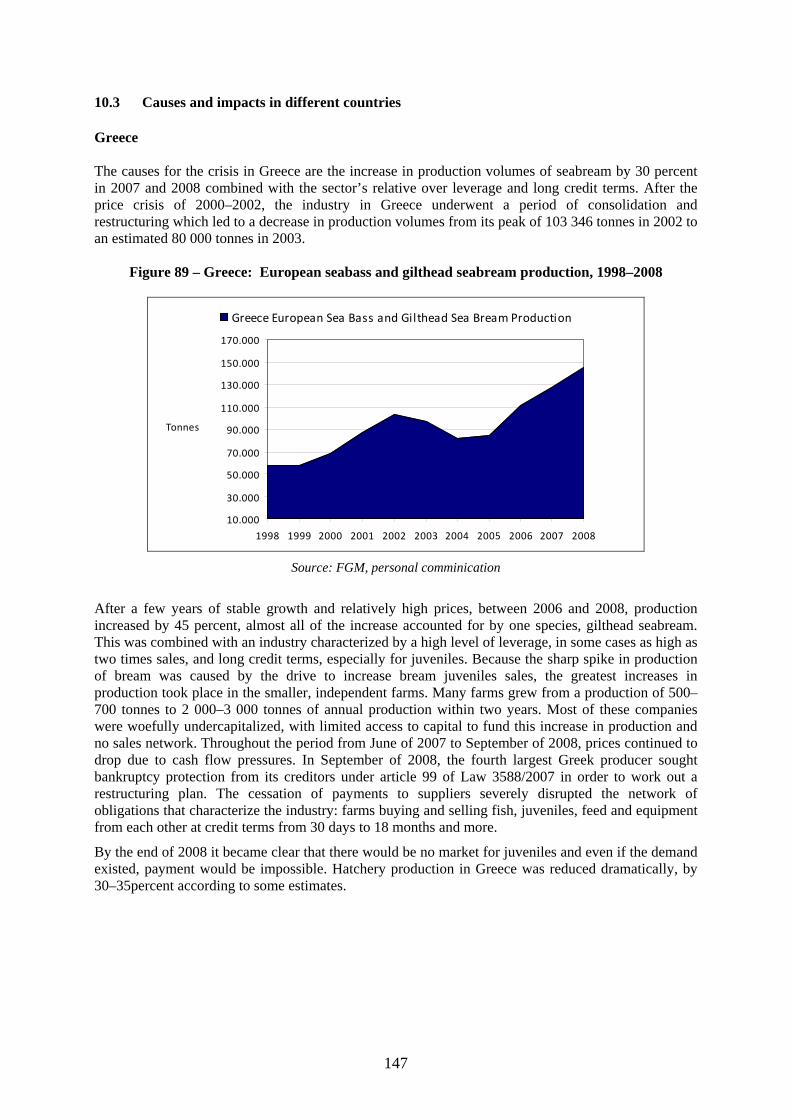
147
10.3 Causes and impacts in different countries Greece The causes for the crisis in Greece are the increase in production volumes of seabream by 30 percent in 2007 and 2008 combined with the sector’s relative over leverage and long credit terms. After the price crisis of 2000–2002, the industry in Greece underwent a period of consolidation and restructuring which led to a decrease in production volumes from its peak of 103 346 tonnes in 2002 to an estimated 80 000 tonnes in 2003.
Figure 89 – Greece: European seabass and gilthead seabream production, 1998–2008
10.000
30.000
50.000
70.000
90.000
110.000
130.000
150.000
170.000
1998 1999 2000 2001 2002 2003 2004 2005 2006 2007 2008
Greece European Sea Bass and Gilthead Sea Bream Production
Tonnes
Source: FGM, personal comminication
After a few years of stable growth and relatively high prices, between 2006 and 2008, production increased by 45 percent, almost all of the increase accounted for by one species, gilthead seabream. This was combined with an industry characterized by a high level of leverage, in some cases as high as two times sales, and long credit terms, especially for juveniles. Because the sharp spike in production of bream was caused by the drive to increase bream juveniles sales, the greatest increases in production took place in the smaller, independent farms. Many farms grew from a production of 500–700 tonnes to 2 000–3 000 tonnes of annual production within two years. Most of these companies were woefully undercapitalized, with limited access to capital to fund this increase in production and no sales network. Throughout the period from June of 2007 to September of 2008, prices continued to drop due to cash flow pressures. In September of 2008, the fourth largest Greek producer sought bankruptcy protection from its creditors under article 99 of Law 3588/2007 in order to work out a restructuring plan. The cessation of payments to suppliers severely disrupted the network of obligations that characterize the industry: farms buying and selling fish, juveniles, feed and equipment from each other at credit terms from 30 days to 18 months and more.
By the end of 2008 it became clear that there would be no market for juveniles and even if the demand existed, payment would be impossible. Hatchery production in Greece was reduced dramatically, by 30–35percent according to some estimates.
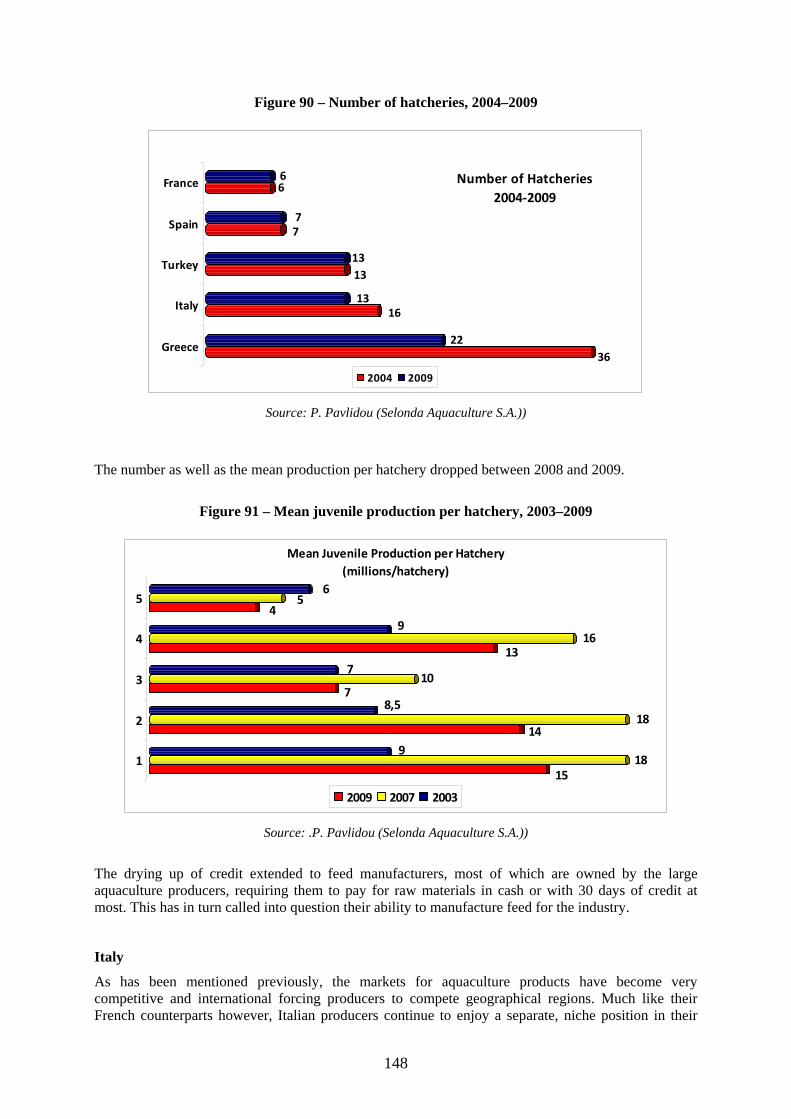
148
Figure 90 – Number of hatcheries, 2004–2009
3622
1613
1313
77
66
Greece
Italy
Turkey
Spain
France Number of Hatcheries2004‐2009
2004 2009
Source: P. Pavlidou (Selonda Aquaculture S.A.))
The number as well as the mean production per hatchery dropped between 2008 and 2009.
Figure 91 – Mean juvenile production per hatchery, 2003–2009
1518
914
188,5
710
713
169
45
6
1
2
3
4
5
Mean Juvenile Production per Hatchery(millions/hatchery)
2009 2007 2003
Source: .P. Pavlidou (Selonda Aquaculture S.A.))
The drying up of credit extended to feed manufacturers, most of which are owned by the large aquaculture producers, requiring them to pay for raw materials in cash or with 30 days of credit at most. This has in turn called into question their ability to manufacture feed for the industry.
Italy
As has been mentioned previously, the markets for aquaculture products have become very competitive and international forcing producers to compete geographical regions. Much like their French counterparts however, Italian producers continue to enjoy a separate, niche position in their
149
local markets and a high level of differentiation over their Greek and Turkish counterparts. Freshness and the ability to do same-day deliveries as well as size, quality and species differentiation have allowed most Italian producers to maintain a price premium in their market. This is not to say that prices were not pushed downwards for Italian producers as well, but most Italian companies have not been affected to the same extent as their Spanish counterparts and there have been few reported cases of company closures as a result. Spain
The Spanish production industry has been adversely affected by the price crisis in that it has forced an important restructuring of the industry. Whereas historically, Spanish production was able to obtain a National premium over imports mainly from Greece and Turkey, this effectively disappeared by the end of 2008 and 2009. Imports from Greece and Turkey reached an all time high in 2008 with prices reaching a historical low of €3.00/kg for bream. In 2008 more than 6 companies have either closed or been absorbed by other companies and a production decrease of 30 percent is projected for 2009.
In addition to the industry’s price crisis, the global financial crisis has made itself felt in the Spanish market most dramatically with an estimated 50 percent reduction in the overall consumption of seafood in the first half of 2009. This has been translated into a 30–40 percent decrease in the consumption of European seabass and gilthead seabream in particular.
Turkey
The effect of the price crisis in gilthead seabream has affected Turkey aquaculture production in a disproportionate way as for the first time in 2008, Turkey increased its aquaculture production of gitlhead seabream relative to European seabass from 42.56 percent in 2005 to 53 percent in 2008. This was caused in large part by the entry into the Turkish industry of Greek farms whose production tends to be oriented to the production of gilthead seabream. This was compounded of course by the global financial crisis which led to the drying up of capital to the major companies as well as the 2006 decision by the Ministry of the Environment to move most of the Turkish aquaculture industry offshore. It seems that small farms will have difficulty continuing their operations as most do not have the financial ability and required size to move and operate offshore installations unless they can do so jointly with other farms and with relocation subsidies. The larger companies are better positioned to do so but have been seriously weakened by the industry’s price crisis, the global financial crisis and the fact that many are as overleveraged as their Greek counterparts. France
The French producers are in much the same situation as the Italian producers, but appear to be somewhat more vulnerable to competition from Greece and Turkey aquaculture producers despite a preference for the National production. Most companies had serious financial problems and at least one has declared bankruptcy. It is also important to note that the French juvenile producers export close to 70 percent of their production and have had to address the double problem of a reduced demand and greater uncertainty as to the ability of their customers to pay them. 10.4 Was the price crisis caused by over production? The consumption of seafood products has been continuously increasing over the past twenty years. Landings from capture fisheries are decreasing and the main markets of the European Community remain dramatically in deficit as to seafood production. Although the price for gilthead seabream was reduced dramatically, the estimated 30 percent increase in production was absorbed by the markets without this price drop being passed on to the consumer in its entirety.
Although it is clear that there was a jump in the production of a single species in a very short time period, the full crisis was caused in the short term by the economic fragility of the companies in the sector and in the long term by the lack of production data for adequate planning as well as any
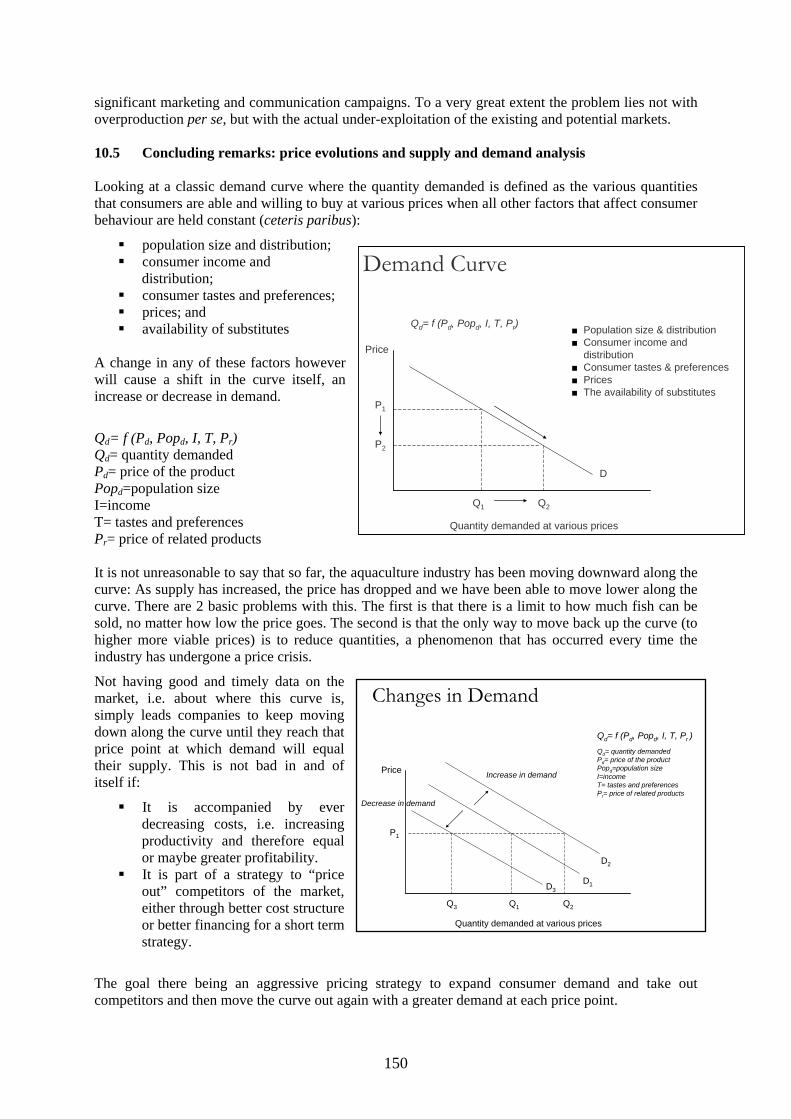
150
significant marketing and communication campaigns. To a very great extent the problem lies not with overproduction per se, but with the actual under-exploitation of the existing and potential markets. 10.5 Concluding remarks: price evolutions and supply and demand analysis Looking at a classic demand curve where the quantity demanded is defined as the various quantities that consumers are able and willing to buy at various prices when all other factors that affect consumer behaviour are held constant (ceteris paribus):
population size and distribution; consumer income and
distribution; consumer tastes and preferences; prices; and availability of substitutes
A change in any of these factors however will cause a shift in the curve itself, an increase or decrease in demand.
Qd= f (Pd, Popd, I, T, Pr) Qd= quantity demanded Pd= price of the product Popd=population size I=income T= tastes and preferences Pr= price of related products It is not unreasonable to say that so far, the aquaculture industry has been moving downward along the curve: As supply has increased, the price has dropped and we have been able to move lower along the curve. There are 2 basic problems with this. The first is that there is a limit to how much fish can be sold, no matter how low the price goes. The second is that the only way to move back up the curve (to higher more viable prices) is to reduce quantities, a phenomenon that has occurred every time the industry has undergone a price crisis.
Not having good and timely data on the market, i.e. about where this curve is, simply leads companies to keep moving down along the curve until they reach that price point at which demand will equal their supply. This is not bad in and of itself if:
It is accompanied by ever decreasing costs, i.e. increasing productivity and therefore equal or maybe greater profitability.
It is part of a strategy to “price out” competitors of the market, either through better cost structure or better financing for a short term strategy.
The goal there being an aggressive pricing strategy to expand consumer demand and take out competitors and then move the curve out again with a greater demand at each price point.
Demand Curve
Qd= f (Pd, Popd, I, T, Pr)
D
Price
Quantity demanded at various prices
P1
P2
Q1 Q2
■ Population size & distribution■ Consumer income and
distribution■ Consumer tastes & preferences■ Prices■ The availability of substitutes
Changes in Demand
Qd= f (Pd, Popd, I, T, Pr )
Price
Quantity demanded at various prices
P1
Q1 Q2Q3
D1D3
Increase in demand
Decrease in demand
Qd= quantity demandedPd= price of the productPopd=population sizeI=incomeT= tastes and preferencesPr= price of related products
D2
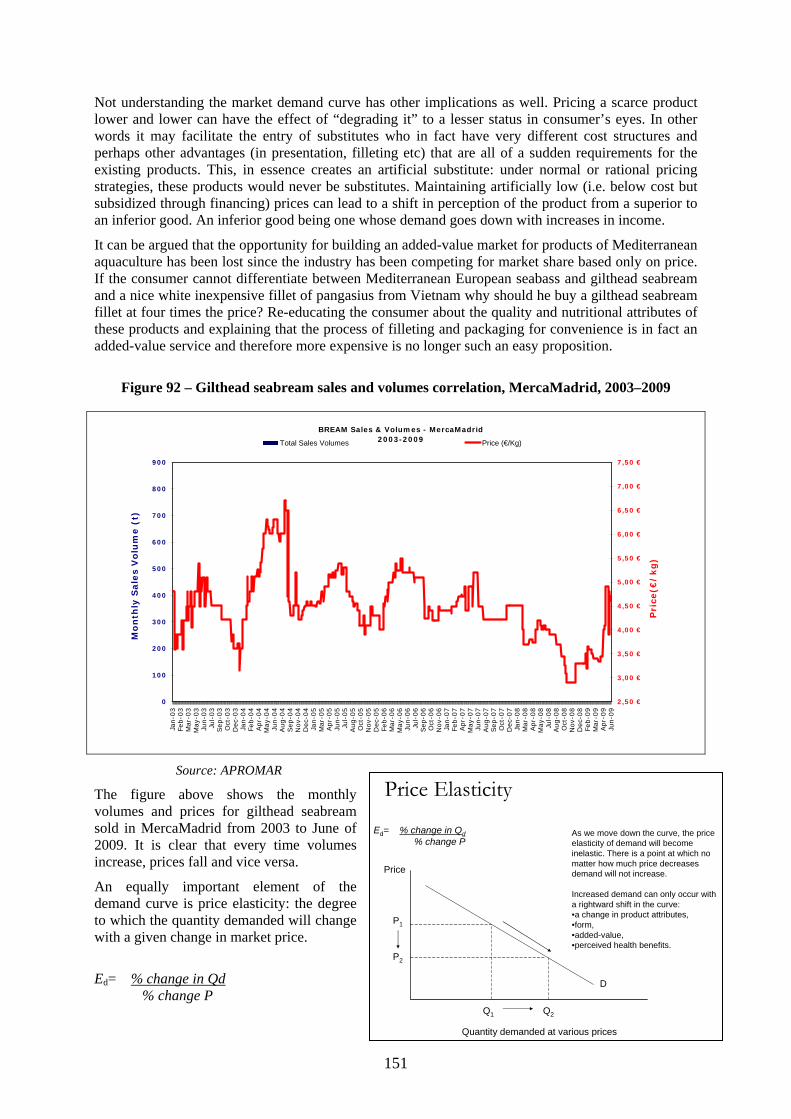
151
Not understanding the market demand curve has other implications as well. Pricing a scarce product lower and lower can have the effect of “degrading it” to a lesser status in consumer’s eyes. In other words it may facilitate the entry of substitutes who in fact have very different cost structures and perhaps other advantages (in presentation, filleting etc) that are all of a sudden requirements for the existing products. This, in essence creates an artificial substitute: under normal or rational pricing strategies, these products would never be substitutes. Maintaining artificially low (i.e. below cost but subsidized through financing) prices can lead to a shift in perception of the product from a superior to an inferior good. An inferior good being one whose demand goes down with increases in income.
It can be argued that the opportunity for building an added-value market for products of Mediterranean aquaculture has been lost since the industry has been competing for market share based only on price. If the consumer cannot differentiate between Mediterranean European seabass and gilthead seabream and a nice white inexpensive fillet of pangasius from Vietnam why should he buy a gilthead seabream fillet at four times the price? Re-educating the consumer about the quality and nutritional attributes of these products and explaining that the process of filleting and packaging for convenience is in fact an added-value service and therefore more expensive is no longer such an easy proposition.
Figure 92 – Gilthead seabream sales and volumes correlation, MercaMadrid, 2003–2009
BREAM Sales & Volumes - MercaMadrid2003-2009
0
100
200
300
400
500
600
700
800
900
Jan-0
3Fe
b-0
3M
ar-0
3M
ay-0
3Ju
n-0
3Ju
l-03
Sep
-03
Oct
-03
Dec
-03
Jan-0
4Fe
b-0
4Apr-
04
May
-04
Jun-0
4Aug-0
4Sep
-04
Nov-
04
Dec
-04
Jan-0
5M
ar-0
5Apr-
05
Jun-0
5Ju
l-05
Aug-0
5O
ct-0
5N
ov-
05
Dec
-05
Feb-0
6M
ar-0
6M
ay-0
6Ju
n-0
6Ju
l-06
Sep
-06
Oct
-06
Nov-
06
Jan-0
7Fe
b-0
7Apr-
07
May
-07
Jun-0
7Aug-0
7Sep
-07
Oct
-07
Dec
-07
Jan-0
8M
ar-0
8Apr-
08
May
-08
Jul-
08
Aug-0
8O
ct-0
8N
ov-
08
Dec
-08
Feb-0
9M
ar-0
9Apr-
09
Jun-0
9
Mo
nth
ly S
ale
s V
olu
me (
t)
2,50 €
3,00 €
3,50 €
4,00 €
4,50 €
5,00 €
5,50 €
6,00 €
6,50 €
7,00 €
7,50 €
Pri
ce(€
/kg
)
Total Sales Volumes Price (€/Kg)
Source: APROMAR
The figure above shows the monthly volumes and prices for gilthead seabream sold in MercaMadrid from 2003 to June of 2009. It is clear that every time volumes increase, prices fall and vice versa.
An equally important element of the demand curve is price elasticity: the degree to which the quantity demanded will change with a given change in market price.
Ed= % change in Qd % change P
Price Elasticity
D
Price
Quantity demanded at various prices
P1
P2
Q1 Q2
Ed= % change in Qd% change P
As we move down the curve, the price elasticity of demand will become inelastic. There is a point at which no matter how much price decreases demand will not increase.
Increased demand can only occur with a rightward shift in the curve: •a change in product attributes, •form, •added-value, •perceived health benefits.
152
At the high end of the demand curve, with high prices and lower quantities, price elasticity is greater and becomes more inelastic as prices decrease and quantity demanded increases. In other words, at high prices the quantity demanded is very responsive to price changes. If prices go up and are too high, demand will shift to a substitute product. Conversely if prices go down somewhat, then the percentage change in quantity demanded will be greater than the percentage change in price.
What happens as we move down the curve? At the lower end of the curve, for a normal good, the price elasticity of demand will become inelastic: a decrease in price will result in a smaller proportionate increase in quantity demanded. There is a point at which no matter how much price decreases demand will not increase. Increased demand can only occur with a rightward shift in the curve: a change in product attributes, form, added-value, or perceived health benefits.
There is one more aspect of aquaculture that is useful to examine under classic economic market behaviour terms: elasticity of supply. Because the Mediterranean aquaculture industry is characterized by relatively high fixed costs and a long production cycle supply elasticity for the industry is relatively inelastic. The ability to “warehouse” products and therefore respond to changes in price by reducing supply, is an essential component to smoothing out the cyclicality of the markets. Due to size and space limitations warehousing in live form is a limited option but developing product forms which can be more easily stored (frozen, filleted etc…) or sold in a different market (geographical or different market segment) should allow for greater supply elasticity.
11. SWOT ANALYSES (Strengths, Weaknesses, Opportunities and Threats)
Because of the differences in development levels of the industry in different countries as well as their inclusion or not in the EU it is appropriate to differentiate SWOT analyses for the industry as a whole as well as for the category of countries in the EU and out. The analysis below includes issues that are applicable to all countries in the GFCM area. It is the result of a compilation from the various national country reports submitted as well as a discussion among participants in the Meeting of the CAQ Working Group on Marketing entitled “Development of a Strategy for Marketing and Promotion of Mediterranean Aquaculture” held in Tangier, Morocco, from 26 to 27 October 2009. A summary of this report was presented and discussed with the participants of the meeting as well as the SWOT analysis. Participants included representatives from the industry, the public sector and the FAO (See Appendix IV).
Strengths
availability of suitable areas for aquaculture development; favourable environmental conditions; know-how as to basic technical methods; access to high-level research in national aquaculture research centres and institutes in
the Mediterranean; proximity to major international markets (EU countries); high rate of product intrusion to large retailers (supermarkets in EU countries); acceptance of the industry’s products in the catering sector (EU countries); controlled production process with the ability to provide uniform sizes and quantities
throughout the year; quality control and quality assurance; assurance of food safety and controls; uniform quality of aquaculture products; high level of per capita consumption of fish in the major markets (EU countries); general perception of fish as a healthy food; ongoing research for the production of new species; and innovative sector.
153
Weaknesses
lack of cooperation between producers and research centres/institutes; lack of cooperation amongst producers for promotional activities; low level of collective action; development based on production oriented management; actual production volumes higher than officially claimed (not allowing for a pragmatic
evaluation of the industry) in most countries; unregulated production and trade; inefficient mechanisms to control product supply and price reductions; relatively small number of markets (and segments) targeted; fragmentation of the commercialization agents; low level of species diversification; low level of product type differentiation; delicate (perishable) nature of products; lack of market and consumer information for domestic and foreign market markets; lack of efficient marketing management strategies; overall lack of a strategic plan for the sector’s development; unsystematic and non-coordinated R&D efforts for the commercial exploitation of more
species by the producers; big difference between the first sale price and the final price to consumers; small number of certified products (specific labels, geographic denominations, etc); lack of a unified and consistent National policy for aquaculture; onerous bureaucracy and often complicated and lengthy licensing procedure; unclear, overlapping and decentralized legislation; competition for space with other coastal users; no organized spatial planning of coastal zones; onerous environmental regulation often with little scientific validation; lack of comprehensive environmental data; lack of communication between stakeholders, industry and public institutions; not enough stakeholder/industry consultation and participation during decision-making
processes; and lack of management and production planning in smaller companies.
Opportunities
State financial support; development of various quality certification and labelling schemes; globalization of the markets (closer to global customer); improvements in transport logistics; wider acceptance of “cultured” seafood; increasing per capita consumption of seafood; increasing demand for products of aquaculture in domestic and international markets; emergence of high-performance large-scale distributors and retailers; increasing share of large retailers in seafood trade; increasing consumption of seafood in urban areas (largely-supplied by large retailers); stimulation of purchase and consumption through carefully planned marketing actions; promotability of the “Mediterranean diet” to which seafood -mainly in its fresh form- is
a major constituent; volumes of capture fisheries landings stabilised or on decline; good perspectives for the diversification of aquaculture species; a clear priority for improving the quality of the aquaculture products; appropriate integration in the natural environment, opening the way for making
aquaculture a sustainable activity;
154
internationalization of companies and their increase of competitiveness; development of new commercial presentations (new product forms) and increasing
added-value through processing; development of new technologies for the production of new species; development of new offshore and recirculation technologies; identification of new markets (Middle East, USA and Asia); strengthening of the mechanisms for improving the construction of prices; use of collective actions to regulate supply; development of sustainable aquaculture; and implementation of environmental monitoring and protection systems.
Threats
globalization of the markets (increased domestic and international competition); competition from other type of “protein” food products; inability to expand and to exploit new markets; directly and/or indirectly related food “scares”; negative publicity by mass media (bad press); strong negative perceptions towards fish (mainly related to preparation and cooking); oversupply of the domestic and international markets and price crashes; cyclicality of the industry; low prices of aquaculture products. Further compression of prices and profit margins; further concentration of demand by large distributors and retailers; failure of company debt-refinancing; too long waiting periods for obtaining licenses, authorizations and concessions; low profitability that hinders the investment in R&D; expensive taxes on the use harbours, water, etc.; uncertainty on the fulfilment of all the new environmental requisites; increasing fish health risks; disconnection between the price paid by consumers and first sale prices; high cost of environmental monitoring and protection systems; decreasing supply (Increasing competition for the supply) of fish meal and fish oil; and lack of appropriate and cost effective replacements for fish meal and fish oil.
12. CONCLUSIONS The information gathered , the results of the different MedAquaMarket national report as well as the quantitative and qualitative analysis and assessment of the Mediterranean finfish marine aquaculture market and production are useful in formulating a better understanding of the present situation with particular attention to the market. Furthermore, continued exchanges of information and point of views with the main stakeholders, in particular within the Mediterranean industry, are essential in the formulation of a sustainable strategy for the Mediterranean aquaculture products and market. Some conclusions about the basic aspects of the industry can be made based on the National Country Reports. It is a dynamic industry with strong demand spanning a period of almost thirty years and with the potential for continued steady growth in the future based on population growth, growing per capita seafood consumption, changes in purchasing power and a growing understanding of the health benefits of greater fish consumption. Like many commodity products, however, the industry is characterized by a strong cyclicality with uneven periods of production growth and retrenchment. Stabilizing measures such as the provision of timely production and market data, market studies in order to better understand the demand potential of consuming markets and the promotion tools to improve the image of Mediterranean aquaculture products are essential to help smooth out the sharp boom and bust cycles of the industry.
155
The future of aquaculture growth in the Mediterranean is greatly dependent upon the resolution of some problems common to all Mediterranean countries such as:
Competition for space. The nature of the Mediterranean is such that aquaculture must compete with other users of a relatively limited coastline. Although the development of tourism takes precedence in most countries, it is important to recognize that in contrast with tourism, aquaculture can provide full-time employment, represents a less permanent mark on the physical environment. Most importantly the two activities are not mutually exclusive. The establishment of maritime spatial planning which take into account the development priorities of each region and country and have as a priority the proper management and protection of the physical environment is essential to reducing conflicts among users of the coastline.
Simplification of the licensing procedure. Most countries have expressed a desire to develop aquaculture as a viable industry but the often complicated and long licensing procedure inhibits investment. The most careful and well designed business plan can fail if the licensing procedures result in long delays and additional costs.
Simplification of legislation. Legislation for an aquaculture holding in most countries can involve a number of different ministries, departments and authorities with no clear hierarchy or responsibility. Most countries expressed the need for a specialized “one-stop shop” for all issues pertaining to the aquaculture activity.
Coherence between responsibilities of the national, regional and local authorities. There are often conflicting responsibilities and priorities between national, regional and local authorities and in the case of European Union countries, EU regulations.
Improving the industry’s competitiveness and productivity. Measures such as the provision of timely information on production and the markets, research and development in improving the technical aspects of production and education and training for fish farmers are all measures which can help the industry become more competitive and productive.
Competition with imports. The issue of competition with imports was mentioned both by EU countries when referring to third-country imports which may not have the same cost burdens associated with stringent EU environmental, health and animal welfare regulations as well as by countries outside the EU when referring to competition from countries with a cost benefit associated with access to cheaper and more cost effective raw materials inputs (such as feed and juveniles).
High costs associated with compliance to stringent environmental, health and animal welfare regulations. Many countries referred to the high cost associated with these regulations which can be prohibitive.
Some issues which are specific to EU countries are:
Lack of a level playing field among member states and mainly with respect to third-country imports: producers within the EU are subject to strict environmental, health, animal welfare and labour laws and regulations which third-countries may not be. Imports from these countries compete unfairly with EU produced goods since they may not be subject to the same standards.
Coherence between priorities and responsibilities set at the EU level and the Member States: Priorities set at the EU level are not always adequately reflected at the Member State level.
While the development of any given industry cannot and must not be dictated by the public authorities, they do have a very important role to play in establishing the legal and regulatory framework in which the industry operates. The questions of allocation of space, protection of the environment and protection of the consumer are all the responsibility of the public authorities. If the
156
industry is considered to be particularly valuable, then certainly its viable growth can be encouraged through well applied incentives for communication and research. 12.1 Production Production growth in the Mediterranean has been uneven among countries and uneven when viewed as a whole. Some countries have enjoyed impressive growth rates while others have stagnated or decreased. Greece in particular has grown the fastest overall but unevenly, going through classic boom and bust episodes in the almost 30 years of the industry. Turkey’s growth was halted in recent years, due to the current industry crisis but mostly because it is undergoing a period of restructuring from a spatial planning perspective. Perhaps the best example of a country whose growth has been impressive but within the constraints of its demand is Spain. Other European countries such as Italy, France and Cyprus and Malta have stagnated or stabilised or decreased their production mainly due to spatial planning issues. Smaller producing countries such as Cyprus, Malta, Croatia and Montenegro have small domestic markets, and as such would need to be competitive in larger EU markets. Competition from Greece and Turkey has made this very difficult. For the countries of the southern Mediterranean the situation is compounded by technical difficulties such as the availability of juveniles, feed and trained technical personnel. Egypt presents the exception with an impressive production growth rate over the past decade and a large and growing domestic market. From a production perspective these characteristics lead to two basic priorities to ensure the future viable growth of the industry:
initiatives which facilitate the legal and spatial framework for growth; and initiatives which improve cost competitiveness.
A legal framework which will encourage investment in the sector, facilitate daily operations and impart a sense of long-term stability to entrepreneurs is essential especially since the industry is capital intensive and long term in its production structure. Most MedAquaMarket National Country Reports mention the complicated and overlapping institutional and regulatory system as a major hurdle for future growth. Adequate spatial planning which allocates space for production units in an efficient and cost-effective manner while protecting the environment and minimizing conflict with other users is also essential for the future growth of the sector. France and Italy are clear cases where space limitations have halted the industry’s growth in recent years although there is a clear demand for the national product which is not being met.
Initiatives which can increase cost competitiveness from a production perspective are mostly centred on research and development to improve feed conversion rates, juvenile quality and survival rates, address health issues, as well as technical issues associated with offshore and closed-system farming.
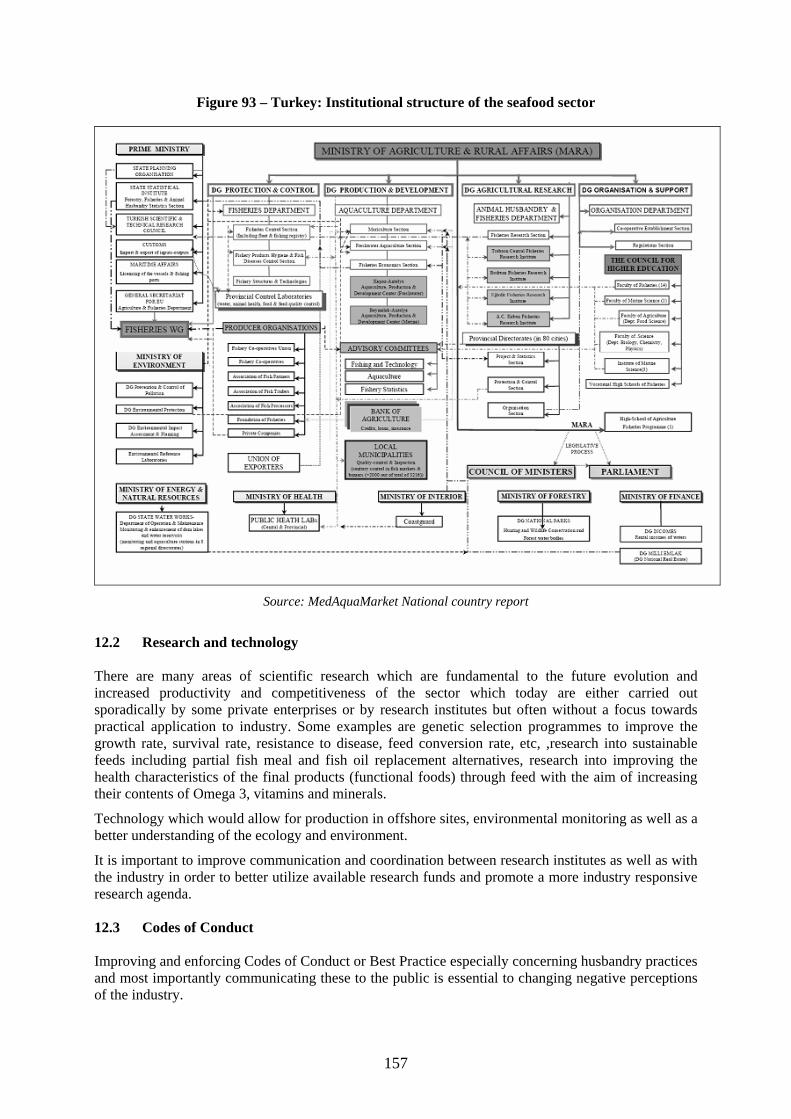
157
Figure 93 – Turkey: Institutional structure of the seafood sector
Source: MedAquaMarket National country report
12.2 Research and technology There are many areas of scientific research which are fundamental to the future evolution and increased productivity and competitiveness of the sector which today are either carried out sporadically by some private enterprises or by research institutes but often without a focus towards practical application to industry. Some examples are genetic selection programmes to improve the growth rate, survival rate, resistance to disease, feed conversion rate, etc, ,research into sustainable feeds including partial fish meal and fish oil replacement alternatives, research into improving the health characteristics of the final products (functional foods) through feed with the aim of increasing their contents of Omega 3, vitamins and minerals.
Technology which would allow for production in offshore sites, environmental monitoring as well as a better understanding of the ecology and environment.
It is important to improve communication and coordination between research institutes as well as with the industry in order to better utilize available research funds and promote a more industry responsive research agenda. 12.3 Codes of Conduct Improving and enforcing Codes of Conduct or Best Practice especially concerning husbandry practices and most importantly communicating these to the public is essential to changing negative perceptions of the industry.
158
Encouraging environmental monitoring, making these results available to the public and implementing recommendations for reducing any negative effects on the environment are equally essential for improving the image of the industry. The industry must be encouraged to be proactive and transparent in addressing environmental issues. An issue of great importance is the implementation of a Mediterranean-wide bio security plan combined with an integrated coastal zone management plan. It is not at all unrealistic to imagine a situation in the future where a widespread epidemic could cause disruptions such as has been recently experienced in Chile with Salmon production. Although the species, densities, intensity and methods of production are still quite different, planning for the long-term development of this industry in the Mediterranean requires learning lessons from other, similar cases. 12.4 The market The aquaculture industry in the Mediterranean is characterized by an impressive cyclicality, with marked periods of growth followed by dramatic restructuring and retrenchment. This is especially unfortunate when taking into account the gradual and consistent growth in the consumption of these products over the past twenty years at least. The inability of the industry to adequately match its supply to the demand is the single most important issue with regards to the markets. The lack of an appropriate legal framework and organized and specialized institutional framework in the great majority of countries has indirectly exacerbated this problem: the lack of reliable and timely data on production stems in large part from the unregulated production. Licence capacity has only recently started to be strictly enforced in some countries, allowing for more reliable production data. The second part of this equation is clearly knowing the capacity and characteristics of the market and matching one’s supply to the demand.
In addition to smoothing out the cyclicality of the industry, it is essential to consider the increasingly negative image that exists in most countries, not so much of the products of aquaculture as much as the mode of production. Informational campaigns on the mode of production, the regulatory framework and the quality, safety and health controls and certifications that exist in the industry are essential to increasing the social acceptability of the activity. The culture of “secrecy” in the industry stems in large part from its past (and present in some important cases) as an anarchic and unregulated (or perhaps under-inspected) industry. Today the great majority of the industry operates under strict environmental and health and safety regulations. Finally informational campaigns about the nutritional qualities of the product are important in order to grow the demand for farmed fish. 12.5 Information According to popular thinking, we are currently in the information age: the provision and management of information is now widely accepted as the challenge and true competitive edge in most industries. This is equally true for aquaculture. Information on a farm basis is vital to understanding costs, finding ways of improving efficiency and productivity and making decisions about production choices (species, size categories and timing). Obtaining accurate data from farms on production is equally vital for both industry players and national authorities to plan production. It is equally important in making decisions about the allocation of research and development funds and subsidies.
From a market perspective, information on consumption, consumer preferences and concerns and price trends are vital to planning one’s production whether at the farm, company or national authority level. There are five essential aspects to the information challenge in the industry:
Information gathering Analysis Dissemination
information gathering systems at the farm level; data collection systems at the industry and public authority level; market studies; informational campaigns concerning the mode of production; and
159
informational campaigns concerning the nutritional aspects of the product. 12.6 Price observatory A price monitoring system aimed at improving knowledge on price setting and added-value generation throughout the marketing chain can help in analysis and decision making. Improving the anticipation of price variation can lead to decreasing volatility in the market and enable producers to better adapt their supply to market conditions. What contributes to growth of the industry?
Most important/basic precondition:
geography/physiochemical characteristics; legal basis; and access to capital (private or public).
Second stage factors for sustainable growth
access to markets; access to research institutions; and level of organization/maturity of industry.
What contributes to the profitability/viability of the industry?
competitiveness; and responsiveness to the demands of the market
The ability to produce what the market wants at the price it wants. This does not mean that there is only one viable strategy but it must be a holistic approach: products can be high-end or low end, but it must all make economic sense.
Based on various analyses of the market and demand for European seabass and gilthead seabream in the main consuming countries of Europe, it would not be unrealistic to expect demand for these products to keep growing. The rate of growth in consumption has been around 7–8 percent from 2003 to 2007 and the current total demand can be estimated around 270 000 tonnes per year.
Any marketing or promotion effort should differentiate between existing, large markets and new markets. In existing markets, the focus is to obtain a greater percentage of the market share for seafood. This growth is driven by the increasing interest of the consumer in the health attributes of fish in general. Promotion of products of aquaculture should therefore focus on the advantages of farmed products such as quality and hygiene controls, freshness, and traceability. The sustainability of the industry is an issue which, if properly addressed, could be an important perceived advantage of aquaculture over capture fisheries. New markets in Northern and Eastern Europe also have interesting potential but the focus of any campaign there needs to inform the consumer about what are basically new species for them. In addition to information about the nutritional advantages of these Mediterranean species, in comparison to freshwater species, any promotional campaign should include recipes and cooking instructions capitalizing perhaps on positive experiences/images of Mediterranean holidays.
Two very basic preconditions to successfully growing the market for Mediterranean aquaculture products are:
access to current and updated information on market demand, consumption habits and demographics in target markets; and
long-term, focused campaign which combines information/communication, with promotion.
160
More important perhaps than campaigns with large budgets that occur sporadically, are campaigns which target “under-the-line marketing”. Apart from being far less expensive, they have proven to be far more successful in that they tend to achieve a greater degree of credibility. These two elements go hand-in-hand as up to date market data will allow for a more focused, efficient and productive promotional campaign and a long-term, continuous promotion campaign will make it more likely that it’s effects can be measured in the long-run. 12.7 Collective actions and interbranch organizations A major challenge for the sector is to keep track of and adapt to changing consumer habits and trends in distribution. The sector faces two challenges as far as the distribution of its products is concerned: the vastly disproportionate negotiating power of large retail chains and distributors and distance from the final consumer. In fact the preferences and priorities of consumers are being interpreted and sometimes dictated by the retailer sector itself. Although consumer surveys have repeatedly shown that issues such as sustainability and animal welfare rank low on the list of factors affecting purchasing decisions (CONSENSUS), there is more and more pressure by major retailers for the aquaculture industry to provide assurances that their products are sustainable. Inter-branch organizations have proved successful in downstream alliances/integration. Interbranch organizations are groupings of sector representatives (PO’s), processing and retail distribution. Providing funding for such alliances would encourage the processing and distribution sector to “come to the table” and cooperate with the production sector. Joint actions may involve joint marketing and promotion efforts and market research. 12.8 Future scenarios It is difficult to define the optimal business and market strategy for the industry. As with most industries, it has been proven again and again that there is no “right” business model or enterprise size. What seems certain is that for the industry to progress to a more stable and viable rate of growth it will go through a restructuring and maturing phase. This will involve the closure or buyout of many of the smaller and medium sized enterprises that are not financially able to deal with the cyclicality of the industry as well as the current financial crisis. What is also clear is that the industry requires a fundamental restructuring in its approach to management on the production side as well as the market side. Investment in systems to better control production costs, better information and control of the biomass will allow companies to understand their cost structure and be better positioned to plan their production to respond to shifts in market conditions. Investment in information gathering and analysis of market conditions (customer buying trends for example) can allow for better production planning and a more market-oriented approach.
This is really what will determine the success or failure of a company in the future: not so much its size but its ability to collect, analyse and interpret information and respond accordingly. Of course size of enterprise will determine its capacity for such, often expensive, investment. However, here the role of collective action is vital to allow for even small enterprises to take advantage of information collected jointly. Companies that have the ability from a financial, management and organizational point of view to take advantage of such practices are those who will be able to position themselves most competitively in the future and be best positioned to respond in time to market changes and new market requirements.
The industry in truth competes for consumers with other sources of protein and as such there is a need for vision and strategic thinking in order to successfully place aquaculture products at the forefront of the consumer’s choices.
The future development of the industry is also dependent on measures and responsibilities taken by the State authorities which can substantially improve the business environment:
simplify existing laws and regulations; unifying the role of various local authorities, departments and ministries;
161
incentives to encourage data gathering, communication and marketing actions both on a company and collective level;
incentives for environmental monitoring systems; and zoning and planning.
13. RECOMMENDATIONS (Development of a Strategy for Marketing and Promotion of Mediterranean Aquaculture) The aim of promoting a market-oriented approach for the industry is to provide the means and the opportunity for companies, either individually or jointly, to improve the first-sale value of the product.
From the industry perspective the challenge is to find ways to match supply to market demand both in terms of quantities but also in terms of form (convenience), price and attributes (health, hygiene, nutrition, sustainable, green) The only way to obtain commercially viable prices is to provide the market with what it wants in terms of quantity, form, quality and regularity of supply.
Both greater marketing organization as well as product diversification are essential to the future development and viability of the industry. It should be possible to encourage the parallel development of the industry as both a high-end luxury or niche product and a lower margin, mass market product. In fact it is entirely possible and desirable for these strategies to be pursued by the same company with different brands, extracting value in many segments of the markets.
Furthermore the following specific conclusions were the result of the Technical Meeting of the GFCM/CAQ Working Group on Marketing held in Tangiers, Morocco, from 26 to 27 October 2009. The present report was summarized to the participants together with the recommendations suggested by the various MedAquaMarket national country reports. The following set of principles was derived as priorities upon which specific recommendations should be based for the development of a sustainable Mediterranean aquaculture industry. Principles
strengthen a consumer responsive and market oriented aquaculture industry; strengthen risk assessment and crisis management capabilities; strengthen financial management of enterprises; and strengthen the role of producers’ organizations for the economic sustainability of
aquaculture. The recommendations derived from the MedAquaMarket national country reports and the stakeholder dialogue can be divided into three general categories: Legal/Institutional, production/R&D and Market. Legal framework
The majority of the country reports highlighted the need to strengthen the existing legislation applying to the sector. The spatial planning of the coastal zones and the creation of efficient mechanisms to monitor production, distribution and consumption are of critical importance.
Completion of the Integrated Coastal Zone Management (ICZM) and maritime spatial planning in order to deal with the increased competition from other sea areas users, to ensure adequate space for the sector to develop and to attract potential investors.
Measures for legalizing and simplifying and clarifying licensing procedures in order to increase production quality.
Legal framework to encourage the establishment of Producers’ Organizations.
162
Production – R&D
The responsible and well-managed increase of production remains a priority. Special attention should be given to product diversification and the environmental protection.
Modernization of existing facilities and infrastructure, access to feed. Diversification of products, species and farming methods like open-sea, remote-cage
farming and closed recirculation systems. Encourage R&D into better feeds that optimize growth and health status of the fish. R&D into better feed management and monitoring systems. Introduce standards for better environmental management and research on the
interaction between aquaculture and the environment. Improve management of public sector R&D funds, including better coordination of
R&D activities in applied research. Incentives for responsible aquaculture practices as well as promotional activities. Zoo sanitary monitoring network Promote education and professional training for fish farmers. Promote the development and use of risk assessment and management tools with
regards to disease prevention, costs/financial management, and production planning. Market – Trade
The absence of a marketing strategy for the sector has been criticized by the vast majority of the Country Reports. The goals of price stability, exploitation of emerging - niche markets, improvement of the public image of the sector, have not yet been achieved. More specifically:
Initiatives to achieve sustainability of the business in the context of falling prices. Well-structured and continuous promotion, marketing and communication strategy to
selected target groups in order to increase domestic consumption. Well-structured and continuous promotion, marketing and communication strategy to
selected target groups in order to improve the image of the sector. Introduce and enforce traceability systems. Encourage harmonization of traceability
systems and the adoption of common minimum standards in the GFCM area. Introduce certification and labelling systems and procedures in order to improve
competition. Better exploitation of existing or emerging markets, especially the domestic market. Encourage the development of added value and processed products. Establishment of reliable data collection systems concerning production volumes. Data collection and dissemination on consumption, distribution channels, market trends
and trade information. Market and Price Observatory of Aquaculture for the Mediterranean Sea. Harmonization of minimum standards (GFCM/Med) in the GFCM area in order to
ensure fair competition among producers and to protect consumers. Encouraging collective actions such as Producer’s Organizations.
163
14. REFERENCES
Angel, D. and S. Freeman, 2007. Integrated Aquaculture (INTAQ) as a Tool for an Ecosystem Approach: The Mediterranean Sea. Presentation to the Expert Workshop: Building an Ecosystem Approach to Aquaculture. FAO/Universitat de les Illes Balears., Palma de Mallorca, Spain, 7-11 May 2007
Anon. 2008. Consumer perceptions on certified fishery aquatic food products. Technology Educational Institute of Thessaloniki., Greece.
Aquilina, R.J. (ed). 2009. GFCM-CAQ Working Group on Marketing, National Aquaculture Market Report: Malta. (unpublished report).
Badani, A., Labidi, N., Lounaci, L. and Zouadi C. 2008. GFCM-CAQ Working Group on Marketing, National Aquaculture Market Report: Algeria. (unpublished report).
BDI (Business Data Israel). 2004. Organic market study. In: Freeman, S. (ed). 2008. GFCM-CAQ Working Group on Marketing, National Aquaculture Market Report: Israel. (unpublished report).
BioBank, http://www.biobank.it/ Cayeux-Fourtine, S. 2008. La place des produits aquatiques dans la consommation des ménages,
Panel de Consommateurs TNS Worldpanel Central Bureau of Statistics. 2009. Statistical abstract of Israel. n.60,
http://www1.cbs.gov.il/reader/shnatonenew_site.htm Cobani, M. (ed). 2008. GFCM-CAQ Working Group on Marketing, National Aquaculture Market
Report: Albania. (unpublished report). Consensus (Sustainable Aquaculture in Europe). 2005. Proceeding of the Multi-stakeholder
workshop “Defining Indicators for Sustainable Aquaculture Development in Europe”, Oostende, Belgium, 21-23 November 2005, 118p
Cozzolino, M. (ed). 2009. GFCM-CAQ Working Group on Marketing, National Aquaculture Market Report: Italy. (unpublished report).
Department of Marketing & Institute of Aquaculture (University of Stirling), 2004. Study on the market for the aquaculture produced sea bass and seabream species. European Commission DG Fisheries (Contract no Fish/2003/05), Stirling, UK, 84p
http://ec.europa.eu/fisheries/documentation/studies/aquaculture_market_230404_en.pdf Deniz, H. (ed). 2009. GFCM-CAQ Working Group on Marketing National Aquaculture Market
Report: Turkey. (unpublished report). Edelist, D. Best estimate for wild fish prices. Ministry of Agriculture and Rural Development,
Department of Fisheries and Aquaculture, Israel. Based on interviews with fishers. Elahdal, M. 2009. National Market Report of Aquaculture, 2003 – 2007. GFCM-CAQ Working
Group on Marketing, National Aquaculture Market Report: Morocco. 58p (unpublished report). EU, 2009. DG Trade Presentation of the CFP Reform. The Common Fisheries Policy – Towards a
reform, Brussels, Belgium, 17 April 2009. Eurostat Services. http://epp.eurostat.ec.europa.eu FAO, 2008. Aquaculture Production 1950-2006 FAO, 2008. Capture Fisheries Production 1950-2006 FAO, 2009. Aquaculture Production 1950-2007 FAO, 2009. Capture Fisheries Production 1950-2007 FEAP, http://www.feap.info/feap/ FGM, http://www.imbc.gr/fgm/index.html FranceAgriMer. 2009. Établissement national des produits de l'agriculture et de la mer: les chiffres
clés de la filière pêche et aquaculture en France. http://www.ofimer.fr/Pages/Accueil/1Accueil2004.html
164
Franičevic, V. (ed). 2002. FAIR CT98-3500. Methodology for seafood markets with the aim of introducing new aquaculture products. Concerted Action. Final Report (April 2002)
Franičevic, V. (ed) 2009. GFCM-CAQ Working Group on Marketing, National Aquaculture Market Report: Croatia. (unpublished report).
Freeman, S. (ed). 2009. GFCM-CAQ Working Group on Marketing, National Aquaculture Market Report: Israel. (unpublished report).
GFCM. 2008. Trends and Issues of Marine and Brackish Mediterranean Aquaculture. GFCM:CAQ/VI/2008/2, 5p
GIRA. 2002. An analysis of the farmed trout and seabream supply chains in the main EU markets.Denmark, France, Germany, Greece, Italy, Spain and the UK. Report prepared for the EU Commission under the Perspectives for PlantProtein Use in Aquaculture Programme PEPPA, Q5RS-2000-30068, France.
GIRA. 2009. Foodservice Market Report Foodservice 2009. France. http://www.girafoodservice.com/en/etudes_multi-clients.php Glitnir Seafood Research. 2008. EU Seafood Industry Report. http://www.islandsbanki.is/english/industry-focus/seafood-industry/ Globefish. 2009a, Globefish. European Price Reports. www.globefish.org Globefish. 2009b. Pangasius Market Report, July 2009. http://www.thefishsite.com/articles/724/pangasius-market-report-july-2009 González-Posada, J.O. (ed). 2009. GFCM-CAQ Working Group on Marketing, National Aquaculture
Market Report: Spain. (unpublished report). Guillotreau, P. 2007. The European Market for Seafood Products. European Commission -DG FISH,
Seminar on economic dimensions of European fisheries. Brussels, Belgium, 14-15 May 2007. Hadjali Salem, M. (ed). 2009. Brief Review of the Aquaculture Industry in Tunisia. GFCM-CAQ
Working Group on Marketing, National Aquaculture Market Report: Tunisia, 14p (unpublished report).
Hellastat. 2007. Study titled Organic Farming and Products: Market analysis (April 2007): http://www.hellastat.eu/en/
IFREMER, http://www.ifremer.fr ISMEA. 2007. ACNielsen Report. The Italian Organic Market. http://www.ismea.it/flex/cm/pages/ServeBLOB.php/L/IT/IDPagina/2808 Lem, A. 2004. An Introduction into organic seafood: overview of the present market and trade
situation in the aquaculture sector and the current and potential role of organic products. Proceedings of the Global Technical and Trade Conference. Ho Chi Minh City, Vietnam, 15-16 June 2004
Malta Centre of Fisheries Sciences, http://vafd.gov.mt/home Marine Environment Research Lab LTD (ed). 2009. GFCM-CAQ Working Group on Marketing,
National Aquaculture Market Report: Cyprus. (unpublished report). Michels, P., Müller, H. and Schmanke, A. 2004. Strukturen der Nachfrage nach ökologischen
Nahrungsmitteln in Deutschland. ZMP, Bonn. http://www.cababstractsplus.org/abstracts/Abstract.aspx?AcNo=20043206720 Mingozzi A and Bertino R. M. (eds). 2008. Tutto Bio 2008. The Italian Organic Yearbook. Bio-
Bank, 304p Ministry of Rural Development and Food, Greece. 2007. National Operational Programme
‘Fisheries’ 2007–2013. www.alieia.gr Monfort, M.C. 2006. Markets and marketing of aquaculture finfish in Europe. Focus on the
Mediterranean Basin for FAO Fisheries division. 46p. Niessen, J.1 & Hamm, U. 2008. Identifying the gap between stated and actual buying behaviour on
organic products based on consumer panel data. 16th IFOAM Organic World Congress, Modena, Italy, June 16-20, 2008
165
O’Dierno, L.J., Govindasamy, R., Puduri, V., Myers, J.J. and Islam, S. 2006. Consumer perceptions and preferences for organic aquatic products: results from the telephone survey. New Jersey Agricultural Experiment Station, 67p.,
http://www.dafre.rutgers.edu/documents/ramu/organicaquaculturesurvey.pdf Ofimer. 2007. Le marché français des produits de la pêche et de l’aquaculture. Opportunités de
marchés pour l’offre française de produits de la pêche et de l’aquaculture. http://www.ofimer.fr/Pages/filiere/Publications_ObsEco.html
Ofimer. 2008. Opportunités de marchés pour l’offre française de produits de la pêche et de l’aquaculture. 24p, http://www.ofimer.fr/99_up99load/2_actudoc/1828d1_01.pdf
Okologisch Μαrkte Εrschliessen. 2005. Marktinformationen zu Öko-Gemüse in Deutschland. http://www.oekolandbau.de/fileadmin/redaktion/bestellformular/pdf/030805.pdf
Organic Monitor. 2008. Overview of the global market for organic seafood products. http://www.organicmonitor.com/
Papageorgiou, P. 1999. Marketing development for new Mediterranean aquaculture species: enterprise strategies. Cah. Options Mediterr. .47: 11–24
Papageorgiou, P. 2003. The Greek Aquaculture Industry: Strategies for Market Development. MBA Thesis. University of Leicester, UK, March 2003.
Papageorgiou, P. 2005. A way out of the crisis for the Greek Aquaculture Industry. Proceedings of the XVII Annual EAFE Conference. Thessaloniki, Greece, 21–23 March 2005.
Papageorgiou, P. (ed). 2009. GFCM-CAQ Working Group on Marketing, National Aquaculture Market Report: Greece. (unpublished report).
Papandroulakis N. and Divanach P. 2008. Culture of marine fish other than gilthead seabream and European seabass (unpublished article)
Paquotte, P. 2009. The place of pangasius in the European seafood market. EU ACFA Working Group Aquaculture, Brussels, Belgium, 3 June 2009.
Pavlidou P. (Selonda Aquaculture S.A.), pers. comm.. Rippin, M. 2006. Deutschland: Bio-Markt mit starken Zuwächsen. In: ZMP-Ökomarkt Forum, 6: 2-3. Rodgers, P. and Le Grel, L. 2007. Marketing and Price Formation of Fisheries and Aquaculture
Products. P/B/PECH/IC/2007-039. Erinshore economics. Salem, A.M. (ed). 2009. GFCM-CAQ Working Group on Marketing, National Aquaculture Market
Report: Egypt. (unpublished report). Shapiro, J. (ed). 2004. The Fisheries and Aquaculture of Israel in numbers. Ministry of Agriculture
and Rural Development. Department of Fisheries. 38p Shapiro, J. (ed). 2005. The Fisheries and Aquaculture of Israel in numbers. Ministry of Agriculture
and Rural Development. Department of Fisheries. 41p Shapiro, J. (ed). 2006. The Fisheries and Aquaculture of Israel in numbers. Ministry of Agriculture
and Rural Development. Department of Fisheries. 48p Shapiro, J. (ed). 2007. The Fisheries and Aquaculture of Israel in numbers. Ministry of Agriculture
and Rural Development. Department of Fisheries. 48p Sljivancanin, M. (ed). 2009. GFCM-CAQ Working Group on Marketing, National Aquaculture
Market Report: Montenegro. (unpublished report). Snovsky, G. and Shapiro, J. (eds). 2003. The Fisheries and Aquaculture of Israel in numbers.
Ministry of Agriculture and Rural Development. Department of Fisheries, Tel Aviv, Israel, 38p. Theodorou, J.A. 2002. Current and future technological trends of European seabass-seabream culture.
Reviews in Fisheries Science. 10: 529– 543 University of Stirling. 2004. Study of the Market for Aquaculture produced seabass and seabream
species. Final Report to the European Commission, DG Fisheries. http://ec.europa.eu/fisheries/documentation/studies/aquaculture_market_230404_en.pdf
Vietnam Association of Seafood Exporters and Producers (VASEP). http://vasep.com.vn
166
White Y. (French Aquaculture Federation). pers. comm.. Willer H., Yussefi-Menzler M., Sorensen N. (eds) 2008. The World of Organic Agriculture.
Statistics and Emerging Trends. Earthscan, IFOAM, Bonn and FiBL, Frick, 268p ZMP-Oekomarkt. 2008. Central Market and Price Reporting Bureau in Germany ZMP.,
www.zmp.de
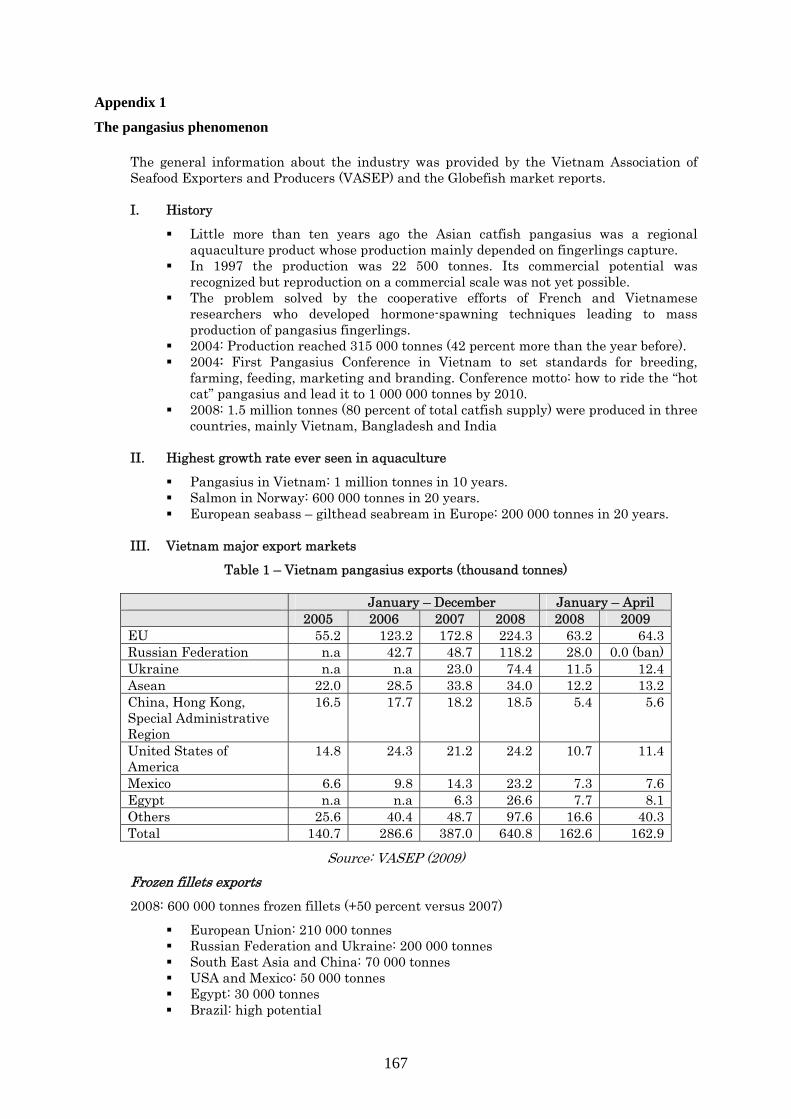
167
Appendix 1
The pangasius phenomenon
The general information about the industry was provided by the Vietnam Association of Seafood Exporters and Producers (VASEP) and the Globefish market reports. I. History
Little more than ten years ago the Asian catfish pangasius was a regional aquaculture product whose production mainly depended on fingerlings capture.
In 1997 the production was 22 500 tonnes. Its commercial potential was recognized but reproduction on a commercial scale was not yet possible.
The problem solved by the cooperative efforts of French and Vietnamese researchers who developed hormone-spawning techniques leading to mass production of pangasius fingerlings.
2004: Production reached 315 000 tonnes (42 percent more than the year before). 2004: First Pangasius Conference in Vietnam to set standards for breeding,
farming, feeding, marketing and branding. Conference motto: how to ride the “hot cat” pangasius and lead it to 1 000 000 tonnes by 2010.
2008: 1.5 million tonnes (80 percent of total catfish supply) were produced in three countries, mainly Vietnam, Bangladesh and India
II. Highest growth rate ever seen in aquaculture
Pangasius in Vietnam: 1 million tonnes in 10 years. Salmon in Norway: 600 000 tonnes in 20 years. European seabass – gilthead seabream in Europe: 200 000 tonnes in 20 years.
III. Vietnam major export markets
Table 1 – Vietnam pangasius exports (thousand tonnes)
January – December January – April 2005 2006 2007 2008 2008 2009
EU 55.2 123.2 172.8 224.3 63.2 64.3 Russian Federation n.a 42.7 48.7 118.2 28.0 0.0 (ban) Ukraine n.a n.a 23.0 74.4 11.5 12.4 Asean 22.0 28.5 33.8 34.0 12.2 13.2 China, Hong Kong, Special Administrative Region
16.5 17.7 18.2 18.5 5.4 5.6
United States of America
14.8 24.3 21.2 24.2 10.7 11.4
Mexico 6.6 9.8 14.3 23.2 7.3 7.6 Egypt n.a n.a 6.3 26.6 7.7 8.1 Others 25.6 40.4 48.7 97.6 16.6 40.3 Total 140.7 286.6 387.0 640.8 162.6 162.9
Source: VASEP (2009) Frozen fillets exports 2008: 600 000 tonnes frozen fillets (+50 percent versus 2007)
European Union: 210 000 tonnes Russian Federation and Ukraine: 200 000 tonnes South East Asia and China: 70 000 tonnes USA and Mexico: 50 000 tonnes Egypt: 30 000 tonnes Brazil: high potential
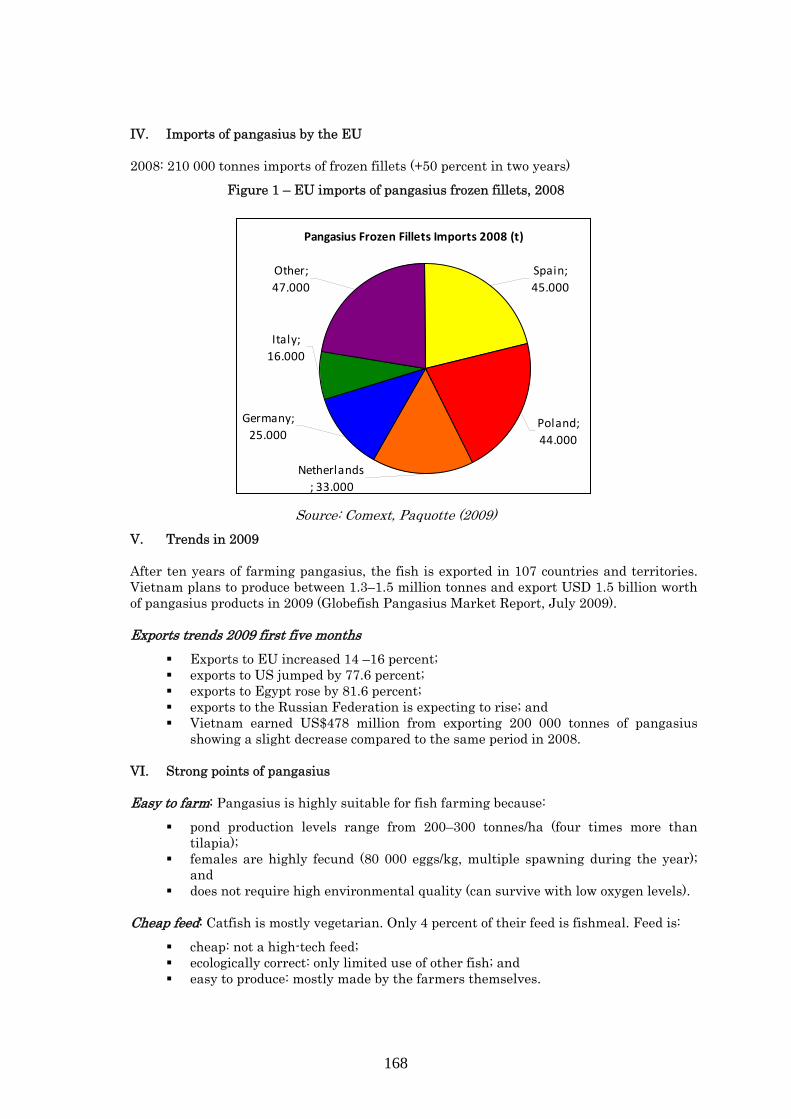
168
IV. Imports of pangasius by the EU 2008: 210 000 tonnes imports of frozen fillets (+50 percent in two years)
Figure 1 – EU imports of pangasius frozen fillets, 2008
Pangasius Frozen Fillets Imports 2008 (t)
Other; 47.000
Spain; 45.000
Poland; 44.000
Netherlands; 33.000
Germany; 25.000
Italy; 16.000
Source: Comext, Paquotte (2009)
V. Trends in 2009 After ten years of farming pangasius, the fish is exported in 107 countries and territories. Vietnam plans to produce between 1.3–1.5 million tonnes and export USD 1.5 billion worth of pangasius products in 2009 (Globefish Pangasius Market Report, July 2009). Exports trends 2009 first five months
Exports to EU increased 14 –16 percent; exports to US jumped by 77.6 percent; exports to Egypt rose by 81.6 percent; exports to the Russian Federation is expecting to rise; and Vietnam earned US$478 million from exporting 200 000 tonnes of pangasius
showing a slight decrease compared to the same period in 2008. VI. Strong points of pangasius Easy to farm: Pangasius is highly suitable for fish farming because:
pond production levels range from 200–300 tonnes/ha (four times more than tilapia);
females are highly fecund (80 000 eggs/kg, multiple spawning during the year); and
does not require high environmental quality (can survive with low oxygen levels).
Cheap feed: Catfish is mostly vegetarian. Only 4 percent of their feed is fishmeal. Feed is:
cheap: not a high-tech feed; ecologically correct: only limited use of other fish; and easy to produce: mostly made by the farmers themselves.
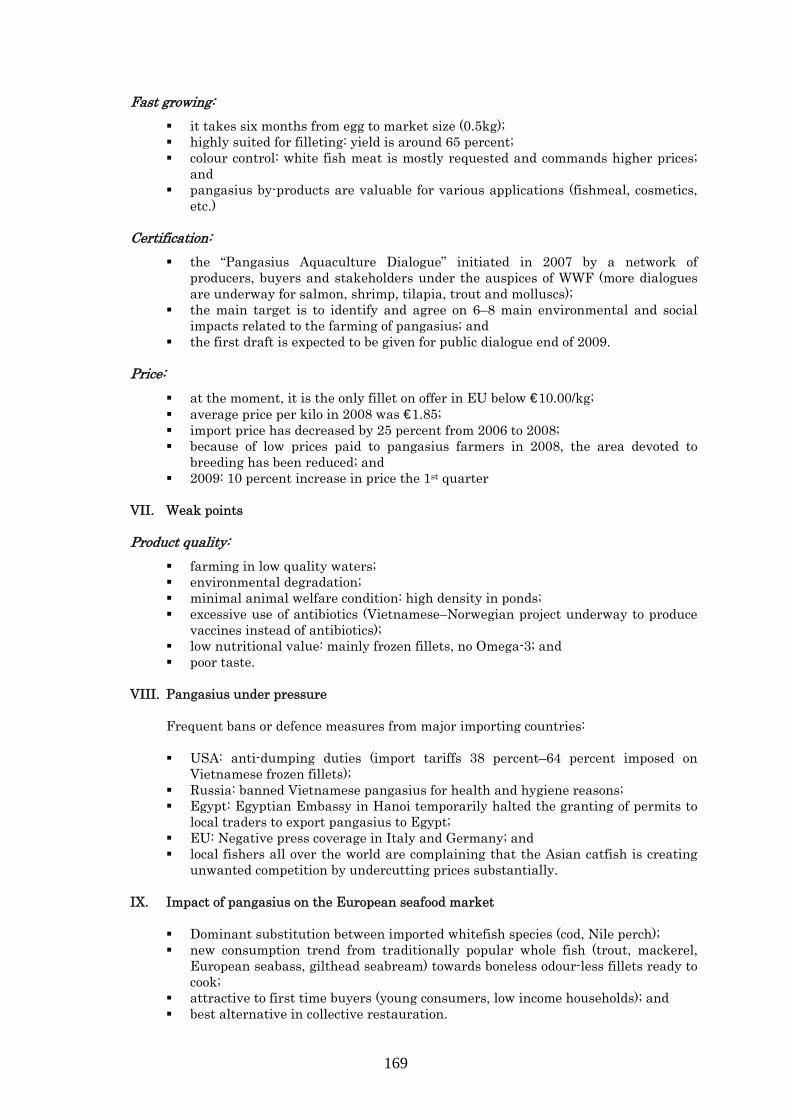
169
Fast growing: it takes six months from egg to market size (0.5kg); highly suited for filleting: yield is around 65 percent; colour control: white fish meat is mostly requested and commands higher prices;
and pangasius by-products are valuable for various applications (fishmeal, cosmetics,
etc.) Certification:
the “Pangasius Aquaculture Dialogue” initiated in 2007 by a network of producers, buyers and stakeholders under the auspices of WWF (more dialogues are underway for salmon, shrimp, tilapia, trout and molluscs);
the main target is to identify and agree on 6–8 main environmental and social impacts related to the farming of pangasius; and
the first draft is expected to be given for public dialogue end of 2009. Price:
at the moment, it is the only fillet on offer in EU below €10.00/kg; average price per kilo in 2008 was €1.85; import price has decreased by 25 percent from 2006 to 2008; because of low prices paid to pangasius farmers in 2008, the area devoted to
breeding has been reduced; and 2009: 10 percent increase in price the 1st quarter
VII. Weak points Product quality:
farming in low quality waters; environmental degradation; minimal animal welfare condition: high density in ponds; excessive use of antibiotics (Vietnamese–Norwegian project underway to produce
vaccines instead of antibiotics); low nutritional value: mainly frozen fillets, no Omega-3; and poor taste.
VIII. Pangasius under pressure
Frequent bans or defence measures from major importing countries: USA: anti-dumping duties (import tariffs 38 percent–64 percent imposed on
Vietnamese frozen fillets); Russia: banned Vietnamese pangasius for health and hygiene reasons; Egypt: Egyptian Embassy in Hanoi temporarily halted the granting of permits to
local traders to export pangasius to Egypt; EU: Negative press coverage in Italy and Germany; and local fishers all over the world are complaining that the Asian catfish is creating
unwanted competition by undercutting prices substantially. IX. Impact of pangasius on the European seafood market
Dominant substitution between imported whitefish species (cod, Nile perch); new consumption trend from traditionally popular whole fish (trout, mackerel,
European seabass, gilthead seabream) towards boneless odour-less fillets ready to cook;
attractive to first time buyers (young consumers, low income households); and best alternative in collective restauration.
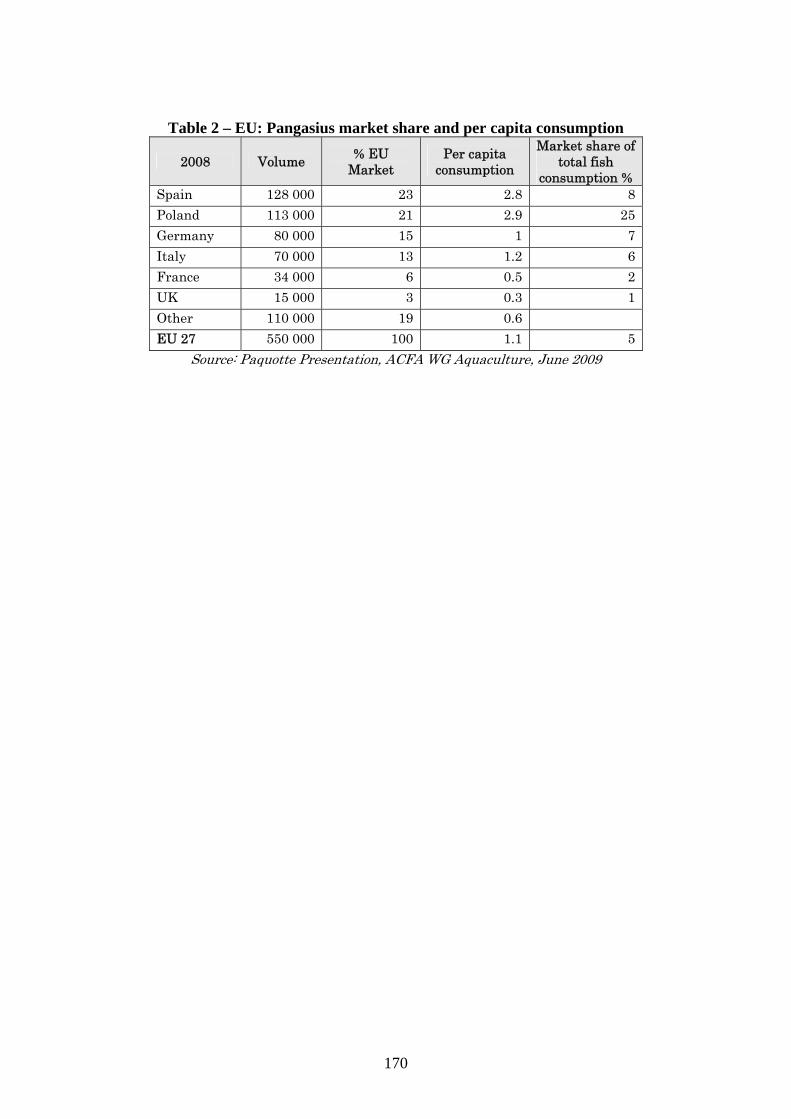
170
Table 2 – EU: Pangasius market share and per capita consumption
2008 Volume % EU Market
Per capita consumption
Market share of total fish
consumption % Spain 128 000 23 2.8 8 Poland 113 000 21 2.9 25 Germany 80 000 15 1 7 Italy 70 000 13 1.2 6 France 34 000 6 0.5 2 UK 15 000 3 0.3 1 Other 110 000 19 0.6 EU 27 550 000 100 1.1 5
Source: Paquotte Presentation, ACFA WG Aquaculture, June 2009
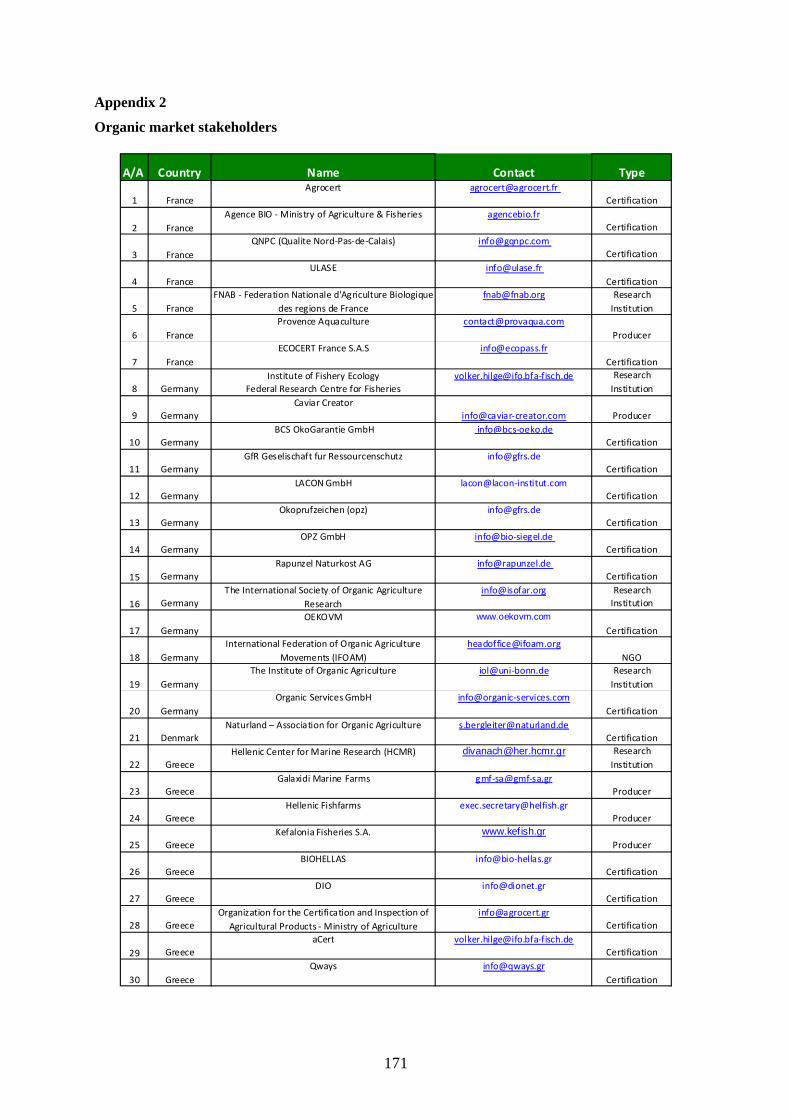
171
Appendix 2
Organic market stakeholders
Α/Α Country Name Contact Type
1 FranceAgrocert [email protected]
Certification
2 FranceAgence BIO ‐ Ministry of Agriculture & Fisheries agencebio.fr
Certification
3 FranceQNPC (Qualite Nord‐Pas‐de‐Calais) [email protected]
Certification
4 FranceULASE [email protected]
Certification
5 FranceFNAB ‐ Federation Nationale d'Agriculture Biologique
des regions de [email protected] Research
Institution
6 FranceProvence Aquaculture [email protected]
Producer
7 FranceECOCERT France S.A.S [email protected]
Certification
8 GermanyInstitute of Fishery Ecology
Federal Research Centre for [email protected]‐fisch.de Research
Institution
9 GermanyCaviar Creator
info@caviar‐creator.com Producer
10 Germany BCS OkoGarantie GmbH info@bcs‐oeko.de
Certification
11 GermanyGfR Geselischaft fur Ressourcenschutz [email protected]
Certification
12 GermanyLACON GmbH lacon@lacon‐institut.com
Certification
13 GermanyOkoprufzeichen (opz) [email protected]
Certification
14 GermanyOPZ GmbH info@bio‐siegel.de
Certification
15 GermanyRapunzel Naturkost AG [email protected]
Certification
16 GermanyThe International Society of Organic Agriculture
[email protected] Research
Institution
17 GermanyOEKOVM www.oekovm.com
Certification
18 GermanyInternational Federation of Organic Agriculture
Movements (IFOAM) [email protected]
NGO
19 GermanyThe Institute of Organic Agriculture iol@uni‐bonn.de Research
Institution
20 GermanyOrganic Services GmbH info@organic‐services.com
Certification
21 DenmarkNaturland – Association for Organic Agriculture [email protected]
Certification
22 GreeceHellenic Center for Marine Research (HCMR) [email protected] Research
Institution
23 GreeceGalaxidi Marine Farms gmf‐sa@gmf‐sa.gr
Producer
24 GreeceHellenic Fishfarms [email protected]
Producer
25 GreeceKefalonia Fisheries S.A. www.kefish.gr
Producer
26 GreeceBIOHELLAS info@bio‐hellas.gr
Certification
27 GreeceDIO [email protected]
Certification
28 GreeceOrganization for the Certification and Inspection of
Agricultural Products ‐ Ministry of [email protected]
Certification
29 GreeceaCert [email protected]‐fisch.de
Certification
30 GreeceQways [email protected]
Certification
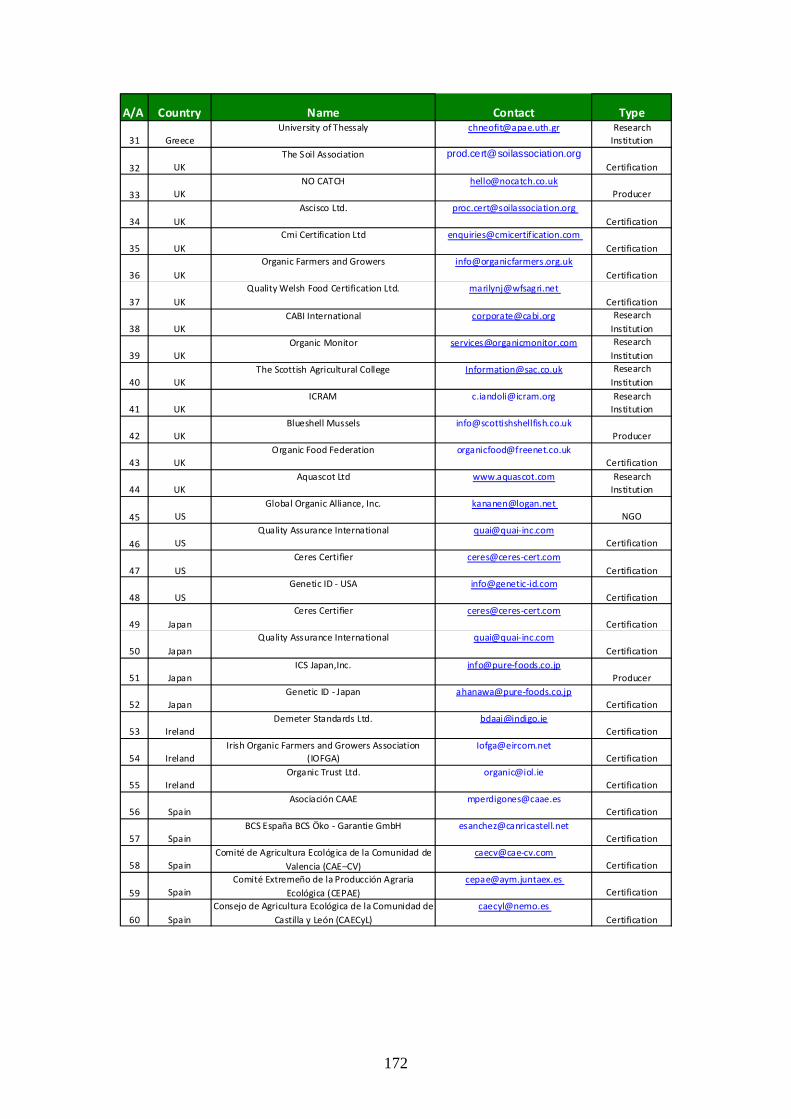
172
Α/Α Country Name Contact Type
31 GreeceUniversity of Thessaly [email protected] Research
Institution
32 UKThe Soil Association [email protected]
Certification
33 UKNO CATCH [email protected]
Producer
34 UKAscisco Ltd. [email protected]
Certification
35 UKCmi Certification Ltd [email protected]
Certification
36 UKOrganic Farmers and Growers [email protected]
Certification
37 UKQuality Welsh Food Certification Ltd. [email protected]
Certification
38 UKCABI International [email protected] Research
Institution
39 UKOrganic Monitor [email protected] Research
Institution
40 UKThe Scottish Agricultural College [email protected] Research
Institution
41 UKICRAM [email protected] Research
Institution
42 UKBlueshell Mussels [email protected]
Producer
43 UKOrganic Food Federation [email protected]
Certification
44 UKAquascot Ltd www.aquascot.com Research
Institution
45 USGlobal Organic Alliance, Inc. [email protected]
NGO
46 USQuality Assurance International quai@quai‐inc.com
Certification
47 USCeres Certifier ceres@ceres‐cert.com
Certification
48 USGenetic ID ‐ USA info@genetic‐id.com
Certification
49 JapanCeres Certifier ceres@ceres‐cert.com
Certification
50 JapanQuality Assurance International quai@quai‐inc.com
Certification
51 JapanICS Japan,Inc. info@pure‐foods.co.jp
Producer
52 JapanGenetic ID ‐ Japan ahanawa@pure‐foods.co.jp
Certification
53 IrelandDemeter Standards Ltd. [email protected]
Certification
54 IrelandIrish Organic Farmers and Growers Association
(IOFGA)[email protected]
Certification
55 IrelandOrganic Trust Ltd. [email protected]
Certification
56 SpainAsociación CAAE [email protected]
Certification
57 SpainBCS España BCS Öko ‐ Garantie GmbH [email protected]
Certification
58 SpainComité de Agricultura Ecológica de la Comunidad de
Valencia (CAE–CV)caecv@cae‐cv.com
Certification
59 SpainComité Extremeño de la Producción Agraria
Ecológica (CEPAE)[email protected]
Certification
60 SpainConsejo de Agricultura Ecológica de la Comunidad de
Castilla y León (CAECyL)[email protected]
Certification
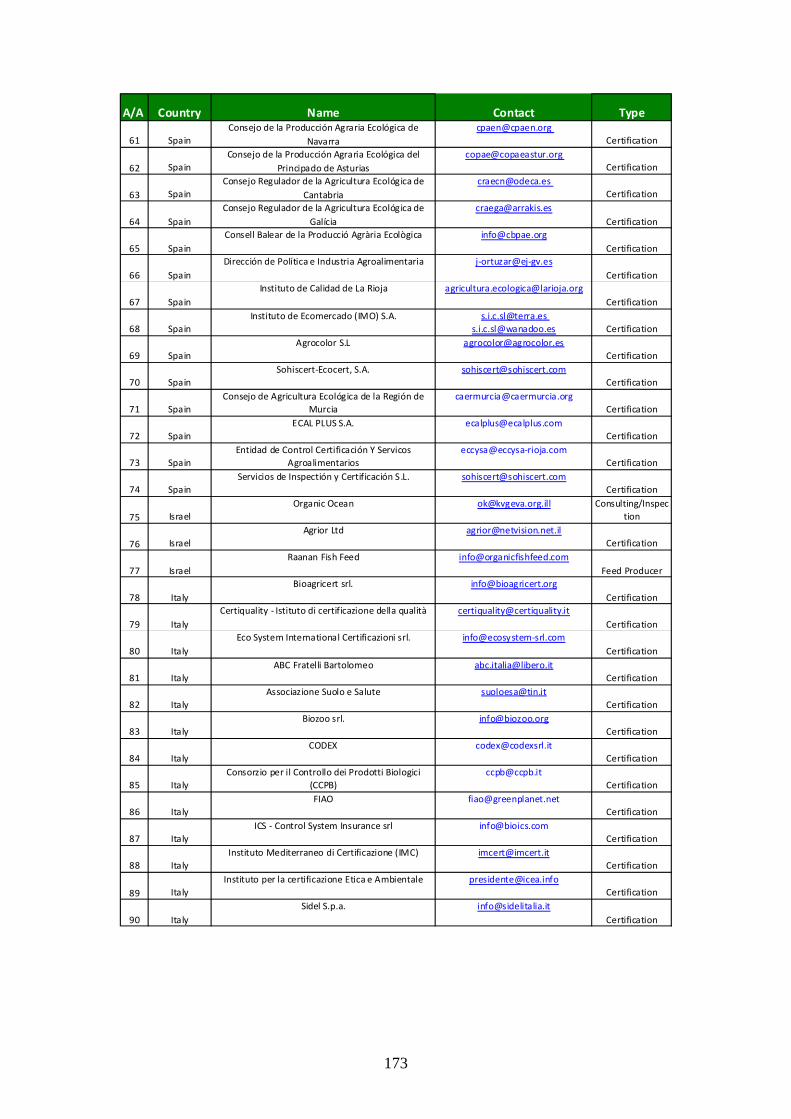
173
Α/Α Country Name Contact Type
61 SpainConsejo de la Producción Agraria Ecológica de
Certification
62 SpainConsejo de la Producción Agraria Ecológica del
Principado de Asturias [email protected]
Certification
63 SpainConsejo Regulador de la Agricultura Ecológica de
Certification
64 SpainConsejo Regulador de la Agricultura Ecológica de
Certification
65 SpainConsell Balear de la Producció Agrària Ecològica [email protected]
Certification
66 SpainDirección de Política e Industria Agroalimentaria j‐ortuzar@ej‐gv.es
Certification
67 SpainInstituto de Calidad de La Rioja [email protected]
Certification
68 SpainInstituto de Ecomercado (IMO) S.A. [email protected]
[email protected] Certification
69 SpainAgrocolor S.L [email protected]
Certification
70 SpainSohiscert‐Ecocert, S.A. [email protected]
Certification
71 SpainConsejo de Agricultura Ecológica de la Región de
Certification
72 SpainECAL PLUS S.A. [email protected]
Certification
73 SpainEntidad de Control Certificación Y Servicos
Agroalimentarioseccysa@eccysa‐rioja.com
Certification
74 SpainServicios de Inspectión y Certificación S.L. [email protected]
Certification
75 IsraelOrganic Ocean [email protected] Consulting/Inspec
tion
76 IsraelAgrior Ltd [email protected]
Certification
77 IsraelRaanan Fish Feed [email protected]
Feed Producer
78 ItalyBioagricert srl. [email protected]
Certification
79 ItalyCertiquality ‐ Istituto di certificazione della qualità [email protected]
Certification
80 ItalyEco System International Certificazioni srl. info@ecosystem‐srl.com
Certification
81 ItalyABC Fratelli Bartolomeo [email protected]
Certification
82 ItalyAssociazione Suolo e Salute [email protected]
Certification
83 ItalyBiozoo srl. [email protected]
Certification
84 ItalyCODEX [email protected]
Certification
85 ItalyConsorzio per il Controllo dei Prodotti Biologici
(CCPB)[email protected]
Certification
86 ItalyFIAO [email protected]
Certification
87 ItalyICS ‐ Control System Insurance srl [email protected]
Certification
88 ItalyInstituto Mediterraneo di Certificazione (IMC) [email protected]
Certification
89 ItalyInstituto per la certificazione Etica e Ambientale [email protected]
Certification
90 ItalySidel S.p.a. [email protected]
Certification
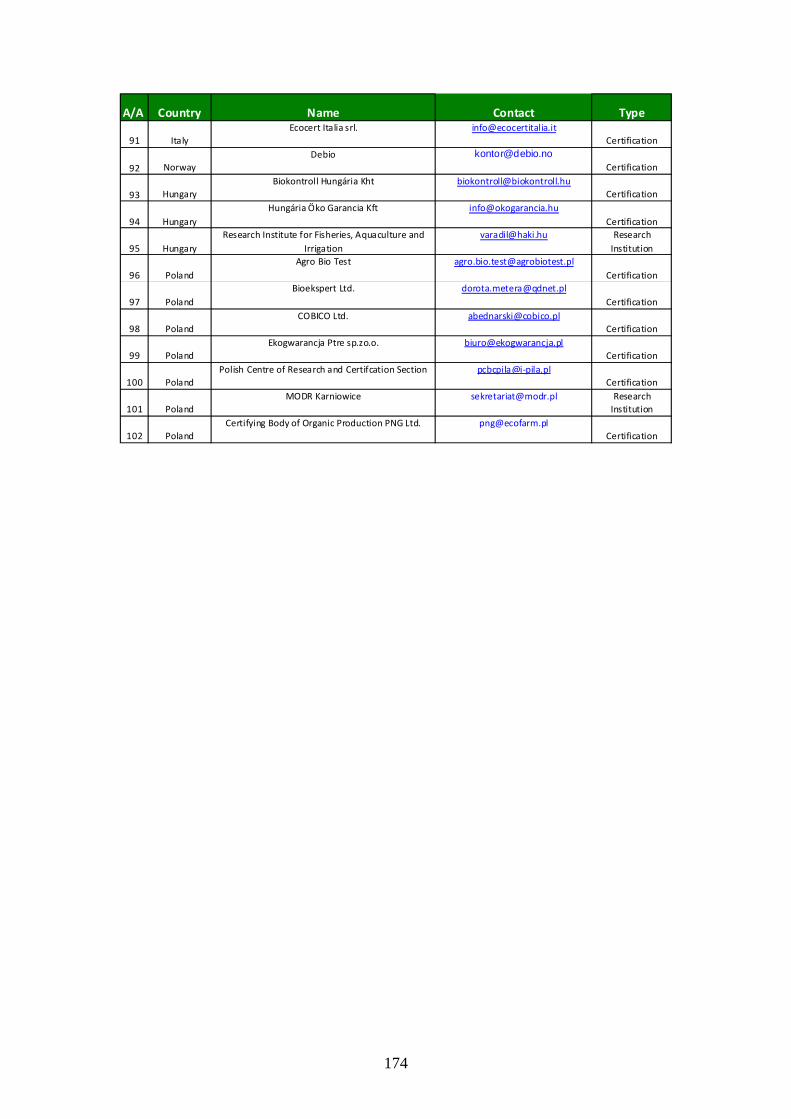
174
Α/Α Country Name Contact Type
91 ItalyEcocert Italia srl. [email protected]
Certification
92 NorwayDebio [email protected]
Certification
93 HungaryBiokontroll Hungária Kht [email protected]
Certification
94 HungaryHungária Öko Garancia Kft [email protected]
Certification
95 HungaryResearch Institute for Fisheries, Aquaculture and
[email protected] Research
Institution
96 PolandAgro Bio Test [email protected]
Certification
97 PolandBioekspert Ltd. [email protected]
Certification
98 PolandCOBICO Ltd. [email protected]
Certification
99 PolandEkogwarancja Ptre sp.zo.o. [email protected]
Certification
100 PolandPolish Centre of Research and Certifcation Section pcbcpila@i‐pila.pl
Certification
101 PolandMODR Karniowice [email protected] Research
Institution
102 PolandCertifying Body of Organic Production PNG Ltd. [email protected]
Certification
175
Appendix 3
EU organic regulations
Council Regulation 2092/91 for organic agriculture does not cover aquaculture products and was replaced by Regulation 834/2007 on 28 June 2007. For the first time EU Legislation includes organic aquaculture and seaweed in its scope. This Regulation together with planned Implementing Rules will apply Community wide from 1 January 2009. Although the Implementation Rules have not been finalized yet the general principles are as follows:
Principles of organic aquaculture:
sustainable management system for aquaculture respecting nature producing products of high quality responding to consumers’ demands;
involving appropriate design and management, restricting the use of external inputs, strict limit on chemical inputs; and
producing food from organic ingredients and restricting additives. General production rules:
the entire holding to be managed in compliance with the requirements applicable to organic production;
however, in accordance with specific conditions to be developed a holding may be split up into clearly separated aquaculture production sites which are not all managed under organic production; and
the same species may be involved, provided that there is adequate separation between the production sites.
Aquaculture production tules:
organic aquaculture to be based on the rearing of young stock originating from organic broodstock and organic holdings; and
when young stock from organic broodstock or holdings are not available, non-organically produced animals may be brought onto a holding under specific conditions.
Husbandry practices:
farmers to have knowledge and skills as regards the health and the welfare needs of the animals;
husbandry practices to ensure that developmental, physiological and behavioural needs of animals are met and minimise negative environmental impact from the holding, including the escape of farmed stock;
organic animals to be kept separate from other aquaculture animals; transport to ensure that the welfare of animals is maintained; and suffering of the animals including at slaughter to be kept to a minimum.
Breeding:
artificial induction of polyploidy, artificial hybridization, cloning and production of monosex strains, except by hand sorting, not to be used;
the appropriate strains compatible with the objectives and principles of organic production to be chosen; and
species-specific conditions for broodstock management, breeding and juvenile production to be established.
Feeds for fish and crustaceans:
feeds to meet the animal’s nutritional requirements at the various stages of its development;
176
plant fraction of feed to originate from organic production and ingredients from fisheries to originate from sustainable fisheries;
non-organic feed materials from plants origin, feed materials from animal and mineral origin, feed additives and certain other products to be used only if they have been authorised for use in organic production under the regulation; and
growth promoters and synthetic amino-acids shall not be used. Bivalve molluscs:
to receive all their nutritional requirements from nature except in the case of juveniles reared in hatcheries and nurseries;
to be grown in waters which meet the criteria for Class A or Class B areas as defined in Community hygiene rules; and
the growing areas to be of high ecological quality as defined by EU Water Legislation (Water Framework Directive).
Disease prevention:
to be based on keeping the animals in optimal conditions by appropriate siting, optimal design of the holdings, the application of good husbandry and management practices, high quality feed, appropriate stocking density, and breed and strain selection;
disease shall be treated immediately to avoid suffering to the animal; and chemically synthesised allopathic veterinary medicinal products including antibiotics
may be used where necessary and under strict conditions, when the use of phytotherapeutic, homeopathic and other products is inappropriate.
Veterinary treatment:
the use of immunological veterinary medicines is allowed; treatments related to the protection of human and animal health imposed on the basis of
Community legislation shall be allowed; and with regard to cleaning and disinfection, products for cleaning and disinfection in ponds,
cages, buildings and installations, shall be used only if they have been authorised for use in organic production under Article 11.
177
Appendix 4
Organic issues Α. GENERAL
Minimum distance between organic and conventional farms; minimum distance between sea bottom and bottom of the net; minimum sea depth; maximum capability; sea current speed (minimum); elaboration of Environmental Impact Assessment a priori; and transportation of products (decision – mean of transportation).
Β. HATCHERY
Origin of breeders (regional stocks – late mature – wild – domesticated); use of hormones (hypophysis); use of photoperiod; close or open water flow circulation systems; use of hybrids – triploids – polyploids; food;
• use of chemical amino acid; and • use of prebiotics (including yeast).
disease treatment; • use of antiparasitic drugs (times/breeding period); • use of antibiotics (times/ breeding period); and • use of homeopathic drugs.
C. ONGROWING
Maximum ongrowing density; food;
• use of proteins of plant origin (%); • use of synthetic amino acids (histidine); • use of blood meal from land animals; • use of antioxidants; • use of prebiotics (including yeast); • use of fish meals from responsible fishing; • use of trimmings, by catches, whole fish; • use of pigments (natural – synthetic); and • maximum content in phosphorus.
disease treatment; • use of anaesthetics; • use of antiparasitic drugs (times/breeding period); • use of antibiotics (times/breeding period); • use of homeopathic drugs.
slaughter method – ice; continuous monitoring of environmental parameters; limit for the consumption of energy; use of cement tanks; use of Ο2/air ventilation; use of antifouling; and management of predators.

178
D. SOCIAL RESPONSIBILITY
Employees’ rights; and holding entities.
179
Appendix 5
List of participants to the GFCM/CAQ Technical Meeting of the Working Group on Marketing held at the Centre régional de l’Institut National de Recherche Halieutique (INRH), Malabata – Tangier (Morocco), 26-27 October 2009 Azeddine ABREHOUCH Biologiste INRH Bp 31, Centre Aquacole, port de M'diq/M'diq Morocco Tel : +212 667038800 Fax : +212 539975506 E-mail : [email protected] Aina AFANASJEVA (Ms) Director H.C. Andersens Boulevard 44-46, 1553 Copenhagen V, Danemark Telephone: 33 37 77 55 Fax: 33 37 77 56 E-mail: [email protected] Ali AIT ALI Cadre en Aquaculture Centre specialise’ en aquaculture Bp 31, Centre Aquacole, port de M'diq/M'diq Morocco Tel : +212 678047869 Fax : +212 539975506 E-mail : [email protected] Lara BARAZI-YEROULANOS (Ms) 12.Vas Sofias Avenue Athens 10674, Greece Tel : + 30 6948059115 E-mail : [email protected] Zouadi CHANEZ Chef de Bureau, Sous Direction des Statistiques Ministère de la Pêche et des Ressources Halieutiques Route des 4 canons, Alger, Algeria Tel: +213 21433987 Fax: +213 21433987 E-mail: [email protected] Kamal CHEBBAKI Biologiste, INRH Bp 31, Centre Aquacole, port de M'diq/M'diq Morocco Tel : +212 539663170 Fax : +212 539975506 E-mail : [email protected]
Mimoza COBANI (Ms) Fishery Expert Fishery Policies Directorate, Ministry of Environment, Forestry and Water Administration Str. n°27, Tirana, Albania Tel: +355682081671 E-Mail: [email protected] Maria COZZOLINO (Ms) Institute for Economic Research on Fisheries and Aquaculture (IREPA) Via S. Leonardo - Travesra Migliaro 84131 Salerno, Italy Tel: +39 089330919 Fax: +39 089330835 E-mail: [email protected] Mohammed ID HALLA Chef de laboratoire central d'Aquaculture INRH-Casablanca 2 Rue de Tiznit, Casablanca, Morocco Tel: +212 522298534 Fax: +212 522298534 E-mail: [email protected] M'hamed IDRISSI Chef du Centre Régional INRH Cap Malabata km 10, Tanger, Morocco Tel: +212 539 32 51 34 Fax: +212 539 32 51 39 E-Mail: [email protected] Thierry GIVERNAUD Ingénieur Setexam/Stecof Km7, route de Tanger, Kénitra, Morocco Tel : +212 661237838 Fax : +212 537329848 E-mail: [email protected]
180
Spyros KLAOUDATOS Professor of Aquaculture Dept. of Ichthyology and Aquatic Environment, University of Thessaly, Fitokou Str. New Ionia Magnisia 38446, Greece Tel: +30 2421 0 93145 Fax: +30 210 8991738 E-mail: [email protected] Majdi LAHMAR Directeur de Société Société Aquaculture Ruspina BP98, ZI5080 Teboulba, Tunisia Tel: +216 73447622 Fax: +21673447633 E-mail: [email protected] Mohamed MARHRAOUI Chimiste INRH Bp 31, Centre Aquacole, port de M'diq/M'diq Morocco Tel: +212 539975763 Fax: +212 539663845 E-mail: [email protected] Abdellah MOUSTATIR Ministere de Pêches Maritimes - DPNA Rabat, Morocco Tel: +212.53.688.217 E-mail: [email protected] Hassan NHHALA Chef du laboratoire Océanographie et d’Aquaculture INRH Cap Malabata km 10, Tangier, Morocco Tel : +212 662458023 Fax : +212 539325139 E-mail: [email protected] Abdellatif ORBI Chef du Département d’Océanographie et d’Aquaculture INRH 2 Rue de Tiznit, Casablanca, Morocco Tel: +212 522298534 Fax: +212 522298534 E-mail: [email protected]
Javier PILES FIsh Farmer sea bream/sea bass Acuigroup Maremar SL Recinto portuariozona relleno 3 46520 Puerto Sagunto, Spain Tel : +34 962699200 Fax : +34962699201 E-mail : [email protected] Maja POLIC (Ms) Directorate of Fisheries Ministry of Agriculture, Fishery and Rural Development I. Mažuranića 30, 23000 Zadar, Croatia Tel:+ 385 23 309820 Fax: +385 23 309830 Email [email protected] Ferit RAD Associate Professor University of Mersin Yenisehir, Mersin, Turkey Tel: +903243411914 E-Mail: [email protected] Mohamed SADIKI Ingénieur DPM Rabat 11 BP476 Rabat, Morocco Tel: +212 53768235 Fax: +212 537688362 E-mail: [email protected] Nezha SALAH EDDINE Directrice régionale ONP BP63 Agdal, Rabat, Morocco Tel: +212 661000816 Fax: +212 539936273 E-mail: [email protected] Ahmed Mohamed SALEM General Manager General Authority for fish resources development GAFRD 4, Tayran Street, Nasr City, Cairo Egypt Tel: +20 123178501 E-mail: [email protected]
181
Pablo SÁNCHEZ JEREZ Senior Lecture University of Alicante Dept. of Marine Science and Applied Biology. Edf. Ciencias 5 Ap. C. 99 03080 Alicante, Spain Tel:+ 34 965903400, ext 2977 Fax:+ 34 965909897 E-mail: [email protected] Petek SENGUL ILEM Agromey, Turkey Tel: +905 333264016 Fax: +902 324460908 E-mail: [email protected] El Mostapha TALBAOUI vétérinaire INRH-M'diq Bp 31, Centre Aquacole, port de M'diq/M'diq Morocco Tel: +212 539663170 Fax: +212 539975506 E-mail: [email protected] Güzel YÜCEL GIER (Ms) Dokuz Eylul University, Institute of Marine Science and Technology Baku Bulvarı No: 100 35340 Đnciralti-Đzmir, Turkey Tel: + 232 278 65 15 -278 65 25/140 Fax: + 232 278 50 82 E-mail: [email protected]
FAO Via delle Terme di Caracalla 00153 Rome, Italy Audun LEM Fishery industry officer Fisheries Department Tel.: +39 06 57052692 Fax: +39 06 57055188 E-mail: [email protected] GFCM Secretariat Via delle Terme di Caracalla 00153, Rome, Italy Fabio MASSA Aquaculture Officer / CAQ Technical Secretary International Institutions and Liaison Service Fisheries and Aquaculture Economics and Policy Division Fisheries and Aquaculture Department Tel.: +39 06 57053885 Fax: +39 06 57056500 E-mail: [email protected] Federico DE ROSSI Data and content manager International Institutions and Liaison Service Fisheries and Aquaculture Economics and Policy Division Fisheries and Aquaculture Department Tel.: +39 06 57053481 Fax: +39 06 57056500 E-mail: [email protected]

182
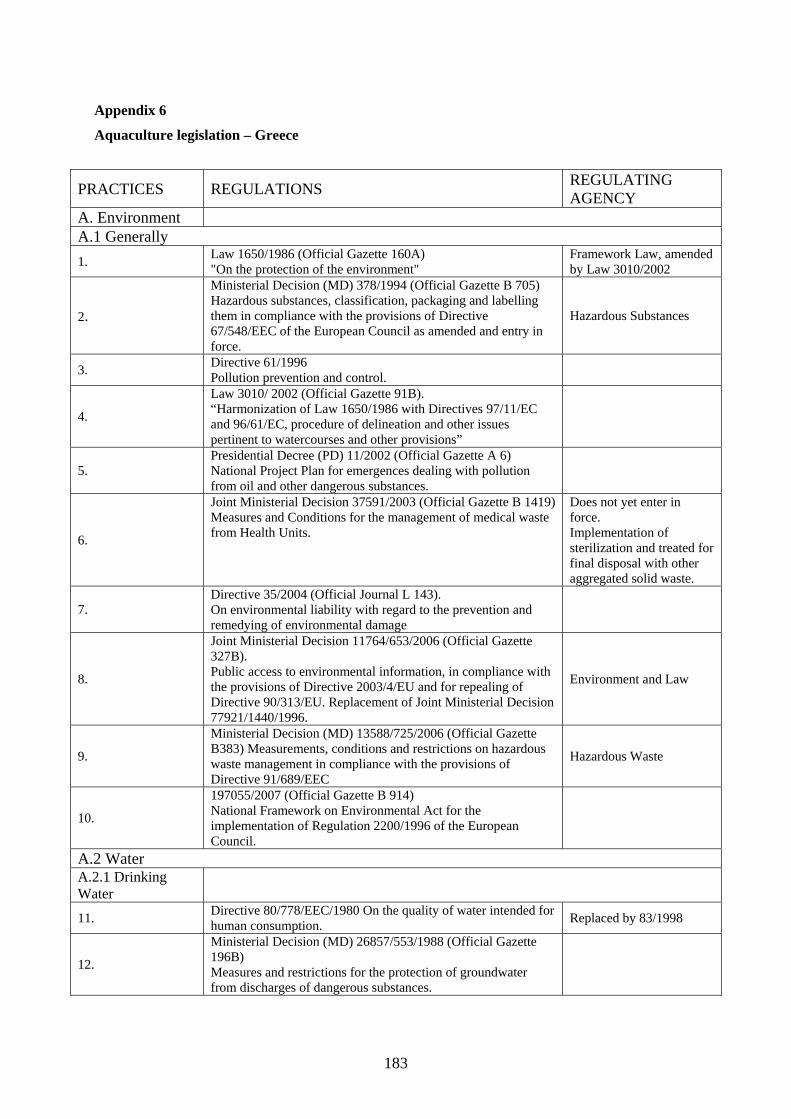
183
Appendix 6
Aquaculture legislation – Greece
PRACTICES REGULATIONS REGULATING AGENCY
A. Environment A.1 Generally 1. Law 1650/1986 (Official Gazette 160A)
"On the protection of the environment" Framework Law, amended by Law 3010/2002
2.
Ministerial Decision (MD) 378/1994 (Official Gazette B 705) Hazardous substances, classification, packaging and labelling them in compliance with the provisions of Directive 67/548/EEC of the European Council as amended and entry in force.
Hazardous Substances
3. Directive 61/1996 Pollution prevention and control.
4.
Law 3010/ 2002 (Official Gazette 91B). “Harmonization of Law 1650/1986 with Directives 97/11/EC and 96/61/EC, procedure of delineation and other issues pertinent to watercourses and other provisions”
5. Presidential Decree (PD) 11/2002 (Official Gazette A 6) National Project Plan for emergences dealing with pollution from oil and other dangerous substances.
6.
Joint Ministerial Decision 37591/2003 (Official Gazette B 1419) Measures and Conditions for the management of medical waste from Health Units.
Does not yet enter in force. Implementation of sterilization and treated for final disposal with other aggregated solid waste.
7. Directive 35/2004 (Official Journal L 143). On environmental liability with regard to the prevention and remedying of environmental damage
8.
Joint Ministerial Decision 11764/653/2006 (Official Gazette 327B). Public access to environmental information, in compliance with the provisions of Directive 2003/4/EU and for repealing of Directive 90/313/EU. Replacement of Joint Ministerial Decision 77921/1440/1996.
Environment and Law
9.
Ministerial Decision (MD) 13588/725/2006 (Official Gazette B383) Measurements, conditions and restrictions on hazardous waste management in compliance with the provisions of Directive 91/689/EEC
Hazardous Waste
10.
197055/2007 (Official Gazette B 914) National Framework on Environmental Act for the implementation of Regulation 2200/1996 of the European Council.
A.2 Water A.2.1 Drinking Water
11. Directive 80/778/EEC/1980 On the quality of water intended for human consumption. Replaced by 83/1998
12.
Ministerial Decision (MD) 26857/553/1988 (Official Gazette 196B) Measures and restrictions for the protection of groundwater from discharges of dangerous substances.
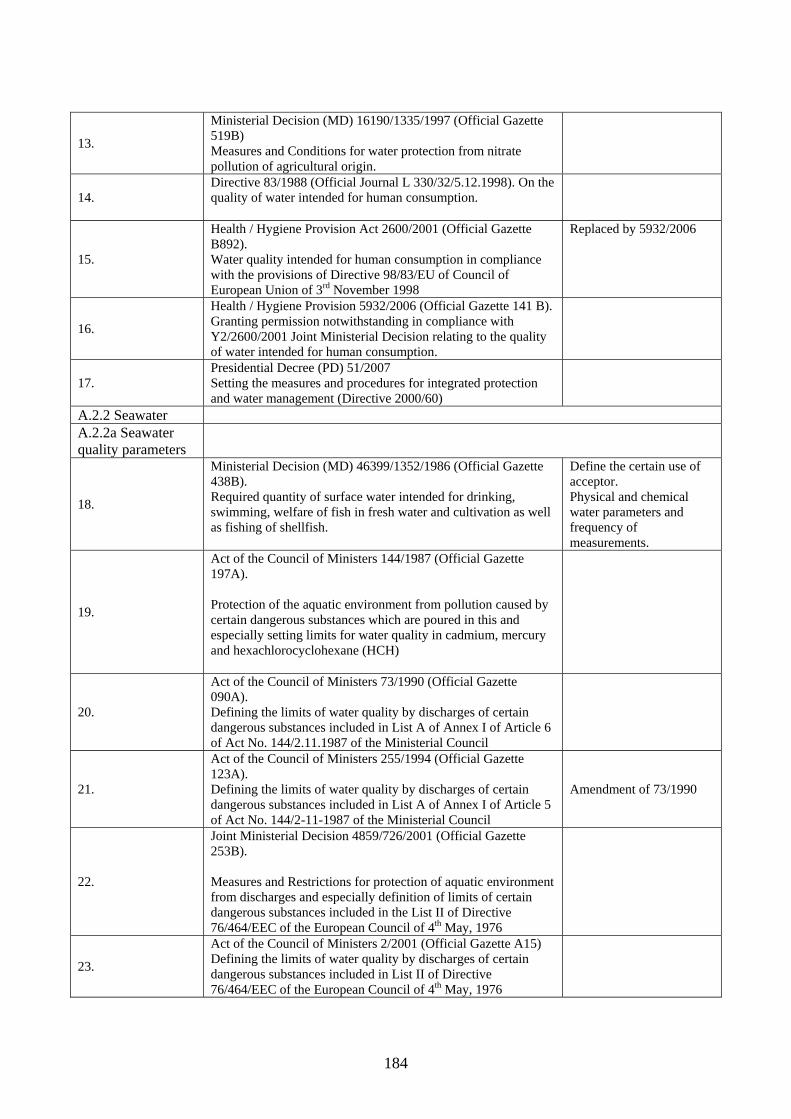
184
13.
Ministerial Decision (MD) 16190/1335/1997 (Official Gazette 519B) Measures and Conditions for water protection from nitrate pollution of agricultural origin.
14. Directive 83/1988 (Official Journal L 330/32/5.12.1998). On the quality of water intended for human consumption.
15.
Health / Hygiene Provision Act 2600/2001 (Official Gazette B892). Water quality intended for human consumption in compliance with the provisions of Directive 98/83/EU of Council of European Union of 3rd November 1998
Replaced by 5932/2006
16.
Health / Hygiene Provision 5932/2006 (Official Gazette 141 B). Granting permission notwithstanding in compliance with Y2/2600/2001 Joint Ministerial Decision relating to the quality of water intended for human consumption.
17. Presidential Decree (PD) 51/2007 Setting the measures and procedures for integrated protection and water management (Directive 2000/60)
A.2.2 Seawater A.2.2a Seawater quality parameters
18.
Ministerial Decision (MD) 46399/1352/1986 (Official Gazette 438B). Required quantity of surface water intended for drinking, swimming, welfare of fish in fresh water and cultivation as well as fishing of shellfish.
Define the certain use of acceptor. Physical and chemical water parameters and frequency of measurements.
19.
Act of the Council of Ministers 144/1987 (Official Gazette 197A). Protection of the aquatic environment from pollution caused by certain dangerous substances which are poured in this and especially setting limits for water quality in cadmium, mercury and hexachlorocyclohexane (HCH)
20.
Act of the Council of Ministers 73/1990 (Official Gazette 090A). Defining the limits of water quality by discharges of certain dangerous substances included in List A of Annex I of Article 6 of Act No. 144/2.11.1987 of the Ministerial Council
21.
Act of the Council of Ministers 255/1994 (Official Gazette 123A). Defining the limits of water quality by discharges of certain dangerous substances included in List A of Annex I of Article 5 of Act No. 144/2-11-1987 of the Ministerial Council
Amendment of 73/1990
22.
Joint Ministerial Decision 4859/726/2001 (Official Gazette 253B). Measures and Restrictions for protection of aquatic environment from discharges and especially definition of limits of certain dangerous substances included in the List II of Directive 76/464/EEC of the European Council of 4th May, 1976
23.
Act of the Council of Ministers 2/2001 (Official Gazette A15) Defining the limits of water quality by discharges of certain dangerous substances included in List II of Directive 76/464/EEC of the European Council of 4th May, 1976
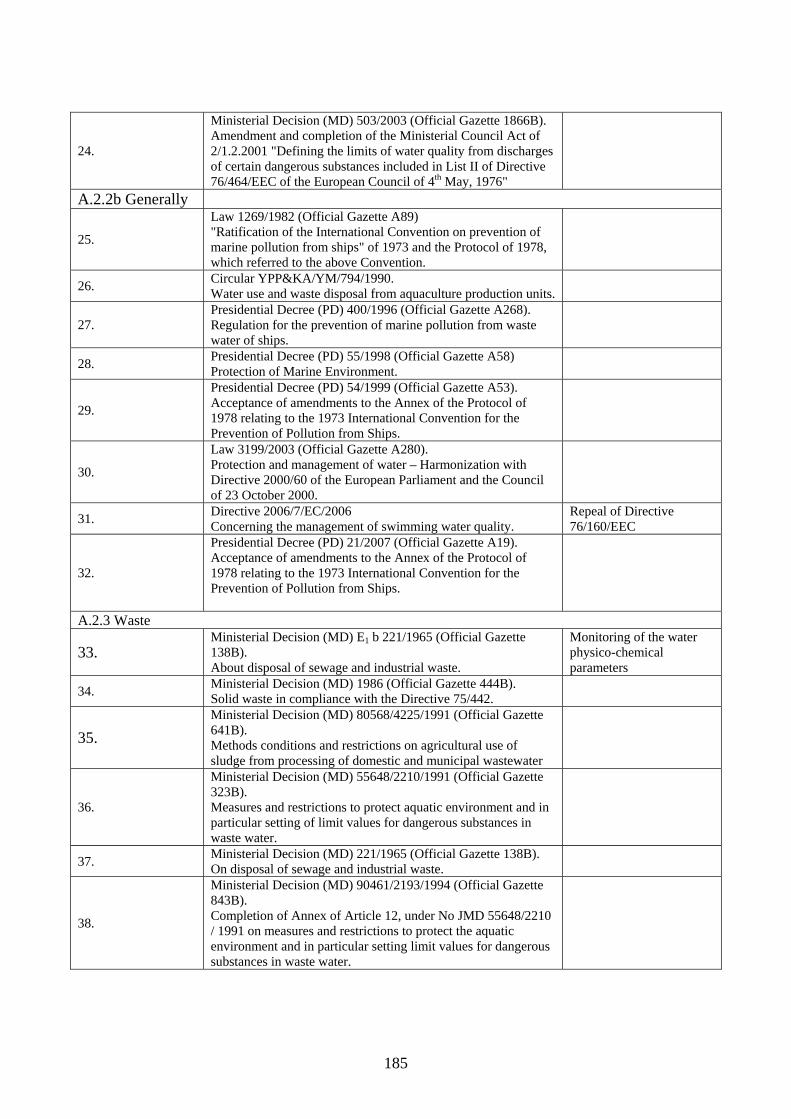
185
24.
Ministerial Decision (MD) 503/2003 (Official Gazette 1866B). Amendment and completion of the Ministerial Council Act of 2/1.2.2001 "Defining the limits of water quality from discharges of certain dangerous substances included in List II of Directive 76/464/EEC of the European Council of 4th May, 1976"
A.2.2b Generally
25.
Law 1269/1982 (Official Gazette A89) "Ratification of the International Convention on prevention of marine pollution from ships" of 1973 and the Protocol of 1978, which referred to the above Convention.
26. Circular YPP&KA/YM/794/1990. Water use and waste disposal from aquaculture production units.
27. Presidential Decree (PD) 400/1996 (Official Gazette A268). Regulation for the prevention of marine pollution from waste water of ships.
28. Presidential Decree (PD) 55/1998 (Official Gazette A58) Protection of Marine Environment.
29.
Presidential Decree (PD) 54/1999 (Official Gazette A53). Acceptance of amendments to the Annex of the Protocol of 1978 relating to the 1973 International Convention for the Prevention of Pollution from Ships.
30.
Law 3199/2003 (Official Gazette A280). Protection and management of water – Harmonization with Directive 2000/60 of the European Parliament and the Council of 23 October 2000.
31. Directive 2006/7/EC/2006 Concerning the management of swimming water quality.
Repeal of Directive 76/160/EEC
32.
Presidential Decree (PD) 21/2007 (Official Gazette A19). Acceptance of amendments to the Annex of the Protocol of 1978 relating to the 1973 International Convention for the Prevention of Pollution from Ships.
A.2.3 Waste
33. Ministerial Decision (MD) E1 b 221/1965 (Official Gazette 138B). About disposal of sewage and industrial waste.
Monitoring of the water physico-chemical parameters
34. Ministerial Decision (MD) 1986 (Official Gazette 444B). Solid waste in compliance with the Directive 75/442.
35. Ministerial Decision (MD) 80568/4225/1991 (Official Gazette 641B). Methods conditions and restrictions on agricultural use of sludge from processing of domestic and municipal wastewater
36.
Ministerial Decision (MD) 55648/2210/1991 (Official Gazette 323B). Measures and restrictions to protect aquatic environment and in particular setting of limit values for dangerous substances in waste water.
37. Ministerial Decision (MD) 221/1965 (Official Gazette 138B). On disposal of sewage and industrial waste.
38.
Ministerial Decision (MD) 90461/2193/1994 (Official Gazette 843B). Completion of Annex of Article 12, under No JMD 55648/2210 / 1991 on measures and restrictions to protect the aquatic environment and in particular setting limit values for dangerous substances in waste water.
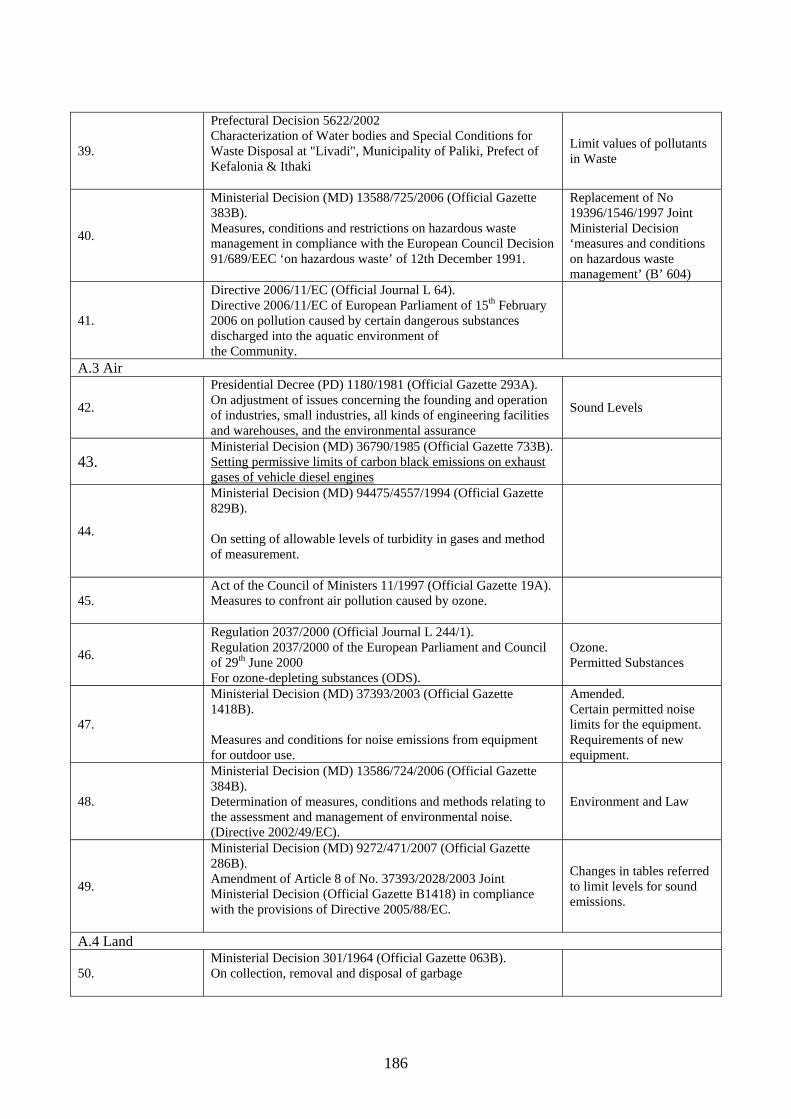
186
39.
Prefectural Decision 5622/2002 Characterization of Water bodies and Special Conditions for Waste Disposal at "Livadi", Municipality of Paliki, Prefect of Kefalonia & Ithaki
Limit values of pollutants in Waste
40.
Ministerial Decision (MD) 13588/725/2006 (Official Gazette 383B). Measures, conditions and restrictions on hazardous waste management in compliance with the European Council Decision 91/689/EEC ‘on hazardous waste’ of 12th December 1991.
Replacement of No 19396/1546/1997 Joint Ministerial Decision ‘measures and conditions on hazardous waste management’ (B’ 604)
41.
Directive 2006/11/EC (Official Journal L 64). Directive 2006/11/EC of European Parliament of 15th February 2006 on pollution caused by certain dangerous substances discharged into the aquatic environment of the Community.
A.3 Air
42.
Presidential Decree (PD) 1180/1981 (Official Gazette 293A). On adjustment of issues concerning the founding and operation of industries, small industries, all kinds of engineering facilities and warehouses, and the environmental assurance
Sound Levels
43. Ministerial Decision (MD) 36790/1985 (Official Gazette 733B). Setting permissive limits of carbon black emissions on exhaust gases of vehicle diesel engines
44.
Ministerial Decision (MD) 94475/4557/1994 (Official Gazette 829B). On setting of allowable levels of turbidity in gases and method of measurement.
45. Act of the Council of Ministers 11/1997 (Official Gazette 19A). Measures to confront air pollution caused by ozone.
46.
Regulation 2037/2000 (Official Journal L 244/1). Regulation 2037/2000 of the European Parliament and Council of 29th June 2000 For ozone-depleting substances (ODS).
Ozone. Permitted Substances
47.
Ministerial Decision (MD) 37393/2003 (Official Gazette 1418B). Measures and conditions for noise emissions from equipment for outdoor use.
Amended. Certain permitted noise limits for the equipment. Requirements of new equipment.
48.
Ministerial Decision (MD) 13586/724/2006 (Official Gazette 384B). Determination of measures, conditions and methods relating to the assessment and management of environmental noise. (Directive 2002/49/EC).
Environment and Law
49.
Ministerial Decision (MD) 9272/471/2007 (Official Gazette 286B). Amendment of Article 8 of No. 37393/2028/2003 Joint Ministerial Decision (Official Gazette B1418) in compliance with the provisions of Directive 2005/88/EC.
Changes in tables referred to limit levels for sound emissions.
A.4 Land
50. Ministerial Decision 301/1964 (Official Gazette 063B). On collection, removal and disposal of garbage
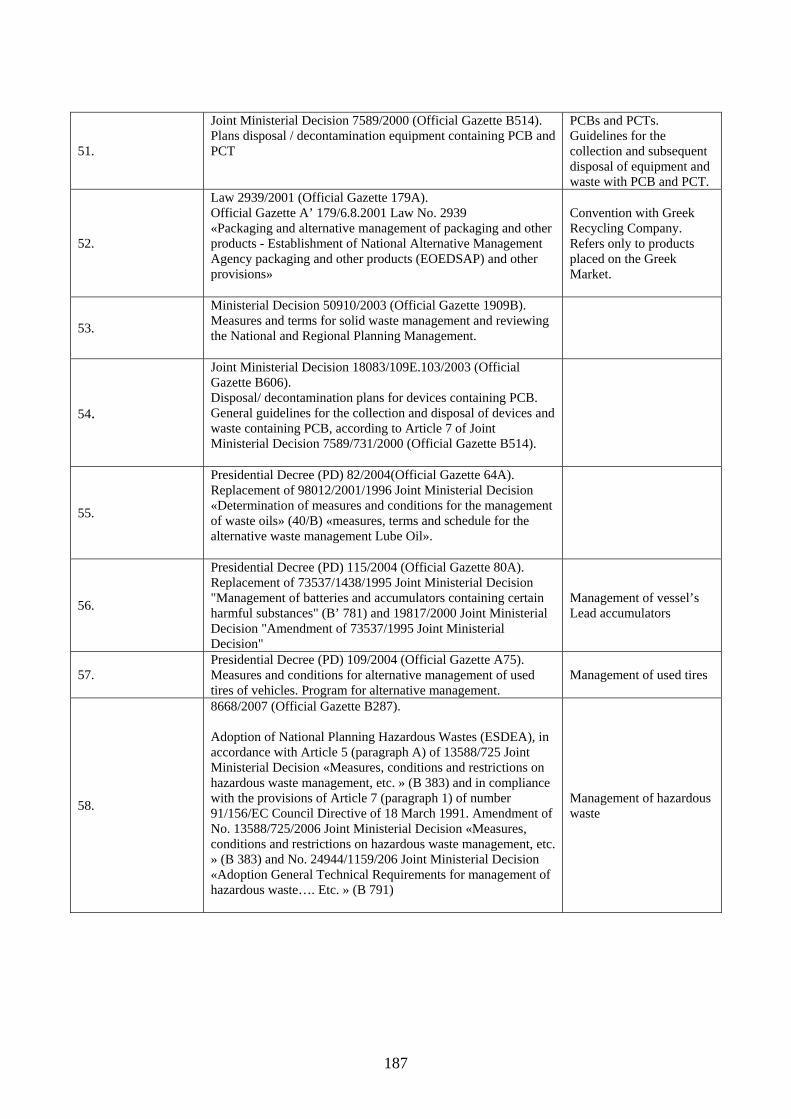
187
51.
Joint Ministerial Decision 7589/2000 (Official Gazette B514). Plans disposal / decontamination equipment containing PCB and PCT
PCBs and PCTs. Guidelines for the collection and subsequent disposal of equipment and waste with PCB and PCT.
52.
Law 2939/2001 (Official Gazette 179A). Official Gazette A’ 179/6.8.2001 Law No. 2939 «Packaging and alternative management of packaging and other products - Establishment of National Alternative Management Agency packaging and other products (EOEDSAP) and other provisions»
Convention with Greek Recycling Company. Refers only to products placed on the Greek Market.
53.
Ministerial Decision 50910/2003 (Official Gazette 1909B). Measures and terms for solid waste management and reviewing the National and Regional Planning Management.
54.
Joint Ministerial Decision 18083/109E.103/2003 (Official Gazette B606). Disposal/ decontamination plans for devices containing PCB. General guidelines for the collection and disposal of devices and waste containing PCB, according to Article 7 of Joint Ministerial Decision 7589/731/2000 (Official Gazette B514).
55.
Presidential Decree (PD) 82/2004(Official Gazette 64A). Replacement of 98012/2001/1996 Joint Ministerial Decision «Determination of measures and conditions for the management of waste oils» (40/B) «measures, terms and schedule for the alternative waste management Lube Oil».
56.
Presidential Decree (PD) 115/2004 (Official Gazette 80A). Replacement of 73537/1438/1995 Joint Ministerial Decision "Management of batteries and accumulators containing certain harmful substances" (B’ 781) and 19817/2000 Joint Ministerial Decision "Amendment of 73537/1995 Joint Ministerial Decision"
Management of vessel’s Lead accumulators
57. Presidential Decree (PD) 109/2004 (Official Gazette A75). Measures and conditions for alternative management of used tires of vehicles. Program for alternative management.
Management of used tires
58.
8668/2007 (Official Gazette B287). Adoption of National Planning Hazardous Wastes (ESDEA), in accordance with Article 5 (paragraph A) of 13588/725 Joint Ministerial Decision «Measures, conditions and restrictions on hazardous waste management, etc. » (B 383) and in compliance with the provisions of Article 7 (paragraph 1) of number 91/156/EC Council Directive of 18 March 1991. Amendment of No. 13588/725/2006 Joint Ministerial Decision «Measures, conditions and restrictions on hazardous waste management, etc. » (B 383) and No. 24944/1159/206 Joint Ministerial Decision «Adoption General Technical Requirements for management of hazardous waste…. Etc. » (B 791)
Management of hazardous waste
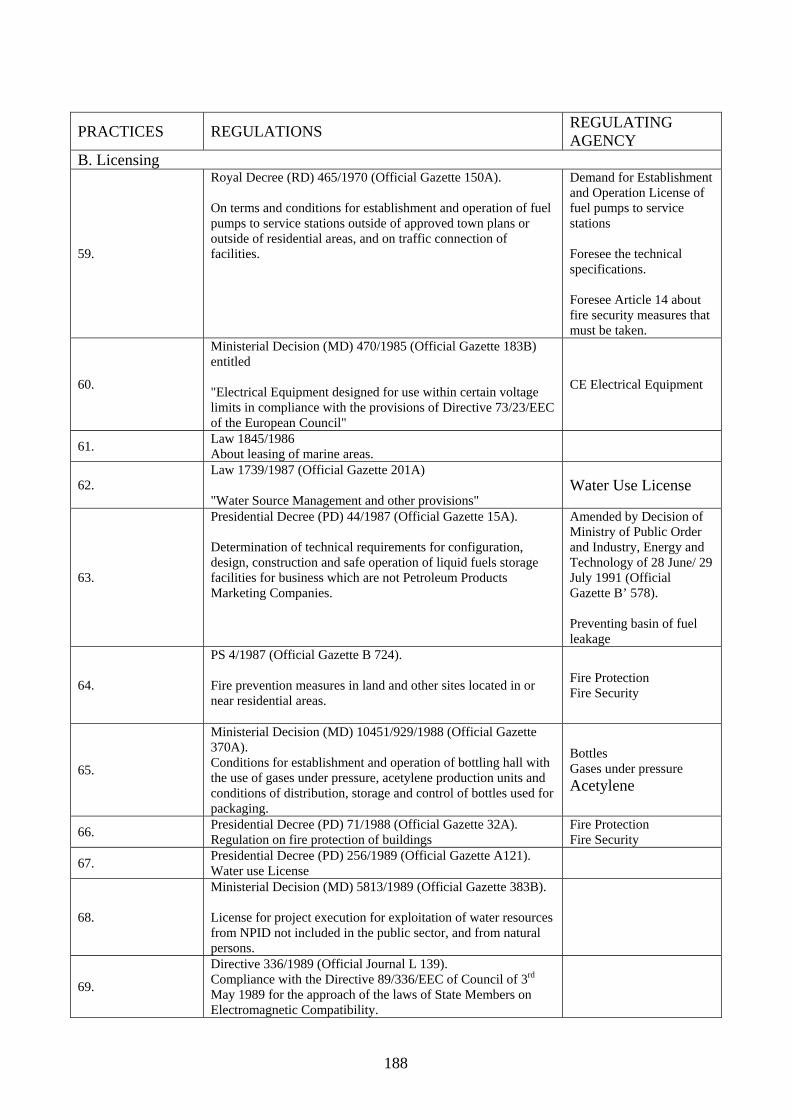
188
PRACTICES REGULATIONS REGULATING AGENCY
B. Licensing
59.
Royal Decree (RD) 465/1970 (Official Gazette 150A). On terms and conditions for establishment and operation of fuel pumps to service stations outside of approved town plans or outside of residential areas, and on traffic connection of facilities.
Demand for Establishment and Operation License of fuel pumps to service stations Foresee the technical specifications. Foresee Article 14 about fire security measures that must be taken.
60.
Ministerial Decision (MD) 470/1985 (Official Gazette 183B) entitled "Electrical Equipment designed for use within certain voltage limits in compliance with the provisions of Directive 73/23/EEC of the European Council"
CE Electrical Equipment
61. Law 1845/1986 About leasing of marine areas.
62. Law 1739/1987 (Official Gazette 201A) "Water Source Management and other provisions"
Water Use License
63.
Presidential Decree (PD) 44/1987 (Official Gazette 15A). Determination of technical requirements for configuration, design, construction and safe operation of liquid fuels storage facilities for business which are not Petroleum Products Marketing Companies.
Amended by Decision of Ministry of Public Order and Industry, Energy and Technology of 28 June/ 29 July 1991 (Official Gazette B’ 578). Preventing basin of fuel leakage
64.
PS 4/1987 (Official Gazette B 724). Fire prevention measures in land and other sites located in or near residential areas.
Fire Protection Fire Security
65.
Ministerial Decision (MD) 10451/929/1988 (Official Gazette 370A). Conditions for establishment and operation of bottling hall with the use of gases under pressure, acetylene production units and conditions of distribution, storage and control of bottles used for packaging.
Bottles Gases under pressure Acetylene
66. Presidential Decree (PD) 71/1988 (Official Gazette 32A). Regulation on fire protection of buildings
Fire Protection Fire Security
67. Presidential Decree (PD) 256/1989 (Official Gazette A121). Water use License
68.
Ministerial Decision (MD) 5813/1989 (Official Gazette 383B). License for project execution for exploitation of water resources from NPID not included in the public sector, and from natural persons.
69.
Directive 336/1989 (Official Journal L 139). Compliance with the Directive 89/336/EEC of Council of 3rd
May 1989 for the approach of the laws of State Members on Electromagnetic Compatibility.
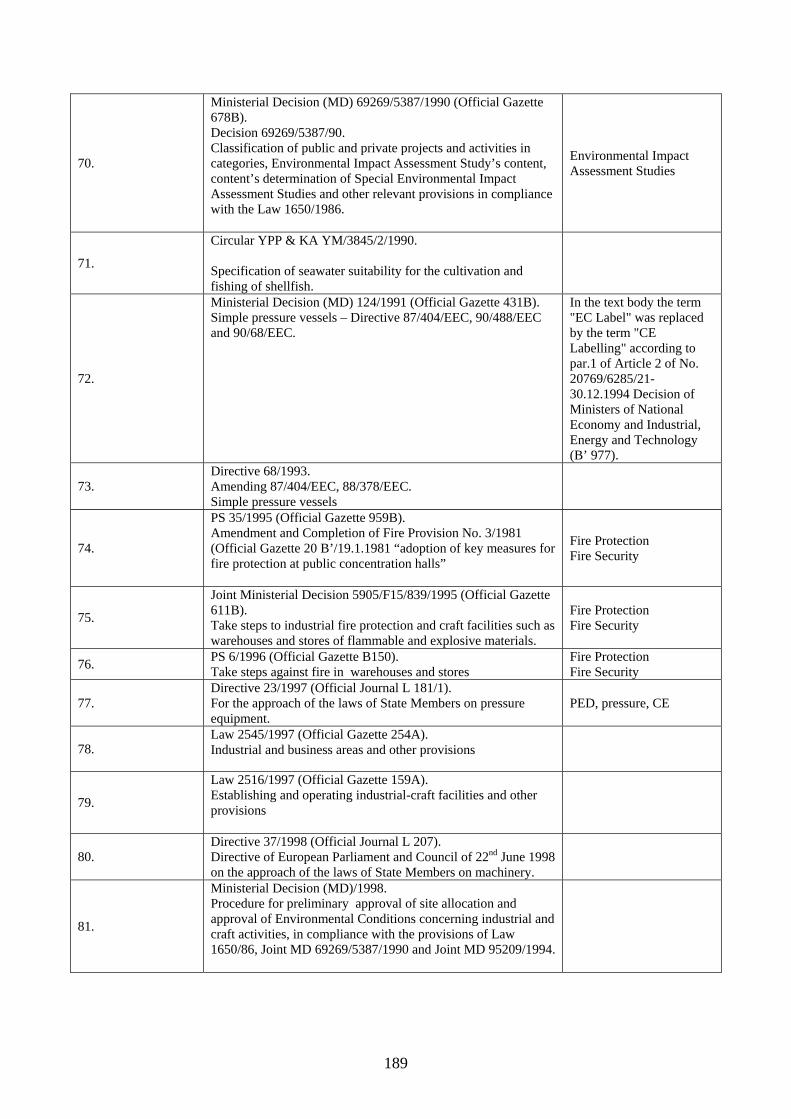
189
70.
Ministerial Decision (MD) 69269/5387/1990 (Official Gazette 678B). Decision 69269/5387/90. Classification of public and private projects and activities in categories, Environmental Impact Assessment Study’s content, content’s determination of Special Environmental Impact Assessment Studies and other relevant provisions in compliance with the Law 1650/1986.
Environmental Impact Assessment Studies
71.
Circular YPP & KA YM/3845/2/1990. Specification of seawater suitability for the cultivation and fishing of shellfish.
72.
Ministerial Decision (MD) 124/1991 (Official Gazette 431B). Simple pressure vessels – Directive 87/404/EEC, 90/488/EEC and 90/68/EEC.
In the text body the term "EC Label" was replaced by the term "CE Labelling" according to par.1 of Article 2 of No. 20769/6285/21-30.12.1994 Decision of Ministers of National Economy and Industrial, Energy and Technology (B’ 977).
73. Directive 68/1993. Amending 87/404/EEC, 88/378/EEC. Simple pressure vessels
74.
PS 35/1995 (Official Gazette 959B). Amendment and Completion of Fire Provision No. 3/1981 (Official Gazette 20 B’/19.1.1981 “adoption of key measures for fire protection at public concentration halls”
Fire Protection Fire Security
75.
Joint Ministerial Decision 5905/F15/839/1995 (Official Gazette 611B). Take steps to industrial fire protection and craft facilities such as warehouses and stores of flammable and explosive materials.
Fire Protection Fire Security
76. PS 6/1996 (Official Gazette B150). Take steps against fire in warehouses and stores
Fire Protection Fire Security
77. Directive 23/1997 (Official Journal L 181/1). For the approach of the laws of State Members on pressure equipment.
PED, pressure, CE
78. Law 2545/1997 (Official Gazette 254A). Industrial and business areas and other provisions
79.
Law 2516/1997 (Official Gazette 159A). Establishing and operating industrial-craft facilities and other provisions
80. Directive 37/1998 (Official Journal L 207). Directive of European Parliament and Council of 22nd June 1998 on the approach of the laws of State Members on machinery.
81.
Ministerial Decision (MD)/1998. Procedure for preliminary approval of site allocation and approval of Environmental Conditions concerning industrial and craft activities, in compliance with the provisions of Law 1650/86, Joint MD 69269/5387/1990 and Joint MD 95209/1994.
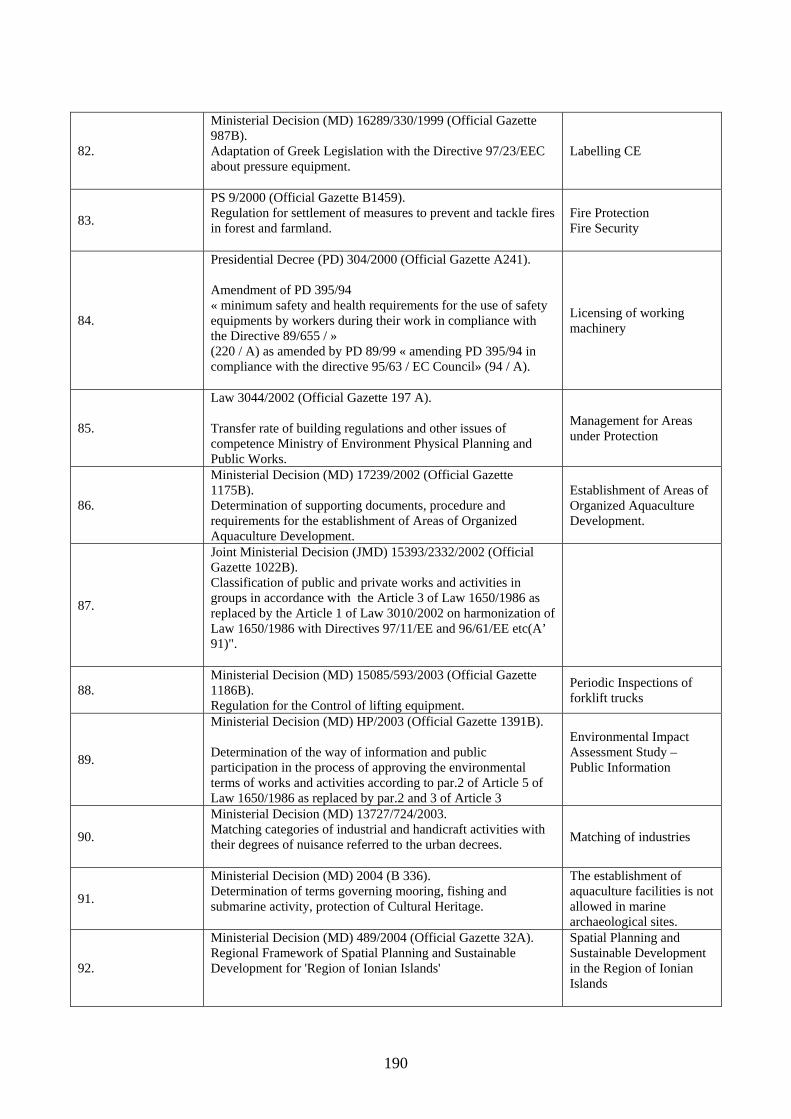
190
82.
Ministerial Decision (MD) 16289/330/1999 (Official Gazette 987B). Adaptation of Greek Legislation with the Directive 97/23/EEC about pressure equipment.
Labelling CE
83.
PS 9/2000 (Official Gazette B1459). Regulation for settlement of measures to prevent and tackle fires in forest and farmland.
Fire Protection Fire Security
84.
Presidential Decree (PD) 304/2000 (Official Gazette A241). Amendment of PD 395/94 « minimum safety and health requirements for the use of safety equipments by workers during their work in compliance with the Directive 89/655 / » (220 / A) as amended by PD 89/99 « amending PD 395/94 in compliance with the directive 95/63 / EC Council» (94 / A).
Licensing of working machinery
85.
Law 3044/2002 (Official Gazette 197 A). Transfer rate of building regulations and other issues of competence Ministry of Environment Physical Planning and Public Works.
Management for Areas under Protection
86.
Ministerial Decision (MD) 17239/2002 (Official Gazette 1175B). Determination of supporting documents, procedure and requirements for the establishment of Areas of Organized Aquaculture Development.
Establishment of Areas of Organized Aquaculture Development.
87.
Joint Ministerial Decision (JMD) 15393/2332/2002 (Official Gazette 1022B). Classification of public and private works and activities in groups in accordance with the Article 3 of Law 1650/1986 as replaced by the Article 1 of Law 3010/2002 on harmonization of Law 1650/1986 with Directives 97/11/EE and 96/61/EE etc(A’ 91)".
88. Ministerial Decision (MD) 15085/593/2003 (Official Gazette 1186B). Regulation for the Control of lifting equipment.
Periodic Inspections of forklift trucks
89.
Ministerial Decision (MD) HP/2003 (Official Gazette 1391B). Determination of the way of information and public participation in the process of approving the environmental terms of works and activities according to par.2 of Article 5 of Law 1650/1986 as replaced by par.2 and 3 of Article 3
Environmental Impact Assessment Study – Public Information
90.
Ministerial Decision (MD) 13727/724/2003. Matching categories of industrial and handicraft activities with their degrees of nuisance referred to the urban decrees.
Matching of industries
91.
Ministerial Decision (MD) 2004 (B 336). Determination of terms governing mooring, fishing and submarine activity, protection of Cultural Heritage.
The establishment of aquaculture facilities is not allowed in marine archaeological sites.
92.
Ministerial Decision (MD) 489/2004 (Official Gazette 32A). Regional Framework of Spatial Planning and Sustainable Development for 'Region of Ionian Islands'
Spatial Planning and Sustainable Development in the Region of Ionian Islands
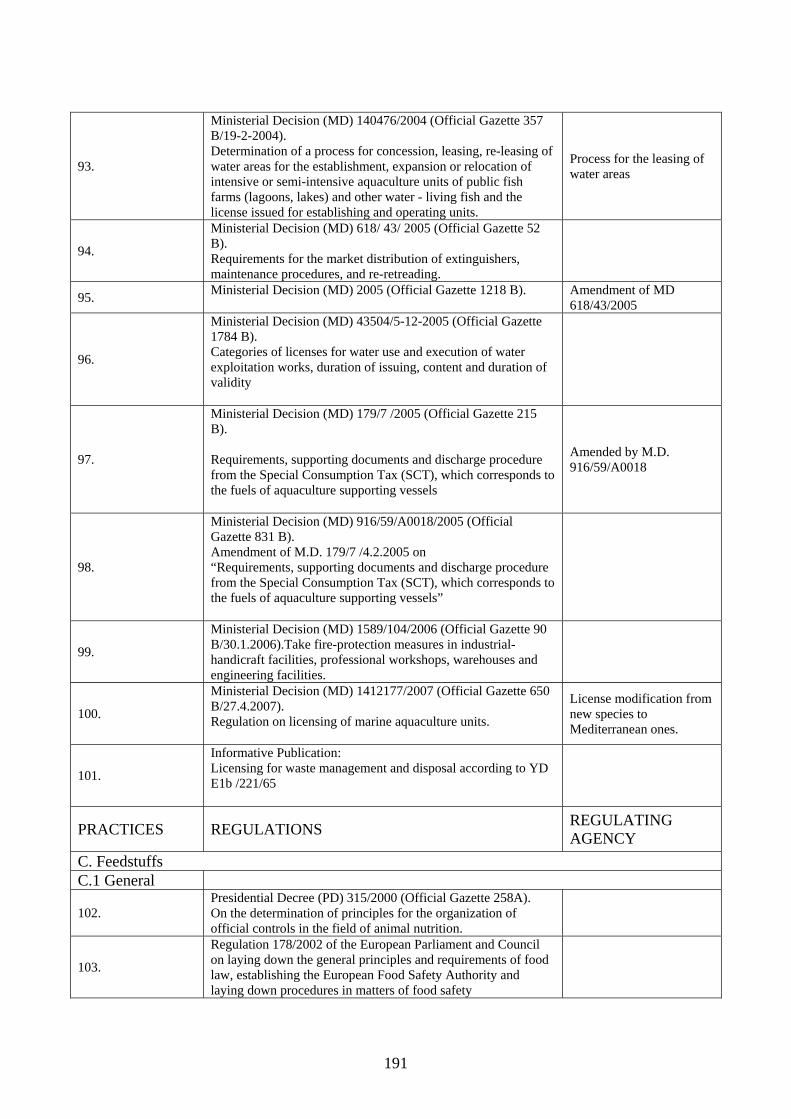
191
93.
Ministerial Decision (MD) 140476/2004 (Official Gazette 357 B/19-2-2004). Determination of a process for concession, leasing, re-leasing of water areas for the establishment, expansion or relocation of intensive or semi-intensive aquaculture units of public fish farms (lagoons, lakes) and other water - living fish and the license issued for establishing and operating units.
Process for the leasing of water areas
94.
Ministerial Decision (MD) 618/ 43/ 2005 (Official Gazette 52 B). Requirements for the market distribution of extinguishers, maintenance procedures, and re-retreading.
95. Ministerial Decision (MD) 2005 (Official Gazette 1218 B). Amendment of MD 618/43/2005
96.
Ministerial Decision (MD) 43504/5-12-2005 (Official Gazette 1784 B). Categories of licenses for water use and execution of water exploitation works, duration of issuing, content and duration of validity
97.
Ministerial Decision (MD) 179/7 /2005 (Official Gazette 215 B). Requirements, supporting documents and discharge procedure from the Special Consumption Tax (SCT), which corresponds to the fuels of aquaculture supporting vessels
Amended by M.D. 916/59/A0018
98.
Ministerial Decision (MD) 916/59/A0018/2005 (Official Gazette 831 B). Amendment of M.D. 179/7 /4.2.2005 on “Requirements, supporting documents and discharge procedure from the Special Consumption Tax (SCT), which corresponds to the fuels of aquaculture supporting vessels”
99.
Ministerial Decision (MD) 1589/104/2006 (Official Gazette 90 B/30.1.2006).Take fire-protection measures in industrial- handicraft facilities, professional workshops, warehouses and engineering facilities.
100.
Ministerial Decision (MD) 1412177/2007 (Official Gazette 650 B/27.4.2007). Regulation on licensing of marine aquaculture units.
License modification from new species to Mediterranean ones.
101.
Informative Publication: Licensing for waste management and disposal according to YD E1b /221/65
PRACTICES REGULATIONS REGULATING AGENCY
C. Feedstuffs C.1 General
102. Presidential Decree (PD) 315/2000 (Official Gazette 258A). On the determination of principles for the organization of official controls in the field of animal nutrition.
103.
Regulation 178/2002 of the European Parliament and Council on laying down the general principles and requirements of food law, establishing the European Food Safety Authority and laying down procedures in matters of food safety
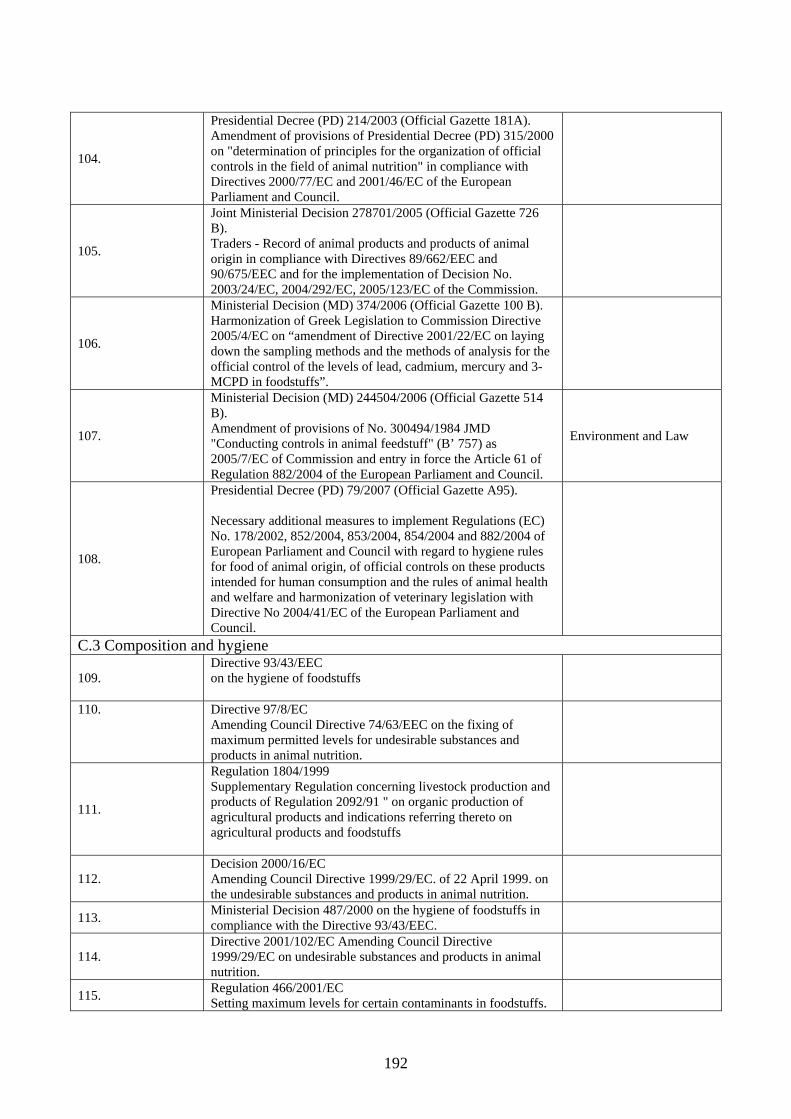
192
104.
Presidential Decree (PD) 214/2003 (Official Gazette 181A). Amendment of provisions of Presidential Decree (PD) 315/2000 on "determination of principles for the organization of official controls in the field of animal nutrition" in compliance with Directives 2000/77/EC and 2001/46/EC of the European Parliament and Council.
105.
Joint Ministerial Decision 278701/2005 (Official Gazette 726 B). Traders - Record of animal products and products of animal origin in compliance with Directives 89/662/EEC and 90/675/EEC and for the implementation of Decision No. 2003/24/EC, 2004/292/EC, 2005/123/EC of the Commission.
106.
Ministerial Decision (MD) 374/2006 (Official Gazette 100 B). Harmonization of Greek Legislation to Commission Directive 2005/4/EC on “amendment of Directive 2001/22/EC on laying down the sampling methods and the methods of analysis for the official control of the levels of lead, cadmium, mercury and 3-MCPD in foodstuffs”.
107.
Ministerial Decision (MD) 244504/2006 (Official Gazette 514 B). Amendment of provisions of No. 300494/1984 JMD "Conducting controls in animal feedstuff" (B’ 757) as 2005/7/EC of Commission and entry in force the Article 61 of Regulation 882/2004 of the European Parliament and Council.
Environment and Law
108.
Presidential Decree (PD) 79/2007 (Official Gazette A95). Necessary additional measures to implement Regulations (EC) No. 178/2002, 852/2004, 853/2004, 854/2004 and 882/2004 of European Parliament and Council with regard to hygiene rules for food of animal origin, of official controls on these products intended for human consumption and the rules of animal health and welfare and harmonization of veterinary legislation with Directive No 2004/41/EC of the European Parliament and Council.
C.3 Composition and hygiene
109. Directive 93/43/EEC on the hygiene of foodstuffs
110.
Directive 97/8/EC Amending Council Directive 74/63/EEC on the fixing of maximum permitted levels for undesirable substances and products in animal nutrition.
111.
Regulation 1804/1999 Supplementary Regulation concerning livestock production and products of Regulation 2092/91 " on organic production of agricultural products and indications referring thereto on agricultural products and foodstuffs
112. Decision 2000/16/EC Amending Council Directive 1999/29/EC. of 22 April 1999. on the undesirable substances and products in animal nutrition.
113. Ministerial Decision 487/2000 on the hygiene of foodstuffs in compliance with the Directive 93/43/EEC.
114. Directive 2001/102/EC Amending Council Directive 1999/29/EC on undesirable substances and products in animal nutrition.
115. Regulation 466/2001/EC Setting maximum levels for certain contaminants in foodstuffs.
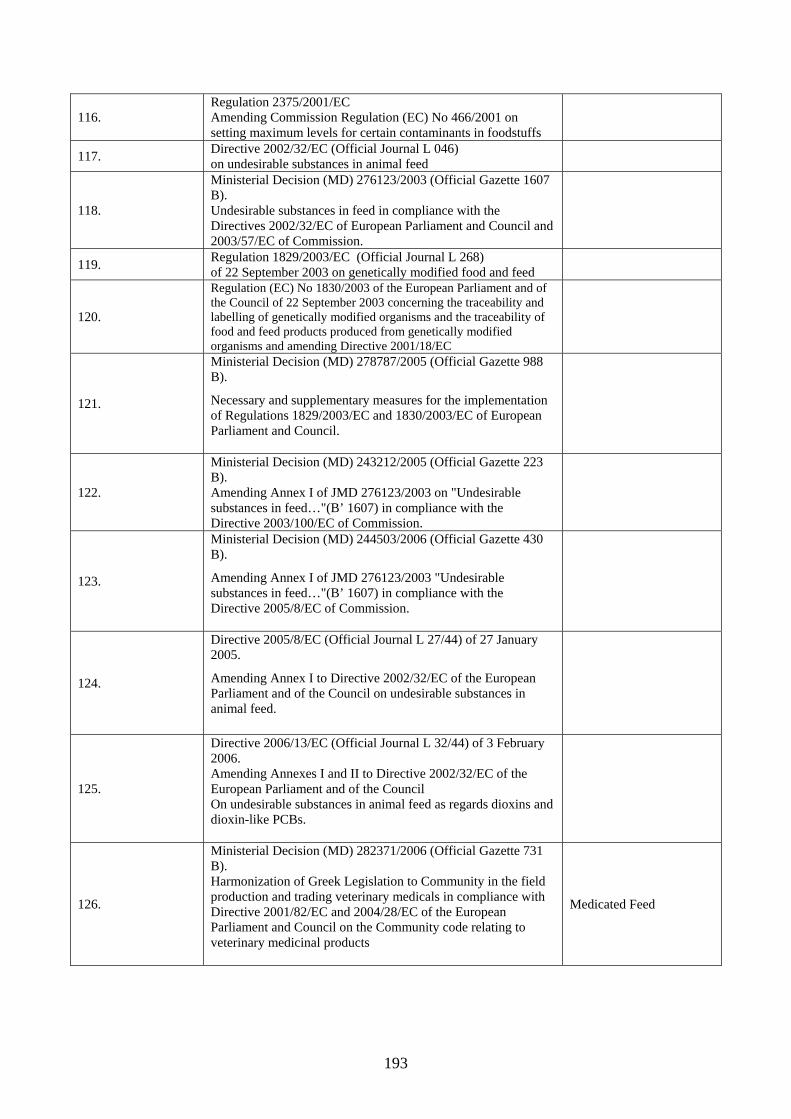
193
116. Regulation 2375/2001/EC Amending Commission Regulation (EC) No 466/2001 on setting maximum levels for certain contaminants in foodstuffs
117. Directive 2002/32/EC (Official Journal L 046) on undesirable substances in animal feed
118.
Ministerial Decision (MD) 276123/2003 (Official Gazette 1607 B). Undesirable substances in feed in compliance with the Directives 2002/32/EC of European Parliament and Council and 2003/57/EC of Commission.
119. Regulation 1829/2003/EC (Official Journal L 268) of 22 September 2003 on genetically modified food and feed
120.
Regulation (EC) No 1830/2003 of the European Parliament and of the Council of 22 September 2003 concerning the traceability and labelling of genetically modified organisms and the traceability of food and feed products produced from genetically modified organisms and amending Directive 2001/18/EC
121.
Ministerial Decision (MD) 278787/2005 (Official Gazette 988 B).
Necessary and supplementary measures for the implementation of Regulations 1829/2003/EC and 1830/2003/EC of European Parliament and Council.
122.
Ministerial Decision (MD) 243212/2005 (Official Gazette 223 B). Amending Annex I of JMD 276123/2003 on "Undesirable substances in feed…"(B’ 1607) in compliance with the Directive 2003/100/EC of Commission.
123.
Ministerial Decision (MD) 244503/2006 (Official Gazette 430 B).
Amending Annex I of JMD 276123/2003 "Undesirable substances in feed…"(B’ 1607) in compliance with the Directive 2005/8/EC of Commission.
124.
Directive 2005/8/EC (Official Journal L 27/44) of 27 January 2005.
Amending Annex I to Directive 2002/32/EC of the European Parliament and of the Council on undesirable substances in animal feed.
125.
Directive 2006/13/EC (Official Journal L 32/44) of 3 February 2006. Amending Annexes I and II to Directive 2002/32/EC of the European Parliament and of the Council On undesirable substances in animal feed as regards dioxins and dioxin-like PCBs.
126.
Ministerial Decision (MD) 282371/2006 (Official Gazette 731 B). Harmonization of Greek Legislation to Community in the field production and trading veterinary medicals in compliance with Directive 2001/82/EC and 2004/28/EC of the European Parliament and Council on the Community code relating to veterinary medicinal products
Medicated Feed
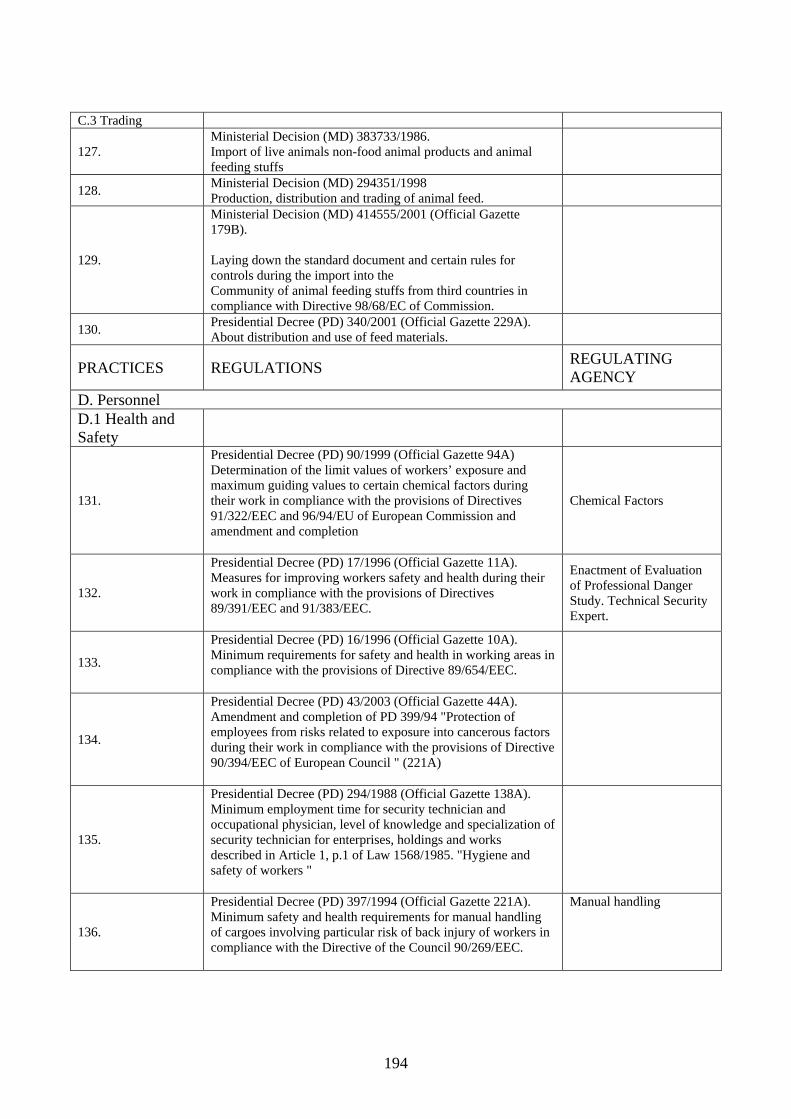
194
C.3 Trading
127. Ministerial Decision (MD) 383733/1986. Import of live animals non-food animal products and animal feeding stuffs
128. Ministerial Decision (MD) 294351/1998 Production, distribution and trading of animal feed.
129.
Ministerial Decision (MD) 414555/2001 (Official Gazette 179B). Laying down the standard document and certain rules for controls during the import into the Community of animal feeding stuffs from third countries in compliance with Directive 98/68/EC of Commission.
130. Presidential Decree (PD) 340/2001 (Official Gazette 229A). About distribution and use of feed materials.
PRACTICES REGULATIONS REGULATING AGENCY
D. Personnel D.1 Health and Safety
131.
Presidential Decree (PD) 90/1999 (Official Gazette 94A) Determination of the limit values of workers’ exposure and maximum guiding values to certain chemical factors during their work in compliance with the provisions of Directives 91/322/EEC and 96/94/EU of European Commission and amendment and completion
Chemical Factors
132.
Presidential Decree (PD) 17/1996 (Official Gazette 11A). Measures for improving workers safety and health during their work in compliance with the provisions of Directives 89/391/EEC and 91/383/EEC.
Enactment of Evaluation of Professional Danger Study. Technical Security Expert.
133.
Presidential Decree (PD) 16/1996 (Official Gazette 10A). Minimum requirements for safety and health in working areas in compliance with the provisions of Directive 89/654/EEC.
134.
Presidential Decree (PD) 43/2003 (Official Gazette 44A). Amendment and completion of PD 399/94 "Protection of employees from risks related to exposure into cancerous factors during their work in compliance with the provisions of Directive 90/394/EEC of European Council " (221A)
135.
Presidential Decree (PD) 294/1988 (Official Gazette 138A). Minimum employment time for security technician and occupational physician, level of knowledge and specialization of security technician for enterprises, holdings and works described in Article 1, p.1 of Law 1568/1985. "Hygiene and safety of workers "
136.
Presidential Decree (PD) 397/1994 (Official Gazette 221A). Minimum safety and health requirements for manual handling of cargoes involving particular risk of back injury of workers in compliance with the Directive of the Council 90/269/EEC.
Manual handling
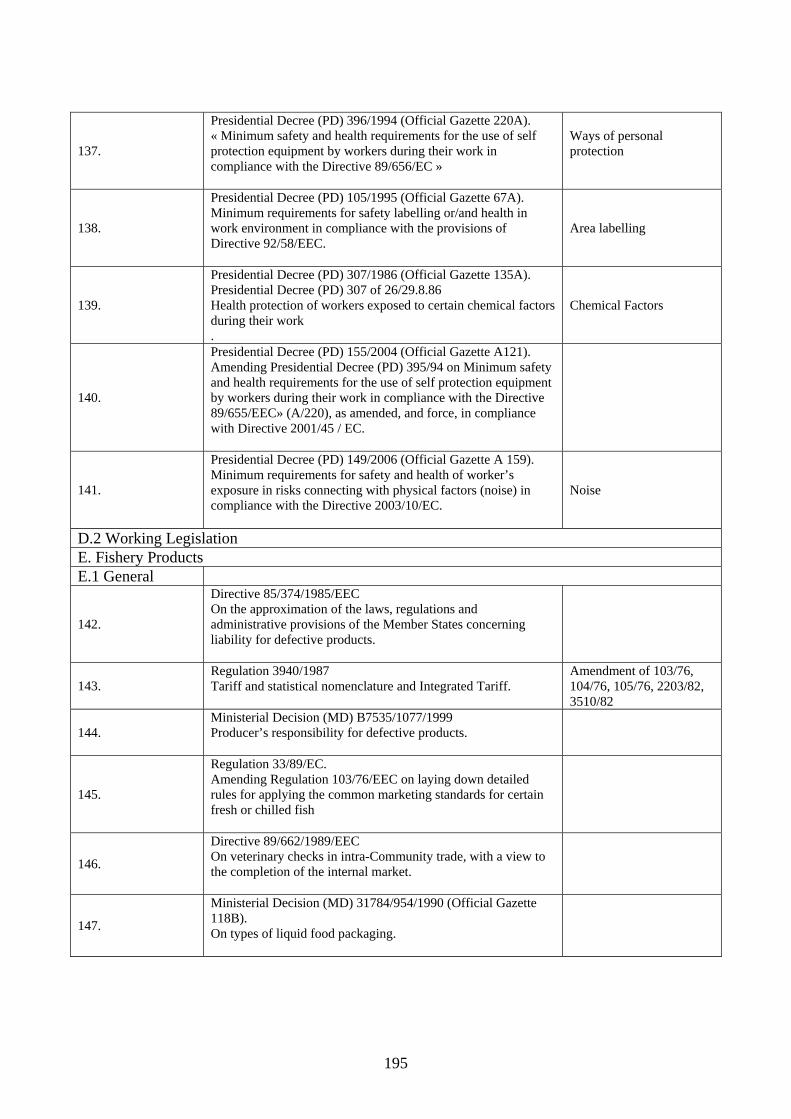
195
137.
Presidential Decree (PD) 396/1994 (Official Gazette 220A). « Minimum safety and health requirements for the use of self protection equipment by workers during their work in compliance with the Directive 89/656/EC »
Ways of personal protection
138.
Presidential Decree (PD) 105/1995 (Official Gazette 67A). Minimum requirements for safety labelling or/and health in work environment in compliance with the provisions of Directive 92/58/EEC.
Area labelling
139.
Presidential Decree (PD) 307/1986 (Official Gazette 135A). Presidential Decree (PD) 307 of 26/29.8.86 Health protection of workers exposed to certain chemical factors during their work .
Chemical Factors
140.
Presidential Decree (PD) 155/2004 (Official Gazette A121). Amending Presidential Decree (PD) 395/94 on Minimum safety and health requirements for the use of self protection equipment by workers during their work in compliance with the Directive 89/655/EEC» (A/220), as amended, and force, in compliance with Directive 2001/45 / EC.
141.
Presidential Decree (PD) 149/2006 (Official Gazette A 159). Minimum requirements for safety and health of worker’s exposure in risks connecting with physical factors (noise) in compliance with the Directive 2003/10/EC.
Noise
D.2 Working Legislation E. Fishery Products E.1 General
142.
Directive 85/374/1985/EEC On the approximation of the laws, regulations and administrative provisions of the Member States concerning liability for defective products.
143. Regulation 3940/1987 Tariff and statistical nomenclature and Integrated Tariff.
Amendment of 103/76, 104/76, 105/76, 2203/82, 3510/82
144. Ministerial Decision (MD) B7535/1077/1999 Producer’s responsibility for defective products.
145.
Regulation 33/89/EC. Amending Regulation 103/76/EEC on laying down detailed rules for applying the common marketing standards for certain fresh or chilled fish
146.
Directive 89/662/1989/EEC On veterinary checks in intra-Community trade, with a view to the completion of the internal market.
147.
Ministerial Decision (MD) 31784/954/1990 (Official Gazette 118B). On types of liquid food packaging.
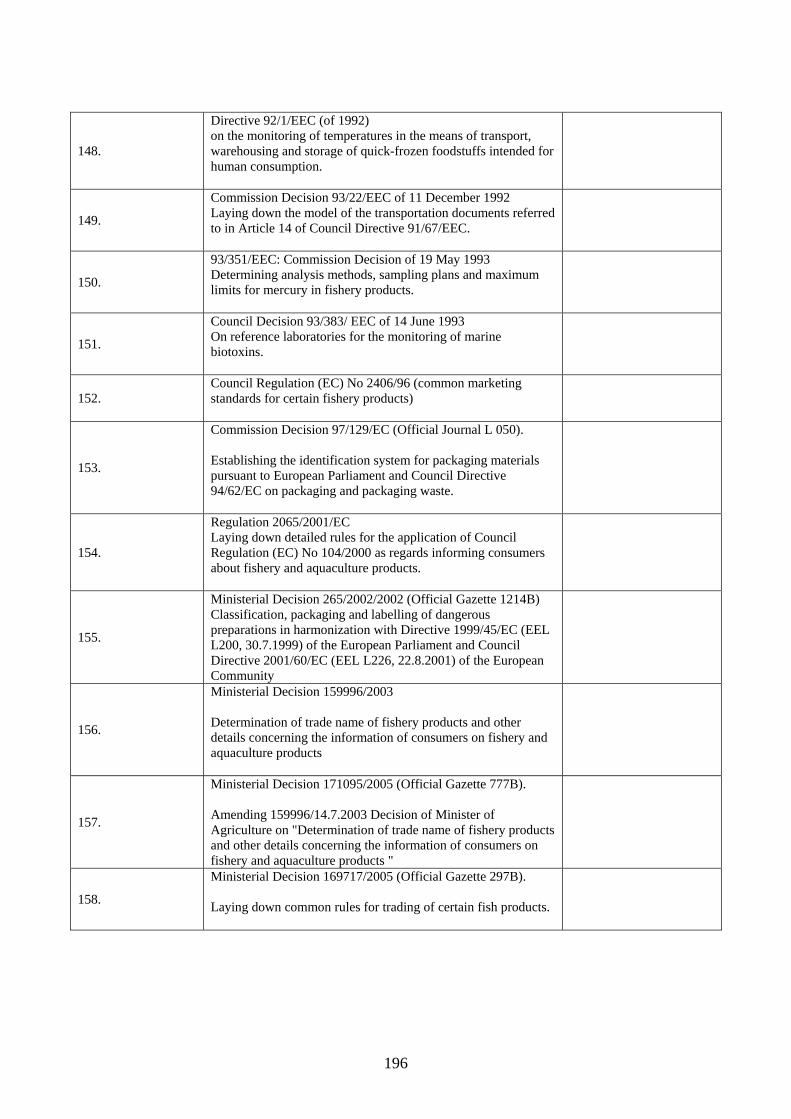
196
148.
Directive 92/1/EEC (of 1992) on the monitoring of temperatures in the means of transport, warehousing and storage of quick-frozen foodstuffs intended for human consumption.
149.
Commission Decision 93/22/EEC of 11 December 1992 Laying down the model of the transportation documents referred to in Article 14 of Council Directive 91/67/EEC.
150.
93/351/EEC: Commission Decision of 19 May 1993 Determining analysis methods, sampling plans and maximum limits for mercury in fishery products.
151.
Council Decision 93/383/ EEC of 14 June 1993 On reference laboratories for the monitoring of marine biotoxins.
152. Council Regulation (EC) No 2406/96 (common marketing standards for certain fishery products)
153.
Commission Decision 97/129/EC (Official Journal L 050). Establishing the identification system for packaging materials pursuant to European Parliament and Council Directive 94/62/EC on packaging and packaging waste.
154.
Regulation 2065/2001/EC Laying down detailed rules for the application of Council Regulation (EC) No 104/2000 as regards informing consumers about fishery and aquaculture products.
155.
Ministerial Decision 265/2002/2002 (Official Gazette 1214B) Classification, packaging and labelling of dangerous preparations in harmonization with Directive 1999/45/EC (EEL L200, 30.7.1999) of the European Parliament and Council Directive 2001/60/EC (EEL L226, 22.8.2001) of the European Community
156.
Ministerial Decision 159996/2003 Determination of trade name of fishery products and other details concerning the information of consumers on fishery and aquaculture products
157.
Ministerial Decision 171095/2005 (Official Gazette 777B). Amending 159996/14.7.2003 Decision of Minister of Agriculture on "Determination of trade name of fishery products and other details concerning the information of consumers on fishery and aquaculture products "
158.
Ministerial Decision 169717/2005 (Official Gazette 297B). Laying down common rules for trading of certain fish products.
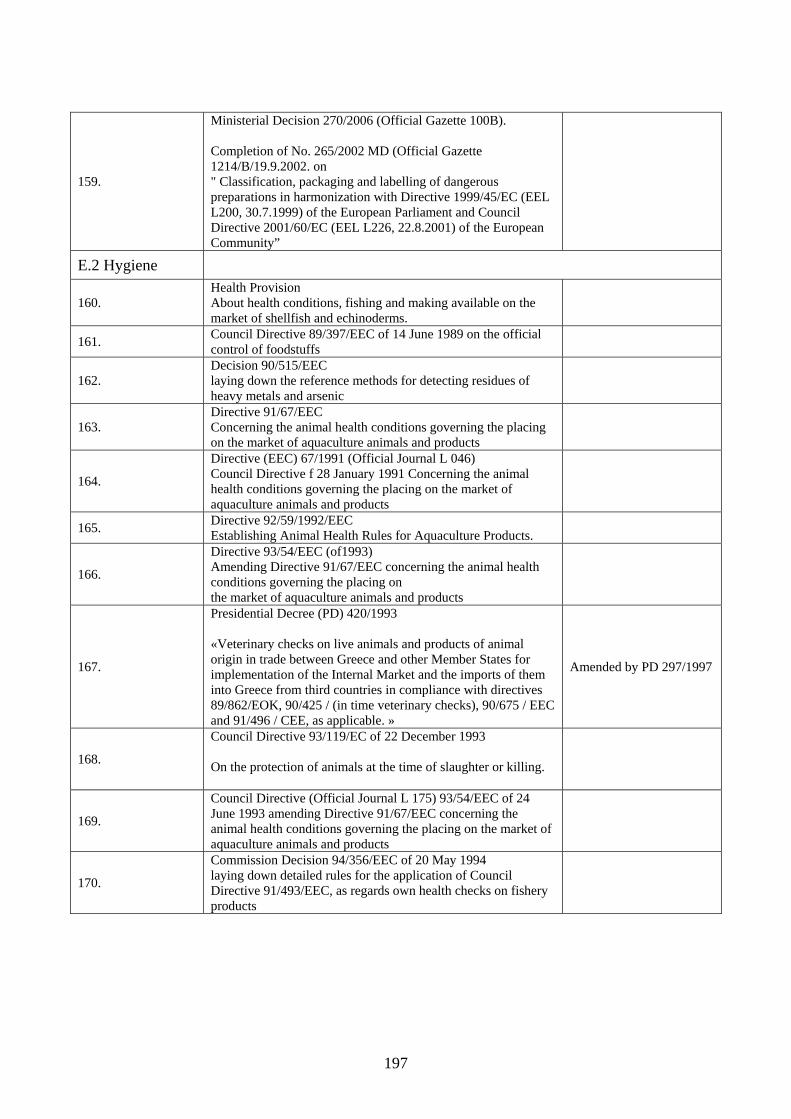
197
159.
Ministerial Decision 270/2006 (Official Gazette 100B). Completion of No. 265/2002 MD (Official Gazette 1214/B/19.9.2002. on " Classification, packaging and labelling of dangerous preparations in harmonization with Directive 1999/45/EC (EEL L200, 30.7.1999) of the European Parliament and Council Directive 2001/60/EC (EEL L226, 22.8.2001) of the European Community”
E.2 Hygiene
160. Health Provision About health conditions, fishing and making available on the market of shellfish and echinoderms.
161. Council Directive 89/397/EEC of 14 June 1989 on the official control of foodstuffs
162. Decision 90/515/EEC laying down the reference methods for detecting residues of heavy metals and arsenic
163. Directive 91/67/EEC Concerning the animal health conditions governing the placing on the market of aquaculture animals and products
164.
Directive (EEC) 67/1991 (Official Journal L 046) Council Directive f 28 January 1991 Concerning the animal health conditions governing the placing on the market of aquaculture animals and products
165. Directive 92/59/1992/EEC Establishing Animal Health Rules for Aquaculture Products.
166.
Directive 93/54/EEC (of1993) Amending Directive 91/67/EEC concerning the animal health conditions governing the placing on the market of aquaculture animals and products
167.
Presidential Decree (PD) 420/1993 «Veterinary checks on live animals and products of animal origin in trade between Greece and other Member States for implementation of the Internal Market and the imports of them into Greece from third countries in compliance with directives 89/862/EOK, 90/425 / (in time veterinary checks), 90/675 / EEC and 91/496 / CEE, as applicable. »
Amended by PD 297/1997
168.
Council Directive 93/119/EC of 22 December 1993 On the protection of animals at the time of slaughter or killing.
169.
Council Directive (Official Journal L 175) 93/54/EEC of 24 June 1993 amending Directive 91/67/EEC concerning the animal health conditions governing the placing on the market of aquaculture animals and products
170.
Commission Decision 94/356/EEC of 20 May 1994 laying down detailed rules for the application of Council Directive 91/493/EEC, as regards own health checks on fishery products
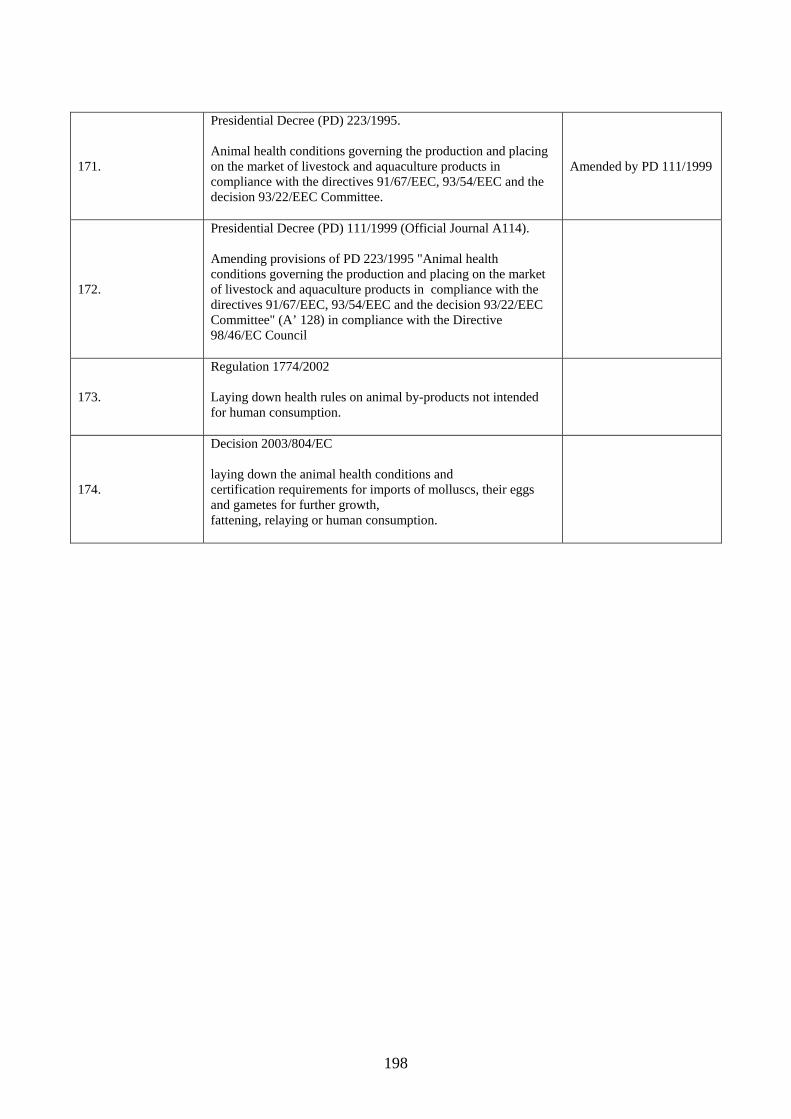
198
171.
Presidential Decree (PD) 223/1995. Animal health conditions governing the production and placing on the market of livestock and aquaculture products in compliance with the directives 91/67/EEC, 93/54/EEC and the decision 93/22/EEC Committee.
Amended by PD 111/1999
172.
Presidential Decree (PD) 111/1999 (Official Journal A114). Amending provisions of PD 223/1995 "Animal health conditions governing the production and placing on the market of livestock and aquaculture products in compliance with the directives 91/67/EEC, 93/54/EEC and the decision 93/22/EEC Committee" (A’ 128) in compliance with the Directive 98/46/EC Council
173.
Regulation 1774/2002 Laying down health rules on animal by-products not intended for human consumption.
174.
Decision 2003/804/EC laying down the animal health conditions and certification requirements for imports of molluscs, their eggs and gametes for further growth, fattening, relaying or human consumption.
ÉTUDES ET REVUES DE LA CGPM DÉJÀ PUBLIÉES GFCM STUDIES AND REVIEWS ALREADY ISSUED 1 Standardisation de méthodes d'étude biométrique et d'observation de clupéidés (en particulier de Sardina
pilchardus) utilisées en biologie des pêches. Division des pêches de la FAO. 1957 1 Standardization of biometric and observation methods for Clupeidae (especially Sardina pilchardus) used in
fisheries biology. FAO Fisheries Division. 1957 2 Le Chalutage en Méditerranée – Observations préliminaires sur les chaluts italiens. Division des pêches de la
FAO. 1957 2 Mediterranean trawling Preliminary observations in the study of Italian trawl nets. FAO Fisheries Division. 1957 3 La pollution des eaux provoquée par les déversements des sucreries. C. Maldura et P. Vivier. 1958 3 Water pollution caused by wastes from sugar refineries. C. Maldura and P. Vivier. 1958 4 Filets tournants et coulissants en fibres synthétiques. G. Klust. 1958 4 Ring nets made of synthetic fibres. G. Klust. 1958 5 La pisciculture dans les eaux intérieures des pays membres du CGPM. Secrétariat du CGPM. 1959 5 Inland water fisheries in the GFCM member countries. Secretariat of the GFCM. 1959 6 Le chalutage en Méditerranée. Deuxième et troisième rapports. Division des pêches de la FAO. 1959 6 Mediterranean trawling. Second and third reports. FAO Fisheries Division. 1959 7 La technique des pêcheries dans les lagunes saumâtres. R. de Angelis. 1959 7 Fishing installations in brackish lagoons. R. de Angelis. 1959 8 La situation de la pêche en Italie, en particulier dans le secteur de la distribution. P. Pagliazzi. 1959 8 Situation of the fishing industry in Italy, particularly regarding distribution. P. Pagliazzi. 1959 9 Documentation graphique sur certains engins de pêche utilisés dans les lagunes littorales espagnoles. F. Lozano
Cabo. 1959 9 Graphic documentation on some fishing gear used in Spanish coastal lagoons. F. Lozano Cabo. 1959 10 Le chalutage en Méditerranée Quatrième rapport. J. Schärfe, Division des pêches de la FAO. 1960 10 Mediterranean trawling. Fourth report. J. Schärfe, FAO Fisheries Division. 1960 11 Le traitement du fond des étangs piscicoles et ses effets sur la productivité. La pisciculture dans divers pays
européens. A. G. Wurtz. 1960 11 Methods of treating the bottom of fish ponds and their effects on productivity. Fish culture in certain European
countries. A. G. Wurtz. 1960 12 Exploitation et description des lagunes saumâtres de la Méditerranée. R. de Angelis. 1960 12 Mediterranean brackish water lagoons and their exploitation. R. de Angelis. 1960 13 Contrôle d'un chalut opérant entre deux eaux ou sur le fond et tiré par un seul bateau. J. Schärfe, Division des
pêches de la FAO. 1960 13 A new method for "aimed" one-boat trawling in mid-water and on the bottom. J. Schärfe, FAO Fisheries
Division. 1960
14 Le chalutage en Méditerranée. Cinquième rapport. J. Schärfe, Division des pêches de la FAO. 1961 14 Mediterranean trawling. Fifth report. J. Schärfe, FAO Fisheries Division. 1961 15 La madrague sicilienne de course. V. Fodera. 1961 15 The Sicilian tuna trap. V. Fodera. 1961 16 Influence de la température et de l'éclairement sur la distribution des crevettes des moyennes et grandes
profondeurs. W. Ghidalia et F. Bourgois. 1961 16 The influence of temperature and light on the distribution of shrimps in medium and great depths. W. Ghidalia
and F. Bourgois. 1961 17 L'amélioration des techniques de la pêche au feu. F. Bourgois et L. Farina, Experts de la FAO. 1961 17 Improvements of techniques for fishing with lights. F. Bourgois and L. Farina, FAO Experts. 1961 18 L'élevage des huîtres en parcs flottants. M. Nikolic et I. Stojnic. 1962 18 A sytem of oyster culture on floating shellfish parks. M. Nikolic and I. Stojnic. 1962 19 Pêche au feu. R. Sarà. 1962 19 Light fishing. R. Sarà. 1962 20 Réglementation en vigueur sur la pêche de la sardine en Méditerranée. Service d'études législatives de la FAO.
1963 20 Existing regulations for sardine fishing in the Mediterranean. FAO Legislation Research Branch. 1963 21 Diagnoses démographiques sur les populations de poissons dans les cours d'eau à truites. R. Cuinat et
R. Vibert. 1963 21 Demographic diagnosis on fish populations in trout streams. R. Cuinat and R. Vibert. 1963 22 Dommages causés par les marsouins et autres animaux marins déprédateurs en Méditerranée. C. Ravel. 1963 22 Damage caused by porpoises and other other predatory marine animals in the Mediterranean. C. Ravel. 1963 23 Etudes sur la sardine (Sardina pilchardus Walb.) et l'anchois (Engraulis encrasicholus L.) dans le golfe de Naples
et sur leur comportement sous l'influence de la lumière artificielle. O. Dragesund. 1964 23 Studies on the sardine (Sardina pilchardus Walb.) and anchovy (Engraulis encrasicholus L.) in the Gulf of
Naples and their behaviour in artificial light. O. Dragesund. 1964 24 Réglementations concernant certaines industries de transformation des produits des pêches maritimes dans les
pays méditerranéens. D. Rémy. 1964 24 Regulations on certain sea food processing industries in Mediterranean countries. D. Rémy. 1964 25 Sur la valeur des anneaux nets pour la détermination de l'âge des sardines (Sardina pilchardus Walb.).
R. Muzinic. 1964 25 The value of sharp rings for the age determination of sardine (Sardina pilchardus Walb.). R. Muzinic. 1964 26 Revue critique des effets des détergents synthétiques sur la vie aquatique. R. Marchetti. 1965 26 Critical review of the effects of synthetic detergents on aquatic life. R. Marchetti. 1965 27 Méthodes permettant d'économiser la main-d'oeuvre à bord des chalutiers méditerranéens. M. Ben-Yami. 1965 27 Labour-saving methods on board Mediterranean trawlers. M. Ben-Yami. 1965
28 La distribution et la commercialisation du poisson en Sicile. G. Bombace. 1965 28 Preliminary report on fish distribution and marketing in Sicily. G. Bombace. 1965 29 Réglementation sanitaire des mollusques. R. Coppini. 1965 29 Sanitary regulations for molluscs. R. Coppini. 1965 30 L'élevage de la truite fario et de la truite arc-en-ciel dans les eaux à température très élevée. E.G. Calderon.
1965 30 The raising of brown trout and rainbow trout in water at high temperatures. E.G. Calderon. 1965 30 (Suppl.1) Suite des études sur les possibilités de développement de la salmoniculture en eaux chaudes. E.G.
Calderon. 1968 31 Mortalité initiale de la sardine dans les conditions expérimentales et mortalité due au marquage. R. Muzinic.
1966 31 Initial mortality of the sardine under experimental conditions and in the tagging work. R. Muzinic. 1966 32 Study of hake (Merluccius merluccius L.) biology and population dynamics in the central Adriatic.
S. Zupanovic. 1968 33 Unités de stock de la sardine de la Méditerranée occidentale et de l'Adriatique. M.G. Larrañeta. 1968 34 The system of currents in the Adriatic Sea. M. Zore-Armanda. 1968 35 Investigations of mullet fisheries by beach seine on the U.A.R. Mediterranean coast. S. Zaky Rafail. Rehabilitation of the fisheries of an inland saline lake in the United Arab Republic. S. El Zarka. Variations annuelles des captures de mulet dans le lac de Varna. D. Morovic. 1968 36 Aquarium tagging experiments on sardines with anchor tags by the use of tricaine methane sulfonate.
R. Muzinic. 1968 37 Fishery of the green crab (Carcinus maenas L.) and soft crab cultivation in the lagoon of Venice. S. Varagnolo. Results obtained by geological charting of trawling grounds in the channels of the northern Adriatic.
S. Alfierivic. Effects of fresh water and saturated sea-water brine on the survival of mussels, oysters and some epibionts on
them. M. Hrs. Brenko and L. Igic. 1968 38 The weight-length relationship of United Arab Republic Sardinella. A.M. El-Maghraby Distribution et densité des oeufs de sardines (Sardina pilchardus Walb.) dans l'Adriatique centrale au cours de
la saison 1965/66. J. Karlovac Coincidence and alternation in Yugoslav pelagic fisheries. R. Muzinic. 1969 39 Selectivity of gillnets for Nile perch (Lates niloticus L.). R. Koura and A.A. Shaheen. Cod end mesh size effect on Italian otter trawl efficiency. R. Koura. 1969 40 Studies on the life history of Adriatic sprat. N. and D. Zavodnik. 1969 41 Note préliminaire à l'étude de la production primaire dans l'Adriatique centrale. T. Pucher-Petkovic. Long term observation of plankton fluctuation in the central Adriatic. T. Vucetic and T. Pucher-Petkovic. Relation between some factors affecting productivity and fish catch in the central Adriatic area. M. Buljan. 1969 42 Long line Mediterranean fisheries studies west of Alexandria. S.Z. Rafail; W.L. Daoud and M.M. Hilal. 1969 43 Marine resource of the United Arab Republic. A.A. Aleem. 1969
44 Les ressources vivantes des eaux profondes de la Méditerranée occidentale et leur exploitation. Groupe d'experts du CGPM. 1970
44 Living deep water resources of the western Mediterranean and their exploitation. GFCM Group of Experts.
1970 45 Quelques techniques de fumage du poisson applicables dans la zone méditerranéenne. H. Lizac, Département
des pêches de la FAO. 1971 45 Some techniques of smoking fish applicable in the Mediterranean area. H. Lisac, FAO Fisheries Department.
1970 46 Studies on the distribution, growth and abundance of migrating fry and juveniles of mullet in a brackish coastal
lake (Edku) in the United Arab Republic. S. E. Zarka; A.M. El-Maghraby and Kh. Abdel-Hamid. 1970 47 On the use of anaesthetics in the transportation of sardines. R. Muzinic. 1970 48 Investigations on Sciaenidae and Moronidae catches and on the total catch by beach seine on the U.A.R.
Mediterranean coast. S.Z. Rafail. Studies on the population and the catchability of Norway lobster in the central Adriatic. S. Jukic. 1971 49 Evolution de la pêche sur le talus du plateau continental des îles Baléares entre 1940 et 1969. M. Massuti. Explorations of the possible deep-water trawling grounds in the Levant Basin. O.H. Oren; M. Ben-Yami and L.
Zismann. 1971 50 Commercialisation du poisson frais et congelé dans certains pays méditerranéens. CGPM. 1971 50 Marketing of fresh and frozen fish in Mediterranean countries. GFCM. 1971 51 Etat de la pollution marine en Méditerranée et réglementation. CGPM. 1972 51 The state of marine pollution in the Mediterranean and legislative controls. GFCM. 1972 52 Aquaculture en eau saumâtre dans la région méditerranéenne. CGPM. 1973 52 Brackish water aquaculture in the Mediterranean region. GFCM. 1973 53 Fuel consumption as an index of fishing effort. D. Levi and G. Giannetti. Fluctuations of zooplankton and echo-trace abundance in the central Adriatic. T. Vucetic and I. Kacic. 1973 54 Study of fish populations by capture data and the value of tagging experiments. S. Zaky Rafail. Les ressources halieutiques de la Méditerranée et de la mer Noire. D. Levi et J.-P. Troadec. Perspectives for fisheries development to 1985 in the GFCM Member Nations. GFCM Secretariat. 1974 54 Study of fish populations by capture data and the value of tagging experiments. S. Zaky Rafail. The fish resources of the Mediterranean and the Black Sea. D. Levi and J.-P. Troadec. Perspectives for fisheries development to 1985 in the GFCM Member Nations. GFCM Secretariat. 1974 55 Ponte contrôlée et élevage des larves d'espèces marines sélectionnées de la Méditerranée. CGPM Controlled breeding and larval rearing of selected Mediterranean marine species. GFCM. 1976 56 Données sur les bateaux et engins de pêche en Méditerranée. P.-Y. Dremière et C. Nédélec. 1977 56 Data on fishing vessels and gear in the Mediterranean. P.-Y. Dremière and C. Nédélec. 1977 57 Quelques aspects de la culture du poisson et des crustacés en eau saumâtre en Méditerranée. CGPM. 1981
57 Aspects of brackish water fish and crustacean culture in the Mediterranean. GFCM. 1980 58 Aménagement des ressources vivantes dans la zone littorale de la Méditerranée. CGPM. 1981 58 Management of living resources in the Mediterranean coastal area. GFCM. 1981 59 Les ressources halieutiques de la Méditerranée. Première partie: Méditerranée occidentale. P. Oliver. 1983 59 Los recursos pesqueros del Mediterráneo. Primera parte: Mediterráneo occidental. P. Oliver. 1983 60 The fisheries resources of the Mediterranean. Part two: Black Sea. L. Ivanov and R.J.H. Beverton.1985 61 Aménagement des pêches dans les lagunes côtières. J.M. Kapetsky et G. Lasserre. 1984 61 Management of coastal lagoon fisheries. J.M. Kapetsky and G. Lasserre. 1984 62 Evolution des techniques de la pêche italienne. 1987 62 Evolution of technology in Italian fisheries. 1987 63 Tendances récentes des pêches et de l'environnement dans la zone couverte par le Conseil général des pêches
pour la Méditerranée (CGPM). J.F. Caddy et R.C. Griffiths. 1990 63 Recent trends in the fisheries and environment in the General Fisheries Council for the Mediterranean (GFCM)
area. J.F. Caddy and R.C. Griffiths. 1990 64 Fisheries and environment studies in the Black Sea. Part 1: V.G. Dubinina and A.D. Semenov. Part 2:
Yu. P. Zaitzsev. Part 3: A. Kocatas, T. Koray, M. Kaya and O.F. Kara. 65 A review of the state of the fisheries and the environment of the Northeastern Mediterranean (Northern
Levantine Basin). F. Bingel, E. Ozsoy and U. Unluata. 1993 65 Etude de l'état des pêches et de l'environnement dans la Méditerranée du Nord-Est (bassin levantin
septentrional). F. Bingel, E. Ozsoy et U. Unluata. 1997 66 Resource and Environmental Issues Relevant to Mediterranean Fisheries Management. 1996 66 Questions concernant les ressources et l'environnement dans la gestion des pêcheries méditerranéennes. 1997 67 Introduction of mullet haarder (Mugil so-iuy Basilewsky) into the Black Sea and the Sea of Azov.
L.I. Starushenko and A.B. Kazansky. 1996 68 Environmental management of fish resources in the Black Sea and their rational exploitation. K. Prodanov, K.
Mikhailov, G. Daskalov, C. Maxim, A. Chashchin, A. Arkhipov, V. Shlyakhov and E. Ozdamar. 1997 69 Long and short-term trends of Mediterranean fishery resources. L. Fiorentini, J.F. Caddy and J.I. de Leiva. 1997 70 Issues in Mediterranean fisheries management: geographical units and effort control. J.F. Caddy. 1998 70 Eléments pour l'aménagement des pêcheries méditerranéennes: unités géographiques et contrôle de l'effort. J.F.
Caddy. 1999 71 Feasibility assessment for a database on socio-economic indicators for Mediterranean fisheries. R. Franquesa,
I.M. Malouli and J.A. Alarcón. 2001 72 Decision-support systems for fisheries. The ITAFISH case study. Coppola, S. and Crosetti, D. 2001 73 Manual of fisheries sampling surveys: methodologies for estimations of socio-economic indicators in the
Mediterranean Sea. E. Sabatella and R. Franquesa. 2004 74 Ecosystem effects of fishing in the Mediterranean: an analysis of the major threats of fishing gear and practices
to biodiversity and marine habitats. S. Tudela. 2004 75 Fisheries laws and regulation in the Mediterranean: a comparative study. P. Cacaud. 2005
75 Étude comparative des lois et réglementations des pêches en Méditerranée. P. Cacaud. 2008 75 Fisheries laws and regulation in the Mediterranean: a comparative study. P. Cacaud. 2008 (Arabic version) 76 Implementation of the International Plan of Action to Prevent, Deter and Eliminate Illegal, Unreported and
Unregulated Fishing: relationship to, and potential effects on, fisheries management in the Mediterranean. J. Swan. 2005
77 Inventory of artisanal fishery communities in the Western and Central Mediterranean. S.R. Coppola. 2006 78 AdriaMed Expert Consultation: “Interactions between aquaculture and capture fisheries”. Cataudella, S.;
Massa, F.; Crosetti, D. (eds.). 2005 79 An adaptive approach for the improvement of fishery statistical systems in Mediterranean countries under
FAO projects. Coppola, S.R. 2007 80 The Operational Units approach for fisheries management in the Mediterranean Sea. Accadia, P. and Franquesa, R. 2006 81 Recreational fisheries in the Mediterranean countries: a review of existing legal frameworks. Gaudin, C. and
De Young, C. 2007 82 Marketing of aquacultured seabass and seabream from the Mediterranean basin. Monfort, M.C. 2007 83 Selected papers presented at the Workshop on Biological Reference Points. Rome, 20–21 April 2004. Lembo,
G. (ed.). 2006 84 Impact des techniques de pêche sur l’environnement en Méditerranée. Sacchi, J. 2008 85 Regional study on small tunas in the Mediterranean including the Black Sea. Di Natale, A.; Srour, A; Hattour,
A.; Keskin, Ç; Idrissi, M.; Orsi Relini, L. 2009 86 Fish trade among Mediterranean countries: Intraregional trade and import–export with the European Union.
Malvarosa, L.; De Young, C. 2010 87 Status of alien species in the Black and Mediterranean Seas. Öztürk, B. 2010

This document “Synthesis of Mediterranean marine finfish aquaculture - A marketing and promotion strategy” is an output of the project “Support to the GFCM Working Group on Marketing of Aquaculture Products:
Development of a Strategy for Marketing and Promotion of Mediterranean Aquaculture (MedAquaMarket)”. The purpose of this report is to provide an overview of the marine aquaculture industry in the Mediterranean and its markets based on national country reports submitted by national marketing experts selected in the
Mediterranean countries. Examples from individual countries, where available, have been included to illustrate or explain a certain point or trend. Additional insight obtained through interviews of industry professionals,
members of the scientific and academic community and the author’s own experience has also been used throughout the document. The experience of this project has clearly illustrated the problem of consistent and reliable data collection for the industry. Informal, experience-based information was often proved to provide a more accurate picture of the state of the industry than official figures, with a discrepancy of more than thirty percent in some countries. However, in comparison with past surveys, it is clear that official data collection
systems are becoming more accurate.


