Embed Size (px)
Citation preview
Aquaculture
Coastal and Estuarine Processes
http://ecowin.org/aulas/mega/pce
J. Gomes Ferreira
http://ecowin.org/
Universidade Nova de Lisboa
Aquaculture and fisheries
• World supply and demand
• Species, nations, and trade
• Aquaculture, the blue revolution?
• Carrying capacity and site selection
• Co-use and offshore aquaculture
• Summary
Lecture topics
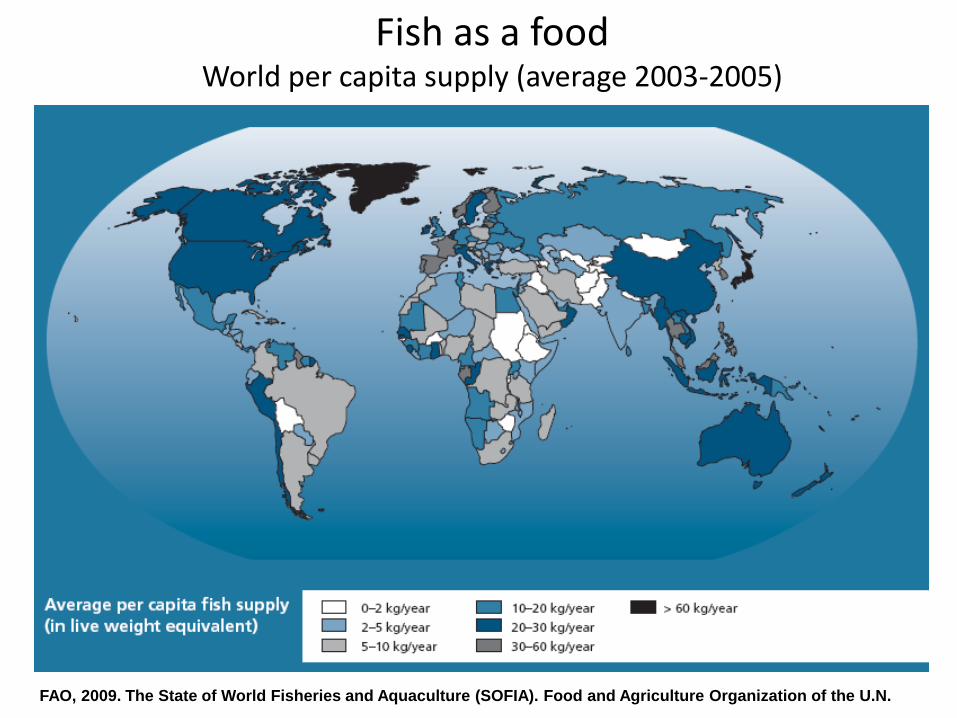
Fish as a food World per capita supply (average 2003-2005)
FAO, 2009. The State of World Fisheries and Aquaculture (SOFIA). Food and Agriculture Organization of the U.N.
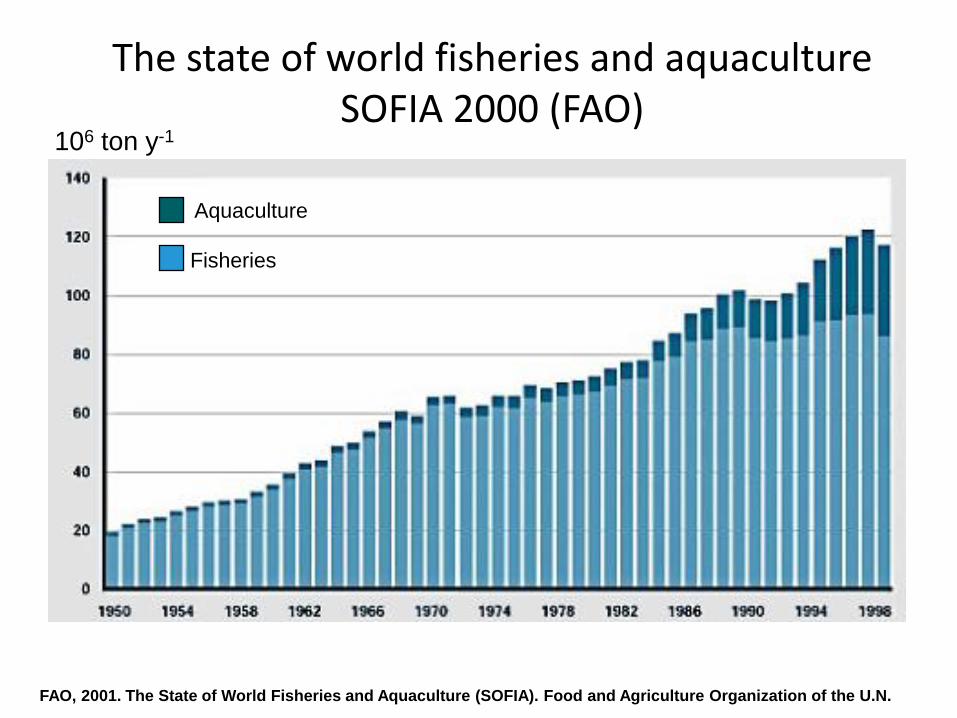
The state of world fisheries and aquaculture SOFIA 2000 (FAO)
FAO, 2001. The State of World Fisheries and Aquaculture (SOFIA). Food and Agriculture Organization of the U.N.
Aquaculture
Fisheries
106 ton y-1
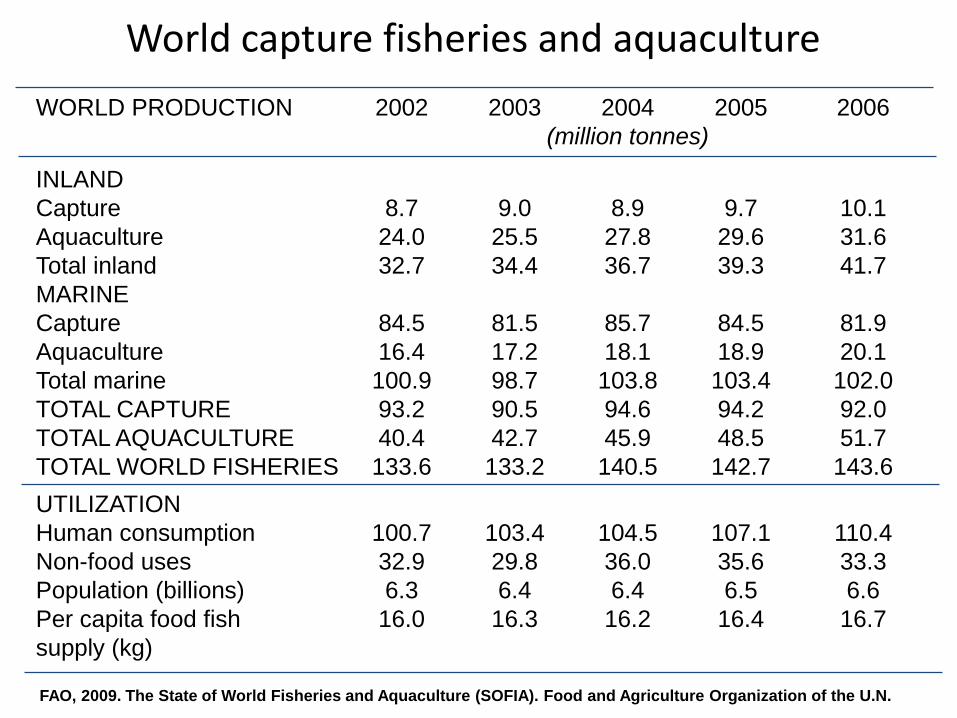
World capture fisheries and aquaculture
FAO, 2009. The State of World Fisheries and Aquaculture (SOFIA). Food and Agriculture Organization of the U.N.
WORLD PRODUCTION 2002 2003 2004 2005 2006
(million tonnes)
INLAND
Capture 8.7 9.0 8.9 9.7 10.1
Aquaculture 24.0 25.5 27.8 29.6 31.6
Total inland 32.7 34.4 36.7 39.3 41.7
MARINE
Capture 84.5 81.5 85.7 84.5 81.9
Aquaculture 16.4 17.2 18.1 18.9 20.1
Total marine 100.9 98.7 103.8 103.4 102.0
TOTAL CAPTURE 93.2 90.5 94.6 94.2 92.0
TOTAL AQUACULTURE 40.4 42.7 45.9 48.5 51.7
TOTAL WORLD FISHERIES 133.6 133.2 140.5 142.7 143.6
UTILIZATION
Human consumption 100.7 103.4 104.5 107.1 110.4
Non-food uses 32.9 29.8 36.0 35.6 33.3
Population (billions) 6.3 6.4 6.4 6.5 6.6
Per capita food fish 16.0 16.3 16.2 16.4 16.7
supply (kg)
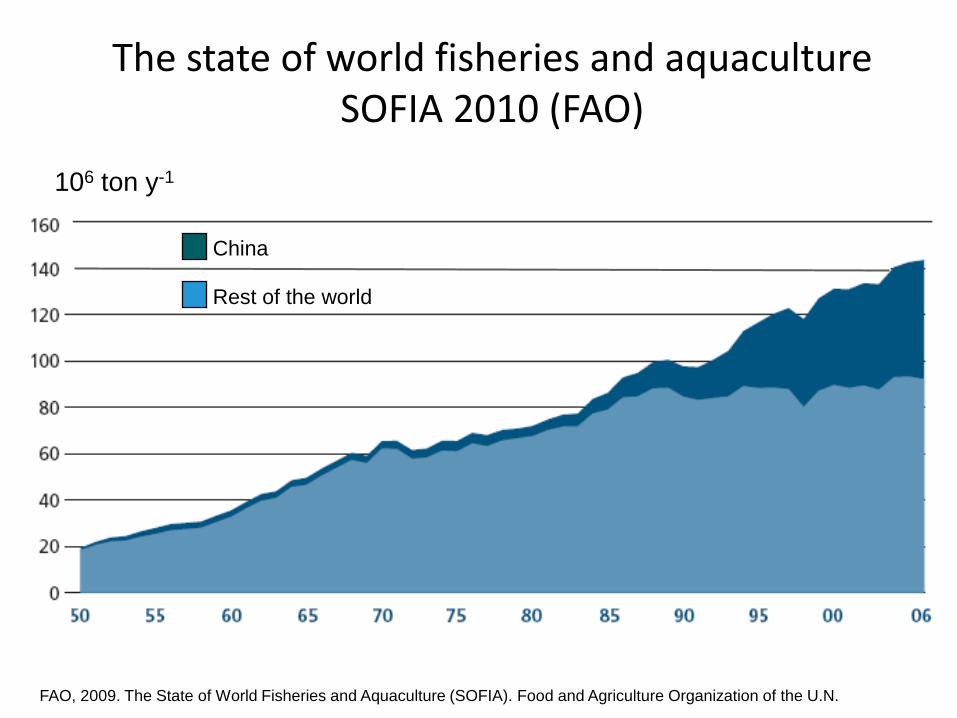
The state of world fisheries and aquaculture SOFIA 2010 (FAO)
FAO, 2009. The State of World Fisheries and Aquaculture (SOFIA). Food and Agriculture Organization of the U.N.
106 ton y-1
China
Rest of the world
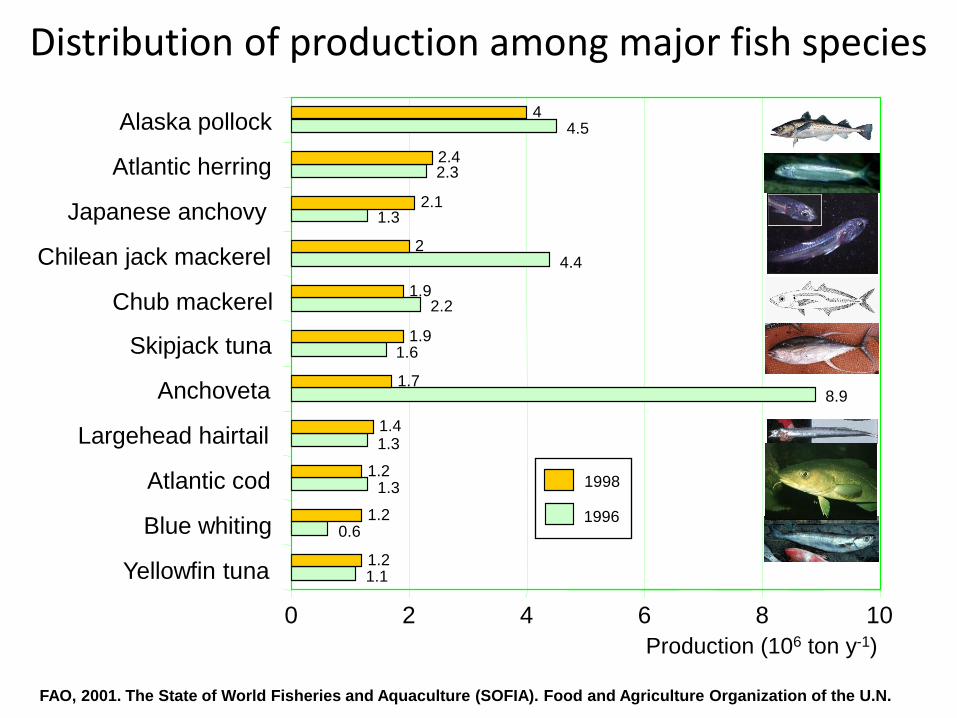
Distribution of production among major fish species
FAO, 2001. The State of World Fisheries and Aquaculture (SOFIA). Food and Agriculture Organization of the U.N.
Production (106 ton y-1)
1.1
0.6
1.3
1.3
8.9
1.6
2.2
4.4
1.3
2.3
4.5
1.2
1.2
1.2
1.4
1.7
1.9
1.9
2
2.1
2.4
4
0 2 4 6 8 10
Yellowfin tuna
Blue whiting
Atlantic cod
Largehead hairtail
Anchoveta
Skipjack tuna
Chub mackerel
Chilean jack mackerel
Japanese anchovy
Atlantic herring
Alaska pollock
1996
1998
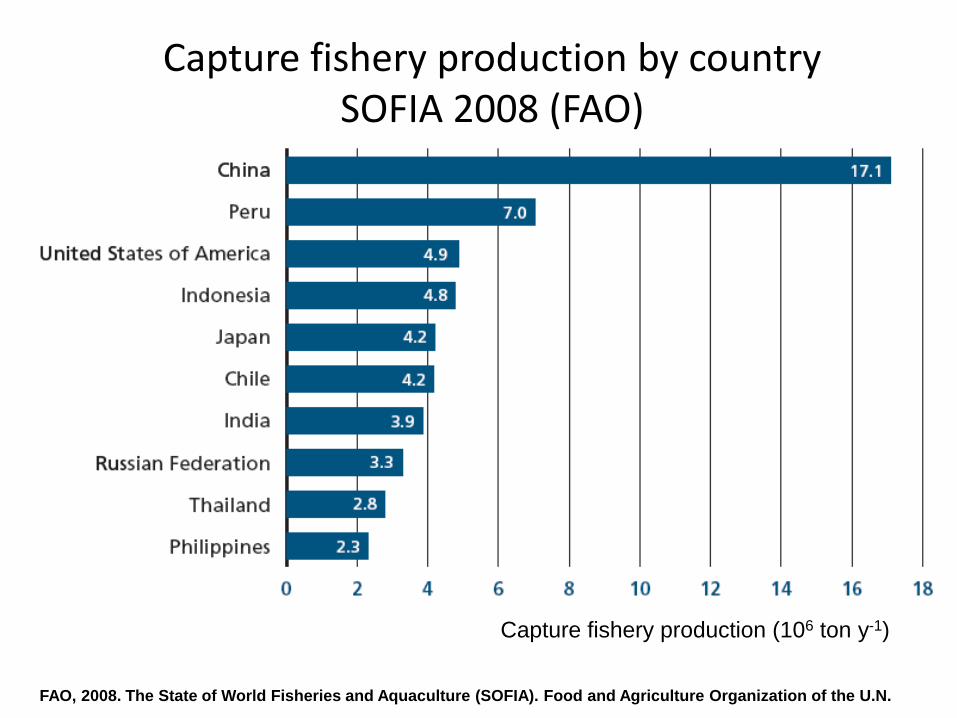
Capture fishery production by country SOFIA 2008 (FAO)
FAO, 2008. The State of World Fisheries and Aquaculture (SOFIA). Food and Agriculture Organization of the U.N.
Capture fishery production (106 ton y-1)
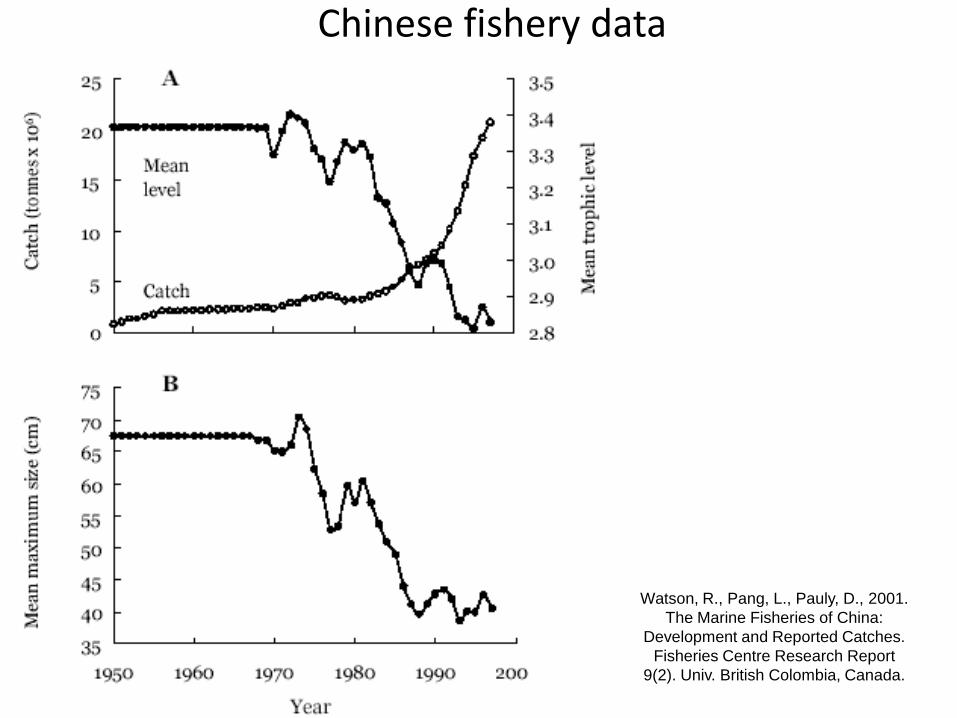
Chinese fishery data
Watson, R., Pang, L., Pauly, D., 2001.
The Marine Fisheries of China:
Development and Reported Catches.
Fisheries Centre Research Report
9(2). Univ. British Colombia, Canada.
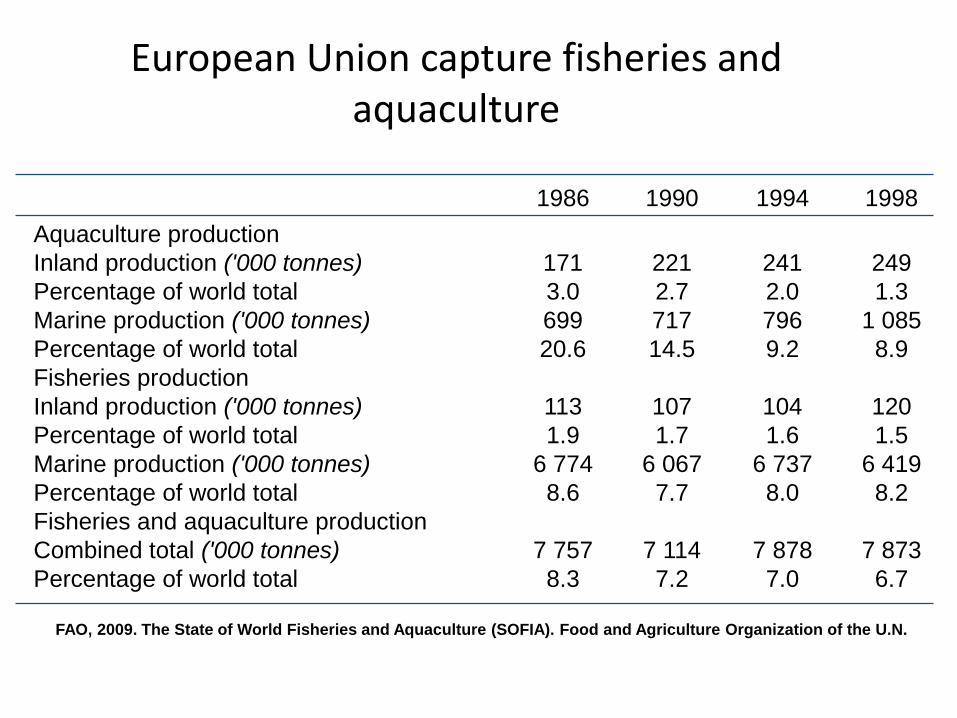
European Union capture fisheries and aquaculture
FAO, 2009. The State of World Fisheries and Aquaculture (SOFIA). Food and Agriculture Organization of the U.N.
1986 1990 1994 1998
Aquaculture production
Inland production ('000 tonnes) 171 221 241 249
Percentage of world total 3.0 2.7 2.0 1.3
Marine production ('000 tonnes) 699 717 796 1 085
Percentage of world total 20.6 14.5 9.2 8.9
Fisheries production
Inland production ('000 tonnes) 113 107 104 120
Percentage of world total 1.9 1.7 1.6 1.5
Marine production ('000 tonnes) 6 774 6 067 6 737 6 419
Percentage of world total 8.6 7.7 8.0 8.2
Fisheries and aquaculture production
Combined total ('000 tonnes) 7 757 7 114 7 878 7 873
Percentage of world total 8.3 7.2 7.0 6.7
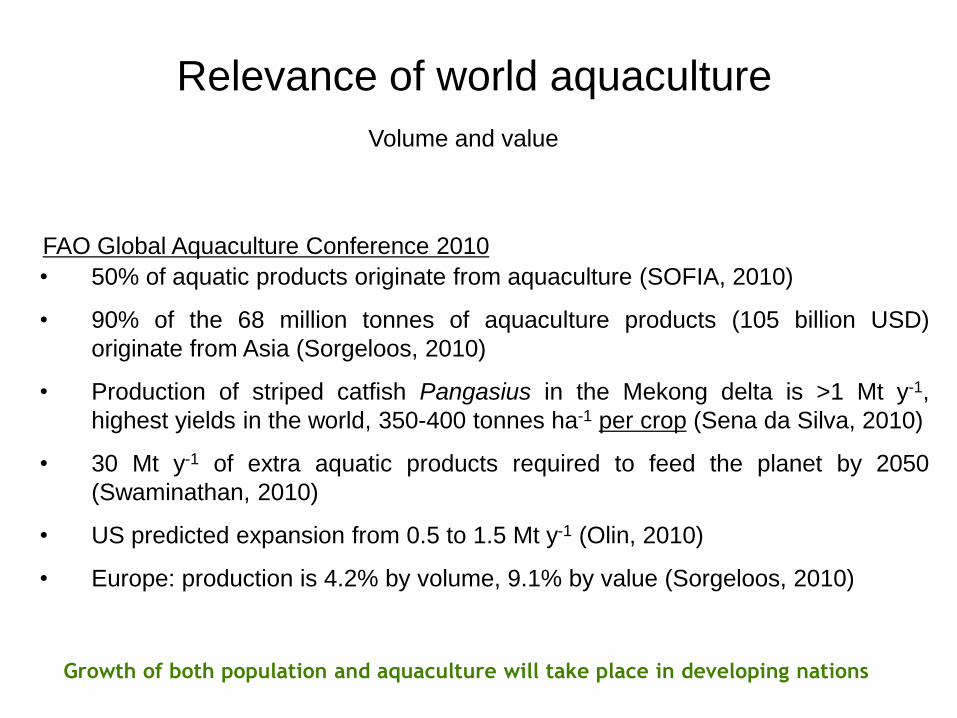
Relevance of world aquaculture
• 50% of aquatic products originate from aquaculture (SOFIA, 2010)
• 90% of the 68 million tonnes of aquaculture products (105 billion USD)
originate from Asia (Sorgeloos, 2010)
• Production of striped catfish Pangasius in the Mekong delta is >1 Mt y-1,
highest yields in the world, 350-400 tonnes ha-1 per crop (Sena da Silva, 2010)
• 30 Mt y-1 of extra aquatic products required to feed the planet by 2050
(Swaminathan, 2010)
• US predicted expansion from 0.5 to 1.5 Mt y-1 (Olin, 2010)
• Europe: production is 4.2% by volume, 9.1% by value (Sorgeloos, 2010)
Growth of both population and aquaculture will take place in developing nations
Volume and value
FAO Global Aquaculture Conference 2010
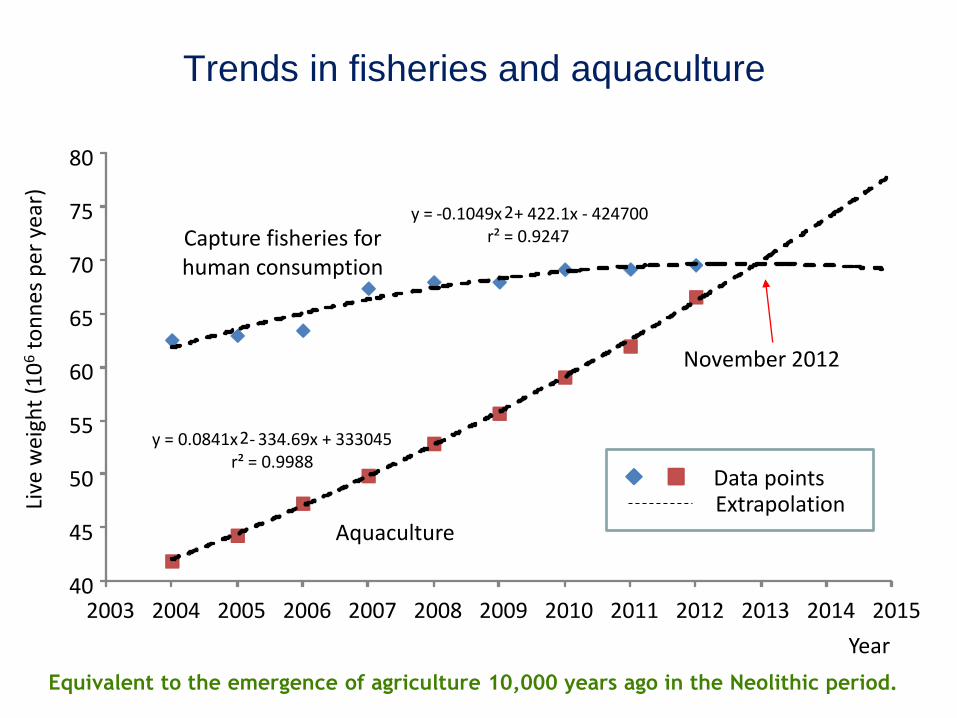
Trends in fisheries and aquaculture
Capture fisheries for human consumption
Data points Extrapolation
Year
Live
wei
ght
(10
6 t
on
ne
s p
er
year
)
Equivalent to the emergence of agriculture 10,000 years ago in the Neolithic period.
y = - 0.1049x 2 + 422.1x - 424700
r² = 0.9247
y = 0.0841x 2 - 334.69x + 333045
r² = 0.9988
40
45
50
55
60
65
70
75
80
2003 2004 2005 2006 2007 2008 2009 2010 2011 2012 2013 2014 2015
Aquaculture
November 2012
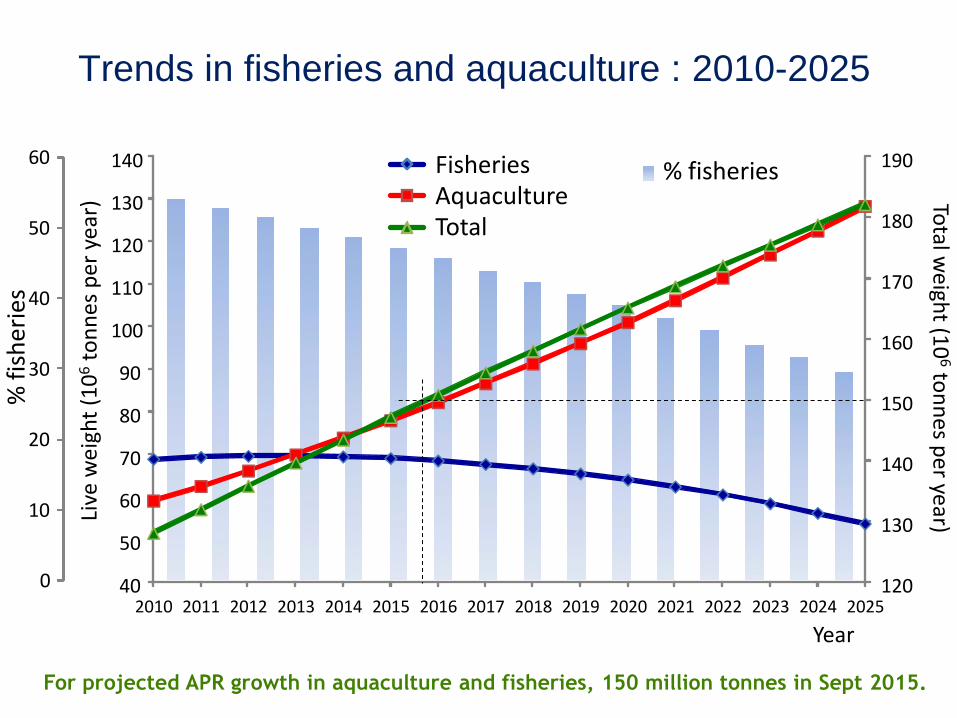
Trends in fisheries and aquaculture : 2010-2025
0
10
20
30
40
50
60 % fisheries
120
130
140
150
160
170
180
190
40
50
60
70
80
90
100
110
120
130
140
2010 2011 2012 2013 2014 2015 2016 2017 2018 2019 2020 2021 2022 2023 2024 2025
Fisheries Aquaculture Total
Year
Live
wei
ght
(10
6 t
on
nes
per
yea
r)
% f
ish
erie
s To
tal weigh
t (10
6 ton
ne
s pe
r year)
For projected APR growth in aquaculture and fisheries, 150 million tonnes in Sept 2015.
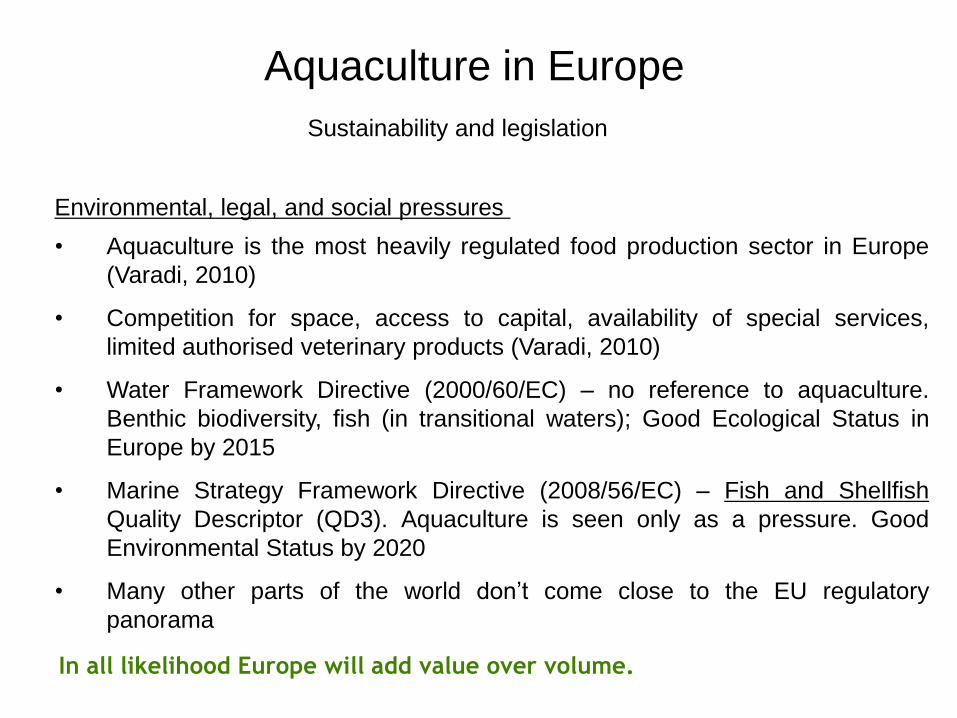
Aquaculture in Europe
• Aquaculture is the most heavily regulated food production sector in Europe
(Varadi, 2010)
• Competition for space, access to capital, availability of special services,
limited authorised veterinary products (Varadi, 2010)
• Water Framework Directive (2000/60/EC) – no reference to aquaculture.
Benthic biodiversity, fish (in transitional waters); Good Ecological Status in
Europe by 2015
• Marine Strategy Framework Directive (2008/56/EC) – Fish and Shellfish
Quality Descriptor (QD3). Aquaculture is seen only as a pressure. Good
Environmental Status by 2020
• Many other parts of the world don’t come close to the EU regulatory
panorama
In all likelihood Europe will add value over volume.
Sustainability and legislation
Environmental, legal, and social pressures
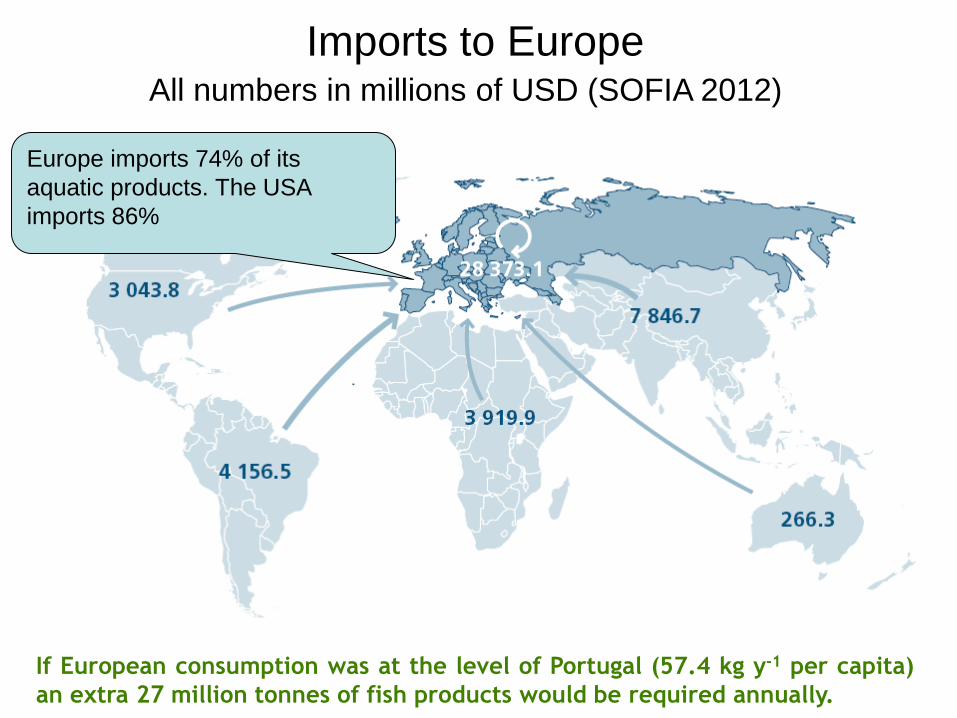
Imports to Europe
If European consumption was at the level of Portugal (57.4 kg y-1 per capita)
an extra 27 million tonnes of fish products would be required annually.
Europe imports 74% of its
aquatic products. The USA
imports 86%
All numbers in millions of USD (SOFIA 2012)
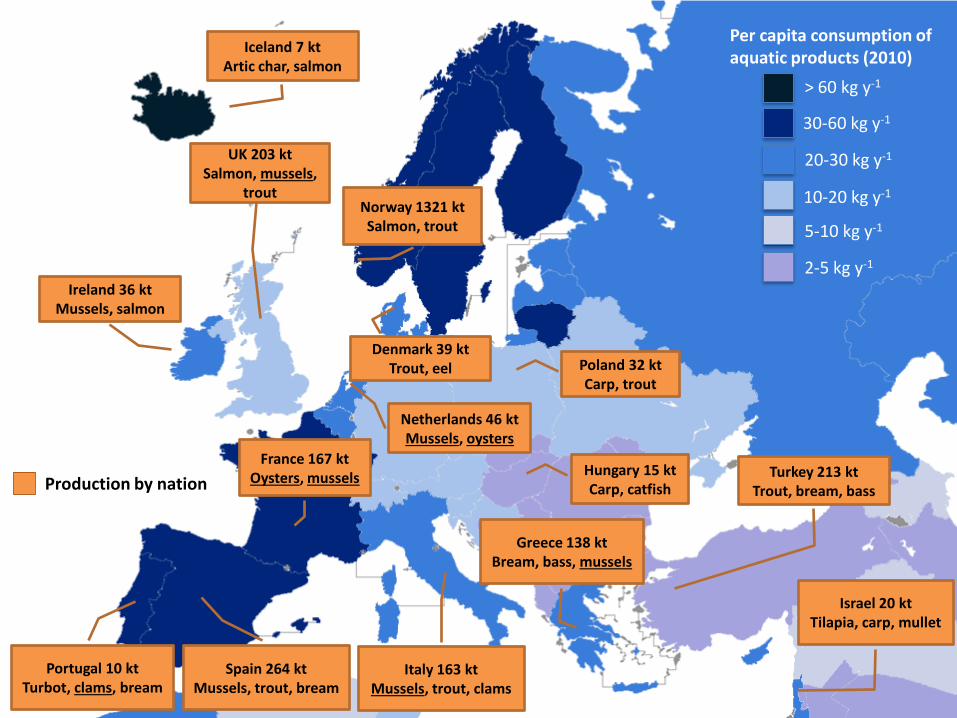
Spain 264 kt Mussels, trout, bream
Italy 163 kt Mussels, trout, clams
Greece 138 kt Bream, bass, mussels
Turkey 213 kt Trout, bream, bass
Israel 20 kt Tilapia, carp, mullet
Hungary 15 kt Carp, catfish
Norway 1321 kt Salmon, trout
Netherlands 46 kt Mussels, oysters
UK 203 kt Salmon, mussels,
trout
France 167 kt Oysters, mussels
Portugal 10 kt Turbot, clams, bream
2-5 kg y-1
5-10 kg y-1
10-20 kg y-1
20-30 kg y-1
30-60 kg y-1
> 60 kg y-1
Per capita consumption of aquatic products (2010)
Ireland 36 kt Mussels, salmon
Iceland 7 kt Artic char, salmon
Denmark 39 kt Trout, eel
Production by nation
Poland 32 kt Carp, trout
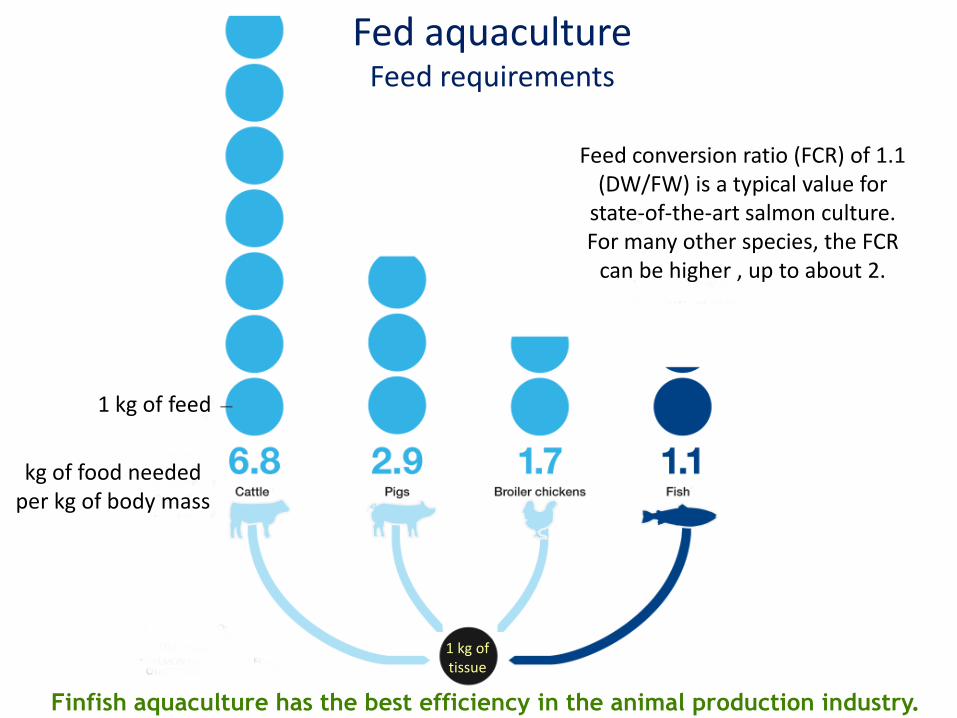
1 kg of feed
kg of food needed per kg of body mass
Feed conversion ratio (FCR) of 1.1 (DW/FW) is a typical value for
state-of-the-art salmon culture. For many other species, the FCR
can be higher , up to about 2.
1 kg of tissue
Fed aquaculture Feed requirements
Finfish aquaculture has the best efficiency in the animal production industry.
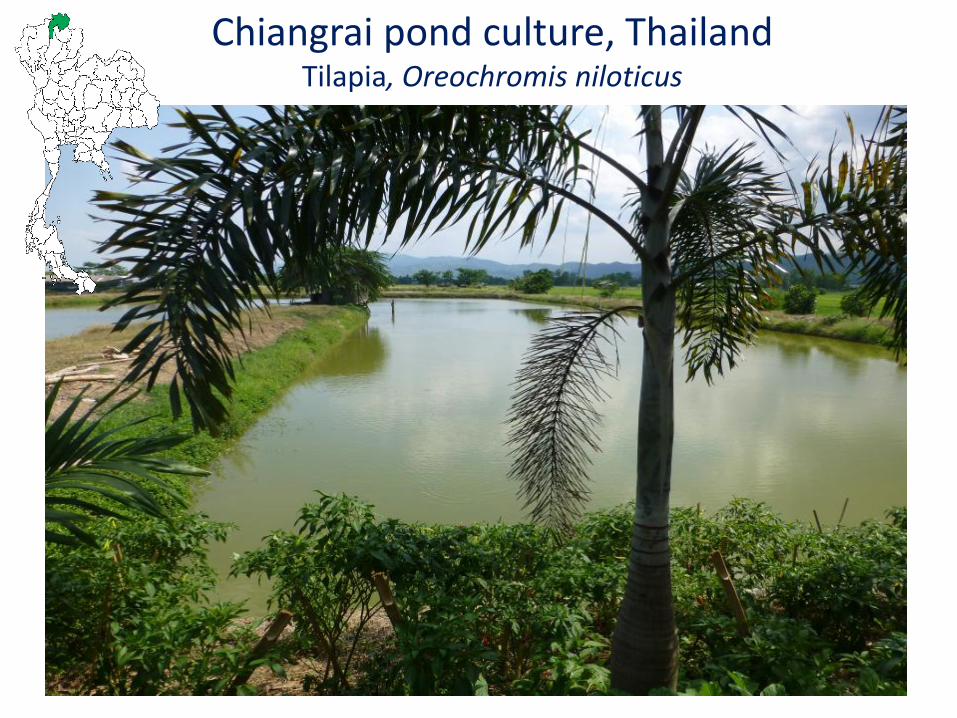
Chiangrai pond culture, Thailand Tilapia, Oreochromis niloticus
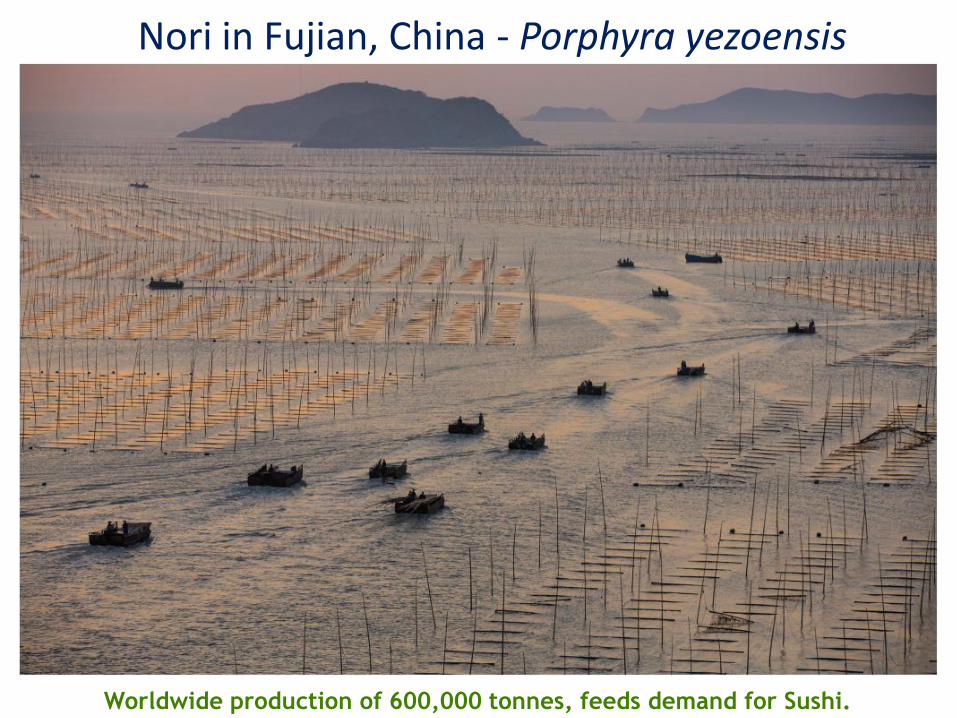
Nori in Fujian, China - Porphyra yezoensis
Worldwide production of 600,000 tonnes, feeds demand for Sushi.
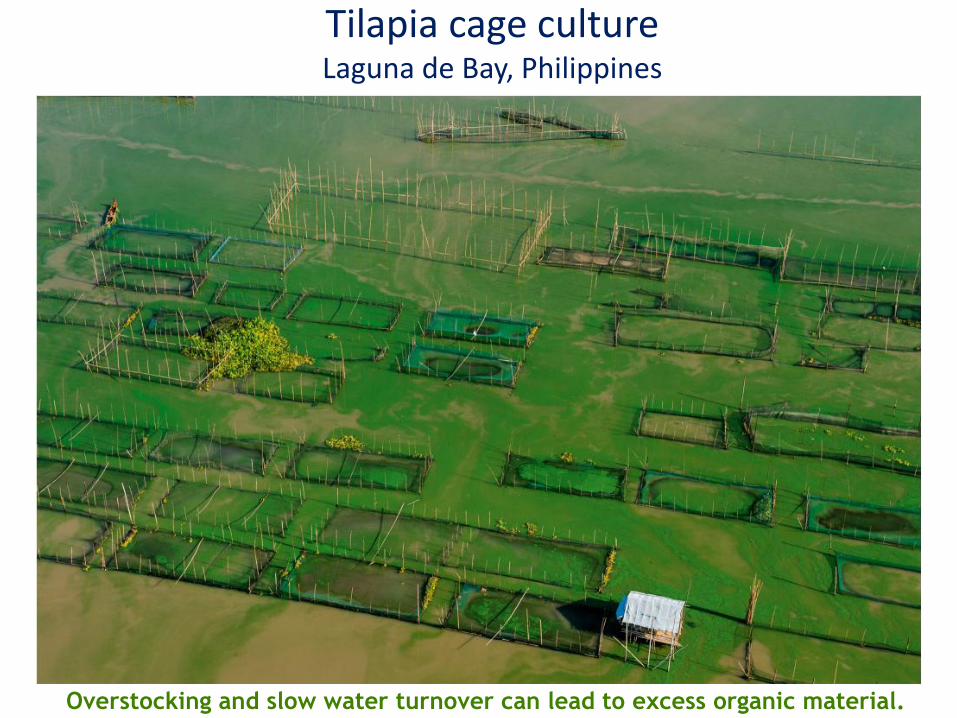
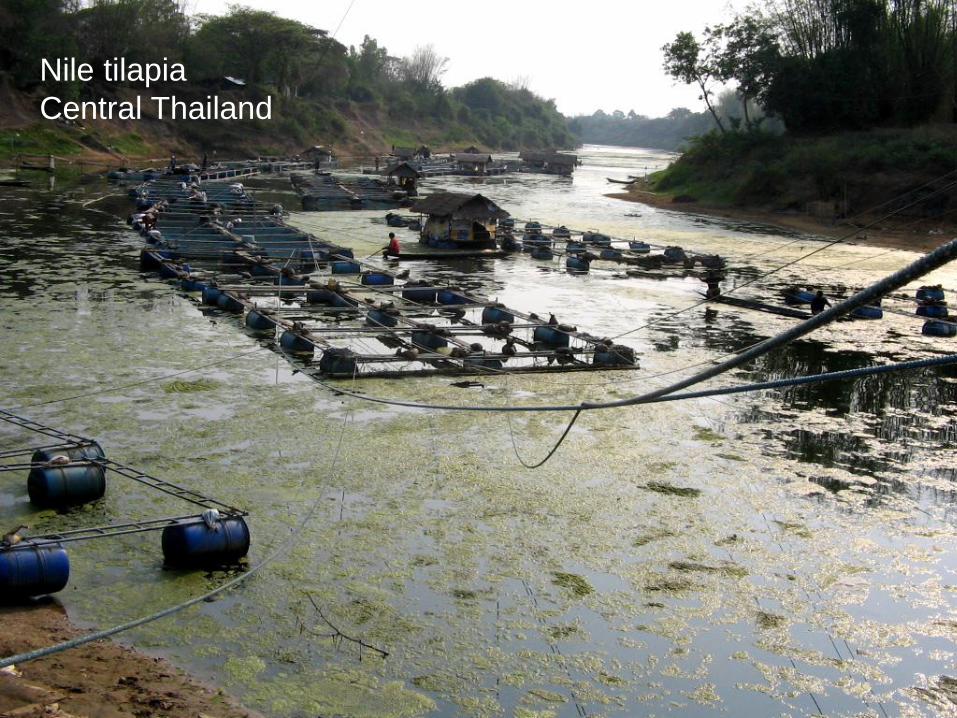
Tilapia cage culture Laguna de Bay, Philippines
Overstocking and slow water turnover can lead to excess organic material.
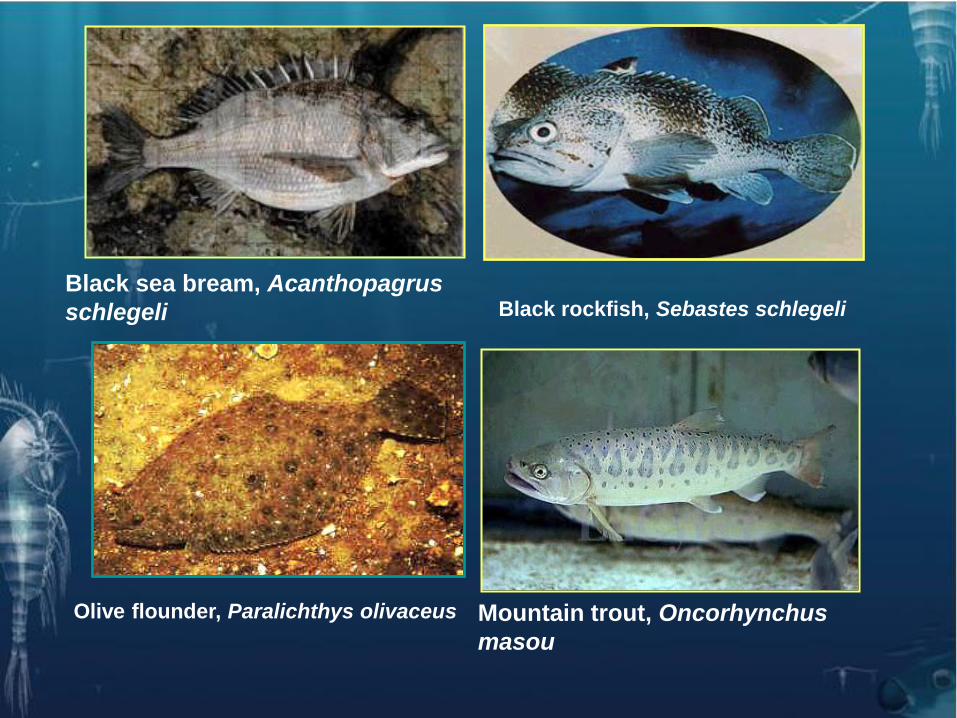
Mountain trout, Oncorhynchus
masou
Black rockfish, Sebastes schlegeli Black sea bream, Acanthopagrus
schlegeli
Olive flounder, Paralichthys olivaceus
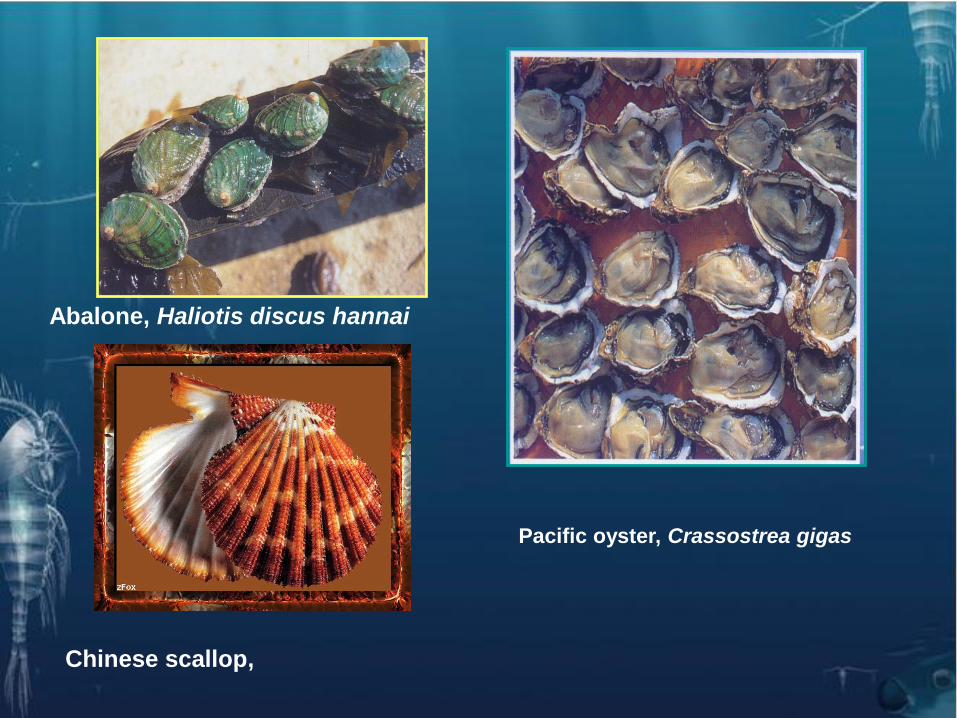
Chinese scallop,
Abalone, Haliotis discus hannai
Pacific oyster, Crassostrea gigas
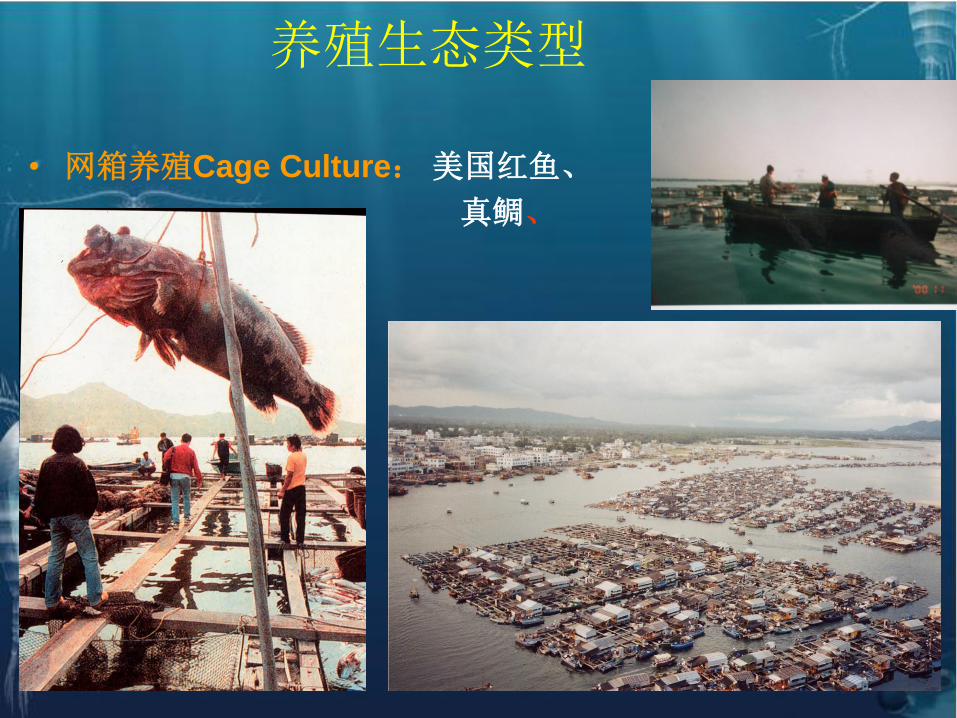
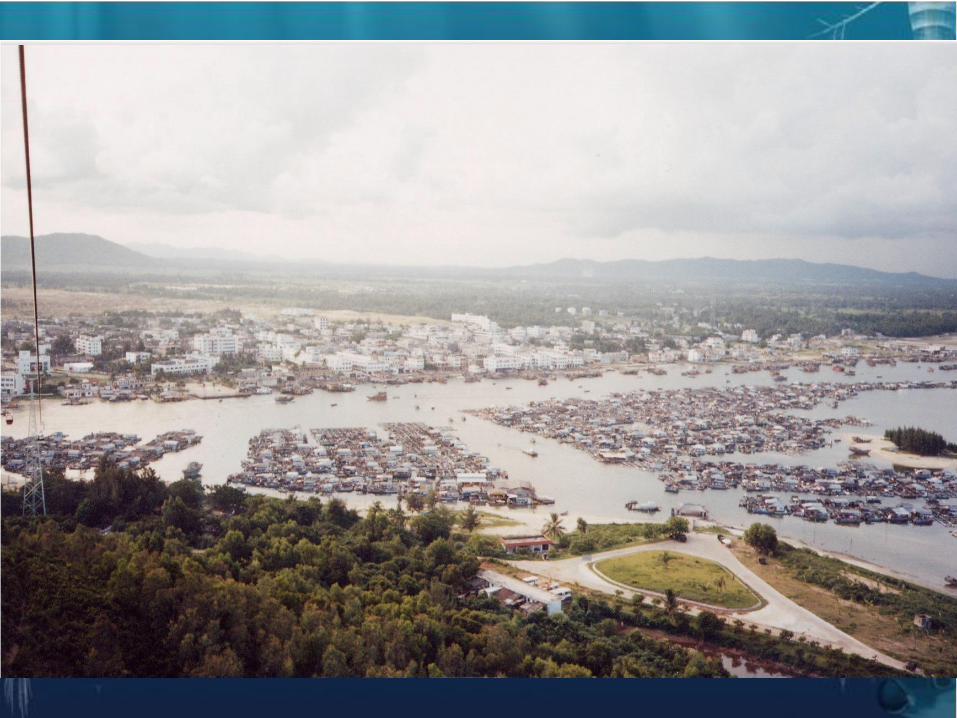
养殖生态类型
• 网箱养殖Cage Culture: 美国红鱼、
真鲷、
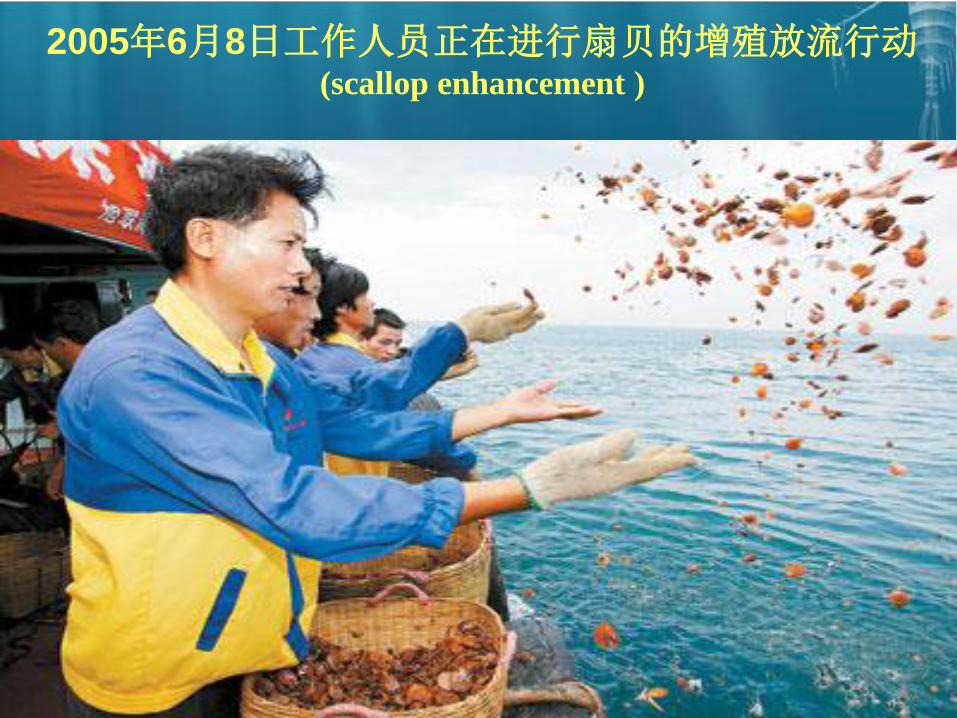
2005年6月8日工作人员正在进行扇贝的增殖放流行动 (scallop enhancement )
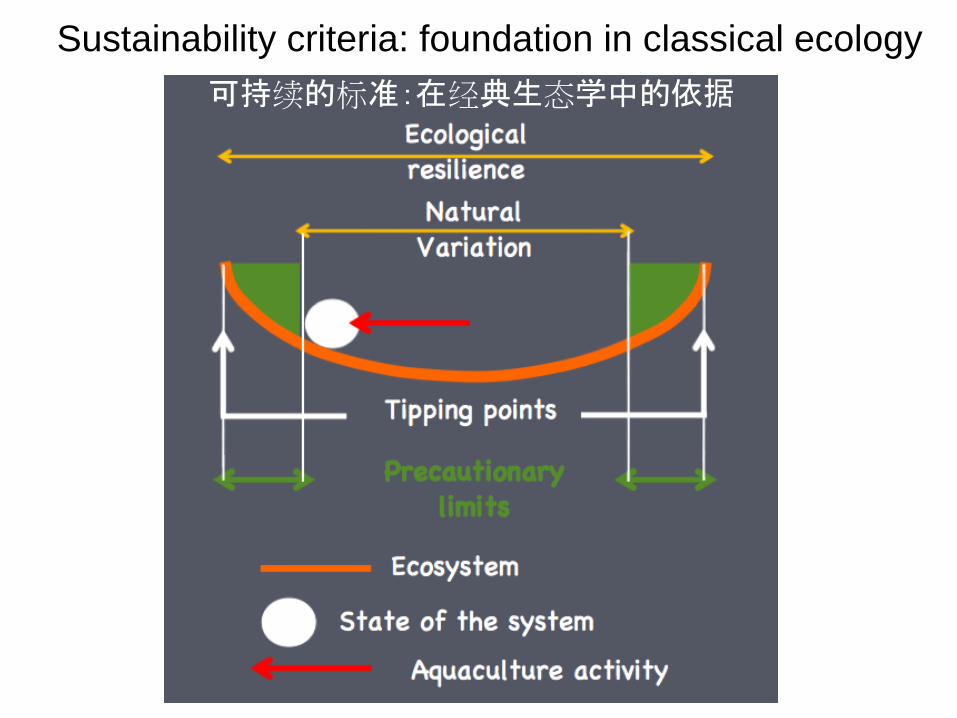
Sustainability criteria: foundation in classical ecology
可持续的标准:在经典生态学中的依据
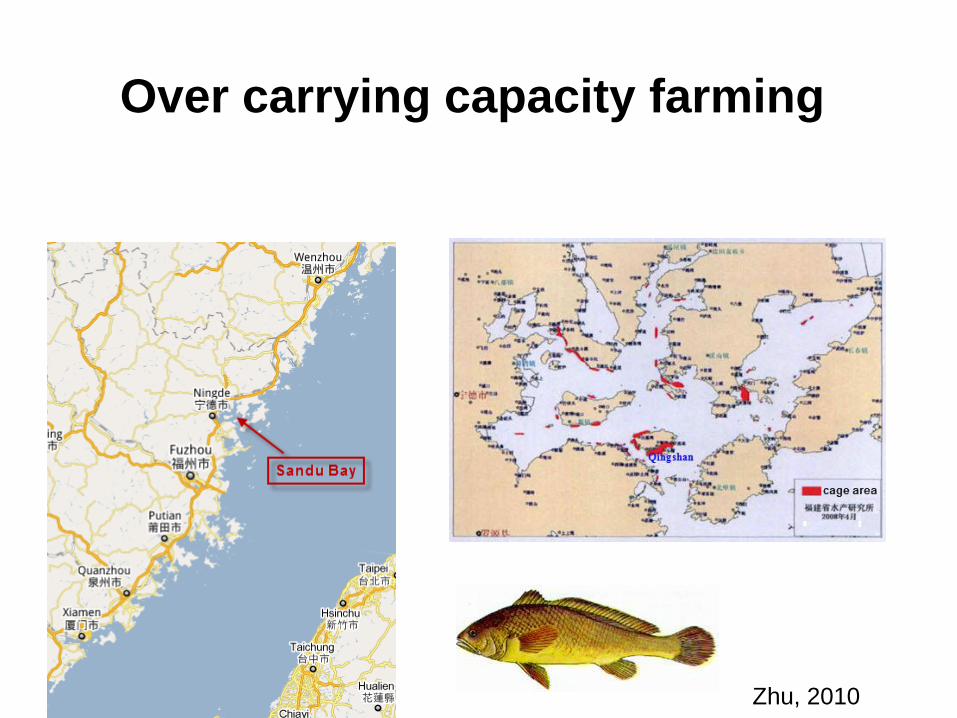
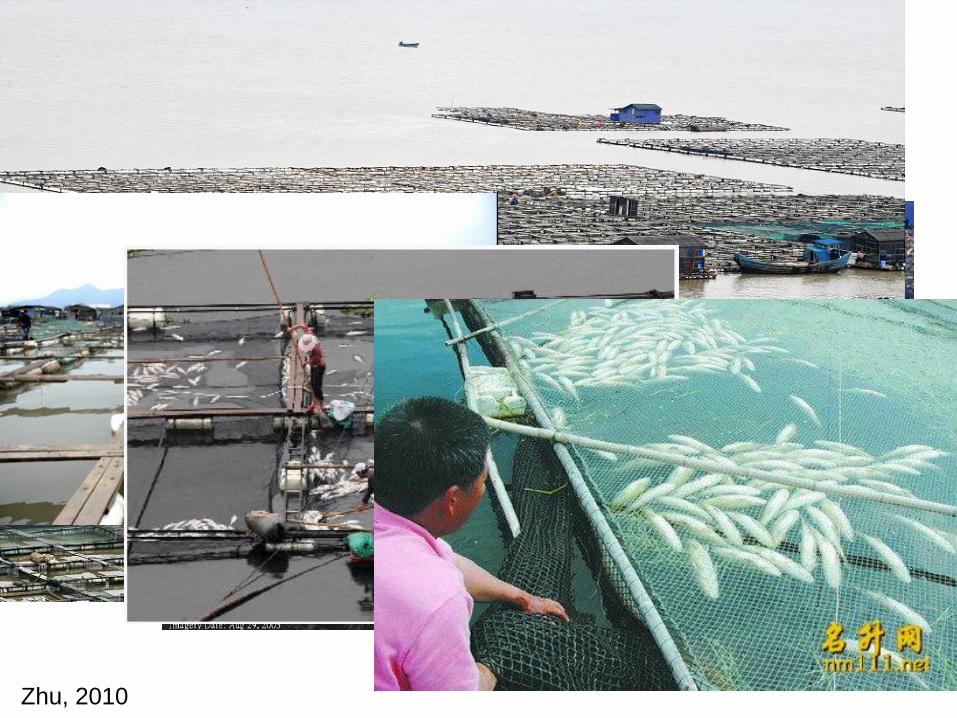
Over carrying capacity farming
An extreme case study of cage farming in
Sandu Bay
Yellow croaker
(Zhang, 2008)
Zhu, 2010
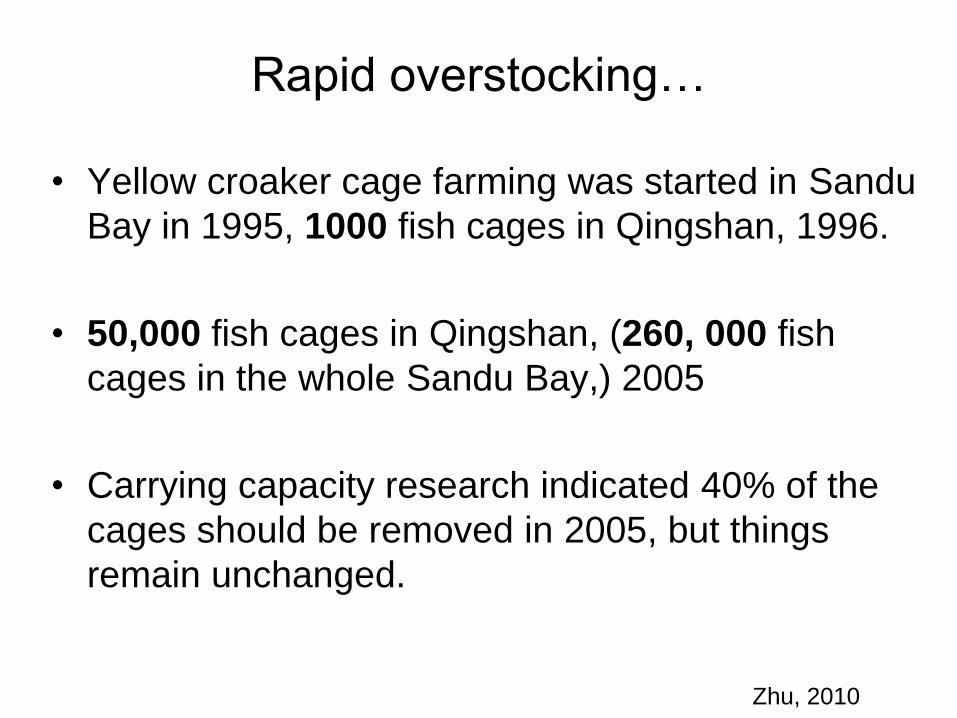
Rapid overstocking…
• Yellow croaker cage farming was started in Sandu
Bay in 1995, 1000 fish cages in Qingshan, 1996.
• 50,000 fish cages in Qingshan, (260, 000 fish
cages in the whole Sandu Bay,) 2005
• Carrying capacity research indicated 40% of the
cages should be removed in 2005, but things
remain unchanged.
Zhu, 2010
Zhu, 2010
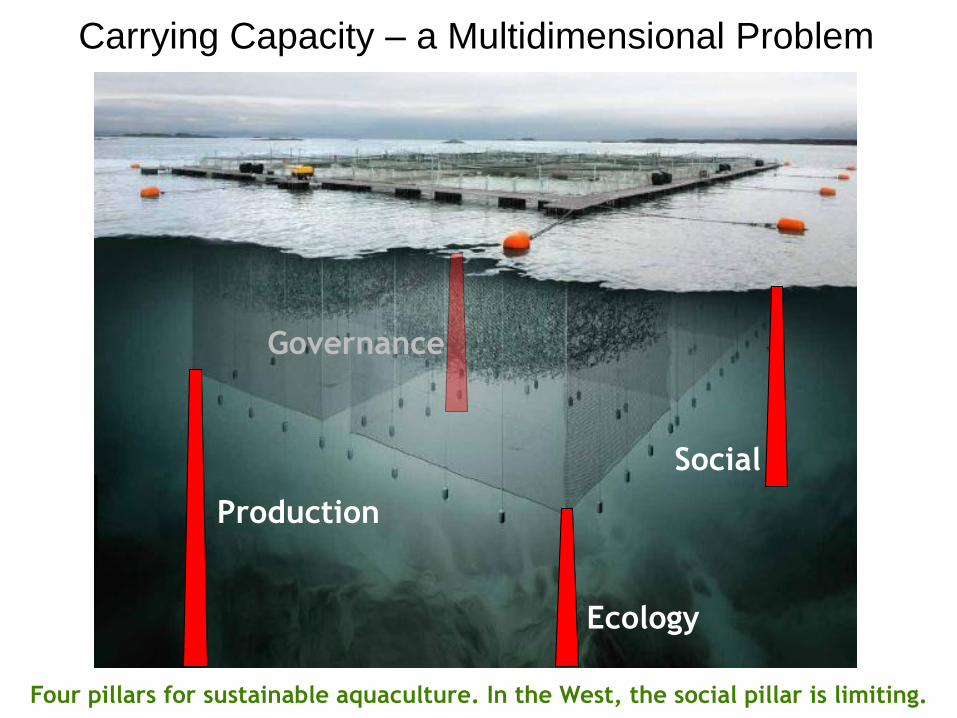
Carrying Capacity – a Multidimensional Problem
Production
Ecology
Social
Four pillars for sustainable aquaculture. In the West, the social pillar is limiting.
Governance
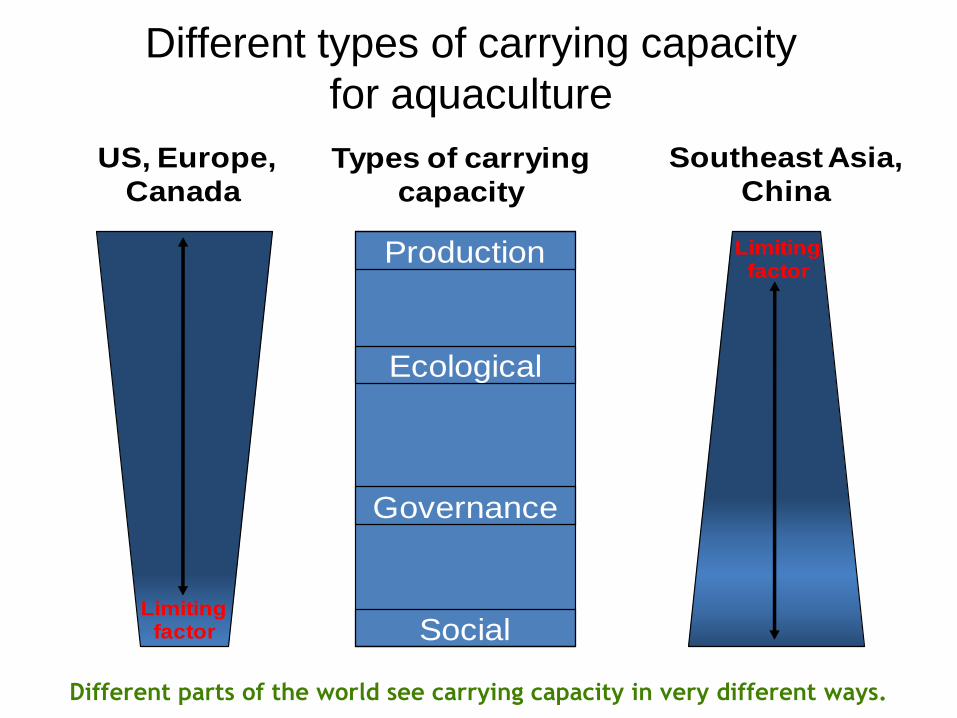
Different types of carrying capacity
for aquaculture
Southeast Asia,
China
Production
Ecological
Governance
Social
US, Europe,
Canada Types of carrying
capacity
Limiting factor
Limiting factor
Different parts of the world see carrying capacity in very different ways.
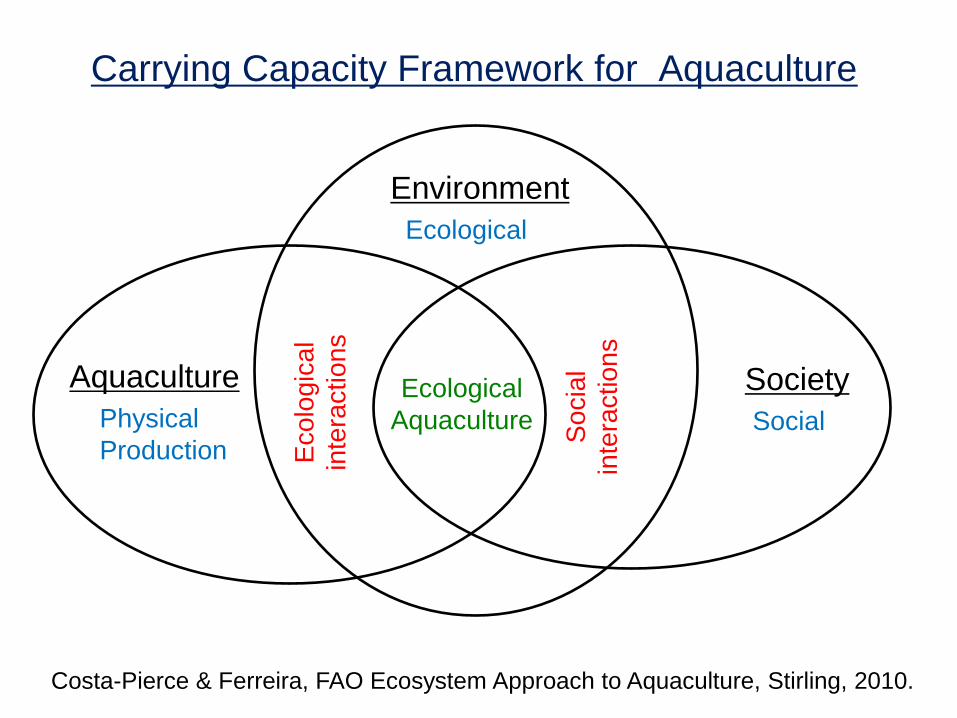
Carrying Capacity Framework for Aquaculture
Environment
Aquaculture Society
Ecological
Social Physical
Production
Ecological
Aquaculture
Eco
log
ica
l
inte
ractio
ns
So
cia
l
inte
ractions
Costa-Pierce & Ferreira, FAO Ecosystem Approach to Aquaculture, Stirling, 2010.
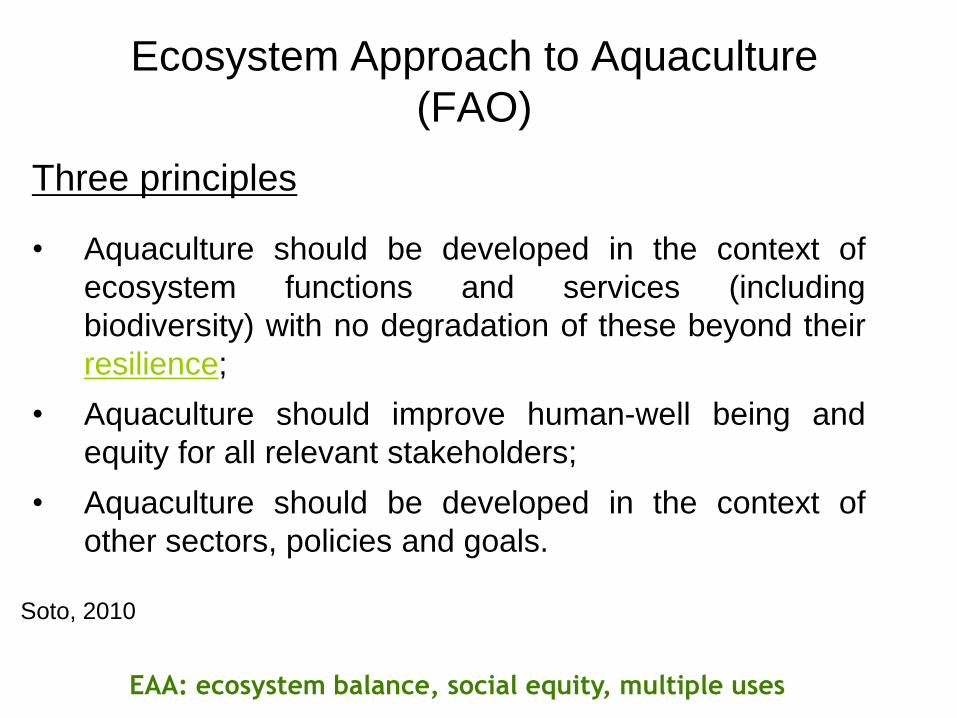
Ecosystem Approach to Aquaculture
(FAO)
• Aquaculture should be developed in the context of
ecosystem functions and services (including
biodiversity) with no degradation of these beyond their
resilience;
• Aquaculture should improve human-well being and
equity for all relevant stakeholders;
• Aquaculture should be developed in the context of
other sectors, policies and goals.
Three principles
Soto, 2010
EAA: ecosystem balance, social equity, multiple uses
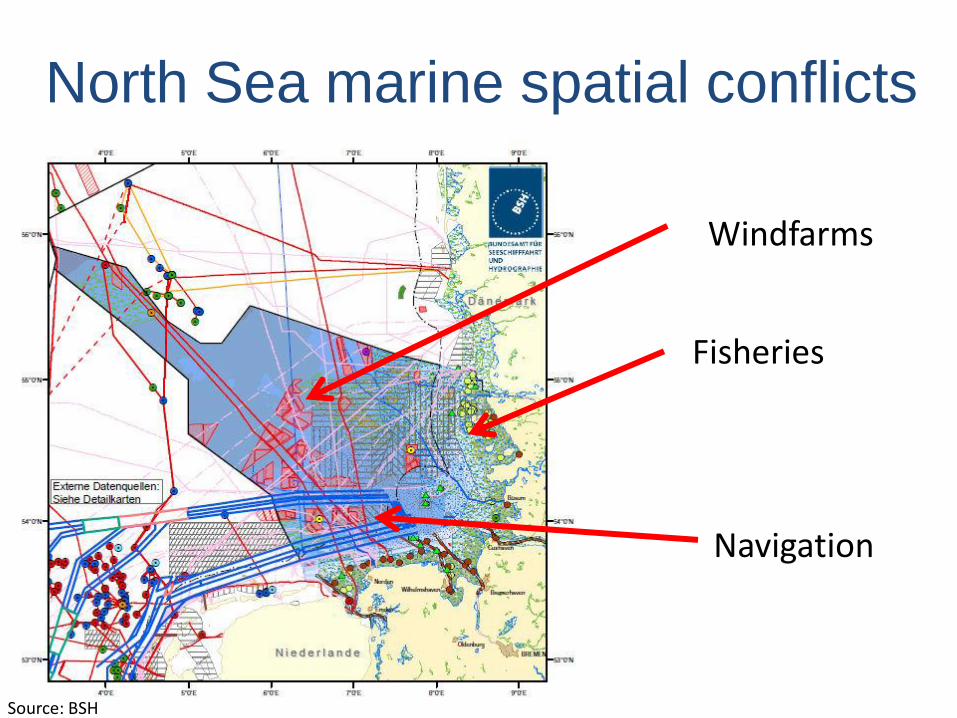
North Sea marine spatial conflicts
Source: BSH
Windfarms
Navigation
Fisheries
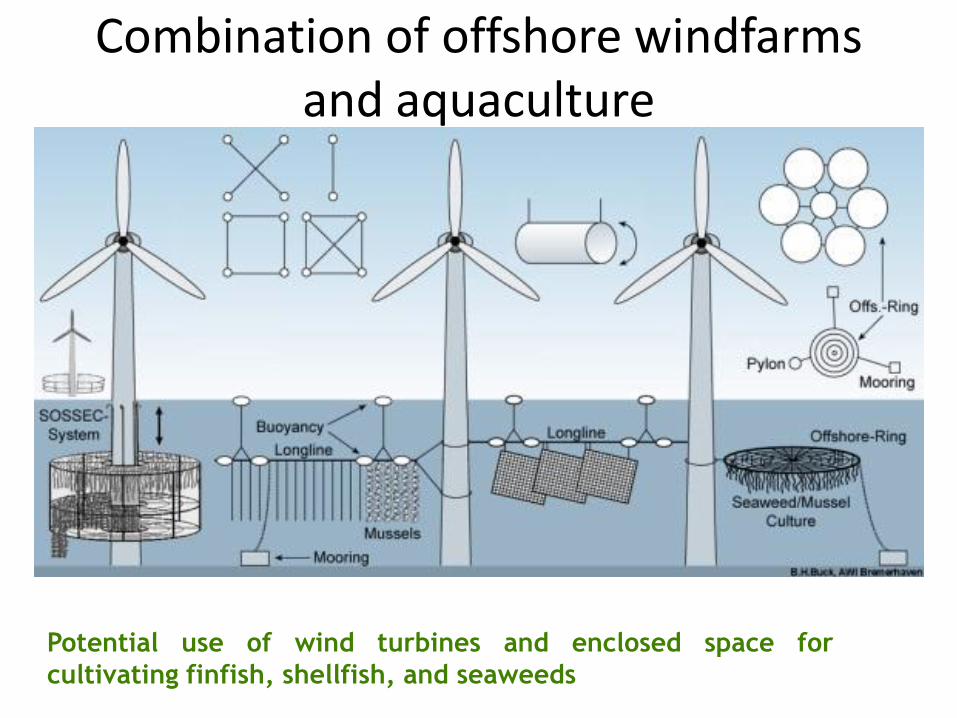
Combination of offshore windfarms and aquaculture
Potential use of wind turbines and enclosed space for
cultivating finfish, shellfish, and seaweeds
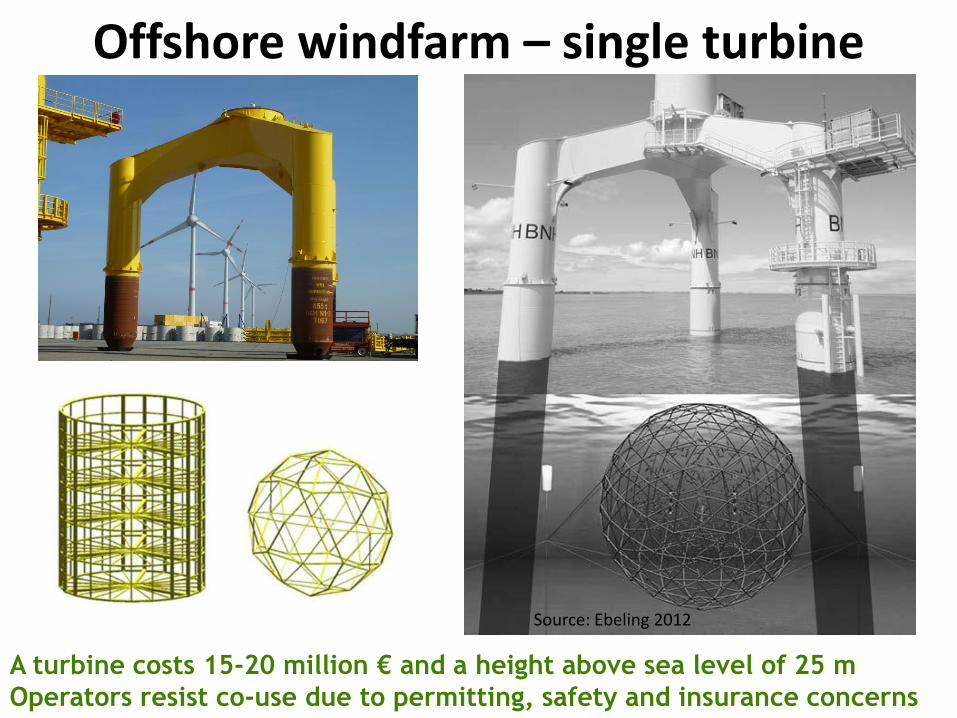
Offshore windfarm – single turbine
Source: Ebeling 2012
A turbine costs 15-20 million € and a height above sea level of 25 m
Operators resist co-use due to permitting, safety and insurance concerns
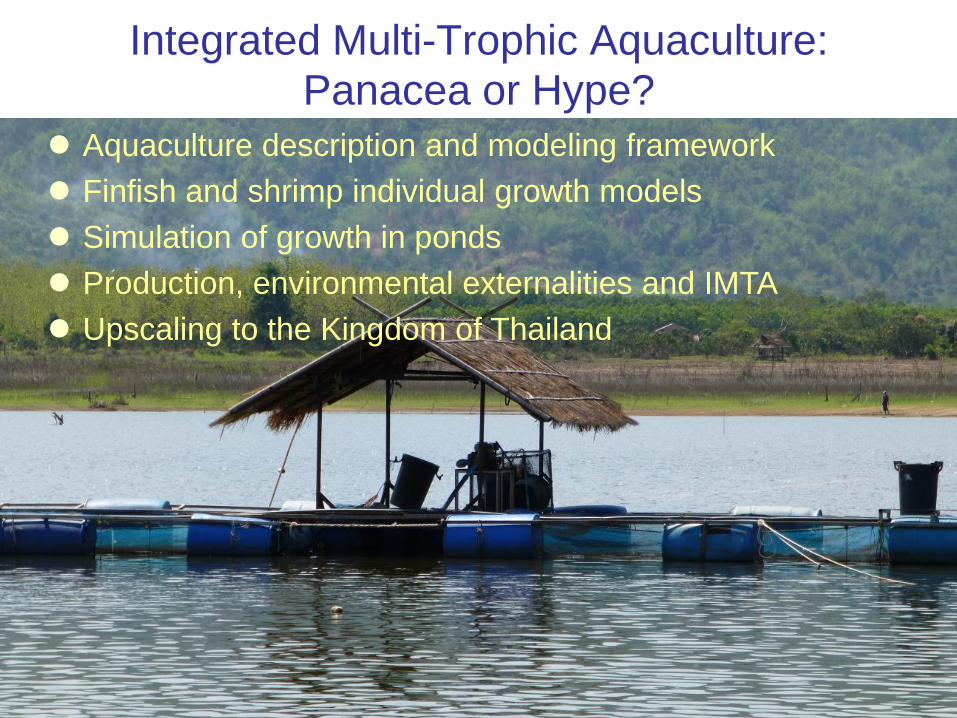
Aquaculture description and modeling framework
Finfish and shrimp individual growth models
Simulation of growth in ponds
Production, environmental externalities and IMTA
Upscaling to the Kingdom of Thailand
Integrated Multi-Trophic Aquaculture: Panacea or Hype?
51%
21%
12%
4% 3% 3% 3% 3%
White shrimp Tilapia Clarias Silver barb Gourami Pangasius Giant prawn Misc. sp.
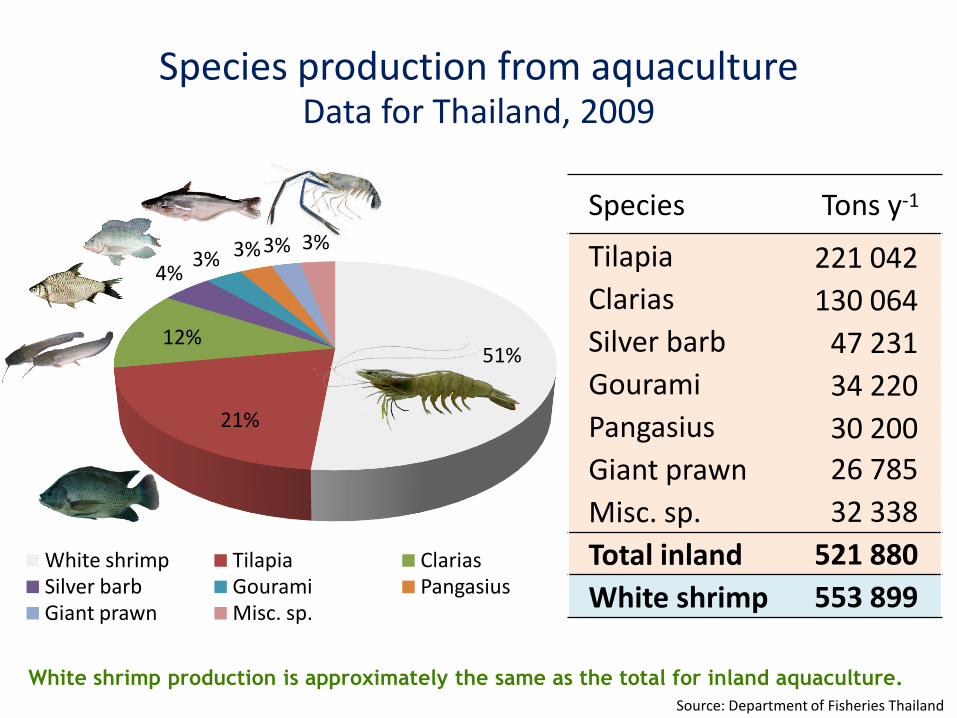
Species production from aquaculture Data for Thailand, 2009
Species Tons y-1
Tilapia 221 042
Clarias 130 064
Silver barb 47 231
Gourami 34 220
Pangasius 30 200
Giant prawn 26 785
Misc. sp. 32 338
Total inland 521 880
White shrimp 553 899
White shrimp production is approximately the same as the total for inland aquaculture.
Source: Department of Fisheries Thailand
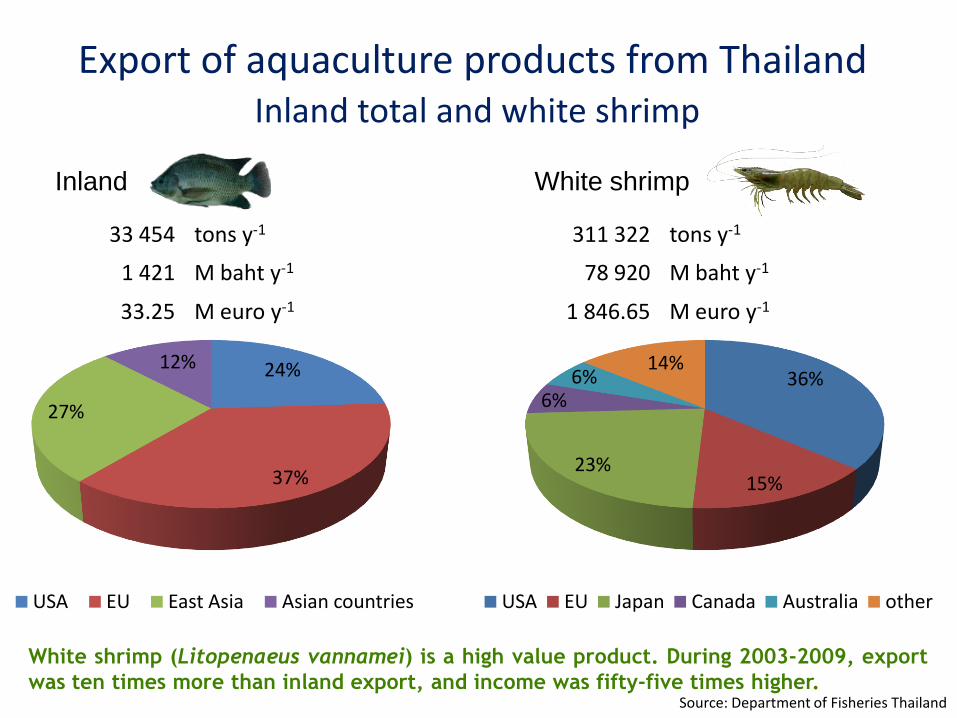
Export of aquaculture products from Thailand Inland total and white shrimp
Source: Department of Fisheries Thailand
36%
15% 23%
6% 6%
14%
USA EU Japan Canada Australia other
24%
37%
27%
12%
USA EU East Asia Asian countries
33 454 tons y-1
1 421 M baht y-1
33.25 M euro y-1
Inland White shrimp
311 322 tons y-1
78 920 M baht y-1
1 846.65 M euro y-1
White shrimp (Litopenaeus vannamei) is a high value product. During 2003-2009, export
was ten times more than inland export, and income was fifty-five times higher.
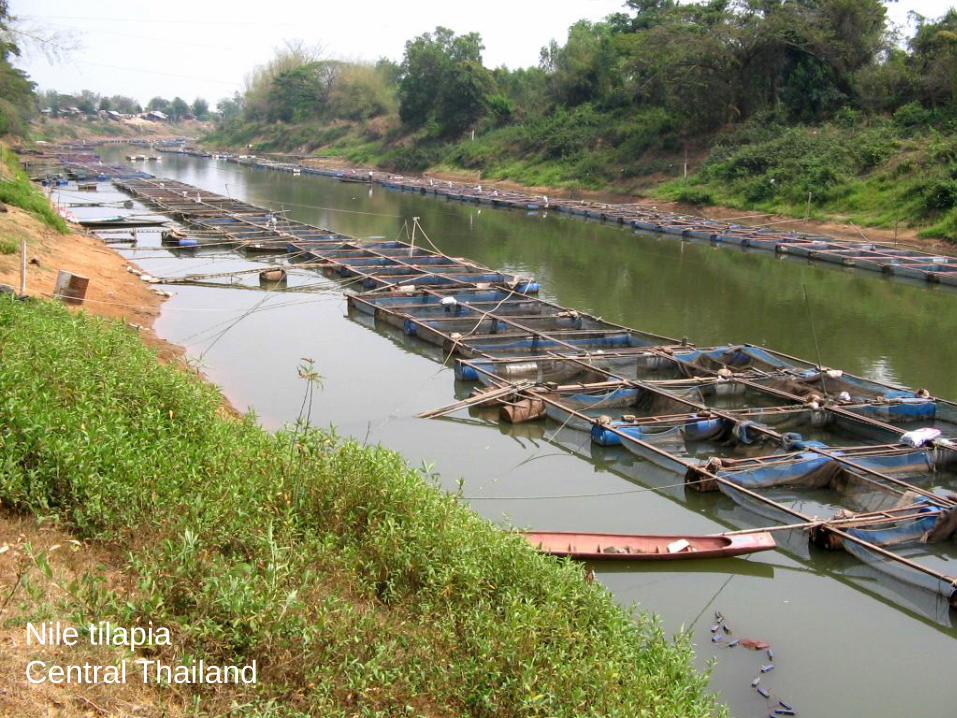
Nile tilapia
Central Thailand
Nile tilapia
Central Thailand
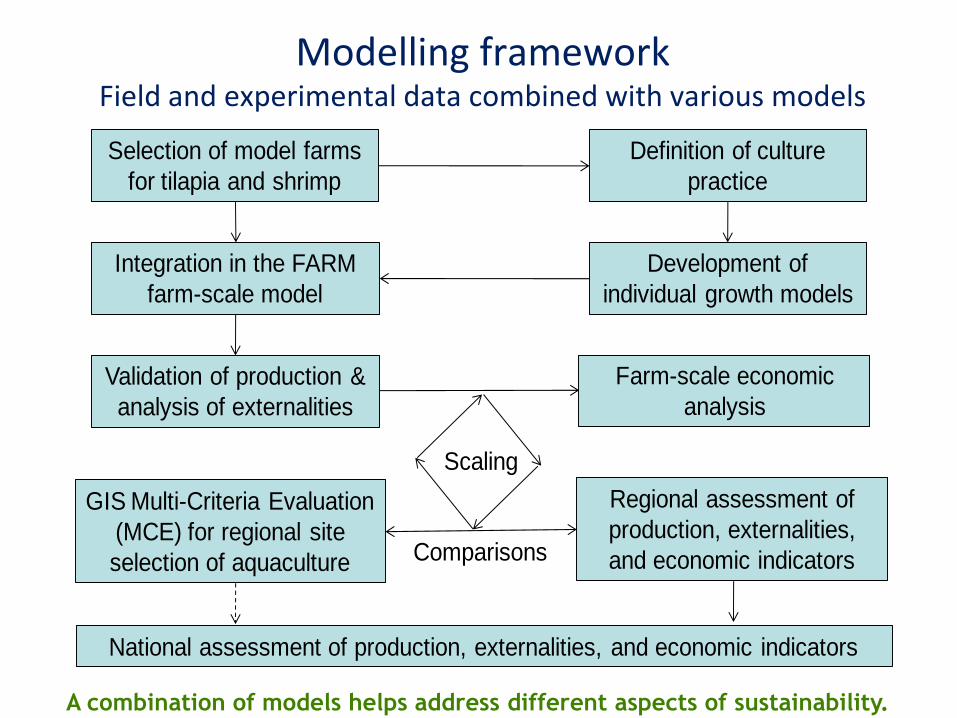
Modelling framework Field and experimental data combined with various models
A combination of models helps address different aspects of sustainability.
Selection of model farms
for tilapia and shrimp
Definition of culture
practice
Development of
individual growth models
Integration in the FARM
farm-scale model
Validation of production &
analysis of externalities
Farm-scale economic
analysis
GIS Multi-Criteria Evaluation
(MCE) for regional site
selection of aquaculture
Regional assessment of
production, externalities,
and economic indicators
Scaling
National assessment of production, externalities, and economic indicators
Comparisons
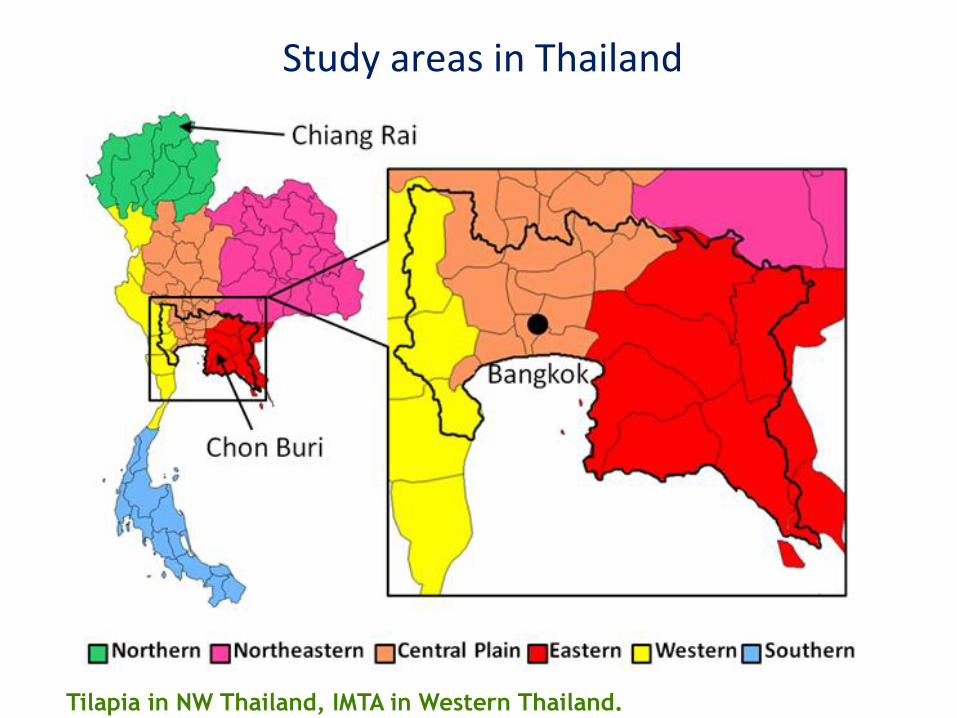
Study areas in Thailand
Tilapia in NW Thailand, IMTA in Western Thailand.
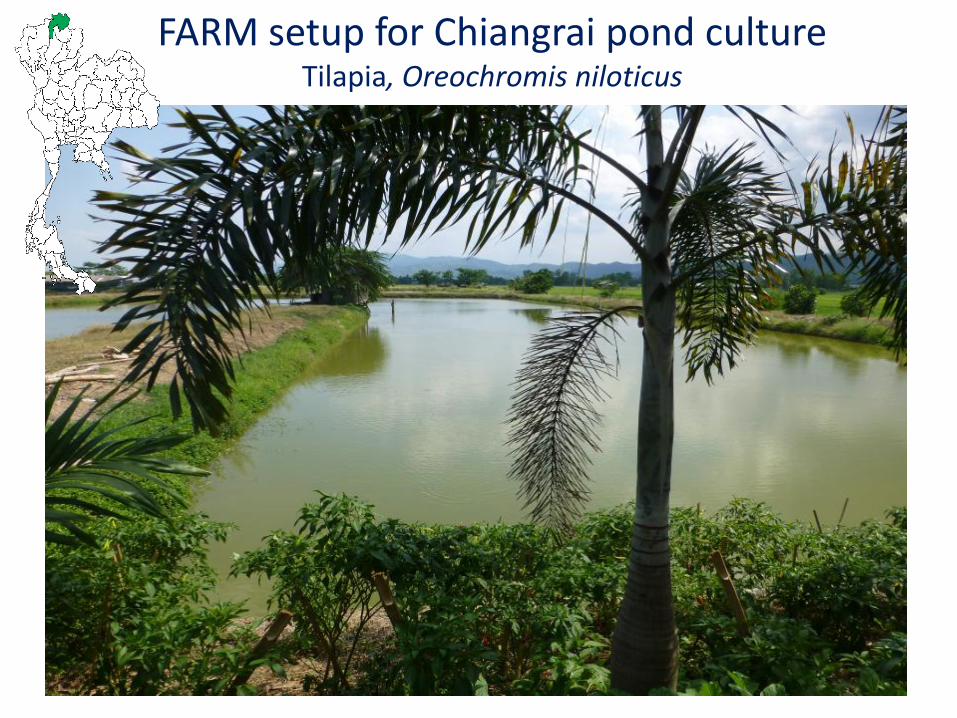
FARM setup for Chiangrai pond culture Tilapia, Oreochromis niloticus
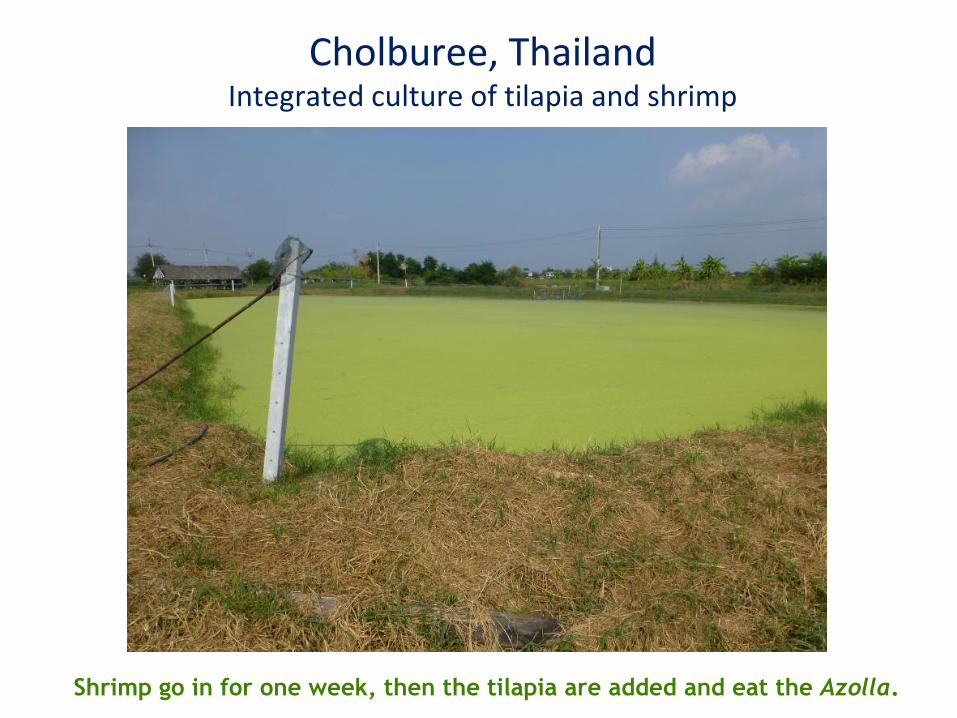
Cholburee, Thailand Integrated culture of tilapia and shrimp
Shrimp go in for one week, then the tilapia are added and eat the Azolla.
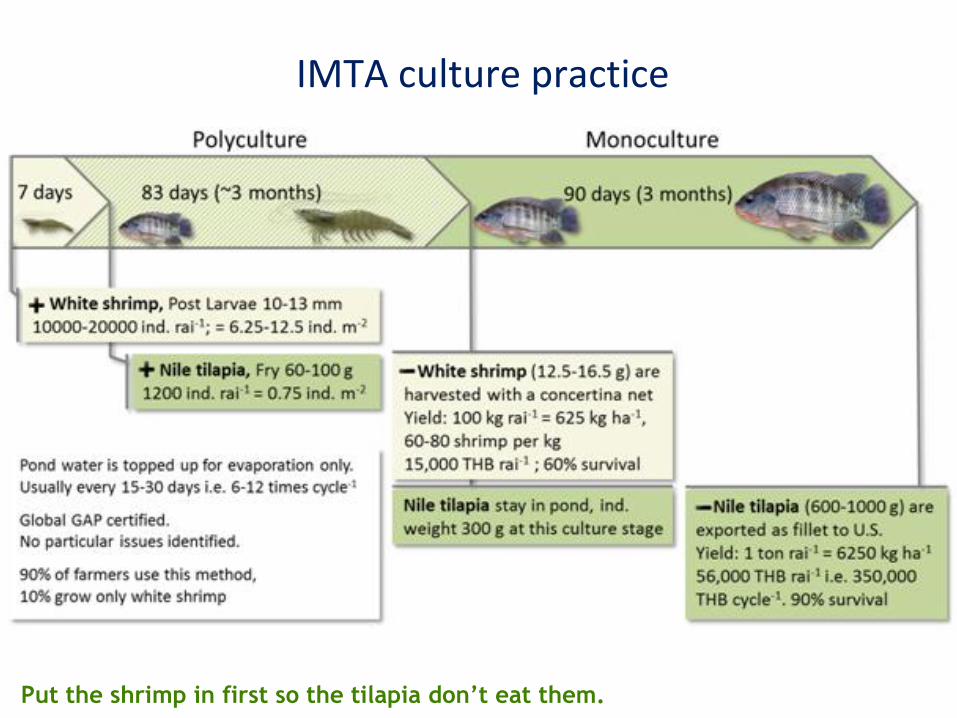
IMTA culture practice
Put the shrimp in first so the tilapia don’t eat them.
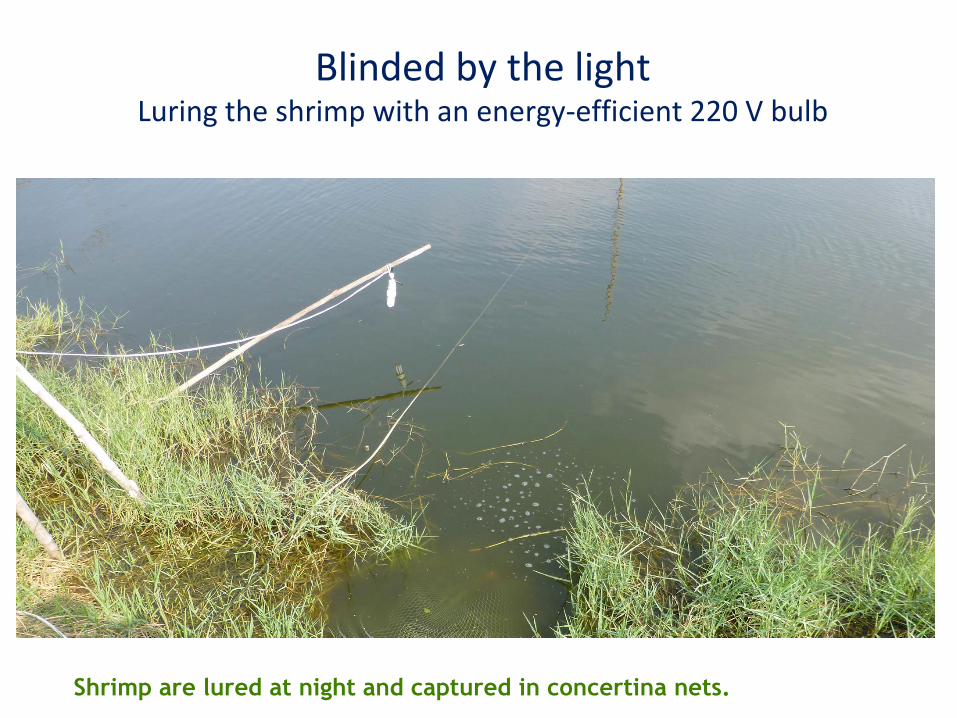
Blinded by the light Luring the shrimp with an energy-efficient 220 V bulb
Shrimp are lured at night and captured in concertina nets.
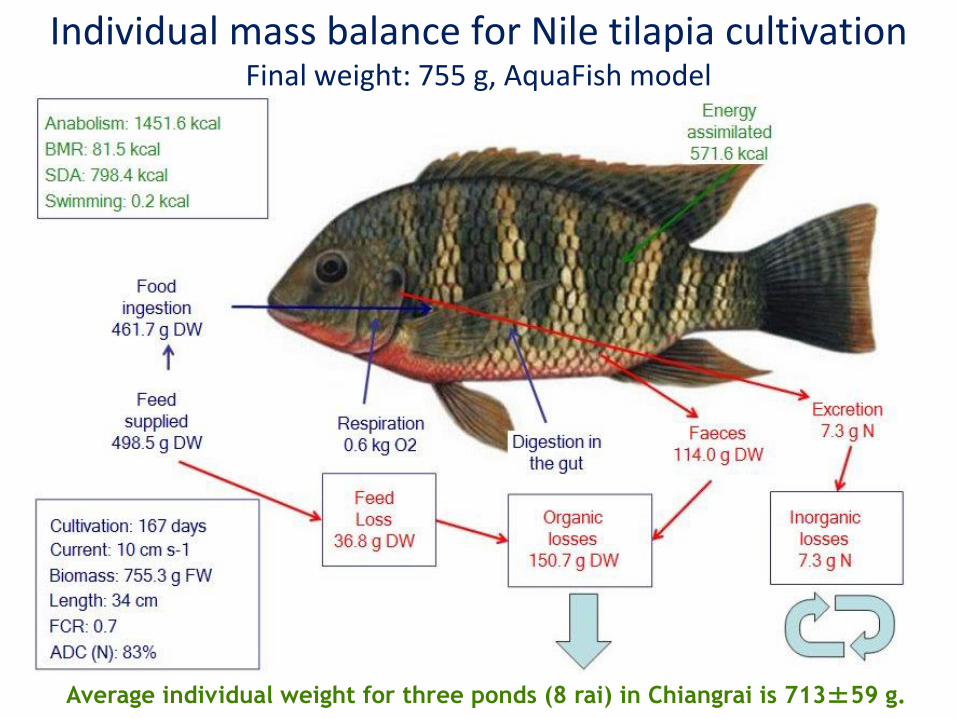
Individual mass balance for Nile tilapia cultivation Final weight: 755 g, AquaFish model
Average individual weight for three ponds (8 rai) in Chiangrai is 713±59 g.
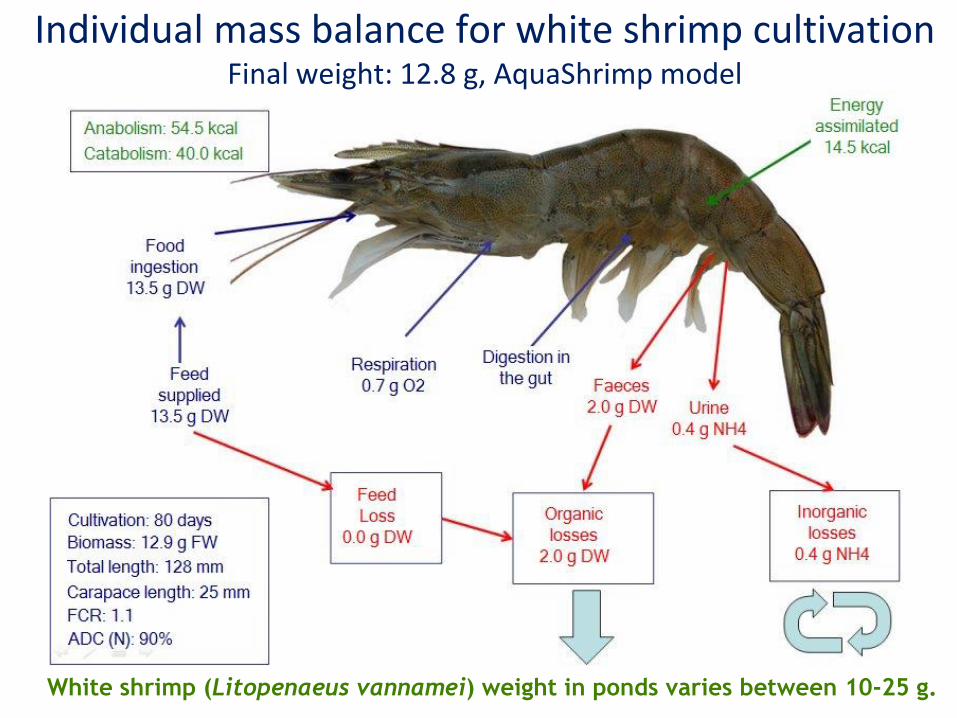
Individual mass balance for white shrimp cultivation Final weight: 12.8 g, AquaShrimp model
White shrimp (Litopenaeus vannamei) weight in ponds varies between 10-25 g.
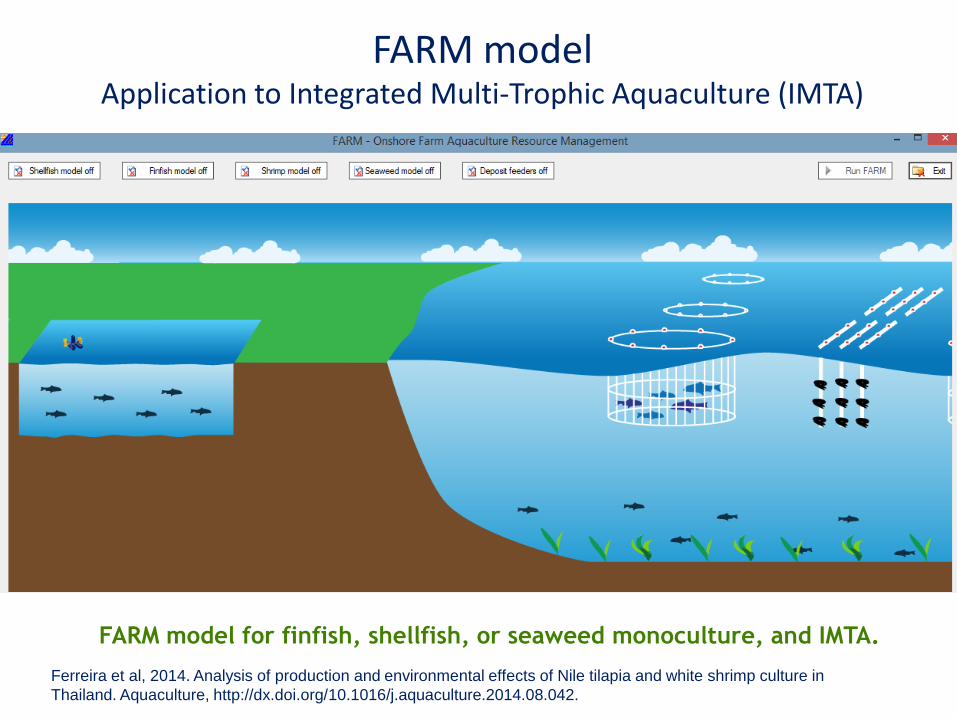
FARM model Application to Integrated Multi-Trophic Aquaculture (IMTA)
Ferreira et al, 2014. Analysis of production and environmental effects of Nile tilapia and white shrimp culture in
Thailand. Aquaculture, http://dx.doi.org/10.1016/j.aquaculture.2014.08.042.
FARM model for finfish, shellfish, or seaweed monoculture, and IMTA.
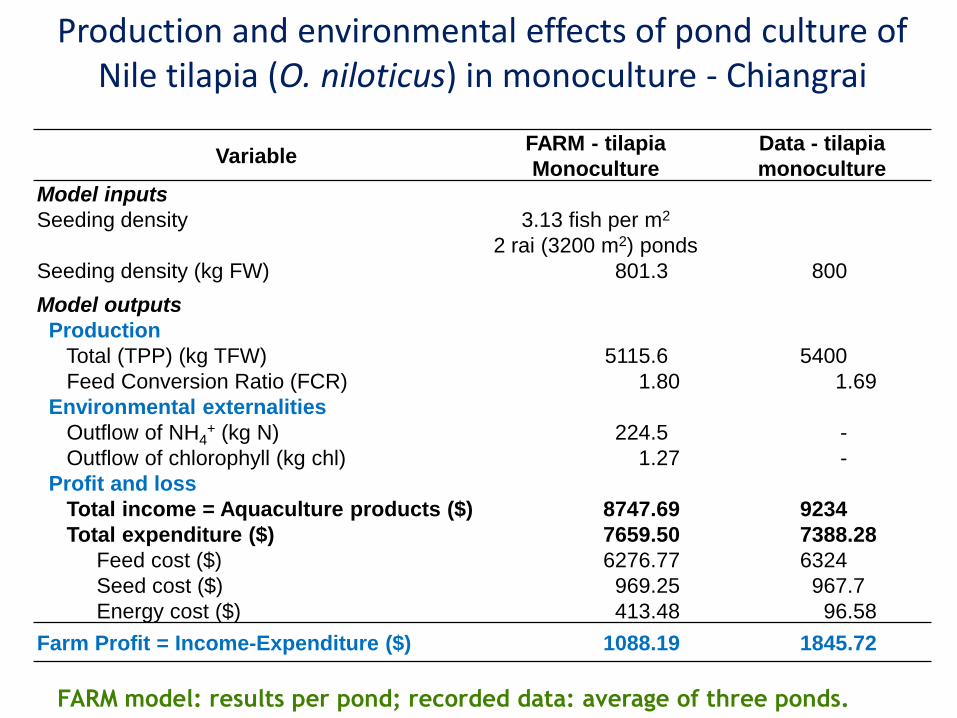
Production and environmental effects of pond culture of Nile tilapia (O. niloticus) in monoculture - Chiangrai
Variable FARM - tilapia
Monoculture
Data - tilapia
monoculture
Model inputs
Seeding density 3.13 fish per m2
2 rai (3200 m2) ponds
Seeding density (kg FW) 801.3 800
Model outputs
Production
Total (TPP) (kg TFW) 5115.6 5400
Feed Conversion Ratio (FCR) 1.80 1.69
Environmental externalities
Outflow of NH4+ (kg N) 224.5 -
Outflow of chlorophyll (kg chl) 1.27 -
Profit and loss
Total income = Aquaculture products ($) 8747.69 9234
Total expenditure ($) 7659.50 7388.28
Feed cost ($) 6276.77 6324
Seed cost ($) 969.25 967.7
Energy cost ($) 413.48 96.58
Farm Profit = Income-Expenditure ($) 1088.19 1845.72
FARM model: results per pond; recorded data: average of three ponds.
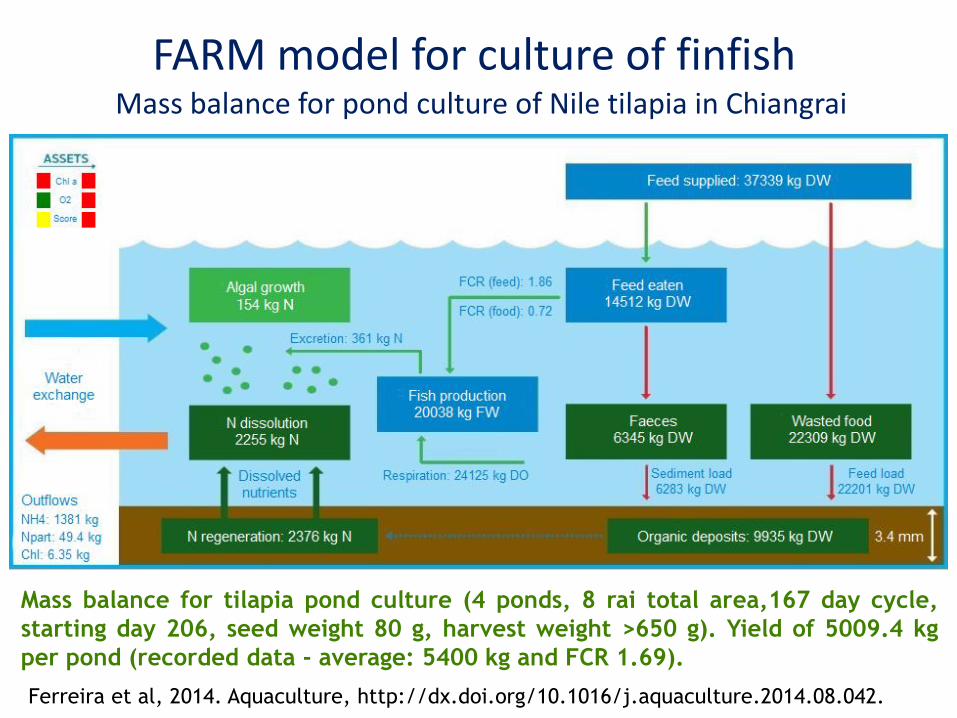
FARM model for culture of finfish Mass balance for pond culture of Nile tilapia in Chiangrai
Mass balance for tilapia pond culture (4 ponds, 8 rai total area,167 day cycle,
starting day 206, seed weight 80 g, harvest weight >650 g). Yield of 5009.4 kg
per pond (recorded data - average: 5400 kg and FCR 1.69).
Ferreira et al, 2014. Aquaculture, http://dx.doi.org/10.1016/j.aquaculture.2014.08.042.
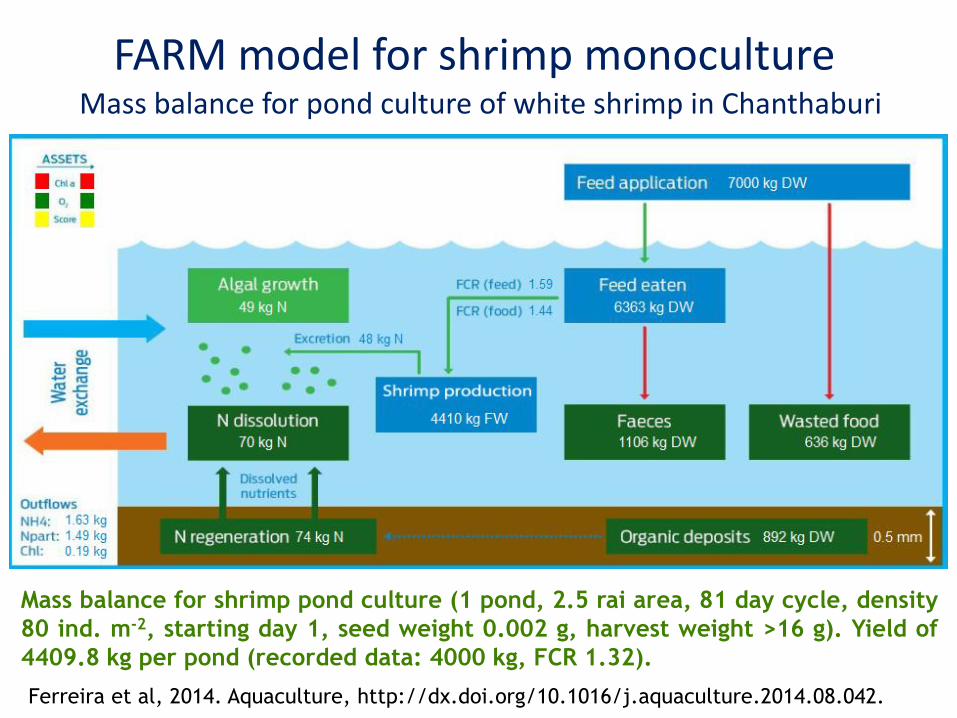
FARM model for shrimp monoculture Mass balance for pond culture of white shrimp in Chanthaburi
Mass balance for shrimp pond culture (1 pond, 2.5 rai area, 81 day cycle, density
80 ind. m-2, starting day 1, seed weight 0.002 g, harvest weight >16 g). Yield of
4409.8 kg per pond (recorded data: 4000 kg, FCR 1.32).
Ferreira et al, 2014. Aquaculture, http://dx.doi.org/10.1016/j.aquaculture.2014.08.042.
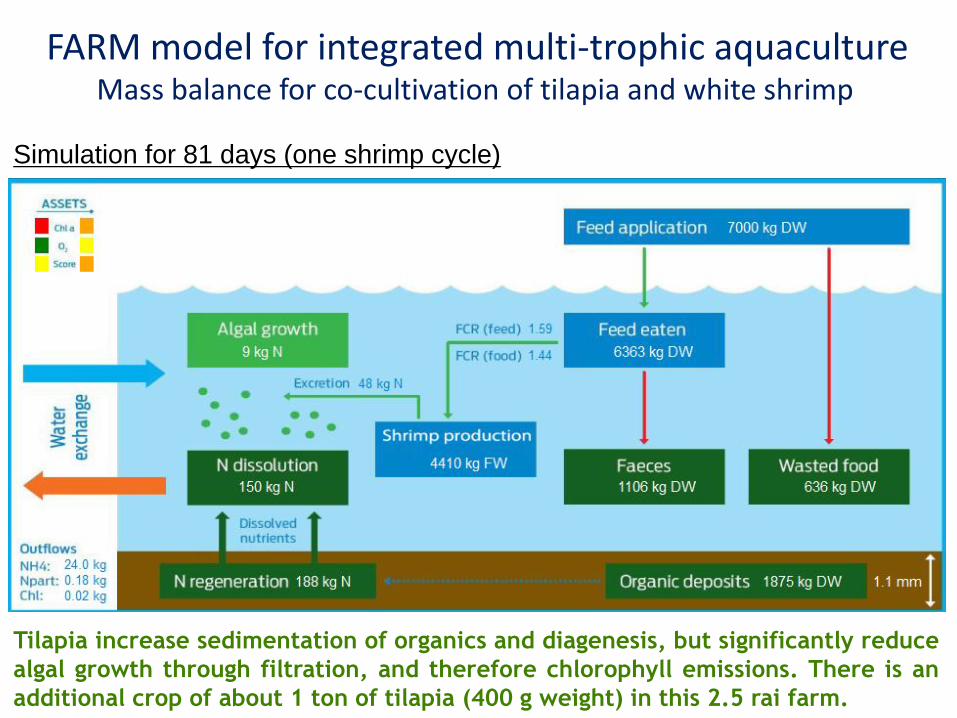
FARM model for integrated multi-trophic aquaculture Mass balance for co-cultivation of tilapia and white shrimp
Tilapia increase sedimentation of organics and diagenesis, but significantly reduce
algal growth through filtration, and therefore chlorophyll emissions. There is an
additional crop of about 1 ton of tilapia (400 g weight) in this 2.5 rai farm.
Simulation for 81 days (one shrimp cycle)
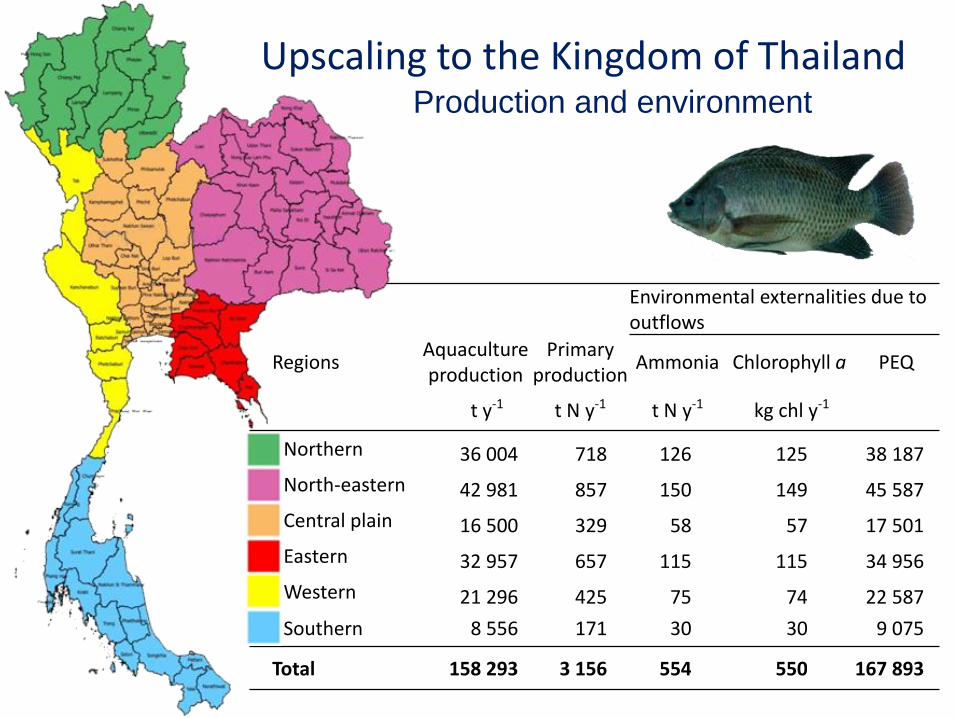
Environmental externalities due to outflows
Regions Aquaculture production
Primary production
Ammonia Chlorophyll a PEQ
t y-1 t N y-1 t N y-1 kg chl y-1
Northern 36 004 718 126 125 38 187
North-eastern 42 981 857 150 149 45 587
Central plain 16 500 329 58 57 17 501
Eastern 32 957 657 115 115 34 956
Western 21 296 425 75 74 22 587
Southern 8 556 171 30 30 9 075
Total 158 293 3 156 554 550 167 893
Upscaling to the Kingdom of Thailand Production and environment
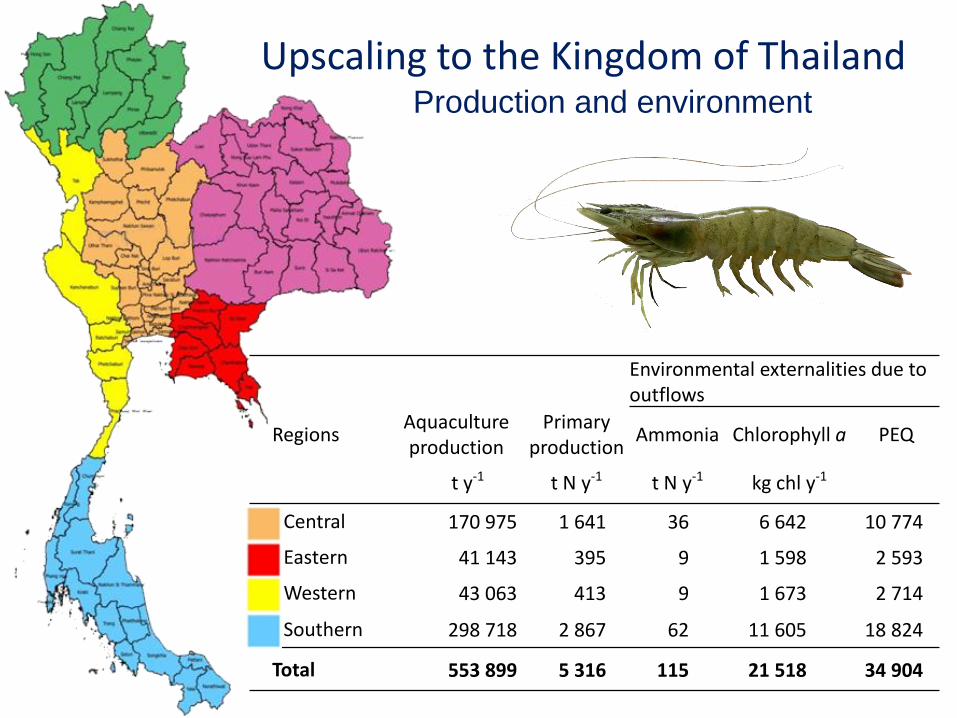
Environmental externalities due to outflows
Regions Aquaculture production
Primary production
Ammonia Chlorophyll a PEQ
t y-1 t N y-1 t N y-1 kg chl y-1
Central 170 975 1 641 36 6 642 10 774
Eastern 41 143 395 9 1 598 2 593
Western 43 063 413 9 1 673 2 714
Southern 298 718 2 867 62 11 605 18 824
Total 553 899 5 316 115 21 518 34 904
Production and environment
Upscaling to the Kingdom of Thailand
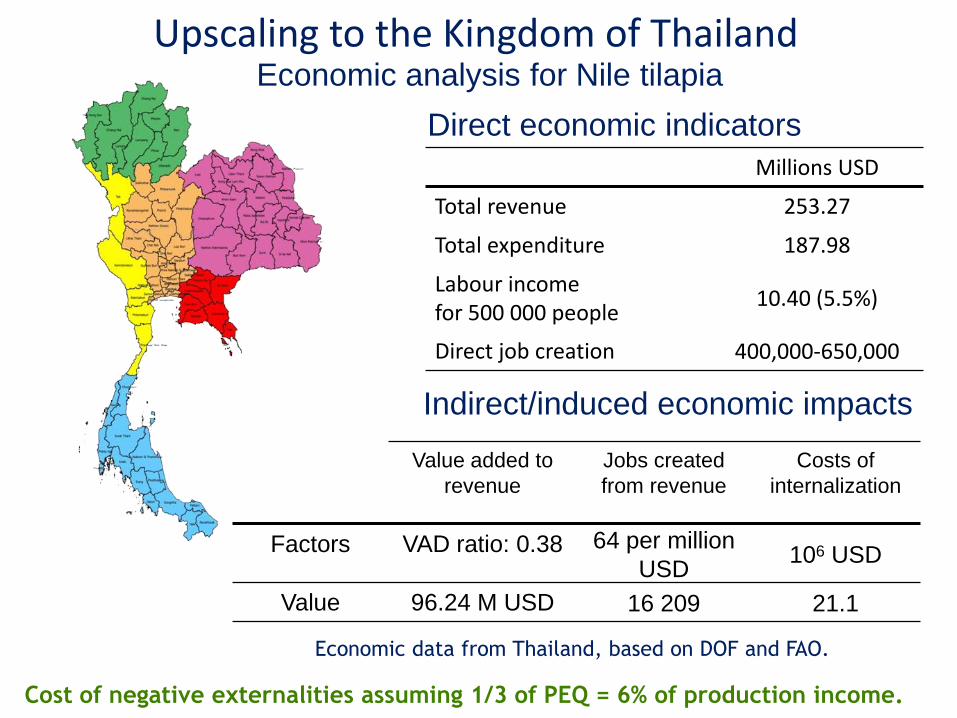
Upscaling to the Kingdom of Thailand
Direct economic indicators
Indirect/induced economic impacts
Value added to
revenue
Jobs created
from revenue
Costs of
internalization
Factors VAD ratio: 0.38 64 per million
USD 106 USD
Value 96.24 M USD 16 209 21.1
Millions USD
Total revenue 253.27
Total expenditure 187.98
Labour income for 500 000 people
10.40 (5.5%)
Direct job creation 400,000-650,000
Cost of negative externalities assuming 1/3 of PEQ = 6% of production income.
Economic analysis for Nile tilapia
Economic data from Thailand, based on DOF and FAO.
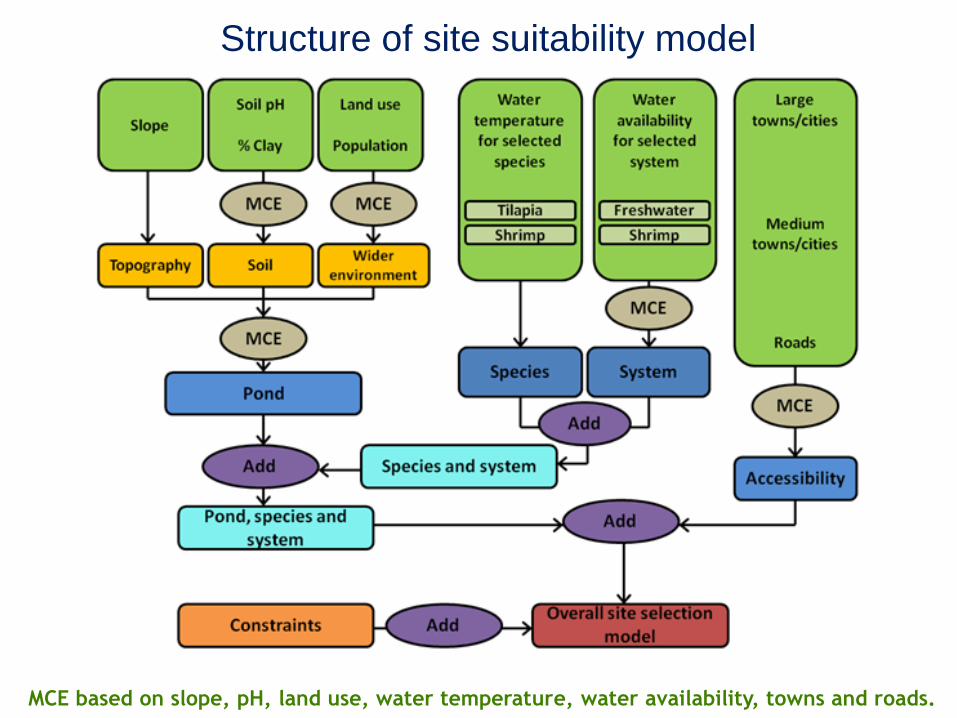
Structure of site suitability model
MCE based on slope, pH, land use, water temperature, water availability, towns and roads.
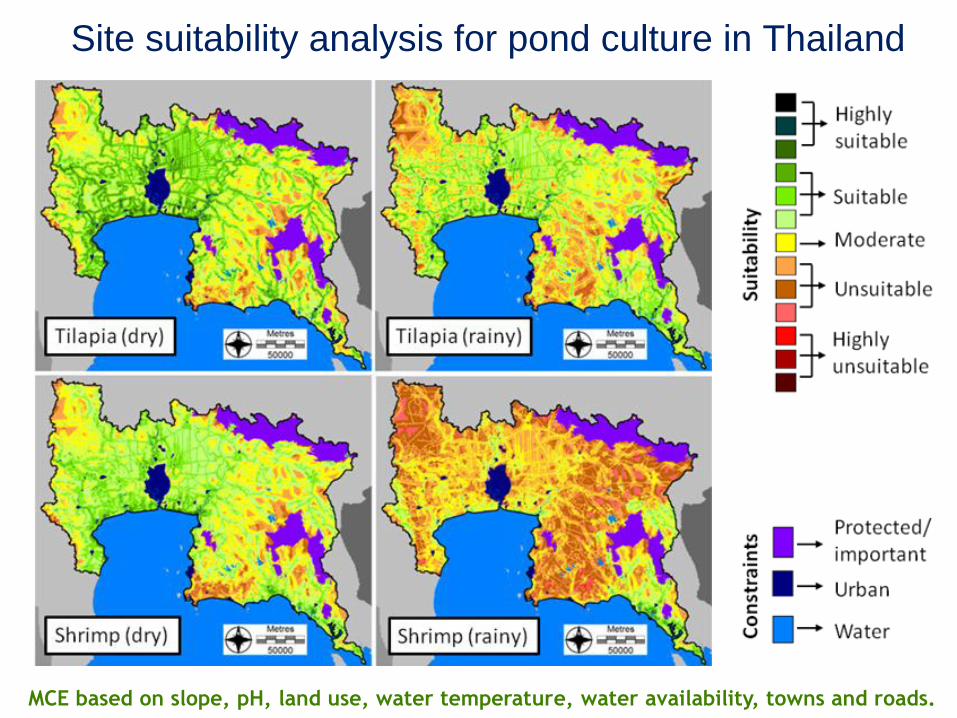
Site suitability analysis for pond culture in Thailand
MCE based on slope, pH, land use, water temperature, water availability, towns and roads.
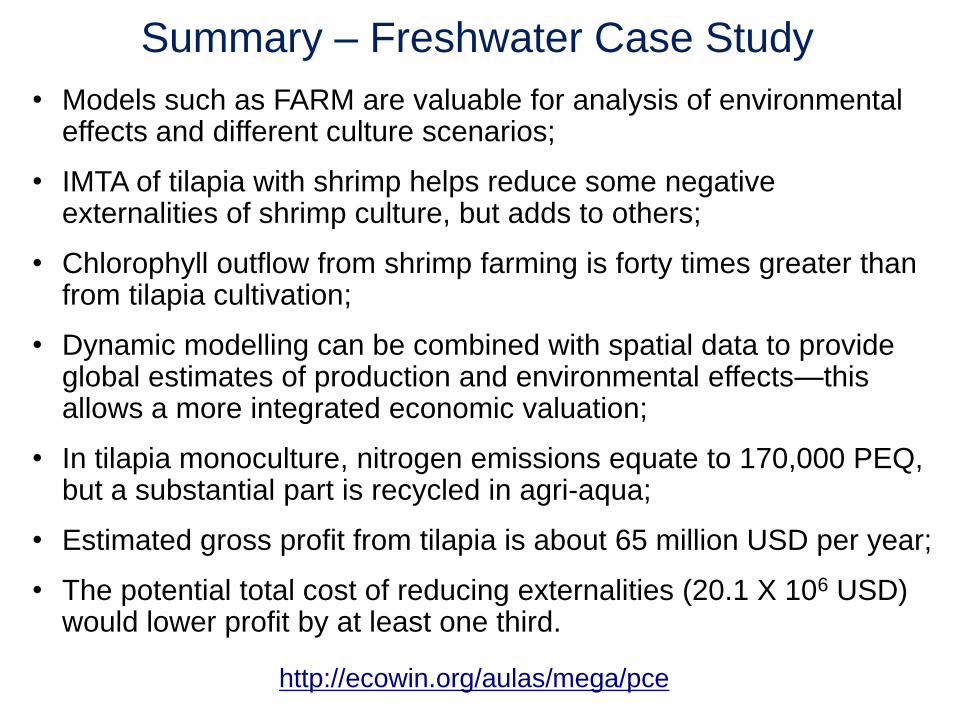
• Models such as FARM are valuable for analysis of environmental effects and different culture scenarios;
• IMTA of tilapia with shrimp helps reduce some negative externalities of shrimp culture, but adds to others;
• Chlorophyll outflow from shrimp farming is forty times greater than from tilapia cultivation;
• Dynamic modelling can be combined with spatial data to provide global estimates of production and environmental effects—this allows a more integrated economic valuation;
• In tilapia monoculture, nitrogen emissions equate to 170,000 PEQ, but a substantial part is recycled in agri-aqua;
• Estimated gross profit from tilapia is about 65 million USD per year;
• The potential total cost of reducing externalities (20.1 X 10⁶ USD) would lower profit by at least one third.
http://ecowin.org/aulas/mega/pce
Summary – Freshwater Case Study
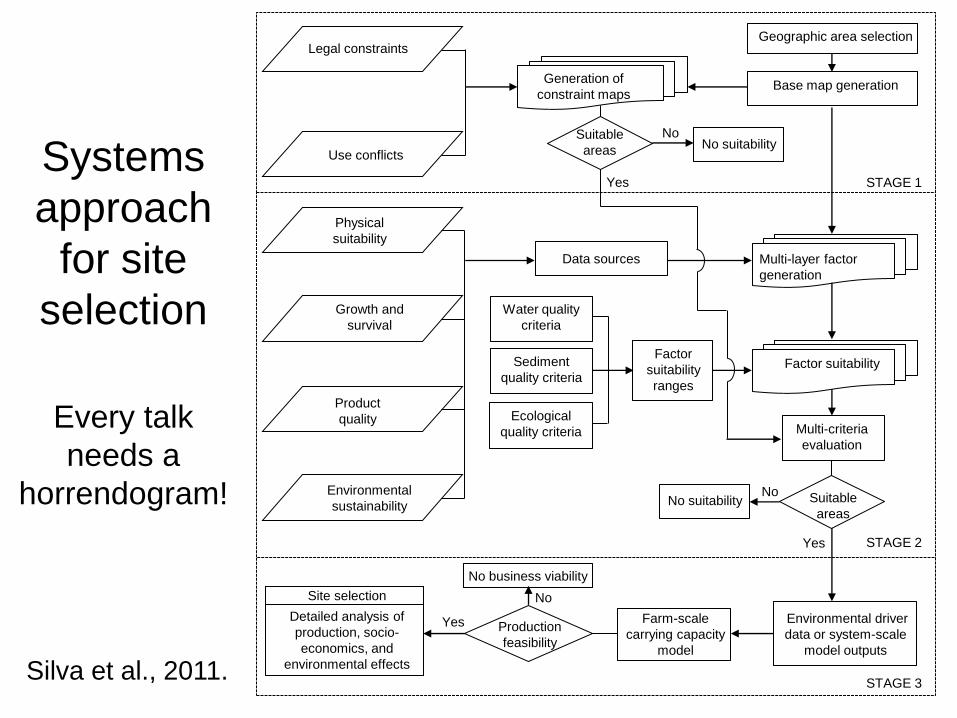
Legal constraints
Use conflicts
Generation of
constraint maps
Geographic area selection
Base map generation
Suitable
areas
Yes
No
Physical
suitability
Growth and
survival
Product
quality
Environmental
sustainability
Data sources Multi-layer factor
generation
Water quality
criteria
Sediment
quality criteria
Factor
suitability
ranges
Multi-criteria
evaluation
Suitable
areas
No
Yes
No suitability
No suitability
Environmental driver
data or system-scale
model outputs
Farm-scale
carrying capacity
model
Production
feasibility
Yes
No
No business viability
Site selection
Factor suitability
STAGE 1
STAGE 2
STAGE 3
Detailed analysis of
production, socio-
economics, and
environmental effects
Ecological
quality criteria
Systems
approach
for site
selection
Every talk
needs a
horrendogram!
Silva et al., 2011.
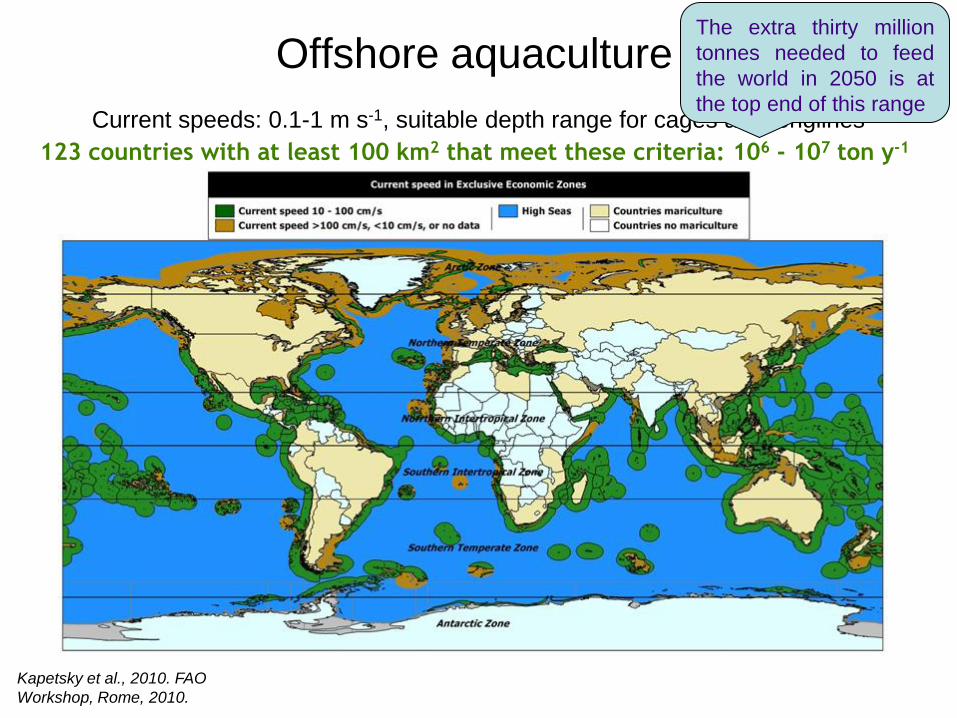
Offshore aquaculture
123 countries with at least 100 km2 that meet these criteria: 106 - 107 ton y-1
Current speeds: 0.1-1 m s-1, suitable depth range for cages and longlines
Kapetsky et al., 2010. FAO
Workshop, Rome, 2010.
The extra thirty million
tonnes needed to feed
the world in 2050 is at
the top end of this range
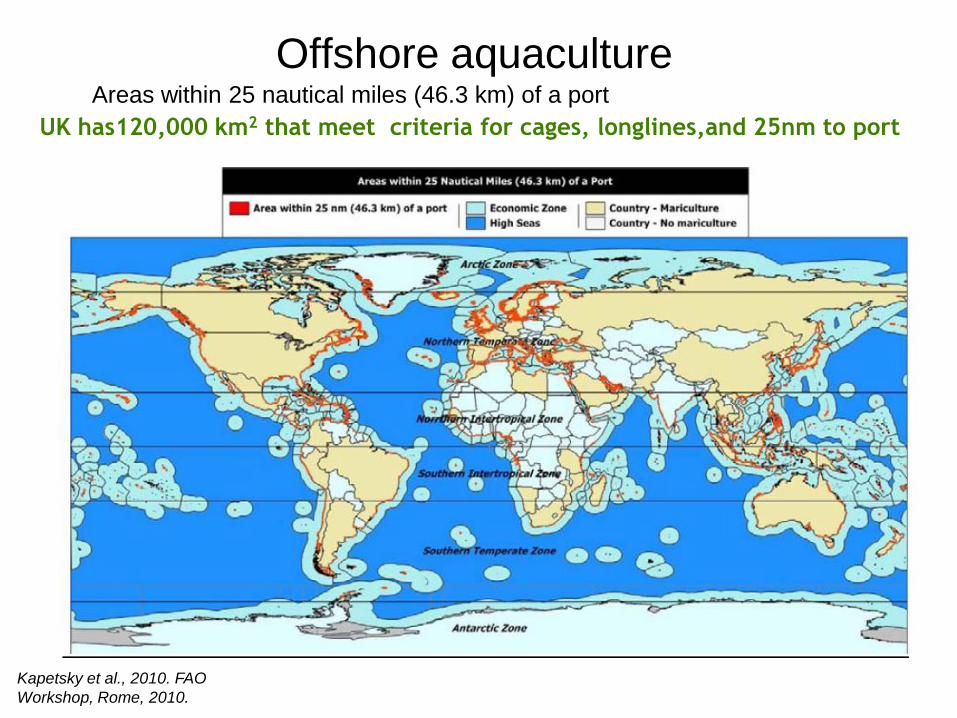
Offshore aquaculture
UK has120,000 km2 that meet criteria for cages, longlines,and 25nm to port
Areas within 25 nautical miles (46.3 km) of a port
Kapetsky et al., 2010. FAO
Workshop, Rome, 2010.
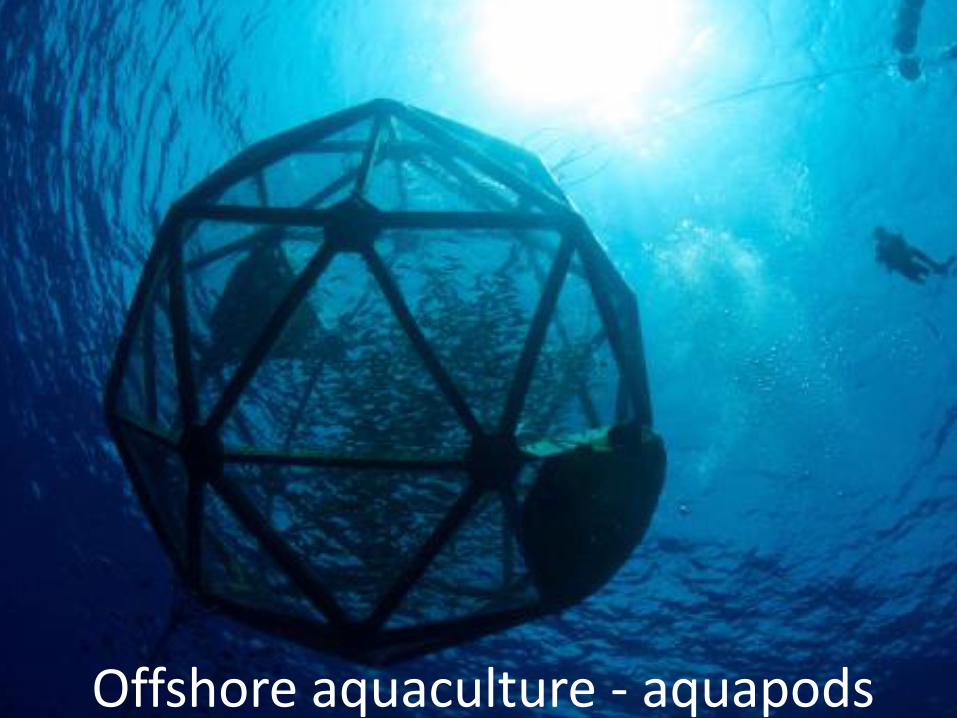
Offshore aquaculture - aquapods
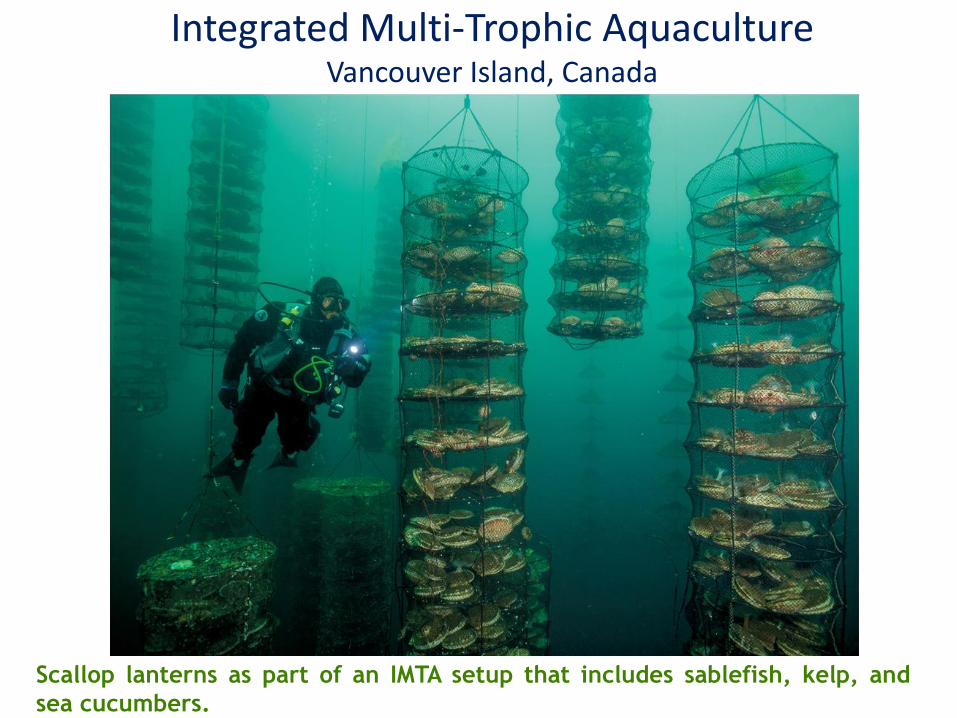
Integrated Multi-Trophic Aquaculture Vancouver Island, Canada
Scallop lanterns as part of an IMTA setup that includes sablefish, kelp, and
sea cucumbers.
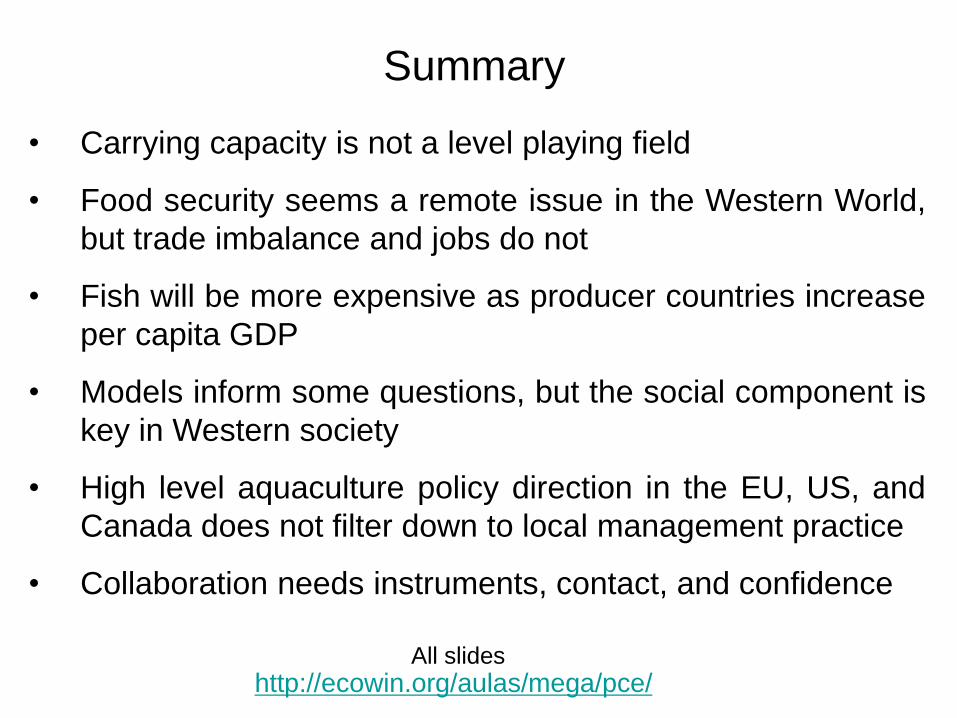
Summary
• Carrying capacity is not a level playing field
• Food security seems a remote issue in the Western World,
but trade imbalance and jobs do not
• Fish will be more expensive as producer countries increase
per capita GDP
• Models inform some questions, but the social component is
key in Western society
• High level aquaculture policy direction in the EU, US, and
Canada does not filter down to local management practice
• Collaboration needs instruments, contact, and confidence
http://ecowin.org/aulas/mega/pce/ All slides
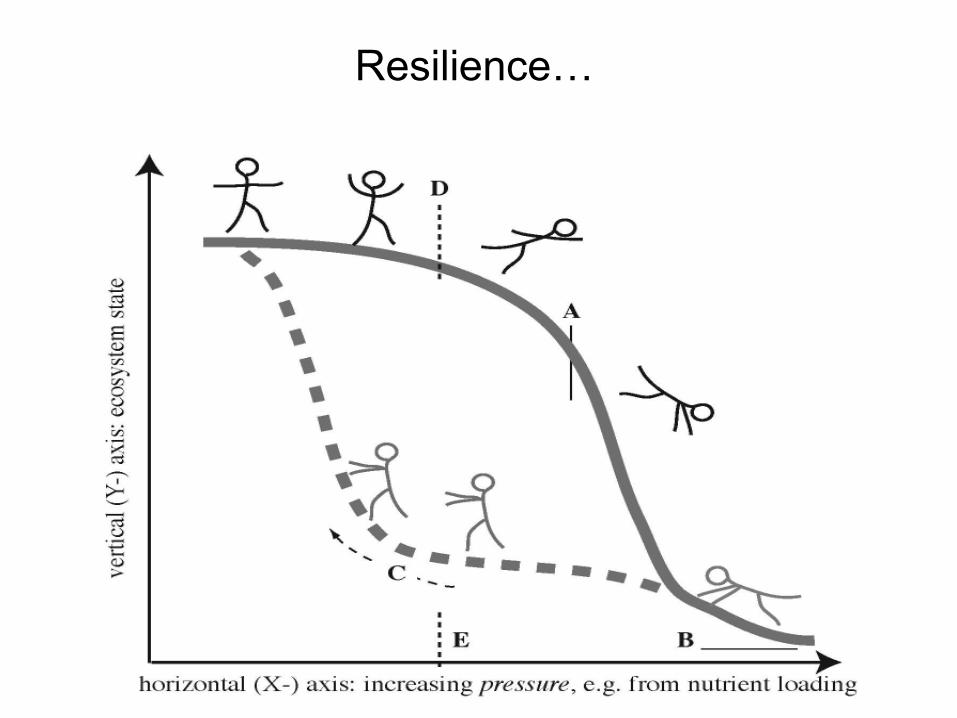
Resilience…


