Embed Size (px)
Citation preview
Journal of Analytical Toxicology, Vol. 32, April 2008
An Enantiomer-Selective Liquid Chromatography- Tandem Mass Spectrometry Method for Methadone and EDDP Validated for Use in Human Plasma, Urine, and Liver Microsomes David E. Moody 1,*, Shen-Nan Lin 1, Yan Chang 1, Lolita Lamm 1, Mark K. Greenwald 2, and Mahmoud S. Ahmed 3 1Center for Human Toxicology, Department of Pharmacology and Toxicology, University of Utah, Salt Lake City, Utah 84108; 2Substance Abuse Research Division, Department of Psychiatry and Behavioral Neurosciences, Wayne State University, Detroit, Michigan 48207; and 3Department of Obstetrics and Gynecology, University of Texas Medical Branch, Galveston, Texas 77555
Abstract I A liquid chromatography-electrospray ionization-tandem mass spectrometry method has been developed and validated to detect (R)-and (S)-methadone and (R)-and (S)-2-ethylidene-l,5-dimethyl- 3,3-diphenylpyrrolidine (EDDP) in human plasma with cross- validation to urine and liver microsomes. Use of deuterated internal standards and liquid-liquid extraction coupled with chiral separation provided baseline separation with a lower limit of quantitation (LLOQ) of 2.5 ng/mL The LLOQ was established from comparison of signal in blanks from six different sources per matrix with the same sources fortified at the LLOQ (none exceeded 19% of LLOQ) and precision and accuracy at the LLOQ determined in the same six sources per matrix. The assay was precise (% coefficients of variation within 13.8%) and accurate (% targets within 15%) in all three matrices. No interference was seen from addition of other psychoactive drugs. Stability was determined in plasma (24 h at room temperature, 321 days at -20~ 3 freeze-thaw cycles); processed plasma samples (5 days at -20~ 12 days on autosampler); urine (24 h at room temperature); and stock solutions (20 h at room temperature, 61 days at -20~ Applications of varying degree are presented for each matrix. Plasma from five subjects maintained on 100 mg oral methadone per day permitted comparison of the pharmacokinetics of the enantiomers. The t,/~ of (R)-methadone was significantly longer than for (S)-methadone, and (S)-methadone was more tightly protein bound. The Cmax, AUC, Cmin, and % protein bound of (S)-EDDP were significantly greater than (R)-EDDP, while the t,/2 of (R)-EDDP was significantly greater than (S)-EDDP. In spot urines, (R)- was higher than (S)-methadone, and (S)- was generally higher than (R)-EDDP. (R)- and (S)-EDDP production was detected after incubation of therapeutic concentrations of racemic methadone with human liver microsomes, and (S)-EDDP production was twofold greater than (R)-FDDP in three human placental microsomes incubated with racemic methadone.
* Author to whom correspondence should be addressed: David E. Moody, Ph.D., University of Utah, Center for Human Toxicology, 417 Wakara Way, Suite 2111, Salt Lake City, UT 84108. E-mail: [email protected].
Introduction
Methadone is a la-opioid receptor agonist that is used to treat opioid dependence and chronic pain (1,2). Recently, a growing number of fatalities have been associated with methadone exposure (3-7), which has been attributed, in part, to the resurgence in the use of methadone to treat pain (3,6,8- 10). In many cases of methadone-related deaths multiple drugs were identified (3). Methadone by itself can be fatal and phar- macodynamic interactions with other CNS-depressants can enhance its respiratory depressant effects. Methadone is, how- ever, also known to have pharmacokinetic interactions with a number of drugs (2,11-13). Should these drug interactions increase methadone concentrations, they would augment the toxic effects of methadone. Conversely, drug interactions that decrease methadone concentrations can precipitate withdrawal symptoms.
Methadone is generally used as the racemic mixture of (R)- or levo (l) and (S)- or dextro (d) enantiomers. In vitro (14,15) and clinical studies (16-18) demonstrate that (R)-methadone is a more potent l>opioid receptor agonist than (S)-methadone. The pharmacokinetics of methadone is also enantiomer-selec- tive (18-24). The pharmacokinetics of (R)- and (S)-2- ethylidene-l,5-dimethyl-3,3-diphenylpyrrolidine (EDDP) have not yet been described. In general, a higher maximum plasma concentration (Cmax) is found for (S)-methadone and a longer elimination half-life (t,,~) is found for (R)-methadone, and a higher percent binding of (S)- than (R)-methadone to plasma proteins (21,22,24,25).
Methadone is primarily metabolized by N-demethylation, which is combined with spontaneous cyclilization to produce EDDP. A subsequent N-demethylation produces 2-ethyl-5- methyl-3,3-diphenylpyrroline (EMDP); the latter is rarely detected in plasma, but it is found in urine. In vitro studies of the role of different cytochrome P450 (CYP) enzymes in methadone metabolism have identified a consistent role for
208 Reproduction (photocopying) of editorial content of this journal is prohibited without publisher's permission.
Dow
nloaded from https://academ
ic.oup.com/jat/article/32/3/208/897718 by guest on 09 January 2022
Journal of Analytical Toxicology, Vol. 32, April 2008
CYP3A4 and more recently CYP2B6 with moderate to strong involvement of 2C9, 2C8, 2C19, and 2D6 (26-33). Studies on enantiomer-specific metabolism of methadone are more lim- ited. Although slightly to moderately greater metabolism of (R)-methadone by 2C9 and 2C19 was consistently found, in- consistent results were found for 2D6 and 3A4 (28-31,33). Two recent studies have reported that CYP2B6 was much more active at metabolizing (S)-methadone (31,33). The in- volvement of CYP2B6 in the metabolism of (S)-methadone is consistent with clinical studies where genotypes of poor and extensive 2B6 metabolizers were compared to (S)- and (R)- methadone peak and trough plasma concentrations in methadone patients (34,35). These studies also demonstrated a major role of the CYP3A4 phenotype and a minor role of the CYP2D6 genotype on methadone plasma concentrations; no impact of the CYP2C9 and 2C19 genotypes was found. When methadone is used during pregnancy, the placenta forms a major barrier to reduce fetal methadone exposure. The aromatase enzyme (CYP19) in human placental micro- somes metabolizes methadone to EDDP (36); the enantiomer selectivity of the CYP19 metabolism of methadone is un- known.
Monitoring metabolite formation is useful to understand potential mechanisms of drug interactions. In vitro studies in human liver microsomes can predict, at least qualitatively, some potential drug interactions. Although several methods have been described for the enantiomer-selective determination of methadone, only recently has the metabolite EDDP also been included in the plasma methods (25,37). These methods were fairly well validated, but the studies were limited to a single matrix, plasma, and the applications were limited to ei- ther a time-course of plasma concentrations in a single subject (37), or 3-6 different total and unbound plasma concentrations from five subjects that are not linked to any time after dosing (25).
Both Whittington et al. (37) and Rodriguez-Rosas et al. (25) employed liquid chromatography coupled to single-stage mass spectrometry (LC-MS). LC-MS-MS has been used to measure methadone and EDDP in other matrices, including oral fluid (38), hair (39), meconium (40), sera (41), plasma (42), and wastewater (43). Only the study on hair (39) and sera (41) mea- sured (R)- and (S)-methadone and (R)- and (S)-EDDP. The latter study did not achieve baseline separation of (R)- and (S)- methadone. Because LC-MS-MS potentially offers greater specificity, we used it to develop a method for determination of (R)- and (S)-methadone and (R)- and (S)-EDDP in multiple matrices.
At this time, we have adapted the methadone enantiomer se- lective LC-electrospray ionization (ESI)-MS-MS method of Liang et al. (44) to include EDDP. The method has undergone a thorough Good Laboratory Practices validation in human plasma and has been cross-validated to urine and human liver microsomes. The present study applied this method to 1. de- termine the pharmacokinetics of (R)- and (S)-methadone and (R)- and (S)-EDDP in five subjects taking 100 mg per day oral methadone; 2. determine both (R)- and (S)-methadone and (R)- and (S)-EDDP in human urine; 3. to follow (R)- and (S)- EDDP production in human liver microsomes incubated with
therapeutic concentrations of methadone; and 4. show that human placental microsomes form (S)-EDDP to a much greater extent than (R)-EDDP when incubated with racemic methadone.
Experimental
Materials Racemic methadone, racemic EDPP perchlorate, and the
corresponding @labeled analogues were purchased trom Cer- illiant (Round Rock, TX). Pure (R)- and (S)-methadone free- base were provided by the National Institute on Drug Abuse (Bethesda, MD). Glucose-6-phosphate, glucose-6-phosphate dehydrogenase (Type XII), NADP, and ammonia acetate were purchased from Sigma-Aldrich (St. Louis, MO). Sodium hy- droxide and HCI were purchased from Mallinckrodt Specialty Chemicals (St. Louis, MO). All solvents were HPLC grade. YM- 30 Centrifree centrifugal filter ultraffltration devices were pur- chased from Millipore (Billerica, MA). Water was obtained from a MilliQ filter apparatus (Millipore). Human plasma was from the University of Utah blood bank. Human urine was con- tributed by Center staff.
Liquid-liquid extraction Screw-capped culture tubes (16 • 100 mm) were silanized
as previously described (45) and used for 0.1-mL aliquots of quality control (QC), calibration standards, and study sam- ples. Twenty nanograms each of (R)- and (S)-methadone-d3 and (R)- and (S)-EDDP-d3 (20 t~L of 1 ng/lJL in methanol) were added to each tube (except blanks) followed by 25 IJL of 1 N NaOH. After vortex mixing, 3 mL of methyl t-butyl ether was added; the tubes were capped tightly, vortex mixed, and centrifuged for 10 rain at 2400 rpm. The organic layer was carefully transferred into 13 x 100-ram silanized culture tubes, 10 IJL of 0.1 N HCI was added, and the tubes were vortex mixed. The organic solvent was evaporated under a stream of air at 40~ in a Zymark Turbo Vap evaporator. The residues were reconstituted in 100 tJL of methanol/10 mM ammonium acetate (1:9, v/v) and transferred to autosampler vials.
LC-ESI-MS--MS The LC system was a Hewlett-Packard 1100 series (Agilent
Technologies, Palo Alto, CA). It consists of a solvent cabinet, vacuum degasser, binary pump, and a column compartment and autosampler both with temperature control. The LC column was a Chiral-AGP (50 • 2.0 mm, 5 ]am, Analytical, Pompton Plains, N J). The mobile phase was a gradient of 10 mM ammonium acetate (A) and methanol (B) with %A at 88, 88, 60, 60, 88, and 88 at 0, 2.5, 3.6, 9.0, 9.1, and 16 min, re- spectively. The flow rate was 0.2 mL/min. The column tem- perature was 30~ and the autosampler was at room temper- ature. The injection volume was 10 1JL.
A Finniganfrhermo Quest TSQ triple-stage quadrupole MS was used for analysis. It was equipped with a Gateway GP6-450 computer with Windows NT operating system and Xcalibur
209
Dow
nloaded from https://academ
ic.oup.com/jat/article/32/3/208/897718 by guest on 09 January 2022
(v 1.1) operating software. The LC was interfaced with the MS by means of an ESI manifold. The instrument was operated under selective reaction monitoring (SRM) mode. Capillary temperature was 250~ ESI spray voltage was set at 5 kV. High purity N2 was used as both sheath and auxiliary gas, which were set at 60 psi and 10 flow units, respectively. High purity Ar (2.8-3.2 reTort) was used as collision gas. The Xcal- ibur software was used for the setup and operation of sequence lists, and LC Quan (within the Xcalibur software) was used for batch quantitation.
The m/z 310 (MH § to 265, m/z 313 (MH § to 268, m/z 278 (MH § to 234, and m/z 281 (MH § to 234 selected monitoring transitions were used to analyze methadone, methadone-d3, EDDP, and EDDP-d3, respectively. The concentrations of (R)- and (S)-methadone and (R)- and (S)-EDDP were determined by the peak-area ratio of the analyte and its internal standard, with comparison to the calibration curve that was generated from the analysis of plasma or urine fortified with known concen- trations of the analyte and its internal standard. Calibration curves were run in duplicate with enantiomer concentrations (fortified to reach twice the concentration with racemic ana- lyte) at 0, 2.5, 5, 10, 25, 100, 250, 425, and 500 ng/mL. A quadratic curve with 1/Y 2 weighting was used.
Quality control (QC) QC samples and calibrators were prepared from stock solu-
tions that were prepared by different staff members from dif- ferent lots of reference material. Plasma calibrators were used for plasma and liver microsome experiments; urine calibrators were used for urine experiments. One set of calibrators was run at the beginning of the batch, one set at the end. Each cali- brator was back calibrated. Calibrators were deleted from the curve if they were more than + 15% (+ 20% at the LLOQ) from target. If more than 25% of calibrators had to be deleted, the run failed. QCs were prepared in the matrix being exam- ined. QCs were run at an N > 2 per concentration. If only two per concentration, then one set (low, medium, and high) were run just after the first calibration curve, the other just before the second calibration curve. If the N was greater than 2, ad- ditional QCs were dispersed within the run. QCs were accept- able if they were within + 15% of target. For a run to pass, at least two-thirds of all QCs must pass, and at least 50% at'any concentration must pass.
Ion suppression Aliquots of drug-free human plasma, urine, and liver mi-
crosomes, each from three sources, were extracted according to the method described. The LC-MS-MS was plumbed to allow for a post LC column infusion of 20 pg/mL methadone and EDDP (10 IJg/mL for each enantiomer) and their deuter- ated internal standards (46). The infusion rate was 9 IJL/min. The extracted samples were injected onto the instrument under analytical conditions described. Any ion suppression is indi- cated by a depression in the baseline generated by the infused methadone/EDDP mixture. Any observed ion suppression at the retention times of the analytes of interest may warrant further evaluation of chromatographic conditions, internal standards, or limits of detection.
210
Journal of Analytical Toxicology, Vol. 32, April 2008
Method validation Method validation experiments were conducted under Good
Laboratory Practices specified by the U.S. Food and Drug Ad- ministration (47). Full validation was performed with plasma as the matrix. Once this has been done satisfactorily, only a partial validation is required for matrix cross-validation. The experiments used to cross-validate urine and liver micro- somes included specificity, intrarun precision and accuracy, and for urine, room temperature stability. Room temperature stability was not determined for human liver microsomes since these are never handled under conditions that permit prolonged exposure to room temperature once methadone is added.
Specificity was determined for all three matrices using six dis- tinct sources of each matrix. The six sources were fortified with three aliquots containing internal standard only and an addi- tional aliquot with internal standard and analytes at the LLOQ. Samples were then extracted and analyzed. In samples with in- ternal standard only any peak within the retention limits of the LLOQ peaks was integrated, using manual integrations if necessary. The peak-area ratios were obtained and compared to the mean of the peak-area ratios for the six LLOQ samples. The mean of the three internal standard only samples peak-area ratios could not exceed 20% of the mean of the LLOQ peak-area ratios.
Interference was determined from analysis of blank plasma samples containing internal standard that were fortified with different drugs or drug metabolites. One set (n = 3 plasmas) was fortified with buprenorphine and norbuprenorphine to 200 ng/mL, morphine and codeine to 1000 ng/mL, aripiprazole to 500 ng/mL, and cocaine, benzoylecgonine, ecgonine methyl ester, and norcocaine to 1500 ng/mL. The second set (n = 3 plasmas) was fortified with triazolam to 40 ng/mL, oxazepam to 300 ng/mL, fluoxetine to 10,000 ng/mL, and pseu- doephedrine to 1500 ng/mL. As with the specificity samples, any peak area at the retention time of the analytes was mea- sured, the peak-area ratio determined, and that ratio com- pared to the mean ratio of the LLOQ calibrators in the run. A mean peak-area ratio that exceeded 20% of the LLOQ mean ratio would be indicative of interference.
Intrarun precision and accuracy was determined using QCs prepared within 3x of the LLOQ (low), and 70% of the upper limit of quantitation (high); no specifications are listed for the medium QC, but we try to approximate the median calibrator concentration. LLOQ samples were prepared in the same six sources used for the specificity study. QCs in an N = 5 per concentration and the six LLOQ samples were analyzed in a single run. This experiment was run for all three matrices. Acceptance criteria for accuracy are mean results within 15% of target (20% for LLOQ) and precision for % coefficients of variation (%CV) within 15% (20% for LLOQ).
Interrun precision and accuracy was performed only with plasma. QCs atN = 5 per concentration were run in two addi- tional runs for a total of 15 results per concentration. As cur- rently based in our SOP and in recent publications, the overall means and SDs were determined and expressed as %target and %CV. Acceptance criteria for accuracy are mean results within 15% of target and precision for %CVs within 15%.
Dow
nloaded from https://academ
ic.oup.com/jat/article/32/3/208/897718 by guest on 09 January 2022
Journal of Analytical Toxicology, Vol. 32, April 2008
Alternatively, use of one-way analysis of variance (ANOVA) has been suggested as a better estimate of interrun precision (48). Precision (i.e., the equivalent of the standard deviation for a particular concentration, st) in this case is calculated by run- ning an ANOVA with the replicates for each run entered in a separate column. The between mean squares (MSB) and within mean squares (MSw) are then used as follows, where n = number of replicates per run:
S t = ( ( M S B - MSw)/n) 1/2
sr is used solely to indicate the component of interrun pre- cision due to differences between runs (between-group). The precision to be used to evaluate acceptance criteria is referred to as the time-dependent intermediate precision (st). Where
st = (MSb- st2) 1/2
Division of St by the overall (or grand) mean then provides the %CV (48).
Stability experiments were performed with analysis of the low and high QCs stored under various conditions (N ~. 3 per concentration and condition). For room temperature stability plasma and urine QCs were removed from frozen storage 24 h prior to extraction. Stability at -20~ was determined on plasma QCs stored under that condition for 321 days since their preparation. For freeze-thaw stability, plasma QCs were removed from frozen storage, allowed to completely thaw (30- 60 min), and returned to frozen storage for at least 12 h; this process was repeated two additional times with the last just prior to extraction. For processed sample stability, plasma QCs were extracted and analyzed; they were then stored either at - 20~ or on the autosampler until they were reanalyzed with a freshly extracted set of calibrators and QCs. Primary acceptance criterion for stability is that the QCs as a whole are acceptable; secondary criterion is that the mean result is within _+ 15% of target.
Preparation of plasma ultrafiltrates The extent of plasma protein binding of (R)- and (S)-
methadone and (R)- and (S)-EDDP was determined using ul- trafiltration, essentially as described by Wilkins et al. (49). Five-hundred microliters of plasma from selected clinical sam- ples were equilibrated to room temperature for 30 min and then transferred into the YM-30 Centrifree centrifugal filter de- vices (30,000 m.w. cutoff). These were centrifuged at 2400 rpm for 20 rain (or until slight]y more than 100 IJL of ultrafiltrate was obtained). Phosphate-buffered saline fortified with 300 ng/mL of methadone and 25 nglmL EDDP were co-processed to control for non-specific binding. As previously reported by Foster et al. (2 i) for the MPS-I Amicon ultrafiltration devices, non-specific binding of methadone (9 13.4%), but not EDDP, was found with the Centrifree devices and this was not dimin- ished by passivation. We therefore corrected for the non-spe- cific binding as follows:
% Bound = 1 - (Amount in Ultrafiltrate)/ (1 - % Non-specific Binding)/Amount in Unfiltered)
Clinical pharmacokinetic samples All participants were participating in an Institutional Re-
view Board (IRB) approved study and signed informed con- sent before participating in the study. All participants were maintained on methadone 100 mglday for at least two weeks prior to this pharmacokinetic study. Methadone oral con- centrate (10 mg/mL) was administered in a constant liquid volume with distilled water as vehicle. This protocol was part of a larger study that involved double-blind dose omis- sions (i.e., placebo instead of methadone). Because partici- pants are able to detect differences in methadone dose based on bitter taste (50), a taste mask was used just prior to methadone administration. All participants first received an identical-looking 40-mL drink made of Ora-Sweet and water (1:4 ratio) containing 12 nglmL of denatonium benzoate (Bitrex, Spectrum Quality Products). Research staff moni- tored the participant while s/he drank the taste mask, then methadone.
A complete pharmacokinetic profile was obtained. This as- sessment was conducted three days after each participant was admitted to an inpatient research unit. An intravenous catheter was inserted and used to collect blood samples 15 min before and i, 2, 3, 4, 8, and 24 h after the 100-mg methadone dose. Blood samples were collected into 10-mL Vacutainers con- taining the anticoagulant heparin (green top tubes). Each tube was inverted several times then centrifuged for 15 rain. The plasma was siphoned using plastic, disposable pipettes and placed into plastic tubes. Samples were frozen at -20~ before being shipped on dry ice by overnight courier to the analytical facility.
Pharmacokinetic analysis The primary purposes of the pharmacokinetic study were to
1. compare (R)- versus (S)- pharmacokinetics for both methadone and EDDP and 2. compare our results for (R)- and (S)-methadone to previous published results. To allow com- parison to previous studies, pharmacokinetic parameters were determined using noncompartmental methods. The max- imum concentration in plasma (Cmax) and time to reach the maximum concentration (Tma~) were determined by observa- tion of the data. The area under the curve (AUC0_24) was de- termined using the trapezoidal rule. The elimination rate constant (~.z) was estimated from ]inear regression of the last 3-5 plasma concentration data points using a log-linear plot. The t~,2 was determined from 0.6931~.z. Results, except Tmax, for (R)- versus (S)-methadone and (R)- versus (S)-EDDP were compared using the two-tail paired t-test with minimal sig- nificance set at p < 0.05. The Tmax values were compared using the non-parametric Wilcoxon test with minimal sig- nificance set at p < 0.05. Because the comparisons made were within subject, no normalization for subject weight was needed.
Urine samples Urine samples were those submitted for forensic analyses
that were screened for a number of drugs of abuse. Four sam- ples that screened positive for methadone were chosen for this study.
211
Dow
nloaded from https://academ
ic.oup.com/jat/article/32/3/208/897718 by guest on 09 January 2022
Journal of Analytical Toxicology, Vol. 32, April 2008
Human liver microsome samples Human liver tissue was obtained from Tissue Transformation
Tech (Edison, N J). Microsomes were prepared from human liver by means of differential centrifugation as described by Nelson et al. (51) with the first centrifugation at 9000 x g, the homogenization buffer containing 0.25 M sucrose, and 10 strokes of homogenization. The protein content was deter- mined by the method of Lowry et al. (52). The incubation system (final volume of 0.5 mL) contained 0.25 mg micro- somal protein, an NADPH generating system (10 mM glucose- 6-phosphate, 1.2 mM NADP and 1.2 units of glucose-6- phosphate dehydrogenase), 0.] M phosphate buffer (pH 7.4), 1.0 mM EDTA, and 5.0 mM MgCI2. Methadone was added to a final concentration of 300 ng/mL. Reactions were initiated by the addition of the NADPH-generating system in a 37~ shakingwater bath and terminated at the times noted by ad- dition of 0.2 mL methanol. The mixtures were then stored at -80~ until thawed for analysis.
'm'= O.,II
A Vl~ ~,: * o u l ~ t ~ q u
,~2 Sa O.~'OOle.O0 I al~l.104.l~.~OI I,m
r;'m~218,t[l~4@~
kf
Time (~n)
~:~ ~.~ ~.,o i~,a~lm q
B
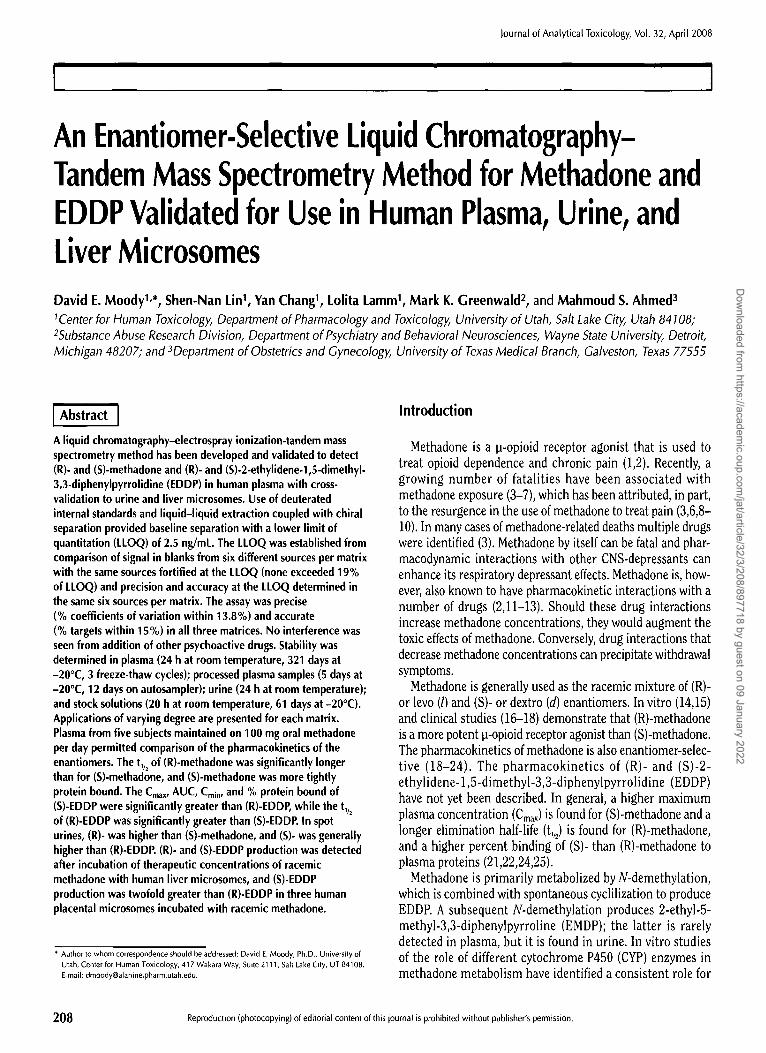
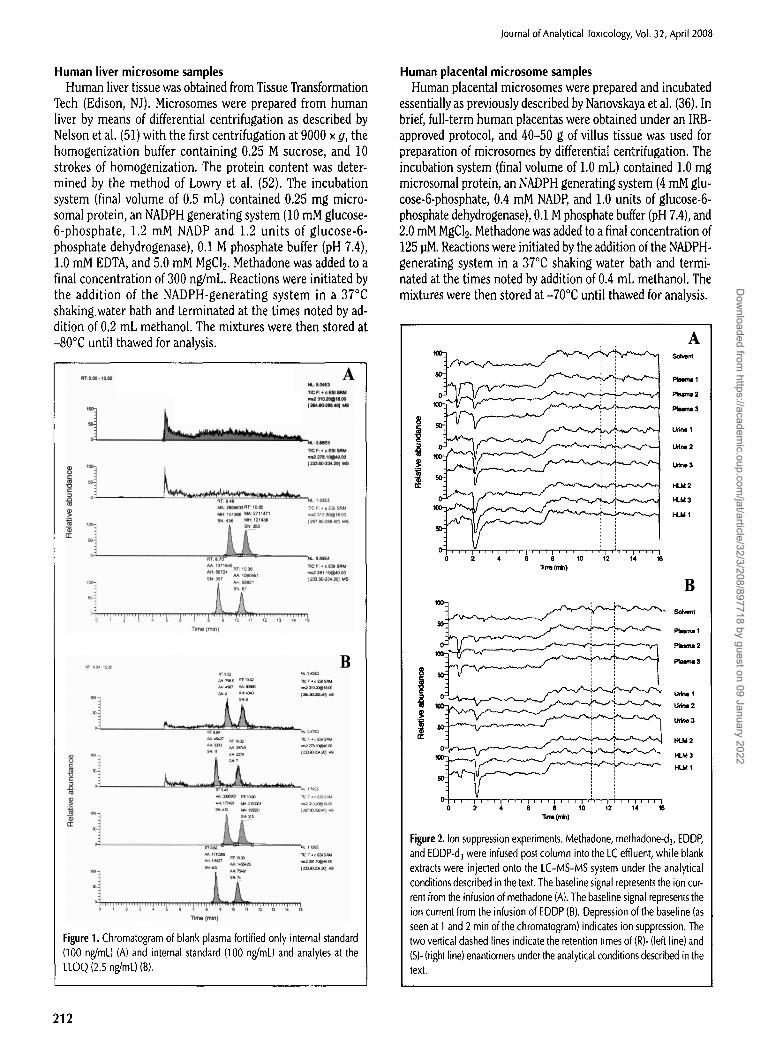
Figure 1. Chromatogram of blank plasma fortified only internal standard (100 ng/mL) (A) and internal standard (100 ng/mL) and analytes at the LLOQ (2.5 ng/mL)(B).
Human placental microsome samples Human placental microsomes were prepared and incubated
essentially as previously described by Nanovskaya et al. (36). In brief, full-term human placentas were obtained under an IRB- approved protocol, and 40-50 g of villus tissue was used for preparation of microsomes by differentia[ centrifugation. The incubation system (final volume of 1.0 mL) contained 1.0 mg microsomal protein, an NADPH generating system (4 mM g]u- cose-6-phosphate, 0.4 mM NADP, and 1.0 units of glucose-6- phosphate dehydrogenase), 0.1 M phosphate buffer (pH 7.4), and 2.0 mM MgCI2. Methadone was added to a final concentration of 125 pM. Reactions were initiated by the addition of the NADPH- generating system in a 37~ shaking water bath and termi- nated at the times noted by addition of 0.4 mL methanol. The mixtures were then stored at -70~ until thawed for analysis.
0 2 4 6 8 10 12 14 16 l i t ~ (min)
0 2 4 6 e I0 ~2 14 16
A SO~er~
~ 2
P1~ma 3
Urk~1
Udr~
U ~ 3
HLM 2
HLM 3
HLMI
B S(~wmt
F ~ w ~ I
P~l~r~ 2
P I u I ~ 3
U r ~ l I
U ~ 2
Un~l 3
HI-~ 2
HI.M 3
H i M I
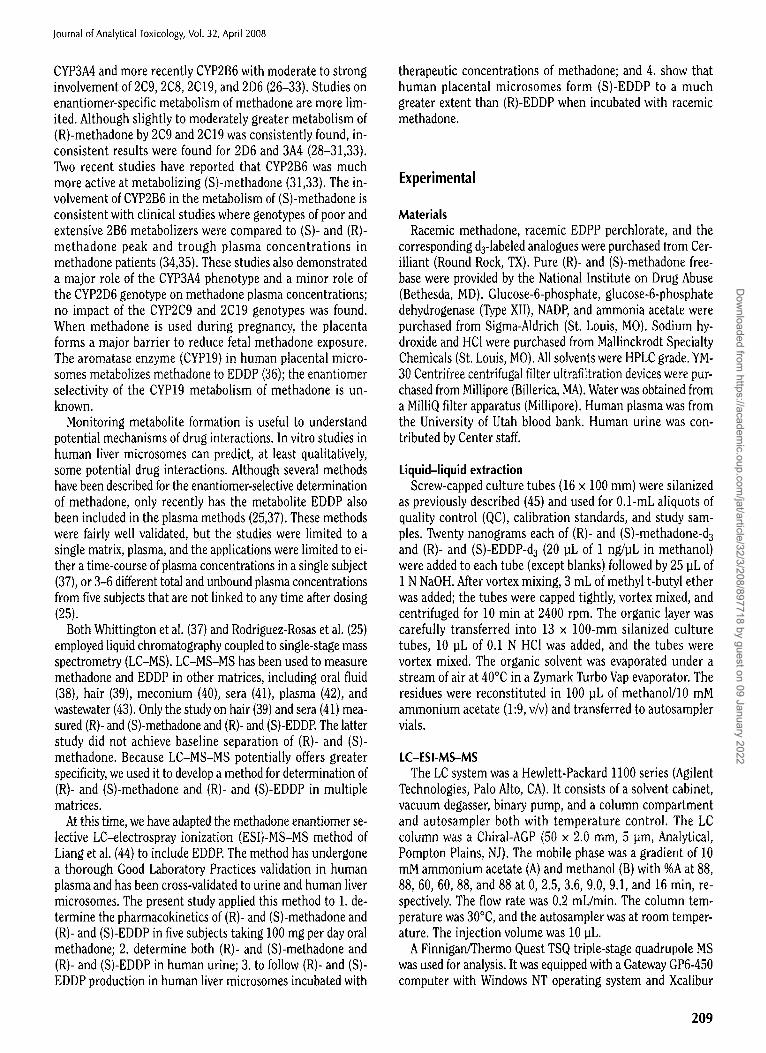
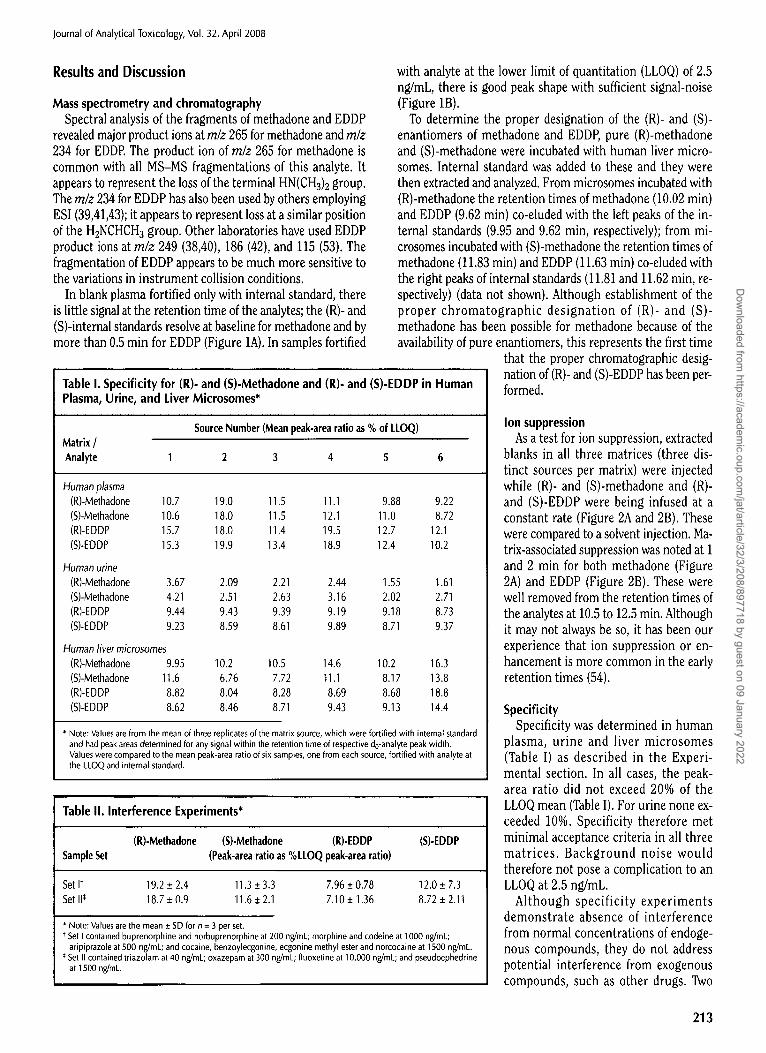
Figure 2. Ion suppression experiments. Methadone, methadone-d3, EDDP, and EDDP-d3 were infused post column into the LC effluent, while blank extracts were injected onto the LC-M.%MS system under the analytical conditions described in the text. The baseline signal represents the ion cur- rent from the infusion of methadone (A). The baseline signal represents the ion current from the infusion of EDDP (B). Depression of the baseline (as seen at 1 and 2 min of the chromatogram) indicates ion suppression. The two vertical dashed lines indicate the retention times of (R)- (left line) and (S)- (right line) enantiomers under the analytical conditions described in the text.
212
Dow
nloaded from https://academ
ic.oup.com/jat/article/32/3/208/897718 by guest on 09 January 2022
Journal of Analytical Toxicology, Vol. 32, April 2008
Results and Discussion
Mass spectrometry and chromatography Spectral analysis of the fragments of methadone and EDDP
revealed major product ions at rn/z 265 for methadone and rn/z 234 for EDDP. The product ion of m/z 265 for methadone is common with all MS-MS fragmentations of this analyte. It appears to represent the loss of the terminal HN(CH3)2 group. The m/z 234 for EDDP has also been used by others employing ESI (39,41,43); it appears to represent loss at a similar position of the H2NCHCH 3 group. Other laboratories have used EDDP product ions at rn/z 249 (38,40), 186 (42), and 115 (53). The fragmentation of EDDP appears to be much more sensitive to the variations in instrument collision conditions.
In blank plasma fortified only with internal standard, there is little signal at the retention time of the analytes; the (R)- and (S)-internal standards resolve at baseline for methadone and by more than 0.5 rain for EDDP (Figure 1A). In samples fortified
Table I. Specificity for (R)- and (S)-Methadone and (R)- and (S)-EDDP in Human Plasma, Urine, and Liver Microsomes*
Source Number (Mean peak-area ratio as % of LLOQ) Matrix / Analyte 1
with analyte at the lower limit of quantitation (LLOQ) of 2.5 ng/mL, there is good peak shape with sufficient signal-noise (Figure 1B).
To determine the proper designation of the (R)- and (S)- enantiomers of methadone and EDDP, pure (R)-methadone and (S)-methadone were incubated with human liver micro- somes. Internal standard was added to these and they were then extracted and analyzed. From microsomes incubated with (R)-methadone the retention times of methadone (10.02 rain) and EDDP (9.62 rain) co-eluded with the left peaks of the in- ternal standards (9.95 and 9.62 rain, respectively); from mi- crosomes incubated with (S)-methadone the retention times of methadone (11.83 min) and EDDP (11.63 min) co-eluded with the right peaks of internal standards (11.81 and 11.62 rain, re- spectively) (data not shown). Although establishment of the proper chromatographic designation of (R)- and (S)- methadone has been possible for methadone because of the availability of pure enantiomers, this represents the first time
that the proper chromatographic desig- nation of (R)- and (S)-EDDP has been per- formed.
2 3 4 5 6
Human plasma (R)-Methadone 10.7 19,0 11,5 11.1 9.88 9.22 (S)-Methadone 10.6 18.0 11.5 12.1 11.0 8.72 (R)-EDDP 15.7 18.0 11,4 19.5 12.7 12.1 (S)-EDDP 15.3 19.9 13,4 18.9 12.4 10.2
Human urine (R)-Methadone 3.67 2.09 2.21 2.44 1.55 1.61 (S)-Methadone 4.21 2.51 2.63 3,16 2.02 2,71 (R)-EDDP 9.44 9.43 9.39 9.19 9.18 8.73 (S)-EDDP 9.23 8.59 8.61 9.89 8.71 9.37
Human liver microsomes (R)-Methadone 9.95 10.2 10.5 14.6 10.2 16.3 (S)-Methadone 11.6 6.76 7.72 11.1 8.17 13.8 (R)-EDDP 8.82 8.04 8.28 8.69 8.68 18.8 (S)-EDDP 8.62 8.46 8.71 9.43 9.13 14.4
* Note: Values are from the mean of three replicates of the matrix source, which were fortified with internal standard and had peak areas determined for any signal within the retention time of respective do-analyte peak width. Values were compared to the mean peak-area ratio of six samples, one from each source, fortified with analyte at the LLOQ and internal standard.
Table II. Interference Experiments*
(R)-Methadone (S)-Methadone (R)-EDDP (S)-EDDP Sample Set (Peak-area ratio as %LLOQ peak-area ratio)
Set P 19.2 + 2.4 11.3 _+ 3.3 7.96 _+ 0,78 12.0 + 7.3 Set I1' 18.7 + 0.9 11.6 _+ 2.1 7.10 + 1.36 8.72 _+ 2.11
* Note: Values are the mean + SD for n = 3 per set. t Set I contained buprenorphine and norbuprenorphine at 200 ng/mL; morphine and codeine at 1000 ng/mL;
aripiprazole at 500 ng/mL; and cocaine, benzoylecgonine, ecgonine methyl ester and norcocaine at 1500 ng/mL. * Set II contained triazolam at 40 ng/mL; oxazepam at 300 ng/mL; fluoxetine at 10,000 ng/mL; and pseudoephedrine
at 1500 ng/mL.
Ion suppression As a test for ion suppression, extracted
blanks in all three matrices (three dis- tinct sources per matrix) were injected while (R)- and (S)-methadone and (R)- and (S)-EDDP were being infused at a constant rate (Figure 2A and 2B). These were compared to a solvent injection. Ma- trix-associated suppression was noted at 1 and 2 rain for both methadone (Figure 2A) and EDDP (Figure 2B). These were well removed from the retention times of the analytes at 10.5 to 12.5 min. Although it may not always be so, it has been our experience that ion suppression or en- hancement is more common in the early retention times (54).
Specificity Specificity was determined in human
plasma, urine and liver microsomes (Table I) as described in the Experi- mental section. In all cases, the peak- area ratio did not exceed 20% of the LLOQ mean (Table I). For urine none ex- ceeded 10%. Specificity therefore met minimal acceptance criteria in all three matrices. Background noise would therefore not pose a complication to an LLOQ at 2.5 ng/mL.
Although specificity experiments demonstrate absence of interference from normal concentrations of endoge- nous compounds, they do not address potential interference from exogenous compounds, such as other drugs. Two
213
Dow
nloaded from https://academ
ic.oup.com/jat/article/32/3/208/897718 by guest on 09 January 2022
Journal of Analytical Toxicology, Vol. 32, April 2008
Table III. Intrarun Accuracy and Precision for Determination of (R)- and (S)-Methadone and (R)- and (S)-EDDP in Human Plasma, Urine, and Liver Microsomes*
LLOQ Low QC Medium QC High QC Dilution QC 2.5 ng/mL 2.5 or 5 ng/mL t 100 ng/mL 400 ng/mt 2500 ng/mL
Matrix / Analyte % Target %CV % Target %CV % Target %CV % Target %CV % Target %CV
Human plasma (R)-Methadone 97.2 5.8 105.6 5.7 93.0 4.6 99.8 2.4 (S)-Methadone 106.0 5.7 106.4 5.6 92.7 4.3 99.8 3.1 (R)-EDDP 92.0 4.3 94.8 8.9 91.2 3.4 92.2 4.3 (S)-EDDP 99.2 4.4 100.0 4.8 90.0 3.0 91.8 3.8
Human urine (R)-Methadone 98.8 2.8 110.0 2.2 92.2 1.7 104.2 3.2 (S)-Methadone 98.8 1.6 108.4 2.6 90.1 2.2 106.8 2.4 (R)-EDDP 96.0 5.4 105.0 3.0 93.7 2.5 105.6 3.8 (S)-EDDP 97.6 2.5 104.2 3.3 90.6 1.7 104.2 5.0
Human liver microsomes (R)-Methadone 84.0 9.0 109.4 6.6 115.0 1.7 109.4 1.1 (S)-Methadone 98.8 10.5 97.0 13.8 114.0 2.6 108 0 1.3 (R)-EDDP 101.2 7.5 97.8 3.5 109.0 1.8 107.1 4.0 (S)-EDDP 96.8 7.4 104.3 13.0 113.0 5.3 106.8 0.7
100.9 6.9 101.2 5.6 99.8 6.4
100.0 6.4
* Note: Values are from the mean of five replicates for QCs; for the LLOQ, they are from the mean of six differences sources of matrix each fortified at the LLOQ. t The low QC for plasma was prepared at 2.5 nglmL; for urine and liver microsomes, it was prepared at 5.0 ng/mU
Table IV. Interrun Accuracy and Precision for Determination of (R)- and (S)- Methadone and (R)- and (S)-EDDP in Human Plasma*
tow QC Medium QC 2.5 ng/mt 100 ng/mt
Analyte % Target %CV % Target %CV % Target %CV
Precision and accuracy Intrarun precision and accuracy was
determined in human plasma, urine and liver microsomes (Table III). For urine a
High QC dilution control was also included, as 400 ng/mt samples in this matrix would routinely
be diluted. In plasma and urine, accura- cies were within 10% of target, and the
3.8 (3.3) measures of precision, %CV, were within 3.6 (2.2) 8.9%. In human liver microsomes, accu- 5.2 (2.6) 5.2 (2.2) racy was with in 15% of target and %CVs
were wi th in 13% (Table I l l ) . Therefore, intrarun precision and accuracy met min- imal acceptance criteria in all three ma- trices.
Interrun precision and accuracy were determined in plasma (Table IV). Accuracy was within 12.3% and %CVs within 10.9% (Table IV). Use of the one-way ANOVA to calculate %CVs for be- tween-run variance (Sr) permits an evaluation of interrun vari- abil i ty corrected for intrarun variability. I t is therefore not surprising that the %CVs calculated in this manner (Table I l l in parentheses) were all smaller than the intermediate (St) %CVs; in one case, the interrun %CV was even zero. Because we have earlier publications where we used the overall standard deviation to calculate %CVs, i t was worthwhile comparing the overall with the intermediate %CVs. The greatest difference was 10% [3.40 versus 3.76 for the high (R)-methadone QCs] with an average difference for the 12 calculated %CVs of 4.15%, with the overall %CV slightly lower in 11 of the 12 cases. Where the between-run (Sr) was zero, the overall %CV was greater than the intermediate. Although the intermediate %CV gives a statistically more accurate determination of interrun
(R)-Methadone 103.2 8.2 (0.0) 90.6 5.0 (2.8) 103.8 (S)-Methadone 102.8 9.0 (3.8) 89.9 5.1 (3.6) 101.9 (R)-EDDP 96.0 10.9 (7.8) 87.9 5.6 (2.9) 95.8 (S)-EDDP 104.4 9.9 (5.4) 87.7 5.0(1.8) 95.1
* Note: Values are from the mean of 15 replicates, run as an N of 5 on three separate days. %CVs calculated from use of one-way ANOVA, the intermediate (st) %CV is given first with the between-run (s~) given in parentheses.
sets of blank plasma (N = 3 per set) were fortified with in- ternal standards along with drugs or drug metabolites of representative psychoactive drug classes (Table II). Any signal at the retention time of the analytes was expressed as it peak-area ratio relative to the mean peak-area ratio of the LLOQ samples. In neither set did the mean peak-area ratio exceed 20% of the as %LLOQ mean peak-area ratio, which is indicative of no interference (Table II). Chromatographic separation coupled with SRM MS-MS, as used in this tech- nique, minimizes the potential for interferences from co-ad- ministered drugs or endogenous compounds that may in- crease in disease states. We have now shown here, and previously, that the coupling of chromatographic separation and SRM produce analytical methods free from interference from a number of drugs commonly co-administered with anti-abuse medications like methadone, including other opi- oids (55-57).
214
Dow
nloaded from https://academ
ic.oup.com/jat/article/32/3/208/897718 by guest on 09 January 2022
Journal of Analytical Toxicology, Vol. 32, April 2008
Table V. Stability of (R)- and (S)-Methadone and (R)- and (S)-EDDP*
Analyte
(R)-Methadone (S)-Methadone (R)-EDDP (S)-EDDP Matrix / Storage Conditions % Target %CV % Target %CV % Target %CV % Target %CV
Plasma /Room Temperature for 24 h 2.5 ng/mL 97.2 5.3 94.4 3.8 92.4 2.6 91.6 1.7 425 ng/mL 98.6 3.6 98.1 2.6 106.0 1.0 103.1 1.6
Plasma/-20~ for 321 Days 5.0 ng/mL 105.4 6.3 110.0 4.0 96.4 6.2 91.8 9.4 425 ng/mL 97.9 6.5 96.6 9.1 97.2 8.9 98.4 8.5
Plasma/Three Freeze-Thaw Cycles 2.5 ng/mL 106.4 5.6 107.2 3.0 92.0 3.0 92.4 1.7 425 ng/mL 102.1 2.8 100.9 2.8 96.5 1.7 96.2 2.4
Processed Plasma/-20~ for 5 Days 2.5 ng/mL 103.2 2.7 99.6 4.4 98.8 9.7 104.4 3.4 425 ng/mL 98.1 0.8 99.2 1.5 95.0 0.9 95.0 1.5
Processed Plasma/Autosampler for 12 Days 2.5 ng/mL 105.2 8.7 103.6 13.1 92.0 5.2 101.2 5.5 425 ng/mL 103.1 2.7 102.6 2.5 96.7 4.6 96.9 2.7
Urine / Room Temperature for 24 h 5.0 ng/mL 97.6 9.6 96.4 7.5 108.6 6.4 113.2 4.8 425 ng/mL 104.5 4.5 102.8 4.6 100.7 3.0 100.5 3.5
Stock Solutions, Stored: (% Fresh Stock/%CV) -20~ for 61 days 94.8 1.3 95.0 1.0 97.9 0.8 Room temperature
for 20 h 98.4 1.5 98.2 1.5 99.8 1.5
a function of the matrix being measured. Therefore, when a method is fully vali- dated in one matrix, such as plasma in this study, and other matrices are shown to have acceptable intrarun precision and accuracy at the LLOQ and across the cal- ibration run, as was done here for urine and HLM, it is appropriate to say the method is accurate and precise in all three matrices.
Although the LLOQ of this method is higher than those achieved by Whit- tington et al. (37) and Rodriguez-Rosas et al. (25), our use of specificity data and plasma from six different sources to es- tablish the LLOQ provides a robustness to the assay that will be useful for pharma- cokinetic studies where plasma is pro- vided from various individuals. Further, the LLOQ was sufficient to follow 24-h pharmacokinetics in methadone-main- tained patients and detect EDDP forma- tion in human liver microsomes incu- bated with therapeutic concentrations of methadone.
* Results are derived from the mean • SD of N = 3 per concentration (N = 5 for processed samples on autosampler and for stock stability).
t000
g
oo t~
100
10 0 6 12 18 24
Time (h)
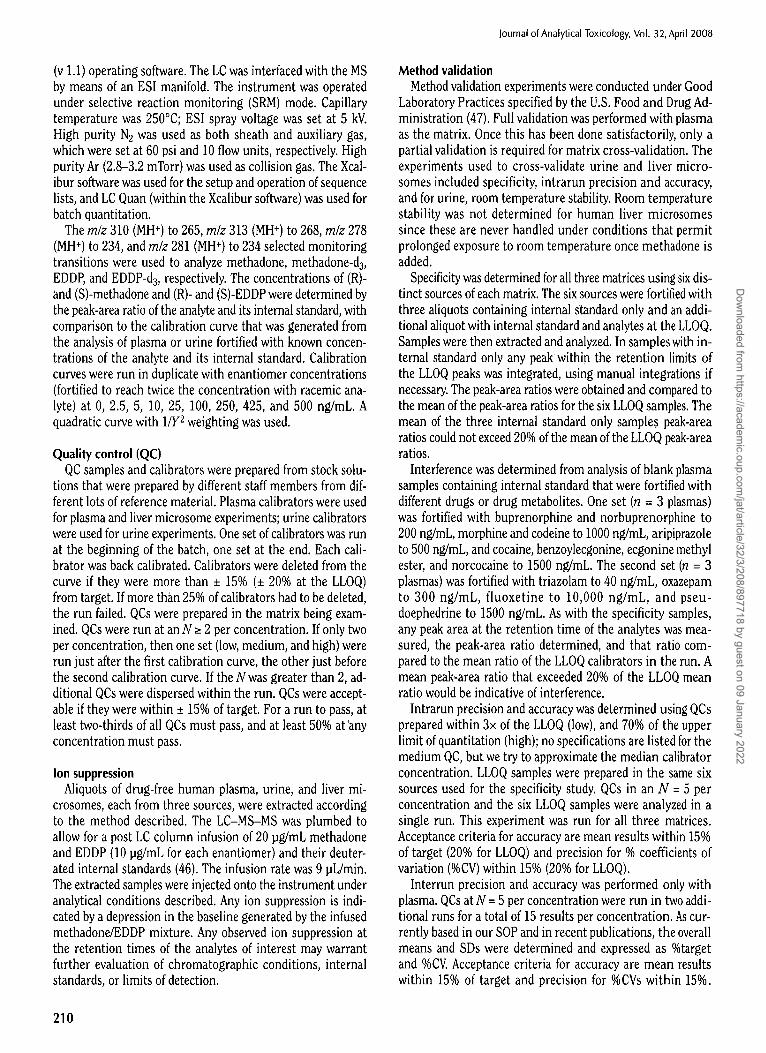
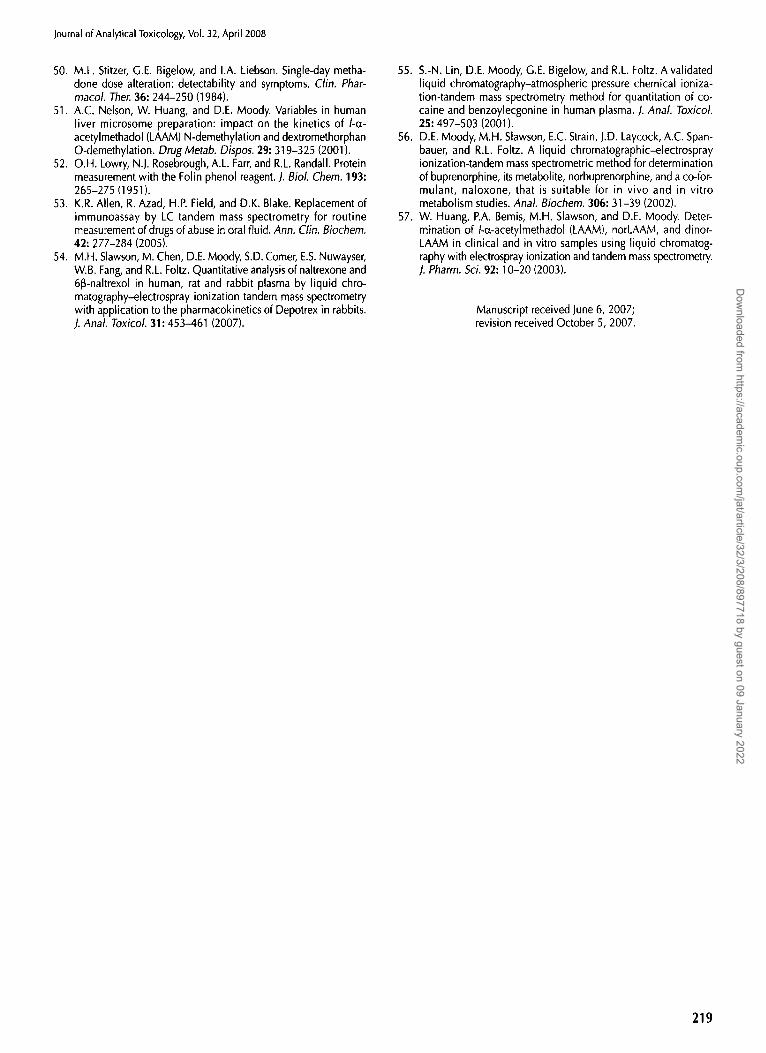
Figure 3. Time course of (R)- and (S)-methadone and (R)- and (S)-EDDP in methadone in plasma of maintenance subjects receiving 100 mg oral methadone per day. Results are the mean + SEM for five subjects.
precision, the use of overall standard deviation does not grossly differ. Use of either approach must be done with an under- standing of their limitations.
Interrun accuracy and precision are a measure of the repro- ducibility of the assay over day-to-day operation. This is rarely
Stability 99.0 0.8 The stability of the analytes was studied
under a number of conditions (Table V). 99.7 1.9 Both enantiomers of methadone and
EDDP (all analytes) met acceptance cri- teria to be considered stable in plasma and urine for up to 24 h at room temper- ature, and in plasma stored at -20~ for
up to 321 days. As previously shown by Rodriguez-Rosas et al. (25), all analytes are stable after three freeze-thaw cycles. They found analytes stable for up to 24 h when processed samples stored on the autosampler, we have extended that finding to 12 days. Analytes were also stable in processed samples stored for up to 5 days at -20~ In methanolic stock solutions analytes were stable for up to 20 h at room temperature and up to 61 days at -20~ (Table IV).
Clinical applications: in vivo Methadone is known to be involved in a number of drug in-
teractions (2,11,12). A major concern is the recent findings of drug interactions between methadone and some of the anti- retroviral medications (13). To further understand the mech- anism of these interactions methods suitable for following methadone metabolism both in vivo and in vitro are needed. A number of studies on the enantiomeric pharmacokinetics of methadone have been published (18-24). However, our knowl- edge on the enantiomeric disposition of EDDP is limited to two studies: one showed the plasma time-course for a single subject (37), and the other presented results from blood samples col- lected at unspecified times after dosing (25).
This study used our current method to measure enantiomers of methadone and EDDP in plasma collected over the 24-h
215
Dow
nloaded from https://academ
ic.oup.com/jat/article/32/3/208/897718 by guest on 09 January 2022
Journal of Analytical Toxicology, Vol. 32, April 2008
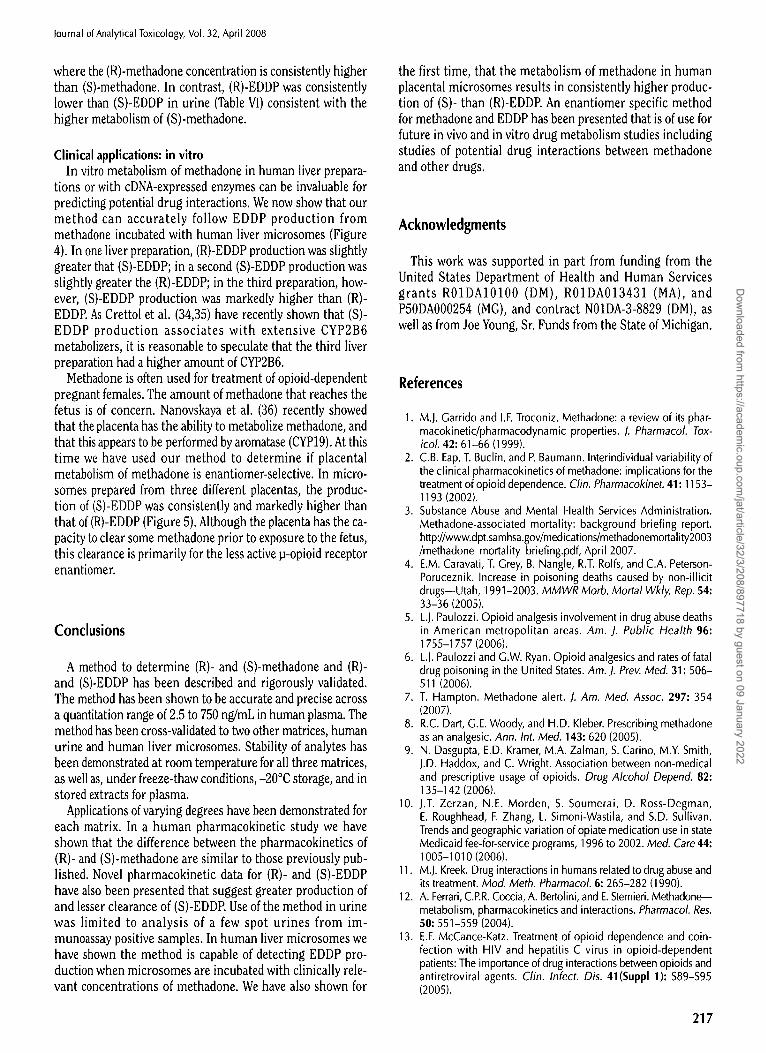
Table Vl, Pharmacokinetic Parameters for (R)- and (S)-Methadone and (R)- and (S)-EDDP in Subjects Taking 100 mg Oral Methadone Daily*
Parameter (R)-Meth (S)-Meth p (R)-EDDP (S)-EDDP p
Cmax (ng/mL) 260 _+ 82 304 • 105 NS 23.9 _+ 6.8 38.5 +_ 8.5 < 0.0005 Tma x (h) 3.8 (3-4) 3.4 (3-4) NS 2.8 (2~.) 2,8 (2-4) NS AUCo-24 (ng/mL*h) 4710 :t: 1470 5200 • 2190 NS 385 • "127 555 • 145 < 0.0005 CI (mL/h/kg) 4.90 _+ 0.65 4.66 • 1.32 NS 61.1 • 13,4 41.4 • 7.0 < 0.005 tl/2 (h) 36.6 • 14.1 22.6 _+ 5.1 < 0.05 23.1 + 3.0 18.2 _+ 1.9 < 0.05 Cm~n 0 h (ng/mL) 162 • 65 164 • 85 NS 12.2 __. 5.0 16.4 + 6.3 < 0.005 Cmin 24 h (ng/mL) 161 • 48 155 + 65 NS 11.4 + 2.9 14.8 + 3.1 < 0.005 Protein bound (%) 92.0 • 0.5 94.1 + 0.4 1.2 x 10 -6 65.5 + 1.5 68.7 • 0.8 < 0.05
R-MeIh/R-EDDP S-MeIh/S-EDDP p
Metabolic ratio 12.5 _+ 2.2 9.26 + 2.07 < 0.05
* Note: Values are the mean _ SD (mean with range for Tma x) for five subjects. Comparison was made using Student's paired two-sided t-test (Wilcoxin for nonparametric Tmax).
Table VII. (R)- and (S)-Methadone and (R)- and (S)-EDDP in Random Urine Specimens That Screened Positive for Methadone
Sample (R)-Methadone (S)-Methadone R/S Ratio (R)-EDDP (S)-EDDP R/S Ratio
WB5354 3687 951 1.89 14842 17589 WB5383 5273 3263 1.62 3643 4636 WB5394 1213 410 2.96 10663 14000 WB5620 6781 4774 1.42 7106 8976
dosing period of five maintenance pa- tients receiving 100 mg methadone. The time-course of concentrations is shown in Figure 3, and the pharmacokinetic pa- rameters are in Table VI. While the AUC and Cmax of (S)-methadone are higher
0.89 than for (R)-methadone, this difference 0.79 0.76 was not significant; the concentration of 0.79 the enantiomers does not differ at trough
(Cmi n 0 and 24 h). The t,,2 for (R)-metha- done is significantly longer than that for (S)-methadone, and (R)-methadone has
a significantly higher free fraction than (S)-methadone (Table VI). Our findings for (R)- and (S)-methadone are consistent with other studies after multiple doses of methadone (20,21,23,24).
Our pharmacokinetic findings for EDDP are, to the best of our knowledge, novel. The AUC and Cma~ of (S)-EDDP are sig- nificantly greater than those for (R)-EDDP. The concentra- tions of (S)-EDDP remain significantly higher at trough. The t,~2 for (R)-EDDP is significantly greater than that for (S)-EDDP and the free fraction of (R)-EDDP is slightly, but significantly, greater than that for (S)-EDDP. From the AUCs of methadone and EDDP, the metabolic ratios can be determined; that for the (R)-enantiomers is significantly greater than that for the (S)- enantiomers (Table VI). These findings are consistent with (S)- methadone being metabolized at a higher rate than (R)- methadone, but with (R)-methadone having a higher volume of distribution and greater renal elimination due to the higher free fraction. Therefore, even though (S)-methadone is me- tabolized at a higher rate, the Cma x for (S)-methadone is slightly higher because it does not get distributed from the plasma as much as (R)-methadone.
Our findings in spot urines (Table VII) show the utility of the method in this matrix. While the results from these urine sam- ples collected at unspecified times after dosing cannot sub- stantiate a greater elimination for (R)-methadone, these find- ings are consistent with those that used controlled urine collections (21). Specifically, they are consistent with the con- cept of a greater elimination of (R)-methadone from urine,
8gO f.~, 16
400 ,m'"
20o
0 0 IO 20 30 ,~
~/u~-~ ~ [ ~ uv-~g
200
0 0 0 lO 2g 30 4o 0 LO 20 30 4.o
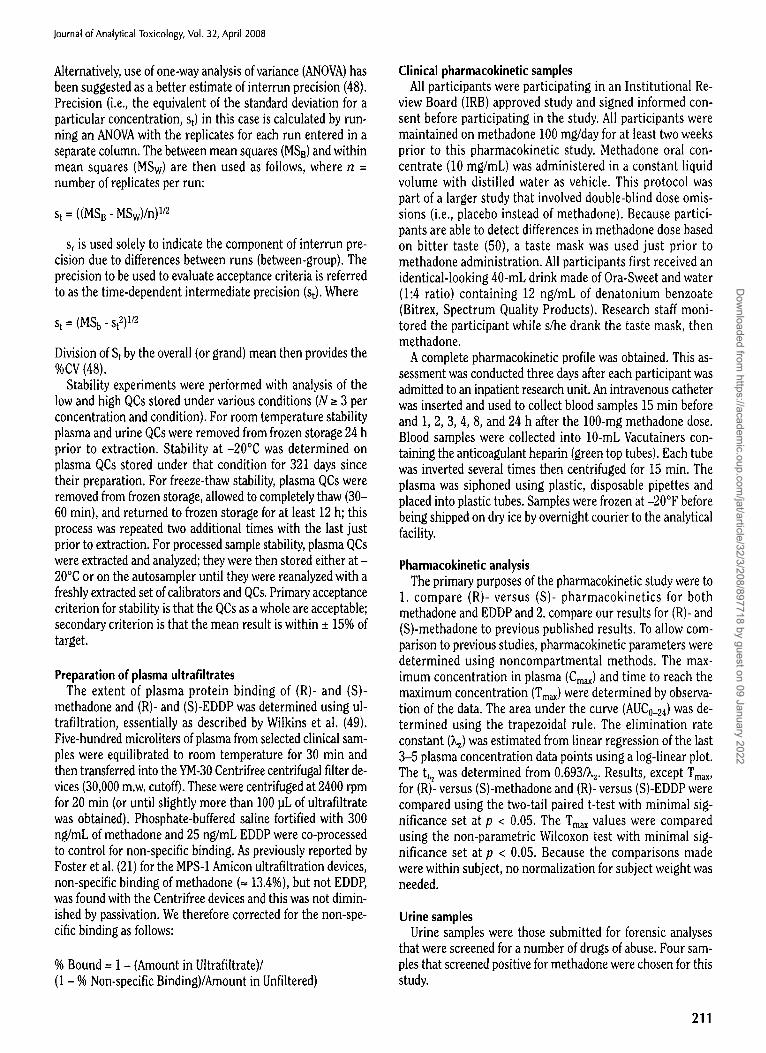
Figure 4. (R)- and (S)-EDDP production in three different human liver mi- crosome preparations incubated with 300 ng/mL (- 1.0 pM) racemic methadone. Microsomes were at 0.5 mg/mL, with buffer and NADPH-gen- erating system in a total volume of 0.5 mL as described in Experimental.
4~0
300 . . /
2..00�84 .~-.
0 0 1~ 30 45 60 75
500 1~-333
0 0 15 30 4~ 60 75
In~s~on ~ (rn~)
4OO PI-335
sm .,,---.e---., , /
0 0 15 30 45 60 75
Figure 5, (R)- and (S)-EDDP production in three different human placenta microsome preparations incubated with 125 pM (~ 38.6 pg/mL) racemic methadone. Microsomes were at 1.0 mg/mL, with buffer and NADPH-gen- erating system in a total volume of 1.0 mL as described in Experimental.
216
Dow
nloaded from https://academ
ic.oup.com/jat/article/32/3/208/897718 by guest on 09 January 2022
Journal of Analytical Toxicology, Vol. 32, April 2008
where the (R)-methadone concentration is consistently higher than (S)-methadone. In contrast, (R)-EDDP was consistently lower than (S)-EDDP in urine (Table VI) consistent with the higher metabolism of (S)-methadone.
Clinical applications: in vitro In vitro metabolism of methadone in human liver prepara-
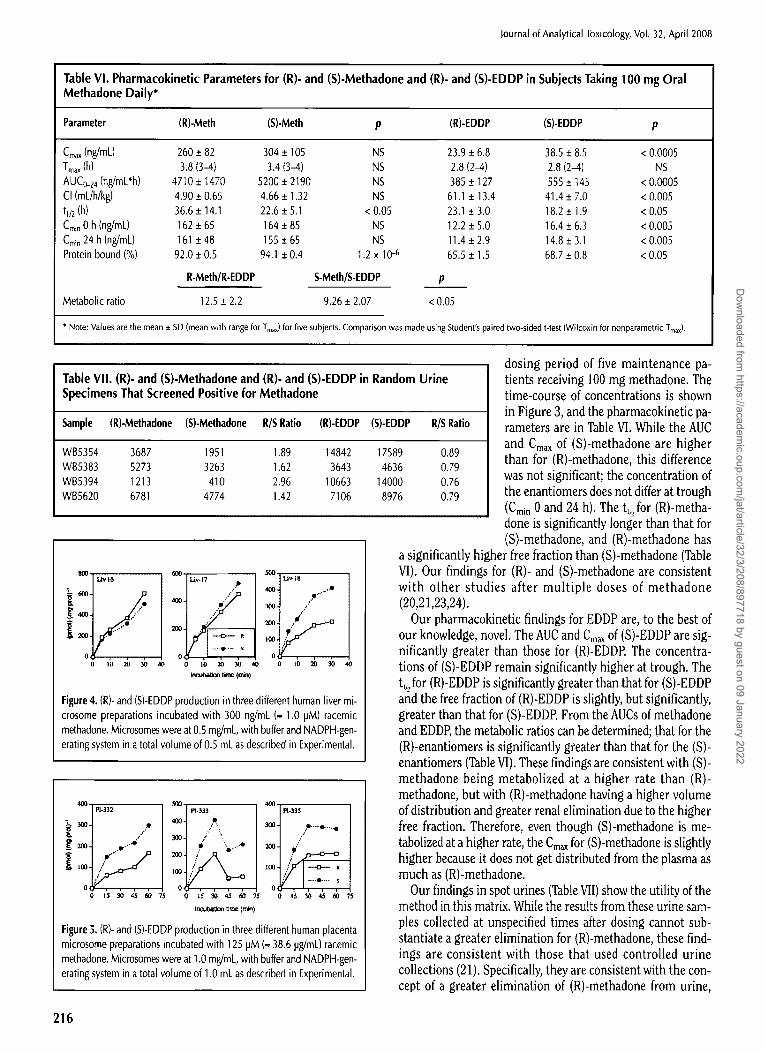
tions or with cDNA-expressed enzymes can be invaluable for predicting potential drug interactions. We now show that our method can accurately follow EDDP production from methadone incubated with human liver microsomes (Figure 4). In one liver preparation, (R)-EDDP production was slightly greater that (S)-EDDP; in a second (S)-EDDP production was slightly greater the (R)-EDDP; in the third preparation, how- ever, (S)-EDDP production was markedly higher than (R)- EDDP. As Crettol et al. (34,35) have recently shown that (S)- EDDP production associates with extensive CYP2B6 metabolizers, it is reasonable to speculate that the third liver preparation had a higher amount of CYP2B6.
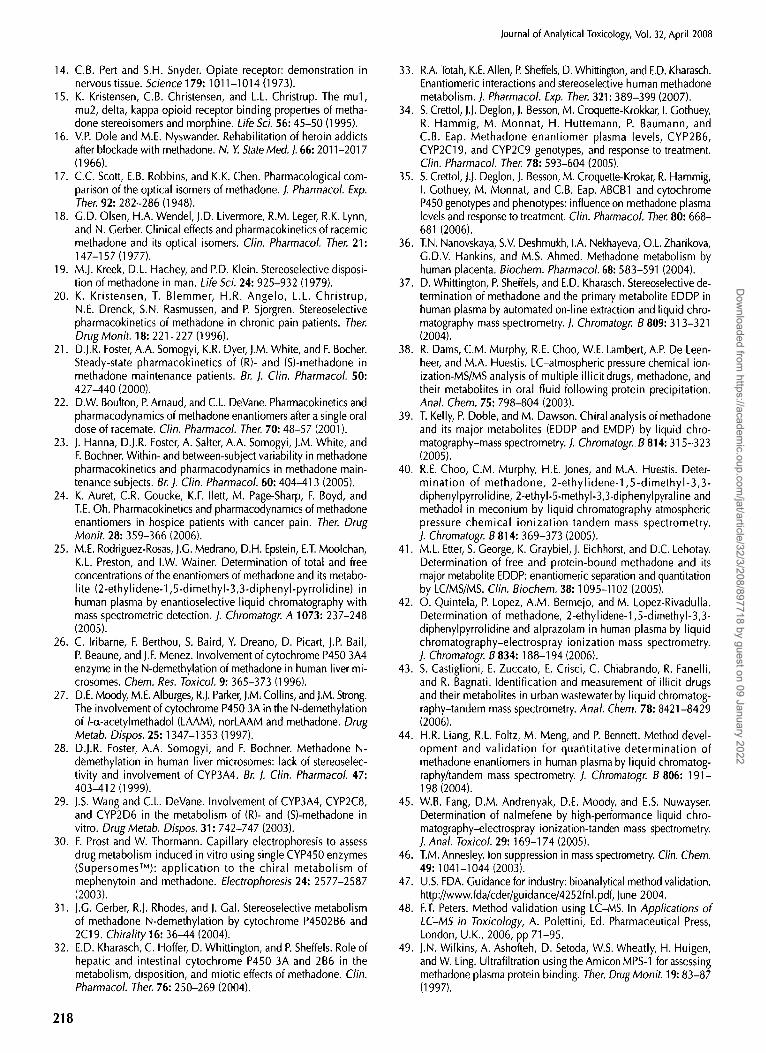
Methadone is often used for treatment of opioid-dependent pregnant females. The amount of methadone that reaches the fetus is of concern. Nanovskaya et al. (36) recently showed that the placenta has the ability to metabolize methadone, and that this appears to be performed by aromatase (CYP19). At this time we have used our method to determine if placental metabolism of methadone is enantiomer-selective. In micro- somes prepared from three different placentas, the produc- tion of (S)-EDDP was consistently and markedly higher than that of (R)-EDDP (Figure 5). Although the placenta has the ca- pacity to clear some methadone prior to exposure to the fetus, this clearance is primarily for the less active p-opioid receptor enantiomer.
Conclusions
A method to determine (R)- and (S)-methadone and (R)- and (S)-EDDP has been described and rigorously validated. The method has been shown to be accurate and precise across a quantitation range of 2.5 to 750 ng/mL in human plasma. The method has been cross-validated to two other matrices, human urine and human liver microsomes. Stability of analytes has been demonstrated at room temperature for all three matrices, as well as, under freeze-thaw conditions, -20~ storage, and in stored extracts for plasma.
Applications of varying degrees have been demonstrated for each matrix. In a human pharmacokinetic study we have shown that the difference between the pharmacokinetics of (R)- and (S)-methadone are similar to those previously pub- lished. Novel pharmacokinetic data for (R)- and (S)-EDDP have also been presented that suggest greater production of and lesser clearance of (S)-EDDP. Use of the method in urine was limited to analysis of a few spot urines from im- munoassay positive samples. In human liver microsomes we have shown the method is capable of detecting EDDP pro- duction when microsomes are incubated with clinically rele- vant concentrations of methadone. We have also shown for
the first time, that the metabolism of methadone in human placental microsomes results in consistently higher produc- tion of (S)- than (R)-EDDP. An enantiomer specific method for methadone and EDDP has been presented that is of use for future in vivo and in vitro drug metabolism studies including studies of potential drug interactions between methadone and other drugs.
Acknowledgments
This work was supported in part from funding from the United States Department of Health and Human Services grants R01DA10100 (DM), R01DA013431 (MA), and P50DA000254 (MG), and contract N0]DA-3-8829 (DM), as well as from Joe Young, Sr. Funds from the State of Michigan.
References
1. M.J. Garrido and I.F. Troconiz. Methadone: a review of its phar- macokinetic/pharmacodynamic properties. J. Pharmacol. Tox- icol. 42:61-66 (1999).
2. C.B. Eap, T. Buclin, and P. Baumann. Interindividual variability of the clinical pharmacokinetics of methadone: implications for the treatment of opioid dependence. Clin. Pharrnacokinet. 41: 1153- 1193 (2O02).
3. Substance Abuse and Mental Health Services Administration. Methadone-associated mortality: background briefing report. http://www.dpt.samhsa.gov/medications/methadonemortality2003 /methadone_mortality_briefing.pdf, April 2007.
4. E.M. Caravati, T. Grey, B. Nangle, R.T. Rolfs, and C.A. Peterson- Poruceznik. Increase in poisoning deaths caused by non-illicit drugs--Utah, 1991-2003. MMWR Morb. Mortal Wkly. Rep. 54: 33-36 (2005).
5. L.J. Paulozzi. Opioid analgesis involvement in drug abuse deaths in American metropolitan areas. Am. J. Public Health 96: 1755-1757 (2006).
6. L.J. Paulozzi and G.W. Ryan. Opioid analgesics and rates of fatal drug poisoning in the United States. Am. J. Prey. Med. 31: 506- 511 (2006).
7. T. Hampton. Methadone alert. J. Am. Med. Assoc. 297:354 (2007).
8. R.C. Dart, G.E. Woody, and H.D. Kleber. Prescribing methadone as an analgesic. Ann. Int. Med. 143:620 (2005).
9. N. Dasgupta, E.D. Kramer, M.A. Zalman, S. Carino, M.Y. Smith, J.D. Haddox, and C. Wright. Association between non-medical and prescriptive usage of opioids. Drug Alcohol Depend. 82: 135-142 (2006).
10. J.T. Zerzan, N.E. Morden, S. Soumerai, D. Ross-Degman, E. Roughhead, F. Zhang, L. Simoni-Wastila, and S.D. Sullivan. Trends and geographic variation of opiate medication use in state Medicaid fee-for-service programs, 1996 to 2002. Med. Care 44: 1005-1010 (2006).
11. M.J. Kreek. Drug interactions in humans related to drug abuse and its treatment. Mod. Meth. Pharmacol. 6:265-282 (1990).
12. A. Ferrari, C.P.R. Coccia, A. Bertolini, and E. Sternieri. Methadone-- metabolism, pharmacokinetics and interactions. Pharrnacol. Res. 50:551-559 (2004).
13. E.F. McCance-Katz. Treatment of opioid dependence and coin- fection with HIV and hepatitis C virus in opioid-dependent patients: The importance of drug interactions between opioids and antiretroviral agents. Clin. Infect. Dis. 41(Suppl 1): $89-$95 (2005).
217
Dow
nloaded from https://academ
ic.oup.com/jat/article/32/3/208/897718 by guest on 09 January 2022
14. C.B. Pert and S.H. Snyder. Opiate receptor: demonstration in nervous tissue. Science 179:1011-1014 (1973).
15. K. Kristensen, C.B. Christensen, and L.L. Christrup. The mul, mu2, delta, kappa opioid receptor binding properties of metha- done stereoisomers and morphine. Life Sci. 56:45-50 (1995).
16. V.P. Dole and M.E. Nyswander. Rehabilitation of heroin addicts after blockade with methadone. N. Y State Med. J. 66:2011-2017 (1966).
17. C.C. Scott, E.B. Robbins, and K.K. Chen. Pharmacological com- parison of the optical isomers of methadone. J. Pharmacol. Exp. Ther. 92:282-286 (1948).
18. G.D. Olsen, H.A. Wendel, J.D. Livermore, R.M. Leger, R.K. Lynn, and N. Gerber. Clinical effects and pharmacokinetics of racemic methadone and its optical isomers. Clin. Pharmacol. Ther. 21: 147-157 (1977).
19. M.J. Kreek, D.L. Hachey, and P.D. Klein. Stereoselective disposi- tion of methadone in man. Life Sci. 24:925-932 (1979).
20. K. Kristensen, T. Blemmer, H.R. Angelo, L.L. Christrup, N.E. Drenck, S.N. Rasmussen, and P. Sjorgren. Stereoselective pharmacokinetics of methadone in chronic pain patients. Ther. Drug Monit. 18:221-227 (1996).
21. D.J.R. Foster, A.A. Somogyi, K.R. Dyer, J.M. White, and F. Bocher. Steady-state pharmacokinetics of (R)- and (S)-methadone in methadone maintenance patients. Br. J. Clin. Pharmacol. 50: 427-440 (2000).
22. D.W. Boulton, P. Arnaud, and C.L. DeVane. Pharmacokinetics and pharmacodynamics of methadone enantiomers after a single oral dose of racemate. Clin. Pharmacol. Ther. 70:48-57 (2001).
23. J. Hanna, D.J.R. Foster, A. Salter, A.A. Somogyi, J.M. White, and F. Bochner. Within- and between-subject variability in methadone pharmacokinetics and pharmacodynamics in methadone main- tenance subjects. Br. J. Clin. Pharmacol. 60:404-413 (2005).
24. K. Auret, C.R. Goucke, K.F. Ilett, M. Page-Sharp, F. Boyd, and T.E. Oh. Pharmacokinetics and pharmacodynamics of methadone enantiomers in hospice patients with cancer pain. Ther. Drug Monit. 28:359-366 (2006).
25. M.E. Rodriguez-Rosas, J.G. Medrano, D.H. Epstein, E.T. Moolchan, K.L. Preston, and I.W. Wainer. Determination of total and free concentrations of the enantiomers of methadone and its metabo- lite (2-ethylidene-l,5-dimethyl-3,3-diphenyl-pyrrolidine) in human plasma by enantioselective liquid chromatography with mass spectrometric detection. J. Chromatogr. A 1073:237-248 (20O5).
26. C. Iribarne, F. Berthou, S. Baird, Y. Dreano, D. Picart, J.P. Bail, P. Beaune, and J.F. Menez. Involvement of cytochrome P450 3A4 enzyme in the N-demethylation of methadone in human liver mi- crosomes. Chem. Res. Toxicol. 9:365-373 (1996).
27. D.E. Moody, M.E. Alburges, R.J. Parker, J.M, Collins, and J.M. Strong. The involvement of cytochrome P450 3A in the N-demethylation of/-a-acetylmethadol (LAAM), norLAAM and methadone. Drug Metab. Dispos. 25:1347-1353 (1997).
28. D.J.R. Foster, A.A. Somogyi, and F. Bochner. Methadone N- demethylation in human liver microsomes: lack of stereoselec- tivity and involvement of CYP3A4. Br. J. Clin. Pharmacol. 47: 403-412 (1999).
29. J.S. Wang and C.L. DeVane. Involvement of CYP3A4, CYP2C8, and CYP2D6 in the metabolism of (R)- and (S)-methadone in vitro. Drug Metab. Dispos. 31:742-747 (2003).
30. F. Prost and W. Thormann. Capillary electrophoresis to assess drug metabolism induced in vitro using single CYP450 enzymes (SupersomesTM): application to the chiral metabolism of mephenytoin and methadone. Electrophoresis 24:2577-2587 (2003).
31. J.G. Gerber, R.J. Rhodes, and J. Gal. Stereoselective metabolism of methadone N-demethylation by cytochrome P4502B6 and 2C19. Chirality 16:36-44 (2004).
32. E.D. Kharasch, C. Hoffer, D. Whittington, and P. Sheffels. Role of hepatic and intestinal cytochrome P450 3A and 2B6 in the metabolism, disposition, and miotic effects of methadone. Clin. Pharmacol. Ther. 76:250-269 (2004).
218
Journal of Analytical Toxicology, Vol. 32, April 2008
33. R.A. Totah, K.E. Allen, R Sheffels, D. Whittington, and E.D. Kharasch. Enantiomeric interactions and stereoselective human methadone metabolism. ]. Pharmacol. Exp. Ther. 321:389-399 (2007).
34. S. Crettol, J.J. Deglon, J. Besson, M. Croquette-Krokkar, I. Gothuey, R. Hammig, M. Monnat, H. Huttemann, P. Baumann, and C.B. Eap. Methadone enantiomer plasma levels, CYP2B6, CYP2C19, and CYP2C9 genotypes, and response to treatment. Clin. Pharmacol. Ther. 78:593-604 (2005).
35. S. Crettol, J.J. Deglon, J. Besson, M. Croquette-Krokar, R. Hammig, I. Gothuey, M. Monnat, and C.B. Eap. ABCBI and cytochrome P450 genotypes and phenotypes: influence on methadone plasma levels and response to treatment. Clin. Pharmacol. Ther. 80: 668- 681 (2006).
36. T.N. Nanovskaya, S.V. Deshmukh, I.A. Nekhayeva, O.L Zharikova, G.D.V. Hankins, and M.S. Ahmed. Methadone metabolism by human placenta. Biochem. Pharmacol. 68:583-591 (2004).
37. D. Whittington, P. Sheffels, and E.D. Kharasch. Stereoselective de- termination of methadone and the primary metabolite EDDP in human plasma by automated on-line extraction and liquid chro- matography mass spectrometry. J. Chromatogr. B 809:313-321 (2004).
38. R. Dams, C.M. Murphy, R.E. Choo, W.E. Lambert, A.P. De Leen- heer, and M.A. Huestis. LC-atmospheric pressure chemical ion- ization-MS/MS analysis of multiple illicit drugs, methadone, and their metabolites in oral fluid following protein precipitation. Anal. Chem. 75:798-804 (2003).
39. T. Kelly, P. Doble, and M. Dawson. Chiral analysis of methadone and its major metabolites (EDDP and EMDP) by liquid chro- matography-mass spectrometry. J. Chromatogr. B 814:315-323 (2005).
40. R.E. Choo, C.M. Murphy, H.E. Jones, and M.A. Huestis. Deter- mination of methadone, 2-ethylidene-l,5-dimethyl-3,3- diphenylpyrrolidine, 2-ethyl-5-methyl-3,3-diphenylpyraline and methadol in meconium by liquid chromatography atmospheric pressure chemical ionization tandem mass spectrometry. J. Chromatogr. B 814:369-373 (2005).
41. M.L. Etter, S. George, K. Graybiel, J. Eichhorst, and D.C. Lehotay Determination of free and protein-bound methadone and its major metabolite EDDP: enantiomeric separation and quantitation by LC/MS/MS. Clin. Biochem. 38:1095-1102 (2005).
42. O. Quintela, P. Lopez, A.M. Bermejo, and M. Lopez-Rivadulla. Determination of methadone, 2-ethylidene-l,5-dimethyl-3,3- diphenylpyrrolidine and alprazolam in human plasma by liquid chromatography-electrospray ionization mass spectrometry. J. Chromatogr. B 834:188-194 (2006).
43. S. Castiglioni, E. Zuccato, E. Crisci, C. Chiabrando, R. Fanelli, and R. Bagnati. Identification and measurement of illicit drugs and their metabolites in urban wastewater by liquid chromatog- raphy-tandem mass spectrometry. Anal. Chem. 78:8421-8429 (2006).
44. H.R. Liang, R.L. Foltz, M. Meng, and P. Bennett. Method devel- opment and validation for quantitative determination of methadone enantiomers in human plasma by liquid chromatog- raphy/tandem mass spectrometry J. Chromatogr. B 806: 191- 198 (2004).
45. W.B. Fang, D.M. Andrenyak, D.E. Moody, and E.S. Nuwayser. Determination of nalmefene by high-performance liquid chro- matography-electrospray ionization-tanden mass spectrometry. J. Anal. Toxicol. 29:169-174 (2005).
46. T.M. Annesley Ion suppression in mass spectrometry. Clin. Chem. 49:1041-1044 (2003).
47. U.S. FDA. Guidance for industry: bioanalytical method validation. http://www.fda/cder/guidance/4252fnl.pdf, June 2004.
48. F.T. Peters. Method validation using LC-MS. In Applications of LC-MS in Toxicology, A. Polettini, Ed. Pharmaceutical Press, London, U.K., 2006, pp 71-95.
49. J.N. Wilkins, A. Ashofteh, D. Setoda, W.S. Wheatly, H. Huigen, and W. Ling. Ultrafiltration using the Amicon MPS-1 for assessing methadone plasma protein binding. Ther. Drug Monit. 19" 83-87 (1997).
Dow
nloaded from https://academ
ic.oup.com/jat/article/32/3/208/897718 by guest on 09 January 2022
Journal of Analytical Toxicology, Vol. 32, April 2008
50. M.L. Stitzer, G.E. Bigelow, and I.A. Liebson. Single-day metha- done dose alteration: detectability and symptoms. Clin. Phar- macol. Ther. 36:244-250 (1984).
51. A.C. Nelson, W. Huang, and D.E. Moody Variables in human liver microsome preparation: impact on the kinetics of/-a- acetylmethadol (LAAM) N-demethylation and dextromethorphan O-demethylation. Drug Metab. Dispos. 29:319-325 (2001).
52. O.H. Lowry, N.J. Rosebrough, A.L. Farr, and R.L. Randall. Protein measurement with the Folin phenol reagent. J. Biol. Chem. 193: 265-275 (1951).
53. K.R. Allen, R. Azad, H.P. Field, and D.K. Blake. Replacement of immunoassay by LC tandem mass spectrometry for routine measurement of drugs of abuse in oral fluid. Ann. Ctin. Biochern. 42:277-284 (2005).
54. M.H. Slawson, M. Chen, D.E. Moody, S.D. Comer, E.S. Nuwayser, W.B. Fang, and R.L. Foltz. Quantitative analysis of naltrexone and 6tg-naltrexol in human, rat and rabbit plasma by liquid chro- matography-electrospray ionization tandem mass spectrometry with application to the pharmacokinetics of Depotrex in rabbits. ]. Anal. Toxicol. 31:453-461 (2007).
55. S.-N. Lin, D.E. Moody, G.E. Bigelow, and R.L. Foltz. A validated liquid chromatography-atmospheric pressure chemical ioniza- tion-tandem mass spectrometry method for quantitation of co- caine and benzoylecgonine in human plasma. J. Anal. Toxicol. 25" 497-503 (2001).
56. D.E. Moody, M.H. Slawson, E.C. Strain, J.D. Laycock, A.C. Span- bauer, and R.L. Foltz. A liquid chromatographic-electrospray ionization-tandem mass spectrometric method for determination of buprenorphine, its metabolite, norbuprenorphine, and a co-for- mulant, naloxone, that is suitable for in vivo and in vitro metabolism studies. Anal. Biochem. 306:31-39 (2002).
57. W. Huang, P.A. Bemis, M.H. Slawson, and D.E. Moody. Deter- mination of/-c~-acetylmethadol (LAAM), norLAAM, and dinor- LAAM in clinical and in vitro samples using liquid chromatog- raphy with electrospray ionization and tandem mass spectrometry. J. Pharm. Sci. 92:10-20 (2003).
Manuscript received June 6, 2007; revision received October 5, 2007.
219
Dow
nloaded from https://academ
ic.oup.com/jat/article/32/3/208/897718 by guest on 09 January 2022


