Embed Size (px)
Citation preview

FISHERY ASSESSMENT REPORT
TASMANIAN GIANT CRAB FISHERY 2002/2003
C. Gardner, C. Mackinnon, P. Burch and M. Bermudes
March 2004

This is the third in a series of giant crab fishery assessments to be produced by the Tasmanian Aquaculture and Fisheries Institute (TAFI). These reports provide summaries of our current understanding of the state of the stocks rather than management recommendations.
TAFI Marine Research Laboratories, Private Bag 49, Hobart, TAS 7000, Australia. E-mail: [email protected]. Ph. (03) 6227 7277, Fax (03) 6227 8035
The Tasmanian Aquaculture and Fisheries Institute, University of Tasmania 2003.
Copyright protects this publication. Except for purposes permitted by the Copyright Act, reproduction by whatever means is prohibited without the prior written permission of the Tasmanian Aquaculture and Fisheries Institute.

Giant Crab Fishery Assessment: 2002/03
Giant Crab Fishery Assessment: 2002/03
C. Mackinnon, C. Gardner, P. Burch and M. Bermudes
Executive Summary
The giant crab fishery is a small volume fishery with a total allowable commercial catch (TACC) in 2002/03 of 103.5 tonnes. There is virtually no recreational harvest. The fishery is closely aligned with the rock lobster fishery although the TACC equates to only around 6.5% of the annual rock lobster catch. Most catch is taken on the edge of the continental shelf, and as very little catch taken in Bass Strait or in the south of the State, the fishery is effectively split into eastern and western components. Most fishers work in either one or the other of these regions rather than shifting between the two.
This assessment evaluates the state of the stock against a range of performance indicators defined in the management plan. Additional information is also presented where possible to assist in informed management decision-making.
Several of the trigger points for this fishery were breached in the 2002/03 season, indicating that review of current management arrangements was required.
The total catch taken in 2002/03 was only 74.2 tonnes thus breaching the trigger point that total yearly catch is not less than 90% of the TACC.
Statewide catch rate in 2002/03 was the lowest on record but not sufficient to breach the trigger point related to a decline in catch rate for two successive years. This was explained in part by an increase in fishing effort from April to June when catch rates were lowest. A broader problem in the fishery was apparent, however, as catch rates were lowest on record for most other months. Thus there appeared to be a general contraction in catch rates across the fishery with very few shots obtaining greater than 2 kg/potday.
The trigger point for regional catch rates, a decline of greater than 20% over 2 years, was exceeded in 4 of the 6 areas, by declines of greater than 40%. Exceptions were area 3 (NE) which declined by 17% and area 4 (NNE) which increased by 11%. Changes in catch rate relative to those 5 years ago were strongly negative in all areas (greater than 50% decline). The east and west coasts exhibited different patterns in catch rate with stability over the last 2 years on the east and a 52% decline on the west. Record low catch rates were recorded for all months on the west coast except November.
Basic catch rate data can obscure trends in abundance of crabs because of the effects of depth of fishing effort, location of effort, change in the expertise of skippers, month of fishing and change of vessels. Catch rate was standardised for these factors to reveal the underlying trends. Standardised catch rates on the west coast exhibited a severe downward trend since the introduction of the quota management plan. Standardised
TAFI Fishery Assessment Report Page i

Giant Crab Fishery Assessment: 2002/03
catch rates on the east coast have remained stable since the first full year of quota was taken in 2000/2001.
Bycatch taken by trawlers operating in the South East Fishery (SEF) was difficult to quantify but appeared to exceed 4 tonnes, which was significant in a fishery of this magnitude. Less than 1 tonne of the catch was taken as bycatch by lobster fishers so this source of fishing mortality appeared to be of less concern, and did not breach trigger points.
Trigger points relating to size structure of the catch were breached with a general trend of fewer large animals and more small animals in the catch. There was an increase in the proportion of medium sized crabs so that mean weight of individual crabs remained stable.
Catches were composed mainly of legal sized crabs so there was less power to detect changes in catch rate of undersize crabs. Nonetheless, it appeared that undersize abundance, based on catch rate, was stable on the east coast but falling on the west.
The sex ratio of catch was skewed towards females, which was not optimal for yield or egg production, with around 59% of the catch made up of females (by number).
Effort did not appear to have shifted between the west and east coasts in response to the changes in the stocks.
Byproduct and bycatch appeared to be of minor concern with most bycatch consisting of other crustaceans that were returned alive. No protected species interactions were reported.
Industry and management expressed concern about the increase in effort and movement into shallower waters by SEF trawlers, particularly off the west coast. These concerns related to a range of issues including the direct harvest of crabs by trawlers, potential high mortality of discarded crabs, impacts on crabs that come in contact with gear but not taken, and impact on habitat and areas critical for recruitment. Analyses presented in this report appear to support these concerns as declines in stock were mainly apparent in west coast areas in regions where trawling effort has recently commenced. However, declines in the giant crab stock caused by targeted fishing cannot be discounted by these data.
In summary, the assessment pointed to an overall decline in the giant crab fishery in Tasmania, particularly off the west coast, and suggested vulnerability to excess fishing mortality from either targeted crab trapping or through impacts from other sectors.
Research is underway on aspects of the crab fishery that will continue improvement in assessments. These include the development of a stock assessment model and the evaluation of shelf-edge ecosystems and vulnerability to fishing effort.
TAFI Fishery Assessment Report Page ii

Giant Crab Fishery Assessment: 2002/03
Table of Contents
EXECUTIVE SUMMARY........................................................................................................................I
1. INTRODUCTION ........................................................................................................................... 1
2. INDUSTRY STOCK ASSESSMENT ISSUES ............................................................................. 3
3. FISHERY ASSESSMENT .............................................................................................................. 4 3.1 EVALUATION OF TRIGGER POINTS ............................................................................................. 4
3.1.1 Catch per unit effort ............................................................................................................ 4 Statewide trends in CPUE ............................................................................................................................. 5 Regional catch rates....................................................................................................................................... 8
3.1.2 Total annual commercial catch.......................................................................................... 15 Total yearly catch ........................................................................................................................................ 15 Catch taken as bycatch ................................................................................................................................ 16
3.1.3 Size distribution of the commercial catch ......................................................................... 18 3.2 OTHER ANALYSES ................................................................................................................... 22
3.2.1 Bycatch.............................................................................................................................. 22 3.2.2 Byproduct .......................................................................................................................... 22 3.2.3 Protected species interactions............................................................................................ 23 3.2.4 Ecosystem impacts and interactions .................................................................................. 23 3.2.5 Spatial distribution of catches ........................................................................................... 24 3.2.6 Structure of catches: proportion undersize, female/male, and discarded .......................... 26
Seasonal patterns ......................................................................................................................................... 26 Interannular patterns.................................................................................................................................... 27
4. CATCH RATE STANDARDISATION....................................................................................... 29 4.1 SUMMARY............................................................................................................................... 29 4.2 METHODS................................................................................................................................ 29 4.3 RESULTS ................................................................................................................................. 30
4.3.1 East Coast Fishery Bimonthly Analysis ............................................................................ 30 4.3.2 East Coast Fishery Yearly Analysis .................................................................................. 31 4.3.3 West Coast Fishery Bimonthly Analysis........................................................................... 32 4.3.4 West Coast Yearly Analysis .............................................................................................. 33
5. ACKNOWLEDGMENTS............................................................................................................. 34
6. REFERENCES .............................................................................................................................. 34
7. APPENDIX 1. SUMMARY OF RULES FOR THE TASMANIAN GIANT CRAB FISHERY36
TAFI Fishery Assessment Report Page iii


Giant Crab Fishery Assessment: 2002/03
1. Introduction
This report is the third formal stock assessment of the Tasmanian giant crab resource and is an annual requirement of the Tasmanian giant crab management plan.
Giant crabs are taken in deeper water than most commercial crustacean species, with fishing effort concentrated around the edge of the continental shelf. The species is only found across southern Australia. Commercial exploitation was sporadic until the early 1990's due to their low market price. Commercial rock lobster fishers had identified regions with high giant crab density off Portland in Victoria by the 1880's and small numbers were marketed in Melbourne. The fishery was reassessed in Tasmania during the 1970's with the aim of establishing an industry based on picked flesh. This never eventuated due to low catches and prices.
Historically giant crabs collected as a bycatch to the rock lobster fishery were marketed occasionally in southern Australian States, however most animals captured were discarded. The development of markets and techniques for live rock lobster enabled several processors and fishers to start developing markets for live giant crabs in 1991. This resulted in a rapid increase in price and volume of landed product so that fishers were able to target giant crab with steel traps on deeper ground than that for rock lobster. By 1994/95, catches in Tasmania had risen to 290 tonnes from less than 1 tonne in 1991 (Figure 1). Catches subsequently declined and a quota (total allowable commercial catch – TACC) of 103.5 tonnes was introduced in November 1999 as part of a new management plan for the fishery. The quota season is from March 1st through to the end of February, which is the same as for rock lobster. Other States have had a similar rise and fall in catches. The majority of the Australian catch (and TACC) is now taken around Tasmania.
050
100150200250300350
1989
/90
1990
/91
1991
/92
1992
/93
1993
/94
1994
/95
1995
/96
1996
/97
1997
/98
1998
/99
1999
/00
2000
/01
2001
/02
2002
/03
Tonn
es
Figure 1. Historical giant crab catch in Tasmania. The Total Allowable Catch was set at 103.5 tonnes in November 1999. Catches in 1998/99 and 1999/00 (solid circles) were from partial fishing years due to an extended seasonal closure to allow revision of management arrangements.
TAFI Fishery Assessment Report Page 1

Giant Crab Fishery Assessment: 2002/03
The giant crab fishery is still closely associated with the rock lobster fishery with many participants shifting effort between the two species depending on catches and market price. The majority of the catch is taken by less than 10 boats specifically targeting giant crab. A few tonnes are also taken as bycatch by around 10 lobster fishers operating in deeper waters. Fishers targeting giant crab have altered their gear from traditional rock lobster gear to larger, heavier steel pots to overcome drag from the long buoy lines. Opening of other fisheries, particularly scallop, also influence effort directed at giant crab.
The giant crab industry is small by volume but valuable due to the high market price of the product. The direct value of the Tasmanian giant crab fishery is estimated to be between $3 and $4 million annually. Employment is generated in catching giant crabs and also in support of vessels through provision of fuel, boat maintenance, insurance, bait, etc. These flow-on benefits are typically a high percentage of the catch value in wild fisheries. Live holding and transport is critical for the giant crab industry and employment in processing facilities is also a significant benefit from the fishery. The integration of the giant crab fishery with the rock lobster industry assists both industries by enabling operators to improve efficiency by switching effort in response to markets.
Giant crab catch and fishing effort figures have been recorded by the industry throughout the duration of the fishery through the Tasmanian Department of Primary Industry, Water and Environment mandatory logbook program. Size-structure samples have been recorded on several occasions by Deakin University, the Tasmanian Aquaculture and Fisheries Institute (TAFI), and also by some fishers. Tagging has also been undertaken with the bulk of this work driven through Deakin University (Levings et al., 2001). Additional research has been conducted by various organisations on a range of other aspects such as larval biology, diet, reproductive biology and product handling.
A key step in giant crab assessment research was the production of a yield- and egg per recruit model in 1999 (McGarvey et al., 1999). This model incorporated data from a range of sources, primarily that described by Levings et al. (2001). This model provided estimates of the effect of different size limits on stocks under different fishing scenarios. Further development of this model is currently underway to allow a broader range of scenario testing, including different size limits for males and females (as per rock lobsters) and the harvest of non-berried females during winter.
While the model described by McGarvey et al. (1999) provided information on size limits, it was not intended to be an assessment model that would provide an ongoing measure of the state of the resource. The need for ongoing information on stock size was identified by the Tasmanian Giant Crab Fishery Advisory Committee during the process of formulating the draft management plan. As a result, a new project on the development of giant crab assessment techniques commenced in July 2001 with funding support from the Fisheries Research and Development Corporation. That project has begun to produce results that are included in this stock assessment report, but the project is not yet complete. Improvements to the stock assessment process for giant crab are expected to continue over the next few years.
TAFI Fishery Assessment Report Page 2

Giant Crab Fishery Assessment: 2002/03
2. Industry Stock Assessment Issues
The formal procedure for production of the giant crab stock assessment includes industry and management involvement in the interpretation of data through an assessment working group. The aim of that group is to provide input on interpretation of trends, for example if catch rates were influenced by extremes of weather. The working group was not convened this year as far broader input was achieved through two special industry and management meetings to review the assessment. These meetings were initiated following the breaching of the trigger point relating to total allowable catch.
Key points raised at these meetings were:
• That catch rates may appear depressed for 2002/03 due to increased soak times used by many fishers, especially those with small holdings of quota who do not generally target crabs. This has the effect of increasing the number of pot-days without necessarily raising the catch. Thus catch rate is depressed. It was also noted that sometimes fishers would leave gear soaking for extended periods (eg a month) due to weather or other commitments. Again this would depress catch rates. This stock assessment has attempted to respond to these points by limiting pot days to a maximum of seven days, after this there is assumed to be no advantage to catch in additional soak times. The value of seven days was derived from an industry survey. Although opinions differed between skippers, this period of seven days was best supported.
• There was concern about the historical accuracy of catch rate data due to the use of more pots than was permitted (or recorded). The practice of “over-potting” would lead to inflated catch rates for periods prior to 1998 when the practice was reputedly more prevalent. Thus, when fishers started recording true catch rates after the introduction of quota the catch rates would appear relatively low. This issue has been addressed in this report in two ways. First, the data were checked record-by-record to identify anomalies and exclude data from fishers that appeared suspect. Secondly, catch rates were standardised by a range of factors including skipper.
• The main point of industry discussion at meetings was the impact of inshore movement of trawlers on catch rates and the crab resource. It was considered that this rapid in crease in trawl effort was affecting catch rates through both reduced trap fishing effectiveness and also through impact on actual stock abundance. Industry considered that catch rates had declined independently of abundance for a range of reasons including: loss of some gear and thus disruption to activities; displacement from areas of highest catch rates; and reduced catchability of crabs due to feeding on discarded bycatch from trawlers. It was also proposed that actual decline in abundance of crabs had occurred through: capture and retention by trawlers; mortality of crabs captured and discarded; mortality of crabs coming in contact with gear; and reduced productivity through removal of crab habitat by trawl gear.
TAFI Fishery Assessment Report Page 3

Giant Crab Fishery Assessment: 2002/03
3. Fishery Assessment
3.1 Evaluation of trigger points
3.1.1 Catch per unit effort
The giant crab management plan defines two trigger points relating to catch per unit effort (CPUE):
• When CPUE for the state declines for two consecutive years;
• When CPUE for any region declines by a total of 20% in two years.
The data used in this analysis is drawn from commercial logbooks and has changed since the start of targeted giant crab fishing in 1992. Logbook data prior to January 1995 does not include a measure of effort (as number of traps) so that data cannot be used for calculation of CPUE.
From 1995 to 1999, giant crab data was stored in the general fish database and effort was recorded as the number of traps and the duration of deployment (soak time). Although this allowed the calculation of effort, no record was made whether fishers were targeting giant crabs or simply retaining bycatch while lobster fishing. CPUE would be expected to be quite different in these two cases.
In the 2000/01 assessment report (Gardner and Mackinnon, 2002), attempted to identify when fishers were targeting crabs by using data where the gear type was recorded as “crab trap” rather than “lobster pot”. This solution was clearly inadequate as only a small proportion of the reported catch was taken by “crab trap” (around 10%). From November 1999 onwards, fishers were asked to specify if they were targeting lobster or crab. We have used this information to develop rules for splitting historical catch data (1995-1999) into “targeted” and “non targeted” (based on factors including depth fished, soak times, catch of lobsters and fisher).
Other adjustments to catch and effort data include the identification and correction of errors from a range of sources such as data entry, or reporting of catch in numbers rather than weight. In more recent data, it has been possible to compare catch records recorded through the logbook system with those recorded through quota monitoring. Substantial changes have been made to the measures of effort in historical records, which has subsequently affected calculations of catch rate. These changes include correcting pot number where fishers have advised that they were using more traps than authorised under their permits. Records from some vessels were consistently erroneous. Where it was not possible to correct these, they have been excluded from calculations of catch rate (but not total catch).
Note that fishing practices for giant crab differ from that of lobsters as gear is generally set for periods of several days when targeting giant crab. To account for variability in soak time, catch rates are standardised to catch per 24 hours soak time (this assumes that there is no saturation of traps and that the presence of crabs in a trap does not influence entry of additional animals).
TAFI Fishery Assessment Report Page 4

Giant Crab Fishery Assessment: 2002/03
Statewide trends in CPUE
Annual catch rates have declined since records became available in 1995. After an apparent stabilising of the catch rate between the 2000/01 and 2001/02 seasons, the 2002/03 season saw a continuation of the downward trend (Figure 2). Although the continuation of reduced catch rate is alarming, the trigger point requires two consecutive years of state decline, thus the trigger has not been activated.
Since the process of database correction was completed, seasonal patterns in statewide catch and effort data have become clearer (Figure 3). As noted in the previous assessment (Gardner et al., 2003), catch rates tend to be higher in summer months. This was again apparent for the 2002/03 season, however catch rates tended to be much lower than the previous seasons. This occurred throughout the season and reflects the declining annual catch rate trend (Figure 2).
0.0
0.5
1.0
1.5
2.0
2.5
3.0
95/96 96/97 97/98 98/99 99/00 00/01 01/02 02/03Quota year
CP
UE
(kg/
pot d
ay)
Figure 2. Trends in annual catch per unit effort statewide since 1995/96. Years are split by quota years (March –February). Effort is pot days.
0.00.51.01.52.02.53.03.54.04.5
Mar
Apr
May Jun
Jul
Aug Sep Oct
Nov
Dec Jan
Feb
Month
CP
UE
(kg/
potd
ay)
1995/96
1996/97
1997/98
1998/99
1999/00
2000/01
2001/02
2002/03
Statewide
Figure 3. Statewide seasonal patterns in CPUE since 1995.
TAFI Fishery Assessment Report Page 5

Giant Crab Fishery Assessment: 2002/03
0
4000
8000
12000
16000
20000
Mar
Apr
May Jun
Jul
Aug Sep Oct
Nov
Dec Jan
Feb
Month
Pot
days
1995/96
1996/97
1997/98
1998/99
1999/00
2000/01
2001/02
2002/03
Statewide
Figure 4. Statewide seasonal patterns in effort (pot days) since 1995.
Figure 5 shows the frequencies of catch rates of individual records for each year since 1995. This figure is important in understanding the pattern of change in statewide CPUE for two reasons. First, as indicted in the previous assessment (Gardner et. al., 2003), the distribution of the data is clearly non-normal, which implies that the statewide values of CPUE presented may be biased. Research has been conducted on providing an improved system for tracking changes in time in the CPUE that is suited to the data with this type of distribution. This is summarised in Chapter 4. Secondly, there is a clear pattern of change in the shape of these distributions through time. The distributions have tended to shift to the left, which implies that catch rates are declining. The marked shift to the left that occurred in the 2002/03 season supports the large decline in CPUE indicated in Figure 2.
TAFI Fishery Assessment Report Page 6

Giant Crab Fishery Assessment: 2002/03
1996-1997
0
10
20
30
0 1 2 3
% re
cord
s
0
10
20
30
0 1 2 3
% re
cord
s
0
10
20
30
0 1 2 3
% re
cord
s
0
10
20
30
0 1 2 3
% re
cord
s
0
10
20
30
0 1 2 3
% re
cord
s
0
10
20
30
0 1 2 3
% re
cord
s
0
10
20
30
0 1 2 3
% re
cord
s
e
Figure 5. Frequencies of catch rate (x-axis; k(split by quota years) from statewide. Note ththat the arithmetic means of catch rate will be left through time, which indicates a shift towarcrabs per shot are excluded.
Statewid
4 5 6 7 8 9 10 11 12
1997-1998
4 5 6 7 8 9 10 11 12
1998-19994 5 6 7 8 9 10 11 12
1999-2000
4 5 6 7 8 9 10 11 12
2000-2001
4 5 6 7 8 9 10 11 12
2001-2002
4 5 6 7 8 9 10 11 12
2002-2003
4 5 6 7 8 9 10 11 12 g/potday) for individual records in fisher logbook returns at the distribution of these is not normal, which implies biased. Also, note that the distributions are shifting to the ds lower catch rates. Frequencies of catch rates of zero
TAFI Fishery Assessment Report Page 7

Giant Crab Fishery Assessment: 2002/03
Regional catch rates
Regional patterns in catch per unit effort (CPUE) currently relate to each of the eight stock assessment areas as used in the Tasmanian rock lobster fishery (Figure 6). The second trigger relating to CPUE is stated as “CPUE for any region declines by a total of 20% in two years”. As only a small amount of catch is reported from the southern Areas 1 and 8, data is shown for Areas 2 to 7 only. This assessment compares catch rates from two full fishing seasons, unlike the previous assessment, which used the small amount of data available for the partial 1999/2000 season.
Regional CPUE is highly variable between years with no clear pattern between regions (Figure 7). The trigger point of a total decline in CPUE of 20% in 2 years was breached in four of the six assessment areas (Table 1). Only Areas 3 (-17%) and 4 (+11%) on the east coast failed to set off the trigger. Changes in the catch rate from five years ago are strongly negative (>-50%) in all areas. Regional changes in catch rate for the last year were also strongly negative, with the exception of Area 4, which showed a healthy increase (+33%).
Figure 6. Regional stock assessment areas used for evastate is divided into eight areas as set for the Tasmaniandivided into two regions: east (Stock Assessment AreasAreas 5-8 combined).
TAFI Fishery Assessment Report Page 8
West
luation of regional catch rates. On rock lobster fishery. On the right, 1-4 combined) and west (Stock As
East
the left, the the state is sessment

Giant Crab Fishery Assessment: 2002/03
0.00.51.01.52.02.53.0
95/9
6
96/9
7
97/9
8
98/9
9
99/0
0
00/0
1
01/0
2
02/0
3
CP
UE
(kg/
pot d
ay)
Area 5
0.00.51.01.52.02.53.0
95/9
6
96/9
7
97/9
8
98/9
9
99/0
0
00/0
1
01/0
2
02/0
3
CP
UE
(kg/
pot d
ay)
Area 6
0.00.51.01.52.02.53.0
95/9
6
96/9
7
97/9
8
98/9
9
99/0
0
00/0
1
01/0
2
02/0
3
CP
UE
(kg/
pot d
ay)
Area 7
0.00.51.01.52.02.53.0
95/9
6
96/9
7
97/9
8
98/9
9
99/0
0
00/0
1
01/0
2
02/0
3
CP
UE
(kg/
pot d
ay)
Area 4
0.00.51.01.52.02.53.0
95/9
6
96/9
7
97/9
8
98/9
9
99/0
0
00/0
1
01/0
2
02/0
3
CP
UE
(kg/
pot d
ay)
Area 3
0.00.51.01.52.02.53.0
95/9
6
96/9
7
97/9
8
98/9
9
99/0
0
00/0
1
01/0
2
02/0
3
CP
UE
(kg/
pot d
ay)
Area 2
Figure 7. Trends in catch per unit effort (CPUE) from each of the 6 main assessment regions. Years are split by quota years (March –February). Effort is pot days.
Table 1. Catch per unit effort (CPUE) in each assessment area for the 2002/2003 quota year relative to CPUE 5, 2 and 1 year ago. Shaded percentages indicate areas that have activated the trigger of 20%
decline in two years. Area CPUE
97/98 CPUE 00/01
CPUE 01/02
CPUE 02/03
% Change 5 years
% Change 2 years
% Change 1 year
2 1.02 0.56 1.58 0.31 -70 -45 -80 3 1.98 0.87 0.85 0.72 -64 -17 -14 4 2.54 0.93 0.77 1.03 -59 +11 +33 5 2.19 1.71 1.38 0.75 -66 -56 -46 6 1.42 1.41 1.68 0.67 -52 -52 -60 7 2.78 1.69 1.57 0.80 -71 -53 -49
The high degree of variability in CPUE between assessment areas is of some concern as interannual trends can be difficult to interpret. This volatility is caused by small sample size so areas were grouped into 2 larger regions, an east coast region that consisted of Assessment Areas 1-4 (east of 147°), and a west coast region that consisted of Areas 5-8 (west of 147°)(Figure 6). Giant crabs have been shown to move large distances (Levings et al., 2001), which suggests that biomass may be exchanged between the 8 assessment areas. Large spatial blocks of east- and west-coasts may be more appropriate as no movement has been detected between east and west coasts. With little or no catch taken from Bass Strait in the north and the far southern regions of the state
TAFI Fishery Assessment Report Page 9
Giant Crab Fishery Assessment: 2002/03
(i.e. Areas 1 and 8), these areas seem to form a natural boundary between the two regions. Fishers also tend to restrict there fishing to either the east or west coasts, with only a couple of fishers regularly targeting both regions. In summary, several factors other support the spatial segregation of assessment into east and west coast regions, they include: a) natural boundaries, b) lack of crab movement between these areas and c) fleet dynamics.
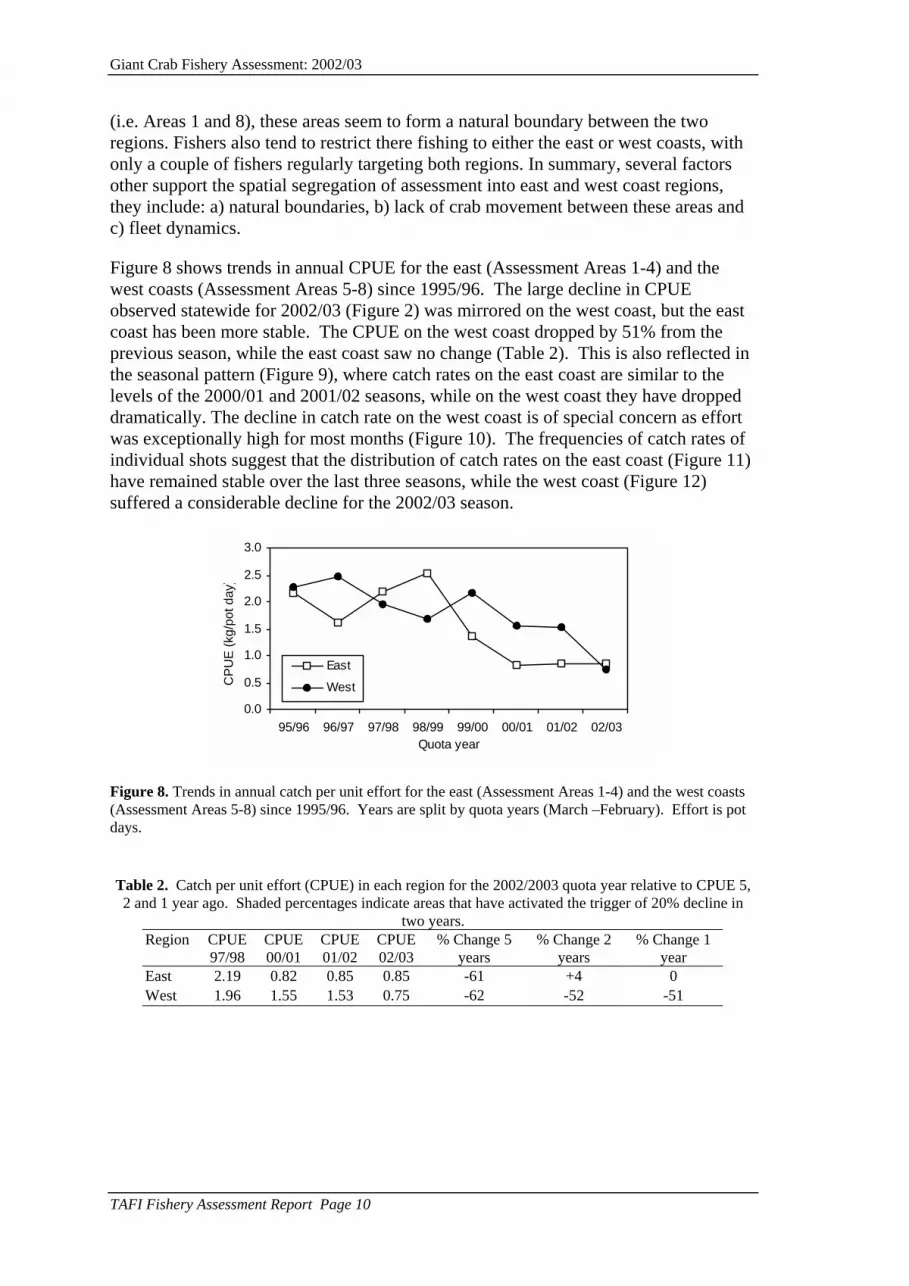
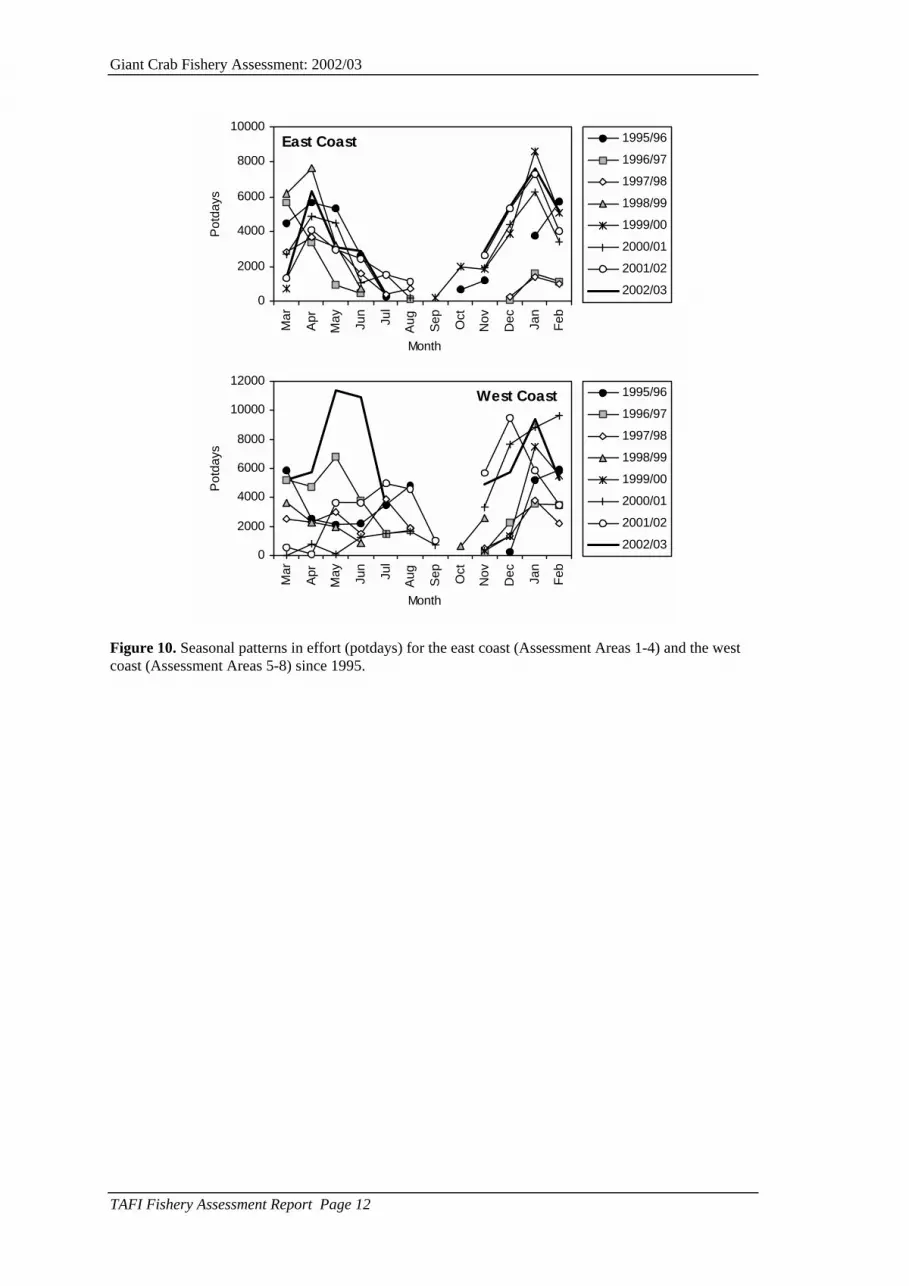
Figure 8 shows trends in annual CPUE for the east (Assessment Areas 1-4) and the west coasts (Assessment Areas 5-8) since 1995/96. The large decline in CPUE observed statewide for 2002/03 (Figure 2) was mirrored on the west coast, but the east coast has been more stable. The CPUE on the west coast dropped by 51% from the previous season, while the east coast saw no change (Table 2). This is also reflected in the seasonal pattern (Figure 9), where catch rates on the east coast are similar to the levels of the 2000/01 and 2001/02 seasons, while on the west coast they have dropped dramatically. The decline in catch rate on the west coast is of special concern as effort was exceptionally high for most months (Figure 10). The frequencies of catch rates of individual shots suggest that the distribution of catch rates on the east coast (Figure 11) have remained stable over the last three seasons, while the west coast (Figure 12) suffered a considerable decline for the 2002/03 season.
0.0
0.5
1.0
1.5
2.0
2.5
3.0
95/96 96/97 97/98 98/99 99/00 00/01 01/02 02/03Quota year
CP
UE
(kg/
pot d
ay)
East
West
Figure 8. Trends in annual catch per unit effort for the east (Assessment Areas 1-4) and the west coasts (Assessment Areas 5-8) since 1995/96. Years are split by quota years (March –February). Effort is pot days.
Table 2. Catch per unit effort (CPUE) in each region for the 2002/2003 quota year relative to CPUE 5, 2 and 1 year ago. Shaded percentages indicate areas that have activated the trigger of 20% decline in
two years. Region CPUE
97/98 CPUE 00/01
CPUE 01/02
CPUE 02/03
% Change 5 years
% Change 2 years
% Change 1 year
East 2.19 0.82 0.85 0.85 -61 +4 0 West 1.96 1.55 1.53 0.75 -62 -52 -51
TAFI Fishery Assessment Report Page 10

Giant Crab Fishery Assessment: 2002/03
0.00.51.01.52.02.53.03.54.04.5
Mar
Apr
May Jun
Jul
Aug Sep Oct
Nov
Dec Jan
Feb
Month
CP
UE
(kg/
potd
ay)
1995/96
1996/97
1997/98
1998/99
1999/00
2000/01
2001/02
2002/03
East Coast
0.00.51.01.52.02.53.03.54.04.55.0
Mar
Apr
May Jun
Jul
Aug Sep Oct
Nov
Dec Jan
Feb
Month
CP
UE
(kg/
potd
ay)
1995/96
1996/97
1997/98
1998/99
1999/00
2000/01
2001/02
2002/03
West Coast
Figure 9. Seasonal patterns in CPUE (kg/potday) for the east coast (Assessment Areas 1-4) and the west coast (Assessment Areas 5-8) since 1995.
TAFI Fishery Assessment Report Page 11
Giant Crab Fishery Assessment: 2002/03
0
2000
4000
6000
8000
10000
Mar
Apr
May Jun
Jul
Aug Sep Oct
Nov
Dec Jan
Feb
Month
Pot
days
1995/96
1996/97
1997/98
1998/99
1999/00
2000/01
2001/02
2002/03
East Coast
0
2000
4000
6000
8000
10000
12000
Mar
Apr
May Jun
Jul
Aug Sep Oct
Nov
Dec Jan
Feb
Month
Pot
days
1995/96
1996/97
1997/98
1998/99
1999/00
2000/01
2001/02
2002/03
West Coast
Figure 10. Seasonal patterns in effort (potdays) for the east coast (Assessment Areas 1-4) and the west coast (Assessment Areas 5-8) since 1995.
TAFI Fishery Assessment Report Page 12

Giant Crab Fishery Assessment: 2002/03
1996-1997
010
2030
40
0 1 2 3
% re
cord
s
010
2030
40
0 1 2 3
% re
cord
s
010
2030
40
0 1 2 3
% re
cord
s
010
2030
40
0 1 2 3
% re
cord
s
010
2030
40
0 1 2 3
% re
cord
s
010
2030
40
0 1 2 3
% re
cord
s
010
2030
40
0 1 2 3
% re
cord
s
Figure 11. Frequencies of catch rate (x-axis; k(split by quota years) for the east coast (assessnormal, which implies that the arithmetic meadistributions are shifting to the left through timFrequencies of catch rates of zero crabs per sh
East Coast
4 5 6 7 8 9 10 11 12
1997-1998
4 5 6 7 8 9 10 11 12
1998-1999
4 5 6 7 8 9 10 11 12
1999-2000
4 5 6 7 8 9 10 11 122000-2001
4 5 6 7 8 9 10 11 12
2001-2002
4 5 6 7 8 9 10 11 12
2002-2003
4 5 6 7 8 9 10 11 12
g/potday) for individual records in fisher log book returns ment areas 1-4). Note that the distribution of these is not ns of catch rate will be biased. Also, note that the e, which indicates a shift towards lower catch rates.
ot are excluded.
TAFI Fishery Assessment Report Page 13

Giant Crab Fishery Assessment: 2002/03
1996-1997
010
2030
40
0 1 2 3
% re
cord
s
010
2030
400 1 2 3
% re
cord
s
010
2030
40
0 1 2 3
% re
cord
s
010
2030
40
0 1 2 3
% re
cord
s
010
2030
40
0 1 2 3
% re
cord
s
010
2030
40
0 1 2 3
% re
cord
s
010
2030
40
0 1 2 3
% re
cord
s
Figure 12. Frequencies of catch rate (x-axi(split by quota years) for the west coast (assnormal, which implies that the arithmetic mdistributions are shifting to the left through Frequencies of catch rates of zero crabs per
TAFI Fishery Assessment Report Page 14
West Coast
4 5 6 7 8 9 10 11 12
1997-1998
4 5 6 7 8 9 10 11 12
1998-19994 5 6 7 8 9 10 11 12
1999-2000
4 5 6 7 8 9 10 11 12
2000-2001
4 5 6 7 8 9 10 11 12
2001-2002
4 5 6 7 8 9 10 11 12
2002-2003
4 5 6 7 8 9 10 11 12
s; kg/potday) for individual records in fisher log book returns essment areas 5-8). Note that the distribution of these is not eans of catch rate will be biased. Also, note that the time, which indicates a shift towards lower catch rates. shot are excluded.

Giant Crab Fishery Assessment: 2002/03
3.1.2 Total annual commercial catch
Two triggers are based on the total annual commercial catch:
• The total yearly catch is not less than 90% of the TAC in any year;
• The bycatch of giant crabs taken by lobster fishers does not exceed 5 tonnes in any year.
Total yearly catch
Catch weight of giant crab is recorded at several stages, at the time of capture in commercial logbooks, at the time of landing through the quota audit system, and also by processors. Data presented is from the quota audit system and the processors.
Total catch for the first quota year under the Tasmanian giant crab management plan (1999/00) was considerably less than the TAC of 103.5 tonnes because this quota year was abbreviated to run for only 4 months (Table 3)(Figure 13). During the 2002/03 season, which was open to fishing for the full quota year, fishers caught just over 74 tonnes, well below the 90 tonne trigger. This large reduction in the total catch from last season (nearly 26 tonnes) indicates cause for concern.
When the weight of giant crab recorded by processors is compared to the QMS catch, discrepancies are evident (Table 3). Processor weight does not distinguish between catch caught interstate (eg. Vic or SA) and Tasmanian caught catch. The large discrepancy between the QMS and the processor catch for the 2002/03 season may be partly due to interstate fishers offloading interstate caught fish to Tasmanian processors. The carry over of quota from one season to the other may also result in some of the discrepancy. As a result, processor derived catch estimates may not truly reflect the catch taken in the fishing season.
Table 3. Total catch of giant crab for quota years since introduction of the TAC. Catches recorded by fishers through the quota monitoring system are recorded as “QMS”. Two secondary sources of
information on total catch are that reported by processors and fishers via their logbooks. Year QMS Total catch
(kg) QMS Total N Mean weight
(kg) Logbook weight
(kg) Processor weight
(kg) 1999/00 53054 16394 3.24 64811 43938 2000/01 96226 28627 3.36 86510 85588 2001/02 98188 27268 3.60 96593 98246 2002/03 74263 20462 3.63 78180 92926
The manner in which catch for the quota year was accumulated is shown in Figure 13 and Figure 14. The 2002/03 season had an unusual seasonal pattern in accumulation of catch relative to previous years. Rate of accumulation of catch was the fasted recorded for the period from March to June. This appears to be due to the record high rates of effort during this period (Figure 4, page 6). Accumulation of catch during winter months is usually slow but rises rapidly after the season opening in November. In 2002/03 the rate of accumulation after the November opening was very slow and it was this period that led to the failure to take the TACC.
TAFI Fishery Assessment Report Page 15

Giant Crab Fishery Assessment: 2002/03
0
20
40
60
80
100
Mar Apr May Jun Jul Aug Sep Oct Nov Dec Jan Feb
Cum
ulat
ive
catc
h (t)
1999/00 2000/01
2001/02 2002/03
Figure 13. Cumulative catch obtained from the quota monitoring system (QMS). Cumulative catch is by month for each quota year since introduction of QMS in 1999. Note the 1999/00 season only ran from November 1999 until February 2000.
0
20
40
60
80
100
Mar Apr May Jun Jul Aug Sep Oct Nov Dec Jan Feb
Cum
ulat
ive
catc
h (t)
1999/00 2000/01
2001/02 2002/03
Figure 14. Cumulative catch obtained from fishers logbooks. Cumulative catch is by month for each quota year since introduction of QMS in 1999. Note the 1999/00 season only ran from November 1999 until February 2000.
Catch taken as bycatch
Giant crabs can be captured by a range of methods that fall outside the giant crab quota management system. Crabs can be captured in standard rock lobster gear, and provisions in the management plan allow for the landing of a small number of crabs as bycatch. The management plan includes a performance indicator that relates solely to bycatch taken in rock lobster pots.
Total bycatch of giant crabs taken by lobster fishers who did not hold giant crab quota is shown in Table 4. Reported bycatch of giant crab reached 1100 kg in 2000/01 but the past two seasons have seen a dramatic decline. In the 2001/02 season bycatch was only around half that amount (650 kg), while the 2002/03 season saw a further reduction (180kg). Bycatch of giant crab has been less than the trigger point of 5 tonnes in each year since the introduction of the management plan. Thus, this trigger has not been activated.
TAFI Fishery Assessment Report Page 16

Giant Crab Fishery Assessment: 2002/03
Table 4. Giant crab bycatch taken by lobster fishers without giant crab quota. Giant crab bycatch (t) % of total landings
1999/00 0.87 1.61 2000/01 1.11 1.14 2001/02 0.65 0.66 2002/03 0.18 0.24
Fishers have also reported capturing giant crabs using set nets, baited hooks and trawl. Reported giant crab catch taken by all gear types managed by the State of Tasmania are small relative to catches from crab traps with catches exceeding 100 kg only for graball nets in 1997/98 and shark nets from 1995/96 to 1997/98 (Figure 15). In 2002/03, only 5.5 kg of catch was reported from a shark line, which was the only reported catch from a gear type other than a crab trap or lobster pot.
Several fisheries managed by the Commonwealth through the Australian Fisheries Management Authority (AFMA) also appear to catch and retain giant crab. Reported catches are shown for two categories: “unclassified crab” and “giant crab” in Table 5. It is unclear what species are included in the “crab” category (Figure 16) although it is probable that this also includes records of giant crab. It appears that total catch of giant crabs by trawlers in Tasmania could approach 5 tonnes, which is an insignificant component of seafood landed by SEF trawlers, but may be a significant component of the total giant crab harvests from Tasmania. SEF trawlers have initiated a voluntary logbook to track capture of giant crab so improved data is expected for next year’s assessment.
00.10.20.30.40.50.60.70.80.9
1995
/96
1996
/97
1997
/98
1998
/99
1999
/00
2000
/01
2001
/02
2002
/03
Cat
ch (t
onne
s)
Graball NetHandlineOtterboard Traw lShark LineShark NetFish trap
Figure 15. Giant crab catch reported through Tasmanian State managed fisheries for gear types other than giant crab traps or lobster pots.
TAFI Fishery Assessment Report Page 17

Giant Crab Fishery Assessment: 2002/03
Table 5. Reported retained catch by trawlers in the South East Fishery (SEF) and also for waters broadly equating to areas contained within the Tasmanian OCS (ie below latitude 39 and between
longitudes 143 and 149). Most crab catch is simply classed as “crab” and probably consists mainly of giant crabs as well as other species such as king crabs (Neolithodes and Lithodes species) and spider
crabs. Bycatch species category “crab” (kg) giant crab (kg) total Total SEF 7261 984 8245 “Tasmania” 3895 822 4717
Figure 16. Other crabs taken occasionally by the SEF and included in the category of “crab”: king crabs
(spiny king crab Lithodes longispina – left; and Brodie’s king crab Neolithodes brodei – middle) and spider crabs (Leptomithrax gaimardii – right). None of these are of high value and most are discarded.
Consequently, they are expected to make only a small contribution to records of catch classed generically as “crab”.
3.1.3 Size distribution of the commercial catch
The size distribution of the commercial catch provides a guide to changes to the population as a result of fishing mortality and recruitment pulses. Information on size distribution is obtained from several sources including:
• voluntary measuring of catch (including undersize) by commercial fishers;
• mean weights from estimated catch and number data in commercial log books;
• mean weights from measured weight and number in quota audit data; and
• weights of crabs sold into different price category splits.
Trigger points in the current management plan relate to only the last of these with two triggers listed:
• The proportion of the catch above 5kg varies by more than 30% compared to the 1996/97 distribution;
• The proportion of the catch below 3 kg varies by more than 30% compared to the 1996/97 distribution.
TAFI Fishery Assessment Report Page 18

Giant Crab Fishery Assessment: 2002/03
The proportion of crabs in small (<3kg) and large (>5kg) size splits from sales of fishers to processors are shown in Figure 17. Trigger points were breached for each of these indicators due to an increase in the proportion of small crabs and a decline in the proportion of large crabs. These data were drawn from information collected from both processors and fishers, with the majority of data originating from fishers who tend to work on the west coast. Note this data set does not include all crabs sales, rather only the 65% that can be obtained voluntarily from either fishers or processors (Table 6).
Table 6. Proportion of total landed catch included in analyses of processor size-split categories. Year 1994/95 1995/96 1996/97 1997/98 1998/99 1999/00 2000/01 2001/02 2002/03
% 12.4 23.5 34.2 34.1 27.8 18.5 72.3 14.9 65.3
0%
20%
40%
60%
80%
100%
1994/95 1995/96 1996/97 1997/98 1998/99 1999/00 2000/01 2001/02 2002/03
Fishing Year
Per
cent
age
of C
atch
< 3kgs
3-5Kgs > 5kgs
Figure 17. Proportions of commercial processor size-split categories in the landed catch.
TAFI Fishery Assessment Report Page 19

Giant Crab Fishery Assessment: 2002/03
Above 5kgs
-80
-60
-40
-20
0
20
40
60
801994/95 1995/96 1996/97 1997/98 1998/99 1999/00 2000/01 2001/02 2002/03
Fishing Year
% v
aria
tion
from
refe
renc
e ye
ar
7.56(36.12)
18.20(54.51)
18.79(46.40)
13.06(35.35)
1.43(9.79)
43.88(69.52)
5.89(20.87)
Reference Year4.49
(14.58)9.91
(48.45)
Below 3kgs
-50
0
50
100
150
200
1994/95 1995/96 1996/97 1997/98 1998/99 1999/00 2000/01 2001/02 2002/03Fishing year
% v
aria
tion
from
refe
renc
e ye
ar
25.72(36.12)
18.34(54.51)
9.70(35.35)
8.16(20.87)
4.36(9.79)
11.90(69.52)
12.12(46.40)
3.33(14.58)
Reference Year 19.57(48.45)
Figure 18. Percentage difference of the proportion of the catch in large or small size splits relative to the reference year of 1996/97. Total weight of catch (tonnes) in each size split is shown next to each column, with the total catch weight (tonnes) that data is available for in parentheses. Dotted lines represent 30% differences.
TAFI Fishery Assessment Report Page 20

Giant Crab Fishery Assessment: 2002/03
Although no trigger point relates directly to data on the mean size of landed crabs collected through the quota audit process, these are useful for observing patterns in the size distribution of the population. Figure 19 shows the mean monthly weight of landed crabs since the introduction of QMS in 1999. No trend is apparent, which would suggest stability in size structure of the landed catch. The considerable rise in the September 2002/03 mean monthly weight is of no concern as it is based on a small amount of catch. Catches are composed mainly of legal size crabs so there is less power in logbook data to detect trends in undersize crabs (Figure 20). Nonetheless, it appears that undersize catch rates on the east coast are stable while those on the west coast were the lowest for the 4 years that data are available.
012345678
Mar Apr May Jun Jul Aug Sep Oct Nov Dec Jan Feb
Ave
rage
indi
vidu
al w
eigh
t (kg
)
1999/00 2000/012001/02 2002/03
Figure 19. Average weight of crabs landed by month for each year since the introduction of quota management. These data are drawn from numbers and weights reported through the quota audit process.
West Coast
00.10.20.30.40.50.60.7
1999/00 2000/01 2001/02 2002/03Quota year
Num
ber o
f cr
abs/
potd
ay
undersize
legal
East Coast
00.10.20.30.40.50.60.7
1999/00 2000/01 2001/02 2002/03Quota year
Num
ber o
f cr
abs/
potd
ay
undersize
legal
Figure 20. Changes in catch per unit effort (number of crabs per potday) between the legal and undersized proportion of the total catch for both the east and west coasts.
TAFI Fishery Assessment Report Page 21

Giant Crab Fishery Assessment: 2002/03
3.2 Other analyses
3.2.1 Bycatch
Information on bycatch species taken by crab fishers has been recorded as part of catch sampling conducted for the FRDC funded projected on the development of giant crab assessment techniques. Bycatch data were presented in the previous stock assessment report. In summary, that report noted that few species were recorded as bycatch with the most numerous being the antlered crab Paromola petterdi. Hermits crabs (Strigipagurus strigimanus and Dardanus arrosor) were the next most common species followed by pink ling Genypterus blacodes. All hermit crabs and over 90% of antlered crabs were observed to be released apparently unharmed. These animals do not contain air spaces and thus are apparently unaffected by the pressure change experienced during hauling to the surface. In contrast, finfish (mainly ling) bycatch was moribund.
3.2.2 Byproduct
Byproduct differs from bycatch in that it is retained for sale. Information on bycatch is collected through the general fish logbook and can be traced back to giant crab fishing where the fisher specifies their gear type as “crab traps” or “lobster pots”. This byproduct catch from crustacean traps is included in the fisheries assessment for those species. Crab and lobster fishers have reported very little byproduct over the last few years (Figure 21). Octopus form the bulk of byproduct from lobster pots but no clear trend is evident from records of this byproduct type. Byproduct is recorded for assessments through the general fish logbook.
0
500
1000
1500
2000
2500
3000
1999
/200
0
2000
/200
1
2001
/200
2
2002
/200
3
kg
Cod
Ling
JackassMorwongOctopus
StripedTrumpeter
Figure 21. Byproduct reported from fishers using “crab traps” or “lobster pots” excluding inshore species such as wrasse or species where less than 100 kg of catch has been reported. The distinction between “crab trap” and “lobster pot” gear types is ambiguous so these gear types are combined. .
TAFI Fishery Assessment Report Page 22

Giant Crab Fishery Assessment: 2002/03
3.2.3 Protected species interactions
No interactions between fishers and protected species were reported over the last year, although this information is currently collected only in an ad-hoc manner by encouraging fishers to report interactions. Benign interactions with seabirds and other protected species have inevitably occurred during this period, but have not been reported. To assist with data collection on this issue, a revised logbook has been drafted which includes a component on protected species. This logbook was introduced in February 2003 and results will be reported in the next assessment report.
3.2.4 Ecosystem impacts and interactions
Habitat at the shelf break - a depth zone in ~180-400 m where the continental shelf drops away rapidly down the continental slope - is an area of high productivity off Southern Australia and is targeted by different fisheries using different gear types. For example, traps are used for ling and giant crab fisheries, weighted drop lines for blue eye and various trawl gear configurations are used to target a range of finfish species in the SEF. Each of these gear types interacts with the benthic habitat in different ways and there is potential for the activities of one industry to influence another through changes to target species abundance, habitat structure, and ecosystems. Sustainability of any one of these fisheries is reliant on the habitat and ecosystem, which must be considered in the context of all industries operating in the area.
This issue has been highlighted recently with interactions between giant crab trappers and finfish trawlers, both of which operate in the same region at similar depths, and both of which have undergone large expansion of effort over the last decade. Research on the habitat effects of these industries is required for understanding interactions and broader ecosystem effects.
Research recently commenced in a collaborative project between CSIRO and TAFI to address these issues through video sampling of habitat in the region with quantification of the impacts of fishing activities by comparison between transects. In addition to video data, information on these habitats will be collected through SWATH mapping, sediment grabs and sled samples.
A pilot scale survey was conducted in late 2003 on board a fishing vessel normally used for scallop and salmon fishing, with support from the giant crab fishing industry. That voyage conducted video tows to beyond 400 m depth and demonstrated that target species including giant crabs can be "sampled" by video tows. In addition, impacts of fishing gear were evident and habitat types and species assemblages readily classified. Thus a basic premise of this proposal has been tested and confirmed - that species assemblages and impacts of fishing activities on the shelf-break and slope can be assessed by video tow. Methods developed for that cruise form the basis of the more extensive research proposed here with further refinement of sampling including the collection of additional data on environment including sediment, current, temperature and bathymetry.
The project has the following objectives:
• Evaluate the vulnerability of shelf-edge habitat to damage by trawl and trap
TAFI Fishery Assessment Report Page 23

Giant Crab Fishery Assessment: 2002/03
fishing gears.
• Detail the distribution of exploited shelf-edge species in relation to habitat features.
• Define and map key habitats on the shelf edge (~80-180 fm) at key locations around Tasmania where fisheries using different gear types interact.
• Evaluate ecosystem links within habitats, specifically trophic, temperature and current-flow links.
• Evaluate our ability to use video to obtain fishery independent stock assessment information such as abundance, sex ratio, condition and size of target species.
Figure 22. Deep water video system used for collecting images of giant crab habitat and a male giant crab encountered on the first survey at around 300 m.
3.2.5 Spatial distribution of catches
The spatial distribution of effort for the fishery is shown in Figure 23. The majority of the effort is directed north of 42º S, although fishing grounds extend south of this into Area 7 on the west coast and Area 2 on the east coast. Spatial distribution of catch is shown in Figure 24. During the 2002/03 season a small shift in the distribution of catch from the west to east coast was evident. There appears to have been a shift away from Area 5 (NW) and Area 6 (W) to Area 4 (NE) and Area 3 (E) between 2001/02 and 2002/03. When the statewide distribution of effort and catch is separated into two regions, the east and west coasts, a distinct trend is evident (Figure 25). There appears to be an increasing proportion of effort on the west coast, but an increased percentage of the overall statewide catch is now caught on the east coast.
TAFI Fishery Assessment Report Page 24

Giant Crab Fishery Assessment: 2002/03
147
45
Figtotaof t
200
Fignumcatc
2000/01
6
7
8
Tasmani
2
1
3
ure 23. Distribution of effort of fishers targeting crabs from each assel number of potdays undertaken around the State). Effort from Areasotal effort.
6
7
8
5
147
3
4
1
2
Tasmania
2002/03 2001/020/01 20
ure 24. Distribution of legal-sized, retained catch between assessmenber of animals taken around the State). Catch from Areas 1 and 8 reph.
TAFI Fish
2000/01
2001/02 2002/03ssment are 1 and 8 rep
20000/01
t areas (as present less
ery Assessm
2001/02
as (as perceresent less
1/02 20
ercentage than 1% of
ent Report
2002/03
ntage of than 3%
02/03
of total total
Page 25

Giant Crab Fishery Assessment: 2002/03
East Coast
010203040506070
1999/00 2000/01 2001/02 2002/03
%
CatchEffort West Coast
0
20
40
60
80
1999/00 2000/01 2001/02 2002/03
%
CatchEffort
Figure 25. The percentage of catch (legal-sized retained) and effort (potdays) of the statewide total for both the east coast (assessment areas 1-4) and the west coast (assessment areas 5-8).
3.2.6 Structure of catches: proportion undersize, female/male, and discarded
Following the introduction of a new logbook in November 1999, fishers now provide details of the structure of their catch in terms of the number of males and females retained, the number of undersize crabs discarded, and the number of animals discarded for other reasons (eg oversize, damaged or berried). This information will provide a valuable guide to changes in the fishery in the future and will assist in interpreting changes in catch rate. Data is only available for four seasons at this stage so temporal trends are difficult to identify. Note also that one of these four seasons was incomplete (Nov 1999 – February 2000).
Seasonal patterns
As noted in Section 3.1.1 catch per unit effort varies seasonally with the highest catch rates during the summer months (November – March). This period corresponds to those months where a large proportion of the retained catch is female (approximately 2-3 females for each male retained; Figure 26). The proportion of females in the retained catch declines in autumn, as females become ovigerous or berried.
01020
3040506070
8090
100
Mar Apr May Jun Jul Aug Sep Oct Nov Dec Jan Feb
% o
f tot
al le
gal s
ized
cra
bs
% Sized Female 1999/00% Sized Female 2000/01% Sized Female 2001/02% Sized Female 2002/03
Figure 26. The proportion of retained giant crabs that were female for each month since November 1999. Note these proportions are based on number of individuals, not weight, and that a proportion of 0.75 equates to catch comprised of three females for every male. The horizontal line at 50% represents the proportion where equal numbers of males and females were taken.
TAFI Fishery Assessment Report Page 26

Giant Crab Fishery Assessment: 2002/03
The legal minimum size limit for giant crabs is 150mm carapace length, with a maximum of 215mm. The proportion of undersize in catches for 2002/03 appears to have increased when compared to previous seasons across all months, except August and September (Figure 27). Discarded crabs (possibly damaged or one-armed) appear relatively stable across all months, although they tend to be marginally higher in August and September (Figure 28).
01020
3040506070
8090
100
Mar Apr May Jun Jul Aug Sep Oct Nov Dec Jan Feb
% o
f tot
al c
rabs
cap
ture
d
% Undersized 1999/00% Undersized 2000/01% Undersized 2001/02% Undersized 2002/03
Figure 27. The proportion of giant crab catch that was undersize for each month since November 1999. Note these proportions are based on the number of individuals, not weight.
01020
3040506070
8090
100
Mar Apr May Jun Jul Aug Sep Oct Nov Dec Jan Feb
% o
f tot
al c
rabs
cap
ture
d
% Discarded other 1999/00% Discarded other 2000/01% Discarded other 2001/02% Discarded other 2002/03
Figure 28. The proportion of giant crab catch that was discarded, but not undersize, for each month since November 1999. Crabs in this category include berried females, males larger than the maximum legal size of 216 mm, and animals with only one claw, which are usually discarded due to their low market value. Note these proportions are based on the number of individuals, not weight.
Interannular patterns
Information on the change in the proportion of females and undersize crabs in catches will be of value for future monitoring of annual changes in giant crab stocks. Data collected since November 1999 is presented here, although as noted earlier, data is available for only three full years.
The proportion of females in the retained catch and the mean weight appear stable since 2000/01, while the proportion of undersize crabs in catches appears to have increased during the 2002/03 season (Figure 29).
TAFI Fishery Assessment Report Page 27

Giant Crab Fishery Assessment: 2002/03
Regional patterns are shown in Figure 30 although the significance of temporal changes is difficult to assess with such a limited time-series of data. Catches on the east coast tend to include a higher proportion of females than those from the west. This is supported when the assessment areas are pooled for both the east and west coasts (Figure 31). Also of note is the statewide trend of increasing proportion of undersized crabs in catches is consistent for both regions.
0
20
40
60
80
100
1999/00 2000/01 2001/02 2002/03
%
0.0
0.5
1.0
1.5
2.0
2.5
3.0
3.5
4.0
kg
% Female
% Undersized
Mean Weight
Figure 29. Statewide, interannual trends in the proportion of retained catch that was female, proportion of undersize in catch, and the mean weight of retained crabs.
0
20
40
60
80
100
1999/00 2000/01 2001/02 2002/03
%
0
2
4
6
8
10
12
kg
Area 2
0
20
40
60
80
100
1999/00 2000/01 2001/02 2002/03
%
0
1
2
3
4
5
kg
Area 3
0
20
40
60
80
100
1999/00 2000/01 2001/02 2002/03
%
0
1
2
3
4
5
kg
Area 4
0
20
40
60
80
100
1999/00 2000/01 2001/02 2002/03
%
0
1
2
3
4
5
kg
Area 5
0
20
40
60
80
100
1999/00 2000/01 2001/02 2002/03
%
0
1
2
3
4
5
kg
Area 6
0
20
40
60
80
100
1999/00 2000/01 2001/02 2002/03
%
0
1
2
3
4
5
kg
Area 7
Figure 30. Interannual change in the proportion (based on numbers of individuals) of females in retained catch (solid squares), proportion of undersize in catch (hollow diamonds), and mean weight (heavy line) for each assessment area. Areas 1 and 8 are omitted due to low catches.
TAFI Fishery Assessment Report Page 28

Giant Crab Fishery Assessment: 2002/03
West Coast0
20
40
60
80
100
1999/00 2000/01 2001/02 2002/03
%
0
1
2
3
4
5
kg
East Coast0
20
40
60
80
100
1999/00 2000/01 2001/02 2002/03
%
0
1
2
3
4
kg
Figure 31. Interannual change in the proportion (based on numbers of individuals) of females in retained catch (solid squares), proportion of undersize in catch (hollow diamonds), and mean weight (heavy line) for both the east coast (Assessment Areas 1-4) and west coast (Assessment Areas 5-8).
4. Catch Rate Standardisation
Summarised below is a component of a report on the standardisation of catch rates for the giant crab fishery. This work was conducted as part of an FRDC funded project (2001/042) entitled “Development of the tools for long term management of the giant crab resource: data collection methodology, stock assessment and harvest strategy evaluation”.
4.1 Summary
• After standardisation, catch rates continue to exhibit a marked decline on the west coast. This is of especial concern given that the TAC was not reached in the fishery in 2002/2003.
• Both the bimonthly and yearly standardisations for the west coast show a severe downward trend in catch rates since the introduction of the management plan, although the details of the trends are different.
• The bimonthly analysis for the west coast provides a better representation of the stock status than the yearly analysis. Due to the varied history of fishing over the last eight years, the yearly analysis amalgamates different sets of months for some of the years, making comparisons between whole years less reliable.
• Catch rates on the east coast have remained stable since the first full year of quota was taken in 2000/2001.
4.2 Methods
Before commencing the analysis it was necessary to correct for errors and confusions in the database because some operators and vessels had been allocated multiple identification numbers. The corrected data were analysed using Generalised Linear Models (GLMs) in order to determine the best statistical description (prediction) of catch-rates in terms of the various factors available such as effort, vessel, etc. Models
TAFI Fishery Assessment Report Page 29

Giant Crab Fishery Assessment: 2002/03
were fitted to provide estimates of standardised catch rates both by quota year and bimonthly, separately for the east and west coast. It was necessary to pool data from pairs of consecutive months because the number of observations per month was often too few to obtain workable or valid results. Starting with the first two months of the quota year March was pooled with April, May with June and so on. For the east coast analysis, the period from the beginning of July until the end of October was excluded due to a lack of data in these months. On the west coast, the months of September and October were excluded. Additionally any two monthly period having fewer than ten observations was excluded from the analysis. The same dataset was used for both the yearly and bimonthly analyses so as to provide comparability between the yearly and bimonthly analyses. In all instances, the statistical package R 1.7.0 was used to generate the GLMs from which standardisations were derived. In the model the standardised catch rates are the coefficients for the quota years in the yearly analysis and the year*bimonth interaction terms in the bimonthly analysis. All standardised catch rates are relative to the 1995/1996 quota year in the yearly analysis and to the March/April 1995 year*bimonth interaction in the bimonthly analysis. All factors were treated as dummy variables except for depth, which was modelled as continuous; this analysis is a fixed-effects linear model.
4.3 Results
4.3.1 East Coast Fishery Bimonthly Analysis
The optimal bimonthly model for the east coast was determined to be:
Ln(CPUE) = Const + Year*Bimonth + Block + Traps + Depth + Vessel + Block*Vessel + Skipper + Block*Traps,
where factors in the model, except for depth, were treated as dummy variables. There was relatively little difference between the simple geometric means and the best fitting model (Figure 32). Catch rates dropped after the management plan was introduced in November 1999 but appear to have stabilized since then.
TAFI Fishery Assessment Report Page 30
Giant Crab Fishery Assessment: 2002/03
0
0.2
0.4
0.6
0.8
1
1.2
Mar
/Apr
-199
5Ju
l/Aug
-199
5N
ov/D
ec-1
995
Mar
/Apr
-199
6Ju
l/Aug
-199
6N
ov/D
ec-1
996
Mar
/Apr
-199
7Ju
l/Aug
-199
7N
ov/D
ec-1
997
Mar
/Apr
-199
8Ju
l/Aug
-199
8N
ov/D
ec-1
998
Mar
/Apr
-199
9Ju
l/Aug
-199
9N
ov/D
ec-1
999
Mar
/Apr
-200
0Ju
l/Aug
-200
0N
ov/D
ec-2
000
Mar
/Apr
-200
1Ju
l/Aug
-200
1N
ov/D
ec-2
001
Mar
/Apr
-200
2Ju
l/Aug
-200
2N
ov/D
ec-2
002
Stan
dard
ized
CPU
E
Model 8
Model 1
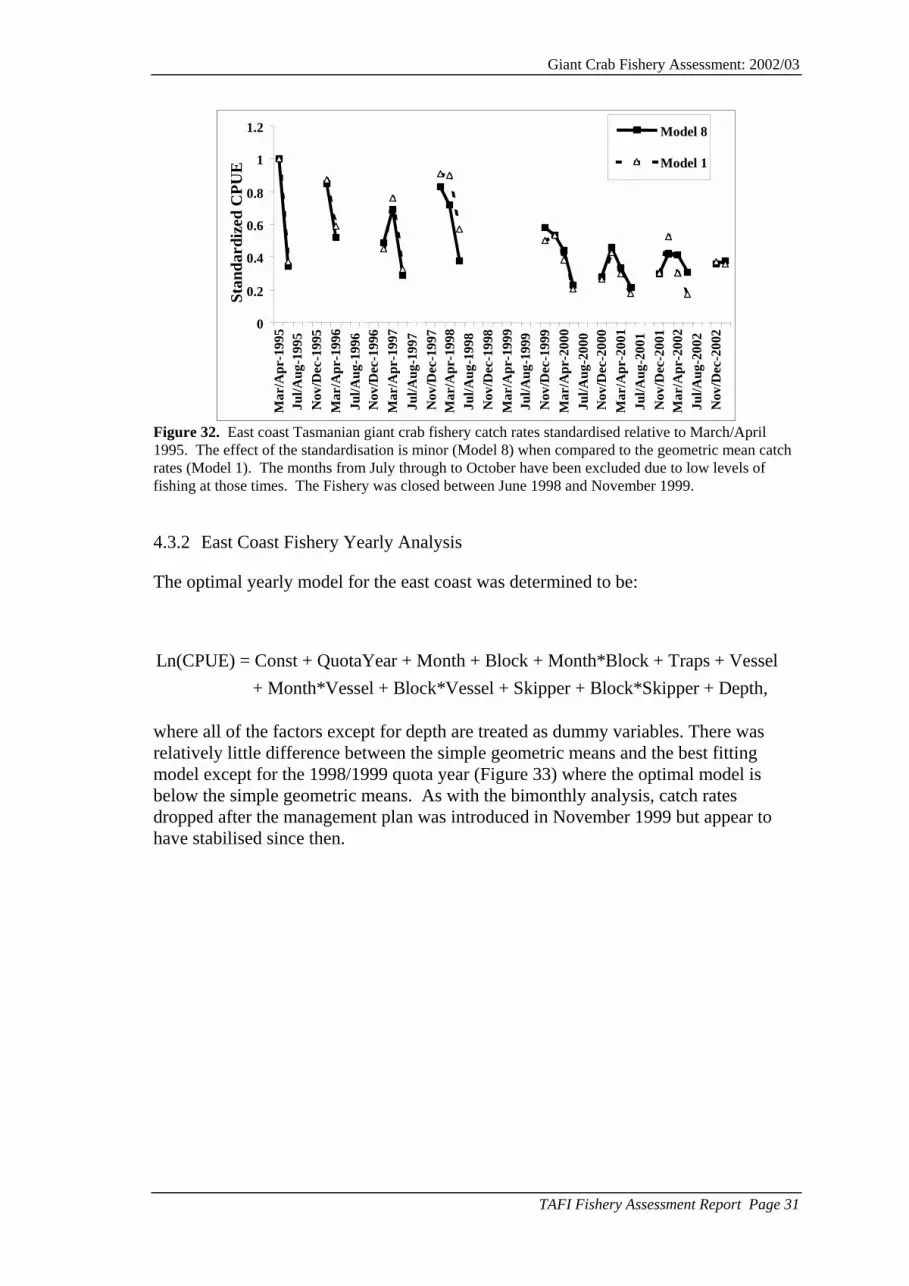
Figure 32. East coast Tasmanian giant crab fishery catch rates standardised relative to March/April 1995. The effect of the standardisation is minor (Model 8) when compared to the geometric mean catch rates (Model 1). The months from July through to October have been excluded due to low levels of fishing at those times. The Fishery was closed between June 1998 and November 1999.
4.3.2 East Coast Fishery Yearly Analysis
The optimal yearly model for the east coast was determined to be:
Ln(CPUE) = Const + QuotaYear + Month + Block + Month*Block + Traps + Vessel + Month*Vessel + Block*Vessel + Skipper + Block*Skipper + Depth,
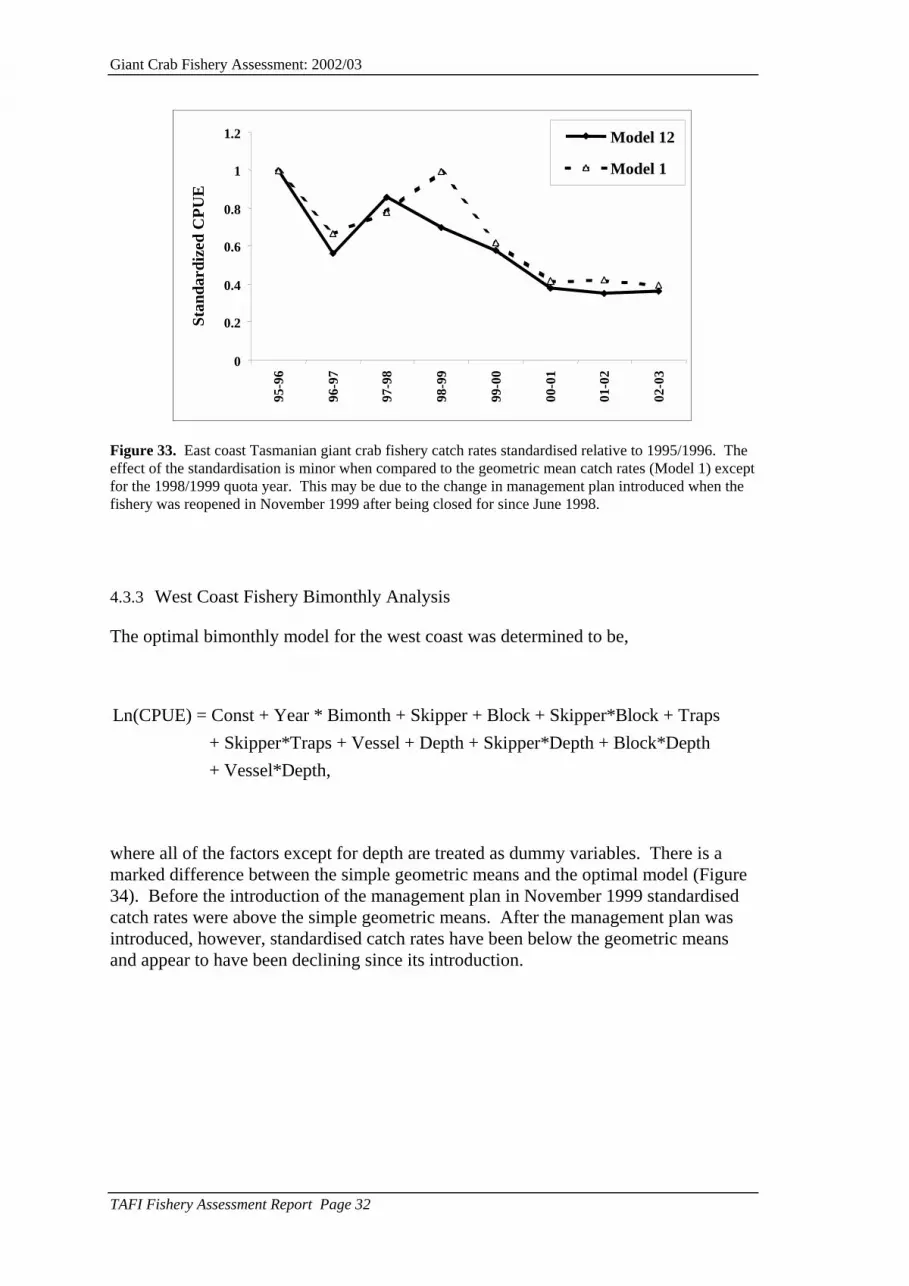
where all of the factors except for depth are treated as dummy variables. There was relatively little difference between the simple geometric means and the best fitting model except for the 1998/1999 quota year (Figure 33) where the optimal model is below the simple geometric means. As with the bimonthly analysis, catch rates dropped after the management plan was introduced in November 1999 but appear to have stabilised since then.
TAFI Fishery Assessment Report Page 31
Giant Crab Fishery Assessment: 2002/03
0
0.2
0.4
0.6
0.8
1
1.2
95-9
6
96-9
7
97-9
8
98-9
9
99-0
0
00-0
1
01-0
2
02-0
3
Stan
dard
ized
CPU
E
Model 12
Model 1
0
0.2
0.4
0.6
0.8
1
1.2
95-9
6
96-9
7
97-9
8
98-9
9
99-0
0
00-0
1
01-0
2
02-0
3
Stan
dard
ized
CPU
E
Model 12
Model 1
Figure 33. East coast Tasmanian giant crab fishery catch rates standardised relative to 1995/1996. The effect of the standardisation is minor when compared to the geometric mean catch rates (Model 1) except for the 1998/1999 quota year. This may be due to the change in management plan introduced when the fishery was reopened in November 1999 after being closed for since June 1998.
4.3.3 West Coast Fishery Bimonthly Analysis
The optimal bimonthly model for the west coast was determined to be,
Ln(CPUE) = Const + Year * Bimonth + Skipper + Block + Skipper*Block + Traps + Skipper*Traps + Vessel + Depth + Skipper*Depth + Block*Depth + Vessel*Depth,
where all of the factors except for depth are treated as dummy variables. There is a marked difference between the simple geometric means and the optimal model (Figure 34). Before the introduction of the management plan in November 1999 standardised catch rates were above the simple geometric means. After the management plan was introduced, however, standardised catch rates have been below the geometric means and appear to have been declining since its introduction.
TAFI Fishery Assessment Report Page 32

Giant Crab Fishery Assessment: 2002/03
0
0.5
1
1.5
2
2.5
3
3.5
Mar
/Apr
-199
5Ju
l/Aug
-199
5N
ov/D
ec-1
995
Mar
/Apr
-199
6Ju
l/Aug
-199
6N
ov/D
ec-1
996
Mar
/Apr
-199
7Ju
l/Aug
-199
7N
ov/D
ec-1
997
Mar
/Apr
-199
8Ju
l/Aug
-199
8N
ov/D
ec-1
998
Mar
/Apr
-199
9Ju
l/Aug
-199
9N
ov/D
ec-1
999
Mar
/Apr
-200
0Ju
l/Aug
-200
0N
ov/D
ec-2
000
Mar
/Apr
-200
1Ju
l/Aug
-200
1N
ov/D
ec-2
001
Mar
/Apr
-200
2Ju
l/Aug
-200
2N
ov/D
ec-2
002
Stan
dard
ized
CPU
E
Model 11
Model 1
Figure 34. West coast fishery catch rates standardised relative to March/April 1995. Once the quota system is in place (after November 1999) the effect of the standardisation is reversed relative to the geometric mean catch rates (Model 1). The months September and October have been excluded due to low levels of fishing at those times.
4.3.4 West Coast Yearly Analysis
The optimal yearly model for the west coast was determined to be,
Ln(CPUE) = Const + Quota Year + Skipper + Month + Skipper*Month + Traps + Skipper*Traps + Month*Traps + Block + Month*Block + Skipper*Block
where all of the factors except for depth are treated as dummy variables. There were marked differences between the simple geometric means and the optimal model (Figure 35) where the optimal model tends to be below the simple geometric means. Catch rates peaked in 1999/2000 and have been declining sharply since then. It should be noted that in the bimonthly analysis, the standardised catch rates were above the simple geometric means before the introduction of the management plan in November 1999 and below them after the management plans introduction. In the yearly model the reverse is true, the standardised catch rates are below the geometric means before the management plan and above the geometric means after the management plan was introduced. However, both the simple geometric means and the standardised catch rates are declining steeply.
Owing to the history of the fishery, the yearly analysis combines different arrays of months during which fishing occurred (Figure 34). This implies that the fishing behaviours and fishery responses being compared by the statistical analysis are different in important ways. Of the bimonthly and yearly analyses, the bimonthly must be preferred as being a closer representation of the dynamics of the fishery.
TAFI Fishery Assessment Report Page 33

Giant Crab Fishery Assessment: 2002/03
0
0.5
1
1.5
2
2.5
95-9
6
96-9
7
97-9
8
98-9
9
99-0
0
00-0
1
01-0
2
02-0
3
Stan
dard
ized
CPU
EModel 10
Model 1
0
0.5
1
1.5
2
2.5
95-9
6
96-9
7
97-9
8
98-9
9
99-0
0
00-0
1
01-0
2
02-0
3
Stan
dard
ized
CPU
EModel 10
Model 1
Figure 35. West coast fishery catch rates standardised relative to the 1995/1996 quota year. The effect of the standardisation is distinct when compared to the simple geometric means represented by Model 1. The months of September and October have been excluded due to low levels of fishing at those times, as has any two month period with fewer than 10 records.
5. Acknowledgments
Data on catch of crabs by SEF trawlers was supplied by John Garvey (AFMA) and advice with standardisation was provided by Assoc. Prof. Malcolm Haddon. Aspects of this report were drawn from research conducted through funding support from the Fisheries Research Development Corporation. Prof Colin Buxton is thanked for his comments on the draft report.
6. References
Gardner, C., Bermudes, M. and Mackinnon, C. (2003). Tasmanian Giant Crab Fishery 2001/02. Tasmanian Aquaculture and Fisheries Assessment Report. Tasmania, Australia. 41p
Gardner, C. and Mackinnon, C. (2002). Tasmanian Giant Crab Fishery 2000/01. Tasmanian Aquaculture and Fisheries Assessment Report. Tasmania, Australia. 26p
Levings, A., Mitchell, B. D., McGarvey, R., Mathews, J., Laurenson, L., Austin, C., Heeren, T., Murphy, N., Miller, A., Rowsell, M. and Jones, P. (2001). Fisheries biology of the giant crab (Pseudocarcinus gigas). Final report to the Fisheries Research and Development Corporation, 93/220 and 97/132.
McGarvey, R., Matthews, J. M. and Levings, A. H. (1999). Yield-, Value-, and Egg-per-recruit of Giant Crab, Pseudocarcinus gigas. South Australian Research and Development Institute Report.
TAFI Fishery Assessment Report Page 34

Giant Crab Fishery Assessment: 2002/03
TAFI Fishery Assessment Report Page 35
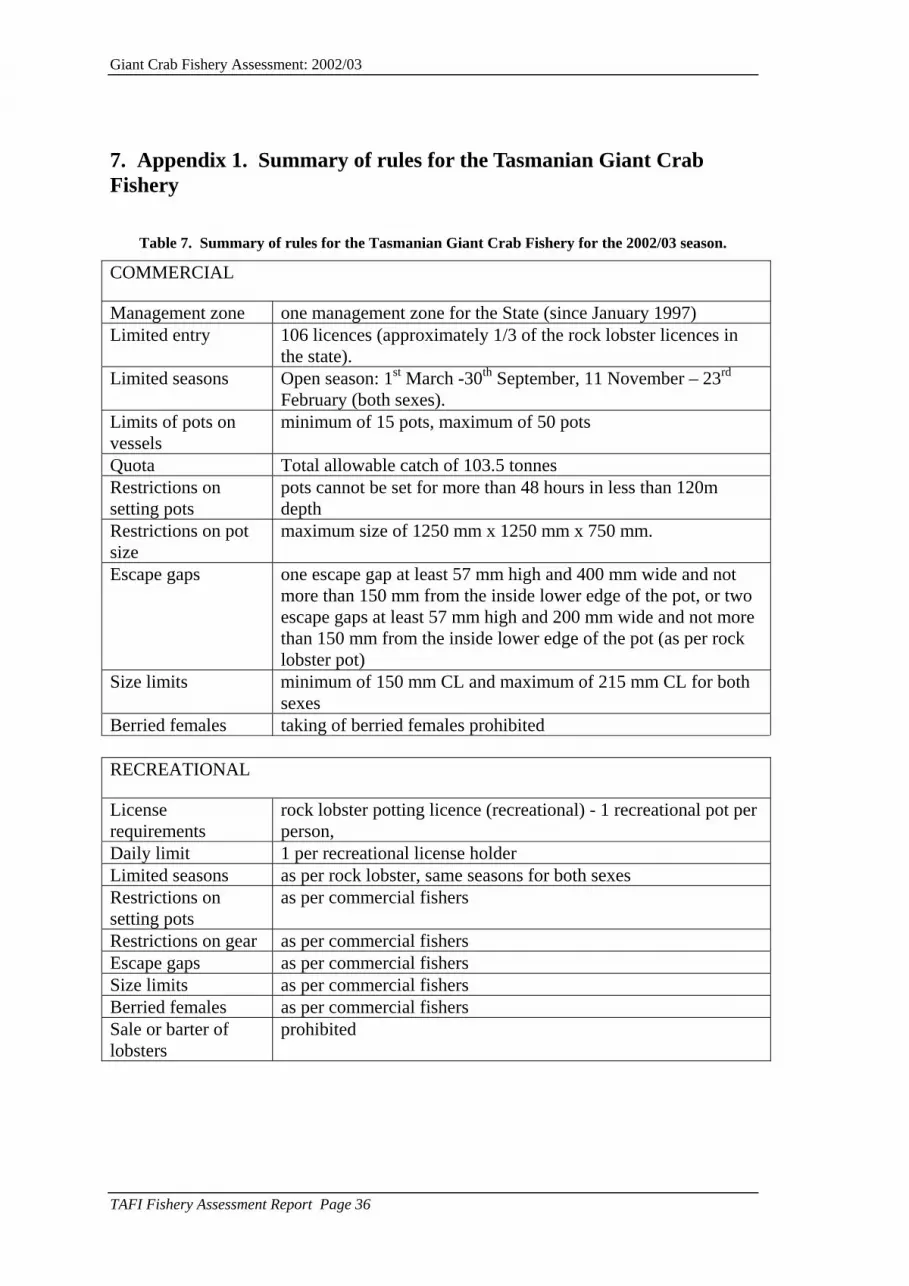
Giant Crab Fishery Assessment: 2002/03
7. Appendix 1. Summary of rules for the Tasmanian Giant Crab Fishery
Table 7. Summary of rules for the Tasmanian Giant Crab Fishery for the 2002/03 season.
COMMERCIAL
Management zone one management zone for the State (since January 1997) Limited entry 106 licences (approximately 1/3 of the rock lobster licences in
the state). Limited seasons Open season: 1st March -30th September, 11 November – 23rd
February (both sexes). Limits of pots on vessels
minimum of 15 pots, maximum of 50 pots
Quota Total allowable catch of 103.5 tonnes Restrictions on setting pots
pots cannot be set for more than 48 hours in less than 120m depth
Restrictions on pot size
maximum size of 1250 mm x 1250 mm x 750 mm.
Escape gaps one escape gap at least 57 mm high and 400 mm wide and not more than 150 mm from the inside lower edge of the pot, or two escape gaps at least 57 mm high and 200 mm wide and not more than 150 mm from the inside lower edge of the pot (as per rock lobster pot)
Size limits minimum of 150 mm CL and maximum of 215 mm CL for both sexes
Berried females taking of berried females prohibited RECREATIONAL
License requirements
rock lobster potting licence (recreational) - 1 recreational pot per person,
Daily limit 1 per recreational license holder Limited seasons as per rock lobster, same seasons for both sexes Restrictions on setting pots
as per commercial fishers
Restrictions on gear as per commercial fishers Escape gaps as per commercial fishers Size limits as per commercial fishers Berried females as per commercial fishers Sale or barter of lobsters
prohibited
TAFI Fishery Assessment Report Page 36


