Embed Size (px)
Citation preview

Behavioral/Systems/Cognitive
Taste-Guided Decisions Differentially Engage NeuronalEnsembles across Gustatory Cortices
Christopher J. MacDonald,1 Warren H. Meck,1 Sidney A. Simon,2,3,4 and Miguel A. L. Nicolelis1,2,3,4,5
1Department of Psychology and Neuroscience, 2Center for Neuroengineering, and 3Department of Biomedical Engineering, Duke University, Durham,North Carolina 27708, 4Department of Neurobiology, Duke University Medical Center, Durham, North Carolina 27710, and 5Edmond and Lily SafraInternational Institute of Neuroscience of Natal, Natal RN, 59066-060 Brazil
Much remains to be understood about the differential contributions from primary and secondary sensory cortices to sensory-guideddecision making. To address this issue we simultaneously recorded activity from neuronal ensembles in primary [gustatory cortex GC)]and secondary gustatory [orbitofrontal cortex (OFC)] cortices while rats made a taste-guided decision between two response alternatives.We found that before animals commenced a response guided by a tastant cue, GC ensembles contained more information than OFC aboutthe response alternative about to be selected. Thereafter, while the animal’s response was underway, the response-selective informationin ensembles from both regions increased, albeit to a greater degree in OFC. In GC, this increase depends on a representation of the tastecue guiding the animal‘s response. The increase in the OFC also depends on the taste cue guiding and other features of the response suchas its spatiomotor properties and the behavioral context under which it is executed. Each of these latter features is encoded by differentensembles of OFC neurons that are recruited at specific times throughout the response selection process. These results indicate thatduring a taste-guided decision task both primary and secondary gustatory cortices dynamically encode different types of information.
IntroductionAdaptive decision-making requires processing information pro-vided by sensory cues to guide the selection of a behavioral re-sponse and obtain a desired outcome. Typically, this responseselection process is conceptualized as an interaction between pri-mary sensory and motor areas, which interface through higher-order brain regions (Shadlen and Newsome, 1996; Glimcher,2001; Schall, 2003). One such higher-order region is the orbito-frontal cortex (OFC), a cortical region that has been the focus ofmuch inquiry (Schultz, 2004; O’Doherty, 2007; Wallis, 2007).The OFC is a functionally heterogeneous structure and its con-nectivity to other brain areas gives it access to a wide range ofdisparate information types that must be integrated to optimizeresponse selection. In this regard, the OFC has strong connec-tions with limbic structures (Shi and Cassell, 1998; Price, 2007),through which it receives input regarding incentive value andspatial information that can guide the animal behavioral re-sponse selection process. OFC neurons have also been found torespond following the execution of sensory-guided tasks withreference to both the incentive value assigned to the availableoutcomes as well as their spatiomotor properties (Schoenbaum etal., 1998; Feierstein et al., 2006).
With regard to taste-guided behavior, the OFC receives directinputs from the primary gustatory cortex (GC) (Shi and Cassell,
1998; Price, 2007), which have led to proposals that the OFCfunctions, at least in part, as a secondary taste cortex (Rolls,2004). However, the precise contribution of the GC and OFC tothe process of animal behavioral response selection is not wellunderstood. In particular, it is unclear to what extent the response-selective properties of neuronal populations in GC compare withthose observed in OFC. To address this issue, we simultaneouslyrecorded neuronal ensembles from GC and OFC in rats trainedon a taste-cued two-alternative forced choice task (2-AFC).Under this design, all neurons recorded from both regions aresubjected to the same overt behaviors of the animal thereby facil-itating between-region comparisons. We tested the hypothesisthat neuronal ensembles in GC act in concert with those in OFCto guide and monitor taste-guided decision-making. To ourknowledge, these experiments constitute the first within-subjectdirect comparison between ensemble neuronal responses fromprimary (GC) and secondary (OFC) sensory cortical neuronsduring a sensory-guided decision-making task.
Materials and MethodsSubjects and behavioral procedure. Five adult male Long–Evans rats weresubjected to a daily 23.5 h water deprivation schedule. Rats were given 15min access to water 30 min after the end of the task. All protocols wereapproved by the Duke University Institutional Animal Care and UseCommittee.
Behavioral testing was performed in a standard operant chamber(MED-PC, MED Associates). Three recessed panels were positionedfrom left to right on the front wall at the same height. Each recessed panelhad a small hole in the middle, through which the rat could gain access toa lick spout. Each panel was equipped with two photodiodes and photo-transistors; one to detect head entry into the recess and another to detectthe rat’s tongue contacting the lick spout. Several concealed tubes could
Received Feb. 24, 2009; revised May 15, 2009; accepted Aug. 3, 2009.This work was supported in part by National Institutes of Health Grant DC-01065. We thank Dr. Ivan de Araujo for
his comments and Jim Meloy and Gary Lehew for their technical expertise.Correspondence should be addressed to Christopher J. MacDonald, Center for Memory and Brain, 2 Cummington
St., Boston, MA 02215. E-mail: [email protected]:10.1523/JNEUROSCI.1033-09.2009
Copyright © 2009 Society for Neuroscience 0270-6474/09/2911271-12$15.00/0
The Journal of Neuroscience, September 9, 2009 • 29(36):11271–11282 • 11271

deliver multiple tastants to any of the threelick-spouts, which were delivered by openingsolenoid valves for 20 ms when the photobeamwas interrupted. The tubes were interfacedwith an air-tank in which pressure was adjustedto deliver 20 �l of tastant per valve opening.
Thirsty rats were tested on a taste-related2-AFC task. The rats were trained so that theconcentration of NaCl (i.e., its intensity) pre-sented during a trial, reliably cued which of tworesponse alternatives should be selected to ob-tain the water reward. A trial started when 20�l of NaCl solution was delivered after each oftwo successive licks on the central lick spout(the Sample spout) (Fig. 1a). The two aliquotsof NaCl delivered during the trial were alwaysof the same concentration. The NaCl concen-tration that was delivered during the trial waspseudorandomly chosen from one of four con-centrations (30, 47, 76, and 120 mM NaCl) thatwere approximately equally spaced on a logscale. The lowest and highest concentrations(Low—30 mM NaCl; High—120 mM NaCl)were chosen because they are qualitatively sim-ilar to rats (i.e., “salty”), even though their in-tensities (“saltiness”) differ (Yamamoto et al.,1994). Also, NaCl does not activate trigeminalchemosensitive neurons over this concentra-tion range (Carstens et al., 1998).
After the second NaCl delivery during thetrial, the rat was free to make a choice responseby selecting one of the lick spouts positioned tothe left or right of the Sample spout. Thesespouts are referred to as Choice spouts (Fig.1a). Before selecting a Choice spout, all of therats made several additional licks on the Sam-ple spout even though no solution was deliv-ered. Consequently, we refer to these as “drylicks” (Fig. 1a). The Low NaCl concentrationreliably cued water availability on only oneChoice spout (Low response). For an individ-ual rat, the side (left or right) that was consid-ered a Low response was fixed across trainingand testing. Similarly, the High NaCl concen-tration reliably cued water availability on theother Choice spout (High response) and, asabove, was fixed across training and testing. Ifthe rat made its first lick on a correct Choicespout, the next trial could be started immedi-ately after a water reward was delivered (Fig.1a). If the rat made its first lick on an incorrect Choice spout, the trial wasaborted and it was given a 10 s timeout (e.g., a Low response following120 mM delivery and vice versa).
When an intermediate NaCl concentration (47 and 76 mM NaCl) wasdelivered during a trial, the rat was not rewarded for either a Low or Highresponse. Despite the absence of reward during these trials, rats never-theless made Low or High-responses; this was a product of the trainingprotocol that we designed and implemented (see supplemental Materialsand Methods). During these nonrewarded trials, response selection wasguided by how similar the intermediate NaCl value was to the Low andHigh NaCl concentration. In this way, the 47 mM NaCl concentrationresulted in a Low-response more often than a High-response. The oppo-site pattern was observed after 76 mM NaCl concentration was delivered(Fig. 1b). This 2-AFC task may also be considered a bisection procedure,which has been applied in psychology to both humans and nonhumansmany times before (Stevens, 1957; Fagot, 1963; Boakes, 1969; Penney etal., 2008). Here bisection procedures are used to quantify the relationshipbetween specific values of a sensory feature that is presented (e.g., con-centration) and the judgment of magnitude that is made thereafter (i.e.,
psychophysical scaling). To our knowledge, this is the first time a bisec-tion task has been adapted to the study of the chemical senses.
Electrodes, surgery, and histology. Recordings of extracellular activitywere obtained using custom-built double microelectrode-arrays. Eacharray was made from 16 moveable 35 �m diameter microwires that werearranged in a 4 � 4 design with �250 �m spacing between adjacentwires. In each rat, one array was implanted in the left hemisphere in OFC(3.0 mm anterior to bregma, 3.25 mm lateral to bregma, 3.50 mm ventralto the brain surface) and one in the left hemisphere of GC (1.2 mmanterior to bregma, 5.3 mm lateral to bregma, 3.80 mm ventral to thebrain surface). All rats were allowed 1 week to recover. After the session,the arrays were advanced in �125 �m increments. Recording wasstopped when the estimated position of the electrode bundle was consis-tent with passage beyond the region of interest. Using our knowledge ofthe number of turns made while lowering the arrays, we could estimatetheir more dorsal coordinates. The arrays that targeted the OFC weremainly confined to the lateral orbital area, whereas the arrays that tar-geted the GC monitored neurons from the ventral-most granular insularregion, the whole extent of the dysgranular insular region, and the dorsal-
Figure 1. Two-alternative forced choice task. a, An illustration of a trial. Licks on a particular spout are depicted as vertical ticks.Color-coded bars are placed over licks that are followed by solution delivery (red � NaCl, blue � water). RT and MT are indicatedby lines that mark their beginning and end and are aligned to the relevant trial events. The Epochs E0 –E3 and Baseline (B), eachbeing 500 ms, are highlighted in beige during the trial, and described in the text. The delivery of a particular cue (i.e., a single NaClconcentration) determines which choice response will most likely result in reward. b, This plot depicts the mean probability[P(“high”)], of the rat choosing the High choice spout as a function of NaCl concentration. c, A bar graph showing the relativeproportions of event-related neurons from E0 –E3 in GC (red) and OFC (blue). A black line that bridges two bars indicates asignificant difference ( p � 0.05; � 2 test) between the groups represented by each bar.
11272 • J. Neurosci., September 9, 2009 • 29(36):11271–11282 MacDonald et al. • Cortical Framework for Taste-Guided Decisions
most part of the agranular insular region (Shi and Cassell, 1998) (seesupplemental Fig. S1, available at www.jneurosci.org as supplementalmaterial). Neurons were sorted off-line by following standard methodsfrom this lab and have been described previously (Stapleton et al., 2006)(see supplemental Materials and Methods for additional details).
Behavioral measurements. For each rat, the probability of selecting aHigh response [P(“high”)] was calculated as a function of NaCl concen-tration. A one-way ANOVA was used to test the effect of concentrationon P(“high”). On each trial during a session we also measured the reac-tion time (RT). The RT was defined as the interval starting from the lickthat produces the second NaCl delivery during the trial to the final drylick on the Sample spout before the rat initiated a choice response (Fig.1a). A session’s RTs were sorted according to the rat selecting a Low orHigh response during a trial, and for each rat the mean RT was deter-mined as a function of this response selection during the session. We alsodetermined the number of licks following the final delivery of NaCl(post-NaCl licks) for each trial during a session. Like the RT measure-ment, the post-NaCl licks were sorted according to the rat’s responseselection. These data also permitted measurements of the movementtime (MT), which was defined as the time starting from the last dry lickon the Sample spout to the first lick on the Choice spout (Fig. 1a). Asession’s MTs were sorted according to whether the rat selected the Lowor High response during a trial and, for each rat, the mean MT wasdetermined as a function of response selection during the session.Finally, after the first NaCl delivery in the trial, we obtained the meanof the three subsequent interlick intervals (ILIs) for each trial andsession (Fig. 1c).
Classification of neurons with respect to Epochs. As presented in Figure1a, a trial was divided into five 500 ms long Epochs (B, and E0 –E3) whoseduration encompassed trial-relevant events. Epoch B is the baseline Ep-och and its end coincided with the first NaCl delivery, which also markedthe beginning of E0. Epoch E0 encompassed the two NaCl deliveries andsubsequent dry licks (to 500 ms). Epoch E1 is the 500 ms interval preced-ing the final dry lick on the Sample spout. After the rat’s termination ofthe lick sequence on the Sample spout, the rat moved toward one of theChoice spouts. The start of E2 was chosen to coincide with the final lickon the Sample spout; therefore E2 encompassed approximately the firsthalf of the movement toward a Choice spout (Fig. 1a). Altogether, thefinal lick on the Sample spout during the trial was straddled on each sideby E1 and E2 such that in real time these Epochs were contiguous. Finally,we defined E3 as the 500 ms interval preceding the first lick on the Choicespout. Therefore, E3 encompassed the last 500 ms interval before aChoice spout was selected.
For each of the E0 –E3 epochs, we made use of a two-sample Kolmog-orov–Smirnov test and made four comparisons to Epoch B. The null-hypothesis was that the trial-by-trial spike counts for Epoch B and theEpoch of interest (E0 –E3) came from the same distribution. Our � valuewas set at p � 0.05. If the E0 and B comparison yielded a statisticallysignificant result, we further assigned the neuron into one of two catego-ries: if the change from B to E0 was positive, the neuron was consideredE0EX, whereas a negative change resulted in an E0IN-neuron assignment.For E1–E3, only excitatory responses were considered. In this way, aneuron from one of these Epochs was considered event-related during anEpoch if it was classified as excitatory. Unclassified neurons during thesame Epoch were considered event-unrelated. Because a neuron could beassigned to more than one class, a neuron can be event-related in morethan one Epoch.
Constructing PSTHs and population PSTHs. PSTHs were made by us-ing custom scripts for Matlab (MathWorks) or purchased software(Neuroexplorer, Plexon). A PSTH was determined for each neuron in apopulation of interest with reference to the start of the Epoch underconsideration. We used 20 ms time bins and smoothed the PSTH using abox-car filter of 3 bins. Subsequently, the mean PSTH across the wholepopulation could be determined. The population PSTH was normalizedso that the minimum activity during the time of interest is set to 1.0. Inaddition, we determined 99% confidence intervals for each point thatmakes up the population PSTH.
Calculating the ensemble discrimination index for GC and OFC during asession. We determined the firing rate for a neuron during an Epoch of
interest (E0 –E3) and with reference to response selection (Low or Highresponse). The neuron’s firing rate during the Epoch was expressed as avector that was 25 elements long (500 ms), and each element representedthe firing rate during a 20 ms time bin. The neuron’s firing rate wasnormalized to the time bin with the highest firing rate across E0 –E3.
To assign an ensemble discrimination index (eDI) to a GC or OFCensemble during an experiment, all of the 25 element vectors (neuron)within a given region and Epoch were concatenated. However, only vec-tors associated with the same response selected (Low or High response)were concatenated. The result of this operation yielded two n � 25(where n � number of neurons from that region) element-long vec-tors— one for the Low response (ai—see equation below) and one for theHigh response (bi—see equation below). These vectors represent a spa-tiotemporal pattern of neuronal firing within a region that is associatedwith response selection during an Epoch of interest. The obtained vectorsfor each response selected—ai and bi—were compared with one anotherusing a variant of the Euclidean distance measure as described in thefollowing equation:
ensemble discriminative index (eDI) ���
i�1
N
�bi � ai�2
N
���b1 � a1�
2 � �b2 � a2�2 � � � � � �bN � aN�2
N
where N � total number of elements in one concatenated vector, whichis the same number in each condition. We divided by N because thenumber of neurons from each region during an experiment was notalways equal. In this case, the total number of elements contributing tothe sum of the squared differences would not be equal. Therefore, wenormalized the obtained value by the number of contributing elements.
Comparing the eDIs from GC and OFC across Epochs E1–E3. For eachexperiment and Epoch, the eDI was separately calculated for GC andOFC ensembles. We first conducted a three-way ANOVA with repeatedmeasures on factor Concentration, Epoch, and Region. There was nomain effect of Concentration (F(3,51) � 1.51, p � 0.22) on eDI but therewas an effect of Epoch (F(3,51) � 32.0, p � 0.001) and Region (F(1,17) �12.32, p � 0.001) on the eDI. The interaction between Epoch and Regionwas significant (F(3,51) � 6.61, p � 0.001) but no other interactions weresignificant (all other F values �1, all p values �0.46). The results fromthis analysis prompted us to pool all of trials together only as a function ofresponse selection and regardless of the NaCl concentration. Moreover,the lack of any reliable effect of NaCl concentration on the eDI alsoindicates that the measure is not influenced by whether the NaCl is or isnot rewarded.
Comparing the eDI for event-related and event-unrelated neurons. Foreach experiment and Epoch, GC and OFC neurons were divided intoevent-related and event-unrelated. For example, in E0 one subpopu-lation consisted of E0-neurons (i.e., event-related during E0) and theremaining subpopulation was composed of neurons that were E0-unrelated (i.e., event-unrelated during E0). Using the methods describedabove, for each experiment and Epoch, we calculated an eDI for ensem-bles of neurons composed only of event-related and event-unrelatedneurons.
Comparing the eDI change during the Post-Cue period to the eDI duringthe Post-Choice period. In this analysis, we compared the eDI obtainedfrom E1, E2 and E3 to three Epochs called C1, C2 and C3 that define threedifferent 500 ms time-periods during a trial. The C1–C3 Epochs areshown (see Fig. 7, top) as is their relation to E1–E3. The C1–C3 Epochsencompass the time when a rat terminates licking on one of the Choicespouts, then initiates a lateral movement (i.e., to its left or right) to theSample spout to start a new trial. The end of C1 marks the final dry lick onthe Choice spout. The beginning of C2 is placed at the final dry lick on theChoice spout, so that in real time C1 and C2 are contiguous. Finally, theend of C3 is placed at the first dry lick on the Sample spout made afterterminating its response on the Choice spout. As above, each neuron’sfiring rate was normalized to the bin with the highest firing rate acrossE1–E3 and C1–C3 to make the 25 element vectors.
MacDonald et al. • Cortical Framework for Taste-Guided Decisions J. Neurosci., September 9, 2009 • 29(36):11271–11282 • 11273

ResultsBehavioral performance during a taste-cueddecision-making taskTo obtain a water-reward, thirsty rats were trained to associate aparticular concentration of NaCl solution (delivered from a cen-trally positioned lick-spout) with the selection of one of two lat-erally positioned lick-spouts. The lowest concentration of NaCl(30 mM) was reliably associated with one response option (theLow response), whereas the highest concentration of NaCl (120mM) was reliably associated with the other response option (the
High response). Figure 1a displays the relevant sequence ofevents that constitute a trial, which consists of the sequence ofevents starting with the rat licking NaCl solutions from the cen-tral lick-spout (Sample spout) and finishing with its selection ofone of the lateral lick-spouts (Choice spout), after which a newtrial follows. Because a correct response depended on the ratscorrectly evaluating the intensity of NaCl solution, we first deter-mined the extent to which the NaCl concentration effectivelyguided response selection. We calculated the probability of ratsselecting the High response as a function of NaCl concentration
Figure 2. GC and OFC neurons show selective responses during trial-relevant Epochs. The raster plots and PSTHs of representative neurons from five neuron classes. A representative GC and OFCneuron from each class is shown with reference to the Baseline (B) and Epochs E0 –E3 as seen in Figure 1a and described in the text. The regions are separated by double black lines. Within eachregion, a neuron class is represented by a row and each column denotes the trial Epoch (B and E0 –E3) to which the PSTH is time-locked. The PSTHs reflect all trials in the session, regardless of responseselection.
11274 • J. Neurosci., September 9, 2009 • 29(36):11271–11282 MacDonald et al. • Cortical Framework for Taste-Guided Decisions

[P(“high”), Fig. 1b]. The P(“high”) increased monotonically withincreasing NaCl concentration and post hoc comparisons con-firmed that the values of P(“high”) differed from one another ateach NaCl concentration [Tukey’s honestly significant difference(HSD), all p values �0.02). These data show that, across rats, theanimal behavioral response selection was guided by the perceivedintensity of NaCl.
Our experimental design presupposed that the responseselection was uniquely determined by the NaCl concentration.Therefore, we determined whether other behavioral measuresincidental to the NaCl delivery covaried with response selec-tion. The mean interlick interval (ILI) during NaCl delivery (seeMaterials and Methods) did not change as a function of the rat’sresponse selection (0.148 � 0.005 s mean � SE; one-wayrepeated-measures ANOVA, F(1,4) � 1.56, p � 0.28). Therefore,after NaCl delivery the lick rate did not predict the animal’s be-havioral response selection. We also inquired as to whether re-sponse selection could be predicted by the RT (Fig. 1a)—i.e., thetime taken by the rat to initiate response selection following thedelivery of the second NaCl aliquot during the trial. There was nodifference in RT as a function of response selection (1.49 � 0.30 smean � SE; one-way repeated-measures ANOVA, F(1,4) � 1.05,
p � 0.36). We note that before initiating amovement toward one of the Choicespouts, rats reliably dry licked for an addi-tional �1.5 s on the Sample spout. Inother words, after the final second NaCldelivery they averaged nearly 10 addi-tional dry licks (mean � SE � 9.9 � 1.8;no main effect of response selection; one-way repeated-measures ANOVA, F(1,4) �0.53, p � 0.55). We also determinedwhether response selection varied as afunction of MT (Fig. 1a), defined as thetime taken by the rat to move from theSample spout and then make the first lickon the selected Choice spout. Once again,there was no significant effect of responseselection on MT (1.20 � 0.07 s mean �SE; one-way repeated-measures ANOVA,F(1,4) � 0.94, p � 0.39). Together, theseresults demonstrate that behavioral mea-sures incidental to NaCl cue deliverydid not differ as a function of responseselection.
GC and OFC neurons were responsiveto the different Epochs that composeda single trialA total of 337 distinct single neurons(nGC � 125; nOFC � 212) were recordedin 19 experimental sessions from 5 rats(mean � 4.20 per rat, SD � 2.78). Aunique set of neuronal units was obtainedeach session because each moveable arraywas independently lowered after an ex-periment (see Materials and Methods fordetails). To compare the neuronal re-sponses from GC and OFC with referenceto E0 –E3, we broadly defined five classesof neurons (E0EX, E0IN, E1, E2 and E3). Ifthe modulation of a neuron’s firing rateduring an Epoch was significantly differ-
ent from Baseline (depicted in Fig. 1a), it was considered “event-related” during that Epoch and “event-unrelated” if not. Overall,the OFC (69%, nOFC � 146) had significantly more event-relatedneurons than did the GC (58%, nGC � 72; � 2 test, p � 0.04).However, the proportion of event-related neurons found in bothGC and OFC was dependent on the Epoch (Fig. 1c) (discussed inmore detail below). We also observed oscillatory activity in manyneurons whose periodicity matched the licking frequency ob-served in the rat (�6 –7 Hz). Supplemental Figure S2a (availableat www.jneurosci.org as supplemental material) illustrates theresults of an analysis that shows that event-related neurons fromGC exhibited more oscillatory responses in the 6 –10 Hz (theta)range than those from the OFC population.
Figure 2 illustrates representative examples of neurons fromGC (left column) and OFC (right column) that were event-related across E0 –E3 (rows 1–5). In addition, we also provide inFigure 3 the population PSTHs for each class of event-relatedneuron from GC and OFC in reference to the Epoch under con-sideration. Two classes of event-related neurons during E0 wereidentified depending on whether the response to NaCl was exci-tatory (E0EX) (Fig. 2, row 1) or inhibitory (E0IN) (Fig. 2, row 2). Inboth classes, the response to NaCl was rapid given that maximum
Figure 3. Event-related neurons in GC and OFC. a, Population PSTH (mean � 99% confidence interval) for E0EX-neurons fromGC (red) and OFC (blue) referenced to the start of E0. b, Population PSTH for E0IN-neurons from GC (red) and OFC (blue) referencedto the start of E0. c, Population PSTH for E1 neurons from GC (red) and OFC (blue) referenced to the end of E1 and beginning of E2.d, Population PSTH for E2 neurons from GC (red) and OFC (blue) referenced to the end of E1 and beginning of E2. e, Population PSTHfor E3 neurons from GC (red) and OFC (blue) referenced to the end of E3. In all panels data are presented as mean�99% confidenceinterval.
MacDonald et al. • Cortical Framework for Taste-Guided Decisions J. Neurosci., September 9, 2009 • 29(36):11271–11282 • 11275

excitation (E0EX) or inhibition (E0IN) wastypically reached by 250 ms (Fig. 3a,b). Asseen in Figure 1c, there were proportionallymore E0EX-neurons in GC (21%, nGC � 26)compared with OFC (13%, nOFC � 27; �2
test, p � 0.05), and there were moreE0IN-neurons in OFC (17%, nOFC � 35)than GC (8%, nGC � 10; �2 test, p � 0.001).Therefore, the E0-neurons differed betweenGC and OFC in reference to whether theNaCl cue was more likely to evoke rapid ex-citation or inhibition.
Figure 2 (row 3) depicts a representa-tive E1 response from both GC (left col-umn) and OFC (right column). Theseneurons are distinguished by a slower la-tency of response to NaCl and a peak ofactivity occurring just before the rat ter-minated dry licking on the Sample spout(Fig. 3c). There was a higher proportion ofE1 neurons in GC (26%, nGC � 33) com-pared with OFC (18%, nOFC � 36; � 2 test,p � 0.04) (Fig. 1c). Interestingly, the ac-tivity of E1 neurons in GC were stronglyoscillatory in the 6 –10 Hz range (Fig. 3c;supplemental Fig. S2a, available at www.jneurosci.org as supplemental material),and its important to note that these oscil-lations were not simply somatosensorybecause these cells were relatively inactivearound E0 and the oscillatory activity of-ten extended into E2 and E3 (see also sup-plemental Fig. S2b, available at www.jneurosci.org as supplemental material)during which the rats were not licking.
A representative E2 response from GCand OFC is shown in Figure 2 (row 4). TheE2 responses were generally observed toabruptly increase activity during the rat’sinitiation of a choice response (Fig. 3d).The GC (23%, nGC � 29) and OFC (25%,nOFC � 54) contained equivalent propor-tions of E2-type neurons (� 2 test, p �0.98) (Fig. 1a). Also shown in Figure 2(row 5) is a representative E3 responsefrom the GC (left column) and OFC (rightcolumn). In both regions, the E3 responsesramped up their activity during the choiceresponse but rapidly decreased their activity just before the first lickon the Choice spout (Fig. 3e). As seen in Figure 1c, the proportion ofE3 neurons was significantly higher in OFC (47%, nOFC � 100)compared with GC (20%, nGC � 25; �2 test, p � 0.001).
In our analysis we allowed for a neuron to be assigned to morethan one class. In the supplemental material (supplemental Fig.S3, available at www.jneurosci.org), we present tables of data thatdescribe the number (top) or proportion (bottom) of neurons forGC and OFC from one class that are also assigned to any of theother four remaining class. Altogether, these results support abroad distinction between GC and OFC neuronal responses. Spe-cifically, there are greater proportions of neurons from GC thatincrease their activity earlier in the trial, while the rat is evaluatingthe NaCl-cue and preparing to initiate a choice response (E0 –E1). Conversely, there a higher proportion of OFC neurons that
increase their activity just before rats select a response on the basisof the NaCl cue (E3). Nevertheless, it is important to note thatneurons in both regions can modulate their firing rate in distinctepochs of the task trial.
Ensemble response selectivity increases during responseexecution for both GC and OFC ensembles, but at differentratesAlthough the previous analysis reveals some interesting neuralresponses during the trial as well as some regional corticalspecializations, our principal aim was to compare GC andOFC neuronal ensembles with regard to response selection whilethe taste-guided decision process evolves. The following analyseswere based on measuring the spatiotemporal pattern of activityfrom GC and OFC neuronal ensembles during E0 –E3.
Figure 4. The ensemble discrimination index (eDI) reflects a neuronal population’s response selectivity. a, Two PSTHs (20 mstime bins) and associated raster plots are shown for a single OFC neuron under the Low response (left) and High response (right)selection condition. The PSTHs are referenced to the end of E3, which is highlighted in beige. The PSTH during E3 in each responseselection condition is converted into a column vector (activity vectors) reexpressing activity as a normalized value between 0 and1. Each column vector is directly compared using the equation depicted to generate an eDI value � 0.098. b, The same process asdescribed above is performed for a different OFC neuron with an eDI value � 0.019, indicating the response is more similar to thatthan the neuron’s response depicted in a.
11276 • J. Neurosci., September 9, 2009 • 29(36):11271–11282 MacDonald et al. • Cortical Framework for Taste-Guided Decisions

An example of this analysis is illustrated in Figure 4 (see Ma-terials and Methods for complete details). Figure 4a depicts anOFC neuron that responded during E3 to a much greater extentto a Low-choice response than to a High-choice response. Incomparison, Figure 4b illustrates a neuron that responded simi-larly to the Low and High-responses. Each PSTH and raster plotcorresponds to only those trials, regardless of NaCl concentra-tion, in which the rat selected the Low or High response. The E3segment from each Low- and High-response PSTH, which ishighlighted, is converted into a vector that was N-elements long(where N is the number of time bins in the Epoch) so that theneuron has associated with it two 1�N vectors (i.e., E3 activityvectors in Fig. 4a,b). We quantify the difference between the twovectors to yield an ensemble discriminative index (eDI) (see Ma-terials and Methods for calculation). The smaller degree of re-sponse selectivity of the neuron seen in Figure 4b compared withthe neuron shown in Figure 4a is reflected by a smaller eDI score.
From these two examples, it is easy to extrapolate from thesingle-neuron case to an ensemble with multiple neurons fromthe same brain region. For a given region (i.e., GC or OFC), theLow response vector derived from each neuron were concate-nated, resulting in a longer vector of r�N elements in length(where r is the number of neurons within a region). The sameprocedure was done to generate an r�N element-long High re-sponse vector. In this manner, the difference between each r�Nelement-long vector from the Low and High response can bequantified for a specific recording session. Note that each vectorrepresents the same ensemble under the Low and High responsecondition. The eDI quantifies the difference between the spatio-temporal patterns of neural activity observed for the Low- andHigh-choice ensemble. Thus, the greater the eDI value, thegreater the difference in ensemble activity during trials associatedwith Low versus High response selection. In this manner, forE0 –E3 and across sessions, we quantified the response selectionfrom GC and OFC ensembles.
In regard to decision-making, the neural activity correlatedwith behavioral response selectivity is typically assessed by firstrestricting one’s analysis to the period between sensory-stimuluspresentation and the initiation of the choice response (i.e., the RTperiod; Glimcher, 2001; Schall, 2003; Shadlen and Newsome,1996). Therefore, once the response selection is completed andthe animal is committed to the execution of the response, anychange in neural responses during E2 and E3 might be construedto arise at least in part from motor (i.e., movement) aspects of theresponse. To this point, we verified that the eDI does not correlatewith any incidental measures of motor behavior that may beuniquely associated with each choice response and could influ-ence the eDI. Specifically, there was no relationship between theeDI and either the ILIs for the final four licks on the Sample spoutor the MTs recorded during each session (supplemental Fig. S4,available at www.jneurosci.org as supplemental material).
Although a neuron may be active during an Epoch (i.e., event-related), this observation does not address the degree to whichthis activity differs depending on a behavioral response selection.Consequently, we also inquired whether event-related neuronswere more response selective than those that were event-unrelated. The separate calculation of eDIs for event-related andevent-unrelated neurons across Epochs E0 –E3 allowed for amore comprehensive description of response selectivity duringEpochs E0 –E3. The results from this analysis are discussed indetail within the supplemental material (supplemental Figs. S5,S6, available at www.jneurosci.org). Overall, these analyses con-firm that our earlier neuronal classification scheme (event-
related neurons) was useful beyond a heuristic standpoint, to theextent that in most cases the event-related neurons are moreresponse selective than event-unrelated neurons.
To complete these analyses, we determined the animal’sbehavioral response selectivity from GC and OFC ensemblesas a function of E0 –E3 by comparing the mean eDI for GCensembles to the mean eDI for OFC ensembles across sessions.A three-way ANOVA with repeated-measures on factor Ep-och, Region and Concentration revealed no main effect ofConcentration (F(3,51) � 1.51, p � 0.22) nor any other inter-actions having to do with Concentration (F values �1.0, p �0.46 for all interactions, except for a Epoch � Region, F(3,51) �6.61, p � 0.001; see Materials and Methods for more details). Forthese reasons, all of the data were pooled across concentrations. Atwo-way ANOVA with repeated-measures on factor Epoch andRegion was conducted on the eDIs. This analysis revealed a maineffect of Epoch (F(3,54) � 37.75, p � 0.001), but no effect ofRegion (F(1,18) � 2.86, p � 0.11). However, there was an interac-tion between Epoch and Region (F(3,54) � 7.29, p � 0.001) indi-cating that the difference in the eDI observed between eachregion depended on the Epoch. Post hoc comparisons (Tukey’sHSD) confirmed that the eDI differed between regions during E1( p � 0.005), but not during E0 ( p � 0.13), E2 ( p � 0.89) or E3( p � 0.33). Therefore, these results show that only in E1 was theeDI from GC greater than the eDI from OFC (Fig. 5a).
As seen in Figure 5b, in each region the eDIs changed acrossE0 –E3 albeit at different rates. To determine how the eDIschanged across Epochs, a post hoc contrast analysis was con-ducted on each region separately. We focused on E1–E3, whichrepresents the time during which the rat was terminating drylicking on the Sample spout (E1) as well as the execution of thechoice response (E2–E3). In both GC (F(1,18) � 12.3, p � 0.003)and OFC (F(1,18) � 107.5, p � 0.001), a linear effect of Epoch oneDI was obtained. Although the eDI increased linearly acrossE1–E3 in GC and OFC, the change was greater in OFC. To con-
Figure 5. The ensemble discrimination index (eDI) increases from E0 to E3. a, The eDI(mean � SEM) for E0 –E3 as a function of region. b, The eDI for E0 –E3 for data in a displayed asa line-plot to better illustrate the eDI increase across Epochs and regions.
MacDonald et al. • Cortical Framework for Taste-Guided Decisions J. Neurosci., September 9, 2009 • 29(36):11271–11282 • 11277

firm this, we compared the mean changein the eDI (eDI) across E1–E3 in GC andOFC and found that the eDI was signif-icantly greater in OFC compared with GC(meanGC � SE � 2.1 � 103 � 5.9 �104, meanOFC � SE � 5.9 � 103 �5.6 � 104; paired t test, t(18) � 4.23, p �0.001).
Overall, these results revealed that thespatiotemporal ensemble patterns ob-tained from neurons recorded in GC andOFC changed such that after NaCl deliv-ery their response selectivity increased atdifferent rates. Moreover, these resultsshow that during E1, GC ensembles weresignificantly more response selective thanthose from OFC. Note that the NaCl solu-tion was delivered only during the first60% (2 licks or �300 ms) of E0 (Fig. 1a)and �1.5 s (�10 dry licks) reliably passedbetween the last NaCl delivery and the fi-nal dry lick on the Sample spout duringthe trial (E1). This is important becausealthough the rat was freely licking on theSample spout during E1, no solution wasdelivered during this time and thus thegreater response selectivity during thisEpoch might reflect information regard-ing the forthcoming choice response.
In GC, but not OFC, the increase inresponse selectivity depends onwhether the choice response isguided by NaClEach choice response is a lateralizedmovement in different directions (e.g., tothe rat’s left or right), but with a commonstarting point at the Sample spout. Therefore, the spatial topog-raphy of the two choice responses (i.e., the spatiomotor proper-ties) diverges from start to finish. Accordingly, for each choiceresponse we initially asked whether the change in the eDI acrossE1–E3 could be accounted for by differences in each choice re-sponse’s spatiomotor properties. To determine whether this isthe case, we first defined a Post-Choice condition, which takesplace after the rat makes a response on the choice spout. ThisPost-Choice condition is composed of three new 500 ms Epochs(C1–C3). In particular, C1–C3 describes the time during whichthe rat prepares to terminate its response on the Choice spout andthen make a lateralized response (left or right) toward the Samplespout to start a new trial (Fig. 6a). Therefore, the rat’s behaviorsfrom a movement perspective are analogous during the E1–E3and C1–C3 Epochs. If the eDIs increase simply reflects the grow-ing difference between spatiomotor properties of each response,then the eDI during the C1–C3 Post-Choice condition shouldincrease to the same degree as that observed during E1–E3, or thePost-Cue condition (Fig. 6b).
Figure 7a shows the eDIs for GC neurons during both Post-Cue and Post-Choice conditions. A two-way ANOVA withrepeated-measures on factor Epoch (here we use Epoch to refer toE1–E3 and C1–C3) and Condition (Post-Cue or Post-Choice)revealed that the eDIs differed across Epochs (F(2,36) � 3.33, p �0.05) and between Conditions (F(1,18) � 5.23, p � 0.03). More-over, there was an interaction between Epoch and Condition
(F(2,36) � 6.04, p � 0.005), which indicates that the difference inthe eDIs between conditions depended on the Epoch. Post hoccomparisons (Tukey’s HSD) confirmed that the eDI differed be-tween conditions during E3 ( p � 0.02) but not during E1 ( p �0.87) or E2 ( p � 0.06). Under each condition we conducted aseparate contrast analysis on the eDI to determine, in each con-dition, whether it changed linearly across Epochs. Whereas theeDI increases linearly in the Post-Cue condition (F(1,18) � 20.22,p � 0.001), it did not increase in the Post-Choice condition(F(1,18) � 0.22, p � 0.64). This result is most clearly seen in Figure7b, which displays the same data from Figure 7a as a line-plot.Indeed, in the GC the mean change in the eDI across E1–E3 wasgreater than the mean change across C1–C3 (meanpost-cue � SE �2.4 � 103 � 5.4 � 104, meanpost-choice � SE � 0.3 � 103 �6.2 � 104; paired t test; t(18) � 3.54, p � 0.002). In fact, unlikethe changes observed during E1–E3 (single-sample t test, Ho:eDIE3 eDIE1 � 0; t(18) � 4.50, p � 0.001) there was no changeacross C1–C3 (single-sample t test, Ho: eDIC3 eDIC1 � 0; t(18) �0.47, p � 0.64).
For the OFC responses the mean eDI across the Post-Cue(E1–E3) and Post-Choice (C1–C3) conditions is illustrated inFigure 7c. Here the eDI differed across Epochs (F(2,36) � 34.84,p � 0.001) and between Conditions (F(1,18) � 11.10, p � 0.004).An interaction between Epoch and Condition was found (F(2,36) �7.52, p � 0.002), which indicates that the difference in the eDIsbetween conditions depends on the Epoch. During E3, post hoc
Figure 6. The laterally directed choice (E1–E3) responses are compared with the laterally directed responses that precede thestart of a trial (C1–C3). a, A continuation of the single trial depicted in Figure 1a, in relation to the rat’s movements after a waterreward is delivered. Licks on a particular spout are depicted as vertical ticks. Color-coded bars are placed over licks that are followedby solution delivery (blue � water). The C1–C3 time periods are highlighted in beige together with the E1–E3 time periods. Blacklines that connect the E1–C1, E2–C2 and E3–C3 time periods are considered to be analogous in regard to the type of behavior inwhich the rat is engaging. b, Depicts the left- and right-directed movement in egocentric space for the Post-Cue (left) andPost-Choice (right) condition.
11278 • J. Neurosci., September 9, 2009 • 29(36):11271–11282 MacDonald et al. • Cortical Framework for Taste-Guided Decisions
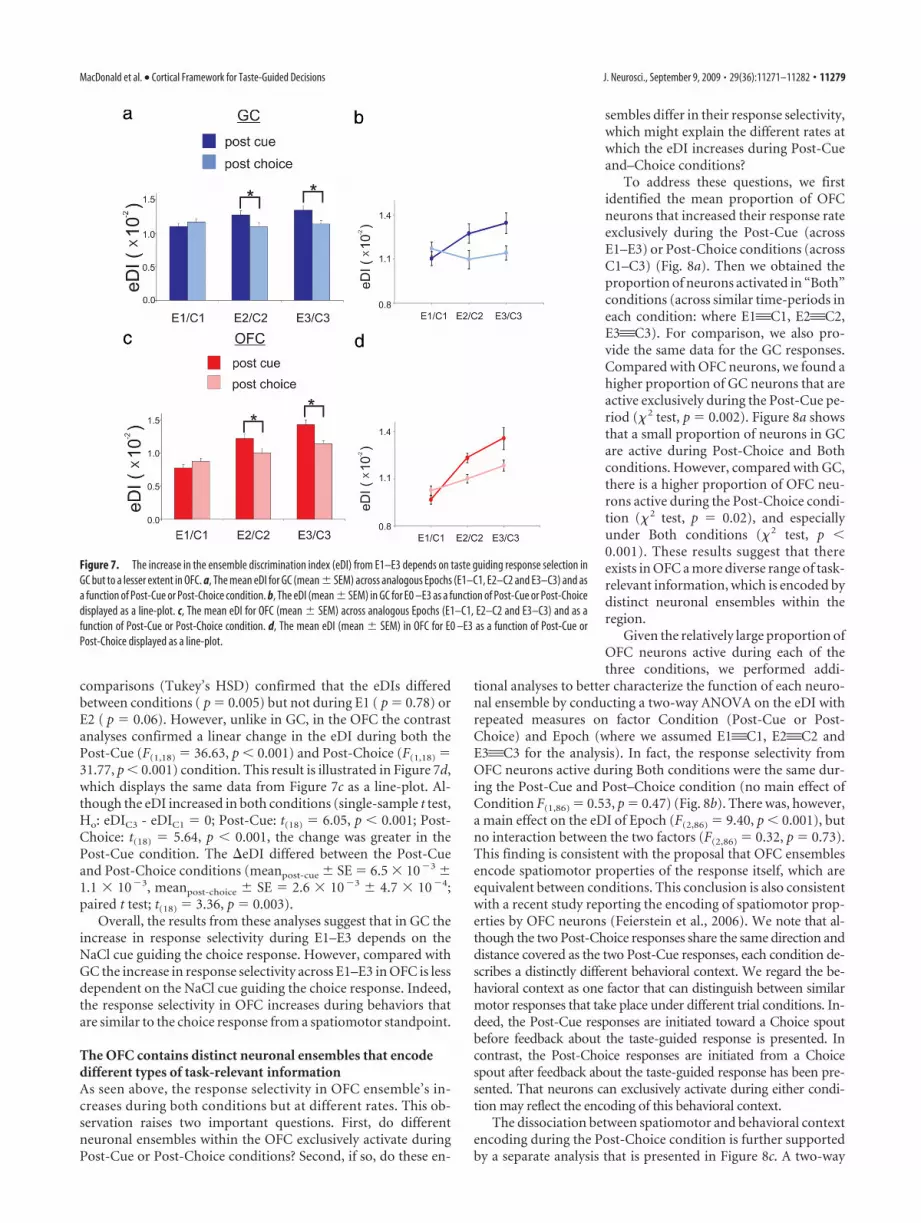
comparisons (Tukey’s HSD) confirmed that the eDIs differedbetween conditions ( p � 0.005) but not during E1 ( p � 0.78) orE2 ( p � 0.06). However, unlike in GC, in the OFC the contrastanalyses confirmed a linear change in the eDI during both thePost-Cue (F(1,18) � 36.63, p � 0.001) and Post-Choice (F(1,18) �31.77, p � 0.001) condition. This result is illustrated in Figure 7d,which displays the same data from Figure 7c as a line-plot. Al-though the eDI increased in both conditions (single-sample t test,Ho: eDIC3 - eDIC1 � 0; Post-Cue: t(18) � 6.05, p � 0.001; Post-Choice: t(18) � 5.64, p � 0.001, the change was greater in thePost-Cue condition. The eDI differed between the Post-Cueand Post-Choice conditions (meanpost-cue � SE � 6.5 � 103 �1.1 � 103, meanpost-choice � SE � 2.6 � 103 � 4.7 � 104;paired t test; t(18) � 3.36, p � 0.003).
Overall, the results from these analyses suggest that in GC theincrease in response selectivity during E1–E3 depends on theNaCl cue guiding the choice response. However, compared withGC the increase in response selectivity across E1–E3 in OFC is lessdependent on the NaCl cue guiding the choice response. Indeed,the response selectivity in OFC increases during behaviors thatare similar to the choice response from a spatiomotor standpoint.
The OFC contains distinct neuronal ensembles that encodedifferent types of task-relevant informationAs seen above, the response selectivity in OFC ensemble’s in-creases during both conditions but at different rates. This ob-servation raises two important questions. First, do differentneuronal ensembles within the OFC exclusively activate duringPost-Cue or Post-Choice conditions? Second, if so, do these en-
sembles differ in their response selectivity,which might explain the different rates atwhich the eDI increases during Post-Cueand–Choice conditions?
To address these questions, we firstidentified the mean proportion of OFCneurons that increased their response rateexclusively during the Post-Cue (acrossE1–E3) or Post-Choice conditions (acrossC1–C3) (Fig. 8a). Then we obtained theproportion of neurons activated in “Both”conditions (across similar time-periods ineach condition: where E1'C1, E2'C2,E3'C3). For comparison, we also pro-vide the same data for the GC responses.Compared with OFC neurons, we found ahigher proportion of GC neurons that areactive exclusively during the Post-Cue pe-riod (� 2 test, p � 0.002). Figure 8a showsthat a small proportion of neurons in GCare active during Post-Choice and Bothconditions. However, compared with GC,there is a higher proportion of OFC neu-rons active during the Post-Choice condi-tion (� 2 test, p � 0.02), and especiallyunder Both conditions (� 2 test, p �0.001). These results suggest that thereexists in OFC a more diverse range of task-relevant information, which is encoded bydistinct neuronal ensembles within theregion.
Given the relatively large proportion ofOFC neurons active during each of thethree conditions, we performed addi-
tional analyses to better characterize the function of each neuro-nal ensemble by conducting a two-way ANOVA on the eDI withrepeated measures on factor Condition (Post-Cue or Post-Choice) and Epoch (where we assumed E1'C1, E2'C2 andE3'C3 for the analysis). In fact, the response selectivity fromOFC neurons active during Both conditions were the same dur-ing the Post-Cue and Post–Choice condition (no main effect ofCondition F(1,86) � 0.53, p � 0.47) (Fig. 8b). There was, however,a main effect on the eDI of Epoch (F(2,86) � 9.40, p � 0.001), butno interaction between the two factors (F(2,86) � 0.32, p � 0.73).This finding is consistent with the proposal that OFC ensemblesencode spatiomotor properties of the response itself, which areequivalent between conditions. This conclusion is also consistentwith a recent study reporting the encoding of spatiomotor prop-erties by OFC neurons (Feierstein et al., 2006). We note that al-though the two Post-Choice responses share the same direction anddistance covered as the two Post-Cue responses, each condition de-scribes a distinctly different behavioral context. We regard the be-havioral context as one factor that can distinguish between similarmotor responses that take place under different trial conditions. In-deed, the Post-Cue responses are initiated toward a Choice spoutbefore feedback about the taste-guided response is presented. Incontrast, the Post-Choice responses are initiated from a Choicespout after feedback about the taste-guided response has been pre-sented. That neurons can exclusively activate during either condi-tion may reflect the encoding of this behavioral context.
The dissociation between spatiomotor and behavioral contextencoding during the Post-Choice condition is further supportedby a separate analysis that is presented in Figure 8c. A two-way
Figure 7. The increase in the ensemble discrimination index (eDI) from E1–E3 depends on taste guiding response selection inGC but to a lesser extent in OFC. a, The mean eDI for GC (mean � SEM) across analogous Epochs (E1–C1, E2–C2 and E3–C3) and asa function of Post-Cue or Post-Choice condition. b, The eDI (mean � SEM) in GC for E0 –E3 as a function of Post-Cue or Post-Choicedisplayed as a line-plot. c, The mean eDI for OFC (mean � SEM) across analogous Epochs (E1–C1, E2–C2 and E3–C3) and as afunction of Post-Cue or Post-Choice condition. d, The mean eDI (mean � SEM) in OFC for E0 –E3 as a function of Post-Cue orPost-Choice displayed as a line-plot.
MacDonald et al. • Cortical Framework for Taste-Guided Decisions J. Neurosci., September 9, 2009 • 29(36):11271–11282 • 11279

ANOVA was conducted with the eDIs using repeated measureson factors Condition (Both or Post-Choice neurons) and Epoch(where we assumed E1'C1, E2'C2 and E3'C3 for the analy-sis). Here it is shown that the response selectivity by OFCneurons exclusively active during the Post-Choice conditionsis higher than those neurons active during Both conditionsThere was also an effect of Epoch on the eDI during eachCondition (F(2,69) � 3.31, p � 0.04) but no interaction be-tween the two factors (F(2,69) � 0.06, p � 0.93).
These results suggest that across E1–E3, the increase in re-sponse selectivity by GC neuronal ensembles, but not those inOFC, depend almost exclusively on the NaCl cue that was pro-cessed �1.5 s earlier and guides the ongoing choice response. InOFC, two distinct ensembles encode response selectivity withreference to the behavioral context of a rat’s movement and athird encodes the spatiomotor properties of responses regardlessof behavioral context. A much larger proportion of these latterneuronal populations are recruited in OFC compared with GC.Together, the response selectivity in OFC increases more whilethe taste cue is used to select and guide a motor response com-pared with when the taste cue is not guiding behavior. However,the activity from different OFC ensembles appears sufficient toincrease response selectivity during motor responses that are ex-ecuted in the Post-Choice condition.
DiscussionIn this study, we simultaneously recorded neuronal ensemblesfrom the rat primary (GC) and secondary (OFC) cortices whilerats evaluated the intensity of NaCl cue to guide their selection ofa response. During this process, ensembles of GC and OFC neu-rons both exhibited similar and dynamic activity profiles (Figs. 1,2). However, our novel analysis allowed us to quantify and thusdirectly compare encoding by GC and OFC neuronal ensemblesfor the behavioral response selected by the rat. Importantly, ouranalyses also revealed how response selective encoding was influ-enced by certain task-relevant variables.
We found that within 500 ms of a NaCl-cue delivery (E0),neuronal ensembles from both GC and OFC were response selec-tive at comparable levels (Fig. 5a). As preference can increase as afunction of tastant concentration (i.e., intensity), the increase inOFC may reflect affective value of the stimulus, whereas in GC itmay reflect its perceived intensity (Small et al., 2003). However,in neither region did the ensembles exhibit an effect of concen-tration on response selectivity. This observation suggests that theeDI measure is more a reflection of the behavioral response se-lected rather than the sensory features being used to guide theprocess.
One major finding was that before response execution (E1),neuronal ensembles in GC differentiate the animal’s behavioralresponse selection better than neuronal ensembles in OFC (Fig.5a). During E1 the rats were licking without receiving any fluid,suggesting that they were using this time to make a decision. Weconsidered the possibility that during E1 the increased responseselectivity observed in GC arises from NaCl that remains on therat’s tongue after its delivery. However, the response selectivityand its change across E0 –E3 in GC and OFC did not depend onNaCl concentration. Nevertheless, we did not monitor whetherthe animal swallowed during this period (Weijnen et al., 1984;Travers and Jackson, 1992) although freely licking rats are ob-served to swallow regularly every 5– 8 licks (Weijnen, 1998). Thatrats dry lick �10 times before the end of E1 suggests that thelikelihood of NaCl remaining on the tongue the entire time ishighly unlikely.
If the GC’s greater response selectivity during E1 is not exclu-sively attributable to chemosensory information, what can ac-count for the difference between it and the OFC response? Oneexplanation is that the GC contributes more than the OFC to thetaste-guided response that is about to be selected (Fig. 4a). Herewe note that a higher proportion of GC neurons follow a late timecourse of responding to NaCl (Fig. 1c). These neurons respondedwhen dry licking began and peaked at the very end of the dry licksequence on the Sample spout. We also found that particularlyduring E1 (Fig. 3; supplemental Fig. S2a, available at www.jneurosci.org as supplemental material), event-related GC neu-rons were more oscillatory within the 6 –10 Hz (theta) range thanOFC neurons. Many other “natural” behaviors used to samplesensory stimuli take place in the 6 –10 Hz (theta) range such assniffing (Komisaruk, 1970; Macrides et al., 1982), whisking(Semba and Komisaruk, 1984; Nicolelis et al., 1995) and eyemovements during restrained but active exploration (Kemp andKaada, 1975). Because theta rhythm is hypothesized to contrib-ute to information transfer (Siapas et al., 2005) and sensorimotorintegration (Nicolelis et al., 1995; Bland and Oddie, 2001; Kay,2005; Bland et al., 2006) among brain structures, we speculatethat ongoing GC activity within the theta range facilitatestaste-related information transfer across brain regions toguide response selection. These findings further challenge a
Figure 8. The OFC contains three distinct neuronal ensembles that are differentiated bywhen they become active in relation to the Choice response. a, A bar graph showing the relativeproportions of neurons active in the Post-Cue (left), Post-Choice (center), or Both (right) condi-tions in GC (red) and OFC (blue). A black line that bridges two bars indicates a significantdifference ( p � 0.05; � 2 test) between the groups represented by each bar. b, The eDI(mean � SEM) for OFC Both neurons during the Post-Cue (light blue) or Post-Choice (dark blue)condition and as a function of Epoch (where we assumed E1'C1, E2'C2 and E3'C3 for theanalysis). c, The eDI (mean � SEM) for OFC Both neurons (light blue—see text) and OFCPost-Choice neurons (black—see text) only during the Post-Choice condition and expressed asa function of C1–C3.
11280 • J. Neurosci., September 9, 2009 • 29(36):11271–11282 MacDonald et al. • Cortical Framework for Taste-Guided Decisions

strict chemosensory interpretation of E1 response and support amore prominent role for rodent GC than OFC in response selec-tivity during this Epoch.
In light of our results, it is useful to consider an importantseries of experiments conducted with monkeys (Ifuku et al., 2002,2003, 2006). Their results indicated that lower order cortical re-gions (area G and orosensory regions of area 3) contribute moreto processing the basic chemosensory properties of the tasterather than response selection. In this way, response-selectiveinformation is thought to increase while gustatory informationascends the cortical taste hierarchy (Ogawa et al., 2005).
On the other hand, a recent report confirms a prominentcognitive role for the monkey’s GC in a task that makes largedemands on taste working memory (Lara et al., 2009). In thisexperiment, a comparable proportion of GC and OFC neuronsselectively encoded the representation of a specific taste that hadto be sustained over the course of a delay period so that a responsecould eventually be selected. In addition, an equivalent propor-tion of GC and OFC neurons encoded the behavioral responseselected.
Taking into account the obvious differences among the stud-ies (e.g., species, task, analyses), all of these results may be recon-ciled if GC function is particularly sensitive to demands formaintaining or retrieving a representation of a taste feature overtime (E1) to guide response selection. In our task, correct re-sponse selection requires that the NaCl intensity is accuratelyperceived during E0 and maintained until (or available by) theend of E1, which is �1.5 s later. Given that two licks (�300 ms) issufficient time for a trained rat to discriminate among qualities oftastants (Halpern and Tapper, 1971), the animals may use thisadditional time to select a response based on “within-quality”discrimination among NaCl intensities.
We believe our emphasis on GC’s role in taste-guided re-sponse selection is consistent with a long-standing proposal thatit is fundamental to acquisition and the normal expression oflearned behaviors that are cued by taste, as is the case with con-ditioned taste aversion (CTA—Braun et al., 1982; Kiefer et al.,1984; Braun, 1990). Indeed, both lesion (Lorden, 1976;Yamamoto et al., 1980; Braun et al., 1981; Kiefer et al., 1984;Braun, 1990) and imaging (Yasoshima and Yamamoto, 1998;Accolla and Carleton, 2008; Grossman et al., 2008) studies notonly confirm a role for the GC in CTA acquisition but also inretention (i.e., the expression of a CTA). Our results extend thesefindings outside the CTA context and show that neuronal ensem-ble activity in GC dynamically reflects the retention and expres-sion of a learned behavioral response that is selected because of ataste cue.
What is the nature of the increase in response selectivity byGC and OFC while the choice response is in progress?We showed that while the rat is making a taste-guided choiceresponse the spatiotemporal patterns of activity recorded fromneuronal ensembles in GC and OFC diverge (Fig. 5). This diver-gence depends on differential activation in GC and OFC by task-relevant variables, which are encoded while carrying out thetaste-guided response. During the taste-guided response, the in-crease in GC response selectivity depends on the taste-cue guid-ing the response (Fig. 7a,b). During the same time, the responseselectivity in OFC increased much faster than GC, although thiseffect is less dependent on taste per se than in GC (Fig. 7c,d). Incontrast, the OFC provides a “richer” representation of the taste-guided response. One population of OFC neurons activates sim-ilarly under two distinctly different behavioral contexts, which
likely reflects the encoding of spatiomotor information (Fig.8a,b). However, there are also OFC neurons that encode re-sponses that are similar from a spatiomotor perspective, but dif-fer in relation to whether feedback has been given about its choiceresponse (Fig. 8a,c). In this way, the OFC can disambiguate sim-ilar spatiomotor responses by means of task-relevant informa-tion. This finding is also consistent with a function in globallymonitoring goal-directed responses (Feierstein et al., 2006). In-deed, our results extend these conclusions by confirming an im-portant role for the OFC in responses selected by a taste cue.
A system’s level approach to sensory-guided behavior revealsneuronal population dynamics that differ between regionsThe sensory-guided decision and subsequent response made byan organism is in fact expressed as an organized sequence ofbehaviors that unfold over time. We emphasize a systems levelapproach to understanding how multiple brain regions cooper-ate to mediate this complex process (MacDonald and Meck,2004; Nicolelis, 2007). By making explicit comparisons betweenbrain regions from which neurons are simultaneously recorded,one can better separate the functional contributions of these areasto taste-related decision making. Our results provide support fora distributed cortical network that mediates taste-guided deci-sion making. Although generally GC and OFC neurons activatesimilarly during a taste-guided decision, each region in the net-work can be distinguished by their relative contribution to whattypes of information (e.g., taste and/or spatial) are encoded andwhen the encoding takes place while taste is guiding a response toobtain an outcome. Importantly, our results also suggest that thefunction of the primary taste cortex is intimately tied to encodingrelations between the taste and any learned response that is even-tually selected and executed as a result of the taste. In this way, theGC may act as a specialized (i.e., taste specific) sensorimotorinterface to mediate the expression of taste-guided behavior.
ReferencesAccolla R, Carleton A (2008) Internal body state influences topographical
plasticity of sensory representations in the rat gustatory cortex. Proc NatlAcad Sci U S A 105:4010 – 4015.
Bland BH, Jackson J, Derrie-Gillespie D, Azad T, Rickhi A, Abriam J (2006)Amplitude, frequency, and phase analysis of hippocampal theta duringsensorimotor processing in a jump avoidance task. Hippocampus16:673– 681.
Bland BH, Oddie SD (2001) Theta band oscillation and synchrony in thehippocampal formation and associated structures: the case for its role insensorimotor integration. Behav Brain Res 127:119 –136.
Boakes RA (1969) The bisection of a brightness interval by pigeons. J ExpAnal Behav 12:201–209.
Braun JJ (1990) Gustatory cortex: definition and function. In: The cerebralcortex of the rat (Kolb B, Tees RC, eds), pp 407– 430. Cambridge, MA:MIT.
Braun JJ, Kiefer SW, Ouellet JV (1981) Psychic ageusia in rats lacking gus-tatory neocortex. Exp Neurol 72:711–716.
Braun JJ, Lasiter PS, Kiefer SW (1982) The gustatory neocortex of the rat.Physiol Psychol 10:13– 45.
Carstens E, Kuenzler N, Handwerker HO (1998) Activation of neurons inrat trigeminal subnucleus caudalis by different irritant chemicals appliedto oral or ocular mucosa. J Neurophysiol 80:465– 492.
Fagot RF (1963) On the psychophysical law and estimation procedures inpsychophysical scaling. Psychometrika 28:145–160.
Feierstein CE, Quirk MC, Uchida N, Sosulski DL, Mainen ZF (2006) Rep-resentation of spatial goals in rat orbitofrontal cortex. Neuron 51:495–507.
Glimcher PW (2001) Making choices: the neurophysiology of visual-saccadic decision making. Trends Neurosci 24:654 – 659.
Grossman SE, Fontanini A, Wieskopf JS, Katz DB (2008) Learning-related
MacDonald et al. • Cortical Framework for Taste-Guided Decisions J. Neurosci., September 9, 2009 • 29(36):11271–11282 • 11281

plasticity of temporal coding in simultaneously recorded amygdala-cortical ensembles. J Neurosci 28:2864 –2873.
Halpern BP, Tapper DN (1971) Taste stimuli: quality coding time. Science171:1256 –1258.
Ifuku H, Ohgushi M, Ito S, Ogawa H (2002) Neurons associated with be-havioral context errors in the primary and higher-order gustatory corticesin the monkey. Neurosci Lett 319:121–123.
Ifuku H, Hirata S, Nakamura T, Ogawa H (2003) Neuronal activities in themonkey primary and higher-order gustatory cortices during a taste dis-crimination delayed GO/NOGO task and after reversal. Neurosci Res47:161–175.
Ifuku H, Nakamura T, Hirata S, Ogawa H (2006) Neuronal activities in thereward phase in primary and higher-order gustatory cortices of monkeys.Neurosci Res 55:54 – 64.
Kay LM (2005) Theta oscillations and sensorimotor performance. Proc NatlAcad Sci U S A 102:3863–3868.
Kemp IR, Kaada BR (1975) The relation of hippocampal theta activity toarousal, attentive behaviour and somato-motor movements in unre-strained cats. Brain Res 95:323–342.
Kiefer SW, Leach LR, Braun JJ (1984) Taste agnosia following gustatoryneocortex ablation: dissociation from odor and generality across tastequalities. Behav Neurosci 98:590 – 608.
Komisaruk BR (1970) Synchrony between limbic system theta activity andrhythmical behavior in rats. J Comp Physiol Psychol 70:482– 492.
Lara AH, Kennerley SW, Wallis JD (2009) Encoding of gustatory workingmemory by orbitofrontal neurons. J Neurosci 29:765–774.
Lorden JF (1976) Effects of lesions of the gustatory neocortex on taste aver-sion learning in the rat. J Comp Physiol Psychol 90:665– 679.
MacDonald CJ, Meck WH (2004) Systems-level integration of interval tim-ing and reaction time. Neurosci Biobehav Rev 28:747–769.
Macrides F, Eichenbaum HB, Forbes WB (1982) Temporal relationship be-tween sniffing and the limbic theta rhythm during odor discriminationreversal learning. J Neurosci 2:1705–1717.
Nicolelis MAL (2007) Methods for neural ensemble recordings. Boca Ra-ton, FL: CRC.
Nicolelis MA, Baccala LA, Lin RC, Chapin JK (1995) Sensorimotor encod-ing by synchronous neural ensemble activity at multiple levels of thesomatosensory system. Science 268:1353–1358.
O’Doherty JP (2007) Lights, camembert, action! The role of human orbito-frontal cortex in encoding stimuli, rewards, and choices. Ann N Y AcadSci 1121:254 –272.
Ogawa H, Ifuku H, Nakamura T, Hirata S (2005) Possible changes in infor-mation from the primary to higher-order gustatory cortices, studied byrecording neural activities during a taste discrimination GO/NOGO taskin monkeys. Chem Senses 30 [Suppl 1]:i78 –i79.
Penney TB, Gibbon J, Meck WH (2008) Categorical scaling of durationbisection in pigeons (Columba livia), mice (Mus musculus), and humans(Homo sapiens). Psychol Sci 19:1103–1109.
Price JL (2007) Definition of the orbital cortex in relation to specific con-nections with limbic and visceral structures and other cortical regions.Ann N Y Acad Sci 1121:54 –71.
Rolls ET (2004) The functions of the orbitofrontal cortex. Brain Cogn55:11–29.
Schall JD (2003) Neural correlates of decision processes: neural and mentalchronometry. Curr Opin Neurobiol 13:182–186.
Schoenbaum G, Chiba AA, Gallagher M (1998) Orbitofrontal cortex andbasolateral amygdala encode expected outcomes during learning. NatNeurosci 1:155–159.
Schultz W (2004) Neural coding of basic reward terms of animal learningtheory, game theory, microeconomics and behavioural ecology. CurrOpin Neurobiol 14:139 –147.
Semba K, Komisaruk BR (1984) Neural substrates of two different rhythmi-cal vibrissal movements in the rat. Neuroscience 12:761–774.
Shadlen MN, Newsome WT (1996) Motion perception: seeing and decid-ing. Proc Natl Acad Sci U S A 93:628 – 633.
Shi CJ, Cassell MD (1998) Cortical, thalamic, and amygdaloid connectionsof the anterior and posterior insular cortices. J Comp Neurol399:440 – 468
Siapas AG, Lubenov EV, Wilson MA (2005) Prefrontal phase locking tohippocampal theta oscillations. Neuron 46:141–151.
Small DM, Gregory MD, Mak YE, Gitelman D, Mesulam MM, Parrish T(2003) Dissociation of neural representation of intensity and affectivevaluation in human gustation. Neuron 39:701–711.
Stapleton JR, Lavine ML, Wolpert RL, Nicolelis MA, Simon SA (2006)Rapid taste responses in the gustatory cortex during licking. J Neurosci26:4126 – 4138.
Stevens SS (1957) On the psychophysical law. Psychol Rev 64:153–181.Travers JB, Jackson LM (1992) Hypoglossal neural activity during licking
and swallowing in the awake rat. J Neurophysiol 67:1171–1184.Wallis JD (2007) Orbitofrontal cortex and its contribution to decision-
making. Annu Rev Neurosci 30:31–56.Weijnen JA (1998) Licking behavior in the rat: measurement and situational
control of licking frequency. Neurosci Biobehav Rev 22:751–760.Weijnen JA, Wouters J, van Hest JM (1984) Interaction between licking and
swallowing in the drinking rat. Brain Behav Evol 25:117–127.Yamamoto T, Matsuo R, Kawamura Y (1980) Localization of cortical gus-
tatory area in rats and its role in taste discrimination. J Neurophysiol44:440 – 455.
Yamamoto T, Shimura T, Sako N, Yasoshima Y, Sakai N (1994) Some crit-ical factors involved in formation of conditioned taste aversion to sodiumchloride in rats. Chemical Senses 19:209 –217.
Yasoshima Y, Yamamoto T (1998) Short-term and long-term excitabilitychanges of the insular cortical neurons after the acquisition of taste aver-sion learning in behaving rats. Neuroscience 84:1–5.
11282 • J. Neurosci., September 9, 2009 • 29(36):11271–11282 MacDonald et al. • Cortical Framework for Taste-Guided Decisions