Embed Size (px)
Citation preview

TATA ENERGY RESEARCH INSTITUTENEW DELHI
~lIT 1II rI n
ROLE OF TECHNOLOGY TRANSFERIN ABATlNG CO2 EMISSIONS
Final Report
Submitted to:
US Agency for International Development
BYTHE TATA ENERGY RESEARCH INSTITUTE
Jan 1993\

Dr. R.K. PachauriDr. Prodipto GhoshMr. O.N. KaulDr. Ranjan BoseMs. Leena SrivastavaMr. Sudheer KatochMs. Deepa Prabhakar
PROJECT TEAM
Senior AnalystSenior AnalystSenior AnalystJunior AnalystJunior AnalystJunior AnalystPrivate Secretary
The project team would like to acknowledge the guidance and support provided by thefollowing, in the preparation of this report.
''-.,
1. Prof. Jose R. Moreira of Biomass Users Network, Dr. Alan Poole of InstitutoNacional Eficiencia Energetica and Dr. Elvo Calixto Burini Jr. of Instituto deEletrotecnica E Energia, Universidade De Sao Paulo, Brazil.
2. Dr. K.1. Omar and Dr. 1. Hossain of Bangladesh University of Engineering andTechnology, Bangladesh.
3. Prof. Wu Zongxin and Prof. Wei Zeihong of the Institute for Nuclear EnergyTechnology, Tsinghua University, China.
4. Ms. Amrita N. Achanta, Mr. S. Bhattacharya, Mr. G. Chandrasekar and Mr.Akshay Jaitly of the Tata Energy Research Institute, India.
5. Dr. S. Sasmojo, Dr. Moekti H. Soejachmocn and Dr. Ucok Siagian of the Centrefor Research on Energy, Institut Teknologi Bandung, Indonesia.
6. Dr. Mohammad Sarir of the Institute for Political and International Studiesand Dr. Mahmoud Shriat of the Faculty of Health and Envir()nment,University of Tehran, Iran.
7. Mr. T. Tomitate of the Institute for Energy Economics, Japan.
8. The Sri Lanka Energy Managers Association, Sri Lanka.
9. Dr. C. Boonyubol and Dr. Chaiya Chamchoy of Chulalongkorn University'sEnergy Research Institute, Thailand.

Foreword
This study on the role of technology transfer in a9ating CO2 emissions is an
integral phase of a larger project on estimation of GHG emissions from Asia and
Brazil and policy responses for their minimization undertaken by the members of the
Asian Energy Institute along with a group of researchers from Brazil. In the earlier
phases of this project the focus was on estimation of emissions and identification of
strategies/technologies to abate CO2 emissions. Computation of likely reduction in
CO2 emissions and the specific costs for each technology was also undertaken.
In this report, as mentioned earlier, the focus is on the issue of technology
transfer and the barriers to effecting such transfers. Each country paper has a brief
description of on the general country policy that affect technology transfer such as,
investment policy, tax incentives, capital financing and foreign exchange control. This
is followed by a specific case study for either cogeneration or lighting technology or
both in the country papers. In particular, the barriers and opportunities in each of
the phases of technology transfer viz.,technology acquisition, absorption, adaptation
and development, are addressed and the necessary policy and regulatory changes are
identified.
In addition, a description of various notions of equity is also included.
-----.rrllI-r...,..---

Table of Contents
Foreword
Section I
Brazil
Bangladesh
China
India
Indonesia
Iran
Japan
Sri Lanka
Thailand
country Papers
Section II
Structuring the Equity Issue in Climate Change
~I

TECHNOLOGY TRANSFER AND ABSORPTION INDEVELOPING COUNTRIES:
A CASE STUDY OF LIGHTING AND COGENERA TlON INBRAZIL
We gratefully acknowledge the generous support provided byProf. Jose Roberto Moreira, Biomass Users Network. Dr. AlanPoole of Instituto Nacional Eficiencia Energetica, Rio de Janeiroand Dr. Elvo Calixto Burini Jr. of Instituto de Eletrotecnica E
Energia, Universidade De Sao Paulo,for completing this paper

In this paper, the authors have addressed the issues related to
transferring efficient lighting and cogeneration technologies into Brazil. TIle
case study for lighting systems is presented first.
1. Case study of efficient lighting systems in Brazil
1.1 Introduction
This section is about the transfer and absorption of a set of new
technologies for more energy efficient lighting. It is the first of a series of
papers to analyze the barriers to the market penetration of groups of energy
efficient technologies which are, in principle, cost effective. The rapid diffusion
of these technologies is of special interest to developing countries, because with
its severe financial and environmental constraints on supplying a growing
energy service demand are both relieved. In broader terms, energy efficient
technologies and systems can add new degrees of freedom in resolving trade
ofTs between environmental and development imperatives. However, these
technologies (and the "software" and "systems" associated with them) are
mostly not penetrating their markets rapidly in developing countries, even in
situations where they afTer very high returns, as is the case with several
lighting technologies in Brazil. Important barriers exist to the penetration of
cost effective new technologies. In order to obtain a comparative international
perspective, the Asian Energy Institute is coordinating parallel analyses in
developing countries. of which this discussion paper is one case, In each
country a discrete set of technologies has been chosen.
"Technology", as understood in this work. includes not only Nluipmpnt
"hardware" but the "software" needed to use it well skills, institutions.
information and "culture", This "software" is receIving growing attention among
those concerned with the diffusion of energy effiCIent technologies.
The emphasis here is on technology acquisition and absorption rather
than on development or even adaptation. 111is is partly a consequence of the
characteristics of market for supplying lighting equipment, which is dominated
by a small numlwr of multinationals (see below), But it :11:-(1 rcflpct.- ~l wider
belief that most technol,.;.:ips of interest already l'xi:ot and ~Irp pl'O\','n. TJ1£' main
problem is thpi I' IIltl'OdUl'tIOll alld pPlwtrat iOll ill t Iw 111<lrk.'[:; of rh:llJi ;llld
other dp\-pl()Plll~ ClIlIllt 1'1,'';.
r'0

This paper is restricted to electric lighting technology. As in many
developing countries, kerosene is widely used for lighting in rural areas due to
the lack of access to electricity. However, the authors have no experience with
non-electric artificial lighting sources. It is to be hoped that these lighting
sources will be treated in the parallel papers from countries where residential
kerosene consumption is relatively more significant than in Brazil. Here it
accounts for only 0.2o/c of oil consumption, and consumption has fallen almost
sixty percent since 1980.
1.2 Context for lighting technology transfer and absorption in Brazil
The future evolution of lighting technology and its application is a
question of strategic importance for policy towards power sector expansion. As
end-use, lighting accounts for about 15% of electricity consumption, but its
importance for near-term policy on technology transfer and energy efficiency
improvement is greater than this number suggests. First the technical potential
for efficiency improvement in basic equipment is very large, perhaps the largest
of any kind of end-use. There are many cases (see below) where the energy
consumption of the basic lamp assemblies supplying the same quantity and
~i!T1ilar quality of light falls by a half or more. Furthermore, the technology is
"immercially proven. Second. the design of the use of these lamp assemblies
olfers large scope for improvement. For example. most architects in Brazil
appear to ha\"(~ only a rudimentary understanding of lighting. The solutions
adopted often involve unnecessarily high maintenance and operating costs and
initially impressive rather than functional lighting. There is ample scope to
address the factors leading to this situation. In this sense, lighting shares with
other areas for energy l'fficiency improvement, the possihility of significant.
gains from rethinking the basic "process" of producing a product. the product
It::ielf, and how to use till' product in a context of financial :Ind pn\'ironmental
rpstrictions.
A third point is that much lighting equipment has, on a\'prage, a lIseful
life which is rplatively ,;hort compared to most investments by consumers which
sil_;nificantly inllupncl' l'npq,')' consumption. Conventional Imlll" ;\I1d lamps last
lpss than OIH' to a vpry fl'w years. \\'11ile the lighting system is dl'si/:,'lH'd to last
suhstantially longer t !l;lt\ till' lamp. major changes in lamp alld IltllPr
tpchno!ogy comhined \\'itll IH'\\' lIspr perceptions of lighting nee(!:' and costs cun,
1
j
J

in principle, lenu relatively quickly to notable changes in the stock of
equipment.
These points, plus the sheer visibility of lighting, makes this an
interesting area for energy efficiency programs to emphasize in their early
phase. A lighting program can show results which increase consumers'
awareness of energy efficiency in general. Brazil's early modest efforts at
electricity conservation have in fact given considerable emphasis to lighting.
Some individual utilities have had programs of electricity conservation
for ten years. A national program, called PROCEL was launched in 1986 to
deal comprehensively with barriers to improving energy efficiency (1)
Considerable attention was given to defining new technologies of interest,
labelling certain appliances, energy audits. and the promotion of more efficient
public illumination. Some results were achieved. but the program then suffered
cutbacks. In 1990 a special high·level council was created to help orient
conservation efforts in general and give them political impetus, This council
(GERE-the Executive Group for Energy Rationalization) has achieved some
concrete results. especially regarding taxation and import duties (2). The
council has reccntly uecome less active, but in compensatioll PROCEL has
again become more dynamic.
The supph' of lighting equipment and systems is entirely in the pri Y 3te
sector. At the bao'l' of this induo'try ar(' tlw llwTIufacturers of lamp. This
segment is UOllllllateu by a small num[w!" of multInationals - Phillips, Sih:ania.
GE and Osram . anu is definitely yery C:lrle1ized within BraZIl. The cartel's
market is mostl,\' protected against imports. as is the case with most Brazilian
industrial cartpls, This combination of cartelization anu protection can create
problems for int l'llducing improwd techIHdo!-.')', For example. PROCEL launched
a pro},,'Tam to stimulate the installation of more efficient puhlic illumination,
Thio' prol-,'Tam pnt:llled frpe marketing for the manufacturcrs of relevant
equipment. It would help them increase \'olume of sales in the short and
mpdiul11 term. thlls reducing unit costs, LTnfortunatPly, the l:art"'l':" response
was to increasp prices. using market power to achieve short·term profit
maximization, .\nuther prohleIll. raised in sections :3 & 4 lwlow, is product
quality (indudill": lifetinll' t-,ruaranll'PS), Carlplizalinll and prnl(·etion are
widespread in Brazilian induslr\' and :1pppar to aet as a factor inhibiting morp
rapid market IWlll'tration of IH'W tpchllol"g\,. thllll,.:h it was not p":,,siblc to

analyze these and other broad economic issues (e.g. inflation) in preparing this
paper.
Certainly progress in creating an overall business environment with
more competition, less inflation, and reformed regulation will create more
auspicious conditions for investment in process productivity and product quality
throughout the economy. Yet the existing macro distortions should not paralyse
efforts to seek energy efficiency gains (with usually attendant new technology I.
Indeed the measures described below, ranging from realistic electricity tariffs to
norms and information are compatible which broader efforts to reduce
distortions.
1.3 Analyses of specific lighting technologies
1.3.1 Efficient first generation incandescent lamps
Multinational companies operating in the country have already
manufactured the product and placed it in the market 122W, 36\V, 54\V and
135\V). This was motivated by the government's price control and the attempt
of the manufacturers of creating new products whose prices were not controlled.
The advertising companies worked hard and there was support from some
government institutions. The product was removed from the market with the
argument that the consumer was becoming confused with the already existing
well-known traditional lamps 125, 40, 60, lOOWand 150W) and preferred these
models. He always thought he was buying a less intensive lamp for a higher nr
similar price iat the lmd of the commerciLtlization its price was l'(jualled to that
of the conventional lamp), whl'n he chose the efficient lamp.
Various convprsations between PROCEL/GERE and manufacturers
(ABILUX) show that they are not interested in only producing the efficient
lamps because:
a I it would demand investment of USS 70 million in order to sen'p the
whole market:
b) it would represent a potential risk of a market invasion of imported
conventional incandescpnt lamps, since consumer is used to tIll'
traditional lamp;
c) it would demand a !-,'TP,lt advertising effort in order to educate the
consumer. This effort could be co-financed by thl' government it-"plf;

dl there is some expectation that the incandescent lamp will eventually
disappear from the market, surpassed by the technology of the simple
fluorescent lamp, known in the market as the compact fluorescent lamp.
The surcharge which has to be included in efficient lamp, due to the
additional investment of US$ 70 million is perfectly acceptable considering the
benefit oITered to the consumer. The Brazilian production surpasses 300 million
units/year, which means that an increase of US$ D.l/unity provides a payback
time of a little over 2 years. For an average price of a conventional
incandescent lamp of US$ 0.6 and electricity of US$ O.OB/kWh (consumption
over 200kWh/monthl, we see that the saving of 1.3kWh compensates the price
increase for the consumer. For a 60W lamp, this represents nearly 200h of
consumption (or let us say 400h. supposing that the retail price is US$
O.2/unity, consequence of USS 0.1 of the retail margin I.
The non-existence of such products in Brazil at present can be easily
diagnosed as resulting from poor information and poor popular education as for
as market demand is concerned since most of the population is unable to
understand the technical and economical advantages assuciated WIth the first
generation of incandescent light bulbs.
Shortage of capital also create a barrier. The im'p"tmpnts rpquired to
convert all the eXIstent incandescent light factorie,; can he recovered in a
reasonahl(! tinw "pan, as discu,..""d aboy,>. hut tlwre ;HP <)t]wr inn'stment
opportunitip" III lh,' cOllntry whll'h ,:all pr"\'ldp p<ldl<!rk lillH'S shorter than t\\'o
years.
1.3.2 Second generation incandescent lamps
The awaited product "lamp in a lamp" is alreadv in the ....merican and
European market. One can find halogen bmpo-; fitted im·ide a con\'entional
lamp. This prOdlll't is interesting bec<1usP the halogen lamp can re<lch an
efficienc:-' of 20 tu ~2 lumeni\V, almost duuhle uf the' r(,n\'elltional incandpscPl11.
Besides this tlw halogen lamp lasts 2.000h lI1:-;tPdd u! tll£' 1.\lI)\lh of the
conventional ont',
Anotl1l'r ;"''Tl':lt ad\':llltagl' is that ;..,ri\en the small nd1l111e of its filament I if
cUl11pared to th:tt ,,1' tlw l'Ulln'ntlllllal lamp,,1 it is pOSSill!" 10 l'OIl"trlll'l a good
reflection s.\·"telll WIth n'ducl'd dim(,lbiun". projecting ,dlll":-! ;ill thl' light tu ,I
dptprmined ,up:\. In thi" \\'ay. a product which i,., :l\';uLIhl" 111 the .... \lwric:ln
market, :l "flu'Hlllght" LIIllP, with the n,fl",'tur :,'"stl'lll lllC(lrporatpd in thp
/0
~ ..- ..

extreme part of the hulb, is capable of supplying light equivalent to a 150\Y
lamp, with a consumption of only 90W. This product is economically efficient
because its consumer price is US$ 4.00 while a conventional floodlight costs
USS 2.50. This difference in cost (US$ l.50), to save 60W is compensated with
310h of operation (at US$ a.OB/kWh).
This type of "lamp in a lamp" does not exist in the Brazilian market.
Halogen lamps are produced in the country so it will not be very difficult to see
that the new product in our multinationals operating in Brazil have access to
the technology, The problem is essentially related to the product's absorbing
capacity in the national market. It is estimated at the present, demand for
halogen lamps of general use (including the ones used in the car industry) in
the Brazilian market is 1.2 million units/year, 30°;- of which are imported.
Floodlight lamps are sold in very small quantities in the country. The
estimated annual market is of 2.5 million units and its cost is 4 times the cost
of the WOW conventional incandescent lamps. Thus it is difficult to motivate
the production of "lamps within lamps" in the country while the market does
not expand. A natural procedure would be making importation easier and
allowing the product to be known among consumers and project engineers.
Importation can be made easier through the reduction or even elimination nf
taxes, which already happens with some fluorescent simple lamps.
1.3.3 Thil·d generation incandescent lamps (or IRF) - the most
efficient one
ThiS product is interesting because the halogen lamp, due to a thin layer
of material which i" deposited in its interior, provides interference for the light
and the heat irradiated by the filament, and can reach efficiencies of 28.6
!unlPniW (in lamps of 350W) and of :35.6 IUl11eniW (in lamps of 900W), The,:e
numhers are mol'(' than 70Cf higher when compared to the conventional
incandescent Ulle,: '500W), Besides this, the halogen lamp lasts 2,000h in"tead
uf the 1,OOOh uf the conventional lamp.
Thes!' products are very new in the market and information about them
is tlltally Ulla\';lIlahl,,_ Even at the manufacturers' development departments
till' informalillll i:; puorly appreciated. :\ strollg change in the managenal
attitude of "uch \'llterprises must occur. Since tlwy arp all multinational what
i" really IH'CPSsar.\' is that such companies ;ISSUIll(' tIll' r('sponsibility to lli'e !Jpst
tPchnologie" in all part::; of the world.

1
1.3.4 Conventional fluorescent lamps
These lamps (15,20,30,40,65 and nOW) are being manufactured in the
country for many decades. The average consumer price (USS 5.36; 3.31; 5.36;
3.31; 10.62; 8.68 respectively) is high if compared to the American market.
Total production reaches 30 million units per year.
These lamps, when operated with conventional reactors register a
deficiency in relation to the product found in the United States, (40W
fluorescent lamps can be acquired in USA retail stores for US$ 1.50). It is
difficult to obtain the nominal value of the flux. Fluorescent lamps of 40W with
a nominal value of 2,700 lumen, usually supply 2,500 lumen when operated
with reference reactors (reactor with strictly defined electrical characteristics)
and with nominal current of 430mA. In these conditions, it is generally possible
to deliver power of 39W on the lamp's are, which does not occur when operated
with conventional reactors (35W). This problem shows that there is a loss of 10
to 159(: of the normal luminous flux, with a reduction of also 1W'r in the power
applied to the lamp. Considering that there is a loss of 10 to 1:")('( of the normal
luminous flux, with a rl'duction of also 10(;i; in till' PO\VPI" applied to the lamp.
Considering that tlwre is also spent power in the filanwnt;,; I =:1Wl and loss in
the reactor, It lllay !Jl' concluded that the loss of up to 15";' of the flux occurs
with a redlll:tion (~f the puwer of 1017i or le'3s in thl' comhination lamp and
reactor. which Illl~anS a real loss for till' final Clll1SUIlWr who is essentially
il1terestl'd ill till' illumination SI'I"\"ice at till' lowl'"t co"t. This loss can lw l'\'l'l1
larger if '1111' cOIl"idl'rs illumination for spaces with areas over 20m~, In thp:;p
spaces. the smallest light nux milv requin> the in~tallatiol1 of one or more
lamps in the illuminating system, This cost of tlw extra lamp(sJ and its
installation is a loss for the final consumer.
Anuther prohlem is the average life of thr lamp which is not guaranteed
by the manufacturer. Data show that fluorescent. lamps ha\·p an average liff' of
4.000h, which is low if compared to American literature 18.000h).
These df'ficiencies are tlw cause of many discussions; the manufacturer",
are now questioning thl' hall quality of various reactors usee! in the cOllntry.
The issul'S dewcted and di"ClIssed aho\'e show th~1t iI wl]()lf~ new busil1l'SS
"culture" must hr ]H1rsupd, Such a "culture" ::;hould gin' prj'II'it\' to:
al quality control
bi preparation and folluw-up of productiun quality norms

c) respect for consumer's rights
This last item is obviously linked with adequate information
dissemination and with the cultural level of the population. Requiring
efficiency standards equivalent to what is achieved in the develuped countries
will have the indirect benefit of increasing job opportunities for qualified man
power.
1.3.5 Economical tubular florescent lamps
In this category there are 1'12 lamps (with a diameter of 38mm) of :37W
and 1'8 lamps (with a diameter of 25mm) of 32W and 16W, with a luminous
flux of 2,500.2,750 and 2,900 lumens for the first (1'8) and 1,020, 1,150 and
1,050 lumens for the second respectively, This variation is due to the use of
depusition technology of conventional phosphorous and phusphorous of three
different spectrums (tri-phosphorousJ. The :32 and 16W lamps show a gain of
20'k in the luminous efficiency in relation to the conventional fluorescent lamps
of 40 and 20W. when used without white luminaries, and even more than that
when used with reflective lamps given their smaller physical dimension, when
cumpared tu the conventional f1uurescent uf numinal powl'r of 40 and 20\V
respective ly,
The lamps with tri-phosphorous, besides prpsenting a bTfPater initial
luminous flux in n~1:ltion to the conventional phosphorous ones, also have the
advantage of ,;howing- a It~sser dpcrease of lIw nux as time gops by. This Ipsspr
d(~crem;e is the important fact for a morp l'llicient pn',j('ct, vpry often allowing
the use of Il'S'; lillll(lS (llr the same illumination sl'n'ice. when compared to tlH'
conventional phosphoruus ones,
The main problems requirini? impnlvPIIlPnt" an> the ones related to tilt'
initial flux which almost nevpr r(~ad1l's till' nominal I the ::iilme type of problem
mentioned ill Itl'lIl :3) and the cost problem, The :t~W lamps with common
phosphoruus ha\'!' a price for the consumer which is :2lV; higher than the -lO\\'
lamp. without ;lIlY justification, except for the nowlt\, of the product, 111e tri
phosphorous lamps h:l\'C a cost at least lOt)';- higher than conventional
phosphorous UlU'S. thus withdrawing ~1 gTPat part uf potential consunlPrs. Thi"
last problem i" n'lated only to the po:,-sihility of a largl' :,cale production sincl',
sim:p in tilt' anll'rican markl't tlw price dilfpl'I'lltl:lI is !lilly :')W;-
The sm;dl sizl' ,.1' tlw mal·ket fpr :-illch prtllllll'l:-' I" a conSl'ljllence of till'
shortag'l' of inl',q'llliltioll, thl' high co"t Ill' 1l1Onf',\' alld till' low technical

qualifications. DlIP to high cost, manufacturers need to reCClyer the initial
investm~l1ts quickly, thus new products always carry hi~h rrices, which limits
demand. Small demand on the other hand pushes price,", Ull. Low technical
qualifications complicate the development of new products and increase the cost
of standard technologies. There are complaints from entrepreneurs not only
about such products costs but about other construction co::13 of industrial
building:: and associated infrastructute in Brazil, higher than that would be
cost in developed countries.
1.3.6 Mercury lamps for public illumination
These lamps are very common in public illumination in main Brazilian
cities. The country still uses a reasonable quantity of incandescent lamps
'=600.000 units) for this purpose and its most natural sub"titute is the
mercury-\'apor lamp. The most used models vary between 125 and 4000\V and
are preferred for their lower price.
l'vlereury-vapor lamps are sold with the duration expectancy of 12,000 to
15,000h of life, and the available data show a life duratIOn l)f about 8.000h. It IS
very difficult to determine that the deficiency comes from till' lamp because
yery frequcntly the disl:harge current (in the ballast) and c'Jl1trol of luminou"
nux (with till' luminaryl show a performance in sl:rvice which is liltl!' l:valualPd
;lI1d SOIlH'lImes l'Vt'11 docs not n1l'et Brazilian Norms.
R\>;:~ll"ding its luminuus nux. tIll' J"(>:,lilt l)htaim'd f'lr :Ill' Brazilian pl"t1dul"t
1" l~qllal tu the lampo; produced ahroad. Unl'orlunately tl1P k,cal manufacttlrl'l"
does not ;1.laranI1'l' the avcrage' lifl' of llw product; only one of them stall'O' t h,>
Ilominal lift' il\'prage obtnined in a laboratol"Y in his catal(lpll'.
1.3.7 High pressure sodium-vapOl' lamps
These lamps (wilh intprnal if,'1\ill'r - "startl,'",," lnm]li ha\"(' beell used
lllcrensin:.:l~- in public illumination in Brazil. 111 spitl' of hl'i:1!! more el1icirnt
than thL' mL'ITUry une, its market is limitrd 1J~' Ihc prol!ucl;'ln price. Part of 11"
l'LJmj1onl'lIIs are llnportl'd anu it is said that implies in an mcre;\se in thl' fmai
,'pst dup ;,1 ll\\pP!'1 tariff" \\'hat rl'ally h;\j1pPlwd is that \qlh th,' lillPratiol\ pC
Imj1ort,'d :,:,)pd" 11\ till' coulltry. (111'''<' tarill" \\",'n' n'dllu,t! ,llld ll\l)n' rt'dlll·titlll~
;\l"e l:XIW,,:,'d ill 1HH>j alld 19H4,
Lif,' \'x]l,'C\;IIll:Y is up 10 :!-i.lH)()h hut till' 11l:lllllfactur.'r dOL'" IWI
;.:'uarant",> Ihl". In praclic,' "htlrt,'r Ii""" lLI\'" 1""'11 ob"PI... ,'ti '(i()OOh, ,\I\d II ha~
I~
II

10
been blamed on the inappropriate performance of the auxiliary start-up and
fJperati!1g system. In relation to the price, it is also important to \'erify that for
the same amount of luminous flux they cost between 2.5 and 4 times more than
the mercury lamps, which is a lot if compared to the price in the United States
(where it costs between 2 and 3.5 times mercury lamp).
The performance of mercury and sodium lamps is another evidence of the
poor technological level. There is a shortage of qualified people to deal with the
problem on the producer and consumer's side. Consumer's rights are not
respected nor claimed, and this leads to a loss for the whole society.
1.3.8 Simple fluorescent lamps (CFL)
Compact fluorescent lamp.:; have been offered in the Brazilian market for
;) years, with a power of 5, 7, 11 and 13\1,,'. As all other discharge lamps they
need current limitation reactors. They are found in the market whether
incorporating the reactor or not and they have sockets which are compatible
with the conventional incandescent lamps. The units with the incorporated
reactor are imported, with no import tax, while the bulbs up to 13\V are
manufactured in the country by multinationals, The market of th(:se products
in 1991 was of 0.8 million units ,)i which 6.3':0 were produced in the country,
:3;3':0 were assembled in the country with the majority of fon~ign components
and 4<;0 w('t'P imported. Their retail price is USS (j without till: reactor, :lnd US;;;
11 with tl1l' I'('aclor. Tlwre are abo CFL lamps with electronic rr'actors
,introduced this month) in the domestic nlarkpt, which can also he illlported
;Illd sold ill retail for USS 15.
CFL lamps are manufactured with tri-phosphorous amI tJll'rpfore show
~ood efficilmcy. In spite of this rhe~' do not comJwte with the efficiency of till'
conventional fluorescent lamps IIr -to\V because they are desig-ned for small
powp!' only.
[n spite of their high unitar:: CO:'it, if compared with incandpscent lamps.
they ha\·p advantage of being repi;lced easily (as happens with incandescent
lamps). and of bping 4 times mort' economical and demanding IPss maintenance
due to their avprage life ::;pan of ~,UOOh. Even though thi::; lilst fact is not
gl.larantpPd by thl' manllfaclun'r. many lI::,,'rs are satisfi('d with till' rpdllcti"n
in the cost of replaccnll'nt.
[f WP cOllsidpr it power of 1~\V for thl' spt litmp-rl'actor l!l\\-'I and a jwriod
"I'S,OOO hours Inormal lifL' dl'clitrt,d for thi" typP of lampi ,llld if w(' comparl'd
/6

\\
this system with tlw traditional incandescent lamp of (jOW Ilominal, we would
have a comparison between the respective costs of illumination (per million
lumen houri of approximately 2 in benefit of the first one, this is 5.09
US$/million lm.h (fluorescent 9W) against 9.60 USS/million lm.h (incandescent).
Now, if we divided the mentioned period 18,000 hi into 8 ref,'1t1ar intervals to be
paid by the consumer we will have after 2.5 intervals, a luwer cost for the same
benefit, illumination, for the consumer who can chouse the fluorescent system.
\Vithout any doubt, at first sight, this tacky-econumical argument is able
to change CFL technology into a very attractive alternative for the replacement
of conventional incandescent lamps. But. if we examine some other points, we
will surely re\'ise this position, Just to mention lao' the discussion of these
points are not our main objective):
al necessal'v time (about 45 minutes I to attain tl](' stanclard luminous flux;
bl maximum luminous flux is a function of the angk of installation and
operating temperature;
c J (strong' dl'p(,ndency of useful life 1Il I'cbtion to til(' Ilumber of timcs it
wa:: switclwd 011:
dl control o\'pr the l'l',jl'cted IllPITUn' after the lamp',.; U";(', For :200 million
lamp>' \'par :Jl11g ml'rcury/lalllp, WP will h;]\'e :lpproximately 187 tOil:' or
HgYP:lr, Ji' tl](>:,e blllJb sur\'l\'(' KJIII() h, that I>' t1 tillJ('s !llol'e thall till'
CIlll\-t'IlUllll:t1 illC:lllll"::'C('llt lamp:-.
III tlll:- \Cd\' W(' cl!'adv "I'!' till' Il!"'l':-:-It\' of 1I'\·I,.;ill~ till' cosl of
illuminatioll III rt'!:ltilln tu thl' u",agl' halHt, hl'yolld till' COllc('rll rill' clPar
d"fillition::, ,)j) till' rpcyclillg of tllI'I'Cllr\' __\t PI'l':'Plll WI' think It would bl~
c:on\'l'nient lo rl'l'Om1l1P1HI the usp of t 11l.~ IVJW of i:lmp fo]' are;]::, with cont illUo\!:-
anciunintPlTupil'd Jwriod,; ::ill)wrior tIl () hlllll'c-.d:l\- ':b lICCUI''' in till' commt'l'ci;Ji
,;pctol'l_
Tlw CFL l:llllpc- with illLlid 1,II'Cll'llnIC I'l'acl,'r" call \ll' m:lllufacturpd ill
Brazil. .\ccol'llin:.; to till' :\lultillatilln:Ji", tlll' pxic-tlll:,,: h;lrri,,1' is ollly due tn th"
low t!plll;lnd Ilf th,' produd ill re!:Jtioll In It>' high l'l1:-l. III >'Pltp of thi,,; diffindtv
it i,; \'1'1',\' ndl llr:t1 thd! "i,'l'lI'Ollic I'pal't,'r:- ,II'l' ll>,pd "ith CI:" lamp...; lH'cnu",· of
it" lo\\' In';';I'''' !':I,'C1t'llm:lg-lwttc I'l';ll'!llr" ,':111 "hO\\' ,[ Ill,,:- of --l\\', \\'hich 1:-; \'l'ry
Sigllific:1I11 \\'!Wll Ilppratill:": wit h LllllP" \\'It h :1 t:lill:-\I1l1pt lOll of ';'\\-,
r ---.r

\,;{,
Besides this, there has to exist a compatibility in tIl(> physical size, so
that the replacement of the incandescent lamp for the eFL may he easier. CFL
lamps with inlaid traditional reactors are much longer, while the use of the
electronic reactor allows a reduction in the physical dimension.
The use of CFL lamps encapsulated in glass is also becoming very
popular because they are able to simulate better the colours of the incandescent
lamps. This product is coveted because the colouring of the incandescent lamp
today is better associated with residential environments, ,vith the exception of
the service areas in the house. This product already exists in the Brazilian
market, imported by the multinationals and sold at a price of USS 20.
1.3.9 Dichroic lamps
They are halogen lamps incorporatpd to a reflection :"-,,tem which has
the characteristics of reflecting only visible radiation I light) in a given direction
and transmits heat in the opposite direction. Therefore', this type of iiource
already has. in an improved way, its "own luminary", emits a cold light, when
compared to the conventional incandescent lamp, with excellent coluur
reproduction. For certain applications it is much lllore dficient energetically
th a n COlwentiona I options_
Thpse lamps are available in 20, .')0 amI 7:)\V, twu-pin hasp, for a 12
Vllih nOl\linaltensioll (which dplllands a transfllrnll'r Ill' ('Ipctronic convertl'r
hllth In us(', at pnCI' of USS 1;) I)('r unity_ Then' I'xist:; In lhl' market a [;llnp for
\'IJilag(~s ,.,imilar 10 Ihazil'" grid Icodl' F.LlI, :l()()\\' - 1:2()VI, hut lhl'y arl'
imported and tlwir u"e is rl'stricted due to thpir high powpr.
TIlPY hay!' very limited use for dpl:or<lli\'(~ purposps, \WIIlL:" used almost
exclusively by the upper social class who can alTOI'd it, with tlw specific
illumination for tlw room or pieces of art for ",hort Iwriods of time. TIll'
l'l'duction of light intensity is cOlllmun (,'c1illlllll'r") for till' reduction of ils work
tellsion. I Ltlogpn lamps han' ;\ nominal life ;-,p:lI1 of L:i()() hours when Illwrated
at nominal tensilln, fllr this i,.; the l:onditilln for the n'gel]('rati\'(~ cvcll' to oculr.
Tlw cycle does not work with ll~nsions below the nominal ilnd in this \\'a,';'
durahility bpconH's that Ill';1 conventional lamp labout 1,000 hours).
1.3.10 Conven tiona} light fixtures
TIlt' use of light fixtUrt's as part of tlw i1luminatio!l :-.":-t"1II with
tluol'l'scl'nt lamps is \'pry common in tIll' counlry, I'\'en thou~h t)]('I'(' an'
simpler art'as wlH're 1I11'l'l' hulb,.; an' used. Till' l'41nVl'nl ional light fixlun's an'

prepared much more to supply an archit('donic appearance! than to improve the
illumination efficiency.
Conventional light fixtures are generally made with iron sheets
enamelled with white paint.
The white paint is a ,guarantee of obtaining a good reflection for the light
that comes from the lamp and is directed the upwards, The reflection index of
the white enamelled surfaces is approximately 90%, which apparently shows
great efficiency.
Due to architectonic reasons, and less frequently. due to technical
reasons, it is common to use an opaqtle or semi-opaque material near the base
or flaps, also with white enamel. The opaque material can ahsorb up to 50("" of
tran;:;mitted light, while semi-opaque materials of hetter performance absorb
20'k. The flaps also reduce, the efficiency, absorbing anr.~ refl(~cting light to
other directions which are not the working area, The architectonic reason is
associated to the light fixtures' lack of aesthetics LIml tht' technical n~ason with
the po;:;sibility uf opacity caused by direct light of the lamp concllrrlllg with the
sight or reflecting on generally mirrored surfaces which :nay exi"t 11l offices,
In spite of the opacity only being a prohlelll ill \\",'rking an'as. the use of
flaps and tran"llIcid matc·rials arp of comlllon 11"(' in li;:!:t fixtures placed in
ci rClilation al"['a,;.
1.3.11 High efficiency light fixtUl'es
It i:o; pos::,ible to pro\'p that light fiXllll"l''; which aI',' mad(' with tl1('
appropriate gC(Jl1lPtry and with reflectin' matprial can ..'upply illumination lip
to t.wo tinH''' highpl" than that obtained frolll cOllvpnti(l!l;lJ O!w,." The 1'[';I:,on for
thi,., impro\'enwnt lies in tlw fact that tl1(' r(,(l('ction illd,'x which i" what rpally
intere:'t:3 ill a ~llate1'ial. in ordl'1' to jllsti(\' its IUlllillou" eI1icll·ncy. i" till'
inten:3it ....· of the sJ1Pcldar rpflection and lIot thl' illtclIsit\ ,J!' tIll' diffu:-,('
reflection, Enmllclkcl ;lnd white painted :3l1rf;lCl'S ha\"<' .1 :ligh lIld!'x of difTu:-,p
efficil'ncy. thar is if 1l11'Hsll1'ed the light intPlI"it ....· I'dlec!c'j ill Ill(' whol('
!wllli"plll'n', A high L'ol,lTicient of specular n'flpctiOI1 11I,':1:1" t 11:lt allllost til('
n~nl~ctl'd light I" ill (llll' d('[('rmillcd di1'pctiull. dpfilll'd [)\ :111' 1;1\\' of optical
rdlpl"tillll,
\\"l1l'1I gPlld rpfll,ctivf' l1lal('rial is a\·;llLtbll'. spl'cllL:r l'('fl"L'tlOn takps
plaL'l'. :dlowillg thl' l'bhu1'<lliull of a good gl·olll.'lry with l:ll' O!J.!"l"tI\'I' of
I ~

14-
diffusing this light to the area of interest. In the case of diffus(' rC'fll'dion, the
light which falls on a determined angle is spread in all din·etion, including the
ceiling and the wall, where there is no interest in illuminating,
Optimized geometrical forms may be calculated and some manufacturers
already produce these light fixtures in Brazil obtaining an efficiency of nearly
90%, inside a spherid'cone of 60 degrees opening (measure between the
generating line of the cone and its median line) centered in the fixture and with
its base on the ground. Even though the manufacturers do not totally
understand the optimized geometrical form, practical experience and the
availability of good quality reflective materials, already allows this type of
product to be found in the market.
The reflective material which has been mostly lIsed is the Silverlux film,
which is imported from the United States and offered in the domestic market
for US$ 30 per square meter. It is a film composed of a silwr deposit on top of
plastic on one of the sides, while the other side is made of a self-adhesive
material.
Another product which is available in the American market is the metal
sheet on which the manufacturer has already fixed til<' film, Siln'r deposition
demands on sputtering techniques and its price in tli!' Brazilian marlwt may
f'(~ach approxlll1ately l'SS 20/J)('r square Illl,tl'r all'l'ad,\' COl!",r!I'ring tlw ll1l'tallic
material.
The fir"t option has beel! uspd mainly I'or application on aluminiulll,
Otl1('r types of material have not ofl'PI:pd satisfactory adhen'ncl', Thl' :'l'c(Jnd
option may he applied in aluminum and iron shppt::;. which I:' ;111<>lIwr
ecollomical advantage.
Beside:3 these two alternativps, anudizl'd aluminulll ,,!JPI·t:3 and ;..:-Ia:,:,
mirrors ,11'(' <11:30 used a:3 ref1ecting material. Hi,,!J rPlll'cti\(' ;llwdizpc! aluminum
is llot availahle in the l'uuntry and the anodization ha:- to he lllildp in "mall
enterprises on liPmand, TI1(' pl'(lcedul'p has allll(lst no qualin' ,'(lilt I'O\. \\,hic!J
means that a(""(lrding til thl' lo!. t1w quality of th,' pl'odu,·t \;11'1":' :\Ilodizl'd
aluminulll rpf1,'ctuls \\",'n' I\('q'r producl'd III thIS ("uunln' \\'Ith th(' ,,;111](' qualit,\'
as thosl' fllund ill tlw lndll:,tnalizpc! cOllntl'il''', E\'t'n th"lI;,,:'!J tilt' lllllTIII,(,d
glasses art' of;1Il excl'll,'nt quality till'.\' 11a\,(' tIll' 111l'()n\'i'1l11'IlCI' III' tlw \\'l'ight
anc! high appli,'ation ("(1st (Ill lllt't;l!:" I"l'qllirillg gIlIt' and ;lllht,,,i\'l' (;ljw" a:' \\'1·11
rq

as l,'Teat quantity of labour. TIll' possibility of importing anodizpd aluminum of
gTPal reflective power was considprpd by the Brazilian Illumination ;\SsOClallOn
fABILUX) but it never took plan'.
Sume tariff barriers on t1w institutional side wen' !"('ll1m'pd in order to
make importation Pelsier. The Executive Group of Energy !\alionalizalion, an
intenninisterial pntity, was able to obtain a reduction from 2f)Cr to zero of tIll'
import tariff on Silvprlux film. which allowed its sale for USS 3U/mc, Otlll'r
efforts made in till' same directIOn for anodized alumilllLIl1 and sheets Wilh
applied films have not shown any I'psldts yet. The impact of the importation tax
on the product's final price is rplatively higher than the reduction percentagl' of
the tax because other f'pder:1j and slate taxps a]'(~ abo charged in additiun to tilt'
,:-en'ice taxes of ports and airports ..~n pstimatp shows that :l product which 1:
importNI in lot" :IL a \'nllll' 111c:lwr than U:SS IO.OOD. "nd,,,; \11) \\'ith a 1'11,,1 ;-)(1',
ili,.dwr thall lh,' impurt pri,'", I'ur;l <'tbtum t:lx Ill' 2S' '. :tlt"I' ;III 1:IXl':- ,md
:-t'J'\'icl's an~ pait!, ,\ n't!lIl'11i<11 10 /I'l'£1 (d' thb tax show,.; ,l d," 1'1';1:-" III l:-J'/ 1111
til(' Illlport Illl:li pl"l"(',
In til<' '::\':-" lIl' Ih,· l'j11':II-nl 11ght fixtlll'l':- WP C;\ll :-1'" II'dl I ill' Illl'or111;llliin
01' its exislpnce 1:- knowJ) 11\' :\ :-mall "lite "incp 1~)9D, '.\'I1('J) ,1-111:111 PllIIH'prJIl:":
1:'l\llp,;titioll prllll1011'd hv till' Ullivprsity 01' Sao Palllu. n'qll"~IHi Jig-ht I'ixtlll'P:
with ;111 dficieJ)c\' "tqwriul' (u 4:2 11l1l1l'n,\V fro1l1 llw lI1arkl'!. This infoI'111;1111111
ha" !JPPll spn'ad ,~illC(' lh"n :1Ilt! th"n' all"':)(I\' a!'" SOIl1l' "lltl'rprl"" ;""TOllp:- \\,1\(1
ila\'!> dpll1anl!l'd Ihl' liS" 'Ii .'lficH'J)t light rl:\tlll'l~" 111 tl1l'11' Ill"ll!l'ct,.; Cor 199~, TIl£'
malll llliillllCactlll'l'rS an' :\I:-u :\w:ln' ul' tIll' jll'lIUllct'" ('Xi"«~IlCl' itnd of il,..,
[llltPlltial ill lIH'(lilllll tpnn :-)'1111<' ,'ll:..:-illl-Prlll:": I:UlI1pCll1lE'" :11'(' :-till llli,..,l11f,lrll1l't!
:ll1d this has pr(Ivnked h'l'Pal [P,:hllologicid 111t'l'tia,
RI~g-arclill:": product lOll ,'apaclt\', ;1 jll'lIiollnd kll(>W!"c!,:":l' "f thl' ]'('qUil'0d
:..:'ponwtry :drp<HI\' ('xi,..,ts 111 thr Llli"ersity it"; well a" ,-OllH' kllll\\'i"t!ge ilcqllln,d
Iw ,~I)Jne manufacturer" hy llw trial and ,,!Tor llll'thl,d, Till -:lk:-1WI>U]k :In'
"till 110t prepart·t! tu "I,ll thl' prueluct fur lh,,\' ha\'(' 11111 Ull l!"I'-l')IIt! till'
:11l\-i1.ntag-0S III' til" ,'qUipllll'Jlt :mel tl1l'rpfof'(' !'ind it difficull 11~,,11. \l'Il'£'
ach'ertising uf tlll' prol!lIl'l 1:0 IH'ct;o,sary a:', well as cunfc'j'('llCI':- :llll! "Pllltn,JrH',o
l'apabll~ of :ittr:lcllll~ 11 l'{l!p l', ,'ng-lIll't'l'lng C(llllpilllll':-',
Thpl'f' ;In' ~t ill ~OIlH' dtlficult IPS in t h(' 1:;1"1' tif t('Chlllll'I~.': 1"1' lb('
prpp,1I'atioll <Jf 1il,' 111:I1,'ri:J!, TIll' tpchniqtll, <Jr llwLli ''':IClIlIlll ':"P"~ll1lln h\'
('\'aporatiull b Pl'ill'tl:-l'd l'olllllH'l'ciallv for til" d"p'hitllJll lIi' :JilllllI1l\l1l1 III
r II[

/6
pja_~llc_" Til" IOII-<i'liltnin~ t{'c!lI11qUl' i;; \\"(,11 undl~r.<l()()d ,lIld u.-l·d nl
l;nln'L:iJl)(~_- ilnd I{l~,~l~arch (:C!lll'r:-, Ono of tlll' big lIght fixturc~:- flrm:- IS a
multinatloll~tl t'lltprprJ,~(' and It Iw:- no difllcult,Y ill !lrinf.'1ng in llTllllO!ogy from
it:- headquarter:-, If thl' oth(~r enterprises would hi' motivated h\' theu'
competitor,- t11e,\ could bring tht· deposition equipment from abroad and fine!
jocal experti::il' and lal)(IUr HI produce thenL
Thl' maill lack of interest in till" production of tlw reflectivp material l::i
the :illlall demand markel, up to now, reflpClive light fixtun,,, '11'1' sold in
qUilntiti(~:- of se\'(~ral thousands per vear and it i" not a oig hU:ill\I'sS yeL
_-\notiler probil-:l1l which hindl:r:- tl1£' ll::ip of product clll(' to lack Df
[l'Cllllll'ai C'"lljwtl'IlCP lIf th(, buyt>r", !.- that the,\' hll:, the effinent light fixtlll'l',
!H'CdU:-'l' l,f thpir appl',II'<JnCI' and IH'\"l'r worn' wltli qllilntitatiq· 11:,<t:- when
ch(lll"ing ur rt'Cl'I\'lIlg th(· merchandbP_ TIlI:- worL- agall\st ((;chll"lug'lcal
prugrt'"'' bl'C:1U"I' (1]1 (Jill' hdncl It allow::, tlwl bad quality proc!uct.- i'l' "uld, dlld
011 thl' otlwr hilnd tIll' bll\-('! i" not satisfil'd \\-ith th,· IlpW tl'elmol"!-,,, lhu,.;
d\davill~ it:- lI";l'
1.3.12 Electric l'eactol'S fOl' gas disch:u'ge lamps
\Yl' r111llk t hd! III thl last dC'Cddl', til(' first l1oticl'abll' "tl'ji lil\\',Jrd"
impro\'t.'Ill('1ll of thi' I'l\prg~, per!(lrlllallcP 01" tll(' COll\Tl1tional flllOrt''';CPllt ,'-'vs[('m
i·Hl\Y! wa;- tllf' Illtroduclitlli td' tlll' ,;witclt rI,illll't;JiIIl' placed III "1'rIP:- willI till'
Illal11\'l1t:- ,1 IIII III til"~ IIIlt'ri,'! or lh,' cI i,.;clt'l 1""," tlllll' ,>I lhi", lalllp Tlu~ rt'.'-'ultt'd ill
,I Lll11p o! IIOlIIII};ll pOWI'1 ;:-;-\\ \dudl 1111';IIL-, that [ll~' 10",,,, III til<' iildlll('I1t.~ :;-:\\1
dlllll!;": [11" 1\111l'[I<IIIIII;": of til!' >\',-II'I1L "lop,- ".'(I,.;tlllg \\-ltl1 th,' lIlt"IT11J11 1<)11 III"
tl11- Ul"clIIl ,!iII'1" til" i,C:'l1itloll oj till' 1,11ll!' L'I1I"rtllll,I[('h- till' l!IqJlC:dlIOIl or tlti"
{I'l'illl',jO~'" iw:-o IH"'11 ,dlll(l_~1 1I1:-01~'llilil-iI111 dlld (1IIh' 'III,' IlldllllLIl'1 1I 1... 1' 111 lha/,il
produce:- till"; typl' oj' lamp,
_'\ppr"xilllat(']y tl1rPl' \'(,ilr,.; a",'\I, thi", Sdlll(' Id<Cil 1 of disCOlllll'ctlllg tilt'
fildllwllt::, I wiliell i,.; abll' to r,'c!lICI' llWI'(' o!' le.~.-, 7( ( thl' pOWl'!' of thi" 1.\'1)(' of
1n1llP 1-10\\',. wa" launched III till' BLlziliall IlWrl\.l't 11\ mallllfmtllrt'" of
l'lI11\,pntiollal reactors, Till'" il1lw\'atlOll consists of all pll'ctrollic "\\'Itch which
di"colllll'et,>d th,· L:oib that I"l'l'd llll' lamp'" filalllPllt" illitolllilticalh aftl'r till'
sran, Thl" 111Ilm-illlOll dOl'" l10l vel !t;!\,(' llw pll[l'l1tlill llf being Llpidl,'>' illTI'I)\I'd
ill tl1(> lllarkl'l a" thl' first Oill'. j'or It I::' dl'stilH'd to Ih'W illstallalioll alld
PH'lltlial suhstitlitillll':'> Itlw COllvPlltiollal I'l';lctor" hit\"(, a Iif't' expectallcy of' ]0
,\'ear::' 1 amI has IIO! ,V\'[ lH'(,1I di\'ldg\'d a" I'Xpl'Ctl'd, \\t' htdievl' that till' priet,

.~
difference in relation to the conventional reactor and thf' lac k of consideration
for small economies, all behalf of the project engineers, an' responsihle for th£>
reduced usage of this product.
The first technical developments ..... ith views to obtaining the electronic
reactor (re) were also started in Brazil at the same time three years ago. There
are today at least five manufacturers who have this product for
commercialization and we know of others who are still developing it. Some of
the prototypes we examined sho..... that:
a) the electric current in the lamps discharge has a frequency above the
audio band;
bl the relative efficiency of the system (in Im-W, is located in the band of
+20 to 3or/i-, when referring to the conventional reactors (elect romagnetic)
for two fluorescent lamps;
c) the power absorbed from the network for tlw sanlf' luminous flux is -20';'
in relation to the conventional reactor;
d) the electric efficiellcy is superior to gW!i against 75"i uf the conventional
reactor;
In spite of the above mentioned advantages, in some prototypes the
power factor is still situated around 60'/(.
1.4 Barriers and possible lines of action
The technology-defined cases described above point towards severell
major problems/barriers for the market penetration of energy efficient lighting
equipment and design. Observations made at three professionally oriented
seminars during Rio 92 complement and broadly support this early diagnosis.
The problem of quality control in the manufacturing of lighting
equipment appears to be widespread, Thii:' can be seen with lamp lifetimes.
Guaranteed lifetimes often do not even exi"t, The past record for many key,
already commercial technologiei:' is frequently poor. High pressure sodium
lamps appear to have a real world lifetime in Brazil of 6,000 h versus a norm of
25,000 h. Much smaller uncertainties regarding this basic parameter can play
havoc with any financial!entrepreneurial analysis of additional investment in
lighting efficiency. This is not entirely a problem of manufactures' quality
control. Maintenance, operations, and uncertainties regarding the specified
quality parameters of electricity supply all playa role. Equipment lifetime is
also only one aspect of the quality control problem .
r - .--.r

The problems of operations and maintenance, not to mention appropriate
initial design of lighting systems, make training programs for technology users
a high priority. This "human resource" theme will be returned to, because it is
central to energy efficiency initiatives in consuming sectors with very diffprent
characteristics. The priority need for "education! training" and accessible
information permeates most Brazilian analysis of how to "modernize" the
economy. This is partly a consequence of the low standard of Brazilian
education, especially basic education, as already discussed.
ThE' problem of overall quality control effects both "conventional" and
more advanced/efficient lighting equipment. Advanced equipment sutTers as
well frum a !,'Teater relative price differential than is found in industrial
countril's. This greatf'r differ('lltial inhibit,.; it "hift toward" more enE'rgy
efficient l'quipnH'nt. Spveral factors can playa role in creating it. First, tlw
industry is cartelizecl and has considerable protect ion f;)r ib products. Second,
imported components weigb more in energy efficif'Jlt f'quipment and may pay
tariffs though the reduction of import barriers has Iwen achieved for certain
key components. Finally, the small size of tllP mark"t kPPps costs high.
Strategies are Iweded to break the high cost - high price - ,.;mall market
triangle which particul::nly limits some technologies. Largpr market volullle can
help reduce costs, opening new seglllents of demand in a virtuous circle.
Spveral market oriented approaches are worth following. Financing
mechani"'lIls to reduce first costs appear to he nl'ces",ar.y. Capital is very
expensive in Brazil. It can earn 20':'( (real) in highly liquid low risk pap!'!',.;.
People's implied discount rates for persollnl consumption decisions, are oftpn
much higher. In addition, l11allY lighting systems are plllThased and installed
by entities who will not pay the ope]'f\ting hill and who think only of
minimizing up-front costs. Different mechanisms and institutions will prohably
be required for different segments of the lighting market. At present no line of
credit exists for any end-user investment in efficiency.
Another, complementary approach, emphasizes increasing the awareness
and information availahle to potential investors while reducing their
"transaction" costs in planning and carrying out elH'rgy l'fficil'ncy invcstnwnts.
A good example of this approach is the "Green Lights' program created in early
1991 in the U.S. hy tlw Environmental Protection Agl'llcy. A variant of this
program is heing estahlislwd in Mexico and another is und!'!' consideration in
•

by their power input and not their luminous output. This led to a surrealistic
impasse on labelling norms that contributed to the demise of "energy saver"
(first generation)- incandescent bulbs described above. Implicit in labelling
programs or the establishment of norms is the existence of neutral laboratory
facilities for monitoring performance of different products.
Another set of "command and control" measures involves government
regulation of the electric utility sector. The need for regulatory reform, part of a
wider change in the institutionaIi financial model, is recognized as urgent,
though negotiations have been complex and slow. Reform is likely to be
necessary if utilities here are to make significant investments in end use
efficiency and firmly incorporate "demand side management" (DSM) into tllPir
sprvice expansion strategies. Distribution utilities esppcially feel little financial
incentive to promote DSM. International experience suggests that actiw utility
led DSM programs can make an important contrihution to overcoming market
imperfections. In the U.S. they were crucial to tlw consolidation of "Energy
Sl'rvice Companies" (ESCO's) though DSM doesn't necessarily imply ESCO's.
These new intermediaries help reduce the transaction costs and risks of energy
efficiency investments.
BSCO-type companies exist in Brazil, but their market is still very
precarious. The consolidation of this kind of service could contrihute tu casing
market acceptance uf lighting another efficienc,Y improvements in the
comnwrcial and industrial sectors. Utility led DSIvl is still very limited in
Brazil. \-Vhile regulatory reform is ultimately necessary, it wuuld be a mistake
to paralyse SM while waiting for this unpredictable process to reach a
conclusion. There is a gTeat need for pilot programs to develop and test various
measures,
So fal' electricity pricing has not been discussed. The average electricity
tariff in Brazil is substantially below the marginal cost of supply. There is an
important school of thought coming out of neo-liberal economics which believes
that if the price were brought up to the marbrinilJ cost, uptimization of demand
would occur almost automatically with a helping hand from trade liberalization.
Most measures raised above are of little or no value in this view. The authors
do Ilot ab'Tee with this school's diagnosis. Full cost pricing is neitlwr a
necessary Ilor a sufficient condition for achieving much cost effective energy
efficiency gains. Obviously, it is desirable that pricl's rl'fleded full marginal
'111'.- I_ --

costs (including externalities) and higher prices will cl('arly help viabilize
additional energy efficiency gains. However, even with tlw existing inadequate
tariffs many efficiency investments are cost-effective 13 I. Furthermore, in at
least two sectors of demand (low-voltage commercial and larger residential)
exi~ting tariff levels equal or exceed the marginal co~t. These two sectors also
offer a rather effective rebuttal of the purist neo-liberal \-iew that full cost
pricing is sufficient to stimulate an optimized demand adjustment. By this
view, the efriciency of energy consumption in these two sectors should be
markedly better than in the rest. There is no ('videmE' that it is. Either
con"umers are magically correct letting opportunities to earn returns of 30'k,
40( ( or more pass by or there are serious market imperfl'ction~ at work. We
believe that the latter alternative is more reasonable and far abundantly
documented. The measurps discussed above an' attempts to address these
market imperfections. This does not mean a blank check for a philosophy of
go\"('rnment intervention. The measures propos('d han- the objective of helping
tlw market adjust closer to the new optimum suggpst,~d by the electricity price
signals. The kinds of measures being discussf'd should lJf' regarded as a key
complement to pricing policy, partly in order to lwlp II work better, partly in
ordpr to make the large lwcessary increases in ,1\-('ra1-'e tiiriffs pulitically
acceptable. This latter point is very important and ha:- not been adequately
considered. If prices were easy to increase to (\e::-in'd I"yel by government
decree, that would have been done long ago. The \\"orld Bank has been
pressuring Brazil's electrical sector ever harder on thl::- point since 19S4, and
power sector loan negotiat ions have been discunt inuecl <13 a result.
Any discllssion of pricing and of utilitie< :-upp]\ demand strategies in
Brazil cannot ignore the importance of inflatiun. the uncertainty regarding
when and how a sustained economic recovery will OCCllr after a dozen years of
stagnation, and the near certainty that any Tt'Cow]"\" \\"111 quickly hit the limits
of electricity supply. Brazil is a country with a long hi:"tory of high inflation.
This history generates a culture. For example, Im"inE':-sman quickly reckon
(correctly) that at moments of increasing inflation the government can be ndied
on to hold back all electricity tariff increases, as i:-- ol'lurring ag~in now. This
short-term signal influences priorities. By-and-large tIll' pffects of a "high
inflation culture" are inimical to energy efficiency imp]ll\ements, or indeed any
major productivity - enhancing investments in industn and commerce. Firms
""I,,1-\.0

costs (including externalities) and higher pricf'~ will ch-arly help viabilize
additional energy efficiency gains. However, even with tl1l' existing inadequate
tariffs many efficiency investments are cost -effectivE' (3 J. Furthermore, in at
lea:-t two sectors of demand (low-voltage commercial and larger residential)
exi~ting tariff levels equal or exceed the marginal cost. These two sectors also
ofler a rather effective rebuttal of the purist nen-liberal yiew that full cost
pricing is sufficient to stimulate an optimized demand adjustment. By this
view, the efficiency of energy consumption in these two sectors should be
markedly better than in the rest. There is no evidencE' that it is. Either
consumers are magically correct letting opportHni ties to earn retu rns of 3OCk,
40', or more pass by or there are serious market imperfections at work. \Ve
believe that the latter alternative is more rea"onable and far abundantly
documented. The measures discussed above are attempt" to address these
market imperfections. This docs not mean a blank chf'ck for a philosophy of
gowrnment intervention, The measures propos(·d hayE' tilt' objective of helping
the market adjust closer to the new optimum suggeo'tt-d by the electricity price
signals. The kinds of measures being discussed should 1)(' regarded as a key
complement to pricing policy, partly in order to Iwlp It \\'ork better, partly in
onler to make the large nt'cessary increases in an'rClf't' tariffs politically
acceptable, This latter point is very important :-md ha~ !lot been adequately
con"idered, If prices were easy to increase to dl'~i 1'(.c1 I"\'pl hy government
decree, that would have been done long ago. The \\'orld Bank has been
pressuring Brazil's electrical sector ever harder on thi:o puint since 19ii4, and
power sector loan negotiations have been discontinued as a result,
Any discussion of pricing and of utilities' "uppJy dem:-l.11d strategies in
Brazil cannot ignore the importance of inflation. the ulll'ertainty regarding
when and how a sustained economic recovery \\'ill occur after a dozen years of
stagnation, and the near certainty that any reco\"el'.\' \\111 quickly hit the limits
of electricity supply. Brazil is a country with a long history of high inflation.
This history generates a culture. For example, husinf':o:oman quickly reckon
(correctly) that at moment::: of increasing inflat ion tlw gowrnll1pnt can be relied
on to hold back on electricity tariff increa:oes, a" j" Ol'l'lI rring ag~in now. This
short-term signal influences priorities. By-and-large the effe'cts of a "high
inflation culture' are inimical to energy efficiency imprnvpnwnts, or indeed any
major productivit), - enhancing investments in induo'try dnd commerce. Firms

dedicate disproportionate senior management to short term financial
intermediation. Consumers find it difficult to do more careful "comparison
shopping". Successive macro-economic shocks to bring down inflation add to the
uncertainty which complicates and inhibits investment decisions.
The hibernation of Brazil's fundamentally dynamic economy since 1980
has permitted the country' state-owned hydro-electrical sector to usually satisfy
demand without any rationing except for two brief occasions - 1978 and 1986 in
the Southern Region of Brazil, and in 1979 and 1987/88 in the area reached by
the North-Northeastern Grid. This relatively good performance of a state-owned
infrastructure sector in an extremely adverse business climate has probably
lulled Brazil's key political and business decision-markers into a false sense of
spcurity regarding an extrapolation of business-as-usual hehaviour. However,
among strategic thinkers in the electrical sector the consensus is different.
Unless measures are taken soon to advance Brazil up to the learning curve to
exploit its large potential for electricity conservation and private sector
investment in generation, it would be physically and financially almost
impossible to meet the electricity service requirements of a sustained and rapid
economy recovery, though San Pedro's rains are an element of uncertainty.
This convergence in the definition of the problem among diverse professionals
in the electric sector has lead to the creation of the only NGO in Brazil focused
on addressing it. The existing institutional channels for catalyzing such wide
ranging changes were felt to be inadequate. This new kind of entity is
appearing under various guises in Eastern Europe, the ex-Soviet Union, and
other Latin American countries, though there are important differences in
priorities and styles. Will they be able to contribute significantly to improving
energy efficiency? In Brazil at least there is a belief that such an entity can
make a difference, catalyzing and leveraging larger investment flows and
helping to create markets for relevant services. In the search for responses to
the challenge of more rapidly introducing energy efficient technology in
developing countries, the role of such NGO's and possible offspring should be
tested, stimulated and monitored.
1.5 Conclusions
There is a very large theoretical cost-effective potential for energy
etriciency savings in lighting. The rate of penetration of improved technology
will depend on policy towards electricity tariffs and wlwther market harriers
-lIT lII'TW""--

which inhibit economically efficient consumer adaptations are effectively
addressed. The realization of the former may depend on progress in the latter.
Achieving the latter will require creativity and change. These change from
ind~pendent and transparent regulatory organs of the government, to private
companies specializing in new market services (including subsidiaries of
utilities), to NGO's.
Within the context of invigorating policy towards energy efficiency
overall, lighting is an interesting early priority. The end-use equipment is
relatively short-lived. This means that changes in the profile of new equipment
sales can more quickly influence the energy profile of the operating stock of
lighting equipment than is possible in most energy consuming sectors. Also,
while there are millions of c~nsumers of lighting equipment, the manufacturers
of basic equipment are few and it is possible to define market segments. This
simplifies policy-making. Furthermore, light is highly "visible". These
characteristics together make energy efficiency in lighting an excellent target
for a multifaceted program which can begin to show palpable results in the
relatively short-term and can also have an impact on various publics'
awareness of the potential of energy conservation and how to do it. This is a
basic premise of the "Green Lights" program in the USA, discussed above,
which may be interesting to explore in developing countries.
The relatively slow penetration of more energy efficient technology and
system in the lighting market is a result of factors on the supply and the
demand side. On the supply side this report has raised pervasive problems of
quality control and larger price differentials between conventional and more
efficient lighting equipment. An approach to both problems involves liberalizing
imports of final products and components. Technology development and
acquisition do not appear to be bottlenecks in the lighting sector, though the
costs of technology acquisition were not fully analyzed in detail for this report.
While supply-side problems exist, the most important drag on
penetration has been the lack of demand "pull" for new products. The lack of
demand volume helps maintain equipment prices high. Various studies have
shown that very high returns can be gained on many investments in lighting
efficiency, even with existing unsustainabfy low tariff levels. The report
presented some of the major barriers to realizing this potential: financing,
information! awareness, transaction costs and the lack of skilled service
r··_
intermediaries. Some initial lines of action were sketched out. Brazil is well
down the learning curve for these kinds of measures. For example, the only
public sector credit-line for energy efficiency was recently cancelled for lack of
applications. It is an urgent priority to start launching a series of pilot
programs.
It will be very difficult to fully finance these pilot programs domestically,
even though their requirements are small relative to supply investments. The
government cannot escape its deficit, inflation remains very high, the utilities
are in financial crisis. There is a very strong case here for catalytic
international financing, especially from the multilateral development banks,
the IFC and the GEF. There have been, however, strong impediments to such
financing. In the case of the World Bank, the priority is to pressure for closer
approximations to the full marginal cost of electricity supply. Adequate
operational mechanisms to finance end-use efficiency projects are not yet in
place. There may be changes as a result of an internal review of the Bank's role
in promoting energy efficiency which js currently undPrway. The Bank has in
any case not made any new power sector loans to Brazil for some time, since
the government's commitment to increase average tariff levels has not been
fulfilled. One way out of this impasse might be to finance a package of
structural adjustment measures - such as energy efficiency, utility DSM
programs and private sector power generation and cogeneration - which can
create and improved climate for achieving and maintaining adequate electricity
tariffs, among other things.
In the case of GEF (Global Environment Facility), the criteria for project
approval have so far been highly unfavourable for the most interesting energy
efficiency programs. These generally have relatively high economic returns,
whereas the GEF is supposed to finance low-return projects in order to bring
returns up to an acceptable level. As a consequence the GEF has had to
downplay the most promising area for CO2 abatement in energy. Interpretation
of these criteria has gone back and forth during the GEFs pilot phase. It is to
be helped that with the GEFs consolidation of Rio-92 a compromise can be
settled on that allows financing of innovative energy efficiency programs.
Perhaps greater emphasis should be placed on market barriers rather than on
the projected economic return of a successful program.

Whatever the source, external financing CHn HcceleTHte the consolidation
of a policies to overcome market barriers to energy efficiency improvement and
the diffusion of new technology. The retur.ns should be adequate to attract
increasing levels of locHI financing.
2. Cogeneration technologies in Brazil - Potential and limitations
2.1 Introduction
Cogeneration is defined as being the production of electricity and usable
heat from a single thermodynamic machine.
Oportunities to increase the supply of electricity through the use of
central power stations are being reduced due to escalation in investment costs,
and the concern with environmentHI degrHdHtion, locally or at global level,
which is always Hssociated with more energy production(4). Decision makers
are becoming more interested in the use of energy "",ith high efficiency. One
way to save energv is through the development of cogeneration plants by
industries which use significant amounts of thennHI energy for process heat or
for space heating and cooling. Electric generation through a thermodynamic
cycle always produces heat as a by product; if this heat can be llsed we have
the potential to produce considerable fuel savings. Obviously central power
plants also have the possibility to operate in a cogeneration mode, where the
waste heat is sold to residentiHI customers for space heating or to industrial
customers for space heating or as process steam. This case requires installation
of a steam distributing network in cities, which implies a large investment and
is more suitablp for temperate countries. In this paper we will not discuss this
technology.
In this paper we diyide the discussion according to the final use of the
heat produced. Under item 2.2 we present the possibility of using heat as a
source of more electricity. In item 2.3 we discuss the option of direct final use of
steam and in item 2.4 the particular case of using heat as an pnergy input for
cooling air. Item 2.6 deals with the possibility of lIsing thp npw generation of
gas turbines for cogeneration units. Iterns 2.5, 2.7, 2.8, and 2.9 deal with
specific cogeneration applications in Brazil and their consequpnce,." It is not our
intention to present all their possible cogeneration schemes according to the
final use of the heat, as well as. \Ve have only sell'cted the most important
cases in the Brazilian context.
jD
.'

2.2 Cogeneration for central power stations
The cost escalations that have made coal-fired steam electric plants
expensive and have essentially killed nuclear power as an option for new
construction in the foreseeable future in the United States are due in part to
tightening environmental and safety rules.
Figure 1 shows that in the United States the electricity price had been
declining from 1935 up to 1973. After the oil shock, prices increased. Even after
1982 with a decrease of 70'k in oil prices, the average electricity price has
declined only 4% (5). The main reason for this price increase should not be
attributable to the price of fuel, but to the fact that the capital costs of central
station power plants have escalated dramatically.
Electricity rate increase and the Public Utility Policies Act of 1978
(PURPAl have led to a competitive challenge for utilities from independent
cogenerators and small power produces. PURPA requires a utility to purchase
electricity from cogenerators and other qualifying indqwndent power producers
at a price equal to the utility's avoided cost.
The b'Teatest challenge to utilities from cogfmeration comes from the
steam-using basic industries, where the economics of cogeneration are the most
favorable. Under this condition in 1987 the Federal Eneq,'}' Regulatory
Commission in USA began considering establishing a scheme to allow
competitive bidding for utilities incremental power requirements, a scheme that
would allow cogenerators, small power produces, other independent power
produces, and utilities to compete on the same basis(6).
To compete with cogenerators utilities have to exploit the possibility of
improving the efficiency of traditional steam-based electricity generation or to
search for alternatives that will allow them to use the produced heat as a
source of more electricity. Unfortunately the possibilities for improving
efficiency of steam-based plants are not good. The efficiency of modern fossil
fuel-fired, steam-electric power working at steam pressures as high as 24MPa
and temperatures of 540°C, has not improved since the late of 1950 when such
peak steam temperature were reached. Under such conditions, as shown in
Figure 2, the maximum net efficiency of a steam plant does not surpass 40<7£,
which is quite low as compared with the full energy efficiency n~ached by
cogenerators, which easily reaches 80'k.
31

One possible alternHtivp is the use of combined cycle technology.
Combined cycle technoloh'V is familiar to the electric utility industry worldwide.
In a combined cycle,H gHS turbine produce::; mechanical mH'rgy to rotate an
electric generator and producps heat in tlw form of hot air exhaust thHt is used
to heat water and produce::; steam which drives a conventional steam-based
electric generator. The interest in this technology has increased in the last 10
years, since gas turbines have become almost as efficient as the best steam
turbines. Up to the early 80::;, the historical attraction of gas turbines for
utilities has bpen its low cost of $300 per kW(7) or less, a small fraction of the
cost of coal or nuclear plants(h). Simplicity has been the major, target of gas
turbine constructors and even thuugh the turhine inlet temperature is high in a
ga:o turbillP 11l00"C cOlnparec! tu 540'C in a steam turbine), the efficipllcy has
bppn less tl1iJl1 :10'",. Th is COllst raint as>;ociated with tl1£' cost of better qu ality
fuel (natural ga:o, kprospne or dipsel oil I limited tIl(' ga", turbim' in utility
applications mainly to peaking :orrvicp,
More recently sen·ral improvements in the design of gas turhilH'S,
mainly sma lIn size" uf the ;wroderivatin> type, have sil,,'llificantly' increased
efficiency. For pxalllpl(,. a comhined c'ycl(~ was put into oppratioll in 1986, for
the N.V. Jj,."e]cpntralp, a Dutch utility cumpany with ,I gross power efficipllL)'
of 50</«(8). The plant U:OI'" 2 LJ\12500 ga>; turbines, one stl'allJ turbine and the
plectric gellerator eouplpd together through only OlW axis. Power output of both
gas turbine" i" 42I\lW with a gru"s pfficiellCy' of 35(/, wbik the steam turhine
pruvide" 101\IWl'. allowing a g]'()s:o puw(,r uutput of 60I\lW, Total natural gao;
consumption is (·quivalent to 11 (J1\IW, yielding a gross efficiellCy of SO<, , This
system lia;-. a n~markahl(' l'fflcielll'Y hut due to the use of H small size steam
turhine has a priet, per kW aho\"(' llSS1()(IIJ.OO, as shown in Fipne 3,
Other improvemPllts haH' achil'vpd high efficiency with a price pC'r k\\'
very much the same as the gas turhine single c,vele gHs turbine, The
improvements allow the use of the heat H~leased with the exhaust gases to
produce steam which is inject(,d back in the combustion chHmbn of the turbine.
These unit;-. cHlled STIG arp being used in commercial applications and there
are 30 units in operation. cOllstruction or under order in the USA alonp. Tlw
largest unit l'UlIllllelTia 11.\' ;1 \'aila hIe is bas(·d un t hp GE L1\J-5000 turhine !used
in the Boeing i4i airplane), A" a simple l·.wl" it produce:o 33]\]\\"p at 33 percent
efficiency wlwn opl'rated Ull Ilat ural ga,. fue!. \\"ith full stl'am in.i"ction thi"

engine produces 51MWe at 40 percent efficiency. Turnkey STIG units of this
capacity packaged on a skid and without a building are commercially offered
for about $700/kWe(9).
Another alternative to steam-based power plants is to use the evolving
technology of combined-cycle. For example the GE LM- 6000 which should be in
the market in 1992, will produce 42.4 MWe at a simple cycle efficiency greater
than 36 percent using natural gas and will have an estimated gen-set
equipment price of $250/kWe(l0). Combined cycles based on the LM-6000 are
expected to produce 53.3 MWe at an efficiency of 48 percent( 11).
Obviously such remarkable performance is attractive but the total
electricity generation efficiency is not above 50 r'r, which is low compared with
the 80~'c efficiency obtained when steam and electricity can be simultaneousl~'
used as end applications(8). Neve]'thele~s central power station with such
efficiency are able to compete with steam and electricity cogenerators, because
electricity has a higher value as compared with steam.
2.3 Steam and electricity cogeneration
This is a well known commercial practice. AlmoH all producers use a
steam - Rankine cycle, a technology 100 years old.
In general the higher the peak temperaturp of the working fluid the
higher the thermodynamic efficiency of a power- generating cycle. Most of the
units are of small size (up to 30MWe) as compared with central power station
(200MW and up). Due to the small size, economy of scale imposes high
investment cost per kW, as shown in Figure 3, and also limit the maximum
achievable electricity efficiency. Such units when designed only for power
production have efficiencies of 14 to 18 percent in CaliforniarI2) and from 10
to 16'1r in the North of Brazil as shown in Table 1 (13).
Such levels of power generation efficiency are achieved with a fully
condensing turbine. When large amounts of steam are produced, the power
generation efficiency can be as low as 50r, as is very common in sugar mills in
Brazil(l4). Such low efficiency is the main reason why slllall scale electricity
production is not understood as a good business foJ' largf> entreprenpurs.
2.4 Air cooling and electricity cogeneration
This is another technology well kno""'!l for sf'\,pral decades, but only in
the last few years has it become the object of cOlllmcrcial interest. Air cooling
1If1lI~

can be obtained with absorptioll pumps that USl' hot air or stl'3m as tl1('
provider of energy input.
Absorption cycles us£' a vaporizable liquid, for eXHlnph' ammonia, as a
refrigerant and a second liquid, for examph' watl'r, as an absorbent for the
first. A schematic diagram of the flow process involving both the water and the
ammonia is shown in Figure 4. The right-hand size of the diagram is identical
to the condenser-evaporator arrangement of a device utilizing vapor
compression, cycle, except that there are no longer a compressor and a
throttling valve linking thel1. Instead, heat enen.,')' is used to drive an
absorption-generator unit which effectively acts as a compressor. Tl1P ammonia
circulates completely around th£' circuit, that is from the eVflporator through
th£' absorber flnd generfltor to till' condpnspr, whpreas thl' w(lier only circulates
bptwl'en absorbl'r and gl'lwrat<IJ'.
In th£' condenser tIll' ammonia los1'S heat and cond£'l1ses. TIl(' liquid
ammonia is passed through a flow valv£' to thl' evaporator. Here the pressure is
sufficiently low for evaporation to occur, the latent heat being extracted from
the evaporator surroundings. The ammonia vapor enters tlw ahsorhl'r whp]"(' it
is ahsorbed by the water with an accompanying relpasl' uf tIll' heat of solution.
TJw cO!H.:cntrat£'d solution can now !Jp pas:-l'cI pasily to till' high-pressure region
of the generator using a pump. iAs till' ahsorptiol! proce",,,, hac, effectively
"compre",,£'d" th£' ndume of Yap"r thie- i", nut ,\ l'Oll1p]'(',;,;ur, but lll£'rely a
circulating clP\'ice requiring litt]" plll'rgyll:"'i)I. In thp generatur tIll' water ancl
ammonia are ag-ain separated using Iwat pncrgy as the eneJ'g:v pre,;cnt at
exhaust of a thermal equipmt'nl. TIll' watcr flo\\,,.; back to thp ab",orber via a
flo\\' control vahe and the ammonia vapor pas",e,; directly to thc condells£'r.
1'hu:, the absorpt ion refrigeration c~Tle j" ('""ent iall)' a heat engin(' (mel (l yapor
compression cyc!r' combill£'cl. The t£'chllo!ogy all"ws the "'lUll(' cnprh'y ."£'rvice a."
tlw conH'ntlOna] (']Pctric pumjwd co"ling "v",telll with one only fourth of tlw
elpl'lricity consumption and \\'ilh tlw significant Pl1\'irOlllllental acJvantage of
ayoiding the us£' of eFe gas('"" silll'(' it use" ammonia or lithium bromide as the
cooling agpn t.
In tbis circumstance :-,mall scalp plectricit~, gl'neration can 1)(' performed
in a thermodymllllic cycle' and the heatecJ exhaust air can 1)(' u"ed directly in
the absorption PUlllP or imlirectJ.\' through the production of sit-am. CumllH'rcial
cooling systelll are lower thall ;jOOO Tf\ PP]' h"\lr which is compatible with the
II'

generation of less than 10 MW of electricity. Due to the small size, as
compared with central power station, the economy of scale in the investment is
an important adverse factor.
Absorption air-cooling systems are being installed in USA in systems
that use gas turbine or diesel engines for the generation of electricity. Gas
turbines are less efficient than diesel engines for this range of size but have a
longer operational life. Initial investments in the USA are very similar for both
options, but this is not the case in Developing Countries. Diesel engines are an
old technology and some Developing Countries have the capability to produce or
to assemble such engines. Gas turbines are a new technology for them and
almost all the equipment has to be ialported with a consequent increase in
price due to taxes, transportation and outside assistance.
2.5 Case studies for Brazil
Thermoelectricity is responsible for a very small fraction of electricity
g('nerated in central power stations in Brazil. Tlwre ar(' a few coal based steam
turbines being used in the southern state of Rio Grande do SuI. Such units are
of small size as compared with the international market (around 300MW per
unit) and the total installed capacity adds up to 1500M\iV. The efficiency is not
good (28<;'( in average according to ref. 16) and they haw to compet!c· with
hydroelectricity since they are connected to the major gTicl system which links
the South/Southeast and the Centerwest of Brazil.
There are three other medium size oil-fired steam turbines units (500 to
200 MW) in operation in Southeast of Brazil. They also complement with
hydroelectricity and in years of normal rainfall they are used less than lOC;'i of
the time, a little less than the coal-based stations which run with a load factor
of 20'{, under the same circumstances(l7).
In Amazonia there is more space for thermoelectricity. Isolated systems
are mainly supplied by single cycle gas turbines using a blend of light fuel
oil/diesel or diesel engines coupled to generators(18).
On average thermoelectricity supplies only 4'k of the total electricity
demand(6).
It is only in the last 6 years that interest in the installation of more
thermoelectric units based on fuels other than coal has appeared. For central
power stations the largest project being considered is the installation of a
450MW complex fueled with natural gao,; from Bolivia and which should be
•

installed in Bolivia, near the frontier with Brazil, for the purpose of exporting
eletricity to the South/Southeast/Centerwest linked grid(19). The project was
object of a contract between Brazil and Bolivia and the interest of Brazil is in
the reception of the electricity and not with the technology used. There is no
clear information about the equipment that shall be used but some
information(20l claims that single cycle gas turbines may be used.
Another project under discussion is the proposal of the Companhia Energetica
de Seo Paulo to install two steam-based thermal plants (700MW and 350MW)
near oil refineries to run with very heavy oiI06,18). Another possibility is the
proposal to convert the oil-based steam thermal plant in Seo Paulo state
(475MW) to a combined cycle, with the additional installation of gas turbines.
This project would require an investment of 1 billion dollars and would increase
the plant output to 1200MW.(22) This proposal has been much criticized, since
the existing plant is 30 years old and was designed to use high pressure steam
010bars) which will not be used in a combined cycle.
A program which is being seriously executed is the production and
exportation of electricity to the grid by the sugarcane industries. The sugar and
ethanol mills, installed in large numbers (359 units in (23)) to supply the
Program a Nilcionill do Jcool (PNA) since 1975, were designed to use very
simple technologies, including that for the production of electricity and steam.
Since the begining of the PNA, mills were equiped with steam boilers fueled
mainly by sugarcanE' bagasse and, when necessary with wood. Low pressure
steam is required ill large amounts fur thp production of sugar and as much as
500 kg of steam is consumed during the processing of one tonne of sugarcane.
Since steam has to be produced for the distillation process, most of the mills
were designed to produce steam at a pressure of 21 bars, which means that this
medium pressun' steam can be used initi811y for providing mechanical power
and the low prpssure escape steam for heating the distillation columns. Up to Ii
few years ago. there was no reason to he efficient since the surgacane residue
had little or no value. Low efficiency boilers are able to provide up to 20
kWh/TC and 500kg of steam per TC, which is enough to run the processing
planU20)
Technulog\' is available for the production of much more electricity per
tonne of canp (Tel A recent evaluation carried by Eletrobras and
Copersucar(24 \ concluded that steam turbines burning sugarc8ne b8g8sse can

produce as much as 83 kWhtrC, as well as, all the steam required for the sugar
and/or alcohol processing.
The study investigated six alternatives to enhance electricity production
from sugar mills in Sao Paulo state. The simplest one is the reduction in the
amount of steam required for sugarcane processing. Steam reduction from 465
kg/TC up tp 332 kg/TC were analysed as feasible. Alternative 2 proposes
cogeneration with steam extraction at the limit of steam pressure required for
[he process, using boilers from 21 up to 80 bars of pressure. Alternative 3
foresees the use of condensing-extraction steam turbines with the use of 10070
of the bagasse and other sugarcane residues during the season, with steam
pressure of 21 up 80 bars. Alternative 4 is the same as 3 plus the burning of
iJiogas produced from stillage fermentation. Alternative 5 is the same as 3, plus
Lhe burning of dry stillage and Alternative 6 deals with a complete different
technology - gas turbines (see section 2.6). Investment cost ranges from US1300
La US$1800 per kW produced using stealll turbines, which means that all
investment of up to 20 million dollars is necessary to take full advantage of
the efficient use of the sugarcane bagasse and residues available in a mill
,)rocessing 300 TC/hr (650,000 lIday of ethanol during the season). This is a
.ignificant investment since a conventional mill of this size requ ires a total
l11Vestment of about 40 million dollars. The increment in investment is high but
,he study concludes that further electric generation is cost effective if electricity
:an be sold to the grid at US$55/MWh (48US$ for the generation and 7USS for
the avoided transmission investments). Total electricity production from
"ugarcane and residues using steam turbine technology can be as large as 19.2
1'\Vh or about] or/( of the total electricity consumed in Brazil today.
2.6 Advanced technology status
Another possibility is the use of gas turbines using sugarcane bagasse
:md residues as a fuel. This technology requires gasification of biomass, as a
front-end process, to provide the adequate fuel to the turbine. There are no
commercial instaJlations in the world based on this technology but research is
111lder way and projects are being developed to use its potential.
Biomass gasification, like coal gasification, is by no means a novel
concept, as, fuel gas has been manufactured from coal for some two centuries.
Throughout the nineteenth century and well into the twentieth, the most
familiar fuel gas was "town gas", a combustible mixture of hydrogen and carbon
3lIl"-~-'

monoxide produced from coal, used for lighting and cooking. After 1950, the
most successful fuel gas has been natural gas and its upsurge has been a key
reason why some markets for coal have dwindled. In the 1990s, although the
competition from natural gas has became even more intense, fuel gases from
coal and biomass are gradually edging back into contention.
A variety of large scale coal gasification units have recently been
assembled and become operational. In 1975 British Gas (UK) constructed a
commercial-scale prototype gasifier in Westfield, in Scotland. The reactor
operates at high pressure (23 bars) and uses pure oxygen and steam to gasify
550 tonnes-per-day of coal. The performances has been quite good and the unit
was used mainly as a test bed for different trials for various applications. A
Rolls-Royce SK 30 gas turbine was installed in 1986 and supplied electricity to
the South of Scotland Electricity Board.(25J
The international oil company Shell began its own coal gasification
program in 1972. A large experimental unit, with a capacity of 150
tonnes-per-day started operation in 1978 at Shell's Hamburg refinery in
ex-\\lest Germany. It operates at 23 bars and also uses pure oxygen. A full scale
commercial demonstration unit was completed in 1987, at Shell's Deer Park
facility near Houston, Texas, with a capacity to gasify 250 tonnes per day of
bituminous high-sulphur coal. The unit is in operation and according to EPRI it
has met and exceeded all environmental H>quirements. Shell has always been
interested in the production of electricity as an end-use of the fuel gas. Thus it
decided to install, at Buggenum, in the Netherland's a plant able to gasi(v
2,000 tonnes per-day of bituminous coal for generating 285 MWe, from a gas
turbine generator and 130 i\,1\\'e from a steam turbine generator (com bined
cyclel. Net efficiency of the plant should be 43.2 percenU25) The plant is duc to
start up in 1993 and from Shell's experience they believe that a new
commercial unit with 400 MWe will cost US$1400-1500/k\" 0990 USS dollars I.
Texaco is also very interested in the electricity generation business and
its gasifier designed was used as part of the Cool Water project. Under this
project 1,000 tonnes of coal per day was gasified at high pressure, using oxygen
and a combined-cycle power plant. An EPRl study published in late 1987
suggested that electricity from a mature commercial plant with tlw same
technology would be able to sell electricity 10S'{ cheaper than from a
conventional coal-fired plant with the same emission quality. The plfinJH'cJ

experimental programme was completed in 1989 and was shut down, since its
overall fuel efficiency was only 32 percent and it could not compete
economically with other generating capacity available in the region.(25)
Dow Chemical Company also has a coal gasifier in operation in
Plaquemine near Baton Rouge, Luisiana. The gasifier feeds a combined cycle
power plant which generates 161 MW of net power. The gas turbine runs with
producer gas, natural gas or blends of both and has been able to comply with
federal environmental standards.(25) Other projects are under consideration,
using similar technology or adding major breakthough like the one proposed by
H & G Engineering and candidate for installation at the Nynas Energy
Chemical Complex AB, south of Stockholm. The breakthrough is the passage of
the hot producer gas through a water qucllch, and then into a su-called "shift
expander" to promote the "shift reaction": CO + H20 - C02 + H2. This is an
exothermic reaction which reduces the steam content of the fuel gas avoiding
water condensation during gas expansion and the temperature ill crease raises
the pressure enough that the gas can be fed through an "expander", like the
turbine stage of a gas turbine producing extra electricity.(25)
Biomass gasification, in principle technically more easily achievable than
coal gasification(26), is not so well developed. The IlHljor reason is that until
recently biomass was envisaged as a low quality fuel, with a tendency for its
participation in the primary energy matrix to decline, as countries develop.
Commercial biomass was poorly used and 11011- commercial biomass was
important as a source of energy only in the Third World, where technical
competence and financial constraints impose serious limitations for
development of new technologies. Important differences with respect to coal
gasification are the use of air-blown instead of oxygen-!.J]own gasification and
probably the use of a steam injected gas turbine instead of a combined cycle'.
The sensitivity to scale costs of oxygen plants and conventional combined cycles
recommends the other options (see Figure 5). Also, while the gas exiting the
gasifier must be cleaned, so doing would not require df'veloping advanced hot
sulfur removal technologies las required fo!' coa]), because most biomass
contains negligible sulfur. Furthermore, the looser molecular structures of
biomass compared to coal makes it more rpactive and f'asif'!' to gasify (Sf'f' Fig.
6) so that fixed-bee! and fluidized-bed gasifif'rs, which operate at lower average

temperatures than some of the gasifiers used for coal, can provide essentially
complete carbon conversion and high gasification efficicncy.(27)
There are four major projects under development to make Biomass
Gasification Gas Turbine (B1G/GT) a commercial product. Ahlstrom, a Finnish
producer of biomass gasifier plans to build a 6-10 MWe B1G/GT cogeneration
demonstration plant in Sweden(28). The gasifier should be of the pressurized
fluidized bed type, and starts operation in 1993. The Department of Energy in
the U.S. has selected one pressurized bubbling-fluidized bed gasifier developed
by the lnstitute of Gas Technology to be assembled in Hawaii, using sugarcane
bagasse.(29) lnitial operation is scheduled for 1993. Also in the US the
Vermont Department of Public Service was quite active in 1990/1991 overseeing
the installation of a gasifier and a gas-turbine unit that would use wood
residues as fuel. Under this project General Electric carried out a complete
experiment on the compatibility of tIll' gas fuel characteristics and the
performance of the gas turbine simul11tor.(301 The fourth project is described in
the next item.
2.7 Advance technology in Brazil
ln Brazil a consortium of priv11te and public companies prep11red a
proposal to build a wood gasifier coupled with a gas turbine to producp 20 to 30
MWe. The projpct received a gTant from the Global Environmental Facility
(GEF) and is presently in Phas(' II, which is the detailed engineering project
and the removal of major technological bottlenecks (small modifications all the
gas turbine to run with low BTU-g3S () 000 kcaUNm3) and the choice of the
appropriate gasifier and gas clean-up system able to provide fuel gas under the
severe specific3tions of the gas turbine manufacturer). Tlw Phase 1I of tlw
project should be completed in 94 11m1 if :'I successful detailed project can he
prpp<ired, USS23 million is aV<lilable, as a GEl" grant, for its construction. Total
cost is being estimated around USS2500ik\\'e for thp first demonstratlUn
unit(31). 'Which means that total investment cost for the generation of 201\1We
will add to USS50 million, with the balance of the money provided with capital
from the involved companies (Shell do TIrasiL Companhia Vale do Rio Doce,
Companhia Hidrelitrica do Sea Francisco and Eletrobras I. Genewl Electric is
preparing the gas turbine modifications and Bioflow, a Finnish Con"ortium of
the Ahlstrom and Skydkraft companies, and Studvick. a Swedish comp11ny, are
designing two different gasifiers.i,121

A recent evaluation carried out by the major ethanol producers
organization in Brazil (COPERSUCAR) and the Electric Sector Board
(Eletrobras) concluded, after analysing 6 different alternatives for electric
power production (see section 5), that the gas turbine alternative requires less
investments and allows the production of 40% of the total electricity -consumed
in Brazil in 1991.(24)
Advanced technology is also being used in Brazil for cogeneration of
electricity and air cooling. An installation using such technology was completed
in a Shopping Center in Rio de Janeiro, using a Caterpilar gas turbine and an
air cooling absorption pump. A project is under development for a large office
area of the Banespa Bank in the city of Seo Paulo. To provide air cooling to
240,000m2 of space, a system with a total heat capacity of 4000 TR fed with
the heat exausted by a set of two 3MW gas turbines (6MW) should be used'(33)
Another Shopping Center under construction in Sao Paulo is interested in the
technology. A pre-feasibility study concluded that the total cost for the
installation of 1800 TR plus the generation of 3000 kWe would reach US$4-6
million.(34) Even with the lowest price of natural gas 03 cents per Nm3 under
a take or pay contractJ, the payback period would be 4-7 years, which is long by
private entrepeneurial criteria. The reasons for the poor economic feasibility
are: a) the technology is very new and the first units will be more expensive; b)
electricity during off-peak hours in Brazil is low (4 cents/k\Vh) and even
charging heavily on price during the peak period the average cost is low (8
cents/kWh) for users that buy power at middle voltage 03.SkV).
2.8 Institutional issues in Brazil
The interest of the public authorities in the use of cogeneration is
growing. Shortage of public money to expand the supply of electricity is the
major motivation. A recent document prepared by the Secretary of Science &
Technology of the State of Sao Pau]o(35) claims that cogeneration using natural
gas as a fuel is reliable, less costly than adding of new central power station,
requires a short time to be operational, can be installed near the major
consumers in the cities, has good efficiency, and causes less impact to the
environment.
Another document(36) raises several institutional issues that must be
solved to stimulate cogeneration:
Ll/
'lIlt II_ i_
Tariff rat€ . th(' acquisition price of excess el('ctricity sold to the grid should h('
object of negotiation can not be lower than US$42 per MWh and nor higher
than the long term marginal cost of the interconnected grid system (presently
around US$53/kWhJ.
Continuous supply - Since most Brazilian electricity is supplied from hydro
sources, the major utilities would like to sell their energy as base load and to
rely on private cogenerators only during the dry season and/or critical rain
years. This situation does not favor private producers and does not fit the
profile of electricity generated by them. Thus minimum load factors should be
guaranteed in contracts to foster cogeneration.
Existing legislation - The first ref,'1Jlation about private cogenerator set by the
Federal Control Board (DNAEE) is from 1981. Since than few contracts were
signed. Further reglllation ha~ been issued but they do not guarantee minimum
load factors and there is no clear methodology for the definition of avoided cost
on central power station construction due to electricity supply by cogenerators.
Also the time horizon of contracts is not regulated in order to guarantee return
on investments.
The necessity for regulations more favorable to cogenerators is obvious.
The potential for natural gas based cogenerators is very significant. A
conservative e:-timate based on data from 1985(35) claims that 13 T\Nh (6.S'!' of
the electricity consumed in Brazil in 1991) could be produced. Cogeneration
potential by the sugar/ethanol industry can be as high as 100 T\V}d37)
Even in the existing difficult context, cogenerators from the
sugar/ethanol industry are selling excess electricity to the grid. The largest
supplier (Compill1hia Agucareira Vale do Rosario) sells to the grid 2.31\1\\7
during the season, at a price of US$21/M\Vh. The surplus electricity is derived
from sugarcane bagasse burned in a 2] bar steam boiler. An agreement
between the three major utilities of the State of Seo Paulo will set the
acquisition electricity price equivalent tu the long range marginal cost. The
cogenerator is willing to invest USS2.5 million to upgrade the boiler to 42 bars
and then sell 5 !\1\V if the price is adjusted between USS45 and 55/MW1d38)
2.9 Environmental issues
The principal greenhouse gas CGIIG) of which Brazil is an important
contributor in the world is C02 and the largest source of C02 emission in the
country is from clearing of forest land for uther use;.;. Despite the

preponderancp of deforestation on C02 emissions it is important to search fOT
possibilities of its reduction from fossil fuel.
Total C02 emission from the comlmstion of fossil fuel in 1990 reached
approximately 57 Mt of C. (39). To this value we have to add C02 produced
from biomass when burned for energy production. A rough evaluation(39)
suggests that 9Mt of C has to be added to the earlier figure yielding a total C
emission of 66 Mt in 1990.
C02 emissions for electricity generation in Brazil are very low as
compared with other developing countries; and is about 9 kg C per MWh
Clgainst a world average of 170. Thus the impact of a change in the profile of
the electric sector, du(> to the introduction of thermal central power stations or
cogenerators, e\"('n if they represent a sif-.,'llificant change at the margin of the
('lectricity profile, will b(> ncgligiblp for a long time. Even so, if it is possible to
develop a policy that will fulfil other major requirements and can be less
aggTessive to tlw environment, it should be pursued.
Cogeneration CCln be practised in Brazil with a net benefit to the
environment. lndustries in Brazil (see Table 1) used 8.0 Mtoe of oil and 4.9
J\Hoe of firewood. With cogeneration, mainly performed with natural gas, we
should obscrve a decline in the amount of fuel oil .and firewood consumed.
Remembering that fueJ oil has an emission rate of 72.0 t of C02 and natural
gas only 50.6 t of C02 pel' 1012,} of burned fuel this substitution implies C02
abatement. Also the prC'scnt use of firewood plays an important role, since
around 50(/~ of it is dup to defurestatioll(:i9J contriuutillg to C02 emission.
Firewood based industries will not be good candidates for cogeneration, because
of instabilit:_ of supply alld growing public and privatp awareness against
(kforestatwll. Sugarcane bagassl' Oil tIll' otlll'r halld is a very good candidate to
be used by cogcnerators of the sugar('thano} industries. Being a complete
renewahle ('nerg:,' source its agTesslon to the environmpnt, through C02
emISSIOn, IS zero.
Another rf'ason to believe that overall C02 emission from cogeneration
will not increase abovE' the present indu",trial level is the necpssity of improving
tlw fuel efficiemy if the",p units are expected to be' cost effective against
electricity suppliC'd by the grid. The high technology being offered world widely
for generation of electricity is always concerlled with reductillll of local and
glohal pollutiull14i
..

Table 1.
C1TY UT1LlTY CAPAC1TY MW lNVESTMENT EFFIC1ENCY
US$ MILLlON (<'if )
Cruzeiro Electroacre 6 18 13.6
do Sui
Tarauaca Electroacre 3 8.7 14.6
Feijo
Sena Eletroacre 1.5 4.5 14.6
Madureira
Guajara CERON 6.2 17.5 13.2
Boca do CEAM 3 8.7 16.2
Acre
Carauari CEAM 3 8.7 16.2
Eirunepe CEAM 3 8.7 16.2
Ariquemes CERON 8 20.7 9.7
,10 ConclUSion
CogelH'J'ation is an excellent opportunity to improve efTiciency in till' USP
of energy. Due to <ievenli difTicultie<i the state owned electric sector is "tarting
to accept cogenerators as one possible solution to attract private capital fur
infrastructure inve<itment. Cogeneration is being commercially practised in the
United States and several projects are being implemented in Brazil, where a
few cases an' already in operation. The largest potential cogeneratur has been
identified as tl1f' sugar and ethanol industries followed by uther industrial
activities which use large amuunts process heat. The first candidates should
usp sugarcane bagasse and field residues as the source of primary enerf,')' and
the other potential industries should rely on natural ga;;, Renewable energy
sources like bagasse will help to improve the quality of the environment at a
global level and should be rewarded by that through grants or preferenCE' form
international financing. Natural gas, will replace fuel oil in the potential
cogenerators' industries with also a positive impact on the environment at a

global scale, sinep its C02 emission is lower than oil for the sanlP amount of
energy consumed(39).
Finally it is important to observe that the valorization of biomass as a
source of energy is the only way to avoid deforestation. The development of
commercial biomass gasifiers, coupled to gas turbine is a technology fu))y
discussed due to its large inducing potential for man made forests.
Some of the several technologies discussed should become extensively
commercial before the end of the century.
T •.

45,-----------r-----------------,
40
J:3= 35~
cr:~ 30
(J)I-Z 25W<.>
~ 20m
5
19,5
1945 1955 1965 1975 1985 1995
Long-term and recent (insert) electricity p~ice
the United States. The prices shown are the totaldivided by the total electricity sales(38),in January 1986 cents per kWh.
O-t-----,-----r-----,-----r-----,------j1935
Figure 1trends inrevenuesexpressed
0+---,----,---.----.-----,---.---,----,----,---,
1900 1910 1920 1930 1940 1950 1960 1970 1980 1990 2000
Figure 2 - The historical trend in the average efficiency ofelectricity generation in central-station power thermalpower plants in the United States(4~).

.""',----------------------------,
1000
cw·r.-ls.......II,lIinft
Figure 3 - Unit installed costs for small-scale cogenerationsystems. The numbers at the tops of the bars are theinstalled electrical generating capacity in megawatts(3B).
NH,-H,O tSolution I
GenerotorN-i, Vopour
Condenser
--- Flow valves ----
NH Vapour,
Figure 4 - Absorption refrigeration cycle source - ref. (12)

ITyplc.1 fl ..d 8.d "lIh
_______ Hel G'I C:IUf)Up
~-"~--••!'-'~--~'---~
4DOO
~~
'" 3000
c
E~'50' 2000"a:~"g.u." '000(;f-
00 100
ITypluIO·YQrnfllown,Celli u..l Clunup
20D 300
Power Output, MWe
Figure 5 Cost comparison (in 1988 $) of coalgasifiers/gas-turbine power plants(37). The upper curverepresents technology like the Cool Water commercialdemonstration plant that uses a Texaco entrained-bedgasifier, cold-gas cleanup. and a combined cycle. The lowercurve represents systems using air-blown fixed-bedgasification with hot gas clean up and either combinedcycles or stean-J-injected gas turbines. The points on thiscurve are calculated costs for specific plants usingintegral numbers of gasifiers and commercial gas turbines.
cr.~: ~ E:'c' 7::
" " f-'--+------7-f-H'--f---f-:
(E)
'-'
c,(,.e
-- "!'J
(.E
~
, c,
c ,-
(,)
" :.7
0 ,lS: )S;;; sec 7::
ll"-fH...:.ll,iH ltu
Figure 6 - Comparison of gasification characteristics ofbioITJas's and coal(2"n: (a) Weight loss as a function ofpyrolisis temperature for coal and cellulose (a majorcomponent of biomass); (b) Gasification rates in stean: ofchars from different feedstocks.

References
(1) Howard S. Geller, Jose R. Moreira, "Brazil's National Electricity
Conservation Program (PROCELl Progress and Lessons", Demand-side
Management and the Global Environment Conference, Arlington, VA,
April 22-23, 1992.
(2) Relatorio de Atividades do Grupo Executivo do Programa Nacional de
Racionalizacao da Producao e do Uso de Energia (GERE) - Secretaria de
Ciencia e TecnologialPR, Brasilia, April 01, 1992.
(3) Alan d. Poole and Jose R Moreira, "C02 Emission Abatement in Brazil",
Secretaria de Cienciae Tecnologia/PR, Brasilia, March 01, 1992.
(4) "Solar Energy Solutions for an Environmentally Sustainable World",
Final Report for the United Nations Conference on Environment and
DeveMpment, International Solar Energy· ISES, USA, June 1992
(5) RH.Williams and E.D.Larson, "Aeroderivative Turbines for Stationary
Power", Ann. Rev. Energy, 1988,13: 429-89
(6) Fed. Energy Regul. Comm. Sept 25,1987. Notice of technical conference
on the regulation of independent power producers. Pocket no.EL
87-67-000, Washington, DC
(7) Technical Assessment Guide 1: Electricity Supply - 1986. Palo Alto,
Calif.: Electr. Power Res. Institute
(8) A. L. Broekhuizen, R. R. Van Lavieren and P. Kamming, '"A Gas Turbine
Cogeneration Plant with a Gross Electrical Efficiency of Over 50<7,- ",
Intern. Gas Turbine Conference and Exhibit, Dusseldorf, West Germany,
June 8-12, 1988
(9) G. R Bemis et aI, "Technology Characterization: Final Report", Staff
Issue Paper # 7R, Sacramento, California: Energy Resources
Conservation and Development Commission, 1989
(10) V. de Biasi, "LM 6000 dubbed the 40/40 machine duf' for full- load tests
in late 1991. Gas Turbine World, 20(3):1620
(11) E. Macchi, "Power generation (including cogeneration). Draft manuscript.
Milan: Polytechnic University, 1990
(12) R H. Williams and E.Larson, "Advanced Gasification-Based Biomass
Power Generation and Cogeneration", editor T. Johansson et aI, in press
yqT- -.--.r

(3) UTE Boca do Acre, Vol. 1 - Projeto, Sathel - Usina Termo e Hidroelitrica
S.A., Cotia, Sao Paulo, July 1985
(4) A. D. Poole and J. R. Moreira, "Energy Problems in Brazil with a Closer
Look of the Ethanol -Methanol Problem", Instituto de Fmsica da
Universidade de Seo Paulo, SP, July 1979
(5) J. T. McMullan, R. Morgan and R. B. Murray, "Energy Resources and
Supply", John Wiley & Sons, Chichester, 1977
(6) Balango Energitico Nacional, Ministirio da lnfraestrutura, Brasilia,
Brazil, 1992
(17) Boletim de Mercado e Carga Prspria, monthly report, Eletrobras, Rio de
Janeiro, Brazil
(8) A. D. Poole, O. E. Ortega and ,J. R. Moreira, "Energia para 0
Desenvolvimento da Amazonia", contribution for the project
UNDP/SUDAM/SUFRAMNBASA, in "Macrocenarios da Amazonia 2010",
Sao Paulo, February, 1990
(9) Plano Decenal 1990/1991, Eletrobras, Ministirio das Minai-- e Energia,
Rio de Janeiro, Brazil, December. 1989
(20) Secretaria Nacional de Energia, Ministery of Infrastructure, Brasilia,
Brazil, 1992
(21) Paulina Thermal Power Plant Technical Specification, CESP, Sao Paulo,
Brazil, 1989
(22) Tecnoplan, Reconstrugeo da Usina de Piratininga, Sao Paulo, 1989
(23) Report "Agroindzstria dE' Cana-dE'-Agucar", Copersucar, Sao Paulo,
Brazil, 1992
(24) "Gerageo de Energia Elitrica em Usinas e Destilarias", Convjnio
Eletrobras-Copersucar, Copersucar, Sao Paulo, Brazil, Nov 18, 1991
(25) W. C. Patterson, "Coal-Use Technologies in a Changing Environment",
FinallCial Times Business Information, N.York, 1990
(26) E.D.Larson, "Biomass-Gasifier/Gas-Turbine Cogeneration in the Pulp and
Paper Industry", Center for Energy and Environment Studies, Princeton
University, Princeton, NJ, USA, June, 1991
(27) E. D. Larson, S. Svellllingsson, and 1. Bjerle, "Biomass Gasification for
Gas Turbine Power Generation", Electricity End- Use and New
Generation Technologies, and Their Planning Implications, Lund
Univeirsity Press, Lund, Sweden, pp 697-739
~-.r"1I. I.' -

(28) Ahlstrom Corp. and Skydkraft, AB, "SkydkraSt AB, Sweden and A.
Ahlstrom, Finland Goes Ahead with Unique Gasification Process", press
release, November 7, Helsinki, Finland and Malmo, Sweden, 1990
(29) S. Babu, Institute of Gas Technology, Chicago, Il; personal
communication, Nov 1990
(30) G. E. Researchers Say Waste From Plants Can be Used as Fuel for Gas
Turbines, Wall Street Journal, May, 6,1992
(31) L.C.de Queiroz, BRASCEP, personal communication, May, 1992
(32) J.M.Esteves, Ministirio de Cijncia e Tecnologia, Brasilia, Brazil, 1992
(personal communication)
(33) Internal report, Banespa Bank, Banespa, Sao Paulo, Brazil, 1991
(34) Avaliageo Ticnico Econtmica para Utilizageo do Sistema de Cogerageo de
Energia para 0 Shopping Plaza Sul-SP, MHA Engenharia e Projetos
Ltda., Sao Paulo, Brazil, August 1992
(35) S. A. W. Ennes and M. E. M. Carmo, "Cogerageo a Gas Natural" - texto
para Subcomisseo de Usos do Gas Natural, Gov. de Seo Paulo, Sao Paulo,
Brazil, Jan 1992
(36) Proposta de Resolugeo Provissria para Alterageo de Portarias do
DNAEE, Subcomisseo de Usos do Gas Natural, Governo de Sao Paulo,
Brazil, August, 1992
(37) J. R. Moreira and J. Goldemberg, "Prof,'Tama Nacional do Alcool ern
1988", Preprint PE-EN-001!88, Institutode Eletroticnica e Energia, USP,
July, 1988
(38) Gazeta Mercantil, Nov 14, 15-16, pp 11, 1992
(39) J. R. Moreira, G. M. Januzzi, A. D. Poole, D. Zylbersztajn and J. Fries,
"Estimation of Asia's and Brazil's Contribution to GHG Emissions and
Policy Responses for the Minimization", International Centre of
Theoretical Physics, Workshop and Conference on "Global Change and
Environmental Considerations for Energy System Development", Trieste,
Italy, April 21-May 8, 1992
(40) A.A.Pitrolo and L.E.Grahan, "DOE Activities Supporting IGCC
Technologies". Proc. Conf. on Integrated Gasification Combined Cycle
Plants for Utility Applications, Chla, Canadian Electrical Assoc.,
Montreal, 1990
'II'

(41) Staitistical Yearbook of the Electric Utility Industry. Annual.
Washington, D.C., Edison Electric Inst.
(42) OfT. Ind. Programs, U.S.Dept. Energy, Industrial Cogeneration Potential
1980-2000, DOE, Applications of Four Commercially Available Prime
Movers at the Plant Size, Washington, D.C., 1984
(43) R.H.WilJiams, E.D.Larson, "Expanding roles for gas turbines in power
generation, pp 503-553. In Electricity: Efficient End- Use and New
Generation Technologies and their Planning Implications, eds
T.B.Johansson, B.Bodlund, R.H.WilIiams, Lund University Press, Lund,
Sweden

TECHNOLOGY TRANSFER IN THE BANGLADESH CONTEXT
We gratefully acknowledge the generous support provided byDr. K.I. Omar and Dr. I. Hossain of Bangladesh University of
Engineering and Technology, Dhaka,for completing this paper
••

1. Introduction
Technolog)', which wab onc,' refprreu to as a "residlwl" factor for development,
is now Bcceptf'u universally as tlH' "engine" of growth for any economy
developed Hnd developing. Thl' four babic components of' techno!oj.,')', which
cuntribu1.e l'llll;-lll,Y to t)1I' development goab of Bny ecunomy have bet'n shown
a~:
Ii) Techno\vare: Productioll tools, machines etc" which art' the object
emhodied form of technology.
Iii) Humanware: Production skills, inllovativenes:-, creativity Nc., which
CUlktitut!, t1w human PJnlH,died form the techno]oj.,,)'.
iiiil Info\\'a)'(~ Pruduction fact" rpcon!,·d ,IS thl'ori,·". dp"igns, Idll!'-print.~ "IL'
which con"titutt, tIll' doclIllH'nt l'lll\)odit,cl cHTlIlllllLtll'd klltlwlpdg,' or
informatilln.
li\'1 Orgaware: Pruduction arrangemf'nt linkages which cOllstilull' Ihl'
org;llllzalliJJlal fr,IIlll'\\,(ll'k withill \\'llieh 1.eehll"I,,;.'Y JI"I,t!" (II (lp"rCllt' (II
rais,' prodllctivil.\'.
The"I' cumpolH'llh of 11'chll,,]ogy ,HI' ellmp]pllll'lll;try anti inlpnleppntl,'nt.
TJw comph'IIlI'IJ!;tl',\' JI;~llln' uf 1111' c(lmp"III'llt" can 1)(' 1':\l'lailll'd a" h']lo\\',,:
Techno\\'are I" 1111' ClllT III' am' 1':ln"fll,·malioll. It I" dl'\'l'lllpeci. ill"lall,'c1
alld O!,I'J';llI'd h,\' Hli m;lll II'; II't'
Human\\'are I" the kl'y 1'!"Illt'nl "I ;IIl,\ 1'l' .... llllJ"·" lrall"formalioll
O)lf'l'<lll"ll :lIld it i" ill lllrn ~IIHkd 11.1 lllf()\\art~.
lnt'oware I" generaled ;-!Ild db" 1I1111Z,'c1 by HlIlIlclllwa]'(' 1',,]' tl.'ci"i"l1
milking ;(Jill o!wraliull of 'J\'dlll"I\i11 ,'.
Orga\\'at'(' acqllll'p" alld "'''1I11"l,, Ildll\\;l]'('. Hlllll;I!lWarf' ClI1r1 Tf'd1l11l\\';Il'l'
III l,n"i'! ;111\' 1't'"IIUl'L'I' trilll"fi'lmiJ(illll "j)I']';Il i"l!
It Iw> 1""':1 ,d)"I~I'\'l'c! thit! Ihe Slll'l'l':-:-l'lIl dl'\'ejoJlir:g COUlIll'if'" ]l;lrl
intl'odUCf'd IllL' ]']ghl policy in"IJ'LJlllenlS \\'hich ellSIIJ'f'd 1h,' clf'wduplJ\"lll and
pJ'olJ\otion 01 ;Ill till' f(JllJ COlJ\plllll'nts of t"L'hno!ugy. Sud1 d"\'l'lopllll'lll lee! to an
efll,cti\'(, 11'dllllll";';:I' lnJlls!t-1 I" lh,',,!, L'oLJlltril'" of lIlt' t1,·\·,·I"pillg \\'""Id ],'adlllg
lu lllcligl'llllU .... 11',·]IIlIl]"gll'all'aj1iihI1ilil'.....
2. Technology transfer
AI(I1lJll.~h 11", k"11I '!'I"'!IIl"!lIg\' T";lI, ... I,,]' gi'l'" Ihl' illlpl'l'"sioll ,,1';1 c!"llUJ'
;Jlld il n'('lpl"111 III<' "lllJ;llillli 1:- 'ilill" dill"""lll in 1'l';tlll'l'm;.., 'l'1·,'hlloj(l.:":" i~ nol

gi\'l'n away frcl'; it ha" to Ill' paid in one way or otlll'1'. TI'chllOlogy transfer IS
tlIP importation of technology based on mutualit.y of intpl't'''t.
A meaningful and effedive technology transfpr in"olws the' folluwing
stl'ps:
(i) Tech nology assl'ssment
(ii) ']'f'chnology acquisition, adoption, adaptat ion and deve!opnwnt
(iii) Technology diffusion
Successful technology transfer occurs only wlIPn all thl' cOll1puncnt:: of
tl'c11110Iogy, as discussed in tlw previous spction, an' considpl't'd in dl'lails In
thesp stpps. As discussed in subsequent slc'ctions, policy planllers, scientists and
tl'chnologists in Bangladesh haH!, ill most rasp". l'o!ll'l'ntrall,d Oil tIll' sf'colld
"1"p. A" a r<'sult, tl'l'llIlO!Ogy transfer activitil':-i \\'t'l'" lIot "lIl'('(',,:-flil.
l\lorlc'o"Ic'r, tllP ad;'lptatioll and dpvelupmellt l'oml)(lIll'lll::- of t1w sccond
step did not takt, place to allY lIoticeahle degrpe. All tpchllo!ugy that is pH'sent
in tlw country hac- lJl'pll acquired frum abroad alld tlll' millillium training
requirement fur lIurma] uperation and ruutilH' mainl('lliIllCI' ha,; hl'en ml'l.
Tpchnical it",,;e;-:'-Illent of large projects ill'l' lwing cal'l'ipt! out Oil behalf on
Bangl;'ldesh by expatriate COII."-ultanb engaged I,ll till' _job iind paid for by tIl('
donor agencies out of ll1l' aid alloc'lt JOIl,
3. Barriers to technology transfer in Bangladesh
31 Technology policy inadequacies
Pulicy studies and initiatives for tel'llllulogy transfer ill Banglftdesh has
l'l'll1ailll'd limited to dpc!aratiolls of intpllt \\'ithout the operational IllPchanism.
Thl' implc'lllC'ntillg agl'lIcies, ill most cas('" lack the llJa.npowpr and
()l'g-allizatiollal capalnlit.\· to cOIl1]lrpllC'nd tli,' il11]lli\';ll illll> Ill' pro]wr tpchno]ogy
transfer and a]'p unaIJlt' to c(ll'l'Y out pulicy dirpui\'p> ill thj,~ nigard. In SUllH'
ca"l'" unly a small pint uf the total transkr procp:,-" ha> IH"'11 catp]'(,d to,
resulting in stuntpd "11I\\'th.
1'11(-' fir:;t altl'll1)ll to",ard" the formulation (If it "Lll\' p,,Jil'y fill' ScielJ~(,
allll Technolog\' \\'il> Iliadl' ill 19S0 and in HiS:,), ,I C(illljll't'hl'l1"i\'l' l\'illional
Science and Technology Policy INST)'} dOl'lJlllI'lll \\'il.~ pn'piln'c! and circulated.
A section of tlw NSTP l!l'als with '''Estahli"hlllelll of il national capability fur
dl"'l']Opllll'1l1 uf indi"I'IIl'lI" tl'chllolog\ allli illtilillllllilll of';l 11;ltioll;I! capacity for
thl' il":-(>""l1l<'nt. >{,II'dl"l], acqui~ilioll. illl"iit:"11 ::lld ;ll!:tpliltilll1 Ilf j"'ITigJl

compa1'pd to a IW<ik df'lIlalld of 1'oug-hly 1600 MW. Thu;; ))0\\'1'1' supply remainsunreliable.
Thermal dTiciplIcy of gPlIPrating plant.;; (mostly steam therl11alunit.s) islow (approximatdy 2:)', I, ]\1orpov('r the tt·rhllical ami nOll-techllieHI loss(';; ofPJHfs power distributiull HmOUll! to a staggl'rillg 40'1(. PUB thel'l'fur,' opeHltesat a very low level of efficif'llcy,
4.2 Participation of the private sector in the power industry (Electricpower)
Before the eslabli,,]lIIH'nt of t.he POWI')" IkYeIopnH'llt Board (PDB),pri\';-jle cOlllpalli",.. opl>rRlt'd RJH]mallaged pJpctrie utility ;;I'n'iet's, AI prespnttJl!' I)()w('r sl'clor ill Ibn;..:I;HI"sh IS totall,Y eOlltrolll,d by 1'1)f{ with tIll' ('xu'ptiollof;, fl'\\' st:J1HI!,,' ;":1'1l"I';I1"1''' III "OJIII' imlll,..trif''', Tlw FOllr111 Fi\'I' 1'1';1/' PlallI ]~1~J()-9;)1 h"wI'\I·r. lid" L'ld ('llll'h;lSis Oil prl":llt' .'-'cel"r p;lrt!l'ipdtJlJll lJll BuildOpprale and TUIJl.-.;fl'r (]:< )'1'1 lJa,..is fur pO\\'t'r gt'IH'ralioll, HO\\'(>\"'r dl'1aiJpdstudies cHI' .\'1'1 to hI' CiHri"cI out for deciding Ihe appropri;JtI' st ra1!'i-;;I'S forprivate seelor participatioll. A cJp;uIy statl~d policy to (>IlClJunJ.ge ]oraJ'f()reignpri\'alp iJ1W',-.;tIlH'llt is required,
11 i" 1'1'11 that pJ'j\'d("lv ""'Iit'd ;Jlld 111;III;lgl'd PO\I'('1 gl'nl'nttilJlI IIn;l" c"uld111t'1'! thl' ;..:'rll\\'III,C: d,'lll;llld f"r 1'''\\1'1 :Il1d 1"" dl tll" ":1111" I illlt', 111<11'1' l'I'II"il'lltill](1 J'I,li,J!,'" Ih;1l1 J'I)I),
4,3 Cogeneration technology and B~,lIigladestl
111 J);llIglacle::;h, cugl'nl'r:lIWll jJlu\'ick,- IlIl' lnJlk uf tIll' 1~II·ctlil' /JU\\'I'J /UI'tIll' fertilizer. P;lJw], aml sugar industril'" .\ddtlioJlalJy. SU1111' indu"trH',., :'-lieh as('I'nl('l1t han' ::,(,If gPllPratiulI capability.
A ll'l'llJli,,;tI putPnli;tI ('xi"t:, f"r fU]'I}lf']' utiliz;)tl"ll Ill' cug"l1ermiun III
H;IJlglcJ.d""h ill ,-IX illdll:-'tl\ ",:clllr,,:
(lth.'J p;IJII'r ;lIld ,'/Ji,·d Jlr"dul'l"
T"d
01]]('1' I(,"d
JUII'
T""l iJ.."()th,']' 1I1;lllllfHcturill,:": JIlcluslril'"
B;I.-"d Ull " recent :JI];lh>l~ l:iJ, tll.' ;.:T";II.·"t pUll'J1tiil} P)(J~t" Jll tl1l' ,iutc'ililel t'·XIII., ",,,,I"I>,!"''' illdll"ll'i,'" \\'Itll \"'1\' "lgniflcillll 1'IC'ctri"it\, l'IIll"lIlllplJUII.

The econolll ic potential for cogcneration is shown bPlow (ill P.J)
Industry Eb:tricity consumed at Electricity which can be
present displaced under
cog('neration
Other paper & allied 0.14 O.ml
products-
Tea 0.50 0.04
Other food 2.02 0.4'7
Jute ;~.54 2.'27
I Textile>:> '2. (j() ] .li7,
I-~-
Other IllHnuL,t'luring
-f]'2::~~ --- Ofi].--
,5] :"j L
Thu>:> a n('t saYing" of 5.]5 P.J could Iw l'palized through initiation of a
lIational industril's cogelwration program. This l'epre"enb i1ppruximately ]2.OCi
of thl' fossil fue] l'UJbUlllptiull for powpr gl'llpratioJl.
The technicClI putential fi)r cogl'Jleration was de1l:'rlllilll,d through
eXHmination of tJw (!t-tdil,'d l'nl'rgy consumption pattl'rJl:, 1)\ im!u,..tr\. Upon
prpliminary eX:llllill,ll ilill of till' ('co]wl11ies of various cugl'IlIT<ltioll sy"tPl11S it
was determined that gil" engine" with waste heat recun'r)' ! hut air. steam
and/or hot watl'r' alld g;iS t urlJilJe>:> with heat recovery ste;11ll generators werc
the most viable
Further l·,unulllil ;1n;·dy.~i,.. un tJll''''(' cogcneration Systl'l11 J"E'ycaled that
til<' minil11um (""IIIIlllil· ",1.(' lin a h;,,,,· IIIdd,'1I unit is 500 K\\' ('l('ctric and for a
unit designed t" lkjj\I'J" Pl'ilk d"lll;~lld I" !lIUU K\\- electric. Tl1l' ('COnUlllIL'
putentials fur L'O;':"II,'Lltlun wa", d,'tL'rJIlIIll'l! a:-, thu:-,p plant" which han' pll\q'r
llt-mand gl'~<iteJ L1Ulll tlJU"p aIHlli'.
The total 111\-I'::-tIlH'lIt requil"l'llIt'llt" f'iI- :I natiunal cogenlT:ltiuJi prugram
;H(' es.timated to \H-' lS S 70 milliun I] 9S~ '. Cogl'neratiun can potcntially san"
:,ignificant quantitil'::- uf f'lwrgy and also ]'('c!UL'(' the burden un P])B'"
uq'rstrPlched g,'IlPrat iOIl capacity.

Huwpvpr, a llumllPr of m;ljor pulicy j""U(':; nced t.o ))(' re:;olvpd befort,
cogenerat.ion will be feasible for gt'llend implementation in Bangladesh.
Cugeneration will require a cU/ll'prled guvprnment effort to pffe'ct Si/-,'llificant
implementation and i;.; at prpsl'llt of nH'dium priority, In til(' J1('ar term, thl'
/t,cus should he Ull resolving the policy issues; in the medium t('I'm (assuming
the policy issue" arc resolved) the focus should he' 011 dClIlon"tration projects
imel initial impklllPlltation; in the lOllgl'r tPl'll! a full implpl!H'lltatioll effort
,,!luuld be purHI,·d,
Fur caM'" of Nt'w buill'r l'oll"lruct ion or replacenll'llt of old built'r" 0]('
economic inccnt i\'l'.~ of cogf'llf'ratioll is evell greater with pool' power relil1hilily,
,,(,]1' generatioll CClIl he both co"t em'cli",' imel abo e]lC'rgy ell'lCit'IlI,
Implelllplltntioll of illelustrial ('Oi.'J'llPratiuli ".\>II'lll \\,ol1le1llij\'(' a IlI<\.1ur impact
Oil )'('clucillg l'1H'r~'\ 11",'.
4.4 Specific examples of cogeneratioll potential
Tit" cugl'lll'J'i1tiu]1 ]Hit"llti;r1 and iJI\,'-tIlWIl( I'l'Cjllin'lllf'nl ,dollg with
proflta!Ji!ity '1I1,t!y.-i" of tlin'., 111lIu"lri,':- Ld.- },""lJ H'l't'lll1y :-ludl<'d b,\ tJll'
EIll'rg,\' J\lollitoJ'Jll;': Lillit I E'\1 L', of till' ~11 !:HJ'\ IIf Ellt'l'gy alld ~ljr]l'r';J1
UI'"Olll'l'I''' (41. Till' SllmJllill'.\' of t!JI':-" :-1 lid It':- 1:- ]lrt':-'Plltl·e! ill '1',th]I' 1. '1'1H'
imhl"tril''' ,1]'(' .hltl' tl), 'I\'xti!I':- 1III <llld ;1 l:oJl1!lill;rtillll orjll!I'. (('xtill':- illld (('a
(Illi. All th('S(, ]lr0)f'c1s show gllIJe! i!ltel'llill JiIll' ,,1']'1'111111111;];, ,l1lel slllall
paybnck period, Cogc!lcrati"n alld capti\'(' ]10\\'('1' gene)';rlJlJll ('<Ill. tlH'refori'. saw'
cOIl"ie!enrldl' IllIJ"II111 "I' "Ilt'/'g\ iI/lll lllll:- 1"lld t" ]"\1'1'1' c<lrL',1l ,'I1JI-.-IIIIlC',
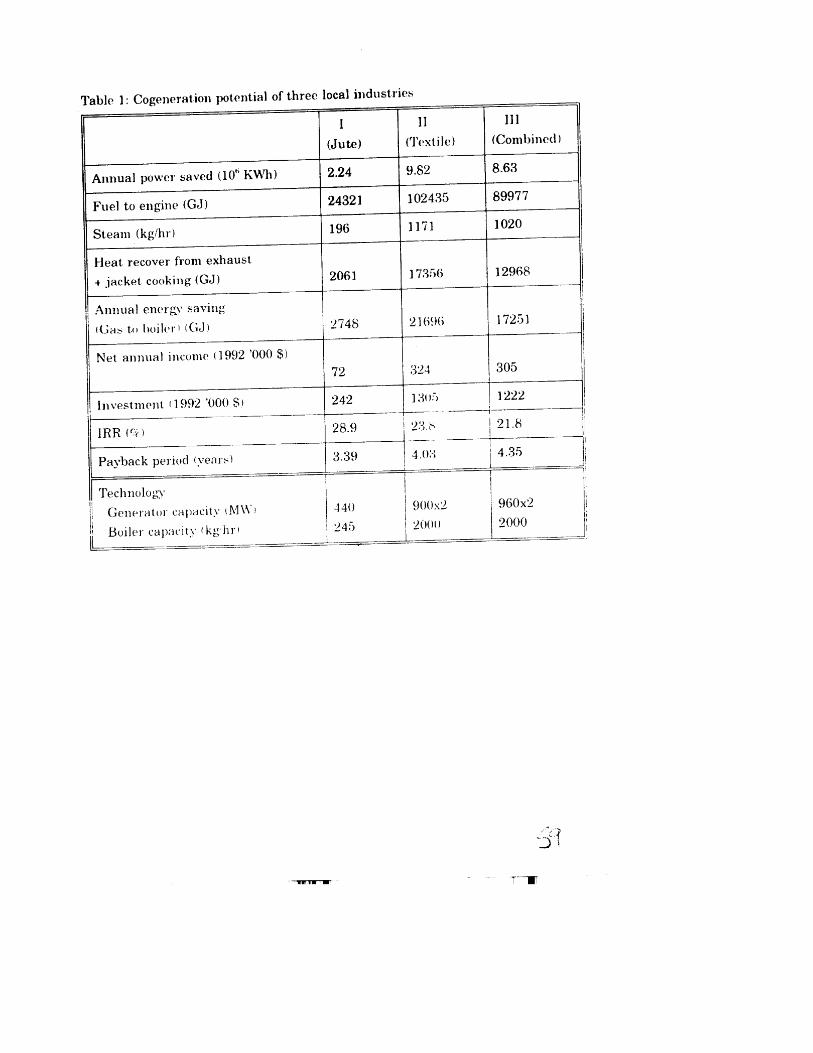
Table 1: Cogeneration potential of three local industries
IiIII,
i,
Ji'I 960x:2
2000I ~)()Ox2I .I 2U(I()I
] Il 111
(Jute) (Textile) (Combined)
Annual power saved (10" KWh) 2.24 9.82 8.63
Fuel to engine (GJ) 24321 102435 89977
Steam (kg/hrl 196 ll71 1020
Heat recover from exhaust
-+ jacket cooking (GJ) 2061 17.'1;)() 12968
Annual Plwrgy savingI
I,
~t;a::- to lwill-r I I(;,J) :!748 21 ()~Hj ] 72Gl II
Net annual income (]992 '000 $) I"1') 324 305I~ II
InvestnlPnt 11992 '00081 242 1;-\11:-) I ]222 Ii
I--~_
.~.-
-j-- - -~-, II
IRR ((/() 28.9 :!:1.(~ I 21.8 :1
i II----
~IPayback period (years)
I
~1.39 4.0:; ! 4..'3.')I
I Technolog~\', I 11
! 1\
1I: Generator capacity IMW, I ..J4()
i~ler capacity Ikghri======1~4:J
-~.-

tl'chno)ot,')"', In this cunnpctioll a committl'l' llalllPd tlH' Consllitativp Commit tN'
on Transfer of'I\'chllolog)' (C( 'Tn was fOrllH'd in 1987 for implellH'lltation of
til(' National Scii'nn' and 'l\'c!lIlology Pulic,\', This committe(' has sugge"tpd
:--onll' action programs alld IIHlicatl'd till' illstitutional arrangl>nlPnt" for tlwir
impl('mentation, How('v('r, as yd nothing tangibh' has O('ell achieved,
3.2 Human resources and research and development
High litPHlcy ratf' and skilll'd manpowPl' l"i1'f' prprf'quisites for
technological advancement, In Banglade:-ih till' litl,J'acy nit!' of 15 ypar:-- and
ahovi' i" 29,2(/; only. In addilion, tl1P f'mplw"i:-- hl:--torically has 1)('el1 towards
liI)('ral arts suh,ii'cts rather Ihan sciencp amI tpchllical SUh,iI'ctS, /\,.. a ]'(':--ult, the
tl'chllical ec]llcati"l1 11;1,.,1' i,., wI'a].;,.
;\S all'(';llh' 1l11'lIti"lll'(1. Iltll]';' of 1111' ll'chn,,!"gy ill th,' "Jluntrv i,~ illl!)()rt('d,
Th(,I'(' ha:-- 1101 lll'l'll ;lll." 1'(llll'i'rt"d dfort for tl)(> huildin" lip of ill"titutl(llb that
could 1)(' in\'ldl,,'d with stud II'S rp"l'arch Oil a":--I',,>Il11'1l1 ,IIHI all:--orptioll (If
impurll'd It'chllol,'g\·. Till' \';Irioll" stl'p" 11l'('I'S"an' ill Ihl.' C(lllll,'('t lOll ;11'(' tIll'
identificatio11 i'll1d p\,alllatloll of technological alt "J'lHIt i\'(,,,, lI'gubtion of
tec!lll<l)oi_',y illlJllIrt;ltioll, PII"ill('I'ring d,',.,i,,11. tl'Chll,,!ogy ,,(hlplat iOll,
I' X p" I' i III I' I I till gIll , 'x i"I ill" I ILI IIt S ,'1('
\\'jth till' "\,,,'pliull ,,j' ",J111l' ;il'".I.' ill Ill,· ;,;;ric:llitlil'" ",','Iur, 1ll",,1
org;'llizC1li"ll lack ol'gallizl'd <11111 w,'II-pbllll<'tI )'(''''';uch 1ll<lllagl'IlIl'1l1 ,~\'"I"1I1
Ecs(!arcll effurt:- are fragllll'llldl',\', Ull-CIlO! dllldll'd dlld an' gUll'r;llly Ii"l rl'ldtf·J
t., IOllg t1'l'm c!"""I"pmpnt "hy,cti",,:-, l'I'l'>"lltl,\ H&]) ,~C11\illl'" "u!f"r frllill
"]W!'l;,gP or C"Ill!H'tl'lll lllaJ11"'\I"'!'. ~('\"'I'l' Ilr,illl drain" J'('sullll1g frolll p,,,'r
fundin" and hJ\,j; ofp!'())1pr :-pn'i('f~ cOlldili"n" III H&D in,'litllll(ll1> of till' cllunlr."
h;IH' in n'cI'nl lillj('s cilu:-(,d <I d"ilrlh of ('''llIpl·t''111 ,.,ci"IlII-IS, ('llgill('('I'> ;llld
ot 111'1' skilled J)('r,-'I11lllo/
_'\nul!ll'J' I"i·thillg p/""""III of tl\(, luc;Ii J{&IJ in:,1Itul;1I11- I> Ih,· Lid, of
;lI!<'qu,i!1' dlll'UIII"llt<l111l11 <l11l1 illful'lllaliun LlI,ilitll'" LI,'II \\ ,111111 Ih" ,'(llIlltn, a
prup!'!' illfunnatlull lll'l\\'u!']; ,-.\'",t1'lIl haC' !lut hel-'n dl,,,',,I''i,,,d \'-,ith Ih" >lIl"
exceptio11 of th" agTil'ultlll(' "I'rtilL
3,3 The impact of external assistance
III tlH' ,dl,-"IlCI' or iI CllllIpl'l'Ill'IlS]\'I' !('Chll"lilgy !>,l:",'d dl'\'('loplll('1I1 pl,IIL'.\'
with ('1'''''" ",'('1"1;,1 "'ilISld,'I;111'i11 <I" "A"IIII,liI',,·d 1,\ Ih,· I'X,,,IIII,, Sltll<lII"'1 III
Ibngladl'"h, II iJ"""IlIl'> dil'lll'lIll I,ll' til 1111111;": <I"'""It·,~ I" ,d"lllil." Ill<'
ll'I'!lllOl"gi,',J! gll;ll" uf a d"\',,I"lJllIg l'lIunln,

Up to th(' present time new and varied t.echnologil's of different origins
were t.ransplanU~u in the various sectors of 1.11(' economy in Bangladebh,
Technology transfpr was confined to inst.allation of thl' imported plant with the
help of expatriates, training of engineers, technologists and technicianb in a
similar plant abroad and t.he supply of a set of operating/instruction manual
(often inadequate) and a set of drawings, Such transfer elements amount to a
"stat ic" mode of technology transfer and prevents the chances of "dynamic"
tram-fer of technology which is necessary t.o raise the technulogical It'vcl of the
count.ry for unchTtaking innovative vcnturcs in a cOlllpetitive world,
As is common in many developing countries "projects" arC' initiated and
implpllll'nted which bend'it some Transnational (:olllpalliE"~ ITNCl Hnd tlwir
age'llls, Thus UJ1\' Iwar" of "Agl'ncy Oriented Pno,ipcts" (II' "»onor Oril'lltPd
Pr()j(~cts" - or eY('1l projE','t" designPlI to profit a g'jvP!i :-,upplil'r of hardw;ut,
and/or suftwal'l',
Another ilSP(>ct worth I\lentioning l1('re iH,' case'" ill \I'hich tlW](' an'
multiple donors uf a single pruject. In these, tIll' "pares amI raw materials arl'
so Yiuipd that local inputs Iwcol11P difficult d1J(~ tll tl1" sizl' of tIlt' ckmancJ,
4. Case study of the cogeneration in the context of technology
transfer
4,1 Tile electric power sector in Bangladesh
The Power DevelopIllC'nt Buard lPDB I is th ... public ,.;ector agenc," solely
re"ponsibk for the ckvelopnlPlll. production anel manage'lllpnt of tIl(' power sub
spctor in Banglade,.;h
'I'll(' inslitlltod gp]]('l<ltion l'apacity oj PUB I.JUJU' l~l~ltl) is :3,)7~1 !\lW of
which 1~114 1\l'I'\' j,~ :-uilahlt, for Im,.;e load o]wratiull alit! th,' ll'lllilining flO;") MW
for intel'llwcliatC' and jW;lk luad generation 121, TIlt' luLll (,II ,'tril,jll' gl'Il(']'alpd in
ImW was /7::;'2 (;\\h \IHiI tjl\~ folluwing bn'ak-up
,', Hydro RR4 (;\\-h ( 114:-\', )
" Natural ga:- ba"pd 661;') GWh 184,2f)"; I
Petru!pulll liquid fuels :3:3::; (;\\,h 14,31"; I
PDIL- PU\\"'l' planb consisl of hoth 111'\1' alld old plant:-, TI1l' old(']' plant,..
t,,"l1ll' 0\('1' '2;') .1"<1]'''' ;1l'(' )In'!\(' to fn'qul'Il1 IJrC',!l,doWIl:- Of' the IoU] gl']H']'ation
cilJlilcity of' '211~1 1\1\\, till' dC'Jl"lldaLdl' cal';lhilit,\ j,.. ollly ahout 14/91\'1\\',
•

Table 2: Breakdown of investment requirement
A) Engine/alternator sets
B) Waste heat recovery boilers
C) Civil and building works
D) Mechanical installation
E) Gas installation
F) Electrical installation
G) Spares
H) Engineering design/project management
l) Import duties and taxes
J) Monitoring and bank costs
K) Contingencies
TOTAL
(1992 $ = 40.00 Taka)
Lakh Taka
275.00
40.00
16.00
5.00
5.00
53.00
15.00
5.00
50.00
9.58
15.00
488.58
The breakdo'W'l1 of the investment requirement of one of the projects
(Combined, III in Table 1) is shown in Table 2. As is evident the obvious
drawback of cogeneration projects is the high initial investment required for
the latest state of the art cogeneration technology. Furthermore over 85<!'- of tIl('
investment would require foreign currency. Table 1 shows that the technology
suggested in all cases is gas fired reciprocating engines and waste heat boilers.
At present it is not possible for Bangladesh to develop its ov.'l1 technology for
the production of efficient generators. Waste heat boilers may be produced
locally if effective technology transfer can be achieved. Soft loans must be
provided to help local industries in acquiring the state of the art power
generation technology. In fact, international financial institutions like the
World Bank has agreed to finance cogeneration projects, which is a positiw
step in the technology transfer process. However, sectors where cogeneration
potential is high namely jute and textile, are either incurring losses or are only
marginally profitable. The credit worthiness of these industries are not

Imlll!-' ohtainpd froll1 til(' World Bank. Tlwrefore, dPfipit(· the good viahility of
such projcct.s as indicated in Tab)p 1 in terms of saving both mOIH'y and cnergy,
little has hecl) achievcd t.owll]'(b actual imp]('mentatioll of cogenprat iOIl
pr~ipct!-'.

References
1. A Framework for Technology-Based Development, YoU; Outputs of the
Technology Atlas Project, published by APCTT, UNESCAP, 1989.
2. Report of the Energy Task Force on Energy Development Planning in
Bangladesh; Ministry of Planning, Government of Bangladesh, February,
1991.
3. National Industry Energy Conservation/Substitution Program; Report
prepared by Arthur D'LittIe Inc. of USA for the Ministry of Energy and
Mineral Resources, Government of Bangladesh, 1986.
4. appraisal Reports of Various Industries for Potential Cogeneration,
prepared by Energy Monitoring Unit, Government of Bangladesh, Jan.
June, 1991.

OVERVIEW OF TECHNOLOGY DEVELOPMENT OFCO-GENERATION AND ENERGY-SAVING LIGHTING
IN CHINA
We gratefully acknowledge the generous support provided byProf. Wu Zongxin and Prof. Wei Zhihong of Institute of
Nuclear Energy Technology, Tsinghua University, Beijing,China, for completing this paper

Overview of Technology Development of Co-generation and
Energy-saving Lighting in China
1. China's attitude about technology transferEnvironment and development are two major concerns of the international
community. In past, neglect of the environment in the course of
industrialization, particularly the irrational exploitation and utilization of
natural resources, has caused global environmental pollution and ecological
degradation, posing a real threat to the survival and dl'velopment of mankind,
It is therefor!' an urgent and formidable task for all countries around the world
to protect OH' environment and maintain sustainable dl'velopment.
China considprs that solutions to the two issues of environment anel
development have to call for extensive and effective international cooperation,
since environmpntal protect ion is a common task of mankind as a whole,
However, inlprnatiomll cooperation will only be a miragp without a gllarante('
of funds and tpchnology transfer. As mankind shares one parth and
environmental problems sometimes transcend national and regional
boundaries, 8 global approach is in the common intere:-t of all countries and
regions. Historically, environment problems stemmed mainly from the excessi\'('
consumption of natural resources and massive dischargp of pollutants by
developed nation:, in the course of thpir industrializatio)l. Even today, their
consumption of natural rpsources and discharge of pollutants, ",I)(>ther in term;;
of total volulllp or per-capita share, far exceeds that of developing countrips.
Therefore, tlii'.\' ~h()uld assume the major responsibility fo)' the deterioration of
the glohal PII\in'llllH'n1. On tlip other hand. they have gTeatcr ecollomic
strength and mol'(' "uplii~ticated technol()gie~ for ellvirunllH'ntal protpction, so
that it is natural for them undertaking a gTeater obligation for its solution,
They should providp c1ev~loping countries with new and additional funds and
transfer technologies of environmental prutPctiol1, especially those commonl:'
used in energy cOllversioll ~ector:; and elld-usp service, uncleI' cOllccssional
conditions to Iwlp tl1l' lattpl' to improve' tlwir ('mvironml'lltal and participate in
the activitie:- of global environmental protection, This i" a wise thing for
developed countries to do, since it serves both their own interests and those of
developing coulltri('~

The Chinese government has made environmental protection one of its
basic state policies and incorporated it into its national economic and social
development strat.egies. On one hand, China has obtained remarkable results
in environmental protection by iL'i own hard work, e.g. over the past decade or
more China has, in the course of reform and opening up, maintained steady
economic growth while averting a corresponding degradation of the
environment, with even some local investments. On the other hand, China is
still willing to receive technologics transfer to accelerate its environment
improvement.
2. Co-generation
2.1 Current situation
China's generation sets and the contribution of the co-generation in 1990
are shown in the following table.
Power generation and co-generation in China
Capacity (GW) Percentage ('k)
Total Installed capacity 137.89 100
1. Hydro Power 36.05 26
2. Thermal Power 101.84 74of which: Cogeneration 10
Total installed capacity of co-generation in the talJle only includes the units
with single capacity over 6 M\V, which account for 11.30/< of the coal-fired units
with the same capacity, while the coal-fircd units with single capacity over 6 MW
takes up 879i: of total coal-fired units.
According to the statistic", at present, the industrial heat consumption of
co-generation amounts to B7lk. 111(' largest installed capacity of the thermal power
station in operation is 850 MW. The Co-generation and district heating system in
China are closely related. Co-gl'neration has remained the major source of tlw
urban district heating. According to the statistics in 1990, there are 89 cities with
the district heating system in the northern part of China where heating sources
are necessarily required, registering 52(/( of total cities in the north of China. The
district heating area is 0.19 billiun 11l~, thl' rate of popularization is 12S'; .
••fil_ J_

2.2 Energy-Saving
2.2.1 Average fue] consumption in power generation
Condensation unit (~ 200 MW) 394 gce/kwh
Back-pressure unit 200 gce/kwh
Extraction unit 350 gce/kwh
where gcP is grams of coal equivalent.
So, the co-generation power plant consumes less fupl than the coal-fired
power plant by 44-194 gce/kwh in electricity generation, that also means that as
many as 3-13 million tons of coal have been saved and CO~ emissions have been
reduced by 1.6-6.8 million tons of carbon in 1990.
2.2.2 Average energy consumption in heat generation
Thermal power plant : 40 kgce/GJ
Decentralized small boiler: 52-62 kgce/GJ
The above fuel consumptiun shows that the heating efficiency oftl)(> thermal
power plant ri"l's to as high as R5C,i whilp that of the decentralized small boiler ic
only 55-65'/;. In 1990, the total heat generation in China is approximately 565 PJ,
Co-generation has saved] .2-2.1 million tons of coal and n·ducecl 0.6-1.] million
tons of COl emission lin carbon content) if the district lH'ating nlte is calculated
by 12<;;.
23 Development prospect
In some industrially-devcloped countries, co-gcneration make" up a high
percentage of tlwrmal power generation, for example, the Jwrcentage is as high as
407c in former USSR. Comparatively speaking, developml'nt of cu-gcncration in
China is slow and backward But, to realizl' the objectives of energy-saving and
environmental protection as \\'cll aeo to mcet the requirrment:" of industrial
production and ftrowing demand ofpeople';-; living, co-gellcration is pXjwcted to find
wiele application:' in the future.
" China's energy sectors bas set a preliminary energv-saYing target for 2000
that the fuel consumption of electricity supply wuuld drop to 360-370
gee/kwh f)°om 427 gce'kwh in 1990, and stipulated th:1t the nf'wly-built unit,;
will eOIlSUIlH' no mon' than 330 gee/kwh offuel for e!l·ctrieity supply and no
more than 270-280 gee/kwh of fuel for heat gelleratiull. It i" e;-;timated that
during tlJP periud of 1mlO-2000, total new capacity of 90 (;W uf thelmal
power plant are ('xjwctpcl to bE' built in order to n'alize the ob.iectin' of

*
energy-saving. They all should be high efficiency co-generation, and take alarge share over the existing level of 10%.Coal represents more than 85% in the fuel for the thermal powergeneration, and about 0.29 billion tons of coal is fired every year, thusproducing emissions of CO~, SO~, NO" smoke and dust, and posing seriousthreat to the environment with the future development of electrical powerindustry the coal consumption will increase, so it is a necessary andimportant requirement that the efficiency of power gPlleration be raised toreduce coal consumption so as to protect the environment.Now, there are 240 thousand industrial boilers in China, heat generationis about 9Wk of the industrial heat demand. So the replacement of thedecentraJi7.ed smalI boilers with the large thermal power plant remains farpotential.
The district heating rate in North China is relatively low 02'k), and the hotwater supply is practically nil. With the improvement of the people's livingstandard, the demand will impose a high gJ'Owing heal load.
2.4 Measures and policiesNow, the proper measures fll1d policies have been adopted to encourage the
development of co-generRtion.". District heating system is encouraged to be actively diffused in urban areas,
which is proposed in "Environmental Protection LR\\' of PRC".Co-generation and district heating system should be dPYeloped, stressed by"Provision a J Regulation for Energy-saving Managem en I".High-parameter and large-capacity units, including co-generation ones,should be Hrongly taken into cun:-;ideration in making future electricitydevelopment plan.
Operation of some small-capacity. medium and low pressure condensationunits in sprvice for too long should he stopped in a plmmed way. For thoseunits which cannot be scrapped at the moment, reforming and renovationwill have to be carried out by ways of transforming them into extractionunits or back-pressure units. Some of the concretp measures to be adoptpdcould be listed as follows: first, all the total 20 GW capacity of medium andlow pressure units should be phased out firmly, and part of them can bepermitted to lw shifted to the units for heat supply. Second, for the total 60GW capacity of high-pressure units including the units of ]00 MW, ]25

MW, 200 MW, and some old 300 MW, special renovation should also bemade, and emphases will be put towards 200 MW units, of which there arestill 110 units with fuel consumption as high as 410 gee/kwh, to satisfy thetarget of fuel consumption 360 gce/kwh.Studies on the tri-generation of gas, thermal power and electrical powershould be conducted in the near future.Management of existing power grids would be enhanced, insulation of pipenetwork and valves would be improved to prevent leakage of heat energy.Power grids should be economically dispatched, e.g. regional power plants,coal supply could be shifted from small-sized power ones to large sized onesto enable full (J!wration.If all aho\'(' policips and measures are implemented, thr target of reducing
furl consumption prr kwh of electricity supply could Iw realized. And, if thecapacity of thermal power stations would total to be lOO GW, about 60 Mice ofpnprgy could be saved resulting in removal of 44 million ton of CO~, and largealllount of NO, and dust.
2.5 Problems to be solved2 ..5.] To develop high·paranlPtt'J' and large-capacity units, it is quite importantand necessary to leiHIl the newest design and manuhlcttlring tf'chniques in tlll'world and hav(' tpchnology tnmsfl'r from thl' dpvel"j1,'d l'otlntrips gratis or (IllcOllcessional terms.
2 ..5.2 Transformation of the small-capacity, medium <'lllel low prpssure units intoco-generation units nreds an investment cost of 2000 Yuan/kw, all equivalent totlw current cost {('I' buge unit btl ilding. lf tot al capacity of ] 6 G\V is planned torl'1orm. an input of :~2 billion YUClll is ncedl·d. but thl' annual investmcnt fortechnical rcnovat IOn IS ('v('n Ipss than 0.5 hillion Yuan. It should open morechannels to collPct IlPCeSSilTY fund to ease the shortage and layout appropriatl'policies for invpstment, price, tax and foreign tradp to elJ"lIre this process.
Investmcnt
IJl t he existing. investmcnt composition of eled ricit)' indust ry, st Ht e's investmentand loan, fund raising, funds raispd hy onl'self arl' the ma.ior channels, accountingfor ]7.4«, ]7.0',. ]7.](, respectively in reccnt ypars. Since the economy reformstarted in !Htp 19700', tIl(' ill\'estment pattern depending mainl~' on state'sinvestment and loan has heen shifted to multi-channcl ways. In particular, theinvestment policJ('s of fund raismg and funds raisNj 11\, ()]ll'self havp cncouraged

regions and enterprises, where serious electricity shortage exist, to enjoy investingin power industry, because these policies stipulate clearly that "who invests, whowould bf>nefit" which guarantee investors having sufficient power supply and thenearning better profits.'" Price
The price of heat supply from cogeneration stations is too low.to lead them to earnnegative profits, e.g. loss of profits from selling heat was about US$ O.36/GJ inrecent years, losses suffered by power industry hinder expansion of cogeneration.It is necessary to adjust the price rationally through price reform combined witheconomic reform as a whole to encourage the development of cogeneration.,', Tax
In order to ease the situation of fund shortage, a special item of "Funds for KeyEnergy and Transport Construction" was imposed since 1983. The funds raisedhas to be used specially for the development of energy and transport sectors.Furthermore, a survey report on the situation of urban district heating submittedby a group of domestic environmental experts recently suggested that smoke taxf(Or decentralized small boilers in urban areas might be stipulated in order torestrict the development of small-sized boilers, and the money of smoke tax wouldbe taken as the special construction funds for cogeneration development." Foreign funds
Since economic reform and opening up, policy of absorbing foreign funds fordomestic economic development has been actively implemented in China, and moreflexible approaches will be adopted for perfecting investment environment,providing more convenient condition and legal guarantee to foreign investors, andfinally attracting foreign funds. The foreign investment will be guided to the majorfieJd~ of technical innovation in infrastructure and basic jndustries as weI! asenterpri:,;es, of capital- and teclllloloh'Y-inten:,;ivp industries. In pHSt ypars, a lot offoreign ill\'estment was oriented to the development of cogeneration, foreign fundsshared about 13.6<j( of total each year.2.5.3 TIlP stable heat load is considered to be a very important factor to developco-generation and bring about the economic and environmental benefit..'i. Atpresent, the industrial production lay-out and urban construction arc less unifiedand co-ordinated, thus resulting in decentralized heat load and uJlstable demand.Therefore. it is necessary to step up the co-generation man<lgemcnt, uni(v thedevelopment plan <lnd standardize the construction.
11

3. Lighting
3.1 Current situation
With the rapid development of the industrial and agricultural production,
urban construction and tourism as well as the improvement of people's housing
and public facilities, there has been a substantial increase in electrical power for
lighting. Since 1985, the annual growth rate has come to 1Mi. In 1990, the
electricity consumption in lighting is about 80 Twh, accounting for 13% of total
electricity consumption. It is roughly estimated that some 23 T'wh of electricity
was consumed for lighting by residential sector and 57 'I'wh by other sectors.
Based on this fact and some assumptions of electricity consumption in the sectors
of industry, tran::;port, commerce and service, etc., it is derived that lighting load
accounts for approximately 40-45'!i of total peak load. In that case, pnPlj!,.v
efficiency improvement in lighting is one of the important measurps to ease tense
power supply by reducing peak load.
In 1990, China's production of electric bulbs was about 2.] billion, while the
incandescent bulb output was 1.85 billion pcs, amounting to 88(/( of totill
production. The production output of the common f1uoresnmt lamp was
approximately 0.2 billion pCS, that of high-pressure mercury lamp, high-pressure
sodium lamp anel others 200 million pcs totally.
3.2 Energy-saving
The power rate of most incandpscent lamp is 40·7fJW. As is known,
incandescent lamp is notorious for low efficiency and large electricity consumption.
The fluorescent lamp and compact energy-saving flu orescent (i.e. trichromatic
lamp), which are expected to replace the incandescent lamp, will demonstrate
b'Teat energ:v-s<l\'ing potential.
Now, till' fluorescent lamp made ill China only consume 1/.'3 - 1/2 of
electricity Heedpd for the incallllescpnt lamp under the condition of providing san1f'
illumination, but it" wide application is still limited owing to some circumstances
such as comparatively big volume not to be convenience for use, low colouring
index not Siltisfy special requirement in some sectors, low lifetinlE' which does not
reach the normal operating hours and higher price compan'cJ with that of
incandescent Jamp.
The trichrollwtic lamp is the latest product, the lighting efflcienc.y of which
is supp'osed tu Ill' 4-7 timps that of the incandescent lamp, 1.2-2.:1 times as many
Ii

as that of the fluorescent lamp and also has long service, convenipnt size and high
colouring index etc.
If an incandescent lamp with 75W is replaced by a trichromatic lamp with
16W power consumption, assuming the average lighting hou rs to he 1,800 hr. then
we can calculate that every year about 10.5 Twh are expect~d to be saved. The
price of trichromatic lamp is 26 Yuan/pes around, the service life is 3,000 hr.
The average service life of the incandescent lamp is only 1,000 hr in spite
of rather low price (0.7 Yuan/pes). The analysis and comparison show that the
application of trichromatic lamp is both highly energy-saving and benefits.
3.3 Development planAs stated above, we can see the great energy-saving potential of the
trichromatic lamp, which is expected to substitute for the currf'nt incandescent
lamp.
By the year 2000, if every household would have at least one trichromatic
lamp, and some enterprises and administrative organizations would also takp
action to use more of this kind oflamp for energy-saving, it is estimated that there
will be 0.5-0.7 billion pes of trichromatic lamps replacing the incandescent lamps
and about 50-70 Twh will be saved, as many as 20 million tons of coal and 10
million tons of CO" reduction (in carbon contents).
3.4 Measures and policies
*
*
Increase in investment to establish and improve the indu;.;trial production
system for trichromatic lamp so as to expand the production and ensure
supply. In order to raise more funds nnd catch up with the world's advanced
level, foreign investment and advanced technologies are encouraged to be
imported according to policies cOlH:erning foreign investnH'nt mentioned in
above section 1.5.2. For Chinese industry and enterprises, foreign funds
with concessional conditions, e.g. low locm interests and long payback
period, are put in priority. Now, somc advanced production lines of energy
saving lamps have been imported by Chinese factories, for instance, more
than ten kinds of trichromatic lamp;.; an' Iwjng mm1ll fact ured by Beijing
Electron 1\lbe Plant using imported production line:,;. The new products can
generally save electricity by 80Cii: while compared with inc;-mdescent bulbs.
Pay more attentions to the research work of trichromat ic lam p. At present,
the poor quality poses a serious handicap to til(' applicMion of trichromatic
lamp. The actmd service life is ahout ],000 hr. on],Y 1 ':1 of the nominal

service, so no economic benefits can be brought to the user:-.. To improve the
quality, the emphasis may be placed on the import and introduction of the
advanced technological process and production line, for example, the service
life of the trichromatic lamp made in Phillips Co. may become 8,000-10,000
hr.
Go in for publicity and education to raise the puhlic awareness of energy
saving and take initiative to push application of the trichromatic lamp.
7'1
References
1. State Statistical Bureau of China, Statistical Yearbook of Chi,w (1991),
Press of Chinese Statistical, Beijing, China, August 1991.
2. State Statistical Bureau of China, Energy Statistical Yearbook of China
(1991), Press of Chinese Statistical, Beijing, China, January 1992.
3. Wang Zhenming, "Energy Conservation and Cogeneration", research report,
April 1991.
4. Wu Liangsheng et al (1992), "Development Strategy of Energy-Saving Lamp
Industry in China", Quantitative and Technical Economics, Beijing, China,
Vo1.8, No.4, 1992.
III: Iii I., ~

TECHNOLOGY TRANSFER IN THEINDIAN CONTEXT
We gratefully acknowledge the generous support provided byMs. Amrita N. Achanta, Mr. S. Bhattacharya,
Mr. G. Chandrasekar and Mr. Akshay Jaitly ofTata Energy Research Institute,
9 Jor Bagh, New Delhi, for completing this paper

1. Introduction
1.1 Technology transfer
The Conventions on Climate Change and Biodiversity adopted in Rio in
1992, both envisage technology transfer for developing countries. The
developing countries are expected to meet certain commitments conditional to
these transfers being made. This necessitates an assessment of the prevalent
conditions in which such transfers would be made. This report commences with
a general discussion of the issues involved in technology transfer, followed by a
discussion of the barriers hitherto preventing an effective transfer under Indian
conditions; and finally a brief description of policy reforms introduced by the
government to facilitate technology transfer and foreign direct investment.
Technology transfer can be defined as the process by which technology,
knowledge and/or information developed in one organisation, in one area or for
one purpose is applied and utilised in another organisation, in another area or
for another purpose.
Bell (990)1 distinguishes between these categories of transferrable
technology and has identified them as three flows:
i. Flow A: Capital goods, Services and Design Specifications
ii. Flow B: Skills and Know-How for production
iii.Flow C: Knowledge and Expertise for generating and managing technical
change.
Transfer of technology can occur from a supplier to a recipient by various
mechanisms both commercial and non-commercial. The principal routes of
commercial transfer of technology are :
1. Direct foreign investment in a host country subsidiary or a joint venture
2. Licensing of industrial property rights
3. Technical assistance
4. Sale, importation,installation and servicing of machinery and equipment
and other capital goods and
5. Franchising of consumer goods and services
1 Bell,M., Continuing Industrialization, Climate Change and
International Technology Transfer. A Report prepared in
collaboration with the Resource Policy Group,Oslo,Norway. Science
Policy Research Unit.University of Sussex. (1990)

The success or effectiveness of transfer of the technology would bedependent on the prevalent conditions within the recipient country, apart fromthe stage of technological development, characteristics of end users andpotential for absorption and diffusion within the recipient country, amongother factors. The following discussion pertains to some of the barriersidentified by individuals involved in collaboration agreements with Indianindustry.
1.2 Barriers to Effective Technology TransferSome of the barriers to effective technology transfer which have been
perceived by foreign industry with respect to collaboration with Indian industryin the past have been identified as :a.Import restrictions on technology, b. Limited depth of technology transfer, c.Delays in approval,d. Royalty limit of 5 per cent on value added ( withexceptions for highly sophisticated technologies); is considered restrictive byinternational standards apart from the limitation on the contract duration, e.Firms also disliked the control exercised by the Indian Government. Inparticular they disliked the obligatory sublicensing requirement of Indian lawaccording to which the Indian party could sublicense the technology onmutually agreed terms. f.Procedures to be followed were considered complicateddue to reasons ranging from bureaucratic detours, administrative problems,andvarying approval procedures. g. The profitability of the technology transfer maybe under question due to the tax burden, the customs duties on imports and thepotential of better payments for these tranfers.
A study carried out by Desai in the mid 1980's has been considered alandmark study. Some of the findings of this study which was a critique of theimport substituting regime were:1. The extent of foreign teclmolol:,'Y as well as foreign direct investment has
been negligible as compared to other LDCs as measured by number oftechnical collaboration agreements.
2. Regarding outflow of payments on account of profits and dividends Indiawas way below most other LDC's.
3. Indian collaborations have tended to be shallow in depth of technologytransferred.
4. Restrictions have been in existence on foreign direct investment andtechnology import in the form of restrictions on royalties, duration,
.,<.( (J

equity participation and absence of large lumpsum payments. This has
reduced outflow of foreign exchange simultaneously decreasing the
depth of technology transferred.
5. lt was found that technology import did not deter indigenous research
effort and importers of technology tended to do more research.
6. Multinational corporations were not the major sources of the technology
transferred so far.
7. The highly sheltered import-substitution industrialization regime lead to
a lack of competitive pressure to upgrade existing technology.
8. The prevailing industrial policy discouraged the existence of the kind of
firm which could effectively negotiate and assimilate technology.
9. The study also focused attention on Government expenditure on
industrial R&D. They have been unable to generate the requisite amount
of commercially relevant technology and the income generatf'd from the
sale of such technology has been negligible.
The study also advocated some remedial policy measures such as :
1. Liberalization of restrictions on the import of technology
2. Simplification of procedures
3. Removal of limits on royalties
4. Removal of limit on lumpsum payments
5. Encourage foreign equity participation and therefore modify Foreign
Exchange Regulations Act.
6. Encourage R&D through tax concessions, incentives to in-house research
and development like investment subsidies and other financial support.
7. Lower trade barriers
8. Delicensing and broadbanding
9. Removal of FER.i\ (Foreign Exchange Regulation Act) and MRTP
(Monopolies and Restrictive Trade Practices) controls on large and
foreign enterprises
10. Dereservation of products for the small scale sector and industries for
the public sector
11. Exposure of public sector to competitive pressures
12. Removal of restrictions on mergers.
The inclusion of these study findings is significant because of its
relevance in the present altered environment meant to encourage and/or

facilitate technology transfer. Thes(> liberalization measures introduced by the
Government have to a great extent removed the irritants hitherto discouraging
such transfers.
1.3 Transfer of Technology Regulations
In India transfer of technology regulations, relate to the major policy
areas of Ci) Technology policy,(ii) Foreign Exchange Regulations
(iii) Industrial policy and (iv) Trade policy.
Till recently, entry of foreign capital and technology into India, have
been allowed if they met the following conditions:
a) Undertakings either Indian or foreign should conform to the general
requirements of the Industrial Policy.
b) Foreign concerns are permitted to earn profits subject to regulations
common to all other enterprises functioning within the country.
c) Foreign exchange considerations would determine the freedom to remit
profits and repatriate capital.
d) The major interest in ownership and effective control of an undertaking
was to be in Indian hands.
Two major policy statements have affected significantly the transfer of
technology. One being the Industrial Policy Statement (1980) and secondly the
Technology Policy (1983). A new industrial policy statement has been released
as recently as July 1991. This is discussed later in the report. The noteworthy
features are that import of technology can be considered under certain
circumstances.
if technology is not too closely held and is not available on competitive
terms
if technology is required for updating the existing technology to meet
higher domestic requirements or to become competitive in the export
market
if the technology is required for production of items with substantial
exports backed by buy-back guarantees.
Collaboration agreements are subject to Indian law and are expected to
meet certain terms and conditions.
a. The Indian party should be free to sublicense the technical
knowhow/product design/engineering design under the agreement to
another Indian party on terms to be rnutuaJlyagreed to by all the parties
III' III,..,. -, r·· •

concerned including the foreign collaborator and subject to the approval
of the Government.
b. The percentage of royalty is dependent on the nature of the technology
but should not normaHy exceed a limit of 5 percent on sales.
c. The coHaboration agreement should be for a duration of ten years,
including the period for going into production.
d. There should not be any binding clauses in the Indian agreement
relating to procurement of capital goods, components, raw mat€rials,
pricing policy and so on.
e. Use of foreign brand names is not permitted for internal sales.
f. Under the Foreign Exchange Regulation Act both Government approval
and Reserve Bank approval is required prior to entering such
coHaborative agreements.
Renewal of contracts has also been difficult under Indian conditions and
was normally done in exceptional cases like:
1. Item of manufacture sophisticated and period of collaboration needs to be
ext€nded so that absorption of know-how may occur.
2. When collaboration agreement relates to the manufacture of a number of
related items and the delay in manufacture of certain items may
necessitate an extension.
3. An extension could be made if it is likely, to affect the export of the
manufactured product. Even when such extensions are granted every
effort is made to reduce the royalty payable.
1.4 The Technology Policy Statement (1983)
The technology policy lays down the guidelines towards technology
acquisition by India. The policy encouragps self reliance but does not imply self
sufficiency.
Acquisition of technology is governed by some of these principles not all
of which are discussed within this report.
a) Import of technology and foreign investment should be on a selective
basis where need has been established and the technology does not exist
within the country and the time required to develop the technology
would delay achievement of development targets.
b) Absorption, adaptation and subsequent improvement of imported
technology must form part of a Research and Development commitment.

The technology policy also incorporates encouragement of in-house R&D.
The Department of Science and Technology (DST) in collaboration with the
Directorate General of Technical Development (DGTD) operates a scheme
whereby recognized R&D units of industrial enterprises receive fiscal
concessions and other incentives.
According to the technology policy, based on the access of industry to
foreign technologies, industries have been categorized as follows:
a. Those in which indigenous technology was adequate hence no foreign
investmentllicensing to be allowed.
b. Those in which foreign technology is necessary but tightly held hence
only licensing to be allowed.
c. Those industries where licensing and direct investment would both be
allowed.
1.5 Policy reforms facilitating technology transfer and foreign direct
investment
The new industrial policy announced in July 1991 has been instrumental
in substantially deregulating the industrial sector and liberalizing foreign
investment and technology imports. The reforms would have far reaching
consequences for industry by shifting from a regulatory and protected regime
to a free market oriented competitive environment.
1.5.1 Industrial policy reforms
Some of the changes in industrial policy are:
(i) De-reservation of industries for the public sector, with the list of
reserved industries being reduced from 18 to 8. Those industries which
would continue to be reserved are in those areas where security and
strategic concerns dominate.
(ii) Abolishing industrial licensing for all projects except in 18 industries
where strategic or environmental concerns are paramount or where
industries produce goods with exceptionally high import content.
(iii) The MRTP Act has been amended so that the need for prior approval by
large companies for capacity expansion or diversification has been
eliminated,to enable Indian firms to become large enough to compete
effectively in global markets.
(iv) The requirement of phased manufacturing programmes has been
discontinued for all new projects. This had been in force for a number of
.~'

engineering and electronic industries in an attempt to quicken the pace
of indigenisation in manufacturing.
(v) Areas reserved for the public sector have been narrowed down, and
greater participation by the private sector was permitted in the core and
basic industries. This has been narrowed to 8 such areas as compared to
the earlier 17 areas.
(vi) Government clearance for location of projects has been dispensed with
except in the cases of 23 cities with a population of more than one
million.
(vii) Small scale industries have been given the option of offering upto 24 per
cent of their shareholding to large scale and other industrial
undertakings thus allowing them greater access to capital and
technology.
(viii)A national renewal fund has been set up with a corpus of Rs. 200 crore to
ensure that the costs of technological change and modernization of
industry are not borne by the workers.
Likewise industrial policy has been altered to promote inflow of direct
foreign investment:
(i) For a specified list of high technology industries and high investment
priority industries firms will receive automatic approval to make foreign
technology agreements within certain guidelines. This list has been
further altered to increase the number of industries which could obtain
direct approval.
Oi) Hiring of foreign technicians and testing of indigenous technology abroad
earlier required case by case approval. This will not be required any
longer.
(iii) The limit of foreign equit.!' holdings has been raised from 40 per cent to
51 per cent in a wide range of 34 priority industries. However, foreign
exchange outflow on account of dividends on additional equity will be
balanced by export earnings over a period of 7 years from the
commencement of production. Foreign equity participation has automatic
approval and is cleared by the Reserve Bank of India.
Foreign technology agreements are also liberalized for the same
industries allowing them to negotiate the terms of technology transfer
based on their own commercial judgement and avoiding the need for

government approval for both hiring of foreign technicians and the
testing of indigenous technologies abroad.
(iv) The procedures for investment in non priority industries have been
streamlined. The Foreign Investment Promotion Board (FIPB) has been
established to negotiate with large international firms and to expedite
the clearances required. The FIPB also considers individual cases
involving foreign equity participation over 51 per cent.
(v) Technology imports for priority industries are automatically approved for
royalty payments upto 5 per cent of domestic sales and 8 per cent of
export sales or for lumpsum payments of Rs. one crore.
The response to the new industrial policy has been very encouraging.
After the announcement of the new industrial policy, although registrations
have been discontinued the filing of industrial entrepreneurs memoranda has
replaced it. The number of investment approvals given in 1991 has risen to
5538 from 3335 in 1990. The figure for 1991 includes 3095 Industrial
Entrepreneurs Memoranda filed under the new policy, which would have
earlier required letters of intent or industrial licenses. 3897 investment
proposals were cleared between the announcement of the new policy on 24th
July 1991 and 31 January 1992. During the same period, 505 foreign
technology import agreements were also approved.
Changes brought about in policies toward direct foreign investment have
also evoked a strong positive response from foreign companies. In 1991, a total
of 244 cases of foreign equity participation with a proposed equity investment
of $504 million was approved. In the previous three years, 1988, 1989 and 1990
the total inflow of foreign equity was $95 million, $120 million and 50 million
respectively.
1.5.2 Trade policy reforms
Some initiatives have been taken to provide an environment which
would reduce the degree of regulation and licensing control on foreign trade.
Theyare:
(i) Permission to import capital goods was given without clearance from the
indigenous availability angle provided this import was fully covered by
foreign equity or was upto 25 per cent of the plant and machinery,
subject to a maximum of Rs 2 crore.
11..-1lI -fW" ~

(ii) Export and trading houses and Star Trading houses are permitted a
larger range of imports. 51 per cent foreign equity is also now allowed in
trading houses.
1.5.3 Investment in R&D 0990-91)
It is important to assess expenditure on R&D in the light of the
measures announced by the government to facilitate technology transfer. A
recent estimate of India's annual expenditure on Research and Development in
science and technology shows a substantial decline in 1991. The nation's
research and development investment in 1990-91 was 4,186.43 crore (0.89
percent of the GNP) as opposed to the 1988-89 figure which was (0.96 percent
of the GNP) 4,003 crore.
Although the Government Research and Development investment has
decreased (this is significant considering that it is the largest investor in
Research and Development), there has been no significant increase from
industry.
The share of the industrial sector in the national research and
development budget was 23 percent amounting to Rs. 970.29 crores in both the
private and public sector. This is of significance given the government's policies
of encouraging technology transfer.
1.5.4 Patent protection ~d technology transfer
The nature and extent of intellectual property right protection extended
to technologies within a country, is important from the viewpont that some
developed countries believe that a strengthened IPR regime in India, would
encourage more technology transfer. In India, the legislation for protection of
technology exists in the form of the Patent Act 1970. This attempts to strike a
reasonable balance between adequate and effective protection of patents on one
hand and the developmental, technological and public interest needs on the
other. It considers the specific needs and conditions of the country ensuring
that protection neither affects public interest, needs of critical sectors of the
economy nor hinders the build-up of indigenous technological capacity. It is
argued that such a regime would favour the diffusion of technology.
Patent Law and Technology Transfer
A patent is thus a statutory grant by the government (or regulating
authority) to inventors and other persons deriving rights from the inventors, for
a limited duration, that confers on them the right to exclude others from

manufacturing and selling the patented article or using or imitating the
patented process or vending the resultant product.
The standard justification for any class of intellectual property rights,
including patents, is that they provide incentives for creative work. Further,
these rights 8re to be granted in a manner that maximizes the difference
between the value of the resulting intellectual property and ~he social cost of its
creation, including administration and transactions costs.
There are three issues involved here. First, IPRs regimes are premised
on the belief that prospective financial returns drive private creators of
intellectual property. In other words, that such private creators will have
sufficient incentives only if they have the ability to capture at least some of the
value that users place on such property. Second, there is the issue of whether
innovative activity takes place at least social cost. This may depend on the
extent to which creators borrow ideas or concepts from earlier work. Third is
the issue whether the IPRs regime maintains a proper balance between
creating and disseminating intellectual property. We now examine how the
specific IPR of a patent right (as distinct from copyrights or trademarks) find
expression in the Indian legal system.
1.6 Indian patent law
The primary law governing patents in India is the Indian Patents Act
1970, which was based on recommendations of the Tek Chand \ Iyengar
Commission on the subject. The Act was passed by a special sitting of
Parliament in 1970, and came into force on April 20, 1970.
Section 83 of the Act enunciates the general principles governing the
grant of a patent right and also the broad philosophy behind the Act. First,
patents should be granted to encourage invention and to secure that the
inventions are worked in India on a commercial scale and to the practical
extent possible. Second, they should not merely enable patentees to enjoy a
monopoly for the importation of the patented article.
The main features of the Act are as follows:
1. Patentable inventions are usually granted product patents. Process
patents are granted for substances used as food or as medicine or drugs
and substances produced through chemical processes.
2. Under Section 3, non-patentatable items include inventions relating to
atomic energy; methods of agriculture or horticulture, processes for

medicinal, surgical etc treatment of human beings or processes for
similar treatment of animals or plants to free them of disease or increase
to their economic value.
3. As specified by Section 53, the normal term of all patents is 14 years,
except for food, medicine, drugs and substances produced by chemical
processes, for which the period of the patent is 7 years from the date of
application or 5 years from the date of sealing, whichever is earlier.
4. The patent confers on the patentees the exclusive right to use, exercise,
sell or distribute the patented article or substances in India.
5. There is no statutory distinction between Indian nationals and foreign
nationals regarding patent rights. However, since India is not party to
the Paris Convention, it usually grants national treatment subject to
reciprocity.
6. A system of compulsory licensing, under Section 84, ensures the working
of the patent after 3 years from the date of sealing. If any reasonable
requirements of public interest are not satisfied, any interested party can
be licensed on application. The meaning of 'public interest' includes
issues around the potential availability and price of the item covered by
the patent.
7. If reasonable requirements of public interest are not served, the
government may, under Section 87, apply the principle of endorsement of
licenses of right for any patent. Process patents for food, medicines,
drugs and chemical substances are automatically deemed to be endorsed
by licenses of right after 3 years from the date of sealing.
8. A patent may be revoked by the central government if its application is
found to be mischievous to the state or generally prejudicial to the
public. Patents can be revoked for other reasons as specified by the Act.
The Act attempts to strike a reasonable balance between the adequate
and effective protection of patents on the one hand and objectives of develop
ment, technological advancement and public interest on the other. It attempts
to consider the specific needs and conditions of the country, ensuring that
protection does not negatively affect the public interest and the needs of critical
sectors not hinders the buildup of indigenous technological capacity.
There are thus important departures in the Indian statute from typical
patent laws in GEeD countries, relating largely to the duration of patents and
T .,
the patentability of certain products and processes i.e. a normative view of
what kinds of inventions may be patented.
1.7 The Dunkel draft text
The Final Act on the Uruguay Round negotiations of the General
Agreement on Tariffs and Trade (GAIT), also known as the Dunkel Draft Text
after Mr. Arthur Dunkel, the Director General of GAIT, envisages far reaching
changes in the current regime of IPRs, especially that of patents. If
implemented, these proposals will have profound impacts on the current Indian
system of patents. A look at the proposals is therefore germane to an
examination of Indian legislation on patents.
TRIPS (Trade Related Intellectual Property Rights)
The Dunkel Draft Text introduces product patents for all inventions,
including food, medicine and chemicals. It extends the protection of IPRs to
plant varieties in the form of breeders rights. Further, it provides for the
protection of patents for 20 years, regardless of the place of invention and
whether products are imported or produced locally. The Draft provides for
extremely strict limits on compulsory licensing of patented products by govern
ments, a device commonly used by governments in rich and poor countries for
items such as pharmaceuticals. It also extends exclusive marketing rights for
five years after the grant of marketing approval in the interim period when
product patent applications are under consideration. The TRIPS Agreement
envisages an uniform intellectual property regime. Once a developing country
like India is a signatory it no longer has the right to either frame or pursue its
own IPR regime in line with its developmental goals.
TRIMS (Trade Related Investment Measures)
The DDT seeks the removal of all TRIMS within a period of five years.
The proposals not only seeks to extend national treatment to foreign investors
but also aims to deny the impositions of performance obligations imposed on
foreign investors in respect of the use of local raw materials, components and
equipment, exports, the earning of foreign exchange, technology transfer re
quirements etc.
Agriculture
No special treatment for developing countries is provided in the case of price
support to farmers. The proposals require a reduction of support to farmers by
a minimum of 13.37c by 2003, in all cases where the domestic support is more
111111al_

than 10% of the value of production. Price support is to be calculated by
comparing the fixed external price and the administered price in the country, in
the base period of 1986 to 1988. The ability of the government to provide
subsidies for agricultural inputs is severely curtailed by the Draft. It allows
exemption from reduction for agricultural inputs only in the case for low
income or resource poor producers, something that may have -serious
implications for the diffusion of new technologies. These reductions of subsidies
would apply not only to chemical fertilizers but also to bio-fertilizers and new
varieties of seeds. The Draft also removes the right of governments to intervene
in the market by stipulating that food purchases by the government shall be
made at current market prices. This is applicable to purchase made even to
maintain stocks for food security reasons or to support public distribution.
Institutional Matters
A council on trade related aspects of intellectual property rights (TRIPS) would
supervise the operation of the accord, sitting alongside GAIT and the
envisaged General Agreement on Services under the umbrella of the proposed
Multilateral Trade Organization (MTO). The new agreement in regard to trade
in services (GATS), attempts to bring within the ambit of the MTO all services
such as banking, insurance, shipping etc. The Dunkel Draft provides for a
system of cross retaliation between countries under the disputes settlement
mechanism. This allows a country claiming violation of its patent rights by
another country to discriminate against the other in the matter of commodity
trade. Further, the Dunkel Draft envisages no special or differential treatment
for developing countries.
All these rules would have to be implemented in national legislation by
the 102 members of GAIT, observing the basic free trade precepts of national
treatment and non-discrimination between trading partners.
1,8 Effect of the Dunkel proposals on Indian patent law
As can be seen from the above examination of the Dunkel proposals, a number
of these will have a profound impact on current Indian legislation relating to
patents.2 We briefly examine some of the conflicts between the two.
The adoption of a new patents regime will also havesignificant impacts on prices of commodities andindustrial and economic policy in the country I butthese are not being considered here.

First, the distinction in the Indian patents regime between product and
process patents will have to be removed, since the Dunkel proposals provide
only for product patents. Second, the differential terms of patents permitted in
India, which varies between 5 and 14 years, wiII have to be removed and will
have to conform to the uniform standard of 20 year operation. Extension of this
period could be done further by using process patents. Third, the granting of
national treatment to foreign nationals seeking patents become compulsory, in
contrast with the current regime, where such decisions are discretionary. In the
case of the violation of a patent law, the burden of proof wiII shift from the
holder of the patent to the defendant, in contravention with Indian legal
principles, where, thus far, this burden has rested on the holder of the patent.
Oue of the obligations of the patentee was that the patent was
'workable'; so as to encourage the working of that particular invention within
the country. According to the Indian Patents Act (1970) a) patents are granted
to encourage inventions and to secure that the inventions are worked in India
on a commercial scale and to the fullest extent that is reasonably practicable
without undue delay and b) They are not granted merely to enable patentees to
enjoy a monopoly for the importation of the patented article. In comparison,
import of a patented product would be treated as equivalent to the working of
the patent, according to the Dunkel Draft.
lndian patent law not only confers rights of monopoly to the patentee but
it also ensures public interest by introducing an element of compulsory
licensing or license of right clauses. These obligations on the patentee holder
are to ensure the interests of the public are met; these obligations are to be
removed according to the DDT Text.
The DDT on TRIPS also completely rejects 'Special and Differential
Treatment' presently accorded to developing countries. Although there is
provision that the concerns of developing countries vis a vis meeting public
policy objectives will not be neglected, there is only a 510 year transitional
period which is given to these countries so that the domestic laws may be
harmonized.
Being a signatory to the DDT TRIPS Text would necessarily mean that
India has to automatically accept the Paris WIPO Conwntion to which it is not
a party.

In the following sections the case of cogeneration and lighting
technologies will be discussed in the context of technology transfers to India.
2. Case study of the cogeneration Industry In the context of
technology transfer
2.1 Introduction
Electric power is recognised as one of the key inputs for the
development of any modern economy. In India, although there has been a
phenomenal growth in the installed generation capacity, a chronic and sizeable
gap still exists between demand and supply of electric power. Studies carried
out by Central Electricity Authority have indicated that the power shortage
was of the order of 13% during the period 1980-85 and would be around 10%
from 1985-95. The uncertainty and cost associated with the supply of electric
power coupled with the fact that the environmental regulations are becoming
more stringent, it is anticipated that the economics of conventional power
generation will be adversely affected in future. One of the ways of increasing
the efficiency of energy conversion and usage lies in the concept of
cogeneration, which means simultaneous conversion of fuel into heat and
power. In the following sections, the concept of cogeneration is discussed in
brief covering different cogeneration technologies, the scope for cogeneration
in India and the barriers to the implementation of the cogeneration
programmes.
2.1.1 Concept of cogeneration
The term cogeneration is not strictly an engineering or a scientific
term. Cogeneration simply means the sequential use of energy from the same
fuel source. In other words, both work and heat producing ability of a given
fuel is fully exploited, thereby minimising instances of ' lost work'. Any system
that supplies both the steam and elecricity needs of a customer, therefore,
qualifies as cogeneration. The technology has merit, as it is more efficient to
produce steam and electricity simultaneously rather than produce them
separately. Cogeneration is not a new concept. In the US it was very popular
in the 1950's when it supplied over 50'!;' of the USA's power needs. With the
installation of large power plants, the interest in self generated electricity
gradually waned because of economic reasons. Cogeneration, however, made a
quick comeback in the US in 1980·s. The factors that helped this was the
'11

PURPA policy act that required utilities to accept and pay for self generated
electricity at an appropriate 'avoided cost' and the enforcement of stringent
environmental emissions. It is estimated that the expected USA cogeneration
market (in industries) by the year 2000, will be around 39348 MW (Gainey).
2.1.2 Advantages of cogeneration
The various advantages of cogeneration system are outlined below:
In a cogeneration plant, a good portion of the exhaust heat which is
otherwise wasted in the condensing circuit of a conventional thermal
power plant, is utilised in different processes, thereby utilising
70-90% of the thermal energy input.
Cogenerated electricity, depending on the system, is produced with only
40-70lk of the fuel normalIy required in a power plant.
It leads to lesser environmental degradation because of efficient fuel
use.
Cogeneration serves as a reliable source of power for the customer.
It leads to reduction in transmission and distribution losses as the
energy is produced in-house.
2.1.3 Cogeneration technologies
Cogeneration systems fall into two distinct categories: topping systems
and bottoming systems. In the topping system, the primary fuel is used to
produce electricity and the thermal energy exhausted is used for process
heating. In the bottoming cycle system, the primary fuel is used to produce
high temperature thermal energy needed for furnaces/kilns etc. The hot
exhaust stream is subsequently used to produce electrical energy through
waste heat boiler and turbine-generator system.
Based on the prime mover used, the topping systems are classified as:
Steam turbine topping system
Gas turbine topping system
Combined gas/steam turbine topping system
Diesel engine topping system
Fuel cell topping system
Stirling engine topping system
The bottoming systems are based on Rankine cycles and use either
steam or organic working fluids. Accordingly, the bottoming systems are
classfied as

Steam Rankine bottoming sytem
Organic Rankine bottoming system
Topping systems are more widely used in industries. Bottoming systems
are used mainly in industries where high temperature waste heat are
available and are characterised by higher capital costs than topping systems.
2.2 Potential for cogeneration in India
All process industries such as fertilisers, paper and pulp, sugar, food
processing, textiles, petrochemicals, refineries etc. need both steam and electric
power and represent ideal cases for the installation of cogeneration plant. An
independent study was conducted in 1986 by a team of consultants from
Gujarat and Maharashtra (CEI). The study revealed the following potential for
these two states alone with respect to cogeneration application for medium and
small scale industries.
Systems
Industrial topping systemsIndustrial bottoming systemsCommercial systems - packaged
Cogeneration unit (studiesconfined to Bombay City only)
Cogenerationpotential
(MW)
215050
50
Financialcost ofgeneration(Paise/kWh)
up to 13070-120
<160
Note:Systems with electricity generation cost under 130
paise per kWh are considered financially attractive.
Although a similar study on a national level has not been carried out so
far, it would be reasonable to asume that a potential of 10,000 MW of
cogeneration power exists in India in industrial and commercial systems.
Some independent sample surveys were also carried out in some specific
sectors. The results of the survey with regard to paper and pulp industry,
sugar industry and textile industry are summarised below.
Paper & Pulp Industry53 mills were covered under the survey. It was estmated that by generating
process steam at a higher pressure (with the help of high pressure boilers), it
would be possible to generate 600 MW of extra electric power with the same
quantity of fuel presently being consumed at a high load factor and negligible
transmission losses.
Cf3
JI1

Sugar industryA sample survey of a small number of sugar mills revealed the scope orcogeneration by going for higher steam pressure and temperature. It wasestimated that the additional power these sugar industries could generate for150 days a year, would vary from 2 MW to about 3.5 MW depending upon thecrushing capacity. The total power which could be generated from about 225modern sugar factories is estimated to be about 1750 MW without consumingany more bagasse than what is presently being burnt.Textile industryTextile mills utilise 60% of their normal steam requirement at a pressurebelow 60 p.s.i.g, while in most cases, the boilers installed in these mills arecapable of generating steam at 150 p.sj.g. or more. The low pressure steam isgenerally obtained through pressure reducing stations which leads to wastageof available energy. In a textile mill which is producing around 1,00,000meters of cloth per day, a small back pressure turbine can produce nearby 160kWh of electricity and simultaneously low pressure steam for the processheating purposes in the mill.
In spite of its vast potential, the cogeneration concept is not exploitedfully in India. The reasons for this are many, but some important technical,economic and institutional barriers are mentioned below:
In developing countries like India, the required hardware may not bereadily available in adequate numbers and may have to be imported forspeedy implementation. Capabilities for manufacturing cogenerationsystems based on coalloil based steam generator and turbine generatordo, however, exist in our country. Capability of indegenous manufactureof gas turbine based generators and diesel generators is, however, verylimited.Lack of skilled manpower required for the operation of cogenerationsystem and technical problems like tube failures in the high pressuresystem make the industry wary of tapping cogeneration potential.The design of cogeneration systems are site specific. Hence most systemsare custom made depending upon the specific requirements. Sometimesdue to lack of technical know-how, industries by themselves are notcapable of undertaking the design of cogeneration systems.Cogeneration schemes are capital intensive and as such, financialsupport in terms of soft credit, concessional customs duty etc. mayencourage industries to take up cogeneration programme. The highinitial cost, however, should not act as a deterrant. A preliminaryassessment indicates that the cogeneration investments arehighlyprofitable with payback periods ranging from less than one year to fiveyears for different industry sectors (3)Electricity boards should allow paralleling of cogeneration systems withthe grid supply and in order to improve the economics of cogenerationsystem should buy the surplus energy generated by the plant. Thereason being that sometimes the industry requirements may not befully met by the cogeneration system and hence there is a need to

interface this system with power utility so that the system can buypower from the grid. In the event of excess power being generated, thesystem can sell powerto the grid or to another industry by wheeling thepower through the power utility transmission network. The mainproblem foreseen in this type of arrangement is in the fixing of tariffsfor the interchange of power. The concept of 'avoided cost' as in PURPAact can be followed in this regard. Under this scheme, the utility buyback the excess electricity generated at a cost which the utility wouldhave had to invest in order to produce that power at that time.Some users feel that the size of cogeneration schemes being small, thereis little incentive to operate in parallel with the grid, and the electricityboards are also not keen or willing to reciprocate with power supplyduring breakdown of cogeneration units.Clients like paper mills are wary of switching over to coal in view ofproblems of coal dust affecting their product quality. The other fueloptions are gas and fuel oil. In the event of direct gas not beingavailable, any solution with fuel oil may not be commercially viable.
2.3 ConclusionsThe design of cogeneration systems permit cascading of energy from the
highest possible temperatures to lower temperatures, thereby generating workand providing thermal energy for the process. The concept of cogeneration isnot new and is practised very extensively in Europe and North America for along time. In India, although a systematic study to assess the cogenerationpotential on a national basis has not been made so far, but the scope appearsto be tremendous. It may be worthwhile to identify certain specific sectors andcarry out detailed techno-economic feasibility of the cogeneration scheme.Although it seems that technical barriers can be overcome, but large scaleimplementation of cogeneration programme, will largely depend on removinginstitutional and economic barriers as outlined in the report.
3. Specific technology study on energy efficient lightingtechnologies in India
3.1 IntroductionIn India, four different types of lighting systems are widely used
incandescent, fluorescent, mercury vapour, and sodium vapour. Table 1 showsthat over 80 percent of incandescent use is in the domestic sector, over 90percent of fluorescent energy use is in the industrial, commercial andmiscellaneous sectors, and over 60 percent of mercury and sodium vapour lampenergy use is in the industrial sector. However Indian electric utilities do nothave precise data on the contribution of electric lighting to the total utilityload. This is because electric lighting is required by domestic, commercial andindustrial consumers and no separate metering arrangements exist todetermine the contribution of electric lighting to the total load for each sector.Hence all available data is based on sample surveys or on macro level

assumptions on share of lighting in the total connected load or on theutilization pattern of lighting equipment.
Table l:Lighting electricity use by sector & lamp type (Twh)
Lighting system type
Sector Incand. Fluor. Mercury SodiumDomestic 7.4 0.3 0.0 0.0Comm.& mis 1.2 6.2 0.1 0.1Industrial 0.3 6.5 1.2 0.8Public 19t 0.2 0.9 0.2 0.3Total 9.1 13.9 1.5 1.2
Gadgil and Jannuzzi estimated the share of electric lighting as 17.4 percent of India's annual energy consumption. If the electric lighting requirementsduring system peak, which occurs between 1800-2100 hours, were to be fullymet, it would constitute 30-35 per cent of this unrestricted demand.Data based on a sample survey of 400 consumers in Delhi indicated thatthe percentage share of lighting in the total connected load was about 15 -20per cent. In villages the share of energy use in lighting is much higher at 70per cent due the restricted appliance ownership pattern of the rural consumers.The break up of this connected load in four electrical districts where the surveywas conducted are shown in Table 2.
Table 2: Percentage share of lighting in the connected load
District Fluorescents 9C Incandescents %
1. 40 602. 26 743. 24 76
4. 23 77
Similarly a survey of domestic and commercial consumers conducted inSouth Bombay showed that domestic lighting contributes 18.7 per cent of thesystem load during the peak time.
The share of lighting and its contribution to peak electricity demand areexpected to increase in future. The major reasons for this are:
(i) The population in the rural areas account for about 75 per cent of the
total population of India. Even though there are large scale rural
electrification programmes, only about 25 percent of the households in
electrified areas actually have electricity in their homes.
(ii) The shares of both domestic and commercial electricity consumption have
been steadily increasing. Table 3 shows the details. Lighting and space
conditioning loads are primarily responsible for this increase. This trend
is likely to continue.
Savings potential
As mentioned earlier the increasing migration of population from rural to
urban areas, shift from non-commercial to commercial sources of fuel and large
scale rural electrification programmes have increased the share of domestic and
commercial sectors in the total energy consumption from 17.3 in 1980-81 to
21.64 at the end of 1988-89. What makes energy efficiency in lighting more
important is a very high peak coincidence rate, arising due the fact that
majority of the lighting equipment in the domestic & commercial sector are
being used in the evening hours which is peak period for most systems in our
country.
There several options for improving the energy efficiency of lighting
systems in the domestic sector. These are:
1) Replacement of incandescent lamps by conventional tubular fluorescent
lamps fixtures.
2) Replace incandescent lamps with compact fluorescent lamps.
3) Use TLD fluorescent lamps in place of conventional fluorescent lamps.
4) Use of electronic ballasts for fluorescent lamp lighting systems.
There are many more technological options for improvement of end use
efficiency in lighting but we feel that only these would make a considerable
impact on the Indian power scene. The current stock of lamps in India is about
225 million of which incadescents acount for about 152 million and fluorescents
for 68.5 million.The details of the number of light points are given in Table 3.
('-11I

Table 3: Number of light points, million
Incand. Fluor. Mercury Sodium TotalDomestic 140.69 5.63 0.00 0.00 146.32Commer. 6.28 25.13 0.00 0.00 31.41Industr. 1.18 19.57 1.89 0.94 23.58Pub.Lgt 2.20 7.11 0.44 0.51 10.26Other 1.58 11.06 0.55 0.24 13.43Total 151.93 68.50 2.88 1.69 225.00
Incandescent lam s convert about 4% er cent of the In ut eJectncltp p p yinto light, while the conversion in fluorescents is about 10%. Compactfluorescent cost about Rs.250 each and are available in various sizes andratings. The life of these lamps is about BOOO hours on an average. Fluorescentlamps of 40 Ware most commonly used in India. The average life of theselamps is about 4000 hours. Incandescents last about a year and have anaverage rating of about 60 W. The main difference is in the cost of installationwhich are Rs 15 and Rs 130 respectively.3.2 Indian lighting industry
While the technology for manufacturing fluorescent lamps and electronicballasts is available in India, the compact fluorscents have not yet entered theIndian markets.An attempt was made by the Department of Scientific and IndustrialResearch (DSIR) to evaluate the state of the lndian lighting industry. The
report recommended introduction of new energy saving lamps, support &upgradation of small scale units, R&D thurst in basic lamp making processesand establishment of an all India Institute of lighting technology LightingIndustry in India.
The conclusions which emerged from the report are summarized below:a) The industry has been generally slow in product innovation andmachinery renewal.
b) The industry is charecterised by poor productivity, high production cost& low material efficiencies. It was felt that the quality of materials andcomponents need to be improved.
c) To improve the lighting industry to world standards free technology andreduced import duty on sophisticated equipment for energy saving lampsas well as components would be helpful.GLS lamps are manufactured in India are in the range of 15 W to 2000W, used for general purpose lighting in the domestic and commercial units. Theluminous efficacy of the lamps range from 8 to 15 lm/W. About 75 per cent ofthe general lighting service or GLS lamps which are for use in domestic (and
some commercial) applications are manufactured by 20 large and medium scalecompanies in India. Production levels have risen from 12 million pcs in 1940 toabout 260 million pieces in 1990. There is no discemible trend in production ofGLS lamps.Fluorescent lamps in India produce between 60-80 1m/Wand can be
designed either for high efficacy or good colour rendering. Fluorescent lampswere initially manufactured in Calcutta. At present there are about 20 largeand medium scale units in the organised sector producing about 48 million
clQC'

interface this system with power utility so that the system can buypower from the grid. In the event of excess power being generated, thesystem can sell powerto the grid or to another industry by wheeling thepower through the power utility transmission network. The mainproblem foreseen in this type of arrangement is in the fixing of tariffsfor the interchange of power. The concept of 'avoided cost' as in PURPAact can be followed in this regard. Under this scheme, the utility buyback the excess electricity generated at a cost which the utility wouldhave had to invest in order to produce that power at that time.Some users feel that the size of cogeneration schemes being small, thereis little incentive to operate in parallel with the grid, and the electricityboards are also not keen or willing to reciprocate with power supplyduring breakdown of cogeneration units.Clients like paper mills are wary of switching over to coal in view ofproblems of coal dust affecting their product quality. The other fueloptions are gas and fuel oil. In the event of direct gas not beingavailable, any solution with fuel oil may not be commercially viable.
2.3 ConclusionsThe design of cogeneration systems permit cascading of energy from the
highest possible temperatures to lower temperatures, thereby generating workand providing thermal energy for the process. The concept of cogeneration isnot new and is practised very extensively in Europe and North America for along time. In India, although a systematic study to assess the cogenerationpotential on a national basis has not been made so far, but the scope appearsto be tremendous. It may be worthwhile to identify certain specific sectors andcarry out detailed techno-economic feasibility of the cogeneration scheme.Although it seems that technical barriers can be overcome, but large scaleimplementation of cogeneration programme, will largely depend on removinginstitutional and economic barriers as outlined in the report.
3. Specific technology study on energy efficient lightingtechnologies in India
3.1 IntroductionIn India, four different types of lighting systems are widely used
incandescent, fluorescent, mercury vapour, and sodium vapour. Table 1 showsthat over 80 percent of incandescent use is in the domestic sector, over 90percent of fluorescent energy use is in the industrial, commercial andmiscellaneous sectors, and over 60 percent of mercury and sodium vapour lampenergy use is in the industrial sector. However Indian electric utilities do nothave precise data on the contribution of electric lighting to the total utilityload. This is because electric lighting is required by domestic, commercial andindustrial consumers and no separate metering arrangements exist todetermine the contribution of electric lighting to the total load for each sector.Hence all available data is based on sample surveys or on macro level

assumptions on share of lighting in the total connected load or on theutilization pattern of lighting equipment.
Table l:Ligbting electricity use by sector & lamp type (Twh)
Lighting system type
Sector Incand. Fluor. Mercury SodiumDomestic 7.4 0.3 0.0 0.0Comm.& mis 1.2 6.2 0.1 0.1Industrial 0.3 6.5 1.2 0.8Public 19t 0.2 0.9 0.2 0.3Total 9.1 13.9 1.5 1.2
Gadgil and J annuzzi estimated the share of electric lighting as 17.4 percent of India's annual energy consumption. If the electric lighting requirementsduring system peak, which occurs between 1800-2100 hours, were to be fullymet, it would constitute 30-35 per cent of this unrestricted demand.Data based on a sample survey of 400 consumers in Delhi indicated thatthe percentage share of lighting in the total connected load was about 15 -20per cent. In villages the share of energy use in lighting is much higher at 70per cent due the restricted appliance ownership pattern of the rural consumers.The break up of this connected load in four electrical districts where the surveywas conducted are shown in Table 2.
Table 2: Percentage share of lighting in the connected load
District Fluorescents % lncandescents %
1. 40 60
2. 26 74
3. 24 76
4. 23 77
Similarly a survey of domestic and commercial consumers conducted inSouth Bombay showed that domestic lighting contributes 18.7 per cent of thesystem load during the peak time.
The share of lighting and its contribution to peak electricity demand areexpected to increase in future. The major reasons for this are:
1l1;R~

pieces annually. The low capacity utilisation of these units is an indication thatthe lamp production can be increased considerably without furtherinvestments in capacity.3.2.1 Technology acquisition
As regards the compact fluorescent lamp, the technology formanufacturing is not available in India at present.However, several companiesare planning to manufacture these lamps in India in the near future. In themean time, CFLs are being imported into India in small quantities. Thetechnology for these projects would be made available by PHILIPS(Netherlands), aSRAM (Germany), GE (U.S.A) and PHOENIX ELECTRIC(Japan) to their counterparts in India, PHILIPS India, Surya Roshni, AparLtd., and Halonix Ltd. respectively. The acquisition of technology has not beena problem, as all these Indian companies had tieups already existing formanufacture of other type of lamps. Discussions with the manufacturersrevealed that there was no inhibition on part of the collaborators to provide thelatest technology. The manufacturers however felt that the prevailing importduties on equipment should be reduced from the present figure of 110 percentplus CVT( countervailed tax) as an incentive to manufacture compactfluorescent lamps in India.3.2.2 Technology absorption
Indian consumers seek to minimize the initial cost of a piece ofequipment and do not pay much attention to operating costs. There is generalconsumer reluctance to invest in efficiency. CFL's, being aproximately 10 timesmore expensive than the conventional sources of light, do not find consumeracceptance. At present, consumers in India are looking at CFL's more as afancy lighting system rather than a energy efficient source of lighting. Underthese conditions it is unnatural for companies to plan for manufacture CFL'sfor the domestic market only. Discussions with manufactures also indicatedthat at present it would not be economical to manufacture these lamps in Indiaas the market is quite smal!. Some of the manufacturers are planning to go infor CFL manufacturing plants in export processing zones which offer reducedcustoms duties for import of equipment in turn for a firm export commitment.These export oriented manufacturing zones also allow the units to sell asmallpercentage of their production in the domestic market. At present there is ashortage of CFLs in the int~rnational market. The Indian manufactures couldpossibly take advatage of this global situation. As mentioned earlier, themanufacturers are trying to first build tlw market by slowly exposing theconsumers to this technology by making available small quantities of CFL'simported from their respective collaborators. They feel that innovativefinancing schemes are required to increase the demand of these lamps in India.The manufacturers are looking at large campuses belonging to autonomousbodies and public sector companies so as to ensure smooth operation offinancing schemes. For achieving this end some of the manufacturers are alsoplanning to tie up with leasing firms. Another measure for increasedpenetration of CFL's in India would be introduction of such schemes bygovernment funding agencies/financial institutions. The Industrial developmentbank of India (JDBl) has a implemented such a scheme for industrialconsumers. Under this scheme industries get 90 per cent of the total amount ofrequired for changing over from high pressure mercury vapour lamps (HPMV)to high pressure sodium vapour lamps (BPSV). The remaining amount isrecovered through part payments over a pc-riod of five years.
I ') (

3.2.3 Technology adaptationThere are several labs in India which ~st lighting equipment and issue
certificates of performance levels. However, at present the Bureau of Indianstandards does not have any standards of performance for the compactfluorescent lamps. The basic infrastructure for lamp testing does exist in all th~ labs belonging to the BIS. Apart from labs of the BIS,the National test houses' - .and some of the regional test centres, also have facilities for testing lamps. At a .later stage, these facilities could be upgraded to test compact fluorescent lamps.Among research institutes in India, The CentrEil Power Research Institute(CPR!), at Bangalore 'has carried out fundamental research on CFL's. Thisinstitute has also brought out a report on the performance of CFLs. It coverstechnical aspects like -life of these lamps under Indian conditions, luminousefficacy compared to other sources of lighting, etc.
The National physical laboratory, a government funded research lab alsohas infrastructural capabilities for testing and research purposes. However, tbetime taken by these labs for providing test results is quite long due to a largenumber of interested clients. There is an urgent need to increase the number oftest centres in view of the ever increasing demand.
4. ConclusionIt is obvious from the foregoing discussion that technologies for both
cogeneration and efficient lighting are easily available to the Indianmanufacturers. The only lacuna seems to be lack of institutional facilities topromote them, as also a low level of consumer awareness.
rbJ-'

Bibliography
1. Sridharan,E.1991. Liberalisation, Self-Reliance and Technology Policy inIndia in the Eighties: A shift in the Terms of Discourse. Centre for PolicyResearch .Delhi.
2. Menon,K.S.V., Technology Transfer.Concept, Modalities and Casestudies. Goldline Publishers.Delhi.1991.
3. Economic Survey 1991-92.Part 1. General Review. Government ofIndia.Ministry of Finance,Economic Division. 1992.
4. Economic Survey 1991-92.Part II.Sectoral Developments, Government ofIndia.Ministry of Finance,Economic Division.1992.
5. "Cogeneration principles and practices and a European Overview",Report prepared by B.W. Gainey, Shell Inter-national Petroleum Co. Ltd.
6. "A status paper on cogeneration, prepared by the Confederation ofEngineering Industries (CEl), India, Task force on Energy.
7. S. Subha Rao and A. Sudhakar, "Some aspects of integrated energygeneration and utilization", Steam and Fuel Users Journals,January-March 1985.
8. TERI, 1987, Report on strategies for electric load levelling in India:PhaseI, submitted to the Advisory Board on Energy, Government of India.
9. TERI, 1991, Report on technical, policy and economic assessment onenergy conservation from efficient electric lighting, submitted to theDepartment of Power, Government of India.
10. DSIR, Government of India, 1988, Report on technology evaluation illelectric lamp industry.
11. CPRI, 1991, TR No. 230, Evaluation of energy efficient lamps: Compactfluorescent lamps.
12. Kothari et ai, Opportunities for improving end-use electricity efficiency inIndia, submitted to USAID.

TECHNOLOGY TRANSFER OF CO-GENERATlONSYSTEMS IN INDONESIA
We gratefully acknowledge the generous support provided byDr. Saswinadi Sasmojo, Dr. Moekti H Soejachmocn and
Dr. Ucok Siagian of Center for Research on Energy,Institute of Technology, Bandung,
Indonesia, for completing this paper

1. IntroductionAn investigat.ion on the status and development of the functioning of co
generation syst.ems in IndonesiCl, and an evaluation of the opport.unities for its
wider application possibilities has been carried out.
The study is mClinly concerned with the question of: (a) what
opportunities are open for the wider functioning of co-generation systems in
Indonesia, (b) what is and would be the role of international transfer of
technology of Indonesia in influencing the development of wider application of
co-generation system, and (c) what would be necessary to promote a better
environment for such transfer process to occur.
Prior to answering those questions, a set of relevant background
information will be provided, namely the general economic development of the
country, the developments in the energy sector, and major issues pertinent to
technolof,'Y transfer processes in Indonesia.
HClving analysed the t€chnology transfer issues pertinent to the wider
functioning of co-generation systems, a scheme for investment is proposed,
whereby technology transfer of co-generation systcms in selected applications is
envisaged to tak" place beneficially in tenns of improving enerf,'.v efficiency of
those selected art'a of applications. Such efficiency improvement will, in turn,
suppress the rate of genpration of spent resources from encrgy lise; thereby will
reduce emissions of environmentally undesired suh"tflncps. One can also expect
that the improvPd energy efficiency will result in better economic performance.
Excluding this introductory section, the report is organized into four
sections. First, an overview of the Indonesian enPl'gy setting will be gin'n.
Following that, sonw of the major issues in technology transfer will be
discussed. This i:-: followed by an analysis of technology transfer of cu~
generation systems can 1)(' bpnpficially prumoted.
2. Overview of the Indonesian energy setting
2.1 General overview
Oil is dominating the supply and consumption of energy in Indonpsia.
Other major commercifll energy. in decreasing order of r01:'1t ivp shil)"('s of
production and cunHllllption, are natural gas, hydropuwer, coal and geothermal.
Biomass, as traditional furm of enprg,y, has a very high sharp in thp total
energy supply, ctl/Tl'ntly estimated at 40':"-(. Its main consulllj)tion is in thp
rllral and 11 rbfln jwripheral residpnt ifl I sector.
The donwstic use of coal hB.s been accelerating for thp pflst fivp y(~ar",
and the levp] of production is abo increasing rapidly. However, the sharf' uf
I )
-

coal in domestic energy supply is still very low and mainly used in power
generation and the cement industry.
Electricity generation as energy supply has also developed at a rapid
rate, catering for the growing needs of the industry, urban households, and
rural electrification program. Considerable opportunity for improvement with
respect to losses can be found in the power sector; the margin between
electricity production by PLN and the electricity consumption is about 25-35%
of the generated electricity.
An overview of energy resources in Indonesia is given in Table 2.1.
Table 2.1. Energy Resources of Indonesia
Oil 6.78 x 10⁹ tons
Natural gas 6.04 x 10¹² rna
Coal 28.3 x 10⁹ tons
Hydro 75,000 MW
Geothermal 16,000 MW
Uranium indicatedPeat 200 x 109 tonsWind prospective
Biomass 1.085 x 10⁸ km 2 forest area and agro &silvicultural waste
Tidal, wave and ocean-thermal identifiedConcernmg the energy consum hon, at least at the last decade, thep
industrial sector has always the highest share of commercial energy
consumption followed by the transportation sector. The most rapidly increasing
consumption is also found in these two sectors.
The developments in energy demand can be described as follows:
during the periods prior to launching of the series of Five Year National
Development Plans (REPELITAJ, energy demand growth rate was 7.49{
per annum.
the average annual growth in energy consumption in each REPELITA
have always been higher than the average annual economic growth
The high growth rate of the commercial energy consumption is the result
of several factors, the major factors being:
the expanding investment in energy intensive industries
the rapid growth rate in electric power generation
the growth of the population
2.2 Energy Conservation Program
The government has planned a national program on energy conservation
consisting of four parts:
public education and campaign
technical information services
laws and regulation
research, development and demonstration
The first part. of the program was launched in early 1980, the objective of
which was to create public awareness of the Indonesian energy problem, and to
educate the general public on the importance of energy conservation.
Towards the end of 1983, the second phase of the programme was
start.ed by implementing an in depth energy audit and analysis in selected
energy intensive industries, power generCltion and distribution, transportiltioll
and commercial sectors. The result will be' used to identify potential enerh'\'
savings and to identi(y needs and problems to establish the basi:; for the
following phasE'S.
It is believed that it would be logical to start with laws and regulations
in the industrial sector, as it would be in tl1[' best interest of industries to S8ve
energy to cut pruductioll cost:;.
The government has estahlished a permanent national committee on
('nergy conservation with a comprehensive tasks that includp forllluli'ltion of
laws and reg1dations, g11idelines, and campaign and now is in the process of
issuing a Presidential Decree on Energy (:ullservation, and producing a mastpr
plcm for national campaign on energy cons(']'\'ation.
2.3 Environmental Issues Related to Energy
A view of the identified and observed environmental effects related to
energy deveJoplllPllt in Indonpsia is presented in Table 2.2.
2.4 Energy Policy, Planning and Institutional Framework
Energy Policy
TliP dpvpJopJ1H'nt in the energy system have takpn place within an
energy policy !OPt ting, Ill(' implementation of which has the following basic
fpatures:
process of the energy is regulated IJy the government
declining sharp of domestic petroleum consumption is pUJ'suPd, so that
export \"olume of oj] can be maintained or increased as targeted.
lOI

Table 2.2. Environmental Issues and Effects Related to Energy Developmentand Utilization.
Ppolicy measures in support the policy objectives.
policies on natural gas utilization and pricing is !lot specifically and
explicitly formulated in a comprehensive way.
Env. Area Environmental Environmental Affected AreasProblems Issues
Air Air pollution Urban air Major cities in Java;- particulates (dusts) pollution due to Jakarta, Bandung,- Carbon Monoxide transportation, Surbaya, Semarang,- Carbon Dioxide and dust Medan- Hydrocarbons- Lead
Lead Human- Nitrogen Oxides uptake- H2S Major cities in Java;- Acid Precipitation Urban pollution Jakarta, Bandung
Geothermal Bandungdevelopment Dieng, Kamojang,Urban & Power Mt. Salak MuraPlant Karnag, Jakarta
Water Oil Spills Marine pollution Offshore areas,Brines/Organics coastal pollution tanker oil refineries
Oilacap, Dumai,Acid mine drainage Coal mines East Kalimantan,
Ombilin, BukitHeat discharge Thermal Asam, East and
pollution south KalimantanLoss of habitat Power plant effiuent
Hydrologica in Jakarta BayBalance Coastal West, Central, Eastpollution Java Bontang Bay,
Jakarta Gulf
Land Land disturbance Land use Coal mine areas,Aesthetic Bligh transformation, Power plants,Loss of habitat deforesta tion, Hydropower,Subsidence' environmental Onshore oilLeachate hazardsStoragelDisposal Coal mine areas,waste sold waste Energy processing
and conversion
Social Population Resettlements HydropowerDevelopment
- energy conservatIOn In romoted, but there have not been anyeflectJ"e

Concurrent with th£' objpctivp:" and priorities of the national
d('ve!opment, the policy on energy development has the following
orientation;
energy development and utilization are to be directed towards prudent
and efficient management of energy, with due considerations to the
growing energy need, opportunity for export, and the long term
sustainability of energy resources; efforts for diversification through
enhancement in exploration, utilization and wider social acceptance of
alternative energies are to pursue,
within the framework of managing energy efficiently, conservation of
energy, particularly with respect to depictable oil derived energies is to
be pursued through, among others, appropriate pricing policy, the usc of
energ:'" efficient systems, and campaif,'l1 for lifestyle OUtt pr£'vent from
wastl'ful use of energy; th£' development of alternative energy source has
to lw pun;ued with due consideration to safety, sustainability of natural
resourc£'s and the environm£'nt.
t11P national capability and capacity in science and technology on the
supply and utilization of elwrgy has to be pursued through research and
development, education and t rainll1g.
development of the pOWI' sector has to be continuf>ll to induce economic
activities and to support human resources cleH,lopnH'nt in the rural area,
the proper expluitations are to be promoted to conserve pet roleum
consumption and to avoid em"ironmental degradation.
to assure and strengthen national resiliency in coping with future
development needs through proper management in t lw supply and use of
energy.
To achif>\"f> the poltr.\· ob.1,'diyl's allCi the specific targf'ts in shifting tIlt'
energy mix toward:- ]owpr shall' of uil, a set of policy program>, an'
defined, that are designated as intensification, diversification and
consen'ation programs.
111 tensificatioll program
\Vhat is mf'ant by this prog.ram is that survey and exploration of energy
resource" are to be intcnsifipcl to innease the level of economically
exploitable energy reservps.
DiversifIcation prugram
In the program, the df'dining sharp of oil in thf' donH'"tic eJlPr/-,,,' supply
mix is tu 1)(' pursued through repIHC('llH'nt with otlwl dume"tically
i'!."aihhlf> j"(':"OUH'P".

Conservation program
This program is considered as a mean of improving the efficiency of
energy use and is regarded as being supportive to the pursuit for
realizing equitable development process. This program also is intended,
as its objectives, to safeguard the sustainability of natural resources and
to achieve more balanced developments in pursuit for economic growth,
equity, and environmental protection.
In line with the above program objectives, the functioning of technically
and economically efficient, and environmentally sound technology in the
production sectors and in the use of energy resources is to be promoted
and developed.
The priority ranking for energy development in the near future is as
follows:
hydro and geothermal
coal and natural gas
new and renewable energy
The general policy on energy also include, as its component,
considerations concerning the creation of better climate for energy
developments and environmental management aspects. Regarding improved
and supportive climate for energy development, the policy specially points to
the importance of:
capability enhancement in support of the development of energy industry
appropriate investment climate and energy price
Regarding environmental issues, the general policy on energy stipulates
that the sustainability of environmental bearing capacity and environmental
functions must be maintained by way of:
diversifying the supply of energy
enhancing conservation measures
developments of local resources based energy supply to enhance regional
energy resiliency and reliability and to minimize disturbances to
environmental functions and bearing capacity
alleviate environmental pollution around abandoned energy mining and
development sites through proper land reclamation and rehabilitation
prevent negative social effects in undertaking energy development
projects
/1)

Energy Planning
Energy planning in Indonesia is undertaken within the realm of the
national development planning exercise. The national plan on energy
development is covered under development plan on mining and energy.
The main responsibility for producing the plan formulation in the energy
sector is the Ministry of Mines and Energy. Inputs for the planning
formulations are taken from the major energy state enterprises, namely
PERTAMINA (oil and gas), PLN (electricity), the coal state enterprise and PGN
(gas utility), and from other ministries. Other major agencies that are supposed
to contribute important inputs are BPPT (technology) and BATAN (nuclear).
The formulated plan would then go to the BAPPENAS (the National
Planning Agency), where it is synthesizes and integrated to become a
component of the five year national development plan.
With reference to the REPELlTA, yearly detail planning, mainly in
relation to public sector activities and yearly planni\lg government budget
preparation, is carried out, the plans are translated into specific programs and
projects. The planning for implementation of the programs and projects still
require considerable improvements.
On the supply side, the choice of reliable and efficient systems and
environmentally less damaging technology, in ·addition to economic
considerations, is extremely important in response to the demand for rapid
expansion. There is also considerable room for reduction of transmission and
distribution losses. On the demand side, there is even more room for better
management.
Considering that, being a developing country, Indonesia sill have to
struggle in coping with problems in dealing basic development imperative, the
available resources that can be allocated for technology development is highly
constrained. In the efforts for improving the performance of the systems in the
power sector, requisition of the required technologies by way of technology
transfer would be the best, if not the only, available option.
The lack in coordinatory functions to cope with incoming initiative and to
anticipate situational changes, and appropriately and timely incorporating
these to the on-going plans, as well as for long term considerations are
observed.
Institutional Framework
The energy policy is discussed and approved by the 14 member of the National
Energy Coordinating Board (BAKOREN).
The draft policy formulation were prepared by the Technical Committee
on Energy Resources (PTE). Originally, the scope of work of the PTE were:
1/\

to review and study future energy issues and based on which formulate a
national energy policy
to collect all reviews, formulations, suggestions, and programs, and
submit them to the Chairman of the Natural Resources Committee
to monitor all the follow-ups of government decisions on energy matters
and submit appraisal concerning those follow-ups
The implementation of energy policies is the responsibility of the various
government Ministries and agencies concerned. The responsibilities including
energy planning, resources deliniation and development, oil and gas
exploration, production and marketing, and development of coal, geothermal
and power sectors.
Within the government establishments, energy research and development
are carried out by several institutions.
If one look at the structural side of the Indonesian energy policy and
planning institutional framework, one can say that the necessary institutional
elements are in place. What is the most lacking is the establishment of strong
coordinatory support systems and the operationalization of an effective and
productive technical support systems, that deals with data maintenance, in
depth analysis, and preparatory ground works in producing policy and planning
formulations. There are no specially assigned resources on a full time allocation
bases for all these functions.
These weak points also results in the bias towards the supply side in
planning considerations and, therefore, inadequate attention to the demand
side management. A balance supply and demand considerations, that should
also take environmental factors into account, would require considerably higher
capacity in policy analysis and planning exercises.
2.5 Concluding remarks
From the previous description, one can conclude that an area that
requires considerable attention in energy development is the power sector. With
respect to the power sector, a great deal of effort is required, both in terms of
capacity expansion and in terms of efficiency improvement.
3. Major issues in technology transfer processesPrior to analysing the problem of technology transfer of co-generations systems,
the general issue of technology transfer will first be reviewed. In doing so it is
necessary to layout some analytical frampwork upon which thr issues will be
look at in perspective.
II )-•

This section, therefore, begins with R brief elahoration of the RTHllyticaJ
framework that will be used as a frame of reference in delineating relevant
issues and in guiding the analysis that will be made in suhsequent sections,
where the subject of technology transfer of co-generation systems will be
analyzed.
Subsequently, relevant issues concerning technology transfer in
Indonesia will he discussed in terms of a set of identified major parameters
defined in the previously mentioned framework. Finally, a discussion that
focuses on technology transfer in the power sector, where co-generation is part
of, will be given.
3. ~. Analytical framework
In discussing transfer of tpcllllology, first it is important to have a clear
conception of what is meant by technology. £>-isclltially tl'chnolof,'Y is
information. 1'1](' set of information that can be classified as technoloh'Y are tlw
ones that describe human knowledge on til£' creation of systems. As such,
technology can he viewed as a suhsd uf l:-'cientific knowledge that concprns with
the creation of things, as distinct from tIl£' other subset of scientific knowledge,
namely science. Science concerns with the description and explanation about
the strUC{UH' and behaviour of systems, whether natural of humAn
institutionalized s:\'stems.
The cOllll'nt of tlw set of tecllllological information i" gruwing
dynamically, in line with tl1P dynlllllics of human endeavours fIJI' t1w creation of
things, that call he useful or not very useful, and many Ill.'." turll out to be
damaging.
Volhen technology as previously conceptualized is operationalized, there
will be functional systems. 8mh sy"tems are 1110rp appropriately designated as
technological plwllumena. Technological pllPnomena can aplwar in diffen'nt
forms, such as physical functional system:--, organizational systems, practices
and prescriptivl' informational systems, such as design drawings, operating
manuals, management ted1l1iques, material specificfltion, wurk procecluH's, etc.
It cuuld also be extended to imlude skill" and eXlwrti,.,e or individuals having
the distinct feature of being skilled am] expert, or othp)'\vi,,(, knowledgeable in
technological llHl tters[1].
All those technological phenomena, however, an' caniprs of technolof,'Y.
The Asian and Pacific Center for Transfer of Technology of E8CAP grouped till'
information cont ent of thos!' varioll S tf'chnological phellOl11Pn<l int 0 fOll I'
categories[2]. llHII1t'ly:
object emlJ()dil'd techno]oKY, desil"TJHlted as tl'c1mowaH':
II j

person embodied technology, designated as humanware;
document embodied technology, designated as infoware; and
institution embodied technology, designated as orgaware.
Following the above conception on technology, transfer of technology is
essentially a process of flow of information on human creativity in producing
functional entities, that takes place among and through institutional entities.
Upon capture and accumulation within those institutional entities, such flow
may result in the generation of physical objects, or working arrangements that
(for some reasonable or unreasonable reasons) are valued as useful in support
of human moods or desires. The information transfers can be physical entities
like capital goods, or individuals, or data carrying media like engineering
drawings, or institutional working arrangements like corporates.
The underlying problem that arise in relation to the previously
mentioned technological information flow basically stems from the fact that: (i)
the information transferred is a valuable one, embodied in systems or
prescribing systems capable of creating benefits, or wealth, or influencing
societal behaviour; and (ii) the effort to generate the information and the
process of its embodiment of into functional entities require a certain amount of
allocation of resources (human, matrial and funds).
It is natu!al that the generators and providers of the information expect
compensation for the resources spent to generate and package the information,
and also certain rewards for the effect that the functionalization of the
information can have in creating benefits or wealth.
Consequently, the recipient of the information must spend their
resources to acquire that information. This party, in turn, will concern with the
return of the resources spent. This return is expected to be generated through
the functioning of the acquired information.
It is therefore apparent that, in spite of other considerations, the key
issue to be realized in dealing with technology transfer is that it is basically a
process of exchange where information is being traded directly. If the
information trading occurs indirectly, such as when the information is already
embodied in physical objects, the mechanism and institution of exchange is well
established and well known. One will see such indirect information trade as
commodity trade, where whatever problems that originally may have developed
in the past have already been resolved. Such established mechanism and
institution for direct information trade remains to come.
Besides the considerable void of established mechanism and institution,
technology transfer processes also have additional problem. There are certain
/ I i

peculiaritie1' 3hout til£' commodity he'ing trad£'d in wchnology transfer
processes. The' following are some illustrations about such peculiarities:
(i) Technology, by its very nature, has the potential of inducing change in
productivity; this in turn could affect cost of production, competitiveness,
or economic g3ins of thf' buyer. Furthermore, it. may also induce
imlOvative processes t.hat. may lead to the development of capability of
the buyer to make improvement of the particular technology, or generate
other technology. All of those may run counter t.o tll(' interests of the
provider or producer of the technology;
(ii) Since the essence of technology is informat.ion, and information
acquisition is attractivp only when the party that try to acquire the
information does not completely mast.er tlw subject matter contained in
the information, the technology buyer has to face the' risks of not getting
what he r"eally wants. On the other hand, the seller would not release the
essential information, since otherwise the attractiveness will be lost.
Having elabonlll'd 011 thf' e;;sl'l1tial nRt u n' of technology and
tnmsfer of technology, tlw core of the subject matter of this sub-section,
i.e. the analytical framework that will be taken as a frame of reference
for analysis in this study will be developed and outlined.
3.1.1. The structure of technology institu.ticm system
The structure of systems wherein t£'chnolof,':'· transfer processes take
place has some generic feature".
Figure .'3.1 delineates the generic feCltures of :oystem;; in which processes
of innovation that leads to the functioning of technolugical systems in
productive activities take plac('. Transfer of technology takes place inside and
through the VarilltlS elements of that structure.
A" can h,· "eell in Figur\' :-\1, the b;ISic elpmenb that accommodates amI
drive innovati\'e processes "HI': science and technology (S&T) institutions,
professional institutions, industry institutions, and the market. Except the
market, the oth('r elements arp directly in\'olved in technology transfer
processe;; arp all of the other elements mentiuned.
The industry institution ha;,; two di;,;tinct components, desif,'llated as
technology illdu:,-try and commodity and sprvices indut'try. The last is part of
the indu;;trial system that concern with the production imd delivery of goods or
services, hut does not generaU' or produce the prescribing aSlwch of the goods
or sen'ices that tho;,;e industries dPliver to the m;lrkpt. 1'111' otl1l'r element is
introduced to clp:,ignate part of the industry institutilln th,-11 tra11.'-late ancl
package S&T rp:,j'an:h and cleve 10p111ent J'psults into t pch 11111 llgica I prescriptions
1/
•

Ixtfrn.ll ~
tcquired,chnolog'Y
Mal
Sci.nc. I Tichnolo9Y Institution
I N.tinona.linforM.tion B.s.
I I I...----_.....--, ,..--'----..,Education Mil RIDInstitutions Insitutions-
.:ro:esslona ..Institutions
Profession,a.ssociatiol
$ MalProfess iona
COMMunicati(
externall':l.cquiredtechno I 09':l
Industria.l Institution
Technolo9':l Industr':lTechnolog':l develOPMentTechnology tra.ding/licencin9Design a.nd EngineeringRepalf a Mainentance servicesTechnical consulatanc':lMa.nageMent consulta.nc':l
$ supply laS deMand
COMModit':l I services industr':l
Medi a
and
ForUMS
externallyiCquiredTechno 109':l
GOODSAgricul tureFore~tryMinin9Manuf acturi rig
SERVICESConstructionlouris!"1Banki ng a
Financial
$. GaS
DOMestic a foregin Market
Figure 3.1. ScheMatic representation of innovation processes SysteM$ - MOne':l M- hUMan resources I - inforMation S - services; G- goods
~--.rIilI I.

that can be opcrationalized in the production and delivery of goods and services
that are found in the commodity and services industry.
The technology industry is the key element in the structure that
determine the technological capability of the described system, since it is the
place where information is processed and packaged into prescriptive
informational packages that are useful and implementable in production
activities.
3.1.2. Pattenls of technology transfer
The technological components being transferred can originate from
sources internal or external to the described system. The transfer of technology
originated from sources external to the structure is part of the international
transfer of technology (ITT) process.
With respc'ct to tilt' system under cOllsideratioll, such transfer (i.e. 111')
will be designated as horizontal transfer, for the simple reason that tlw
direction of the externally acquired technology flow is indicated as horizontal
flows. The transfer of technology originalf'd from internal sources, as is drawn
in Figure 3.1, basically flows in the vertical direction, and is therefore
designated as vertical transfer. For internally generated technology, the' spark
of the' innovation that leads to tIw generation of a cl:'rtain tl:'chnology could take
place in any of the elements of the indicated structme, but til(' flow will always
tRke place downwards.
Externally acquired technology
\Vith respect to tIl(' externally acquired (i.e. foreign) technology, the entry point
could be at any level, but the dominant technological components acquired are
different for each entry point. Thp cost il1\olvpd are also sib'11ificantly different.
If tl1P transiiction occurs at the S&T and professioniil institutions, the
dominant componenb being transferred aric' hU111ill1ware and infoware. and
mustly involve", opcn information. The co"l consequcnces of the transfcr is
lowest as compared to flow entering to tl1<' other element, nan1Ply the industry
institution. However the outcome of follcJ\\··on activities that will eventually
result in productive comnwrciaJ operation I'" uncertain and undpt'·rmined.
Thp transactions which take placp at the intlustry institution can have
two different entry puint::;, namely to the tl'chnolof-,'Y industry, or to till'
commodity and service" industry.
If the entry point is at the technology industry, the technological
components being transkrred is dominated by hUll1all\\',i!'c' and infr)wilJ'c, as in
t11(' CRse with tlw Iransanioll'" taking placc in Ilw S&T ill1d profr'ssiollill
institutions. But. in iiddition, it can also includp suhstiitltial level of transfer of
(11

orgawares. Furthermore, the cost required for this particular transaction is
considerably higher. The effectiveness of the transfer, as measured by the
quality and intensity of subsequent transfer to the commodity and services
industry, is predominantly governed by the level technological capability of the
recipient.
The flow of externally acquired technology that takes place at the
commodity and services industry are generally most costly, and dominated by
technowares and orgawares. A nation's lack of technological capability can be
detected by the high proportion of externally acquired technology at this entry
point.
In most developing countries this type of transfer generally leads the
other transfer nlPchanisms. The major reasons are:
I. in the process of industrial development the most felt need is the supply
of basic goods and services and to set the industry in motion; technology
acquisition is, therefore, made by way of purchase of capital goods;
ii. there is generally lack of technological capability to cope with the more
sophisticated or less ready-ta-operate type of technological forms; e.g.
capital goods vs. equipment drawings.
111. this type of transfer is most preferable to investors, either domestic or
foreign, since from any investor's point of view the motivational base for
capital in\"estn1Pnt certainly is not technology transfer, but tD capture
market opportunity and to secure market share of their products;
IV. considerations concerning scarcity of capital and technological resources,
investment risks, gestation time for effective delivery of the services that
the technology is expected to offer, make this type of transfer more
appea!ill g.
In the course of operating the acquired technology, when problems
appears and mort' expprience is gained in dealing with the technology, the need
for support systems'such as repair and maintenance, trouble shooting, technical
advise are felt, and demand for such services al'e growing. Such demand will
induce business opportunities and venturps in technical services that are
within the realm of what was previously designated as technology industry.
Otherwise the situation will motivate such endeavours through different
channels, such a" government initiated establishmenb or enterprises, or
through the impo::;ition of regulations that force the establishment;;; of the above
mentioned technical service::;. Eventually it may lead to the development of
design and engincrring as well as internally generated technological

prescriptions, either on newly developed technology or the improvement or
adaptation of the externally acquired technology.
Internally generated technology
Technology transfer processes involving internally generated technological
systems can be seen as a separate process parallel to those involving externally
acquired technology, or else can be considered as part of the overall transfer
process.
As one consider many interacting systems, each has a structure as the
one described in Figure 3.1, then the second point of view is more appropriate.
Processes within each structural system boundaries can be considered as part
of the overall transfer process among the interacting systems. The system
boundaries may coincide with national boundaries, corporate boundaries, or
other entities carrying such technology institutional structurp.
Transfer processes among the systems mainly contains information flow
processes through various exchange mechanisms. The proc{'sses taking place
inside the boundaries of each system comprises many process elements, that
include decisional processes concerning the allocation and exchange of resources
related to technology development or technology acquisition, processes for
technology marketing, dissemination for acquisition, and processes that are
directly dealing with the development, maintenance and olwration of.
technology.
Concerning the last group of processes, i.e. technology de\'elopment,
maintenance, and operation, if the particular technology originated from
sources outside of the system boundaries, the following terms are often used:
a. adoption, if the technology, upon acquisition, is made to function as is
receivcd;
b. alborptioll. if jn tll.:' course of opC'riitillg the tt'chnolog\ increasing
cumprelwn"ion and mastery of thp tcchnoJog,)' is taking place;
c. adaptation, if modification is undertaken to make the technology more
suitable to the environment where it is made to function.
\\Then adaptation and absorption are taking place, further effects may
occur that leads to the stimulation of technology development in areas around
the acquired technology. The confidence that evolve with the development
activities may also lead to the stimulation for the developments of otlwr
technologies.
3.1.2. Mechanism of transfer of technology
Fipne 3.:2 pro"ic]('s a visualization of the structure {If the mechanisms of
the previously described processes. It is shown in that fif,'l.ll"l· thR1 thpre arp

M
SOURCE OJ RECIPIENT(S) (R)
wi th respect with reshect with respectto the SOIJrce to the c lanne I to the recipie
EENVIRONMENT FOR TECHHOLOG~ TRANSFER
nt
Figure 3.2. The structure of the basic eleMents in the MechanisMs of transfer ofTechnology; T - technology cOMponent, M- MediUM, C- channel,S - source, R - recipient, E - environMent.
/2°
•

basic elelllents to be considered in analysing transfer of ext.ernally acquired
technology, namely: the technology being transferred (T), the nwdium that
carries the technology (M), the channel for the transfer (C), the source of the
technology (S), the recipient of the technology (R), and the environment in
which the transfer processes take place.
SOllle elaboration will be given concerning the terms previously
mentioned for clarification. Technology component is the particular technology
being transferred; in this particular study the technology in question is co
generation technology. The medium is the carrier of that technology and
appears as capital goods, management contract, technical assistance contract,
training, documents, experts or skilled person. The tnmsfer from the source to
the recipipnt will take place through transfer channeb, such as investment,
technical a:-sistance program, or development aiel programs. The environlllPnt
for technology transfer are law;,;, regulations, procedu]'('s, business practin's,
general economic conditions, wages, income level, as well as level of
technological capability of the work force, R&D institlltions, and educational
institutions. Policies on development, trade, energy, and other development
sectors are also important elements that influence technology transfer
processes.
The analysis in this study will be focllsed on tl)(' evaluation of selected
parameters of the previollsly mentioned environmental factors.
3.2. An evaluation on main parameters affecting technology transfer
processes
Of the many parameters affecting technolob'Y transfer, the ones to be
considered are: economic devPlopment, financing and fiscal policy, business
environment where the policy on investnH'nt arc also P)aborated, banking and
financial sy;,;tem;" investment fillilllcing. and the technolof,')' institutional set up
and level of capability.
3.2.1. The genera] environment for technology transfer
Salient features of the IndOJ1Psian economic developJl1Pnt
In tl)(' seventies, mainly due to the high oil priCf's in the international
market, the country experienced relatively high economic growth of around
7.80~ per annum. \\Then there was considerable drop in oil pricC', lower economic
f.'Towth was experienced with tIlt' average annual gTi>wlh 1"<1te in tllf' eighties is
around 5.7(i.
Beginning 198:), a serip;, of pconomic reforms WPJ'(' madl' hv tIl('
Government in reaction to the declining oil revenue;,. In gl'lH'ral they are
directed to develop and pro mot!· exports of commoditil's otlwJ" than oil and gas,
1\."'--J- -c

particularly manufactured, agricultural, and forestry products, With the seriefi
of economic reforms, revenues from exports of these other commodities have
been steadily increasing and in 1987 export revenues from these other sectors
surpassed that from export of oil and gas.
A deeper look at the structure of the import and export figures will
reveal that:
The share of imports of capital goods is close to ZO'Ic of tIlE' total import
values;
about 70-80';( of the imports are purchased of capital goods and other
major industrial inputs in the form of manufactured commodities;
while since 1987 revenues from exports of other commodities have
exceeded that from exports of oil and gas, OIl(' can observe that for
commoditif'S other than oil and gas, the balance of trClde has always been
negative.
Foreign exchange revenues from export is therefore an absolute necessity
for acquiring the flow of technology in the form of capital goods, technical
services, and commodities for industrial inputs. When demand for export of
manufactured products started to develop, the dPllHlJ1l1 for capitnl goods,
techical sf'nices. and commodities for industrial input:-; \\'PH' also accelerated;
this implies the importance of devising measures to enhancp technological
capallilit.\' and capacity for more resilient economic and industrial den>}opment.
\Vithin tlw past deCiidl!, efforts ill that direction are I\ll)]"l' "l'riou::,ly considerlJd
and undertaken ill the c1evelopmpnt process. In the Pi1."'1 fp\\ yeln::, there are
also indications that stronger linkages between the agricultural and industrial
sectors are pursued; this may eventually lead to improve tlw level of income of
the majority of the population, as allollt 55(~ of the labour force are employed in
the agriculture "ector.
The manufacturing sector hii" g-rowll more rapidly compan'd to the other
sectors since 1983, albeit the relatively strong dependency to import" of
technology.
During tlw on-going developnlPnt plan, tIlt' overiilJ economy is expectpd
to grow in real terms at an average annual rate of about 5"( _Provisional
estimates indicate that the industrial sector will, on average, grow at the rate
of 8.59( per annum, followed by the transport and comllllll1ication sector at
about 6.4\{ per annum, and the construction sector at about 6"( per annum. At
the saIllP time, tIlt' agricultural sector is PXlwcted to h'TO\\" h\' about ;-U-V".
mining by ii!Jout 0.4', (mel other sectors by about 6.1 {r 11('1 \'\'m.
•

Consequently, by the end of 1993, the basic structure of til(' economy will
have undergone changes. The share of agriculture in GDP is expected to decline
from 23.3% in 1988 to about 21.60/£ in 1993, follows by the mining sector from
15.9% to 12.6c!c. On the other hand, the share of industry is expected to
increase from 14.4% to 16.97t-, followed by transport and communication from
5.7% to 6.4%, construction sector from 5.6<')( to 5.8% and other sectors will
increase from 35.2% to 37.1%. With an expected annual population growth rate
of about 1.9<)(, the annual GDP per capita is expected to improve from US$ 424
in 1988 to US$ 706 in 1993.
Regional disparity and population
The population of the country is estimated to be 179 millions in 1990.
Population growth ratp has been declining ill tl1{' past two decades 0970-1990),
hut the prcsent level i" still relatively high about 2.2(1r pCI' year. TllP growth
rate is expected to drop to 1.9Cfr during REPBLITA V. Partly due to this
relatively high population growth rate, but more important is HlP limited
capacity of the economy to provide employment opportunities, l1lwmployment is
still a problem. It is estimated that new labour force seeking jobs during the
current 5 years development plan (which started in 1989) is 11.9 million; with
an expected annual average economic growth rate of 5ci-, the economy may be
able to provide only 11.4 millon of new employment opportunitie". Therefore, it
is expected that about half of a million pcople will remain unempluyed.
It is estimated that about 55'/( of the work force are ill tlH' agriculture
sector, where the level of income is generally lower than those in the industrial
sector. In combination with the proportion lwtween urban-rural population
(307t- to 70%), the situation creates pressure for increasing urbanization.
Another important issues is the unbalanced population density
distributioll alllong the region". In 1985 ,J H va ha" a populat ion den~it,\' of 755
population 'kill", SllIllatera 69, Nllsa Tenggara and Bali 106, Kalimantan 14,
Sulawesi 61, and Maluku and Irian ,Jaya 6: with the average population density
is 85/km2.
Financing and fiscal policy and business environment
Financing policy
In the 1970s and early 19805, expanding oil revenues enabled Indonesia
to sustain a policy framework characterized by largp pH IJlic inVt'stnll'nt in
capital intensive infrastructure and industries, together with a trade regulator)'
regime that stiO"c! competition.
Adjustment program which was laullched ill 198:1 i" c1esiglll'cJ to promote
more competitive economy, with increasing role of the privatP S('l'!ur and less
1,""1 oj.d..J

dcpcndpncy from the oil and gas sPctor. Thus the macro-economic measures of
the program are targeted not only at stabilization objectives, but also at
reducing direct public involvement in production and sustaining
competitiveness of the economy.
In parallel with those, the government has initiated deregulation in the
industrial sector by simplifying and relaxing the multitude of domestic
regulations and licensing procedures that constrianed the performance of the
industrial sector.
In 1986, the number of areas to private foreign and domestic investment
was expanded substantially and only a limited number of areas that are
announced in what is called negative list were restricted. With the introduction
of this new list, practically all sect.ors are now open to foreign investment.
Foreign investment are also given greater access to domestic capital and
financial institutions, and domestic partner ownership requirements are eased,
only 20C;; of the total US$ 250,000 as minimum requirements of investment.
Tlw applications of foreign investment are handled under one roof and
the procedure is designed such that the handling can be completed within 6
weeks. To promote and attract more foreif,'1l investment, the gO\'ernment gives
some tax facilities, in the form of tax exemption or delayed paympnt.
The inflation rate was relatively low during the past two years, i.e. 5A(/;
and 5.97(/{, but has gone up considerably towards the end of 199U. The
governnwnt has liirgeted to achit'H> an avprage 5r.·; inflation during the
REPELITA V.
The banking and financial institutional system
The banking system in Indonesia comprises a central bank, namely Bank
Indonesia, and state-o\-lll1ed commercial banks, private commercial banks,
regional development banks, and other non-banking financial institutions.
Some private commercial banks are owned by foreign banks, and opNate as
subsidiaries or branches.
A series of policy packages effecting the banking system have been
issued by the government. The first was HnllolllH'pd in .June 1983, that allows
banks to independently decide on the level of interest for their dppositors and
debtors without any majoT direction aT involvement from the central bank.
Each bank must be capable of accumulating and allocating funels directly from
and to the business community and the public.
The policy package of October 27, 1988 was launched to achieve the
following objectl\'f~s:
stimulating higher fund accumulation from tl1(' public

stimulating- drive for commodities other than oil and ga~
motivating efficiency improvemcnts in the operation and managemcnt of
financial institutes and banks
improving the capability in controlling and implementing monetary
policy
creating a better climate for the development of capital market
The policy package of December 20, 1988 is mainly directed to the capital
market, leasing institutions and insurances with the objectives of promoting
the availability of alternative financial resources to support the development
and enhancing the growth of the production sector.
The major sustances of the January 20,1990 policy package are:
that thf' central bank will terminate several credit programs on due datc
that the commercial banks an' obliged to allocate 2W·; of their credits of
small bu;.;iness firms
that the commerical banks mu;;t ohsPrve the legal lcllding limits in
allocating their credits
Some dominant characteristics of thp national banking system are:
the banking system is dominated by state-owned banks
operatiollally the banks are very centralistic
their oriplltation are to the five big cities in IndoJ1l'si,l, Medan, Jakarta,
Bandullg. Surahaya. and Semarallg
their dpcision to gTant a credit put a high emphasi;; on the provision of
coll;l1('ral and less considerations on credit worthinp",,,
their own capital equity are relat ively small compared to their assets
\Vith the previously mentioned policy measures, the banking system has
slowly undergojj(' shifts towards bettc'f' uperation"" and are forced to be
financially healt Iii.'!'.
8. Terms on )08n for investment
The procedure to get loan for im'pstment is relatively simp\(', Application
for investment loan has to be submitted with a feasihility study, If credit is in
the category of O!lf' of the existing sl)('cial programs, then fixPd proc('dur(' and
criteria ha;; to 1)(> followed,
There is a "pecific financial schenH' for each of the credit prOf.,'Tam
category. \\'ith the deregualtiol1 01' policy reforms, the l1umlwr of these special
credit programs are cOl1siderably reduced. Each bank establishes its own
procedure aml criteria requirements; the normal five Cs considerations are
applied, i.e, character of tlw lll<lnagellll'.llL capability of tlw l11ilnagPIlll'l1t.
capacity to earn profit, and capital.

The recent developments, the bank can accept a project that it finances if
it considers that the project is safe in terms of its risks. There 8re also cases
where several banks establish a consortium to finance an investment if:
the amount of credit is too large to be handled by each of the bank
the amount of credit exceeds the legal lending limit
each of the bank does not have sufficient knowledge and experience to
finance a certain business
Availability of long-term investment financing
The availability of funds to finance such long term investment is also
hampered by their equity, which usually are small, even though some banks
have gone public, other factors are:
the banks are very reluctant to provide long term credit funds, even a
high rate of interest
depositors are hesitant to put their money into a long term financial
contract
b. Changes in interest rate
Since the launching of the June 1, 1983 deregulation package, the banks
have more freedom in setting the interest rates of money deposits as well as
loans. The launching of the October 30, 1988 policy package, was partly aimed
at controlling the tendency and it seems to have positive effects in stabilizing
the interest rate level.
In the effort tu control inflation rate, the governn1Pnt has launched tight
money policy towards the end of 1990 and this has brough lip luan interest rate
that ranges between 24-289£. The continuing high interest rate has apparently
undesired effect to the business world; the hanks have responded to such
development by taking joint initiati yes to bring down the interest rate to lower
levels. The current level of interest rate i" around 22-23(;( per annum.
Norms of lmsiness organization
There are four major types of business organization:
limited liability company (PT); a corporate entity having shares with
limited liability of shareholdC'rs
joint and several liability of founders exist until the Deed of
Establishment has been approved by the fvlinister of .Justice
joint and several liability of Directors exist until tlw approved Deed of
Establishment is registered with the relevant local and published in the
State Gazette
a PT is l1ldnagl!d oy a Board of Directors Imandatoryl which is
supervised by a Board of Supervisors (not mandatory I. The Board of
•
Director:;; and the BOelrd of Supervisor~ are respon~ible to the General
Meeting of shareholders
Limited liability company (PT) is tlH' most relevant in modern business
ventures.
Taxation
The present tax laws of Indonesia comprises law no. 6/1983 on General
Tax Provision and Procedures, Law no. 7/1983 on Income Tax, thelt are applied
to individuals and organizations; and Law no. 8/1983 on Value Added Tax
NAT) on Goods and Services, and Sales Tax on Luxury Goods, that is applied
to business.
The tax system is basically self-assessment system with f'xtensive
withholding tax provisions. The tax authoritie:; will not issue clearances unless
adjustment in the form of Tax Asse:;snlPIJ ( or Tax Collection Not ices are made
resulting from any tax audit within a period of five years from tIl(' date the
payment was due.
The gClH'ral features of the income tax law can he described as follows:
tax subject under the incume tax lal"
resident tax subject and IJon-re:;;ident tax suhject
tax object is the world wide income
Taxable income of an organization or individual is 3rriw'd at by
substracting allowable deductions and non-taxable income from the gTOS:;
income. The allowable deductiolls include:
the cost of deriving, recovering and conserving
losses which may in most cases carried forward for five yp,trs
depreci3tion of the acquisition cost of property and amortization of costs
incuned in obtaining right,; and utlwr cost" that h<'lve <'l u",·ful life of
mun' thall O]ll' yl'ar
A permalll'nt l'stalJlishllll'lIt is SUl.Jjl'Ct to tax un taxablp im:ume abO\'e
rates plus 20,/, on the after tax taxable income, subject to existing Double Tax
Agreement rDTAl
The DTA generally pro"ide fur tlH' ,woidance of incidental douhle tax on
certain inconH' such as profits, di"idends, interest" and royaltie", because they
are derived from OIl(' DTA coulltry and rl'lllitted to ,mother DTA ("ountry. The
existing DTAs follow international model" for such a;"'H'enwnb.
Presently IndOlH'sia has condudpd DTAs with the following countries:
- I\etherlands - Canada - Auqria
- Bplfriumh
- Greelt Britain
- Philippi!1(,s
- Thailand
- India
. );e\\, Zealand
/)7

. Germany - Japan - France
- Denmark
Value added tax in imposed on the rendering of services, imports,
manufactured goods and all traded goods excluding retail at rate of 10%.
Luxury sales tax is only once imposed on a wide range of luxury goods at the
manufacturing or import level at rates of 10%,20% and 30l7£.
Foreign investment
The basic legislation on foreign investment is Law no. 1/1967, that was
subsequently amended by Law no. 11/1970. In these laws, foreign capital is
defined as foreign exchange that is not forming assets and part of assets not
procured with Indonesian foreign exchange reserves, and also reinvested profits
which were free to be repatriated.
As a general rule, the minimum total intended investment is set at U8$1
million, with the exception that a minimum as low as U8$250,000 is allowable
for investment in:sectors requiring little capital
particularly labour intensive, export oriented projects and in such
projects which are supportive the large-scale industry
projects entirely aimed at exports
The maximum foreign equity share is 80Ck to he reduced to less than 50Ck
within 15 years by divestment to local (national) hands. There is an exception,
whereby maximum initial foreign investment share of 95(k is allowable to be
reduced to 80'7c within 10 years and further to less than 50~i; within 15 years in
cases where large investment of U8$ 10 millions or more is il1'·olved or located
at remote areas at 10 designated provinces, or if 65('k of the products is for
export.
Where investment is located in bonded areas and the product is 100Cir for
export, the maximum 95ck foreign share is also allowable.
The government also provide investment incentives to foreign investors,
these are fiscal in nature.
Foreign capital can also participate in business in Indonesia through:
appointment of agents and/or distributors
joint operations or cooperations agreements
opening representative offices
technical or financial assistance agreements, licencing agreements, etc.
Investment in this category include business sectors in oil and gas,
general mining, forestry, and finance and banking.
Other particular factors to be considered
•

Besides the previously described parameters that set the environment for
transfer of technology, other factors related to business practices are also
shaping the environment, since technology transfer cannot be detached from
business activities. Another important factor is protection of intellectual
property rights and patent law of the country.
With respect to protection of intellectual rights and patent laws, one can
only say that in the past ten years the government has undertaken steps and
measures to strengthen the system; Act No.6, 1982 was issued to replace an
existing patent law that was dated from the Dutch colonial era. However
considerable efforts still have to be done. The institutional set up is still in the
making to be able to function and operate. The government enforcing apparatus
and the judicial system, in particular, still requires a great deal of
enhancement to be functioning effectively and properly.
Concerning factors related to business practices, the following quotations
n can properly reflect the situation:
A number of factors converge to make Indonesia a challenging (some
might say 'frustating' or risky) place to do business. The first is rooted in the
country's culture. The way business deals are made here is, in truest sense of
the word "foreign" to many who come to Indonesia from abroad (including many
fellow Asians). Business deals are not so much based on carefully crafted legal
documents (though these are certainly drawn up) as they are on the
relationships and bonds of trust that arise between partners in a venture.
A second, and related, matter is the state of Indonesia's commercial code,
some parts of which date from the Dutch colonial era, while others (particularly
regarding land rights and transfers) are entangled in a morass of locally-based
traditions reaching back centuries. The rule of law here is still very much in its
nascent stages. As a result, alternative strategies to minimize risk and
maximize your room for maneuver must be considered.
One clear upshot of these two considerations is that the standard ideas
foreign business people tend to have about being able to resolve serious
conflicts and disputes through the pursuit of legal principles and the
enforcement of legal document.s in a court of law can sometimes of be lit.tle
n Harvey Goldstein, 'Doing business in Indonesia' in Business in Indonesia,
Richard J Mann (editor), Gateway Books, Toronto, Canada, 1990.
utility in the Indonesian context. The reason for this are again partly rooted in
Indonesia culture.

utility in the Indonesian context. The reason for this are again partly rooted inIndonesia culture.
Eschewing litigation, the Indonesians prefer to solve disputes throughwhat they term "musyawarah" and "mufakat". These words mean "deliberation"and "consensus" and the process often involves mediators and arbitrators whoassist the conflicting parties in reaching an acceptable solution.
Another is that the average business person, no matter how skilled andsuccessful in other contexts, is utterly unequipped to make this mostfundamental of decisions. Whom should you choose as your partner? Whatrequirements should your partner fulfil? What and who should be avoided?How does one even begin to search? The answer to each of these question is asdifferent as the investments and business deals themselves. It is for this mostweighty of business decisions that you must seek advice and assistance. To failto do so is to court disaster.
Despite of what were quoted, it is also mentioned in the same referencethat:" ....... .Indonesia is moving rapidly in the right direction and, as a result,tremendous business opportunities have been and continue to be opened up".3.2.2. The channels and media for technology transfer
The channels for technology transfer, as was elabor1ited in the analyticalframework, depends on where the point of transaction tah~s place; at thescience and technology community, at the technology industry institution, or atthe commodity ,md services industry. Of the three transaction points, only thelast two will be considered. Possible channels for transfer in the direction of thetwo industrial institutions are:direct investment, joint venture, licensing, andtechnical assistance arrangement, whether on commercial basis or as part of agrant. All these channels are available, and the basic features concerninginvestment have been elaborated in Section 3.2.l. Elaboration on technicalassistance program is not necessary, as this type of transfer channel isnormally handled by way of simple contractual arrangement. Licensingagreement are usually made as part of the investment arrangement. If it is astand alone agreement, one has to be familiar with the legal aspects, thesalient features of which have been described in the preceeding section. As waspointed out the system is still developing and evolving.
All of the media described in the analytical framework are available asoptions. There is no particular that need to be elaborated on this aspect.3.2.3. Salient features of the recipient
With refl-'rl:'llcl:' to Figure :~.l there are thrl-'e classes of recipients, namelythe science and technology institution, the professional institution and the
1<")<..)

illdu~trial institution. Each of thosp entitips has basic diffprent fpatures,
corresponding to the roles that each has within the overall technological
institution depicted schematically in Figure 3.1.
The science and technology institution
TIl(' science and technology (S&T) institution comprises three basic
elements, the S&T information system, the educational system, and the R&D
system. In Indonesia thl' practical need for such system~, l'xcept til('
educational system is not really felt by the community at Iflrge. As such, therl'
is practically no allocation of resources by the private sector to establish and
operate R&D units and S&T information base system in Indonesia.
Establishments within the S&T institution in Indonesia are, therefore, almost
exclusively government operated or in some cases run by some of the large
state enterprises. Private sector R&D is practically non pxistent.
Basicil)]Y the S&T institution systpms ilre accoml11odated within five
organizational set ups, namely the university system, the government R&D
organizations, the departmental R&D agencies run by various government
ministries, R&D units of the state-owned l'nterprises, and R&D units of the
private industrial establishments.
As Ciln 11<' observed in other developing countries. tlw university system
(particulilrly sate universities) is the strongest element of the S&T institutions
in Indonesia in term of manpower resources, outlook, and id('a generating
capacity and capilhility. It must be pointed out thilt up to this point in time
only about five or six universities, illl art' stilte universities, that have such
strength. Practically all other S&T institutions ill tl1P country are initiated from
or by elements of the university system, and university people are always
involved ilnd plilY leading role in t]w process of estahlishing, and even
operating. thos(' institution.~.
\\'hik the univer"ity system has ilh'·;ly" Ill'pn playing leading role in the
establishment and operiltion of t]w various clements of the S&T institutions,
meaningful R&D output from the system it:;plf is minimill. Several filctors can
bp accounted for, the important ones being:
a. the heavy teaching IOild that facult~' members hayp to take, due to the
tremendously increasing dt'milnd for higher education;
b. tilt' numerous challenges ilnd opportunities that the fi1culty Jllf'mlwrs
have in applying their pXlwrtise outside of thp campus;
Co the luw ",aJary that tilE' government can provide to ul1ivPJ"sity staff:,:-;
d. tlw \"PI".\· clIllstrainl·d fimtllci<11 resources avaiJahlf' for I~&]) activitif'''',
/3l

Besides the university system, comparable R&D activities are
undertaken by government research organizations such as the Indonesian
Institute of Sciences (LIPI), the National Atomic Agency (BATAN), the National
Aeronautic and Space Agency (LAPAN), and several laboratories that are
accommodated within a science complex known as the PUSPIPTEK (National
, Science and Technology Development Center), and the Agency for Technology
Assessment and Application or better known as BPPT. These research
organizations, while not burdened with educational function, are facing similar
constraints as the universities.
R&D agencies of the various government ministries and R&D units that
are operated by state and private enterprises, such as the State Enterprise for
Fertilizer (PUSRD, the State Enterprise for Oil and Gas (PERTAMINA), and
the State Enterprise for Electricity (PLN) are functionally directed towards
solving operational problems and to provide technical inputs required for
planning purposes. In many cases their R&D efforts are contracted out to
university staffs or other government research organizations previously
mentioned.
At the national level, S&T development is administered by a specially
established ministry, and the current ministry is designated as the State
Ministry for Research and Technology. There is also a National Research
Council (DRN) that has an advisory function to the State Minister for Research
and Technology, and another hig!1Pr advisory body callpd the lndunesian
Academy of Sciences, that provides councel and advice to the President on
national S&T matters.
With an institutional set up as previously described, almost all of the
standard, formal government departments, councils and institutes are in place,
defining a system that, in principle, addresses the full range of S&T
requirements 011 the nation. However, as was partly pointed out previously,
there are serious shortcomings in the operation and effectiveness of the system.
The single outstanding aspect of the S&T institution with respect to S&T
development of the nation is its ability in maintaining the growth and the
spirit of the scientific community, without which the country would not be able
to reach whatever progress that it has.
The professional institution
In nurturing processes of innovation, professional associations playa key
role in accommodating forums of communication among the actor" the cut
across the R&D and industrial communitips. The functioning of professional

institution is thprefore an important element in technology trawofer processes,
particularly in technology absorption and mastery processes.
Unfortunately, the professional institution is fuctionally weak. None of
the existing professional associations in Indonesia are properly managed and
functioning. Except of proceedings of meetings and conferences, one practically
cannot find regular publications on S&T subjects produced by the professional
associations. However, in line with the improving eC6nomy of til(' country, there
are trends of improvements within the professional institution.
The industrial institution
As was indicated in Figure 3.1 and the corresponding elaboration, the
industrial institution comprises two major elements, namely tlw technology
industry system and the commodity and services indllstry syst.em.
Although horizontal (international! technology transfer abo occurs <It tl1£'
other institutions (S&T and profession <II institutions), it is in the industrial
institution that the need for ext.ernally acqllired technology arc strongly felt;
mainly because of its t.angibility and obspnable effects. This is more clearly
observed when the transfer process is taking place in the commodity and
services industry.
In terms of monetary vallie, the flow of externally acquin'd technology is
highest in the cOllunodity and services inclustl)'. As WliS lilrendy pointed out in
the elaboration on the patterns of technology transfer, such phC'lIomena are
generally obser\'l~d in dpveloping countries. Less int.ellectual sophistaication is
required with such transfer process, since the technoloi,'".l' is alrei'ldy will
packaged and 'frozen' in functional and operable mediums such as capital
goods, very detailed product design description amI specifications, and
operating inst ruction manuals, and usually is complemented with training.
Such technology tr<lnsfer processes it" exemplifipd ill the car industry,
fertilizer industry, cement industry, have "hown to be effectively taking pl:ice
in terms of the first level of technology alborption, which is the mastery of
operating the technology by way of adnptioll of tlw acquired technolob')" There
is no observable serious prohlem in this process. The mastery for operating the
technology has ill fact stimulate furtlwr IpYl'l of absorption processes, where
what is known as progressive manufacturing process is taking place. \l\7])3t is
meant by 'progressive manufacturing process' is that in the cour"e of operating
the transferred tpchnolog,y, the flow of technological components thi'lt were
originating from t1w sourcp is progressively deleted ami replaced by locally
produced or gPIH'nltecl components.

In the machinery industry, the process takes place by stages, started
with gradual replacements of imported parts, and eventually, following Ii
planned schedule, the development of new product designs is taking place. In
the process industry, such as energy or chemical plants, the stages that take
place are plant construction based on a given design, the development of the
design for construction, and eventually the design of the whole system as well
as the construction of the plant based on that design. This process also
stimulates other transfer processes for the production of selected process
equipment, following the progressive manufacturing scheme as previously
described.
The described processes have taken place in many sectors of the
manufacturing industry, and has resulted in the deepening of the structure of
the industrial system of the country. Starting with the commodity industry, it
goes to the technology industry, where engineering design and technology
development and packaging are evolving taking place.
The evolution that takes place is increasingly stimulating the
development of technology industry, and with that the demand for R&D
activities is also evolving. These trends are currently observed, albeit only at
the initial stages.
Concluding remarks
The above elaboration shows that technology mastery process that are
initiated with the acquisition of externally acquired technology is taking place
satisfactorily. With whatever limitation in human resources that the country
has, there is adequate capability for the absorption process. The hampering
factors are not in the domain of level of capability (either potential or real) but
in terms of capacity, regulatory infrastructure, and some other parameters that
set the environment for transfer.
3.3. Technology transfer issues in the power sectorIn discussing technology transfer issues in the power sector, first a
review of the development of the power sector is made. Issues pertinent to this
study will then be identified and discussed. Of those identified issues,
particular aspects that are most relevant to be considered in analysing the
problem of technology transfer of co-generation system will be pointed out and
assessed.
3.3.1. Review of the power sector development
The Indonesian power sector comprises: a) the State Electricity
Corporation (PLN) with 9171 MW installed capacity (1991) b) captive plants
installed by private and state-owned companies for their own use, with around
9000 MVA of capRcity (l990), and c) a IRrg(' number of cooperatives and small
private establishments which generate and distribute electricity at rural areas.
The Indonesian power sector is regulated by the Ministry of Mines and Energy
(MOME) through the Directorate General of Electric Power and New Energy
(DGEPNE). The Directorate is responsible for policy formulation, licensing of
electricity undertaking and general supervision of the power subsector.
PLN (the State Power Company)
PLN is a public corporation assigned to act as the holder of state
authority in the development of power sector throughout the country. Its
responsibility includes planning, construction, operation of power supply and
distribution facilities. Since its establishment in 1972 PLN has grown into an
enterprise with around 52,000 employees, of whom around 2500 are university
graduates. To support its development, PLN established 4 agencies namely
Engineering Service Center. Education and Training Center, Electric Power
Research Center and Management Service Center.
In line with economic development of the country since the seventies the
electric sector has been growing rapidly. The installed power capacity of PLN in
FY 1991/92 is 9,171 MW which is around seventeen fold higher as compared to
that in 1969/1970 which was only 541 MW or grew at an average rate of 14.4%
per annum. The power generating facilities of PLN (991192), in decreasing
order, consists of oil (44.5%), coal 09%), hydro (24.5%), gas 00.9%), and
geothermal 0.5%) power plants. The PLN's supply systems consists of over
1,000 individual systems, ranging in size from 100 kW to 4700 MW. PLN's
service extends to all regencies and about 70% of sub-regencies in the country.
Almost 70% of PLN's total capacity is located in Java, the most densely
populated island of the country.
With such capacity growth the PLN's power generation during that
period increased from 1,429 GWh to 30,000 GWh or at an average annual
growth of 16'k. In addition to this power generation PLN also purchases power
from other entities. The share of purchased power on PLN's production (self
generation and purchased) tends to decrease from a substantial 25.5% (489
GWh) in FY 1969/1970 to ollly 2.2% (443 GWh) in FY 1991/92.
PLN's customer totals about 10 million comprising of four sectoral groups
namely household (87%), industry CO.3'7c), commercial (3.6%) and public service
(2.4%). Up tD 1986, household sector had been the largest consumer of PLN's
J~S
supply and since then this position has been taken over by the consumption of
industrial sector, indicating that electricity consumption has shifted to the
more productive uses. Between 1982-1992 the relative share of household sector
consumption decreased from 44% to 33%. In the same period the share of
industrial consumption increased from 27% to 51%. However, PLN's relative
share in industrial electricity consumption is still relatively low. In 1991 PLN's
contribution in total industrial consumption is only around 42%, the rest being
accounted fro by captive generation facilities operated by industrial plants. In
the last ten years the demand from PLN's industrial customers grew at an
average rate of 22% per annum. In line with the rapid industrial growth,
industrifll electricity demand is expected to continue at high rate at least in the
next ten years.
One of PLN's impressive achievements is its rapid rural electrification
program. The program was launched in 1978 and in 1979 PLN electrified a
total of 280,000 rural households at 2,244 villages. In 1991 the total PLN's
rural customer has reached 6.3 millions distributed over 23,000 villages. With
total rural households of 28 millions and total village of 62,000 villages (in
1990), the rural electrification ratio, in terms of household and village, are
respectively 22.5(/, and 37%.
In spite of its rapid development, PLN is only able to serve around 70~i:
of urban household and 229, rural household (1990), whereas it is estimated
that around 90(/t of urban household and 609t of those in rural villages could
afford to purchase electricity.
According to PLN projection the Indonesia power demand in Repelita VI
(1994-1988), Repelita VII 0999-2003) and Repelita VlIl (2004-2008) will grow
at a rate of respectively 17c/c, 12c/c and 87r. To meet such demand growth PLN
installed capacity is tu be increased that at the end uf each of the above
mentioned repelita PLN's capacity would reach respectively 25 1W, 40 TW and
57TW.
Captive power
The unmet demand of electricity, in terms of quantities as well as
quality, for industrial sector which rapidly grew in the late seventies has since
lead to the rapid growth of industrial captive plants. Excluding large captive
plants (more than 200 MW/plantJ, the total installed capacity of captives has
grown from 2,385 MVA in 1978/79 to 5,775 MVA in 1989/90. Almost half of the
later are also connected to PLN and operating on standhy basis. Including large
captive plants the total captive power in 1989/1990 was 9000 MVA and about
half of them are plants with installed capacity of at least 10 MVA per industry.
111'11. r_

I
The PLN's share in industrial electricity consumption is only around 420
(991); the rest being supplied by captive plants.
Unlike PLN's electricity system where it is concentrated in Java, more
than half of captive plants are installed outside Java. Captive generators in
Java is mainly diesel plants (about 80%). Outside Java captive power
generators are more evenly mixed. It comprises of: diesel (44"w); natural gas
(27~); hydro (17.7%); biomass (6.6%) and oil/coal-fired power plants (4.2'.H
Biomass power plants are used in industries processing agricultural products
like in palm oil and sugar industries and in wood processing industries
(sawmills/plywood).
Rural electric cooperative and micro enterprises
Lack of PLN electricity supply in rural an,as gave rise to the
establishment of rural electric cooperative and micro enterprises. In 1990 there
were a total of around 20 rural cooperatives with total capacity of about 265
MVA serving about 40 thousand rUTal households. According to a 1986
economic census, there were a total of about 17 thousand small private utilit ies
in 1986, each operating generator of] kW or more with at least ]0 customers.
The total installed capacity of this micro utilities was about ]80 MW. Most of
these utilities were household establishments without licence, serving low
quality electricity and charging high tariff (4-8 times higher than PLN tarim.
With such service these utilities could not compete with PLN and usually
disappear when PLN reaches the region.
Other private participation in electricity undertaking is in the form of
sub-contract services of private in the metering, hilling and line installation of
PLN's electricity systems. With the objectives of reducing PLN's manpower
deployment anel to support rural development, in 1979 MOME and Ministry of
Cooperative established four schcnJPs (or l'ola) in which village cooperative,..
(KUD) could participate in the rural electrification program, i.e.:
Pola 1 :
KUDs are contracted by PLN to handle metering, billing and minor repair of
PLN's distribution system;
Pola II :
KUDs install housewiring as contractor of to tilE' custonJPr; with licence and
cost approved b~' PLN;
Pola III :
KUD function as local distribution companies for PLN (KUD purchase bulk
power from PLN and sell it to customer);
Pola IV :
131
KUD generates and distributes its own electricity independent of PLN.
In ] 990 the total number of KUDs that were involve in Pola I, II and a
combination of Pola I and II were respectively, 602, ]23 and 227 units. Up to
now KUD involvement in Pola III does not exist. As previously mentioned in
1989/1990 there were around 20 KUDs operating under Pola IV. To increase
the capability of these cooperatives PLN also provide training program for
KUDs. Up ]990 PLN has trained a total of 989 KUDs.
Recently PLN introduced a new KUD·PLN framework designated as
Management and Service Arrangement (MSA). In this framework KUDs are
contracted by PLN to manage the operation and maintenance of PLN's isolated
system. This framework is a further development of Pola I and II which are
considered successful and is aimed to prepare cooperatives for the more
advanced Pola III framework.
Power shortage
The rapid growth of industrial sector and PLN's inability to keep up the
pace with such growth, primarily due to financial constraints and delayed
expansion projects, has been the cause of the prevailing power shortage. In
Java, i.e. the most felt shortage region, the additional demand of industrial
sector in FY 1991/1992 was about 2,500 MVA while in the same year PLN
could only serve additional supply of around 800 MVA. The shortage was more
felt during the long dry season in 1991 when the hydro plants (22'/{ of Java
capacity) could nut operate optimally. At present the reliability of Java supply
system is actually critical as at normal condition the capacity reserves of PLN
plants is only around 16~.
To not hampering industrial development, the government has been
advising new large industrial estates to install captive power since PLN could
only provide additional supply in 1993 when the large combined-cycle plant in
East Java is expected to come on-line. To speed up the availability of power
this industrial estates primarily rely on diesel plants. In order to not burden
the government the subsidy budget this industrial estates will have to pay
imported fuel at the international oil market price.
Private power generation
A relatively new scheme of private sector participation in the electricity
development is private investment in dedicated power plants. The GOI has
taken initiatives toward this direction and is currently arranging some private
power generation projects. In addition, the GOI encourages pri vate investments
in those situation::> where private generation is economically competitive to
PLN's grid, such as (i) heat and power cogeneration, (ii) the utilization of waste
material for power generation, and (iii) the development of large' Rcale power
plants to meet specific industrial requirements and augument PLN supply.
Despite the provisions enabling the participation of cooperatives and
private has principally been issued since 1985, the supporting regulations and
rules for implementation are stiJl lacking. The existing regulations or
guidelines which is issued in 1983 and derived from 1979 regulation are
basically administrative in nature. This comprises of pl'Ocedural steps needed to
be followed by parties interested in electricity undertaking. Provisions
regarding the processing of proposals, especially on the pricing and guarantee
issues has not been defined in those regulations.
To implement provisions stipulated in Law 15, 1985, which is of
particular concern to private power, in ,June 1990 the GOI established as
Private Power Team in chargl' of developing the lacking impll'JI1cntation
guidelines and ret,'l.t1ations to handle private power projects. This team is an
interministerial committee chaired by tl1(' Director General of DGENE and
includes officials from PLN; Directorate General of Oil and Gas; BKPM
(Investment Coordination Board); BPPT IAgency for Technology Assessment
and Application); Directorate General of Taxation, and Directorate General of
Monetary Affairs of the Ministry of Finance.
Presently this team is processing the first private power project i.e. a
1200 MW power plant in Paiton east ,Java possibly under ROO type of contract.
It is expect{'d that lessons leaJ'lwcl from this project could lw further studied
and used to develop comprehensive regulations, accommodating various range
of plant scale, to deal subsequent private projects.
Considering the budgetary constraint the Government of Indonesia
expects tlw participation of private investor in the developnwnt of electricity
sector. The inve,;tnH'nt for abollt 60'·;- of llew generation capacity for Java,
which up to the year 1999 would require additional 13 1\'1\\', is expected to come
from private sector sources. In 1991 the COl has invited private' investor to be
involved in the development of another fi\'(' projects which include coal, peat
and geothermal plants with capacity ranging from 25-600 1\'1\\'.
3.3.2. Technology transfer issues
As the national level there are nim' actors that are involwd in the
processes of technology transfer, namely the State Power Company (PLNJ, the
Industry, the Agency for Technology Asse"sment and Application, the
Directorate Gcneral for Power and New Energy. the Department of
Cooperative"" tlw rural ell'ctric cooperativp" and micro (·l1tl'l'pl'i"ps. univer"ity
I '2,'1.J.

and government R&D organizations, and non-government community services
organizations.
In terms of the scope of functions being undertaken, those actors can be
categorized into three groups.
8. The first category are those in charge of determining the policy and
guidelines that influence the choice of technology, where the particular
actors are: the Agency for Technology Assessment and Application
CEPPT), the Directorate General for Power and New Energy, and the
Department of Cooperatives. Of the three government agencies, BPPT
has a dominant role in technology selection and evaluation, particularly
for government investment.
b. The second category are organizations that conduct R&D, develop
technological systems, and disseminate technology by way of
demonstration projects. Basically the type of technology that are dealt
with are small scale technology, renewable resource based energy
systems, energy conservation technology, and technological softwares.
University and government R&D organizations, and some units of the
agencies belonging to the first category (see point (a)) are elements of
this second category of actors. Non-government community service
organizations are mainly in dissemination through demonstration
projects.
c. The third and most important category are enterprises, large and small,
that are directly involved in the investment and operation of power
systems, and enterprises that manufacture machineries and equipments,
as well as those that provide technical service like construction,
installation, repair and maintenance. Some of the major actors are PLN,
captive power generators in the industrial and service sectors.
The bulk of technological flow goes to this third category, where PLN and
industrial captive power generators are the dominant ones. The mode of
transfer is mainly by way of investment, and the teachnology being transfered
are embeded in capital goods, engineering design and construction services. The
level of mastery in the absorption process has only reach the ability to operate
and maintain the installed system, part of the construction work, namely the
structural part, and manufacturing of licence based st atic equipment such as
boilers, heat exchangers, and burners.
Energy equipment manufacturing
Technical assistance is still required in equipment manufacturing,
namely in production, supervision, and engineering design. The design and
It/o

prescriptive aspects are completely adapted through licensing mechanism. The
level of mastery that has been reached is really a renection of the infancy of
machinery and equipment industry of the country, which has only plant
reached assembling operation and structural works. Processes that require
forging and heat treatment is only beginning to develop. So is alf'o the case
with works involving skills and expertise on precision mechanicf'.
The rapid growth of the power sector contributed significantly to the
stimulation for investment in energy equipments and machineries. However, in
many cases the level of demand in terms of number of units is presently still
too small to make additional domestic or joint venture investment attractive,
production facilities that are inplace are still considerably underutilized
especially those producing large scale equipments.
An area where transfer of technology related to electricity production is
economically attractive is in the production of medium and small capacity
diesel engine and electricity generetors, !wcause of the large area of application
in productive activities and also because of the unmet demand for need of
electricity. The demand for high capacity units has not reached a level where
investment for domestic production is attractive. The level of technological
mastery in the commodity producing industry institution has onl:,' reached
assembling opereltion of licenced desing. Most of the essential components still
have to be acquired from the source; economic considerations do not justify
further stages of progressive melnufacturing scheme.
Table 3.1: Provide some illustration on the development of diesel and generator
machinery industry
90
Year Diesel engine Generetors(Units) (Units)
1973-74 2,000 -
1978-79 30,400 -
1983-84 52,775 3,771
1988-89 32,424 6,570
1989-90 46,500 7,790
:lource: Lamplran Pldato Preslden dl UPK, 1b Agustus l~ .
Engineering design and construction
Other areClS wlwre trClnsfer of technology is eCCJlllIm ieally attractive and
processes of absorption is taking place are engineering design and construction.
The activities are normally undertaken in connection with the implementation
of power generation and distribution projects, whether pelr! of an industry

construction project or electric utility project of PLN or private power
generators.
Except for diesel powered generators, activities in engineering design and
construction are undertaken by foreign firms in cooperation with local partners.
By government regulation, such arrangement is to be compiled by any foreign
engineering and contracting firms. In an evolutionary manner, as the capability
and capacity are develping, local consultants and contractors are taking the
role as the main contractors.
Technical studies and services
Technical studies for feasibility and preliminary configuration of power
plants are mostly undertaken by domestic technical resources. PLN in
particular, has in-house capability for such studies. Engineering capability for
energy conservation studies and services for industry and commercial sectors
are also beginning to evolve in the past ten years, but the progress is hampered
by the subsidised prices of refinery products, natural gas and electricity, which
are the major component of the energy supply of the country.
The practices of those studies and services are based on externally
acquired methodologies and techniques, whereby the support of computer based
softwares has dominant role in accellerating the level of performance. There is,
however, a glaring deficiency of development efforts in generating those
techniques and methodologies, either compoter based or not. The practiced
techniques and methodulugies are two or three gpnpration behind from state of
the art techniques, and therefore have not been able to address current issues
where, for example, conserving measures in the demand sectors are to be
accounted for jn supply planning.
\Vaste heat recovery systems, commonly practiced in the process
industry, has somehow been alient to those dealing with the power sector.
Combined cycle and co-generation are only widely discussed and put in practice
in the past five years. The role of donor agencies are dominant in the
introduction of such technologies.
Application of non-conventional mode of electricity supply
Following the sudden jump of oil price in 1973, a wave of grants and
technical aids are coming to developing countries, including Indonesia, where
non-conventional mode of power generation technologies are promoted by way
of introducing or re-introducing revived forgoten' technologies. Except for solar
photovoltaic and fuel-cell based systems, the non-coll\'€ntiullal aspect is really
not the power generation itself, but the primary energy that are exploited or
utilized to drive the prime-movers of the power generation system.

Among tl1(' array of promoted technology, the ones that were gaining
wide spread attention in Indonesia are: biological digest ion of biomass wastes,
thermal gasification of biomass, wind mills, mini- and micro-hydro turbines,
and solar photovoltaic cells.
Development works, adaptation, and straight demonstration activities of
the technology are undertaken by university people, government R&D
organizations, and even some government administrative offices dealing with
energy. In terms of the previously described technology institutional structure
(see Section 3.1.1), the entry point for the transfer of mostly externally acquired
technology is at the Science and Technology institution. The area where the
technology are being testf'd for application is the rural community or small and
relatively primitive industries.
\\'11ile there are islands of R&D groups th<lt dew>Jop high level of mast pry
of the technology, the functioning of the technology in real application
practically is not happening. Three factors can lw accounted for, namely:
<I. The channel of transfer is taking place through tlw R&D institution
route. With limited resources that can the country can allocate for R&D
purposes, the dissemination processes are mosly stopped when the
external funding is receeding and discontinued.
b. The area of application where the technolob')' is directed, i.e. rural
environment and small/primitive industry, is lacking of nurturing
capacity for the appropriate functioning of the technology.
c. The prices of established energy commodities against which those
technologies are to compete is distorted, mainly due to subsidy.
With a few exceptions, only when the techJlology is robust with respect to
requirements for technical support, and there i,.. <l combination of agressive
promotion by foreign donors and government, support, would the technology
able to function. But this is, in fact, some form of subsidized scheme. Such
situation is recently observed with the promotion of small solar panels of
photovoltaic cells for individual ruml families.
V,Thile small photovoltaic solar panels seems to Iw the only one of the
alTay of teclmolugy on nOll-conventional mode of electricity generation being
dealth with, the level of technological mastery of the technology is, rel<ltive to
the others that were previollsly mentioned, the least.
The only technology, within the category under di,;cussion in this sub
section, where high level of mastery has been achieved and nearly competitive
with established systems, <lnd furthermore can survj\'(' ullc]C'r minimal
technological support system is minimises hydru s~'st('m. The other technology

that have been highly mastered are biodigestion of biomass wastes, andbiomass thermal gasifIcation. Both technology are also nearly competitiveagainst established systems, but both require certain level of technical effortsto operate; the requirement for biomass thermal gasification is considerablymuch higher.
Concluding remarks
The discussion concerning technology transfer issues in the power sector hasbeen made by focussing on absorption aspect. The emphasis on that particularaspect is made, since other relevant aspects has been substantially covered inSection 3.2.1.
By also refering to the elaboration concerning the development of thepower sector in Section 3.3.1, a set of conclusions that are most relevant inseeking justifiable opportunity for the application of co-generation system canbe made.
a. The most effective route of technology transfer in terms of having thetechnology operating and responding to needs is to the industrialinstitution, where the flow is dominated by capital goods and/or packagedand ready for use technological prescription. The process of absorptiontowards technological mastery, however, is slow as compared to otherroutes.
b. For equipment manufacturing, there is less opportunity to developeconomically attractive investment in the production of large scale units.The market is easily saturated, and can easily lead to under utilizaitionof capital.
c. With reference to point (b), if one wants tu achie\'e an objective throughthe introduction of technological means, e.g. improvement of efficiency ofthe energy system by way of promoting the wider functioning of cogeneration system, it would be more appropriate not to focus to themanufacturing of large scale equipments.
d. To 8\'oid unnecessary failure, it is important to identi(y areas for thefunctioning of the technology that has the capacity to nuture the growthof the application of the technology and it,,; further mastery.
e. Considering the average manufacturing capability, it is best that theinitial effort should be focused on developing manufacturing of staticdevices, sllch as waste-heat boilers and heat exchangers, and through aprogressive manufacturing scheme, moves towards the manufacturing ofmore sophisticated production precedures, such as the manufacturing of

rotating equipment:,; and devices that requires wider capability base in
precision mechanics, heat treatment and forging.
4. Technology transfer of co-generation systemAfter elahorating pertinent background considerations in the preceding
sections, the key questions to be addressed in analysing technology transfer of
co-generation system will be dealt with in the chapter.
As was pointed out at the outset, the investigation is focused to respond
to the following questions:
(a) VVhat opportunities are available for the wider application of co
generation systems in Indonesia'!;
(b) 'What is and would be the role of international transfer of technology to
Indonesia in influencing the wilier application of co-generation systems;
(c) "\That would be necessary to prumote a better environment for such
transfer process to occur?
4.1 Opportunities for co-generation in Indonesia
As was previously pointed out (see Section 2) Indonesia has launched
energy conservation program as one of the important componenets of the
national energy policy. The energy policy is therefore supportive to efforts for
the utilization of co-generation systems, although effective implenlcntation of
the policy has not been observed. The major barrier being the prevailing
subsidized pricr' (If energy, particularly !wtroleum products and electricity.
Potential consumers of co-genrration system products, i.e. electricity and
heat, are the industry and commercial Sl>ctors. If one extend the analysis not
strictly to co-generation, but considers the wider problem of waste heat
recovery from power generation units, there are also considerable opportnity for
the application of the technology in the power sector, namely to enhance the
production of electricity generated hy t1ies(>] powered phmts. However, there is
practically no demand for residf'ntial space heating, for the obviolls reason that
Indonesia is a tropical country.
4.1.1 Overview of the opportunities in v31·ious applications
Opportunities ill the industrial sector
Since thp last decade energy consumption of indust.rial sector has been
the largest among sectoral energy consumers (commercial, transport and
residential sectors). In 1990 industrial energy consumption accounted for about
40'/( of total commercial energy consumption.
Elf'ctric 11"\\'f'r demand for the sector is supplied b:r PLN (state electricity
utility) alld indll"trial captive' plall\";. At ]r-il,.;! sillce the last t\\'o decades electric

power supplied by captive plants have been larger than that of PLN. In 1991
captive power plants supplied about 58% of the total industrial electricity
demand. Although the share of PLN in the industrial electricity supply has
been increasing with it's rapid capacity expansion in the last decade, one
cannot expect that the growth of supply from PLN will be able to keep up with
the pace of growth of the demand for electricity from the industry. Captive
power plants will remain important.
Most of industrial captive power generators are thermal-based plants
fueled with refinery products. More than half of this captive thermal plants
capacity use diesel gensets.
Industrial process heat requirements are supplied by respective industry.
At most industries that operate captive plants and have process heat demand,
co-generation is still not practiced. The production of electricity and process
heat are performed separately. However, co-generation systems have been long
a standard energy supply system of palm-oil and sugar industries.
Opportunities in the commercial sector
In the commercial sector, particularly in commercial buildings (hotels,
shopping centers etc.) electricity is supplied by PLN. For reliability reasons,
however, such establishments, especially large commercial buildings, also
maintain diesel power generators, operated on a stand-by basis.
Heat energy demand particularly for water heating exist in classified
hotels. They usually operate electric heater or steam boiler for the hot water
needs.
Opportunities in the power sector
In addition to the industrial and commercial sectors, opportunities for
the utilisation of co-generation systems also exist in the power sector. There are
two possible schemes of modes of co-generation implementation in this sector.
The first scheme is the utilization of heat energy released by PLN's thermal
plants to supply process heat demand of adjacent industries. While such
scheme is technically feasible, the implementation will not he easy as such
scheme would require inter-institutional transactions.
In the second scheme, heat recovered from exhaust gas and water jacket
of PLN's diesel plants is utilized to produce steam which subsequently be used
for power generation using steam turbines. The second scheme is, by definition,
not a co-generation system since it produces electricity rather than heat, and is
commonly designated as combined-cycle operation.
4.1.2 Potential capacity of co-generation applicationIndustrial sector
.'

Commercial energy consumption in the industrial sect.or in 1990 is
estimated to be 140 mboe or 20 mtoe. Around half of it is natural gas and coal
which is primarily consumed by 3 major industrial sub-sector namely fertilizer,
steel and cement. industries. Although these industries are large energy
customers, they have to be excluded from the anlaysis since co-generation of
atleast waste-heat recovery systems have been widely applied. The same
applies to the pulp and paper factory that, based on 1990 data, consumes 5% of
the total industrial consumption.
Among the remaining industries, the significant commercial energy
consumers are the textile and food industries.
The textile industry consumes 10% of total industrial use of commercial
energy, which amounts to 2 mtoe. The food indstry consumes 5% of total
industrial use of commercial energy, or in absolute term is 1 mtoe. According to
USA experience, for each mtoe of energy lise in the food sector, the co
generation potential is 30 MWe. Therefore it is estimated that the co-gen
potential in Indonesia food sector is around 30 MWe.
In the textile industry around 70O/C of fuel consumption goes to electricity
generation, in which air conditioning accounts for a significant energy
consumption. Assuming that air conducting could be performed using
absorption chiller inst.ead of electric chiller, the co-gen potential as percentage
of the total energy consumption could be as high as that in food sector, where
fuel for electricity generation is about the same with that of for heat
generation. Applying that assumption, the co-gen potential in textile industry is
estimated to be 2 mtue x 30 MWeimtoe, which is 60 MWe.
Commercial sector
Classified hotels have the potentials to utilize co-gen system for their
electricity and hot water need. There are around 430 classified hotels in the
country, 69 hotels of which are rated as :3-star hotels or higher, with following
breakdown; 3-star=44; 4-star=15; and 5-s1ar=10 hotels.
Those hotels normally get their electricity supply from PLN and have
diesel gensets as stand-by systems. The total stand-by unit capacity of the 69
hotels is estimated to be 25 MWe, and therefore is the co-gen potential.
Power Sector
PLN (the State Electric Utility Company)
PLN has around 1800 MW diesel plants. If they were retrofitted with
waste heat recovery systems and operate as steam topping comhined cycle
there would be an additional capacity of 600 M\'V, based on the assumption that
I (f!
II

efficiency of diesel plant is 30%, and the efficiency of diesel combined-cycle is
40%.
Captive plants
The total capacity of the existing industrial stand-by units is estimated
at 2100 MW, and these are diesel units. If and when those were operated as
combined-cycle to supply their own demand and sell excess power to PLN, the
latter could supply an additional electricity of 2800 MWe; i.e. 2100 MW of
avoided supply from PLN to those industries and 700 MW of additional
capacity due to the purchase of generated electricity from diesel combined-cycle
operation.
The total capacity of currently operated captive diesel power plants is
2100 MW. If and when these units were converted into diesel-combined cycle,
the capacity would be increased to 2800 MWe. This would create an
opportunity for PLN to acquire an additional electricity supply of 700 MW
(2800 MW - 2100MW).
Industrial estates
According to government (Directorate General of Electricity and New
Energy) projection the additional electricity demand for industrial estate within
1989-1994 in Java will be around 1300 MW. Assuming that PLN could only
supply one half of it and the rest would be supplied by captive plants, the co
gen potential in this industrial estates would amounts to 650 MW.
Referring to the analysis on the opportunity for co-gen technology,
elaborated in Section 4.1, an area where efforts could be interesting and
attractive to be undertaken is the retrofitting of existing diesel power plants,
both for the production of process heat, as well as power generation capacity
enhancement by way of utilizing the recovered waste heat for combined-cycle
operation. The latter scheme could contribute meaningfully to the current
power shortage problem, particularly in the island of Jawa.
Agro processing industries
Co-generation technology has been practiced in Indonesia at major agro
processing industries i.e. sugar and palm-oil. The same is also tTlle with the
plywood and veneer mills. Around 40% (60 MW) of plymills total power demand
is supplied by biomass fueled co-gen systems. If the remaining 60% were
switched into co-gen, potential in this sub-sector is estimated at around 90 MW.
Aside from the plymills, there are also co-gen potentials in the large
sawmills, as they require both electricity and heat (for drying). The total co-gen
potential in this industry is around 150 MW (around 50% of total power
capacity of large mills in Indonesia in 1987.)
1IIIITIr-

4.2 The role of international transfer of technology and the transfer
mechanismThe presence and the functioning of co-generation systems in various
industries in Indonesia has taken place not because of the particular choice of
that technology, but because the systems were offered as part of the technology
package of the whole plant. This has been the case with co-gen systems that
are found in some major chemical plants.
For agrobased processes like palm oil and sugar refining manufacturing,
the use of the technology was introduced during the colonial era by the estates
that operated such plants. When in recent years there was a boom in plywood
and wood products manufacturing, most of the plants are not using co-gen
system, although the plants need both heat and electricity. 'While the plants
are using biomass to fuel their steam geJ1Pration plants, their electricity
requirements are supplied by diesel power plants.
Apparently the advantages of having co-gen system is not quite
appreciated, due to several reasons. First, because refinery products are easily
available at low (subsidized) prices. Secondly, while the notion ahout co-gen
system is familiar to the business owners, they apparently do not quite
comprehend what that system is, and therefore perceive the technology as
being too complicated or too expensive, or otherwise is not regarded as a proven
technology.
The above indicate that there are considerable efforts have to be
undertaken to familiarize and demonstrate the technology. This is where, in
the first stage, international inputs are required, and therefore the important
role for promoting technology transfer processes for co-gen system in the
country.
Several channels have to be exploited in the process, ranging from
information dissemination processes, in the form of seminars, workshops and
training, to further stages of dissemination in the form of real world
demonstration, investments in technical services and devices manufacturing of
elements of the co-gen systems.
As fas as efforts to develop domestic capability and capacity to support
the functioning of co-gen technology, there are two technological components
that should be most appropriate to be taken as the media to mitiate the
establishment of such capability and capacity. These are co-gen systems desit,'11,
and licence based production of stationary components, such as heat exhangers
and waste heat hoilers. Other more complicated system components and
devices, like steam turbine could follow at later stages. If and when such co-gen
engineering business firms are functioning, they have to include also training
component to customers as part of the delivery function.
Referring to the analysis on the opportunity for co-gcn technology,
elaborated in Section 4.1, an area where efforts could be interesting and
attractive to be undertaken is the retrofitting of existing diesel power plants
both for the promotion of process levels as well as power generation capacity
enhancement by way of utilizing the recovered waste heat for combined-cycle
operation. The latter scheme could contribute meaningfully to the current
power shortage problem, particularly in the island of Jawa.
Another area is revamping of steam generation and power plants in
plymills, that currently utilize heat and electricity, but are not using co-gen
systems.
4.3 Developing conducive environment
In search of viable and feasible initiatives to promote and to support the
implementability of the policy on energy, particularly with respect to energy
conservatioll, whereby the application of co-gen technology can have significant
contribution, a set of factors for developing conducive environment will be
identified.
Having most of those environment factors in place, potential areas for
the wider functioning of co-gen systems, as was elaborated in Section 4.1 can be
taken as targets of implementing the system. 1\\'0 basic criteria have to be
considered in the final selection, namely:
a. the dimension of the beneficial impacts that can be gained at the
national level, as measured in terms of the extend of contribution that
such endeavour would have in realizing the objectives stipulated in the
policy on energy; and
b. the economic viability and profitability, and therefore the attractiveness
to business enterprises to implement co-gen systems, or to venture into
the business of delivering co-gen systems.
In terms of achieving the objectives stipulated in thp policy on energy,
the particular criteria most relevant to be considered are that, the investment
to implement co-gen systems and to establish business ventures for delivering
such systems have the following features:
a. economically and financially justifiable
b. responding directly to the most felt issues in the energy problem in
Indonesia; currently these are increasing level of consumption of refinery
products and deficient supply of electricity

c. be implementable without aggravating the balance of payment situation
of the country
d. prevent from any scheme that will sustain energy subsidy or lead to the
wider spectrum of energy supply systems requiring government
budgetary subsidy;
e. nurture the strengthening of domestic technological capability and
capacity, particularly in support of the development of energy industry,
that include the manufacturing of energy devices.
There does not seem to be any problem in satisfying the above criteria by
taking co-generation system as an investment theme. In fact, investments in
engineering firms to undertake co-gen system design and device manufacturing,
and fo]' implementing co-gen systems in various sectors (industry, commercial
and services, and the power generation) will all lead to the achievements of the
objectives implicitly and explicitly expressed in the above criteria.
In terms of economic feasibility and attractiveness, while the general
policy on energy is clearly supportive, there still need to be changes to current
policy on capital investment financing, taxation, import duties and most
important of all, energy pricing. Except for energy pricing the government will
be perceptive for such policy changes; since 1983 the government has been
taking continuous actions to direct the economy of the country to be more
efficient, and is still continuing to do so.
An important element to set such drive for policy changes, however, is
still required. There has to be a thorough and convincing analysis that indicate
the benefits of making the desired policy and regulatory changes that would,
among others, promote energy conservation in general, and the functioning of
co-gen systems in particular. The results must be followed-up by information
disseminative activities, presenting technical and techno-economical aspects of
co-gen systems. These are directed to the business community.
Since the government is the main oQject of the 'advocacy' for policy
changes, the effort has to be undertaken by some entities having the necessary
resources to do so. Some inputs from international funding agencies or other
supportive agencies are required.
Carefully designed demonstration projects in various applications
through risk sharing scheme between the sponsoring agency and the recipient
of the demonstrated system will enhance the appreciation of implementing co
gen system.
In summary, the parameters for tIll' development of conducive
environment for the wider functioning of co-gen ~.vstelll'; are:
/:, !

a. information dissemination through workshops, training, demonstration
and analysis work that will create better understanding and appreciation
about the technicalities and the economics of co-gen systems;
b. technical and engineering capability development in the operation,
manufacturing and design of co-gen systems and devices through
appropriate technology transfer channels and mechanisms, involving
capable technical institutions and business enterprises.
c. regulatory measures to provide tax incentives for capital investment and
import tariff facilities to business ventures that deliver goods and
services for the functioning of energy conserving systems in general, and
co-generation systems in general, and co-generation systems in
particular.
d. available financing facilities that are significantly supportive to
investment in business ventures in the area of energy conserving efforts.
5. Conclusions and recommendationsThe following conclusions can be drawn from this study:
a. In the energy development of the country, the rate of gro\\'th of
electricity supply has been increasing at very high rates, yet there is
sustained unmet demand. The current estimate is that for the coming
years, the averaage demand growth rate for the period of 1994-1998 will
be around 17(,1, per annum, declining to 12(1, during 1999-2003, and in
the following five year develoopment plan (2003-2008) may further
decline to an average of 89t. per annum. Even though there is a declining
trend in the projected demand growth rates, the figures are very high,
Most of the power demand are concentrated in the island of Java.
b. Since oil and natural gas both play determining role as source of foreign
exchange revenue and also because of declining reserves, the availability
of oil and natural gas will be limited. The power sector is therefore
anticipated to be dominated by coal based generation plants. Such high
share of coal utilization, however, is presently considered to be
environmentally undesirable, unless less polluting coal technology and
mitigative techniques are utilized. This will require higlwr investment
costs, while capital availability is highly constrained.
c. Conservation measures is therefore essential to be pursued, and there is
considerable potential for that. The present total loss is still relatively
high, i.e. within the range of 23-26L(. Furthermore demand side
management has not been practiced. Efficiency improvement of the
•

power sector is also desired in terms of fuel conservation and from
environmental point of view.
d. Ai:, one of the many means of achieving improved efficiency, this study
has focused on the potentials of wider application of co-generation
technology. While the technology is not completely unknown in the
country, it is observed that there is considerable degree of lack of
familiarity and appreciation.
e. An initial analysis of the opportunity for augmenting co-generation to
existing power generating systems in the industrial, commercial, and
power sectors indicates that there is around 4900 mW potential capacity
for co-generation. This would be equivalent to an additional power supply
of about 1600 mW installed capacity, if the recovered waste hea t were
used in a combined cycle mode of operation.
f. The observation pointed out in points (d) and (e) implies that there is a
need for technology transfer processes to be undertaken, and there is
economic justification and feasibility for undertaking the transfer process
through investment channels.
g. Ai:,sessing the domestic capability and capacity in engineering design and
equipment manufacturing, the study suggests that the transfer process is
best undertaken by focusing first on the development of co-gen systems
design capability, and the manufacturing of the stationary components of
the co-gen system, such as efficient heat exchangers and waste-heat
boilers. The manufacturing of rotating equipments can be considered at
later stages. Until stICh undertaking is considered justifiable, rotating
equipments and instrumentation devices are components that have to be
imported. It must be noted that the requirement for rotating equipment
arises only when a combined cycle system is to be delivered.
h. Finally, it must be pointed out that some advocacy initiatives is
necessary to develop more conducive environment for the wider
funtioning of co-gen systems, whereby the support of donor agencies may
considerably help in accelerating such effort.
On the basis of the above conclusions, particularly points le\, Ifl, (g) and
(hl, it is recommended that further study be made, focussing on the assessment
of the market-potentials for implementing co-gen systems, and hased on that
produce a set of proposed investment schemes for the realization of
commercially operated co-gen delivery systems and the commercial application
of co-gen system:,;, based on externally acquired best available technology.

Furthermore, considering that similar potentials arp found in many
Asian countries, it is also recommended that parallel with the previously
recommended effort, mobilization of some funding resources be made to support
the organization of a regionwide workshop and seminars, focusing on the
technical and techno-economic aspects of the technology.
•

COUNTRY POLICY AFFECTING TECHNOLOGYTRANSFER IN IRAN
We gratefully acknowledge the generous support provided by
Dr. Mohammad Sarir of Institute for Political and International
Studies and Dr. Mahmoud Shriat of the Faculty of Health and
Environment, University of Tehran,Iran, for completing this paper

1. IntroductionConsidering the fact that emission of the most important gas in the GreenHouse Effect, Carbon Dioxide, is unavoidable due to the use of Fossil Fuels, thebest way of reducing this gas may lie in a more efficient use of energy on oneside and increase in consumption of CO2 on the other. In this respect, it wasdecided in the Bellagio Conference in April 1992 that every country shouldstudy one or more technological methods to reduce Green House Gases.The Iranian study was suggested to be on,1) Lighting2) Afforestation and land use change
It was decided to discuss the problem of Afforestation and lighting whichthe Government officials are presently more concerned about. And, asmentioned before, this will reduce the consumption of fossil fuels and the useof more Carbon Dioxide.
2. LightingThe demand for electricity has been growing due to the increase in populationand use of electricity per head. In this respect the electricity generation isplanned to reach 28 thousand Mega Watt during the First and Second FiveYear Plan which is an addition of 17 Mega Watt to the present capacity ofelectric generation in Iran.
Considering the present efficiency of the power generation units, thiswill consume 50 thousand Mega Watt of heat energy with 33 million tonsconsumption of carbon in the form of CO2 emission. In addition to that heavyconsumption of fuels the cost of electricity is to be considered. At present, theIranian Government is subsidizing 30 Rials for each Killowatt hour. Therefore,it should consider economic aspects of electricity generation which has to beproduced with minimum cost and maximum benefit. For this goal, differenttechnical and managerial methods have been studied. The summary ofsuggestion and theories will be outlined.2.1 Reduction in the loss of energy in consumption equipment
Lighting is the main component of electrical consumption in Iran andmore efficient use can play an important role in improving electric industry.With present technological advance a variety of bell-shaped electric lamps hasbeen developed which are similar to florescent lights with a difference that byconcentrating the electric circuit, it could be replaced with the traditionallamps.
Considering the efficiency of these bulbs compared to the traditionalones, they could improve the quality of the network. But its high cost and itseconomic aspects must be studied.
Saving in each Megawatt is equal to 0.7 MTOE. Saving in each MTOE isequivalent to 0.66 Million Tons of Carbon (in the form of CO2),
If we reduce the energy used for lighting by 30%, the reduction in use offossil fuels will be 27% which results in 7.7 million tones less carbon in the air.
For this programme we do not need new laws or specific actions. All thatis required is a government decision to use this technology and determine theappropriate budget to subsidize the purchase of these bulbs. Governmentdecision for the use of this technology and for the appropriate budget tosubsiding the purchase of these bulbs will be sufficient.

concentrating the electric circuit, it could be replaced with the traditionallamps.
Considering the efficiency of these bulbs compared to the traditional
ones, they could improve the quality of the network. But its high cost and its
economic aspects must be studied.
Saving in each Megawatt is equal to 0.7 MTOE. Saving in each MTOE is
equivalent to 0.66 Million Tons of Carbon (in the form of CO2),
If we reduce the energy used for lighting by 30%, the reduction in use of
fossil fuels will be 27% which results in 7.7 million tones less carbon in the air.
For this programme we do not need new laws or specific actions. All that
is required is a government decision to use this technology and determine the
appropriate budget to subsidize the purchase of these bulbs. Government
decision for the use of this technology and for the appropriate budget to
subsiding the purchase of these bulbs will be sufficient.
The only difficulty is the replacement of the existing bulbs with the new
ones considering their prices with respect to their life span compared to the
traditional bulbs.
The reduction in consumption which will lower the amount of investment
needed for electricity generation will justify subsidizing the price of the bulbs to
the consumer.
It has been forecasted that the power generation will reach 22500 Mega
Watt by 1993, and 35000 Mega Watt by 1998. But due to difficulties, it does
not seem that all the projects will finish on time. Presently, a generation of
5000 Mega Watt productivity is under construction, and hopefully, will be
added to the network on time.
3. Electric industry in Iran
3.1 Past, present and future
The capacity of the power generation units reached 14000 Mega Watts in
1988 which had a growth of 6.5% between 1979 and 1988. The status of the
power generation units controlled by the Ministry of Energy are shown in Table
1.
/51

Table 1: Electricity Generation Situation in Iran between1979-1989
Year/ 1979 1980 1981 1982 198.1 1984 1985 1986 1987 1988 1989Subjoct
Maximum 3744 4390 426(' . 6704 6605 7370 7746 8289 8298 ll985Con.~umption
need (Mw)
Maximum 362\ 4\43 4229 4923 6582 6333 61'>06 74G4 7743 7762 8911llRRigned load(Mw)
Operated 12.3 247 40 . 122 272 764 282 646 6-36 76power cul off ..fMw)
Needed . . 22644 26407 30813 34568 37722 -40385 43577 . .Energy~Million Kh.
Energy 19441 19880 22406 26333 30569 34094 36720 39045 4255-1 43775 39956supplied(Million Khl
Kehable informatIOn not avallatlle
** Actual cut off in this year had been 1153 MW
These units are mostly using fossil fuels, and therefore, the Ministry is
the largest consumer of the fossil fuels, and it is responsible for the largest
emission of Green House gases (Table 2 shows the consumption of different
fuels).
Table 2: Use of fuels in power plants under Management of theof Energy from 1979 to 1989
Ministry
gpgy
YearlFuel 1979 1980 1981 1982 1983 1984 1985 1986 1987 \98 19898
Gas oil 1398 983 948 1010 1289 \622 2191 \642 14M 151 1259(Million Li 7
Hesidunl oil 1064 1473 \900 1947 26Hl 318.1 3568 41,,0 3559 38.1 4100(Million U 9
Natural gas 2335 2278 2360 3177 3621 3885 399:1 3856 6451 573 6863(Million M3
) 0
GeneratIOn and transmIsSIOn OJ electrIC ener nas tleen ex anClm
regardless of its costly operation.
Among the factors that have contributed to the failures which the
Ministry of Energy has met by the growing demand for electricity are:
1. Rapid growth
2. Financial constrains due to dependence on foreign technology which
requires large sums of foreign exchange allocations.
3. The low profit
~·T.

4. Inability to secure fuels on time for the power generation unite which
prevented the fuel use of these units in the network.
5. Other difficulties such as:
- Social conditions
• decentralization of decision-making
- climate conditions of the country
4. Forests
Jungles in Iran are situated in the two distinguished Regions of North and
West.
1. Forest in the north cover 1.9 million acres, from which 1.3 Million acres
are considered to be devoted to Industrial purposes (worthwhile and
ready for industrial activities) and the rest, 0.6 Million acres are semi
demolished forests.
2. Forests in the west cover 3.5 Million acres. Most of them are considered
to be semi-demolished.
Every year two million cubic meters of wood is manufactured from these
above mentioned jungles. Another 2 Mm3 is also prepared by cultivation of
woody trees and from gardens. Since the total need of the country for
manufactured wood is 8 million cubic meter, there is a 50% shortage.
The FAO has estimated the per capita need of manufactured wood for
people of developing countries to be 0.4 m3• According to this estimation, the
need of Iran should be 22 Mm3 of wood. Obviously there is a far distance
between the actual need and estimated figure.
General goal of the forestry in Iran are as follows:
A. Protecting the forests
B. Reviving the forests
C. Proper utilization
D. Relative self sufficiency in providing wood products
In the past 30 years, forestry plans for 630000 hectares and forest
plantation of 52000 hectares in the North in addition to 2900 hectares in other
areas have been implemented; this has compensated for a small propagation of
the damage to the forests.
The following steps are to be considered with respect to the renewing the
forests:

1. Planting 50000 hectares of forests in the North to revive the 600000
hectares of destroyed forest in this region.
2. Planting 50000 hectares of forests in the Western region to replace 3.5
million hectares of forest destroyed there.
3. Planting 11000 hectares of forest in other parts to provide wood.
The Budget for reviving the forests are as follows:
Planting forests 29000 Million Rials
Foresting 8366 "
Forest engineering 5590
The main causes of vegetation destruction in Iran are:
1. Movement of sand in the areas with a high speed of wind
2. Loss of pastures due to uncontrolled grazing specially with respect to
goat.
3. Illegal use of forests and using the land for other agricultural purposes.
4. Wrong approach to the utilization of water leading to the lowering of the
underground water level, and consequently to forest dryness.
5. Uncontrolled expansion of dry farming.
6. Natural, regional and industrial causes.
5. Transfer of technology
Transfer of technology in this report could be outlined into four parts:
Development, Adaptation, Absorption and Acquisition.
Iran has considerable experience with respect to forest plantation and
creation of forests with the help of irrigation. For many years Iran has
developed forests around big cities such as Tehran, and planted special plants
around deserts to swp the movement of sand and add to the green areas. In
these respects, there will be no need for transfer of technology, and what is
required is more educational centers for teaching forest plantation and natural
resource engineering in order to train the required human resources for the
projects. Other countries could also benefit from Iran's experience in these
fields. What is needed for absorption, adaptation and development of technology
in the research in the types of vegetation adoptable to the Iranian climate
conditions, or the improvement of the local vegetation.
'What is noticed with respect to forest plantation and reviving is financial
assistance from international foreign sources such as World Bank and private

sector. Iranian Ministry of Agriculture, Ministry of Natural Resources andJahad have extensive plans for the development of forests in the country.
The most important task and the relevant legislations that must bepursued are as follows:1. Establishment of appropriate and adequate structure for the projects
with the help of legislations in the parliament.2. Establishing a balance between cattle pasture by purchasing excess
cattle.3. Executing programme in the development of pasture projects.4. Executing programmes for reviving the pastures land to achieve
additional potential for production of wood.5. Coordination for the creation of balance among cattle, animal feed and
pesture land.6. Executing programmes for the expansion of animal feedssand other
similar feeds in the country, and planting industrial trees.

JAPAN'S TECHNOLOGY TRANSFER POLICY ANDPROBLEMS IN FUTURE
We gratefully acknowledge the generous support provided byMr. Takao Tomitate of The Institute of Energy Economics,
Japan, for completing this paper
1. Japan's official development assistance and technical
cooperation
Japan's actual extension of Official Development Assistance (ODA) in
1991 reached $10,951 million, according to a million registered in 1990. This
was the largest amount among DAC (Development Assistance Committee)
member countries, followed by $9,642 million donated by the U.S. and $6,769
million by Germany. Japan's ODA included technical cooperation, which rose
from $1,645 million in 1990 to $1,868 million in 1991, a 16.9% increase.
Although Japan's ODA tops the world in gross volume, it represents a
mere 0.32Cjll of GNP -. Slightly lower than the twenty DAC member countries'
average of O.34C;{ and ranking 12th. Given the rising expectations and requests
by the rest of the world for Japan's assistance with the emergence of global
environmental problems, Japan is being urged to increase the ratio of its ODA
vis-a-vis GNP in the future. By way of comparison, the U.S.'s ODA represents
only 0.17ck of GNP -- 20th place _. and Germany's ODA represents 0.4% of GNP
.- 9th place. It is the major ODA donors' common obligation, therefore, to raise
the ODA-GNP ratio.
Outlined below is the current status of Japan's technology transfer
policy, centering on its technical cooperatiun, and an analysis of problems
related thereto in the future.
2. General description of current status of Japan's technical
cooperation
Japan is carrying out technical cooperation in various forms, as outlined
below. There is project-type technical cooperation, which combines the
acceptance of trainees, the dispatch of experts, and the provision of equipment.
Other formats include development studies and the dispatch of Japan Overseas
Cooperation Volunteers. Technical cooperation activities supported by public
funds include the acceptance of students from the developing countries at
government expense, and survey and research programs conducted by
government-affiliated agencies and other organizations in cooperation with
government agencies in the developing countries.
As is the case for total ODA, Japan allocates a large share of its
technical assistance to Asia. A regional analysis of technical assistance

provided in 1990 shows that Asia received 49.08, Latin America 12.1%, Mrica
7.6%, the Middle East 5.8% the Pacific 1.9%, and Europe 1.0%.
The current status of technical cooperation by major program is
mentioned below.
2.1 Technical training programJapan launched the technical training program in fiscal 1954 and
received a cumulative total of 82,553 participants in the program by the end of
March 1991. Japan received 5,183 participants in fiscal 1990. The technical
training program includes group training, individual training, third-country
training, the establishment and operation of training centers. In addition,
Japan is providing "follow-up service for ex-participants," sending abroad 13
teams of experts to acquaint ex-participants with new technology and to give
technical advice adapted to local conditions.
2.2 Expert dispatch program
Japan dispatched a total of 14,501 technical experts to overseas during
the period fiscal 1955-1990, sending 1,592 experts in fiscal 1990. This program
covers joint study projects, aimed at contributing to socio-economic development
of recipient countries, dispatch of private-sector skilled workers and sending of
survey teams.
2.3 Provision of equipment
Japan's provision of equipment necessary for promotion of technical
cooperation began in fiscal 1964, having reached a cumulative total of ¥21
billion by fiscal 1990. In fiscal 1990, equipment worth ¥7,000 mi11ion was
provided to 50 countries.
2.4 Project type technical cooperationProject-type technical cooperation is a type of program whereby three
forms of cooperation are combined into one: training of overseas participants,
dispatch of experts, and provision of equipment.
Project-type technical cooperation implemented in fiscal 1990 involved
185 projects, including those completed within the fiscal year. Of these, 57 were
social development cooperation, 35 were health and medical cooperation, 8 were
population and family planning cooperation, 66 were agriculture, forestry, and
fisheries cooperation, and 19 were in industrial development cooperation. By
region, 106 were carried out in Asia, 17 in the Middle East, 18 in Mrica, 41 in
Latin America, two in Oceania, and one in Europe.
fl~() ,

2.5 Development studies
Development Study is the general term that involves the following
activities carried out for public development planning, which is necessary for
the socio-economic progress of developing countries: i) organizing study teams
composed of experts to contribute to the implementation of a development plan
for the recipient country; ii) carrying out a field survey, as well as analysis and
study in Japan of the findings of the field survey; iii) making a study report
which serves as basic information on a socio-economic development strategy for
the recipient country; and iv) promoting technical transfer in terms of study
methods and a planning approach to local counterparts in the course of the
development study.
Development studies are classified into the following categories; Master
Plan Studies, Feasibility Studies, Detailed Design Studies, and Studies for
Improving Project Efficiency.
In fiscal 1990, 275 development studies were carried out -- 182
development studies were funded from the budgetary item for development
studies, 74 from that of overseas development planning studies, and 19 from
that of resource development cooperation basic studies; 152 development
studies were conducted in Asia, 25 in the Middle East, 35 in Mrica, 54 in Latin
America, 5 in Oceania and 4 in Europe.

3. Energy cooperation3.1 Current status of cooperation in energy sector
Bilateral ODA in Energy Sector
(Commitment Basis)
FY Grant aid ODA Loans Trainees Experts J.O.C.V.(l00 (100 accepted dispatchedMillion MillionYen) Yen)
] 986 56.09 1,120.78 ]55 22 0(5.4) (2.6) 0.1) (0.0)
(20.0)
1987 28.09 1,873.94 ]86 18 5(2.6) (26.9) (2.9) (0.8) (0.6)
1988 28.91 1,564.23 ] 96 49 2(3.0) 04.7) (2.9) (2.0) (0.6)
]989 45.52 1,518.99 238 33 2(4.3) 05.5) (3.2) (] .4) (0.2)
1990 9.63 1,057.83 211 22 °0.0) 00.5) (2.8) (0.9) (0.0)Note:r'lgures III parentheses are respectIve shares 111 general grant aId (excl.grant aid for debt relief, non-profit grant assistance & small-scale grantassistance), ODA loans (excl. reschedule) and technical cooperation.(Al Compared with uther advanced count.ries, ,Japan devotes a high
proportion of its ODA to the energy sector. Over the past five years (F'Y1986-1990) this area has accounted for approximately 15(/< of totalfinancial assistance (E/N basis).However, an analysis of past trends shows that assistance in this field
has declined from the FY 1983 peak of ¥230.9 billion (32.6 7c of totalassistancel. In FY 1989 and FY ]990 the energy spctor accountpd for only about12(,< of total financial assistance.
This strong emphasis on energy reflects Japan's active coopewtion inthis field, which it regards as one of the most important areas of assistancebecause of the import.ance of energy development to the achievement ofindustrial development.(B) Projects in energy sector have the potential to produce profits. For this
reason, financial assistance is provided primarily in the form of loans.

Over the past five years, loans have accounted for 98% of total financial
assistance in this area.
In the case of Indonesia, for example, Japan has provided loan aid for
such projects as a hydroelectric power station on the Brantas River in Eastern
Java, and thermal power stations at Gresik and Surabaya. The power
generation capacity created through this assistance now accounts for 31 % of
Indonesia's total capacity, and Japan's cooperation in this area has made a
major contribution to Indonesia's economic and social development.
In Laos, Japan provided loan aid for a hydroelectric scheme, the Nam
Gum Dam. The output of this scheme is so large that Laos is able to earn
foreign currency by supplying some of the electric power to Thailand.
(C) Cooperation in the field of energy involves such areas as energy resource
development, power generation and transmission facilities, regional
electrification, the development of new energy forms, energy
conservation, and energy administration. Electric power generation
projects are by far the largest category, but in recent years there has also
been an increase in the number of regional and rural electrification
projects.
3.2 Priorities for cooperation in energy sector
(A) Integration of Economic Planning and Energy Planning
It is important to incorporate energy planning into the economic plans of
developing countries, and to provide assistance in ways that reflect medium
and long-range policies relating to energy supply and demand and the
development of energy.
When formulating energy plans, it is first necessary to prepare
development and utilization plans that permit the achievement of the optimal
energy mix, taking into account such factors as the extent of energy resources,
geographical conditions, the structure of industry, economic growth rates,
energy demand patterns, and population distribution.
Cooperation at the "software" level, including human resource
development, the improvement of administration capabilities, and the
establishment of the necessary legislation, is effective in relation to the drafting
of these plans, and in this sense it will be necessary to enhance Japan's
response at the level of technical cooperation.
1/1III

Human resource development and technology transfers are also vital to
the operation and maintenance of energy facilities, as well as to the collection
and analysis of energy related data. Technical cooperation is also vital from
this viewpoint.
(B) Correcting Imbalances between Urban and Rural Sectors
Rural electrification leads to improvements in rural living standards and
is therefore vital to the elimination of gaps between the urban and rural
sectors. However, there are a number of problems, including the limited
profitability of electric power services in the rural sector of developing
countries, and the fact that small-scale power generation for rural and regional
electrification is more costly than large-scale generation. For this reason,
assistance for rural and regional electrification should be provided primarily
through grant aid.
Rural communities in developing countries are trees cut from nearby
forests to provide domestic fuel in the form of firewood and charcoal. As a
consequence of population growth many areas, such as Nepal and the Sahel
region of Sub-Saharan Mrica, now face serious fuel shortages and
environmental problems due to the depletion of forests thruugh excessive
logging. In addition to small-scale power generation mentioned above, other
approaches should also be considered, including the use of alternative energy
resources such as dung, straw, and briquettes, and the popular{zation of
efficient ovens.
(C) Environmental Considerations
Gases emitted by hydrocarbonate thermal power stations cause
atmospheric pollution, much of which can be prevented through the
improvement of plant management technology and the use of desulfurization
and dust collection systems. Japan possesses advanced technology in the field
of pollution control and will need to make an active contribution through
technical cooperation in this area. Since the high cost of these facilities would
impose a considerable burden on developing countries, it will probably be most
effective to cooperate in the development of simplified systems that suit
conditions in recipient countries.
(D) Joint Financing with the Private Sector
Many developing countries have difficulties in developing their energy
resources efficiently because of their limited financial resources for investment

in the energy sector. Some large-scale electric power projects cannot befinanced solely through ODA, and consideration should therefore be given to
the promotion of joint financing with private sector investors in cases in which
the prospects for the recovery of funds are good.
4. Measures to be taken to Implement Japan's technology
transfer policy4.1 Comprehensive and Integrated Structure of Technology Transfer
Outlined above is the current status of Japan's technology transfer
policy, focussing attention on the government supported technical cooperation.
The technical cooperation is comprehensive and integrated in its structure.
Let's consider technology transfer of, for example, a most advanced 600
1,000 MW coal-fired power generation plant (having a thermal efficiency of
39%), with highly efficient flue gas desulfurization equipment.
First of all, it is necessary to consider the transfer of technology for
assembling and installing a generator and related facilities. (Transfer of
technology related to production of these equipment and facilities is not
considered here.) Next, the transfer of the related technical know-how to
management, technical personnel and laborers is undertaken, assuming that all
of them are available to manage, operate and carry out maintenance of the
power plant in question. Then, supply of fuel and spare parts for maintenance
must be secured. Moreover, an efficient network must be established for
transmission, sales and distribution of the electric power that is generated. It is
necessary that the project in question be well incorporated in power generation
plans as well as energy plans of the state and regional area concerned. Of
course, it is essential that adequate funds necessary to implement the
technology transfer and technical experts to be dispatched from the donor
country to recipient countries be fully available.
The technology transfer through establishment of a joint venture
company is being carried out fairly smoothly in the area where these conditions
are met, since the project is placed on a commercial basis. Generally speaking,
however, the larger the project becomes in its scale, the greater support by both
governments in the form of preferential measures is needed in order to place
the project on a paying basis. If the construction and management of the coal
fired power plant referred to above, fOJ' example, is implemented under the
--.rnrrrr. -. 'Ill

"BOT" (build, operation, transfer) formula, in which developing countries are
showing keen interest, the foregoing conditions must all be met. At the same
time difficult problems such as establishment of power rate, assurance of the
profitability of the project, and repayment terms for borrowed foreign capital
must be resolved. Government support through powerful preferential measures
is indispensable to successful implementation of the technology transfer, but
there must be some limitations to this governmental support. It should be
pointed out that, in the end, recipient countries' self-help effort is the trump
card.
4.2 Establishment of priority order and importance of project finding
In order to successfully promote technology transfer, which is beset with
a number of problems as outlined above, it is essential to establish an order of
priorities and find a most appropriate project. In establishing an order of
priorities for projects, it is important to pay due consideration to the following.
1) Top priority should be given to technology that best fits the current
conditions of recipient countries (especially the socio-economic realities
and the people's lifestyles).
2) Technology that meets the foregoing conditions and has a high cost
effect.
3) Technology that can offer multipurpose solutions to serious problems now
facing developing countries such as the gap in economic development
between urban and rural areas, damage to forests, traffic congestion air
pollution, trade deficits, and so forth.
4) Given the above conditions, state-of-the-art technology is not necessarily
essential; it is more important to find a project of transferring technology
which may be at the infant or intermediate level and yet has a high cost
effect and is simple and low-cost.
5) In more concrete terms, truly needed projects cover a wide variety
ranging from "konro" (a portable cooking stove), "kamado" (an oven),
improvement in thermal efficiency of boilers in a small-scale factory, coal
washing, electric dust collectDT, to technologies of simplified
desulfurization and fludized bed combustion, which help reduce air
pollution and conserve energy - technologies which indirectly reduce C02
emissions to a great extent.
/10
4.3 Measures for overcoming problems in Japan
1) Drastic expansion of energy and environment related aDA budgets and
flexible appropriations thereof, governmental support of R&D studies in
Japan of technologies suitable for developing countries and preferential
measures applied to capital investments by joint venture companies in
desulfurization and energy-conservation facilities.
2) Re-examination of the current formula of Japan's accepting requests from
recipient countries, strengthened project-finding activities and expansion
of research and bilateral/multilateral meetings.
3) Rapid expansion of training programs for recipient countries' technical
experts. Expansion of the number of Japanese experts dispakhed to
recipient countries and education of talented personnel to provide such
experts, and improvement in their 'Salaries. Efforts to eliminate language
barriers of those who are engaged in these activities. (In general, utmost
efforts must be made to overcome the absolute shortage of human
resources undertaking Japan's technology transfer.)
4) Promotion of cooperation to formulate energy master plans and plans for
technology transfer which provide a basis for successful technology
transfer.
4.4 Measures for overcoming problems in recipient countries
1) Formulation of pertinent, realistic and detailed energy plans and
technology transfer plans which are commensurate with economic plans
and establishment of a system for implementation and management of
those plans. Expansion of the data and statistics to support these plans.
2) Education of technical personnel undertaking the technology transfer and
its maintenance, and efforts to produce related equipment/facilities and
spare parts in recipient countries themselves.
3) Establishment of the "road to sustainable development" which best fits
the recipient countries' culture and climate, and proposals for technology
transfer plans commensurate with their culture and climate and
measures to implement them.
4) Expansion of the government's preferential measures for technology
transfers from foreign countries, including joint venture companies.
5. ConclusionThe technology transfer is a joint project between donors and recipients
aiming at global "sustainable development" and common benefit. To make it asuccess, it is essential that comprehensive and integrated structure involvingvarious conditions outlined above be firmly established, or at least that bothparties spare no efforts to establish that structure. Otherwise, even if Japanincreases energy and environment-related budgets, for example, actual projectswill not be implemented in an appropriate manner - a situation distressing toboth parties.

STUDY ON ROLE OF TECHNOLOGY TRANSFER INABATING GREEN HOUSE GAS EMISSIONS:
THE CASE OF SRI LANKA
We gratefully acknowledge the generous support provided byMr. K. Gnanalingam of Ceylon Electricity Board and Dr. TilakSiyambalapitiya of Sri Lanka Energy Managers Association,
Colombo, Sri Lanka for completing this paper

1. Introduction1.1 The energy scenario
In Sri Lanka 6.6 million tones of oil equivalent of total energy was
supplied in 1989. The share of commercial energy was 1.9 million tones of oil
equivalent or 29 per cent. The balance 71 per cent was from fuel wood. Central
consumption of commercial energy in 1989 divides into transport 55%, house
hold 20%, industry 18%, agriculture 2% and others 4%.
Hydro remains the major source of electricity supplying about 3,000
GWH in 1990. Thermal generation account for about 5% only. Impact
associated with the generation of hydro power is linked to the construction of
dams and reservoirs. No major impact can be expected from the thermal source
at present, in view of its limited use.
But environmental safeguards will be required when thermal plants are
continuously operated or when new plants are planned. It is evident that
transportation sector is the largest consumer of commercial energy. The
principle environmental impact associated with transportation is air pollution.
National Environmental (amendment) act of 1980 gives the Central
Environmental Authority (CEA) among other powers, the functions; the control
emissions, disposal of wastes into the environment and to subject development
activities to environmental impact assessment at project planning stage.
The former has been given operational effect through the National
Environmental <Protection and quality) Regulation No 1 of 1990).
1.2 Prevalent policies in the country that affects the process of
technology transfer
The Board of Investment (BOI) of Sri Lanka has been created recently.
The BOI is the sole authority for promoting and approving investment in Sri
Lanka. It functions as the "One Stop Shop" service centre catering to every
need of the investor. It administers three Free Trade Zones established for
investors. In addition, an attractive package of incentives is offered for export
oriented investments. Approval procedures have been evolved, shorn of
bureaucratic delays, to the point where it has become simple and transparent.
An attractive package of incentives with no restrictions on repatriation of
funds and dividends and tax holidays up to 15 years and more have been
introduced. The other significant developments are:
;1

• Liberalised policies of import/export.
• A well developed infrastructure and BOI's experience of over 14 years in
the operation of Export Processing Zones.
• The high literacy of the workforce.
• Simplified approval procedures.
• Free operation of foreign Bank Accounts.
100% foreign ownership or joint ventures with local investors.
The primary objective is to attract foreign investors and provide them
with maximum opportunities for investment, trade and joint ventures. Arrange
one-to-one meetings and visits to the Export Processing Zones. And appraise
them of the areas of foreign investment.
It is our view that Sri Lanka has so far no restrictions as far as the
process of technology transfer. It is open for any type of technology provided the
industries that are set out will promote the use of unemployed human
resources of the country instead of making use of machines and reduce labour
content.
2. Historical perspective : since 1982In 1982 Dr. Mohan Munasinghe from the World Bank was on an assignment
as energy advisor to the President of Sri Lanka for a two year period. He
initiated an Integrated Energy Planning system so that inter'Ministerial
coordination takes place in all energy related matters. The Ministry of Power
and Energy was created and the National Planning took important details
from Ministry of Forestry, Transport, Power and Petroleum sectors.
Unfortunately, force task for which were created has been dispensed with and
action has to be taken to revive them.
Present Government intention: regarding energy conservation is shown
by the creation of the State Ministry of Conservation from the year 1991. We
are glad to note that Director of this Ministry of Conservation is the past
President of S.L.E.M.A. It is expected Government will be able to give more
incentives for energy conservation matters.
Parts of Energy Conservation Fund which is presently used for
preparation documents to be issued to the public at exhibitions on conservation.
Regular T.V. and Radio programs are held under the auspices of this ministry.

In the domestic sector following conservation measures are under
consideration.
For cooking improved cook stove are being promoted through the
Ministry of Power and Energy. Use of gas in preference to electricity is being
promoted by pricing. Use of good conducting bottom vessels in cookers, use of
rice cooker which are fully insulated,.use of pressure cookers which reduce
energy consumption are all being promoted.
Efficient lighting: A separate report on the use of efficient lights is
annexed to this report. It is estimated that about 80 megawatt (1/10 of Peak) of
power is caused by smoothing Irons which is being used by all the houses daily.
An effective change to material of Non-Iron type could save this load and it also
reduces the energy use.
Action is being taken to work with Institute of Architecture in planning
and designing houses so that they will use natural lighting. Wherever air
conditioning is used the house has to be designed to minimize losses and to
prevent direct solar radiation into the house.
Domestic solar water heaters had to be promoted by giving tax
incentives.
At present energy management is used in the industry and almost all
large industries have efficacy engineer or a Energy Manager in their staff. A
good part of the industrial load comes from hotel industry. Regular seminars
and training of boiler operators are held annually to promote this energy
conservation activity by SLEMA itself with support from Ministry.
In agriculture four wheel tractors and two wheel tractors have been
introduced in the recent past.
Research institutes studies indicate that the energy used by four wheel
tractors for ploughing is inefficient. Deep plugging is not really required. A two
wheel tractor may be a better compromise. Solar powered battery weed cutting
device and ploughing machines are being proposed by the agricultural research
institutes. The sea around Sri Lanka is intensively tapped for fish. Energy
efficient boats need to be introduced for this activity and energy efficient.
Refrigeration need is high in the processing of fish.
Several steps have been taken to improve viability of public sector
industries. Opening up opportunities to engage in joint ventures with large
foreign companies is one of them. Collaboration with Japan, Germany,
/10
111'

Australia, Britain are some examples. A presidential commission onprivatisation has completed a study on 21 public enterprise with World Bankassistance. It has categorized enterprise into three those that had to be closed,those which can be within a short period be restructured either financially ortechnically, those which have to be privatized.
The balanced development of energy planning skills both atmanagement and technical level is important. Underlying theme should beself-reliance in energy planning, because the final responsibility of theintegrated national energy planning should rest on local staff and policymakers. Although in many cases it may be necessary to rely on foreign expertsor consultants to initiate the process and play an advisory role, the training oflocal counter parts and the goal of eventual transition to completely thenational staffing should have a high priority. At the same time because bothtechnical and economic knowledge in the energy area tends to change rapidlyenergy planners should have good up-to-date library and documentationfacilities as well as ready access to international conferences training coursesand meetings. Finally if salary levels are inadequate it will be rather difficultto recruit and retain personnel with energy related skills. It is our experiencethat large number of experienced professionals have left for greener pasturesin other parts of the world, some taken away by the consultants or loan givingbodies.
2.1 Industrial policyIn 1990 initiative were taken with regard to the implementation of new
industrial policy introduced by the Ministry of industries science andtechnology. The greater Colombo economic commission (GECE) and foreigninvestment advisory committee (FIAC) were merged in January 1990 to form aone window in order to facilitate entry of foreign investments. Approvalprocedure were also simplified. In response, foreign investment, in January1990 foreigners were permitted to own 40 per cent of shares of existingcompanies without any approval. Multinational corporation are showingpreference to investing in countries with the well educated and technicallyqualified work force. More sophisticated industrial production requires skilledlabour. Therefore the availability and cost of skilled labour become verysignificant. Since we have the disadvantage of a small domestic marketinternal insecurity and perceived country risk, our ability to attract a higher
/11

level of foreign investment would depend on the development of our
infrastructure and improvement in the quality of our labour.
New industrial strategy was introduced in 1990 by Ministry of Industries
with a view to restructure the overall domestic Industrial Policy. It intends (a)
Transform the import substituting industry to an export oriented industry (b)
Provide greater employment and income opportunities. (c) diversify the
economy and strengthen the balance of payments and (d) ensure more equitable
distribution of income and wealth.
The strategy also includes policy measures aimed at mobilizing resources
for investment and export; encouraging foreign and local investment; reforming
public enterprises; promoting a competitive environment; establishing linkages
between large and small industries; promoting research, training and
marketing and removing administrative obstacles to investment, production
and exports.
In promoting research, training large amount of work can be done for
technology transfer and conservation.
2.2 Changes done in foreign investment policy in 1992
Changes in exchange control regulators to all foreigners and foreign
agencies to fully buy up certain Sri Lankan ventures has been gazetted.
Government will permit non nationals and approved foreign funds and
corporate bodies to purchase shares in Sri Lankan companies up to 100% of the
issued capital subject to certain restriction (If capital is more than one million
US dollars).
The 100% transfer tax composed on transfer of assets between nationals
and non-nationals also has been already abolished.
A textile mill which was a gift from East Germany in nineteen eighties
was such a sick and efficient plant. For acquiring spares we had to lose a large
amount of foreign exchange. Many energy management programmes were
developed but when a Korean firm bought this up to Total Electrical Power
requirement came down from 25-30 MW to 15 MW and they used only half the
floor area for there machinery and production was doubled. No staff were
retrenched at take over this being one condition of transfer. Technology
transfer has improved efficiency reduced wastage. Some of the profits will leave
the country.
17~
•

2.3 ConclusionToo much of forcing on a developing country to reduce emission of green
house gases can be accepted only if the necessary funds for capital investments
and the technology transfer for more energy conserving devices can come. Use
of alternate source of energy be promoted.
Studies sponsored by USAID programme through TERI gives
encouragement that there is a hope in the future for proper transfer of
technology and funds will be available to reach the targets. '
One also feels that it is best to learn to live in harmony with the nature
than work against it then our life will be peaceful. Nature will definitely look
after itself. We should try and disturb it to the minimum in reducing our
wants.
3. Case study of energy efficient lighting systems in Sri Lanka
3.1 The backgroundSri Lanka's national electricity grid provides all the electricity
requirements in the country, except in a few very remote areas where, if at all,
small generating sets are being used for a few hours of the day. The system
demand profile given in figure 1 shows a very high peak during the evening
hours of 1800 to 2000 hrs. The system load factor for 1991 was 56% which has
been recently varying between 54% and 56%. Ceylon Electricity Board is
optimistic of achieving a higher load factor of 58% by the year 1997.
Sri Lanka Power System is predominantly hydroelectric in which the
entire demand as of now can be met from hydroelectricity in an average rainfall
year. The poor load factor is not of significance when generating capacity is
considered; the hydroelectric system has over 80% reserve margin. The sharp
peak in the evening is only of significance now for the transmission and
distribution system, and the substations in which certain links are overloaded
during the peak. However, high reserve margins will not prevail for long as the
generating system is presently transforming from a predominantly
hydroelectric system to the a mixed hydro-thermal system. Any savings in
peak time capacity requirements would certainly be beneficial from about the
year 1998.
However, the sharp lighting peak in the evening causes a heavy demand
for energy. It can be clearly identified that the evening peak demand is almost

entirely caused by household lighting; the street lighting and commercial
buildings cause not more than 10% of the 300 MW evening lighting peak. With
the rapid rural electrification programme of the government in which most new
consumers are households, the system load factor and peak time energy
consumption can only be expected to worsen.
The time-of-day tariff introduced 6 years ago is now available to medium
and large industrial and commercial consumers as well as for hotels. This tariff
carries unit charge of double the regular rate between 6 pm and 9 pm and
rebate for energy used during off-peak hours. While the exact benefits of the
time-of-day tariff for large consumers is yet to be evaluated, introduction of
such a tariff for households has not been considered yet.
Therefore, the only alternative to achieve the desired improvement in the
system load factor and to bring about a reduction in household consumption of
electricity, will be to improve the efficiency of lighting system used in the
households. This paper describes the efforts made so far towards this objective
and their results, together with details of costs and benefits of a possible state
sponsored or private sector funded popularization programme to popularize
efficient lighting system.
3.2 The composition of the load curve
The electric system demand curve shows a sharp peak approximately
between 6pm and 9pm on all days of the week. On a typical Weekday in
February 1992 (see figure 1), the system demand increased from 380 MW at
6pm to a peak of 680 MW at 7.30 pm. Figure 1 shows the half-hourly peak but
the instantaneous peak may be higher.
In the absence of a specific study at the consumer level on the
composition of the demand curve, it would be reasonable to assume that the
total evening lighting load in the country is 300 MW. If an allowance is made
for the industries finishing their working shift at 6pm, this estimate can be
. higher. Similarly, an unknown portion of the evening peak would be taken up
by television sets. With the exception of street lamps, the lighting load operates
for about 3 hours a day. Therefore, the corresponding energy use will be 300
MW x 3 hrs x 365 days = 329 GWh/ year. There is also the day-time lighting
load, especially in commercial buildings, which has not been estimated.
Ii

The mix of lamp types causing the lighting demand is also not known.
An estimate may be made by assuming that at least 3 incandescent lamps of
40W each would be operated in each household at peak time, which amounts to
an incandescent share of 120 MW in the evening demand from the 1 million
households electrified. There is widespread belief that this share is higher,
reaching at least 200 MW.
Owing to financial constraints, households newly electrified would
always be on incandescent lamps. These will be partially replaced with
fluorescent fittings depending on the level of the consumer's awareness on
energy conservation potential and his ability to pay the higher costs required.
The quality of conventional fluorescent fittings available in the Sri Lankan
market is not satisfactory, with excessive losses occurring in the ballast. The
fluorescent bulbs used in the fittings also do not generally provide the best
luminous efficacy of the conventional bulbs.
The lamps used in the commercial buildings and in industries during all
hours of the day are not estimated here because a proposed programme for
popularization need not give incentives to such consumers. The exception will
be public institutions such as hospitals and government offices, which remain
under the direct control of the government.
3.3 Previous effortsThe efforts by the Government, state agencies and NGOs'in the
improvement of the efficiency of lighting systems began in the late 1970s with
the national electric power utility, the CEB, conducting publicity on energy
efficient lighting systems. However, the serious efforts for widespread use of
fluorescent lamps began only in the mid 1980s with the sharp escalation of
electricity tariffs.
It would be confidently expressed that large commercial buildings and
hotels in Sri Lanka now use fluorescent lamps to the best of their ability and
limit. The area that needs special concentration is therefore the household
sector.
Households consume nearly 40% of the electricity consumed in the
country, a significantly high share for any country. Industries consume yet
another 40% and remainder is taken up by the hotels, commercial buildings
and street lighting.
.-

3.4 Regulatory measuresThe major issues in the regulatory framework for energy efficient
lighting systems are,
(a) the absence of efficacy standards for lamps locally manufactured and
those imported into the country
(b) the poor enforcement of the quality standards
(c) the absence of national guidelines/standards for the levels and quality of
illumination within buildings
(d) the taxes and duties applicable to lamps.
There is an established local industry for the manufacture of
incandescent lamps together with Sri Lanka standards for covering their
quality. H~wever, the standards do not cover their luminous efficacy and
overall energy efficiency. There is no local industry manufacturing fluorescent
lamps for the local market (there is at least 1 export-oriented venture). Thus all
such lamps and the accessories are imported. Fluorescent lamp as~embly is
done locally. The import of fluorescent lamps of poor luminous efficacy and
quality (life exp'ectancy etc), ballasts of unacceptable loss and audible noise
levels, are widespread. Further, the assembled fittings do not consist of a power
factor correction capacitor, which has an adverse effect on the consumers' and
system power factor as well as on the luminous efficacy of the lamp. Existing
standards do not cover the luminous output of lamps, Standards do not cover
the energy efficiency of the ballast.
The enforcement of quality standards in terms of the electrical
characteristics of the lamps and fittings requires to be strengthened. The initial
requirement is to enforce the existing national standards on all locally
manufactured and imported lamps, accessories and assemblies. The present
practice is for the lamps and lamp fittings to carry the approval from the
Standards Institution, if they confirm to the relevant Sri Lanka Standard. The
majority of lamps and lamp fittings available in the market do not carry the
approval of the Standards Institution.
The level of awareness among the general public, engineers and
architects about appropriate illumination levels for different tasks, optimization
of daylighting and the design of buildings for energy efficiency is low. An
awareness campaign supported by informative material, seminars, training
courses and an award scheme have been suggested by SLEMA and it is hoped
•

that the Sri Lanka Institute of Architects will participate in this campaign. Apre-requisite for such a programme would be the national standards/guidelinesfor efficient illumination systems for buildings.
The import customs duty for conventional fluorescent lamps is fIXed at5% of the value while the compact fluorescent lamps carry a 30% duty. Animmediate priority action that can be taken by the Government is to totallyabolish the duty of fluorescent lamps, both conventional and compact. Thisshould allow the lowest possible cost of these lamps in the market. The cost oflamps are of importance, especially at a time when there is rapid depreciationof the value of Sri Lanka rupee against the US dollar and when there is high(over 10% per year) inflation in the country.
A further issue that requires detailed study and follow-up action is theelectricity tariff structure. While the electricity tariffs structure in Sri Lanka isguided by long run marginal cost considerations, the low-consuming group upto100 kWh/month receive electricity at a subsidized price as follows:-
Upto 10 kWh/month at 0.55 SLRs/kWhNext 40 kWh/month at 1.05 SLRs/kWhNext 50 kWh/month at 2.00 SLRs/kWhNext 350 kWh/month at 3.00 SLRs/kWhfurhter use at 4.00 SLRs/kWh
(Note:- Average price of electricity is 2.40 Rs/kWh)Household electricity consumers using less than 100 kWh/month receive
electricity at a subsidized price, well below the average selling price of 2.40SLRs/kWh achieved in 1991 for the entire utility. (Note that the average tarifftoo does not exactly reflect the true cost of electricity but it can be used as anindicator of the finances required to retain the financial viability of the utility).
The majority of the household consumers consume below 100 kWh/monthand hence they are subsidized (by the other electricity consumers). Theimportant factor is that these very consumers who receive electricity atsubsidized rates are those responsible for the high evening lighting peak andall the consequences thereby.3.5 Replacement options
In formulating a programme for widespread used of energy efficientlamps, the following replacement options have to be considered:-

(a) Replacement of incandescent lamps with conventional fluorescent(b) Replacement of conventional fluorescent lamps with high efficiency
fluorescent lamps and fittings, including the use of compact fluorescentlamps.
(c) Replacement of incandescent lamps with high efficiency fluorescentfittings, including the use of compact fluorescent lamps.The country has very little experience with the use of high efficiency
fluorescent lamps, especially with compact fluorescent lamps (CFLs). Technicalissues related to the operation of such lamps, with regard to the voltage andfrequency effects, and how widespread those effects are in the existing system,requires further study. Views have been expressed as to whether a componentsystem, where the ballast, starter and the high efficacy bulb are individuallyreplaceable would be more suitable than a compact fitting.3.6 Model for the popularization of efficient systems
The manner in which efficient lamps and fittings should be popularizedfurther in the efforts to improve the efficiency of electricity use, thus reducinggreenhouse gas' emissions has been under discussion for some time. It has beenrecognized that widespread use of efficient lamps in the households wouldrequire financial assistance for the consumers to meet the initial cost of thelamps and fittings.(a) A state sponsored programme(I) An option for the State utility would be to distribute free compact
fluorescent lamps to households, in an effort to strongly carry themessage of their high efficacy. If a 40W incandescent is replaced with anllW compact fluorescent, the 120MW demand estimated in the earliersection would reduce to 33 MW and 95 GWh/year would be saved.Generating capacity is not a constraint in the Sri Lanka system as yetbecause the system carries a high reserve margin. The energy saved isvalued at 228 million Rs/year (i.e. at 1991 average tariff of 2.40 Rs/kWh).From the utility's point of view, the costs and benefits are as follows:-
Assuming consumers save their marginal units usually paid for at 1.05Rs/kWh,
t, 'f

Present subsidy to household
Subsidy after installation of
CF lamps
Subsidy saved
131 GWhjyear x (2.40
1.05) Rs/kWh
177 million Rs/year
36 GWh/year x (2.40
1.05) Rs/year
49 million Rs/year
177 . 49 = 128 million
Rs/year
Number of lamps required 3 million
Market price of a lamp Rs 600
Total cost 3x600=1800 million Rs
Thus for an entirely utility sponsored programme, 1800 million Rs
require to be invested, saving 128 million Rs/year of subsidy to households
which makes such an investment unattractive to the utility, showing a payback
period of 14 years. Duty free import of lamps too would cost about Rs 400 each
and the payback period would then be 9 years. The reduction in peak demand
requires to be shown to cause the cancellation of a new power station, in order
to further justify such an investment. This issue will arise only after about the
year 2000, when the system reserve margins are expected to fall to
international norms of 20-30%. The 87 MW of peak demand reduced can be
assumed to avoid the investment on a gas turbine with a capital cost of Rs
1914 million, which clearly indicates the viability of investing Rs 1200 million
in a CFL programme at that time.
However, a free CFL distribution programme does not appear to be
viable now for the utility, unless heavily supported by the Government and
external funding agencies.
A further justification for the use of CFLs would be the reduction of
greenhouse gas emissions, by the expected saving of 95 GWh/year, which under
average hydrological conditions, would be marginal units generated from
thermal sources. The thermal source presently earmarked to meet this demand
are residual oil fired diesel engines.

3 x 400 Rs = 1200 Rs(40-11)W x 3 x 3 hrs/day x 36595 kWh
95 x 1.05 = 100 Rs/year
(ii) A further option is for the lamps to be distributed on loan, to berecovered in instalments on an interest-free basis. Assume a householdpurchasing 3 x 11W lamps.Cost of lampsEnergy saved
Cost saved
Consumer's paybackperiod 12 years
The payback period is unacceptable to a consumer. However, the paybackduration will change for consumers in the higher monthly consumption blocks,whose marginal kWh is paid for either at Rs 3 or 4 but such households are asmall share of the total.(iii)Options (i) and (ii) above clearly indicate that a CFL programme fully paidfor by the utility or by the consumers would not be viable, under the presentgenerating system configuration and the consumers' tariff structure. Thelifeline rates for lower-income consumers are likely to remain for some timeand the system load factor is likely to remain low as long as the greateremphasis in system expansion is placed on rural household electrification.
There are also the possible weaknesses in a state/utility-runimplementation programme. The utility is continuously engaged in theexpansion and rehabilitation of the distribution network and handling day-today consumer services. The time available for the regular field staff to provideand monitor the use of CFLs in the households would be limited.(b) A private sector project to handle the popularization of CFL is another
option but at the outset, it has to be clear that Government or donorfunding should be made available to launch the project.The subsidy may be arranged in terms of the number of bulbs sold, in
which the consumer returns a confirmation note to the Government/utilityabout the receipt of the lamp. A private organization with a strong engineeringand marketing background and its own dealer network would be better placedto promote the use of CFLs, provide field level support and monitor their use,than a state utility. Adequate safeguards have to be built-in to protect theinvestment of the state/donor in the project together with backup monitoring bythe utility/donor.

3.7 SummaryThe problems to be solved in the use of efficient lighting systems, with
one of the objectives being the reduction of greenhouse gas emissions, are notstrictly related to technology transfer but the dissemination of the technol9gyalready available. The barriers to overcome are the high capital cost andtechnical performance of efficient lighting systems on one hand and thesubsidized household tariffs that make the critical component of systemdemand insensitive to the financial benefits of efficient lighting systems.
/'61

f(ju.y.. J
Sri Lanka Power Systen1Half-hourly Demand Profile at Generation
Wednesday, 12th Feb 1992
Demand(MW)700 -.---'----;-~---,----~--.,.--__,___-~___,_-_,__-.,._:-----,
r':"-:\
60 0 -+--'----;---+---+---------+--+--+----.,.---e-----:--+--C--->:\---,-l-i
~ 00 +------+--+---+------:f----+:--+:--;~--,---+r-;---1\~':.::..---j
·t\I~!- \400 +--1-;-----t-j~f\V---.:il,l------;-----:.~=:.::::;::~"-J-+. -.:-____l.\\--1
300 --1-..~~.-j""':""l-~~·---:---:---~----:-----:----'i
';>00 +-----:---.:....---,.----.,.----,------:----,-------j
100 -1-----.:....---:---.:...---,--:-----:---:-------:---1
o I I
o 2 4 6 8 10 12 14 16 18 20 22' 24
Time(hrs)
!\Ioi. adjusted for disconnectedTliorthern load

AEI COLLABORATIVE STUDY ON ROLE OFTECHNOLOGY TRANSFER IN LIMITING CO2 EMISSIONS:THAILAND'S COGENERATION AND ENERGY-EFFICIENT
LIGHTING
We gratefully acknowledge the generous support provided byDr. Charuay Boonyubol and Dr. Chaiya Chamchoy of
Chulalongkorn University, Thailand for completing this paper

1. Introduction
Af:, the results of the Collaborative Study to Limit C0:l Emission in Phase
1, the study recommended that the rate of greenhouse gas or GHG emission
worldwide must be reduced. This may be achieved by a number of
methodologies. The following methodologies are suggested.
(1) Energy conservation.
(2) Measures to reduce the rate of deforestation.
(S) Measures to discourage the use of wood from natural forest as fuel.
(4) Replant fast-growing trees for energy.
(5) Replace conventional fuels by renewables.
The first methodology suggested, i.e., enerb')' l:onbervation seems to be
the most implementable methodology among others and in fact has been
accepted widely as ~n efficient means to conserve energy.
By energy conservation we mean using energy only when necessary and
as efficiently as possible. Energy has been consumed by mankind for several
thousand years 'for ways of living and comfort. In the past 50 years, energy
l:onsumption by mankind has innea::.ed at a l:onsiderable sharp rate in
transportation, industrial, business and residential sectors. Energy has been
used in an inefficient and luxurious manner as a result of cheap oil, until 1973
when the first oil crisis occurred, followed by the second crisis in 1979. Oil
prices had been sharply increased, creating concerns to governments of oil
importing countries to reduce oil consumption by energy conservation measures
and energy diversification.
Energy conservation measures have been adopted and successful in
industrial countrieb. ,Japan where energy supply is largely dependent on
imported energy could be cited as one of the most successful l:ountries in energy
conservation. Energy efficiency has been increased and losses have been
reduced. Research and development to switch to renewable energy such as solar
and wind have been and are being carried out. Japan targets at its industry
mainly and has been succegsful. It is to be noted that cogeneration of heat and
power which was a practice in the industry about a century ago and was halted
when cheap power from distribution lines was available everywhere, has
revived with success in industrial countries during the last ten years after the
second oil crisis. Unfortunately, cogeneration has not been so successful in
developing countries due to lack of government measures and incentives, and
due to low economic growth and underdeveloped industry.
Energy conservation measures have been successful not only in
increasing the energy utilization efficiency, but also resulted in reducing CO2
emission rate. In Thailand, priority has been given to energy conservation in
industry and buildings. Legislative measures were considered to be an effective
instrument for energy conservation policy.
In the following context we shall discuss in general Thailand's policy in
energy conservation that will affect technology transfer in two selected
priorities, namely, industrial cogeneration and energy-efficient lighting for
buildings.
2. Thailand's energy conservation policy and measuresThailand is a net energy importing country. Its dependence on imported
energy, mainly petroleum, is about 45% of country's energy demand. Mter the
second oil crisis in 1979, Thailand suffered a major economic setback due to
large expenditure on import of oil. Energy conservation has been a national
policy to reduce Thailand's oil dependence since then. Public relation has
always been put forward by governments as priority measures aimed at the
general public. They set up ministerial level committee and use government
mass media such as televisions, radios to urge the public to use energy
efficiently in order to save energy for the young generation. This has been a
practice for years without success due to perhaps lack of knowledge about
technology of enerb'Y conservation among top decisioll makers, or perhaps due
to normal practice of elected government to use government mass media for
their own sake in seeking popularity for next general election. The sole
government energy agency, the former National Energy Administration now
Department of Energy Affairs, had tried to convince past governments for
almost six years to enact a law on energy conservation, but unfortunately they
were not successful. The failure was due to perhaps not only the lack of
seriousness on the part of politicians or lack of political will, but also to the fact
that the content of the law proposed aimed to regulate and control the users of
energy, particularly the industry and the owners of buildings, without positive
measures 01' incentives t{) give assistance technically ano financially to private
sector.

During the interim period of the unelected Anand Punyarachun
government in 1991, energy conservation was again stated as national policy.
But this time the government took it seriously and used legislative measures as
an instrument to put forward its policy into action. The Prime Minister utilized
his National Energy Policy Office to revise the previously proposed energy
conservation law. The content of the law has changed to provide incentives to
private sector to conserve energy for their own benefit, which in turn will
benefit the country in the long run. The government realizes that besides
housekeeping and retrofitting measures for energy utilization efficiency, capital
investment for new equipment of higher energy efficiency would be necessary
for the industry. Therefore, energy conservation funds were stated in one
section of the law as a commitment from the government to provide financial
assistance to energy conservation projects. The law was enacted within three
months after the appointment of the working group for revision, in contrast
with the six-year period of drafting the old version of the law. The energy
conservation act was announced in the Royal Gazette in April 1992 and became
effective since then, thanks to the Anand's government. It is believed that thp
newly enacted energy conservation act in wnjunction with the current
investment promotion act and governnlPnt policy on energy conservation would
affect the technology transfer as follows.
2.1 Investment policy and tax incentives
Before the energy conservation act became effective in April 1992, the
government has already had a policy to promote energy conservation by issuing
a Finance Ministry Announcement to reduce import duty of all proven energy
conservation machinery and equipment from about 40'k to 10lk. The process of
approval of energy conservation projects is done through a special committee
set up by the Department of Energy Affairs. The process has been slow and
taken long time before a project could be approved. The energy conservation act
through the energy ,conservation funds would provide an alternative incentive
by giving financial assistance to approved energy conservation projects
equivalent to tax incentive. It is believed that it would eventually replace the
tax incentive measures by the Finance Ministry. The energy conservation Act
provides incentives for investment in energy conservation equipment industry
too.
q),J ."

2.2 Capital financingAt the moment there is no special financing arrangement for energyconservation project provided directly by the government. However, the energyconservation project would be equally eligible to receive capital financing withlow interest rate from the government-owned Industrial Finance Corporation ofThailand (lFCT) as other government approved projects. Capital financing isnot much a problem for large firms which normally have good relation withthe banks. In the future, it is hoped that the government would consider capitalfinancing to small and medium industries.
2.3 Energy conservation-related programsOne of the most promising project to cope with energy conservationlaunched recently by the government is the Demand-side Management (DSM).This project is aimed at increasing the electricity utilization efficiency of powerconsumers. The project cost is 4,570 million baht equivalent to US$ 183 millionfor 5 years aimed at saving of 225MW of peak demand. The project will requiretechnology transfer on high efficiency light bulbs, high-efficiency electricalappliances, cogeneration equipment, etc.
3. Industrial cogenerationThis section will discuss technology transfer of industrial cogenerationtechnology to Thailand and assess barriers and opportunities of the transferprocess.
Cogeneration known as a simultaneous production of heat and power isan effective means for increasing energy efficiency and reducing energy cost.Cogeneration has been used by U.S. industry since the turn of century. It iswidely practised in Europe and elsewhere at present.In Thailand, the first cogeneration system was installed at TeijinPolyester (Thailand) Ltd. Company in 1974, one year after the first oil crisis.Teijin installed a 9-MW turbogenerator to generate steam and electric power ina cogeneration system.
After the Second Oil Crisis in 1979, the industry has become moreconcerned about reducing energy costs. Cogeneration has been increasinglyapplied in other industries such as pulp and paper, petrochemical, cement, etc.
1'13liE Ira ,.ry

3.1 Technology acquisitionThailand's economy has grown steadily at a high rate of about 10%
during the last 4-5 years, and continues to grow at a slightly decreased rate of
7-8% for the next few years. This is due largely to the continued economic
policy of every government to support and encourage investment in the country
from both foreign and local investors, with attractive tax privilege from the
Board of Investment and without too much control. The private sector grows
and builds up their own capability in choices and transfer of technology. A
study of Thailand Development Research Institute (TDRI) on Development of
Thailand's Technological Capability in Industry in 1989 reveals that large firms
have developed their own acquisitive capability to the point that they can be on
their own without having assistance from government bodies.
As regards the cogeneration technology transfer, large private
enterprises have capable technical and planning staff and access to information
and development of cogeneration facilities in industrialized countries. They are
capable of making their own study and decision to what technology they will
acquire. It can be said that there is no barrier for cogeneration technology
acquisition for large firms. For small and medium enterprises, the
opportunities for technology acquisition may be limited due to limitation of
qualified staff. However, they can be assisted by government agencies
concerned or attain a consultancy service from concerned institutions.
In Thailand, a number of distributors or representatives of foreign
cogeneration facility companies from the United State, European countries,
Japan and Australia are prepared to offer their services. Local companies in
association with foreign suppliers are capable of supplying some parts of
facilities or installation services.
In conclusion, it can be said that there is no barrier at all for Thailand to
acquire cogeneration technology from foreign sources. Foreign producers of
cogeneration facilities are willing to provide information and to transfer
technology to Thai companies. There are a lot of opportunities for foreign firms
to create business in cogeneration and for local industry to acquire cogeneration
technology.
3.2 Technology absorptionCogeneration is the simultaneous production of heat and power.
Cogeneration technologies have been developed up to a stable state that the
Thai industry is familiar with. Widely used cogeneration technology in

Thailand today is the steam-turbine cogeneration of topping cycle where steam
produced from boiler at high pressure and temperature is fed to run a steam
turbogenerator to produce electric power. Steam is either extracted from steam
turbine at a medium pressure or exhausted without condenser to be used in the
process. The industry has no difficulty in absorbing this kind of cogeneration
technology.
The second cogeneration technology that has become more popular in
Thailand is the Diesel cogeneration when exhaust gas heat i~necovered in a
heat recovery boiler producing steam for process steam requirement. This
technology also is not difficult to be absorbed by the industry. In the technology
transfer agreement, training for engineers and technicians is normally provided
by the technology suppliers.
The third cogeneration t€chnology is perhaps the gas-turbine
cogeneration with waste heat boiler. The basic cycle consists of a gas turbine,
heat recovery boiler and a process heating load. Gas turbine cycles provide the
opportunities to generate a large power output pel' unit of heat required in the
process relative to non-condensing steam turbine cogeneration cycle. In the past
due to rpstriction of power production, industry cuuld nut sell their excess
power produced to the grid, gas turbine cogeneration was nut suitable for Thai
industr.\"_ At present the government has revised tlw [<HI' concerning power
production to aHow private power producers from cogpneration to sell back
excess power to the grid, gas turbine cogeneration is likely to gain int€rest of
the industry. As regards the absorption of technology, it is again not a problem
for large enterprises. However, training courses otlpred by academic
institutions in association with experts from cogenE'ration suppliers would help
enhallce absorption of technologies for mediulll entl'rprises.
3.3 Technology adaptation and development
A number of engineering technologies, namely, combustion, steam boiler,
stealH turbine, gas turbine, diesel engine, heat recuvery, constitute cogeneration
tt'ch nologies. Thailand has gaud institutiOlwJ capability ill science and
technology' in these areas. However, sincE' its indu>"try i" slllall as compared to
industrialized countries, using of those facilities is limitE'd in number and it is
not economically feasible for energy facility industry to set ruot in Thailand.
Even today the government provides attractive incentives fi)r foreign
investment for export it is unlikely that cugeneration industry would be
I --1: ' "'

established in Thailand. However, part of cogeneration facility technology such
as steam boiler technology has been adapted and develuped in Thailand.
Frankly speaking, the state of adaptation and development in the industry is
still in a beginning state. Only low and medium pressure steam boilers could be
manufactured in Thailand. Large firms prefer to deal with the supplier as a
turn-key project. It is assessed that there is a potential for steam boiler
industry in Thailand to be developed further by joint venture of foreign
technology suppliers and Thai partners. With investment incentives from the
government and capable manpower in engineering as well as low labour costs it
should make the in vestment beneficial. Market cuuld be both domestic and
expurt through fiJrei/-,'ll partner distribution challliei. Process of technolob.'V
transfer could ill' done through training and learning process of the company.
3.4 Examples of cogeneration facilities
A few example" of installed cogeneration facilities will be briefly
described including their characteri"tics and how the technology has been
acquired
aJ Teijin Polyes!"r Company Limited (TpxtiiP Indllstryi
The company ha:" installed a 9-.I\TW steam-turIJIIlt' cog('neration facility
and is now in oJl(·ratiun. As the company is a JapaIwo>(' .iuint \"l~nture company,
they haH~ an <h'c'""" tu cugenpral](ln technology fr'llll tlH'11' llIutlH'r company in
Japan. A Japanl'"'' l'(Jlllpany Hitachi, is the techno!u;;y ::-lIJlP!H'r. The contract
for purchase of cogeneration facilities includes the cost uf kllowhow, dispatch of
ellgineers, inst;-tILition, training of personnel and cunlllli,,::;iolling.
b) NationaJ Pet luchcmical Corpuration I Petrochemical Industry)
The COmpilll\' has installed :3 units of gas-turbim' cogeneration facilities
01':24 MV',' each. Jt acquired equipllll'llt and tf'ChllOJugy from a German company.
AEG, in almost the same way as Teijin Pulyester.
c) PunjapoJ Group of Companies (Pulp and Paper ImlustryJ
A 38-MV\' cugeneration s.v::;tcm ha". IwelJ instnlled with the supply of
technology and equipment from a foreigll cumpan,\', Hitachi.
In cunclu"i(Jll, it is a common practice in Thailand that the terms and
conditions of supply of equipment and technology wuuld Iw incurporated in the
contract between suppliers and purchaser:". The technolugy and knowhow cost
is normally incJudpd ill the equipment cost. It is important that cuntract sit.,'lled
would t.,'1Hil'antl'\· rl1(' purchasl'l's (If smuoth transfer of tpchnulogy. After
I ~! ,,)

commissioning, the purchasers should be able to operate the facility bythemselves.
4. Energy-efficient lighting4.1 Introduction
In 1990, total electricity consumption in Thailand was 38 BkWh, ofwhich 20% or 7.6 BkWh was used for lighting. Commercial sector consumedabout 12 BkWh and about 309( or 3.6 BkWh was for lighting. Therefore,approximately 50% of electric power used for lighting is consumed bycommercial sector. It is estimated that 20% of commercial sector lightingelectricity consumption can be saved by 780 MkWh per year by using demandside management measure, such as replacing ordinary light bulbs with energyefficient bulbs.
4.2 Demand side management (DSM)Thailand's five-year project on Demand Sidp Management has been
launched by the government early this year to support t1w enerb'}' conservationpolicy. The project is to be implemented by the three power utilit ies with thecollaboration uf othl'l' ellprg,Y·rl'lated public organization;.;, ;Jc;ldl'JIlic institutesas well as private sectur organizations.l
Overall budget has been earmarked at 4.75 billion baht, of which about1.8 b will be spent on DSM of commercial buildings for the period of 5 years.Half of 1.8 b for commercial buildings progTam is allucated to efficient lighting.
For commercial buildings. the plan targets at twu markets: largecUlllmercial buildillgS larger than several thuusand square llIpter:o in size andsmall commercial buildings primarily shophouses. According to the plan largebuildings in the program will receive a comprehensive lighting retrofit withelectronic ballasts and 32W lamps, specular parabolic reflectors (fixtures) andautomatic controls where appropriate. Small buildings are mainly shophouseslit almost entirely by 40W fluorescent tubes. The buildings would receive apackage consisting of 32W tubes and efficient mah'11Ptir ballasts to replaceexisting equipment. A special project to assess the cost of pruviding energyefficient lighting fur all of the temples and religious schools and buildings inThailand will be t,,,uiblished. It should be possibh' III Pl'O!l\oll' the use ofefficient lighting which will be both the 32W tubes with efficient magneticballasts and compact fluorescent lamps. The latter will be used to replace the

low-efficiency incandescent lamps. It is estimated that about 4-5 million 32W
lamps with either electronic or low-loss magnetic ballasts will replace the
existing 40W lamps in the project for the next 5 years.
4.3 Research and developmentA typical 40W tube and ballast together consume about 50W. An
alternative is an efficient 32W tube with a low-loss magnetic ballast consumes
only 36W emitting light lumen equivalent to that of 40w. With electronic
ballast, less than 33W will be consumed. The price of an electronic ballast is
much higher than a magnetic ballast which at present is not attractive for
users. However, it is envisaged that in the long run, research and development
tu reach low-cost technology and mass production would bring down production
cost and more will be used to replace the existing ones.
For this reason, the Department of Energy Affairs is now interested in
developing electronic ballast and has sponsured a research project to a
researcher at Chulalongkorn University. It is hoped that knowledge of technical
characteristics and design experience would help in technulogy transfer to
Thailand.
4.4 Technology transfer
As a result of DSM prOf,'Tam, it is estimated that more than 4 million
32W energy-efficient fluorescent lamps will be used to replace the existing 40W
lamps. \Vith elll']';';:\' cunservatiun policy a IIII incentives from the Bnergy
Cunservation Fund", it i" anticipatpd that these lamps will be widely used by
new buildings. I t is then an appropriate t inle fur ThaiJand to transfer
t€chnoJogies regarding energy-efficient fluorescent tubes, Jaw-loss magnetic
ballasts, electronic ballasts and compact fluorescent lamps.
4.4.1 Technology acquisition
The role of the government is to encourage investment for production of
energy-efficient equipment by offering incpntives through tlw Board of
JIlvestment.
The pri,":!t!' spc!or will seek opportunities to either ,.,pt up new lines of
business.
Since Thai illdll:stry ha:,; been developed to a lllal lire state, lllost of them
are able to make lip their own minds in seJecting tpchnologie::;. The factors that
they may consider essential t('lr technolog" suppliers are past record of

performance, well-developed technologies, reasonable licensing fees and friendly
partnerships.
Barriers and Opportunities: The market of fluorescent tubes in Thailand
is sizable. Approximately 35 million fluorescent tubes were sold in 1990. There
are 9 manufacturers of fluorescent tubes, of which Phillips co. takes the largest
. shares of 35% followed by Toshiba 30%. There will be no barrier to acquire
energy-efficient lighting technologies from industrialized countries. The
acquisition process is normally done by private sector by contacting the
technology suppliers, visiting the factories and negotiating. The project
feasibility will be made taking into accounts all incentives that will be given by
the BOl. If the project turns out to be economically feasible, then agreements
can be signed without any control from the government.
4.4.2 Technology absorption
Lighting equipment industry has set root in Thailand for almost 20
years. Technolugies havlc' belc'n transferred tu Thailand through joint ventures
and also to local manufacturers. New technologies can be absorbed without
difficulties. Standard testing laboratories are available to help increase the
quality of the products. The established linkages between academic institutions
and industry have provided means for collahoration in technology transfer by
means of training, consultancy and R&D.
4.4.3 Technolog'Y adaptation and development
Thailand has developed its science and technology capability for some
years thruugh furmal educatioll, R&D in"titutions and leaming prucess ill
industry. Large industries have develuped tlwir own adaptive capability and set
up R&D division. Technology adaptation and development could be done in the
factory, or by collaboration with universities or R&D institutes.
5. ConclusionIt is agref'able among dinerent parties that enprh'"\' conservatiun measure
among others would ,-;(')"\'l! as a means for limiting ('U~ emission. Developing
countries unlikp industrialized ones have not [)pen S lIccessful in eneq..'Y
conservation. One barrier is the lack of technologics and knowledge of
technology transfer.

Thailand j:-. furtunate that it has developed ib indu~tr'y tu the state that
technology transfer processes have been practiced widely and known to public
and private sector. Thailand has enough science and technology capability and
manpower for the transfer of technology.
Thailand's policy on energy conservation is clear. It has an energy
conservation law as a master measure for implementation. Energy-related
organizations have been restructured. Energy conservation projects such as
Demand-side Management have been launched.
Industrial cogeneration is now promoted by the government. Recently,
there has been a policy change allowing industrial cogenerators to sell their
excess power back to the grid at a fair price based on long-run marginal cost.
On technology transfer of cogeneration, the Thai inclu::;try, particularly large
enterprises, are capable of acquiring technology and have enough capability in
t€chnology absurption. There is a good opportunity tu prumute cogeneration
market in Thailand, sillc£' the hanipr prohibiting sp]ling hc1ck of power to the
grid has been remuved.
Energy-efficient lighting is also being campaif.,'1lCd a litI promoted through
a DSM project. High capital costs are seen to be the only Imrrier to promote tIl('
utilization of energy-efficient lighting equipment. However, technologies can he
tr<iIlsfered to Thailand by setting up manufacturing plants to produce energy
elficient lighting equipment using investment illl'enti"E's frum the government.
) Y)
.,

STRUCTURING THE EQUITY ISSUE IN CLIMATE CHANGE
We gratefully acknowledge the generous support provided byDr. Prodipto Ghosh of Tata Energy Research Institute,
9 Jor Bagh, New Delhi, for completing this paper
---.m~·T

1. IntroductionThe key to an eventual international agreement for regulation of Climate
Change is the issue of equity or fairness. Equity is involved in at least the
following aspects:
I. Real resource transfers may be involved in the application of regulatory
instruments. For example, carbon taxes or (auctioned) tradeable permits
may be expected to yield net revenues to the international regulatory
authority, and these would need to be shared by countries on the basis of
an equity determination. Alternatively, assignments of emissions rights
can be shown to also involve actual resource transfers across countries
and generations.
II. Actual Climate Change manifestations may impact countries or regions,
or generations differentially, and without apparent relationship to their
respective contributions to GHGs emissions. The equity dimension
relates to assigning punitive or compensatory responsibility for
environmental impacts.
The first 'aspect relates to the sharing of a global common property
resource, the atmosphere. The second, relates to compensation for adverse
impacts of Climate Change, or alternatively, but less plausibly, resource
transfers from regions which may experience favourable impacts. While the
first aspect has merited some treatment in the literature, work on the second is
still limited.
The issue of equity is also central to any economic analysis of the
impacts of different regulatory schemes. Unlike in the case of domestic
programs (at least in some countries), no neat separation between efficiency
and equity concerns are possible in the case of major global economic issues,
because the international community does not have an armoury of policy
instruments to redistribute economic output across nations and generations.
Accordingly, in thecase of Climate Change, any regulatory structure will have
to simultaneously determine and embody the equity issue. Since such a
detemination will involve resource flows across countries and generations,
economic analyses of the regulatory regimes will be contingent on the equity
resolution.
~·T III

The issue is complex, and in this paper we do not attempt anything more
than providing an outline of a framework for analysis of the problem.
2. Earlier workThe previous literature on the issue of equity in Climate Change is briefly
reviewed as follows:
One doctrine suggests that all human beings should be entitled to an
equal share in the global sinks for GHGs emissions (e.g. Aggarwal and Narain
(1990), Bertram et. al. (1991), and Grubb (1989». A stronger version of this
principle is furnished by Fuji (1990) to the effect that all persons should have
equal quotas of emIssions regardless of the country slhe belongs to or the
generation in which slbe is born into. In effect, this formulation would require
regions which historically have been the principal contributors to increased
atmospheric concentrations of GHGs, to compensate regions whose historical
GHGs emissions have been lower. Grubb et. a1. (1991) furnishes two ethical
objections to this principle: First, that the people were unaware in the past of
the adverse impacts of GHGs emissions, and their descendants cannot therefore
be held responsible for their predecessors use of these resources. Second, that
the development process, aided by emissions of GHGs has furnished important
positive externalities to all countries, and, by implication, compensation if any
is due, has already been secured. Both these objections are dealt with in the
analytical framework presented below.
Another line of reasoning, furnished by Young (991), is that not only are
past GHGs emitters not liable for their appropriation of these resources, but,
additionally, their historical emissions levels constitute entitlements on the
common-law doctrine of "adverse possession". Grubb et. al. (1991) points out
that this doctrine is intuitively unappealing, and in any case pollution rights
have no common-law sanction. It is indeed, doubtful if the adverse possession
principle is sustainable under any modern juridical system in respect of
common property.
A less extreme variant of this principle is that of "comparable burdens",
which may, or Illay not, be linked with current levels of emissions. This
approach is in line with traditional public finance theory, which views the
resource costs of provision of public goods (in this case, global environmental
quality or climate), as a societal "burden" which is to be shared by members of
i " )/ 'J
111'lla 18 T

society. Two approaches to equity in this literature are that the (tax) burden
should be in line with "benefits received" (differentially) by persons, and that it
should be related to "ability to pay". The first approach has the advantage of
linking the tax and expenditure sides of the budget, which the second approach
does not. However, redistributive concerns cannot be operated under the first
principle, and in any case the benefit rule cannot be implemented ih most cases
because it is difficult to assign benefits of public goods. The second approach
has generated several criteria of ability to pay for example, "equal absolute",
"equal proportional", and "equal marginal" sacrifice. At this point circularity
creeps into the argument, since choosing among these criteria involves the prior
acceptance of an equity principle.
A completely different line of argument is furnished by the "natural debt"
doctrine (Smith, 1990). This approach argues that all countries have
accumulated debts "to nature" in line with their use of environmental
resources, including GHGs emissions. Since further increase in GHGs levels
may lead to unprecedented risk of Climate Change, it would be advisable to
reduce further GHGs emissions, or "liquidate" part of the debt to nature, for
which each country may assume responsibility in proportion to their
accumulated emissions. This may be done both by reducing GHGs intensity of
the economy, as well as by creating offsets, for example through reforestation.
Since the economic costs of such measures may vary across countries, and in
particular, developing countries may have significant cost advantages in such
measures, industrialized countries may transfer resources to developing
countries to enable them to adopt such measures, liquidating their own natural
debt in the process. Clearly, this formulation does not acknowledge
responsibility to others for one's actions degrading the global environment. In
other words, the equity content of this approach does not relate to fairness
across human beings, and is for this reason, intuitively unappealing. As a
practical matter, it justifies only very limited resource transfers across
countries.
The developing country perspective may be best reflected in the Fuji
doctrine, cited above, which allows fur per-capita shal'ing of global
environmental resources, including across countries and generations (i.e.,
compensation·for historical emissions levels). We now proceed to a formal,

analytical derivation of the Fuji doctrine, starting from primitive propositions,
and also employing widely reviewed political economy principles:
3. A structuring of the equity Issue"Equity" or fairness is a fundamental, intuitive notion, but deeply intertwined
with the idea of "equality." The term 'equality' is used in different senses. It
may refer to "equality before the law", i.e., equality of treatment by authorities.
Alternatively, it may refer to "equality of opportunity", i.e., equality of chances
in an economic system. A third meaning is "equality of result", i.e., equal
distribution of goods. Coleman (1987) seeks to distinguish between these
different meanings in the following manner:
Suppose that a system consists of:
(a) a set of positions which have two properties:
(i) when occupied by persons, they generate activities producing
valued goods and services;
(ii) the persons in these positions are rewarded for these activities,
both materially and symbolically;
(b) a set of adults who occupy positions:
(c) children of these adults;
(d) a set of normative or legal constraints on certain actions.
Equality under law concerns (b), (c), and (d): i.e., the nornlative or legal
constraints on actions depend only on the nature of the action, and not on the
identity of the actor. That is, the law treats persons in similar positions
similarly. Equality of opportunity concerns (a), (b), and (c), i.e., that the
processs through which persons come to occupy positions give an equal chance
to all. Ordinarily this means that a child's opportunities to uccupy one of the
positions (a) does not depend on which particular adults from set (b) are her
parents. Finally, equality of result has to do with (a ii), i.e., the rewards given
to the position occupied by each person are the same, independent of the
activity.
These three concepts can also be seen as involving different relations of
the "State" to inequalities that exist, or arise in society. Equality before the law
means that laws do not recognize distinctions between persons that are
irrelevant to the activities of the positions they occupy, but that otherwise
policies do not attempt to eliminate inequalities as they arise. Equality of
Illill_ 1M. 1 .,
opportunity means that the State intervenes to ensure that inequalities do not
cross generations. Equality of result implies that the State periodically or
continuously intervenes to ensure that inequalities arising from activities are
not accumulated.
In applying these concepts to Climate Change, the first key question is
that of the "identification of agents". Ordinary notions of equity involve fairnes~
among human individuals as agents, although often couched in terms of equity
between different groups, or classes. An intuitively appealing notion of "agent"
in the Climate Change context would be human beings, irrespective of where or
when they happen to live. Alternative notions of 'agent', for example, countries,
regions, or defined communities are unappealing, if for no other reason than
that they are susceptible to fundamental change in character and composition
in the time frame of Climate Change. In that case, i.e., with agents as
individuals as defined above, sovereign States may assume the role of trustees
with respect to their citizens in the matter of equity in Climate Change, and an
attribute of sovereignty would be that such a claim of trusteeship is not open to
challenge.
In the context of multilateral regulation of Climate Change, given that
this definition of 'agents' is accepted, how may we identify the other elements
of the system described above? 'Legal constraints on actions' may be interpreted
as limitations on GHGs emissions. Further, the 'set of positions' would include
various occupations resulting in GHGs emissions and resulting in economic
reward, no matter where or when located. Finally, 'children', would, at any
given generation, mean the members of the succeeding generations.
What would 'equality under the law' imply, given these definitions? Since
under this principle, no note must be taken of distinctions which are irrelevant
to the activities of the agents, a multilateral regulatory framework cannot
distinguish between individuals on the basis of nationality, temporal
generation, or other. attributes, such as race, religion, or colour. WE thus
establish one component of the Fuji doctrine, that emissions rights across
human beings cannot be differentiated spatially or temporally, Equality under
law is generally considered the weakest equity principle, to which even an
minimalist State may be expected to adhere. It would be difficult to argue
against following this principle, in the multilateral Climate Change context.

What of 'equality of opportunity'? This principle requires that
inequalities (in wealth, welfare) arising from differential levels of GHGs
emissions do not carryover across generations. Specifically, at a minimum this
principle would seem to require that the access to GHGs emissions cannot be
hereditary, (ruling out "Grandfathering" as a basis for emissions entitlements),
and that the incremental wealth accruing to individuals from higher, unentitled
GHGs emissions by them, cannot be bequeathed to their offspring. This
principle furnishes the basis for the assertion that societies with higher
historical per-capita emissions, should compensate societies with lower past
per-capita emissions, a second attribute of the Fuji doctrine. Additionally, it
counters Grubb's argument, cited above, that compensation for historical
emissions is inappropriate because the earlier generations were innocent in
their emissions behavior. The Fuji doctrine, in this derivation, is not punitive.
Ensuring equality of opportunity is a central concern of the welfare State, and
(to varying degrees) is sought to be realized in all but avowed legally
minimalist States. Little support may be found in international public
documents, or current instruments, for abrogating this principle.
Finally, 'equality of result'. Different ethical schools have evolved to
address this question, albeit in the context of distribution of the natiunal
income between different social classes or groups.! n the Climate Change
context, this principle should be interpreted as equal per-capita tights to GHGs
emissions across all agents.
Several philosophical positions take equality of result as 'natural', in the
sense that while it needs no justification, deviations from the principle would
require it. Rawls (1971), accordingly seeks to address the question: "When can
inequalities of result be justified?" The answer, summarized in a sentence, is
that "only those inequalities are just, which would make the least well off
person in society better off than that person would be, (given ceterus-paribus
and that that basic human rights are equally assigned to all), in the absence of
the inequalities." Rawls' theory of justice would thus cast a strong onus on
advocates of differential per-capita GHGs emissions entitlements to
demonstrate that any scheme of unequal entitlements would be of greater
benefit to the poorest of mankind, than equal entitlements.
•
Traditional welfare economics based on Utilitarianism, would support the
idea of equality of result in income, since declining marginal utility of income
would mean that social welfare, an aggregation of individual utilities (cardinal,
inter-personally comparable), is maximized when incomes are equal (Pigou,
1932). A progressive per-capita distribution of GHGs emission rights (i.e.,
emissions rights for the poor are higher than for the rich) might have the effect
of equalizing incomes, and thereby, increasing global social welfare. Of course,
the underlying assumptions for existence of such a social welfare function are
strong. However, there is another objection to the Pigouvian result. That is, if
individual welfare is inter-dependent, or in other words, if one person's
activities benefit or harm others, even if such external effects are unintended,
maximization of social welfare over time would require such external effects to
be taken into account. This would mean an allocation of resources to persons in
line with the value of these external effects, justifying some inequalities. This
argument, as noted above, has also been furnished by Grubb. Of course, the
application of this principle must be comprehensive, i.e., all external
contributions of·all persons over all time must be accounted for. This would
allow, for example, for developing countries which were the cradle of human
civilization, to claim resource transfers to them for their fundamental
contributions to the human state. It is difficult to see that practical ways of
implementing this principle can be devised.
Libertarianism (Nozick, 1973) points out that a preferred (say, equal)
societal distribution of resources at one point in time will lead, by the very
process by which persons pursue their own welfare, to less preferred (unequal)
distributions at later times. The three ways to prevent this, i.e., preventing
economic exchange, or banning economic activities which lead to inequality, or
progressive taxation, can each be shown, in the limit, to reduce societal welfare.
In other words, continuous interventions by the State to restore the preferred
resource distribution may lead to reduction in societal welfare. The Libertarian
premise is thus, that intervntions by public authorities to promote equality of
result is unjustified. Nozick further asserts that distribution of resources
cannot be seen in isolation from the process by which wealth is created.
"Whomever makes something, having bought or contracted for all other held
resources used in the process (transferring some of his holdings for these
cooperating factors), is entitled to it. The situation is not one of somethings

getting made, and there being an open question of who is to get it. Things comeinto the world already attached to people having entitlements over them."
This "historical entitlement theory" would seem, as applied to goodswhich come into being with pre-existing claims to them, arising for example,from initial property rights over the factors of production, or from theapplication of one's skill, to deny that equal rights to these goods is natural.However, this would not be the case with resources which are virginal innature, and Nozick has difficulty in specifying which of several possiblemethods, for example, through labour, first occupancy, possession, declaration,or some other historical means is appropriate. Steiner (1977) has pointed outthat since the process of acquisition of natural resources (which would clearlyinclude environmental resources) creates nothing new, but involves theextraction of pre-existent resources from nature, differential entitlements tovirginal resources should be proscribed by the Libertarian. Moreover, the equalright to liberty tD which Nozick (apparently) subscribes should imply an initialequal distribution of natural resources. It is thus possible, even from thepremises of Libertarianism, to derive the principle of equal per-capita rights toGHGs emissions.
Developing countries assert that their levels of past, current, and(foreseeable) future per-capita GHGs emissions would not aggregatively induceClimate Change. On the other hand, just the past rates of emissions ofindustrialized States suffice to ensure increasing concentrations of GHGs in theatmosphere. Further, because of the apparent close linkages betwen economicgrowth and GHGs emissions, developing countries cannot accept anycommittment with regard to their emissions levels in the foreseeable future. Inaddition, equity principles, as argued above, would justify compensatorytransfers to them for the historically high levels of emissions by industrializedcountries.
The final component of the Fuji doctrine, i.e., equality of per- capitaemissions rights, accordingly derives from the principles of each of three m~orethical schools.

References
1. Aggarwal A. and Narain S. "Global warming in an unequal world",
Centre for Science and Environment, New Delhi, 1990.
2. Bertram G., Stephens RG. and Wallace C.C. "The relevance of economic
instruments for tackling the greenhouse effect", Report to the New
Zealand Ministry of Environment, 1989.
3. Coleman, J.S: "Equality," in: The New Palgrave Dictionary of Economics,
Eatwell, J, Milgate, M, and Newman, P. (Eds), W.W. Norton & Co., 1987.
Fujii Yasumasa (1990):
4. Grubb M.J. "The greenhouse effect: negotiating targets", Royal Institute
of International Affairs, London, 1989.
5. Grubb M.J., Sebenius J.K. and Magalhaes A. "Who bears the burden?
Equity and allocation in greenhouse gases emissions and abatement",
mimeo, 1991.
6. Pigou, A.C: "The Economics of Welfare," 4th ed. London, Macmillan,
1932. Rawls, J.A: "A Theory of Justice," Cambridge, Mass: Harvard
University Press, 1971.
7. Smith K. "Have you paid your natural debt'?", Environment and Policy
Institute, East-West Center, Honolulu, mimeo, 1990.
8. Steiner, I.H: "The natural right to the means of productiun,"
Philosophical Quarterly 37,41-49, 1977.
9. Young H.P. "Sharing the burden of global warming", Equity and Global
Climate Change Project, School of Public Affairs, University of Maryland,
1991.
)ID

4. Concluding commentThe arguments of the developing countries, formally embodied in the Fuji
doctrine, and derived formally in th present paper, cannot easily be dismissed,
even if one urges that in their own self- interest, because of likely adverse
environmental impacts, developing countries should eschew GHGs intensive
growth paths. However, a determination of the equity issues in Climate Change
before the current multilateral efforts to finalize a Framework Convention for
regulating Climate Change are concluded, is unlikely. Two possible operative
aspects of such a Framework Convention are committments by industrialized
countries to stabilize and then reduce GHGs emissions, within a specified
time-frame, and second, financial flows to developing countries to adopt
strategies to reduce future growth of GHGs emissions by them. The first aspect
is unexceptionable from the point of view of developing countries, as long as
similar committments are not sought from developing countries before a
determination of equity principles. Regarding the second, two considerl'j.tions
are important. One, that such flows must be additional to, and not competitive
with, normal aid flows for growth. Second, that financial (and technology) flows,
without an equity determination (when then might accrue as of right), must be
considered as paternalistic, and no obligation can be cast on anyone to accept
such transfers. Accordingly, it would be inappropriate to prescribe' binding
norms for such financial or technology transfers, and it should be open to
individual countries to state the conditions under which they would accept such
transfers.
;1\••til_ I.-r T IE